UNITED STATES
SECURITIES AND EXCHANGE COMMISSION
WASHINGTON, D.C. 20549
FORM N-CSR
CERTIFIED SHAREHOLDER REPORT OF REGISTERED MANAGEMENT
INVESTMENT COMPANIES
Investment Company Act file number 811-23086
WP Trust
(Exact name of registrant as specified in charter)
| 127 NW 13th Street Suite 13, Boca Raton, FL | 33432 |
| (Address of principal executive offices) | (Zip code) |
The Corporation Trust Company
Corporation Trust Center
1209 Orange St., Wilmington, DE 19801
(Name and address of agent for service)
With Copies To:
John H. Lively
Practus, LLP
11300 Tomahawk Creek Parkway, Suite 310
Leawood, KS 66211 |
Registrant’s telephone number, including area code: (800) 950-9112
Date of fiscal year end: February 28, 2021
Date of reporting period: August 31, 2021
Item 1. Report to Stockholders.

IPS Strategic Capital Absolute Return Fund
Institutional Class Shares (Ticker Symbol: IPSAX)
A series of the
WP TRUST
SEMI-ANNUAL REPORT
August 31, 2021 |
Investment Adviser
IPS Strategic Capital, Inc.
215 S. Wadsworth Blvd., Suite 540
Denver, CO 80226 |
| Table of Contents | |
| |
| |
| |
| |
| WP Trust | |
| |
| Investment Highlights | 2 |
| Sector Allocation | 2 |
| Schedule of Investments | 3 |
| Schedule of Options Written | 4 |
| Schedule of Futures Contracts | 5 |
| Statement of Assets and Liabilities | 6 |
| Statement of Operations | 7 |
| Statements of Changes in Net Assets | 8 |
| Financial Highlights | 9 |
| |
| NOTES TO FINANCIAL STATEMENTS | 10 |
| |
| ADDITIONAL INFORMATION | 18 |
2021 Semi-Annual Report 1
IPS Strategic Capital Absolute Return Fund (Unaudited)
INVESTMENT HIGHLIGHTS
August 31, 2021
The investment objective of the IPS Strategic Capital Absolute Return Fund (the “Fund”) is total return. Under normal circumstances, the Fund’s primary strategy consists of selling and purchasing put and call options on equity indices and exchange traded funds (“ETFs”). The sale of put options generates income for the Fund, but exposes it to the risk of declines in the value of the underlying assets. The risk in purchasing options is limited to the premium paid by the Fund for the options. The sale of call options generates income for the Fund, but may limit the Fund's participation in equity market gains.
IPS Strategic Capital, Inc. (the “Adviser”) seeks to reduce the overall volatility of returns by managing a portfolio of options. The Fund buys and sells both put and call exchange-traded listed options to establish exposure to the overall market. When the Adviser believes the value of an underlying asset will decline, the Fund may purchase a put option to profit from the decline. Similarly, when the Adviser anticipates an increase in the value of an underlying asset, the Fund may purchase a call option with respect to that asset.
The Fund may take a defensive position when the Adviser believes that current market, economic, political or other conditions are unsuitable and would impair the pursuit of the Fund’s investment objectives. When taking a defensive position, the Fund may invest up to 100% of its assets in cash, cash equivalents, including but not limited to, obligations of the U.S. Government, money market fund shares, commercial paper, certificates of deposit and/or bankers acceptances, as well as other interest bearing or discount obligations or debt instruments that carry an investment grade rating by a national rating agency. When the Fund takes a defensive position, the Fund may not achieve its investment objectives.
The Adviser reallocates the Fund’s investments continually to be commensurate with the risk profile that the Adviser deems appropriate for the Fund. The Fund seeks to use leverage to modify portfolio risk to be equal to, or less than that of, the market in total.
Allocation of Portfolio Holdings
(% of Investments net written options) as of August 31, 2021 |
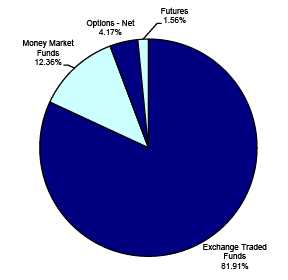
The percentages in the above graph are based on the portfolio holdings of the Fund as of August 31, 2021 and are subject to change.
For a detailed break-out of holdings by industry and exchange traded funds by investment type, please refer to the Schedule of Investments, Schedule of Futures Contracts and Schedule of Options Written.
2021 Semi-Annual Report 2
| IPS Strategic Capital Absolute Return Fund |
| |
| | | | | | | | Schedule of Investments |
| | | | | | | August 31, 2021 (Unaudited) |
| Shares | | | | | | Fair Value | % of Net Assets |
| |
| EXCHANGE TRADED FUNDS | | | | | | | | | |
| Equity Funds - Equity | | | | | | | | | |
| 110,000 | iShares Core S&P 500 ETF + (a) | | | | | $49,908,100 | | | |
| 1 | SPDR S&P 500 ETF Trust | | | | | | 452 | | | |
| Total for Exchange Traded Funds (Cost $40,479,109) | | | | | 49,908,552 | | 72.03 | % |
| MONEY MARKET FUNDS | | | | | | | | | |
| 7,531,613 | Federated Hermes Government Obligations Fund - Institutional | | | 7,531,613 | | | |
| | Class 0.02% ** | | | | | | 7,531,613 | | 10.87 | % |
| Total for Money Market Funds (Cost $7,531,613) | | | | | | | | |
| CALL/PUT OPTIONS PURCHASED | | | Notional | | | | | | |
| Expiration Date/Exercise Price | Contracts | | Amount | | Fair Value | | % of Net Assets |
| CBOE S&P 500 Index * | | | | | | | | | |
| August 19, 2022, Put @ $3,675.00 *** | 200 | $ | 73,500,000 | | | 2,648,000 | | | |
| September 10, 2021, Put @ $4,190.00 | 33 | | 13,827,000 | | | 7,920 | | | |
| September 17, 2021, Put @ $4,215.00 | 33 | | 13,909,500 | | | 20,493 | | | |
| September 17, 2021, Put @ $4,380.00 | 50 | | 21,900,000 | | | 70,500 | | | |
| September 24, 2021, Put @ $4,230.00 | 33 | | 13,959,000 | | | 42,636 | | | |
| September 30, 2021, Put @ $4,255.00 | 16 | | 6,808,000 | | | 31,312 | | | |
| September 30, 2021, Put @ $4,230.00 | 17 | | 7,191,000 | | | 30,515 | | | |
| Total for Options Purchased (Premiums Paid $3,431,514) | $ | 151,094,500 | | | 2,851,376 | | 4.11 | % |
| Total Investments (Cost $51,442,236) | | | | | | 60,291,541 | | 87.01 | % |
| Other Assets in Excess of Liabilities | | | | | | 9,000,931 | | 12.99 | % |
| Net Assets | | | | | | $69,292,472 | | 100.00 | % |
* Non-Income Producing Securities.
** The Yield Rate shown represents the 7-day yield at August 31, 2021.
*** Level 2 valuation. See Note 2.
+ Portion or all of the security is pledged as collateral for options written.
(a) Additional information, including the current prospectus and annual report, is available at
https://www.ishares.com/us/products/239726/ishares-core-sp-500-etf. |
The accompanying notes are an integral part of these
financial statements. |
2021 Semi-Annual Report 3
| IPS Strategic Capital Absolute Return Fund |
| |
| | | | Schedule of Options Written |
| | | | August 31, 2021 (Unaudited) |
| Underlying Security | | | Notional | | | |
| Expiration Date/Exercise Price | Contracts | | Amount | | | Fair Value |
| Put Options Written | | | | | | |
| CBOE S&P 500 Index * | | | | | | |
| September 10, 2021, Put @ $4,355.00 | 33 | $ | 14,371,500 | | $ | 19,140 |
| September 17, 2021, Put @ $4,150.00 | 100 | | 41,500,000 | | | 54,000 |
| September 17, 2021, Put @ $4,375.00 | 33 | | 14,437,500 | | | 46,530 |
| September 24, 2021, Put @ $4,400.00 | 33 | | 14,520,000 | | | 82,929 |
| September 30, 2021, Put @ $4,425.00 | 16 | | 7,080,000 | | | 56,288 |
| September 30, 2021, Put @ $4,405.00 *** | 17 | | 7,488,500 | | | 54,740 |
| Total Put Options Written (Premiums Received $747,489) | | | 99,397,500 | | | 313,627 |
| Total Options (Premiums Received $747,489) | | $ | 99,397,500 | | $ | 313,627 |
* Non-Income Producing Securities.
*** Level 2 valuation. See Note 2.
The accompanying notes are an integral part of these
financial statements. |
2021 Semi-Annual Report 4
| IPS Strategic Capital Absolute Return Fund | | |
| |
| | | | | Schedule of Futures Contracts |
| | | | | August 31, 2021 (Unaudited) |
| | | Expiration | | Notional | | Value/Unrealized |
| | Contracts | Date | | Value | | Appreciation |
| FUTURES CONTRACTS PURCHASED LONG | | | | | |
| Index Futures | | | | | | |
| E-mini Standard & Poor's 500 Futures | 67 | 9/17/2021 | $ | 15,143,675 | | $ 950,919 |
| Total | | | $ | 15,143,675 | | $ 950,919 |
The accompanying notes are an integral part of these
financial statements. |
2021 Semi-Annual Report 5
| WP Trust | | |
| |
| Statement of Assets and Liabilities (Unaudited) | | |
| August 31, 2021 | | IPS Strategic |
| | | Capital |
| | | Absolute |
| | | Return Fund |
| |
| Assets: | | |
| Investments at Fair Value* | $ | 60,291,541 |
| Deposit at Broker for Written Options | | 6,295,168 |
| Deposit at Broker for Futures Contracts | | 3,117,261 |
| Dividends Receivable | | 127 |
| Prepaid Expenses | | 10,632 |
| Total Assets | | 69,714,729 |
| Liabilities: | | |
| Options Written at Fair Value (Premiums Received $747,489) | | 313,627 |
| Payable to Adviser | | 58,131 |
| Payable to Administrator | | 4,141 |
| Payable to Chief Compliance Officer | | 2,798 |
| Payable to Trustees | | 1,358 |
| Other Accrued Expenses | | 42,202 |
| Total Liabilities | | 422,257 |
| Net Assets | $ | 69,292,472 |
| Net Assets Consist of: | | |
| Paid In Capital | $ | 56,550,519 |
| Total Distributable Earnings / (Accumulated Deficit) | | 12,741,953 |
| Net Assets | $ | 69,292,472 |
| |
| Net Asset Value, Offering and Redemption Price | $ | 12.09 |
| |
| * Investments at Identified Cost | $ | 51,442,236 |
| |
| Shares Outstanding (Unlimited number of shares | | 5,732,731 |
| authorized without par value) | | |
The accompanying notes are an integral part of these
financial statements. |
2021 Semi-Annual Report 6
| WP Trust | | | |
| |
| Statement of Operations (Unaudited) | | | |
| For the period ended August 31, 2021 | | IPS Strategic | |
| | | Capital | |
| | | Absolute | |
| | | Return Fund | |
| |
| Investment Income: | | | |
| Dividends | $ | 280,697 | |
| Total Investment Income | | 280,697 | |
| Expenses: | | | |
| Management Fees | | 328,578 | |
| Administration, Fund Accounting & Transfer Agent Fees | | 105,709 | |
| Portfolio Software Fees | | 32,446 | |
| Compliance Officer Expense | | 12,098 | |
| Audit Fees | | 9,829 | |
| Legal Fees | | 24,437 | |
| Trustees Fees | | 6,347 | |
| Registration Expense | | 5,913 | |
| Printing and Postage Expense | | 8,571 | |
| Custody Fees | | 5,546 | |
| Miscellaneous Expense | | 12,833 | |
| Insurance Expense | | 318 | |
| Total Expenses | | 552,625 | |
| |
| |
| Net Investment Income (Loss) | | (271,928 | ) |
| |
| Realized and Unrealized Gain (Loss) on Investments: | | | |
| Net Realized Gain (Loss) on Options Purchased | | (8,937,793 | ) |
| Net Realized Gain (Loss) on Options Written | | 6,917,797 | |
| Net Realized Gain (Loss) on Futures Contracts | | 2,170,665 | |
| Net Change in Unrealized Appreciation (Depreciation) on Investments | | 7,912,735 | |
| Net Change in Unrealized Appreciation (Depreciation) on Options Purchased | | (1,463,364 | ) |
| Net Change in Unrealized Appreciation (Depreciation) on Options Written | | 1,031,655 | |
| Net Change in Unrealized Appreciation (Depreciation) on Futures Contracts | | 316,577 | |
| Net Realized and Unrealized Gains (Loss) on Investments | | 7,948,272 | |
| |
| Net Increase (Decrease) in Net Assets from Operations | $ | 7,676,344 | |
The accompanying notes are an integral part of these
financial statements. |
2021 Semi-Annual Report 7
| WP Trust |
| | |
| Statements of Changes in Net Assets | | | | | | | | |
| | | IPS Strategic Capital Absolute | | |
| | | Return Fund | | |
| | | (Unaudited) | | | | | | |
| | | 3/1/2021 | | | | 3/1/2020 | | |
| | | to | | | | to | | |
| | | 8/31/2021 | | | | 2/28/2021 | | |
| From Operations: | | | | | | | | |
| Net Investment Income (Loss) | $ | (271,928 | ) | | $ | (642,959 | ) | |
| Net Realized Gain (Loss) on Investments, Options | | | | | | | | |
| Contracts and Futures Contracts | | 150,669 | | | | 2,002,529 | | |
| Net Change in Unrealized Appreciation (Depreciation) | | | | | | | | |
| on Investments, Options Contracts and Futures | | | | | | | | |
| Contracts | | 7,797,603 | | | | 3,685,614 | | |
| Net Increase (Decrease) in Net Assets from Operations | | 7,676,344 | | | | 5,045,184 | | |
| From Distributions to Shareholders: | | - | | | | (280,150 | ) | |
| From Capital Share Transactions: | | | | | | | | |
| Proceeds From Sale of Shares | | 4,095,767 | | | | 15,770,834 | | |
| Shares Issued on Reinvestment of Dividends | | - | | | | 269,732 | | |
| Cost of Shares Redeemed | | (4,127,633 | ) | | | (10,858,143 | ) | |
| Net Increase (Decrease) from Shareholder Activity | | (31,866 | ) | | | 5,182,423 | | |
| Net Increase (Decrease) in Net Assets | | 7,644,478 | | | | 9,947,457 | | |
| | |
| Net Assets at Beginning of Period | | 61,647,994 | | | | 51,700,537 | | |
| | |
| Net Assets at End of Period | $ | 69,292,472 | | | $ | 61,647,994 | | |
| | |
| | |
| Share Transactions: | | | | | | | | |
| Issued | | 356,555 | | | | 1,625,163 | | |
| Reinvested | | - | | | | 25,936 | | |
| Redeemed | | (363,089 | ) | | | (1,083,116 | ) | |
| Net Increase (Decrease) in Shares | | (6,534 | ) | | | 567,983 | | |
The accompanying notes are an integral part of these
financial statements. |
2021 Semi-Annual Report 8
| WP Trust |
| | |
| Financial Highlights - IPS Strategic Capital Absolute Return Fund | | | | | | | | | | | | | | | | | | | |
| | |
| Selected data for a share outstanding throughout the period: | | (Unaudited) | | | | | | | | | | | | | | | | | | | | | | | |
| | | 3/1/2021 | | | | 3/1/2020 | | | | 3/1/2019 | | | | 3/1/2018 | | | | 3/1/2017 | | | | 4/15/2016* | | |
| | | to | | | | to | | | | to | | | | to | | | | to | | | | to | | |
| | | 8/31/2021 | | | | 2/28/2021 | | | | 2/29/2020 | | | | 2/28/2019 | | | | 2/28/2018 | | | | 2/28/2017 | | |
| Net Asset Value - Beginning of Period | $ | 10.74 | | | $ | 10.00 | | | $ | 9.54 | | | $ | 10.66 | | | $ | 10.38 | | | $ | 10.00 | | |
| Net Investment Income (Loss) (a) | | (0.05 | ) | | | | (0.11 | ) | | | - | | + | | (0.02 | ) | | | (0.09 | ) | | | (0.11 | ) | |
| Net Gain (Loss) on Investments (Realized and Unrealized) | | 1.40 | | | | | 0.90 | | | | 0.46 | | | | (0.20 | ) | | | 1.33 | | | | 0.56 | | |
| Total from Investment Operations | | 1.35 | | | | | 0.79 | | | | 0.46 | | | | (0.22 | ) | | | 1.24 | | | | 0.45 | | |
| Distributions (From Net Investment Income) | | - | | | | | - | | + | | - | | | | - | | | | - | | | | - | | |
| Distributions (From Capital Gains) | | - | | | | | (0.05 | ) | | | - | | | | (0.90 | ) | | | (0.96 | ) | | | (0.07 | ) | |
| Total Distributions | | - | | | | | (0.05 | ) | | | - | | | | (0.90 | ) | | | (0.96 | ) | | | (0.07 | ) | |
| | |
| Net Asset Value - End of Period | $ | 12.09 | | | $ | 10.74 | | | $ | 10.00 | | | $ | 9.54 | | | $ | 10.66 | | | $ | 10.38 | | |
| Total Return (b) | | 12.57 | % | ** | | | 7.90 | % | | | 4.82 | % | | | (2.05 | )% | | | 12.15 | % | | | 4.51 | % | ** |
| Ratios/Supplemental Data | | | | | | | | | | | | | | | | | | | | | | | | | |
| Net Assets - End of Period (Thousands) | $ | 69,292 | | | $ | 61,648 | | | $ | 51,701 | | | $ | 62,598 | | | $ | 86,384 | | | $ | 90,391 | | |
| Ratio of Expenses to Average Net Assets (c) (e) | | 1.68 | % | *** | | | 1.67 | % | | | 1.65 | % | | | 1.84 | % | | | 1.69 | % | | | 1.52 | % | *** (f) |
| Ratio of Net Investment Income (Loss) to Average | | | | | | | | | | | | | | | | | | | | | | | | | |
| Net Assets (d) (e) | | (0.83 | )% | *** | | | (1.07 | )% | | | 0.00 | % | + | | (0.15 | )% | | | (0.89 | )% | | | (1.24 | )% | *** (f) |
| Portfolio Turnover Rate | | 0.00 | % | ** | | | 50.17 | % | | | 0.00 | % | | | 0.00 | % | | | 0.00 | % | | | 0.00 | % | ** |
| | * Commencement of operations.
** Not annualized.
*** Annualized.
+ Less than $0.005/0.005% per share.
(a) Per share amount calculated using the average shares method.
(b) Total return represents the rate that the investor would have earned or lost on an investment in the Fund assuming
reinvestment of dividends. Returns do not reflect the deduction of taxes a shareholder would pay on Fund distributions
or redemption of Fund shares.
(c) Ratios do not include expenses of the investment companies (“ETFs”) in which the Fund invests.
(d) Recognition of net investment income by the Fund is affected by the timing of the declaration of the dividends by
the underlying investment companies (“ETFs”) in which the Fund invests.
(e) The ratios include 0.00%, 0.00%, 0.00%, 0.33%, 0.19% and 0.06% of interest expense during the period ended
August 31, 2021, the years ended February 28, 2021, February 29, 2020, February 28, 2019, February 28, 2018 and
the period ended February 28, 2017, respectively.
(f) Ratios are for the period from April 15, 2016, the date of initial expense accruals, through February 28, 2017. |
The accompanying notes are an integral part of these
financial statements. |
2021 Semi-Annual Report 9
NOTES TO FINANCIAL STATEMENTS
IPS STRATEGIC CAPITAL ABSOLUTE RETURN FUND
August 31, 2021
(Unaudited)
1.) ORGANIZATION AND SIGNIFICANT ACCOUNTING POLICIES
The IPS Strategic Capital Absolute Return Fund (the “Fund”) is a series of WP Trust (the “Trust”). The Trust was organized on June 4, 2015 as a Delaware statutory trust. The Trust is registered as an open-end management investment company under the Investment Company Act of 1940 (the “1940 Act”). The Fund is a non-diversified Fund. As a non-diversified Fund, the Fund may invest a significant portion of its assets in a small number of companies. The Fund’s investment objective is total return. The Fund’s investment adviser is IPS Strategic Capital, Inc. (the “Adviser”). The Fund has three classes of shares, Class A, Class C and Institutional Class shares. Currently, only the Institutional Class shares are being offered for sale. The Institutional Class shares commenced operations on April 15, 2016.
The following is a summary of the significant accounting policies followed by the Fund in the preparation of its financial statements. The Fund is an investment company that follows the investment company accounting and reporting guidance of Financial Accounting Standards Board (“FASB”) Accounting Standards Codification Topic 946 Financial Services - Investment Companies.
SHARE VALUATION:
The net asset value (“NAV”) is generally calculated as of the close of trading on the New York Stock Exchange (the “Exchange”) (normally 4:00 p.m. Eastern time) every day the Exchange is open. The NAV is calculated by taking the total value of the Fund’s assets, subtracting its liabilities, and then dividing by the total number of shares outstanding, rounded to the nearest cent. For the Institutional Class, the offering price and redemption price per share is equal to the NAV per share.
SECURITY VALUATION: All investments in securities are recorded at their estimated fair value, as described in note 2.
OPTIONS: The Fund’s option strategy consists of selling and purchasing put and call options on equity indices and exchange traded funds (“ETFs”). The sale of put options generates income for the Fund, but exposes it to the risk of declines in the value of the underlying assets. The risk in purchasing options is limited to the premium paid by the Fund for the options. The sale of call options generates income for the Fund, but may limit the Fund's participation in equity market gains. The Fund’s Adviser seeks to reduce the overall volatility of returns by managing a portfolio of options. When the Fund writes or purchases an option, an amount equal to the premium received or paid by the Fund is recorded as a liability or an asset and is subsequently adjusted to the current value of the option written or purchased. Premiums received or paid from writing or purchasing options which expire unexercised are treated by the Fund on the expiration date as realized gains or losses. The difference between the premium and the amount paid or received on effecting a closing purchase or sale transaction, including brokerage commissions, is also treated as a realized gain or loss. If an option is exercised, the premium paid or received is added to the cost of the purchase or proceeds from the sale in determining whether the Fund has realized a gain or a loss on investment transactions.
Purchasing and selling put and call options are highly specialized activities and entail greater than ordinary investment risks. The successful use of options depends in part on the ability of the Adviser to manage future price fluctuations and the degree of correlation between the options and securities (or currency) markets. By selling call options on equity securities or indices, the Fund gives up the opportunity to benefit from potential increases in the value of the underlying securities above the strike prices of the sold call options, but continues to bear the risks of declines in the value of the markets, including the underlying indices for the puts as well, if different, as the securities that are held by the Fund. The premium received from the sold options may not be sufficient to offset any losses sustained from the volatility of the underlying equity indices over time.
The Fund will incur a loss as a result of a written option (also referred to as a short position) if the price of the written option instrument increases in value between the date when the Fund writes the option and the date on which the Fund purchases an offsetting position. The Fund’s losses are potentially large in a written put transaction and potentially unlimited in a written call transaction. Please refer to the Fund’s prospectus for a full listing of risks associated with these instruments.
2021 Semi-Annual Report 10
Notes to Financial Statements (Unaudited) - continued
ETFs AND MONEY MARKET FUNDS: The Fund may invest in ETFs and money market mutual funds (“MM Funds”). An ETF is a fund that may hold a portfolio of common stocks or bonds designed to track the performance of a securities index or sector of an index. ETFs are traded on a securities exchange based on their market value. Some ETF portfolios are designed to track the performance of an index and it is possible the ETF’s performance may not closely track its index. ETFs and MM Funds incur fees and expenses such as operating expenses, licensing fees, registration fees, trustees’ fees, and marketing expenses, and ETF and MM Fund shareholders, such as the Fund, pay their proportionate share of these expenses. Your cost of investing in the Fund will generally be higher than the cost of investing directly in ETFs and MM Funds. By investing in the Fund, you will indirectly bear fees and expenses charged by the underlying ETFs and MM Funds in which the Fund invests in addition to the Fund’s direct fees and expenses.
The Fund may invest a significant portion of its assets in shares of one or more investment companies (i.e., ETFs). From time to time, the Fund may invest greater than 25% of its net assets in one security. As of August 31, 2021, the iShares Core S&P 500 ETF represented 72.03% of the Fund’s net assets. Additional information for this security, including its financial statements, is available from the U.S. Securities and Exchange Commission’s website at www.sec.gov.
SHORT SALES OF SECURITIES: The Fund may make short sales, which are transactions in which the Fund sells a security it does not own in anticipation of a decline in the market value of that security. To complete a short sale transaction, the Fund will borrow the security from a broker-dealer, which generally involves the payment of a premium and transaction costs. The Fund then sells the borrowed security to a buyer in the market. The Fund will then cover the short position by buying shares in the market either (i) at its discretion; or (ii) when called by the broker-dealer lender. Until the security is replaced, the Fund is required to pay the broker-dealer lender any dividends or interest that accrue during the period of the loan. In addition, the net proceeds of the short sale will be retained by the broker to the extent necessary to meet regulatory or other requirements, until the short position is closed out.
The Fund will incur a loss, unlimited in size, as a result of the short sale if the price of the security increases between the date of the short sale and the date on which the Fund replaces the borrowed security. The Fund will realize a gain if the security declines in price between those dates. The amount of any gain will be decreased, and the amount of any loss increased, by the amount of the premium, dividends, interest or expenses the Fund may be required to pay in connection with a short sale. When the Fund makes a short sale, the Fund will segregate liquid assets (such as cash, U.S. government securities, or equity securities) on the Fund’s books and/or in a segregated account at the Fund’s custodian in an amount sufficient to cover the current value of the securities to be replaced as well as any dividends, interest and/or transaction costs due to the broker-dealer lender. In determining the amount to be segregated, any securities that have been sold short by the Fund will be marked to market daily. To the extent the market price of the security sold short increases and more assets are required to meet the Fund’s short sale obligations, additional assets will be segregated to ensure adequate coverage of the Fund’s short position obligations.
In addition, the Fund may make short sales “against the box” (i.e., when the Fund sells a security short when the Fund has segregated securities equivalent in kind and amount to the securities sold short, or securities convertible or exchangeable into such securities) and will hold such securities while the short sale is outstanding. The Fund will incur transaction costs, including interest, in connection with opening, maintaining, and closing short sales against the box.
FUTURES CONTRACTS: The Fund may use futures contracts and put and call options on equity indexes and ETFs to pursue its investment objective of total return. There is no guarantee such strategies will work. If the Fund is not successful in employing such instruments in managing its portfolio, its performance will be worse than if it did not invest in such instruments. Successful use by the Fund of futures contracts will be subject to its ability to correctly predict movements in the direction of the securities generally or of a particular market segment. In addition, the Fund will pay commissions and other costs in connection with such investments, which may increase the Fund’s expenses and reduce the return. In utilizing certain derivatives, the Fund’s losses are potentially unlimited. Derivative instruments may also involve the risk that other parties to the derivative contract may fail to meet their obligations, which could cause losses.
While futures contracts are generally liquid instruments, under certain market conditions they may become illiquid. As a result, the Fund may not be able to close out a position in a futures contract at a time that is advantageous. The price of futures can be highly volatile; using them could lower total return, and the potential loss from futures can exceed the Fund’s initial investment in such contracts. The Fund’s use of derivatives may magnify losses for the Fund.
FEDERAL INCOME TAXES: The Fund has qualified and intends to continue to qualify as a regulated investment company under Subchapter M of the Internal Revenue Code of 1986, as amended (the “Code”). It is the policy of the Fund to comply with the requirements of the Code applicable to regulated investment
2021 Semi-Annual Report 11
Notes to Financial Statements (Unaudited) - continued
companies and to distribute substantially all of its net investment company taxable income and net capital gains. Therefore, no provision for federal income taxes is required.
As of and during the six month period ended August 31, 2021, the Fund did not have a liability for any unrecognized tax benefits. The Fund recognizes interest and penalties, if any, related to unrecognized tax liability as income tax expense in the Statement of Operations. During the six month period ended August 31, 2021, the Fund did not incur any interest or penalties. The Fund identifies its major tax jurisdictions as U.S. Federal and the state of Delaware.
In addition, accounting principles generally accepted in the United States of America (“GAAP”) requires management of the Fund to analyze all open tax years, as defined by IRS statute of limitations, including federal tax authorities and certain state tax authorities. Management has analyzed the Fund’s tax positions and has concluded that no liability for unrecognized tax benefits should be recorded related to uncertain tax positions taken on returns filed for open tax years. The Fund has no examination in progress and is not aware of any tax positions for which it is reasonably possible that the total tax amounts of unrecognized tax benefits will significantly change in the next twelve months.
DISTRIBUTIONS TO SHAREHOLDERS: Dividends from net investment income and distributions of net realized capital gains, if any, will be declared and paid at least annually. Income and capital gain distributions, which are determined in accordance with income tax regulations, are recorded on the ex-dividend date. GAAP requires that permanent financial reporting differences relating to shareholder distributions be reclassified to paid-in capital or net realized gains.
USE OF ESTIMATES: The preparation of financial statements in conformity with GAAP requires management to make estimates and assumptions that affect the reported amounts of assets and liabilities and disclosure of contingent assets and liabilities at the date of the financial statements and the reported amounts of increases and decreases in net assets from operations during the reporting period. Actual results could differ from those estimates.
EXPENSES: Expenses incurred by the Trust that do not relate to a specific fund of the Trust are allocated to the individual funds based on each fund's relative net assets or another appropriate basis (as determined by the Board of Trustees (the “Board”)).
OTHER: Investment and shareholder transactions are recorded on trade date. The Fund determines the gain or loss realized from the investment transactions by comparing the original cost of the security lot sold with the net sales proceeds using the identified cost method. Dividend income is recognized on the ex-dividend date or as soon as information is available to the Fund and interest income and expenses are recognized on an accrual basis utilizing the effective interest method. Withholding taxes on foreign dividends have been provided for in accordance with the Fund’s understanding of the applicable country’s tax rules and rates.
2.) SECURITIES VALUATIONS
PROCESSES AND STRUCTURE
The Fund’s Board has adopted guidelines for valuing securities and other derivative instruments including in circumstances in which market quotes are not readily available, and has delegated authority to the Adviser to apply those guidelines in determining fair value prices, subject to review by the Board.
HIERARCHY OF FAIR VALUE INPUTS
The Fund utilizes various methods to measure the fair value of most of its investments on a recurring basis. GAAP establishes a hierarchy that prioritizes inputs to valuation techniques used to measure fair value. The three levels of inputs are as follows:
Level 1 - Unadjusted quoted prices in active markets for identical assets or liabilities.
Level 2 - Observable inputs other than quoted prices included in level 1 that are observable for the asset or liability, either directly or indirectly. These inputs may include quoted prices for the identical instrument on an inactive market, prices for similar instruments, interest rates, prepayment speeds, credit risk, yield curves, default rates and similar data.
Level 3 - Unobservable inputs for the asset or liability, to the extent relevant observable inputs are not available, representing the Fund’s best information about the assumptions a market participant would use in valuing the assets or liabilities.
The availability of observable inputs can vary from security to security and is affected by a wide variety of factors, including, for example, the type of security, whether the security is new and not yet established in
2021 Semi-Annual Report 12
Notes to Financial Statements (Unaudited) - continued
the marketplace, the liquidity of markets, and other characteristics particular to the security. To the extent that valuation is based on models or inputs that are less observable or unobservable in the market, the determination of fair value requires more judgment. Accordingly, the degree of judgment exercised in determining fair value is greatest for instruments categorized in Level 3.
The inputs used to measure fair value may fall into different levels of the fair value hierarchy. In such cases, for disclosure purposes, the level in the fair value hierarchy within which the fair value measurement falls in its entirety is determined based on the lowest level input that is significant to the fair value measurement in its entirety.
FAIR VALUE MEASUREMENTS
A description of the valuation techniques applied to the Fund’s major categories of assets and liabilities measured at fair value on a recurring basis follows.
Equity securities (ETFs) Equity securities generally are valued by using market quotations, but may be valued on the basis of prices furnished by a pricing service when the Adviser believes such prices accurately reflect the fair value of such securities. Securities that are traded on any stock exchange or on the NASDAQ over-the-counter market are generally valued by the pricing service at the last quoted sale price. Lacking a last sale price, an equity security is generally valued by the pricing service at its last bid price. In the event of a short sale of an equity security, lacking a last sale price, an equity security is generally valued by the pricing service at its last ask price. Generally, if the security is traded in an active market and is valued at the last sale price, the security is categorized as a level 1 security, and if an equity security is valued by the pricing service at its last bid, it is generally categorized as a level 2 security. When market quotations are not readily available, when the Adviser determines that the market quotation or the price provided by the pricing service does not accurately reflect the current fair value, or when restricted securities are being valued, such securities are valued as determined in good faith by the Adviser, subject to review of the Board and are categorized in level 2 or level 3, when appropriate.
Money market funds Money market funds are valued at net asset value and are classified in Level 1 of the fair value hierarchy.
Derivative instruments Listed derivatives, including options and futures, that are actively traded are valued based on quoted prices from the exchange and categorized in level 1 of the fair value hierarchy. Derivatives held by the Fund for which no current quotations are readily available and which are not traded on the valuation date are valued at the mean price and are categorized within level 2 of the fair value hierarchy. Derivatives that are thinly traded for which a mean price is not available are valued at the ask price or the bid price, whichever is available, and are categorized within level 2 of the fair value hierarchy. Over-the-counter (OTC) derivative contracts include forward, swap, and option contracts related to interest rates; foreign currencies; credit standing of reference entities; equity prices; or commodity prices, and warrants on exchange-traded securities. Depending on the product and terms of the transaction, the fair value of the OTC derivative products can be modeled taking into account the counterparties’ creditworthiness and using a series of techniques, including simulation models. Many pricing models do not entail material subjectivity because the methodologies employed do not necessitate significant judgments, and the pricing inputs are observed from actively quoted markets, as is the case of interest rate swap and option contracts. OTC derivative products valued using pricing models are categorized within level 2 of the fair value hierarchy.
Fixed income securities. Fixed income securities, including government securities denominated in U.S. dollars, valued using market quotations in an active market, will be categorized as level 1 securities. However, they may be valued on the basis of prices furnished by a pricing service when the Adviser believes such prices more accurately reflect the fair value of such securities. A pricing service utilizes electronic data processing techniques based on yield spreads relating to securities with similar characteristics to determine prices for normal institutional-size trading units of debt securities without regard to sale or bid prices. These securities will generally be categorized as level 2 securities.
If the Adviser decides that a price provided by the pricing service does not accurately reflect the fair value of the securities, when prices are not readily available from a pricing service, or when certain restricted or illiquid securities are being valued, these securities are valued at fair value as determined in good faith by the Adviser, in conformity with guidelines adopted by and subject to review of the Board and the Fair Valuation Committee. These securities will be categorized as Level 3 securities.
The following tables summarize the inputs used to value the Funds’ assets and liabilities measured at fair value as of August 31, 2021:
2021 Semi-Annual Report 13
| Notes to Financial Statements (Unaudited) - continued | | | | |
| |
| Valuation Inputs of Assets | | Level 1 | | Level 2 | | Level 3 | | Total |
| Exchange Traded Funds | | $49,908,552 | | $ – | | $ – | | $49,908,552 |
| Futures Contracts * | | 950,919 | | – | | – | | 950,919 |
| Put Options Purchased | | 203,376 | | 2,648,000 | | – | | 2,851,376 |
| Money Market Funds | | 7,531,613 | | – | | – | | 7,531,613 |
| Total | | $58,594,460 | | $ 2,648,000 | | $ – | | $61,242,460 |
* Amount represents net unrealized appreciation as presented in Schedule of Futures Contracts.
| Valuation Inputs of Liabilities | | Level 1 | | Level 2 | | Level 3 | | Total |
| Put Options Written | | $258,887 | | $54,740 | | $– | | $313,627 |
| Total | | $258,887 | | $54,740 | | $– | | $313,627 |
Refer to the Fund’s Schedule of Investments for a listing of securities by industry. The Fund did not hold any level 3 assets during the six month period ended August 31, 2021.
3. DERIVATIVES TRANSACTIONS
As of August 31, 2021, portfolio securities valued at $22,685,500 were held in segregated accounts by the custodian as collateral for options written by the Fund. As of August 31, 2021, cash of $9,412,429 was held at the broker as collateral for options and futures transactions.
The average monthly notional values of futures contracts purchased long and short and options contracts purchased and written by the Fund for the six month period ended August 31, 2021, were as follows:
| Derivative Type | | Average Notional Value | |
| Put Options Purchased | | $153,477,286 | |
| Put Options Written | | ($89,824,143) | |
| Futures Contracts Purchased Long | | $14,263,070 | |
As of August 31, 2021, the location on the Statement of Assets and Liabilities for financial derivative instrument fair values is as follows:
| Assets | | Location | | Equity Contracts/Total |
| Put options purchased | | Investments at Fair Value | | $2,851,376 |
| Net unrealized appreciation on futures | | | | |
| contracts | | Schedule of Futures Contracts ** | | 950,919 |
| Total Assets | | | | $3,802,295 |
| |
| Liabilities | | Location | | Equity Contracts/Total |
| Put options written | | Options Written at Fair Value | | $313,627 |
| Total Liabilities | | | | $313,627 |
** The Statement of Assets and Liabilities location for Futures Contracts is “Deposits at Broker for Futures Contracts”.
Realized and unrealized gains and losses on derivatives contracts entered into by the Fund during the six month period ended August 31, 2021, are recorded in the following locations in the Statement of Operations:
| Net change in unrealized | | | | |
| appreciation (depreciation) on: | | Location | | Equity Contracts/Total |
| Put options purchased | | Options purchased | | $(1,463,364) |
| Put options written | | Options written | | 1,031,655 |
| Futures contracts | | Futures contracts | | 316,577 |
| | | | | $ (115,132) |
| |
| Net realized gain (loss) on: | | Location | | Equity Contracts/Total |
| Put options purchased | | Options purchased | | $(8,937,793) |
| Put options written | | Options written | | 6,917,797 |
| Futures contracts | | Futures contracts | | 2,170,665 |
| | | | | $ 150,669 |
All open derivative positions at August 31, 2021 are reflected on the Fund's Schedule of Investments, Schedule of Futures Contracts and Schedule of Options Written.
2021 Semi-Annual Report 14
Notes to Financial Statements (Unaudited) - continued
The following tables present the Fund’s asset and liability derivatives available for offset under a master netting arrangement as of August 31, 2021.
| Assets: | | Gross Amounts of Assets Presented in the Statement of Assets & Liabilities |
| | | | | | | | | | Gross Amounts Not Offset in | | |
| | | | | | | | | | the Statement of Assets and | | |
| | | | | | | | | | Liabilities | | |
| | | | | | Gross | | Net Amount of | | | | | | | |
| | | | | | Amounts | | Assets | | | | | | | |
| | | Gross | | | Offset in the | | Presented in the | | | | | | | |
| | | Amounts of | | | Statement of | | Statement of | | | Financial | | Cash | | |
| | | Recognized | | | Assets and | | Assets and | | | Instruments | | Collateral | | Net Amount |
| Description | | Assets | | | Liabilities | | Liabilities | | | Pledged | | Pledged | | of Assets |
| Options Purchased | $ | 2,851,376 | (1) | $ | - | $ | 2,851,376 | (1) | $ | (313,627) | (2) | $ - | $ | 2,537,749 |
| Futures Contracts | | 950,919 | (3) | | - | | 950,919 | (3) | | - | | - | | 950,919 |
| Total | $ | 3,802,295 | | $ | - | $ | 3,802,295 | | | $(313,627) | | $ - | $ | 3,488,668 |
| Liabilities: | | Gross Amounts of Liabilities Presented in the Statement of Assets & Liabilities |
| | | | | | | | | | Gross Amounts Not Offset in | |
| | | | | | | | | | the Statement of Assets and | |
| | | | | | | | | | Liabilities | |
| | | | | | Gross | | Net Amount of | | | | | |
| | | | | | Amounts | | Liabilities | | | | | |
| | | Gross | | | Offset in the | | Presented in the | | | | | |
| | | Amounts of | | | Statement of | | Statement of | | Financial | | Cash | |
| | | Recognized | | | Assets and | | Assets and | | Instruments | | Collateral | Net Amount |
| Description | | Liabilities | | | Liabilities | | Liabilities | | Pledged | | Pledged | of Liabilities |
| Options Written | $ | (313,627) | (4) | $ | - | | $ (313,627) | (4) | $ 313,627 | (2) | $ - | $ - |
(1) Purchased options at value as presented in the Schedule of Investments.
(2) The amount is limited to the derivative liability balance and accordingly does not include excess collateral pledged.
(3) Unrealized appreciation on futures contracts as presented in the Schedule of Futures Contracts and included within deposits at broker for futures contracts in the Statement of Assets and Liabilities.
(4) Written options at value as presented in the Schedule of Options Written.
4.) ADVISORY FEES AND OTHER RELATED PARTY TRANSACTIONS
The Fund has entered into an Investment Advisory Agreement (the “Advisory Agreement”) with the Adviser. Pursuant to the Advisory Agreement, the Adviser manages the operations of the Fund and manages the Fund’s investments in accordance with the stated policies of the Fund. As compensation for the investment advisory services provided to the Fund, the Adviser receives a monthly management fee equal to an annual rate of 1.00% of the Fund’s net assets. For the six month period ended August 31, 2021, the Adviser earned $328,578 of advisory fees.
Prior to June 12, 2021, the Fund had entered into an Investment Company Services Agreement (“ICSA”) with M3Sixty Administration, LLC (“M3Sixty” or “Prior Administrator”). Pursuant to the ICSA, M3Sixty provided day-to-day operational services to the Fund including, but not limited to: (a) Fund accounting services; (b) financial statement preparation; (c) valuation of the Fund's portfolio securities; (d) pricing the Fund's shares; (e) assistance in preparing tax returns; (f) preparation and filing of required regulatory reports; (g) communications with shareholders; (h) coordination of Board and shareholder meetings; (i) monitoring the Fund's legal compliance; and (j) maintaining shareholder account records.
For their services provided through June 11, 2021, M3Sixty earned $89,370 including compliance officer fees and out of pocket expenses.
Through June 11, 2021, certain officers of the Fund were also employees of the Prior Administrator.
Prior to June 12, 2021 the Fund had entered into a Distribution Agreement with Matrix 360 Distributors, LLC (“M3SixtyD”). Pursuant to the Distribution Agreement, M3SixtyD provided distribution services to the Fund through June 12, 2021. M3SixtyD served as underwriter/distributor of the Fund. M3SixtyD was an affiliate of M3Sixty. Fees earned by M3SixtyD were paid by the Adviser.
Effective June 12, 2021, Premier Fund Solutions, Inc. (“PFS” or “Administrator”) serves as the Administrator for all the Funds in the Trust, pursuant to a written agreement with the Trust. PFS provides day-to-day
2021 Semi-Annual Report 15
Notes to Financial Statements (Unaudited) - continued
administrative services to the Funds. For PFS’s services to the Funds, each Fund of the Trust pays PFS an annualized asset-based fee of 0.07% of average daily net assets up to $200 million, with lower fees at higher asset levels; subject to a minimum monthly fee of $2,800 per Fund, plus reimbursement of out of pocket expenses. For its services to the Fund, from June 12, 2021 through August 31, 2021, amounts earned by PFS were $10,415.
An officer of the Fund is also an employee of the Administrator.
6.) TAX MATTERS
For federal income tax purposes, at August 31, 2021 the cost of securities on a tax basis and the composition of gross unrealized appreciation (the excess of value over tax cost) and depreciation (the excess of tax cost over value) including written options were as follows:
| Cost of Investments | $ | 48,010,722 |
| |
| Gross Unrealized Appreciation | $ | 9,429,443 |
| Gross Unrealized Depreciation | | – |
| Net Unrealized Appreciation (Depreciation) on Investments | $ | 9,429,443 |
The difference between book basis and tax basis unrealized appreciation (depreciation) is primarily attributable to the tax treatment of derivatives.
The Fund’s tax basis distributable earnings are determined only at the end of each fiscal year. The tax character of distributable earnings (deficit) at February 28, 2021, the Fund’s most recent fiscal year-end, was as follows:
| Undistributed ordinary income | $ | 668,552 |
| Undistributed Long-Term Capital Gains | | 2,880,349 |
| Unrealized appreciation | | 1,516,708 |
| | $ | 5,065,609 |
Under current tax law, net capital losses realized after October 31st and net ordinary losses incurred after December 31st may be deferred and treated as occurring on the first day of the following fiscal year. As of February 28, 2021, the Fund did not defer any post-October losses or Post-December losses.
As of February 28, 2021, the Fund did not have any capital loss carryforwards available for federal income tax purposes to offset future capital gains.
As of February 28, 2021, no reclassifications to capital accounts were necessary.
During the year ended February 28, 2021, the Fund distributed $118,463 of ordinary income and $161,687 of long-term capital gains.
The Fund did not pay any distributions during the six month period ended August 31, 2021.
7.) COMMITMENTS AND CONTINGENCIES
In the normal course of business, the Trust may enter into contracts that may contain a variety of representations and warranties and provide general indemnifications. The Funds’ maximum exposure under these arrangements is dependent on future claims that may be made against the Funds and, therefore, cannot be estimated; however, management considers the risk of loss from such claims to be remote.
8.) COVID-19 RISKS
Unexpected local, regional or global events, such as war; acts of terrorism; financial, political or social disruptions; natural, environmental or man-made disasters; the spread of infectious illnesses or other public health issues; and recessions and depressions could have a significant impact on the Funds and its investments and may impair market liquidity. Such events can cause investor fear, which can adversely affect the economies of nations, regions and the market in general, in ways that cannot necessarily be foreseen. An outbreak of infectious respiratory illness known as COVID-19, which is caused by a novel coronavirus (SARS-CoV-2), was first detected in China in December 2019 and subsequently spread globally. This coron-avirus has resulted in, among other things, travel restrictions, closed international borders, enhanced health screenings at ports of entry and elsewhere, disruption of and delays in healthcare service preparation and delivery, prolonged quarantines, significant disruptions to business operations, market closures, cancellations and restrictions, supply chain disruptions, lower consumer demand, and significant volatility and declines in global financial markets, as well as general concern and uncertainty. The impact of COVID-19
2021 Semi-Annual Report 16
Notes to Financial Statements (Unaudited) - continued
has adversely affected, and other infectious illness outbreaks that may arise in the future could adversely affect, the economies of many nations and the entire global economy, individual issuers and capital markets in ways that cannot necessarily be foreseen. Public health crises caused by the COVID-19 outbreak may exacerbate other pre-existing political, social and economic risks in certain countries or globally. The duration of the COVID-19 outbreak and its effects cannot be determined with certainty.
9.) SUBSEQUENT EVENTS
Subsequent events after the date of the Statement of Assets and Liabilities have been evaluated through the date the financial statements were issued. Management has concluded that there are no other subsequent events requiring adjustment to or disclosure in the financial statements.
2021 Semi-Annual Report 17
ADDITIONAL INFORMATION
August 31, 2021
(Unaudited)
EXPENSE EXAMPLE |
As a shareholder of the Fund, you incur ongoing costs, including management fees and other Fund expenses. Although the Fund charges no sales loads or transaction fees, you will be assessed fees for outgoing wire transfers, returned checks and stop payment orders at prevailing rates charged by Mutual Shareholder Services, LLC, the Fund’s transfer agent. IRA accounts will be charged an $8.00 annual maintenance fee. The following example is intended to help you understand your ongoing costs of investing in the Fund and to compare these costs with similar costs of investing in other mutual funds. The example is based on an investment of $1,000 invested in the Fund on March 1, 2021 and held through August 31, 2021.
The first line of the table below provides information about actual account values and actual expenses. In order to estimate the expenses a shareholder paid during the period covered by this report, shareholders can divide their account value by $1,000 (for example, an $8,600 account value divided by $1,000 = 8.6) and then multiply the result by the number in the first line under the heading entitled “Expenses Paid During the Period.”
The second line of the table below provides information about hypothetical account values and hypothetical expenses based on the Fund’s actual expense ratios and an assumed rate of return of 5% per year before expenses, which is not the Fund’s actual return. The hypothetical account values and expenses may not be used to estimate the actual ending account balance or expenses paid by a shareholder for the period. Shareholders may use this information to compare the ongoing costs of investing in the Fund and other funds. In order to do so, compare these 5% hypothetical examples with the 5% hypothetical examples that appear in other funds’ shareholder reports.
Please note that the expenses shown in the table are meant to highlight your ongoing costs only and do not reflect any transactional costs, such as the annual maintenance fee charged to IRA accounts, or exchange fees. Therefore, the second line of the table is useful in comparing ongoing costs only, and will not help you determine the relative total costs of owning different funds. In addition, if these transactional costs were included, your costs would have been higher.
| | | | | | | Expenses Paid |
| | | Beginning | | Ending | | During the Period* |
| | | Account Value | | Account Value | | March 1, 2021 to |
| | | March 1, 2021 | | August 31, 2021 | | August 31, 2021 |
| |
| Actual | | $1,000.00 | | $1,125.70 | | $9.00 |
| |
| Hypothetical | | $1,000.00 | | $1,016.74 | | $8.54 |
| (5% annual return | | | | | | |
| before expenses) | | | | | | |
* Expenses are equal to the Fund’s annualized expense ratio of 1.68%, multiplied by the average
account value over the period, multiplied by 184/365 (to reflect the one-half year period).
AVAILABILITY OF QUARTERLY SCHEDULE OF INVESTMENTS
The Fund publicly files its complete schedules of portfolio holdings with the Securities and Exchange Commission (“SEC”) for the first and third quarters of each fiscal year on Form N-PORT. The Fund’s Form N-PORT is available on the SEC’s website at http://www.sec.gov.
A description of the policies and procedures that the Fund uses to determine how to vote proxies relating to portfolio securities is available without charge, upon request, by calling 1-877-244-6235; and on the Commission’s website at http://www.sec.gov.
Information regarding how the Fund voted proxies, Form N-PX, relating to portfolio securities during the most recent 12-month period ended June 30 is available without charge, upon request, by calling 1-877-244-6235. This information is also available on the SEC’s website at http://www.sec.gov.
2021 Semi-Annual Report 18
WP TRUST
127 NW 13th Street
Suite 13
Boca Raton, FL 33432
INVESTMENT ADVISER
IPS Strategic Capital, Inc.
215 S. Wadsworth Blvd.
Suite 540
Denver, CO 80226
FUND ADMINISTRATOR
Premier Fund Solutions, Inc.
1939 Friendship Drive
Suite C
El Cajon, CA 92020
TRANSFER AGENT AND FUND ACCOUNTANT
Mutual Shareholder Services, LLC
8000 Town Centre Drive
Suite 400
Broadview Heights, OH 44147
DISTRIBUTOR
Arbor Court Capital, LLC
8000 Town Centre Drive
Suite 400
Broadview Heights, OH 44147
INDEPENDENT REGISTERED PUBLIC ACCOUNTING FIRM
Cohen & Company, Ltd.
342 N. Water Street
Suite 830
Milwaukee, WI 53202
LEGAL COUNSEL
Practus, LLP
11300 Tomahawk Creek Parkway
Suite 310
Leawood, KS 66211
CUSTODIAN BANK
Fifth Third Bank
Fifth Third Center
38 Fountain Square Plaza
Cincinnati, OH 45263 |
Item 2. Code of Ethics. Not applicable.
Item 3. Audit Committee Financial Expert. Not applicable.
Item 4. Principal Accountant Fees and Services. Not applicable.
Item 5. Audit Committee of Listed Companies. Not applicable.
Item 6. Investments.
(a) Not applicable. Schedule filed with Item 1.
(b) Not applicable.
Item 7. Disclosure of Proxy Voting Policies and Procedures for Closed-End Management Investment Companies. Not applicable.
Item 8. Portfolio Managers of Closed End Management Investment Companies. Not applicable.
Item 9. Purchases of Equity Securities by Closed-End Management Investment Companies and Affiliated Purchasers. Not applicable.
Item 10. Submission of Matters to a Vote of Security Holders.
The registrant has not adopted procedures by which shareholders may recommend nominees to the registrant’s board of trustees.
Item 11. Controls and Procedures.
(a) The Registrant’s president and chief financial officer concluded that the disclosure controls and procedures (as defined in Rule 30a-3(c) under the Act (17 CFR 270.30a -3(c))) as of a date within 90 days of the filing date of the report that includes the disclosure required by this paragraph, based on the evaluation of these controls and procedures required by Rule 30a-3(b) under the Act (17 CFR 270.30a -3(b)) and Rules 13a-15(b) or 15d-15(b) under the Exchange Act (17 CFR 240.13a -15(b) or 240.15d -15(b)).
(b) There were no changes in the registrant’s internal control over financial reporting (as defined in Rule 30a-3(d) under the Act (17 CFR 270.30a -3(d)) that occurred during the period covered by this report that has materially affected, or is reasonably likely to materially affect, the registrant’s internal control over financial reporting.
Item 12. Disclosure of Securities Lending Activities for Closed-End Management Investment Companies.
Not applicable.
Item 13. Exhibits.
(a)(1) Code of Ethics. Not applicable.
(a)(2) Certifications pursuant to Section 302 of the Sarbanes-Oxley Act of 2002. Filed herewith.
(a)(3) Not applicable.
(a)(4) Not applicable.
(b) Certification pursuant to Section 906 of the Sarbanes-Oxley Act of 2002. Filed herewith.
Pursuant to the requirements of the Securities Exchange Act of 1934 and the Investment Company Act of 1940, the registrant has duly caused this report to be signed on its behalf by the undersigned, thereunto duly authorized.
| | By: /s/Charles S. Stoll
Charles S. Stoll
Principal Executive Officer |
Pursuant to the requirements of the Securities Exchange Act of 1934 and the Investment Company Act of 1940, this report has been signed below by the following persons on behalf of the registrant and in the capacities and on the dates indicated.
| | By: /s/Charles S. Stoll
Charles S. Stoll
Principal Executive Officer |
| | By: /s/James Craft
James Craft
Chief Financial Officer |