Table of Contents
UNITED STATES
SECURITIES AND EXCHANGE COMMISSION
Washington, D.C. 20549
FORM N-CSR
CERTIFIED SHAREHOLDER REPORT OF REGISTERED
MANAGEMENT INVESTMENT COMPANIES
Investment Company Act file number 811-23096
Legg Mason ETF Investment Trust
(Exact name of registrant as specified in charter)
620 Eighth Avenue, 49th Floor, New York, NY 10018
(Address of principal executive offices) (Zip code)
Robert I. Frenkel, Esq.
Legg Mason & Co., LLC
100 First Stamford Place
Stamford, CT 06902
(Name and address of agent for service)
Registrant’s telephone number, including area code: 1-877-721-1926
Date of fiscal year end: July 31
Date of reporting period: January 31, 2018
Table of Contents
Explanatory Note:
The Registrant is filing this amendment to its Form N-CSRS for the period ended January 31, 2018, filed with the Securities and Exchange Commission on March 26, 2018 (Accession Number 0001193125-18-095674). The sole purpose of this amendment is to correct the fund market price and fund market total return presented in the Investment Commentary for the Legg Mason Small-Cap Quality Value ETF within Item 1, Report to Stockholders. Except as set forth above, this amendment does not amend, update or change any other items or disclosures found in the original Form N-CSRS filing.
Table of Contents
| ITEM 1. | REPORT TO STOCKHOLDERS. |
The Semi-Annual Report to Stockholders is filed herewith.
Table of Contents

| Semi-Annual Report | January 31, 2018 |
LEGG MASON
SMALL-CAP QUALITY VALUE ETF
SQLV
| INVESTMENT PRODUCTS: NOT FDIC INSURED • NO BANK GUARANTEE • MAY LOSE VALUE |
Table of Contents
Fund objective
The Fund seeks to track the investment results of an index composed of equity securities of small-capitalization companies that are traded in the United States.

Dear Shareholder,
We are pleased to provide the semi-annual report of Legg Mason Small-Cap Quality Value ETF for the six-month reporting period ended January 31, 2018. Please read on for Fund performance information and a detailed look at prevailing economic and market conditions during the Fund’s reporting period.
As always, we remain committed to providing you with excellent service and a full spectrum of investment choices. We also remain committed to supplementing the support you receive from your financial advisor. One way we accomplish this is through our website, www.leggmason.com. Here you can gain immediate access to market and investment information, including:
| • | Fund net asset value and market price, |
| • | Market insights and commentaries from our portfolio managers, and |
| • | A host of educational resources. |
We look forward to helping you meet your financial goals.
Sincerely,

Jane Trust, CFA
President and Chief Executive Officer
February 28, 2018
| II | Legg Mason Small-Cap Quality Value ETF |
Table of Contents
Economic review
Economic activity in the U.S. was somewhat mixed during the six months ended January 31, 2018 (the “reporting period”). Looking back, the U.S. Department of Commerce reported that second and third quarter 2017 U.S. gross domestic product (“GDP”)i growth was 3.1% and 3.2%, respectively. The U.S. Department of Commerce’s second reading for fourth quarter 2017 GDP growth — released after the reporting period ended — was 2.5%. The deceleration in growth reflected a downturn in private investor investment, which was partially offset by accelerations in personal consumption expenditures (“PCE”), exports, state and local government spending, nonresidential fixed investment and federal government spending.
Job growth in the U.S. was solid overall and supported the economy during the reporting period. When the reporting period ended on January 31, 2018, the unemployment rate was 4.1%, as reported by the U.S. Department of Labor. This equaled the lowest unemployment rate since December 2000. The percentage of longer-term unemployed declined during the reporting period. In January 2018, 21.5% of Americans looking for a job had been out of work for more than six months, versus 24.7% when the period began.
| Legg Mason Small-Cap Quality Value ETF | III |
Table of Contents
Investment commentary (cont’d)
Market review
Q. How did the Federal Reserve Board (the “Fed”)ii respond to the economic environment?
A. Looking back, at its meeting that ended on March 15, 2017, the Fed increased the federal funds rateiii 0.25% to a range between 0.75% and 1.00%. At its meeting that concluded on June 14, 2017, the Fed raised rates to a range between 1.00% and 1.25%. The Fed raised the rate once during the reporting period. During its meeting that concluded on September 20, 2017, the Fed kept rates on hold, but reiterated its intention to begin reducing its balance sheet, saying, “In October, the Committee will initiate the balance sheet normalization program….” At its meeting that ended on December 13, 2017, the Fed raised rates to a range between 1.25% and 1.50%. As expected, the Fed kept rates on hold at its meeting that concluded on January 31, 2018.
Q. What factors impacted the U.S. stock market during the reporting period?
A. The U.S. stock market posted strong results during the reporting period. The market moved higher during all six months of the period and reached several new all-time highs. This was driven by overall solid corporate profits, signs of improving economic growth, expectations for a rollback for certain government regulations and, in December 2017, the signing of the U.S. tax reform bill. All told, for the six months ended January 31, 2018, the S&P 500 Indexiv gained 15.43%.
Looking at the U.S. stock market more closely, large-cap stocks, as measured by the Russell 1000 Indexv, generated the strongest returns, as they gained 15.19% over the reporting period. In contrast, mid-cap stocks, as measured by the Russell Midcap Indexvi, returned 12.23%, whereas small-cap stocks, as measured by the Russell 2000 Indexvii, generated the weakest relative results, gaining 11.23%. From an investment style perspective, growth and value stocks, as measured by the Russell 3000 Growthviii and Russell 3000 Valueix Indices, returned 18.79% and 11.07%, respectively, during the six months ended January 31, 2018.
Performance review
For the six months ended January 31, 2018, Legg Mason Small-Cap Quality Value ETF generated a 10.95% return on a net asset value (“NAV”)x basis and 10.90% based on its market pricexi per share.
The performance table shows the Fund’s total return for the six months ended January 31, 2018 based on its NAV and market price as of January 31, 2018. The Fund seeks to track the investment results of an index composed of equity securities of small-capitalization companies that are traded in the United States, the Royce Small-Cap Quality Value Indexxii, which returned 11.44% for the same period. The Fund’s broad-based market index, the Russell 2000 Index returned 11.23% over the same time frame. The Lipper Small-Cap Value Funds Category Average1 returned 9.74% for the same period. Please note that Lipper performance returns are based on each fund’s NAV.
| 1 | Lipper, Inc., a wholly-owned subsidiary of Reuters, provides independent insight on global collective investments. Returns are based on the six-month period ended January 31, 2018, including the reinvestment of all distributions, including returns of capital, if any, calculated among the 281 funds in the Fund’s Lipper category. |
| IV | Legg Mason Small-Cap Quality Value ETF |
Table of Contents
| Performance Snapshot as of January 31, 2018 (unaudited) | ||||
| 6 months | ||||
| Legg Mason Small-Cap Quality Value ETF: | ||||
$27.57 (NAV) | 10.95 | %*† | ||
$27.58 (Market Price) | 10.90 | %*‡ | ||
| Royce Small-Cap Quality Value Index | 11.44 | % | ||
| Russell 2000 Index | 11.23 | % | ||
| Lipper Small-Cap Value Funds Category Average1 | 9.74 | % | ||
The performance shown represents past performance. Past performance is no guarantee of future results and current performance may be higher or lower than the performance shown. Principal value and investment returns will fluctuate so shares, when sold, may be worth more or less than their original cost. Performance data current to the most recent month-end is available at www.leggmason.com/etf.
Investors buy and sell shares of an exchange-traded fund (“ETF”) at market price (not NAV) in the secondary market throughout the trading day. These shares are not individually available for purchase or redemption directly from the ETF. Market price returns shown are typically based upon the mid-point between the bid and ask on the Fund’s principal trading market when the Fund’s NAV is determined, which is typically 4:00 p.m. Eastern time (US). These returns do not represent investors’ returns had they traded shares at other times. Performance figures for periods shorter than one year represent cumulative figures and are not annualized.
Information showing the number of days the market price of the Fund’s shares was greater than the Fund’s NAV and the number of days it was less than the Fund’s NAV (i.e., premium or discount) for various time periods is available by visiting the Fund’s website at www.leggmason.com/etf.
As of the Fund’s current prospectus dated July 11, 2017, the gross total annual fund operating expense ratio for the Fund was 0.60%.
* Total returns are based on changes in NAV or market price, respectively. Returns reflect the deduction of all Fund expenses. Returns do not reflect the deduction of brokerage commissions or taxes that investors pay on distributions or the sale of shares.
† Total return assumes the reinvestment of all distributions, including returns of capital, if any, at NAV.
‡ Total return assumes the reinvestment of all distributions, including returns of capital, if any, at market price.
Looking for additional information?
The Fund’s daily NAV is available on-line at www.leggmason.com/etf. The Fund is traded under the symbol “SQLV” and its closing market price is available on most financial websites. In a continuing effort to provide information concerning the Fund, shareholders may call 1-877-721-1926 (toll free), Monday through Friday from 8:00 a.m. to 5:30 p.m. Eastern Time, for the Fund’s current NAV, market price and other information.
| 1 | Lipper, Inc., a wholly-owned subsidiary of Reuters, provides independent insight on global collective investments. Returns are based on the six-month period ended January 31, 2018, including the reinvestment of all distributions, including returns of capital, if any, calculated among the 281 funds in the Fund’s Lipper category. |
| Legg Mason Small-Cap Quality Value ETF | V |
Table of Contents
Investment commentary (cont’d)
As always, thank you for your confidence in our stewardship of your assets.
Sincerely,
Jane Trust, CFA
President and Chief Executive Officer
February 28, 2018
RISKS: The Fund is newly organized, with a limited history of operations. Equity securities are subject to market and price fluctuations. The Fund invests primarily in small-cap stocks, which may involve considerably more risk than investing in larger-cap stocks. The Fund has significant exposure to U.S. issuers. A decrease in imports or exports, changes in trade regulations and/or an economic recession in the United States may have a material adverse effect on the U.S. economy and the securities listed on U.S. exchanges. There is no guarantee that the Fund will achieve a high degree of correlation to the index it seeks to track. The Fund does not seek to outperform the index it tracks, and does not seek temporary defensive positions when markets decline or appear overvalued. The Fund may focus its investments in certain industries, increasing its vulnerability to market volatility. Diversification does not ensure gains or protect against market declines. Derivatives, such as options and futures, can be illiquid, may disproportionately increase losses and have a potentially large impact on Fund performance. Please see the Fund’s prospectus for a more complete discussion of these and other risks and the Fund’s investment strategies.
All investments are subject to risk including the possible loss of principal. Past performance is no guarantee of future results. An index is a statistical composite that tracks a specified financial market, sector or rules-based investment process. Unlike a fund, an index does not actually hold a portfolio of securities and therefore does not incur the expenses incurred by a fund. These expenses negatively impact fund performance. All index performance reflects no deduction for fees, expenses or taxes. Please note that an investor cannot invest directly in an index.
The information provided is not intended to be a forecast of future events, a guarantee of future results or investment advice. Views expressed may differ from those of the firm as a whole.
| VI | Legg Mason Small-Cap Quality Value ETF |
Table of Contents
| i | Gross domestic product (“GDP”) is the market value of all final goods and services produced within a country in a given period of time. |
| ii | The Federal Reserve Board (the “Fed”) is responsible for the formulation of U.S. policies designed to promote economic growth, full employment, stable prices and a sustainable pattern of international trade and payments. |
| iii | The federal funds rate is the rate charged by one depository institution on an overnight sale of immediately available funds (balances at the Federal Reserve) to another depository institution; the rate may vary from depository institution to depository institution and from day to day. |
| iv | The S&P 500 Index is an unmanaged index of 500 stocks and is generally representative of the performance of larger companies in the U.S. |
| v | The Russell 1000 Index measures the performance of the large-cap segment of the U.S. equity universe. It is a subset of the Russell 3000 Index and includes approximately 1,000 of the largest securities based on a combination of their market cap and current index membership. The Russell 1000 represents approximately 90% of the U.S. market. The Russell 3000 Index measures the performance of the 3,000 largest U.S. companies based on total market capitalization, which represents approximately 98% of the U.S. equity market. |
| vi | The Russell Midcap Index measures the performance of the mid-cap segment of the U.S. equity universe. The Russell Midcap is a subset of the Russell 1000 Index. It includes approximately 800 of the smallest securities based on a combination of their market cap and current index membership. The Russell Midcap represents approximately 31% of the total market capitalization of the Russell 1000 companies. |
| vii | The Russell 2000 Index measures the performance of the small-cap segment of the U.S. equity universe. The Russell 2000 is a subset of the Russell 3000 Index representing approximately 10% of the total market capitalization of that index. It includes approximately 2,000 of the smallest securities based on a combination of their market cap and current index membership. |
| viii | The Russell 3000 Growth Index measures the performance of the broad growth segment of the U.S. equity universe. It includes those Russell 3000 Index companies with higher price-to-book ratios and higher forecasted growth values. (A price-to-book ratio is the price of a stock compared to the difference between a company’s assets and liabilities.) |
| ix | The Russell 3000 Value Index measures the performance of the broad value segment of the U.S. equity value universe. It includes those Russell 3000 Index companies with lower price-to-book ratios and lower forecasted growth values. |
| x | Net Asset Value (NAV) is calculated by subtracting total liabilities from total assets and dividing the results by the number of shares outstanding. |
| xi | Market Price is determined by supply and demand. It is the price at which an investor purchases or sells shares of the Fund. The Market Price may differ from the Fund’s NAV. |
| xii | The Royce Small-Cap Quality Value Index is a proprietary index composed of small-cap stocks trading in the United States with relatively low valuations, high profitability and high debt coverage compared with the average of stocks in the investment universe. |
| Legg Mason Small-Cap Quality Value ETF | VII |
Table of Contents
Investment breakdown (%) as a percent of total investments
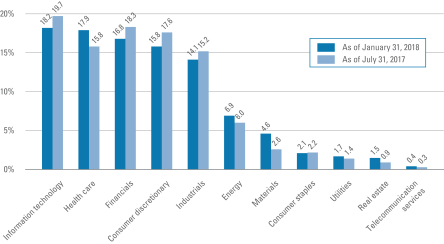
| † | The bar graph above represents the composition of the Fund’s investments as of January 31, 2018 and July 31,2017. The composition of the Fund’s investments is subject to change at any time. |
| Legg Mason Small-Cap Quality Value ETF 2018 Semi-Annual Report | 1 |
Table of Contents
Example
As a shareholder of the Fund, you may incur two types of costs: (1) transaction costs, such as brokerage commissions paid on purchases and sales of Fund shares; and (2) ongoing costs, including management fees; and other Fund expenses. This example is intended to help you understand your ongoing costs (in dollars) of investing in the Fund and to compare these costs with the ongoing costs of investing in other funds.
This example is based on an investment of $1,000 invested on August 1, 2017 and held for the six months ended January 31, 2018.
Actual expenses
The table below titled “Based on Actual Total Return” provides information about actual account values and actual expenses. You may use the information provided in this table, together with the amount you invested, to estimate the expenses that you paid over the period. To estimate the expenses you paid on your account, divide your ending account value by $1,000 (for example, an $8,600 ending account value divided by $1,000 = 8.6), then multiply the result by the number under the heading entitled “Expenses Paid During the Period”.
Hypothetical example for comparison purposes
The table below titled “Based on Hypothetical Total Return” provides information about hypothetical account values and hypothetical expenses based on the actual expense ratio and an assumed rate of return of 5.00% per year before expenses, which is not the Fund’s actual return. The hypothetical account values and expenses may not be used to estimate the actual ending account balance or expenses you paid for the period. You may use the information provided in this table to compare the ongoing costs of investing in the Fund and other funds. To do so, compare the 5.00% hypothetical example relating to the Fund with the 5.00% hypothetical examples that appear in the shareholder reports of the other funds.
Please note that the expenses shown in the table below are meant to highlight your ongoing costs only and do not reflect any transactional costs, such as brokerage commissions paid on purchases and sales of Fund shares. Therefore, the table is useful in comparing ongoing costs only, and will not help you determine the relative total costs of owning different funds. In addition, if these transaction costs were included, your costs would have been higher.
| Based on actual total return1 | Based on hypothetical total return1 | |||||||||||||||||||||||||||||||||||||||||||||||||
| Actual Total Return2 | Beginning Account Value | Ending Account Value | Annualized Expense Ratio | Expenses Paid During the Period3 | Hypothetical Annualized Total Return | Beginning Account Value | Ending Account Value | Annualized Expense Ratio | Expenses Paid During the Period3 | |||||||||||||||||||||||||||||||||||||||||
| 10.95% | $ | 1,000.00 | $ | 1,109.50 | 0.60 | % | $ | 3.19 | 5.00 | % | $1,000.00 | $ | 1,022.18 | 0.60 | % | $ | 3.06 | |||||||||||||||||||||||||||||||||
| 1 | For the six months ended January 31, 2018. |
| 2 | Assumes the reinvestment of all distributions, including returns of capital, if any, at net asset value. Total return is not annualized, as it may not be representative of the total return for the year. Performance figures may reflect fee waivers and/or expense reimbursements. In the absence of fee waivers and/or expense reimbursements, the total return would have been lower. Past performance is no guarantee of future results. |
| 3 | Expenses (net of fee waivers and/or expense reimbursements) are equal to the Fund’s annualized expense ratio multiplied by the average account value over the period, multiplied by the number of days in the most recent fiscal half-year (184), then divided by 365. |
| 2 | Legg Mason Small-Cap Quality Value ETF 2018 Semi-Annual Report |
Table of Contents
Schedule of investments (unaudited)
January 31, 2018
Legg Mason Small-Cap Quality Value ETF
| Security | Shares | Value | ||||||||||||||
| Common Stocks — 99.1% | ||||||||||||||||
| Consumer Discretionary — 15.7% | ||||||||||||||||
Auto Components — 0.9% | ||||||||||||||||
Cooper-Standard Holdings Inc. | 123 | $ | 15,325 | * | ||||||||||||
Shiloh Industries Inc. | 1,196 | 8,910 | * | |||||||||||||
Total Auto Components | 24,235 | |||||||||||||||
Diversified Consumer Services — 2.7% | ||||||||||||||||
Adtalem Global Education Inc. | 341 | 15,686 | * | |||||||||||||
American Public Education Inc. | 353 | 8,966 | * | |||||||||||||
Cambium Learning Group Inc. | 1,175 | 8,249 | * | |||||||||||||
Capella Education Co. | 135 | 10,739 | ||||||||||||||
K12 Inc. | 728 | 12,631 | * | |||||||||||||
Liberty Tax Inc. | 764 | 7,869 | ||||||||||||||
Strayer Education Inc. | 105 | 9,710 | ||||||||||||||
Total Diversified Consumer Services | 73,850 | |||||||||||||||
Hotels, Restaurants & Leisure — 1.5% | ||||||||||||||||
Brinker International Inc. | 433 | 15,735 | ||||||||||||||
Cheesecake Factory Inc. | 313 | 15,397 | ||||||||||||||
Ruth’s Hospitality Group Inc. | 440 | 10,428 | ||||||||||||||
Total Hotels, Restaurants & Leisure | 41,560 | |||||||||||||||
Household Durables — 0.4% | ||||||||||||||||
Hamilton Beach Brands Holding Co., Class A Shares | 467 | 12,007 | ||||||||||||||
Internet & Direct Marketing Retail — 0.4% | ||||||||||||||||
PetMed Express Inc. | 216 | 9,763 | ||||||||||||||
Leisure Products — 0.9% | ||||||||||||||||
MCBC Holdings Inc. | 504 | 12,181 | * | |||||||||||||
Sturm Ruger & Co. Inc. | 225 | 11,914 | ||||||||||||||
Total Leisure Products | 24,095 | |||||||||||||||
Media — 2.1% | ||||||||||||||||
Gannett Co. Inc. | 1,499 | 17,688 | ||||||||||||||
MSG Networks Inc., Class A Shares | 1,165 | 27,960 | * | |||||||||||||
tronc Inc. | 658 | 13,423 | * | |||||||||||||
Total Media | 59,071 | |||||||||||||||
Multiline Retail — 0.7% | ||||||||||||||||
Big Lots Inc. | 309 | 18,781 | ||||||||||||||
Specialty Retail — 4.1% | ||||||||||||||||
Buckle Inc. | 748 | 14,997 | ||||||||||||||
Caleres Inc. | 450 | 13,338 | ||||||||||||||
Cato Corp., Class A Shares | 854 | 10,146 | ||||||||||||||
See Notes to Financial Statements.
| Legg Mason Small-Cap Quality Value ETF 2018 Semi-Annual Report | 3 |
Table of Contents
Schedule of investments (unaudited) (cont’d)
January 31, 2018
Legg Mason Small-Cap Quality Value ETF
| Security | Shares | Value | ||||||||||||||
Specialty Retail — continued | ||||||||||||||||
Children’s Place Inc. | 101 | $ | 15,130 | |||||||||||||
Francesca’s Holdings Corp. | 1,313 | 7,655 | * | |||||||||||||
Hibbett Sports Inc. | 519 | 11,729 | * | |||||||||||||
Sally Beauty Holdings Inc. | 903 | 14,999 | * | |||||||||||||
Sleep Number Corp. | 294 | 11,066 | * | |||||||||||||
Tilly’s Inc., Class A Shares | 613 | 9,146 | ||||||||||||||
Winmark Corp. | 36 | 4,824 | ||||||||||||||
Total Specialty Retail | 113,030 | |||||||||||||||
Textiles, Apparel & Luxury Goods — 2.0% | ||||||||||||||||
Culp Inc. | 279 | 8,872 | ||||||||||||||
Deckers Outdoor Corp. | 178 | 15,256 | * | |||||||||||||
Fossil Group Inc. | 2,307 | 18,364 | * | |||||||||||||
Lakeland Industries Inc. | 416 | 5,866 | * | |||||||||||||
Rocky Brands Inc. | 451 | 7,757 | ||||||||||||||
Total Textiles, Apparel & Luxury Goods | 56,115 | |||||||||||||||
Total Consumer Discretionary | 432,507 | |||||||||||||||
| Consumer Staples — 2.1% | ||||||||||||||||
Beverages — 0.4% | ||||||||||||||||
Boston Beer Co. Inc., Class A Shares | 62 | 11,771 | * | |||||||||||||
Food & Staples Retailing — 0.6% | ||||||||||||||||
United Natural Foods Inc. | 366 | 17,421 | * | |||||||||||||
Personal Products — 0.5% | ||||||||||||||||
USANA Health Sciences Inc. | 161 | 12,019 | * | |||||||||||||
Tobacco — 0.6% | ||||||||||||||||
Vector Group Ltd. | 808 | 17,210 | ||||||||||||||
Total Consumer Staples | 58,421 | |||||||||||||||
| Energy — 6.8% | ||||||||||||||||
Energy Equipment & Services — 2.3% | ||||||||||||||||
Dril-Quip Inc. | 300 | 15,495 | * | |||||||||||||
Exterran Corp. | 414 | 11,956 | * | |||||||||||||
Natural Gas Services Group Inc. | 313 | 8,623 | * | |||||||||||||
RigNet Inc. | 509 | 8,399 | * | |||||||||||||
Rowan Cos. PLC, Class A Shares | 1,331 | 19,592 | * | |||||||||||||
Total Energy Equipment & Services | 64,065 | |||||||||||||||
Oil, Gas & Consumable Fuels — 4.5% | ||||||||||||||||
Cloud Peak Energy Inc. | 2,770 | 13,850 | * | |||||||||||||
CVR Energy Inc. | 600 | 21,474 | ||||||||||||||
Evolution Petroleum Corp. | 1,116 | 8,538 | ||||||||||||||
See Notes to Financial Statements.
| 4 | Legg Mason Small-Cap Quality Value ETF 2018 Semi-Annual Report |
Table of Contents
Legg Mason Small-Cap Quality Value ETF
| Security | Shares | Value | ||||||||||||||
Oil, Gas & Consumable Fuels — continued | ||||||||||||||||
Hallador Energy Co. | 1,594 | $ | 11,126 | |||||||||||||
NACCO Industries Inc., Class A Shares | 265 | 11,143 | ||||||||||||||
NuStar GP Holdings LLC | 990 | 17,573 | ||||||||||||||
Overseas Shipholding Group Inc., Class A Shares | 5,382 | 11,356 | * | |||||||||||||
Pacific Ethanol Inc. | 2,466 | 10,357 | * | |||||||||||||
Penn Virginia Corp. | 212 | 8,955 | * | |||||||||||||
REX American Resources Corp. | 114 | 9,308 | * | |||||||||||||
Total Oil, Gas & Consumable Fuels | 123,680 | |||||||||||||||
Total Energy | 187,745 | |||||||||||||||
| Financials — 16.6% | ||||||||||||||||
Banks — 8.6% | ||||||||||||||||
Bank of Princeton | 199 | 6,517 | * | |||||||||||||
Byline Bancorp Inc. | 390 | 8,724 | * | |||||||||||||
Camden National Corp. | 236 | 10,021 | ||||||||||||||
Central Valley Community Bancorp | 388 | 7,523 | ||||||||||||||
City Holding Co. | 174 | 11,971 | ||||||||||||||
Community Trust Bancorp Inc. | 242 | 11,447 | ||||||||||||||
Customers Bancorp Inc. | 362 | 11,095 | * | |||||||||||||
Fidelity Southern Corp. | 447 | 10,710 | ||||||||||||||
Financial Institutions Inc. | 306 | 9,532 | ||||||||||||||
First Financial Corp. | 227 | 10,510 | ||||||||||||||
First Internet Bancorp | 187 | 7,003 | ||||||||||||||
Flushing Financial Corp. | 413 | 11,630 | ||||||||||||||
Franklin Financial Network Inc. | 246 | 7,934 | * | |||||||||||||
Great Southern Bancorp Inc. | 207 | 10,505 | ||||||||||||||
Great Western Bancorp Inc. | 379 | 15,975 | ||||||||||||||
Hanmi Financial Corp. | 374 | 11,781 | ||||||||||||||
Heartland Financial USA Inc. | 248 | 13,181 | ||||||||||||||
Hilltop Holdings Inc. | 588 | 15,400 | ||||||||||||||
Northeast Bancorp | 246 | 5,498 | ||||||||||||||
Old National Bancorp | 877 | 15,172 | ||||||||||||||
RBB Bancorp | 304 | 8,172 | ||||||||||||||
Sun Bancorp Inc. | 355 | 8,698 | ||||||||||||||
West Bancorp Inc. | 347 | 8,883 | ||||||||||||||
Total Banks | 237,882 | |||||||||||||||
Capital Markets — 2.3% | ||||||||||||||||
Cohen & Steers Inc. | 318 | 12,965 | ||||||||||||||
Diamond Hill Investment Group Inc. | 50 | 10,518 | ||||||||||||||
See Notes to Financial Statements.
| Legg Mason Small-Cap Quality Value ETF 2018 Semi-Annual Report | 5 |
Table of Contents
Schedule of investments (unaudited) (cont’d)
January 31, 2018
Legg Mason Small-Cap Quality Value ETF
| Security | Shares | Value | ||||||||||||||
Capital Markets — continued | ||||||||||||||||
GAMCO Investors Inc., Class A Shares | 361 | $ | 10,642 | |||||||||||||
Waddell & Reed Financial Inc., Class A Shares | 850 | 19,550 | ||||||||||||||
Westwood Holdings Group Inc. | 154 | 10,082 | ||||||||||||||
Total Capital Markets | 63,757 | |||||||||||||||
Consumer Finance — 0.7% | ||||||||||||||||
World Acceptance Corp. | 158 | 18,652 | * | |||||||||||||
Insurance — 1.8% | ||||||||||||||||
Genworth Financial Inc., Class A Shares | 8,454 | 25,869 | * | |||||||||||||
Investors Title Co. | 41 | 7,974 | ||||||||||||||
Universal Insurance Holdings Inc. | 517 | 15,200 | ||||||||||||||
Total Insurance | 49,043 | |||||||||||||||
Thrifts & Mortgage Finance — 3.2% | ||||||||||||||||
BofI Holding Inc. | 440 | 15,827 | * | |||||||||||||
Flagstar Bancorp Inc. | 329 | 12,255 | * | |||||||||||||
FS Bancorp Inc. | 106 | 6,079 | ||||||||||||||
Nationstar Mortgage Holdings Inc. | 741 | 13,145 | * | |||||||||||||
NMI Holdings Inc., Class A Shares | 542 | 9,946 | * | |||||||||||||
Oritani Financial Corp. | 783 | 13,076 | ||||||||||||||
Timberland Bancorp Inc. | 244 | 6,808 | ||||||||||||||
United Financial Bancorp Inc. | 668 | 11,196 | ||||||||||||||
Total Thrifts & Mortgage Finance | 88,332 | |||||||||||||||
Total Financials | 457,666 | |||||||||||||||
| Health Care — 17.7% | ||||||||||||||||
Biotechnology — 5.9% | ||||||||||||||||
Akebia Therapeutics Inc. | 347 | 5,129 | * | |||||||||||||
AMAG Pharmaceuticals Inc. | 859 | 12,327 | * | |||||||||||||
BioSpecifics Technologies Corp. | 138 | 5,909 | * | |||||||||||||
Calithera Biosciences Inc. | 656 | 5,248 | * | |||||||||||||
Conatus Pharmaceuticals Inc. | 920 | 5,115 | * | |||||||||||||
CytomX Therapeutics Inc. | 366 | 9,790 | * | |||||||||||||
Eagle Pharmaceuticals Inc. | 133 | 7,949 | * | |||||||||||||
Emergent BioSolutions Inc. | 232 | 11,319 | * | |||||||||||||
Enanta Pharmaceuticals Inc. | 188 | 15,971 | * | |||||||||||||
Jounce Therapeutics Inc. | 588 | 14,218 | * | |||||||||||||
Ligand Pharmaceuticals Inc. | 70 | 11,033 | * | |||||||||||||
Mersana Therapeutics Inc. | 342 | 4,874 | * | |||||||||||||
Momenta Pharmaceuticals Inc. | 608 | 10,336 | * | |||||||||||||
Myriad Genetics Inc. | 389 | 14,346 | * | |||||||||||||
See Notes to Financial Statements.
| 6 | Legg Mason Small-Cap Quality Value ETF 2018 Semi-Annual Report |
Table of Contents
Legg Mason Small-Cap Quality Value ETF
| Security | Shares | Value | ||||||||||||||
Biotechnology — continued | ||||||||||||||||
PDL BioPharma Inc. | 5,015 | $ | 13,841 | * | ||||||||||||
Pieris Pharmaceuticals Inc. | 752 | 5,663 | * | |||||||||||||
Repligen Corp. | 251 | 8,878 | * | |||||||||||||
Total Biotechnology | 161,946 | |||||||||||||||
Health Care Equipment & Supplies — 7.7% | ||||||||||||||||
Abaxis Inc. | 205 | 14,688 | ||||||||||||||
Analogic Corp. | 126 | 10,446 | ||||||||||||||
AngioDynamics Inc. | 587 | 10,220 | * | |||||||||||||
Anika Therapeutics Inc. | 154 | 10,275 | * | |||||||||||||
Atrion Corp. | 14 | 8,056 | ||||||||||||||
CONMED Corp. | 242 | 13,983 | ||||||||||||||
CryoLife Inc. | 405 | 7,634 | * | |||||||||||||
Cutera Inc. | 119 | 5,902 | * | |||||||||||||
Exactech Inc. | 154 | 7,715 | * | |||||||||||||
Fonar Corp. | 269 | 6,604 | * | |||||||||||||
Haemonetics Corp. | 208 | 13,447 | * | |||||||||||||
Inogen Inc. | 70 | 8,529 | * | |||||||||||||
Lantheus Holdings Inc. | 353 | 8,119 | * | |||||||||||||
LeMaitre Vascular Inc. | 220 | 7,656 | ||||||||||||||
Meridian Bioscience Inc. | 783 | 12,254 | ||||||||||||||
Natus Medical Inc. | 248 | 7,700 | * | |||||||||||||
Neogen Corp. | 164 | 9,681 | * | |||||||||||||
OraSure Technologies Inc. | 455 | 9,901 | * | |||||||||||||
Quidel Corp. | 193 | 8,836 | * | |||||||||||||
Surmodics Inc. | 224 | 6,563 | * | |||||||||||||
Tactile Systems Technology Inc. | 189 | 5,959 | * | |||||||||||||
Utah Medical Products Inc. | 88 | 7,929 | ||||||||||||||
Varex Imaging Corp. | 271 | 11,509 | * | |||||||||||||
Total Health Care Equipment & Supplies | 213,606 | |||||||||||||||
Health Care Providers & Services — 2.0% | ||||||||||||||||
Aceto Corp. | 1,017 | 11,197 | ||||||||||||||
National Research Corp., Class A Shares | 277 | 10,429 | ||||||||||||||
Premier Inc., Class A Shares | 495 | 16,063 | * | |||||||||||||
Psychemedics Corp. | 284 | 5,683 | ||||||||||||||
Tivity Health Inc. | 277 | 10,734 | * | |||||||||||||
Total Health Care Providers & Services | 54,106 | |||||||||||||||
See Notes to Financial Statements.
| Legg Mason Small-Cap Quality Value ETF 2018 Semi-Annual Report | 7 |
Table of Contents
Schedule of investments (unaudited) (cont’d)
January 31, 2018
Legg Mason Small-Cap Quality Value ETF
| Security | Shares | Value | ||||||||||||||
Health Care Technology — 0.6% | ||||||||||||||||
Quality Systems Inc. | 853 | $ | 11,089 | * | ||||||||||||
Simulations Plus Inc. | 377 | 6,089 | ||||||||||||||
Total Health Care Technology | 17,178 | |||||||||||||||
Life Sciences Tools & Services — 0.3% | ||||||||||||||||
Luminex Corp. | 474 | 9,570 | ||||||||||||||
Pharmaceuticals — 1.2% | ||||||||||||||||
Innoviva Inc. | 847 | 12,358 | * | |||||||||||||
Lannett Co. Inc. | 396 | 8,058 | * | |||||||||||||
Opiant Pharmaceuticals Inc. | 78 | 1,611 | * | |||||||||||||
Phibro Animal Health Corp., Class A Shares | 328 | 11,168 | ||||||||||||||
Total Pharmaceuticals | 33,195 | |||||||||||||||
Total Health Care | 489,601 | |||||||||||||||
| Industrials — 14.0% | ||||||||||||||||
Aerospace & Defense — 0.7% | ||||||||||||||||
Aerojet Rocketdyne Holdings Inc. | 366 | 10,065 | * | |||||||||||||
Vectrus Inc. | 316 | 9,606 | * | |||||||||||||
Total Aerospace & Defense | 19,671 | |||||||||||||||
Airlines — 0.5% | ||||||||||||||||
Hawaiian Holdings Inc. | 370 | 13,820 | ||||||||||||||
Building Products — 1.3% | ||||||||||||||||
American Woodmark Corp. | 87 | 11,819 | * | |||||||||||||
Gibraltar Industries Inc. | 380 | 14,098 | * | |||||||||||||
Trex Co. Inc. | 91 | 10,155 | * | |||||||||||||
Total Building Products | 36,072 | |||||||||||||||
Commercial Services & Supplies — 3.3% | ||||||||||||||||
ACCO Brands Corp. | 1,087 | 12,881 | * | |||||||||||||
ARC Document Solutions Inc. | 3,561 | 8,618 | * | |||||||||||||
Ennis Inc. | 619 | 12,318 | ||||||||||||||
Heritage-Crystal Clean Inc. | 422 | 9,178 | * | |||||||||||||
Kimball International Inc., Class B Shares | 547 | 10,158 | ||||||||||||||
LSC Communications Inc. | 941 | 12,873 | ||||||||||||||
Pitney Bowes Inc. | 1,747 | 24,650 | ||||||||||||||
Total Commercial Services & Supplies | 90,676 | |||||||||||||||
Construction & Engineering — 1.5% | ||||||||||||||||
Argan Inc. | 287 | 12,513 | ||||||||||||||
KBR Inc. | 889 | 18,082 | ||||||||||||||
Primoris Services Corp. | 459 | 11,934 | ||||||||||||||
Total Construction & Engineering | 42,529 | |||||||||||||||
See Notes to Financial Statements.
| 8 | Legg Mason Small-Cap Quality Value ETF 2018 Semi-Annual Report |
Table of Contents
Legg Mason Small-Cap Quality Value ETF
| Security | Shares | Value | ||||||||||||||
Electrical Equipment — 1.3% | ||||||||||||||||
Atkore International Group Inc. | 591 | $ | 13,817 | * | ||||||||||||
Powell Industries Inc. | 364 | 11,863 | ||||||||||||||
TPI Composites Inc. | 434 | 8,715 | * | |||||||||||||
Total Electrical Equipment | 34,395 | |||||||||||||||
Machinery — 2.7% | ||||||||||||||||
Gencor Industries Inc. | 371 | 6,233 | * | |||||||||||||
Global Brass & Copper Holdings Inc. | 332 | 10,674 | ||||||||||||||
Graham Corp. | 356 | 7,618 | ||||||||||||||
Greenbrier Cos. Inc. | 306 | 15,346 | ||||||||||||||
Hardinge Inc. | 466 | 8,789 | ||||||||||||||
Omega Flex Inc. | 123 | 7,522 | ||||||||||||||
Wabash National Corp. | 660 | 17,048 | ||||||||||||||
Total Machinery | 73,230 | |||||||||||||||
Professional Services — 2.6% | ||||||||||||||||
Barrett Business Services Inc. | 168 | 11,708 | ||||||||||||||
Exponent Inc. | 152 | 11,271 | ||||||||||||||
Mistras Group Inc. | 447 | 9,526 | * | |||||||||||||
TriNet Group Inc. | 314 | 13,775 | * | |||||||||||||
TrueBlue Inc. | 493 | 13,483 | * | |||||||||||||
WageWorks Inc. | 195 | 11,807 | * | |||||||||||||
Total Professional Services | 71,570 | |||||||||||||||
Transportation Infrastructure — 0.1% | ||||||||||||||||
Sino-Global Shipping America Ltd. | 1,313 | 3,086 | * | |||||||||||||
Total Industrials | 385,049 | |||||||||||||||
| Information Technology — 18.1% | ||||||||||||||||
Communications Equipment — 1.7% | ||||||||||||||||
Acacia Communications Inc. | 254 | 9,375 | * | |||||||||||||
InterDigital Inc. | 194 | 15,142 | ||||||||||||||
Oclaro Inc. | 1,339 | 7,954 | * | |||||||||||||
Plantronics Inc. | 254 | 14,983 | ||||||||||||||
Total Communications Equipment | 47,454 | |||||||||||||||
Electronic Equipment, Instruments & Components — 5.9% | ||||||||||||||||
AVX Corp. | 993 | 17,814 | ||||||||||||||
Benchmark Electronics Inc. | 505 | 14,620 | * | |||||||||||||
Daktronics Inc. | 1,125 | 10,418 | ||||||||||||||
Data I/O Corp. | 337 | 3,835 | * | |||||||||||||
Mesa Laboratories Inc. | 52 | 7,359 | ||||||||||||||
Methode Electronics Inc. | 314 | 12,827 | ||||||||||||||
See Notes to Financial Statements.
| Legg Mason Small-Cap Quality Value ETF 2018 Semi-Annual Report | 9 |
Table of Contents
Schedule of investments (unaudited) (cont’d)
January 31, 2018
Legg Mason Small-Cap Quality Value ETF
| Security | Shares | Value | ||||||||||||||
Electronic Equipment, Instruments & Components — continued | ||||||||||||||||
Park Electrochemical Corp. | 503 | $ | 9,205 | |||||||||||||
Plexus Corp. | 230 | 13,742 | * | |||||||||||||
Sanmina Corp. | 566 | 14,801 | * | |||||||||||||
ScanSource Inc. | 406 | 13,885 | * | |||||||||||||
Systemax Inc. | 403 | 12,513 | ||||||||||||||
TTM Technologies Inc. | 927 | 15,286 | * | |||||||||||||
Vishay Intertechnology Inc. | 779 | 17,099 | ||||||||||||||
Total Electronic Equipment, Instruments & Components | 163,404 | |||||||||||||||
Internet Software & Services — 2.7% | ||||||||||||||||
AutoWeb Inc. | 798 | 6,592 | * | |||||||||||||
Bandwidth Inc., Class A Shares | 404 | 9,429 | * | |||||||||||||
CommerceHub Inc., Series A Shares | 297 | 6,005 | * | |||||||||||||
DHI Group Inc. | 4,145 | 7,461 | * | |||||||||||||
Meet Group Inc. | 3,358 | 9,268 | * | |||||||||||||
Shutterstock Inc. | 236 | 10,446 | * | |||||||||||||
Trade Desk Inc., Class A Shares | 151 | 7,321 | * | |||||||||||||
XO Group Inc. | 413 | 7,888 | * | |||||||||||||
YuMe Inc. | 2,408 | 8,813 | ||||||||||||||
Total Internet Software & Services | 73,223 | |||||||||||||||
IT Services — 2.7% | ||||||||||||||||
Cass Information Systems Inc. | 148 | 8,576 | ||||||||||||||
Convergys Corp. | 682 | 15,870 | ||||||||||||||
CSG Systems International Inc. | 286 | 12,919 | ||||||||||||||
ManTech International Corp., Class A Shares | 301 | 15,673 | ||||||||||||||
Syntel Inc. | 862 | 19,438 | * | |||||||||||||
Total IT Services | 72,476 | |||||||||||||||
Semiconductors & Semiconductor Equipment — 3.1% | ||||||||||||||||
Advanced Energy Industries Inc. | 168 | 11,950 | * | |||||||||||||
Ambarella Inc. | 188 | 9,475 | * | |||||||||||||
Amtech Systems Inc. | 618 | 6,198 | * | |||||||||||||
Cabot Microelectronics Corp. | 130 | 13,246 | ||||||||||||||
Cirrus Logic Inc. | 287 | 14,227 | * | |||||||||||||
inTEST Corp. | 605 | 5,354 | * | |||||||||||||
Rudolph Technologies Inc. | 389 | 10,192 | * | |||||||||||||
Synaptics Inc. | 350 | 15,169 | * | |||||||||||||
Total Semiconductors & Semiconductor Equipment | 85,811 | |||||||||||||||
See Notes to Financial Statements.
| 10 | Legg Mason Small-Cap Quality Value ETF 2018 Semi-Annual Report |
Table of Contents
Legg Mason Small-Cap Quality Value ETF
| Security | Shares | Value | ||||||||||||||
Software — 2.0% | ||||||||||||||||
Altair Engineering Inc., Class A Shares | 289 | $ | 7,687 | * | ||||||||||||
American Software Inc., Class A Shares | 733 | 9,185 | ||||||||||||||
Progress Software Corp. | 272 | 13,554 | ||||||||||||||
Qualys Inc. | 162 | 10,125 | * | |||||||||||||
Synchronoss Technologies Inc. | 1,162 | 9,342 | * | |||||||||||||
Zix Corp. | 1,365 | 5,774 | * | |||||||||||||
Total Software | 55,667 | |||||||||||||||
Total Information Technology | 498,035 | |||||||||||||||
| Materials — 4.6% | ||||||||||||||||
Chemicals — 2.6% | ||||||||||||||||
Advanced Emissions Solutions Inc. | 679 | 5,473 | ||||||||||||||
Chase Corp. | 80 | 8,988 | ||||||||||||||
Core Molding Technologies Inc. | 338 | 7,030 | ||||||||||||||
FutureFuel Corp. | 875 | 11,725 | ||||||||||||||
Innophos Holdings Inc. | 287 | 13,279 | ||||||||||||||
Rayonier Advanced Materials Inc. | 635 | 12,014 | ||||||||||||||
Stepan Co. | 173 | 13,567 | ||||||||||||||
Total Chemicals | 72,076 | |||||||||||||||
Construction Materials — 0.3% | ||||||||||||||||
U.S. Lime & Minerals Inc. | 101 | 7,752 | ||||||||||||||
Metals & Mining — 1.7% | ||||||||||||||||
Cleveland-Cliffs Inc. | 2,292 | 15,700 | * | |||||||||||||
SunCoke Energy Inc. | 1,114 | 12,366 | * | |||||||||||||
Worthington Industries Inc. | 399 | 18,657 | ||||||||||||||
Total Metals & Mining | 46,723 | |||||||||||||||
Total Materials | 126,551 | |||||||||||||||
| Real Estate — 1.5% | ||||||||||||||||
Real Estate Management & Development — 1.5% | ||||||||||||||||
Forestar Group Inc. | 448 | 10,931 | * | |||||||||||||
HFF Inc., Class A Shares | 287 | 14,124 | ||||||||||||||
Marcus & Millichap Inc. | 328 | 10,709 | * | |||||||||||||
Maui Land & Pineapple Co. Inc. | 353 | 4,854 | * | |||||||||||||
Total Real Estate | 40,618 | |||||||||||||||
| Telecommunication Services — 0.4% | ||||||||||||||||
Wireless Telecommunication Services — 0.4% | ||||||||||||||||
Spok Holdings Inc. | 640 | 9,984 | ||||||||||||||
See Notes to Financial Statements.
| Legg Mason Small-Cap Quality Value ETF 2018 Semi-Annual Report | 11 |
Table of Contents
Schedule of investments (unaudited) (cont’d)
January 31, 2018
Legg Mason Small-Cap Quality Value ETF
| Security | Shares | Value | ||||||||||||||
| Utilities — 1.6% | ||||||||||||||||
Electric Utilities — 0.7% | ||||||||||||||||
MGE Energy Inc. | 219 | $ | 13,096 | |||||||||||||
Spark Energy Inc., Class A Shares | 706 | 6,990 | ||||||||||||||
Total Electric Utilities | 20,086 | |||||||||||||||
Gas Utilities — 0.5% | ||||||||||||||||
Northwest Natural Gas Co. | 220 | 12,617 | ||||||||||||||
Water Utilities — 0.4% | ||||||||||||||||
American States Water Co. | 219 | 12,093 | ||||||||||||||
Total Utilities | 44,796 | |||||||||||||||
Total Investments — 99.1% (Cost — $2,670,686) | 2,730,973 | |||||||||||||||
Other Assets in Excess of Liabilities — 0.9% | 26,147 | |||||||||||||||
Total Net Assets — 100.0% | $ | 2,757,120 | ||||||||||||||
| * | Non-income producing security. |
See Notes to Financial Statements.
| 12 | Legg Mason Small-Cap Quality Value ETF 2018 Semi-Annual Report |
Table of Contents
Statement of assets and liabilities (unaudited)
January 31, 2018
| Assets: | ||||
Investments, at value (Cost — $2,670,686) | $ | 2,730,973 | ||
Cash | 25,320 | |||
Dividends receivable | 2,243 | |||
Total Assets | 2,758,536 | |||
| Liabilities: | ||||
Investment management fee payable | 1,416 | |||
Total Liabilities | 1,416 | |||
| Total Net Assets | $ | 2,757,120 | ||
| Net Assets: | ||||
Par value (Note 5) | $ | 1 | ||
Paid-in capital in excess of par value | 2,504,972 | |||
Undistributed net investment income | 3,305 | |||
Accumulated net realized gain on investments | 188,555 | |||
Net unrealized appreciation on investments | 60,287 | |||
| Total Net Assets | $ | 2,757,120 | ||
| Shares Outstanding | 100,000 | |||
| Net Asset Value | $27.57 | |||
See Notes to Financial Statements.
| Legg Mason Small-Cap Quality Value ETF 2018 Semi-Annual Report | 13 |
Table of Contents
Statement of operations (unaudited)
For the Six Months Ended January 31, 2018
| Investment Income: | ||||
Dividends | $ | 22,313 | ||
Interest | 10 | |||
Total Investment Income | 22,323 | |||
| Expenses: | ||||
Investment management fee (Note 2) | 8,018 | |||
Total Expenses | 8,018 | |||
| Net Investment Income | 14,305 | |||
| Realized and Unrealized Gain on Investments (Notes 1 and 3): | ||||
Net Realized Gain From Investment Transactions | 188,555 | |||
Change in Net Unrealized Appreciation (Depreciation) From Investments | 78,342 | |||
| Net Gain on Investments | 266,897 | |||
| Increase in Net Assets From Operations | $ | 281,202 | ||
See Notes to Financial Statements.
| 14 | Legg Mason Small-Cap Quality Value ETF 2018 Semi-Annual Report |
Table of Contents
Statements of changes in net assets
| For the Six Months Ended January 31, 2018 (unaudited) and the Period Ended July 31, 2017 | 2018 | 2017† | ||||||
| Operations: | ||||||||
Net investment income (loss) | $ | 14,305 | $ | (378) | ||||
Net realized gain | 188,555 | 13 | ||||||
Change in net unrealized appreciation (depreciation) | 78,342 | (18,055) | ||||||
Increase (Decrease) in Net Assets From Operations | 281,202 | (18,420) | ||||||
| Distributions to Shareholders From (Note 1): | ||||||||
Net investment income | (11,000) | — | ||||||
Decrease in Net Assets From Distributions to Shareholders | (11,000) | — | ||||||
| Fund Share Transactions (Note 5): | ||||||||
Net proceeds from sale of shares (100,000 and 100,000 shares issued, respectively) | 2,573,303 | 2,513,711 | ||||||
Cost of shares repurchased (100,000 and 0 shares repurchased, respectively) | (2,581,676) | — | ||||||
Increase (Decrease) in Net Assets From Fund Share Transactions | (8,373) | 2,513,711 | ||||||
Increase in Net Assets | 261,829 | 2,495,291 | ||||||
| Net Assets: | ||||||||
Beginning of period | 2,495,291 | — | ||||||
End of period* | $ | 2,757,120 | $ | 2,495,291 | ||||
*Includes undistributed net investment income of: | $3,305 | — | ||||||
| † | For the period July 12, 2017 (inception date) to July 31, 2017. |
See Notes to Financial Statements.
| Legg Mason Small-Cap Quality Value ETF 2018 Semi-Annual Report | 15 |
Table of Contents
| For a share of beneficial interest outstanding throughout each year ended July 31, unless otherwise noted: | ||||||||
| 20181,2 | 20171,3 | |||||||
| Net asset value, beginning of period | $24.95 | $25.14 | ||||||
| Income (loss) from operations: | ||||||||
Net investment income (loss) | 0.14 | (0.00) | 4 | |||||
Net realized and unrealized gain (loss) | 2.59 | (0.19) | ||||||
Total income (loss) from operations | 2.73 | (0.19) | ||||||
| Less distributions from: | ||||||||
Net investment income | (0.11) | — | ||||||
Total distributions | (0.11) | — | ||||||
| Net asset value, end of period | $27.57 | $24.95 | ||||||
Total return, at NAV5 | 10.95 | % | (0.76) | % | ||||
| Net assets, end of period (000s) | $2,757 | $2,495 | ||||||
| Ratios to average net assets: | ||||||||
Gross expenses6 | 0.60 | % | 0.60 | % | ||||
Net expenses6 | 0.60 | 0.60 | ||||||
Net investment income (loss)6 | 1.07 | (0.29) | ||||||
| Portfolio turnover rate7 | 33 | % | 0 | % | ||||
| 1 | Per share amounts have been calculated using the average shares method. |
| 2 | For the six months ended January 31, 2018 (unaudited). |
| 3 | For the period July 12, 2017 (inception date) to July 31, 2017. |
| 4 | Amount represents less than $0.005 per share. |
| 5 | Performance figures may reflect fee waivers and/or expense reimbursements. In the absence of fee waivers and/or expense reimbursements, the total return would have been lower. The total return calculation assumes that distributions are reinvested at NAV. Past performance is no guarantee of future results. Total returns for periods of less than one year are not annualized. |
| 6 | Annualized. |
| 7 | Portfolio turnover excludes the value of portfolio securities received or delivered as a result of in-kind fund share transactions. |
See Notes to Financial Statements.
| 16 | Legg Mason Small-Cap Quality Value ETF 2018 Semi-Annual Report |
Table of Contents
Notes to financial statements (unaudited)
1. Organization and significant accounting policies
Legg Mason Small-Cap Quality Value ETF (the “Fund”) is a separate diversified investment series of Legg Mason ETF Investment Trust (the “Trust”). The Trust, a Maryland statutory trust, is registered under the Investment Company Act of 1940, as amended (the “1940 Act”), as an open-end management investment company.
The Fund is an exchange-traded fund (“ETF”). ETFs are funds that trade like other publicly-traded securities. The Fund is designed to track an index. Similar to shares of an index mutual fund, each share of the Fund represents an ownership interest in an underlying portfolio of securities intended to track an index. Unlike shares of a mutual fund, which can be bought from and redeemed by the issuing fund by all shareholders at a price based on net asset value (“NAV”), shares of the Fund may be directly purchased from and redeemed by the Fund at NAV solely by certain large institutional investors who have entered into agreements with the Fund’s distributor (“Authorized Participants”). Also unlike shares of a mutual fund, shares of the Fund are listed on a national securities exchange and trade in the secondary market at market prices that change throughout the day.
Shares of the Fund are listed and traded at market prices on NASDAQ. The market price for the Fund’s shares may be different from the Fund’s NAV. The Fund issues and redeems shares at NAV only in blocks of a specified number of shares or multiples thereof (“Creation Units”). Only Authorized Participants may purchase or redeem Creation Units directly with the Fund at NAV. Creation Units are created and redeemed principally in kind (although under some circumstances its shares are created and redeemed partially for cash). Except when aggregated in Creation Units, shares of the Fund are not redeemable securities. Shareholders who are not Authorized Participants may not redeem shares directly from the Fund at NAV.
The Fund seeks to track the investment results of the Royce Small-Cap Quality Value Index (the “Underlying Index”). The Underlying Index utilizes a proprietary methodology created and sponsored by Royce & Associates, LP (“Royce”), the Fund’s subadviser.
The following are significant accounting policies consistently followed by the Fund and are in conformity with U.S. generally accepted accounting principles (“GAAP”). Estimates and assumptions are required to be made regarding assets, liabilities and changes in net assets resulting from operations when financial statements are prepared. Changes in the economic environment, financial markets and any other parameters used in determining these estimates could cause actual results to differ. Subsequent events have been evaluated through the date the financial statements were issued.
(a) Investment valuation. Equity securities for which market quotations are available are valued at the last reported sales price or official closing price on the primary market or exchange on which they trade. The valuations for fixed income securities (which may include, but are not limited to, corporate, government, municipal, mortgage-backed, collateralized mortgage obligations and asset-backed securities) and certain derivative instruments are typically the prices supplied by independent third party pricing services, which may use market prices or broker/dealer quotations or a variety of valuation techniques and methodologies. The
| Legg Mason Small-Cap Quality Value ETF 2018 Semi-Annual Report | 17 |
Table of Contents
Notes to financial statements (unaudited) (cont’d)
independent third party pricing services use inputs that are observable such as issuer details, interest rates, yield curves, prepayment speeds, credit risks/spreads, default rates and quoted prices for similar securities. Prior to December 1, 2017, short-term fixed income securities that would mature in 60 days or less were valued at amortized cost, unless it was determined that using this method would not reflect an investment’s fair value. If independent third party pricing services are unable to supply prices for a portfolio investment, or if the prices supplied are deemed by the manager to be unreliable, the market price may be determined by the manager using quotations from one or more broker/dealers or at the transaction price if the security has recently been purchased and no value has yet been obtained from a pricing service or pricing broker. When reliable prices are not readily available, such as when the value of a security has been significantly affected by events after the close of the exchange or market on which the security is principally traded, but before the Fund calculates its net asset value, the Fund values these securities as determined in accordance with procedures approved by the Fund’s Board of Trustees.
The Board of Trustees is responsible for the valuation process and has delegated the supervision of the daily valuation process to the Legg Mason North Atlantic Fund Valuation Committee (the “Valuation Committee”). The Valuation Committee, pursuant to the policies adopted by the Board of Trustees, is responsible for making fair value determinations, evaluating the effectiveness of the Fund’s pricing policies, and reporting to the Board of Trustees. When determining the reliability of third party pricing information for investments owned by the Fund, the Valuation Committee, among other things, conducts due diligence reviews of pricing vendors, monitors the daily change in prices and reviews transactions among market participants.
The Valuation Committee will consider pricing methodologies it deems relevant and appropriate when making fair value determinations. Examples of possible methodologies include, but are not limited to, multiple of earnings; discount from market of a similar freely traded security; discounted cash-flow analysis; book value or a multiple thereof; risk premium/yield analysis; yield to maturity; and/or fundamental investment analysis. The Valuation Committee will also consider factors it deems relevant and appropriate in light of the facts and circumstances. Examples of possible factors include, but are not limited to, the type of security; the issuer’s financial statements; the purchase price of the security; the discount from market value of unrestricted securities of the same class at the time of purchase; analysts’ research and observations from financial institutions; information regarding any transactions or offers with respect to the security; the existence of merger proposals or tender offers affecting the security; the price and extent of public trading in similar securities of the issuer or comparable companies; and the existence of a shelf registration for restricted securities.
For each portfolio security that has been fair valued pursuant to the policies adopted by the Board of Trustees, the fair value price is compared against the last available and next available market quotations. The Valuation Committee reviews the results of such back testing monthly and fair valuation occurrences are reported to the Board of Trustees quarterly.
| 18 | Legg Mason Small-Cap Quality Value ETF 2018 Semi-Annual Report |
Table of Contents
The Fund uses valuation techniques to measure fair value that are consistent with the market approach and/or income approach, depending on the type of security and the particular circumstance. The market approach uses prices and other relevant information generated by market transactions involving identical or comparable securities. The income approach uses valuation techniques to discount estimated future cash flows to present value.
GAAP establishes a disclosure hierarchy that categorizes the inputs to valuation techniques used to value assets and liabilities at measurement date. These inputs are summarized in the three broad levels listed below:
| • | Level 1 — quoted prices in active markets for identical investments |
| • | Level 2 — other significant observable inputs (including quoted prices for similar investments, interest rates, prepayment speeds, credit risk, etc.) |
| • | Level 3 — significant unobservable inputs (including the Fund’s own assumptions in determining the fair value of investments) |
The inputs or methodologies used to value securities are not necessarily an indication of the risk associated with investing in those securities.
The following is a summary of the inputs used in valuing the Fund’s assets carried at fair value:
| ASSETS | ||||||||||||||||
| Description | Quoted Prices (Level 1) | Other Significant Observable Inputs (Level 2) | Significant Unobservable Inputs (Level 3) | Total | ||||||||||||
| Common stocks† | $ | 2,730,973 | — | — | $ | 2,730,973 | ||||||||||
| † | See Schedule of Investments for additional detailed categorizations. |
(b) Security transactions and investment income. Security transactions are accounted for on a trade date basis. Interest income (including interest income from payment-in-kind securities), adjusted for amortization of premium and accretion of discount, is recorded on the accrual basis. Dividend income is recorded on the ex-dividend date for dividends received in cash and/or securities. The cost of investments sold is determined by use of the specific identification method. To the extent any issuer defaults or a credit event occurs that impacts the issuer, the Fund may halt any additional interest income accruals and consider the realizability of interest accrued up to the date of default or credit event.
(c) Distributions to shareholders. Distributions from net investment income and distributions of net realized gains, if any, are declared at least annually. Distributions to shareholders of the Fund are recorded on the ex-dividend date and are determined in accordance with income tax regulations, which may differ from GAAP.
(d) Federal and other taxes. It is the Fund’s policy to comply with the federal income and excise tax requirements of the Internal Revenue Code of 1986 (the “Code”), as
| Legg Mason Small-Cap Quality Value ETF 2018 Semi-Annual Report | 19 |
Table of Contents
Notes to financial statements (unaudited) (cont’d)
amended, applicable to regulated investment companies. Accordingly, the Fund intends to distribute its taxable income and net realized gains, if any, to shareholders in accordance with timing requirements imposed by the Code. Therefore, no federal or state income tax provision is required in the Fund’s financial statements.
Management has analyzed the Fund’s tax positions taken on income tax returns for all open tax years and has concluded that as of July 31, 2017, no provision for income tax is required in the Fund’s financial statements. The Fund’s federal and state income and federal excise tax returns for tax years for which the applicable statutes of limitations have not expired are subject to examination by the Internal Revenue Service and state departments of revenue.
(e) Reclassification. GAAP requires that certain components of net assets be reclassified to reflect permanent differences between financial and tax reporting. These reclassifications have no effect on net assets or net asset value per share.
2. Investment management agreement and other transactions with affiliates
Legg Mason Partners Fund Advisor, LLC (“LMPFA”) is the Fund’s investment manager and Royce & Associates, LP (“Royce”) is the Fund’s subadviser. Western Asset Management Company (“Western Asset”) manages the portion of the Fund’s cash and short-term instruments allocated to it. LMPFA and Western Asset are wholly-owned subsidiaries, and Royce is a majority-owned subsidiary, of Legg Mason, Inc. (“Legg Mason”).
LMPFA provides administrative and certain oversight services to the Fund. LMPFA delegates to the subadviser the day-to-day portfolio management of the Fund. The Fund is responsible for paying interest expenses, taxes, brokerage expenses, future 12b-1 fees (if any), acquired fund fees and expenses, extraordinary expenses and the management fee payable to LMPFA under the investment management agreement. LMPFA has agreed to pay all of the Fund’s organization and offering costs.
Under the investment management agreement and subject to the general supervision of the Fund’s Board of Trustees, LMPFA provides or causes to be furnished all investment management, supervisory, administrative and other services reasonably necessary for the operation of the Fund, including certain distribution services (provided pursuant to a separate distribution agreement) and investment advisory services (provided pursuant to separate subadvisory agreements) under a unitary fee structure. The Fund pays an investment management fee, calculated daily and paid monthly, at an annual rate of 0.60% of the Fund’s average daily net assets.
As compensation for its subadvisory services, LMPFA pays Royce monthly 90% of the management fee paid by the Fund to LMPFA, net of (i) all fees and expenses incurred by LMPFA under the investment management agreement (including without limitation any subadvisory fee paid to another subadviser to the Fund) and (ii) expense waivers, if any, and reimbursements. LMPFA pays Western Asset monthly a fee of 0.02% of the portion of the Fund’s average daily net assets allocated to Western Asset for the management of cash and other short-term instruments, net of expense waivers, if any, and reimbursements.
| 20 | Legg Mason Small-Cap Quality Value ETF 2018 Semi-Annual Report |
Table of Contents
Legg Mason Investor Services, LLC, a wholly-owned broker-dealer subsidiary of Legg Mason, serves as the distributor of Creation Units for the Fund on an agency basis.
The Fund’s Board of Trustees has adopted a Rule 12b-1 shareholder services and distribution plan and under that plan, the Fund is authorized to pay service and/or distribution fees calculated at an annual rate of up to 0.25% of its average daily net assets. No service and/or distribution fees are currently paid by the Fund, and there are no current plans to impose these fees.
All officers and one Trustee of the Trust are employees of Legg Mason or its affiliates and do not receive compensation from the Trust.
3. Investments
During the six months ended January 31, 2018, the aggregate cost of purchases and proceeds from sales of investments (excluding in-kind transactions and short-term investments) were as follows:
| Purchases | $ | 923,041 | ||
| Sales | 860,305 |
During the six months ended January 31, 2018, in-kind transactions (see Note 5) were as follows:
| Contributions | $ | 2,516,500 | ||
| Redemptions | 2,582,477 | |||
| Realized gain (loss)* | 249,184 |
| * | Net realized gains on redemptions in-kind are not taxable to the remaining shareholders of the Fund. |
The in-kind contributions and in-kind redemptions shown in this table may not agree with the Fund Share Transactions on the Statement of Changes in Net Assets. This table represents the accumulation of the Fund’s daily net shareholder transactions while the Statement of Changes in Net Assets reflects gross shareholder transactions including any cash component of the transactions.
At January 31, 2018, the aggregate cost of investments and the aggregate gross unrealized appreciation and depreciation of investments for federal income tax purposes were substantially as follows:
| Cost | Gross Unrealized Appreciation | Gross Unrealized Depreciation | Net Appreciation | |||||||||||||
| Securities | $ | 2,670,686 | $ | 168,467 | $ | (108,180) | $ | 60,287 | ||||||||
4. Derivative instruments and hedging activities
During the six months ended January 31, 2018, the Fund did not invest in derivative instruments.
| Legg Mason Small-Cap Quality Value ETF 2018 Semi-Annual Report | 21 |
Table of Contents
Notes to financial statements (unaudited) (cont’d)
5. Fund share transactions
At January 31, 2018, the Trust had an unlimited number of shares of beneficial interest authorized with a par value of $0.00001 per share. Fund shares are issued and redeemed by the Fund only in Creation Units or Creation Unit aggregations, where 50,000 shares of the Fund constitute a Creation Unit. Such transactions are generally on an in-kind basis, with a separate cash payment, which is a balancing cash component to equate the transaction to the net asset value per share of the Fund on the transaction date. Transactions in capital shares of the Fund are disclosed in detail in the Statement of Changes in Net Assets. Authorized Participants are subject to standard creation and redemption transaction fees to offset transfer and other transaction costs associated with the issuance and redemption of Creation Units. Creations and redemptions for cash (when cash creations and redemptions are available or specified) may be subject to an additional variable fee.
6. Recent accounting pronouncement
In October 2016, the U.S. Securities and Exchange Commission adopted new rules and amended existing rules (together, the “final rules”) intended to modernize the reporting and disclosure of information by registered investment companies. In part, the final rules amend Regulation S-X and require standardized, enhanced disclosure about derivatives in investment company financial statements, as well as other amendments. The compliance date for the amendments to Regulation S-X was August 1, 2017. The Fund has adopted the amendments to Regulation S-X and, upon evaluation, has concluded that the amendments do not materially impact the financial statement amounts; however, as required, additional or enhanced disclosure has been included.
| 22 | Legg Mason Small-Cap Quality Value ETF 2018 Semi-Annual Report |
Table of Contents
Legg Mason
Small-Cap Quality Value ETF
Trustees
Paul R. Ades
Andrew L. Breech
Dwight B. Crane
Althea L. Duersten
Frank G. Hubbard
Howard J. Johnson
Chairman
Jerome H. Miller
Ken Miller
John J. Murphy
Thomas F. Schlafly
Jane Trust
Investment manager
Legg Mason Partners Fund Advisor, LLC
Subadviser
Royce & Associates, LP
Custodian
State Street Bank and Trust Company
Transfer agent
State Street Bank and Trust Company
One Lincoln Street
Boston, Massachusetts 02111
Independent registered public accounting firm
PricewaterhouseCoopers LLP
Baltimore, MD
Legg Mason Small-Cap Quality Value ETF
The Fund is a separate investment series of Legg Mason ETF Investment Trust, a Maryland statutory trust.
Legg Mason Small-Cap Quality Value ETF
Legg Mason Funds
620 Eighth Avenue, 49th Floor
New York, NY 10018
The Fund files its complete schedule of portfolio holdings with the Securities and Exchange Commission (“SEC”) for the first and third quarters of each fiscal year on Form N-Q. The Fund’s Forms N-Q are available on the SEC’s website at www.sec.gov. The Fund’s Forms N-Q may be reviewed and copied at the SEC’s Public Reference Room in Washington, D.C., and information on the operation of the Public Reference Room may be obtained by calling 1-800-SEC-0330. To obtain information on Form N-Q, shareholders can call the Fund at 1-877-721-1926.
Information on how the Fund voted proxies relating to portfolio securities during the prior 12-month period ended June 30th of each year and a description of the policies and procedures that the Fund uses to determine how to vote proxies related to portfolio transactions are available (1) without charge, upon request, by calling the Fund at 1-877-721-1926, (2) at www.leggmason.com/etf and (3) on the SEC’s website at www.sec.gov.
This report is submitted for the general information of the shareholders of Legg Mason Small-Cap Quality Value ETF. This report is not authorized for distribution to prospective investors in the Fund unless preceded or accompanied by a current prospectus.
Investors should consider the Fund’s investment objectives, risks, charges and expenses carefully before investing. The prospectus contains this and other important information about the Fund. Please read the prospectus carefully before investing.
www.leggmason.com
© 2018 Legg Mason Investor Services, LLC
Member FINRA, SIPC
Table of Contents
ETF Index Disclaimers
The Royce Small-Cap Quality Value Index (the “Underlying Index”) is created and sponsored by Royce & Associates, LP (“Royce”), the subadviser to Legg Mason Small-Cap Quality Value ETF (the “Fund”). Royce is an affiliated person of Legg Mason Partners Fund Advisor, LLC, the Fund’s manager and the Fund. The Underlying Index is the exclusive property of Royce. Legg Mason ETF Investment Trust has entered into a license agreement with Royce to use the Underlying Index at no charge. Royce has retained Solactive AG, an unaffiliated third party, to calculate the Underlying Index. Solactive AG publishes information regarding the market value of the Underlying Index.
The Fund is not sponsored, promoted, sold or supported in any other manner by Solactive AG nor does Solactive AG offer any express or implicit guarantee or assurance either with regard to the results of using the Underlying Index and/or Underlying Index trade marks or the Underlying Index Price at any time or in any other respect. The Underlying Index is calculated and published by Solactive AG. Solactive AG uses its best efforts to ensure that the Underlying Index is calculated correctly. Irrespective of its obligations towards the Fund, Solactive AG has no obligation to point out errors in the Underlying Index to third parties including but not limited to investors and/or financial intermediaries of the Fund. Neither publication of the Underlying Index by Solactive AG nor the licensing of the Underlying Index or Underlying Index trade marks for the purpose of use in connection with the Fund constitutes a recommendation by Solactive AG to invest capital in the Fund nor does it in any way represent an assurance or opinion of Solactive AG with regard to any investment in the Fund.
Royce does not guarantee the accuracy and/or the completeness of the Underlying Index or any data included therein, and Royce shall not have any liability for any errors, omissions or interruptions therein. Royce makes no warranty, express or implied, as to results to be obtained by the Fund, owners of the shares of the Fund or any other person or entity from the use of the Underlying Index or any data included therein, either in connection with the Fund or for any other use. Royce makes no express or implied warranties, and expressly disclaims all warranties of merchantability or fitness for a particular purpose or use with respect to the Underlying Index or any data included therein. Without limiting any of the foregoing, in no event shall Royce have any liability for any special, punitive, direct, indirect or consequential damages (including lost profits) arising out of matters relating to the use of the Underlying Index, even if notified of the possibility of such damages.
Table of Contents
www.leggmason.com
© 2018 Legg Mason Investor Services, LLC Member FINRA, SIPC
ETFF436861 3/18 SR18-3293
Table of Contents
| ITEM 2. | CODE OF ETHICS. |
Not applicable.
| ITEM 3. | AUDIT COMMITTEE FINANCIAL EXPERT. |
Not applicable.
| ITEM 4. | PRINCIPAL ACCOUNTANT FEES AND SERVICES. |
Not applicable.
| ITEM 5. | AUDIT COMMITTEE OF LISTED REGISTRANTS. |
Not applicable.
| ITEM 6. | SCHEDULE OF INVESTMENTS. |
Included herein under Item 1.
| ITEM 7. | DISCLOSURE OF PROXY VOTING POLICIES AND PROCEDURES FOR CLOSED-END MANAGEMENT INVESTMENT COMPANIES. |
Not applicable.
| ITEM 8. | PORTFOLIO MANAGERS OF CLOSED-END MANAGEMENT INVESTMENT COMPANIES. |
Not applicable.
| ITEM 9. | PURCHASES OF EQUITY SECURITIES BY CLOSED-END MANAGEMENT INVESTMENT COMPANY AND AFFILIATED PURCHASERS. |
Not applicable.
| ITEM 10. | SUBMISSION OF MATTERS TO A VOTE OF SECURITY HOLDERS. |
Not applicable.
| ITEM 11. | CONTROLS AND PROCEDURES. |
| (a) | The registrant’s principal executive officer and principal financial officer have concluded that the registrant’s disclosure controls and procedures (as defined in Rule 30a- 3(c) under the Investment Company Act of 1940, as amended (the “1940 Act”)) are effective as of a date within 90 days of the filing date of this report that includes the disclosure required by this paragraph, based on their evaluation of the disclosure controls and procedures required by Rule 30a-3(b) under the 1940 Act and 15d-15(b) under the Securities Exchange Act of 1934. |
| (b) | There were no changes in the registrant’s internal control over financial reporting (as defined in Rule 30a-3(d) under the 1940 Act) that occurred during the second fiscal quarter of the period covered by this report that have materially affected, or are likely to materially affect the registrant’s internal control over financial reporting. |
Table of Contents
| ITEM 12. | EXHIBITS. |
(a) (1) Not applicable.
Exhibit 99.CODE ETH
(a) (2) Certifications pursuant to section 302 of the Sarbanes-Oxley Act of 2002 attached hereto.
Exhibit 99.CERT
(b) Certifications pursuant to Section 906 of the Sarbanes-Oxley Act of 2002 attached hereto.
Exhibit 99.906CERT
Table of Contents
SIGNATURES
Pursuant to the requirements of the Securities Exchange Act of 1934 and the Investment Company Act of 1940, the registrant has duly caused this Report to be signed on its behalf by the undersigned, there unto duly authorized.
Legg Mason ETF Investment Trust
| By: | /s/ Jane Trust | |
| Jane Trust | ||
| Chief Executive Officer | ||
| Date: | August 30, 2018 | |
Pursuant to the requirements of the Securities Exchange Act of 1934 and the Investment Company Act of 1940, this report has been signed below by the following persons on behalf of the registrant and in the capacities and on the dates indicated.
| By: | /s/ Jane Trust | |
| Jane Trust | ||
| Chief Executive Officer | ||
| Date: | August 30, 2018 | |
| By: | /s/ Richard F. Sennett | |
| Richard F. Sennett | ||
| Principal Financial Officer | ||
| Date: | August 30, 2018 | |