UNITED STATES
SECURITIES AND EXCHANGE COMMISSION
Washington, D.C. 20549
FORMN-CSR
CERTIFIED SHAREHOLDER REPORT OF REGISTERED
MANAGEMENT INVESTMENT COMPANIES
Investment Company Act file number811-23096
Legg Mason ETF Investment Trust
(Exact name of registrant as specified in charter)
620 Eighth Avenue, 49th Floor, New York, NY 10018
(Address of principal executive offices) (Zip code)
Robert I. Frenkel, Esq.
Legg Mason & Co., LLC
100 First Stamford Place
Stamford, CT 06902
(Name and address of agent for service)
Registrant’s telephone number, including area code:1-877-721-1926
Date of fiscal year end: October 31
Date of reporting period: October 31, 2019
| ITEM 1. | REPORT TO STOCKHOLDERS. |
TheAnnual Report to Stockholders is filed herewith.

| | |
| Annual Report | | October 31, 2019 |
LEGG MASON
LOW VOLATILITY
HIGH DIVIDEND ETF
LVHD
Beginning in April 2021, as permitted by regulations adopted by the Securities and Exchange Commission, the Fund intends to no longer mail paper copies of the Fund’s shareholder reports like this one, unless you specifically request paper copies of the reports from your financial intermediary (such as a broker-dealer or bank). Instead, the reports will be made available on a website, and you will be notified by mail each time a report is posted and provided with a website link to access the report.
If you already elected to receive shareholder reports electronically(“e-delivery”), you will not be affected by this change and you need not take any action. If you have not already electede-delivery, you may elect to receive shareholder reports and other communications from the Fund electronically by contacting your financial intermediary.
You may elect to receive all future reports in paper free of charge by contacting your financial intermediary to request that you continue to receive paper copies of your shareholder reports. Your election to receive reports in paper will apply to all Legg Mason Funds held in your account with your financial intermediary.
|
| INVESTMENT PRODUCTS: NOT FDIC INSURED • NO BANK GUARANTEE • MAY LOSE VALUE |
Fund objective
The Fund seeks to track the investment results of an index composed of equity securities of U.S. companies with relatively high yield and low price and earnings volatility.
Letter from the president

Dear Shareholder,
We are pleased to provide the annual report of Legg Mason Low Volatility High Dividend ETF for the twelve-month reporting period ended October 31, 2019. Please read on for a detailed look at prevailing economic and market conditions during the Fund’s reporting period and to learn how those conditions have affected Fund performance.
As always, we remain committed to providing you with excellent service and a full spectrum of investment choices. We also remain committed to supplementing the support you receive from your financial advisor. One way we accomplish this is through our website, www.leggmason.com. Here you can gain immediate access to market and investment information, including:
| • | | Fund net asset value and market price, |
| • | | Market insights and commentaries from our portfolio managers, and |
| • | | A host of educational resources. |
We look forward to helping you meet your financial goals.
Sincerely,

Jane Trust, CFA
President and Chief Executive Officer
November 29, 2019
| | |
II | | Legg Mason Low Volatility High Dividend ETF |
Fund overview
Q. What is the Fund’s investment strategy?
A. Legg Mason Low Volatility High Dividend ETF (the “Fund”) seeks to track the investment results of the QS Low Volatility High Dividend Index (the “Underlying Index”). The Underlying Index seeks to provide more stable income through investments in stocks of profitable U.S. companies with relatively high dividend yields and lower price and earnings volatility. The Underlying Index is based on a proprietary methodology created and sponsored by QS Investors, LLC (“QS Investors”), the Fund’s subadviser. The Underlying Index is composed of stocks of U.S. companies across a wide range of market capitalizations, including the largest 3,000 U.S. stocks as determined by the Solactive US Broad Market Index.
The Underlying Index’s components are reconstituted annually and rebalanced quarterly. The composition of the Underlying Index and the Fund after reconstitution and rebalancing may fluctuate and exceed the Underlying Index limitations due to market movements. The Underlying Index may include large-,mid- or small-capitalization companies. The components of the Underlying Index, and the degree to which these components represent certain sectors and industries, may change over time.
The Fund’s portfolio is rebalanced when the Underlying Index is rebalanced or reconstituted. The Fund may trade at times other than when the Underlying Index is rebalanced or reconstituted for a variety of reasons, including when adjustments may be made to its representative sampling process from time to time or when investing cash.
The Fund will invest at least 80% of its net assets, plus borrowings for investment purposes, if any, in securities that compose the Underlying Index.
The Fund may invest up to 20% of its net assets in certain index futures, options, options on index futures, swap contracts or other derivatives related to its Underlying Index and its component securities; cash and cash equivalents; other investment companies, including exchange-traded funds; exchange-traded notes; and in securities and other instruments not included in its Underlying Index, but which QS Investors believes will help the Fund track its Underlying Index. The Fund may invest in exchange-traded equity index futures to manage sector exposure and for cash management purposes.
Q. What were the overall market conditions during the Fund’s reporting period?
A.The U.S. equity market, as measured by the Russell 3000 Indexi returned 13.49% for the twelve-month reporting period ended October 31, 2019, with considerable volatility within and across quarters.
In the final months of 2018, the U.S. equity market exhibited large daily moves in both directions, rebounding from asell-off in November and further declining into bear market territory in December 2018. A confluence of factors drove equity markets to their worst month of the decade in December, including the trade conflict between the U.S. and China and a partial shutdown of the U.S. government driven by disagreement regarding funding for a Mexican border wall.
| | |
| Legg Mason Low Volatility High Dividend ETF 2019 Annual Report | | 1 |
Fund overview (cont’d)
Equity markets rallied in January 2019 and continued to generate positive returns, posting the best first calendar quarter return since 1998. Despite worries about China’s slowdown at 2018 year end and Brexit uncertainty, markets globally returned to arisk-on sentiment as central bank policies became increasingly accommodative, the U.S. experienced a positive earnings season, and China manufacturing indicators returned to modest growth levels. Over the first calendar quarter of 2019, a rise in oil prices of 32% and a U.S. yield curveii inversion in late March 2019 did little to stop the positive market momentum. Investor optimism pushed markets higher, and most U.S. sectors had double-digit returns. The Real Estate sector in particular benefited from the U.S. Federal Reserve Board (the “Fed”)iii pivot to a dovish stance. The Fed suggested that mixed economic signals justified a revised approach to interest rate hikes, making them unlikely for the rest of 2019.
U.S. equity returns continued to be volatile in the second calendar quarter of 2019. The quarter started with a strong rally in April, only to sharply decline in May and then rebound dramatically in June 2019. Therisk-on/risk-off theme that had dominated financial markets over the past few years was also pervasive during this quarter, as most risky assets appreciated dramatically in April and June but exhibited dismal performance during May 2019. The shifts in investor sentiment were propelled by the perception of a number of risks, including an escalation in the U.S.-China trade tariff war, uncertainty around Brexit, an inversion of the yield curve in the U.S. and soft global growth. These risks overshadowed several sources of investor optimism, including a tariff freeze agreement between the U.S. and China.
In the third quarter of 2019, the U.S. economy remained on a stronger footing than most other major markets, driven by robust employment and consumer spending numbers. However, this quarter saw a contraction within the manufacturing index, and consumer, business and investor confidence indices were at multi-year lows. In July 2019, the Fed cut interest rates by twenty-five basis pointsiv for the first time in eleven years, and then by an additional twenty-five basis points cut in both September and October 2019.
The Fund uses a passive investment approach to achieve its investment objective, and therefore made no change in investment approach in response to market conditions.
Performance review
For the twelve months ended October 31, 2019, Legg Mason Low Volatility High Dividend ETF generated a 15.15% return on a net asset value (“NAV”)v basis and 15.22% based on its market pricevi per share.
The performance table shows the Fund’s total return for the twelve months ended October 31, 2019 based on its NAV and market price as of October 31, 2019. The Fund seeks to track the investment results of the QS Low Volatility High Dividend Index, which returned 15.55% for the same period. The Fund’s broad-based market index, the Russell 3000 Index returned 13.49% over the same time frame. The LipperMulti-Cap Value Funds Category
| | |
2 | | Legg Mason Low Volatility High Dividend ETF 2019 Annual Report |
Averagevii returned 8.29% for the period. Please note that Lipper performance returns are based on each fund’s NAV.
| | | | | | | | |
Performance Snapshotas of October 31, 2019
(unaudited) | |
| | 6 months | | | 12 months | |
| Legg Mason Low Volatility High Dividend ETF: | | | | | | | | |
$33.77 (NAV) | | | 5.68 | % | | | 15.15 | %*† |
$33.79 (Market Price) | | | 5.71 | % | | | 15.22 | %*‡ |
| QS Low Volatility High Dividend Index | | | 5.86 | % | | | 15.55 | % |
| Russell 3000 Index | | | 3.44 | % | | | 13.49 | % |
| LipperMulti-Cap Value Funds Category Average | | | 1.39 | % | | | 8.29 | % |
The performance shown represents past performance. Past performance is no guarantee of future results and current performance may be higher or lower than the performance shown above. Principal value and investment returns will fluctuate so shares, when sold, may be worth more or less than their original cost. Performance data current to the most recentmonth-end is available at www.leggmason.com/etf.
Investors buy and sell shares of an exchange-traded fund (“ETF”) at market price (not NAV) in the secondary market throughout the trading day. These shares are not individually available for direct purchase from or direct redemption to the ETF. Market price returns shown are typically based upon themid-point between the bid and ask on the Fund’s principal trading market when the Fund’s NAV is determined, which is typically 4:00 p.m. Eastern time (US). These returns do not represent investors’ returns had they traded shares at other times. Performance figures for periods shorter than one year represent cumulative figures and are not annualized.
Information showing the number of days the market price of the Fund’s shares was greater than the Fund’s NAV and the number of days it was less than the Fund’s NAV (i.e., premium or discount) for various time periods is available by visiting the Fund’s website at www.leggmason.com/etf.
As of the Fund’s current prospectus dated March 1, 2019, the gross total annual fund operating expense ratio for the Fund was 0.27%.
* Total returns are based on changes in NAV or market price, respectively. Returns reflect the deduction of all Fund expenses. Returns do not reflect the deduction of brokerage commissions or taxes that investors pay on distributions or the sale of shares.
† Total return assumes the reinvestment of all distributions at NAV.
‡ Total return assumes the reinvestment of all distributions at market price.
Q. What were the leading contributors to performance?
A.The leading contributors to performance in the Underlying Index for the reporting period were the Utilities and Real Estate sectors, by virtue of their weight in the Underlying Index and returns in excess of 25%. The Communication Services sector was also a contributor to performance for the period.
| | |
| Legg Mason Low Volatility High Dividend ETF 2019 Annual Report | | 3 |
Fund overview (cont’d)
Q. What were the leading detractors from performance?
A.The leading detractors from performance, despite posting positive returns in the Underlying Index, were the Materials and Energy sectors. Health Care was also a detractor from results, with a modestly negative return for the period.
Looking for additional information?
The Fund’s daily NAV is availableon-line at www.leggmason.com/etf. The Fund is traded under the symbol “LVHD” and its closing market price is available on most financial websites. In a continuing effort to provide information concerning the Fund, shareholders may call1-877-721-1926 (toll free), Monday through Friday from 8:00 a.m. to 5:30 p.m. Eastern time, for the Fund’s current NAV, market price and other information.
Thank you for your investment in Legg Mason Low Volatility High Dividend ETF. As always, we appreciate that you have chosen us to manage your assets and we remain focused on achieving the Fund’s investment goals.
Sincerely,

QS Investors, LLC
November 18, 2019
RISKS: Equity securities are subject to market and price fluctuations. Dividends are not guaranteed, and a company may reduce or eliminate its dividend at any time. In rising markets, the value oflarge-cap stocks may not rise as much assmaller-cap stocks. Small- andmid-cap stocks involve greater risks and volatility thanlarge-cap stocks. The Fund may focus its investments in certain industries, increasing its vulnerability to market volatility. There is no guarantee that the Fund will achieve a high degree of correlation to the index it seeks to track. The Fund does not seek to outperform the index it tracks and does not seek temporary defensive positions when markets decline or appear overvalued. Derivatives, such as options and futures, can be illiquid, may disproportionately increase losses and have a potentially large impact on Fund performance. Distributions are not guaranteed and are subject to change. Please see the Fund’s prospectus for a more complete discussion of these and other risks and the Fund’s investment strategies.
The mention of sector breakdowns is for informational purposes only and should not be construed as a recommendation to purchase or sell any securities. The information provided regarding such sectors is not a sufficient basis upon which to make an investment decision. Investors seeking financial advice regarding the appropriateness of investing in any securities or investment strategies discussed should consult their financial professional. The Fund’s top five sector holdings (as a percentage of net assets) as of October 31, 2019 were: Utilities (26.1%), Real Estate (16.3%), Consumer Staples (14.1%), Energy (7.5%) and Communication Services (7.3%). The Fund’s composition may differ over time.
| | |
4 | | Legg Mason Low Volatility High Dividend ETF 2019 Annual Report |
All investments are subject to risk including the possible loss of principal. Past performance is no guarantee of future results. An index is a statistical composite that tracks a specified financial market, sector or rules-based investment process. Unlike a fund, an index does not actually hold a portfolio of securities and therefore does not incur the expenses incurred by a fund. These expenses negatively impact fund performance. All index performance reflects no deduction for fees, expenses or taxes. Please note that an investor cannot invest directly in an index.
The information provided is not intended to be a forecast of future events, a guarantee of future results or investment advice. Views expressed may differ from those of the firm as a whole.
| i | The Russell 3000 Index measures the performance of the 3,000 largest U.S. companies based on total market capitalization, which represents approximately 98% of the U.S. equity market. |
| ii | The yield curve is the graphical depiction of the relationship between the yield on bonds of the same credit quality but different maturities. |
| iii | The Federal Reserve Board (the “Fed”) is responsible for the formulation of U.S. policies designed to promote economic growth, full employment, stable prices and a sustainable pattern of international trade and payments. |
| iv | A basis point isone-hundredth (1/100 or 0.01) of one percent. |
| v | Net Asset Value (NAV) is calculated by subtracting total liabilities from total assets and dividing the results by the number of shares outstanding. |
| vi | Market Price is determined by supply and demand. It is the price at which an investor purchases or sells shares of the Fund. The Market Price may differ from the Fund’s NAV. |
| vii | Lipper, Inc., a wholly-owned subsidiary of Reuters, provides independent insight on global collective investments. Returns are based on the twelve-month ended October 31, 2019, including the reinvestment of all distributions, including returns of capital, if any, calculated among the 449 funds for thesix-month period and among the 446 funds for the twelve-month period in the Fund’s Lipper category. |
| | |
| Legg Mason Low Volatility High Dividend ETF 2019 Annual Report | | 5 |
Fund at a glance†(unaudited)
Investment breakdown(%) as a percent of total investments
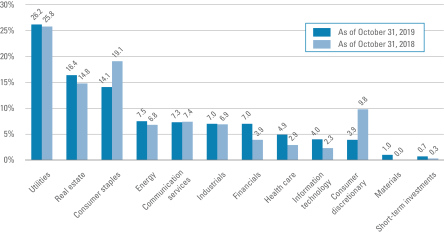
| † | The bar graph above represents the composition of the Fund’s investments as of October 31, 2019 and October 31, 2018 and does not include derivatives such as futures contracts. The composition of the Fund’s investments is subject to change at any time. |
| | |
6 | | Legg Mason Low Volatility High Dividend ETF 2019 Annual Report |
Fund expenses(unaudited)
Example
As a shareholder of the Fund, you may incur two types of costs: (1) transaction costs, such as brokerage commissions paid on purchases and sales of Fund shares; and (2) ongoing costs, including management fees; and other Fund expenses. This example is intended to help you understand your ongoing costs (in dollars) of investing in the Fund and to compare these costs with the ongoing costs of investing in other funds.
This example is based on an investment of $1,000 invested on May 1, 2019 and held for the six months ended October 31, 2019.
Actual expenses
The table below titled “Based on Actual Total Return” provides information about actual account values and actual expenses. You may use the information provided in this table, together with the amount you invested, to estimate the expenses that you paid over the period. To estimate the expenses you paid on your account, divide your ending account value by $1,000 (for example, an $8,600 ending account value divided by $1,000 = 8.6), then multiply the result by the number under the heading entitled “Expenses Paid During the Period”.
Hypothetical example for comparison purposes
The table below titled “Based on Hypothetical Total Return” provides information about hypothetical account values and hypothetical expenses based on the actual expense ratio and an assumed rate of return of 5.00% per year before expenses, which is not the Fund’s actual return. The hypothetical account values and expenses may not be used to estimate the actual ending account balance or expenses you paid for the period. You may use the information provided in this table to compare the ongoing costs of investing in the Fund and other funds. To do so, compare the 5.00% hypothetical example relating to the Fund with the 5.00% hypothetical examples that appear in the shareholder reports of the other funds.
Please note that the expenses shown in the table below are meant to highlight your ongoing costs only and do not reflect any transactional costs, such as brokerage commissions paid on purchases and sales of Fund shares. Therefore, the table is useful in comparing ongoing costs only, and will not help you determine the relative total costs of owning different funds. In addition, if these transaction costs were included, your costs would have been higher.
| | | | | | | | | | | | | | | | | | | | | | | | | | | | | | | | | | | | | | | | | | | | | | | | | | |
| | |
| Based on actual total return1 | | | | Based on hypothetical total return1 |
Actual
Total Return2 | | Beginning
Account
Value | | Ending
Account
Value | | Annualized
Expense
Ratio | | Expenses
Paid During
the Period3 | | | | Hypothetical
Annualized
Total Return | | Beginning
Account
Value | | Ending
Account
Value | | Annualized
Expense
Ratio | | Expenses
Paid During
the Period3 |
| | | 5.68% | | | | $ | 1,000.00 | | | | $ | 1,056.80 | | | | | 0.27 | % | | | $ | 1.40 | | | | | | | 5.00 | % | | | | $1,000.00 | | | | $ | 1,023.84 | | | | | 0.27 | % | | | $ | 1.38 | |
| 1 | For the six months ended October 31, 2019. |
| 2 | Assumes the reinvestment of all distributions, including returns of capital, if any, at net asset value. Total return is not annualized, as it may not be representative of the total return for the year. Performance figures may reflect fee waivers and/or expense reimbursements. In the absence of fee waivers and/or expense reimbursements, the total return would have been lower. Past performance is no guarantee of future results. |
| 3 | Expenses (net of fee waivers and/or expense reimbursements) are equal to the Fund’s annualized expense ratio multiplied by the average account value over the period, multiplied by the number of days in the most recent fiscal half-year (184), then divided by 365. |
| | |
| Legg Mason Low Volatility High Dividend ETF 2019 Annual Report | | 7 |
Fund performance(unaudited)
| | | | |
| Net Asset Value | | | |
| Average annual total returns1 | | | |
| Twelve Months Ended 10/31/19 | | | 15.15 | % |
| Inception* through 10/31/19 | | | 11.49 | |
| |
| Cumulative total returns1 | | | |
| Inception date of 12/28/15 through 10/31/19 | | | 51.89 | % |
| | | | |
| Market Price | | | |
| Average annual total returns2 | | | |
| Twelve Months Ended 10/31/19 | | | 15.22 | % |
| Inception* through 10/31/19 | | | 11.50 | |
| |
| Cumulative total returns2 | | | |
| Inception date of 12/28/15 through 10/31/19 | | | 51.97 | % |
All figures represent past performance and are not a guarantee of future results. Investment returns and principal value of an investment will fluctuate so that an investor’s shares, when redeemed, may be worth more or less than their original cost. The returns shown do not reflect the deduction of brokerage commissions or taxes that investors would pay on distributions or the sale of shares. Performance figures may reflect fee waivers and/or expense reimbursements. In the absence of fee waivers and/or expense reimbursements, the total return would have been lower.
Investors buy and sell shares of the Fund at market price, not NAV, in the secondary market throughout the trading day. These shares are not individually available for direct purchase from or direct redemption to the Fund. The Fund’s per share NAV is the value of one share of the Fund and is calculated by dividing the value of total assets less total liabilities by the number of shares outstanding. The NAV return is based on the NAV of the Fund and the market price return is typically based upon themid-point between the bid and ask on the Fund’s principal trading market when the Fund’s NAV is determined, which is typically 4:00 p.m. Eastern time (US). These returns do not represent investors’ returns had they traded shares at other times. NAV and market price returns assume that dividends and capital gain distributions have been reinvested in the Fund at NAV and market price, respectively. As with other exchange-traded funds, NAV returns and market price returns may differ because of factors such as the supply and demand for Fund shares and investors’ assessment of the underlying value of the Fund’s portfolio securities.
| 1 | Assumes the reinvestment of all distributions, including returns of capital, if any, at net asset value. |
| 2 | Assumes the reinvestment of all distributions, including returns of capital, if any, at market price. |
| * | Inception date of the Fund is December 28, 2015. |
| | |
8 | | Legg Mason Low Volatility High Dividend ETF 2019 Annual Report |
Historical performance
Value of $10,000 invested in
Legg Mason Low Volatility High Dividend ETF vs QS Low Volatility High Dividend Index and Russell 3000 Index† — December 28, 2015 - October 2019
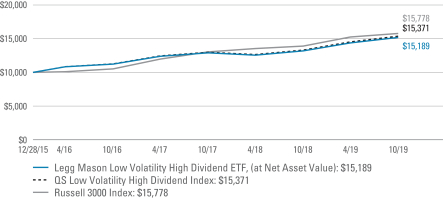
All figures represent past performance and are not a guarantee of future results. Investment returns and principal value of an investment will fluctuate so that an investor’s shares, when sold, may be worth more or less than their original cost. NAV returns assume that dividends and capital gain distributions have been reinvested in the Fund at NAV. The returns shown do not reflect the deduction of brokerage commissions or taxes that investors would pay on distributions or the sale of shares. Performance figures may reflect fee waivers and/or expense reimbursements. In the absence of fee waivers and/or expense reimbursements, the total return would have been lower.
| † | Hypothetical illustration of $10,000 invested in Legg Mason Low Volatility High Dividend ETF on December 28, 2015 (inception date), assuming the reinvestment of all distributions, including returns of capital, if any, at net asset value through October 31, 2019. The hypothetical illustration also assumes a $10,000 investment in the QS Low Volatility High Dividend Index and the Russell 3000 Index. The Fund’s per share NAV is the value of one share of the Fund and is calculated by dividing the value of total assets less total liabilities by the number of shares outstanding. The NAV return is based on the NAV of the Fund. QS Low Volatility High Dividend Index (the “Underlying Index”), is an index composed of equity securities of U.S. companies with relatively high yield and low price and earnings volatility. The Underlying Index is based on a proprietary methodology created and sponsored by QS Investors, LLC, the Fund’s subadviser. The Underlying Index is composed of stocks of U.S. companies across a wide range of market capitalizations, including the largest 3,000 U.S. stocks as determined by the Solactive US Broad Market Index. The Russell 3000 Index measures the performance of the 3,000 largest U.S. companies based on total market capitalization, which represents approximately 98% of the U.S. equity market. The indices are not subject to the same management and trading expenses as a fund. An index is a statistical composite that tracks a specified financial market, sector, or rules-based investment process. Unlike a fund, an index does not actually hold a portfolio of securities and therefore does not incur the expenses incurred by a fund. These expenses negatively impact fund performance. All index performance reflects no deduction for fees, expenses or taxes. Please note that an investor cannot invest directly in an index. |
| | |
| Legg Mason Low Volatility High Dividend ETF 2019 Annual Report | | 9 |
Schedule of investments
October 31, 2019
Legg Mason Low Volatility High Dividend ETF
| | | | | | | | | | | | | | | | |
| Security | | | | | | | | Shares | | | Value | |
| Common Stocks — 99.1% | | | | | | | | | | | | | | | | |
| Communication Services — 7.3% | | | | | | | | | | | | | | | | |
Diversified Telecommunication Services — 5.4% | | | | | | | | | | | | | | | | |
AT&T Inc. | | | | | | | | | | | 602,692 | | | $ | 23,197,615 | |
Verizon Communications Inc. | | | | | | | | | | | 352,643 | | | | 21,324,323 | |
Total Diversified Telecommunication Services | | | | | | | | | | | | | | | 44,521,938 | |
Media — 1.9% | | | | | | | | | | | | | | | | |
Omnicom Group Inc. | | | | | | | | | | | 206,254 | | | | 15,920,746 | |
Total Communication Services | | | | | | | | | | | | | | | 60,442,684 | |
| Consumer Discretionary — 3.9% | | | | | | | | | | | | | | | | |
Distributors — 1.2% | | | | | | | | | | | | | | | | |
Genuine Parts Co. | | | | | | | | | | | 96,578 | | | | 9,906,971 | |
Hotels, Restaurants & Leisure — 2.2% | | | | | | | | | | | | | | | | |
Carnival Corp. | | | | | | | | | | | 274,751 | | | | 11,784,070 | |
Cracker Barrel Old Country Store Inc. | | | | | | | | | | | 42,480 | | | | 6,605,640 | |
Total Hotels, Restaurants & Leisure | | | | | | | | | | | | | | | 18,389,710 | |
Specialty Retail — 0.5% | | | | | | | | | | | | | | | | |
L Brands Inc. | | | | | | | | | | | 217,837 | | | | 3,711,943 | |
Total Consumer Discretionary | | | | | | | | | | | | | | | 32,008,624 | |
| Consumer Staples — 14.1% | | | | | | | | | | | | | | | | |
Beverages — 2.6% | | | | | | | | | | | | | | | | |
PepsiCo Inc. | | | | | | | | | | | 158,839 | | | | 21,787,946 | |
Food Products — 6.8% | | | | | | | | | | | | | | | | |
Archer-Daniels-Midland Co. | | | | | | | | | | | 405,407 | | | | 17,043,310 | |
General Mills Inc. | | | | | | | | | | | 377,809 | | | | 19,215,366 | |
Kellogg Co. | | | | | | | | | | | 312,583 | | | | 19,858,398 | |
Total Food Products | | | | | | | | | | | | | | | 56,117,074 | |
Household Products — 2.8% | | | | | | | | | | | | | | | | |
Procter & Gamble Co. | | | | | | | | | | | 182,728 | | | | 22,751,463 | |
Tobacco — 1.9% | | | | | | | | | | | | | | | | |
Altria Group Inc. | �� | | | | | | | | | | 341,188 | | | | 15,281,810 | |
Total Consumer Staples | | | | | | | | | | | | | | | 115,938,293 | |
| Energy — 7.5% | | | | | | | | | | | | | | | | |
Oil, Gas & Consumable Fuels — 7.5% | | | | | | | | | | | | | | | | |
Chevron Corp. | | | | | | | | | | | 74,964 | | | | 8,706,319 | |
Exxon Mobil Corp. | | | | | | | | | | | 262,019 | | | | 17,704,624 | |
Phillips 66 | | | | | | | | | | | 164,519 | | | | 19,219,109 | |
Valero Energy Corp. | | | | | | | | | | | 166,758 | | | | 16,172,191 | |
Total Energy | | | | | | | | | | | | | | | 61,802,243 | |
See Notes to Financial Statements.
| | |
10 | | Legg Mason Low Volatility High Dividend ETF 2019 Annual Report |
Legg Mason Low Volatility High Dividend ETF
| | | | | | | | | | | | | | | | |
| Security | | | | | | | | Shares | | | Value | |
| Financials — 7.0% | | | | | | | | | | | | | | | | |
Banks — 4.5% | | | | | | | | | | | | | | | | |
FNB Corp. | | | | | | | | | | | 276,362 | | | $ | 3,332,926 | |
Huntington Bancshares Inc. | | | | | | | | | | | 1,421,970 | | | | 20,092,436 | |
PacWest Bancorp | | | | | | | | | | | 120,757 | | | | 4,466,801 | |
People’s United Financial Inc. | | | | | | | | | | | 404,431 | | | | 6,539,649 | |
Umpqua Holdings Corp. | | | | | | | | | | | 178,295 | | | | 2,820,627 | |
Total Banks | | | | | | | | | | | | | | | 37,252,439 | |
Capital Markets — 0.6% | | | | | | | | | | | | | | | | |
Cohen & Steers Inc. | | | | | | | | | | | 12,228 | | | | 800,201 | |
Invesco Ltd. | | | | | | | | | | | 235,316 | | | | 3,958,015 | |
Total Capital Markets | | | | | | | | | | | | | | | 4,758,216 | |
Insurance — 0.6% | | | | | | | | | | | | | | | | |
CNA Financial Corp. | | | | | | | | | | | 31,373 | | | | 1,406,765 | |
Old Republic International Corp. | | | | | | | | | | | 167,891 | | | | 3,750,685 | |
Total Insurance | | | | | | | | | | | | | | | 5,157,450 | |
Mortgage Real Estate Investment Trusts (REITs) — 0.2% | | | | | | | | | | | | | | | | |
Arbor Realty Trust Inc. | | | | | | | | | | | 109,919 | | | | 1,501,494 | |
Thrifts & Mortgage Finance — 1.1% | | | | | | | | | | | | | | | | |
New York Community Bancorp Inc. | | | | | | | | | | | 614,342 | | | | 7,157,084 | |
Northwest Bancshares Inc. | | | | | | | | | | | 61,852 | | | | 1,043,443 | |
Provident Financial Services Inc. | | | | | | | | | | | 20,527 | | | | 512,149 | |
Total Thrifts & Mortgage Finance | | | | | | | | | | | | | | | 8,712,676 | |
Total Financials | | | | | | | | | | | | | | | 57,382,275 | |
| Health Care — 4.8% | | | | | | | | | | | | | | | | |
Pharmaceuticals — 4.8% | | | | | | | | | | | | | | | | |
Merck & Co. Inc. | | | | | | | | | | | 250,695 | | | | 21,725,229 | |
Pfizer Inc. | | | | | | | | | | | 475,469 | | | | 18,243,745 | |
Total Health Care | | | | | | | | | | | | | | | 39,968,974 | |
| Industrials — 7.0% | | | | | | | | | | | | | | | | |
Air Freight & Logistics — 2.3% | | | | | | | | | | | | | | | | |
United Parcel Service Inc., Class B Shares | | | | | | | | | | | 161,438 | | | | 18,592,815 | |
Electrical Equipment — 4.6% | | | | | | | | | | | | | | | | |
Eaton Corp. PLC | | | | | | | | | | | 231,112 | | | | 20,132,166 | |
Emerson Electric Co. | | | | | | | | | | | 253,739 | | | | 17,799,791 | |
Total Electrical Equipment | | | | | | | | | | | | | | | 37,931,957 | |
Trading Companies & Distributors — 0.1% | | | | | | | | | | | | | | | | |
Aircastle Ltd. | | | | | | | | | | | 36,850 | | | | 1,003,057 | |
Total Industrials | | | | | | | | | | | | | | | 57,527,829 | |
See Notes to Financial Statements.
| | |
| Legg Mason Low Volatility High Dividend ETF 2019 Annual Report | | 11 |
Schedule of investments (cont’d)
October 31, 2019
Legg Mason Low Volatility High Dividend ETF
| | | | | | | | | | | | | | | | |
| Security | | | | | | | | Shares | | | Value | |
| Information Technology — 4.0% | | | | | | | | | | | | | | | | |
IT Services — 4.0% | | | | | | | | | | | | | | | | |
Paychex Inc. | | | | | | | | | | | 206,148 | | | $ | 17,242,219 | |
Western Union Co. | | | | | | | | | | | 643,326 | | | | 16,121,749 | |
Total Information Technology | | | | | | | | | | | | | | | 33,363,968 | |
| Materials — 1.1% | | | | | | | | | | | | | | | | |
Chemicals — 1.1% | | | | | | | | | | | | | | | | |
LyondellBasell Industries NV, Class A Shares | | | | | | | | | | | 98,433 | | | | 8,829,440 | |
| Real Estate — 16.3% | | | | | | | | | | | | | | | | |
Equity Real Estate Investment Trusts (REITs) — 16.3% | | | | | | | | | | | | | | | | |
Apple Hospitality REIT Inc. | | | | | | | | | | | 132,547 | | | | 2,184,374 | |
Chatham Lodging Trust | | | | | | | | | | | 28,157 | | | | 508,234 | |
Crown Castle International Corp. | | | | | | | | | | | 155,419 | | | | 21,570,603 | |
DiamondRock Hospitality Co. | | | | | | | | | | | 299,845 | | | | 2,992,453 | |
Easterly Government Properties Inc. | | | | | | | | | | | 48,335 | | | | 1,078,837 | |
EPR Properties | | | | | | | | | | | 49,519 | | | | 3,852,083 | |
Four Corners Property Trust Inc. | | | | | | | | | | | 37,968 | | | | 1,087,783 | |
Gaming and Leisure Properties Inc. | | | | | | | | | | | 147,424 | | | | 5,950,033 | |
Getty Realty Corp. | | | | | | | | | | | 13,290 | | | | 445,747 | |
Highwoods Properties Inc. | | | | | | | | | | | 75,248 | | | | 3,521,606 | |
Industrial Logistics Properties Trust | | | | | | | | | | | 39,365 | | | | 836,113 | |
Lamar Advertising Co., Class A Shares | | | | | | | | | | | 40,099 | | | | 3,208,321 | |
Lexington Realty Trust | | | | | | | | | | | 130,914 | | | | 1,424,344 | |
LTC Properties Inc. | | | | | | | | | | | 22,279 | | | | 1,155,166 | |
Monmouth Real Estate Investment Corp. | | | | | | | | | | | 31,446 | | | | 474,206 | |
National Health Investors Inc. | | | | | | | | | | | 23,882 | | | | 2,048,837 | |
National Retail Properties Inc. | | | | | | | | | | | 111,134 | | | | 6,546,904 | |
Piedmont Office Realty Trust Inc., Class A Shares | | | | | | | | | | | 88,273 | | | | 1,980,846 | |
Public Storage | | | | | | | | | | | 56,098 | | | | 12,502,000 | |
Realty Income Corp. | | | | | | | | | | | 215,891 | | | | 17,657,725 | |
Service Properties Trust | | | | | | | | | | | 85,650 | | | | 2,166,945 | |
STORE Capital Corp. | | | | | | | | | | | 188,324 | | | | 7,627,122 | |
Ventas Inc. | | | | | | | | | | | 238,786 | | | | 15,544,969 | |
VICI Properties Inc. | | | | | | | | | | | 336,345 | | | | 7,920,925 | |
WP Carey Inc. | | | | | | | | | | | 111,850 | | | | 10,296,911 | |
Total Real Estate | | | | | | | | | | | | | | | 134,583,087 | |
| Utilities — 26.1% | | | | | | | | | | | | | | | | |
Electric Utilities — 15.8% | | | | | | | | | | | | | | | | |
American Electric Power Co. Inc. | | | | | | | | | | | 234,203 | | | | 22,106,421 | |
Duke Energy Corp. | | | | | | | | | | | 226,445 | | | | 21,344,706 | |
Evergy Inc. | | | | | | | | | | | 196,969 | | | | 12,588,289 | |
See Notes to Financial Statements.
| | |
12 | | Legg Mason Low Volatility High Dividend ETF 2019 Annual Report |
Legg Mason Low Volatility High Dividend ETF
| | | | | | | | | | | | | | | | |
| Security | | | | | | | | Shares | | | Value | |
Electric Utilities — continued | | | | | | | | | | | | | | | | |
Eversource Energy | | | | | | | | | | | 206,265 | | | $ | 17,272,631 | |
Exelon Corp. | | | | | | | | | | | 95,882 | | | | 4,361,672 | |
OGE Energy Corp. | | | | | | | | | | | 145,892 | | | | 6,282,110 | |
Pinnacle West Capital Corp. | | | | | | | | | | | 110,194 | | | | 10,371,459 | |
PPL Corp. | | | | | | | | | | | 474,775 | | | | 15,900,215 | |
Xcel Energy Inc. | | | | | | | | | | | 310,150 | | | | 19,697,626 | |
Total Electric Utilities | | | | | | | | | | | | | | | 129,925,129 | |
Multi-Utilities — 10.3% | | | | | | | | | | | | | | | | |
Ameren Corp. | | | | | | | | | | | 155,274 | | | | 12,064,790 | |
Consolidated Edison Inc. | | | | | | | | | | | 207,927 | | | | 19,175,028 | |
DTE Energy Co. | | | | | | | | | | | 114,763 | | | | 14,611,625 | |
Public Service Enterprise Group Inc. | | | | | | | | | | | 327,638 | | | | 20,742,762 | |
WEC Energy Group Inc. | | | | | | | | | | | 198,559 | | | | 18,743,969 | |
Total Multi-Utilities | | | | | | | | | | | | | | | 85,338,174 | |
Total Utilities | | | | | | | | | | | | | | | 215,263,303 | |
Total Investments before Short-Term Investments (Cost — $748,144,442) | | | | | | | | 817,110,720 | |
| | | | |
| | | | | | Rate | | | | | | | |
| Short-Term Investments — 0.7% | | | | | | | | | | | | | | | | |
Invesco Treasury Portfolio, Institutional Class (Cost — $5,451,995) | | | | | | | 1.632% | | | | 5,451,995 | | | | 5,451,995 | |
Total Investments — 99.8% (Cost — $753,596,437) | | | | | | | | | | | | 822,562,715 | |
Other Assets in Excess of Liabilities — 0.2% | | | | | | | | | | | | | | | 1,459,522 | |
Total Net Assets — 100.0% | | | | | | | | | | | | | | $ | 824,022,237 | |
| | |
Abbreviation used in this schedule: |
|
| REIT — Real Estate Investment Trust |
At October 31, 2019, the Fund had the following open futures contracts:
| | | | | | | | | | | | | | | | | | | | |
| | | Number of
Contracts | | | Expiration
Date | | | Notional
Amount | | | Market
Value | | | Unrealized
Appreciation | |
| Contracts to Buy: | | | | | | | | | | | | | | | | | | | | |
| E-Mini S&P 500 Index | | | 25 | | | | 12/19 | | | $ | 3,744,304 | | | $ | 3,794,750 | | | $ | 50,446 | |
See Notes to Financial Statements.
| | |
| Legg Mason Low Volatility High Dividend ETF 2019 Annual Report | | 13 |
Statement of assets and liabilities
October 31, 2019
| | | | |
| |
| Assets: | | | | |
Investments, at value (Cost — $753,596,437) | | | $822,562,715 | |
Dividends and interest receivable | | | 1,473,446 | |
Deposits with brokers for open futures contracts | | | 117,415 | |
Receivable from broker — variation margin on open futures contracts | | | 50,513 | |
Receivable for Fund shares sold | | | 1,345 | |
Total Assets | | | 824,205,434 | |
| |
| Liabilities: | | | | |
Investment management fee payable | | | 183,197 | |
Total Liabilities | | | 183,197 | |
| Total Net Assets | | | $824,022,237 | |
| |
| Net Assets: | | | | |
Par value (Note 5) | | | $ 244 | |
Paid-in capital in excess of par value | | | 787,394,646 | |
Total distributable earnings (loss) | | | 36,627,347 | |
| Total Net Assets | | | $824,022,237 | |
| |
| Shares Outstanding | | | 24,400,000 | |
| |
| Net Asset Value | | | $33.77 | |
See Notes to Financial Statements.
| | |
14 | | Legg Mason Low Volatility High Dividend ETF 2019 Annual Report |
Statement of operations
For the Year Ended October 31, 2019
| | | | |
| |
| Investment Income: | | | | |
Dividends | | | $24,778,146 | |
Interest | | | 67,351 | |
Total Investment Income | | | 24,845,497 | |
| |
| Expenses: | | | | |
Investment management fee (Note 2) | | | 1,777,914 | |
Total Expenses | | | 1,777,914 | |
| Net Investment Income | | | 23,067,583 | |
| |
| Realized and Unrealized Gain (Loss) on Investments and Futures Contracts (Notes 1, 3 and 4): | | | | |
Net Realized Gain (Loss) From: | | | | |
Investment transactions | | | 7,499,480 | |
Futures contracts | | | (298,607) | |
Net Realized Gain | | | 7,200,873 | |
Change in Net Unrealized Appreciation (Depreciation) From: | | | | |
Investments | | | 63,687,080 | |
Futures contracts | | | 154,523 | |
Change in Net Unrealized Appreciation (Depreciation) | | | 63,841,603 | |
| Net Gain on Investments and Futures Contracts | | | 71,042,476 | |
| Increase in Net Assets From Operations | | | $94,110,059 | |
See Notes to Financial Statements.
| | |
| Legg Mason Low Volatility High Dividend ETF 2019 Annual Report | | 15 |
Statements of changes in net assets
| | | | | | | | |
| For the Years Ended October 31, | | 2019 | | | 2018 | |
| | |
| Operations: | | | | | | | | |
Net investment income | | $ | 23,067,583 | | | $ | 20,135,495 | |
Net realized gain (loss) | | | 7,200,873 | | | | (1,194,737) | |
Change in net unrealized appreciation (depreciation) | | | 63,841,603 | | | | (7,129,106) | |
Increase in Net Assets From Operations | | | 94,110,059 | | | | 11,811,652 | |
| | |
| Distributions to Shareholders From (Note 1): | | | | | | | | |
Total distributable earnings(a) | | | (17,910,014) | | | | (20,202,397) | |
Decrease in Net Assets From Distributions to Shareholders | | | (17,910,014) | | | | (20,202,397) | |
| | |
| Fund Share Transactions (Note 5): | | | | | | | | |
Net proceeds from sale of shares (10,250,000 and 10,100,000 shares issued, respectively) | | | 327,352,803 | | | | 304,989,897 | |
Cost of shares repurchased (5,000,000 and 5,550,000 shares repurchased, respectively) | | | (157,610,637) | | | | (165,282,853) | |
Increase in Net Assets From Fund Share Transactions | | | 169,742,166 | | | | 139,707,044 | |
Increase in Net Assets | | | 245,942,211 | | | | 131,316,299 | |
| | |
| Net Assets: | | | | | | | | |
Beginning of year | | | 578,080,026 | | | | 446,763,727 | |
End of year(b) | | $ | 824,022,237 | | | $ | 578,080,026 | |
| (a) | Distributions from net investment income and from realized gains are no longer required to be separately disclosed (Note 7). For the year ended October 31, 2018, distributions from net investment income were $20,202,397. |
| (b) | Parenthetical disclosure of undistributed net investment income is no longer required (Note 7). For the year ended October 31, 2018, end of year net assets included undistributed net investment income of $619,004. |
See Notes to Financial Statements.
| | |
16 | | Legg Mason Low Volatility High Dividend ETF 2019 Annual Report |
Financial highlights
| | | | | | | | | | | | | | | | |
For a share of beneficial interest outstanding throughout each year ended October 31,
unless otherwise noted: | |
| | | 20191 | | | 20181 | | | 20171 | | | 20161,2 | |
| | | | |
| Net asset value, beginning of year | | | $30.19 | | | | $30.60 | | | | $27.55 | | | | $24.96 | |
| | | | |
| Income (loss) from operations: | | | | | | | | | | | | | | | | |
Net investment income | | | 1.11 | | | | 1.09 | | | | 1.03 | | | | 0.80 | |
Net realized and unrealized gain (loss) | | | 3.36 | | | | (0.41) | | | | 3.03 | | | | 2.26 | 3 |
Total income from operations | | | 4.47 | | | | 0.68 | | | | 4.06 | | | | 3.06 | |
| | | | |
| Less distributions from: | | | | | | | | | | | | | | | | |
Net investment income | | | (0.89) | | | | (1.09) | | | | (1.01) | | | | (0.47) | |
Total distributions | | | (0.89) | | | | (1.09) | | | | (1.01) | | | | (0.47) | |
| | | | |
| Net asset value, end of year | | | $33.77 | | | | $30.19 | | | | $30.60 | | | | $27.55 | |
Total return, based on NAV4 | | | 15.15 | % | | | 2.25 | % | | | 14.89 | % | | | 12.28 | % |
| | | | |
| Net assets, end of year (millions) | | | $824 | | | | $578 | | | | $447 | | | | $95 | |
| | | | |
| Ratios to average net assets: | | | | | | | | | | | | | | | | |
Gross expenses | | | 0.27 | % | | | 0.27 | % | | | 0.29 | % | | | 0.30 | %5 |
Net expenses | | | 0.27 | | | | 0.27 | | | | 0.29 | | | | 0.30 | 5 |
Net investment income | | | 3.50 | | | | 3.60 | | | | 3.45 | | | | 3.42 | 5 |
| | | | |
| Portfolio turnover rate6 | | | 29 | % | | | 44 | % | | | 28 | % | | | 48 | % |
| 1 | Per share amounts have been calculated using the average shares method. |
| 2 | For the period December 28, 2015 (inception date) to October 31, 2016. |
| 3 | Calculation of the net gain per share (both realized and unrealized) does not correlate to the aggregate realized and unrealized losses presented in the Statement of Operations due to the timing of the of the sales and repurchases of Fund shares in relation to fluctuating market values of the investments of the Fund. |
| 4 | Performance figures may reflect fee waivers and/or expense reimbursements. In the absence of fee waivers and/or expense reimbursements, the total return would have been lower. The total return calculation assumes that distributions are reinvested at NAV. Past performance is no guarantee of future results. Total returns for periods of less than one year are not annualized. |
| 6 | Portfolio turnover excludes the value of portfolio securities received or delivered as a result ofin-kind fund share transactions. |
See Notes to Financial Statements.
| | |
| Legg Mason Low Volatility High Dividend ETF 2019 Annual Report | | 17 |
Notes to financial statements
1. Organization and significant accounting policies
Legg Mason Low Volatility High Dividend ETF (the “Fund”) is a separate diversified investment series of Legg Mason ETF Investment Trust (the “Trust”). The Trust, a Maryland statutory trust, is registered under the Investment Company Act of 1940, as amended (the “1940 Act”), as anopen-end management investment company.
The Fund is an exchange-traded fund (“ETF”). ETFs are funds that trade like other publicly-traded securities. The Fund is designed to track an index. Similar to shares of an index mutual fund, each share of the Fund represents an ownership interest in an underlying portfolio of securities intended to track an index. Unlike shares of a mutual fund, which can be bought from and redeemed by the issuing fund by all shareholders at a price based on net asset value (“NAV”), shares of the Fund may be directly purchased from and redeemed by the Fund at NAV solely by certain large institutional investors who have entered into agreements with the Fund’s distributor (“Authorized Participants”). Also unlike shares of a mutual fund, shares of the Fund are listed on a national securities exchange and trade in the secondary market at market prices that change throughout the day.
Shares of the Fund are listed and traded at market prices on NASDAQ. The market price for the Fund’s shares may be different from the Fund’s NAV. The Fund issues and redeems shares at NAV only in blocks of a specified number of shares or multiples thereof (“Creation Units”). Only Authorized Participants may purchase or redeem Creation Units directly with the Fund at NAV. Creation Units are issued and redeemed generallyin-kind for a basket of securities and/or cash. Except when aggregated in Creation Units, shares of the Fund are not redeemable securities. Shareholders who are not Authorized Participants may not redeem shares directly from the Fund at NAV.
The Fund seeks to track the investment results of the QS Low Volatility High Dividend Index (the “Underlying Index”). The Underlying Index seeks to provide more stable income through investments in stocks of profitable U.S. companies with relatively high dividend yields and lower price and earnings volatility. The Underlying Index is based on a proprietary methodology created and sponsored by QS Investors, LLC, the Fund’s subadviser.
The following are significant accounting policies consistently followed by the Fund and are in conformity with U.S. generally accepted accounting principles (“GAAP”). Estimates and assumptions are required to be made regarding assets, liabilities and changes in net assets resulting from operations when financial statements are prepared. Changes in the economic environment, financial markets and any other parameters used in determining these estimates could cause actual results to differ. Subsequent events have been evaluated through the date the financial statements were issued.
(a) Investment valuation. Equity securities for which market quotations are available are valued at the last reported sales price or official closing price on the primary market or exchange on which they trade. The valuations for fixed income securities (which may
| | |
18 | | Legg Mason Low Volatility High Dividend ETF 2019 Annual Report |
include, but are not limited to, corporate, government, municipal, mortgage-backed, collateralized mortgage obligations and asset-backed securities) and certain derivative instruments are typically the prices supplied by independent third party pricing services, which may use market prices or broker/dealer quotations or a variety of valuation techniques and methodologies. The independent third party pricing services use inputs that are observable such as issuer details, interest rates, yield curves, prepayment speeds, credit risks/spreads, default rates and quoted prices for similar securities. Investments inopen-end funds are valued at the closing net asset value per share of each fund on the day of valuation. Futures contracts are valued daily at the settlement price established by the board of trade or exchange on which they are traded. When the Fund holds securities or other assets that are denominated in a foreign currency, the Fund will use the currency exchange rates, generally determined as of 4:00 p.m. (London Time). If independent third party pricing services are unable to supply prices for a portfolio investment, or if the prices supplied are deemed by the manager to be unreliable, the market price may be determined by the manager using quotations from one or more broker/dealers or at the transaction price if the security has recently been purchased and no value has yet been obtained from a pricing service or pricing broker. When reliable prices are not readily available, such as when the value of a security has been significantly affected by events after the close of the exchange or market on which the security is principally traded, but before the Fund calculates its net asset value, the Fund values these securities as determined in accordance with procedures approved by the Fund’s Board of Trustees.
The Board of Trustees is responsible for the valuation process and has delegated the supervision of the daily valuation process to the Legg Mason North Atlantic Fund Valuation Committee (the “Valuation Committee”). The Valuation Committee, pursuant to the policies adopted by the Board of Trustees, is responsible for making fair value determinations, evaluating the effectiveness of the Fund’s pricing policies, and reporting to the Board of Trustees. When determining the reliability of third party pricing information for investments owned by the Fund, the Valuation Committee, among other things, conducts due diligence reviews of pricing vendors, monitors the daily change in prices and reviews transactions among market participants.
The Valuation Committee will consider pricing methodologies it deems relevant and appropriate when making fair value determinations. Examples of possible methodologies include, but are not limited to, multiple of earnings; discount from market of a similar freely traded security; discounted cash-flow analysis; book value or a multiple thereof; risk premium/yield analysis; yield to maturity; and/or fundamental investment analysis. The Valuation Committee will also consider factors it deems relevant and appropriate in light of the facts and circumstances. Examples of possible factors include, but are not limited to, the type of security; the issuer’s financial statements; the purchase price of the security; the discount from market value of unrestricted securities of the same class at the time of purchase; analysts’ research and observations from financial institutions; information regarding any transactions or offers with respect to the security; the existence of merger proposals or tender
| | |
| Legg Mason Low Volatility High Dividend ETF 2019 Annual Report | | 19 |
Notes to financial statements (cont’d)
offers affecting the security; the price and extent of public trading in similar securities of the issuer or comparable companies; and the existence of a shelf registration for restricted securities.
For each portfolio security that has been fair valued pursuant to the policies adopted by the Board of Trustees, the fair value price is compared against the last available and next available market quotations. The Valuation Committee reviews the results of such back testing monthly and fair valuation occurrences are reported to the Board of Trustees quarterly.
The Fund uses valuation techniques to measure fair value that are consistent with the market approach and/or income approach, depending on the type of security and the particular circumstance. The market approach uses prices and other relevant information generated by market transactions involving identical or comparable securities. The income approach uses valuation techniques to discount estimated future cash flows to present value.
GAAP establishes a disclosure hierarchy that categorizes the inputs to valuation techniques used to value assets and liabilities at measurement date. These inputs are summarized in the three broad levels listed below:
| • | | Level 1 — quoted prices in active markets for identical investments |
| • | | Level 2 — other significant observable inputs (including quoted prices for similar investments, interest rates, prepayment speeds, credit risk, etc.) |
| • | | Level 3 — significant unobservable inputs (including the Fund’s own assumptions in determining the fair value of investments) |
The inputs or methodologies used to value securities are not necessarily an indication of the risk associated with investing in those securities.
The following is a summary of the inputs used in valuing the Fund’s assets carried at fair value:
| | | | | | | | | | | | | | | | |
| ASSETS | |
| Description | | Quoted Prices
(Level 1) | | | Other Significant
Observable Inputs
(Level 2) | | | Significant
Unobservable
Inputs
(Level 3) | | | Total | |
| Common Stocks† | | $ | 817,110,720 | | | | — | | | | — | | | $ | 817,110,720 | |
| Short-Term Investments† | | | 5,451,995 | | | | — | | | | — | | | | 5,451,995 | |
| Total Investments | | $ | 822,562,715 | | | | — | | | | — | | | $ | 822,562,715 | |
| Other Financial Instruments: | | | | | | | | | | | | | | | | |
Futures Contracts | | $ | 50,446 | | | | — | | | | — | | | $ | 50,446 | |
| Total | | $ | 822,613,161 | | | | — | | | | — | | | $ | 822,613,161 | |
|
† See Schedule of Investments for additional detailed categorizations. |
(b) Futures contracts.The Fund uses futures contracts generally to gain or manage exposure to certain assets classes, sectors, or markets or for cash management purposes. A
| | |
20 | | Legg Mason Low Volatility High Dividend ETF 2019 Annual Report |
futures contract represents a commitment for the future purchase or sale of an asset at a specified price on a specified date.
Upon entering into a futures contract, the Fund is required to deposit cash or securities with a broker in an amount equal to a certain percentage of the contract amount. This is known as the ‘‘initial margin’’ and subsequent payments (‘‘variation margin’’) are made or received by the Fund each day, depending on the daily fluctuation in the value of the contract. For certain futures, including foreign denominated futures, variation margin is not settled daily, but is recorded as a net variation margin payable or receivable. The daily changes in contract value are recorded as unrealized gains or losses in the Statement of Operations and the Fund recognizes a realized gain or loss when the contract is closed.
Futures contracts involve, to varying degrees, risk of loss in excess of the amounts reflected in the financial statements. In addition, there is the risk that the Fund may not be able to enter into a closing transaction because of an illiquid secondary market.
(c) Counterparty risk and credit-risk-related contingent features of derivative instruments. The Fund may invest in certain securities or engage in other transactions, where the Fund is exposed to counterparty credit risk in addition to broader market risks. The Fund may invest in securities of issuers, which may also be considered counterparties as trading partners in other transactions. This may increase the risk of loss in the event of default or bankruptcy by the counterparty or if the counterparty otherwise fails to meet its contractual obligations. The Fund’s subadviser attempts to mitigate counterparty risk by (i) periodically assessing the creditworthiness of its trading partners, (ii) monitoring and/or limiting the amount of its net exposure to each individual counterparty based on its assessment and (iii) requiring collateral from the counterparty for certain transactions. Market events and changes in overall economic conditions may impact the assessment of such counterparty risk by the subadviser. In addition, declines in the values of underlying collateral received may expose the Fund to increased risk of loss.
With exchange traded and centrally cleared derivatives, there is less counterparty risk to the Fund since the exchange or clearinghouse, as counterparty to such instruments, guarantees against a possible default. The clearinghouse stands between the buyer and the seller of the contract; therefore, the credit risk is limited to failure of the clearinghouse. While offset rights may exist under applicable law, the Fund does not have a contractual right of offset against a clearing broker or clearinghouse in the event of a default of the clearing broker or clearinghouse.
The Fund has entered into master agreements, such as an International Swaps and Derivatives Association, Inc. Master Agreement (“ISDA Master Agreement”) or similar agreement, with certain of its derivative counterparties that governover-the-counter derivatives and provide for general obligations, representations, agreements, collateral posting terms, netting provisions in the event of default or termination and credit related contingent features. The credit related contingent features include, but are not limited to, a percentage decrease
| | |
| Legg Mason Low Volatility High Dividend ETF 2019 Annual Report | | 21 |
Notes to financial statements (cont’d)
in the Fund’s net assets or NAV over a specified period of time. If these credit related contingent features were triggered, the derivatives counterparty could terminate the positions and demand payment or require additional collateral.
Under an ISDA Master Agreement, the Fund may, under certain circumstances, offset with the counterparty certain derivative financial instruments’ payables and/or receivables with collateral held and/or posted and create one single net payment. However, absent an event of default by the counterparty or a termination of the agreement, the terms of the ISDA Master Agreements do not result in an offset of reported amounts of financial assets and financial liabilities in the Statement of Assets and Liabilities across transactions between the Fund and the applicable counterparty. The enforceability of the right to offset may vary by jurisdiction.
Collateral requirements differ by type of derivative. Collateral or margin requirements are set by the broker or exchange clearinghouse for exchange traded derivatives while collateral terms are contract specific forover-the-counter traded derivatives. Cash collateral that has been pledged to cover obligations of the Fund under derivative contracts, if any, will be reported separately in the Statement of Assets and Liabilities. Securities pledged as collateral, if any, for the same purpose are noted in the Schedule of Investments.
As of October 31, 2019, the Fund did not have any open OTC derivative transactions with credit related contingent futures in a net liability position.
(d) Security transactions and investment income. Security transactions are accounted for on a trade date basis. Interest income (including interest income frompayment-in-kind securities), adjusted for amortization of premium and accretion of discount, is recorded on the accrual basis. Dividend income is recorded on theex-dividend date for dividends received in cash and/or securities. The cost of investments sold is determined by use of the specific identification method. To the extent any issuer defaults or a credit event occurs that impacts the issuer, the Fund may halt any additional interest income accruals and consider the realizability of interest accrued up to the date of default or credit event.
(e) Return of capital estimates. Distributions received from the Fund’s investments in certain securities, most notably master limited partnerships and real estate investment trusts, generally are comprised of income realized gains and/or return of capital. The Fund records investment income, realized capital gains and return of capital based on estimates made at the time such distributions are received. Such estimates are based on historical information available from each issuer and other industry sources. These estimates may subsequently be revised based on information received from the issuers after their tax reporting periods are concluded.
(f) Distributions to shareholders. Distributions from net investment income of the Fund, if any, are declared and paid on a quarterly basis. Distributions of net realized gains, if any, are declared at least annually. Distributions to shareholders of the Fund are recorded on the
| | |
22 | | Legg Mason Low Volatility High Dividend ETF 2019 Annual Report |
ex-dividend date and are determined in accordance with income tax regulations, which may differ from GAAP.
(g) Federal and other taxes. It is the Fund’s policy to comply with the federal income and excise tax requirements of the Internal Revenue Code of 1986 (the “Code”), as amended, applicable to regulated investment companies. Accordingly, the Fund intends to distribute its taxable income and net realized gains, if any, to shareholders in accordance with timing requirements imposed by the Code. Therefore, no federal or state income tax provision is required in the Fund’s financial statements.
Management has analyzed the Fund’s tax positions taken on income tax returns for all open tax years and has concluded that as of October 31, 2019, no provision for income tax is required in the Fund’s financial statements. The Fund’s federal and state income and federal excise tax returns for tax years for which the applicable statutes of limitations have not expired are subject to examination by the Internal Revenue Service and state departments of revenue.
(h) Reclassification. GAAP requires that certain components of net assets be reclassified to reflect permanent differences between financial and tax reporting. These reclassifications have no effect on net assets or net asset value per share. During the current year ended, the following reclassifications have been made:
| | | | | | | | |
| | | Total Distributable
Earnings (Loss) | | | Paid-in
Capital | |
| (a) | | $ | (21,187,074) | | | $ | 21,187,074 | |
| (a) | Reclassifications are due to book/tax differences in the treatment of anin-kind distribution of securities. |
2. Investment management agreement and other transactions with affiliates
Legg Mason Partners Fund Advisor, LLC (“LMPFA”) is the Fund’s investment manager and QS Investors, LLC (“QS Investors”) is the Fund’s subadviser. Western Asset Management Company, LLC (“Western Asset”) manages the portion of the Fund’s cash and short-term instruments allocated to it. LMPFA, QS Investors and Western Asset are wholly-owned subsidiaries of Legg Mason, Inc. (“Legg Mason”).
LMPFA provides administrative and certain oversight services to the Fund. LMPFA delegates to the subadviser theday-to-day portfolio management of the Fund. The Fund is responsible for paying interest expenses, taxes, brokerage expenses, future12b-1 fees (if any), acquired fund fees and expenses, extraordinary expenses and the management fee payable to LMPFA under the investment management agreement.
Under the investment management agreement and subject to the general supervision of the Fund’s Board of Trustees, LMPFA provides or causes to be furnished all investment management, supervisory, administrative and other services reasonably necessary for the operation of the Fund, including certain distribution services (provided pursuant to a separate distribution agreement) and investment advisory services (provided pursuant to separate subadvisory agreements) under a unitary fee structure. The Fund pays an investment management
| | |
| Legg Mason Low Volatility High Dividend ETF 2019 Annual Report | | 23 |
Notes to financial statements (cont’d)
fee, calculated daily and paid monthly, at an annual rate of 0.27% of the Fund’s average daily net assets.
As compensation for its subadvisory services, LMPFA pays QS Investors monthly 90% of the management fee paid by the Fund to LMPFA, net of (i) all fees and expenses incurred by LMPFA under the investment management agreement (including without limitation any subadvisory fee paid to another subadviser to the Fund) and (ii) expense waivers, if any, and reimbursements. LMPFA pays Western Asset monthly a fee of 0.02% of the portion of the Fund’s average daily net assets allocated to Western Asset for the management of cash and other short-term instruments, net of expense waivers, if any, and reimbursements.
Legg Mason Investor Services, LLC, a wholly-owned broker-dealer subsidiary of Legg Mason, serves as the distributor of Creation Units for the Fund on an agency basis.
The Fund’s Board of Trustees has adopted a Rule12b-1 shareholder services and distribution plan and under that plan, the Fund is authorized to pay service and/or distribution fees calculated at an annual rate of up to 0.25% of its average daily net assets. No service and/or distribution fees are currently paid by the Fund, and there are no current plans to impose these fees.
All officers and one Trustee of the Trust are employees of Legg Mason or its affiliates and do not receive compensation from the Trust.
3. Investments
During the year ended October 31, 2019, the aggregate cost of purchases and proceeds from sales of investments (excludingin-kind transactions and short-term investments) were as follows:
| | | | |
| Purchases | | | $194,253,413 | |
| Sales | | | 193,239,927 | |
During the year ended October 31, 2019,in-kind transactions (Note 5) were as follows:
| | | | |
| Contributions | | | $327,296,042 | |
| Redemptions | | | 155,648,606 | |
| Realized gain (loss)* | | | 22,093,740 | |
| * | Net realized gains on redemptionsin-kind are not taxable to the remaining shareholders of the Fund. |
Thein-kind contributions andin-kind redemptions shown in this table may not agree with the Fund Share Transactions on the Statement of Changes in Net Assets. This table represents the accumulation of the Fund’s daily net shareholder transactions while the Statement of Changes in Net Assets reflects gross shareholder transactions including any cash component of the transactions.
| | |
24 | | Legg Mason Low Volatility High Dividend ETF 2019 Annual Report |
At October 31, 2019, the aggregate cost of investments and the aggregate gross unrealized appreciation and depreciation of investments for federal income tax purposes were as follows:
| | | | | | | | | | | | | | | | |
| | | Cost | | | Gross
Unrealized
Appreciation | | | Gross
Unrealized
Depreciation | | | Net
Unrealized
Appreciation | |
| Securities | | $ | 761,668,855 | | | $ | 84,215,710 | | | $ | (23,321,850) | | | $ | 60,893,860 | |
| Futures contracts | | | — | | | | 50,446 | | | | — | | | | 50,446 | |
4. Derivative instruments and hedging activities
Below is a table, grouped by derivative type, that provides information about the fair value and the location of derivatives within the Statement of Assets and Liabilities at October 31, 2019.
| | | | |
| ASSET DERIVATIVES1 | |
| | | Equity
Risk | |
| Futures contracts2 | | $ | 50,446 | |
| 1 | Generally, the balance sheet location for asset derivatives is receivables/net unrealized appreciation (depreciation) and for liability derivatives is payables/net unrealized appreciation (depreciation). |
| 2 | Includes cumulative appreciation (depreciation) of futures contracts as reported in the Schedule of Investments. Only variation margin is reported within the receivables and/or payables on the Statement of Assets and Liabilities. |
The following tables provide information about the effect of derivatives and hedging activities on the Fund’s Statement of Operations for the year ended October 31, 2019. The first table provides additional detail about the amounts and sources of gains (losses) realized on derivatives during the period. The second table provides additional information about the change in unrealized appreciation (depreciation) resulting from the Fund’s derivatives and hedging activities during the period.
| | | | |
| AMOUNT OF REALIZED GAIN (LOSS) ON DERIVATIVES RECOGNIZED | |
| | | Equity
Risk | |
| Futures contracts | | $ | (298,607) | |
| | | | |
| CHANGE IN UNREALIZED APPRECIATION (DEPRECIATION) ON DERIVATIVES RECOGNIZED | |
| | | Equity
Risk | |
| Futures contracts | | $ | 154,523 | |
During the year ended October 31, 2019, the volume of derivative activity for the Fund was as follows:
| | | | |
| | | Average Market
Value | |
| Futures contracts (to buy) | | $ | 2,495,965 | |
| | |
| Legg Mason Low Volatility High Dividend ETF 2019 Annual Report | | 25 |
Notes to financial statements (cont’d)
5. Fund share transactions
At October 31, 2019, the Trust had an unlimited number of shares of beneficial interest authorized with a par value of $0.00001 per share. Fund shares are issued and redeemed by the Fund only in Creation Units or Creation Unit aggregations, where 50,000 shares of the Fund constitute a Creation Unit. Such transactions are generally on anin-kind basis, with a separate cash payment, which is a balancing cash component to equate the transaction to the net asset value per share of the Fund on the transaction date. Transactions in capital shares of the Fund are disclosed in detail in the Statement of Changes in Net Assets. Authorized Participants are subject to standard creation and redemption transaction fees to offset transfer and other transaction costs associated with the issuance and redemption of Creation Units. Creations and redemptions for cash (when cash creations and redemptions are available or specified) may be subject to an additional variable fee.
6. Income tax information and distributions to shareholders
The tax character of distributions paid during the fiscal years ended October 31, was as follows:
| | | | | | | | |
| | | 2019 | | | 2018 | |
| Distributions paid from: | | | | | | | | |
| Ordinary income | | $ | 17,910,014 | | | | $20,202,397 | |
As of October 31, 2019, the components of accumulated earnings (losses) on a tax basis were as follows:
| | | | |
| Undistributed ordinary income — net | | | $ 5,850,996 | |
| Deferred capital losses* | | | (30,117,509) | |
| Other book/tax temporary differences(a) | | | (50,446) | |
| Unrealized appreciation (depreciation)(b) | | | 60,944,306 | |
| Total accumulated earnings (losses) — net | | | $36,627,347 | |
| * | These capital losses have been deferred in the current year as either short-term or long-term losses. The losses will be deemed to occur on the first day of the next taxable year in the same character as they were originally deferred and will be available to offset future taxable capital gains. |
| (a) | Other book/tax temporary differences are attributable to the realization for tax purposes of unrealized gains (losses) on certain futures contracts. |
| (b) | The difference between book-basis andtax-basis unrealized appreciation (depreciation) is attributable to the tax deferral of losses on wash sales and the realization for tax purposes of unrealized gains on investments in foreign passive investment companies. |
7. Recent accounting pronouncements
The Fund has adopted the disclosure provisions of the Financial Accounting Standards Board Accounting Standards UpdateNo. 2018-13,Fair Value Measurement (Topic 820)— Disclosure Framework—Changes to the Disclosure Requirements for Fair Value Measurement(“ASU2018-13”) which introduces new fair value disclosure requirements as well as eliminates and modifies certain existing fair value disclosure requirements. ASU2018-13 would be effective for fiscal years beginning after December 15, 2019, and interim periods
| | |
26 | | Legg Mason Low Volatility High Dividend ETF 2019 Annual Report |
within those fiscal years; however, management has elected to early adopt ASU2018-13. The impact of the Fund’s adoption was limited to changes in the Fund’s financial statement disclosures regarding fair value, primarily those disclosures related to transfers between levels of the fair value hierarchy.
In August 2018, the Securities and Exchange Commission released its Final Rule on Disclosure Update and Simplification (the “Final Rule”) which is intended to simplify an issuer’s disclosure compliance efforts by removing redundant or outdated disclosure requirements without significantly altering the mix of information provided to investors. Effective with the current reporting period, the Fund adopted the Final Rule with the most notable impacts being that the Fund is no longer required to present the components of distributable earnings on the Statement of Assets and Liabilities or the sources of distributions to shareholders and the amount of undistributed net investment income on the Statements of Changes in Net Assets. The tax components of distributable earnings and distributions to shareholders continue to be disclosed within the Notes to Financial Statements.
| | |
| Legg Mason Low Volatility High Dividend ETF 2019 Annual Report | | 27 |
Report of independent registered public accounting firm
To the Board of Trustees of Legg Mason ETF Investment Trust and Shareholders of Legg Mason Low Volatility High Dividend ETF
Opinion on the Financial Statements
We have audited the accompanying statement of assets and liabilities, including the schedule of investments, of Legg Mason Low Volatility High Dividend ETF (one of the funds constituting Legg Mason ETF Investment Trust, referred to hereafter as the “Fund”) as of October 31, 2019, the related statement of operations for the year ended October 31, 2019, the statement of changes in net assets for each of the two years in the period ended October 31, 2019, including the related notes, and the financial highlights for each of the three years in the period ended October 31, 2019 (collectively referred to as the “financial statements”). In our opinion, the financial statements present fairly, in all material respects, the financial position of the Fund as of October 31, 2019, the results of its operations for the year then ended, the changes in its net assets for each of the two years in the period ended October 31, 2019 and the financial highlights for each of the three years in the period ended October 31, 2019 in conformity with accounting principles generally accepted in the United States of America.
The financial statements and financial highlights of the Fund as of October 31, 2016 and for the period December 28, 2015 (inception date) through October 31, 2016 (not presented herein, other than the financial highlights) were audited by other auditors whose report dated December 21, 2016 expressed an unqualified opinion on those financial statements and financial highlights.
Basis for Opinion
These financial statements are the responsibility of the Fund’s management. Our responsibility is to express an opinion on the Fund’s financial statements based on our audits. We are a public accounting firm registered with the Public Company Accounting Oversight Board (United States) (PCAOB) and are required to be independent with respect to the Fund in accordance with the U.S. federal securities laws and the applicable rules and regulations of the Securities and Exchange Commission and the PCAOB.
We conducted our audits of these financial statements in accordance with the standards of the PCAOB. Those standards require that we plan and perform the audit to obtain reasonable assurance about whether the financial statements are free of material misstatement, whether due to error or fraud.
Our audits included performing procedures to assess the risks of material misstatement of the financial statements, whether due to error or fraud, and performing procedures that respond to those risks. Such procedures included examining, on a test basis, evidence regarding the amounts and disclosures in the financial statements. Our audits also included evaluating the accounting principles used and significant estimates made by management, as well as evaluating the overall presentation of the financial statements. Our procedures included confirmation of securities owned as of October 31, 2019 by correspondence with the custodian and broker. We believe that our audits provide a reasonable basis for our opinion.
/s/PricewaterhouseCoopers LLP
Baltimore, Maryland
December 18, 2019
We have served as the auditor of one or more investment companies in Legg Mason investment company group since at least 1973. We have not been able to determine the specific year we began serving as auditor.
| | |
28 | | Legg Mason Low Volatility High Dividend ETF 2019 Annual Report |
Additional information(unaudited)
Information about Trustees and Officers
The business and affairs of Legg Mason Low Volatility High Dividend ETF (the “Fund”) are conducted by management under the supervision and subject to the direction of its Board of Trustees. The business address of each Trustee is c/o Jane Trust, Legg Mason, 100 International Drive, 11th Floor, Baltimore, Maryland 21202. Information pertaining to the Trustees and officers of the Fund is set forth below.
The Statement of Additional Information includes additional information about Trustees and is available, without charge, upon request by calling the Fund at1-877-721-1926.
| | |
| Independent Trustees† |
|
| Paul R. Ades |
| |
| Year of birth | | 1940 |
| Position(s) with Trust | | Trustee |
| Term of office1and length of time served2 | | Since 1983 |
| Principal occupation(s) during the past five years | | Paul R. Ades, PLLC (law firm) (since 2000) |
| Number of funds in fund complex overseen by Trustee | | 44 |
| Other board memberships held by Trustee during the past five years | | None |
|
| Andrew L. Breech |
| Year of birth | | 1952 |
| Position(s) with Trust | | Trustee |
| Term of office1and length of time served2 | | Since 1991 |
| Principal occupation(s) during the past five years | | President, Dealer Operating Control Service, Inc. (automotive retail management) (since 1985) |
| Number of funds in fund complex overseen by Trustee | | 44 |
| Other board memberships held by Trustee during the past five years | | None |
|
| Dwight B. Crane |
| Year of birth | | 1937 |
| Position(s) with Trust | | Trustee |
| Term of office1and length of time served2 | | Since 1981 |
| Principal occupation(s) during the past five years | | Professor Emeritus, Harvard Business School (since 2007); formerly, Professor, Harvard Business School (1969 to 2007); Independent Consultant (since 1969) |
| Number of funds in fund complex overseen by Trustee | | 44 |
| Other board memberships held by Trustee during the past five years | | None |
| | |
| Legg Mason Low Volatility High Dividend ETF | | 29 |
Additional information(unaudited) (cont’d)
Information about Trustees and Officers
| | |
| Independent Trustees† (cont’d) |
|
| Althea L. Duersten |
| Year of birth | | 1951 |
| Position(s) with Trust | | Trustee |
| Term of office1and length of time served2 | | Since 2014 |
| Principal occupation(s) during the past five years | | Retired (since 2011); formerly, Chief Investment Officer, North America, JPMorgan Chase (investment bank) and member of JPMorgan Executive Committee (2007 to 2011) |
| Number of funds in fund complex overseen by Trustee | | 44 |
| Other board memberships held by Trustee during the past five years | | Non-Executive Director, Rokos Capital Management LLP (since 2019) |
|
| Stephen R. Gross* |
| Year of birth | | 1947 |
| Position(s) with Trust | | Trustee |
| Term of office1and length of time served2 | | Since 1986 |
| Principal occupation(s) during the past five years | | Chairman Emeritus (since 2011) and formerly, Chairman, HLB Gross Collins, P.C. (accounting and consulting firm) (1979 to 2011); Executive Director of Business Builders Team, LLC (since 2005); Principal, Gross Consulting Group, LLC (since 2011); CEO, Gross Capital Partners, LLC (since 2014); CEO, Trusted CFO Solutions, LLC (since 2011) |
| Number of funds in fund complex overseen by Trustee | | 90 |
| Other board memberships held by Trustee during the past five years | | None |
|
| Susan M. Heilbron* |
| Year of birth | | 1945 |
| Position(s) with Trust | | Trustee |
| Term of office1and length of time served2 | | Since 1994 |
| Principal occupation(s) during the past five years | | Retired; formerly, President, Lacey & Heilbron (communications consulting) (1990 to 2002); General Counsel and Executive Vice President, The Trump Organization (1986 to 1990); Senior Vice President, New York State Urban Development Corporation (1984 to 1986); Associate, Cravath, Swaine & Moore LLP (1980 to 1984) and (1977 to 1979) |
| Number of funds in fund complex overseen by Trustee | | 90 |
| Other board memberships held by Trustee during the past five years | | Formerly, Director, Lincoln Savings Bank, FSB (1991 to 1994); Director, Trump Shuttle, Inc. (air transportation) (1989 to 1990); Director, Alexander’s Inc. (department store) (1987 to 1990) |
| | |
30 | | Legg Mason Low Volatility High Dividend ETF |
| | |
| Independent Trustees† (cont’d) |
|
| Frank G. Hubbard |
| Year of birth | | 1937 |
| Position(s) with Trust | | Trustee |
| Term of office1and length of time served2 | | Since 1993 |
| Principal occupation(s) during the past five years | | President, Fealds, Inc. (business development) (since 2016); formerly, President, Avatar International Inc. (business development) (1998 to 2015) |
| Number of funds in fund complex overseen by Trustee | | 44 |
| Other board memberships held by Trustee during the past five years | | None |
|
| Howard J. Johnson |
| Year of birth | | 1938 |
| Position(s) with Trust | | Trustee and Chairman |
| Term of office1and length of time served2 | | From 1981 to 1998 and since 2000 (Chairman since 2013) |
| Principal occupation(s) during the past five years | | Retired; formerly, Chief Executive Officer, Genesis Imaging LLC (technology company) (2003 to 2012) |
| Number of funds in fund complex overseen by Trustee | | 44 |
| Other board memberships held by Trustee during the past five years | | None |
|
| Jerome H. Miller |
| Year of birth | | 1938 |
| Position(s) with Trust | | Trustee |
| Term of office1and length of time served2 | | Since 1995 |
| Principal occupation(s) during the past five years | | Retired; formerly, Vice Chairman, Shearson Lehman Hutton Inc. (1989 to 1992) and Senior Executive Vice President, E.F. Hutton Group Inc. (1986 to 1989) |
| Number of funds in fund complex overseen by Trustee | | 44 |
| Other board memberships held by Trustee during the past five years | | None |
|
| Ken Miller |
| Year of birth | | 1942 |
| Position(s) with Trust | | Trustee |
| Term of office1and length of time served2 | | Since 1983 |
| Principal occupation(s) during the past five years | | Retired; formerly, President, Young Stuff Apparel Group, Inc. (apparel manufacturer), division of Li & Fung (1963 to 2012) |
| Number of funds in fund complex overseen by Trustee | | 44 |
| Other board memberships held by Trustee during the past five years | | None |
| | |
| Legg Mason Low Volatility High Dividend ETF | | 31 |
Additional information(unaudited) (cont’d)
Information about Trustees and Officers
| | |
| Independent Trustees† (cont’d) |
|
| Thomas F. Schlafly |
| Year of birth | | 1948 |
| Position(s) with Trust | | Trustee |
| Term of office1and length of time served2 | | Since 1983 |
| Principal occupation(s) during the past five years | | Chairman, The Saint Louis Brewery, LLC (brewery) (since 2012); formerly, President, The Saint Louis Brewery, Inc. (1989 to 2012); Senior Counsel (since 2017) and formerly, Partner (2009 to 2016), Thompson Coburn LLP (law firm) |
| Number of funds in fund complex overseen by Trustee | | 44 |
| Other board memberships held by Trustee during the past five years | | Director, Citizens National Bank of Greater St. Louis (since 2006) |
| | |
| Interested Trustee and Officer |
|
| Jane Trust, CFA3 |
| Year of birth | | 1962 |
| Position(s) with Trust | | Trustee, President and Chief Executive Officer |
| Term of office1and length of time served2 | | Since 2015 |
| Principal occupation(s) during the past five years | | Senior Managing Director of Legg Mason & Co., LLC (“Legg Mason & Co.”) (since 2018); Managing Director of Legg Mason & Co. (2016 to 2018); Officer and/or Trustee/Director of 145 funds associated with Legg Mason Partners Fund Advisor, LLC (“LMPFA”) or its affiliates (since 2015); President and Chief Executive Officer of LMPFA (since 2015); formerly, Senior Vice President of LMPFA (2015); Director of ClearBridge, LLC (formerly, Legg Mason Capital Management, LLC) (2007 to 2014); Managing Director of Legg Mason Investment Counsel & Trust Co. (2000 to 2007) |
| Number of funds in fund complex overseen by Trustee | | 136 |
| Other board memberships held by Trustee during the past five years | | None |
| | |
| Additional Officers |
|
Ted P. Becker
Legg Mason 620 Eighth Avenue, 49th Floor, New York, NY 10018 |
| Year of birth | | 1951 |
| Position(s) with Trust | | Chief Compliance Officer |
| Term of office1and length of time served2 | | Since 2007 |
| Principal occupation(s) during the past five years | | Director of Global Compliance at Legg Mason (since 2006); Chief Compliance Officer of LMPFA (since 2006); Managing Director of Compliance of Legg Mason & Co. (since 2005); Chief Compliance Officer of certain mutual funds associated with Legg Mason & Co. or its affiliates (since 2006) |
| | |
32 | | Legg Mason Low Volatility High Dividend ETF |
| | |
| Additional Officers (cont’d) |
|
Susan Kerr
Legg Mason 620 Eighth Avenue, 49th Floor, New York, NY 10018 |
| Year of birth | | 1949 |
| Position(s) with Trust | | Chief Anti-Money Laundering Compliance Officer |
| Term of office1and length of time served2 | | Since 2013 |
| Principal occupation(s) during the past five years | | Assistant Vice President of Legg Mason & Co. and Legg Mason Investor Services, LLC (“LMIS”) (since 2010); Chief Anti-Money Laundering Compliance Officer of certain mutual funds associated with Legg Mason & Co. or its affiliates (since 2013) and Anti-Money Laundering Compliance Officer of LMIS (since 2012); Senior Compliance Officer of LMIS (since 2011); formerly, AML Consultant, DTCC (2010); AML Consultant, Rabobank Netherlands, (2009); First Vice President, Director of Marketing & Advertising Compliance and Manager of Communications Review Group at Citigroup Inc. (1996 to 2008) |
|
Jenna Bailey Legg Mason 100 First Stamford Place, 5th Floor, Stamford, CT 06902 |
| Year of birth | | 1978 |
| Position(s) with Trust | | Identity Theft Prevention Officer |
| Term of office1and length of time served2 | | Since 2015 |
| Principal occupation(s) during the past five years | | Identity Theft Prevention Officer of certain mutual funds associated with Legg Mason & Co. or its affiliates (since 2015); Compliance Officer of Legg Mason & Co. (since 2013); Assistant Vice President of Legg Mason & Co. (since 2011); formerly, Associate Compliance Officer of Legg Mason & Co. (2011 to 2013) |
|
Robert I. Frenkel
Legg Mason 100 First Stamford Place, 6th Floor, Stamford, CT 06902 |
| Year of birth | | 1954 |
| Position(s) with Trust | | Secretary and Chief Legal Officer |
| Term of office1and length of time served2 | | Since 2007 |
| Principal occupation(s) during the past five years | | Vice President and Deputy General Counsel of Legg Mason, Inc. (since 2006); Managing Director and General Counsel — U.S. Mutual Funds for Legg Mason & Co. (since 2006) and Legg Mason & Co. predecessors (since 1994); Secretary and Chief Legal Officer of certain mutual funds associated with Legg Mason & Co. or its affiliates (since 2006) and Legg Mason & Co. predecessors (prior to 2006) |
| | |
| Legg Mason Low Volatility High Dividend ETF | | 33 |
Additional information(unaudited) (cont’d)
Information about Trustees and Officers
| | |
| Additional Officers (cont’d) |
|
Thomas C. Mandia
Legg Mason 100 First Stamford Place, 6th Floor, Stamford, CT 06902 |
| Year of birth | | 1962 |
| Position(s) with Trust | | Assistant Secretary |
| Term of office1and length of time served2 | | Since 2007 |
| Principal occupation(s) during the past five years | | Managing Director and Deputy General Counsel of Legg Mason & Co. (since 2005) and Legg Mason & Co. predecessors (prior to 2005); Secretary of LMPFA (since 2006); Assistant Secretary of certain mutual funds associated with Legg Mason & Co. or its affiliates (since 2006) and Legg Mason & Co. predecessors (prior to 2006); Secretary of LM Asset Services, LLC (“LMAS”) (since 2002) and Legg Mason Fund Asset Management, Inc. (“LMFAM”) (since 2013) (formerly registered investment advisers) |
|
Christopher Berarducci**
Legg Mason 620 Eighth Avenue, 49th Floor, New York, NY 10018 |
| Year of birth | | 1974 |
| Position(s) with Trust | | Treasurer and Principal Financial Officer |
| Term of office1and length of time served2 | | Since 2014 and 2019 |
| Principal occupation(s) during the past five years | | Treasurer (since 2010) and Principal Financial Officer (since 2019) of certain mutual funds associated with Legg Mason & Co. or its affiliates; Director of Legg Mason & Co. (since 2015); formerly, Vice President of Legg Mason & Co. (2011 to 2015); Assistant Controller of certain mutual funds associated with Legg Mason & Co. or its affiliates (prior to 2010) |
|
Jeanne M. Kelly
Legg Mason 620 Eighth Avenue, 49th Floor, New York, NY 10018 |
| Year of birth | | 1951 |
| Position(s) with Trust | | Senior Vice President |
| Term of office1and length of time served2 | | Since 2007 |
| Principal occupation(s) during the past five years | | Senior Vice President of certain mutual funds associated with Legg Mason & Co. or its affiliates (since 2007); Senior Vice President of LMPFA (since 2006); President and Chief Executive Officer of LMAS and LMFAM (since 2015); Managing Director of Legg Mason & Co. (since 2005) and Legg Mason & Co. predecessors (prior to 2005); formerly, Senior Vice President of LMFAM (2013 to 2015) |
| † | Trustees who are not “interested persons” of the Fund within the meaning of Section 2(a)(19) of the Investment Company Act of 1940, as amended (the “1940 Act”). |
| * | Effective February 6, 2019, Mr. Gross and Ms. Heilbron became Trustees on this Board and an additional Board within the Legg Mason fund complex, which is reflected in the “Number of funds in fund complex overseen by Trustee”. |
| | |
34 | | Legg Mason Low Volatility High Dividend ETF |
| ** | Effective September 27, 2019, Mr. Berarducci became Treasurer and Principal Financial Officer. |
| 1 | Each Trustee and officer serves until his or her respective successor has been duly elected and qualified or until his or her earlier death, resignation, retirement or removal. |
| 2 | Indicates the earliest year in which the Trustee became a board member for a fund in the Legg Mason fund complex or the officer took such office. |
| 3 | Ms. Trust is an “interested person” of the Fund, as defined in the 1940 Act, because of her position with LMPFA and/or certain of its affiliates. |
| | |
| Legg Mason Low Volatility High Dividend ETF | | 35 |
Important tax information(unaudited)
The following information is provided with respect to distributions paid during the taxable year ended October 31, 2019:
| | | | | | | | | | | | | | | | |
| Record date: | | | 12/27/2018 | | | | 3/27/2019 | | | | 5/3/2019 | | | | 8/9/2019 | |
| Payable date: | | | 12/31/2018 | | | | 3/29/2019 | | | | 5/7/2019 | | | | 8/13/2019 | |
| Ordinary Income: | | | | | | | | | | | | | | | | |
Qualified Dividend Income for Individuals | | | 83.75 | % | | | 88.94 | % | | | 88.94 | % | | | 88.94 | % |
Dividends Qualifying for the Dividends | | | | | | | | | | | | | | | | |
Received Deduction for Corporations | | | 84.06 | % | | | 89.54 | % | | | 89.54 | % | | | 89.54 | % |
Please retain this information for your records.
| | |
36 | | Legg Mason Low Volatility High Dividend ETF |
Legg Mason
Low Volatility High Dividend ETF
Trustees
Paul R. Ades
Andrew L. Breech
Dwight B. Crane
Althea L. Duersten
Stephen R. Gross*
Susan M. Heilbron*
Frank G. Hubbard
Howard J. Johnson
Chairman
Jerome H. Miller
Ken Miller
Thomas F. Schlafly
Jane Trust
| * | Effective February 6, 2019, Mr. Gross and Ms. Heilbron became Trustees. |
Investment manager
Legg Mason Partners Fund Advisor, LLC
Subadvisers
QS Investors, LLC
Custodian
The Bank of New York Mellon
Transfer agent
The Bank of New York Mellon
240 Greenwich Street
New York, NY 10286
Independent registered public accounting firm
PricewaterhouseCoopers LLP
Baltimore, MD
Legg Mason Low Volatility High Dividend ETF
The Fund is a separate investment series of Legg Mason ETF Investment Trust, a Maryland statutory trust.
Legg Mason Low Volatility High Dividend ETF
Legg Mason Funds
620 Eighth Avenue, 49th Floor
New York, NY 10018
The Fund files its complete schedule of portfolio holdings with the Securities and Exchange Commission (“SEC”) for the first and third quarters of each fiscal year as an exhibit to its reports on FormN-PORT. Previously, the Fund filed a complete schedule of portfolio holdings with the SEC for the first and third quarters of each fiscal year on FormN-Q. The Fund’s FormsN-PORT andN-Q are available on the SEC’s website at www.sec.gov. To obtain information on FormsN-PORT andN-Q, shareholders can call the Fund at1-877-721-1926.
Information on how the Fund voted proxies relating to portfolio securities during the prior12-month period ended June 30th of each year and a description of the policies and procedures that the Fund uses to determine how to vote proxies related to portfolio transactions are available (1) without charge, upon request, by calling the Fund at1-877-721-1926, (2) at www.leggmason.com/etf and (3) on the SEC’s website at www.sec.gov.
This report is submitted for the general information of the shareholders of Legg Mason Low Volatility High Dividend ETF. This report is not authorized for distribution to prospective investors in the Fund unless preceded or accompanied by a current prospectus.
Investors should consider the Fund’s investment objectives, risks, charges and expenses carefully before investing. The prospectus contains this and other important information about the Fund. Please read the prospectus carefully before investing.
www.leggmason.com
© 2019 Legg Mason Investor Services, LLC
Member FINRA, SIPC
ETF Index Disclaimers
Solactive AG does not sponsor, promote, sell or support in any manner the Legg Mason Low Volatility High Dividend ETF (the “Fund”). Solactive AG does not offer any express or implicit guarantee or assurance either with regard to the results of using the Solactive US Broad Market Index (the “Solactive Index” or the “Underlying Index”) and/or Solactive Index trade mark or the Solactive Index Price at any time or in any other respect. The Solactive Index is calculated and published by Solactive AG. Solactive AG uses its best efforts to ensure that the Solactive Index is calculated correctly. Irrespective of its obligations towards the Fund, Solactive AG has no obligation to point out errors in the Solactive Index to third parties including but not limited to investors and/or financial intermediaries of the Fund. Neither publication of the Solactive Index by Solactive AG nor the licensing of the Solactive Index or Solactive Index trade mark for the purpose of use in connection with the Fund constitutes a recommendation by Solactive AG to invest capital in the Fund nor does it in any way represent an assurance or opinion of Solactive AG with regard to any investment in the Fund.
Solactive AG does not offer any express or implicit guarantee or assurance either with regard to the results of using the Fund’s Underlying Index and/or Underlying Index trade mark or the Underlying Index Price at any time or in any other respect. The Fund’s Underlying Index is calculated and published by Solactive AG. Solactive AG uses its best efforts to ensure that the Underlying Index is calculated correctly. Irrespective of its obligations towards the Fund, Solactive AG has no obligation to point out errors in the Underlying Index to third parties including but not limited to investors and/or financial intermediaries of the Fund. Neither publication of the Underlying Index by Solactive AG nor the licensing of the Underlying Index or Underlying Index trade mark for the purpose of use in connection with the Fund constitutes a recommendation by Solactive AG to invest capital in the Fund nor does it in any way represent an assurance or opinion of Solactive AG with regard to any investment in the Fund.
QS Investors, LLC (“QS Investors”) does not guarantee the accuracy and/or the completeness of the Underlying Index or any data included therein, and QS Investors shall not have any liability for any errors, omissions or interruptions therein. QS Investors makes no warranty, express or implied, as to results to be obtained by the Fund, owners of the shares of the Fund or any other person or entity from the use of the Underlying Index, or any data included therein, either in connection with the Fund or for any other use. QS Investors makes no express or implied warranties, and expressly disclaims all warranties of merchantability or fitness for a particular purpose or use with respect to the Underlying Index or any data included therein. Without limiting any of the foregoing, in no event shall QS Investors have any liability for any special, punitive, direct, indirect or consequential damages (including lost profits) arising out of matters relating to the use of the Underlying Index, even if notified of the possibility of such damages.
www.leggmason.com
© 2019 Legg Mason Investor Services, LLC Member FINRA, SIPC
ETFF323381 12/19SR19-3767
The registrant has adopted a code of ethics that applies to the registrant’s principal executive officer, principal financial officer, principal accounting officer or controller.
| ITEM 3. | AUDIT COMMITTEE FINANCIAL EXPERT. |
The Board of Trustees of the registrant has determined that Dwight B. Crane possesses the technical attributes identified in Instruction 2(b) of Item 3 to FormN-CSR to qualify as an “audit committee financial expert,” and has designated Dwight B. Crane as the Audit Committee’s financial expert Dwight B. Crane is an “independent” Trustees pursuant to paragraph (a)(2) of Item 3 to FormN-CSR.
| ITEM 4. | PRINCIPAL ACCOUNTANT FEES AND SERVICES. |
a)Audit Fees. The aggregate fees billed in the last two fiscal years ending October 31, 2018 and October 31, 2019 (the “Reporting Periods”) for professional services rendered by the Registrant’s principal accountant (the “Auditor”) for the audit of the Registrant’s annual financial statements, or services that are normally provided by the Auditor in connection with the statutory and regulatory filings or engagements for the Reporting Periods, were $140,000 in October 31, 2018 and $90,000 in October 31, 2019.
b)Audit-Related Fees. The aggregate fees billed in the Reporting Period for assurance and related services by the Auditor that are reasonably related to the performance of the Registrant’s financial statements were $52,489 in October 31, 2018 and $0 in October 31, 2019.
In addition, there were no Audit-Related Fees billed in the Reporting Period for assurance and related services by the Auditor to the Registrant’s investment adviser (not including anysub-adviser whose role is primarily portfolio management and is subcontracted with or overseen by another investment adviser), and any entity controlling, controlled by or under common control with the investment adviser that provides ongoing services to the Legg Mason ETF Investment Trust (“service affiliates”), that were reasonably related to the performance of the annual audit of the service affiliates. Accordingly, there were no such fees that requiredpre-approval by the Audit Committee for the Reporting Period.
(c)Tax Fees. The aggregate fees billed in the Reporting Periods for professional services rendered by the Auditor for tax compliance, tax advice and tax planning (“Tax Services”) were $0 in October 31, 2018 and $0 in October 31, 2019. These services consisted of (i) review or preparation of U.S. federal, state, local and excise tax returns; (ii) U.S. federal, state and local tax planning, advice and assistance regarding statutory, regulatory or administrative developments, and (iii) tax advice regarding tax qualification matters and/or treatment of various financial instruments held or proposed to be acquired or held.
There were no fees billed for tax services by the Auditors to service affiliates during the Reporting Periods that requiredpre-approval by the Audit Committee.
d)All Other Fees.
The aggregate fees billed in the Reporting Periods for products and services provided by the Auditor, other than the services reported in paragraphs (a) through (c) for the Item 4 for the Legg Mason ETF Investment Trust, were $0 in October 31, 2018 and $0 in October 31, 2019.
All Other Fees. There were no othernon-audit services rendered by the Auditor to Legg Mason Partners Fund Advisors, LLC (“LMPFA”), and any entity controlling, controlled by or under common control with LMPFA that provided ongoing services to Legg Mason ETF Investment Trust requiringpre-approval by the Audit Committee in the Reporting Period.
(e) Audit Committee’s pre–approval policies and procedures described in paragraph (c) (7) of Rule2-01 of RegulationS-X.
(1) The Charter for the Audit Committee (the “Committee”) of the Board of each registered investment company (the “Fund”) advised by LMPFA or one of their affiliates (each, an “Adviser”) requires that the Committee shall approve (a) all audit and permissiblenon-audit services to be provided to the Fund and (b) all permissiblenon-audit services to be provided by the Fund’s independent auditors to the Adviser and any Covered Service Providers if the engagement relates directly to the operations and financial reporting of the Fund. The Committee may implement policies and procedures by which such services are approved other than by the full Committee.
The Committee shall not approvenon-audit services that the Committee believes may impair the independence of the auditors. As of the date of the approval of this Audit Committee Charter, permissiblenon-audit services include any professional services (including tax services), that are not prohibited services as described below, provided to the Fund by the independent auditors, other than those provided to the Fund in connection with an audit or a review of the financial statements of the Fund. Permissiblenon-audit services may not include: (i) bookkeeping or other services related to the accounting records or financial statements of the Fund; (ii) financial information systems design and implementation; (iii) appraisal or valuation services, fairness opinions orcontribution-in-kind reports; (iv) actuarial services; (v) internal audit outsourcing services; (vi) management functions or human resources; (vii) broker or dealer, investment adviser or investment banking services; (viii) legal services and expert services unrelated to the audit; and (ix) any other service the Public Company Accounting Oversight Board determines, by regulation, is impermissible.
Pre-approval by the Committee of any permissiblenon-audit services is not required so long as: (i) the aggregate amount of all such permissiblenon-audit services provided to the Fund, the Adviser and any service providers controlling, controlled by or under common control with the Adviser that provide ongoing services to the Fund (“Covered Service Providers”) constitutes not more than 5% of the total amount of revenues paid to the independent auditors during the fiscal year in which the permissiblenon-audit services are provided to (a) the Fund, (b) the Adviser and (c) any entity controlling, controlled by or under common control with the Adviser that provides ongoing services to the Fund during the fiscal year in which the services are provided that would have to be approved by the Committee; (ii) the permissiblenon-audit services were not recognized by the Fund at the time of the engagement to benon-audit services; and (iii) such services are promptly brought to the attention of the Committee and approved by the Committee (or its delegate(s)) prior to the completion of the audit.
(2) For the Legg Mason ETF Investment Trust, the percentage of fees that were approved by the audit committee, with respect to: Audit-Related Fees were 100% and 100% for October 31, 2018 and October 31, 2019; Tax Fees were 100% and 100% for October 31, 2018 and October 31, 2019; and Other Fees were 100% and 100% for October 31, 2018 and October 31, 2019.
(f) N/A
(g)Non-audit fees billed by the Auditor for services rendered to Legg Mason ETF Investment Trust, LMPFA and any entity controlling, controlled by, or under common control with LMPFA that provides ongoing services to Legg Mason ETF Investment Trust during the reporting period were $678,000 in October 31, 2018 and $472,562 in October 31, 2019.
(h) Yes. Legg Mason ETF Investment Trust’s Audit Committee has considered whether the provision ofnon-audit services that were rendered to Service Affiliates, which were notpre-approved (not requiringpre-approval), is compatible with maintaining the Accountant’s independence. All services provided by the Auditor to the Legg Mason ETF Investment Trust or to Service Affiliates, which were required to bepre-approved, werepre-approved as required.
| ITEM 5. | AUDIT COMMITTEE OF LISTED REGISTRANTS. |
| | a) | The independent board members are acting as the registrant’s audit committee as specified in Section 3(a)(58)(B) of the Exchange Act. The Audit Committee consists of the following Board members: |
Paul R. Ades
Andrew L. Breech
Dwight B. Crane
Althea L. Duersten
Stephen R. Gross*
Susan M. Heilbron*
Frank G. Hubbard
Howard J. Johnson
Jerome H. Miller
Ken Miller
Thomas F. Schlafly
| | * | Effective February 6, 2019, Mr. Gross and Ms. Heilbron became Trustees. |
| ITEM 6. | SCHEDULE OF INVESTMENTS. |
Included herein under Item 1.
| ITEM 7. | DISCLOSURE OF PROXY VOTING POLICIES AND PROCEDURES FORCLOSED-END MANAGEMENT INVESTMENT COMPANIES. |
Not applicable.
| ITEM 8. | PORTFOLIO MANAGERS OFCLOSED-END MANAGEMENT INVESTMENT COMPANIES. |
Not applicable.
| ITEM 9. | PURCHASES OF EQUITY SECURITIES BYCLOSED-END MANAGEMENT INVESTMENT COMPANY AND AFFILIATED PURCHASERS. |
Not applicable.
| ITEM 10. | SUBMISSION OF MATTERS TO A VOTE OF SECURITY HOLDERS. |
Not applicable.
| ITEM 11. | CONTROLS AND PROCEDURES. |
| | (a) | The registrant’s principal executive officer and principal financial officer have concluded that the registrant’s disclosure controls and procedures (as defined in Rule30a- 3(c) under the Investment Company Act of 1940, as amended (the “1940 Act”)) are effective as of a date within 90 days of the filing date of this report that includes the disclosure required by this paragraph, based on their evaluation of the disclosure controls and procedures required by Rule30a-3(b) under the 1940 Act and15d-15(b) under the Securities Exchange Act of 1934. |
| | (b) | There were no changes in the registrant’s internal control over financial reporting (as defined in Rule30a-3(d) under the 1940 Act) that occurred during the second fiscal quarter of the period covered by this report that have materially affected, or are likely to materially affect the registrant’s internal control over financial reporting. |
| ITEM 12. | DISCLOSURE OF SECURITIES LENDING ACTIVITIES FORCLOSED-END MANAGEMENT INVESTMENT COMPANIES. |
Not applicable.
(a) (1) Code of Ethics attached hereto.
Exhibit 99.CODE ETH
(a) (2) Certifications pursuant to section 302 of the Sarbanes-Oxley Act of 2002 attached hereto.
Exhibit 99.CERT
(b) Certifications pursuant to Section 906 of the Sarbanes-Oxley Act of 2002 attached hereto.
Exhibit 99.906CERT
SIGNATURES
Pursuant to the requirements of the Securities Exchange Act of 1934 and the Investment Company Act of 1940, the registrant has duly caused this Report to be signed on its behalf by the undersigned, there unto duly authorized.
Legg Mason ETF Investment Trust
| | |
| By: | | /s/ Jane Trust |
| | Jane Trust |
| | Chief Executive Officer |
Date: December 30, 2019
Pursuant to the requirements of the Securities Exchange Act of 1934 and the Investment Company Act of 1940, this report has been signed below by the following persons on behalf of the registrant and in the capacities and on the dates indicated.
| | |
| By: | | /s/ Jane Trust |
| | Jane Trust |
| | Chief Executive Officer |
Date: December 30, 2019
| | |
| By: | | /s/ Christopher Berarducci |
| | Christopher Berarducci |
| | Principal Financial Officer |
Date: December 30, 2019