UNITED STATES
SECURITIES AND EXCHANGE COMMISSION
Washington, D.C. 20549
FORM N-CSR
CERTIFIED SHAREHOLDER REPORT OF REGISTERED
MANAGEMENT INVESTMENT COMPANIES
Investment Company Act file number 811-23096
Legg Mason ETF Investment Trust
(Exact name of registrant as specified in charter)
620 Eighth Avenue, 47th Floor, New York, NY 10018
(Address of principal executive offices) (Zip code)
Marc A. De Oliveira
Franklin Templeton
100 First Stamford Place
Stamford, CT 06902
(Name and address of agent for service)
Registrant’s telephone number, including area code: 1-877-721-1926
Date of fiscal year end: October 31
Date of reporting period: October 31, 2021
| ITEM 1. | REPORT TO STOCKHOLDERS. |
The Annual Report to Stockholders is filed herewith.

| | |
| Annual Report | | October 31, 2021 |
LEGG MASON
GLOBAL INFRASTRUCTURE
ETF
INFR
The Fund intends to no longer mail paper copies of the Fund’s shareholder reports like this one, unless you specifically request paper copies of the reports from your financial intermediary (such as a broker-dealer or bank). Instead, the reports will be made available on a website, and you will be notified by mail each time a report is posted and provided with a website link to access the report.
If you already elected to receive shareholder reports electronically (“e-delivery”), you will not be affected by this change and you need not take any action. If you have not already elected e-delivery, you may elect to receive shareholder reports and other communications from the Fund electronically by contacting your financial intermediary.
You may elect to receive all future reports in paper free of charge by contacting your financial intermediary to request that you continue to receive paper copies of your shareholder reports. Your election to receive reports in paper will apply to all Legg Mason Funds held in your account with your financial intermediary.
|
| INVESTMENT PRODUCTS: NOT FDIC INSURED • NO BANK GUARANTEE • MAY LOSE VALUE |
Fund objective
The Fund seeks to track the investment results of an index composed of infrastructure-related equity securities from global markets constructed through the application of several fundamental factors.
Letter from the president

Dear Shareholder,
We are pleased to provide the annual report of Legg Mason Global Infrastructure ETF for the twelve-month reporting period ended October 31, 2021. Please read on for a detailed look at prevailing economic and market conditions during the Fund’s reporting period and to learn how those conditions have affected Fund performance.
Subsequent event notice
On November 19, 2021, the Board of Trustees of Legg Mason ETF Investment Trust, on behalf of the Fund, approved a proposal to liquidate and dissolve the Fund. The liquidation is anticipated to occur on or about February 3, 2022. Trading in the Fund on NASDAQ will be halted prior to market open on January 28, 2022. Proceeds of the liquidation are currently scheduled to be sent to shareholders on or about February 3, 2022. For additional information, please see the Fund’s prospectus supplement dated November 24, 2021.
As always, we remain committed to providing you with excellent service and a full spectrum of investment choices. We also remain committed to supplementing the support you receive from your financial advisor. One way we accomplish this is through our website, www.franklintempleton.com. Here you can gain immediate access to market and investment information, including:
| • | | Fund net asset value and market price, |
| • | | Market insights and commentaries from our portfolio managers, and |
| • | | A host of educational resources. |
| | |
II | | Legg Mason Global Infrastructure ETF |
We look forward to helping you meet your financial goals.
Sincerely,

Patrick O’Connor
President and Chief Executive Officer - Investment Management President
November 30, 2021
| | |
| Legg Mason Global Infrastructure ETF | | III |
Fund overview
Q. What is the Fund’s investment strategy?
A. The Legg Mason Global Infrastructure ETF (the “Fund”) seeks to track the investment results of the RARE Global Infrastructure Index (the “Underlying Index”). The Underlying Index is constructed from global infrastructure-related equity securities. The Underlying Index utilizes a proprietary methodology created and sponsored by ClearBridge RARE Infrastructure (North America) Pty Limited (“RARE”), the Fund’s subadviser. The Fund will invest at least 80% of its net assets, plus borrowings for investment purposes, if any, in securities that compose its Underlying Index. Securities that compose the Underlying Index include depositary receipts representing securities in the Underlying Index. The Underlying Index is composed of equity securities in developed and developing markets that are included in the MSCI ACWI All Cap Indexi.
The Underlying Index’s securities are reconstituted quarterly and rebalanced quarterly. The Underlying Index is reconstituted on different dates from the MSCI ACWI All Cap Index. The Fund’s securities portfolio is rebalanced when the Underlying Index is rebalanced or reconstituted. The composition of the Underlying Index and the Fund after reconstitution and rebalancing may fluctuate and exceed the Underlying Index limitations due to market movements and other factors. The components of the Underlying Index, and the degree to which these components represent certain sectors and industries, may change over time.
The Fund may invest up to 20% of its net assets in certain index futures, options, and options on index futures (“Financial Instruments”) related to its Underlying Index and its component securities; cash and cash equivalents; other investment companies, including exchange-traded funds; exchange-traded notes; and in securities and other instruments not included in its Underlying Index but which RARE believes will help the Fund track its Underlying Index, including structured instruments such as participation notes and low exercise price warrants or other similar instruments. The Fund may invest in Financial Instruments to gain exposure to local markets, as a substitute for buying or selling securities or for cash management purposes.
Q. What were the overall market conditions during the Fund’s reporting period?
A. The twelve-month reporting period ended October 31, 2021 was a volatile period for global equity markets dominated by geopolitical events.
The first quarter of 2021 saw our global listed infrastructure funds underperform the infrastructure indices, which marginally underperformed equities for the quarter, largely due to higher weights in rate-sensitive stocks among infrastructure sectors. The first quarter saw rapid increases in both bond rates and inflation expectations as the economic recovery continued, strongly aided by a quickening vaccine rollout and massive levels of government stimulus. Consensus growth expectations generally were revised higher during the quarter. Inflation was expected to increase before returning to a more normalized rate.
Vaccine rollouts continued to accelerate in many regions, which drove optimism about reductions in mobility restrictions, despite increasing COVID-19 cases in regions such as
| | | | | | |
| Legg Mason Global Infrastructure ETF 2021 Annual Report | | | | | 1 | |
Fund overview (cont’d)
Europe. Reductions in mobility restrictions were expected to impact the second half of 2021 and were required for the recovery of the services sector, which lagged the largely recovered goods sector. Stimulus remained plentiful, particularly in the U.S. with President Biden’s $1.9 trillion stimulus plan approved during the first quarter and closely followed by a proposal for an infrastructure bill.
Economic activity continued to rebound strongly in the second quarter of 2021, with upgrades to consensus earnings and economic growth forecasts. COVID-19 vaccine rollouts gained pace in many regions, although mobility restrictions remained significant as a result of the new Delta variant. Government policy remained supportive, with continued implementation of previously announced stimulus. Bond rates declined slightly in June, following the June FOMC meeting as the Federal Reserve Board (the “Fed”) continued with the view that the inflation spike was largely transitory, with upside risk able to be addressed through potential tapering discussions later in the year. Strong labor and wage data, combined with large increases in commodity prices, highlighted the risk of inflation to the upside. However, significant slack in the labor markets was expected to contain inflation risk. Markets performed solidly on the back of the strong economic data and confidence that the Fed would act accordingly to contain inflation.
Macroeconomic factors continued largely in the same vein as in previous months, with the markets focused on supply chain disruptions and the sustained high level of inflation, including high energy prices. Economic activity continued to rebound, albeit slightly below expectations, largely as a result of supply chain disruptions. Inflation remained high and, combined with high energy prices and strong wage and labor data, increased the markets’ expectation that interest rate increases would be brought forward. Mobility restrictions continued easing as COVID-19 vaccine rollouts carried on strongly in many regions and as some regions such as Asia Pacific moved away from a zero-COVID-19 strategy.
Q. How did we respond to these changing market conditions?
A. The Fund uses a passive investment approach to achieve its investment objective, and therefore made no change in investment approach in response to market conditions.
Performance review
For the twelve months ended October 31, 2021, Legg Mason Global Infrastructure ETF generated a 23.40% return on a net asset value (“NAV”)ii basis and 23.97% based on its market priceiii per share.
The performance table shows the Fund’s total return for the twelve months ended October 31, 2021 based on its NAV and market price as of October 31, 2021. The Fund seeks to track the investment results of the RARE Global Infrastructure Index (NR), which returned 23.99%, for the same period. The Fund’s broad-based market index, the S&P Global Infrastructure Index (NR)iv, returned 27.93% over the same time frame. The Lipper Global Infrastructure Funds Category Averagev returned 25.97% for the same period. Please note that Lipper performance returns are based on each Fund’s NAV.
| | | | |
2 | | | | Legg Mason Global Infrastructure ETF 2021 Annual Report |
| | | | | | | | |
Performance Snapshot as of October 31, 2021 (unaudited) | |
| | | 6 months | | | 12 months | |
| Legg Mason Global Infrastructure ETF: | | | | | | | | |
$ 31.75 (NAV) | | | 2.91 | % | | | 23.40 | %*† |
$ 31.68 (Market Price) | | | 2.49 | % | | | 23.97 | %*‡ |
| RARE Global Infrastructure Index (NR) | | | 3.18 | % | | | 23.99 | % |
| S&P Global Infrastructure Index (NR) | | | 3.52 | % | | | 27.93 | % |
| Lipper Global Infrastructure Funds Category Average | | | 5.13 | % | | | 25.97 | % |
The performance shown represents past performance. Past performance is no guarantee of future results and current performance may be higher or lower than the performance shown above. Principal value and investment returns will fluctuate so shares, when sold, may be worth more or less than their original cost. Performance data current to the most recent month-end is available at www.franklintempleton.com.
Investors buy and sell shares of an exchange-traded fund (“ETF”) at market price (not NAV) in the secondary market throughout the trading day. These shares are not individually available for direct purchase from or direct redemption to the ETF. Market price returns typically will be based upon the official closing price of the Fund’s shares. These returns do not represent investors’ returns had they traded shares at other times. Performance figures for periods shorter than one year represent cumulative figures and are not annualized.
Information showing the Fund’s net asset value, market price, premiums and discounts, and bid-ask spreads for various time periods is available by visiting the Fund’s website at www.franklintempleton.com.
As of the Fund’s current prospectus dated March 1, 2021, the gross total annual fund operating expense ratio for the Fund was 0.45%.
The management agreement between Legg Mason ETF Investment Trust (the “Trust”) and Legg Mason Partners Fund Advisor, LLC (the “LMPFA” or “manager”) (the “Management Agreement”) provides that LMPFA will pay all operating expenses of the Fund, except interest expenses, taxes, brokerage expenses, future Rule 12b-1 fees (if any), acquired fund fees and expenses, extraordinary expenses and the management fee payable to LMPFA under the Management Agreement. LMPFA will also pay all subadvisory fees of the Fund. The manager has agreed to waive and/or reimburse management fees so that the ratio of total annual fund operating expenses will not exceed 0.40% (subject to the same exclusions as the management agreement). This arrangement cannot be terminated prior to March 1, 2022 without the Board of Trustees’ consent.
| * | Total returns are based on changes in NAV or market price, respectively. Returns reflect the deduction of all Fund expenses. Returns do not reflect the deduction of brokerage commissions or taxes that investors pay on distributions or the sale of shares. |
| † | Total return assumes the reinvestment of all distributions at NAV. |
| ‡ | Total return assumes the reinvestment of all distributions at market price, which typically is based upon the official closing price of the Fund’s shares. |
| | | | | | |
| Legg Mason Global Infrastructure ETF 2021 Annual Report | | | | | 3 | |
Fund overview (cont’d)
Q. What were the leading contributors to performance?
A. During the reporting period, the Underlying Index returned 23.99%, underperforming the S&P Global Infrastructure Index (NR) by approximately 400 bps.
The Underlying Index’s exposure to North American rail operators contributed significantly to absolute return, in particular U.S. rails Union Pacific, Norfolk Southern and CSX, and Canadian rail operator Canadian National Railway.
The share prices of Union Pacific, Norfolk Southern and CSX rallied due to strong post- COVID-19 volume recovery, incremental margin gains, price increases ahead of inflation (caused by a tight trucking market), and strong commodity prices which increased demand.
Canadian National performed well during the reporting period due to activist investors TCI forcing management change, which will eventually see legendary railroader Jim Vena take over as CEO following Canadian National’s failed takeover attempt of Kansas City Southern.
Q. What were the leading detractors from performance?
A. Royal Vopak, a Dutch infrastructure company, was the largest detractor from performance during the reporting period. Royal Vopak’s underperformance is attributable to falling returns, and more recently, with oil forward curves in backwardation leading to lower occupancy rates.
Looking for additional information?
The Fund’s daily NAV is available online at www.franklintempleton.com. The Fund is traded under the symbol “INFR” and its closing market price is available on most financial websites. In a continuing effort to provide information concerning the Fund, shareholders may call 1-877-721-1926 (toll free), Monday through Friday from 8:00 a.m. to 5:30 p.m. Eastern time, for the Fund’s current NAV, market price and other information.
Thank you for your investment in Legg Mason Global Infrastructure ETF. As always, we appreciate that you have chosen us to manage your assets and we remain focused on achieving the Fund’s investment goals.
Sincerely,

Charles Hamieh
Portfolio Manager
ClearBridge RARE Infrastructure (North America) Pty Limited
November 10, 2021
| | | | |
4 | | | | Legg Mason Global Infrastructure ETF 2021 Annual Report |
RISKS: Equity securities are subject to market and price fluctuations. Companies in the infrastructure industry may be subject to a variety of factors that could adversely affect their business or operations, including high interest costs in connection with capital construction programs, high degrees of leverage, costs associated with governmental, environmental and other regulations, the effects of economic slowdowns, increased competition from other providers of services, uncertainties concerning costs, the level of government spending on infrastructure projects, and other factors. International investments are subject to special risks including currency fluctuations, social, economic and political uncertainties, which could increase volatility. These risks are magnified in emerging markets. Emerging market countries tend to have economic, political, and legal systems that are less developed and are less stable than those of more developed countries. In rising markets, the value of large-cap stocks may not rise as much as smaller-cap stocks. Small- and mid-cap stocks involve greater risks and volatility than large-cap stocks. The Fund may focus its investments in certain industries, increasing its vulnerability to market volatility. There is no guarantee that the Fund will achieve a high degree of correlation to the index it seeks to track. The Fund does not seek to outperform the index it tracks and does not seek temporary defensive positions when markets decline or appear overvalued. Derivatives, such as options and futures, can be illiquid, may disproportionately increase losses and have a potentially large impact on Fund performance. Please see the Fund’s prospectus for a more complete discussion of these and other risks and the Fund’s investment strategies.
The mention of sector breakdowns is for informational purposes only and should not be construed as a recommendation to purchase or sell any securities. The information provided regarding such sectors is not a sufficient basis upon which to make an investment decision. Investors seeking financial advice regarding the appropriateness of investing in any securities or investment strategies discussed should consult their financial professional. The Fund’s top five sector holdings (as a percentage of net assets) as of October 31, 2021 were: utilities (56.9%), industrials (30.5%), energy (11.7%) and communication services (0.7%). The Fund’s composition may differ over time.
All investments are subject to risk including the possible loss of principal. Past performance is no guarantee of future results. An index is a statistical composite that tracks a specified financial market, sector or rule-based investment process. Unlike a fund, an index does not actually hold a portfolio of securities and therefore does not incur the expenses incurred by a fund. These expenses negatively impact fund performance. All index performance reflects no deduction for fees, expenses or taxes. Please note that an investor cannot invest directly in an index.
The information provided is not intended to be a forecast of future events, a guarantee of future results or investment advice. Views expressed may differ from those of the firm as a whole.
| | | | | | |
| Legg Mason Global Infrastructure ETF 2021 Annual Report | | | | | 5 | |
Fund overview (cont’d)
| i | The MSCI ACWI All Cap Index captures large-, mid-, small- and micro-cap representation across 23 Developed Markets countries and large, mid and small cap representation across 27 Emerging Markets countries. With 15,400 constituents, the index is comprehensive, covering approximately 99% of the global equity investment opportunity set. |
| ii | Net Asset Value (NAV) is calculated by subtracting total liabilities from total assets and dividing the results by the number of shares outstanding. |
| iii | Market Price is determined by supply and demand. It is the price at which an investor purchases or sells shares of the Fund. The Market Price may differ from the NAV. |
| iv | The S&P Global Infrastructure Index (NR) is designed to track 75 companies from around the world chosen to represent the listed infrastructure industry while maintaining liquidity and tradability. Net Returns (NR) include income net of tax withholding when dividends are paid. |
| v | Lipper, Inc., a wholly-owned subsidiary of Refinitiv, provides independent insight on global collective investments. Returns are based on the period ended October 31, 2021, including the reinvestment of all distributions, including returns of capital, if any, calculated among the 94 funds for the six-month period and among the 93 funds for the twelve-month period in the Fund’s Lipper category. |
| | | | |
6 | | | | Legg Mason Global Infrastructure ETF 2021 Annual Report |
Fund at a glance† (unaudited)
Investment breakdown (%) as a percent of total investments

| † | The bar graph above represents the composition of the Fund’s investments as of October 31, 2021 and October 31, 2020. The composition of the Fund’s investments is subject to change at any time. |
| | | | | | |
| Legg Mason Global Infrastructure ETF 2021 Annual Report | | | | | 7 | |
Fund expenses (unaudited)
Example
As a shareholder of the Fund, you may incur two types of costs: (1) transaction costs, such as brokerage commissions paid on purchases and sales of Fund shares; and (2) ongoing costs, including management fees; and other Fund expenses. This example is intended to help you understand your ongoing costs (in dollars) of investing in the Fund and to compare these costs with the ongoing costs of investing in other funds.
This example is based on an investment of $1,000 invested on May 1, 2021 and held for the six months ended October 31, 2021.
Actual expenses
The table below titled “Based on Actual Total Return” provides information about actual account values and actual expenses. You may use the information provided in this table, together with the amount you invested, to estimate the expenses that you paid over the period. To estimate the expenses you paid on your account, divide your ending account value by $1,000 (for example, an $8,600 ending account value divided by $1,000 = 8.6), then multiply the result by the number under the heading entitled “Expenses Paid During the Period”.
Hypothetical example for comparison purposes
The table below titled “Based on Hypothetical Total Return” provides information about hypothetical account values and hypothetical expenses based on the actual expense ratio and an assumed rate of return of 5.00% per year before expenses, which is not the Fund’s actual return. The hypothetical account values and expenses may not be used to estimate the actual ending account balance or expenses you paid for the period. You may use the information provided in this table to compare the ongoing costs of investing in the Fund and other funds. To do so, compare the 5.00% hypothetical example relating to the Fund with the 5.00% hypothetical examples that appear in the shareholder reports of the other funds.
Please note that the expenses shown in the table below are meant to highlight your ongoing costs only and do not reflect any transactional costs, such as brokerage commissions paid on purchases and sales of Fund shares. Therefore, the table is useful in comparing ongoing costs only, and will not help you determine the relative total costs of owning different funds. In addition, if these transaction costs were included, your costs would have been higher.
| | | | | | | | | | | | | | | | | | | | | | | | | | | | | | | | | | | | | | | | | | | | | | | | | | |
| | |
| Based on actual total return1 | | | | Based on hypothetical total return1 |
Actual
Total
Return2 | | Beginning
Account
Value | | Ending
Account
Value | | Annualized
Expense
Ratio | | Expenses
Paid During
the Period3 | | | | Hypothetical
Annualized
Total Return | | Beginning
Account
Value | | Ending
Account
Value | | Annualized
Expense
Ratio | | Expenses
Paid During the Period3 |
| | | 2.91% | | | | $ | 1,000.00 | | | | $ | 1,029.10 | | | | | 0.40 | % | | | $ | 2.05 | | | | | | | 5.00 | % | | | | $1,000.00 | | | | $ | 1,023.19 | | | | | 0.40 | % | | | $ | 2.04 | |
| 1 | For the six months ended October 31, 2021. |
| 2 | Assumes the reinvestment of all distributions, including returns of capital, if any, at net asset value. Total return is not annualized, as it may not be representative of the total return for the year. Performance figures may reflect fee waivers and/or expense reimbursements. In the absence of fee waivers and/or expense reimbursements, the total return would have been lower. Past performance is no guarantee of future results. |
| 3 | Expenses (net of fee waivers and/or expense reimbursements) are equal to the Fund’s annualized expense ratio multiplied by the average account value over the period, multiplied by the number of days in the most recent fiscal half-year (184), then divided by 365. |
| | | | |
8 | | | | Legg Mason Global Infrastructure ETF 2021 Annual Report |
Fund performance (unaudited)
| | | | |
| Net Asset Value | | | |
Average annual total returns1 | | | |
| Twelve Months Ended 10/31/21 | | | 23.40 | % |
| Inception* through 10/31/21 | | | 8.26 | |
| |
| Cumulative total returns1 | | | |
| Inception date of 12/29/16 through 10/31/21 | | | 46.82 | % |
| | | | |
| Market Price | | | |
Average annual total returns2 | | | |
| Twelve Months Ended 10/31/21 | | | 23.97 | % |
| Inception* through 10/31/21 | | | 8.21 | |
| |
| Cumulative total returns2 | | | |
| Inception date of 12/29/16 through 10/31/21 | | | 46.51 | % |
All figures represent past performance and are not a guarantee of future results. Investment returns and principal value of an investment will fluctuate so that an investor’s shares, when sold, may be worth more or less than their original cost. The returns shown do not reflect the deduction of brokerage commissions or taxes that investors would pay on distributions or the sale of shares. Performance figures may reflect fee waivers and/or expense reimbursements. In the absence of fee waivers and/or expense reimbursements, the total return would have been lower.
Investors buy and sell shares of the Fund at market price, not NAV, in the secondary market throughout the trading day. These shares are not individually available for direct purchase from or direct redemption to the Fund. The Fund’s per share NAV is the value of one share of the Fund and is calculated by dividing the value of total assets less total liabilities by the number of shares outstanding. The NAV return is based on the NAV of the Fund and effective July 1, 2020, market price returns typically are based upon the official closing price of the Fund’s shares. Prior to July 1, 2020, market price returns generally were based upon the mid-point between the bid and ask on the Fund’s principal trading market when the Fund’s NAV was determined, which was typically 4:00 p.m. Eastern time (U.S.). Market price performance reported for periods prior to July 1, 2020 continue to reflect market prices calculated based upon the mid-point between the bid and ask on the Fund’s principal trading market typically as of 4:00 p.m. Eastern time (U.S.). These returns do not represent investors’ returns had they traded shares at other times. NAV and market price returns assume that dividends and capital gain distributions have been reinvested in the Fund at NAV and market price, respectively. As with other exchange-traded funds, NAV returns and market price returns may differ because of factors such as the supply and demand for Fund shares and investors’ assessment of the underlying value of the Fund’s portfolio securities.
| 1 | Assumes the reinvestment of all distributions, including returns of capital, if any, at net asset value. |
| 2 | Assumes the reinvestment of all distributions, including returns of capital, if any, at market price. |
| * | Inception date of the Fund is December 29, 2016. |
| | | | | | |
| Legg Mason Global Infrastructure ETF 2021 Annual Report | | | | | 9 | |
Fund performance (unaudited) (cont’d)
Historical performance
Value of $10,000 invested in
Legg Mason Global Infrastructure ETF vs. RARE Global Infrastructure Index and S&P Global Infrastructure Index (NTR)† — December 29, 2016 — October 31, 2021
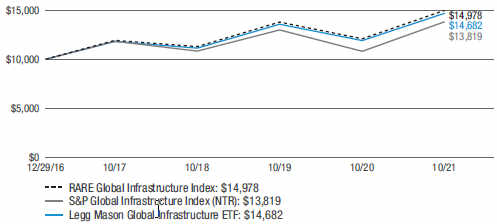
All figures represent past performance and are not a guarantee of future results. Investment returns and principal value of an investment will fluctuate so that an investor’s shares, when sold, may be worth more or less than their original cost. NAV returns assume that dividends and capital gain distributions have been reinvested in the Fund at NAV. The returns shown do not reflect the deduction of brokerage commissions or taxes that investors would pay on distributions or the sale of shares. Performance figures may reflect fee waivers and/or expense reimbursements. In the absence of fee waivers and/or expense reimbursements, the total return would have been lower.
| † | Hypothetical illustration of $10,000 invested in Legg Mason Global Infrastructure ETF on December 29, 2016 (inception date), assuming the reinvestment of all distributions, including returns of capital, if any, at net asset value through October 31, 2021. The hypothetical illustration also assumes a $10,000 investment in the RARE Global Infrastructure Index and the S&P Global Infrastructure Index. The Fund’s per share NAV is the value of one share of the Fund and is calculated by dividing the value of total assets less total liabilities by the number of shares outstanding. The NAV return is based on the NAV of the Fund. The RARE Global Infrastructure Index (the “Underlying Index”) is constructed from global infrastructure-related equity securities. The Underlying Index utilizes a proprietary methodology created and sponsored by ClearBridge RARE Infrastructure (North America) Pty Limited, the Fund’s subadviser. The S&P Global Infrastructure Index (NTR) is designed to track 75 companies from around the world chosen to represent the listed infrastructure industry while maintaining liquidity and tradability. The indices are not subject to the same management and trading expenses as a fund. An index is a statistical composite that tracks a specified financial market, sector, or rules-based investment process. Unlike a fund, an index does not actually hold a portfolio of securities and therefore does not incur the expenses incurred by a fund. These expenses negatively impact fund performance. All index performance reflects no deduction for fees, expenses or taxes. Please note that an investor cannot invest directly in an index. |
| | | | |
10 | | | | Legg Mason Global Infrastructure ETF 2021 Annual Report |
Schedule of investments
October 31, 2021
Legg Mason Global Infrastructure ETF
(Percentages shown based on Fund net assets)
| | | | | | | | |
| Security | | Shares | | | Value | |
| Common Stocks — 99.8% | | | | | | | | |
| Communication Services — 0.7% | | | | | | | | |
Media — 0.7% | | | | | | | | |
Eutelsat Communications SA | | | 3,863 | | | $ | 54,897 | |
SES SA, FDR | | | 4,446 | | | | 39,967 | |
Total Communication Services | | | | | | | 94,864 | |
| Energy — 11.7% | | | | | | | | |
Oil, Gas & Consumable Fuels — 11.7% | | | | | | | | |
Enbridge Inc. | | | 14,989 | | | | 626,864 | |
Kinder Morgan Inc. | | | 11,218 | | | | 187,902 | |
Koninklijke Vopak NV | | | 2,957 | | | | 117,717 | |
ONEOK Inc. | | | 975 | | | | 62,030 | |
Pembina Pipeline Corp. | | | 1,729 | | | | 57,147 | |
TC Energy Corp. | | | 6,085 | | | | 328,660 | |
Williams Cos. Inc. | | | 3,815 | | | | 107,163 | |
Total Energy | | | | | | | 1,487,483 | |
| Industrials — 30.5% | | | | | | | | |
Road & Rail — 25.6% | | | | | | | | |
Aurizon Holdings Ltd. | | | 63,985 | | | | 161,959 | |
Canadian National Railway Co. | | | 5,153 | | | | 683,769 | |
Canadian Pacific Railway Ltd. | | | 6,286 | | | | 485,770 | |
CSX Corp. | | | 14,172 | | | | 512,601 | |
Kansas City Southern | | | 569 | | | | 176,532 | |
Norfolk Southern Corp. | | | 1,553 | | | | 455,107 | |
Rumo SA | | | 14,671 | | | | 41,226 | * |
Union Pacific Corp. | | | 3,046 | | | | 735,304 | |
Total Road & Rail | | | | | | | 3,252,268 | |
Transportation Infrastructure — 4.9% | | | | | | | | |
Atlantia SpA | | | 5,363 | | | | 103,677 | * |
Atlas Arteria Ltd. | | | 19,953 | | | | 92,918 | |
CCR SA | | | 11,632 | | | | 23,772 | |
China Merchants Port Holdings Co. Ltd. | | | 27,915 | | | | 46,650 | |
COSCO SHIPPING Ports Ltd. | | | 39,200 | | | | 32,654 | |
Enav SpA | | | 8,763 | | | | 38,434 | *(a) |
Grupo Aeroportuario del Centro Norte SAB de CV | | | 3,121 | | | | 18,916 | * |
International Container Terminal Services Inc. | | | 18,628 | | | | 66,515 | |
Jiangsu Expressway Co. Ltd., Class H Shares | | | 51,009 | | | | 48,261 | |
Promotora y Operadora de Infraestructura SAB de CV | | | 11,945 | | | | 88,179 | |
See Notes to Financial Statements.
| | | | | | |
| Legg Mason Global Infrastructure ETF 2021 Annual Report | | | | | 11 | |
Schedule of investments (cont’d)
October 31, 2021
Legg Mason Global Infrastructure ETF
(Percentages shown based on Fund net assets)
| | | | | | | | |
| Security | | Shares | | | Value | |
Transportation Infrastructure — continued | | | | | | | | |
Shenzhen International Holdings Ltd. | | | 25,086 | | | $ | 30,281 | |
Zhejiang Expressway Co. Ltd., Class H Shares | | | 29,926 | | | | 26,583 | |
Total Transportation Infrastructure | | | | | | | 616,840 | |
Total Industrials | | | | | | | 3,869,108 | |
| Utilities — 56.9% | | | | | | | | |
Electric Utilities — 33.9% | | | | | | | | |
American Electric Power Co. Inc. | | | 1,504 | | | | 127,404 | |
AusNet Services Ltd. | | | 22,986 | | | | 42,644 | |
BKW AG | | | 193 | | | | 25,600 | |
CEZ AS | | | 1,576 | | | | 52,078 | |
Chubu Electric Power Co. Inc. | | | 5,993 | | | | 61,967 | |
Chugoku Electric Power Co. Inc. | | | 2,754 | | | | 22,824 | |
CK Infrastructure Holdings Ltd. | | | 7,476 | | | | 45,073 | |
CLP Holdings Ltd. | | | 23,352 | | | | 228,595 | |
Contact Energy Ltd. | | | 6,456 | | | | 37,794 | |
Duke Energy Corp. | | | 2,568 | | | | 261,962 | |
Edison International | | | 634 | | | | 39,898 | |
EDP - Energias de Portugal SA | | | 34,029 | | | | 192,332 | |
Electricite de France SA | | | 1,454 | | | | 21,420 | |
Emera Inc. | | | 856 | | | | 39,763 | |
Endesa SA | | | 3,507 | | | | 80,946 | |
Enel SpA | | | 75,672 | | | | 633,667 | |
Energisa SA | | | 2,234 | | | | 15,650 | |
Entergy Corp. | | | 502 | | | | 51,716 | |
Equatorial Energia SA | | | 6,226 | | | | 25,227 | |
Evergy Inc. | | | 378 | | | | 24,097 | |
Exelon Corp. | | | 1,629 | | | | 86,647 | |
FirstEnergy Corp. | | | 907 | | | | 34,947 | |
Fortis Inc. | | | 1,565 | | | | 69,554 | |
Fortum oyj | | | 2,382 | | | | 70,844 | |
HK Electric Investments & HK Electric Investments Ltd. | | | 27,851 | | | | 27,747 | |
Hydro One Ltd. | | | 1,055 | | | | 25,167 | (a) |
Iberdrola SA | | | 59,320 | | | | 701,240 | |
Inter RAO UES PJSC | | | 308,076 | | | | 20,860 | |
Kansai Electric Power Co. Inc. | | | 4,363 | | | | 40,100 | |
Korea Electric Power Corp. | | | 1,915 | | | | 37,036 | |
Kyushu Electric Power Co. Inc. | | | 3,593 | | | | 25,303 | |
Pinnacle West Capital Corp. | | | 282 | | | | 18,186 | |
Power Assets Holdings Ltd. | | | 16,826 | | | | 102,634 | |
PPL Corp. | | | 1,927 | | | | 55,498 | |
See Notes to Financial Statements.
| | | | |
12 | | | | Legg Mason Global Infrastructure ETF 2021 Annual Report |
Legg Mason Global Infrastructure ETF
(Percentages shown based on Fund net assets)
| | | | | | | | |
| Security | | Shares | | | Value | |
Electric Utilities — continued | | | | | | | | |
Red Electrica Corp. SA | | | 4,970 | | | $ | 103,585 | |
Southern Co. | | | 2,648 | | | | 165,023 | |
Spark Infrastructure Group | | | 21,343 | | | | 45,046 | |
SSE PLC | | | 9,768 | | | | 220,056 | |
Tenaga Nasional Bhd | | | 38,477 | | | | 89,758 | |
Terna Rete Elettrica Nazionale SpA | | | 16,943 | | | | 126,310 | |
Tohoku Electric Power Co. Inc. | | | 3,669 | | | | 23,779 | |
Tokyo Electric Power Co. Holdings Inc. | | | 7,919 | | | | 21,877 | * |
Transmissora Alianca de Energia Eletrica SA | | | 4,222 | | | | 27,503 | |
Verbund AG | | | 211 | | | | 22,001 | |
Xcel Energy Inc. | | | 1,797 | | | | 116,068 | |
Total Electric Utilities | | | | | | | 4,307,426 | |
Gas Utilities — 5.6% | | | | | | | | |
APA Group | | | 14,420 | | | | 88,813 | |
Atmos Energy Corp. | | | 325 | | | | 29,939 | |
Beijing Enterprises Holdings Ltd. | | | 4,689 | | | | 18,023 | |
China Resources Gas Group Ltd. | | | 4,938 | | | | 26,534 | |
Enagas SA | | | 2,799 | | | | 62,856 | |
ENN Energy Holdings Ltd. | | | 3,273 | | | | 56,674 | |
Hong Kong & China Gas Co. Ltd. | | | 106,905 | | | | 166,286 | |
Italgas SpA | | | 5,484 | | | | 34,842 | |
Naturgy Energy Group SA | | | 2,442 | | | | 64,235 | |
Snam SpA | | | 17,727 | | | | 100,460 | |
Tokyo Gas Co. Ltd. | | | 3,620 | | | | 62,828 | |
Total Gas Utilities | | | | | | | 711,490 | |
Independent Power and Renewable Electricity Producers — 0.7% | | | | | | | | |
China Longyuan Power Group Corp. Ltd., Class H Shares | | | 9,772 | | | | 22,838 | |
China Resources Power Holdings Co. Ltd. | | | 10,942 | | | | 28,273 | |
Northland Power Inc. | | | 1 | | | | 32 | |
Uniper SE | | | 675 | | | | 29,847 | |
Total Independent Power and Renewable Electricity Producers | | | | | | | 80,990 | |
Multi-Utilities — 14.3% | | | | | | | | |
A2A SpA | | | 9,300 | | | | 19,566 | |
Algonquin Power & Utilities Corp. | | | 1,568 | | | | 22,567 | |
Ameren Corp. | | | 641 | | | | 54,030 | |
Consolidated Edison Inc. | | | 884 | | | | 66,654 | |
Dominion Energy Inc. | | | 2,015 | | | | 152,999 | |
DTE Energy Co. | | | 434 | | | | 49,194 | |
E.ON SE | | | 19,057 | | | | 241,841 | |
Engie SA | | | 13,026 | | | | 185,354 | |
See Notes to Financial Statements.
| | | | | | |
| Legg Mason Global Infrastructure ETF 2021 Annual Report | | | | | 13 | |
Schedule of investments (cont’d)
October 31, 2021
Legg Mason Global Infrastructure ETF
(Percentages shown based on Fund net assets)
| | | | | | | | |
| Security | | Shares | | | Value | |
Multi-Utilities — continued | | | | | | | | |
Hera SpA | | | 4,582 | | | | $ 18,755 | |
National Grid PLC | | | 44,097 | | | | 565,412 | |
NiSource Inc. | | | 976 | | | | 24,078 | |
Public Service Enterprise Group Inc. | | | 1,265 | | | | 80,707 | |
Sempra Energy | | | 800 | | | | 102,104 | |
Suez SA | | | 2,082 | | | | 47,429 | |
Veolia Environnement SA | | | 3,681 | | | | 120,255 | |
WEC Energy Group Inc. | | | 710 | | | | 63,943 | |
Total Multi-Utilities | | | | | | | 1,814,888 | |
Water Utilities — 2.4% | | | | | | | | |
Guangdong Investment Ltd. | | | 20,754 | | | | 26,146 | |
Pennon Group PLC | | | 3,404 | | | | 54,406 | |
Severn Trent PLC | | | 2,902 | | | | 108,915 | |
United Utilities Group PLC | | | 8,249 | | | | 117,427 | |
Total Water Utilities | | | | | | | 306,894 | |
Total Utilities | | | | 7,221,688 | |
Total Investments — 99.8% (Cost — $11,816,414) | | | | 12,673,143 | |
Other Assets in Excess of Liabilities — 0.2% | | | | | | | 27,339 | |
Total Net Assets — 100.0% | | | | | | | $12,700,482 | |
| * | Non-income producing security. |
| (a) | Security is exempt from registration under Rule 144A of the Securities Act of 1933. This security may be resold in transactions that are exempt from registration, normally to qualified institutional buyers. This security has been deemed liquid pursuant to guidelines approved by the Board of Trustees. |
| | |
Abbreviation(s) used in this schedule: |
| |
| FDR | | — Fiduciary Depositary Receipts |
| |
| PJSC | | — Private Joint Stock Company |
See Notes to Financial Statements.
| | | | |
14 | | | | Legg Mason Global Infrastructure ETF 2021 Annual Report |
Legg Mason Global Infrastructure ETF
| | | | |
| Summary of Investments by Country* (unaudited) | | | |
| United States | | | 30.3 | % |
| Canada | | | 18.5 | |
| Italy | | | 8.5 | |
| United Kingdom | | | 8.4 | |
| Spain | | | 8.0 | |
| Hong Kong | | | 4.5 | |
| Australia | | | 3.4 | |
| France | | | 3.4 | |
| China | | | 2.9 | |
| Germany | | | 2.1 | |
| Japan | | | 2.0 | |
| Portugal | | | 1.5 | |
| Brazil | | | 1.1 | |
| Netherlands | | | 0.9 | |
| Mexico | | | 0.8 | |
| Malaysia | | | 0.7 | |
| Finland | | | 0.6 | |
| Philippines | | | 0.5 | |
| Czech Republic | | | 0.4 | |
| Luxembourg | | | 0.3 | |
| New Zealand | | | 0.3 | |
| South Korea | | | 0.3 | |
| Switzerland | | | 0.2 | |
| Austria | | | 0.2 | |
| Russia | | | 0.2 | |
| | | | 100.0 | % |
| * | As a percentage of total investments. Please note that the Fund holdings are as of October 31, 2021 and are subject to change. |
See Notes to Financial Statements.
| | | | | | |
| Legg Mason Global Infrastructure ETF 2021 Annual Report | | | | | 15 | |
Statement of assets and liabilities
October 31, 2021
| | | | |
| |
| Assets: | | | | |
Investments, at value (Cost — $ 11,816,414) | | $ | 12,673,143 | |
Foreign currency, at value (Cost — $4,745) | | | 4,755 | |
Cash | | | 10,647 | |
Dividends and interest receivable | | | 16,125 | |
Receivable for securities sold | | | 4,211 | |
Total Assets | | | 12,708,881 | |
| |
| Liabilities: | | | | |
Investment management fee payable | | | 4,201 | |
Payable for securities purchased | | | 4,198 | |
Total Liabilities | | | 8,399 | |
| Total Net Assets | | $ | 12,700,482 | |
| |
| Net Assets: | | | | |
Par value (Note 5) | | $ | 4 | |
Paid-in capital in excess of par value | | | 13,998,239 | |
Total distributable earnings (loss) | | | (1,297,761) | |
| Total Net Assets | | $ | 12,700,482 | |
| |
| Shares Outstanding | | | 400,000 | |
| |
| Net Asset Value | | | $31.75 | |
See Notes to Financial Statements.
| | | | |
16 | | | | Legg Mason Global Infrastructure ETF 2021 Annual Report |
Statement of operations
For the Year Ended October 31, 2021
| | | | |
| |
| Investment Income: | | | | |
Dividends | | $ | 397,118 | |
Less: Foreign taxes withheld | | | (31,751) | |
Total Investment Income | | | 365,367 | |
| |
| Expenses: | | | | |
Investment management fee (Note 2) | | | 49,586 | |
Total Expenses | | | 49,586 | |
Less: Fee waivers and/or expense reimbursements (Note 2) | | | (5,510) | |
Net Expenses | | | 44,076 | |
| Net Investment Income | | | 321,291 | |
| |
| Realized and Unrealized Gain (Loss) on Investments and Foreign Currency Transactions (Notes 1 and 3): | | | | |
Net Realized Gain (Loss) From: | | | | |
Investment transactions | | | 309,277 | |
Foreign currency transactions | | | (14,474) | |
Net Realized Gain | | | 294,803 | |
Change in Net Unrealized Appreciation (Depreciation) From: | | | | |
Investments | | | 1,436,764 | |
Foreign currencies | | | (361) | |
Change in Net Unrealized Appreciation (Depreciation) | | | 1,436,403 | |
| Net Gain on Investments and Foreign Currency Transactions | | | 1,731,206 | |
| Increase in Net Assets From Operations | | $ | 2,052,497 | |
See Notes to Financial Statements.
| | | | | | |
| Legg Mason Global Infrastructure ETF 2021 Annual Report | | | | | 17 | |
Statements of changes in net assets
| | | | | | | | |
| For the Years Ended October 31, | | 2021 | | | 2020 | |
| | |
| Operations: | | | | | | | | |
Net investment income | | $ | 321,291 | | | $ | 451,597 | |
Net realized gain (loss) | | | 294,803 | | | | (384,062) | |
Change in net unrealized appreciation (depreciation) | | | 1,436,403 | | | | (2,090,954) | |
Increase (Decrease) in Net Assets From Operations | | | 2,052,497 | | | | (2,023,419) | |
| | |
| Distributions to Shareholders From (Note 1): | | | | | | | | |
Total distributable earnings | | | (308,000) | | | | (453,501) | |
Decrease in Net Assets From Distributions to Shareholders | | | (308,000) | | | | (453,501) | |
| | |
| Fund Share Transactions (Note 5): | | | | | | | | |
Net proceeds from sale of shares (300,000 and 0 shares issued, respectively) | | | 9,037,455 | | | | — | |
Cost of shares repurchased (200,000 and 400,000 shares repurchased, respectively) | | | (6,005,130) | | | | (11,425,490) | |
Increase (Decrease) in Net Assets From Fund Share Transactions | | | 3,032,325 | | | | (11,425,490) | |
Increase (Decrease) in Net Assets | | | 4,776,822 | | | | (13,902,410) | |
| | |
| Net Assets: | | | | | | | | |
Beginning of year | | | 7,923,660 | | | | 21,826,070 | |
End of year | | $ | 12,700,482 | | | $ | 7,923,660 | |
See Notes to Financial Statements.
| | | | |
18 | | | | Legg Mason Global Infrastructure ETF 2021 Annual Report |
Financial highlights
| | | | | | | | | | | | | | | | | | | | |
For a share of beneficial interest outstanding throughout each year ended October 31,
unless otherwise noted: | | | | |
| | | 20211 | | | 20201 | | | 20191 | | | 20181 | | | 20171,2 | |
| | | | | |
| Net asset value, beginning of year | | $ | 26.41 | | | $ | 31.18 | | | $ | 26.49 | | | $ | 29.15 | | | $ | 25.18 | |
| | | | | |
| Income (loss) from operations: | | | | | | | | | | | | | | | | | | | | |
Net investment income | | | 0.89 | | | | 0.83 | | | | 0.98 | | | | 1.01 | | | | 0.64 | |
Net realized and unrealized gain (loss) | | | 5.25 | | | | (4.63) | | | | 4.75 | | | | (2.64) | | | | 3.88 | |
Total income (loss) from operations | | | 6.14 | | | | (3.80) | | | | 5.73 | | | | (1.63) | | | | 4.52 | |
| | | | | |
| Less distributions from: | | | | | | | | | | | | | | | | | | | | |
Net investment income | | | (0.80) | | | | (0.97) | | | | (1.04) | | | | (1.03) | | | | (0.55) | |
Total distributions | | | (0.80) | | | | (0.97) | | | | (1.04) | | | | (1.03) | | | | (0.55) | |
| | | | | |
| Net asset value, end of year | | $ | 31.75 | | | $ | 26.41 | | | $ | 31.18 | | | $ | 26.49 | | | $ | 29.15 | |
Total return, based on NAV3 | | | 23.40 | % | | | (12.29) | % | | | 21.93 | % | | | (5.76) | % | | | 18.04 | % |
| | | | | |
| Net assets, end of year (000s) | | $ | 12,700 | | | $ | 7,924 | | | $ | 21,826 | | | $ | 29,137 | | | $ | 34,975 | |
| | | | | |
| Ratios to average net assets: | | | | | | | | | | | | | | | | | | | | |
Gross expenses | | | 0.45 | % | | | 0.45 | % | | | 0.45 | % | | | 0.49 | % | | | 0.53 | %4 |
Net expenses5 | | | 0.40 | 6 | | | 0.40 | 6 | | | 0.40 | 6 | | | 0.47 | 6 | | | 0.53 | 4 |
Net investment income | | | 2.92 | | | | 2.86 | | | | 3.35 | | | | 3.57 | | | | 2.67 | 4 |
| | | | | |
| Portfolio turnover rate7 | | | 49 | % | | | 56 | % | | | 28 | % | | | 45 | % | | | 43 | % |
| 1 | Per share amounts have been calculated using the average shares method. |
| 2 | For the period December 29, 2016 (inception date) to October 31, 2017. |
| 3 | Performance figures may reflect fee waivers and/or expense reimbursements. In the absence of fee waivers and/or expense reimbursements, the total return would have been lower. The total return calculation assumes that distributions are reinvested at NAV. Past performance is no guarantee of future results. Total returns for periods of less than one year are not annualized. |
| 5 | As a result of an expense limitation, effective May 4, 2018, the ratio of total annual fund operating expenses, other than interest expenses, taxes, brokerage expenses, future 12b-1 fees (if any), acquired fund fees and expenses, extraordinary expenses and the management fee payable to LMPFA under the investment management agreement, to average net assets did not exceed 0.40%. This expense limitation cannot be terminated prior to March 1, 2022 without the Board of Trustees’ consent. |
| 6 | Reflects fee waivers and/or expense reimbursements. |
| 7 | Portfolio turnover excludes the value of portfolio securities received or delivered as a result of in-kind fund share transactions. |
See Notes to Financial Statements.
| | | | | | |
| Legg Mason Global Infrastructure ETF 2021 Annual Report | | | | | 19 | |
Notes to financial statements
1. Organization and significant accounting policies
Legg Mason Global Infrastructure ETF (the “Fund”) is a separate diversified investment series of Legg Mason ETF Investment Trust (the “Trust”). The Trust, a Maryland statutory trust, is registered under the Investment Company Act of 1940, as amended (the “1940 Act”), as an open-end management investment company.
The Fund is an exchange-traded fund (“ETF”). ETFs are funds that trade like other publicly-traded securities. The Fund is designed to track an index. Similar to shares of an index mutual fund, each share of the Fund represents an ownership interest in an underlying portfolio of securities intended to track an index. Unlike shares of a mutual fund, which can be bought from and redeemed by the issuing fund by all shareholders at a price based on net asset value (“NAV”), shares of the Fund may be directly purchased from and redeemed by the Fund at NAV solely by certain large institutional investors who have entered into agreements with the Fund’s distributor (“Authorized Participants”). Also unlike shares of a mutual fund, shares of the Fund are listed on a national securities exchange and trade in the secondary market at market prices that change throughout the day.
Shares of the Fund are listed and traded at market prices on NASDAQ. The market price for the Fund’s shares may be different from the Fund’s NAV. The Fund issues and redeems shares at NAV only in blocks of a specified number of shares or multiples thereof (“Creation Units”). Only Authorized Participants may purchase or redeem Creation Units directly with the Fund at NAV. Creation Units are issued and redeemed generally in-kind for a basket of securities and/or cash. Except when aggregated in Creation Units, shares of the Fund are not redeemable securities. Shareholders who are not Authorized Participants may not redeem shares directly from the Fund at NAV.
The Fund seeks to track the investment results of the RARE Global Infrastructure Index (the “Underlying Index”). The Underlying Index is constructed from global infrastructure-related equity securities and utilizes a proprietary methodology created and sponsored by ClearBridge RARE Infrastructure (North America) Pty Limited (“RARE”), the Fund’s subadviser.
The following are significant accounting policies consistently followed by the Fund and are in conformity with U.S. generally accepted accounting principles (“GAAP”). Estimates and assumptions are required to be made regarding assets, liabilities and changes in net assets resulting from operations when financial statements are prepared. Changes in the economic environment, financial markets and any other parameters used in determining these estimates could cause actual results to differ. Subsequent events have been evaluated through the date the financial statements were issued.
(a) Investment valuation. Equity securities for which market quotations are available are valued at the last reported sales price or official closing price on the primary market or exchange on which they trade. The valuations for fixed income securities (which may include, but are not limited to, corporate, government, municipal, mortgage-backed, collateralized mortgage obligations and asset-backed securities) and certain derivative instruments are typically the prices supplied by independent third party pricing services,
| | | | |
20 | | | | Legg Mason Global Infrastructure ETF 2021 Annual Report |
which may use market prices or broker/dealer quotations or a variety of valuation techniques and methodologies. The independent third party pricing services typically use inputs that are observable such as issuer details, interest rates, yield curves, prepayment speeds, credit risks/spreads, default rates and quoted prices for similar securities. Investments in open-end funds are valued at the closing net asset value per share of each fund on the day of valuation. When the Fund holds securities or other assets that are denominated in a foreign currency, the Fund will use the currency exchange rates, generally determined as of 4:00 p.m. (London Time). If independent third party pricing services are unable to supply prices for a portfolio investment, or if the prices supplied are deemed by the manager to be unreliable, the market price may be determined by the manager using quotations from one or more broker/dealers or at the transaction price if the security has recently been purchased and no value has yet been obtained from a pricing service or pricing broker. When reliable prices are not readily available, such as when the value of a security has been significantly affected by events after the close of the exchange or market on which the security is principally traded, but before the Fund calculates its net asset value, the Fund values these securities as determined in accordance with procedures approved by the Fund’s Board of Trustees.
The Board of Trustees is responsible for the valuation process and has delegated the supervision of the daily valuation process to the Global Fund Valuation Committee (known as Legg Mason North Atlantic Fund Valuation Committee prior to March 1, 2021) (the “Valuation Committee”). The Valuation Committee, pursuant to the policies adopted by the Board of Trustees, is responsible for making fair value determinations, evaluating the effectiveness of the Fund’s pricing policies, and reporting to the Board of Trustees. When determining the reliability of third party pricing information for investments owned by the Fund, the Valuation Committee, among other things, conducts due diligence reviews of pricing vendors, monitors the daily change in prices and reviews transactions among market participants.
The Valuation Committee will consider pricing methodologies it deems relevant and appropriate when making fair value determinations. Examples of possible methodologies include, but are not limited to, multiple of earnings; discount from market of a similar freely traded security; discounted cash-flow analysis; book value or a multiple thereof; risk premium/yield analysis; yield to maturity; and/or fundamental investment analysis. The Valuation Committee will also consider factors it deems relevant and appropriate in light of the facts and circumstances. Examples of possible factors include, but are not limited to, the type of security; the issuer’s financial statements; the purchase price of the security; the discount from market value of unrestricted securities of the same class at the time of purchase; analysts’ research and observations from financial institutions; information regarding any transactions or offers with respect to the security; the existence of merger proposals or tender offers affecting the security; the price and extent of public trading in similar securities of the issuer or comparable companies; and the existence of a shelf registration for restricted securities.
| | | | | | |
| Legg Mason Global Infrastructure ETF 2021 Annual Report | | | | | 21 | |
Notes to financial statements (cont’d)
For each portfolio security that has been fair valued pursuant to the policies adopted by the Board of Trustees, the fair value price is compared against the last available and next available market quotations. The Valuation Committee reviews the results of such back testing monthly and fair valuation occurrences are reported to the Board of Trustees quarterly.
The Fund uses valuation techniques to measure fair value that are consistent with the market approach and/or income approach, depending on the type of security and the particular circumstance. The market approach uses prices and other relevant information generated by market transactions involving identical or comparable securities. The income approach uses valuation techniques to discount estimated future cash flows to present value.
GAAP establishes a disclosure hierarchy that categorizes the inputs to valuation techniques used to value assets and liabilities at measurement date. These inputs are summarized in the three broad levels listed below:
| • | | Level 1 — quoted prices in active markets for identical investments |
| • | | Level 2 — other significant observable inputs (including quoted prices for similar investments, interest rates, prepayment speeds, credit risk, etc.) |
| • | | Level 3 — significant unobservable inputs (including the Fund’s own assumptions in determining the fair value of investments) |
The inputs or methodologies used to value securities are not necessarily an indication of the risk associated with investing in those securities.
The following is a summary of the inputs used in valuing the Fund’s assets carried at fair value:
| | | | | | | | | | | | | | | | |
| ASSETS | |
| Description | | Quoted Prices
(Level 1) | | | Other Significant
Observable Inputs
(Level 2) | | | Significant
Unobservable
Inputs
(Level 3) | | | Total | |
| Long-Term Investments†: | | | | | | | | | | | | | | | | |
Common Stocks | | $ | 12,673,143 | | | | — | | | | — | | | $ | 12,673,143 | |
| Total Investments | | $ | 12,673,143 | | | | — | | | | — | | | $ | 12,673,143 | |
| † | See Schedule of Investments for additional detailed categorizations. |
(b) Foreign currency translation. Investment securities and other assets and liabilities denominated in foreign currencies are translated into U.S. dollar amounts based upon prevailing exchange rates on the date of valuation. Purchases and sales of investment securities and income and expense items denominated in foreign currencies are translated into U.S. dollar amounts based upon prevailing exchange rates on the respective dates of such transactions.
| | | | |
22 | | | | Legg Mason Global Infrastructure ETF 2021 Annual Report |
The Fund does not isolate that portion of the results of operations resulting from fluctuations in foreign exchange rates on investments from the fluctuations arising from changes in market prices of securities held. Such fluctuations are included with the net realized and unrealized gain or loss on investments.
Net realized foreign exchange gains or losses arise from sales of foreign currencies, including gains and losses on forward foreign currency contracts, currency gains or losses realized between the trade and settlement dates on securities transactions, and the difference between the amounts of dividends, interest, and foreign withholding taxes recorded on the Fund’s books and the U.S. dollar equivalent of the amounts actually received or paid. Net unrealized foreign exchange gains and losses arise from changes in the values of assets and liabilities, other than investments in securities, on the date of valuation, resulting from changes in exchange rates.
Foreign security and currency transactions may involve certain considerations and risks not typically associated with those of U.S. dollar denominated transactions as a result of, among other factors, the possibility of lower levels of governmental supervision and regulation of foreign securities markets and the possibility of political or economic instability.
(c) Foreign investment risks. The Fund’s investments in foreign securities may involve risks not present in domestic investments. Since securities may be denominated in foreign currencies, may require settlement in foreign currencies or may pay interest or dividends in foreign currencies, changes in the relationship of these foreign currencies to the U.S. dollar can significantly affect the value of the investments and earnings of the Fund. Foreign investments may also subject the Fund to foreign government exchange restrictions, expropriation, taxation or other political, social or economic developments, all of which affect the market and/or credit risk of the investments.
(d) Security transactions and investment income. Security transactions are accounted for on a trade date basis. Interest income (including interest income from payment-in-kind securities), adjusted for amortization of premium and accretion of discount, is recorded on the accrual basis. Dividend income is recorded on the ex-dividend date for dividends received in cash and/or securities. Foreign dividend income is recorded on the ex-dividend date or as soon as practicable after the Fund determines the existence of a dividend declaration after exercising reasonable due diligence. The cost of investments sold is determined by use of the specific identification method. To the extent any issuer defaults or a credit event occurs that impacts the issuer, the Fund may halt any additional interest income accruals and consider the realizability of interest accrued up to the date of default or credit event.
(e) Distributions to shareholders. Distributions from net investment income of the Fund, if any, are declared and paid on a quarterly basis. Distributions of net realized gains, if any, are declared at least annually. Distributions to shareholders of the Fund are recorded on the ex-dividend date and are determined in accordance with income tax regulations, which may differ from GAAP.
| | | | | | |
| Legg Mason Global Infrastructure ETF 2021 Annual Report | | | | | 23 | |
Notes to financial statements (cont’d)
(f) Federal and other taxes. It is the Fund’s policy to comply with the federal income and excise tax requirements of the Internal Revenue Code of 1986 (the “Code”), as amended, applicable to regulated investment companies. Accordingly, the Fund intends to distribute its taxable income and net realized gains, if any, to shareholders in accordance with timing requirements imposed by the Code. Therefore, no federal or state income tax provision is required in the Fund’s financial statements.
Management has analyzed the Fund’s tax positions taken on income tax returns for all open tax years and has concluded that as of October 31, 2021, no provision for income tax is required in the Fund’s financial statements. The Fund’s federal and state income and federal excise tax returns for tax years for which the applicable statutes of limitations have not expired are subject to examination by the Internal Revenue Service and state departments of revenue.
Under the applicable foreign tax laws, a withholding tax may be imposed on interest, dividends and capital gains at various rates.
(g) Reclassification. GAAP requires that certain components of net assets be reclassified to reflect permanent differences between financial and tax reporting. These reclassifications have no effect on net assets or net asset value per share. During the current year, the following reclassifications have been made:
| | | | | | | | |
| | | Total Distributable
Earnings (Loss) | | | Paid-in
Capital | |
| (a) | | $ | (488,655) | | | $ | 488,655 | |
| (a) | Reclassifications are due to book/tax differences in the treatment of an in-kind distribution of securities and a taxable overdistribution. |
2. Investment management agreement and other transactions with affiliates
Legg Mason Partners Fund Advisor, LLC (“LMPFA”) is the Fund’s investment manager and RARE is the Fund’s subadviser. Western Asset Management Company, LLC (“Western Asset”) manages the portion of the Fund’s cash and short-term instruments allocated to it. LMPFA, RARE and Western Asset are indirect, wholly-owned subsidiaries of Franklin Resources, Inc. (“Franklin Resources”).
LMPFA provides administrative and certain oversight services to the Fund. LMPFA delegates to the subadviser the day-to-day portfolio management of the Fund. The Fund is responsible for paying interest expenses, taxes, brokerage expenses, future 12b-1 fees (if any), acquired fund fees and expenses, extraordinary expenses and the management fee payable to LMPFA under the investment management agreement.
Under the investment management agreement and subject to the general supervision of the Fund’s Board of Trustees, LMPFA provides or causes to be furnished all investment management, supervisory, administrative and other services reasonably necessary for the operation of the Fund, including certain distribution services (provided pursuant to a separate distribution agreement) and investment advisory services (provided pursuant to separate subadvisory agreements) under a unitary fee structure. The Fund pays an
| | | | |
24 | | | | Legg Mason Global Infrastructure ETF 2021 Annual Report |
investment management fee, calculated daily and paid monthly, at an annual rate of 0.45% of the Fund’s average daily net assets.
LMPFA has agreed to waive and/or reimburse investment management fees so that the ratio of total annual fund operating expenses will not exceed 0.40% of the Fund’s average daily net assets (subject to the same exclusions as the investment management agreement). This arrangement cannot be terminated prior to March 1, 2022 without the Board of Trustees’ consent.
During the year ended October 31, 2021, fees waived and/or expenses reimbursed amounted to $5,510.
As compensation for its subadvisory services, LMPFA pays RARE a fee monthly, at an annual rate equal to 90% of the management fee paid by the Fund to LMPFA, net of (i) all fees and expenses incurred by LMPFA under the investment management agreement (including without limitation any subadvisory fee paid to another subadviser to the Fund) and (ii) expense waivers, if any, and reimbursements. LMPFA pays Western Asset monthly a fee of 0.02% of the portion of the Fund’s average daily net assets allocated to Western Asset for the management of cash and other short-term instruments, net of expense waivers, if any, and reimbursements.
Franklin Distributors, LLC (known as Legg Mason Investor Services, LLC prior to July 7, 2021) (“Franklin Distributors”) serves as the distributor of Creation Units for the Fund on an agency basis. Franklin Distributors is an indirect, wholly-owned broker-dealer subsidiary of Franklin Resources.
The Fund’s Board of Trustees has adopted a Rule 12b-1 shareholder services and distribution plan and under that plan, the Fund is authorized to pay service and/or distribution fees calculated at an annual rate of up to 0.25% of its average daily net assets. No service and/or distribution fees are currently paid by the Fund, and there are no current plans to impose these fees.
All officers and one Trustee of the Trust are employees of Franklin Resources or its affiliates and do not receive compensation from the Trust.
3. Investments
During the year ended October 31, 2021, the aggregate cost of purchases and proceeds from sales of investments (excluding in-kind transactions and short-term investments) were as follows:
| | | | |
| Purchases | | $ | 5,426,270 | |
| Sales | | | 5,240,082 | |
During the year ended October 31, 2021, in-kind transactions (Note 5) were as follows:
| | | | |
| Contributions | | $ | 8,689,578 | |
| Redemptions | | | 5,852,959 | |
| Realized gain (loss)* | | | 504,771 | |
| | | | | | |
| Legg Mason Global Infrastructure ETF 2021 Annual Report | | | | | 25 | |
Notes to financial statements (cont’d)
| * | Net realized gains on redemptions in-kind are not taxable to the remaining shareholders of the Fund. |
The in-kind contributions and in-kind redemptions shown in this table may not agree with the Fund Share Transactions on the Statement of Changes in Net Assets. This table represents the accumulation of the Fund’s daily net shareholder transactions while the Statement of Changes in Net Assets reflects gross shareholder transactions including any cash component of the transactions.
At October 31, 2021, the aggregate cost of investments and the aggregate gross unrealized appreciation and depreciation of investments for federal income tax purposes were as follows:
| | | | | | | | | | | | | | | | |
| | | Cost | | | Gross
Unrealized
Appreciation | | | Gross
Unrealized
Depreciation | | | Net
Unrealized
Appreciation | |
| Securities | | $ | 11,812,611 | | | $ | 1,189,143 | | | $ | (328,611) | | | $ | 860,532 | |
4. Derivative instruments and hedging activities
During the year ended October 31, 2021, the Fund did not invest in derivative instruments.
5. Fund share transactions
At October 31, 2021, the Trust had an unlimited number of shares of beneficial interest authorized with a par value of $0.00001 per share. Fund shares are issued and redeemed by the Fund only in Creation Units or Creation Unit aggregations, where 50,000 shares of the Fund constitute a Creation Unit. Such transactions are generally on an in-kind basis, with a separate cash payment, which is a balancing cash component to equate the transaction to the net asset value per share of the Fund on the transaction date. Transactions in capital shares of the Fund are disclosed in detail in the Statement of Changes in Net Assets. Authorized Participants are subject to standard creation and redemption transaction fees to offset transfer and other transaction costs associated with the issuance and redemption of Creation Units. Creations and redemptions for cash (when cash creations and redemptions are available or specified) may be subject to an additional variable fee.
6. Income tax information and distributions to shareholders
The tax character of distributions paid during the fiscal years ended October 31, was as follows:
| | | | | | | | |
| | | 2021 | | | 2020 | |
| Distributions paid from: | | | | | | | | |
| Ordinary income | | $ | 308,000 | | | $ | 453,501 | |
As of October 31, 2021, the components of distributable earnings (loss) on a tax basis were as follows:
| | | | |
| Deferred capital losses* | | $ | (2,158,146) | |
| Unrealized appreciation (depreciation)(a) | | | 860,385 | |
| Total distributable earnings (loss) — net | | $ | (1,297,761) | |
| | | | |
26 | | | | Legg Mason Global Infrastructure ETF 2021 Annual Report |
| * | These capital losses have been deferred in the current year as either short-term or long-term losses. The losses will be deemed to occur on the first day of the next taxable year in the same character as they were originally deferred and will be available to offset future taxable capital gains. |
| (a) | The difference between book-basis and tax-basis unrealized appreciation (depreciation) is attributable to the tax deferral of losses on wash sales. |
7. Recent accounting pronouncement
In March 2020, the Financial Accounting Standards Board (FASB) issued Accounting Standards Update (ASU) No. 2020-04, Reference Rate Reform (Topic 848) – Facilitation of the Effects of Reference Rate Reform on Financial Reporting. In January 2021, the FASB issued ASU No. 2021-01, with further amendments to Topic 848. The amendments in the ASUs provide optional temporary accounting recognition and financial reporting relief from the effect of certain types of contract modifications due to the planned discontinuation of the LIBOR and other interbank-offered based reference rates as of the end of 2021 and 2023. The ASUs are effective for certain reference rate-related contract modifications that occur during the period March 12, 2020 through December 31, 2022. Management has reviewed the requirements and believes the adoption of these ASUs will not have a material impact on the financial statements.
8. Other matter
The outbreak of the respiratory illness COVID-19 (commonly referred to as “coronavirus”) has continued to rapidly spread around the world, causing considerable uncertainty for the global economy and financial markets. The ultimate economic fallout from the pandemic, and the long-term impact on economies, markets, industries and individual issuers, are not known. The COVID-19 pandemic could adversely affect the value and liquidity of the Fund’s investments, impair the Fund’s ability to satisfy redemption requests, and negatively impact the Fund’s performance. In addition, the outbreak of COVID-19, and measures taken to mitigate its effects, could result in disruptions to the services provided to the Fund by its service providers.
9. Subsequent event
In September 2021, the Fund’s Board of Trustees approved changing the Fund’s fiscal year end from October 31st to March 31st.
On November 19, 2021, the Board of Trustees of Legg Mason ETF Investment Trust, on behalf of the Fund, approved a proposal to liquidate and dissolve the Fund. The liquidation is anticipated to occur on or about February 3, 2022. Trading in the Fund on NASDAQ will be halted prior to market open on January 28, 2022. Proceeds of the liquidation are currently scheduled to be sent to shareholders on or about February 3, 2022.
| | | | | | |
| Legg Mason Global Infrastructure ETF 2021 Annual Report | | | | | 27 | |
Report of independent registered public accounting firm
To the Board of Trustees of Legg Mason ETF Investment Trust and Shareholders of Legg Mason Global Infrastructure ETF
Opinion on the Financial Statements
We have audited the accompanying statement of assets and liabilities, including the schedule of investments, of Legg Mason Global Infrastructure ETF (one of the funds constituting Legg Mason ETF Investment Trust, referred to hereafter as the “Fund”) as of October 31, 2021, the related statement of operations for the year ended October 31, 2021, the statement of changes in net assets for each of the two years in the period ended October 31, 2021, including the related notes, and the financial highlights for each of the four years in the period ended October 31, 2021 and for the period December 29, 2016 (inception date) through October 31, 2017 (collectively referred to as the “financial statements”). In our opinion, the financial statements present fairly, in all material respects, the financial position of the Fund as of October 31, 2021, the results of its operations for the year then ended, the changes in its net assets for each of the two years in the period ended October 31, 2021 and the financial highlights for each of the four years in the period ended October 31, 2021 and for the period December 29, 2016 (inception date) through October 31, 2017 in conformity with accounting principles generally accepted in the United States of America.
Basis for Opinion
These financial statements are the responsibility of the Fund’s management. Our responsibility is to express an opinion on the Fund’s financial statements based on our audits. We are a public accounting firm registered with the Public Company Accounting Oversight Board (United States) (PCAOB) and are required to be independent with respect to the Fund in accordance with the U.S. federal securities laws and the applicable rules and regulations of the Securities and Exchange Commission and the PCAOB.
We conducted our audits of these financial statements in accordance with the standards of the PCAOB. Those standards require that we plan and perform the audit to obtain reasonable assurance about whether the financial statements are free of material misstatement, whether due to error or fraud.
Our audits included performing procedures to assess the risks of material misstatement of the financial statements, whether due to error or fraud, and performing procedures that respond to those risks. Such procedures included examining, on a test basis, evidence regarding the amounts and disclosures in the financial statements. Our audits also included evaluating the accounting principles used and significant estimates made by management, as well as evaluating the overall presentation of the financial statements. Our procedures included confirmation of securities owned as of October 31, 2021 by correspondence with the custodian. We believe that our audits provide a reasonable basis for our opinion.
PricewaterhouseCoopers LLP
San Francisco, California
December 17, 2021
We have served as the auditor of one or more investment companies in the Franklin Templeton Group of Funds since 1948.
| | | | |
28 | | | | Legg Mason Global Infrastructure ETF 2021 Annual Report |
Additional shareholder information (unaudited)
Results of special meeting of shareholders
A special meeting of shareholders was held on June 15, 2021 for shareholders of record as of March 1, 2021 (the “Record Date”) to elect the Board of Trustees of the Trust. Shareholders of the Fund and each other series of the Trust voted together as a single class to elect the Board.
Shareholders of the Trust voted as indicated below (vote totals are rounded to the nearest whole number). Effective July 1, 2021, the Board is composed of the following Trustees:
| | | | | | |
| Trustees | | For | | | Withheld |
| Deborah D. McWhinney | | | 941,735,402 | | | 14,088,498 |
| Rohit Bhagat | | | 943,565,325 | | | 12,258,574 |
| Anantha K. Pradeep | | | 942,060,249 | | | 13,763,651 |
| Jennifer M. Johnson | | | 943,888,843 | | | 11,935,057 |
| | | | | | |
| Legg Mason Global Infrastructure ETF | | | | | 29 | |
Statement regarding liquidity risk management program
(unaudited)
Each of the Funds has adopted and implemented a written Liquidity Risk Management Program (the “LRMP”) as required by Rule 22e-4 under the Investment Company Act of 1940 (the “Liquidity Rule”). The LRMP is designed to assess and manage each Fund’s liquidity risk, which is defined as the risk that the Fund could not meet requests to redeem shares issued by the Fund without significant dilution of remaining investors’ interests in the Fund. Each of the Funds is an exchange-traded fund (“ETF”) that is considered an “In-Kind ETF” under the Liquidity Rule, which means that the Fund satisfies requests for redemption through in-kind transfers of portfolio securities, positions, and other assets, except for a de minimis amount of cash, and publishes its portfolio holdings daily. In accordance with the Liquidity Rule, the LRMP includes policies and procedures that provide for: (1) assessment, management, and review (no less frequently than annually) of each Fund’s liquidity risk; (2) prohibiting the Fund’s acquisition of Illiquid investments that would result in the Fund holding more than 15% of its net assets in Illiquid assets. The LRMP also requires reporting to the SEC (on a non-public basis) and to the Board if the Fund’s holdings of Illiquid assets exceed 15% of the Fund’s net assets. As an In-Kind ETF, the Fund is not required to include in the LRMP policies and procedures relating to classification of portfolio holdings into four liquidity categories or establishing a highly liquid investment minimum (“HLIM”).
The Funds’ Board of Trustees approved the appointment of the Director of Liquidity Risk within the Investment Risk Management Group (the “IRMG”) as the Administrator of the LRMP. The IRMG maintains the Investment Liquidity Committee (the “ILC”) to provide oversight and administration of policies and procedures governing liquidity risk management for FT products and portfolios. The ILC includes representatives from Franklin Templeton’s Risk, Trading, Global Compliance, Legal, Investment Compliance, Investment Operations, Valuation Committee, Product Management and Global Product Strategy.
In assessing and managing each Fund’s liquidity risk, the ILC considers, as relevant, a variety of factors, including the Fund’s investment strategy and the liquidity of its portfolio investments during both normal and reasonably foreseeable stressed conditions; its short and long-term cash flow projections; and its cash holdings and access to other funding sources including the Funds’ interfund lending facility and line of credit. Because the Funds are ETFs, the ILC also considers, as relevant, (1) the relationship between the Fund’s portfolio liquidity and the way in which, and the prices and spread at which, Fund shares trade, including the efficiency of the arbitrage function and the level of active participation by market participants, including authorized participants and (2) the effect of the composition of baskets on the overall liquidity of the Fund’s portfolio.
At meetings of the Funds’ Board of Trustees held in May 2021, the Program Administrator provided a written report to the Board addressing the adequacy and effectiveness of the program for the year ended December 31, 2020. The Program Administrator report concluded that (i.) the LRMP, as adopted and implemented, remains reasonably designed to
| | | | |
30 | | | | Legg Mason Global Infrastructure ETF |
assess and manage each Fund’s liquidity risk; (ii.) the LRMP, including the Highly Liquid Investment Minimum (“HLIM”) where applicable, was implemented and operated effectively to achieve the goal of assessing and managing each Fund’s liquidity risk; and (iii.) each Fund was able to meet requests for redemption without significant dilution of remaining investors’ interests in the Fund.
| | | | | | |
| Legg Mason Global Infrastructure ETF | | | | | 31 | |
Additional information (unaudited)
Information about Trustees and Officers
The business and affairs of Legg Mason Global Infrastructure ETF (the “Fund”) are conducted by management under the supervision and subject to the direction of its Board of Trustees. The business address of each Trustee is One Franklin Parkway, San Mateo, California 94403-1906. Information pertaining to the Trustees and officers of the Fund is set forth below.
The Statement of Additional Information includes additional information about Trustees and is available, without charge, upon request by calling the Fund at 1-877-721-1926.
| | |
| Independent Trustees† |
|
| Rohit Bhagat |
| |
| Year of birth | | 1964 |
| Position(s) with Trust | | Lead Independent Trustee |
| Term of office1 and length of time served2 | | Since July 2021 |
| Principal occupation(s) during the past five years | | Managing Member, Mukt Capital, LLC (private investment firm) (2014-present); Advisor, Optimal Asset Management (investment technology and advisory services company) (2015- present); and formerly, Chairman, Asia Pacific, BlackRock (2009- 2012); Global Chief Operating Officer, Barclays Global Investors (investment management) (2005- 2009); and Senior Partner, The Boston Consulting Group (management consulting) (1992-2005). |
| Number of funds in fund complex overseen by Trustee | | 59 |
| Other Directorships held by Trustee during the past five years | | AssetMark Financial Holdings, Inc. (investment solutions) (2018- present) and PhonePe (payment and financial services) (2020- present); and formerly, Axis Bank (financial) (2013-2021), FlipKart Limited (eCommerce company) (2019-2020), CapFloat Financial Services Pvt., Ltd. (non-banking finance company) (2018) and Zentific Investment Management (hedge fund) (2015-2018). |
|
| Deborah D. McWhinney |
| |
| Year of birth | | 1955 |
| Position(s) with Trust | | Trustee |
| Term of office1 and length of time served2 | | Since July 2021 |
| Principal occupation(s) during the past five years | | Director of various companies; and formerly, Board Member, Lloyds Banking Group (2015-2018) (financial institution) and Fresenius Medical Group (2016-2018) (healthcare); Chief Executive Officer (2013-2014) and Chief Operating Officer (2011- 2013), CitiGroup Global Enterprise Payments (financial services); and President, Citi’s Personal Banking and Wealth Management (2009-2011). |
| Number of funds in fund complex overseen by Trustee | | 59 |
| Other Directorships held by Trustee during the past five years | | IHS Markit (information services) (2015- present), Borg Warner (automotive) ( 2018- present) and LegalShield (consumer services) (2020-present); and formerly, Fluor Corporation (construction and engineering) (2014-2020) and Focus Financial Partners, LLC (financial services) (2018-2020). |
| | | | |
32 | | | | Legg Mason Global Infrastructure ETF |
| | |
| Independent Trustees† (cont’d) |
|
| Anantha K. Pradeep |
| |
| Year of birth | | 1963 |
| Position(s) with Trust | | Trustee |
| Term of office1 and length of time served2 | | Since July 2021 |
| Principal occupation(s) during the past five years | | Chief Executive Officer, Smilable, Inc. (technology company) (2014-present); Chief Executive Officer, MachineVantage (technology company) (2018-present); Founder and Managing Partner, Consult Meridian, LLC (consulting company) (2009- present); and formerly, Founder, BoardVantage (board portal solutions provider delivering paperless process for boards and leadership) (2000-2002). |
| Number of funds in fund complex overseen by Trustee | | 59 |
| Other Directorships held by Trustee during the past five years | | None |
| | |
| Interested Trustee and Officer | | |
|
| Jennifer M. Johnson3* |
| |
| Year of birth | | 1964 |
| Position(s) with Trust | | Trustee and Chairperson of the Board |
| Term of office1 and length of time served2 | | Since July 2021 |
| Principal occupation(s) during the past five years | | Chief Executive Officer, President and Director, Franklin Resources, Inc.; officer and/or director or trustee, as the case may be, of some of the other subsidiaries of Franklin Resources, Inc. and of eight of the investment companies in Franklin Templeton; and formerly, Chief Operating Officer and Executive Vice President, Franklin Resources, Inc. (1994-2015); Executive Vice President of Operations and Technology, Franklin Resources, Inc. (2005-2010); and Senior Vice President, Franklin Resources, Inc. (2003-2005). |
| Number of funds in fund complex overseen by Trustee | | 70 |
| Other Directorships held by Trustee during the past five years | | None |
| | |
| Additional Officers | | |
|
| Alison E. Baur |
| |
| Franklin Templeton | | |
| One Franklin Parkway, San Mateo, CA 94403-1906 | | |
| Year of birth | | 1964 |
| Position(s) with Trust | | Vice President |
| Term of office1 and length of time served2 | | Since July 2021 |
| Principal occupation(s) during the past five years | | Deputy General Counsel, Franklin Templeton; and officer of some of the other subsidiaries of Franklin Resources, Inc. and of 44 of the investment companies in Franklin Templeton. |
| | | | | | |
| Legg Mason Global Infrastructure ETF | | | | | 33 | |
Additional information (unaudited) (cont’d)
Information about Trustees and Officers
| | |
| Additional Officers (cont’d) | | |
|
Fred Jensen
Franklin Templeton 620 Eighth Avenue, 47th Floor, New York, NY 10018 |
| |
| Year of birth | | 1963 |
| Position(s) with Trust | | Chief Compliance Officer |
| Term of office1 and length of time served2 | | Since July 2021 |
| Principal occupation(s) during the past five years | | Director-Global Compliance of Franklin Templeton (since 2020); Managing Director of Legg Mason & Co. (2006 to 2020); Director of Compliance, Legg Mason Office of the Chief Compliance Officer (2006 to 2020); formerly, Chief Compliance Officer of Legg Mason Global Asset Allocation (prior to 2014); Chief Compliance Officer of Legg Mason Private Portfolio Group (prior to 2013); formerly, Chief Compliance Officer of The Reserve Funds (investment adviser, funds and broker-dealer) (2004) and Ambac Financial Group (investment adviser, funds and broker-dealer) (2000 to 2003). |
|
Harris Goldblat
Franklin Templeton 100 First Stamford Place, 6th Floor, Stamford, CT 06902 |
| |
| Year of birth | | 1969 |
| Position(s) with Trust | | Vice President and Assistant Secretary |
| Term of office1 and length of time served2 | | Since July 2021 |
| Principal occupation(s) during the past five years | | Associate General Counsel to Franklin Templeton (since 2020); Assistant Secretary of certain funds associated with Legg Mason & Co. or its affiliates (since 2006); formerly, Managing Director and Associate General Counsel of Legg Mason & Co. (2005 to 2020). |
|
Steven J. Gray
Franklin Templeton One Franklin Parkway, San Mateo, CA 94403-1906 |
| |
| Year of birth | | 1955 |
| Position(s) with Trust | | Vice President |
| Term of office1 and length of time served2 | | Since July 2021 |
| Principal occupation(s) during the past five years | | Senior Associate General Counsel, Franklin Templeton; Vice President, Franklin Templeton Distributors, Inc. and FASA, LLC; and officer of 44 of the investment companies in Franklin Templeton. |
| | | | |
34 | | | | Legg Mason Global Infrastructure ETF |
| | |
| Additional Officers (cont’d) | | |
|
Matthew T. Hinkle
Franklin Templeton One Franklin Parkway, San Mateo, CA 94403-1906 |
| |
| Year of birth | | 1971 |
| Position(s) with Trust | | Chief Executive Officer –Finance and Administration |
| Term of office1 and length of time served2 | | Since July 2021 |
| Principal occupation(s) during the past five years | | Senior Vice President, Franklin Templeton Services, LLC; officer of 44 of the investment companies in Franklin Templeton; and formerly, Vice President, Global Tax (2012-April 2017) and Treasurer/Assistant Treasurer, Franklin Templeton (2009-2017). |
|
Susan Kerr
Franklin Templeton 620 Eighth Avenue, 47th Floor, New York, NY 10018 |
| |
| Year of birth | | 1949 |
| Position(s) with Trust | | Vice President –AML Compliance |
| Term of office1 and length of time served2 | | Since July 2021 |
| Principal occupation(s) during the past five years | | Senior Compliance Analyst, Franklin Templeton (since 2020); Chief Anti-Money Laundering Compliance Officer of certain Funds associated with Legg Mason & Co. or its affiliates (since 2013) and Anti-Money Laundering Compliance Officer (since 2012), Senior Compliance Officer (since 2011) and Assistant Vice President (since 2010) of Franklin Distributors, LLC; formerly, Assistant Vice President of Legg Mason & Co. (2010 to 2020) |
|
Thomas C. Mandia
Franklin Templeton 100 First Stamford Place, 6th Floor, Stamford, CT 06902 |
| |
| Year of birth | | 1962 |
| Position(s) with Trust | | Vice President and Assistant Secretary |
| Term of office1 and length of time served2 | | Since July 2021 |
| Principal occupation(s) during the past five years | | Senior Associate General Counsel to Franklin Templeton (since 2020); Secretary of LMPFA (since 2006); Assistant Secretary of certain funds associated with Legg Mason & Co. or its affiliates (since 2006); Secretary of LMAS (since 2002) and LMFAM (formerly registered investment advisers) (since 2013); formerly, Managing Director and Deputy General Counsel of Legg Mason & Co. (2005 to 2020). |
| | | | | | |
| Legg Mason Global Infrastructure ETF | | | | | 35 | |
Additional information (unaudited) (cont’d)
Information about Trustees and Officers
| | |
| Additional Officers (cont’d) | | |
|
Patrick O’Connor
Franklin Templeton One Franklin Parkway, San Mateo, CA 94403-1906 |
| |
| Year of birth | | 1967 |
| Position(s) with Trust | | President and Chief Executive Officer–Investment Management |
| Term of office1 and length of time served2 | | Since July 2021 |
| Principal occupation(s) during the past five years | | President and Chief Investment Officer, Franklin Advisory Services, LLC; Senior Vice President, Franklin Advisers, Inc.; officer of five of the investment companies in Franklin Templeton; and formerly, Managing Director, Head of iShares Product Canada, BlackRock (1998-2014). |
|
Vivek Pai
Franklin Templeton 300 S.E. 2nd Street, Fort Lauderdale, FL 33301-1923 |
| |
| Year of birth | | 1970 |
| Position(s) with Trust | | Treasurer, Chief Financial Officer and Chief Accounting Officer |
| Term of office1 and length of time served2 | | Since July 2021 |
| Principal occupation(s) during the past five years | | Treasurer, U.S. Fund Administration & Reporting and officer of five of the investment companies in Franklin Templeton. |
|
Navid J. Tofigh
Franklin Templeton One Franklin Parkway, San Mateo, CA 94403-1906 |
| |
| Year of birth | | 1972 |
| Position(s) with Trust | | Vice President and Secretary |
| Term of office1 and length of time served2 | | Since July 2021 |
| Principal occupation(s) during the past five years | | Associate General Counsel and officer of 44 of the investment companies in Franklin Templeton. |
|
Craig S. Tyle
Franklin Templeton One Franklin Parkway, San Mateo, CA 94403-1906 |
| |
| Year of birth | | 1960 |
| Position(s) with Trust | | Vice President |
| Term of office1 and length of time served2 | | Since July 2021 |
| Principal occupation(s) during the past five years | | General Counsel and Executive Vice President, Franklin Resources, Inc.; and officer of some of the other subsidiaries of Franklin Resources, Inc. and of 44 of the investment companies in Franklin Templeton. |
| | | | |
36 | | | | Legg Mason Global Infrastructure ETF |
| | |
| Additional Officers (cont’d) | | |
|
Lori A. Weber
Franklin Templeton 300 S.E. 2nd Street, Fort Lauderdale, FL 33301-1923 |
| |
| Year of birth | | 1964 |
| Position(s) with Trust | | Vice President |
| Term of office1 and length of time served2 | | Since July 2021 |
| Principal occupation(s) during the past five years | | Senior Associate General Counsel, Franklin Templeton; Assistant Secretary, Franklin Resources, Inc.; Vice President and Secretary, Templeton Investment Counsel, LLC; and officer of 44 of the Investment companies in Franklin Templeton. |
| † | Trustees who are not “interested persons” of the Fund within the meaning of Section 2(a)(19) of the Investment Company Act of 1940, as amended (the “1940 Act”). |
| * | Effective July 1, 2021, Ms. Johnson became Chair. |
| 1 | Each Trustee and officer serves until his or her respective successor has been duly elected and qualified or until his or her earlier death, resignation, retirement or removal. |
| 2 | Indicates the earliest year in which the Trustee became a board member for a fund in the Legg Mason fund complex or the officer took such office. |
| 3 | Ms. Johnson is an “interested person” of the Fund, as defined in the 1940 Act, because of her position with LMPFA and/or certain of its affiliates. |
| | | | | | |
| Legg Mason Global Infrastructure ETF | | | | | 37 | |
Important tax information (unaudited)
By mid-February, tax information related to a shareholder’s proportionate share of distributions paid during the preceding calendar year will be received, if applicable. Please also refer to www.franklintempleton.com for per share tax information related to any distributions paid during the preceding calendar year. Shareholders are advised to consult with their tax advisors for further information on the treatment of these amounts on their tax returns.
The following tax information for the Fund is required to be furnished to shareholders with respect to income earned and distributions paid during its fiscal year.
The Fund hereby reports the following amounts, or if subsequently determined to be different, the maximum allowable amounts, for the fiscal year ended October 31, 2021:
| | | | | | | | |
| | | Pursuant to: | | | Amount Reported | |
| Income Eligible for Dividends Received Deduction (DRD) | | § | 854(b)(1)(A) | | | | $71,916 | |
| Qualified Dividend Income Earned (QDI) | | § | 854(b)(1)(B) | | | | $333,349 | |
Under Section 853 of the Internal Revenue Code, the Fund intends to elect to pass through to its shareholders the following amounts, or amounts as finally determined, of foreign taxes paid and foreign source income earned by the Fund during the fiscal year ended October 31, 2021:
| | | | |
| Foreign Taxes Paid | | $ | 31,497 | |
| Foreign Source Income Earned | | $ | 298,021 | |
| | | | |
38 | | | | Legg Mason Global Infrastructure ETF |
Legg Mason
Global Infrastructure ETF
Trustees*
Rohit Bhagat
Deborah D. McWhinney
Anantha K. Pradeep
Jennifer M. Johnson**
Chair
| * | During a June 15, 2021 special meeting of shareholders, a new group of Trustees were elected to oversee the funds of Legg Mason ETF Investment Trust, effective July 1, 2021. |
| ** | Effective July 1, 2021, Ms. Johnson became Chair. |
Investment manager
Legg Mason Partners Fund Advisor, LLC
Subadviser
ClearBridge RARE Infrastructure (North America) Pty Limited
Custodian
The Bank of New York Mellon
Transfer agent
The Bank of New York Mellon
240 Greenwich Street
New York, NY 10286
Independent registered public accounting firm
PricewaterhouseCoopers LLP Baltimore, MD
Legg Mason Global Infrastructure ETF
The Fund is a separate investment series of Legg Mason ETF Investment Trust, a Maryland statutory trust.
Legg Mason Global Infrastructure ETF
Legg Mason Funds
620 Eighth Avenue, 47th Floor
New York, NY 10018
The Fund files its complete schedule of portfolio holdings with the Securities and Exchange Commission (“SEC”) for the first and third quarters of each fiscal year as an exhibit to its reports on Form N-PORT. The Fund’s Forms N-PORT are available on the SEC’s website at www.sec.gov. To obtain information on Form N-PORT, shareholders can call the Fund at 1-877-721-1926.
Information on how the Fund voted proxies relating to portfolio securities during the prior 12-month period ended June 30th of each year and a description of the policies and procedures that the Fund uses to determine how to vote proxies related to portfolio transactions are available (1) without charge, upon request, by calling the Fund at 1-877-721-1926, (2) at www.franklintempleton.com and (3) on the SEC’s website at www.sec.gov.
This report is submitted for the general information of the shareholders of Legg Mason Global Infrastructure ETF. This report is not authorized for distribution to prospective investors in the Fund unless preceded or accompanied by a current prospectus.
Investors should consider the Fund’s investment objectives, risks, charges and expenses carefully before investing. The prospectus contains this and other important information about the Fund. Please read the prospectus carefully before investing.
www.franklintempleton.com
© 2021 Franklin Distributors, LLC, Member FINRA/SIPC. All rights reserved.
ETF Index Disclaimers
The MSCI ACWI All Cap Index (the “MSCI Index”) was used by ClearBridge RARE Infrastructure (North America) Pty Limited (“RARE”) (formerly known as RARE Infrastructure (North America) Pty Ltd.) as the reference universe for selection of the component securities included in the RARE Global Infrastructure Index (the “Underlying Index”). MSCI Inc. does not in any way sponsor, support, promote or endorse the Underlying Index or Legg Mason Global Infrastructure ETF (the “Fund”). MSCI Inc. was not and is not involved in any way in the creation, calculation, maintenance or review of the Underlying Index. The MSCI Index was provided on an “as is” basis. MSCI Inc., its affiliates and any other person or entity involved in or related to compiling, computing or creating the MSCI Index (collectively, the “MSCI Parties”) expressly disclaim all warranties (including, without limitation, any warranties of originality, accuracy, completeness, timeliness, non-infringement, merchantability and fitness for a particular purpose). Without limiting any of the foregoing, in no event shall any MSCI Party have any liability for any direct, indirect, special, incidental, punitive, consequential (including without limitation lost profits) or any other damages in connection with the MSCI Index, the Underlying Index or the Fund.
The Fund is not sponsored, promoted, sold or supported in any other manner by Solactive AG nor does Solactive AG offer any express or implicit guarantee or assurance either with regard to the results of using the Underlying Index and/or Underlying Index trade mark or the Underlying Index Price at any time or in any other respect. The Underlying Index is calculated and published by Solactive AG. Solactive AG uses its best efforts to ensure that the Underlying Index is calculated correctly. Irrespective of its obligations towards the Fund, Solactive AG has no obligation to point out errors in the Underlying Index to third parties including but not limited to investors and/or financial intermediaries of the Fund. Neither publication of the Underlying Index by Solactive AG nor the licensing of the Underlying Index or the Underlying Index trade mark for the purpose of use in connection with the Fund constitutes a recommendation by Solactive AG to invest capital in this Fund nor does it in any way represent an assurance or opinion of Solactive AG with regard to any investment in this Fund.
RARE does not guarantee the accuracy and/or the completeness of the Underlying Index or any data included therein, and RARE shall not have any liability for any errors, omissions or interruptions therein. RARE makes no warranty, express or implied, as to results to be obtained by the Fund, owners of the shares of the Fund or any other person or entity from the use of the Underlying Index, or any data included therein, either in connection with the Fund or for any other use. RARE makes no express or implied warranties, and expressly disclaims all warranties of merchantability or fitness for a particular purpose or use with respect to the Underlying Index or any data included therein. Without limiting any of the foregoing, in no event shall RARE have any liability for any special, punitive, direct, indirect or consequential damages (including lost profits) arising out of matters relating to the use of the Underlying Index, even if notified of the possibility of such damages.
www.franklintempleton.com
© 2021 Franklin Distributors, LLC, Member FINRA/SIPC. All rights reserved
ETFF418409 12/21 SR 21-4280
The registrant has adopted a code of ethics that applies to the registrant’s principal executive officer, principal financial officer, principal accounting officer or controller.
| ITEM 3. | AUDIT COMMITTEE FINANCIAL EXPERT. |
The Board of Trustees of the registrant has determined that Rohit Bhagat possesses the technical attributes identified in Instruction 2(b) of Item 3 to Form N-CSR to qualify as an “audit committee financial expert,” and has designated Rohit Bhagat as the Audit Committee’s financial expert. Rohit Bhagat is an “independent” Trustees pursuant to paragraph (a)(2) of Item 3 to Form N-CSR.
| ITEM 4. | PRINCIPAL ACCOUNTANT FEES AND SERVICES. |
a) Audit Fees. The aggregate fees billed in the last two fiscal years ending October 31, 2020 and October 31, 2021 (the “Reporting Periods”) for professional services rendered by the Registrant’s principal accountant (the “Auditor”) for the audit of the Registrant’s annual financial statements, or services that are normally provided by the Auditor in connection with the statutory and regulatory filings or engagements for the Reporting Periods, were $81,600 in October 31, 2020 and $61,200 in October 31, 2021.
b) Audit-Related Fees. The aggregate fees billed in the Reporting Period for assurance and related services by the Auditor that are reasonably related to the performance of the Registrant’s financial statements were $0 in October 31, 2020 and $0 in October 31, 2021.
(c) Tax Fees. The aggregate fees billed in the Reporting Periods for professional services rendered by the Auditor for tax compliance, tax advice and tax planning (“Tax Services”) were $0 in October 31, 2020 and $30,000 in October 31, 2021. These services consisted of (i) review or preparation of U.S. federal, state, local and excise tax returns; (ii) U.S. federal, state and local tax planning, advice and assistance regarding statutory, regulatory or administrative developments, and (iii) tax advice regarding tax qualification matters and/or treatment of various financial instruments held or proposed to be acquired or held.
There were no fees billed for tax services by the Auditors to service affiliates during the Reporting Periods that required pre-approval by the Audit Committee.
d) All Other Fees.
The aggregate fees billed in the Reporting Periods for products and services provided by the Auditor, other than the services reported in paragraphs (a) through (c) for the Item 4 for the Legg Mason ETF Investment Trust, were $0 in October 31, 2020 and $0 in October 31, 2021.
All Other Fees. There were no other non-audit services rendered by the Auditor to Legg Mason Partners Fund Advisors, LLC (“LMPFA”), and any entity controlling, controlled by or under common control with LMPFA that provided ongoing services to Legg Mason ETF Investment Trust requiring pre-approval by the Audit Committee in the Reporting Period.
(e) Audit Committee’s pre–approval policies and procedures described in paragraph (c) (7) of Rule 2-01 of Regulation S-X.
(1) The Charter for the Audit Committee (the “Committee”) of the Board of each registered investment company (the “Fund”) advised by LMPFA or one of their affiliates (each, an “Adviser”) requires that the Committee shall approve (a) all audit and permissible non-audit services to be provided to the Fund and (b) all permissible non-audit services to be provided by the Fund’s independent auditors to the Adviser and any Covered Service Providers if the engagement relates directly to the operations and financial reporting of the Fund. The
Committee may implement policies and procedures by which such services are approved other than by the full Committee.
The Committee shall not approve non-audit services that the Committee believes may impair the independence of the auditors. As of the date of the approval of this Audit Committee Charter, permissible non-audit services include any professional services (including tax services), that are not prohibited services as described below, provided to the Fund by the independent auditors, other than those provided to the Fund in connection with an audit or a review of the financial statements of the Fund. Permissible non-audit services may not include: (i) bookkeeping or other services related to the accounting records or financial statements of the Fund; (ii) financial information systems design and implementation; (iii) appraisal or valuation services, fairness opinions or contribution-in-kind reports; (iv) actuarial services; (v) internal audit outsourcing services; (vi) management functions or human resources; (vii) broker or dealer, investment adviser or investment banking services; (viii) legal services and expert services unrelated to the audit; and (ix) any other service the Public Company Accounting Oversight Board determines, by regulation, is impermissible.
Pre-approval by the Committee of any permissible non-audit services is not required so long as: (i) the aggregate amount of all such permissible non-audit services provided to the Fund, the Adviser and any service providers controlling, controlled by or under common control with the Adviser that provide ongoing services to the Fund (“Covered Service Providers”) constitutes not more than 5% of the total amount of revenues paid to the independent auditors during the fiscal year in which the permissible non-audit services are provided to (a) the Fund, (b) the Adviser and (c) any entity controlling, controlled by or under common control with the Adviser that provides ongoing services to the Fund during the fiscal year in which the services are provided that would have to be approved by the Committee; (ii) the permissible non-audit services were not recognized by the Fund at the time of the engagement to be non-audit services; and (iii) such services are promptly brought to the attention of the Committee and approved by the Committee (or its delegate(s)) prior to the completion of the audit.
(2) For the Legg Mason ETF Investment Trust, the percentage of fees that were approved by the audit committee, with respect to: Audit-Related Fees were 100% and 100% for October 31, 2020 and October 31, 2021; Tax Fees were 100% and 100% for October 31, 2020 and October 31, 2021; and Other Fees were 100% and 100% for October 31, 2020 and October 31, 2021.
(f) N/A
(g) Non-audit fees billed by the Auditor for services rendered to Legg Mason ETF Investment Trust, LMPFA and any entity controlling, controlled by, or under common control with LMPFA that provides ongoing services to Legg Mason ETF Investment Trust during the reporting period were $672,688 in October 31, 2020 and $1,558,348 in October 31, 2021.
(h) Yes. Legg Mason ETF Investment Trust’s Audit Committee has considered whether the provision of non-audit services that were rendered to Service Affiliates, which were not pre-approved (not requiring pre-approval), is compatible with maintaining the Accountant’s independence. All services provided by the Auditor to the Legg Mason ETF Investment Trust or to Service Affiliates, which were required to be pre-approved, were pre-approved as required.
| ITEM 5. | AUDIT COMMITTEE OF LISTED REGISTRANTS. |
| | a) | The independent board members are acting as the registrant’s audit committee as specified in Section 3(a)(58)(B) of the Exchange Act. The Audit Committee consists of the following Board members: |
Rohit Bhagat
Deborah D. McWhinney
Anantha K. Pradeep
Jennifer M. Johnson**
* During a June 15, 2021 special meeting of shareholders, a new group of Trustees were elected to oversee the funds of Legg Mason ETF Investment Trust, effective July 1, 2021.
** Effective July 1, 2021, Ms. Johnson became Chair.
| ITEM 6. | SCHEDULE OF INVESTMENTS. |
Included herein under Item 1.
| ITEM 7. | DISCLOSURE OF PROXY VOTING POLICIES AND PROCEDURES FOR CLOSED-END MANAGEMENT INVESTMENT COMPANIES. |
Not applicable.
| ITEM 8. | PORTFOLIO MANAGERS OF CLOSED-END MANAGEMENT INVESTMENT COMPANIES. |
Not applicable.
| ITEM 9. | PURCHASES OF EQUITY SECURITIES BY CLOSED-END MANAGEMENT INVESTMENT COMPANY AND AFFILIATED PURCHASERS. |
Not applicable.
| ITEM 10. | SUBMISSION OF MATTERS TO A VOTE OF SECURITY HOLDERS. |
Not applicable.
| ITEM 11. | CONTROLS AND PROCEDURES. |
| | (a) | The registrant’s principal executive officer and principal financial officer have concluded that the registrant’s disclosure controls and procedures (as defined in Rule 30a- 3(c) under the Investment Company Act of 1940, as amended (the “1940 Act”)) are effective as of a date within 90 days of the filing date of this report that includes the disclosure required by this paragraph, based on their evaluation of the disclosure controls and procedures required by Rule 30a-3(b) under the 1940 Act and 15d-15(b) under the Securities Exchange Act of 1934. |
| | (b) | There were no changes in the registrant’s internal control over financial reporting (as defined in Rule 30a-3(d) under the 1940 Act) that occurred during the second fiscal quarter of the period covered by this report that have materially affected, or are likely to materially affect the registrant’s internal control over financial reporting. |
| ITEM 12. | DISCLOSURE OF SECURITIES LENDING ACTIVITIES FOR CLOSED-END MANAGEMENT INVESTMENT COMPANIES. |
Not applicable.
(a) (1) Code of Ethics attached hereto.
Exhibit 99.CODE ETH
SIGNATURES
Pursuant to the requirements of the Securities Exchange Act of 1934 and the Investment Company Act of 1940, the registrant has duly caused this Report to be signed on its behalf by the undersigned, there unto duly authorized.
Legg Mason ETF Investment Trust
| | |
| By: | | /s/ Matthew T. Hinkle |
| | Matthew T. Hinkle |
| | Chief Executive Officer |
| |
| Date: | | December 23, 2021 |
Pursuant to the requirements of the Securities Exchange Act of 1934 and the Investment Company Act of 1940, this report has been signed below by the following persons on behalf of the registrant and in the capacities and on the dates indicated.
| | |
| By: | | /s/ Matthew T. Hinkle |
| | Matthew T. Hinkle |
| | Chief Executive Officer |
| |
| Date: | | December 23, 2021 |
| | |
| By: | | /s/ Vivek Pai |
| | Vivek Pai |
| | Principal Financial Officer |
| |
| Date: | | December 23, 2021 |