Table of Contents
UNITED STATES
SECURITIES AND EXCHANGE COMMISSION
Washington, D.C. 20549
FORM N-CSR
CERTIFIED SHAREHOLDER REPORT OF REGISTERED
MANAGEMENT INVESTMENT COMPANIES
Investment Company Act file number 811-23096
Legg Mason ETF Investment Trust
(Exact name of registrant as specified in charter)
620 Eighth Avenue, 47th Floor, New York, NY 10018
(Address of principal executive offices) (Zip code)
Harris Goldblat
Franklin Templeton
100 First Stamford Place
Stamford, CT 06902
(Name and address of agent for service)
Registrant’s telephone number, including area code: 1-877-721-1926
Date of fiscal year end: March 31
Date of reporting period: March 31, 2024
Table of Contents
ITEM 1. REPORT TO STOCKHOLDERS.
The Annual Report to Stockholders is filed herewith.
Table of Contents

Annual Report
| March 31, 2024
|
ROYCE
QUANT SMALL-CAP QUALITY VALUE ETF
SQLV
The Securities and Exchange Commission has adopted new regulations that will result in changes to the design and delivery of annual and semi-annual shareholder reports beginning in July 2024.
If you have previously elected to receive shareholder reports electronically, you will continue to do so and need not take any action.
Otherwise, paper copies of the Fund’s shareholder reports will be mailed to you beginning in July 2024. If you would like to receive shareholder reports and other communications from the Fund electronically instead of by mail, you may make that request at any time by contacting your financial intermediary (such as a broker-dealer or bank).

| INVESTMENT PRODUCTS: NOT FDIC INSURED • NO BANK GUARANTEE • MAY LOSE VALUE |
Table of Contents
Fund objective
The Fund seeks to achieve long-term growth of capital.

Dear Shareholder,
We are pleased to provide the annual report of Royce Quant Small-Cap Quality Value ETF for the twelve-month reporting period ended March 31, 2024. Please read on for a detailed look at prevailing economic and market conditions during the Fund’s reporting period and to learn how those conditions have affected Fund performance.
As always, we remain committed to providing you with excellent service and a full spectrum of investment choices. We also remain committed to supplementing the support you receive from your financial advisor. One way we accomplish this is through our website, www.franklintempleton.com. Here you can gain immediate access to market and investment information, including:
| • | Fund net asset value and market price, |
| • | Market insights and commentaries from our portfolio managers, and |
| • | A host of educational resources. |
We look forward to helping you meet your financial goals.
Sincerely,

Patrick O’Connor
President and Chief Executive Officer—Investment Management
April 30, 2024
II | Royce Quant Small-Cap Quality Value ETF |
Table of Contents
Q. What is the Fund’s investment strategy?
A. Royce Quant Small-Cap Quality Value ETF (the “Fund”) primarily invests in equity securities of small-capitalization companies that are traded in the United States and meet certain criteria using a proprietary methodology created by the Fund’s subadviser, Royce & Associates, LP (Royce & Associates, LP primarily conducts its business under the name Royce Investment Partners (“Royce” or the “subadviser”)). Under normal market conditions, the Fund invests at least 80% of its net assets, plus borrowings for investment purposes, if any, in equity securities of small-capitalization companies or other instruments with similar characteristics.
Q. What were the overall market conditions during the Fund’s reporting period?
A. The reporting period from March 31, 2023, through March 31, 2024 was strong on an absolute basis for small-cap stocks. The Russell 2000® Indexi gained 19.71% for the period, though the small-cap index remained -9.87% shy of its November 8, 2021 peak through March 31, 2024. During the 12-month reporting period, large-cap stocks fared better, with the Russell 1000® Indexii advancing 29.87%. Both mega-cap and growth stocks gained more than the large-cap index for the period, with the Russell Top 50® Indexiii up 36.57% and the Nasdaq Composite Indexiv climbing 35.14%. The Russell Microcap® Indexv trailed all of these indexes with a 17.78% gain for the 12-month period. The Russell 2000® Value and the Russell 2000® Growth Indexesvi were close, though growth outpaced value for the period, up 20.35% versus 18.75% for the period.
Within the Russell 2000® index, results at the sector level were driven by positive returns from the Industrials, Information Technology, and Financials sectors. Only two sectors detracted from performance for the period—Utilities and Communication Services — while Materials made the smallest contribution. Traditional growth areas dominated performance at the industry level, with biotechnology (Health Care), technology hardware, storage & peripherals, and software (both from Information Technology) making the biggest impact. The industries that detracted the most were communications equipment (Information Technology), electrical equipment (Industrials), and life sciences tools & services (Health Care).
In the second quarter of 2023, the Russell 2000® Index rose 5.21%. After posting negative results in April and May, small-caps rebounded in June. Most of the action, however, took place in the upper echelons of market capitalization. The Russell 1000® Index gained 8.58%, and the Russell Top 50® Mega Cap Indexvii was up 13.05%. Moreover, the tech-laden Nasdaq Composite, home to market cap behemoths such as Apple, Alphabet, Amazon, and Nvidia, advanced 13.19%. So, while second quarter 2023 results were somewhat saw-toothed—the Russell Midcap Index was up 4.76%—returns were tightly concentrated at the very top of the market. Two factors drove the reversal in leadership between U.S. small- and large-cap stocks. First, small-caps bore the brunt of the damage from the banking crisis, which had some of its most adverse effects on the share prices of smaller regional players. Second, Information Technology—which accounts for more than
| Royce Quant Small-Cap Quality Value ETF 2024 Annual Report |
|
1 |
|
Table of Contents
Fund overview (cont’d)
25% of the large-cap index — dominated performance within the Russell 1000® Index. Consistent with the notion that economic apprehensiveness kept investors away from many small-cap stocks were the relatively underwhelming results for more economically sensitive cyclical stocks within the Russell 2000® Index, which significantly trailed their defensive siblings in the second quarter of 2023. Moreover, the Russell 2000 Value Index trailed the Russell 2000® Growth Index in the second quarter of 2023, up 3.18% versus 7.05%.
The major U.S. stock market indexes were down across the board in the third quarter of 2023, thanks to a combination of revived recession warnings, rising yields, and a looming government shutdown. The 10-Year Treasury yield rose to 4.6% in September, climbing by more than 20.0% in the third quarter 2023, to its highest rate since October 2007. And even with Google and Amazon facing anti-trust suits, small- and micro-cap stocks bore the brunt of the quarterly downturn. The Russell 2000® Index fell -5.13% in the third quarter 2023, while the Russell Microcap® Index lost -7.93% compared to a loss of -3.15% for the Russell 1000® Index and -2.76% for the Russell Top 50® Mega Cap Index. In fact, the Russell 2000® Index fell -10.60% in August and September 2023 alone. This reinforced a stubborn pattern of small-cap underperformance that has been in place for several years and was through the first nine months of 2023—the Russell 2000® Index thus finished September 2023 1,255 basis points behind its large-cap sibling. The end of September 2023 also marked the biggest one-year spread between the Russell 2000® Index (+8.93%) and the Russell Microcap® Index (-1.35%) since the latter’s inception in June 2000. Equally important, the Russell 2000® Index slipped back into bear territory in the third quarter of 2023, down -24.85% from its last peak on November 8, putting the asset class into a nearly two-year bear cycle, while large-caps experienced only a minor loss through this lengthy small-cap correction. As might be expected in a down quarter, the Russell 2000® Value Index lost significantly less than the Russell 2000® Growth Index, down -2.96% in the third quarter of 2023 versus -7.32%.
After stumbling into the quarter, small-cap stocks rallied significantly off their 2023 low in October for a double-digit gain in the fourth quarter of 2023, with the Russell 2000® Index advancing 14.03% to see out 2023. Small-cap stocks showed strength on both an absolute and relative basis, as the Russell 2000® outpaced both the large-cap Russell 1000® Index and Russell Top 50 Mega Cap Indexes, which gained 11.96% and 10.86% respectively for the quarter. With the U.S. Federal Reserve (Fed) mostly committed to no longer hiking rates, a robust showing from domestic equities was hardly surprising. The outperformance for small-caps, however, was arguably more unexpected—though from our perspective well overdue. The year’s final quarter also saw the 10-year Treasury yield fall by more than 100 basis points, from 4.98% in mid-October to 3.84% by the end of December. Thanks to its stellar fourth quarter, the Russell 2000® Index was no longer in a bear market at the end of 2023, though the small-cap index remained down -14.31% from its last peak on November 8. Although both small-cap style indexes did well in the fourth quarter of 2023, the advantage was squarely in small-cap value’s favor, with the Russell 2000® Value Index advancing 15.26% versus 12.75% for the Russell 2000® Growth Index. It’s comparatively
2 | Royce Quant Small-Cap Quality Value ETF 2024 Annual Report |
Table of Contents
rare for small-cap value to best small-cap growth in a positive quarter, particularly one with double-digit gains. It’s happened in 41 of 118 positive, quarters, or 35% of the time since the Russell 2000’s inception on December 31, 1978. It’s worth noting that 2023’s results contributed to something of a sawtooth pattern of relative performance. The Russell 2000® Index Value led for the three-year period (in which the Russell 2000® Growth lost -3.50%) and five-year period while small-cap growth, in addition to its one-year advantage, also outperformed for the 10-year period ended December 31, 2023.
The Russell 2000® Index rose 5.18% in 2024’s opening quarter, trailing the Russell 1000® Index, which gained 10.30%. The large-cap index continued to be dominated by mega-cap stocks, as evidenced by the 11.92% advance for the Russell Top 50® Index in the first quarter of 2024. Once more, returns skewed higher the further up the capitalization scale one went, with the Russell Microcap® Index up 4.68% for the quarter. Yet, in our view, these quarterly results for the U.S. equity indexes do not tell the whole story. From the most recent small-cap low on October 27, 2023, when large-cap indexes were also scuffling, the Russell 2000® Index advanced 30.72% and the Russell 1000® Index was up 28.91%. Moreover, from that low through 2023’s high on December 27, 2023, the small-cap index rose 26.61% versus 17.22% for the Russell 1000®. The Microcap Index was especially strong, rising 30.80% over this 60-day span, while the Russell Top 50 was up “only” 14.77%. It seems clear to us, then, that the first quarter of 2024 was a consolidation period—a common occurrence after particularly sharp short-term rallies—when investors took gains and/or flew back to the—perceived in our estimation—safety of mega-cap stocks. From December 27, 2023 through March 31, 2024, the Russell 2000® Index had a 3.25% gain, while the Russell Microcap® Index was up 2.48%, the Russell 1000® Index rose 9.97%, and the Russell Top 50® Mega Cap Index up 11.60%. Within small-cap, the Russell 2000® Value Index (+26.83%) and Russell 2000® Growth Index (+26.37%) were virtually neck and neck from October 27, 2023 through December 27, 2023. This was somewhat surprising, and certainly encouraging, as small-cap value typically trails in short-term upswings, especially those with dramatic, double-digit gains. This role reversal then held sway into the first quarter, as the small-cap value index was up slightly, 2.90%, while small-cap growth rose 7.58%. This same jockeying for pole position could be seen in longer-term annualized performance periods. The Russell 2000® Index Value was ahead for the three-, and five-year periods ended March 31, 2024 while the Russell 2000® Growth Index led for the one-, and 10-year periods.
Performance review
For the 12 months ended March 31, 2024, Royce Quant Small-Cap Quality Value ETF generated a +18.33% return on a net asset value (“NAV”)viii basis and +18.67% based on its market priceix per share.
The performance table shows the Fund’s total return for the 12 months ended March 31, 2024, based on its NAV and market price as of March 31, 2024. The Fund’s benchmark, the Russell 2000® Index, returned +19.71% over the same time frame.
| Royce Quant Small-Cap Quality Value ETF 2024 Annual Report |
|
3 |
|
Table of Contents
Fund overview (cont’d)
Performance Snapshot as of March 31, 2024 (unaudited) | ||||||||
| Royce Quant Small-Cap Quality Value ETF: | 6 months | 12 months | ||||||
$ 41.52 (NAV) | 16.10 | % | 18.33 | %*† | ||||
$ 41.50 (Market Price) | 16.01 | % | 18.67 | %*‡ | ||||
| Russell 2000® Index | 19.94 | % | 19.71 | % | ||||
The performance shown represents past performance. Past performance is no guarantee of future results and current performance may be higher or lower than the performance shown above. Principal value and investment returns will fluctuate so shares, when sold, may be worth more or less than their original cost. Performance data current to the most recent month-end is available at www.franklintempleton.com.
Investors buy and sell shares of an exchange-traded fund (“ETF”) at market price (not NAV) in the secondary market throughout the trading day. These shares are not individually available for direct purchase from or direct redemption to the ETF. Market price returns shown are typically based upon the official closing price of the Fund’s shares. These returns do not represent investors’ returns had they traded shares at other times. Performance figures for periods shorter than one year represent cumulative figures and are not annualized.
Information showing the Fund’s net asset value, market price, premiums and discounts, and bid-ask spreads for various time periods is available by visiting the Fund’s website at www.franklintempleton.com.
As of the Fund’s current prospectus dated August 1, 2023, the gross total annual fund operating expense ratio for the Fund was 0.60%.
* Total returns are based on changes in NAV or market price, respectively. Returns reflect the deduction of all Fund expenses. Returns do not reflect the deduction of brokerage commissions or taxes that investors pay on distributions or the sale of shares.
† Total return assumes the reinvestment of all distributions, including returns of capital, if any, at NAV.
‡ Total return assumes the reinvestment of all distributions, including returns of capital, if any, at market price, which typically is based upon the official closing price of the Fund’s shares.
Q. What were the leading contributors to performance?
A. Eight of the 11 equity sectors in which the Fund held investments finished the 12-month reporting period ended March 31, 2024 in the black, with the largest contributions coming from Financials, Industrials, and Consumer Discretionary. At the industry level, banks, financial services, and insurance (all in Financials) contributed most for the 12-month period. Relative to the Russell 2000® Index, the Fund benefited from positive stock selection within the Financials and Industrials sectors. Additionally, the Fund benefited relative to the Russell 2000® Index due to exposure to stocks with lower valuation within the small-cap universe.
4 | Royce Quant Small-Cap Quality Value ETF 2024 Annual Report |
Table of Contents
Q. What were the leading detractors from performance?
A. Three of the 11 equity sectors in which the Fund held investments finished the 12-month reporting period ended March 31, 2024 in the red, with the performance detractions coming from Health Care, Consumer Staples, and Communication Services. At the industry level, personal care products (Consumer Staples), media (Communication Services), and health care equipment & supplies (Health Care) detracted most for the 12-month period. Relative to the Russell 2000® Index, Health Care, and Information Technology were the largest detractors due to negative stock selection. The Fund’s relative performance was also hindered by using the short-term momentum factor for timing trades.
Looking for additional information?
The Fund’s daily NAV is available online at www.franklintempleton.com. The Fund is traded under the symbol “SQLV” and its closing market price is available on most financial websites. In a continuing effort to provide information concerning the Fund, shareholders may call 1-877-721-1926 (toll free), Monday through Friday from 8:00 a.m. to 5:30 p.m. Eastern time, for the Fund’s current NAV, market price and other information.
Thank you for your investment in the Royce Quant Small-Cap Quality Value ETF. As always, we appreciate that you have chosen us to manage your assets and we remain focused on achieving the Fund’s investment goals.
Sincerely,
Royce & Associates, LP
April 15, 2024
RISKS: The market values of securities or other assets will fluctuate, sometimes sharply and unpredictably, due to changes in general market conditions, overall economic trends or events, governmental actions or intervention, actions taken by the U.S. Federal Reserve or foreign central banks, market disruptions caused by trade disputes or other factors, political developments, armed conflicts, economic sanctions and countermeasures in response to sanctions, major cybersecurity events, investor sentiment, the global and domestic effects of a pandemic, and other factors that may or may not be related to the issuer of the security or other asset.
The mention of sector breakdowns is for informational purposes only and should not be construed as a recommendation to purchase or sell any securities. The information provided regarding such sectors is not a sufficient basis upon which to make an investment decision. Investors seeking financial advice regarding the appropriateness of investing in any securities or investment strategies discussed should consult their financial professional. The Fund’s top five sector holdings (as a percentage of net assets) as of March 31, 2024 were: health care (18.5%), financials (18.1%), industrials (15.1%), information technology (13.7%) and consumer discretionary (12.1%). The Fund’s composition may differ over time.
All investments involve risks, including possible loss of principal. Equity securities are subject to price fluctuation and possible loss of principal. The Fund invests primarily in small-cap stocks, which may involve considerably more risk than investing in larger-cap stocks. The Fund has significant exposure to U.S. issuers. A decrease in imports or exports, changes in trade regulations
| Royce Quant Small-Cap Quality Value ETF 2024 Annual Report |
|
5 |
|
Table of Contents
Fund overview (cont’d)
and/or an economic recession in the United States may have a material adverse effect on the U.S. economy and the securities listed on U.S. exchanges. The Fund may focus its investments in certain industries, increasing its vulnerability to market volatility. Diversification does not ensure gains or protect against market declines. Please see the Fund’s prospectus for a more complete discussion of these and other risks and the Fund’s investment strategies.
The information provided is not intended to be a forecast of future events, a guarantee of future results or investment advice. Views expressed may differ from those of the firm as a whole.
| i | The Russell 2000®Index measures the performance of the small-cap segment of the U.S. equity universe. The Russell 2000® Index is a subset of the Russell 3000® Index representing approximately 10% of the total market capitalization of that index. It includes approximately 2,000 of the smallest securities based on a combination of their market cap and current index membership. The Russell 3000® Index measures the performance of the 3,000 largest U.S. companies based on total market capitalization, which represents approximately 98% of the U.S. equity market. |
| ii | The Russell 100® Index measures the performance of the large-cap segment of the U.S. equity universe. It is a subset of the Russell 3000® Index and includes approximately 1,000 of the largest securities based on a combination of their market cap and current index membership. The Russell 1000® Index represents approximately 90% of the U.S. market. |
| iii | The Russell Top 50® Index is a market capitalization weighted index of the 50 largest stocks in the Russell 3000® universe of U.S.-based equities. The index can be considered a representation of mega cap stocks. |
| iv | The Nasdaq Composite Index is a stock market index that consists of the stocks that are listed on the Nasdaq stock exchange. |
| v | The Russell Microcap® Index measures the performance of the microcap segment of the U.S. equity market. It makes up less than 3% of the U.S. equity market. It includes 1,000 of the smallest securities in the Russell 2000® Index based on a combination of their market cap and current index membership and it also includes up to the next 1,000 stocks. |
| vi | The Russell 2000® Growth Index measures the performance of the small-cap growth segment of the U.S. equity universe. It includes those Russell 2000 Index companies with higher price-to-book ratios and higher forecasted growth values. The Russell 2000® Value Index measures the performance of those Russell 2000® Index companies with lower price to-book ratios and lower forecasted growth values. (A price-to-book ratio is the price of a stock compared to the difference between a company’s assets and liabilities. |
| vii | The Russell Top 50® Mega Cap Index is a market-capitalization-weighted index of the 50 largest stocks in the broad-based Russell 3000® universe of U.S.-based equities. The Top 50 index therefore is a mega-cap index. |
| viii | Net Asset Value (“NAV”) is calculated by subtracting total liabilities from total assets and dividing the results by the number of shares outstanding. |
| ix | Market Price is determined by supply and demand. It is the price at which an investor purchases or sells shares of the Fund. The Market Price may differ from the Fund’s NAV. |
6 | Royce Quant Small-Cap Quality Value ETF 2024 Annual Report |
Table of Contents
Investment breakdown (%) as a percent of total investments
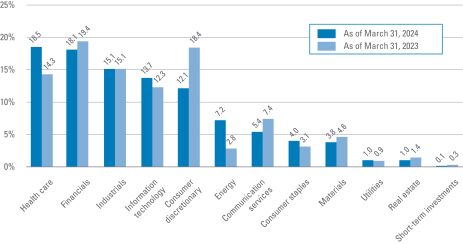
| † | The bar graph above represents the composition of the Fund’s investments as of March 31, 2024 and March 31, 2023. The Fund is actively managed. As a result, the composition of the Fund’s investments is subject to change at any time. |
| Royce Quant Small-Cap Quality Value ETF 2024 Annual Report |
|
7 |
|
Table of Contents
Example
As a shareholder of the Fund, you may incur two types of costs: (1) transaction costs, such as brokerage commissions paid on purchases and sales of Fund shares; and (2) ongoing costs, including management fees; and other Fund expenses. This example is intended to help you understand your ongoing costs (in dollars) of investing in the Fund and to compare these costs with the ongoing costs of investing in other funds.
This example is based on an investment of $1,000 invested on October 1, 2023 and held for the six months ended March 31, 2024.
Actual expenses
The table below titled “Based on actual total return” provides information about actual account values and actual expenses. You may use the information provided in this table, together with the amount you invested, to estimate the expenses that you paid over the period. To estimate the expenses you paid on your account, divide your ending account value by $1,000 (for example, an $8,600 ending account value divided by $1,000 = 8.6), then multiply the result by the number under the heading entitled “Expenses Paid During the Period”.
Hypothetical example for comparison purposes
The table below titled “Based on hypothetical total return” provides information about hypothetical account values and hypothetical expenses based on the actual expense ratio and an assumed rate of return of 5.00% per year before expenses, which is not the Fund’s actual return. The hypothetical account values and expenses may not be used to estimate the actual ending account balance or expenses you paid for the period. You may use the information provided in this table to compare the ongoing costs of investing in the Fund and other funds. To do so, compare the 5.00% hypothetical example relating to the Fund with the 5.00% hypothetical examples that appear in the shareholder reports of the other funds.
Please note that the expenses shown in the table below are meant to highlight your ongoing costs only and do not reflect any transactional costs, such as brokerage commissions paid on purchases and sales of Fund shares. Therefore, the table is useful in comparing ongoing costs only, and will not help you determine the relative total costs of owning different funds. In addition, if these transaction costs were included, your costs would have been higher.
| Based on actual total return1 | Based on hypothetical total return1 | |||||||||||||||||||||||||||||||||||||||||||||||||
| Actual Total Return2 | Beginning Account Value | Ending Account Value | Annualized Expense Ratio | Expenses Paid During the Period3 | Hypothetical Annualized Total Return | Beginning Account Value | Ending Account Value | Annualized Expense Ratio | Expenses Paid During the Period3 | |||||||||||||||||||||||||||||||||||||||||
| 16.10% | $ | 1,000.00 | $ | 1,161.00 | 0.60 | % | $ | 3.24 | 5.00 | % | $1,000.00 | $ | 1,022.00 | 0.60 | % | $ | 3.03 | |||||||||||||||||||||||||||||||||
| 1 | For the six months ended March 31, 2024. |
| 2 | Assumes the reinvestment of all distributions, including returns of capital, if any, at net asset value. Total return is not annualized, as it may not be representative of the total return for the year. Performance figures may reflect fee waivers and/or expense reimbursements. In the absence of fee waivers and/or expense reimbursements, the total return would have been lower. Past performance is no guarantee of future results. |
| 3 | Expenses (net of fee waivers and/or expense reimbursements) are equal to the Fund’s annualized expense ratio multiplied by the average account value over the period, multiplied by the number of days in the most recent fiscal half-year (183), then divided by 366. |
8 | Royce Quant Small-Cap Quality Value ETF 2024 Annual Report |
Table of Contents
| Net Asset Value | ||||
| Average annual total returns1 | ||||
| Twelve Months Ended 3/31/24 | 18.33 | % | ||
| Five Years Ended 3/31/24 | 10.55 | |||
| Inception date of 7/12/17 through 3/31/24 | 9.08 | |||
| Cumulative total returns1 | ||||
| Inception date of 7/12/17 through 3/31/24 | 79.31 | % | ||
| Market Price | ||||
| Average annual total returns2 | ||||
| Twelve Months Ended 3/31/24 | 18.67 | % | ||
| Five Years Ended 3/31/24 | 10.54 | |||
| Inception date of 7/12/17 through 3/31/24 | 9.07 | |||
| Cumulative total returns2 | ||||
| Inception date of 7/12/17 through 3/31/24 | 79.22 | % | ||
All figures represent past performance and are not a guarantee of future results. Investment returns and principal value of an investment will fluctuate so that an investor’s shares, when sold, may be worth more or less than their original cost. NAV returns assume that dividends and capital gain distributions have been reinvested in the Fund at NAV. The returns shown do not reflect the deduction of brokerage commissions or taxes that investors would pay on distributions or the sale of shares. Performance figures may reflect fee waivers and/or expense reimbursements. In the absence of fee waivers and/or expense reimbursements, the total return would have been lower.
Investors buy and sell shares of the Fund at market price, not NAV, in the secondary market throughout the trading day. These shares are not individually available for direct purchase from or direct redemption to the Fund. The Fund’s per share NAV is the value of one share of the Fund and is calculated by dividing the value of total assets less total liabilities by the number of shares outstanding. The NAV return is based on the NAV of the Fund and effective July 1, 2020, market price returns typically are based upon the official closing price of the Fund’s shares. Prior to July 1, 2020, market price returns generally were based upon the mid-point between the bid and ask on the Fund’s principal trading market when the Fund’s NAV was determined, which was typically 4:00 p.m. Eastern time (U.S.). Market price performance reported for periods prior to July 1, 2020 continue to reflect market prices calculated based upon the mid-point between the bid and ask on the Fund’s principal trading market typically as of 4:00 p.m. Eastern time (U.S.). These returns do not represent investors’ returns had they traded shares at other times. NAV and market price returns assume that dividends and capital gain distributions have been reinvested in the Fund at NAV and market price, respectively. As with other exchange-traded funds, NAV returns and market price returns may differ because of factors such as the supply and demand for Fund shares and investors’ assessment of the underlying value of the Fund’s portfolio securities.
| 1 | Assumes the reinvestment of all distributions, including returns of capital, if any, at net asset value. |
| 2 | Assumes the reinvestment of all distributions, including returns of capital, if any, at market price. |
| Royce Quant Small-Cap Quality Value ETF 2024 Annual Report |
|
9 |
|
Table of Contents
Fund performance (unaudited) (cont’d)
Historical performance
Value of $10,000 invested in
Royce Quant Small-Cap Quality Value ETF vs. Russell 2000 Index† — July 12, 2017 - March 31, 2024
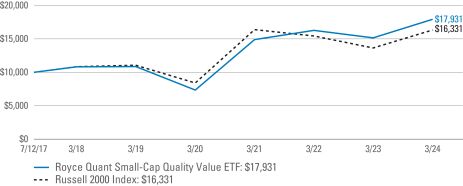
All figures represent past performance and are not a guarantee of future results. Investment returns and principal value of an investment will fluctuate so that an investor’s shares, when sold, may be worth more or less than their original cost. NAV returns assume that dividends and capital gain distributions have been reinvested in the Fund at NAV. The returns shown do not reflect the deduction of brokerage commissions or taxes that investors would pay on distributions or the sale of shares. Performance figures may reflect fee waivers and/or expense reimbursements. In the absence of fee waivers and/or expense reimbursements, the total return would have been lower.
| † | Hypothetical illustration of $10,000 invested in Royce Quant Small-Cap Quality Value ETF on July 12, 2017 (inception date), assuming the reinvestment of all distributions, including returns of capital, if any, at net asset value through March 31, 2024. The hypothetical illustration also assumes a $10,000 investment in the Russell 2000 Index. The Fund’s per share NAV is the value of one share of the Fund and is calculated by dividing the value of total assets less total liabilities by the number of shares outstanding. The NAV return is based on the NAV of the Fund. The Russell 2000 Index (the “Underlying Index”) measures the performance of the small-cap segment of the U.S. equity universe. The Russell 2000 Index is a subset of the Russell 3000 Index representing approximately 10% of the total market capitalization of that index. It includes approximately 2,000 of the smallest securities based on a combination of their market cap and current index membership. The Russell 3000 Index measures the performance of the 3,000 largest U.S. companies based on total market capitalization, which represents approximately 98% of the U.S. equity market. The Underlying Index is based on a proprietary methodology created and sponsored by Royce & Associates, LP, the Fund’s subadviser. The Underlying Index is not subject to the same management and trading expenses as a fund. An index is a statistical composite that tracks a specified financial market, sector, or rules-based investment process. Unlike a fund, an index does not actually hold a portfolio of securities and therefore does not incur the expenses incurred by a fund. These expenses negatively impact fund performance. All index performance reflects no deduction for fees, expenses or taxes. Please note that an investor cannot invest directly in an index. |
Prior to May 10, 2022, the Fund operated as an index-based ETF that sought to track the investment results of the Royce Small-Cap Quality Value Index. |
10 | Royce Quant Small-Cap Quality Value ETF 2024 Annual Report |
Table of Contents
March 31, 2024
Royce Quant Small-Cap Quality Value ETF
(Percentages shown based on Fund net assets)
| Security | Shares | Value | ||||||
| Common Stocks — 99.9% | ||||||||
| Communication Services — 5.4% | ||||||||
Diversified Telecommunication Services — 0.4% | ||||||||
Iridium Communications Inc. | 4,875 | $ | 127,530 | |||||
Entertainment — 0.7% | ||||||||
Playstudios Inc. | 36,139 | 100,466 | * | |||||
Vivid Seats Inc., Class A Shares | 18,034 | 108,024 | * | |||||
Total Entertainment | 208,490 | |||||||
Interactive Media & Services — 1.8% | ||||||||
Shutterstock Inc. | 2,557 | 117,136 | ||||||
Travelzoo | 3,906 | 39,763 | * | |||||
Yelp Inc. | 3,339 | 131,557 | * | |||||
Ziff Davis Inc. | 2,222 | 140,075 | * | |||||
ZipRecruiter Inc., Class A Shares | 8,141 | 93,540 | * | |||||
Total Interactive Media & Services | 522,071 | |||||||
Media — 2.1% | ||||||||
Entravision Communications Corp., Class A Shares | 72,303 | 118,577 | ||||||
Magnite Inc. | 10,260 | 110,295 | * | |||||
Saga Communications Inc., Class A Shares | 3,710 | 82,770 | ||||||
TEGNA Inc. | 12,830 | 191,680 | ||||||
Thryv Holdings Inc. | 4,804 | 106,793 | * | |||||
Total Media | 610,115 | |||||||
Wireless Telecommunication Services — 0.4% | ||||||||
Spok Holdings Inc. | 5,297 | 84,487 | ||||||
SurgePays Inc. | 6,541 | 25,183 | * | |||||
Total Wireless Telecommunication Services | 109,670 | |||||||
Total Communication Services | 1,577,876 | |||||||
| Consumer Discretionary — 12.1% | ||||||||
Diversified Consumer Services — 0.9% | ||||||||
Perdoceo Education Corp. | 6,935 | 121,779 | ||||||
Stride Inc. | 2,190 | 138,079 | * | |||||
Total Diversified Consumer Services | 259,858 | |||||||
Hotels, Restaurants & Leisure — 1.4% | ||||||||
Monarch Casino & Resort Inc. | 1,771 | 132,807 | ||||||
Target Hospitality Corp. | 11,807 | 128,342 | * | |||||
United Parks & Resorts Inc. | 2,499 | 140,469 | * | |||||
Total Hotels, Restaurants & Leisure | 401,618 | |||||||
Household Durables — 2.2% | ||||||||
Cricut Inc., Class A Shares | 30,470 | 145,038 | ||||||
Hamilton Beach Brands Holding Co., Class A Shares | 4,364 | 106,307 | ||||||
Hooker Furnishings Corp. | 4,118 | 98,873 | ||||||
See Notes to Financial Statements.
| Royce Quant Small-Cap Quality Value ETF 2024 Annual Report |
|
11 |
|
Table of Contents
Schedule of investments (cont’d)
March 31, 2024
Royce Quant Small-Cap Quality Value ETF
(Percentages shown based on Fund net assets)
| Security | Shares | Value | ||||||
Household Durables — continued | ||||||||
Smith Douglas Homes Corp. | 4,203 | $ | 124,829 | * | ||||
Worthington Enterprises Inc. | 2,822 | 175,613 | ||||||
Total Household Durables | 650,660 | |||||||
Leisure Products — 2.1% | ||||||||
AMMO Inc. | 32,408 | 89,122 | * | |||||
JAKKS Pacific Inc. | 3,515 | 86,821 | * | |||||
Latham Group Inc. | 38,671 | 153,137 | * | |||||
Marine Products Corp. | 9,293 | 109,193 | ||||||
MasterCraft Boat Holdings Inc. | 4,449 | 105,530 | * | |||||
Solo Brands Inc., Class A Shares | 36,972 | 80,229 | * | |||||
Total Leisure Products | 624,032 | |||||||
Specialty Retail — 3.8% | ||||||||
1-800-Flowers.com Inc., Class A Shares | 10,846 | 117,462 | * | |||||
Buckle Inc. | 4,933 | 198,652 | ||||||
Build-A-Bear Workshop Inc. | 3,881 | 115,926 | ||||||
CarParts.com Inc. | 43,815 | 70,980 | * | |||||
Destination XL Group Inc. | 23,662 | 85,183 | * | |||||
Lands’ End Inc. | 11,299 | 123,046 | * | |||||
ODP Corp. | 3,308 | 175,489 | * | |||||
PetMed Express Inc. | 20,247 | 96,983 | ||||||
Winmark Corp. | 295 | 106,702 | ||||||
Total Specialty Retail | 1,090,423 | |||||||
Textiles, Apparel & Luxury Goods — 1.7% | ||||||||
Carter’s Inc. | 2,000 | 169,360 | ||||||
G-III Apparel Group Ltd. | 4,878 | 141,511 | * | |||||
Superior Group of Cos. Inc. | 6,555 | 108,288 | ||||||
Vera Bradley Inc. | 11,837 | 80,492 | * | |||||
Total Textiles, Apparel & Luxury Goods | 499,651 | |||||||
Total Consumer Discretionary | 3,526,242 | |||||||
| Consumer Staples — 4.0% | ||||||||
Consumer Staples Distribution & Retail — 0.7% | ||||||||
Andersons Inc. | 3,694 | 211,925 | ||||||
Food Products — 1.1% | ||||||||
Cal-Maine Foods Inc. | 3,021 | 177,786 | ||||||
John B Sanfilippo & Son Inc. | 1,234 | 130,705 | ||||||
Total Food Products | 308,491 | |||||||
Personal Care Products — 1.7% | ||||||||
Medifast Inc. | 3,889 | 149,027 | ||||||
Nature’s Sunshine Products Inc. | 4,985 | 103,538 | * | |||||
See Notes to Financial Statements.
12 | Royce Quant Small-Cap Quality Value ETF 2024 Annual Report |
Table of Contents
Royce Quant Small-Cap Quality Value ETF
(Percentages shown based on Fund net assets)
| Security | Shares | Value | ||||||
Personal Care Products — continued | ||||||||
Olaplex Holdings Inc. | 67,782 | $ | 130,141 | * | ||||
USANA Health Sciences Inc. | 2,251 | 109,174 | * | |||||
Total Personal Care Products | 491,880 | |||||||
Tobacco — 0.5% | ||||||||
Vector Group Ltd. | 14,466 | 158,547 | ||||||
Total Consumer Staples | 1,170,843 | |||||||
| Energy — 7.2% | ||||||||
Energy Equipment & Services — 2.2% | ||||||||
Cactus Inc., Class A Shares | 2,921 | 146,313 | ||||||
ProFrac Holding Corp., Class A Shares | 17,686 | 147,855 | * | |||||
Ranger Energy Services Inc. | 7,648 | 86,346 | ||||||
RPC Inc. | 17,130 | 132,586 | ||||||
Select Water Solutions Inc., Class A Shares | 13,530 | 124,882 | ||||||
Total Energy Equipment & Services | 637,982 | |||||||
Oil, Gas & Consumable Fuels — 5.0% | ||||||||
Amplify Energy Corp. | 15,778 | 104,292 | * | |||||
CONSOL Energy Inc. | 2,067 | 173,132 | ||||||
CVR Energy Inc. | 7,295 | 260,140 | ||||||
International Seaways Inc. | 3,346 | 178,007 | ||||||
Overseas Shipholding Group Inc., Class A Shares | 15,062 | 96,397 | ||||||
Par Pacific Holdings Inc. | 4,583 | 169,846 | * | |||||
Peabody Energy Corp. | 8,287 | 201,043 | ||||||
REX American Resources Corp. | 2,368 | 139,025 | * | |||||
SandRidge Energy Inc. | 8,744 | 127,400 | ||||||
Total Oil, Gas & Consumable Fuels | 1,449,282 | |||||||
Total Energy | 2,087,264 | |||||||
| Financials — 18.1% | ||||||||
Banks — 10.4% | ||||||||
Axos Financial Inc. | 2,821 | 152,447 | * | |||||
Bankwell Financial Group Inc. | 1,557 | 40,389 | ||||||
BCB Bancorp Inc. | 9,214 | 96,286 | ||||||
Cathay General Bancorp | 4,615 | 174,585 | ||||||
Civista Bancshares Inc. | 6,323 | 97,248 | ||||||
Evans Bancorp Inc. | 2,783 | 83,100 | ||||||
Financial Institutions Inc. | 5,374 | 101,139 | ||||||
First Financial Corp. | 2,840 | 108,857 | ||||||
Hanmi Financial Corp. | 8,090 | 128,793 | ||||||
Home Bancorp Inc. | 863 | 33,062 | ||||||
International Bancshares Corp. | 3,249 | 182,399 | ||||||
Macatawa Bank Corp. | 9,430 | 92,320 | ||||||
See Notes to Financial Statements.
| Royce Quant Small-Cap Quality Value ETF 2024 Annual Report |
|
13 |
|
Table of Contents
Schedule of investments (cont’d)
March 31, 2024
Royce Quant Small-Cap Quality Value ETF
(Percentages shown based on Fund net assets)
| Security | Shares | Value | ||||||
Banks — continued | ||||||||
MainStreet Bancshares Inc. | 4,208 | $ | 76,417 | |||||
Mercantile Bank Corp. | 3,031 | 116,663 | ||||||
Metropolitan Bank Holding Corp. | 2,544 | 97,944 | * | |||||
Midland States Bancorp Inc. | 5,069 | 127,384 | ||||||
New York Community Bancorp Inc. | 72,382 | 233,070 | ||||||
Northeast Bank | 1,604 | 88,765 | ||||||
Northeast Community Bancorp Inc. | 5,433 | 85,461 | ||||||
Old Second Bancorp Inc. | 7,803 | 107,993 | ||||||
Parke Bancorp Inc. | 5,341 | 91,999 | ||||||
Preferred Bank | 1,736 | 133,273 | ||||||
Premier Financial Corp. | 6,738 | 136,781 | ||||||
S&T Bancorp Inc. | 4,698 | 150,712 | ||||||
South Plains Financial Inc. | 3,662 | 97,995 | ||||||
Summit Financial Group Inc. | 3,836 | 104,186 | ||||||
Unity Bancorp Inc. | 3,144 | 86,774 | ||||||
Total Banks | 3,026,042 | |||||||
Capital Markets — 4.5% | ||||||||
Artisan Partners Asset Management Inc., Class A Shares | 4,436 | 203,036 | ||||||
AssetMark Financial Holdings Inc. | 3,529 | 124,962 | * | |||||
Brightsphere Investment Group Inc. | 3,593 | 82,064 | ||||||
Cohen & Steers Inc. | 2,192 | 168,543 | ||||||
Diamond Hill Investment Group Inc. | 746 | 115,011 | ||||||
Donnelley Financial Solutions Inc. | 1,664 | 103,184 | * | |||||
Federated Hermes Inc. | 4,732 | 170,920 | ||||||
Hamilton Lane Inc., Class A Shares | 1,445 | 162,938 | ||||||
Victory Capital Holdings Inc., Class A Shares | 3,983 | 168,999 | ||||||
Total Capital Markets | 1,299,657 | |||||||
Consumer Finance — 1.3% | ||||||||
Bread Financial Holdings Inc. | 6,059 | 225,637 | ||||||
PROG Holdings Inc. | 4,275 | 147,231 | ||||||
Total Consumer Finance | 372,868 | |||||||
Financial Services — 1.6% | ||||||||
Cass Information Systems Inc. | 2,023 | 97,448 | ||||||
International Money Express Inc. | 4,409 | 100,657 | * | |||||
NMI Holdings Inc., Class A Shares | 4,864 | 157,302 | * | |||||
Payoneer Global Inc. | 24,085 | 117,053 | * | |||||
Total Financial Services | 472,460 | |||||||
Insurance — 0.3% | ||||||||
American Coastal Insurance Corp. | 7,759 | 82,944 | * | |||||
Total Financials | 5,253,971 | |||||||
See Notes to Financial Statements.
14 | Royce Quant Small-Cap Quality Value ETF 2024 Annual Report |
Table of Contents
Royce Quant Small-Cap Quality Value ETF
(Percentages shown based on Fund net assets)
| Security | Shares | Value | ||||||
| Health Care — 18.5% | ||||||||
Biotechnology — 2.7% | ||||||||
Anika Therapeutics Inc. | 2,752 | $ | 69,901 | * | ||||
Arcturus Therapeutics Holdings Inc. | 1,882 | 63,555 | * | |||||
Catalyst Pharmaceuticals Inc. | 5,473 | 87,240 | * | |||||
Dynavax Technologies Corp. | 9,066 | 112,509 | * | |||||
Eagle Pharmaceuticals Inc. | 13,821 | 72,422 | * | |||||
Entrada Therapeutics Inc. | 5,617 | 79,593 | * | |||||
Ironwood Pharmaceuticals Inc. | 12,692 | 110,547 | * | |||||
MiMedx Group Inc. | 8,370 | 64,449 | * | |||||
Puma Biotechnology Inc. | 11,738 | 62,211 | * | |||||
Voyager Therapeutics Inc. | 7,458 | 69,434 | * | |||||
Total Biotechnology | 791,861 | |||||||
Health Care Equipment & Supplies — 5.9% | ||||||||
AngioDynamics Inc. | 14,935 | 87,668 | * | |||||
Atrion Corp. | 207 | 95,955 | ||||||
Avanos Medical Inc. | 5,968 | 118,823 | * | |||||
Envista Holdings Corp. | 7,975 | 170,506 | * | |||||
Haemonetics Corp. | 1,566 | 133,658 | * | |||||
Integer Holdings Corp. | 1,140 | 133,015 | * | |||||
Integra LifeSciences Holdings Corp. | 3,911 | 138,645 | * | |||||
iRadimed Corp. | 1,669 | 73,419 | ||||||
LeMaitre Vascular Inc. | 1,395 | 92,572 | ||||||
Omnicell Inc. | 4,545 | 132,850 | * | |||||
OraSure Technologies Inc. | 11,848 | 72,865 | * | |||||
Semler Scientific Inc. | 1,841 | 53,776 | * | |||||
STAAR Surgical Co. | 2,226 | 85,211 | * | |||||
Tactile Systems Technology Inc. | 4,586 | 74,523 | * | |||||
Utah Medical Products Inc. | 1,089 | 77,439 | ||||||
Varex Imaging Corp. | 6,036 | 109,252 | * | |||||
Zynex Inc. | 4,944 | 61,157 | * | |||||
Total Health Care Equipment & Supplies | 1,711,334 | |||||||
Health Care Providers & Services — 3.8% | ||||||||
Addus HomeCare Corp. | 1,140 | 117,808 | * | |||||
AirSculpt Technologies Inc. | 17,187 | 105,528 | * | |||||
Astrana Health Inc. | 3,028 | 127,146 | * | |||||
CorVel Corp. | 403 | 105,973 | * | |||||
Cross Country Healthcare Inc. | 6,571 | 123,009 | * | |||||
National Research Corp. | 2,360 | 93,480 | ||||||
Owens & Minor Inc. | 7,085 | 196,325 | * | |||||
See Notes to Financial Statements.
| Royce Quant Small-Cap Quality Value ETF 2024 Annual Report |
|
15 |
|
Table of Contents
Schedule of investments (cont’d)
March 31, 2024
Royce Quant Small-Cap Quality Value ETF
(Percentages shown based on Fund net assets)
| Security | Shares | Value | ||||||
Health Care Providers & Services — continued | ||||||||
Pediatrix Medical Group Inc. | 13,544 | $ | 135,846 | * | ||||
PetIQ Inc. | 5,630 | 102,916 | * | |||||
Total Health Care Providers & Services | 1,108,031 | |||||||
Health Care Technology — 0.3% | ||||||||
HealthStream Inc. | 3,271 | 87,205 | ||||||
Life Sciences Tools & Services — 0.8% | ||||||||
Cytek Biosciences Inc. | 11,350 | 76,158 | * | |||||
Maravai LifeSciences Holdings Inc., Class A Shares | 16,437 | 142,509 | * | |||||
OmniAb Inc., $12.50 EARNOUT | 298 | 0 | *(a)(b)(c)(d) | |||||
OmniAb Inc., $15.00 EARNOUT | 298 | 0 | *(a)(b)(c)(d) | |||||
Total Life Sciences Tools & Services | 218,667 | |||||||
Pharmaceuticals — 5.0% | ||||||||
Amphastar Pharmaceuticals Inc. | 2,446 | 107,404 | * | |||||
ANI Pharmaceuticals Inc. | 1,311 | 90,629 | * | |||||
Assertio Holdings Inc. | 75,809 | 72,724 | * | |||||
Biote Corp., Class A Shares | 14,290 | 82,882 | * | |||||
Collegium Pharmaceutical Inc. | 2,829 | 109,822 | * | |||||
Corcept Therapeutics Inc. | 4,472 | 112,650 | * | |||||
Harmony Biosciences Holdings Inc. | 3,633 | 121,996 | * | |||||
Innoviva Inc. | 8,281 | 126,202 | * | |||||
Journey Medical Corp. | 12,654 | 46,567 | * | |||||
Ligand Pharmaceuticals Inc. | 1,431 | 104,606 | * | |||||
Pacira BioSciences Inc. | 3,795 | 110,890 | * | |||||
Phibro Animal Health Corp., Class A Shares | 8,336 | 107,784 | ||||||
Prestige Consumer Healthcare Inc. | 1,900 | 137,864 | * | |||||
Supernus Pharmaceuticals Inc. | 3,568 | 121,705 | * | |||||
Total Pharmaceuticals | 1,453,725 | |||||||
Total Health Care | 5,370,823 | |||||||
| Industrials — 15.1% | ||||||||
Aerospace & Defense — 0.8% | ||||||||
National Presto Industries Inc. | 1,509 | 126,454 | ||||||
Park Aerospace Corp. | 5,356 | 89,070 | ||||||
Total Aerospace & Defense | 215,524 | |||||||
Air Freight & Logistics — 0.8% | ||||||||
Forward Air Corp. | 4,639 | 144,319 | ||||||
Radiant Logistics Inc. | 17,871 | 96,861 | * | |||||
Total Air Freight & Logistics | 241,180 | |||||||
Building Products — 1.4% | ||||||||
Gibraltar Industries Inc. | 1,611 | 129,734 | * | |||||
See Notes to Financial Statements.
16 | Royce Quant Small-Cap Quality Value ETF 2024 Annual Report |
Table of Contents
Royce Quant Small-Cap Quality Value ETF
(Percentages shown based on Fund net assets)
| Security | Shares | Value | ||||||
Building Products — continued | ||||||||
Insteel Industries Inc. | 3,528 | $ | 134,840 | |||||
Quanex Building Products Corp. | 3,354 | 128,894 | ||||||
Total Building Products | 393,468 | |||||||
Commercial Services & Supplies — 2.4% | ||||||||
ARC Document Solutions Inc. | 32,314 | 89,510 | ||||||
Civeo Corp. | 3,931 | 105,547 | ||||||
Ennis Inc. | 5,599 | 114,836 | ||||||
Liquidity Services Inc. | 4,643 | 86,360 | * | |||||
Quad/Graphics Inc. | 24,231 | 128,667 | ||||||
Steelcase Inc., Class A Shares | 11,895 | 155,586 | ||||||
Total Commercial Services & Supplies | 680,506 | |||||||
Construction & Engineering — 0.8% | ||||||||
Argan Inc. | 2,183 | 110,329 | ||||||
Sterling Infrastructure Inc. | 1,177 | 129,835 | * | |||||
Total Construction & Engineering | 240,164 | |||||||
Electrical Equipment — 1.8% | ||||||||
Encore Wire Corp. | 732 | 192,355 | ||||||
NEXTracker Inc., Class A Shares | 2,534 | 142,588 | * | |||||
Powell Industries Inc. | 685 | 97,476 | ||||||
Preformed Line Products Co. | 747 | 96,116 | ||||||
Total Electrical Equipment | 528,535 | |||||||
Ground Transportation — 1.7% | ||||||||
Avis Budget Group Inc. | 1,661 | 203,406 | ||||||
Hertz Global Holdings Inc. | 24,515 | 191,953 | * | |||||
PAM Transportation Services Inc. | 6,392 | 103,614 | * | |||||
Total Ground Transportation | 498,973 | |||||||
Machinery — 2.6% | ||||||||
Atmus Filtration Technologies Inc. | 4,495 | 144,964 | * | |||||
Commercial Vehicle Group Inc. | 14,648 | 94,187 | * | |||||
Omega Flex Inc. | 1,193 | 84,619 | ||||||
Terex Corp. | 2,914 | 187,662 | ||||||
Titan International Inc. | 9,175 | 114,320 | * | |||||
Wabash National Corp. | 4,703 | 140,808 | ||||||
Total Machinery | 766,560 | |||||||
Professional Services — 1.5% | ||||||||
Kforce Inc. | 1,718 | 121,153 | ||||||
Korn Ferry | 2,540 | 167,031 | ||||||
RCM Technologies Inc. | 2,257 | 48,232 | * | |||||
Resources Connection Inc. | 8,345 | 109,820 | ||||||
Total Professional Services | 446,236 | |||||||
See Notes to Financial Statements.
| Royce Quant Small-Cap Quality Value ETF 2024 Annual Report |
|
17 |
|
Table of Contents
Schedule of investments (cont’d)
March 31, 2024
Royce Quant Small-Cap Quality Value ETF
(Percentages shown based on Fund net assets)
| Security | Shares | Value | ||||||
Trading Companies & Distributors — 1.3% | ||||||||
BlueLinx Holdings Inc. | 1,241 | $ | 161,628 | * | ||||
Global Industrial Co. | 2,802 | 125,474 | ||||||
Karat Packaging Inc. | 2,963 | 84,771 | ||||||
Total Trading Companies & Distributors | 371,873 | |||||||
Total Industrials | 4,383,019 | |||||||
| Information Technology — 13.7% | ||||||||
Communications Equipment — 1.4% | ||||||||
Extreme Networks Inc. | 9,631 | 111,142 | * | |||||
Lantronix Inc. | 14,207 | 50,577 | * | |||||
NETGEAR Inc. | 6,720 | 105,974 | * | |||||
NetScout Systems Inc. | 5,769 | 125,995 | * | |||||
Total Communications Equipment | 393,688 | |||||||
Electronic Equipment, Instruments & Components — 3.7% | ||||||||
Bel Fuse Inc., Class B Shares | 1,725 | 104,035 | ||||||
Climb Global Solutions Inc. | 1,113 | 78,890 | ||||||
CTS Corp. | 2,422 | 113,325 | ||||||
Daktronics Inc. | 8,965 | 89,291 | * | |||||
ePlus Inc. | 1,517 | 119,145 | * | |||||
M-Tron Industries Inc. | 886 | 26,580 | * | |||||
PC Connection Inc. | 2,129 | 140,365 | ||||||
Sanmina Corp. | 2,682 | 166,767 | * | |||||
Vishay Intertechnology Inc. | 7,265 | 164,770 | ||||||
Vishay Precision Group Inc. | 2,400 | 84,792 | * | |||||
Total Electronic Equipment, Instruments & Components | 1,087,960 | |||||||
IT Services — 1.4% | ||||||||
DXC Technology Co. | 10,642 | 225,717 | * | |||||
Hackett Group Inc. | 3,674 | 89,278 | ||||||
Unisys Corp. | 20,153 | 98,951 | * | |||||
Total IT Services | 413,946 | |||||||
Semiconductors & Semiconductor Equipment — 1.8% | ||||||||
Cohu Inc. | 3,668 | 122,255 | * | |||||
inTEST Corp. | 5,279 | 69,947 | * | |||||
NVE Corp. | 1,015 | 91,533 | ||||||
Photronics Inc. | 4,117 | 116,593 | * | |||||
SMART Global Holdings Inc. | 5,013 | 131,942 | * | |||||
Total Semiconductors & Semiconductor Equipment | 532,270 | |||||||
Software — 4.1% | ||||||||
A10 Networks Inc. | 6,423 | 87,931 | ||||||
Adeia Inc. | 13,283 | 145,050 | ||||||
American Software Inc., Class A Shares | 7,768 | 88,944 | ||||||
See Notes to Financial Statements.
18 | Royce Quant Small-Cap Quality Value ETF 2024 Annual Report |
Table of Contents
Royce Quant Small-Cap Quality Value ETF
(Percentages shown based on Fund net assets)
| Security | Shares | Value | ||||||
Software — continued | ||||||||
Clear Secure Inc., Class A Shares | 6,171 | $ | 131,257 | |||||
Consensus Cloud Solutions Inc. | 12,149 | 192,683 | * | |||||
CoreCard Corp. | 4,329 | 47,835 | * | |||||
InterDigital Inc. | 1,301 | 138,505 | ||||||
Mitek Systems Inc. | 6,492 | 91,537 | * | |||||
Progress Software Corp. | 2,418 | 128,904 | ||||||
Teradata Corp. | 3,635 | 140,565 | * | |||||
Total Software | 1,193,211 | |||||||
Technology Hardware, Storage & Peripherals — 1.3% | ||||||||
CPI Card Group Inc. | 3,622 | 64,689 | * | |||||
Immersion Corp. | 9,696 | 72,526 | ||||||
Xerox Holdings Corp. | 12,587 | 225,308 | ||||||
Total Technology Hardware, Storage & Peripherals | 362,523 | |||||||
Total Information Technology | 3,983,598 | |||||||
| Materials — 3.8% | ||||||||
Chemicals — 1.1% | ||||||||
Core Molding Technologies Inc. | 3,749 | 70,969 | * | |||||
Hawkins Inc. | 1,493 | 114,662 | ||||||
LSB Industries Inc. | 15,270 | 134,071 | * | |||||
Total Chemicals | 319,702 | |||||||
Metals & Mining — 1.7% | ||||||||
Arch Resources Inc. | 1,215 | 195,360 | ||||||
Olympic Steel Inc. | 1,859 | 131,766 | ||||||
Ryerson Holding Corp. | 5,183 | 173,630 | ||||||
Total Metals & Mining | 500,756 | |||||||
Paper & Forest Products — 1.0% | ||||||||
Clearwater Paper Corp. | 3,062 | 133,901 | * | |||||
Sylvamo Corp. | 2,677 | 165,278 | ||||||
Total Paper & Forest Products | 299,179 | |||||||
Total Materials | 1,119,637 | |||||||
| Real Estate — 1.0% | ||||||||
Real Estate Management & Development — 1.0% | ||||||||
Forestar Group Inc. | 3,451 | 138,696 | * | |||||
RMR Group Inc., Class A Shares | 5,794 | 139,056 | ||||||
Total Real Estate | 277,752 | |||||||
See Notes to Financial Statements.
| Royce Quant Small-Cap Quality Value ETF 2024 Annual Report |
|
19 |
|
Table of Contents
Schedule of investments (cont’d)
March 31, 2024
Royce Quant Small-Cap Quality Value ETF
(Percentages shown based on Fund net assets)
| Security | Shares | Value | ||||||||||
| Utilities — 1.0% | ||||||||||||
Electric Utilities — 1.0% | ||||||||||||
ALLETE Inc. | 3,141 | $ | 187,329 | |||||||||
Genie Energy Ltd., Class B Shares | 6,016 | 90,722 | ||||||||||
Total Utilities | 278,051 | |||||||||||
Total Investments before Short-Term Investments (Cost — $27,906,456) | 29,029,076 | |||||||||||
| Rate | ||||||||||||
| Short-Term Investments — 0.1% | ||||||||||||
Dreyfus Treasury Obligations Cash Management Fund, Institutional Class | 5.202 | % | 24,924 | 24,924 | (e) | |||||||
Total Investments — 100.0% (Cost — $27,931,380) | 29,054,000 | |||||||||||
Other Assets in Excess of Liabilities — 0.0%†† | 9,854 | |||||||||||
Total Net Assets — 100.0% | $ | 29,063,854 | ||||||||||
| †† | Represents less than 0.1%. |
| * | Non-income producing security. |
| (a) | Security is fair valued in accordance with procedures approved by the Board of Trustees (Note 1). |
| (b) | Security is valued using significant unobservable inputs (Note 1). |
| (c) | Value is less than $1. |
| (d) | Restricted security (Note 6). |
| (e) | Rate shown is one-day yield as of the end of the reporting period. |
See Notes to Financial Statements.
20 | Royce Quant Small-Cap Quality Value ETF 2024 Annual Report |
Table of Contents
Statement of assets and liabilities
March 31, 2024
| Assets: | ||||
Investments, at value (Cost — $27,931,380) | $ | 29,054,000 | ||
Dividends receivable | 24,459 | |||
Total Assets | 29,078,459 | |||
| Liabilities: | ||||
Investment management fee payable | 14,605 | |||
Total Liabilities | 14,605 | |||
| Total Net Assets | $ | 29,063,854 | ||
| Net Assets: | ||||
Par value (Note 5) | $ | 7 | ||
Paid-in capital in excess of par value | 33,764,589 | |||
Total distributable earnings (loss) | (4,700,742) | |||
| Total Net Assets | $ | 29,063,854 | ||
| Shares Outstanding | 700,000 | |||
| Net Asset Value | $41.52 | |||
See Notes to Financial Statements.
| Royce Quant Small-Cap Quality Value ETF 2024 Annual Report |
|
21 |
|
Table of Contents
For the Year Ended March 31, 2024
| Investment Income: | ||||
Dividends | $ | 504,562 | ||
Less: Foreign taxes withheld | (754) | |||
Total Investment Income | 503,808 | |||
| Expenses: | ||||
Investment management fee (Note 2) | 163,427 | |||
Total Expenses | 163,427 | |||
| Net Investment Income | 340,381 | |||
| Realized and Unrealized Gain on Investments (Notes 1 and 3): | ||||
Net Realized Gain From Investment Transactions | 2,987,154 | |||
Change in Net Unrealized Appreciation (Depreciation) From Investments | 1,237,689 | |||
| Net Gain on Investments | 4,224,843 | |||
| Increase in Net Assets From Operations | $ | 4,565,224 | ||
See Notes to Financial Statements.
22 | Royce Quant Small-Cap Quality Value ETF 2024 Annual Report |
Table of Contents
Statements of changes in net assets
| For the Years Ended March 31, | 2024 | 2023 | ||||||
| Operations: | ||||||||
Net investment income | $ | 340,381 | $ | 294,254 | ||||
Net realized gain (loss) | 2,987,154 | (887,964) | ||||||
Change in net unrealized appreciation (depreciation) | 1,237,689 | (918,740) | ||||||
Increase (Decrease) in Net Assets From Operations | 4,565,224 | (1,512,450) | ||||||
| Distributions to Shareholders From (Note 1): | ||||||||
Total distributable earnings | (321,630) | (300,658) | ||||||
Return of capital | — | (11,796) | ||||||
Decrease in Net Assets From Distributions to Shareholders | (321,630) | (312,454) | ||||||
| Fund Share Transactions (Note 5): | ||||||||
Net proceeds from sale of shares (200,000 and 450,000 shares issued, respectively) | 7,722,056 | 16,112,292 | ||||||
Cost of shares repurchased (200,000 and 250,000 shares repurchased, respectively) | (7,750,716) | (8,758,342) | ||||||
Increase (Decrease) in Net Assets From Fund Share Transactions | (28,660) | 7,353,950 | ||||||
Increase in Net Assets | 4,214,934 | 5,529,046 | ||||||
| Net Assets: | ||||||||
Beginning of year | 24,848,920 | 19,319,874 | ||||||
End of year | $ | 29,063,854 | $ | 24,848,920 | ||||
See Notes to Financial Statements.
| Royce Quant Small-Cap Quality Value ETF 2024 Annual Report |
|
23 |
|
Table of Contents
| For a share of beneficial interest outstanding throughout each year ended March 31, unless otherwise noted: | ||||||||||||||||||||||||
| 20241 | 20231 | 20221,2 | 20211,3 | 20201,3 | 20191,3 | |||||||||||||||||||
| Net asset value, beginning of period | $35.50 | $38.64 | $37.85 | $22.80 | $26.21 | $30.06 | ||||||||||||||||||
| Income (loss) from operations: | ||||||||||||||||||||||||
Net investment income | 0.47 | 0.47 | 0.36 | 0.35 | 0.35 | 0.35 | ||||||||||||||||||
Net realized and unrealized gain (loss) | 5.99 | (3.15) | 0.82 | 15.03 | (3.42) | (3.77) | ||||||||||||||||||
Total income (loss) from operations | 6.46 | (2.68) | 1.18 | 15.38 | (3.07) | (3.42) | ||||||||||||||||||
| Less distributions from: | ||||||||||||||||||||||||
Net investment income | (0.44) | (0.44) | (0.39) | (0.33) | (0.34) | (0.43) | ||||||||||||||||||
Return of capital | — | (0.02) | — | — | — | — | ||||||||||||||||||
Total distributions | (0.44) | (0.46) | (0.39) | (0.33) | (0.34) | (0.43) | ||||||||||||||||||
| Net asset value, end of period | $41.52 | $35.50 | $38.64 | $37.85 | $22.80 | $26.21 | ||||||||||||||||||
Total return, based on NAV4 | 18.33 | % | (6.88) | % | 3.15 | % | 67.77 | % | (11.71) | % | (11.29) | % | ||||||||||||
| Net assets, end of period (000s) | $29,064 | $24,849 | $19,320 | $17,031 | $11,402 | $10,483 | ||||||||||||||||||
| Ratios to average net assets: | ||||||||||||||||||||||||
Gross expenses | 0.60 | % | 0.60 | % | 0.60 | %5 | 0.60 | % | 0.60 | % | 0.60 | % | ||||||||||||
Net expenses | 0.60 | 0.60 | 0.60 | 5 | 0.60 | 0.60 | 0.60 | |||||||||||||||||
Net investment income | 1.25 | 1.33 | 1.39 | 5 | 1.13 | 1.46 | 1.30 | |||||||||||||||||
| Portfolio turnover rate6 | 101 | % | 51 | % | 73 | % | 99 | % | 95 | % | 87 | % | ||||||||||||
| 1 | Per share amounts have been calculated using the average shares method. |
| 2 | For the period August 1, 2021 through March 31, 2022. |
| 3 | For the year ended July 31. |
| 4 | Performance figures may reflect fee waivers and/or expense reimbursements. In the absence of fee waivers and/or expense reimbursements, the total return would have been lower. The total return calculation assumes that distributions are reinvested at NAV. Past performance is no guarantee of future results. Total returns for periods of less than one year are not annualized. |
| 5 | Annualized. |
| 6 | Portfolio turnover excludes the value of portfolio securities received or delivered as a result of in-kind fund share transactions. |
See Notes to Financial Statements.
24 | Royce Quant Small-Cap Quality Value ETF 2024 Annual Report |
Table of Contents
1. Organization and significant accounting policies
Royce Quant Small-Cap Quality Value ETF (the “Fund”) is a separate diversified investment series of Legg Mason ETF Investment Trust (the “Trust”). The Trust, a Maryland statutory trust, is registered under the Investment Company Act of 1940, as amended (the “1940 Act”), as an open-end management investment company.
The Fund is an actively managed exchange-traded fund (“ETF”). ETFs are funds that trade like other publicly-traded securities. Unlike shares of a mutual fund, which can be bought from and redeemed by the issuing fund by all shareholders at a price based on net asset value (“NAV”), shares of the Fund may be directly purchased from and redeemed by the Fund at NAV solely by certain large institutional investors who have entered into agreements with the Fund’s distributor (“Authorized Participants”). Also unlike shares of a mutual fund, shares of the Fund are listed on a national securities exchange and trade in the secondary market at market prices that change throughout the day.
Shares of the Fund are listed and traded at market prices on NASDAQ. The market price for the Fund’s shares may be different from the Fund’s NAV. The Fund issues and redeems shares at NAV only in blocks of a specified number of shares or multiples thereof (“Creation Units”). Only Authorized Participants may purchase or redeem Creation Units directly with the Fund at NAV. Creation Units are created and redeemed principally in-kind (although under some circumstances its shares are created and redeemed partially for cash). Except when aggregated in Creation Units, shares of the Fund are not redeemable securities. Shareholders who are not Authorized Participants may not redeem shares directly from the Funds at NAV.
The Fund seeks to achieve long-term growth of capital.
The Fund follows the accounting and reporting guidance in Financial Accounting Standards Board (“FASB”) Accounting Standards Codification Topic 946, Financial Services –Investment Companies (“ASC 946”). The following are significant accounting policies consistently followed by the Fund and are in conformity with U.S. generally accepted accounting principles (“GAAP”), including, but not limited to, ASC 946. Estimates and assumptions are required to be made regarding assets, liabilities and changes in net assets resulting from operations when financial statements are prepared. Changes in the economic environment, financial markets and any other parameters used in determining these estimates could cause actual results to differ. Subsequent events have been evaluated through the date the financial statements were issued.
(a) Investment valuation. Equity securities for which market quotations are available are valued at the last reported sales price or official closing price on the primary market or exchange on which they trade. The valuations for fixed income securities (which may include, but are not limited to, corporate, government, municipal, mortgage-backed, collateralized mortgage obligations and asset-backed securities) and certain derivative instruments are typically the prices supplied by independent third party pricing services, which may use market prices or broker/dealer quotations or a variety of valuation techniques and methodologies. The independent third party pricing services typically use
| Royce Quant Small-Cap Quality Value ETF 2024 Annual Report |
|
25 |
|
Table of Contents
Notes to financial statements (cont’d)
inputs that are observable such as issuer details, interest rates, yield curves, prepayment speeds, credit risks/spreads, default rates and quoted prices for similar securities. Investments in open-end funds are valued at the closing net asset value per share of each fund on the day of valuation. When the Fund holds securities or other assets that are denominated in a foreign currency, the Fund will use the currency exchange rates, generally determined as of 4:00 p.m. (London Time). If independent third party pricing services are unable to supply prices for a portfolio investment, or if the prices supplied are deemed by the manager to be unreliable, the market price may be determined by the manager using quotations from one or more broker/dealers or at the transaction price if the security has recently been purchased and no value has yet been obtained from a pricing service or pricing broker. When reliable prices are not readily available, such as when the value of a security has been significantly affected by events after the close of the exchange or market on which the security is principally traded, but before the Fund calculates its net asset value, the Fund values these securities as determined in accordance with procedures approved by the Fund’s Board of Trustees.
Pursuant to policies adopted by the Board of Trustees, the Fund’s manager has been designated as the valuation designee and is responsible for the oversight of the daily valuation process. The Fund’s manager is assisted by the Global Fund Valuation Committee (the “Valuation Committee”). The Valuation Committee is responsible for making fair value determinations, evaluating the effectiveness of the Fund’s pricing policies, and reporting to the Fund’s manager and the Board of Trustees. When determining the reliability of third party pricing information for investments owned by the Fund, the Valuation Committee, among other things, conducts due diligence reviews of pricing vendors, monitors the daily change in prices and reviews transactions among market participants.
The Valuation Committee will consider pricing methodologies it deems relevant and appropriate when making fair value determinations. Examples of possible methodologies include, but are not limited to, multiple of earnings; discount from market of a similar freely traded security; discounted cash-flow analysis; book value or a multiple thereof; risk premium/yield analysis; yield to maturity; and/or fundamental investment analysis. The Valuation Committee will also consider factors it deems relevant and appropriate in light of the facts and circumstances. Examples of possible factors include, but are not limited to, the type of security; the issuer’s financial statements; the purchase price of the security; the discount from market value of unrestricted securities of the same class at the time of purchase; analysts’ research and observations from financial institutions; information regarding any transactions or offers with respect to the security; the existence of merger proposals or tender offers affecting the security; the price and extent of public trading in similar securities of the issuer or comparable companies; and the existence of a shelf registration for restricted securities.
For each portfolio security that has been fair valued pursuant to the policies adopted by the Board of Trustees, the fair value price is compared against the last available and next
26 | Royce Quant Small-Cap Quality Value ETF 2024 Annual Report |
Table of Contents
available market quotations. The Valuation Committee reviews the results of such back testing monthly and fair valuation occurrences are reported to the Board of Trustees quarterly.
The Fund uses valuation techniques to measure fair value that are consistent with the market approach and/or income approach, depending on the type of security and the particular circumstance. The market approach uses prices and other relevant information generated by market transactions involving identical or comparable securities. The income approach uses valuation techniques to discount estimated future cash flows to present value.
GAAP establishes a disclosure hierarchy that categorizes the inputs to valuation techniques used to value assets and liabilities at measurement date. These inputs are summarized in the three broad levels listed below:
| • | Level 1 — unadjusted quoted prices in active markets for identical investments |
| • | Level 2 — other significant observable inputs (including quoted prices for similar investments, interest rates, prepayment speeds, credit risk, etc.) |
| • | Level 3 — significant unobservable inputs (including the Fund’s own assumptions in determining the fair value of investments) |
The inputs or methodologies used to value securities are not necessarily an indication of the risk associated with investing in those securities.
The following is a summary of the inputs used in valuing the Fund’s assets carried at fair value:
ASSETS | ||||||||||||||||
| Description | Quoted Prices (Level 1) | Other Significant Observable Inputs (Level 2) | Significant Unobservable Inputs (Level 3) | Total | ||||||||||||
| Long-Term Investments†: | ||||||||||||||||
Common Stocks: | ||||||||||||||||
Health Care | $ | 5,370,823 | — | $ | 0 | * | $ | 5,370,823 | ||||||||
Other Common Stocks | 23,658,253 | — | — | 23,658,253 | ||||||||||||
| Total Long-Term Investments | 29,029,076 | — | 0 | * | 29,029,076 | |||||||||||
| Short-Term Investments† | 24,924 | — | — | 24,924 | ||||||||||||
| Total Investments | $ | 29,054,000 | — | $ | 0 | * | $ | 29,054,000 | ||||||||
| † | See Schedule of Investments for additional detailed categorizations. |
| * | Amount represents less than $1. |
(b) Foreign investment risks. The Fund’s investments in foreign securities may involve risks not present in domestic investments. Since securities may be denominated in foreign currencies, may require settlement in foreign currencies or may pay interest or dividends in foreign currencies, changes in the relationship of these foreign currencies to the U.S. dollar can significantly affect the value of the investments and earnings of the Fund. Foreign
| Royce Quant Small-Cap Quality Value ETF 2024 Annual Report |
|
27 |
|
Table of Contents
Notes to financial statements (cont’d)
investments may also subject the Fund to foreign government exchange restrictions, expropriation, taxation or other political, social or economic developments, all of which affect the market and/or credit risk of the investments.
(c) Security transactions and investment income. Security transactions are accounted for on a trade date basis. Interest income (including interest income from payment-in-kind securities) is recorded on the accrual basis. Amortization of premiums and accretion of discounts on debt securities are recorded to interest income over the lives of the respective securities, except for premiums on certain callable debt securities, which are amortized to the earliest call date. Dividend income is recorded on the ex-dividend date for dividends received in cash and/or securities. Foreign dividend income is recorded on the ex-dividend date or as soon as practicable after the Fund determines the existence of a dividend declaration after exercising reasonable due diligence. The cost of investments sold is determined by use of the specific identification method. To the extent any issuer defaults or a credit event occurs that impacts the issuer, the Fund may halt any additional interest income accruals and consider the realizability of interest accrued up to the date of default or credit event.
(d) Distributions to shareholders. Distributions from net investment income of the Fund, if any, are declared and paid on a quarterly basis. Distributions of net realized gains, if any, are declared at least annually. Distributions to shareholders of the Fund are recorded on the ex-dividend date and are determined in accordance with income tax regulations, which may differ from GAAP.
(e) Federal and other taxes. It is the Fund’s policy to comply with the federal income and excise tax requirements of the Internal Revenue Code of 1986 (the “Code”), as amended, applicable to regulated investment companies. Accordingly, the Fund intends to distribute its taxable income and net realized gains, if any, to shareholders in accordance with timing requirements imposed by the Code. Therefore, no federal or state income tax provision is required in the Fund’s financial statements.
Management has analyzed the Fund’s tax positions taken on income tax returns for all open tax years and has concluded that as of March 31, 2024, no provision for income tax is required in the Fund’s financial statements. The Fund’s federal and state income and federal excise tax returns for tax years for which the applicable statutes of limitations have not expired are subject to examination by the Internal Revenue Service and state departments of revenue.
Under the applicable foreign tax laws, a withholding tax may be imposed on interest, dividends and capital gains at various rates.
(f) Reclassification. GAAP requires that certain components of net assets be reclassified to reflect permanent differences between financial and tax reporting. These
28 | Royce Quant Small-Cap Quality Value ETF 2024 Annual Report |
Table of Contents
reclassifications have no effect on net assets or net asset value per share. During the current year, the following reclassifications have been made:
| Total Distributable Earnings (Loss) | Paid-in Capital | |||||||
| (a) | $ | (2,521,636) | $ | 2,521,636 | ||||
| (a) | Reclassifications are due to book/tax differences in the treatment of an in-kind distribution of securities. |
2. Investment management agreement and other transactions with affiliates
Franklin Templeton Fund Adviser, LLC (“FTFA”) (formerly known as Legg Mason Partners Fund Advisor, LLC (“LMPFA”) prior to November 30, 2023) is the Fund’s investment manager and Royce & Associates, LP (“Royce”) is the Fund’s subadviser. Western Asset Management Company, LLC (“Western Asset”) manages the portion of the Fund’s cash and short-term instruments allocated to it. FTFA, Western Asset, and Royce are subsidiaries of Franklin Resources, Inc. (“Franklin Resources”).
FTFA provides administrative and certain oversight services to the Fund. FTFA delegates to the subadviser the day-to-day portfolio management of the Fund. The Fund is responsible for paying interest expenses, taxes, brokerage expenses, future 12b-1 fees (if any), acquired fund fees and expenses, extraordinary expenses and the management fee payable to FTFA under the investment management agreement.
Under the investment management agreement and subject to the general supervision of the Fund’s Board of Trustees, FTFA provides or causes to be furnished all investment management, supervisory, administrative and other services reasonably necessary for the operation of the Fund, including certain distribution services (provided pursuant to a separate distribution agreement) and investment advisory services (provided pursuant to separate subadvisory agreements) under a unitary fee structure. The Fund pays an investment management fee, calculated daily and paid monthly, at an annual rate of 0.60% of the Fund’s average daily net assets.
As compensation for its subadvisory services, FTFA pays Royce monthly 90% of the management fee paid by Fund to FTFA, net of (i) all fees and expenses incurred by FTFA under the investment management agreement (including without limitation any subadvisory fee paid to another subadviser to the Fund) and (ii) expense waivers, if any, and reimbursements. FTFA pays Western Asset monthly a fee of 0.02% of the portion of the Fund’s average daily net assets allocated to Western Asset for the management of cash and other short-term instruments, net of expense waivers, if any, and reimbursements.
Franklin Distributors, LLC (“Franklin Distributors”) serves as the distributor of Creation Units for the Fund on an agency basis. Franklin Distributors is an indirect, wholly-owned broker-dealer subsidiary of Franklin Resources.
The Fund’s Board of Trustees has adopted a Rule 12b-1 shareholder services and distribution plan and under that plan, the Fund is authorized to pay service and/or distribution fees calculated at an annual rate of up to 0.25% of its average daily net assets.
| Royce Quant Small-Cap Quality Value ETF 2024 Annual Report |
|
29 |
|
Table of Contents
Notes to financial statements (cont’d)
No service and/or distribution fees are currently paid by the Fund, and there are no current plans to impose these fees.
All officers and one Trustee of the Trust are employees of Franklin Resources or its affiliates and do not receive compensation from the Trust.
3. Investments
During the year ended March 31, 2024, the aggregate cost of purchases and proceeds from sales of investments (excluding in-kind transactions and short-term investments) were as follows:
| Purchases | $ | 27,390,067 | ||
| Sales | 27,273,682 |
During the year ended March 31, 2024, in-kind transactions (Note 5) were as follows:
| Contributions | $ | 7,662,301 | ||
| Redemptions | 7,712,478 | |||
| Realized gain (loss)* | 2,580,784 |
| * | Net realized gains on redemptions in-kind are not taxable to the remaining shareholders of the Fund. |
The in-kind contributions and in-kind redemptions shown in this table may not agree with the Fund Share Transactions on the Statement of Changes in Net Assets. This table represents the accumulation of the Fund’s daily net shareholder transactions while the Statement of Changes in Net Assets reflects gross shareholder transactions including any cash component of the transactions.
At March 31, 2024, the aggregate cost of investments and the aggregate gross unrealized appreciation and depreciation of investments for federal income tax purposes were as follows:
| Cost | Gross Unrealized Appreciation | Gross Unrealized Depreciation | Net Unrealized Appreciation | |||||||||||||
| Securities | $ | 28,192,815 | $ | 2,634,077 | $ | (1,772,892) | $ | 861,185 | ||||||||
4. Derivative instruments and hedging activities
During the year ended March 31, 2024, the Fund did not invest in derivative instruments.
5. Fund share transactions
At March 31, 2024, the Trust had an unlimited number of shares of beneficial interest authorized with a par value of $0.00001 per share. Fund shares are issued and redeemed by the Fund only in Creation Units or Creation Unit aggregations, where 50,000 shares of the Fund constitute a Creation Unit. Such transactions are generally on an in-kind basis, with a separate cash payment, which is a balancing cash component to equate the transaction to the net asset value per share of the Fund on the transaction date. Transactions in capital shares of the Fund are disclosed in detail in the Statement of Changes in Net Assets. Authorized Participants are subject to standard creation and redemption transaction fees to
30 | Royce Quant Small-Cap Quality Value ETF 2024 Annual Report |
Table of Contents
offset transfer and other transaction costs associated with the issuance and redemption of Creation Units. Such transactions fees are treated as increases in capital and are disclosed in the Funds’ Statements of Changes in Net Assets. Creations and redemptions for cash (when cash creations and redemptions are available or specified) may be subject to an additional variable fee.
6. Restricted securities
The following Fund investments are restricted as to resale and, in the absence of readily ascertainable market values, are valued in good faith in accordance with procedures approved by the Board of Trustees.
| Security | Number of Shares | Acquisition Date | Cost | Fair Value at 3/31/2024 | Value Per Share | Percent of Net Assets | ||||||||||||||||||
| OmniAb Inc., $12.50 EARNOUT, Common Shares | 298 | 11/22 | $ | 0 | (a) | $ | 0 | (a) | $ | 0.00 | (b) | 0.00 | (c)% | |||||||||||
| OmniAb Inc., $15.00 EARNOUT, Common Shares | 298 | 11/22 | 0 | (a) | 0 | (a) | 0.00 | (b) | 0.00 | (c) | ||||||||||||||
| $ | 0 | (a) | $ | 0 | (a) | 0.00 | (c)% | |||||||||||||||||
| (a) | Amount represents less than $1. |
| (b) | Amount represents less than $0.005 per share. |
| (c) | Amount represents less than 0.005%. |
7. Income tax information and distributions to shareholders
The tax character of distributions paid during the fiscal years ended March 31, was as follows:
| 2024 | 2023 | |||||||
| Distributions paid from: | ||||||||
| Ordinary income | $ | 321,630 | $ | 300,658 | ||||
| Tax return of capital | — | 11,796 | ||||||
| Total distributions paid | $ | 321,630 | $ | 312,454 | ||||
As of March 31, 2024, the components of distributable earnings (loss) on a tax basis were as follows:
| Undistributed ordinary income — net | $ | 26,514 | ||
| Deferred capital losses* | (5,588,441) | |||
| Unrealized appreciation (depreciation)(a) | 861,185 | |||
| Total distributable earnings (loss) — net | $ | (4,700,742) |
| * | These capital losses have been deferred in the current year as either short-term or long-term losses. The losses will be deemed to occur on the first day of the next taxable year in the same character as they were originally deferred and will be available to offset future taxable capital gains. |
| (a) | The difference between book-basis and tax-basis unrealized appreciation (depreciation) is attributable to the tax deferral of losses on wash sales. |
| Royce Quant Small-Cap Quality Value ETF 2024 Annual Report |
|
31 |
|
Table of Contents
Report of independent registered public accounting firm
To the Board of Trustees of Legg Mason ETF Investment Trust and Shareholders of Royce Quant Small-Cap Quality Value ETF
Opinion on the Financial Statements
We have audited the accompanying statement of assets and liabilities, including the schedule of investments, of Royce Quant Small-Cap Quality Value ETF (one of the funds constituting Legg Mason ETF Investment Trust, referred to hereafter as the “Fund”) as of March 31, 2024, the related statement of operations for the year ended March 31, 2024, the statements of changes in net assets for each of the two years in the period ended March 31, 2024, including the related notes, and the financial highlights for each of the two years in the period ended March 31, 2024, the period August 1, 2021 through March 31, 2022 and each of the three years in the period ended July 31, 2021 (collectively referred to as the “financial statements”). In our opinion, the financial statements present fairly, in all material respects, the financial position of the Fund as of March 31, 2024, the results of its operations for the year ended March 31, 2024, the changes in its net assets for each of the two years in the period ended March 31, 2024 and the financial highlights for each of the two years in the period ended March 31, 2024, the period August 1, 2021 through March 31, 2022 and each of the three years in the period ended July 31, 2021 in conformity with accounting principles generally accepted in the United States of America.
Basis for Opinion
These financial statements are the responsibility of the Fund’s management. Our responsibility is to express an opinion on the Fund’s financial statements based on our audits. We are a public accounting firm registered with the Public Company Accounting Oversight Board (United States) (PCAOB) and are required to be independent with respect to the Fund in accordance with the U.S. federal securities laws and the applicable rules and regulations of the Securities and Exchange Commission and the PCAOB.
We conducted our audits of these financial statements in accordance with the standards of the PCAOB. Those standards require that we plan and perform the audit to obtain reasonable assurance about whether the financial statements are free of material misstatement, whether due to error or fraud.
Our audits included performing procedures to assess the risks of material misstatement of the financial statements, whether due to error or fraud, and performing procedures that respond to those risks. Such procedures included examining, on a test basis, evidence regarding the amounts and disclosures in the financial statements. Our audits also included evaluating the accounting principles used and significant estimates made by management, as well as evaluating the overall presentation of the financial statements. Our procedures included confirmation of securities owned as of March 31, 2024 by correspondence with the custodian. We believe that our audits provide a reasonable basis for our opinion.
/s/PricewaterhouseCoopers LLP
San Francisco, California
May 22, 2024
We have served as the auditor of one or more investment companies in the Franklin Templeton Group of Funds since 1948.
32 | Royce Quant Small-Cap Quality Value ETF 2024 Annual Report |
Table of Contents
Additional information (unaudited)
Information about Trustees and Officers
The business and affairs of Royce Quant Small-Cap Quality Value ETF (the “Fund”) are conducted by management under the supervision and subject to the direction of its Board of Trustees. The business address of each Trustee is One Franklin Parkway, San Mateo, California 94403-1906.
Information pertaining to the Trustees and officers of the Fund is set forth below. The Statement of Additional Information includes additional information about Trustees and is available, without charge, upon request by calling the Fund at 1-877-721-1926.
| Independent Trustees† | ||
| Rohit Bhagat | ||
| Year of birth | 1964 | |
| Position(s) with Trust | Lead Independent Trustee | |
| Term of office1 and length of time served2 | Since 2021 | |
| Principal occupation(s) during the past five years | Managing Member, Mukt Capital, LLC (private investment firm) (2014-present); and formerly, Chairman, Asia Pacific, BlackRock (investment management) (2009-2012); Global Chief Operating Officer, Barclays Global Investors (investment management) (2005-2009); and Senior Partner, The Boston Consulting Group (management consulting) (1992-2005) | |
| Number of funds in fund complex overseen by Trustee | 60 | |
| Other Directorships held by Trustee during the past five years | AssetMark Financial Holdings, Inc. (investment solutions) (2018- present) and PhonePe (payment and financial services) (2020- present); Meesho (eCommerce) (2023-present); and formerly, Axis Bank (financial) (2013-2021), FlipKart Limited (eCommerce company) (2019-2020), CapFloat Financial Services Pvt., Ltd. (non-banking finance company) (2018) and Zentific Investment Management (hedge fund) (2015-2018); Advisor, Optimal Asset Management (investment technology and advisory services company) (2015-2018); Chief Executive Officer and Director, FinTech Evolution Acquisition (February 2021- March 2023) | |
| Deborah D. McWhinney | ||
| Year of birth | 1955 | |
| Position(s) with Trust | Trustee | |
| Term of office1 and length of time served2 | Since 2021 | |
| Principal occupation(s) during the past five years | Director of various companies; and formerly, Board Member, Lloyds Banking Group (2015-2018) (financial institution) and Fresenius Medical Group (2016-2018) (healthcare); Chief Executive Officer (2013-2014) and Chief Operating Officer (2011- 2013), CitiGroup Global Enterprise Payments (financial services); and President, Citi’s Personal Banking and Wealth Management (2009-2011) | |
| Number of funds in fund complex overseen by Trustee | 60 | |
| Other Directorships held by Trustee during the past five years | IHS Markit (information services) (2015-present), Borg Warner (automotive) (2018-present), LegalShield (consumer services) (2020-present); and formerly, IHS Markit (information services) (2015-2022), Fluor Corporation (construction and engineering) (2014-2020) and Focus Financial Partner, LLC (financial services) (2018-2020) | |
| Royce Quant Small-Cap Quality Value ETF |
|
33 |
|
Table of Contents
Additional information (unaudited) (cont’d)
Information about Trustees and Officers
| Independent Trustees† (cont’d) | ||
| Anantha K. Pradeep | ||
| Year of birth | 1963 | |
| Position(s) with Trust | Trustee | |
| Term of office1 and length of time served2 | Since 2021 | |
| Principal occupation(s) during the past five years | Chief Executive Officer, Smilable, Inc. (technology company) (2014-present); Chief Executive Officer, MachineVantage (technology company) (2018-present); Founder and Managing Partner, Consult Meridian, LLC (consulting company) (2009- present); and formerly, Founder, BoardVantage (board portal solutions provider delivering paperless process for boards and leadership) (2000-2002) | |
| Number of funds in fund complex overseen by Trustee | 60 | |
| Other Directorships held by Trustee during the past five years | None | |
| Interested Trustee and Officer | ||
| Jennifer M. Johnson3 | ||
| Year of birth | 1964 | |
| Position(s) with Trust | Trustee and Chairperson of the Board | |
| Term of office1 and length of time served2 | Since 2021 | |
| Principal occupation(s) during the past five years | Chief Executive Officer, President and Director, Franklin Resources, Inc.; officer and/or director or trustee, of some of the other subsidiaries of Franklin Resources, Inc. and of certain funds in the Franklin Templeton/Legg Mason fund complex; and formerly, Chief Operating Officer and Executive Vice President, Franklin Resources, Inc. (1994-2015); Executive Vice President of Operations and Technology, Franklin Resources, Inc. (2005-2010); and Senior Vice President, Franklin Resources, Inc. (2003-2005) | |
| Number of funds in fund complex overseen by Trustee | 70 | |
| Other Directorships held by Trustee during the past five years | None | |
| Additional Officers | ||
Fred Jensen Franklin Templeton 280 Park Avenue, 8th Floor, New York, NY 10017 | ||
| Year of birth | 1963 | |
| Position(s) with Trust | Chief Compliance Officer | |
| Term of office1 and length of time served2 | Since 2021 | |
| Principal occupation(s) during the past five years | Director - Global Compliance of Franklin Templeton; Managing Director of Legg Mason & Co.; Director of Compliance, Legg Mason Office of the Chief Compliance Officer; Chief Compliance Officer, Franklin Advisory Services, LLC; Compliance Officer, Franklin Advisers, Inc.; officer of certain funds in the Franklin Templeton/Legg Mason fund complex; formerly, Chief Compliance Officer of Legg Mason Global Asset Allocation; Chief Compliance Officer, Legg Mason Private Portfolio; Chief Compliance Officer to The Reserves Funds (investment adviser, funds and broker-dealer) and Ambac Financial Group (investment adviser, funds and broker-dealer) | |
34 | Royce Quant Small-Cap Quality Value ETF |
Table of Contents
| Additional Officers (cont’d) | ||
Harris Goldblat Franklin Templeton 100 First Stamford Place, 6th Floor, Stamford, CT 06902 | ||
| Year of birth | 1969 | |
| Position(s) with Trust | Vice President and Secretary | |
| Term of office1 and length of time served2 | Since June 2023 | |
| Principal occupation(s) during the past five years | Associate General Counsel, Franklin Templeton; officer of certain funds in the Franklin Templeton fund complex; formerly, Managing Director and Associate General Counsel for Legg Mason & Co. | |
Susan Kerr Franklin Templeton 280 Park Avenue, 8th Floor, New York, NY 10017 | ||
| Year of birth | 1949 | |
| Position(s) with Trust | Vice President – AML Compliance | |
| Term of office1 and length of time served2 | Since 2021 | |
| Principal occupation(s) during the past five years | Senior Compliance Analyst, Franklin Templeton; Chief Anti- Money Laundering Compliance Officer, Legg Mason & Co., or its affiliates; Anti Money Laundering Compliance Officer; Senior Compliance Officer, LMIS; and officer of certain funds in the Franklin Templeton/Legg Mason fund complex | |
Christopher Kings Franklin Templeton One Franklin Parkway, San Mateo, CA 94403-1906 | ||
| Year of birth | 1974 | |
| Position(s) with Trust | Chief Executive Officer—Finance and Administration | |
| Term of office1 and length of time served2 | Since January 2024 | |
| Principal occupation(s) during the past five years | Senior Vice President, Franklin Templeton Services, LLC; and officer of certain funds in the Franklin Templeton fund complex | |
Thomas C. Mandia Franklin Templeton 100 First Stamford Place, 6th Floor, Stamford, CT 06902 | ||
| Year of birth | 1962 | |
| Position(s) with Trust | Vice President and Assistant Secretary | |
| Term of office1 and length of time served2 | Since 2021 | |
| Principal occupation(s) during the past five years | Senior Associate General Counsel to Franklin Templeton (since 2020); Secretary of FTFA (since 2006); Assistant Secretary of certain funds associated with Legg Mason & Co. or its affiliates (since 2006); Secretary of LMAS (since 2002) and LMFAM (formerly registered investment advisers) (since 2013); formerly, Managing Director and Deputy General Counsel of Legg Mason & Co. (2005 to 2020) | |
| Royce Quant Small-Cap Quality Value ETF |
|
35 |
|
Table of Contents
Additional information (unaudited) (cont’d)
Information about Trustees and Officers
| Additional Officers (cont’d) | ||
David Mann Franklin Templeton One Franklin Parkway, San Mateo, CA 94403-1906 | ||
| Year of birth | 1973 | |
| Position(s) with Trust | Vice President | |
| Term of office1 and length of time served2 | Since 2023 | |
| Principal occupation(s) during the past five years | Head of Global ETF Product and Capital Markets, Franklin Templeton; and officer of certain funds in the Franklin Templeton/Legg Mason fund complex | |
Todd Mathias Franklin Templeton One Franklin Parkway, San Mateo, CA 94403-1906 | ||
| Year of birth | 1983 | |
| Position(s) with Trust | Vice President | |
| Term of office1 and length of time served2 | Since 2023 | |
| Principal occupation(s) during the past five years | Head of US ETF Product Strategy, Franklin Templeton; and officer of certain funds in the Franklin Templeton/Legg Mason fund complex | |
Patrick O’Connor Franklin Templeton One Franklin Parkway, San Mateo, CA 94403-1906 | ||
| Year of birth | 1967 | |
| Position(s) with Trust | President and Chief Executive Officer – Investment Management | |
| Term of office1 and length of time served2 | Since 2021 | |
| Principal occupation(s) during the past five years | President and Chief Investment Officer, Franklin Advisory Services, LLC; Senior Vice President, Franklin Advisers, Inc.; and officer of certain funds in the Franklin Templeton/Legg Mason fund complex | |
Vivek Pai Franklin Templeton 300 S.E. 2nd Street, Fort Lauderdale, FL 33301-1923 | ||
| Year of birth | 1970 | |
| Position(s) with Trust | Treasurer, Chief Financial Officer and Chief Accounting Officer | |
| Term of office1 and length of time served2 | Since 2021 | |
| Principal occupation(s) during the past five years | Treasurer, U.S. Fund Administration & Reporting and officer of certain funds in the Franklin Templeton/Legg Mason fund complex | |
FTFA, referenced above, was formerly known as LMPFA prior to November 30, 2023. |
| † | Trustees who are not “interested persons” of the Fund within the meaning of Section 2(a)(19) of the Investment Company Act of 1940, as amended (the “1940 Act”). |
| 1 | Each Trustee and officer serves until his or her respective successor has been duly elected and qualified or until his or her earlier death, resignation, retirement or removal. |
36 | Royce Quant Small-Cap Quality Value ETF |
Table of Contents
| 2 | Indicates the earliest year in which the Trustee became a board member for a fund in the Legg Mason fund complex or the officer took such office. |
| 3 | Ms. Johnson is an “interested person” of the Fund, as defined in the 1940 Act, because of her position with FTFA and/or certain of its affiliates. |
| Royce Quant Small-Cap Quality Value ETF |
|
37 |
|
Table of Contents
Important tax information (unaudited)
By mid-February, tax information related to a shareholder’s proportionate share of distributions paid during the preceding calendar year will be received, if applicable. Please also refer to www.franklintempleton.com for per share tax information related to any distributions paid during the preceding calendar year. Shareholders are advised to consult with their tax advisors for further information on the treatment of these amounts on their tax returns.
The following tax information for the Fund is required to be furnished to shareholders with respect to income earned and distributions paid during its fiscal year.
The Fund hereby reports the following amounts, or if subsequently determined to be different, the maximum allowable amounts, for the fiscal year ended March 31, 2024:
| Pursuant to: | Amount Reported | |||||||
| Income Eligible for Dividends Received Deduction (DRD) | § | 854(b)(1)(A) | $502,391 | |||||
| Qualified Dividend Income Earned (QDI) | § | 854(b)(1)(B) | $507,368 | |||||
38 | Royce Quant Small-Cap Quality Value ETF |
Table of Contents
Royce
Quant Small-Cap Quality Value ETF
Trustees
Rohit Bhagat
Deborah D. McWhinney
Anantha K. Pradeep
Jennifer M. Johnson
Chair
Investment manager
Franklin Templeton Fund Adviser, LLC*
Subadviser
Royce & Associates, LP
Custodian
The Bank of New York Mellon
Transfer agent
The Bank of New York Mellon
240 Greenwich Street
New York, NY 10286
Independent registered public accounting firm
PricewaterhouseCoopers LLP
San Francisco, CA
Royce Quant Small-Cap Quality Value ETF
The Fund is a separate investment series of Legg Mason ETF Investment Trust, a Maryland statutory trust.
Royce Quant Small-Cap Quality Value ETF
Legg Mason Funds
620 Eighth Avenue, 47th Floor
New York, NY 10018
| * | Formerly known as Legg Mason Partners Fund Advisor, LLC. |
The Fund files its complete schedule of portfolio holdings with the Securities and Exchange Commission (“SEC”) for the first and third quarters of each fiscal year as an exhibit to its reports on Form N-PORT. The Fund’s Forms N-PORT are available on the SEC’s website at www.sec.gov. To obtain information on Form N-PORT, shareholders can call the Fund at 1-877-721-1926.
Information on how the Fund voted proxies relating to portfolio securities during the prior 12-month period ended June 30th of each year and a description of the policies and procedures that the Fund uses to determine how to vote proxies related to portfolio transactions are available (1) without charge, upon request, by calling the Fund at 1-877-721-1926, (2) at www.franklintempleton.com and (3) on the SEC’s website at www.sec.gov.
This report is submitted for the general information of the shareholders of Royce Quant Small-Cap Quality Value ETF. This report is not authorized for distribution to prospective investors in the Fund unless preceded or accompanied by a current prospectus.
Investors should consider the Fund’s investment objectives, risks, charges and expenses carefully before investing. The prospectus contains this and other important information about the Fund. Please read the prospectus carefully before investing.
www.franklintempleton.com
© 2024 Franklin Distributors, LLC, Member FINRA/SIPC. All rights reserved.
Table of Contents
www.franklintempleton.com
© 2024 Franklin Distributors, LLC, Member FINRA/SIPC. All rights reserved.
ETFF399959 5/24
Table of Contents
| ITEM 2. | CODE OF ETHICS. |
The registrant has adopted a code of ethics that applies to the registrant’s principal executive officer, principal financial officer, principal accounting officer or controller.
| ITEM 3. | AUDIT COMMITTEE FINANCIAL EXPERT. |
The Board of Trustees of the registrant has determined that Rohit Bhagat and Deborah D. McWhinney possesses the technical attributes identified in Instruction 2(b) of Item 3 to Form N-CSR to qualify as an “audit committee financial expert,” and has designated Mr. Bhagat and Ms. McWhinney as its Audit Committee’s financial experts. Mr. Bhagat and Ms. McWhinney are “independent” Trustees pursuant to paragraph (a)(2) of Item 3 to Form N-CSR.
| ITEM 4. | PRINCIPAL ACCOUNTANT FEES AND SERVICES. |
a) Audit Fees. The aggregate fees billed in the last two fiscal years ending March 31, 2022 and March 31, 2023 (the “Reporting Periods”) for professional services rendered by the Registrant’s principal accountant (the “Auditor”) for the audit of the Registrant’s annual financial statements, or services that are normally provided by the Auditor in connection with the statutory and regulatory filings or engagements for the Reporting Periods, were $146,240 in March 31, 2023 and $150,630 in March 31, 2024.
b) Audit-Related Fees. The aggregate fees billed in the Reporting Period for assurance and related services by the Auditor that are reasonably related to the performance of the Registrant’s financial statements were $0 in March 31, 2023 and $0 in March 31, 2024.
(c) Tax Fees. The aggregate fees billed in the Reporting Periods for professional services rendered by the Auditor for tax compliance, tax advice and tax planning (“Tax Services”) were $82,000 in March 31, 2023 and $82,000 in March 31, 2024. These services consisted of (i) review or preparation of U.S. federal, state, local and excise tax returns; (ii) U.S. federal, state and local tax planning, advice and assistance regarding statutory, regulatory or administrative developments, and (iii) tax advice regarding tax qualification matters and/or treatment of various financial instruments held or proposed to be acquired or held.
There were no fees billed for tax services by the Auditors to service affiliates during the Reporting Periods that required pre-approval by the Audit Committee.
d) All Other Fees.
The aggregate fees billed in the Reporting Periods for products and services provided by the Auditor, other than the services reported in paragraphs (a) through (c) for the Item 4 for the Legg Mason ETF Investment Trust, were $0 in the previous fiscal year and $0 in March 31, 2024.
All Other Fees. There were no other non-audit services rendered by the Auditor to Franklin Templeton Fund Advisors, LLC (“FTFA”), Formerly known as Legg Mason Partners Fund Advisor, LLC(“FTFA”), and any entity controlling, controlled by or under common control with FTFA that provided ongoing services to Legg Mason ETF Investment Trust requiring pre-approval by the Audit Committee in the Reporting Period.
(e) Audit Committee’s pre–approval policies and procedures described in paragraph (c) (7) of Rule 2-01 of Regulation S-X.
Table of Contents
(1) The Charter for the Audit Committee (the “Committee”) of the Board of each registered investment company (the “Fund”) advised by FTFA or one of their affiliates (each, an “Adviser”) requires that the Committee shall approve (a) all audit and permissible non-audit services to be provided to the Fund and (b) all permissible non-audit services to be provided by the Fund’s independent auditors to the Adviser and any Covered Service Providers if the engagement relates directly to the operations and financial reporting of the Fund. The Committee may implement policies and procedures by which such services are approved other than by the full Committee.
The Committee shall not approve non-audit services that the Committee believes may impair the independence of the auditors. As of the date of the approval of this Audit Committee Charter, permissible non-audit services include any professional services (including tax services), that are not prohibited services as described below, provided to the Fund by the independent auditors, other than those provided to the Fund in connection with an audit or a review of the financial statements of the Fund. Permissible non-audit services may not include: (i) bookkeeping or other services related to the accounting records or financial statements of the Fund; (ii) financial information systems design and implementation; (iii) appraisal or valuation services, fairness opinions or contribution-in-kind reports; (iv) actuarial services; (v) internal audit outsourcing services; (vi) management functions or human resources; (vii) broker or dealer, investment adviser or investment banking services; (viii) legal services and expert services unrelated to the audit; and (ix) any other service the Public Company Accounting Oversight Board determines, by regulation, is impermissible.
Pre-approval by the Committee of any permissible non-audit services is not required so long as: (i) the aggregate amount of all such permissible non-audit services provided to the Fund, the Adviser and any service providers controlling, controlled by or under common control with the Adviser that provide ongoing services to the Fund (“Covered Service Providers”) constitutes not more than 5% of the total amount of revenues paid to the independent auditors during the fiscal year in which the permissible non-audit services are provided to (a) the Fund, (b) the Adviser and (c) any entity controlling, controlled by or under common control with the Adviser that provides ongoing services to the Fund during the fiscal year in which the services are provided that would have to be approved by the Committee; (ii) the permissible non-audit services were not recognized by the Fund at the time of the engagement to be non-audit services; and (iii) such services are promptly brought to the attention of the Committee and approved by the Committee (or its delegate(s)) prior to the completion of the audit.
(2) None of the services described in paragraphs (b) through (d) of this Item were performed in reliance on paragraph (c)(7)(i)(C) of Rule 2-01 of Regulation S-X.
(f) Not applicable.
(g) Non-audit fees billed by the Auditor for services rendered to Legg Mason ETF Investment Trust, FTFA and any entity controlling, controlled by, or under common control with FTFA that provides ongoing services to Legg Mason ETF Investment Trust during the reporting period were $785,604 in the previous fiscal year and $0 in March 31, 2024.
(h) Yes. Legg Mason ETF Investment Trust’s Audit Committee has considered whether the provision of non-audit services that were rendered to Service Affiliates, which were not pre-approved (not requiring pre-approval), is compatible with maintaining the Accountant’s independence. All services provided by the Auditor to the Legg Mason ETF Investment Trust or to Service Affiliates, which were required to be pre-approved, were pre-approved as required.
(i) Not applicable.
(j) Not applicable.
Table of Contents
| ITEM 5. | AUDIT COMMITTEE OF LISTED REGISTRANTS. |
| a) | The independent board members are acting as the registrant’s audit committee as specified in Section 3(a)(58)(B) of the Exchange Act. The Audit Committee consists of the following Board members: |
Rohit Bhagat
Deborah D. McWhinney
Anantha K. Pradeep
| b) | Not applicable. |
| ITEM 6. | SCHEDULE OF INVESTMENTS. |
Included herein under Item 1.
| ITEM 7. | DISCLOSURE OF PROXY VOTING POLICIES AND PROCEDURES FOR CLOSED-END MANAGEMENT INVESTMENT COMPANIES. |
Not applicable.
| ITEM 8. | PORTFOLIO MANAGERS OF CLOSED-END MANAGEMENT INVESTMENT COMPANIES. |
Not applicable.
| ITEM 9. | PURCHASES OF EQUITY SECURITIES BY CLOSED-END MANAGEMENT INVESTMENT COMPANY AND AFFILIATED PURCHASERS. |
Not applicable.
| ITEM 10. | SUBMISSION OF MATTERS TO A VOTE OF SECURITY HOLDERS. |
Not applicable.
| ITEM 11. | CONTROLS AND PROCEDURES. |
| (a) | The registrant’s principal executive officer and principal financial officer have concluded that the registrant’s disclosure controls and procedures (as defined in Rule 31a- 3(c) under the Investment Company Act of 1940, as amended (the “1940 Act”)) are effective as of a date within 90 days of the filing date of this report that includes the disclosure required by this paragraph, based on their evaluation of the disclosure controls and procedures required by Rule 31a-3(b) under the 1940 Act and 15d-15(b) under the Securities Exchange Act of 1934. |
| (b) | There were no changes in the registrant’s internal control over financial reporting (as defined in Rule 31a-3(d) under the 1940 Act) that occurred during the period covered by this report that have materially affected, or are likely to materially affect the registrant’s internal control over financial reporting. |
| ITEM 12. | DISCLOSURE OF SECURITIES LENDING ACTIVITIES FOR CLOSED-END MANAGEMENT INVESTMENT COMPANIES. |
Not applicable.
Table of Contents
| Item 13. | Recovery of Erroneously Awarded Compensation. |
| (a) | N/A |
| (b) | N/A |
| ITEM 14. | EXHIBITS. |
(a) (1) Code of Ethics attached hereto.
Exhibit 99.CODE ETH
(a) (2) Certifications pursuant to section 302 of the Sarbanes-Oxley Act of 2002 attached hereto.
Exhibit 99.CERT
(a)(2)(1) There were no written solicitations to purchase securities under Rule 23c-1 under the Act sent or given during the period covered by the report by or on behalf of the Registrant to 10 or more persons.
(a)(2)(2) There was no change in the Registrant’s independent public accountant during the period covered by the report.
(b) Certifications pursuant to Section 906 of the Sarbanes-Oxley Act of 2002 attached hereto.
Exhibit 99.906CERT
Table of Contents
SIGNATURES
Pursuant to the requirements of the Securities Exchange Act of 1934 and the Investment Company Act of 1940, the registrant has duly caused this Report to be signed on its behalf by the undersigned, there unto duly authorized.
| Legg Mason ETF Investment Trust | ||
| By: | /s/ Christopher King | |
| Christopher Kings | ||
| Chief Executive Officer | ||
| Date: | May 29, 2024 | |
Pursuant to the requirements of the Securities Exchange Act of 1934 and the Investment Company Act of 1940, this report has been signed below by the following persons on behalf of the registrant and in the capacities and on the dates indicated.
| By: | /s/ Christopher King | |
| Christopher Kings | ||
| Chief Executive Officer | ||
| Date: | May 29, 2024 | |
Table of Contents
By: | /s/ Vivek Pai | |
Vivek Pai | ||
Principal Financial Officer | ||
Date: | May 29, 2024 | |