Exhibit 99.2

NYSE: MDV
QUARTERLY SUPPLEMENTAL DATA
December 31, 2022
Supplemental Information - Fourth Quarter 2022
| Table of Contents | ||
| About the Data | 3 | |
| Company Overview | 4 | |
| Financial Results | ||
| Statements of Operations - Last Five Quarters | 5 | |
| Statements of Comprehensive (Loss) Income - Last Five Quarters | 6 | |
| (Loss) Earnings Per Share - Last Five Quarters | 7 | |
| FFO and AFFO - Last Five Quarters | 8 | |
| Adjusted EBITDA - Last Five Quarters | 9 | |
| Leverage Ratio | 10 | |
| Balance Sheets and Capitalization | ||
| Capitalization | 11 | |
| Balance Sheets | 12 | |
| Debt Overview | 13 | |
| Credit Facility and Mortgage Notes Covenants | 14 | |
| Real Estate | ||
| Acquisitions | 15 | |
| Dispositions | 16 | |
| Top 10 Tenants | 17 | |
| Property Type | 17 | |
| Industry Diversification | 18 | |
| Geographic Diversification | 19 | |
| Lease Expirations | 20 | |
| Appendix | ||
| Disclosures Regarding Non-GAAP and Other Metrics | 21 | |
2
About the Data
This data and other information described herein are as of and for the three months ended December 31, 2022 unless otherwise indicated. Future performance may not be consistent with past performance and is subject to change and inherent risks and uncertainties. This information should be read in conjunction with Modiv Inc.'s Annual Report on Form 10-K for the year ended December 31, 2022, including the financial statements and management's discussion and analysis of financial condition and results of operations, which will be filed in March 2023.
Forward Looking Statements
Information set forth herein contains forward-looking statements, which reflect our current views regarding our business, financial performance, growth prospects and strategies, market opportunities, and market trends. Forward-looking statements include all statements that are not historical facts. In some cases, you can identify these forward-looking statements by the use of words such as “outlook,” “believes,” “expects,” “potential,” “continues,” “may,” “will,” “should,” “could,” “seeks,” “approximately,” “projects,” “predicts,” “intends,” “plans,” “estimates,” “anticipates,” or the negative version of these words or other comparable words. All of the forward-looking statements herein are subject to various risks and uncertainties. Assumptions relating to the foregoing involve judgments with respect to, among other things, future economic, competitive and market conditions, and future business decisions, all of which are difficult or impossible to predict accurately and many of which are beyond our control. Although we believe that the expectations reflected in such forward-looking statements are based on reasonable assumptions, our actual results, performance, and achievements could differ materially from those expressed in or by the forward-looking statements and may be affected by a variety of risks and other factors. Accordingly, there are or will be important factors that could cause actual outcomes or results to differ materially from such forward-looking statements. These factors include, but are not limited to, risks and uncertainties related to the COVID-19 pandemic and its related impacts on us and our tenants, general economic conditions, including but not limited to impacts of the Russian war against Ukraine, supply-chain disruptions, increases in the rate of inflation and interest rates, local real estate conditions, tenant financial health, and property acquisitions and the timing of these acquisitions. These and other risks, assumptions, and uncertainties are described in our filings with the SEC, which are available on the SEC’s website at www.sec.gov. You are cautioned not to place undue reliance on any forward-looking statements included herein. All forward-looking statements are made as of the date of this document and the risk that actual results, performance, and achievements will differ materially from the expectations expressed or referenced herein will increase with the passage of time. We undertake no obligation to publicly update or review any forward-looking statement, whether as a result of new information, future developments, or otherwise, except as required by law.
3
Modiv Inc. (NYSE:MDV) (“Modiv”, the “Company”, “we”, “us” and “our”) is an internally managed real estate investment trust (“REIT”) that acquires, owns and manages a portfolio of single-tenant net-lease properties throughout the United States, with a focus on acquiring critical industrial manufacturing properties with long-term leases to tenants that fuel the national economy and strengthen the nation's supply chains. We also own non-core, legacy retail and office real estate properties, and are gradually reducing our office and retail exposure, subject to market conditions, with the goal of becoming a pure-play industrial manufacturing REIT. Driven by an investor-first focus and an experienced and dedicated management team, Modiv is committed to providing investors with MOnthly DIVidends through a durable portfolio of real estate investments designed to generate both current income and long-term growth. As of December 31, 2022, Modiv had a $535 million real estate portfolio (based on estimated fair value) comprised of 3.2 million square feet of aggregate leasable area. For more information, please visit: www.modiv.com.
Modiv strives towards a “best-in-class” corporate governance structure through a board of directors and management team with decades of institutional real estate industry experience.
| Management Team: | Independent Directors: |
| Aaron S. Halfacre | Adam S. Markman |
| Chief Executive Officer and Director | Chairman of the Board |
| Raymond J. Pacini | Asma Ishaq |
| Chief Financial Officer and Secretary | |
| Sandra G. Sciutto | Curtis B. McWilliams |
| Chief Accounting Officer | |
| John C. Raney | Thomas H. Nolan, Jr. |
| Chief Legal Officer | |
| William R. Broms | Kimberly Smith |
| Chief Investment Officer | |
| Connie Tirondola |
Investor Inquiries:
Margaret Boyce, Financial Profiles, Inc.
mboyce@finprofiles.com
310-622-8247
Transfer Agent:
Computershare Trust Company, N.A.
150 Royall Street
Canton, MA 02021
800-736-3001
4
Consolidated Statements of Operations - Last Five Quarters
(Unaudited)
| Three Months Ended | ||||||||||||||||||||
| December 31, 2022 | September 30, 2022 | June 30, 2022 | March 31, 2022 | December 31, 2021 | ||||||||||||||||
| Rental income (a) | $ | 14,372,106 | $ | 10,951,673 | $ | 10,676,148 | $ | 10,174,340 | $ | 8,831,534 | ||||||||||
| Expenses: | ||||||||||||||||||||
| General and administrative (b) | 2,252,304 | 1,838,388 | 1,615,182 | 2,106,183 | 2,188,493 | |||||||||||||||
| Stock compensation | 660,171 | 549,240 | 679,747 | 511,865 | 629,538 | |||||||||||||||
| Depreciation and amortization | 4,347,809 | 3,598,592 | 3,682,681 | 3,300,492 | 3,449,407 | |||||||||||||||
| Interest expense | 2,826,490 | 2,514,838 | 1,197,154 | 1,568,175 | 1,874,867 | |||||||||||||||
| Property expenses (c) | 2,105,257 | 2,063,892 | 1,965,885 | 2,764,592 | 1,578,700 | |||||||||||||||
| Impairment of real estate investment property (d) | 2,080,727 | — | — | — | — | |||||||||||||||
| Impairment of goodwill and intangible assets (e) | — | — | — | 17,320,857 | 3,767,190 | |||||||||||||||
| Total expenses | 14,272,758 | 10,564,950 | 9,140,649 | 27,572,164 | 13,488,195 | |||||||||||||||
| Other operating income (loss): | ||||||||||||||||||||
| Gain on sale of real estate investments | 669,185 | 3,932,029 | 720,071 | 6,875,086 | 2,338,904 | |||||||||||||||
| Operating income (loss) | 768,533 | 4,318,752 | 2,255,570 | (10,522,738 | ) | (2,317,757 | ) | |||||||||||||
| Other income (expense): | ||||||||||||||||||||
| Interest income | 5,047 | 1,665 | 1,763 | 13,435 | 19,958 | |||||||||||||||
| Income from investment in unconsolidated entity | 51,312 | 64,358 | 66,868 | 95,464 | 53,337 | |||||||||||||||
| Loss on early extinguishment of debt (f) | — | — | — | (1,725,318 | ) | — | ||||||||||||||
| Other (a) | (104,157 | ) | 65,992 | 66,143 | 65,993 | 65,993 | ||||||||||||||
| Other (expense) income, net | (47,798 | ) | 132,015 | 134,774 | (1,550,426 | ) | 139,288 | |||||||||||||
| Net income (loss) | 720,735 | 4,450,767 | 2,390,344 | (12,073,164 | ) | (2,178,469 | ) | |||||||||||||
| Less: net income (loss) attributable to noncontrolling interest in Operating Partnership | (42,508 | ) | 528,540 | 219,214 | (1,928,029 | ) | — | |||||||||||||
| Net income (loss) attributable to Modiv Inc. | 763,243 | 3,922,227 | 2,171,130 | (10,145,135 | ) | (2,178,469 | ) | |||||||||||||
| Preferred stock dividends | (921,875 | ) | (921,875 | ) | (921,875 | ) | (921,875 | ) | (921,875 | ) | ||||||||||
| Net (loss) income attributable to common stockholders | $ | (158,632 | ) | $ | 3,000,352 | $ | 1,249,255 | $ | (11,067,010 | ) | $ | (3,100,344 | ) | |||||||
| (Loss) earnings per share attributable to common stockholders | ||||||||||||||||||||
| Basic | $ | (0.02 | ) | $ | 0.40 | $ | 0.17 | $ | (1.47 | ) | $ | (0.41 | ) | |||||||
| Diluted | $ | (0.02 | ) | $ | 0.35 | $ | 0.14 | $ | (1.47 | ) | $ | (0.41 | ) | |||||||
| Weighted-average number of common shares outstanding | ||||||||||||||||||||
| Basic | 7,487,728 | 7,449,968 | 7,478,973 | 7,533,158 | 7,531,167 | |||||||||||||||
| Diluted (g) | 7,487,728 | 10,180,543 | 10,221,490 | 7,533,158 | 7,531,167 | |||||||||||||||
| Distributions declared per common share (h) | $ | 0.2875 | $ | 0.2875 | $ | 0.2875 | $ | 0.3875 | $ | 0.2875 | ||||||||||
| (a) | Rental income includes tenant reimbursements for property expenses and the fourth quarter of 2022 includes an early termination fee of $3,781,929 received from Sutter Health. |
| (b) | General and administrative expenses include a $500,000 accrual for estimated costs of relocating our corporate offices to Reno, Nevada. |
| (c) | Property expenses for the fourth quarter of 2022 include increased property taxes and property management fees compared with the comparable quarter of 2021, primarily related to the growth of our portfolio. These expenses are largely offset by tenant reimbursements included in rental income. Property expenses for the first quarter of 2022 also include $587,000 in write-offs of costs related to our proposed acquisition of 10 properties leased to Walgreens which we abandoned due to inability to obtain the mortgage servicer's approval prior to the contract termination date of February 18, 2022 and changes in market conditions. |
| (d) | Impairment of investment in real estate property represents an impairment charge for a property located in Rocklin, California to reflect the net realizable value as a result of its reclassification to asset held for sale. The sale of this property is expected to close by March 31, 2023. |
| (e) | Goodwill, which relates to the 2019 acquisition of our former sponsor’s crowdfunding platform, was impaired in the first quarter of 2022 in accordance with GAAP given that the market value of our common stock is materially below our historical net asset value and the book value of our equity. The impairment of intangible assets in the fourth quarter of 2021 relates to our decision to terminate our crowdfunding operations. |
| (f) | Loss on early extinguishment of debt for the first quarter of 2022 includes non-recurring charges for (i) $1,164,998 in non-cash write-offs of deferred financing costs upon refinancing 20 mortgages and the prior credit facility with the KeyBank credit facility and mortgage repayments related to four asset sales; (ii) $615,336 of mortgage prepayment fees; and (iii) $733,000 of swap termination fees related to four of the mortgages refinanced with the KeyBank credit facility and the related write-off of unrealized valuation losses of $788,016. |
| (g) | Diluted shares outstanding in the second and third quarters of 2022 include Class C, Class M, Class P and Class R OP Units since we reported net income for those quarters. Diluted shares outstanding for periods when we reported a net loss do not include the OP Units since they would be anti-dilutive. |
| (h) | We increased the annual distribution rate on our common stock from $1.05 per share to $1.15 per share effective October 1, 2021. Distributions declared during the first quarter of 2022 include a one-time 13th distribution for 2021 of $0.10 per share for stockholders of record on December 31, 2021. |
5
Consolidated Statements of Comprehensive Income (Loss) - Last Five Quarters
(Unaudited)
| Three Months Ended | ||||||||||||||||||||
| December 31, 2022 | September 30, 2022 | June 30, 2022 | March 31, 2022 | December 31, 2021 | ||||||||||||||||
| Net income (loss) | $ | 720,735 | $ | 4,450,767 | $ | 2,390,344 | $ | (12,073,164 | ) | $ | (2,178,469 | ) | ||||||||
| Other comprehensive income: | ||||||||||||||||||||
| Unrealized holding (loss) gain on interest rate swap designated as a cash flow hedge (a) | (216,200 | ) | 4,255,906 | — | — | — | ||||||||||||||
| Comprehensive income (loss) | 504,535 | 8,706,673 | 2,390,344 | (12,073,164 | ) | (2,178,469 | ) | |||||||||||||
| Net (loss) income attributable to noncontrolling interest in Operating Partnership | (42,508 | ) | 528,540 | 219,214 | (1,928,029 | ) | — | |||||||||||||
| Other comprehensive (loss) income attributable to noncontrolling interest in Operating Partnership: | ||||||||||||||||||||
| Unrealized holding (loss) gain on interest rate swap designated as a cash flow hedge | (34,942 | ) | 637,429 | — | — | — | ||||||||||||||
| Comprehensive (loss) income attributable noncontrolling interest in Operating Partnership | (77,450 | ) | 1,165,969 | 219,214 | (1,928,029 | ) | — | |||||||||||||
| Comprehensive income (loss) attributable to Modiv Inc. | $ | 581,985 | $ | 7,540,704 | $ | 2,171,130 | $ | (10,145,135 | ) | $ | (2,178,469 | ) | ||||||||
| (a) | Reflects the change in fair value of the hedged derivative instrument for the six months ended December 31, 2022 that was designated as a cash flow hedge for financial accounting purposes beginning July 1, 2022. |
6
(Loss) Earnings Per Share - Last Five Quarters
(Unaudited)
| Three Months Ended | ||||||||||||||||||||
| December 31, 2022 | September 30, 2022 | June 30, 2022 | March 31, 2022 | December 31, 2021 | ||||||||||||||||
| Numerator - Basic: | ||||||||||||||||||||
| Net income (loss) | $ | 720,735 | $ | 4,450,767 | $ | 2,390,344 | $ | (12,073,164 | ) | $ | (2,178,469 | ) | ||||||||
| Net loss (income) attributable to noncontrolling interest in Operating Partnership | 42,508 | (528,540 | ) | (219,214 | ) | 1,928,029 | — | |||||||||||||
| Preferred stock dividends | (921,875 | ) | (921,875 | ) | (921,875 | ) | (921,875 | ) | (921,875 | ) | ||||||||||
| Net (loss) income attributable to common stockholders | $ | (158,632 | ) | $ | 3,000,352 | $ | 1,249,255 | $ | (11,067,010 | ) | $ | (3,100,344 | ) | |||||||
| Numerator - Diluted: | ||||||||||||||||||||
| Net income (loss) | $ | 720,735 | $ | 4,450,767 | $ | 2,390,344 | $ | (12,073,164 | ) | $ | (2,178,469 | ) | ||||||||
| Less: preferred stock dividends | (921,875 | ) | (921,875 | ) | (921,875 | ) | (921,875 | ) | (921,875 | ) | ||||||||||
| Net (loss) income attributable to common stockholders | $ | (201,140 | ) | $ | 3,528,892 | $ | 1,468,469 | $ | (12,995,039 | ) | $ | (3,100,344 | ) | |||||||
| Denominator: | ||||||||||||||||||||
| Weighted average shares outstanding - basic | 7,487,728 | 7,449,968 | 7,478,973 | 7,533,158 | 7,531,167 | |||||||||||||||
| Operating Partnership Units - Class C (a) | — | 1,312,382 | 1,312,382 | — | — | |||||||||||||||
| Operating Partnership Units - other (b) | — | 1,418,193 | 1,430,135 | — | — | |||||||||||||||
| Weighted average shares outstanding - diluted | 7,487,728 | 10,180,543 | 10,221,490 | 7,533,158 | 7,531,167 | |||||||||||||||
| (Loss) earnings per share attributable to common stockholders: | ||||||||||||||||||||
| Basic | $ | (0.02 | ) | $ | 0.40 | $ | 0.17 | $ | (1.47 | ) | $ | (0.41 | ) | |||||||
| Diluted | $ | (0.02 | ) | $ | 0.35 | $ | 0.14 | $ | (1.47 | ) | $ | (0.41 | ) | |||||||
| (a) | We issued 1,312,382 Class C OP Units at an agreed upon value of $25 per unit in connection with our January 18, 2022 acquisition of a KIA auto dealership property in an “UPREIT” transaction. These units were not included in the computation of Diluted EPS for the quarters ended December 31, 2022 and March 31, 2022 because their effect would be anti-dilutive. |
| (b) | During the three months ended December 31, 2022, March 31, 2022 and December 31, 2021, the weighted average dilutive effect of 1,395,759, 1,347,958 and 1,213,173 shares, respectively, related to other Operating Partnership units were excluded from the computation of Diluted EPS because their effect would be anti-dilutive. There were no other outstanding securities or commitments to issue common stock that would have a dilutive effect for the periods then ended. |
7
FFO and AFFO - Last Five Quarters
(Unaudited)
| Three Months Ended | |||||||||||||||||||||
| December 31, 2022 | September 30, 2022 | June 30, 2022 | March 31, 2022 | December 31, 2021 | |||||||||||||||||
| Net income (loss) (in accordance with GAAP) | $ | 720,735 | $ | 4,450,767 | $ | 2,390,344 | $ | (12,073,164 | ) | $ | (2,178,469 | ) | |||||||||
| Preferred stock dividends | (921,875 | ) | (921,875 | ) | (921,875 | ) | (921,875 | ) | (921,875 | ) | |||||||||||
| Net (loss) income attributable to common stockholders and Class C OP Units | (201,140 | ) | 3,528,892 | 1,468,469 | (12,995,039 | ) | (3,100,344 | ) | |||||||||||||
| FFO adjustments: | |||||||||||||||||||||
| Add: | Depreciation and amortization | 4,347,809 | 3,598,592 | 3,682,681 | 3,300,492 | 3,290,588 | |||||||||||||||
| Amortization of lease incentives | 88,752 | 176,296 | 75,655 | 71,394 | 53,203 | ||||||||||||||||
| Depreciation and amortization for unconsolidated investment in a real estate property | 203,554 | 192,551 | 190,468 | 190,468 | 189,439 | ||||||||||||||||
| Impairment of real estate investment property | 2,080,727 | — | — | — | — | ||||||||||||||||
| Less: | Gain on sale of real estate investments, net | (669,185 | ) | (3,932,029 | ) | (720,071 | ) | (6,875,086 | ) | (2,338,904 | ) | ||||||||||
| FFO attributable to common stockholders and Class C OP Units | 5,850,517 | 3,564,302 | 4,697,202 | (16,307,771 | ) | (1,906,018 | ) | ||||||||||||||
| AFFO adjustments: | |||||||||||||||||||||
| Add: | Amortization of corporate intangibles (a) | — | — | — | — | 158,819 | |||||||||||||||
| Impairment of goodwill and intangible assets (a) | — | — | — | 17,320,857 | 3,767,190 | ||||||||||||||||
| Non-recurring corporate relocation costs | 500,000 | — | — | — | — | ||||||||||||||||
| Stock compensation (b) | 660,170 | 549,240 | 679,747 | 511,865 | 629,542 | ||||||||||||||||
| Deferred financing costs (c) | 179,641 | 101,783 | 101,781 | 1,266,725 | 162,200 | ||||||||||||||||
| Non-recurring loan prepayment penalties | — | — | — | 615,336 | — | ||||||||||||||||
| Swap termination costs | — | — | — | 733,000 | — | ||||||||||||||||
| Amortization of above-market lease intangibles | 88,549 | 43,763 | 32,456 | 32,456 | 32,456 | ||||||||||||||||
| Acquisition fees and due diligence expenses, including abandoned pursuit costs (d) | 25,051 | 44,863 | 4,639 | 586,669 | (16,100 | ) | |||||||||||||||
| Less: | Deferred rents | (643,784 | ) | (976,419 | ) | (981,083 | ) | (636,196 | ) | 206,606 | |||||||||||
| Unrealized gain on interest rate swaps | 505,263 | 59,000 | (589,997 | ) | (788,016 | ) | (285,982 | ) | |||||||||||||
| Amortization of below-market lease intangibles | (231,175 | ) | (258,652 | ) | (349,810 | ) | (363,074 | ) | (363,074 | ) | |||||||||||
| Other adjustments for unconsolidated investment in a real estate property | 5,815 | (188 | ) | (188 | ) | (188 | ) | (6,191 | ) | ||||||||||||
| AFFO attributable to common stockholders and Class C OP Units (e) | $ | 6,940,047 | $ | 3,127,692 | $ | 3,594,747 | $ | 2,971,663 | $ | 2,379,448 | |||||||||||
| Weighted average shares outstanding: | |||||||||||||||||||||
| Basic | 7,487,728 | 7,449,968 | 7,478,973 | 7,533,158 | 7,531,167 | ||||||||||||||||
| Fully diluted (f) (g) | 10,195,869 | 10,180,543 | 10,221,490 | 10,193,498 | 8,744,340 | ||||||||||||||||
| FFO per share: | |||||||||||||||||||||
| Basic | $ | 0.78 | $ | 0.48 | $ | 0.63 | $ | (2.16 | ) | $ | (0.25 | ) | |||||||||
| Fully diluted | $ | 0.57 | $ | 0.35 | $ | 0.46 | $ | (2.16 | ) | $ | (0.25 | ) | |||||||||
| AFFO per share: | |||||||||||||||||||||
| Basic | $ | 0.93 | $ | 0.42 | $ | 0.48 | $ | 0.39 | $ | 0.32 | |||||||||||
| Fully diluted (e) | $ | 0.68 | $ | 0.31 | $ | 0.35 | $ | 0.29 | $ | 0.27 | |||||||||||
| (a) | Intangible assets reflected our investment in our crowdfunding platform which was impaired in the fourth quarter of 2021 due to our decision to terminate our crowdfunding operations. Goodwill, which relates to the 2019 acquisition of our former sponsor’s crowdfunding platform, was impaired in the first quarter of 2022 in accordance with GAAP given that the market value of our common stock was materially below our historical net asset value and the book value of our equity. |
| (b) | Stock compensation expense includes (i) amortization of the Class P OP Units granted to our Chief Executive Officer and Chief Financial Officer on December 31, 2019; (ii) amortization of the Class R OP Units granted to all of our employees, including the Chief Executive Officer and Chief Financial Officer, on January 25, 2021; and (iii) stock granted to our independent directors each quarter as partial consideration for their service as directors. |
| (c) | Deferred financing costs for the first quarter of 2022 primarily reflect non-cash write-offs of such costs upon refinancing 20 mortgages with the KeyBank credit facility and mortgage repayments related to four asset sales. |
| (d) | Abandoned pursuit costs for the first quarter of 2022 primarily reflect the write-off of due diligence costs incurred due to our decision not to extend the February 18, 2022 termination date for our agreement to purchase a portfolio of 10 properties leased to Walgreens, which we abandoned due to inability to obtain the mortgage servicer's approval prior to the contract termination date and changes in market conditions. |
| (e) | AFFO for the fourth quarter of 2022 includes an early termination fee of $3,751,984 received from Sutter Health.. |
| (f) | The increase in diluted shares outstanding beginning in the first quarter of 2022 primarily reflects the issuance of 1,312,382 Class C interests in our operating partnership (OP Units”) as partial consideration for the acquisition of a retail property located on Interstate 405 in Carson, CA, leased to a KIA auto dealership. |
| (g) | Includes the Class C, Class M, Class P and Class R OP Units to compute the weighted average number of shares for each of the four quarters ended in 2022 presented above and the Class M, Class P and Class R OP Units to compute the weighted average number of shares for the quarter ended in 2021 presented above. |
8
Adjusted EBITDA - Last Five Quarters
(Unaudited)
| Three Months Ended | |||||||||||||||||||||
| December 31, 2022 | September 30, 2022 | June 30, 2022 | March 31, 2022 | December 31, 2021 | |||||||||||||||||
| Net (loss) income (in accordance with GAAP) | $ | 720,735 | $ | 4,450,767 | $ | 2,390,344 | $ | (12,073,164 | ) | $ | (2,178,469 | ) | |||||||||
| Add: | Depreciation and amortization | 4,347,809 | 3,598,592 | 3,682,681 | 3,300,492 | 3,449,407 | |||||||||||||||
| Depreciation and amortization for unconsolidated investment in a real estate property | 203,554 | 192,551 | 190,468 | 190,468 | 189,439 | ||||||||||||||||
| Interest expense | 2,826,490 | 2,514,838 | 1,197,155 | 1,568,175 | 1,874,867 | ||||||||||||||||
| Loss on early extinguishment of debt (a) | — | — | — | 1,725,318 | — | ||||||||||||||||
| Interest expense on unconsolidated investment in real estate property | 98,073 | 98,624 | 98,135 | 97,645 | 100,257 | ||||||||||||||||
| Impairment of real estate investment property (b) | 2,080,727 | — | — | — | — | ||||||||||||||||
| Impairment of goodwill and intangible assets (c) | — | — | — | 17,320,857 | 3,767,190 | ||||||||||||||||
| Stock compensation | 660,171 | 549,240 | 679,747 | 511,865 | 629,542 | ||||||||||||||||
| Acquisition fees and due diligence expenses, including abandoned pursuit costs | 25,051 | 44,863 | 4,639 | 586,669 | (16,100 | ) | |||||||||||||||
| Less: | Gain on sale of real estate investments | (669,185 | ) | (3,932,029 | ) | (720,071 | ) | (6,875,086 | ) | (2,338,904 | ) | ||||||||||
| Adjusted EBITDA | $ | 10,293,425 | $ | 7,517,446 | $ | 7,523,098 | $ | 6,353,239 | $ | 5,477,229 | |||||||||||
| Annualized adjusted EBITDA | $ | 41,173,698 | $ | 30,069,783 | $ | 30,092,392 | $ | 25,412,956 | $ | 21,908,916 | |||||||||||
| Net debt: | |||||||||||||||||||||
| Debt | $ | 197,515,009 | $ | 201,365,536 | $ | 201,425,173 | $ | 165,509,220 | $ | 183,033,756 | |||||||||||
| Debt of unconsolidated investment in real estate property (d) | 9,487,515 | 9,487,515 | 9,599,182 | 9,653,689 | 9,709,710 | ||||||||||||||||
| Cash and restricted cash | (8,608,649 | ) | (5,726,888 | ) | (11,705,449 | ) | (25,344,063 | ) | (58,407,520 | ) | |||||||||||
| Cash of unconsolidated investment in real estate property (d) | (218,424 | ) | (341,007 | ) | (585,357 | ) | (458,948 | ) | (502,041 | ) | |||||||||||
| $ | 198,175,450 | $ | 204,785,156 | $ | 198,733,549 | $ | 149,359,898 | $ | 133,833,905 | ||||||||||||
| Net debt / Adjusted EBITDA | 4.8x | 6.8x | 6.6x | 5.9x | 6.1x | ||||||||||||||||
| (a) | Loss on early extinguishment of debt includes non-recurring charges for (i) $1,164,998 in non-cash write-offs of deferred financing costs upon refinancing 20 mortgages and the prior credit facility with the KeyBank credit facility and mortgage repayments related to four asset sales; (ii) $615,336 of mortgage prepayment fees; and (iii) $733,000 of swap termination fees related to refinancing four mortgages with the KeyBank credit facility and the related write-off of unrealized valuation losses of $788,016. |
| (b) | Impairment of real estate investment property represents an impairment charge for a property located in Rocklin, California to reflect its net realizable value as a result of its reclassification to asset held for sale. The sale of this property is expected to close by March 31, 2023. |
| (c) | Goodwill, which relates to the 2019 acquisition of our former sponsor’s crowdfunding platform, was impaired in the first quarter of 2022 in accordance with GAAP given that the market value of our common stock is materially below our historical net asset value and the book value of our equity. The impairment of intangible assets in the fourth quarter of 2021 relates to our decision to terminate our crowdfunding operations. |
| (d) | Includes our approximate 72.71% pro rata share of the tenant-in-common's mortgage note payable and cash. |
9
Leverage Ratio
(Unaudited)
In connection with entering into the KeyBank credit facility on January 18, 2022, we modified the calculation of our leverage ratio to conform with the definition used in our KeyBank credit facility as set forth below.
December 31, 2022 | December 31, 2021 (d) | |||||||
Total Asset Value | ||||||||
| Cash and cash equivalents (a) | $ | 8,608,649 | $ | 58,407,520 | ||||
| Borrowing base value (b) | 408,598,973 | 362,497,305 | ||||||
| Other real estate value (c) | 97,340,000 | 130,670,000 | ||||||
| Pro-rata share of unconsolidated investment | 28,582,595 | 28,728,063 | ||||||
| Total asset value | $ | 543,130,217 | $ | 580,302,888 | ||||
Indebtedness | ||||||||
| Credit facility revolver | $ | 3,000,000 | $ | 55,775,000 | ||||
| Credit facility term loan | 150,000,000 | 100,000,000 | ||||||
| Mortgage debt (c) | 44,515,009 | 66,833,439 | ||||||
| Pro-rata share of unconsolidated investment | 9,487,515 | 9,709,710 | ||||||
| Total indebtedness | $ | 207,002,524 | $ | 232,318,149 | ||||
| Leverage Ratio | 38 | % | 40 | % | ||||
| (a) | The decrease in cash and cash equivalents primarily reflects the use of cash to fund a portion of the acquisitions in 2022. |
| (b) | The increase in the borrowing base value reflects the additions of (i) eight industrial properties acquired in April 2022 which are leased to Lindsay Precast and (ii) the Producto and Valtir acquisitions in July and August 2022. These additions were partially offset by the three office properties sold in June, August and September 2022 and one retail property sold in December 2022. |
| (c) | The decrease in other real estate value and mortgage debt primarily reflects the four property dispositions in February 2022. |
10
Capitalization as of December 31, 2022
(Unaudited)
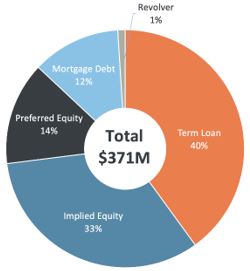
| PREFERRED EQUITY | ||||
| 7.375% Series A Cumulative Redeemable Perpetual Preferred Stock | $ | 50,000,000 | ||
| % of Total Capitalization | 14 | % | ||
| COMMON EQUITY | ||||
| Shares of Class C Common Stock | 7,512,353 | |||
| OP Units (Class M, Class P, Class R and Class C) | 2,818,689 | |||
| Total Class C Common Stock and OP Units | 10,331,042 | |||
Price Per Share / Unit at December 31, 2022 | $ | 12.00 | ||
| IMPLIED EQUITY MARKET CAPITALIZATION | $ | 123,972,504 | ||
| % of Total Capitalization | 33 | % | ||
| DEBT | ||||
| Mortgage Debt | ||||
| Costco Property | $ | 18,850,000 | ||
| Taylor Fresh Foods Property | 12,350,000 | |||
| Sutter Health Property | 13,315,009 | |||
| Total Mortgage Debt | $ | 44,515,009 | ||
| KeyBank Credit Facility | ||||
| Revolver | $ | 3,000,000 | ||
| Term Loan (a) & (b) | 150,000,000 | |||
| Total Credit Facility | $ | 153,000,000 | ||
| TOTAL DEBT | $ | 197,515,009 | ||
| % of Total Capitalization | 53 | % | ||
| % of Total Debt - Floating Rate Debt | 2 | % | ||
% of Total Debt - Fixed Rate Debt (a) & (b) | 98 | % | ||
| % of Total Debt | 100 | % | ||
| ENTERPRISE VALUE | ||||
| Total Capitalization | $ | 371,487,513 | ||
| Less: Cash and Cash Equivalents | (8,608,649 | ) | ||
| Enterprise Value | $ | 362,878,864 | ||
| (a) | On May 10, 2022, we purchased a five-year swap at 2.258% on our $150,000,000 term loan that results in a fixed interest rate of 3.858% when our leverage ratio is less than or equal to 40%. As part of this transaction, we sold a one-time option to terminate the swap on December 31, 2024, which reduced the swap rate. Under our Credit Agreement, the interest rate will continue to vary based on our leverage ratio. |
| (b) | On October 26, 2022, we purchased another five-year swap at 3.440% on our $100,000,000 term loan commitment that will result in a fixed interest rate of 5.04% when our leverage ratio is less than or equal to 40%. As part of this transaction, we sold a one-time option to terminate the swap on December 31, 2024, which reduced the swap rate. Under our Credit Agreement, the interest rate will continue to vary based on our leverage ratio. |
11
Consolidated Balance Sheets
(Unaudited)
December 31, 2022 | December 31, 2021 | |||||||
Assets | ||||||||
| Real estate investments: | ||||||||
| Land | $ | 103,657,237 | $ | 61,005,402 | ||||
| Buildings and improvements | 329,867,099 | 250,723,446 | ||||||
| Equipment | 4,429,000 | — | ||||||
| Tenant origination and absorption costs | 19,499,749 | 22,027,054 | ||||||
| Total investments in real estate property | 457,453,085 | 333,755,902 | ||||||
| Accumulated depreciation and amortization | (46,752,322 | ) | (37,611,133 | ) | ||||
| Total investments in real estate property, net | 410,700,763 | 296,144,769 | ||||||
| Unconsolidated investment in a real estate property | 10,007,420 | 9,941,338 | ||||||
| Total real estate investments excluding real estate investments held for sale, net | 420,708,183 | 306,086,107 | ||||||
| Real estate investments held for sale, net | 5,255,725 | 31,510,762 | ||||||
| Total real estate investments, net | 425,963,908 | 337,596,869 | ||||||
| Cash and cash equivalents | 8,608,649 | 55,965,550 | ||||||
| Restricted cash | — | 2,441,970 | ||||||
| Receivable from sale of early termination of lease | — | 1,836,767 | ||||||
| Tenant receivables | 8,859,329 | 5,996,919 | ||||||
| Above-market lease intangibles, net | 1,850,756 | 691,019 | ||||||
| Prepaid expenses and other assets | 6,100,937 | 5,856,255 | ||||||
| Interest rate swap derivative | 4,629,702 | — | ||||||
| Assets related to real estate investments held for sale | 12,765 | 788,296 | ||||||
| Goodwill | — | 17,320,857 | ||||||
| Total assets | $ | 456,026,046 | $ | 428,494,502 | ||||
Liabilities and Equity | ||||||||
| Mortgage notes payable, net | $ | 44,435,556 | $ | 152,223,579 | ||||
| Mortgage notes payable related to real estate investments held for sale, net | — | 21,699,912 | ||||||
| Total mortgage notes payable, net | 44,435,556 | 173,923,491 | ||||||
| Credit facility revolver | 3,000,000 | 8,022,000 | ||||||
| Credit facility term loan, net | 148,018,164 | — | ||||||
| Accounts payable, accrued and other liabilities | 9,245,933 | 11,844,881 | ||||||
| Below-market lease intangibles, net | 9,675,686 | 11,102,940 | ||||||
| Interest rate swap derivatives | 498,866 | 788,016 | ||||||
| Liabilities related to real estate investments held for sale | 117,881 | 383,282 | ||||||
| Total liabilities | 214,992,086 | 206,064,610 | ||||||
| Commitments and contingencies | ||||||||
7.375% Series A cumulative redeemable perpetual preferred stock, $0.001 par value, 2,000,000 shares authorized, issued and outstanding as of December 31, 2022 and 2021 | 2,000 | 2,000 | ||||||
Class C common stock, $0.001 par value, 300,000,000 shares authorized, 7,762,506 shares issued and 7,512,353 shares outstanding as of December 31, 2022 and 7,426,636 shares issued and outstanding as of December 31, 2021 | 7,762 | 7,427 | ||||||
Class S common stock, $0.001 par value, 100,000,000 shares authorized, no shares issued and outstanding as of December 31, 2022 and 63,768 shares issued and outstanding as of December 31, 2021 | — | 64 | ||||||
| Additional paid-in-capital | 278,349,384 | 273,441,831 | ||||||
Treasury stock, at costs, 250,153 shares held as of December 31, 2022 and no shares as of December 31, 2021 | (4,161,618 | ) | — | |||||
| Cumulative distributions and net losses | (117,949,240 | ) | (101,624,430 | ) | ||||
| Accumulated other comprehensive income | 3,502,616 | — | ||||||
| Total Modiv Inc. equity | 159,750,904 | 171,826,892 | ||||||
| Noncontrolling interests in the Operating Partnership | 81,283,056 | 50,603,000 | ||||||
| Total equity | 241,033,960 | 222,429,892 | ||||||
| Total liabilities and equity | $ | 456,026,046 | $ | 428,494,502 | ||||
12
Modiv Inc.
Debt Overview
(Unaudited)
| Outstanding Balance | |||||||||||||||||||||
| Collateral | December 31, 2022 | December 31, 2021 | Contractual Interest Rate | Effective Interest Rate | Loan Maturity | ||||||||||||||||
| Mortgage Notes: | |||||||||||||||||||||
| Costco property | $ | 18,850,000 | $ | 18,850,000 | 4.85 | % | 4.85 | % | 1/1/30 | ||||||||||||
| Taylor Fresh Foods property | 12,350,000 | 12,350,000 | 3.85 | % | 3.85 | % | 11/1/29 | ||||||||||||||
| Sutter Health property | 13,315,009 | 13,597,120 | 4.50 | % | 4.50 | % | 3/9/24 | ||||||||||||||
| Various mortgage notes repaid on January 18, 2022 (a) | — | 108,178,317 | Various | Various | Various | ||||||||||||||||
| 44,515,009 | 152,975,437 | ||||||||||||||||||||
| Plus unamortized mortgage premium | 119,245 | 204,281 | |||||||||||||||||||
| Less unamortized deferred financing costs | (198,698 | ) | (956,139 | ) | |||||||||||||||||
| Mortgage notes payable, net | 44,435,556 | 152,223,579 | |||||||||||||||||||
| KeyBank Credit Facility: | |||||||||||||||||||||
| Revolver (a) | 3,000,000 | — | (b) | (b) | 1/18/26 | ||||||||||||||||
| Term loan (a)(d)(e) | 150,000,000 | — | (c) | (c) | 1/18/27 | ||||||||||||||||
| Bank of California Credit Facility (a) | — | 8,022,000 | (f) | (f) | n/a | ||||||||||||||||
| Total Credit Facility | 153,000,000 | 8,022,000 | |||||||||||||||||||
| Less unamortized deferred financing costs | (1,981,836 | ) | (100,080 | ) | |||||||||||||||||
| 151,018,164 | 7,921,920 | ||||||||||||||||||||
| Total debt, net | $ | 195,453,720 | $ | 160,145,499 | |||||||||||||||||
| (a) | On January 18, 2022, we refinanced 20 mortgage notes and our prior credit facility with the KeyBank Credit Facility. During the second quarter of 2022, we borrowed $44,000,000 to fund the Lindsay Acquisition, drew the remaining $50,000,000 available under the Term loan commitment and reduced the Revolver to $6,775,000 in June 2022 to reduce interest expense. During the third quarter of 2022, we borrowed $28,000,000 to fund the Producto and Valtir acquisitions in July 2022 and made $28,000,000 in principal payments on the Revolver in September with cash generated by office property sales during the quarter to reduce interest expense. During the fourth quarter, a repayment of $3,775,000 was made on the Revolver utilizing proceeds from the Sutter Health early termination fee. |
| (b) | The interest rate on the Revolver is based on our leverage ratio at the end of the prior quarter. With our leverage ratio at 38% as of September 30, 2022, the spread over the Secured Overnight Financing Rate (‘‘SOFR’’), including a 10 basis point credit adjustment, is 165 basis points and the interest rate on the Revolver was 5.96% as of December 31, 2022. We also pay an annual unused fee of up to 25 basis points on the Revolver, depending on the daily amount of the unused commitment. |
| (c) | On May 10, 2022, we purchased a five-year swap at 2.258% on the $150,000,000 term loan that results in a fixed interest rate of 3.858% when our leverage ratio is less than or equal to 40%. As part of this transaction, we agreed to a one-time option to terminate the swap on December 31, 2024, which reduced the swap rate. Under our Credit Facility, the interest rate will continue to vary based on our leverage ratio. |
| (d) | On October 21, 2022, we exercised the accordion feature of our Credit Facility. Our Credit Facility was increased to $400,000,000 and is comprised of a $150,000,000 Revolver and a $250,000,000 Term Loan. The Credit Facility includes an updated accordion option that allows us to request additional Revolver and Term Loan lender commitments up to a total of $750,000,000. On December 20, 2022, the Credit Agreement was amended to allow us to draw on the additional $100,000,000 Term Loan commitment up to five times between December 20, 2022 and April 19, 2023 in exchange for a quarterly unused fee. |
| (e) | On October 26, 2022, we purchased another five-year swap at 3.440% on our $100,000,000 term loan commitment that will result in a fixed interest rate of 5.04% when our leverage ratio is less than or equal to 40%. As part of this transaction, we sold a one-time option to terminate the swap on December 31, 2024, which reduced the swap rate. Under our Credit Agreement, the interest rate will continue to vary based on our leverage ratio. |
| (f) | Under the terms of the prior credit facility with Bank of California, we paid a variable rate of interest on outstanding amounts equal to one percentage point over the prime rate published in The Wall Street Journal, provided that the interest rate in effect on any one day was not less than 4.75% per annum. |
13
Covenants
Credit Facility and Mortgage Notes Covenants
The following is a summary of key financial covenants for our credit facility and mortgage notes, as defined and calculated per the terms of the facility's credit agreement and the mortgage notes' governing documents, respectively, which are included in our filings with the U.S. Securities and Exchange Commission. These calculations, which are not based on U.S. GAAP measurements are presented to demonstrate that as of December 31, 2022, we believe we are in compliance with the covenants.
| Unsecured Credit Facility Covenants | Required | December 31, 2022 | ||||||
| Maximum leverage ratio | <60% | 38% | ||||||
| Minimum fixed charge coverage ratio | >1.50x | 2.00x | ||||||
| Maximum secured indebtedness ratio | 40% | 8% | ||||||
| Minimum consolidated tangible net worth | $ | 210,760,509 | $ | 289,242,981 | ||||
| Minimum investment grade tenants in borrowing base | 30% | 41% | ||||||
| Weighted average lease term (years) | 7 | 13 | ||||||
| Mortgage Notes Key Covenants | Debt service coverage ratio | December 31, 2022 | ||||
| Costco property | N.A. | N.A. | ||||
| Taylor Fresh Foods property | 1.5 | 3.4 | ||||
| Sutter Health property | 1.4 | 2.4 |
14
Real Estate Acquisitions
(Unaudited)
The following table summarizes our property acquisition activity during each of last five quarters ended December 31, 2022.
| Q4 2022 | ||||||||||||||||||||||||||
| Tenant and Location | Property Type | Area (Square Feet) | Lease Terms (Years) | Annual Rent Increase | Acquisition Price | Initial Cap Rate | Weighted Average Cap Rate | |||||||||||||||||||
| None | — | — | — | % | $ | — | — | % | — | % | ||||||||||||||||
| Q3 2022 |
| Tenant and Location | Property Type | Area (Square Feet) | Lease Terms (Years) | Annual Rent Increase | Acquisition Price | Initial Cap Rate | Weighted Average Cap Rate | |||||||||||||||||||
| Producto, two properties acquired in upstate New York | Industrial | 72,373 | 20.0 | 2.0 | % | $ | 5,343,862 | 7.21 | % | 8.8 | % | |||||||||||||||
| Valtir, four properties acquired in Ohio, South Carolina, Texas and Utah | Industrial | 293,612 | 20.0 | (a) | 2.3 | % | 23,375,000 | 7.70 | % | 9.7 | % | |||||||||||||||
| 365,985 | $ | 28,718,862 | 9.5 | % | ||||||||||||||||||||||
| Q2 2022 | ||||||||||||||||||||||||||
| Tenant and Location | Property Type | Area (Square Feet) | Lease Terms (Years) | Annual Rent Increase | Acquisition Price | Initial Cap Rate | Weighted Average Cap Rate | |||||||||||||||||||
| Lindsay Precast, eight properties acquired in Colorado (3), Ohio (2), North Carolina, South Carolina and Florida | Industrial | 618,195 | 25.0 | 2.0 | % | $ | 56,150,000 | 6.65 | % | 8.5 | % | |||||||||||||||
| Q1 2022 | ||||||||||||||||||||||||||
| Tenant and Location | Property Type | Area (Square Feet) | Lease Terms (Years) | Annual Rent Increase | Acquisition Price | Initial Cap Rate | Weighted Average Cap Rate | |||||||||||||||||||
| KIA, Carson, CA | Retail | 72,623 | 25.0 | 2.0 | % | $ | 69,275,000 | 5.7 | % | 7.3 | % | |||||||||||||||
| Kalera, Saint Paul, MN | Industrial | 78,857 | 20.0 | 2.5 | % | 8,079,000 | 7.0 | % | 8.9 | % | ||||||||||||||||
| 151,480 | $ | 77,354,000 | 8.1 | % | ||||||||||||||||||||||
| Q4 2021 | ||||||||||||||||||||||||||
| Tenant and Location | Property Type | Area (Square Feet) | Lease Terms (Years) | Annual Rent Increase | Acquisition Price | Initial Cap Rate | Weighted Average Cap Rate | |||||||||||||||||||
| Arrow Tru-Line, Archbold, OH | Industrial | 206,155 | 20.0 | 2.0 | % | $ | 11,460,000 | 6.7 | % | 8.1 | % | |||||||||||||||
| (a) | The South Carolina and Ohio properties have a 25-year master lease and the Texas and Utah properties have a 15-year master lease. |
15
Real Estate Dispositions
(Unaudited)
The following table summarizes our property disposition activity during each of last five quarters ended December 31, 2022.
| Q4 2022 | ||||||||||||||||||||||||||||||
| Tenant and Location | Property Type | Area (Square Feet) | Acquisition Price | Disposition Price | Net Book Value | Disposition Costs | Gain on Sale | Cap Rate | ||||||||||||||||||||||
| Raising Cane's, San Antonio, TX | Retail | 3,853 | $ | 3,644,221 | $ | 4,313,045 | $ | 3,504,097 | $ | 139,763 | $ | 669,185 | 5.7 | % | ||||||||||||||||
| Q3 2022 | ||||||||||||||||||||||||||||||
| Tenant and Location | Property Type | Area (Square Feet) | Acquisition Price | Disposition Price | Net Book Value | Disposition Costs | Gain on Sale | Cap Rate | ||||||||||||||||||||||
| Williams Sonoma, Summerlin, NV | Office | 35,867 | $ | 7,211,012 | $ | 9,300,000 | $ | 7,339,316 | $ | 335,748 | $ | 1,624,936 | 7.4 | % | ||||||||||||||||
| Wyndham, Summerlin, NV | Office | 41,390 | 10,116,502 | 12,900,000 | 9,960,478 | 632,429 | 2,307,093 | 7.4 | % | |||||||||||||||||||||
| 77,257 | $ | 17,327,514 | $ | 22,200,000 | $ | 17,299,794 | $ | 968,177 | $ | 3,932,029 | 7.4 | % | ||||||||||||||||||
| Q2 2022 | ||||||||||||||||||||||||||||||
| Tenant and Location | Property Type | Area (Square Feet) | Acquisition Price | Disposition Price | Net Book Value | Disposition Costs | Gain on Sale | Cap Rate | ||||||||||||||||||||||
| EMCOR, Cincinnati, OH | Office | 39,385 | $ | 6,138,538 | $ | 6,525,000 | $ | 5,625,571 | $ | 179,358 | $ | 720,071 | 7.8 | % | ||||||||||||||||
| Q1 2022 | ||||||||||||||||||||||||||||||
| Tenant and Location | Property Type | Area (Square Feet) | Acquisition Price | Disposition Price | Net Book Value | Disposition Costs | Gain on Sale | Cap Rate | ||||||||||||||||||||||
| Bon Secours, Richmond, VA | Office | 72,890 | $ | 10,842,907 | $ | 10,200,000 | $ | 9,919,061 | $ | 252,344 | $ | 28,595 | 8.1 | % | ||||||||||||||||
| Omnicare, Richmond, VA | Flex | 51,800 | 7,324,370 | 8,760,000 | 6,650,887 | 218,489 | 1,890,624 | 6.8 | % | |||||||||||||||||||||
| Texas Health, Dallas, TX | Office | 38,794 | 7,689,924 | 7,040,000 | 6,784,168 | 168,352 | 87,480 | 7.9 | % | |||||||||||||||||||||
| Accredo, Orlando, FL | Office | 63,000 | 10,710,500 | 14,000,000 | 8,682,338 | 449,275 | 4,868,387 | 7.3 | % | |||||||||||||||||||||
| 226,484 | $ | 36,567,701 | $ | 40,000,000 | $ | 32,036,454 | $ | 1,088,460 | $ | 6,875,086 | 7.5 | % | ||||||||||||||||||
| Q4 2021 | ||||||||||||||||||||||||||||||
| Tenant and Location | Property Type | Area (Square Feet) | Acquisition Price | Disposition Price | Net Book Value | Disposition Costs | Gain on Sale | Cap Rate | ||||||||||||||||||||||
| Harley Davidson, Bedford, TX | Retail | 70,960 | $ | 13,178,286 | $ | 15,270,000 | $ | 12,541,067 | $ | 390,029 | $ | 2,338,904 | 6.2 | % | ||||||||||||||||
16
Modiv Inc.
Top 10 Tenants
(Unaudited)
| Tenant | Industry | ABR | ABR as a Percentage of Total Portfolio | Area (Square Feet) | Square Feet as a Percentage of Total Portfolio | |||||||||||||
| KIA of Carson | Retail | $ | 3,984,941 | 12 | % | 72,623 | 2 | % | ||||||||||
| Lindsay | Industrial | 3,783,930 | 11 | % | 618,195 | 20 | % | |||||||||||
| Costco Wholesale | Office | 2,362,956 | 7 | % | 97,191 | 3 | % | |||||||||||
| AvAir | Industrial | 2,318,570 | 7 | % | 162,714 | 5 | % | |||||||||||
| 3M | Industrial | 1,856,419 | 6 | % | 410,400 | 13 | % | |||||||||||
| Valtir | Industrial | 1,814,847 | 5 | % | 293,612 | 9 | % | |||||||||||
| Taylor Fresh Foods | Industrial | 1,638,884 | 5 | % | 216,727 | 7 | % | |||||||||||
| FUJIFILM Dimatix (a) | Industrial | 1,630,916 | 5 | % | 91,740 | 3 | % | |||||||||||
| Cummins | Office | 1,520,789 | 4 | % | 87,230 | 3 | % | |||||||||||
| Northrop Grumman (b) | Industrial | 1,274,437 | 4 | % | 107,419 | 3 | % | |||||||||||
| Total Top 10 Tenants | $ | 22,186,689 | 66 | % | 2,157,851 | 68 | % | |||||||||||
| (a) | Reflects our approximate 72.71% tenant-in-common interest (“TIC Interest”). |
| (b) | Reclassified on December 31, 2022 to industrial property from office property to reflect the lessee's change in use since a majority of the square footage of the property is now being used as laboratory space. |
Property Type
(Unaudited)
| Property | Number of Properties | ABR | ABR as a Percentage of Total Portfolio | Area (Square Feet) | Square Feet as a Percentage of Total Portfolio | |||||||||||||||
| Industrial, including TIC Interest (1) | 27 | $ | 19,982,934 | 59 | % | 2,541,792 | 80 | % | ||||||||||||
| Retail | 12 | 6,702,239 | 20 | % | 230,176 | 7 | % | |||||||||||||
| Office (1) | 7 | 6,982,193 | 21 | % | 401,291 | 13 | % | |||||||||||||
| Total Properties | 46 | $ | 33,667,366 | 100 | % | 3,173,259 | 100 | % | ||||||||||||
| (1) | One property was reclassified on December 31, 2022 to industrial from office to reflect the lessee's change in use since a majority of the square footage of the property is now being used as laboratory space. |
17
Tenant Industry Diversification
(Unaudited)
| Industry | Number of Properties | ABR | ABR as a Percentage of Total Portfolio | Area (Square Feet) | Square Feet as a Percentage of Total Portfolio | |||||||||||||||
| Automobile & Components | 2 | $ | 4,549,518 | 13 | % | 148,623 | 5 | % | ||||||||||||
| Transportation | 5 | 4,133,417 | 12 | % | 456,326 | 14 | % | |||||||||||||
| General Retailers | 11 | 3,801,253 | 11 | % | 204,744 | 6 | % | |||||||||||||
| Precast Concrete | 8 | 3,783,928 | 11 | % | 618,195 | 19 | % | |||||||||||||
| Manufacturing | 5 | 3,585,653 | 10 | % | 430,395 | 14 | % | |||||||||||||
| Food, Beverage & Tobacco | 2 | 2,217,374 | 7 | % | 295,584 | 9 | % | |||||||||||||
| Technology Hardware & Equipment | 2 | 2,215,635 | 7 | % | 130,240 | 4 | % | |||||||||||||
| Defense | 2 | 2,126,623 | 6 | % | 153,633 | 5 | % | |||||||||||||
| Materials | 1 | 1,856,419 | 6 | % | 410,400 | 13 | % | |||||||||||||
| Government | 2 | 1,593,142 | 5 | % | 117,606 | 4 | % | |||||||||||||
| Commercial & Professional Services | 2 | 1,566,981 | 5 | % | 70,567 | 2 | % | |||||||||||||
| Consumer Services | 1 | 924,000 | 3 | % | 50,000 | 2 | % | |||||||||||||
| Pharmaceuticals, Biotechnology & Life Sciences | 1 | 645,900 | 2 | % | 20,800 | 1 | % | |||||||||||||
| Energy | 1 | 565,643 | 2 | % | 26,036 | 1 | % | |||||||||||||
| Consumer Durables and Apparel | 1 | 101,880 | — | % | 40,110 | 1 | % | |||||||||||||
| Total | 46 | $ | 33,667,366 | 100 | % | 3,173,259 | 100 | % | ||||||||||||
18
Tenant Geographic Diversification
(Unaudited)
| State | Number of Properties | ABR | ABR as a Percentage of Total Portfolio | Area (Square Feet) | Square Feet as a Percentage of Total Portfolio | |||||||||||||||
| California | 13 | $ | 11,964,073 | 36 | % | 600,395 | 19 | % | ||||||||||||
| Arizona | 2 | 3,957,454 | 12 | % | 379,441 | 12 | % | |||||||||||||
| Ohio | 7 | 3,133,160 | 9 | % | 644,021 | 20 | % | |||||||||||||
| Florida | 3 | 2,689,529 | 8 | % | 237,329 | 8 | % | |||||||||||||
| Washington | 1 | 2,362,956 | 7 | % | 97,191 | 3 | % | |||||||||||||
| Illinois | 1 | 1,856,419 | 5 | % | 410,400 | 13 | % | |||||||||||||
| Tennessee | 1 | 1,520,789 | 5 | % | 87,230 | 3 | % | |||||||||||||
| North Carolina | 2 | 1,369,728 | 4 | % | 134,576 | 4 | % | |||||||||||||
| Texas | 3 | 1,234,022 | 4 | % | 91,913 | 3 | % | |||||||||||||
| South Carolina | 2 | 880,764 | 3 | % | 129,909 | 4 | % | |||||||||||||
| Colorado | 3 | 835,446 | 2 | % | 98,994 | 3 | % | |||||||||||||
| Minnesota | 1 | 578,490 | 2 | % | 78,857 | 3 | % | |||||||||||||
| Utah | 1 | 501,065 | 1 | % | 72,498 | 2 | % | |||||||||||||
| New York | 2 | 388,466 | 1 | % | 72,373 | 2 | % | |||||||||||||
| Maine | 2 | 205,400 | 1 | % | 18,126 | 1 | % | |||||||||||||
| Georgia | 1 | 103,607 | — | % | 10,906 | — | % | |||||||||||||
| Pennsylvania | 1 | 85,998 | — | % | 9,100 | — | % | |||||||||||||
| Total | 46 | $ | 33,667,366 | 100 | % | 3,173,259 | 100 | % | ||||||||||||
19
Lease Expirations
(Unaudited)

10 Years and Thereafter Lease Expirations
As of December 31, 2022 | ||||||||||||||||||||||||||||
| Year | Number of Leases Expiring | Leased Square Footage Expiring | Percentage of Leased Square Footage Expiring | Cumulative Percentage of Leased Square Footage Expiring | Annualized Base Rent Expiring | Percentage of Annualized Base Rent Expiring | Cumulative Percentage of Annualized Base Rent Expiring | |||||||||||||||||||||
| 2023 | 2 | 116,110 | 3.7 | % | 3.7 | % | 311,455 | 0.9 | % | 0.9 | % | |||||||||||||||||
| 2024 | 1 | 87,230 | 2.8 | % | 6.5 | % | 1,520,789 | 4.5 | % | 5.4 | % | |||||||||||||||||
| 2025 | 4 | 154,933 | 4.9 | % | 11.4 | % | 3,678,106 | 10.9 | % | 16.3 | % | |||||||||||||||||
| 2026 | 5 | 280,740 | 8.8 | % | 20.2 | % | 4,808,337 | 14.3 | % | 30.6 | % | |||||||||||||||||
| 2027 | 1 | 64,637 | 2.0 | % | 22.2 | % | 898,954 | 2.7 | % | 33.3 | % | |||||||||||||||||
| 2028 | 1 | 18,827 | 0.6 | % | 22.8 | % | 341,972 | 1.0 | % | 34.3 | % | |||||||||||||||||
| 2029 | 3 | 134,714 | 4.2 | % | 27.0 | % | 2,360,905 | 7.0 | % | 41.3 | % | |||||||||||||||||
| 2030 | 5 | 45,278 | 1.4 | % | 28.4 | % | 463,363 | 1.4 | % | 42.7 | % | |||||||||||||||||
| 2031 | — | — | — | % | 28.4 | % | — | — | % | 42.7 | % | |||||||||||||||||
| 2032 | 2 | 177,204 | 5.6 | % | 34.0 | % | 2,687,570 | 8.0 | % | 50.7 | % | |||||||||||||||||
| Thereafter | 22 | 2,093,586 | 66.0 | % | 100.0 | % | 16,595,915 | 49.3 | % | 100.0 | % | |||||||||||||||||
| Total | 46 | 3,173,259 | 100.0 | % | $ | 33,667,366 | 100.0 | % | ||||||||||||||||||||
20
Modiv Inc.
Disclosures Regarding Non-GAAP and Other Metrics
Notice Involving Non-GAAP Financial Measures
In addition to U.S. GAAP financial measures, this supplemental report contains and may refer to certain non-GAAP financial measures. These non-GAAP financial measures are in addition to, not a substitute for or superior to, measures of financial performance prepared in accordance with GAAP. These non-GAAP financial measures should not be considered replacements for, and should be read together with, the most comparable GAAP financial measures. Reconciliations to the most directly comparable GAAP financial measures and statements of why management believes these measures are useful to investors are provided below.
Funds from Operations (“FFO”) and Adjusted Funds from Operations (“AFFO”)
In order to provide a more complete understanding of the operating performance of a REIT, the National Association of Real Estate Investment Trusts (“Nareit”) promulgated a measure known as FFO. FFO is defined as net income or loss computed in accordance with GAAP, excluding extraordinary items, as defined by GAAP, and gains and losses from sales of depreciable operating property, plus real estate-related depreciation and amortization (excluding amortization of deferred financing costs and depreciation of non-real estate assets), and after adjustment for unconsolidated partnerships, joint ventures and preferred distributions. Because FFO calculations adjust for such items as depreciation and amortization of real estate assets and gains and losses from sales of operating real estate assets (which can vary among owners of identical assets in similar conditions based on historical cost accounting and useful-life estimates), they facilitate comparisons of operating performance between periods and between other REITs. As a result, we believe that the use of FFO, together with the required GAAP presentations, provides a more complete understanding of our performance relative to our competitors and a more informed and appropriate basis on which to make decisions involving operating, financing, and investing activities. It should be noted, however, that other REITs may not define FFO in accordance with the current Nareit definition or may interpret the current Nareit definition differently than we do, making comparisons less meaningful.
Additionally, we use AFFO as a non-GAAP financial measure to evaluate our operating performance. AFFO excludes non-routine and certain non-cash items such as revenues in excess of cash received, amortization of stock-based compensation, deferred rent, amortization of in-place lease valuation intangibles, acquisition-related costs, deferred financing fees, asset impairment write-downs, gain or loss from the extinguishment of debt, unrealized gains (losses) on derivative instruments, and write-offs of transaction costs and other one-time transactions.
We also believe that AFFO is a recognized measure of sustainable operating performance by the REIT industry. Further, we believe AFFO is useful in comparing the sustainability of our operating performance with the sustainability of the operating performance of other real estate companies. We believe that AFFO is a beneficial indicator of our ongoing portfolio performance and ability to sustain our current distribution level. More specifically, AFFO isolates the financial results of our operations. AFFO, however, is not considered an appropriate measure of historical earnings as it excludes certain significant costs that are otherwise included in reported earnings. Further, since the measure is based on historical financial information, AFFO for the period presented may not be indicative of future results or our future ability to pay our dividends. By providing FFO and AFFO, we present information that assists investors in aligning their analysis with management’s analysis of long-term operating activities.
For all of these reasons, we believe the non-GAAP measures of FFO and AFFO, in addition to income (loss) from operations, net income (loss) and cash flows from operating activities, as defined by GAAP, are helpful supplemental performance measures and useful to investors in evaluating the performance of our real estate portfolio. However, a material limitation associated with FFO and AFFO is that they are not indicative of our cash available to fund distributions since other uses of cash, such as capital expenditures at our properties and principal payments of debt, are not deducted when calculating FFO and AFFO. AFFO is useful in assisting management and investors in assessing our ongoing ability to generate cash flow from operations and continue as a going concern in future operating periods. However, FFO and AFFO are not useful measures in evaluating NAV because impairments are taken into account in determining NAV but not in determining FFO and AFFO. Therefore, FFO and AFFO should not be viewed as a more prominent measure of performance than income (loss) from operations, net income (loss) or cash flows from operating activities and each should be reviewed in connection with GAAP measurements.
21
Neither the SEC, Nareit, nor any other applicable regulatory body has opined on the acceptability of the adjustments contemplated to adjust FFO in order to calculate AFFO and its use as a non-GAAP performance measure. In the future, the SEC or Nareit may decide to standardize the allowable exclusions across the REIT industry, and we may have to adjust the calculation and characterization of this non-GAAP measure. Furthermore, as described in the notes to our unaudited condensed consolidated financial statements, the conversion ratios for units of Class M limited partnership interest in the Operating Partnership, units of Class P limited partnership interest in the Operating Partnership and units of Class R limited partnership interest (“Class R OP Units”) in the Operating Partnership can increase if the specified performance hurdles are achieved.
Adjusted EBITDA
We define Adjusted EBITDA as GAAP net income or loss adjusted to exclude depreciation and amortization, gains or losses from the sales of depreciable property, extraordinary items, provisions for impairment on investment in real estate and goodwill and intangibles, interest expense, non-cash items such as non-cash compensation expenses and write-offs of transaction costs and other one-time transactions. We believe these non-GAAP financial measures are useful to investors because they are widely accepted industry measures used by analysts and investors to compare the operating performance of REITs. EBITDA is not a measure of financial performance under GAAP, and our EBITDA may not be comparable to similarly titled measures of other companies. You should not consider our EBITDA as an alternative to net income or cash flows from operating activities determined in accordance with GAAP.
Net Debt
We define Net Debt as gross debt less cash and cash equivalents and restricted cash.
Leverage Ratio
We define our Leverage Ratio as total debt as a percentage of the aggregate fair value of our real estate properties, including our proportionate interest in real estate owned by unconsolidated entities, plus our cash and cash equivalents.
Annualized Base Rent (“ABR”)
ABR represents contractual annual base rent for the next 12 months.
Initial Cap Rate
We define “initial cap rate” for property acquisitions as the initial annual cash rent divided by the purchase price of the property.
Weighted Average Cap Rate
We define “weighted average cap rate” for property acquisitions as the average annual cash rent including rent escalations over the lease term, divided by the purchase price of the property.
22