Exhibit 99.2

NYSE: MDV
QUARTERLY SUPPLEMENTAL DATA
March 31, 2023
Supplemental Information - First Quarter 2023
| Table of Contents | ||
| About the Data | 3 | |
| Company Overview | 4 | |
| Financial Results | ||
| Consolidated Statements of Operations - Last Five Quarters | 5 | |
| Property Portfolio - Statements of Operations - First Quarter of 2023 | 6 | |
| Consolidated Statements of Comprehensive (Loss) Income - Last Five Quarters | 7 | |
| (Loss) Earnings Per Share - Last Five Quarters | 8 | |
| FFO and AFFO - Last Five Quarters | 9 | |
| Property Portfolio - FFO and AFFO - First Quarter of 2023 | 10 | |
| Adjusted EBITDA - Last Five Quarters | 12 | |
| Leverage Ratio | 13 | |
| Balance Sheets and Capitalization | ||
| Capitalization | 14 | |
| Consolidated Balance Sheets | 15 | |
| Property Portfolio - Balance Sheets - First Quarter of 2023 | 16 | |
| Debt Overview | 17 | |
| Credit Facility and Mortgage Notes Covenants | 18 | |
| Real Estate | ||
| Real Estate Acquisitions | 19 | |
| Real Estate Dispositions | 20 | |
| Top 10 Tenants | 21 | |
| Property Type | 21 | |
| Tenant Industry Diversification | 22 | |
| Tenant Geographic Diversification | 23 | |
| Lease Expirations | 24 | |
| Appendix | ||
| Disclosures Regarding Non-GAAP and Other Metrics | 25 | |
2
About the Data
This data and other information described herein are as of and for the three months ended March 31, 2023 unless otherwise indicated. Future performance may not be consistent with past performance and is subject to change and inherent risks and uncertainties. This information should be read in conjunction with Modiv Inc.'s Annual Report on Form 10-K for the year ended December 31, 2022 filed on March 13, 2023 and Quarterly Report on Form 10-Q for the quarter ended March 31, 2023, including the financial statements and management's discussion and analysis of financial condition and results of operations, filed on May 15, 2023.
Forward-Looking Statements
Information set forth herein contains forward-looking statements, which reflect our current views regarding our business, financial performance, growth prospects and strategies, market opportunities, and market trends. Forward-looking statements include all statements that are not historical facts. In some cases, you can identify these forward-looking statements by the use of words such as “outlook,” “believes,” “expects,” “potential,” “continues,” “may,” “will,” “should,” “could,” “seeks,” “approximately,” “projects,” “predicts,” “intends,” “plans,” “estimates,” “anticipates,” or the negative version of these words or other comparable words. All of the forward-looking statements herein are subject to various risks and uncertainties. Assumptions relating to the foregoing involve judgments with respect to, among other things, future economic, competitive and market conditions, and future business decisions, all of which are difficult or impossible to predict accurately and many of which are beyond our control. Although we believe that the expectations reflected in such forward-looking statements are based on reasonable assumptions, our actual results, performance, and achievements could differ materially from those expressed in or by the forward-looking statements and may be affected by a variety of risks and other factors. Accordingly, there are or will be important factors that could cause actual outcomes or results to differ materially from such forward-looking statements. These factors include, but are not limited to, risks and uncertainties related to the COVID-19 pandemic and its related impacts on us and our tenants, general economic conditions, including but not limited to impacts of the Russian war against Ukraine, supply-chain disruptions, increases in the rate of inflation and interest rates, local real estate conditions, tenant financial health, and property acquisitions and dispositions and the timing of any acquisitions and dispositions. These and other risks, assumptions, and uncertainties are described in our filings with the SEC, which are available on the SEC’s website at www.sec.gov. You are cautioned not to place undue reliance on any forward-looking statements included herein. All forward-looking statements are made as of the date of this document and the risk that actual results, performance, and achievements will differ materially from the expectations expressed or referenced herein will increase with the passage of time. We undertake no obligation to publicly update or review any forward-looking statement, whether as a result of new information, future developments, or otherwise, except as required by law.
3
Company Overview
Modiv Inc. (NYSE:MDV) (“Modiv”, the “Company”, “we”, “us” and “our”) is an internally managed real estate investment trust (“REIT”) that acquires, owns and manages a portfolio of single-tenant net-lease real estate. The Company actively acquires critical industrial manufacturing properties with long-term leases to tenants that fuel the national economy and strengthen the nation's supply chains. Driven by an investor-first focus, the Modiv name reflects its commitment to providing investors with MOnthly DIVidends. As of May 15, 2023, Modiv had a $634 million real estate portfolio (based on estimated fair value) comprised of 4.3 million square feet of aggregate leasable area. For more information, please visit: www.modiv.com.
Modiv strives towards a “best-in-class” corporate governance structure through a board of directors and management team with decades of institutional real estate industry experience.
| Management Team: | Independent Directors: | |
| Aaron S. Halfacre | Adam S. Markman | |
| Chief Executive Officer and Director | Chairman of the Board | |
| Raymond J. Pacini | Asma Ishaq | |
| Chief Financial Officer and Secretary | ||
| Sandra G. Sciutto | Curtis B. McWilliams | |
| Chief Accounting Officer | ||
| John C. Raney | Thomas H. Nolan, Jr. | |
| Chief Legal Officer | ||
| William R. Broms | Kimberly Smith | |
| Chief Investment Officer | ||
| Connie Tirondola | ||
Investor Inquiries:
Margaret Boyce, Financial Profiles, Inc.
mboyce@finprofiles.com
310-622-8247
Transfer Agent:
Computershare Trust Company, N.A.
150 Royall Street
Canton, MA 02021
800-736-3001
4
Consolidated Statements of Operations - Last Five Quarters
(Unaudited)
| Three Months Ended | ||||||||||||||||||||
March 31, 2023 | December 31, 2022 | September 30, 2022 | June 30, 2022 | March 31, 2022 | ||||||||||||||||
| Rental income (a) | $ | 10,311,182 | $ | 13,804,540 | $ | 10,303,402 | $ | 10,144,477 | $ | 9,569,613 | ||||||||||
| Expenses: | ||||||||||||||||||||
| General and administrative (b) | 1,908,055 | 2,252,304 | 1,838,388 | 1,615,182 | 2,106,183 | |||||||||||||||
| Stock compensation expense | 660,169 | 660,171 | 549,240 | 679,747 | 511,865 | |||||||||||||||
| Depreciation and amortization | 3,272,061 | 4,347,809 | 3,598,592 | 3,682,681 | 3,300,492 | |||||||||||||||
| Interest expense (c) | 4,018,792 | 2,826,490 | 2,514,838 | 1,197,154 | 1,568,175 | |||||||||||||||
| Property expenses (d) | 1,706,843 | 1,537,691 | 1,415,621 | 1,434,214 | 2,159,865 | |||||||||||||||
| Impairment of real estate investment property (e) | 3,499,438 | 2,080,727 | — | — | — | |||||||||||||||
| Impairment of goodwill | — | — | — | — | 17,320,857 | |||||||||||||||
| Total expenses | 15,065,358 | 13,705,192 | 9,916,679 | 8,608,978 | 26,967,437 | |||||||||||||||
| Gain on sale of real estate investments | — | 669,185 | 3,932,029 | 720,071 | 6,875,086 | |||||||||||||||
| Operating (loss) income | (4,754,176 | ) | 768,533 | 4,318,752 | 2,255,570 | (10,522,738 | ) | |||||||||||||
| Other income (expense): | ||||||||||||||||||||
| Interest income | 53,695 | 5,047 | 1,665 | 1,763 | 13,435 | |||||||||||||||
| Income from unconsolidated investment in a real estate property | 55,567 | 51,312 | 64,358 | 66,868 | 95,464 | |||||||||||||||
| Loss on early extinguishment of debt (f) | — | — | — | — | (1,725,318 | ) | ||||||||||||||
| Other | 65,993 | (104,157 | ) | 65,992 | 66,143 | 65,993 | ||||||||||||||
| Other income (expense), net | 175,255 | (47,798 | ) | 132,015 | 134,774 | (1,550,426 | ) | |||||||||||||
| Net (loss) income | (4,578,921 | ) | 720,735 | 4,450,767 | 2,390,344 | (12,073,164 | ) | |||||||||||||
| Less: net (loss) income attributable to noncontrolling interest in Operating Partnership | (816,199 | ) | (42,508 | ) | 528,540 | 219,214 | (1,928,029 | ) | ||||||||||||
| Net (loss) income attributable to Modiv Inc. | (3,762,722 | ) | 763,243 | 3,922,227 | 2,171,130 | (10,145,135 | ) | |||||||||||||
| Preferred stock dividends | (921,875 | ) | (921,875 | ) | (921,875 | ) | (921,875 | ) | (921,875 | ) | ||||||||||
| Net (loss) income attributable to common stockholders | $ | (4,684,597 | ) | $ | (158,632 | ) | $ | 3,000,352 | $ | 1,249,255 | $ | (11,067,010 | ) | |||||||
| Net (loss) income per share attributable to common stockholders | ||||||||||||||||||||
| Basic | $ | (0.62 | ) | $ | (0.02 | ) | $ | 0.40 | $ | 0.17 | $ | (1.47 | ) | |||||||
| Diluted | $ | (0.62 | ) | $ | (0.02 | ) | $ | 0.35 | $ | 0.14 | $ | (1.47 | ) | |||||||
| Weighted-average number of common shares outstanding | ||||||||||||||||||||
| Basic | 7,532,452 | 7,487,728 | 7,449,968 | 7,478,973 | 7,533,158 | |||||||||||||||
| Diluted (g) | 7,532,452 | 7,487,728 | 10,180,543 | 10,221,490 | 7,533,158 | |||||||||||||||
| Distributions declared per common share (h) | $ | 0.2875 | $ | 0.2875 | $ | 0.2875 | $ | 0.2875 | $ | 0.3875 | ||||||||||
| (a) | Rental income includes tenant reimbursements for property expenses and the fourth quarter of 2022 includes an early termination fee of $3,781,929 received from Sutter Health. |
| (b) | General and administrative expenses in the fourth quarter of 2022 include a $500,000 accrual for estimated costs of relocating our corporate offices to Reno, Nevada. |
| (c) | Interest expense in the first quarter of 2023 includes a $1,722,184 unrealized loss on swap valuations and a $746,853 increase over the first quarter of 2022 in interest expense incurred in excess of derivative cash settlements. |
| (d) | Property expenses are largely offset by tenant reimbursements included in rental income. |
| (e) | The impairment charge for the first quarter of 2023 relates to an office property located in Nashville, Tennessee leased to Cummins, Inc through February 29, 2024. We determined that an impairment charge was triggered by expectations of a shortened holding period and estimated the property's fair value based upon current market comparables. The impairment charge for the fourth quarter of 2022 relates to an office property located in Rocklin, California to reflect the net realizable value as a result of its reclassification to asset held for sale. The sale of this property is scheduled to close by May 31, 2023. |
| (f) | Loss on early extinguishment of debt for the first quarter of 2022 includes non-recurring charges for (i) $1,164,998 in non-cash write-offs of deferred financing costs upon refinancing 20 mortgages and the prior credit facility with the KeyBank credit facility and mortgage repayments related to four asset sales; (ii) $615,336 of mortgage prepayment fees; and (iii) $733,000 of swap termination fees related to four of the mortgages refinanced with the KeyBank credit facility which were more than offset by the related write-off of unrealized valuation gains of $788,016. |
| (g) | Diluted shares outstanding for periods when we reported a net loss do not include the OP Units since they would be anti-dilutive. Diluted shares outstanding in the second and third quarters of 2022 include Class C, Class M, Class P and Class R OP Units since we reported net income for those quarters. |
| (h) | Distributions declared during the first quarter of 2022 include a one-time 13th distribution for 2021 of $0.10 per share paid to stockholders of record on December 31, 2021 based on how many days they held their shares during 2021. |
5
Property Portfolio - Statements of Operations - First Quarter of 2023
(Unaudited)
| Three Months Ended March 31, 2023 | ||||||||||||||||||||
Industrial Core | Tactical Non-Core (1) | Other Non-Core (2) | Non-Property & Other (3) | Consolidated | ||||||||||||||||
| Rental income | $ | 5,756,815 | $ | 2,778,344 | $ | 1,776,023 | $ | — | $ | 10,311,182 | ||||||||||
| Expenses: | ||||||||||||||||||||
| General and administrative | — | — | — | 1,908,055 | 1,908,055 | |||||||||||||||
| Stock compensation expense | — | — | — | 660,169 | 660,169 | |||||||||||||||
| Depreciation and amortization | 1,924,868 | 806,415 | 540,778 | — | 3,272,061 | |||||||||||||||
| Interest expense (4) | 2,003,879 | 875,509 | 491,305 | 648,099 | 4,018,792 | |||||||||||||||
| Property expenses | 424,379 | 387,953 | 894,511 | — | 1,706,843 | |||||||||||||||
| Impairment of real estate investment property | — | — | 3,499,438 | — | 3,499,438 | |||||||||||||||
| Total expenses | 4,353,126 | 2,069,877 | 5,426,032 | 3,216,323 | 15,065,358 | |||||||||||||||
| Operating income (loss) | 1,403,689 | 708,467 | (3,650,009 | ) | (3,216,323 | ) | (4,754,176 | ) | ||||||||||||
| Other income: | ||||||||||||||||||||
| Interest income | — | — | — | 53,695 | 53,695 | |||||||||||||||
| Income from unconsolidated investment in a real estate property | 55,567 | — | — | — | 55,567 | |||||||||||||||
| Other (5) | — | — | — | — | — | |||||||||||||||
| Total other income | — | — | — | 65,993 | 65,993 | |||||||||||||||
| 55,567 | — | — | 119,688 | 175,255 | ||||||||||||||||
| Net income (loss) | 1,459,256 | 708,467 | (3,650,009 | ) | (3,096,635 | ) | (4,578,921 | ) | ||||||||||||
| Less: net loss attributable to noncontrolling interest in Operating Partnership | — | — | — | (816,199 | ) | (816,199 | ) | |||||||||||||
| Net income (loss) attributable to Modiv Inc. | 1,459,256 | 708,467 | (3,650,009 | ) | (2,280,436 | ) | (3,762,722 | ) | ||||||||||||
| Preferred stock dividends | — | — | — | (921,875 | ) | (921,875 | ) | |||||||||||||
| Net income (loss) attributable to common stockholders | $ | 1,459,256 | $ | 708,467 | $ | (3,650,009 | ) | $ | (3,202,311 | ) | $ | (4,684,597 | ) | |||||||
| (1) | We categorize Tactical Non-Core Assets as those assets that offer compelling value-add or opportunistic investment characteristics when measured over a near-term or interim holding period. We currently hold three such assets: (i) our tactical non-core acquisition of a leading KIA auto dealership located in a prime location in Los Angeles County in January 2022, which was structured as an UPREIT transaction resulting in a favorable equity issuance of $32,809,550 Class C OP Units at a cost basis of $25.00 per share; (ii) our recently executed 12 year lease to the State of California's Office of Emergency Services (OES) into one of our existing assets located in Rancho Cordova, California that includes an attractive purchase option by the tenant which we believe has a favorable probability of being executed upon in the next 24 months; and (iii) our property leased to Costco located in Issaquah, Washington which offers compelling redevelopment opportunities following Costco's lease expiration given its higher density infill location and the fact that the land is zoned for additional uses to include flex/R&D and multi-family. |
| (2) | Other non-core assets includes 11 legacy retail properties and five legacy office properties. We define legacy assets as those inherited through prior mergers and acquisitions activity and such assets that were acquired by different management teams utilizing different investment objectives or underwriting criteria. Of the 16 assets, one office property was classified as held for sale as of March 31, 2023 and is scheduled to close by May 31, 2023. We are considering opportunities for the disposition of the remaining 15 properties. |
| (3) | We do not allocate non-property expenses across our property-specific segments; therefore, we report these expenses separately under the Non-Property & Other caption in the table above. Such expenses can include stock compensation expense, general and administrative, interest rate hedges, and other comprehensive items. |
| (4) | Non-Property & Other interest expense includes a net unrealized loss on interest rate swap valuation of $1,722,184 partially offset by derivative cash settlements of $1,074,085. |
| (5) | Other income reflects management fees earned for managing the TIC Interest. |
6
Consolidated Statements of Comprehensive (Loss) Income - Last Five Quarters
(Unaudited)
| Three Months Ended | ||||||||||||||||||||
March 31, 2023 | December 31, 2022 | September 30, 2022 | June 30, 2022 | March 31, 2022 | ||||||||||||||||
| Net (loss) income | $ | (4,578,921 | ) | $ | 720,735 | $ | 4,450,767 | $ | 2,390,344 | $ | (12,073,164 | ) | ||||||||
| Other comprehensive (loss) income: cash flow adjustment | ||||||||||||||||||||
| Unrealized holding (loss) gain on interest rate swap designated as a cash flow hedge (a) | — | (216,200 | ) | 4,255,906 | — | — | ||||||||||||||
| Amortization of unrealized holding gain on interest rate swap (b) | 250,311 | — | — | — | — | |||||||||||||||
| Comprehensive (loss) income | (4,328,610 | ) | 504,535 | 8,706,673 | 2,390,344 | (12,073,164 | ) | |||||||||||||
| Net (loss) income attributable to noncontrolling interest in Operating Partnership | (816,199 | ) | (42,508 | ) | 528,540 | 219,214 | (1,928,029 | ) | ||||||||||||
| Other comprehensive (loss) income attributable to noncontrolling interest in Operating Partnership: | ||||||||||||||||||||
| Unrealized holding (loss) gain on interest rate swap designated as a cash flow hedge (a) | — | (34,942 | ) | 637,429 | — | — | ||||||||||||||
| Amortization of unrealized holding gain on interest rate swap (b) | 37,141 | — | — | — | — | |||||||||||||||
| Comprehensive (loss) income attributable to noncontrolling interest in Operating Partnership | (779,058 | ) | (77,450 | ) | 1,165,969 | 219,214 | (1,928,029 | ) | ||||||||||||
| Comprehensive (loss) income attributable to Modiv Inc. | $ | (3,549,552 | ) | $ | 581,985 | $ | 7,540,704 | $ | 2,171,130 | $ | (10,145,135 | ) | ||||||||
| (a) | Reflects the change in fair value of the hedged derivative instrument for the six months ended December 31, 2022 that was designated as a cash flow hedge for financial accounting purposes beginning July 1, 2022. |
| (b) | Due to the $150 million Term Loan swap's failure to qualify as a cash flow hedge for the quarterly period ended March 31, 2023, the unrealized gain on interest rate swap derivative on the consolidated balance sheet is being amortized on a straight-line basis, as a reduction to interest expense, through the maturity date of the Term Loan. The interest rate swap derivative instrument failed to qualify as a cash flow hedge during the quarter ended March 31, 2023 because the swap was deemed ineffective due to the potential for a reduced term of the swap that could result from the one-time cancellation option on December 31, 2024 as compared with the maturity of the Term Loan. If there is a significant drop in interest rates in the future, this interest rate swap derivative could potentially qualify again as a cash flow hedge. |
7
(Loss) Earnings Per Share - Last Five Quarters
(Unaudited)
| Three Months Ended | ||||||||||||||||||||
March 31, 2023 | December 31, 2022 | September 30, 2022 | June 30, 2022 | March 31, 2022 | ||||||||||||||||
| Numerator - Basic: | ||||||||||||||||||||
| Net (loss) income | $ | (4,578,921 | ) | $ | 720,735 | $ | 4,450,767 | $ | 2,390,344 | $ | (12,073,164 | ) | ||||||||
| Net loss (income) attributable to noncontrolling interest in Operating Partnership | 816,199 | 42,508 | (528,540 | ) | (219,214 | ) | 1,928,029 | |||||||||||||
| Preferred stock dividends | (921,875 | ) | (921,875 | ) | (921,875 | ) | (921,875 | ) | (921,875 | ) | ||||||||||
| Net (loss) income attributable to common stockholders | $ | (4,684,597 | ) | $ | (158,632 | ) | $ | 3,000,352 | $ | 1,249,255 | $ | (11,067,010 | ) | |||||||
| Numerator - Diluted: | ||||||||||||||||||||
| Net (loss) income | $ | (4,578,921 | ) | $ | 720,735 | $ | 4,450,767 | $ | 2,390,344 | $ | (12,073,164 | ) | ||||||||
| Less: preferred stock dividends | (921,875 | ) | (921,875 | ) | (921,875 | ) | (921,875 | ) | (921,875 | ) | ||||||||||
| Net (loss) income attributable to common stockholders | $ | (5,500,796 | ) | $ | (201,140 | ) | $ | 3,528,892 | $ | 1,468,469 | $ | (12,995,039 | ) | |||||||
| Denominator: | ||||||||||||||||||||
| Weighted average shares outstanding - basic | 7,532,452 | 7,487,728 | 7,449,968 | 7,478,973 | 7,533,158 | |||||||||||||||
| Operating Partnership Units - Class C (a) | — | — | 1,312,382 | 1,312,382 | — | |||||||||||||||
| Operating Partnership Units - other (b) | — | — | 1,418,193 | 1,430,135 | — | |||||||||||||||
| Weighted average shares outstanding - diluted | 7,532,452 | 7,487,728 | 10,180,543 | 10,221,490 | 7,533,158 | |||||||||||||||
| (Loss) income per share attributable to common stockholders: | ||||||||||||||||||||
| Basic | $ | (0.62 | ) | $ | (0.02 | ) | $ | 0.40 | $ | 0.17 | $ | (1.47 | ) | |||||||
| Diluted | $ | (0.62 | ) | $ | (0.02 | ) | $ | 0.35 | $ | 0.14 | $ | (1.47 | ) | |||||||
| (a) | We issued 1,312,382 Class C OP Units at an agreed upon value of $25.00 per unit in connection with our January 18, 2022 acquisition of a KIA auto dealership property in an “UPREIT” transaction. These units were not included in the computation of Diluted EPS for the quarters ended March 31, 2023, December 31, 2023 and March 31, 2022 because their effect would be anti-dilutive. |
| (b) | During the three months ended March 31, 2023, December 31, 2022 and March 31, 2022, the weighted average dilutive effect of 1,506,307, 1,395,759 and 1,347,958 shares, respectively, related to other Operating Partnership units were excluded from the computation of Diluted EPS because their effect would be anti-dilutive. There were no other outstanding securities or commitments to issue common stock that would have a dilutive effect for the periods then ended. |
8
FFO and AFFO - Last Five Quarters
(Unaudited)
| Three Months Ended | ||||||||||||||||||||
March 31, 2023 | December 31, 2022 | September 30, 2022 | June 30, 2022 | March 31, 2022 | ||||||||||||||||
| Net (loss) income (in accordance with GAAP) | $ | (4,578,921 | ) | $ | 720,735 | $ | 4,450,767 | $ | 2,390,344 | $ | (12,073,164 | ) | ||||||||
| Preferred stock dividends | (921,875 | ) | (921,875 | ) | (921,875 | ) | (921,875 | ) | (921,875 | ) | ||||||||||
| Net (loss) income attributable to common stockholders and Class C OP Units | (5,500,796 | ) | (201,140 | ) | 3,528,892 | 1,468,469 | (12,995,039 | ) | ||||||||||||
| FFO adjustments: | ||||||||||||||||||||
| Depreciation and amortization of real estate properties | 3,272,061 | 4,347,809 | 3,598,592 | 3,682,681 | 3,300,492 | |||||||||||||||
| Amortization of lease incentives | 88,570 | 88,752 | 176,296 | 75,655 | 71,394 | |||||||||||||||
| Depreciation and amortization for unconsolidated investment in a real estate property | 194,173 | 203,554 | 192,551 | 190,468 | 190,468 | |||||||||||||||
| Impairment of real estate investment property | 3,499,438 | 2,080,727 | — | — | — | |||||||||||||||
| Gain on sale of real estate investments, net | — | (669,185 | ) | (3,932,029 | ) | (720,071 | ) | (6,875,086 | ) | |||||||||||
| FFO attributable to common stockholders and Class C OP Units | 1,553,446 | 5,850,517 | 3,564,302 | 4,697,202 | (16,307,771 | ) | ||||||||||||||
| AFFO adjustments: | ||||||||||||||||||||
| Impairment of goodwill | — | — | — | — | 17,320,857 | |||||||||||||||
| Non-recurring corporate relocation costs | — | 500,000 | — | — | — | |||||||||||||||
| Stock compensation (a) | 660,169 | 660,170 | 549,240 | 679,747 | 511,865 | |||||||||||||||
| Deferred financing costs (b) | 195,212 | 179,641 | 101,783 | 101,781 | 1,266,725 | |||||||||||||||
| Non-recurring loan prepayment penalties | — | — | — | — | 615,336 | |||||||||||||||
| Swap termination costs | — | — | — | — | 733,000 | |||||||||||||||
| Due diligence expenses, including abandoned pursuit costs (c) | 342,542 | 25,051 | 44,863 | 4,639 | 586,669 | |||||||||||||||
| Deferred rents | (1,175,359 | ) | (643,784 | ) | (976,419 | ) | (981,083 | ) | (636,196 | ) | ||||||||||
| Unrealized (loss) gain on interest rate swaps | 1,722,184 | 505,263 | 59,000 | (589,997 | ) | (788,016 | ) | |||||||||||||
| Amortization of (below) above market lease intangibles | (196,283 | ) | (142,626 | ) | (214,889 | ) | (317,354 | ) | (330,618 | ) | ||||||||||
| Other adjustments for unconsolidated investment in a real estate property | 11,819 | 5,815 | (188 | ) | (188 | ) | (188 | ) | ||||||||||||
| AFFO attributable to common stockholders and Class C OP Units (d) | $ | 3,113,730 | $ | 6,940,047 | $ | 3,127,692 | $ | 3,594,747 | $ | 2,971,663 | ||||||||||
| Weighted average shares outstanding: | ||||||||||||||||||||
| Basic | 7,532,452 | 7,487,728 | 7,449,968 | 7,478,973 | 7,533,158 | |||||||||||||||
| Fully diluted (e) | 10,351,141 | 10,195,869 | 10,180,543 | 10,221,490 | 10,193,498 | |||||||||||||||
| FFO per share: | ||||||||||||||||||||
| Basic | $ | 0.21 | $ | 0.78 | $ | 0.48 | $ | 0.63 | $ | (2.16 | ) | |||||||||
| Fully diluted | $ | 0.15 | $ | 0.57 | $ | 0.35 | $ | 0.46 | $ | (2.16 | ) | |||||||||
| AFFO per share: | ||||||||||||||||||||
| Basic | $ | 0.41 | $ | 0.93 | $ | 0.42 | $ | 0.48 | $ | 0.39 | ||||||||||
| Fully diluted (d) | $ | 0.30 | $ | 0.68 | $ | 0.31 | $ | 0.35 | $ | 0.29 | ||||||||||
| (a) | Stock compensation expense includes (i) amortization of the value of Class P OP Units granted to our Chief Executive Officer and Chief Financial Officer on December 31, 2019; (ii) amortization of the value of Class R OP Units granted to all of our employees, including the Chief Executive Officer and Chief Financial Officer, on January 25, 2021; and (iii) stock granted to our independent directors each quarter as partial consideration for their service as directors. |
| (b) | Deferred financing costs for the first quarter of 2022 primarily reflect non-cash write-offs of such costs upon refinancing 20 mortgages with the KeyBank credit facility and mortgage repayments related to four asset sales. |
| (c) | Abandoned pursuit costs for the first quarter of 2023 primarily reflect the write-off of due diligence costs incurred during 2022 and 2023 for a potential acquisition of a portfolio of industrial manufacturing properties that we abandoned due to changes in market conditions. Abandoned pursuit costs for the first quarter of 2022 primarily reflect the write-off of due diligence costs incurred for a portfolio of 10 properties leased to Walgreens, which we abandoned due to inability to obtain the mortgage servicer's approval prior to the contract termination date and changes in market conditions. |
| (d) | AFFO for the fourth quarter of 2022 includes an early termination fee of $3,751,984 received from Sutter Health. |
| (e) | Includes the Class C, Class M, Class P and Class R OP Units to compute the weighted average number of shares for each of the five quarters ended March 31, 2023 presented above. |
9
Property Portfolio - FFO and AFFO - First Quarter of 2023
(Unaudited)
| Three Months Ended March 31, | ||||||||||||||||||||
Industrial Core | Tactical Non-Core (1) | Other Non-Core (2) | Non-Property & Other (3) | Consolidated | ||||||||||||||||
| Net income (loss) (in accordance with GAAP) | $ | 1,459,256 | $ | 708,467 | $ | (3,650,009 | ) | $ | (3,096,635 | ) | $ | (4,578,921 | ) | |||||||
| Preferred stock dividends | — | — | — | (921,875 | ) | (921,875 | ) | |||||||||||||
| Net income (loss) attributable to common stockholders and Class C OP Unit holders | 1,459,256 | 708,467 | (3,650,009 | ) | (4,018,510 | ) | (5,500,796 | ) | ||||||||||||
| FFO adjustments: | ||||||||||||||||||||
| Depreciation and amortization of real estate properties | 1,924,868 | 806,415 | 540,778 | — | 3,272,061 | |||||||||||||||
| Amortization of lease incentives | 17,177 | — | 71,393 | — | 88,570 | |||||||||||||||
| Depreciation and amortization for unconsolidated investment in a real estate property | 194,173 | — | — | — | 194,173 | |||||||||||||||
| Impairment of real estate investment property | — | — | 3,499,438 | — | 3,499,438 | |||||||||||||||
| FFO attributable to common stockholders and Class C OP Unit holders | 3,595,474 | 1,514,882 | 461,600 | (4,018,510 | ) | 1,553,446 | ||||||||||||||
| AFFO adjustments: | ||||||||||||||||||||
| Stock compensation | — | — | — | 660,169 | 660,169 | |||||||||||||||
| Deferred financing costs | 144,269 | 14,519 | 36,424 | — | 195,212 | |||||||||||||||
| Due diligence expenses, including abandoned pursuit costs | — | — | — | — | — | |||||||||||||||
| Deferred rents | 13,673 | 83 | 328,786 | — | 342,542 | |||||||||||||||
| Unrealized loss (gain) on interest rate swap valuation | (579,161 | ) | (604,781 | ) | 8,583 | — | (1,175,359 | ) | ||||||||||||
| Amortization of (below) above market lease intangibles, net | — | — | — | 1,722,184 | 1,722,184 | |||||||||||||||
| Other adjustments for unconsolidated investment in a real estate property | (207,712 | ) | — | 11,429 | — | (196,283 | ) | |||||||||||||
| AFFO attributable to common stockholders and Class C OP Unit holders | 11,819 | — | — | — | 11,819 | |||||||||||||||
| $ | 2,978,362 | $ | 924,703 | $ | 846,822 | $ | (1,636,157 | ) | $ | 3,113,730 | ||||||||||
| Weighted average shares outstanding: | ||||||||||||||||||||
| Basic | 7,532,452 | 7,532,452 | 7,532,452 | 7,532,452 | 7,532,452 | |||||||||||||||
| Fully diluted (4) | 10,351,141 | 10,351,141 | 10,351,141 | 10,351,141 | 10,351,141 | |||||||||||||||
| FFO Per Share: | ||||||||||||||||||||
| Basic | $ | 0.48 | $ | 0.20 | $ | 0.06 | $ | (0.53 | ) | $ | 0.21 | |||||||||
| Fully Diluted (5) | $ | 0.35 | $ | 0.15 | $ | 0.04 | $ | (0.39 | ) | $ | 0.15 | |||||||||
| AFFO Per Share: | ||||||||||||||||||||
| Basic | $ | 0.40 | $ | 0.12 | $ | 0.11 | $ | (0.22 | ) | $ | 0.41 | |||||||||
| Fully Diluted (5) | $ | 0.29 | $ | 0.09 | $ | 0.08 | $ | (0.16 | ) | $ | 0.30 | |||||||||
10
| (1) | We categorize Tactical Non-Core Assets as those assets that offer compelling value-add or opportunistic investment characteristics when measured over a near-term or interim holding period. We currently hold three such assets: (i) our tactical non-core acquisition of a leading KIA auto dealership located in a prime location in Los Angeles County in January 2022, which was structured as an UPREIT transaction resulting in a favorable equity issuance of $32,809,550 Class C OP Units at a cost basis of $25.00 per share; (ii) our recently executed 12 year lease to the State of California's Office of Emergency Services (OES) into one of our existing assets located in Rancho Cordova, California that includes an attractive purchase option by the tenant which we believe has a favorable probability of being executed upon in the next 24 months; and (iii) our property leased to located in Costco Issaquah, Washington which offers compelling redevelopment opportunities following Costco's lease expiration given its higher density infill location and the fact that the land is zoned for additional uses to include flex/R&D and multi-family. |
| (2) | Other non-core assets includes 11 legacy retail properties and five legacy office properties. We define legacy assets as those inherited through prior mergers and acquisitions activity and such assets that were acquired by different management teams utilizing different investment objectives or underwriting criteria. Of the 16 assets, one office property was classified as held for sale as of March 31, 2023 and is scheduled to close by May 31, 2023. We are considering opportunities for disposition of the remaining 15 properties. |
| (3) | We do not allocate non-property expenses across our property-specific segments; therefore, we report these expenses separately under the Non-Property & Other caption in the table above. Such expenses can include stock compensation expense, general and administrative, interest rate hedges, and other comprehensive items. |
| (4) | Weighted average fully diluted shares outstanding includes the following: |
| (i) | 7,532,452 shares of Class C common stock; |
| (ii) | 1,312,382 Class C OP Units issued on January 18, 2022 in connection with the acquisition of the KIA auto dealership property discussed above. This does not include the 287,516 Class C OP Units issued in April 2023 in conjunction with our acquisition of the property in Reading, Pennsylvania leased to Summit Steel & Manufacturing, LLC. |
| (iii) | 1,189,964 shares of Class C common stock that would result from conversion of 657,949.5 Class M OP Units and 56,029 Class P OP Units assuming a conversion ratio of 1.6667 shares of our Class C Common Stock for each Class M OP Unit and Class P OP Unit outstanding; and |
| (iv) | 316,343 shares of Class C common stock that would result from conversion of Class R OP Units. This does not include 474,515 additional performance-based Class R OP Units that are eligible to be issued by March 31, 2024. |
| (5) | For the intraperiod allocation, we treat all component per share amounts as fully-diluted to correspond with the consolidated FFO and AFFO results reflected above. |
11
Adjusted EBITDA - Last Five Quarters
(Unaudited)
| Three Months Ended | ||||||||||||||||||||
March 31, 2023 | December 31, 2022 | September 30, 2022 | June 30, 2022 | March 31, 2022 | ||||||||||||||||
| Net (loss) income (in accordance with GAAP) | $ | (4,578,921 | ) | $ | 720,735 | $ | 4,450,767 | $ | 2,390,344 | $ | (12,073,164 | ) | ||||||||
| Depreciation and amortization of real estate properties | 3,272,061 | 4,347,809 | 3,598,592 | 3,682,681 | 3,300,492 | |||||||||||||||
| Depreciation and amortization for unconsolidated investment in a real estate property | 194,173 | 203,554 | 192,551 | 190,468 | 190,468 | |||||||||||||||
| Interest expense (a) | 4,018,792 | 2,826,490 | 2,514,838 | 1,197,155 | 1,568,175 | |||||||||||||||
| Loss on early extinguishment of debt (b) | — | — | — | — | 1,725,318 | |||||||||||||||
| Interest expense on unconsolidated investment in real estate property | 95,486 | 98,073 | 98,624 | 98,135 | 97,645 | |||||||||||||||
| Impairment of real estate investment property (c) | 3,499,438 | 2,080,727 | — | — | — | |||||||||||||||
| Impairment of goodwill | — | — | — | — | 17,320,857 | |||||||||||||||
| Stock compensation | 660,169 | 660,171 | 549,240 | 679,747 | 511,865 | |||||||||||||||
| Due diligence expenses, including abandoned pursuit costs | 342,542 | 25,051 | 44,863 | 4,639 | 586,669 | |||||||||||||||
| Gain on sale of real estate investments | — | (669,185 | ) | (3,932,029 | ) | (720,071 | ) | (6,875,086 | ) | |||||||||||
| Adjusted EBITDA (d) | $ | 7,503,740 | $ | 10,293,425 | $ | 7,517,446 | $ | 7,523,098 | $ | 6,353,239 | ||||||||||
| Annualized adjusted EBITDA | 30,014,960 | $ | 41,173,700 | $ | 30,069,784 | $ | 30,092,392 | $ | 25,412,956 | |||||||||||
| Net debt: | ||||||||||||||||||||
| Debt | $ | 214,436,983 | $ | 197,515,009 | $ | 201,365,536 | $ | 201,425,173 | $ | 165,509,220 | ||||||||||
| Debt of unconsolidated investment in real estate property (e) | 9,429,343 | 9,487,515 | 9,544,131 | 9,599,182 | 9,653,689 | |||||||||||||||
| Cash and restricted cash | (13,280,104 | ) | (8,608,649 | ) | (5,726,888 | ) | (11,705,449 | ) | (25,344,063 | ) | ||||||||||
| Cash of unconsolidated investment in real estate property (e) | (420,947 | ) | (218,424 | ) | (341,007 | ) | (585,357 | ) | (458,948 | ) | ||||||||||
| $ | 210,165,275 | $ | 198,175,450 | $ | 204,841,772 | $ | 198,733,549 | $ | 149,359,898 | |||||||||||
| Net debt / Adjusted EBITDA | 7.0 | x | 4.8 | x | 6.8 | x | 6.6 | x | 5.9 | x | ||||||||||
| (a) | Interest expense in the first quarter of 2023 includes a $1,722,184 unrealized loss on swap valuations and a $746,853 increase over the first quarter of 2022 in interest expense incurred in excess of derivative cash settlements. |
| (b) | Loss on early extinguishment of debt includes non-recurring charges for (i) $1,164,998 in non-cash write-offs of deferred financing costs upon refinancing 20 mortgages and the prior credit facility with the KeyBank credit facility and mortgage repayments related to four asset sales; (ii) $615,336 of mortgage prepayment fees; and (iii) $733,000 of swap termination fees related to refinancing four mortgages with the KeyBank credit facility and the related write-off of unrealized valuation losses of $788,016. |
| (c) | The impairment charge for the first quarter of 2023 relates to an office property located in Nashville, Tennessee leased to Cummins, Inc through February 29, 2024. We determined that an impairment charge was triggered by expectations of a shortened holding period and estimated the property's fair value based upon current market comparables. The impairment charge for the fourth quarter of 2022 relates to an office property located in Rocklin, California to reflect net realizable value as a result of its reclassification to asset held for sale. The sale of this property is scheduled to close by May 31, 2023. |
| (d) | Adjusted EBITDA for the fourth quarter of 2022 includes an early termination fee of $3,781,929 received from Sutter Health. |
| (e) | Includes our approximate 72.71% pro rata share of the tenant-in-common's mortgage note payable and cash of our unconsolidated investment in real estate property. |
12
Leverage Ratio
(Unaudited)
We calculate our leverage ratio in conformance with the definition used in our KeyBank credit facility as set forth below.
March 31, 2023 | December 31, 2022 (d) | |||||||
Total Asset Value | ||||||||
| Cash and cash equivalents | $ | 13,280,104 | $ | 8,608,649 | ||||
| Borrowing base value | 403,178,973 | 408,598,973 | ||||||
| Other real estate value (a) | 114,673,362 | 97,340,000 | ||||||
| Pro-rata share of unconsolidated investment in a real estate property | 28,785,118 | 28,582,595 | ||||||
| Total asset value | $ | 559,917,557 | $ | 543,130,217 | ||||
Indebtedness | ||||||||
| Credit facility revolver | $ | — | $ | 3,000,000 | ||||
| Credit facility term loan | 170,000,000 | 150,000,000 | ||||||
| Mortgage debt | 44,436,983 | 44,515,009 | ||||||
| Pro-rata share of unconsolidated investment in a real estate property | 9,429,343 | 9,487,515 | ||||||
| Total indebtedness | $ | 223,866,326 | $ | 207,002,524 | ||||
| Leverage Ratio | 40 | % | 38 | % | ||||
| (a) | The increase in other real estate value primarily reflects first quarter acquisitions which had not been added to the Borrowing Base as of March 31, 2023. |
13
Capitalization as of March 31, 2023
(Unaudited)
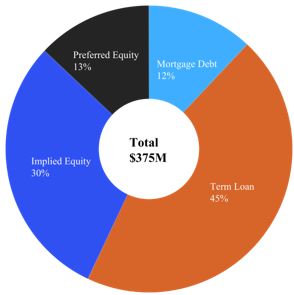
| PREFERRED EQUITY | ||||
| 7.375% Series A Cumulative Redeemable Perpetual Preferred Stock | $ | 50,000,000 | ||
| % of Total Capitalization | 13 | % | ||
| COMMON EQUITY | ||||
| Shares of Class C Common Stock | 7,568,322 | |||
| OP Units (Class M, Class P, Class R and Class C) | 2,818,689 | |||
| Total Class C Common Stock and OP Units | 10,387,011 | |||
Price Per Share / Unit at March 31, 2023 | $ | 10.63 | ||
| IMPLIED EQUITY MARKET CAPITALIZATION | $ | 110,413,927 | ||
| % of Total Capitalization | 30 | % | ||
| DEBT | ||||
| Mortgage Debt | ||||
| Costco Property | $ | 18,850,000 | ||
| Taylor Fresh Foods Property | 12,350,000 | |||
| OES Property | 13,236,983 | |||
| Total Mortgage Debt | $ | 44,436,983 | ||
| KeyBank Credit Facility | ||||
| Revolver | $ | — | ||
| Term Loan (a) & (b) | 170,000,000 | |||
| Total Credit Facility | $ | 170,000,000 | ||
| TOTAL DEBT | $ | 214,436,983 | ||
| % of Total Capitalization | 57 | % | ||
| % of Total Debt - Floating Rate Debt | — | % | ||
% of Total Debt - Fixed Rate Debt (a) & (b) | 100 | % | ||
| % of Total Debt | 100 | % | ||
| ENTERPRISE VALUE | ||||
| Total Capitalization | $ | 374,850,910 | ||
| Less: Cash and Cash Equivalents | (13,280,104 | ) | ||
| Enterprise Value | $ | 361,570,806 | ||
| (a) | On May 10, 2022, we purchased a five-year swap at 2.258% on our $150,000,000 term loan that results in a fixed interest rate of 3.858% when our leverage ratio is less than or equal to 40%. As part of this transaction, we sold a one-time option to terminate the swap on December 31, 2024, which reduced the swap rate. Under our Credit Agreement, the interest rate will continue to vary based on our leverage ratio. |
| (b) | On October 26, 2022, we purchased another five-year swap at 3.440% on our $100,000,000 term loan commitment that will result in a fixed interest rate of 5.04% when our leverage ratio is less than or equal to 40%. As part of this transaction, we sold a one-time option to terminate the swap on December 31, 2024, which reduced the swap rate. Under our Credit Agreement, the interest rate will continue to vary based on our leverage ratio. |
14
Modiv Inc.
Consolidated Balance Sheets
(Unaudited)
March 31, 2023 | December 31, 2022 | |||||||
Assets | ||||||||
| Real estate investments: | ||||||||
| Land | $ | 103,919,101 | $ | 103,657,237 | ||||
| Buildings and improvements | 338,027,128 | 329,867,099 | ||||||
| Equipment | 4,429,000 | 4,429,000 | ||||||
| Tenant origination and absorption costs | 20,085,465 | 19,499,749 | ||||||
| Total investments in real estate property | 466,460,694 | 457,453,085 | ||||||
| Accumulated depreciation and amortization | (50,024,383 | ) | (46,752,322 | ) | ||||
| Total investments in real estate property, net | 416,436,311 | 410,700,763 | ||||||
| Unconsolidated investment in a real estate property | 9,997,292 | 10,007,420 | ||||||
| Total real estate investments excluding real estate investments held for sale, net | 426,433,603 | 420,708,183 | ||||||
| Real estate investments held for sale, net | 5,255,725 | 5,255,725 | ||||||
| Total real estate investments, net | 431,689,328 | 425,963,908 | ||||||
| Cash and cash equivalents | 13,280,104 | 8,608,649 | ||||||
| Tenant receivables | 8,653,550 | 7,263,202 | ||||||
| Above-market lease intangibles, net | 1,808,483 | 1,850,756 | ||||||
| Prepaid expenses and other assets | 5,904,737 | 6,100,937 | ||||||
| Interest rate swap derivative | 3,485,684 | 4,629,702 | ||||||
| Assets related to real estate investments held for sale | 15,939 | 12,765 | ||||||
| Total assets | $ | 464,837,825 | $ | 454,429,919 | ||||
Liabilities and Equity | ||||||||
| Mortgage notes payable, net | $ | 44,338,481 | $ | 44,435,556 | ||||
| Credit facility revolver | — | 3,000,000 | ||||||
| Credit facility term loan, net | 168,140,752 | 148,018,164 | ||||||
| Accounts payable, accrued and other liabilities | 7,338,674 | 7,649,806 | ||||||
| Below-market lease intangibles, net | 9,724,717 | 9,675,686 | ||||||
| Interest rate swap derivatives | 1,327,342 | 498,866 | ||||||
| Liabilities related to real estate investments held for sale | 51,918 | 117,881 | ||||||
| Total liabilities | 230,921,884 | 213,395,959 | ||||||
| Commitments and contingencies | ||||||||
7.375% Series A cumulative redeemable perpetual preferred stock, $0.001 par value, 2,000,000 shares authorized, issued and outstanding as of March 31, 2023 and 2022 | 2,000 | 2,000 | ||||||
Class C common stock, $0.001 par value, 300,000,000 shares authorized, 7,822,940 shares issued and 7,568,322 shares outstanding as of March 31, 2023 and 7,762,506 shares issued and 7,512,353 shares outstanding as of December 31, 2022 | 7,823 | 7,762 | ||||||
Class S common stock, $0.001 par value, 100,000,000 shares authorized, no shares issued and outstanding as of March 31, 2023 and December 31, 2022 | — | — | ||||||
| Additional paid-in-capital | 279,565,984 | 278,339,020 | ||||||
Treasury stock, at cost, 254,618 and 250,153 shares held as of March 31, 2023 and December 31, 2022, respectively | (4,211,300 | ) | (4,161,618 | ) | ||||
| Cumulative distributions and net losses | (124,790,431 | ) | (117,938,876 | ) | ||||
| Accumulated other comprehensive income | 3,289,446 | 3,502,616 | ||||||
| Total Modiv Inc. equity | 153,863,522 | 159,750,904 | ||||||
| Noncontrolling interests in the Operating Partnership | 80,052,419 | 81,283,056 | ||||||
| Total equity | 233,915,941 | 241,033,960 | ||||||
| Total liabilities and equity | $ | 464,837,825 | $ | 454,429,919 | ||||
15
Modiv Inc.
Property Portfolio - Balance Sheets - First Quarter of 2023
(Unaudited)
| March 31, 2023 | ||||||||||||||||||||
| Industrial Core | Tactical Non- Core (1) | Other Non- Core (2) | Non-Property & Other (3) | Consolidated | ||||||||||||||||
Assets | ||||||||||||||||||||
| Real estate investments: | ||||||||||||||||||||
| Land | $ | 48,979,265 | $ | 43,387,936 | $ | 11,551,900 | $ | — | $ | 103,919,101 | ||||||||||
| Buildings and improvements | 206,243,721 | 83,114,194 | 48,669,213 | — | 338,027,128 | |||||||||||||||
| Equipment | 4,429,000 | — | — | — | 4,429,000 | |||||||||||||||
| Tenant origination and absorption costs | 11,104,811 | 4,500,352 | 4,480,302 | — | 20,085,465 | |||||||||||||||
| Total investments in real estate property | 270,756,797 | 131,002,482 | 64,701,415 | — | 466,460,694 | |||||||||||||||
| Accumulated depreciation and amortization | (28,022,301 | ) | (11,132,934 | ) | (10,869,148 | ) | — | (50,024,383 | ) | |||||||||||
| Total investments in real estate property excluding real estate investments held for sale, net, net | 242,734,496 | 119,869,548 | 53,832,267 | — | 416,436,311 | |||||||||||||||
| Unconsolidated investment in a real estate property | 9,997,292 | — | — | — | 9,997,292 | |||||||||||||||
| Total real estate investments, net | 252,731,788 | 119,869,548 | 53,832,267 | — | 426,433,603 | |||||||||||||||
| Real estate investments held for sale, net | — | — | 5,255,725 | — | 5,255,725 | |||||||||||||||
| Total real estate investments, net | 252,731,788 | 119,869,548 | 59,087,992 | — | 431,689,328 | |||||||||||||||
| Cash and cash equivalents | — | — | — | 13,280,104 | 13,280,104 | |||||||||||||||
| Tenant receivables | 5,672,664 | 2,261,779 | 719,107 | — | 8,653,550 | |||||||||||||||
| Above-market lease intangibles, net | 1,372,269 | — | 436,214 | — | 1,808,483 | |||||||||||||||
| Prepaid expenses and other assets (4) | 1,673,671 | 39,652 | 2,011,993 | 2,179,421 | 5,904,737 | |||||||||||||||
| Interest rate swap derivative | — | — | — | 3,485,684 | 3,485,684 | |||||||||||||||
| Assets related to real estate investments held for sale | — | — | 15,939 | — | 15,939 | |||||||||||||||
| Total assets | $ | 261,450,392 | $ | 122,170,979 | $ | 62,271,245 | $ | 18,945,209 | $ | 464,837,825 | ||||||||||
Liabilities and Equity | ||||||||||||||||||||
| Mortgage notes payable, net | $ | 12,218,789 | $ | 32,119,692 | $ | — | $ | — | $ | 44,338,481 | ||||||||||
| Credit facility term loan | 109,291,489 | 30,265,335 | 28,583,928 | — | 168,140,752 | |||||||||||||||
| Accounts payable, accrued and other liabilities | 1,860,919 | 980,213 | 743,011 | 3,754,531 | 7,338,674 | |||||||||||||||
| Below-market lease intangibles, net | 9,558,900 | — | 165,817 | — | 9,724,717 | |||||||||||||||
| Interest rate swap derivatives | — | — | — | 1,327,342 | 1,327,342 | |||||||||||||||
| Liabilities related to real estate investments held for sale | — | — | 51,918 | — | 51,918 | |||||||||||||||
| Total liabilities | 132,930,097 | 63,365,240 | 29,544,674 | 5,081,873 | 230,921,884 | |||||||||||||||
| Commitments and contingencies | ||||||||||||||||||||
| Total Modiv Inc. equity, net of due to affiliates | 128,520,295 | 58,805,739 | 32,726,571 | (66,189,083 | ) | 153,863,522 | ||||||||||||||
| Noncontrolling interests in the Operating Partnership | — | — | — | 80,052,419 | 80,052,419 | |||||||||||||||
| Total equity | 128,520,295 | 58,805,739 | 32,726,571 | 13,863,336 | 233,915,941 | |||||||||||||||
| Total liabilities and equity | $ | 261,450,392 | $ | 122,170,979 | $ | 62,271,245 | $ | 18,945,209 | $ | 464,837,825 | ||||||||||
| (1) | We categorize Tactical Non-Core Assets as those assets that offer compelling value-add or opportunistic investment characteristics when measured over a near-term or interim holding period. We currently hold three such assets: (i) our tactical non-core acquisition of a leading KIA auto dealership located in a prime location in Los Angeles County in January 2022, which was structured as an UPREIT transaction resulting in a favorable equity issuance of $32,809,550 Class C OP Units at a cost basis of $25.00 per share; (ii) our recently executed 12 year lease to the State of California's Office of Emergency Services (OES) into one of our existing assets located in Rancho Cordova, California that includes an attractive purchase option by the tenant which we believe has a favorable probability of being executed upon in the next 24 months; and (iii) our property leased to Costco located in Issaquah, Washington which offers compelling redevelopment opportunities following Costco's lease expiration given its higher density infill location and the fact that the land is zoned for additional uses to include flex/R&D and multi-family. |
| (2) | Other non-core assets includes 11 legacy retail properties and five legacy office properties. We define legacy assets as those inherited through prior mergers and acquisitions activity and such assets that were acquired by different management teams utilizing different investment objectives or underwriting criteria. Of the 16 assets, one office property was classified as held for sale as of March 31, 2023 and is scheduled to close by May 31, 2023. We are considering opportunities for disposition of the remaining 15 properties. |
| (3) | We do not allocate non-property expenses across our property-specific segments; therefore, we report these expenses separately under the Non-Property & Other caption in the table above. Such expenses can include stock compensation expense, general and administrative, interest rate hedges, and other comprehensive items. |
| (4) | Non-Property & Other prepaid expenses and other assets include deferred financing fees on our Revolver and prepaid directors and officers insurance. |
16
Debt Overview
(Unaudited)
| Outstanding Balance | |||||||||||||||||
| Collateral | March 31, 2023 | December 31, 2022 | Contractual Interest Rate | Effective Interest Rate | Loan Maturity | ||||||||||||
| Mortgage Notes: | |||||||||||||||||
| Costco property | $ | 18,850,000 | $ | 18,850,000 | 4.85% | 4.85% | 1/1/2030 | ||||||||||
| Taylor Fresh Foods property | 12,350,000 | 12,350,000 | 3.85% | 3.85% | 11/1/2029 | ||||||||||||
| OES property | 13,236,983 | 13,315,009 | 4.50% | 4.50% | 3/9/2024 | ||||||||||||
| 44,436,983 | 44,515,009 | ||||||||||||||||
| Plus unamortized mortgage premium | 92,962 | 119,245 | |||||||||||||||
| Less unamortized deferred financing costs | (191,464 | ) | (198,698 | ) | |||||||||||||
| Mortgage notes payable, net | 44,338,481 | 44,435,556 | |||||||||||||||
| KeyBank Credit Facility (a): | |||||||||||||||||
| Revolver | — | 3,000,000 | (b) | (b) | 1/18/2026 | ||||||||||||
| Term loan | 170,000,000 | 150,000,000 | (c) | (c) | 1/18/2027 | ||||||||||||
| Total Credit Facility | 170,000,000 | 153,000,000 | |||||||||||||||
| Less unamortized deferred financing costs | (1,859,248 | ) | (1,981,836 | ) | |||||||||||||
| 168,140,752 | 151,018,164 | ||||||||||||||||
| Total debt, net | $ | 212,479,233 | $ | 195,453,720 | |||||||||||||
| (a) | Our Credit Facility which aggregates $400,000,000 is comprised of a $150,000,000 Revolver and a $250,000,000 Term Loan. The Credit Facility includes an accordion option that allows us to request additional Revolver and Term Loan lender commitments up to a total of $750,000,000. As of May 12, 2023, the $250,000,000 Term Loan is fully drawn and the Revolver has no outstanding balance. |
| (b) | The interest rate on the Revolver is based on our leverage ratio at the end of the prior quarter. With our leverage ratio at 38% as of December 31, 2022, the spread over the Secured Overnight Financing Rate (‘‘SOFR’’), including a 10 basis point credit adjustment, is 165 basis points and the interest rate on the Revolver was 6.713% as of May 12, 2023, however there was no outstanding balance. We also pay an annual unused fee of up to 25 basis points on the Revolver, depending on the daily amount of the unused commitment. |
| (c) | To mitigate the risk of rising interest rates, on May 10, 2022, we purchased a five-year swap at 2.258% on the $150,000,000 term loan that results in a fixed interest rate of 3.858% when our leverage ratio is less than or equal to 40%. As part of this transaction, we agreed to a one-time option to terminate the swap on December 31, 2024, which reduced the swap rate. On October 26, 2022, we purchased another five-year swap at 3.440% on our $100,000,000 term loan commitment which results in a fixed interest rate of 5.04% when our leverage ratio is less than or equal to 40%. As part of this transaction, we sold a one-time option to terminate the swap on December 31, 2024, which reduced the swap rate. Under our Credit Agreement, the interest rate will continue to vary based on our leverage ratio. |
17
Covenants
Credit Facility and Mortgage Notes Covenants
The following is a summary of key financial covenants for our credit facility and mortgage notes, as defined and calculated per the terms of the facility's credit agreement and the mortgage notes' governing documents, respectively, which are included in our filings with the U.S. Securities and Exchange Commission. These calculations, which are not based on U.S. GAAP measurements are presented to demonstrate that as of March 31, 2023, we believe we are in compliance with the covenants.
| Unsecured Credit Facility Covenants | Required | March 31, 2023 | ||||||
| Maximum leverage ratio | <60% | 40% | ||||||
| Minimum fixed charge coverage ratio | >1.50x | 1.90x | ||||||
| Maximum secured indebtedness ratio | 40% | 8% | ||||||
| Minimum consolidated tangible net worth | $ | 211,233,527 | $ | 285,397,023 | ||||
| Minimum investment grade tenants in borrowing base | 30% | 42% | ||||||
| Weighted average lease term (years) | 7 | 13 | ||||||
| Mortgage Notes Key Covenants | Debt service coverage ratio | March 31, 2023 | ||||||
| Costco property | N.A. | N.A. | ||||||
| Taylor Fresh Foods property | 1.5 | 2.9 | ||||||
| OES property | 1.4 | 1.9 | ||||||
18
Modiv Inc.
Real Estate Acquisitions
(Unaudited)
The following table summarizes our property acquisition activity during each of last five quarters ended March 31, 2023:
| Q1 2023 | |||||||||||||||||||||||||
| Tenant and Location | Property Type | Area (Square Feet) | Lease Terms (Years) | Annual Rent Increase | Acquisition Price | Initial Cap Rate | Weighted Average Cap Rate | ||||||||||||||||||
| Plastic Products | Industrial | 148,012 | 5.8 | 3.0 | % | $ | 6,368,776 | 7.5 | % | 9.2 | % | ||||||||||||||
| Stealth Manufacturing | Industrial | 55,988 | 20.0 | 2.5 | % | 5,500,000 | 7.7 | % | 9.8 | % | |||||||||||||||
| 204,000 | $ | 11,868,776 | 9.5 | % | |||||||||||||||||||||
| Q4 2022 | ||||||||||||||||||||||||||
| Tenant and Location | Property Type | Area (Square Feet) | Lease Terms (Years) | Annual Rent Increase | Acquisition Price | Initial Cap Rate | Weighted Average Cap Rate | |||||||||||||||||||
| None | — | — | — | % | $ | — | — | % | — | % | ||||||||||||||||
| Q3 2022 | |||||||||||||||||||||||||
| Tenant and Location | Property Type | Area (Square Feet) | Lease Terms (Years) | Annual Rent Increase | Acquisition Price | Initial Cap Rate | Weighted Average Cap Rate | ||||||||||||||||||
| Producto, two properties acquired in upstate New York | Industrial | 72,373 | 20.0 | 2.0 | % | $ | 5,343,862 | 7.21 | % | 8.8 | % | ||||||||||||||
| Valtir, four properties acquired in Ohio, South Carolina, Texas and Utah | Industrial | 293,612 | 20.0 | (a) | 2.3 | % | 23,375,000 | 7.70 | % | 9.7 | % | ||||||||||||||
| 365,985 | $ | 28,718,862 | 9.5 | % | |||||||||||||||||||||
| Q2 2022 | |||||||||||||||||||||||||
| Tenant and Location | Property Type | Area (Square Feet) | Lease Terms (Years) | Annual Rent Increase | Acquisition Price | Initial Cap Rate | Weighted Average Cap Rate | ||||||||||||||||||
| Lindsay Precast, eight properties acquired in Colorado (3), Ohio (2), North Carolina, South Carolina and Florida | Industrial | 618,195 | 25.0 | 2.0 | % | $ | 56,150,000 | 6.65 | % | 8.5 | % | ||||||||||||||
| Q1 2022 | |||||||||||||||||||||||||
| Tenant and Location | Property Type | Area (Square Feet) | Lease Terms (Years) | Annual Rent Increase | Acquisition Price | Initial Cap Rate | Weighted Average Cap Rate | ||||||||||||||||||
| KIA, Carson, CA | Retail | 72,623 | 25.0 | 2.0 | % | $ | 69,275,000 | 5.7 | % | 7.3 | % | ||||||||||||||
| Kalera, Saint Paul, MN | Industrial | 78,857 | 20.0 | 2.5 | % | 8,079,000 | 7.0 | % | 8.9 | % | |||||||||||||||
| 151,480 | $ | 77,354,000 | 8.1 | % | |||||||||||||||||||||
| (a) | The South Carolina and Ohio properties have a 25-year master lease and the Texas and Utah properties have a 15-year master lease. |
19
Modiv Inc.
Real Estate Dispositions
(Unaudited)
The following table summarizes our property disposition activity during each of last five quarters ended March 31, 2023.
| Q1 2023 | |||||||||||||||||||||||||||||||
| Tenant and Location | Property Type | Area (Square Feet) | Acquisition Price | Disposition Price | Net Book Value | Disposition Costs | Gain on Sale | Cap Rate | |||||||||||||||||||||||
| None | — | $ | — | $ | — | $ | — | $ | — | $ | — | — | % | ||||||||||||||||||
| Q4 2022 | |||||||||||||||||||||||||||||||
| Tenant and Location | Property Type | Area (Square Feet) | Acquisition Price | Disposition Price | Net Book Value | Disposition Costs | Gain on Sale | Cap Rate | |||||||||||||||||||||||
| Raising Cane's, San Antonio, TX | Retail | 3,853 | $ | 3,644,221 | $ | 4,313,045 | $ | 3,504,097 | $ | 139,763 | $ | 669,185 | 5.7 | % | |||||||||||||||||
| Q3 2022 | ||||||||||||||||||||||||||||||
| Tenant and Location | Property Type | Area (Square Feet) | Acquisition Price | Disposition Price | Net Book Value | Disposition Costs | Gain on Sale | Cap Rate | ||||||||||||||||||||||
| Williams Sonoma, Summerlin, NV | Office | 35,867 | $ | 7,211,012 | $ | 9,300,000 | $ | 7,339,316 | $ | 335,748 | $ | 1,624,936 | 7.4 | % | ||||||||||||||||
| Wyndham, Summerlin, NV | Office | 41,390 | 10,116,502 | 12,900,000 | 9,960,478 | 632,429 | 2,307,093 | 7.4 | % | |||||||||||||||||||||
| 77,257 | $ | 17,327,514 | $ | 22,200,000 | $ | 17,299,794 | $ | 968,177 | $ | 3,932,029 | 7.4 | % | ||||||||||||||||||
| Q2 2022 | |||||||||||||||||||||||||||||||
| Tenant and Location | Property Type | Area (Square Feet) | Acquisition Price | Disposition Price | Net Book Value | Disposition Costs | Gain on Sale | Cap Rate | |||||||||||||||||||||||
| EMCOR, Cincinnati, OH | Office | 39,385 | $ | 6,138,538 | $ | 6,525,000 | $ | 5,625,571 | $ | 179,358 | $ | 720,071 | 7.8 | % | |||||||||||||||||
| Q1 2022 | ||||||||||||||||||||||||||||||
| Tenant and Location | Property Type | Area (Square Feet) | Acquisition Price | Disposition Price | Net Book Value | Disposition Costs | Gain on Sale | Cap Rate | ||||||||||||||||||||||
| Bon Secours, Richmond, VA | Office | 72,890 | $ | 10,842,907 | $ | 10,200,000 | $ | 9,919,061 | $ | 252,344 | $ | 28,595 | 8.1 | % | ||||||||||||||||
| Omnicare, Richmond, VA | Flex | 51,800 | 7,324,370 | 8,760,000 | 6,650,887 | 218,489 | 1,890,624 | 6.8 | % | |||||||||||||||||||||
| Texas Health, Dallas, TX | Office | 38,794 | 7,689,924 | 7,040,000 | 6,784,168 | 168,352 | 87,480 | 7.9 | % | |||||||||||||||||||||
| Accredo, Orlando, FL | Office | 63,000 | 10,710,500 | 14,000,000 | 8,682,338 | 449,275 | 4,868,387 | 7.3 | % | |||||||||||||||||||||
| 226,484 | $ | 36,567,701 | $ | 40,000,000 | $ | 32,036,454 | $ | 1,088,460 | $ | 6,875,086 | 7.5 | % | ||||||||||||||||||
20
Modiv Inc.
Top 10 Tenants
(Unaudited)
| Tenant | Industry | ABR | ABR as a Percentage of Total Portfolio | Area (Square Feet) | Square Feet as a Percentage of Total Portfolio | |||||||||||||
| KIA of Carson | Tactical Non-Core | $ | 4,184,271 | 12 | % | 72,623 | 2 | % | ||||||||||
| Lindsay | Industrial Core | 3,802,601 | 11 | % | 618,195 | 18 | % | |||||||||||
| Costco Wholesale | Tactical Non-Core | 2,381,180 | 7 | % | 97,191 | 3 | % | |||||||||||
| AvAir | Industrial Core | 2,330,163 | 7 | % | 162,714 | 5 | % | |||||||||||
| 3M | Industrial Core | 1,862,190 | 5 | % | 410,400 | 12 | % | |||||||||||
| Valtir | Industrial Core | 1,824,972 | 5 | % | 293,612 | 9 | % | |||||||||||
| Taylor Fresh Foods | Industrial Core | 1,645,007 | 5 | % | 216,727 | 6 | % | |||||||||||
| FUJIFILM Dimatix (a) | Industrial Core | 1,642,923 | 5 | % | 91,740 | 3 | % | |||||||||||
| Cummins | Non-Core | 1,399,315 | 4 | % | 87,230 | 3 | % | |||||||||||
| Northrop Grumman | Industrial Core | 1,280,614 | 4 | % | 106,592 | 3 | % | |||||||||||
| Total Top 10 Tenants | $ | 22,353,236 | 65 | % | 2,157,024 | 64 | % | |||||||||||
| (a) | Reflects our approximate 72.71% tenant-in-common interest (“TIC Interest”). |
Property Type
(Unaudited)
| Property | Number of Properties | ABR | ABR as a Percentage of Total Portfolio | Area (Square Feet) | Square Feet as a Percentage of Total Portfolio | |||||||||||||||
| Industrial Core, including TIC Interest | 29 | $ | 21,234,259 | 61 | % | 2,744,979 | 81 | % | ||||||||||||
| Tactical Non-Core (1) | 3 | 8,186,799 | 23 | % | 276,406 | 8 | % | |||||||||||||
| Non-Core | 16 | 5,530,141 | 16 | % | 355,061 | 11 | % | |||||||||||||
| Total Properties | 48 | $ | 34,951,199 | 100 | % | 3,376,446 | 100 | % | ||||||||||||
Pro-Forma Property Type (2)
| Property | Number of Properties | ABR | ABR as a Percentage of Total Portfolio | Area (Square Feet) | Square Feet as a Percentage of Total Portfolio | |||||||||||||||
| Industrial Core, including TIC Interest | 36 | $ | 28,063,731 | 67 | % | 3,692,509 | 86 | % | ||||||||||||
| Tactical Non-Core (1) | 3 | 8,186,799 | 20 | % | 276,406 | 7 | % | |||||||||||||
| Non-Core | 16 | 5,530,141 | 13 | % | 314,951 | 7 | % | |||||||||||||
| Total Properties | 55 | $ | 41,780,671 | 100 | % | 4,283,866 | 100 | % | ||||||||||||
| (1) | We categorize Tactical Non-Core Assets as those assets that offer compelling value-add or opportunistic investment characteristics when measured over a near-term or interim holding period. We currently hold three such assets: (i) our tactical non-core acquisition of a leading KIA auto dealership located in a prime location in Los Angeles County in January 2022. This acquisition was structured as an UPREIT transaction resulting in a favorable equity issuance of $32,809,550 in Class C OP Units at a cost basis of $25.00 per share; (ii) our recently executed 12 year lease with the State of California’s Office of Emergency Services (OES) for one of our existing assets located in Rancho Cordova, California that includes an attractive purchase option by the tenant which we believe has a favorable probability of being executed upon in next 24 months; and (iii) our property leased to Costco located in Issaquah, Washington which offers compelling redevelopment opportunities following Costco’s lease expiration given its higher density infill location and the fact that the land is zoned for additional uses to include flex/R&D and multi-family. |
| (2) | Reflects the acquisitions of properties subsequent to March 31, 2023 located in: (i) Gap, Pennsylvania leased to Lindsay Precast, LLC; (ii) Reading, Pennsylvania leased to Summit Steel and Manufacturing, LLC; (iii) Roscoe, Illinois leased to Pacific Bearing Company; (iv) Lansing, Michigan leased to Cameron Tool Company, LLC; (v) Detroit Lakes and Plymouth, Minnesota and Ashland, Ohio leased to S.J. Electro Systems, LLC; and (vi) Alleyton, Texas leased to Titan Production Equipment, LLC. |
21
Tenant Industry Diversification
(Unaudited)
| Industry | Number of Properties | ABR | ABR as a Percentage of Total Portfolio | Area (Square Feet) | Square Feet as a Percentage of Total Portfolio | |||||||||||||||
| Automobile & Components | 2 | $ | 4,980,589 | 14 | % | 148,623 | 4 | % | ||||||||||||
| Manufacturing | 7 | 4,390,515 | 13 | % | 633,582 | 19 | % | |||||||||||||
| Transportation | 5 | 4,155,134 | 12 | % | 456,326 | 14 | % | |||||||||||||
| General Retailers | 12 | 3,827,710 | 11 | % | 244,854 | 7 | % | |||||||||||||
| Precast Concrete | 8 | 3,802,601 | 11 | % | 618,195 | 18 | % | |||||||||||||
| Technology Hardware & Equipment | 2 | 2,231,973 | 6 | % | 130,240 | 4 | % | |||||||||||||
| Food, Beverage & Tobacco | 2 | 2,227,090 | 6 | % | 295,584 | 9 | % | |||||||||||||
| Defense | 2 | 2,139,039 | 6 | % | 153,633 | 5 | % | |||||||||||||
| Materials | 1 | 1,862,190 | 5 | % | 410,400 | 12 | % | |||||||||||||
| Government | 2 | 1,597,225 | 5 | % | 117,606 | 3 | % | |||||||||||||
| Commercial & Professional Services | 2 | 1,579,680 | 4 | % | 70,567 | 2 | % | |||||||||||||
| Consumer Services | 1 | 924,000 | 3 | % | 50,000 | 1 | % | |||||||||||||
| Pharmaceuticals, Biotechnology & Life Sciences | 1 | 649,125 | 2 | % | 20,800 | 1 | % | |||||||||||||
| Energy | 1 | 584,328 | 2 | % | 26,036 | 1 | % | |||||||||||||
| Total | 48 | $ | 34,951,199 | 100 | % | 3,376,446 | 100 | % | ||||||||||||
22
Modiv Inc.
Tenant Geographic Diversification
(Unaudited)
| State | Number of Properties | ABR | ABR as a Percentage of Total Portfolio | Area (Square Feet) | Square Feet as a Percentage of Total Portfolio | |||||||||||||||
| California | 13 | $ | 12,355,459 | 35 | % | 600,395 | 18 | % | ||||||||||||
| Arizona | 2 | 3,975,169 | 11 | % | 379,441 | 11 | % | |||||||||||||
| Ohio | 7 | 3,147,869 | 9 | % | 644,021 | 19 | % | |||||||||||||
| Florida | 3 | 2,705,863 | 8 | % | 237,329 | 7 | % | |||||||||||||
| Washington | 1 | 2,381,179 | 7 | % | 97,191 | 3 | % | |||||||||||||
| Illinois | 1 | 1,862,190 | 5 | % | 410,400 | 12 | % | |||||||||||||
| Minnesota | 3 | 1,496,989 | 4 | % | 282,044 | 8 | % | |||||||||||||
| Tennessee | 1 | 1,399,315 | 4 | % | 87,230 | 3 | % | |||||||||||||
| North Carolina | 2 | 1,377,670 | 4 | % | 134,576 | 4 | % | |||||||||||||
| Texas | 3 | 1,235,270 | 4 | % | 91,913 | 3 | % | |||||||||||||
| South Carolina | 2 | 885,404 | 3 | % | 129,909 | 4 | % | |||||||||||||
| Colorado | 3 | 839,568 | 2 | % | 98,994 | 4 | % | |||||||||||||
| Utah | 1 | 503,857 | 2 | % | 72,498 | 2 | % | |||||||||||||
| New York | 2 | 390,392 | 1 | % | 72,373 | 2 | % | |||||||||||||
| Maine | 2 | 205,400 | 1 | % | 18,126 | — | % | |||||||||||||
| Georgia | 1 | 103,607 | — | % | 10,906 | — | % | |||||||||||||
| Pennsylvania | 1 | 85,998 | — | % | 9,100 | — | % | |||||||||||||
| Total | 48 | $ | 34,951,199 | 100 | % | 3,376,446 | 100 | % | ||||||||||||
23
Modiv Inc.
Lease Expirations
(Unaudited)
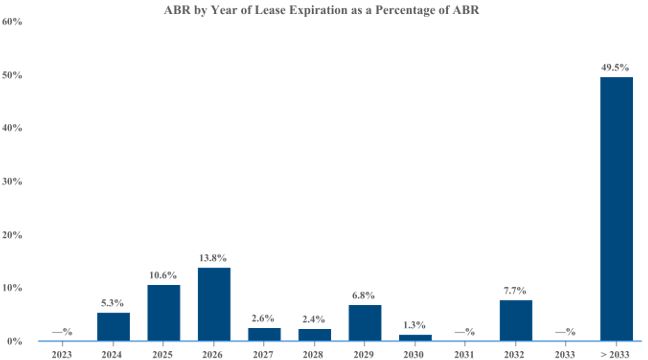
10 Years and Thereafter Lease Expirations
As of March 31, 2023 | ||||||||||||||||||||||||||||
| Year | Number of Leases Expiring | Leased Square Footage Expiring | Percentage of Leased Square Footage Expiring | Cumulative Percentage of Leased Square Footage Expiring | Annualized Base Rent Expiring | Percentage of Annualized Base Rent Expiring | Cumulative Percentage of Annualized Base Rent Expiring | |||||||||||||||||||||
| April to December 2023 (1) | 1 | 40,110 | 1.2 | % | 1.2 | % | — | — | % | — | % | |||||||||||||||||
| 2024 | 2 | 163,230 | 4.8 | % | 6.0 | % | 1,840,633 | 5.3 | % | 5.3 | % | |||||||||||||||||
| 2025 | 4 | 154,933 | 4.6 | % | 10.6 | % | 3,718,240 | 10.6 | % | 15.9 | % | |||||||||||||||||
| 2026 | 5 | 280,740 | 8.3 | % | 18.9 | % | 4,834,094 | 13.8 | % | 29.7 | % | |||||||||||||||||
| 2027 | 1 | 64,637 | 1.9 | % | 20.8 | % | 904,572 | 2.6 | % | 32.3 | % | |||||||||||||||||
| 2028 | 2 | 166,839 | 4.9 | % | 25.7 | % | 844,360 | 2.4 | % | 34.7 | % | |||||||||||||||||
| 2029 | 3 | 134,714 | 4.0 | % | 29.7 | % | 2,371,475 | 6.8 | % | 41.5 | % | |||||||||||||||||
| 2030 | 5 | 45,278 | 1.3 | % | 31.0 | % | 463,363 | 1.3 | % | 42.8 | % | |||||||||||||||||
| 2031 | — | — | — | % | 31.0 | % | — | — | % | 42.8 | % | |||||||||||||||||
| 2032 | 2 | 177,204 | 5.3 | % | 36.3 | % | 2,699,163 | 7.7 | % | 50.5 | % | |||||||||||||||||
| 2033 | — | — | — | % | — | % | — | — | % | — | % | |||||||||||||||||
| Thereafter | 23 | 2,148,761 | 63.7 | % | 100.0 | % | 17,275,299 | 49.5 | % | 100.0 | % | |||||||||||||||||
| Total | 48 | 3,376,446 | 100.0 | % | $ | 34,951,199 | 100.0 | % | ||||||||||||||||||||
| (1) | Reflects one retail property held for sale formerly leased to Gap for which the lease term expired in February 2023. The sale of this property is scheduled to close by May 31, 2023. |
24
Disclosures Regarding Non-GAAP and Other Metrics
Notice Involving Non-GAAP Financial Measures
In addition to U.S. GAAP financial measures, this supplemental report contains and may refer to certain non-GAAP financial measures. These non-GAAP financial measures are in addition to, not a substitute for or superior to, measures of financial performance prepared in accordance with GAAP. These non-GAAP financial measures should not be considered replacements for, and should be read together with, the most comparable GAAP financial measures. Reconciliations to the most directly comparable GAAP financial measures and statements of why management believes these measures are useful to investors are provided below.
Funds from Operations (“FFO”) and Adjusted Funds from Operations (“AFFO”)
In order to provide a more complete understanding of the operating performance of a REIT, the National Association of Real Estate Investment Trusts (“Nareit”) promulgated a measure known as FFO. FFO is defined as net income or loss computed in accordance with GAAP, excluding extraordinary items, as defined by GAAP, and gains and losses from sales of depreciable operating property, plus real estate-related depreciation and amortization (excluding amortization of deferred financing costs and depreciation of non-real estate assets), and after adjustment for unconsolidated partnerships, joint ventures and preferred distributions. Because FFO calculations adjust for such items as depreciation and amortization of real estate assets and gains and losses from sales of operating real estate assets (which can vary among owners of identical assets in similar conditions based on historical cost accounting and useful-life estimates), they facilitate comparisons of operating performance between periods and between other REITs. As a result, we believe that the use of FFO, together with the required GAAP presentations, provides a more complete understanding of our performance relative to our competitors and a more informed and appropriate basis on which to make decisions involving operating, financing, and investing activities. It should be noted, however, that other REITs may not define FFO in accordance with the current Nareit definition or may interpret the current Nareit definition differently than we do, making comparisons less meaningful.
Additionally, we use AFFO as a non-GAAP financial measure to evaluate our operating performance. AFFO excludes non-routine and certain non-cash items such as revenues in excess of cash received, amortization of stock-based compensation, deferred rent, amortization of in-place lease valuation intangibles, acquisition-related costs, deferred financing fees, asset impairment write-downs, gain or loss from the extinguishment of debt, unrealized gains (losses) on derivative instruments, and write-offs of due diligence costs for abandoned pursuits.
We also believe that AFFO is a recognized measure of sustainable operating performance by the REIT industry. Further, we believe AFFO is useful in comparing the sustainability of our operating performance with the sustainability of the operating performance of other real estate companies. We believe that AFFO is a beneficial indicator of our ongoing portfolio performance and ability to sustain our current distribution level. More specifically, AFFO isolates the financial results of our operations. AFFO, however, is not considered an appropriate measure of historical earnings as it excludes certain significant costs that are otherwise included in reported earnings. Further, since the measure is based on historical financial information, AFFO for the period presented may not be indicative of future results or our future ability to pay our dividends. By providing FFO and AFFO, we present information that assists investors in aligning their analysis with management’s analysis of long-term operating activities.
For all of these reasons, we believe the non-GAAP measures of FFO and AFFO, in addition to income (loss) from operations, net income (loss) and cash flows from operating activities, as defined by GAAP, are helpful supplemental performance measures and useful to investors in evaluating the performance of our real estate portfolio. However, a material limitation associated with FFO and AFFO is that they are not indicative of our cash available to fund distributions since other uses of cash, such as capital expenditures at our properties and principal payments of debt, are not deducted when calculating FFO and AFFO. AFFO is useful in assisting management and investors in assessing our ongoing ability to generate cash flow from operations and continue as a going concern in future operating periods. Therefore, FFO and AFFO should not be viewed as a more prominent measure of performance than income (loss) from operations, net income (loss) or cash flows from operating activities and each should be reviewed in connection with GAAP measurements.
25
Neither the SEC, Nareit, nor any other applicable regulatory body has opined on the acceptability of the adjustments contemplated to adjust FFO in order to calculate AFFO and its use as a non-GAAP performance measure. In the future, the SEC or Nareit may decide to standardize the allowable exclusions across the REIT industry, and we may have to adjust the calculation and characterization of this non-GAAP measure. Furthermore, as described in the notes to our unaudited condensed consolidated financial statements, the conversion ratios for units of Class M limited partnership interest in the Operating Partnership, units of Class P limited partnership interest in the Operating Partnership and units of Class R limited partnership interest (“Class R OP Units”) in the Operating Partnership can increase if the specified performance hurdles are achieved.
Adjusted EBITDA
We define Adjusted EBITDA as GAAP net income or loss adjusted to exclude depreciation and amortization, gains or losses from the sales of depreciable property, extraordinary items, provisions for impairment on investment in real estate and goodwill and intangibles, interest expense and non-cash items such as non-cash compensation expenses and write-offs of due diligence costs for abandoned pursuits We believe these non-GAAP financial measures are useful to investors because they are widely accepted industry measures used by analysts and investors to compare the operating performance of REITs. EBITDA is not a measure of financial performance under GAAP, and our EBITDA may not be comparable to similarly titled measures of other companies. You should not consider our EBITDA as an alternative to net income or cash flows from operating activities determined in accordance with GAAP.
Net Debt
We define Net Debt as gross debt less cash and cash equivalents and restricted cash.
Leverage Ratio
We define our Leverage Ratio as total debt as a percentage of the aggregate fair value of our real estate properties, including our proportionate interest in real estate owned by unconsolidated entities, plus our cash and cash equivalents.
Annualized Base Rent (“ABR”)
ABR represents contractual annual base rent for the next 12 months.
Initial Cap Rate
We define “initial cap rate” for property acquisitions as the initial annual cash rent divided by the purchase price of the property.
Weighted Average Cap Rate
We define “weighted average cap rate” for property acquisitions as the average annual cash rent including rent escalations over the lease term, divided by the purchase price of the property.
26