As filed with the Securities and Exchange Commission on May
5
, 2020.Registration No.
333-
236956UNITED STATES
SECURITIES AND EXCHANGE COMMISSION
Washington, D.C. 20549
AMENDMENT NO. 1
TO
FORM
S-1
REGISTRATION STATEMENT
UNDER
THE SECURITIES ACT OF 1933
Albertsons Companies, Inc.
(Exact name of registrant as specified in its charter)
Delaware | 5411 | 47-4376911 | ||
(State or other jurisdiction of incorporation or organization) | (Primary Standard Industrial Classification Code Number) | (I.R.S. Employer Identification No.) |
250 Parkcenter Blvd.
Boise, ID 83706
(208)
395-6200
(Address, including zip code, and telephone number, including area code, of registrant’s principal executive offices)
Robert A. Gordon, Esq.
Executive Vice President and General Counsel
Albertsons Companies, Inc.
250 Parkcenter Blvd.
Boise, ID 83706
(208)
395-6200
(Name, address, including zip code, and telephone number, including area code, of agent for service)
Copies to:
Stuart D. Freedman, Esq. Antonio L. Diaz-Albertini, Esq. Schulte Roth & Zabel LLP 919 Third Avenue New York, NY 10022 Phone: (212) 756-2000 Fax: (212) 593-5955 | William J. Miller, Esq. Cahill Gordon & Reindel LLP 80 Pine Street New York, NY 10005 Phone: (212) 701-3000 Fax: (212) 378-2500 |
Approximate date of commencement of proposed sale to the public:
If any of the securities being registered on this form are to be offered on a delayed or continuous basis pursuant to Rule 415 under the Securities Act of 1933, check the following box.
☐
If this form is filed to register additional securities for an offering pursuant to Rule 462(b) under the Securities Act, check the following box and list the Securities Act registration statement number of the earlier effective registration statement for the same offering.
☐
If this form is a post-effective amendment filed pursuant to Rule 462(c) under the Securities Act, check the following box and list the Securities Act registration statement number of the earlier effective registration statement for the same offering.
☐
If this form is a post-effective amendment filed pursuant to Rule 462(d) under the Securities Act, check the following box and list the Securities Act registration statement number of the earlier effective registration statement for the same offering.
☐
Indicate by check mark whether the registrant is a large accelerated filer, an accelerated filer, a
non-accelerated
filer, smaller reporting company, or an emerging growth company. See the definitions of “large accelerated filer,” “accelerated filer,” “smaller reporting company,” and “emerging growth company” in Rule12b-2
of the Exchange Act.Large accelerated filer | ☐ | Accelerated filer | ☐ | |||
| Non-accelerated filer | ☒ | Smaller reporting company | ☐ | |||
Emerging growth company | ☐ |
If an emerging growth company, indicate by check mark if the registrant has elected not to use the extended transition period for complying with any new or revised financial accounting standards provided pursuant to Section 7(a)(2)(B) of the Securities Act.
☐
CALCULATION OF REGISTRATION FEE
Title of Each Class of Securities to be Registered | Proposed Maximum Aggregate Offering Price(1)(2) | Amount of Registration Fee(3)(4) | ||
Common Stock, par value $0.01 per share | $100,000,000 | $12,980 (7) | ||
Series A mandatory convertible preferred stock, par value $0.01 per share (5) | $100,000,000 | $12,980 (7) | ||
Common Stock, par value $0.01 per share (6) | $ | $ | ||
Total | $ | $ | ||
| (1) | Estimated solely for the purpose of calculating the registration fee pursuant to Rule 457(o) under the Securities Act of 1933, as amended (the “Securities Act”). |
| (2) | Includes the aggregate offering price of additional shares that the underwriters have the option to purchase from the registrant. |
| (3) | Calculated pursuant to Rule 457(o) based on an estimate of the proposed maximum aggregate offering price. |
| (4) | An aggregate registration fee of $11,620 in respect of shares of the registrant’s common stock was previously paid on July 8, 2015 in connection with the registration statement on Form S-1 (No.333-205546). Additionally, an aggregate registration fee of $202,188 in respect of shares of the registrant’s common stock was previously paid on September 25, 2015 in connection withPre-Effective Amendment No. 2 to the registration statement on FormS-1 (No.333-205546). Additionally, an aggregate registration fee of $13,091 in respect of shares of the registrant’s common stock was previously paid on October 2, 2015 in connection withPre-Effective Amendment No. 3 to the registration statement on Form S-1 (No.333-205546). Thus, the aggregate filing fee associated with the registrant in connection with the registration statement on FormS-1 (No.333-205546) was $226,899. The registrant withdrew the registration statement on FormS-1 (No.333-205546) by filing a Form RW on April 6, 2018. The withdrawn registration statement on FormS-1 (No.333-205546) was not declared effective, and no securities were sold thereunder. Pursuant to Rule 457(p), the registrant utilized $225,641 previously paid in connection with the withdrawn registration statement on FormS-1 to offset the filing fee in respect of shares of the registrant’s common stock in connection with the registration statement on FormS-4 (No.333-224169) filed with the Securities and Exchange Commission on April 6, 2018. The registrant terminated the offering and, on August 9, 2018, filed a Post-Effective Amendment No. 1 to FormS-4 (No.333-224169), which Post-Effective Amendment No. 1 to FormS-4 was declared effective on August 14, 2018, to deregister any and all securities registered but unsold or otherwise unissued under the registration statement on FormS-4. Pursuant to Rule 457(p), the registrant hereby offsets $226,899 of the filing fee previously paid in connection with the withdrawn registration statement on FormS-1, of which $225,641 was used to offset the filing fee paid in connection with the terminated offering pursuant to the registration statement on Form S-4, against the filing fee for this registration statement on FormS-1. |
| (5) | In accordance with Rule 457(i) under the Securities Act, this registration statement also registers the shares of our common stock that are initially issuable upon conversion of the Series A preferred stock registered hereby. The number of shares of our common stock issuable upon such conversion is subject to adjustment upon the occurrence of certain events described herein and will vary based on the public offering price of the common stock registered hereby. Pursuant to Rule 416 under the Securities Act, the number of shares of our common stock to be registered includes an indeterminable number of shares of common stock that may become issuable upon conversion of the Series A preferred stock as a result of such adjustments. |
| (6) | This registration statement also registers shares of common stock that may be issued as dividends on the Series A preferred stock in accordance with the terms thereof. |
| (7) | Previously paid. |
The registrant hereby amends this registration statement on such date or dates as may be necessary to delay its effective date until the registrant shall file a further amendment which specifically states that this registration statement shall thereafter become effective in accordance with Section 8(a) of the Securities Act of 1933 or until the registration statement shall become effective on such date as the Securities and Exchange Commission, acting pursuant to said Section 8(a), may determine.
EXPLANATORY NOTE
This Registration Statement contains a prospectus relating to an offering of shares of our common stock (for purposes of this Explanatory Note, the Common Stock Prospectus), together with separate prospectus pages relating to an offering of shares of our Series A preferred stock (for purposes of this Explanatory Note, the Series A Preferred Stock Prospectus). The complete Common Stock Prospectus follows immediately. Following the Common Stock Prospectus are the following alternative and additional pages for the Series A Preferred Stock Prospectus:
| • | front and back cover pages, which will replace the front and back cover pages of the Common Stock Prospectus; |
| • | pages for the “Table of Contents” section, which will replace the “Table of Contents” section of the Common Stock Prospectus; |
| • | pages for the “Prospectus Summary—The Offering” section, which will replace the “Prospectus Summary—The Offering” section of the Common Stock Prospectus; |
| • | pages for the “Risk Factors—Risks Related to this Offering and Owning Our Series A Preferred Stock and Common Stock” section, which will replace the “Risk Factors—Risks Related to this Offering and Owning Our Common Stock” section of the Common Stock Prospectus; |
| • | pages for the “Description of Series A Preferred Stock” section, which will replace the “Concurrent Offering of Series A Preferred Stock” section of the Common Stock Prospectus; |
| • | pages for the “Material U.S. Federal Income Tax Consequences to Holders of Our Series A Mandatory Convertible Preferred Stock” section, which will replace the “Material U.S. Federal Income Tax Consequences to Non-U.S. Holders of Our Common Stock” section of the Common Stock Prospectus; and |
| • | pages for the “Underwriting” section, which will replace the “Underwriting” section of the Common Stock Prospectus. |
In addition, the following disclosures contained within the Common Stock Prospectus will be replaced in the Series A Preferred Stock Prospectus as follows:
| • | references to “this offering” contained in “Explanatory Note,” “Prospectus Summary—Our Corporate Structure,” “Prospectus Summary—Our Sponsors,” “Use of Proceeds,” “Capitalization,” “Dilution,” “Management,” “Certain Relationships and Related Party Transactions,” “Principal and Selling Stockholders,” “Description of Capital Stock” and “Shares Eligible for Future Sale,” “Description of Indebtedness,” and “Where You Can Find Additional Information” of the Common Stock Prospectus will be replaced with references to “the concurrent initial public offering of our common stock” in the Series A Preferred Stock Prospectus; |
| • | references to “common stock” or “our common stock” contained in the first paragraph under “Prospectus Summary,” “Prospectus Summary—Risks Related to Our Business and This Offering,” in the first paragraph under “Risk Factors,” “Legal Matters” and “Where You Can Find Additional Information” of the Common Stock Prospectus will be replaced with a reference to “Series A preferred stock” in the Series A Preferred Stock Prospectus; |
| • | references to “on the cover page of this prospectus” contained in “Prospectus Summary—Our Corporate Structure,” “Prospectus Summary—Our Sponsors,” “Principal and Selling Stockholders,” and “Description of Capital Stock” of the Common Stock Prospectus will be replaced with references to “on the cover page of the prospectus relating to the concurrent initial public offering of our common stock” in the Series A Preferred Stock Prospectus; |
| • | references to “the offering of Series A preferred stock” or “the Series A preferred stock offering” contained in “Prospectus Summary—Our Sponsors,” “Use of Proceeds,” “Capitalization,” “Dilution,” “Certain Relationships and Related Party Transactions,” “Description of Capital Stock,” and “Shares Eligible for Future Sale” of the Common Stock Prospectus will be replaced with references to “this offering” in the Series A Preferred Stock Prospectus; |
| • | the reference to “—Risks Related to this Offering and Owning Our Common Stock—” contained in the last line of the section titled “Prospectus Summary—Our Sponsors” of the Common Stock Prospectus will be replaced with a reference to “—Risks Related to this Offering and Owning of Our Series A Preferred Stock and Common Stock—” in the Series A Preferred Stock Prospectus; |
| • | the first paragraph under “Use of Proceeds” of the Common Stock Prospectus will be removed from the Series A Preferred Stock Prospectus; |
| • | the reference to “—Risks Related to this Offering and Owning Our Common Stock—” contained in the second paragraph of “Dividend Policy” of the Common Stock Prospectus will be replaced with a reference to “—Risks Related to this Offering and Owning of Our Series A Preferred Stock and Common Stock—” in the Series A Preferred Stock Prospectus; |
| • | the section titled “Principal and Selling Stockholders” of the Common Stock Prospectus will be renamed the “Principal Stockholders” in the Series A Preferred Stock Prospectus; and |
| • | the reference to “Concurrent Offering of Series A Preferred Stock” contained in “Description of Capital Stock—Preferred Stock” of the Common Stock Prospectus will be replaced with a reference to “Description of Series A Preferred Stock” in the Series A Preferred Stock Prospectus. |
Each of the complete Common Stock Prospectus and Series A Preferred Stock Prospectus will be filed with the Securities and Exchange Commission in accordance with Rule 424 under the Securities Act of 1933, as amended. The closing of the offering of common stock is conditioned upon the closing of the offering of Series A preferred stock and the closing of the offering of Series A preferred stock is conditioned upon the closing of the offering of common stock.
The information in this preliminary prospectus is not complete and may be changed. These securities may not be sold until the registration statement filed with the Securities and Exchange Commission is effective. This preliminary prospectus is not an offer to sell nor does it seek an offer to buy these securities in any jurisdiction where the offer or sale is not permitted.
Subject to Completion, dated May 5, 2020.
Shares

Albertsons Companies, Inc.
Common Stock
This is an initial public offering of shares of common stock of Albertsons Companies, Inc. The selling stockholders named in this prospectus are selling shares of our common stock. All of the shares of common stock are being sold by the selling stockholders. We will not receive any of the proceeds from the sale of common stock by the selling stockholders.
Prior to this offering, there has been no public market for the common stock. It is currently estimated that the initial public offering price per share will be between $ and $ . We have been approved to list our common stock on the New York Stock Exchange, or NYSE, under the symbol “ACI.”
Concurrently with this offering, we are also making a public offering of shares of our % Series A mandatory convertible preferred stock, $0.01 par value (“Series A preferred stock”). In that offering, we have granted the underwriters an option to purchase up to an additional shares of Series A preferred stock to cover over-allotments. We cannot assure you that the offering of Series A preferred stock will be completed or, if completed, on what terms it will be completed. The closing of this offering is conditioned upon the closing of the offering of Series A preferred stock and the closing of our offering of Series A preferred stock is conditioned upon the closing of this offering.
Investing in our common stock involves a high degree of risk. See “Risk Factors” on page 25 to read about factors you should consider before buying shares of the common stock.
Neither the Securities and Exchange Commission nor any other regulatory body has approved or disapproved of these securities or passed upon the accuracy or adequacy of this prospectus. Any representation to the contrary is a criminal offense.
Per Share | Total | |||||||
Initial public offering price | $ | $ | ||||||
Underwriting discounts and commissions(1) | $ | $ | ||||||
Proceeds to selling stockholders(1) | $ | $ | ||||||
| (1) | See “Underwriting” for additional information regarding underwriting compensation. |
The underwriters may also purchase up to an additional shares of common stock from the selling stockholders, at the initial public offering price, less the underwriting discount and commissions, within 30 days from the date of this prospectus. We will not receive any of the proceeds from the sale of common stock by the selling stockholders in this offering, including from any exercise by the underwriters of their option to purchase additional common stock.
The underwriters expect to deliver the shares against payment on or about , 2020.
BofA Securities | Goldman Sachs & Co. LLC | J.P. Morgan | Citigroup |
Credit Suisse | Morgan Stanley | Wells Fargo Securities | Barclays | Deutsche Bank Securities |
BMO Capital Markets | Evercore ISI | Guggenheim Securities | Oppenheimer & Co. | RBC Capital Markets |
Telsey Advisory Group | MUFG | Academy Securities | Blaylock Van, LLC |
The date of this prospectus is , 2020.

TABLE OF CONTENTS
vi | ||||
1 | ||||
25 | ||||
49 | ||||
51 | ||||
52 | ||||
53 | ||||
55 | ||||
56 | ||||
58 | ||||
79 | ||||
97 | ||||
108 | ||||
131 | ||||
136 | ||||
139 | ||||
143 | ||||
148 | ||||
153 | ||||
161 | ||||
165 | ||||
171 | ||||
171 | ||||
171 | ||||
F- 1 |
Until , 2020 (25 days after the date of this prospectus), all dealers that buy, sell, or trade shares of our common stock, whether or not participating in this initial public offering, may be required to deliver a prospectus. This delivery requirement is in addition to the obligation of dealers to deliver a prospectus when acting as underwriters and with respect to their unsold allotments or subscriptions.
Unless indicated otherwise, the information included in this prospectus assumes that (i) the shares of common stock to be sold in this offering are sold at $ per share, which is the midpoint of the estimated offering range set forth on the cover page of this prospectus and (ii) all shares offered by the selling stockholders in this offering are sold (other than pursuant to the underwriters’ option to purchase additional shares described herein).
We and the selling stockholders have not, and the underwriters have not, authorized anyone to provide any information other than that contained in this prospectus or in any free writing prospectus prepared by or on behalf of us or to which we have referred you. We, the selling stockholders and the underwriters take no responsibility for, and can provide no assurance as to the reliability of, any other information that others may give you. The selling stockholders and the underwriters are offering to sell, and seeking offers to buy, shares of our common stock only in jurisdictions where offers and sales are permitted. The information in this prospectus is accurate only as of the date of this prospectus, regardless of the time of delivery of this prospectus or any sale of shares of our common stock.
i
DEFINITIONS
Unless otherwise indicated or as the context otherwise requires, a reference in this prospectus to:
| • | “ACI” refers to Albertsons Companies, Inc., a Delaware corporation; |
| • | “ACI Institutional Investors” refers to Klaff Realty, L.P., Schottenstein Stores Corp., Lubert-Adler Real Estate Management Company, L.P. (“Lubert-Adler Management”) and Kimco Realty Corporation, and each of their respective controlled affiliates and investment funds; |
| • | “Albertsons” refers to Albertson’s LLC, a Delaware limited liability company and a wholly-owned subsidiary of ACI; |
| • | “Cerberus” refers to Cerberus Capital Management, L.P., a Delaware limited partnership, and investment funds and accounts managed by it and its affiliates; |
| • | “Code” refers to the Internal Revenue Code of 1986, as amended; |
| • | “Exchange Act” refers to the U.S. Securities Exchange Act of 1934, as amended; |
| • | “GAAP” refers to accounting principles generally accepted in the United States of America; |
| • | “NALP” refers to New Albertsons L.P., a Delaware limited partnership and a wholly-owned subsidiary of ACI; |
| • | “Safeway” refers to Safeway Inc., a Delaware corporation and a wholly-owned subsidiary of ACI; |
| • | “SEC” refers to the Securities and Exchange Commission; |
| • | “Securities Act” refers to the U.S. Securities Act of 1933, as amended; |
| • | “Sponsors” refers to Cerberus, the ACI Institutional Investors and their respective controlled affiliates and investment funds; and |
| • | “we,” “our” and “us” refers to ACI and its direct or indirect subsidiaries. |
EXPLANATORY NOTE
ACI is a Delaware corporation. AB Acquisition LLC (“AB Acquisition”) is a Delaware limited liability company. ACI was formed for the purpose of reorganizing the organizational structure of AB Acquisition and its direct and indirect consolidated subsidiaries. Prior to December 3, 2017, ACI had no material assets or operations. On December 3, 2017, Albertsons Companies, LLC, a Delaware limited liability company, and its parent, AB Acquisition, completed a reorganization of their legal entity structure whereby the existing equityholders of AB Acquisition each contributed their equity interests in AB Acquisition to Albertsons Investor Holdings LLC (“Albertsons Investor”) or KIM ACI, LLC (“KIM ACI”). In exchange, equityholders received a proportionate share of units in Albertsons Investor and KIM ACI, respectively. Albertsons Investor and KIM ACI then contributed all of the equity interests they received to ACI in exchange for common stock issued by ACI. As a result, Albertsons Investor and KIM ACI became the parents of ACI, owning all of the outstanding common stock of ACI, with AB Acquisition and its subsidiary, Albertsons Companies, LLC, becoming wholly-owned subsidiaries of ACI. On February 25, 2018, Albertsons Companies, LLC, merged with and into ACI, with ACI as the surviving corporation (the “ACI Reorganization Transactions”). Prior to February 25, 2018, substantially all of the assets and operations of ACI were those of its subsidiary, Albertsons Companies, LLC. In connection with, and prior to the closing of, this offering, Albertsons Investor and KIM ACI will distribute all common stock of ACI held by them to their respective equityholders (the “Distribution”) other than the approximately shares (based upon the midpoint of the estimated offering range set forth on the cover page of this prospectus) that we expect to repurchase from them using the proceeds of the concurrent offering of Series A preferred stock as described under “Use of Proceeds.” As a result, following the Distribution and the repurchase, Albertsons Investor and KIM ACI will no longer be the stockholders of ACI.
ii
BASIS OF PRESENTATION
Except as otherwise noted herein, the consolidated financial statements and consolidated financial data included in this prospectus are those of ACI and its consolidated subsidiaries.
We use a 52 or 53 week fiscal year ending on the last Saturday in February each year. Our first quarter consists of 16 weeks, and our second, third and fourth quarters generally consist of 12 weeks. For ease of reference, unless the context otherwise indicates, we identify our fiscal years in this prospectus by reference to the calendar year of the first day of such fiscal year. The fiscal years ended February 23, 2019 (“fiscal 2018”), February 24, 2018 (“fiscal 2017”), February 25, 2017 (“fiscal 2016”) and February 27, 2016 (“fiscal 2015”) included and the fiscal years ending February 27, 2021 (“fiscal 2020”), February 26, 2022 (“fiscal 2021”), February 25, 2023 (“fiscal 2022”) and February 24, 2024 (“fiscal 2023”) will include 52 weeks. The fiscal years ended February 29, 2020 (“fiscal 2019”) and February 28, 2015 (“fiscal 2014”) consisted of 53 weeks.
IDENTICAL SALES
As used in this prospectus, the term “identical sales” includes stores operating during the same period in both the current fiscal year and the prior fiscal year, comparing sales on a daily basis. Direct to consumer internet sales are included in identical sales and fuel sales are excluded from identical sales. Fiscal 2019 is compared with fiscal 2018, fiscal 2018 is compared with fiscal 2017, fiscal 2017 is compared with fiscal 2016, fiscal 2016 is compared with fiscal 2015 and fiscal 2015 is compared with fiscal 2014. On an actual basis, acquired stores become identical on the
one-year
anniversary date of their acquisition. Stores that are open during remodeling are included in identical sales.TRADEMARKS AND TRADE NAMES
This prospectus includes certain of ACI’s trademarks and trade names, which are protected under applicable intellectual property laws and are the property of ACI and its subsidiaries. This prospectus also contains trademarks, service marks, trade names and copyrights of other companies, which are the property of their respective owners. Solely for convenience, trademarks and trade names referred to in this prospectus may appear without the
®
or TM symbols. We do not intend our use or display of other parties’ trademarks, trade names or service marks to imply, and such use or display should not be construed to imply, a relationship with, or endorsement or sponsorship of ACI by, these other parties.MARKET, INDUSTRY AND OTHER DATA AND APPRAISALS
This prospectus includes market and industry data and outlook, which are based on publicly available information, reports from government agencies, reports by market research firms and/or our own estimates based on our management’s knowledge of and experience in the markets and businesses in which we operate. We believe this information to be reasonable based on the information available to us as of the date of this prospectus. However, we have not independently verified market and industry data from third-party sources. Historical information regarding supermarket and grocery industry revenues, including online grocery revenues, was obtained from Euromonitor and IBISWorld. Forecasts regarding
Food-at-Home
inflation were obtained from the U.S. Department of Agriculture. Information with respect to our market share was obtained from Nielsen ACView All Outlets Combined (Food, Mass and Dollar but excluding Drug). U.S. Gross Domestic Product (GDP) was obtained from the Bureau of Economic Analysis. This information may prove to be inaccurate because of the method by which we obtained some of the data for our estimates or because this information cannot always be verified with complete certainty due to limits on the availability and reliability of raw data, the voluntary nature of the data gathering process and other limitations and uncertainties inherent in a survey ofiii
market size. In addition, market conditions, customer preferences and the competitive landscape can and do change significantly. As a result, you should be aware that the market and industry data included in this prospectus and our estimates and beliefs based on such data may not be reliable. We have not verified the accuracy of such industry and market data.
In addition, the market value reported in the appraisals of the properties described herein are an estimate of value, as of the date stated in each appraisal. The appraisals were subject to the following assumption: the estimate of market value as is, is based on the assumption that the existing occupant/user remains in occupancy in the foreseeable future, commensurate with the typical tenure of a user of this type, and is paying market rent as of the effective date of appraisal. Changes since the appraisal date in external and market factors or in the property itself can significantly affect the conclusions. As an opinion, the reported values are not necessarily a measure of current market value and may not reflect the amount which would be received if the property were sold today. While we and the underwriters are not aware of any misstatements regarding any appraisals, market, industry or similar data presented herein, such data involves risks and uncertainties and is subject to change based on various factors, including those discussed under the sections entitled “Special Note Regarding Forward-Looking Statements” and “Risk Factors” in this prospectus.
NON-GAAP
FINANCIAL MEASURESAs used in this prospectus, (i) EBITDA is defined as GAAP earnings (net income (loss)) before interest, income taxes, depreciation and amortization, (ii) Adjusted EBITDA is defined as GAAP earnings (net income (loss)) before interest, income taxes, depreciation, and amortization, further adjusted to eliminate the effects of items management does not consider in assessing ongoing performance, (iii) Adjusted Net Income is defined as GAAP net income (loss) adjusted to eliminate the effects of items management does not consider in assessing ongoing performance, (iv) Adjusted Free Cash Flow is defined as Adjusted EBITDA less capital expenditures, (v) Net Debt is defined as total debt (which includes finance lease obligations and is net of deferred financing costs and original issue discount) minus unrestricted cash and cash equivalents and (vi) Net Debt Ratio is defined as the ratio of Net Debt to Adjusted EBITDA for the rolling 52 or 53 week period.
EBITDA, Adjusted EBITDA, Adjusted Net Income, Adjusted Free Cash Flow, Net Debt and Net Debt Ratio (collectively, the
“Non-GAAP
Measures”) are performance measures that provide supplemental information management believes is useful to analysts and investors to evaluate ongoing results of operations, when considered alongside other GAAP measures such as net income, operating income and gross profit. TheseNon-GAAP
Measures exclude the financial impact of items management does not consider in assessing our ongoing operating performance, and thereby facilitate review of our operating performance on aperiod-to-period
basis. Other companies may have different capital structures or different lease terms, and comparability to our results of operations may be impacted by the effects of acquisition accounting on our depreciation and amortization. As a result of the effects of these factors and factors specific to other companies, we believe theNon-GAAP
Measures, as applicable, provide helpful information to analysts and investors to facilitate a comparison of our operating performance to that of other companies. We also use Adjusted EBITDA, as further adjusted for additional items defined in our debt instruments, for board of director and bank compliance reporting. For a reconciliation of thesenon-GAAP
financial measures to the most directly comparable GAAP financial measures, see “Prospectus Summary—Summary Consolidated Historical Financial and Other Data.”Non-GAAP
Measures have limitations as analytical tools, and you should not consider them in isolation or as substitutes for analysis of our operating results or cash flows as reported under GAAP. Some of these limitations are:| • | Non-GAAP Measures do not reflect certainone-time ornon-recurring cash costs to achieve anticipated synergies; |
| • | Non-GAAP Measures do not reflect changes in, or cash requirements for, our working capital needs; |
iv
| • | EBITDA and Adjusted EBITDA do not reflect the significant interest expense or the cash requirements necessary to service interest or principal payments on our debt; |
| • | EBITDA and Adjusted EBITDA do not reflect income taxes or the cash payments related to income tax obligations; |
| • | Although depreciation and amortization are non-cash charges, the assets being depreciated or amortized may have to be replaced in the future, and EBITDA and Adjusted EBITDA and, with respect to acquired intangible assets, Adjusted Net Income, do not reflect any cash requirements for such replacements; |
| • | Non-GAAP Measures are adjusted for certainnon-recurring andnon-cash income or expense items that are reflected in our statements of operations; |
| • | Non-GAAP Measures do not reflect our cash expenditures or future requirements for capital expenditures or contractual commitments; and |
| • | Other companies in our industry may calculate these measures differently than we do, limiting their usefulness as comparative measures. |
Because of these limitations,
Non-GAAP
Measures should not be considered as measures of discretionary cash available to us to invest in the growth of our business. We compensate for these limitations by relying primarily on our GAAP results and usingNon-GAAP
Measures only for supplemental purposes. See our consolidated financial statements included elsewhere in this prospectus.v
LETTER FROM VIVEK SANKARAN, PRESIDENT & CHIEF EXECUTIVE OFFICER
Dear Prospective Stockholder,
In 1939, Joe Albertson opened the first Albertsons store at 16
th
and State streets in Boise, Idaho. The store featured welcoming associates, great products and great value. Since then, much has changed in the way we shop for and consume food; but at Albertsons, our purpose and values have not wavered. We remain committed to making every day better for our associates, our customers and our communities, never more so than through the unprecedented events of recent months.When I joined Albertsons from PepsiCo in April of 2019, I found a company that was well-positioned to benefit from changes affecting shopping and eating habits. The banners that make up Albertsons have earned customer loyalty over decades. Yet, in many ways, our Company is only a few years old. Since the Safeway merger in 2015, we have successfully completed the integration of our stores, supply chain and technology platforms. We have invested in capabilities allowing us to serve the customer wherever, whenever and however they choose to shop. We now benefit from one of the industry’s largest networks of
First-and-Main,
food retail locations with leading market shares in valuable and growing markets. It allows us to serve our customers locally, while delivering the advantages of national scale.All of these elements have come together in a corporate identity that is customer focused to make the shopping experience,and. We have developed a robust strategic framework to support this identity, resting on the four pillars of,,and. These pillars equip us to win in our sector. I believe we can deliver attractive and improving financial performance, grow market share and increase customer lifetime value through more engaged relationships across our omni-channel platform and loyalty ecosystem.
Easy
Exciting
Friendly
Growth
Productivity
Technology
Talent and
Culture
Our Goal & Identity
Our goal is to drive deep and lasting relationships with our customers. To achieve our goal, we offer a unique customer shopping experience that is,and– in our stores, at curbside, online and on mobile devices.
Easy
Exciting
Friendly
| • | Easy well-thought-out initiatives underway that seek to make the Albertsons shopping experience easier and more convenient for our existing customers and appealing to new customers. We are leveraging our exceptional store footprint to provide a full suite of omni-channel offerings, including Drive Up & Go curbside pickup and home delivery. We are working to make thein-store shopping experience quicker and easier through initiatives such as faster checkout and improvedin-store navigation. These capabilities are further enhanced through targeted technology investments and partnerships like the ones we have announced with Glympse for location sharing of store pickup and home delivery orders and Takeoff Technologies for automated micro-fulfillment to support our eCommerce efforts. We also seek to simplify the many food-related choices our customers face daily by offering efficient, comprehensive solutions such as meal planning, shopping list creation and prepared foods. |
| • | Exciting best-in-class fresh offerings encompass value-added organic, local and seasonal products. Examples include dailyfresh-cut fruit and vegetables, customized meat cuts and seafood varieties, made-from-scratch bakery items, convenient prepared meal solutions, deli offerings and beautiful floral designs. In many locations, we also provide attractive specialty offerings, including curated wine selections and artisan cheese shops. We feature a localized assortment that is customized to individual markets, like our Santa Monica Seafood in Southern California and our Hatch Chile salsa in Arizona. We continue to |
vi
| innovate with our Own Brands Own Brands O Organics Own Brands |
| • | Friendly non-customer-facing areas of our stores, freeing up our associates to do more of what they love: serving shoppers and providing a great customer experience. |
Our Strategic Framework
We support our,andidentity through a strategy that is designed to drive sustainable growth in our business. Our strategic framework rests on four key pillars: (1); (2); (3); and (4). Each of these pillars comprises specific, identified initiatives. We plan to grow ID sales by leveraging our core business–our stores, accelerating incremental eCommerce growth, continuing to increase the penetration of ourportfolio and increasing customer engagement and lifetime value through our extended loyalty ecosystem. We support our growth through a focus on productivity. We are working to optimize procurement and indirect spend. We are focused on delivering operational efficiencies, including shrink management, general and administrative expense discipline and labor and working capital productivity. We are also leveraging the national scale of our organization to “buy better” and create
Easy
Exciting
Friendly
Growth
Productivity
Technology
Talent and
Culture
Own Brands
best-in-class
supplier relationships. Since I joined the Company, we have developed and begun to implement specific productivity initiatives that target $1 billion of annualrun-rate
productivity benefits by the end of fiscal 2022 to help offset cost inflation, fund growth and drive earnings. While certain projects are well underway and contributing as expected, in other cases, we have temporarily paused some of our initiatives to ensure we are first taking care of our customers and our communities, while focusing on the safety of our associates during the coronavirus (COVID-19) pandemic.Technology, talent and culture underpin every strategic decision we make as an organization. They accelerate our,andidentity and the growth and productivity we are striving for. We are modernizing our technology infrastructure to drive enhancements for our customers, store operations, merchandising and our supply chain. Ongoing technology initiatives include digitizing and automating current capabilities, leveraging data science across our merchandising, pricing and promotional strategies and training our team to be more digitally minded. Lastly, our talent and culture remain Albertsons’ greatest resource. Our friendly service and the deep community ties that we have developed, along with our nationwide loyalty ecosystem, help to drive higher customer lifetime value through increased purchase frequency, basket size, customer satisfaction and retention. We will continue to empower store-level decision makers, encourage frontline ownership and strengthen capabilities so that we remain.
Easy
Exciting
Friendly
Locally Great, Nationally Strong
We are proud of the progress we have made over the past few years. The importance of our role in the communities that we serve has been evident as we strive to meet our customers’ needs during the coronavirus (COVID-19) pandemic. Our highest priority has been ensuring the safety of our associates and customers as we continue to keep America fed. We have taken significant steps to invest in and protect our associates as they serve on the front lines of the public health crisis. They are heroes and I could not be more thankful for their tireless commitment to serving our customers and securing supply of our products to meet unprecedented levels of demand. Additionally, we have committed $50 million to hunger relief to ensure families impacted by coronavirus (COVID-19) in the communities we serve get the food they need. I am keenly aware that this pandemic has brought significant changes to the way we operate. The way we have responded to this crisis,
vii
however, gives me greater conviction in our long runway for growth. At Albertsons, we are just beginning the next chapter in our rich history, and we welcome you to join us on this exciting journey.

Vivek Sankaran
President & Chief Executive Officer
viii
PROSPECTUS SUMMARY
This summary highlights information contained elsewhere in this prospectus and does not contain all of the information that you should consider in making your investment decision. Before investing in our common stock, you should carefully read this entire prospectus, including our consolidated financial statements and the related notes included elsewhere in this prospectus. You should also consider the matters described under the sections titled “Risk Factors” and “Management’s Discussion and Analysis of Financial Condition and Results of Operations,” in each case included elsewhere in this prospectus. Unless the context otherwise requires, the terms “ACI,” the “Company,” “we,” “us” and “our” refer to Albertsons Companies, Inc. and its consolidated subsidiaries.
OUR COMPANY
We are one of the largest food retailers in the United States, with 2,252 stores across 34 states and the District of Columbia. We operate 20 iconic banners with on average 85 years of operating history, includingand, with approximately 270,000 talented and dedicated employees, as of February 29, 2020, who serve on average more than 33 million customers each week. Additionally, as of February 29, 2020, we operated 1,290operating structure empowers decision making at the local level, which we believe better serves our customers and communities, while also providing the systems, analytics and buying power afforded by an organization with national scale and $62.5 billion in annual sales. Throughout the coronavirus (COVID-19) pandemic, our highest priorities have been the safety of our associates and customers and maintaining the supply of product. During the first eight weeks of fiscal 2020, we have delivered strong sales growth and increases in market share across our portfolio.
Albertsons, Safeway, Vons, Pavilions, Randalls, Tom Thumb, Carrs, Jewel-Osco, Acme, Shaw’s, Star Market, United Supermarkets, Market Street
Haggen
in-store
branded coffee shops, 402 adjacent fuel centers, 23 dedicated distribution centers, 20 manufacturing facilities and various online platforms. Our stores operate inFirst-and-Main
retail locations and have leading market share within attractive and growing geographies. We hold a #1 or #2 position by market share in 68% of the 121 metropolitan statistical areas (“MSAs”) in which we operate. Our portfolio of well-located, full-service stores provides the foundation of our omni-channel platform, including our rapidly growing Drive Up & Go curbside pickup, home delivery and rush delivery offerings. We seek to tailor our offerings to local demographics and preferences of the markets that we operate in. OurLocally Great, Nationally Strong
We are focused on creating deep and lasting relationships with our customers by offering them an experience that is,and– wherever, whenever and however they choose to shop. We make lifefor our customers through a convenient and consistent shopping experience across our omni-channel network. Merchandising is at our core and we offer anand differentiated product assortment. We believe we are an industry leader in fresh, emphasizing organic, locally sourced and seasonal items as well as value-added services like dailyportfolio, which achieved over $13.1 billion in sales during fiscal 2019 and reached 25.4% sales penetration. Ourservice is embedded in our culture and enables us to build deep ties with our local communities.
Easy
Exciting
Friendly
Easy
Exciting
fresh-cut
fruit and vegetables, customized meat cuts and seafood varieties, made-from-scratch bakery items, prepared foods, deli and floral. We also continue to grow our innovative and distinctiveOwn Brands
Friendly
 |  | |||
1
Our,andshopping experience, coupled with our nationwide, grocery and fuel rewards programs and pharmacy services, offers a differentiated value proposition to our customers. Theprogram has 20.7 million registered loyalty households which, we believe, provides us with a comprehensive understanding of our core shoppers. These loyalty programs and our omni-channel offerings combine to form an extended loyalty ecosystem that drives increased customer lifetime value through greater purchase frequency, larger basket size and higher customer retention.
Easy
Exciting
Friendly
just for U
just for U
Our Company has grown through a series of transformational acquisitions over the last six years, including our merger with Safeway in 2015 which gave us the benefits of national scale. While our banners have rich histories, we are in many ways a young company. We have integrated systems and converted stores and distribution centers to create a common platform. We believe our common platform gives us greater transparency and compatibility across our network, allowing us to better serve our customers and employees while enhancing our supply chain.
We continue to sharpen our in-store execution, increase our
Own Brands
penetration and expand our omni-channel and digital capabilities. We have invested substantially in our business, deploying approximately $6.8 billion of capital expenditures beginning with fiscal 2015, including the $1.5 billion we spent in fiscal 2019. We used that capital to remodel existing stores, opportunistically build new stores and enhance our digital capabilities. We have also developed and begun to implement specific productivity initiatives across our business that target $1 billion of annual run-rate productivity benefits by the end of fiscal 2022 to help offset cost inflation, fund growth and drive earnings. While certain projects are well underway and contributing as expected, in other cases, we have temporarily paused some of our initiatives to ensure we are first taking care of our customers and our communities, while focusing on the safety of our associates during the coronavirus (COVID-19) pandemic.We have enhanced our management team, adding executives with complementary backgrounds to position us well for the future, including our President and CEO, Vivek Sankaran, who joined the Company from PepsiCo in April 2019. In fiscal 2019, we also added Chris Rupp as Chief Customer & Digital Officer and Mike Theilmann as Chief Human Resources Officer. In addition, we have internally promoted and expanded the roles of certain key members of our leadership team, including Susan Morris, our Chief Operations Officer, and Geoff White, our Chief Merchandising Officer.
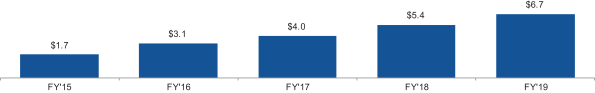
Our recent operational initiatives are driving positive financial momentum. We realized strong financial performance in fiscal 2019, generating net sales of $62.5 billion, Adjusted EBITDA of $2.8 billion and Adjusted Free Cash Flow of $1.4 billion. We have achieved nine consecutive quarters of positive identical sales growth. Adjusted EBITDA grew from $2.7 billion in fiscal 2018 to $2.8 billion in fiscal 2019 and we generated a cumulative $6.7 billion in Adjusted Free Cash Flow since the start of fiscal 2015. The momentum we are experiencing gives us confidence that ourandidentity resonates with customers. We believe our strategic framework will enable us to continue delivering profitable growth going forward.
Easy, Exciting
Friendly
Identical Sales | Net Income ($mm) | Adj. EBITDA ($mm) | ||
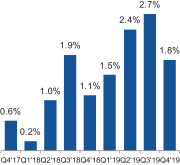 |  |  | ||
2
Cumulative Adjusted Free Cash Flow (in billions)
DRIVERS OF CURRENT MOMENTUM
We have achieved significant near-term momentum in our business through a number of successful and ongoing initiatives, including the following:
Sharpened In-Store Execution.
in-store
execution and enhancing our customer experience to drive profitable growth. We have simplified our merchandising programs, automated ourfront-end
scheduling processes and expanded self-checkout in 533 additional stores during fiscal 2019. These enhancements have been instrumental in improving store-level productivity, allowing us to increase our focus on the customer. To further enhance the customer experience, we remerchandised over 850 stores since the beginning of fiscal 2017, reallocating space to better accentuate high growth fresh categories like produce, meat and seafood, bakery, prepared foods, deli and floral. This, coupled with our robust remodel program, has also allowed us to optimize store layouts and ease shopping patterns to make things simpler for customers and employees.Increased
Own Brands
Penetration.
Own Brands
Own Brands
Own Brands
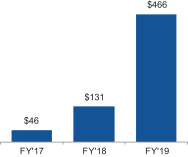
Leading Omni-Channel Capabilities.
ready-to-eat
offerings. We now offer home delivery services across more than 2,000 of our stores and 12 of the country’s top 15 MSAs by population. The coronavirus (COVID-19
) pandemic has significantly increased demand for food-at-home, particularly through our eCommerce offerings. As a result we have accelerated our Drive Up & Go build out and have made several enhancements to our eCommerce platform that we believe will meaningfully improve the overall customer experience and enable us to drive growth and market share. |  |  | ||||||||
Investment in Stores and Technology Capabilities.
3
stores, as well as merchandising and maintenance initiatives. We also increased investment in digital and technology projects, including approximately $375 million spent in fiscal 2019. These investments include upgraded pricing and promotional tools and more integrated and
easy-to-use customer-facing digital applications.
Continued Focus on Productivity
.
With the integration of Safeway behind us, we have developed and are in the early stages of implementing a new set of clearly defined productivity initiatives that are underpinned by technology and talent. We are targeting $1 billion of annual run-rate productivity benefits by the end of fiscal 2022 to help offset cost inflation, fund growth and drive earnings. These initiatives include a focus on enhancing store and distribution center operations, leveraging scale to buy better, increasing promotional effectiveness and leveraging general and administrative costs. For example, we implemented a shrink reduction program centered on the use of technology as well as employee and manager education. As a result, we successfully reduced shrink levels by approximately 45 basis points in fiscal 2019 over fiscal 2017. We also believe these productivity initiatives will drive tangible improvements in our customer satisfaction and customer service scores. While certain projects are well underway and contributing as expected, in other cases, we have temporarily paused some of our initiatives to ensure we are first taking care of our customers and our communities, while focusing on the safety of our associates during the coronavirus (COVID-19) pandemic.OUR COMPETITIVE STRENGTHS
We are focused on driving deep and lasting relationships with our customers by delivering an
and
shopping experience. We believe the following competitive strengths will help us to achieve our goal:
Robust Portfolio of Stores and Iconic Banners with Leading Market Shares.
| • | Well-Known Banners |
| • | Prime Locations First-and-Main locations, providing our customers with exceptional convenience. Our owned and ground leased stores and distribution centers, which represent approximately 39% of our store and distribution base, have an aggregate appraised value of $11.2 billion. |
| • | Strong Market Share and Local Market Density coronavirus ( COVID-19) pandemic and the strength of our supply chain. |
| • | Highly Attractive Markets one-third of the U.S. population and approximately 45% of U.S. GDP. In 60% of the 121 MSAs in which we operate, the projected population growth over the next five years, in aggregate, exceeds the national average by over 60%. |
4
The following illustrative map represents our regional banners and combined store network as of February 29, 2020.

1
Nielsen ACView based on food markets in Company operating geographies as of calendar fourth quarter 2019.Differentiated and Exciting Merchandise Offering.
Exciting
in-store
fresh-cut
fruit,in-store
preparedready-to-cook
vegetables and fresh-made guacamole. In meat and seafood, we featurebest-in-class
full service butcher blocks that highlightcustom-cut
USDA Choice and Prime beef, ground chicken and pork, seasonal smoked meats like sausages and bacon,Open Nature
grass-fed
beef, lamb and wild-caught Alaskan salmon as well as a wide range of responsibly sourced waterfront bistro shrimp. Our bakeries feature scratch-made pastries, artisan breads, and cakesdesigned-to-order
by trained 5 Star decorators. Our prepared foods includeready-to-eat,
ready-to-heat,
andready-to-cook
meal solutions that encompass everything from family favorites to a wide range of world cuisine offerings. Our fresh offerings are complemented by strong specialty assortments. These include our curated wine selections and artisan cheese shops. As our customers demand healthy options and product transparency, we have grown our natural and organic sales nearly twice as fast as the rest of the store during fiscal 2019, with sales penetration of approximately 13% for the same period.5
 |  |  |  |  |
High-Quality Own Brands That Deliver Great Value.
Own Brands
Own Brands
Own Brands
Own Brands
Value Corner
Signature Reserve
Own Brands
Lucerne
Signature Select
Signature Café
O Organics
Own Brands
Own Brands
Own Brands
Own Brands
top-line
growth and margin expansion. Sustainability is also a top priority with ourOwn Brands
Own Brands
      |
      |
Integrated Omni-Channel Solutions.
Drive Up & Go
 | • Currently available in approximately 650 locations, with plans to grow to 1,600 locations in the next two years• Easy-to-use mobile app• Convenient, well-signed, curbside pickup |
6
Home Delivery
 | • First launched home delivery services in 2001• Provide home delivery using our own “white glove” delivery service in approximately 60% of our stores• Operate over 1,000 multi-temperature delivery trucks to support home delivery growth• Successful roll out of new eCommerce website and mobile applications to all divisions |
Rush Delivery
 | • Launched rush delivery in 2017 with Instacart• Delivery within one to two hours in all divisions and covering over 2,000, or nearly 90%, of our stores offered in collaboration with third parties• Partnership with Grubhub and Uber Eats adds delivery offerings for our prepared andready-to-eat options from our stores |
Strong Relationships with Loyal Customers.
just for U
just for U
just for U
Engagement in Enhanced Loyalty Ecosystem Increases Customer Lifetime Value
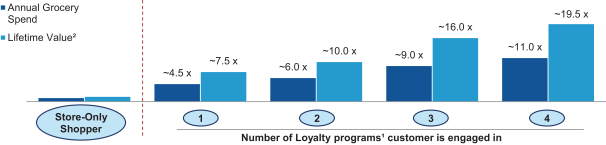
Note: Charts above based on data from a single market division and reflect indexed annual grocery spend and lifetime value versus store-only shoppers who do not participate in our loyalty ecosystem.
1
Programs are just for U, grocery and fuel rewards, pharmacy services, Drive Up & Go and home delivery.2
Defined as annual average gross profit multiplied by average years shopping.Disciplined Approach to Capital Investment and Strong Adjusted Free Cash Flow and Balance Sheet.
7
$3.8 billion of capital expenditures on remodels, upgrades, new stores and merchandising initiatives during this period. We have also invested to enhance our digital and technology assets. We believe these investments have been instrumental in maintaining our position as a leader in the food retail industry. Our strong Adjusted Free Cash Flow profile allows us the flexibility to invest in our business. Beginning with fiscal 2015, the first year after our merger with Safeway, we have generated cumulative Adjusted Free Cash Flow of $6.7 billion through the end of fiscal 2019. We have also reduced our outstanding Net Debt by approximately $3.0 billion since the end of fiscal 2017, decreasing our Net Debt Ratio from 4.7x to 2.9x as of the end of fiscal 2019.
New Best-In-Class Leadership with a Fresh Perspective.
Own Brands
Our team believes in the power of ourapproach. We empower our operators to take ownership of local merchandising and
Locally Great, Nationally Strong
in-store
execution. This enables our local managers to select the best product assortments for their communities, provide a heightened level of customer service and drive improved store performance. This localized approach has been such an important part of our heritage and success.OUR STRATEGIC FRAMEWORK
We are focused on providing our customers with an
and
shopping experience. We support our identity through a strategic framework that rests on four key pillars:
,
,
and
.
Growth:
| • | Achieve More Identical Sales Growth From Our Stores |
| • | Merchandising Excellence Exciting re-merchandised more than 850 stores and plan to expand this successful program. |
| • | Pricing and Promotions |
8
| • | Operating Excellence in-store efficiency by using technology to optimize labor and improvein-stock and display execution, resulting in enhanced store productivity and customer satisfaction. A number of these initiatives are already underway. In stores where we have introduced computer-assisted ordering and production systems, for example, we have seen a meaningful uplift in sales and improved levels ofin-stocks, inventory and shrink. |
| • | Culture of Exceptional Service in-store technology to achieve labor efficiencies through the automation ofnon-customer-facing tasks. We expect this effort to provide our associates more time to better serve customers, enhancing the shopping experience and driving purchase frequency, larger basket size, customer satisfaction and retention. |
| • | Targeted Store Remodels Easy Exciting Friendly |
| • | Drive Incremental eCommerce Growth: a strong growth engine that drives incremental sales. We plan to sustain our eCommerce growth through a number of initiatives. First, we will extend our Drive Up & Go pickup service to approximately 1,600 locations in the next two years. The coronavirus (COVID-19) pandemic has driven significant eCommerce volumes that have caused us to accelerate our omni-channel investments and our Drive up & Go build out. Additionally, we are refreshing our entire digital interface to create a more personalized, easy-to-use and fully-integrated digital experience. We are improving our mobile applications to enable more personalized rewards and services like advanced basket-building tools and product, meal and recipe recommendations. We are further integrating our digital andin-store models to better drive existing customer engagement and new customer trial for our own and third-party delivery. |
| • | Accelerate Own Brand Penetration Own Brands Own Brands Own Brands |
| • | Increase Customer Engagement and Lifetime Value: just for U just for U |
Productivity:
run-rate
productivity benefits by the end of fiscal 2022. This will help us to offset cost inflation, fund growth and drive earnings. Our initiatives include the following:| • | Enhancing Store and DC Operations: non-customer-facing tasks and drive labor productivity. For example, we are working to roll out enhanced demand forecasting and replenishment systems to improve operating efficiency, reduce product waste and optimize labor and inventory levels. We expect to scale these opportunities across the business quickly and efficiently. |
9
| • | Leveraging Scale to Buy Better: |
| • | Increasing Promotional Effectiveness: |
| • | Leveraging G&A: . |
While certain projects are well underway and contributing as expected, in other cases, we have temporarily paused some of our initiatives to ensure we are first taking care of our customers and our communities, while focusing on the safety of our associates during the coronavirus (COVID-19) pandemic.
Technology:
| • | Customers: check-out processes and improve ourat-store pickup experience. For example, we are partnering with Adobe to provide an artificial intelligence-powered solution to personalize the website and mobile application experience. This will enable the customer to see personalized products and information as they browse homepages, categories and product detail pages. |
| • | Store Operations: forecasting and replenishment tools such as computer-assisted ordering and production systems should sharpen our ability to predict store demand and track perpetual inventory, helping us to reduce out-of-stocks, inventory, and shrink. |
10
Additionally, we have begun to introduce
in-store
micro-fulfilment centers (MFCs) to provide enhanced capabilities for last-mile delivery that leverage our well-located store base as the distribution point for online orders. Early learnings from our partnership with Takeoff Technologies indicate improved picking efficiency by more than seven times compared toin-store
services as well as better inventory management andon-time
delivery. We plan to have 10 more MFCs operating within the next two years, in addition to the two operating today. |  |
| • | Merchandising |
| • | Supply Chain: |
Talent and Culture:
11
Across all segments of our business, our associates seek to deliver for our customers, our community, and our Company through their sales and service focus. We seek to celebrate the diversity and inclusiveness of our workforce and focus on improving our communities through sustainability and charitable activities that are an essential part of our business. As we leverage our national scale for efficiencies, we will continue to empower store-level decision makers to take care of our customers and encourage frontline responsibility. We will also continue to nurture an ownership mindset in our stores and ensure that the interests of those who directly manage our customer relationships on a daily basis are aligned with those of our stockholders.
 |  |
12
RISKS RELATED TO OUR BUSINESS AND THIS OFFERING
An investment in our common stock involves a high degree of risk. You should carefully consider the risks highlighted in the section entitled “Risk Factors” following this prospectus summary before making an investment decision. These risks include, among others, the following:
| • | Coronavirus (COVID-19) related factors, risks and challenges, including among others, the length of time that the pandemic continues, the temporary inability of customers to shop due to illness, quarantine, or other travel restrictions or financial hardship, shifts in demand away from discretionary or higher priced products to lower priced products, or stockpiling or similar pantry-filling activities, reduced workforces which may be caused by, but not limited to, the temporary inability of the workforce to work due to illness, quarantine, or government mandates, potential shortages in supply, or temporary store closures due to reduced workforces or government mandates; |
| • | the competitive nature of the industry in which we conduct our business; |
| • | general business and economic conditions, including the rate of inflation or deflation, consumer spending levels, population, employment and job growth and/or losses in our market; |
| • | our ability to increase identical sales, expand our Own Brands |
| • | our ability to expand or grow our home delivery network and Drive Up & Go curbside pickup services; |
| • | pricing pressures and competitive factors, which could include pricing strategies, store openings, remodels or acquisitions by our competitors; |
| • | labor costs, including benefit plan costs and severance payments, or labor disputes that may arise from time to time and work stoppages that could occur in areas where certain collective bargaining agreements have expired or are on indefinite extensions or are scheduled to expire in the near future; |
| • | disruptions in our manufacturing facilities’ or distribution centers’ operations, disruption of significant supplier relationships, or disruptions to our produce or product supply chains; |
| • | results of any ongoing litigation in which we are involved or any litigation in which we may become involved; |
| • | data privacy and security, the failure of our IT systems, or maintaining, expanding or upgrading existing systems or implementing new systems; |
| • | the effects of government regulation and legislation, including healthcare reform; |
| • | our ability to raise additional capital to finance the growth of our business, including to fund acquisitions; |
| • | our ability to service our debt obligations, and restrictions in our debt agreements; |
| • | the impact of private and public third-party payers’ continued reduction in prescription drug reimbursements and the ongoing efforts to limit participation in payor networks, including through mail order; |
| • | plans for future growth and other business development activities; |
| • | our ability to realize anticipated savings from our implementation of cost reduction and productivity initiatives; |
| • | changes in tax laws or interpretations that could increase our consolidated tax liabilities; and |
| • | competitive pressures in all markets in which we operate. |
13
CORONAVIRUS (
COVID-19
) Related DEVELOPMENTSSince the beginning of the coronavirus (
COVID-19
) pandemic, we have acted swiftly to prioritize the safety of our front-line associates and customers, while delivering the essential services we provide in our communities. In responding to the pandemic, we have taken a number ofpro-active
steps. Among other steps, we have:| • | Increased the frequency of how often we clean and disinfect all departments, restrooms, and other high-touch points of our stores, including check stands and service counters, and hourly disinfecting of high touch areas. This is in addition to our rigorous food safety and sanitations programs already in place. |
| • | Installed cart wipes and hand sanitizer stations in key locations within stores. |
| • | Adjusted store hours in certain stores to give store teams the time they need to rest, restock shelves and clean and disinfect. |
| • | Reserved special times for seniors and other vulnerable shoppers who must leave home to obtain their groceries. |
| • | Installed plexiglass in our checkout lanes in all stores to serve as a protective barrier at the check stand. |
| • | Secured masks and gloves for our front-line employees. |
| • | Limited store occupancy to ensure proper social distancing during all hours, and further limited occupancy during times reserved for our most vulnerable customers to improve safety. |
| • | Responded to increased demand for our eCommerce offerings by hiring additional pickers and drivers, and also simplified eCommerce offerings to focus on the products that are most in demand. |
| • | Instituted “contact-free” delivery procedures for home delivery and Drive Up & Go. |
| • | Announced a temporary increase in pay for all front-line associates of $2 per hour for every hour that they work beginning March 15, 2020 in recognition of their significant efforts. |
| • | Hired over 55,000 new associates since the beginning of fiscal 2020, partnering with more than 35 companies to help keep Americans working. |
| • | Announced a commitment of $50 million to hunger relief and previously launched a major fundraiser to help feed families in need during the coronavirus ( COVID-19 ) pandemic and to help ensure that they get the food they need. |
On March 12, 2020, we provided notice to the lenders to borrow $2.0 billion under our ABL Facility (as defined herein) (such borrowing, the “ABL Borrowing”), so that a total of $2.0 billion (excluding $454.5 million in letters of credit) was outstanding immediately following the borrowing. We increased our borrowings under the ABL Facility as a precautionary measure in order to increase our cash position and preserve financial flexibility in light of current uncertainty in the global markets resulting from the coronavirus (COVID-19)
pandemic. In accordance with the terms of the ABL Facility, the proceeds from the ABL Borrowing may in the future be used for working capital, general corporate or other purposes permitted by the ABL Facility, but there is no guarantee how or when we will use the proceeds. For more information on our existing indebtedness, see “Description of Indebtedness.”
Since the beginning of fiscal 2020, we have experienced significant increases in customer traffic, product demand and overall basket size in stores and in our eCommerce business as customers adjust to the circumstances around coronavirus (COVID-19). As a result, identical sales increased 47% during the first four weeks of fiscal 2020 (ending March 28, 2020), and increased 21% during the second four weeks of fiscal 2020 (ending April 25, 2020). Identical sales for the first eight weeks of fiscal 2020 increased 34% compared to the comparable period during fiscal 2019. As a result, our cash balance as of April 25, 2020 was approximately $4.0
14
billion, which includes the proceeds from the ABL Borrowing, and our Net Debt as of April 25, 2020 was approximately $6.7 billion. The increase in cash balance after adjusting for the ABL Borrowing is primarily attributable to incremental operating cash flows driven by the increased sales performance and from changes in net working capital as a result of inventory reductions. Subject to opportunistic investments,
our Net Debt at the end of fiscal 2020 will be approximately $6.7 billion as we anticipate that incremental cash flow from our business will, subject to seasonal fluctuations, fund capital expenditures, debt service, working capital replenishment and other operating needs. It is too early to predict the permanent impact the coronavirus (COVID-19) pandemic will have on our industry or food-at-home consumption or what the impact on sales will be going forward.
Corporate Information
Our principal executive offices are located at 250 Parkcenter Blvd., Boise, ID 83706. Our telephone number is (208)
395-6200
and our internet address is www.albertsonscompanies.com.Our website and the information contained thereon are not part of this prospectus and should not be relied upon by prospective investors in connection with any decision to purchase the common stock offered hereby.
Our Sponsors
We believe that one of our strengths is our relationship with our Sponsors. We believe we will benefit from our Sponsors’ experience in the retail industry, their expertise in mergers and acquisitions and real estate, and their support on various near-term and long-term strategic initiatives.
Cerberus
Kimco Realty Corporation
Klaff Realty, L.P.
Lubert-Adler Management.
Lubert-Adler Management and its affiliated entities (“Lubert-Adler”) were co-founded in 1997 by Ira Lubert and Dean Adler, who collectively have over 65 years of experience in underwriting, acquiring, repositioning, refinancing and disposing of real estate assets. Lubert-Adler has more than 20 investment professionals and has invested $7.8 billion of equity into assets valued at $20 billion.
15
Schottenstein Stores Corp.
Our Sponsors control us and will continue to be able to control the election of our directors, determine our corporate and management policies and determine, without the consent of our other stockholders, the outcome of any corporate transaction or other matter submitted to our stockholders for approval, including potential mergers or acquisitions, asset sales and other significant corporate transactions. Following the completion of the Distribution and the Repurchase, Cerberus will own approximately % of our common stock, Kimco will own approximately % of our common stock, Klaff Realty will own approximately % of our common stock, Lubert-Adler will own approximately % of our common stock and Schottenstein will own approximately % of our common stock and our Sponsors will own in the aggregate approximately % of our common stock, or % if the underwriters exercise their option to purchase additional shares in full. Assuming shares (based upon the midpoint of the estimated offering range set forth on the cover page of this prospectus) of outstanding common stock are repurchased by us using the net proceeds from the offering of % Series A mandatory convertible preferred stock, $0.01 par value (“Series A preferred stock”) (or shares of common stock if the underwriters in the Series A preferred stock offering exercise their over-allotment option in full), our Sponsors will control in the aggregate approximately % of our common stock (or % if the underwriters in the Series A preferred stock offering exercise their over-allotment option in full). Our Sponsors will enter into a Stockholders’ Agreement (as defined herein), pursuant to which they will agree to act in concert and vote together on certain matters. As a result, we expect to be a “controlled company” within the meaning of the corporate governance standards of the NYSE on which we will apply to list our shares and, as a result, will qualify for, and intend to rely on, exemptions from certain corporate governance requirements. As a result, our stockholders will not have the same protections afforded to stockholders of companies that are subject to such requirements.
Following the completion of the Distribution and this offering, we will be required to appoint to our board of directors individuals designated by and voted for by our Sponsors. In connection with this offering, we will enter into a stockholders agreement with our Sponsors (the “Stockholders’ Agreement”). If Cerberus (or a permitted transferee or assignee) has beneficial ownership of at least 20% of our then-outstanding common stock, it shall have the right to designate four directors to our board of directors. If Cerberus (or a permitted transferee or assignee) owns less than 20% but at least 10% of our then-outstanding common stock, it shall have the right to designate two directors to our board of directors. If Cerberus (or a permitted transferee or assignee) owns less than 10% but at least 5% of our then-outstanding common stock, it shall have the right to designate one director to our board of directors. If Klaff Realty (or a permitted transferee or assignee) owns at least 5% of our then-outstanding common stock, it shall have the right to designate one director to our board of directors. If Schottenstein Stores (or a permitted transferee or assignee) owns at least 5% of our then-outstanding common stock, it shall have the right to designate one director to our board of directors.
The interests of our Sponsors may not coincide with the interests of other holders of our common stock. Additionally, our Sponsors are in the business of making investments in companies and may, from time to time, acquire and hold interests in businesses that compete directly or indirectly with us. Our Sponsors may also pursue acquisition opportunities that may be complementary to our business, and as a result, those acquisition opportunities may not be available to us. So long as our Sponsors continue to own a significant amount of the outstanding shares of our common stock, they will continue to be able to strongly influence or effectively control our decisions, including potential mergers or acquisitions, asset sales and other significant transactions.
See “Risk Factors—Risks Related to This Offering and Owning Our Common Stock.”
16
THE OFFERING
| Common stock outstanding | shares |
| Common stock offered by the selling stockholders | shares |
| Option to purchase additional shares of common stock | The selling stockholders have granted to the underwriters a 30-day option to purchase up to additional shares of our common stock at the initial public offering price less the underwriting discount and commissions. |
| Use of proceeds | We will not receive any net proceeds from the sale of common stock by the selling stockholders, including from any exercise by the underwriters of their option to purchase additional shares of our common stock from the selling stockholders. |
| We estimate that the net proceeds to us from the offering of our Series A preferred stock, based upon an assumed public offering price per share of our Series A preferred stock of $ , will be approximately $ (or approximately $ if the underwriters in the Series A preferred stock offering exercise their over-allotment option in full), after deducting underwriting discounts and commissions and estimated offering expenses payable by us. We intend to use the anticipated net proceeds from the offering of Series A preferred stock, together with cash on hand, to repurchase approximately shares (based upon the midpoint of the estimated offering range set forth on the cover page of this prospectus) of outstanding common stock from certain Pre-IPO Stockholders (as defined herein) (the “Repurchase”). The Repurchase is conditioned upon the consummation of the offering of Series A preferred stock and the receipt of funds therefrom. See “Use of Proceeds.” |
| Dividend Policy | Effective fiscal 2020, we have established a dividend policy pursuant to which we intend to pay a dividend on our common stock in an amount of $ per share, starting with the first full quarter following completion of this offering. Our board of directors may change or eliminate the payment of future dividends to our common stockholders at its discretion, without notice to our stockholders. Any future determination relating to our dividend policy will be made at the sole discretion of our board of directors and will depend on a number of factors, including general and economic conditions, industry standards, our financial condition and operating results, our available cash and current and anticipated cash needs, restrictions under the documentation governing certain of our indebtedness, including our ABL Facility and ACI Notes (as defined herein), capital requirements, regulations, contractual, legal, tax and regulatory restrictions and implications on the payment of dividends by us to our |
17
stockholders or by our subsidiaries to us, and such other factors as our board of directors may deem relevant. So long as any shares of our Series A preferred stock remain outstanding, no dividend or distribution may be declared or paid on our common stock unless all accrued and unpaid dividends have been paid on our Series A preferred stock, subject to exceptions such as dividends on our common stock payable solely in shares of our common stock. See “Dividend Policy.”
Lock-Up Agreements | Prior to the closing of this offering, certain Pre-IPO Stockholders will deliver alock-up agreement to us. Pursuant to thelock-up agreements, for a period of six months after the closing of this offering such Pre-IPO Stockholders will agree, subject to certain exceptions, that they will not offer, sell, contract to sell, pledge, grant any option to purchase, make any short sale or otherwise dispose of any shares of common stock or any options or warrants to purchase common stock, or any securities convertible into, exchangeable for or that represent the right to receive common stock, owned by them (whether directly or by means of beneficial ownership) immediately prior to the closing of this offering. Thereafter, such Pre-IPO Stockholders will be permitted to sell shares of common stock subject to certain restrictions. See “Certain Relationships and Related PartyTransactions—Lock-Up Agreements.” |
| Concurrent Series A preferred stock offering | Concurrently with this offering of common stock, we are making a public offering of shares of our Series A preferred stock, and we have granted the underwriters of that offering a 30-day option to purchase up to additional shares of Series A preferred stock to cover over-allotments. Such shares of Series A preferred stock will be convertible into an aggregate of up to shares of our common stock (up to shares of our common stock if the underwriters in the Series A preferred stock offering exercise their over-allotment option in full), in each case subject to anti-dilution, make-whole and other adjustments. |
| We cannot assure you that the offering of Series A preferred stock will be completed or, if completed, on what terms it will be completed. The closing of this offering is conditioned upon the closing of the Series A preferred stock offering and the closing of our offering of Series A preferred stock is conditioned upon the closing of this offering. See “Concurrent Offering of Series A Preferred Stock” for a summary of the terms of our Series A preferred stock and a further description of the concurrent offering. |
| Risk Factors | You should carefully read and consider the information set forth in the section entitled “Risk Factors” beginning on page 25, together with all of the other information set forth in this prospectus, before deciding whether to invest in our common stock. |
| Proposed NYSE trading symbol | “ACI.” |
18
| Directed Share Program | At our request, the underwriters have reserved for sale, at the initial public offering price, up to 5% of the shares offered by this prospectus for sale within the United States to some of our directors, officers, employees, business associates and related persons. If these persons purchase reserved shares, it will reduce the number of shares available for sale to the general public. Any reserved shares that are not so purchased will be offered by the underwriters to the general public on the same terms as the other shares offered by this prospectus. |
Unless otherwise indicated, all information in this prospectus excludes up to shares of our common stock that may be sold by the selling stockholders if the underwriters exercise in full their option to purchase additional shares of our common stock from the selling stockholders. The number of shares of common stock that will be outstanding after this offering also excludes up to shares of our common stock (up to shares if the underwriters in the Series A preferred stock offering exercise their over-allotment option in full), in each case subject to anti-dilution, make-whole and other adjustments, that would be issuable upon conversion of shares of Series A preferred stock issued in our concurrent offering of Series A preferred stock.
19
SUMMARY CONSOLIDATED HISTORICAL FINANCIAL AND OTHER DATA
Albertsons Companies, Inc. was formed for the purpose of reorganizing the organizational structure of AB Acquisition and its direct and indirect consolidated subsidiaries. Prior to December 3, 2017, Albertsons Companies, Inc. had no material assets or operations. On December 3, 2017, Albertsons Companies, LLC and its parent, AB Acquisition, completed a reorganization of their legal entity structure whereby the existing equityholders of AB Acquisition each contributed their equity interests in AB Acquisition to Albertsons Investor or KIM ACI. In exchange, equityholders received a proportionate share of units in Albertsons Investor and KIM ACI, respectively. Albertsons Investor and KIM ACI then contributed all of the equity interests they received to Albertsons Companies, Inc. in exchange for common stock issued by Albertsons Companies, Inc. As a result, Albertsons Investor and KIM ACI became the parents of Albertsons Companies, Inc., owning all of its outstanding common stock with AB Acquisition and its subsidiary, Albertsons Companies, LLC, becoming wholly-owned subsidiaries of Albertsons Companies, Inc. On February 25, 2018, Albertsons Companies, LLC merged with and into Albertsons Companies, Inc., with Albertsons Companies, Inc. as the surviving corporation. Prior to February 25, 2018, substantially all of the assets and operations of Albertsons Companies, Inc. were those of its subsidiary, Albertsons Companies, LLC. The ACI Reorganization Transactions were accounted for as a transaction between entities under common control, and accordingly, there was no change in the basis of the underlying assets and liabilities. The Consolidated Financial Statements are reflective of the changes that occurred as a result of the ACI Reorganization Transactions. Prior to February 25, 2018, our Consolidated Financial Statements reflect the net assets and operations of Albertsons Companies, LLC.
The summary consolidated financial information set forth below is derived from Albertsons Companies, Inc.’s annual consolidated financial statements for the periods indicated below, including the consolidated balance sheets at February 29, 2020 and February 23, 2019 and the related consolidated statements of operations and comprehensive income and consolidated statements of cash flows for the
53-week
period ended February 29, 2020 (fiscal 2019) and each of the52-week
periods ended February 23, 2019 (fiscal 2018) and February 24, 2018 (fiscal 2017) and notes thereto included elsewhere in this prospectus.(dollars in millions, except per share data) | Fiscal 2019 | Fiscal 2018 | Fiscal 2017 | Fiscal 2016 | Fiscal 2015 | |||||||||||||||
Results of Operations: | ||||||||||||||||||||
Net sales and other revenue | $ | 62,455 | $ | 60,535 | $ | 59,925 | $ | 59,678 | $ | 58,734 | ||||||||||
Gross profit | $ | 17,594 | $ | 16,895 | $ | 16,361 | $ | 16,641 | $ | 16,062 | ||||||||||
Selling and administrative expenses | 16,642 | 16,272 | 16,209 | 16,072 | 15,600 | |||||||||||||||
(Gain) loss on property dispositions and impairment losses, net | (485 | ) | (165 | ) | 67 | (39 | ) | 103 | ||||||||||||
Goodwill impairment | — | — | 142 | — | — | |||||||||||||||
Operating income (loss) | 1,437 | 788 | (57 | ) | 608 | 359 | ||||||||||||||
Interest expense, net | 698 | 831 | 875 | 1,004 | 951 | |||||||||||||||
Loss (gain) on debt extinguishment | 111 | 9 | (5 | ) | 112 | — | ||||||||||||||
Other expense (income), net | 29 | (104 | ) | (9 | ) | (44 | ) | (50 | ) | |||||||||||
Income (loss) before income taxes | 599 | 52 | (918 | ) | (464 | ) | (542 | ) | ||||||||||||
Income tax expense (benefit) | 133 | (79 | ) | (964 | ) | (90 | ) | (40 | ) | |||||||||||
| �� | ||||||||||||||||||||
Net income (loss) | $ | 466 | $ | 131 | $ | 46 | $ | (374 | ) | $ | (502 | ) | ||||||||
Other Financial Data: | ||||||||||||||||||||
Adjusted EBITDA(1) | $ | 2,834 | $ | 2,741 | $ | 2,398 | $ | 2,817 | $ | 2,681 | ||||||||||
Adjusted Net Income(1) | 612 | 435 | 74 | 378 | 365 | |||||||||||||||
Rent expense(2)(3) | 1,023 | 864 | 844 | 806 | 781 | |||||||||||||||
Capital expenditures | 1,475 | 1,362 | 1,547 | 1,415 | 960 | |||||||||||||||
Net cash provided by operating activities | 1,904 | 1,688 | 1,019 | 1,814 | 902 | |||||||||||||||
Adjusted Free Cash Flow(1) | 1,359 | 1,379 | 851 | 1,402 | 1,721 | |||||||||||||||
Net Debt(1) | 8,244 | 9,660 | 11,206 | 11,119 | 11,646 | |||||||||||||||
20
(dollars in millions, except per share data) | Fiscal 2019 | Fiscal 2018 | Fiscal 2017 | Fiscal 2016 | Fiscal 2015 | |||||||||||||||
Other Operating Data: | ||||||||||||||||||||
Identical sales(a) | 2.1 | % | 1.0 | % | (1.3 | )% | (0.4 | )% | 4.4 | % | ||||||||||
Store count (at end of fiscal period) | 2,252 | 2,269 | 2,318 | 2,324 | 2,271 | |||||||||||||||
Gross square footage (at end of fiscal period) (in millions) | 112 | 113 | 115 | 115 | 113 | |||||||||||||||
Fuel sales | $ | 3,430 | $ | 3,456 | $ | 3,105 | $ | 2,693 | $ | 2,955 | ||||||||||
Balance Sheet Data (at end of period): | ||||||||||||||||||||
Cash and equivalents | $ | 471 | $ | 926 | $ | 670 | $ | 1,219 | $ | 580 | ||||||||||
Total assets(3) | 24,735 | 20,777 | 21,812 | 23,755 | 23,770 | |||||||||||||||
Total stockholders’ / member equity(3) | 2,278 | 1,451 | 1,398 | 1,371 | 1,613 | |||||||||||||||
Total debt, including finance leases | 8,715 | 10,586 | 11,876 | 12,338 | 12,226 | |||||||||||||||
Per Share Data: | ||||||||||||||||||||
Basic and diluted net income (loss) per common share | $ | 1.67 | $ | 0.47 | $ | 0.17 | $ | (1.33 | ) | $ | (1.80 | ) | ||||||||
Pro forma net income per common share(4) | $ | |||||||||||||||||||
Weighted-average common shares outstanding (in millions): | ||||||||||||||||||||
Basic and diluted | 280 | 280 | 280 | 280 | 280 | |||||||||||||||
Pro forma weighted average common shares outstanding(4) | ||||||||||||||||||||
Fiscal 2019 | Fiscal 2018 | Fiscal 2017 | Fiscal 2016 | Fiscal 2015 | ||||||||||||||||||||||||||||||||||||||||||||||||||||||||||||||||||||||||||||
Q4’19 | Q3’19 | Q2’19 | Q1’19 | Q4’18 | Q3’18 | Q2’18 | Q1’18 | Q4’17 | Q3’17 | Q2’17 | Q1’17 | Q4’16 | Q3’16 | Q2’16 | Q1’16 | Q4’15 | Q3’15 | Q2’15 | Q1’15 | |||||||||||||||||||||||||||||||||||||||||||||||||||||||||||||
(a) Quarterly Identical Sales | 1.8 | % | 2.7 | % | 2.4 | % | 1.5 | % | 1.1 | % | 1.9 | % | 1.0 | % | 0.2 | % | 0.6 | % | (1.8 | )% | (1.8 | )% | (2.1 | )% | (3.3 | )% | (2.1 | )% | 0.1 | % | 2.9 | % | 4.7 | % | 5.1 | % | 4.5 | % | 4.3 | % | ||||||||||||||||||||||||||||||||||||||||
| (1) | Adjusted EBITDA is a Non-GAAP Measure defined as earnings (net income (loss)) before interest, income taxes, depreciation and amortization, further adjusted to eliminate the effects of items management does not consider in assessing ongoing performance. Adjusted Net Income is aNon-GAAP Measure defined as net income (loss) adjusted to eliminate the effects of items management does not consider in assessing ongoing performance. We define Adjusted Free Cash Flow as Adjusted EBITDA less capital expenditures. Net Debt is defined as total debt (which includes finance lease obligations and is net of deferred financing costs and original issue discount) minus cash and cash equivalents. |
21
Adjusted EBITDA, Adjusted Net Income, Adjusted Free Cash Flow and Net Debt are
Non-GAAP
Measures that provide supplemental information we believe is useful to analysts and investors to evaluate ongoing results of operations, when considered alongside other GAAP measures such as net income, operating income and gross profit. TheseNon-GAAP
Measures exclude the financial impact of items management does not consider in assessing ongoing operating performance, and thereby facilitate review of our operating performance on aperiod-to-period
basis. Other companies may have different capital structures or different lease terms, and comparability to our results of operations may be impacted by the effects of acquisition accounting on our depreciation and amortization. As a result of the effects of these factors and factors specific to other companies, we believe Adjusted EBITDA, Adjusted Net Income, Adjusted Free Cash Flow and Net Debt provide helpful information to analysts and investors to facilitate a comparison of our operating performance to that of other companies. Set forth below is a reconciliation of net income to Adjusted Net Income and Adjusted EBITDA and a reconciliation of cash flow from operating activities to Adjusted Free Cash Flow:(dollars in millions) | Fiscal 2019 | Fiscal 2018 | Fiscal 2017 | Fiscal 2016 | Fiscal 2015 | |||||||||||||||
Net income (loss) | $ | 466 | $ | 131 | $ | 46 | $ | (374 | ) | $ | (502 | ) | ||||||||
Adjustments: | ||||||||||||||||||||
Loss (gain) on interest rate and commodity hedges, net | 51 | (1 | ) | (6 | ) | (7 | ) | 16 | ||||||||||||
Facility closures and related transition costs(a) | 18 | 13 | 12 | 23 | 25 | |||||||||||||||
Integration costs(b) | 37 | 186 | 156 | 144 | 125 | |||||||||||||||
Acquisition-related costs(c) | 24 | 74 | 62 | 70 | 217 | |||||||||||||||
Equity-based compensation expense | 33 | 48 | 46 | 53 | 98 | |||||||||||||||
(Gain) loss on property dispositions and impairment losses, net | (485 | ) | (165 | ) | 67 | (39 | ) | 103 | ||||||||||||
Goodwill impairment | — | — | 142 | — | — | |||||||||||||||
LIFO expense (benefit) | 18 | 8 | 3 | (8 | ) | 30 | ||||||||||||||
Amortization and write-off of original issue discount, deferred financing costs and loss on extinguishment of debt | 185 | 72 | 67 | 253 | 82 | |||||||||||||||
Collington acquisition(d) | — | — | — | 79 | — | |||||||||||||||
Amortization of intangible assets resulting from acquisitions | 274 | 326 | 422 | 404 | 377 | |||||||||||||||
Other(e) | 39 | (53 | ) | 66 | 45 | 45 | ||||||||||||||
Effect of ACI Reorganization Transactions, Tax Act and reversal of valuation allowance | — | (57 | ) | (750 | ) | — | — | |||||||||||||
Tax impact of adjustments to Adjusted Net Income(f) | (48 | ) | (147 | ) | (259 | ) | (265 | ) | (251 | ) | ||||||||||
Adjusted Net Income | $ | 612 | $ | 435 | $ | 74 | $ | 378 | $ | 365 | ||||||||||
22
(dollars in millions) | Fiscal 2019 | Fiscal 2018 | Fiscal 2017 | Fiscal 2016 | Fiscal 2015 | |||||||||||||||
Adjustments: | ||||||||||||||||||||
Tax impact of adjustments to Adjusted Net Income(f) | 48 | 147 | 259 | 265 | 251 | |||||||||||||||
Effect of tax restructuring, tax reform, and reversal of valuation allowance | — | 57 | 750 | — | — | |||||||||||||||
Income tax expense (benefit) | 133 | (79 | ) | (964 | ) | (90 | ) | (40 | ) | |||||||||||
Amortization and write-off of original issue discount, deferred financing costs and loss on extinguishment of debt | (185 | ) | (72 | ) | (67 | ) | (253 | ) | (82 | ) | ||||||||||
Interest expense, net | 698 | 831 | 875 | 1,004 | 951 | |||||||||||||||
Loss (gain) on debt extinguishment | 111 | 9 | (5 | ) | 112 | — | ||||||||||||||
Amortization of intangible assets resulting from acquisitions | (274 | ) | (326 | ) | (422 | ) | (404 | ) | (377 | ) | ||||||||||
Depreciation and amortization | 1,691 | 1,739 | 1,898 | 1,805 | 1,613 | |||||||||||||||
Adjusted EBITDA | $ | 2,834 | $ | 2,741 | $ | 2,398 | $ | 2,817 | $ | 2,681 | ||||||||||
Net cash provided by operating activities | $ | 1,904 | $ | 1,688 | $ | 1,019 | $ | 1,814 | $ | 902 | ||||||||||
Income tax expense (benefit) | 133 | (79 | ) | (964 | ) | (90 | ) | (40 | ) | |||||||||||
Deferred income taxes | 6 | 82 | 1,094 | 220 | 90 | |||||||||||||||
Interest expense, net | 698 | 831 | 875 | 1,004 | 951 | |||||||||||||||
Operating lease right-of-use assets amortization | (570 | ) | — | — | — | — | ||||||||||||||
Changes in operating assets and liabilities | 576 | (176 | ) | 222 | (252 | ) | 467 | |||||||||||||
Amortization and write-off of deferred financing costs | (40 | ) | (43 | ) | (56 | ) | (84 | ) | (69 | ) | ||||||||||
Pension and post-retirement (income) expense, net of contributions | 13 | 175 | 23 | (84 | ) | (7 | ) | |||||||||||||
Integration costs | 37 | 186 | 156 | 144 | 125 | |||||||||||||||
Acquisition-related costs | 24 | 74 | 62 | 70 | 217 | |||||||||||||||
Collington acquisition | — | — | — | 79 | — | |||||||||||||||
Other adjustments | 53 | 3 | (33 | ) | (4 | ) | 45 | |||||||||||||
Adjusted EBITDA | 2,834 | 2,741 | 2,398 | 2,817 | 2,681 | |||||||||||||||
Less: capital expenditures | 1,475 | 1,362 | 1,547 | 1,415 | 960 | |||||||||||||||
Adjusted Free Cash Flow | $ | 1,359 | $ | 1,379 | $ | 851 | $ | 1,402 | $ | 1,721 | ||||||||||
| (a) | Includes costs related to facility closures and the transition to our decentralized operating model. Fiscal 2019 includes closure costs related to the discontinuation of our meal kit subscription delivery operations in the third quarter. |
| (b) | Related to conversion activities and related costs associated with integrating acquired businesses, primarily the Safeway acquisition. |
| (c) | Includes expenses related to acquisition and financing activities, including management fees of $13.8 million in each year through fiscal 2019. Fiscal 2018 includes acquisition costs related to the mutually terminated merger with Rite Aid Corporation. Fiscal 2016 and fiscal 2015 include adjustments to tax indemnification assets of $12.3 million and $30.8 million, respectively. Fiscal 2015 also includes losses of $44.2 million related to acquired contingencies in connection with the Safeway acquisition. |
23
| (d) | Fiscal 2016 includes a charge to pension expense, net related to the settlement of a pre-existing contractual relationship and assumption of the pension plan related to the acquisition of Collington Services, LLC (“Collington”) from C&S Wholesale Grocers, Inc. during the first quarter of fiscal 2016. |
| (e) | Primarily includes non-cash lease-related adjustments and lease-related costs for surplus and closed stores. Also includes net realized and unrealized (gains) losses onnon-operating investments, certain legal and regulatory accruals and settlements, net, changes in the fair value of the contingent value rights, changes in our equity investment in Casa Ley, S.A. de C.V. (“Casa Ley”) (disposed of in the fourth quarter of fiscal 2017), foreign currency translation (losses) gains, adjustments to contingent consideration and costs related to our planned initial public offerings. |
| (f) | The tax impact was determined based on the taxable status of the subsidiary to which each of the above adjustments relate. |
| (2) | Represents rent expense on operating leases, including contingent rent expense. |
| (3) | We adopted ASU 2016-02, Leases (Topic 842), and related amendments as of February 24, 2019 under the modified retrospective approach and, therefore, have not revised comparative periods. Under Topic 842, leases historically classified as capital leases are now referred to as finance leases. |
| (4) | Fiscal 2019 pro forma net income per share reflects the effect of the dividend requirement associated with the Series A preferred stock to be issued in the concurrent offering of Series A preferred stock and the Repurchase as if they had taken place on February 24, 2019, the first day of fiscal 2019. Fiscal 2019 historical net income was reduced by $ to reflect the dividend requirement. Pro forma weighted average common shares used in computing pro forma net income per share gives effect to a repurchase of common shares (based upon the midpoint of the estimated offering range set forth on the cover page of this prospectus) from certain Pre-IPO Stockholders using the proceeds from the concurrent offering of Series A Preferred Stock. Assumes no common shares repurchased for the underwriters over-allotment option in the concurrent offering of Series A preferred stock. |
24
RISK FACTORS
You should carefully consider the risks described below and the other information contained in this prospectus, including our consolidated financial statements and the related notes, before making an investment decision. Our business, financial condition and results of operations could be materially and adversely affected by any of these risks or uncertainties. In that case, the trading price of our common stock could decline, and you may lose all or part of your investment.
Risks Related to Our Business and Industry
Various operating factors and general economic conditions affecting the food retail industry may affect our business and may adversely affect our business and operating results.
Our operations and financial performance are affected by economic conditions such as macroeconomic conditions, credit market conditions and the level of consumer confidence. For the majority of fiscal 2019 and prior years, the combination of an improving economy, lower unemployment, higher wages and lower gasoline prices had contributed to increased consumer confidence. However, at present, as a result of the recent coronavirus
(COVID-19)
pandemic, there is substantial uncertainty about the strength of the economy, which may currently be in a recession and has experienced rapid increases in unemployment rates, as well as uncertainty about the pace of recovery despite the fiscal stimulus that Congress has enacted. The full extent to which the coronavirus(COVID-19)
pandemic impacts our business, results of operations and financial condition will depend on future developments, which are currently highly uncertain and cannot be predicted, including, but not limited to the duration, spread, severity and impact of the coronavirus
(COVID-19)
pandemic, the effects of the pandemic on our customers and suppliers, the duration of the federal and local state declarations of emergency and the associated remedial actions and stimulus measures adopted by federal and local governments, including measures to assure social distancing and to what extent normal economic and operating conditions can resume. We are also unable to predict the extent, implementation and effectiveness of any government-funded benefit programs and stimulus packages on employment levels and on demand for our products.
We may experience materially adverse impacts to our business as a result of any economic recession or depression that has occurred or may occur as a result of efforts to curb the spread of coronavirus
(COVID-19).
For example, during March 2020 through April 2020, the United States experienced a rapid and significant increase in unemployment claims and other indications of a significant economic slowdown believed to be related to the coronavirus(COVID-19)
pandemic. Consumers’ perception or uncertainty related to the economy, as well as a decrease in their personal financial condition, could hurt overall consumer confidence and reduce demand for many of our product offerings. Consumers may reduce spending onnon-essential
items, purchase value-oriented products or increasingly rely on food discounters in an effort to secure the food and drug products that they need, all of which could impact our sales and profit.An increase in fuel prices could also have an effect on consumer spending and on our costs of producing and procuring products that we sell. As well, both inflation and deflation affect our business. Food deflation could reduce sales growth and earnings, while food inflation could reduce gross profit margins. Several food items and categories, including poultry and fresh fruit, experienced price deflation in fiscal 2019; however, prices for all other major food categories increased. We are unable to predict the direction of the economy or fuel prices or if deflationary trends will occur. If the economy weakens, fuel prices increase or deflationary trends occur, our business and operating results could be adversely affected.
Competition in our industry is intense, and our failure to compete successfully may adversely affect our profitability and operating results.
The food and drug retail industry is large and dynamic, characterized by intense competition among a collection of local, regional and national participants. We face strong competition from other brick and mortar
25
food and/or drug retailers, supercenters, club stores, discount stores, online retailers, specialty and niche supermarkets, drug stores, general merchandisers, wholesale stores, convenience stores, natural food stores, farmers’ markets, local chains and stand-alone stores that cater to the individual cultural preferences of specific neighborhoods, restaurants and home delivery and meal solution companies. Shifts in the competitive landscape, consumer preference or market share may have an adverse effect on our profitability and results of operations.
As a result of consumers’ growing desire to shop online, we also face increasing competition from both our existing competitors that have incorporated the internet as a
direct-to-consumer
channel and online providers that sell grocery products. In addition, we face increasing competition from online distributors of pharmaceutical products. Although we have accelerated the expansion of our eCommerce business, including to respond to increased customer demand as a result of the pandemic, and offer our customers the ability to shop online for both home delivery and Drive Up & Go curbside pickup, there is no assurance that these online initiatives will be successful. In addition, these initiatives may have an adverse impact on our profitability as a result of lower gross profits or greater operating costs to compete.Our ability to attract customers is dependent, in large part, upon a combination of channel preference, location, store conditions, quality, price, service, convenience and selection. In each of these areas, traditional and
non-traditional
competitors compete with us and may successfully attract our customers by matching or exceeding what we offer or by providing greater shopping convenience. In recent years, many of our competitors have aggressively added locations and adopted a multi-channel approach to marketing and advertising. Our responses to competitive pressures, such as additional promotions, increased advertising, additional capital investment and the development of our eCommerce offerings, could adversely affect our profitability and cash flow. We cannot guarantee that our competitive response will succeed in increasing or maintaining our share of retail food sales.An increasingly competitive industry and, from time to time, deflation in the prices of certain foods have made it difficult for food retailers to achieve positive identical sales growth on a consistent basis. We and our competitors have attempted to maintain or grow our and their respective share of retail food sales through capital and price investment, increased promotional activity and new and remodeled stores, creating a more difficult environment to consistently increase year-over-year sales. Some of our primary competitors are larger than we are or have greater financial resources available to them and, therefore, may be able to devote greater resources to invest in price, promotional activity and new or remodeled stores in order to grow their share of retail food sales. Price investment by our competitors has also, from time to time, adversely affected our operating margins. In recent years, we have invested in price in order to remain competitive and generate sales growth; however, there can be no assurance this strategy will be successful.
Because we face intense competition, we need to anticipate and respond to changing consumer preferences and demands more effectively than our competitors. We devote significant resources to differentiating our banners in the local markets where we operate and invest in loyalty programs to drive traffic. Our local merchandising teams spend considerable time working with store directors to make sure we are satisfying consumer preferences. In addition, we strive to achieve and maintain favorable recognition of ourofferings by marketing these offerings to consumers and enhancing a perception of value for consumers. While we seek to continuously respond to changing consumer preferences, there are no assurances that our responses will be successful.
Own Brands
Our continued success is dependent upon our ability to control operating expenses, including managing health care and pension costs stipulated by our collective bargaining agreements, to effectively compete in the food retail industry. Several of our primary competitors are larger than we are, or are not subject to collective bargaining agreements, allowing them to more effectively leverage their fixed costs or more easily reduce operating expenses. Finally, we need to source, market and merchandise efficiently. Changes in our product mix also may negatively affect our profitability. Failure to accomplish our objectives could impair our ability to compete successfully and adversely affect our profitability.
26
Profit margins in the food retail industry are low. In order to increase or maintain our profit margins, we develop operating strategies to increase revenues, increase gross margins and reduce costs, such as new marketing programs, new advertising campaigns, productivity improvements, shrink-reduction initiatives, distribution center efficiencies, manufacturing efficiencies, energy efficiency programs and other similar strategies. Our failure to achieve forecasted revenue growth, gross margin improvement or cost reductions could have a material adverse effect on our profitability and operating results.
We may not timely identify or effectively respond to consumer trends, which could negatively affect our relationship with our customers, the demand for our products and services and our market share.
It is difficult to predict consistently and successfully the products and services our customers will demand over time. Our success depends, in part, on our ability to identify and respond to evolving trends in demographics and preferences. Failure to timely identify or effectively respond to changing consumer tastes, preferences (including those relating to sustainability of product sources) and spending patterns could lead us to offer our customers a mix of products or a level of pricing that they do not find attractive. This could negatively affect our relationship with our customers, leading them to reduce their visits to our stores and the amount they spend. Further, while we have significantly expanded our digital capabilities and grown our loyalty programs over the last several years, as technology advances, and as the way our customers interact with technology changes, we will need to continue to develop and offer eCommerce and loyalty solutions that are both cost effective and compelling. Our failure to anticipate or respond to customer expectations for products, services, eCommerce and loyalty programs would adversely affect the demand for our products and services and our market share and could have an adverse effect on our performance, margins and operating income.
Increased commodity prices may adversely impact our profitability.
We make
in-store
pricing decisions on a regional basis depending on the competitive landscape. We also set our pricing based on the cost of doing business on a regional basis, as a result of occupancy and labor costs that vary by region. At the same time, we frequently discuss ways to lower our costs with our consumer packaged goods partners based upon our scale and sales momentum. Many of our own and sourced products include ingredients such as wheat, corn, oils, milk, sugar, proteins, cocoa and other commodities. Commodity prices worldwide have been volatile. Any increase in commodity prices may cause an increase in our input costs or the prices our vendors seek from us. Although we typically are able to pass on modest commodity price increases or mitigate vendor efforts to increase our costs, we may be unable to continue to do so, either in whole or in part, if commodity prices increase materially. Suppliers, like us, are incurring additional costs to respond to the coronavirus (COVID-19) pandemic, and may seek to pass those costs through to us. If we are forced to increase prices, our customers may reduce their purchases at our stores or trade down to less profitable products. Both may adversely impact our profitability as a result of reduced revenue or reduced margins.Fuel prices and availability may adversely affect our results of operations.
We currently operate 402 fuel centers that are adjacent to many of our store locations. As a result, we sell a significant amount of gasoline. Increased regulation or significant increases in wholesale fuel costs could result in lower gross profit on fuel sales, and demand could be affected by retail price increases as well as by concerns about the effect of emissions on the environment. We are unable to predict future regulations, environmental effects, political unrest, acts of terrorism, the actions of major oil producing countries to regulate oil production and other matters that may affect the cost and availability of fuel, and how our customers will react, which could adversely affect our results of operations.
Product supply disruptions, especially those to perishable products, may have an adverse effect on our profitability and operating results.
Reflecting consumer preferences, we have a significant focus on perishable products. Perishable sales accounted for over 41% of our revenue in fiscal 2019. We rely on various suppliers and vendors to provide and
27
deliver our perishable and other product inventory on a continuous basis. We could suffer significant perishable and other product inventory losses and significant lost revenue in the event of the loss or a shutdown of a major supplier or vendor, disruption of our distribution network, extended power outages, natural disasters or other catastrophic occurrences. Due to the coronavirus
(COVID-19)
pandemic and the resulting dislocation of workplaces and the economy, the ability of vendors to supply required products may be impaired because of the illness or absenteeism in their workforces, government mandated shutdown orders or impaired financial conditions. Currently, the supply of meat products has been impacted by the shutdown of certain key production facilities due to workforce illness. We have good working relationships with major meat suppliers, smaller domestic suppliers and international suppliers, and we stay in regular contact to assess production capacity and product availability. Nonetheless, we have experienced allocations on a range of meat products, and we have had to expand our supplier portfolio or make adjustments to our merchandising plans to support in-stock conditions for our customers. Based on current discussions with industry leaders, we anticipate that the meat supply chain will remain challenging for the near future. The supply of each product will return to pre-coronavirus (COVID-19) levels at different times, and that there can be no assurance that our efforts to ensure in-stock positions for all of the products that our customers require will be successful.Severe weather and natural disasters may adversely affect our business.
Severe weather conditions such as hurricanes, earthquakes, floods, extended winter storms, heat waves or tornadoes, as well as other natural disasters in areas in which we have stores or distribution centers or from which we source or obtain products have caused and may cause physical damage to our properties, closure of one or more of our stores, manufacturing facilities or distribution centers, lack of an adequate work force in a market, temporary disruption in the manufacture of products, temporary disruption in the supply of products, disruption in the transport of goods, delays in the delivery of goods to our distribution centers or stores, a reduction in customer traffic and a reduction in the availability of products in our stores. In addition, adverse climate conditions and adverse weather patterns, such as drought or flood, that impact growing conditions and the quantity and quality of crops yielded by food producers may adversely affect the availability or cost of certain products within the grocery supply chain. Any of these factors may disrupt our business and adversely affect our business.
Threats or potential threats to security of food and drug safety, the occurrence of a widespread health epidemic and/or pandemic or regulatory concerns in our supply chain may adversely affect our business.
Acts or threats, whether perceived or real, of war or terror or other criminal activity directed at the food and drug industry or the transportation industry, whether or not directly involving our stores, could increase our operating costs and operations, or impact general consumer behavior and consumer spending. Other events that give rise to actual or potential food contamination, drug contamination or food-borne illnesses, or a widespread regional, national or global health epidemic and/or pandemic, such as of influenza, or, specifically, the recent pandemic, could have an adverse effect on our operating results or disrupt production and delivery of the products we sell, our ability to appropriately and safely staff our stores and cause customers to avoid public gathering places or otherwise change their shopping behaviors.
coronavirus
(COVID-19)
We source our products from vendors and suppliers and related networks across the globe who may be subject to regulatory actions or face criticism due to actual or perceived social injustices, including human trafficking, child labor or environmental, health and safety violations. A disruption in our supply chain due to any regulatory action or social injustice could have an adverse impact on our supply chain and ultimately our business, including potential harm to our reputation.
The costs associated with implementing and maintaining the safety measures designed to protect our associates and customers in the coronavirus (COVID-19) pandemic have to date been more than offset by increased sales, but in the event our sales decline as stay-at-home guidance subsides and the economy begins to
28
re-open, we may be required to continue to implement and maintain these protective measures despite lower sales, thereby reducing our profitability.
Specifically, our business has been impacted by the
coronavirus
(COVID-19)
Coronavirus
(COVID-19)
poses a risk to our employees, our customers, our vendors and the communities in which we operate, which could negatively impact our business. As the pandemic has grown, consumer fear about becoming ill with the virus and recommendations and/or mandates from federal, state and local authorities to social distance or self-quarantine have increased. Many states, including California, Washington State and other states in which we operate and have a significant number of stores, have declared a state of emergency, closed schools andnon-essential
businesses and enacted limitations on the number of people allowed to gather at one time in the same space. These rules, as well as the general fear that causes people to avoid gathering in public places, may adversely affect our customer traffic, our ability to adequately staff our stores and operations, and our ability to transport product on a timely basis.We currently operate our stores as an “essential” business under relevant federal, state and local mandates. If the classification of what is an “essential” business changes or other government regulations are adopted, we may be required to severely curtail operations, which would significantly and adversely impact our sales and revenue. Even though our stores are considered essential businesses, state and local mandates may impose limitations on the operations of our stores, including customer traffic. While we have taken many protective measures in our stores, including, among others, spacing requirements, single direction aisles, senior and compromised customer-only hours, plexiglass shields at checkout and providing masks and gloves to our front line employees, there can be no assurance that these measures will be sufficient to protect our store employees and customers. We have, and may in the future be required to temporarily close a store, office or distribution center for cleaning and/or quarantine employees in the event that an employee develops
COVID-19
. We have proactively paused self-service operations, such as soup bars, wing bars, salad bars and olive bars. These factors could impact the ability of our stores to operate normal hours of operation or have sufficient inventory which may disrupt our business and negatively impact our financial results. If we do not respond appropriately to the pandemic, or if customers do not perceive our response to be adequate, we could suffer damage to our reputation and our brand, which could adversely affect our business in the future.Further, coronavirus
(COVID-19)
may also impact our ability to access and ship product to and from impacted locations. Items such as consumer staples, paper goods, key cleaning supplies and protective equipment for our employees, and more recently, meat products have been, and may continue to be, in short supply. While we have put temporary limits on certain products to help our customers to get the items they need, supply for certain products may be negatively impacted as overall demand has increased.Any planned construction and opening of new stores may be negatively impacted due to state or county requirements that workers leave their homes only for essential business and the suspension of governmental permitting processes in some areas during the pandemic in some locations.
We have transitioned a significant subset of our employee population to a remote work environment in an effort to mitigate the spread of coronavirus
(COVID-19),
which may exacerbate certain risks to our business.The extent to which the coronavirus
(COVID-19)
may impact our business will depend on future developments, which are highly uncertain and cannot be predicted at this time. We may experience an impact to the timing and availability of key products from suppliers, broader quarantines or other restrictions that limit consumer visits to our stores, increased, employee impacts from illness, school closures and other community response measures, all of which could negatively impact our business. We continually monitor the situation and regularly adjust our policies and practices as more information and guidance becomes available.29
We could be affected if consumers lose confidence in the food supply chain or the quality and safety of our products.
We could be adversely affected if consumers lose confidence in the safety and quality of certain food products. Adverse publicity about these types of concerns, such as the concerns during fiscal 2019 relating to the coronavirus
(COVID-19)
pandemic and fiscal 2018 relating to romaine lettuce, whether valid or not, may discourage consumers from buying our products or cause production and delivery disruptions. To the extent that a pathogen is food-borne, or perceived to be food-borne, future outbreaks may adversely affect the price and availability of certain food products and cause our customers to eat less of such product. The real or perceived sale of contaminated food products by us could result in product liability claims, a loss of consumer confidence and product recalls, which could have a material adverse effect on our business.Consolidation in the healthcare industry could adversely affect our business and financial condition.
Many organizations in the healthcare industry have consolidated to create larger healthcare enterprises with greater market power, which has resulted in increased pricing pressures. If this consolidation trend continues, it could give the resulting enterprises even greater bargaining power, which may lead to further pressure on the prices for our pharmacy products and services. If these pressures result in reductions in our prices, we will become less profitable unless we are able to achieve corresponding reductions in costs or develop profitable new revenue streams. We expect that market demand, government regulation, third-party reimbursement policies, government contracting requirements and societal pressures will continue to cause the healthcare industry to evolve, potentially resulting in further business consolidations and alliances among the industry participants we engage with, which may adversely impact our business, financial condition and results of operations.
Certain risks are inherent in providing pharmacy services, and our insurance may not be adequate to cover any claims against us.
We currently operate 1,726 pharmacies and, as a result, we are exposed to risks inherent in the packaging, dispensing, distribution and disposal of pharmaceuticals and other healthcare products, such as risks of liability for products which cause harm to consumers, as well as increased regulatory risks and related costs. Although we maintain insurance, we cannot guarantee that the coverage limits under our insurance programs will be adequate to protect us against future claims, or that we will be able to maintain this insurance on acceptable terms in the future, or at all. Our results of operations, financial condition or cash flows may be materially adversely affected if in the future our insurance coverage proves to be inadequate or unavailable, or there is an increase in the liability for which we self-insure, or we suffer harm to our reputation as a result of an error or omission.
We are subject to numerous federal and state regulations. Each of our
in-store
pharmacies must be licensed by the state government. The licensing requirements vary from state to state. An additional registration certificate must be granted by the U.S. Drug Enforcement Administration, and, in some states, a separate controlled substance license must be obtained to dispense controlled substances. In addition, pharmacies selling controlled substances are required to maintain extensive records and often report information to state and federal agencies. If we fail to comply with existing or future laws and regulations, we could suffer substantial civil or criminal penalties, including the loss of our licenses to operate pharmacies and our ability to participate in federal and state healthcare programs. As a consequence of the severe penalties we could face, we must devote significant operational and managerial resources to complying with these laws and regulations.Recently, pharmaceutical manufacturers, wholesale distributors and retailers have faced intense scrutiny and, in some cases, investigations and litigation relating to the distribution of prescription opioid pain medications. On May 22, 2018, we received a subpoena from the Office of the Attorney General for the State of Alaska (the “Alaska Attorney General”) stating that the Alaska Attorney General has reason to believe that we have engaged in unfair or deceptive trade practices under Alaska’s Unfair Trade Practices and Consumer Act and seeking documents regarding our policies, procedures, controls, training, dispensing practices and other matters
30
in connection with the sale and marketing of opioid pain medications. We responded to the subpoena on July 30, 2018 and have not received any further communication from the Alaska Attorney General. We do not currently have a basis to believe we have violated Alaska’s Unfair Trade Practices and Consumer Act; however, at this time, we are unable to determine the probability of the outcome of this matter or estimate a range of reasonably possible loss, if any.
We are one of dozens of companies that have been named in various lawsuits alleging that defendants contributed to the national opioid epidemic. At present, we are named in over 70 suits pending in various state courts as well as in the United States District Court for the Northern District of Ohio, where over 2,000 cases have been consolidated as Multi-District Litigation (“MDL”) pursuant to 28 U.S.C. §1407. In two- we filed motions to dismiss, which were denied, and we have now answered the complaints. The MDL cases are stayed pending bellwether trials, and the only active matter is the New Mexico action where a September 2021 trial date has been set. We are vigorously defending these matters and believe that these cases are without merit. At this early stage in the proceedings, we are unable to determine the probability of the outcome of these matters or the range of reasonably possible loss, if any.
matters-MDL
No. 2804 filed by The Blackfeet Tribe of the Blackfeet Indian Reservation andState of New Mexico v. Purdue Pharma L.P., et al.
Application of federal and state laws and regulations could subject our current practices to allegations of impropriety or illegality, or could require us to make significant changes to our operations. In addition, we cannot predict the impact of future legislation and regulatory changes on our pharmacy business or assure that we will be able to obtain or maintain the regulatory approvals required to operate our business.
Integrating acquisitions may be time-consuming and create costs that could reduce our net income and cash flows.
Part of our strategy may include pursuing acquisitions that we believe will be accretive to our business. With respect to any possible future acquisitions, the process of integrating the acquired business may be complex and time consuming, may be disruptive to the business and may cause an interruption of, or a distraction of management’s attention from, the business as a result of a number of obstacles, including, but not limited to:
| • | transaction litigation; |
| • | a failure of our due diligence process to identify significant risks or issues; |
| • | the loss of customers of the acquired company or our Company; |
| • | negative impact on the brands or banners of the acquired company or our Company; |
| • | a failure to maintain or improve the quality of customer service; |
| • | difficulties assimilating the operations and personnel of the acquired company; |
| • | our inability to retain key personnel of the acquired company; |
| • | the incurrence of unexpected expenses and working capital requirements; |
| • | our inability to achieve the financial and strategic goals, including synergies, for the combined businesses; and |
| • | difficulty in maintaining internal controls, procedures and policies. |
Any of the foregoing obstacles, or a combination of them, could decrease gross profit margins or increase selling, general and administrative expenses in absolute terms and/or as a percentage of net sales, which could in turn negatively impact our net income and cash flows.
We may not be able to consummate acquisitions in the future on terms acceptable to us, or at all. In addition, acquisitions are accompanied by the risk that the obligations and liabilities of an acquired company may
31
not be adequately reflected in the historical financial statements of that company and the risk that those historical financial statements may be based on assumptions which are incorrect or inconsistent with our assumptions or approach to accounting policies. Any of these material obligations, liabilities or incorrect or inconsistent assumptions could adversely impact our results of operations and financial condition.
A significant majority of our employees are unionized, and our relationship with unions, including labor disputes or work stoppages, could have an adverse impact on our operations and financial results.
As of February 29, 2020, approximately 185,000 of our employees were covered by collective bargaining agreements. Collective bargaining agreements covering approximately 45,000 of our employees have expired or are scheduled to expire in fiscal 2020. In future negotiations with labor unions, we expect that health care, pension costs and/or contributions and wage costs, among other issues, will be important topics for negotiation. If, upon the expiration of such collective bargaining agreements, we are unable to negotiate acceptable contracts with labor unions, it could result in strikes by the affected workers and thereby significantly disrupt our operations. As part of our collective bargaining agreements, we may need to fund additional pension contributions, which would negatively impact our Adjusted Free Cash Flow. Further, if we are unable to control health care and pension costs provided for in the collective bargaining agreements, we may experience increased operating costs and an adverse impact on our financial results.
Increased pension expenses, contributions and surcharges may have an adverse impact on our financial results.
We are sponsors of defined benefit retirement plans for certain employees at our Safeway, United Supermarkets, LLC (“United”) and Shaw’s stores and distribution centers. The funded status of these plans (the difference between the fair value of the plan assets and the projected benefit obligation) is a significant factor in determining annual pension expense and cash contributions to fund the plans.
Unfavorable investment performance, increased pension expense and cash contributions may have an adverse impact on our financial results. Under the Employee Retirement Income Security Act of 1974, as amended (“ERISA”), the Pension Benefit Guaranty Corporation (“PBGC”) has the authority to petition a court to terminate an underfunded pension plan in limited circumstances. In the event that our defined benefit pension plans are terminated for any reason, we could be liable for the entire amount of the underfunding, as calculated by the PBGC based on its own assumptions (which would result in a larger obligation than that based on the actuarial assumptions used to fund such plans). Under ERISA and the Code, the liability under these defined benefit plans is joint and several with all members of our control group, such that each member of our control group is potentially liable for the defined benefit plans of each other member of the control group.
In addition, we participate in various multiemployer pension plans for substantially all employees represented by unions pursuant to collective bargaining agreements that require us to contribute to these plans. Under the Pension Protection Act of 2006 (the “PPA”), contributions in addition to those made pursuant to a collective bargaining agreement may be required in limited circumstances.
Pension expenses for multiemployer pension plans are recognized by us as contributions are made. Generally, benefits are based on a fixed amount for each year of service. Our contributions to multiemployer plans were $469.3 million, $451.1 million and $431.2 million during fiscal 2019, fiscal 2018 and fiscal 2017, respectively.
Based on an assessment of the most recent information available, we believe that most of the multiemployer plans to which we contribute are underfunded. We are only one of a number of employers contributing to these plans. As of February 11, 2020, we attempted to estimate our share of the underfunding of multiemployer plans to which we contribute, based on the ratio of our contributions to the total of all contributions to these plans in a year. Our estimate of the Company’s share of the underfunding of multiemployer plans to which we contribute
32
was $4.9 billion. Our share of underfunding described above is an estimate and could change based on the amount contributed to the plans, investment returns on the assets held in the plans, actions taken by trustees who manage the plans’ benefit payments, interest rates, the amount of withdrawal liability payments made to the plans, if the employers currently contributing to these plans cease participation, and requirements under the PPA, the Multiemployer Pension Reform Act of 2014 and applicable provisions of the Code.
We are the second largest contributing employer to the Food Employers Labor Relations Association and United Food and Commercial Workers Pension Fund (“FELRA”) which is currently projected by FELRA to become insolvent in the first quarter of 2021, and to the
Mid-Atlantic
UFCW and Participating Pension Fund (“MAP”). We continue to fund all of our required contributions to FELRA and MAP. On March 5, 2020, we agreed with the two applicable local unions to new collective bargaining agreements pursuant to which we contribute to FELRA and MAP. In connection with these agreements, to address the pending insolvency of FELRA, we and the two local unions, along with the largest contributing employer, agreed to combine MAP into FELRA (“Combined Plan”). Upon the formation of the Combined Plan, the Combined Plan will be frozen and we will be required to annually pay $23.2 million to the Combined Plan for the next 25 years. After making all 25 years of payments, we will receive a release of all withdrawal liability and mass withdrawal liability from FELRA, MAP, the Combined Plan and the PBGC. This $23.2 million payment will replace our current annual contribution to both MAP and FELRA, which was a combined $26.2 million in fiscal 2019. In addition to the $23.2 million payment, we will begin to contribute to a new multiemployer pension plan. This new multiemployer plan will be limited to providing benefits to participants in MAP and FELRA in excess of the benefits the PBGC insures under law. Furthermore, upon formation of the Combined Plan, we will establish and contribute to a new variable defined benefit plan that will provide benefits to participants for future services. We are in discussions with the local unions, the the largest contributing employer, and negotiations with the PBGC with respect to these other plans and the Combined Plan. It is possible some provisions of our agreements with the local unions may change as a result of negotiations with the PBGC. We expect formation of the Combined Plan by no later than December 31, 2020. The local unions reserved their arguments in their respective collective bargaining agreements with Safeway, that Safeway is liable to pay for all FELRA and MAP benefits that are not paid by the PBGC because the PBGC becomes insolvent. Safeway reserved, in its collective bargaining agreements with the local unions, its arguments that it is not liable for FELRA and MAP benefits the PBGC does not pay because the PBGC becomes insolvent. We believe the possibility of the PBGC becoming insolvent is remote. We are currently evaluating the effect of these new agreements to our consolidated financial statements and preliminarily expect to record a material increase to our pension related liabilities with a correspondingnon-cash
charge to pension expense upon approval by the PBGC.The United States Congress established a joint committee in February 2018 with the objective of formulating recommendations to improve the solvency of multiemployer pension plans and the PBGC. Although the joint committee’s term expired without it making any formal recommendations, Congress is continuing to consider these issues, which may result in legislative changes. If the funding required for these plans declines, our future expense could be favorably affected. Favorable legislation could also decrease our financial obligations to the plans. On the other hand, our share of the underfunding and our future expense and liability could increase if the financial condition of the plans deteriorated or if adverse changes in the law occurred. We continue to evaluate our potential exposure to underfunded multiemployer pension plans.
In the event we were to exit certain markets or otherwise cease contributing to these plans, we could trigger a substantial withdrawal liability. Any accrual for withdrawal liability will be recorded when a withdrawal is probable and can be reasonably estimated, in accordance with GAAP. All trades or businesses in the employer’s control group are jointly and severally liable for the employer’s withdrawal liability.
We are subject to withdrawal liabilities related to Safeway’s previous closure in 2013 of its Dominick’s division. One of the plans, the UFCW & Employers Midwest Pension Fund (the “Midwest Plan”), had asserted we may be liable for mass withdrawal liability, if the plan has a mass withdrawal, in addition to the liability the Midwest Plan already has assessed. We had disputed that the Midwest Plan would have the right to assess us a mass withdrawal liability and we were also disputing in arbitration the amount of the withdrawal liability the
33
Midwest Plan had assessed. On March 12, 2020, we agreed to a settlement of these matters with the Midwest Plan’s Board of Trustees. As a result of the settlement, the Company agreed to pay $75.0 million, in a lump sum, which is expected to be paid in the first quarter of fiscal 2020, and forego any amounts already paid to the Midwest Plan. The Company had previously recorded an estimated withdrawal liability and as a result of the settlement, the Company recorded a gain of $43.3 million to reduce the previously recorded estimated withdrawal liability to the settlement amount. The total amount of the withdrawal liability recorded with respect to the Dominick’s division as of February 29, 2020 was $80.0 million, which includes the $75.0 million settlement amount.
Unfavorable changes in government regulation may have a material adverse effect on our business.
Our stores are subject to various federal, state, local and foreign laws, regulations and administrative practices. We must comply with numerous provisions regulating health and sanitation standards, food labeling, energy, environmental, equal employment opportunity, minimum wages, pension, health insurance and other welfare plans, licensing for the sale of food, drugs and alcoholic beverages and any new provisions relating to the coronavirus
(COVID-19)
pandemic. We cannot predict either the nature of future laws, regulations, interpretations or applications, or the effect either additional governmental laws, regulations or administrative procedures, when and if promulgated, or disparate federal, state, local and foreign regulatory schemes would have on our future business. In addition, regulatory changes could require the reformulation of certain products to meet new standards, the recall or discontinuance of certain products not able to be reformulated, additional record keeping, expanded documentation of the properties of certain products, expanded or different labeling and/or scientific substantiation. Any or all of such requirements could have an adverse effect on our business.The minimum wage continues to increase and is subject to factors outside of our control. Changes to wage regulations could have an impact on our future results of operations.
A considerable number of our employees are paid at rates related to the federal minimum wage. Additionally, many of our stores are located in states, including California, where the minimum wage is greater than the federal minimum wage and where a considerable number of employees receive compensation equal to the state’s minimum wage. For example, as of February 29, 2020, we employed approximately 67,000 associates in California, where the current minimum wage was increased to $13.00 per hour, effective January 1, 2020, and will gradually increase each year thereafter to $15.00 per hour by January 1, 2022. In Massachusetts, where we employed approximately 10,800 associates as of February 29, 2020, the minimum wage increased to $12.75 per hour, effective January 1, 2020, and will reach $15.00 per hour by 2023. In New Jersey, where we employed approximately 6,600 associates as of February 29, 2020, the minimum wage increased to $11.00 per hour, effective January 1, 2020, and will reach $15.00 per hour by 2024. In Maryland, where we employed approximately 7,100 associates as of February 29, 2020, the minimum wage increased to $11.00 per hour, effective January 1, 2020, and will reach $15.00 per hour by 2025. Moreover, municipalities may set minimum wages above the applicable state standards. For example, the minimum wage in Seattle, Washington, where we employed approximately 1,800 associates as of February 29, 2020, increased to $16.39 per hour effective January 1, 2020 for employers with more than 500 employees nationwide. In Chicago, Illinois, where we employed approximately 6,100 associates as of February 29, 2020, the minimum wage increased to $13.00 per hour effective July 1, 2019. Any further increases in the federal minimum wage or the enactment of additional state or local minimum wage increases could increase our labor costs, which may adversely affect our results of operations and financial condition.
The food retail industry is labor intensive. Our ability to meet our labor needs, while controlling wage and labor-related costs, is subject to numerous external factors, including the availability of qualified persons in the workforce in the local markets in which we are located, unemployment levels within those markets, prevailing wage rates, changing demographics, health and other insurance costs and changes in employment and labor laws. Such laws related to employee hours, wages, job classification and benefits could significantly increase operating costs. In the event of increasing wage rates, if we fail to increase our wages competitively, the quality of our
34
workforce could decline, causing our customer service to suffer, while increasing wages for our employees could cause our profit margins to decrease. If we are unable to hire and retain employees capable of meeting our business needs and expectations, our business and brand image may be impaired. Any failure to meet our staffing needs or any material increase in turnover rates of our employees may adversely affect our business, results of operations and financial condition.
Beginning March 15, 2020, in recognition of their significant efforts, we instituted a temporary increase in pay for all front-line associates of $2 per hour for every hour that they work. This increase in employee wages will impact our profitability during the period that it is in effect.
Failure to attract and retain qualified associates could materially adversely affect our financial performance.
Our ability to continue to conduct and expand our operations depends on our ability to attract and retain a large and growing number of qualified associates. Our ability to meet our labor needs, including our ability to find qualified personnel to fill positions that become vacant at our existing stores and distribution centers, while controlling our associate wage and related labor costs, is generally subject to numerous external factors, including the availability of a sufficient number of qualified persons in the work force of the markets in which we operate, unemployment levels within those markets, prevailing wage rates, changing demographics, health and other insurance costs and adoption of new or revised employment and labor laws and regulations. If we are unable to locate, to attract or to retain qualified personnel, the quality of service we provide to our customers may decrease and our financial performance may be adversely affected.
To meet our requirements for increased labor in order to meet customer demand in store and across eCommerce channels, we have partnered with major companies to provide temporary jobs to their employees who have been furloughed or had their hours cut. We have hired over 55,000 new associates since the beginning of fiscal 2020, partnering with more than 35 companies to help keep Americans working. To the extent that our need for increased labor continues, we will need to hire and train additional employees to fill the roles performed by these temporary employees. This increase in associates and the wages that we must pay them will impact our profitability during the period that that they are with us.
Failure to realize anticipated benefits from our productivity initiatives could adversely affect our financial performance and competitive position.
Although we have identified and are in the early stages of implementing a broad range of new, specific productivity initiatives that target $1 billion in annual
run-rate
productivity benefits by the end of fiscal 2022 to help offset cost inflation, fund growth and drive earnings, there can be no assurance that all of our initiatives will be successful or that we will realize the estimated benefits in the currently anticipated amounts or time-frame, if at all. Certain of these initiatives involve significant changes in our operating processes and systems that could result in disruptions in our operations. The savings from these planned productivity initiatives represent management’s estimates and remain subject to risks and uncertainties. The actual benefits of our productivity initiatives, if achieved, may be lower than what we expect and may take longer than anticipated. While certain projects are well underway and contributing as expected, in other cases, we have temporarily paused some of our initiatives to ensure we are first taking care of our customers and our communities, while focusing on the safety of our associates during the coronavirus (COVID-19) pandemic.Unfavorable changes in, failure to comply with or increased costs to comply with environmental laws and regulations could adversely affect us. The storage and sale of petroleum products could cause disruptions and expose us to potentially significant liabilities.
Our operations, including our 402 fuel centers, are subject to various laws and regulations relating to the protection of the environment, including those governing the storage, management, disposal and cleanup of hazardous materials. Some environmental laws, such as the Comprehensive Environmental Response,
35
Compensation and Liability Act and similar state statutes, impose strict, and under certain circumstances joint and several, liability for costs to remediate a contaminated site, and also impose liability for damages to natural resources.
Federal regulations under the Clean Air Act require phase out of the production of ozone depleting refrigerants that include hydrochlorofluorocarbons, the most common of which is
R-22.
As of January 1, 2020, industry production of newR-22
refrigerant gas has been completely phased out; however, recovered and recycled/reclaimedR-22
will be available for servicing systems after 2020. We are reducing ourR-22
footprint while continuing to repair leaks, thus extending the useful lifespan of existing equipment. In fiscal 2019, we incurred approximately $16 million for system retrofits, and we have budgeted approximately $11 million per year for subsequent years. Leak repairs are part of the ongoing refrigeration maintenance budget. We may be required to spend additional capital above and beyond what is currently budgeted for system retrofits and leak repairs which could have a significant impact on our business, results of operations and financial condition.Third-party claims in connection with releases of or exposure to hazardous materials relating to our current or former properties or third-party waste disposal sites can also arise. In addition, the presence of contamination at any of our properties could impair our ability to sell or lease the contaminated properties or to borrow money using any of these properties as collateral. The costs and liabilities associated with any such contamination could be substantial and could have a material adverse effect on our business. Under current environmental laws, we may be held responsible for the remediation of environmental conditions regardless of whether we lease, sublease or own the stores or other facilities and regardless of whether such environmental conditions were created by us or a prior owner or tenant. In addition, the increased focus on climate change, waste management and other environmental issues may result in new environmental laws or regulations that negatively affect us directly or indirectly through increased costs on our suppliers. There can be no assurance that environmental contamination relating to prior, existing or future sites or other environmental changes will not adversely affect us through, for example, business interruption, cost of remediation or adverse publicity.
We are subject to, and may in the future be subject to, legal or other proceedings that could have a material adverse effect on us.
From time to time, we are a party to legal proceedings, including matters involving personnel and employment issues, personal injury, antitrust claims, intellectual property claims and other proceedings arising in or outside of the ordinary course of business. In addition, there are an increasing number of cases being filed against companies generally, including class-action allegations under federal and state wage and hour laws. We may also be exposed to legal proceedings arising out of the coronavirus
(COVID-19)
pandemic, including the potential for wrongful death actions brought on behalf of employees that contracted coronavirus(COVID-19)
. We estimate our exposure to these legal proceedings and establish reserves for the estimated liabilities. Assessing and predicting the outcome of these matters involves substantial uncertainties. Although not currently anticipated by management, unexpected outcomes in these legal proceedings or changes in management’s forecast assumptions or predictions could have a material adverse impact on our results of operations.We may be adversely affected by risks related to our dependence on IT systems. Any future changes to or intrusion into these IT systems, even if we are compliant with industry security standards, could materially adversely affect our reputation, financial condition and operating results.
We have complex IT systems that are important to the success of our business operations and marketing initiatives. If we were to experience failures, breakdowns, substandard performance or other adverse events affecting these systems, or difficulties accessing the proprietary business data stored in these systems, or in maintaining, expanding or upgrading existing systems or implementing new systems, we could incur significant losses due to disruptions in our systems and business. These risks may be further exacerbated by the deployment and continued refinement of cloud-based enterprise solutions. In a cloud computing environment, we could be subject to outages by third-party service providers and security breaches to their systems. Unauthorized parties have obtained in the past, and may in the future obtain, access to cloud-based platforms used by companies.
36
Improper activities by third parties, exploitation of encryption technology, new data-hacking tools and discoveries and other events or developments may result in future intrusions into or compromise of our networks, payment card terminals or other payment systems.
The techniques used by criminals to obtain unauthorized access to sensitive data change frequently and often cannot be recognized until launched against a target; accordingly, we may not be able to anticipate these frequently changing techniques or implement adequate preventive measures for all of them. Any unauthorized access into our customers’ sensitive information, or data belonging to us or our suppliers, even if we are compliant with industry security standards, could put us at a competitive disadvantage, result in deterioration of our customers’ confidence in us and subject us to potential litigation, liability, fines and penalties and consent decrees, resulting in a possible material adverse impact on our financial condition and results of operations.
As a merchant that accepts debit and credit cards for payment, we are subject to the Payment Card Industry (“PCI”) Data Security Standard (“PCI DSS”), issued by the PCI Council. PCI DSS contains compliance guidelines and standards with regard to our security surrounding the physical administrative and technical storage, processing and transmission of individual cardholder data. By accepting debit cards for payment, we are also subject to compliance with American National Standards Institute (“ANSI”) data encryption standards and payment network security operating guidelines. Failure to be PCI compliant or to meet other payment card standards may result in the imposition of financial penalties or the allocation by the card brands of the costs of fraudulent charges to us. As well, the Fair and Accurate Credit Transactions Act (“FACTA”) requires systems that print payment card receipts to employ personal account number truncation so that the consumer’s full account number is not viewable on the slip. Despite our efforts to comply with these or other payment card standards and other information security measures, we cannot be certain that all of our IT systems will be able to prevent, contain or detect all cyber-attacks or intrusions from known malware or malware that may be developed in the future. To the extent that any disruption results in the loss, damage or misappropriation of information, we may be adversely affected by claims from customers, financial institutions, regulatory authorities, payment card associations and others. In addition, privacy and information security laws and standards continue to evolve and could expose us to further regulatory burdens. The cost of complying with stricter laws and standards, including PCI DSS, ANSI and FACTA data encryption standards and the California Consumer Privacy Act which took effect in January 2020, could be significant.
The loss of confidence from a data security breach involving our customers or employees could hurt our reputation and cause customer retention and employee recruiting challenges.
We receive and store personal information in connection with our marketing and human resources organizations. The protection of our customer and employee data is critically important to us. Despite our considerable efforts to secure our computer networks, security could be compromised, confidential information could be misappropriated or system disruptions could occur, as has occurred with a number of other retailers. If we experience a data security breach, we could be exposed to government enforcement actions, possible assessments from the card brands if credit card data was involved and potential litigation. In addition, our customers could lose confidence in our ability to protect their personal information, which could cause them to stop shopping at our stores altogether.
Unauthorized computer intrusions could adversely affect our brands and could discourage customers from shopping with us.
In 2014, we were the subject of an unauthorized intrusion affecting 800 of our stores in an attempt to obtain credit card data. While the claims arising out of this intrusion have been substantially resolved, there can be no assurance that we will not suffer a similar criminal attack in the future or that unauthorized parties will not gain access to personal information of our customers. While we have implemented additional security software and hardware designed to provide additional protections against unauthorized intrusions, there can be no assurance that unauthorized individuals will not discover a means to circumvent our security. Hackers and data thieves are
37
increasingly sophisticated and operate large-scale and complex attacks. Experienced computer programmers and hackers may be able to penetrate our security controls and misappropriate or compromise sensitive personal, proprietary or confidential information, create system disruptions or cause shutdowns. They also may be able to develop and deploy malicious software programs that attack our systems or otherwise exploit any security vulnerabilities. Computer intrusions could adversely affect our brands, have caused us to incur legal and other fees, may cause us to incur additional expenses for additional security measures and could discourage customers from shopping in our stores.
We use a combination of insurance and self-insurance to address potential liabilities for workers’ compensation, automobile and general liability, property risk (including earthquake and flood coverage), director and officers’ liability, employment practices liability, pharmacy liability and employee health care benefits.
We use a combination of insurance and self-insurance to address potential liabilities for workers’ compensation, automobile and general liability, property risk (including earthquake and flood coverage), director and officers’ liability, employment practices liability, pharmacy liability and employee health care benefits and cyber and terrorism risks. We estimate the liabilities associated with the risks retained by us, in part, by considering historical claims experience, demographic and severity factors and other actuarial assumptions which, by their nature, are subject to a high degree of variability. Among the causes of this variability are unpredictable external factors affecting future inflation rates, discount rates, litigation trends, legal interpretations, benefit level changes and claim settlement patterns.
The majority of our workers’ compensation liability is from claims occurring in California, where workers’ compensation has received intense scrutiny from the state’s politicians, insurers, employers and providers, as well as the public in general.
Our long-lived assets, primarily goodwill and store-level assets, are subject to periodic testing for impairment, and we may incur significant impairment charges as a result.
Our long-lived assets, primarily goodwill and store-level assets, are subject to periodic testing for impairment. We have incurred significant impairment charges to earnings in the past. Long-lived asset impairment charges were $77.4 million, $36.3 million and $100.9 million in fiscal 2019, fiscal 2018 and fiscal 2017, respectively. Failure to achieve sufficient levels of cash flow at reporting units and at store-level could result in impairment charges on long-lived assets. We also review goodwill for impairment annually on the first day of the fiscal fourth quarter or if events or changes in circumstances indicate the occurrence of a triggering event. During fiscal 2017, we recorded a goodwill impairment loss of $142.3 million. The annual evaluation of goodwill performed for our reporting units during the fourth quarters of fiscal 2019 and fiscal 2018 did not result in impairment.
Our operations are dependent upon the availability of a significant amount of energy and fuel to manufacture, store, transport and sell products.
Our operations are dependent upon the availability of a significant amount of energy and fuel to manufacture, store, transport and sell products. Energy and fuel costs are influenced by international, political and economic circumstances and have experienced volatility over time. To reduce the impact of volatile energy costs, we have entered into contracts to purchase electricity and natural gas at fixed prices to satisfy a portion of our energy needs. We also manage our exposure to changes in energy prices utilized in the shipping process through the use of short-term diesel fuel derivative contracts. Volatility in fuel and energy costs that exceeds offsetting contractual arrangements could adversely affect our results of operations.
We may have liability under certain operating leases that were assigned to third parties.
We may have liability under certain operating leases that were assigned to third parties. If any of these third parties fail to perform their obligations under the leases, including as a result of the economic dislocation caused
38
by the response to the coronavirus
(COVID-19),
we could be responsible for the lease obligation. Due to the wide dispersion among third parties and the variety of remedies available, we believe that if an assignee became insolvent it would not have a material effect on our financial condition, results of operations or cash flows.We may be unable to attract and retain key personnel, which could adversely impact our ability to successfully execute our business strategy.
The continued successful implementation of our business strategy depends in large part upon the ability and experience of members of our senior management. In addition, our performance is dependent on our ability to identify, hire, train, motivate and retain qualified management, technical, sales and marketing and retail personnel. If we lose the services of members of our senior management or are unable to continue to attract and retain the necessary personnel, we may not be able to successfully execute our business strategy, which could have an adverse effect on our business.
Risks Related to our Indebtedness
Our substantial level of indebtedness could adversely affect our financial condition and prevent us from fulfilling our obligations under our indebtedness.
We have a significant amount of indebtedness. As of February 29, 2020, we had approximately $8.2 billion of debt outstanding (other than finance lease obligations), and, subject to our borrowing base, we would have been able to borrow an additional $3.4 billion under our ABL Facility. As of February 29, 2020, we and our subsidiaries had approximately $667 million of finance lease obligations.
Our substantial indebtedness could have important consequences. For example, it could:
| • | increase our vulnerability to general adverse economic and industry conditions; |
| • | require us to dedicate a substantial portion of our cash flow from operations to payments on our indebtedness, thereby reducing the availability of our cash flow to fund working capital, capital expenditures and other general corporate purposes, including acquisitions; |
| • | limit our flexibility in planning for, or reacting to, changes in our business and the industry in which we operate; |
| • | place us at a competitive disadvantage compared to our competitors that have less debt; and |
| • | limit our ability to borrow additional funds. |
In addition, there can be no assurance that we will be able to refinance any of our debt or that we will be able to refinance our debt on commercially reasonable terms. If we were unable to make payments or refinance our debt or obtain new financing under these circumstances, we would have to consider other options, such as:
| • | sales of assets; |
| • | sales of equity; or |
| • | negotiations with our lenders to restructure the applicable debt. |
Our debt instruments may restrict, or market or business conditions may limit, our ability to obtain additional indebtedness, refinance our indebtedness or use some of our options.
Despite our significant indebtedness levels, we may still be able to incur substantially more debt, which could further exacerbate the risks associated with our substantial leverage.
We and our subsidiaries may be able to incur substantial additional indebtedness in the future. The terms of the credit agreement that governs the ABL Facility and the indentures that govern the NALP Notes (as defined
39
herein), the Safeway Notes (as defined herein) and the ACI Notes, permit us to incur significant additional indebtedness, subject to certain limitations. If new indebtedness is added to our and our subsidiaries’ current debt levels, the related risks that we and they now face would intensify. See “Description of Indebtedness.”
To service our indebtedness, we require a significant amount of cash, and our ability to generate cash depends on many factors beyond our control.
Our ability to make cash payments on and to refinance the indebtedness and to fund planned capital expenditures will depend on our ability to generate significant operating cash flow in the future, as described in the section entitled “Management’s Discussion and Analysis of Financial Condition and Results of Operations” included elsewhere in this prospectus. This ability is, to a significant extent, subject to general economic, financial, competitive, legislative, regulatory and other factors that are beyond our control.
Our business may not generate sufficient cash flow from operations to enable us to pay our indebtedness or to fund our other liquidity needs. In any such circumstance, we may need to refinance all or a portion of our indebtedness, on or before maturity. We may not be able to refinance any indebtedness on commercially reasonable terms, or at all. If we cannot service our indebtedness, we may have to take actions such as selling assets, seeking additional equity or reducing or delaying capital expenditures, strategic acquisitions and investments. Any such action, if necessary, may not be effected on commercially reasonable terms or at all. The instruments governing our indebtedness may restrict our ability to sell assets and our use of the proceeds from such sales.
If we are unable to generate sufficient cash flow or are otherwise unable to obtain funds necessary to meet required payments of principal, premium, if any, and interest on our indebtedness, or if we otherwise fail to comply with the various covenants in the instruments governing our indebtedness, we could be in default under the terms of the agreements governing such indebtedness. In the event of such default, the holders of such indebtedness could elect to declare all the funds borrowed thereunder to be due and payable, together with accrued and unpaid interest, the lenders under our credit agreement, or any replacement revolving credit facility in respect thereof, could elect to terminate their revolving commitments thereunder, cease making further loans and institute foreclosure proceedings against our assets, and we could be forced into bankruptcy or liquidation.
In addition, in July 2017, the U.K. Financial Conduct Authority, which regulates the London Interbank Offered Rate (“LIBOR”), announced that it intends to stop compelling banks to submit rates for the calculation of LIBOR after 2021. It is unclear if LIBOR will cease to exist or if new methods of calculating LIBOR will evolve and what, if any, effect these changes, other reforms or the establishment of alternative reference rates may have on instruments that calculate interest rates based on LIBOR including our ABL Facility. Additionally, changes in the method pursuant to which the LIBOR rates are determined may result in a sudden or prolonged increase or decrease in the reported LIBOR rates. While we do not expect that the transition from LIBOR and risks related thereto will have a material adverse effect on our financing costs, it is still uncertain at this time. For more information, see “Management’s Discussion and Analysis of Financial Condition and Results of Operations—Quantitative and Qualitative Disclosures About Market Risk.”
Our debt instruments limit our flexibility in operating our business.
Our debt instruments contain various covenants that limit our and our restricted subsidiaries’ ability to engage in specified types of transactions. A breach of any of these covenants could result in a default under our debt instruments. Any debt agreements we enter into in the future may further limit our ability to enter into certain types of transactions. In addition, certain of the covenants governing the ABL Facility and the ACI Notes restrict, among other things, our and our restricted subsidiaries’ ability to:
| • | incur additional indebtedness or provide guarantees in respect of obligations of other persons; |
| • | pay dividends on, repurchase or make distributions to our owners or make other restricted payments or make certain investments; |
40
| • | prepay, redeem or repurchase debt; |
| • | make loans, investments and capital expenditures; |
| • | sell or otherwise dispose of certain assets; |
| • | incur liens; |
| • | engage in sale leaseback transactions; |
| • | restrict dividends, loans or asset transfers from our subsidiaries; |
| • | consolidate, merge, sell or otherwise dispose of all or substantially all of our assets; |
| • | enter into a new or different line of business; and |
| • | enter into certain transactions with our affiliates. |
In addition, the restrictive covenants in our ABL Facility require us, in certain circumstances, to maintain a specific fixed charge coverage ratio. Our ability to meet that financial ratio can be affected by events beyond our control, and there can be no assurance that we will meet it. A breach of this covenant could result in a default under such facilities. Moreover, the occurrence of a default under our ABL Facility could result in an event of default under our other indebtedness. Upon the occurrence of an event of default under our ABL Facility, the lenders could elect to declare all amounts outstanding under the ABL Facility to be immediately due and payable and terminate all commitments to extend further credit. Even if we are able to obtain new financing, it may not be on commercially reasonable terms, or terms that are acceptable to us.
We may not have the ability to raise the funds necessary to finance the change of control offer required by the indentures governing the 2020 Safeway Notes (as defined herein), the 2021 Safeway Notes (as defined herein) and the ACI Notes (the 2020 Safeway Notes, the 2021 Safeway Notes and the ACI Notes, collectively the “CoC Notes”).
Upon the occurrence of certain kinds of change of control events, we will be required to offer to repurchase outstanding CoC Notes at 101% of the principal amount thereof plus accrued and unpaid interest to the date of repurchase. However, it is possible that we will not have sufficient funds at the time of the change of control to make the required repurchase of the CoC Notes or that restrictions in our debt instruments will not allow such repurchases. Our failure to purchase the tendered notes would constitute an event of default under the indentures governing the CoC Notes which, in turn, would constitute a default under our ABL Facility. In addition, the occurrence of a change of control would also constitute a default under our ABL Facility. A default under our ABL Facility would result in a default under our indentures if the lenders accelerate the debt under our ABL Facility.
Moreover, our debt instruments restrict, and any future indebtedness we incur may restrict, our ability to repurchase the notes, including following a change of control event. As a result, following a change of control event, we may not be able to repurchase the CoC Notes unless we first repay all indebtedness outstanding that contains similar provisions, or obtain a waiver from the holders of such indebtedness to permit us to repurchase the CoC Notes. We may be unable to repay all of that indebtedness or obtain a waiver of that type. Any requirement to offer to repurchase the outstanding CoC Notes may therefore require us to refinance our other outstanding debt, which we may not be able to do on commercially reasonable terms, if at all. These repurchase requirements may also delay or make it more difficult for others to obtain control of us.
Currently, substantially all of our assets (other than real property) are pledged as collateral under our ABL Facility.
As of February 29, 2020, there were no outstanding borrowings under our ABL Facility (excluding $454.5 million of outstanding letters of credit). On March 12, 2020, we provided notice to the lenders of the ABL
41
Borrowing, so that a total of $2.0 billion (excluding $454.5 million in letters of credit) was outstanding immediately following the borrowing. We increased our borrowings under the ABL Facility as a precautionary measure in order to increase our cash position and preserve financial flexibility in light of current uncertainty in the global markets resulting from the coronavirus
(COVID-19)
pandemic. In accordance with the terms of the ABL Facility, the proceeds from the ABL Borrowing may in the future be used for working capital, general corporate or other purposes permitted by the ABL Facility, but there is no guarantee how or when we will use the proceeds.
Increases in interest rates and/or a downgrade of our credit ratings could negatively affect our financing costs and our ability to access capital.
We have exposure to future interest rates based on the variable rate debt under our credit facilities and to the extent we raise additional debt in the capital markets to meet maturing debt obligations, to fund our capital expenditures and working capital needs and to finance future acquisitions. Daily working capital requirements are typically financed with operational cash flow and through the use of our ABL Facility. The interest rate on these borrowing arrangements is generally determined from the inter-bank offering rate at the borrowing date plus a
pre-set
margin. Although we employ risk management techniques to hedge against interest rate volatility, significant and sustained increases in market interest rates could materially increase our financing costs and negatively impact our reported results.We rely on access to bank and capital markets as sources of liquidity for cash requirements not satisfied by cash flows from operations. A downgrade in our credit ratings from the internationally recognized credit rating agencies could negatively affect our ability to access the bank and capital markets, especially in a time of uncertainty in either of those markets. A rating downgrade could also impact our ability to grow our business by substantially increasing the cost of, or limiting access to, capital.
Risks Related to This Offering and Owning Our Common Stock
There is no existing market for our common stock, and we do not know if one will develop to provide you with adequate liquidity. If the stock price fluctuates after this offering, you could lose a significant part of your investment.
Prior to this offering, there has not been a public market for our common stock. We cannot predict the extent to which investor interest in our company will lead to the development of an active trading market on the NYSE or otherwise or how liquid that market might become. If an active trading market does not develop, you may have difficulty selling shares of our common stock that you buy. The initial public offering price for the shares will be determined by negotiations between us, the selling stockholders and the underwriters and may not be indicative of prices that will prevail in the open market following this offering. The market price of our common stock may be influenced by many factors, some of which are beyond our control, including:
| • | the failure of securities analysts to cover our common stock after this offering, or changes in financial estimates by analysts; |
| • | changes in, or investors’ perception of, the food and drug retail industry; |
| • | the activities of competitors; |
| • | future issuances and sales of our common stock, including in connection with acquisitions; |
| • | our quarterly or annual earnings or those of other companies in our industry; |
| • | the public’s reaction to our press releases, our other public announcements and our filings with the SEC; |
| • | regulatory or legal developments in the United States; |
42
| • | litigation involving us, our industry, or both; |
| • | general economic conditions; and |
| • | other factors described elsewhere in these “Risk Factors.” |
As a result of these factors, you may not be able to resell your shares of our common stock at or above the initial offering price. In addition, the stock market often experiences extreme price and volume fluctuations that have often been unrelated or disproportionate to the operating performance of a particular company. These broad market fluctuations and industry factors may materially reduce the market price of our common stock, regardless of our operating performance.
If a substantial number of shares becomes available for sale and are sold in a short period of time, the market price of our common stock could decline.
If our
Pre-IPO
Stockholders sell substantial amounts of our common stock in the public market following this offering, the market price of our common stock could decrease. The perception in the public market that ourPre-IPO
Stockholders might sell shares of common stock could also create a perceived overhang and depress our market price. Upon completion of this offering, we will have shares of common stock outstanding of which shares will be held by ourPre-IPO
Stockholders (assuming that the underwriters do not exercise their option to purchase additional shares from the selling stockholders). Prior to this offering, we, our executive officers and directors and each otherPre-IPO
Stockholder (other than certain Pre-IPO Stockholders that each own less than an aggregate of shares of common stock) will have agreed with the underwriters to a“lock-up”
period, meaning that such parties may not, subject to certain exceptions, sell any of their existing shares of our common stock without the prior written consent of representatives of the underwriters for at least days after the date of this prospectus. Thereafter, suchPre-IPO
Stockholders will be permitted to sell shares of common stock subject to certain restrictions, including the restrictions described in “Certain Relationships and Related PartyTransactions—Lock-Up
Agreements.” Pursuant to these agreements, among other exceptions, we may enter into an agreement providing for the issuance of our common stock in connection with the acquisition, merger or joint venture with another publicly traded entity during the180-day
restricted period after the date of this prospectus. In addition, all of ourPre-IPO
Stockholders and independent directors will be subject to the holding period requirement of Rule 144 (“Rule 144”) under the Securities Act, as described in “Shares Eligible for Future Sale.” When thelock-up
agreements expire, these shares will become eligible for sale, in some cases subject to the requirements of Rule 144. The market price for shares of our common stock may drop when the restrictions on resale by ourPre-IPO
Stockholders and independent directors lapse.Further, if the concurrent offering of Series A preferred stock is completed, up to shares of common stock (up to shares if the underwriters in the Series A preferred stock offering exercise their over-allotment option in full), in each case subject to anti-dilution, make-whole and other adjustments, will be issuable upon conversion of the shares of Series A preferred stock. We may also choose to pay dividends on the Series A preferred stock in the form of shares of our common stock, which would be based on the volume weighted average price per share of our common stock over a certain period, subject to certain limitations set forth in the certificate of designations relating to the Series A preferred stock. See “Concurrent Offering of Series A Preferred Stock.”
In addition, our Sponsors will have substantial demand and incidental registration rights, as described in “Certain Relationships and Related Party Transactions—Registration Rights Agreement.” We also intend to file one or more registration statements on Form
S-8
under the Securities Act to register shares of our common stock or securities convertible into or exchangeable for shares of our common stock issued pursuant to our equity plans. Any such FormS-8
registration statements will automatically become effective upon filing. Accordingly, shares registered under such registration statements will be available for sale in the open market. A decline in the market price of our common stock might impede our ability to raise capital through the issuance of additional shares of our common stock or other equity securities.43
We are controlled by our Sponsors and they may have conflicts of interest with other stockholders in the future.
After the completion of this offering, and assuming an offering of shares by the selling stockholders before giving effect to the Repurchase, our Sponsors will control in the aggregate approximately % of our common stock (or % if the underwriters exercise in full their option to purchase additional shares). Assuming shares (based upon the midpoint of the estimated offering range set forth on the cover page of this prospectus) of outstanding common stock are repurchased by us using the net proceeds from the offering of Series A preferred stock (or shares of common stock if the underwriters in the Series A preferred stock offering exercise their over-allotment option in full), our Sponsors will control in the aggregate approximately % of our common stock (or % if the underwriters in the Series A preferred stock offering exercise their over-allotment option in full). As a result, our Sponsors will continue to be able to control the election of our directors, determine our corporate and management policies and determine, without the consent of our other stockholders, the outcome of any corporate transaction or other matter submitted to our stockholders for approval, including potential mergers or acquisitions, asset sales and other significant corporate transactions. Four of our 12 directors are either employees of, or advisors to, members of our Sponsors, as described under “Management.” Our Sponsors will also have sufficient voting power to amend our organizational documents. The interests of our Sponsors may not coincide with the interests of other holders of our common stock. Additionally, our Sponsors are in the business of making investments in companies and may, from time to time, acquire and hold interests in businesses that compete directly or indirectly with us. Our Sponsors may also pursue, for their own account, acquisition opportunities that may be complementary to our business, and as a result, those acquisition opportunities may not be available to us. So long as our Sponsors continue to own a significant amount of the outstanding shares of our common stock, our Sponsors will continue to be able to strongly influence or effectively control our decisions, including potential mergers or acquisitions, asset sales and other significant corporate transactions.
We are a “controlled company” within the meaning of the NYSE rules and, as a result, will qualify for, and intend to rely on, exemptions from certain corporate governance requirements. You will not have the same protections afforded to stockholders of companies that are subject to such requirements.
Upon completion of this offering, our Sponsors, as a group, will control a majority of our outstanding common stock. As a result, we are a “controlled company” within the meaning of the NYSE rules. Under the NYSE rules, a company of which more than 50% of the voting power is held by an individual, group or another company is a “controlled company” and may elect not to comply with certain corporate governance requirements, including:
| • | the requirement that a majority of the board of directors consist of independent directors; |
| • | the requirement that we have a nominating and corporate governance committee that is composed entirely of independent directors with a written charter addressing the committee’s purpose and responsibilities; |
| • | the requirement that we have a compensation committee that is composed entirely of independent directors with a written charter addressing the committee’s purpose and responsibilities; and |
| • | the requirement for an annual performance evaluation of the nominating and corporate governance and compensation committees. |
Following this offering, we intend to utilize these exemptions. As a result, we will not have a majority of independent directors nor will our nominating and corporate governance and compensation committees consist entirely of independent directors. Accordingly, you will not have the same protections afforded to stockholders of companies that are subject to all of the NYSE corporate governance requirements.
44
Provisions in our charter documents, certain agreements governing our indebtedness, the Stockholders’ Agreement and Delaware law could make an acquisition of the Company more difficult and may prevent attempts by our stockholders to replace or remove our current management, even if beneficial to our stockholders.
Provisions in our amended and restated certificate of incorporation (“certificate of incorporation”) and our amended and restated bylaws (“bylaws”) may discourage, delay or prevent a merger, acquisition or other change in control that some stockholders may consider favorable, including transactions in which you might otherwise receive a premium for your shares of our common stock. These provisions could also limit the price that investors might be willing to pay in the future for shares of our common stock, possibly depressing the market price of our common stock.
In addition, these provisions may frustrate or prevent any attempts by our stockholders to replace members of our board of directors. Because our board of directors is responsible for appointing the members of our management team, these provisions could in turn affect any attempt by our stockholders to replace members of our management team. Examples of such provisions are as follows:
| • | from and after such date that our Sponsors and their respective Affiliates (as defined in Rule 12b-2 of the Exchange Act), or any person who is an express assignee or designee of their respective rights under our certificate of incorporation (and such assignee’s or designee’s Affiliates) ceases to own, in the aggregate, at least 50% of the then-outstanding shares of our common stock (the “50% Trigger Date”), the authorized number of our directors may be increased or decreased only by the affirmative vote oftwo-thirds of the then-outstanding shares of our common stock or by resolution of our board of directors; |
| • | prior to the 50% Trigger Date, only our board of directors and the Sponsors are expressly authorized to make, alter or repeal our bylaws and, from and after the 50% Trigger Date, our stockholders may only amend our bylaws with the approval of at least two-thirds of all of the outstanding shares of our capital stock entitled to vote; |
| • | from and after the 50% Trigger Date, the manner in which stockholders can remove directors from the board will be limited; |
| • | from and after the 50% Trigger Date, stockholder actions must be effected at a duly called stockholder meeting and actions by our stockholders by written consent will be prohibited; |
| • | from and after such date that our Sponsors and their respective Affiliates (or any person who is an express assignee or designee of our Sponsors’ respective rights under our certificate of incorporation (and such assignee’s or designee’s Affiliates)) ceases to own, in the aggregate, at least 35% of the then-outstanding shares of our common stock (the “35% Trigger Date”), advance notice requirements for stockholder proposals that can be acted on at stockholder meetings and nominations to our board of directors will be established; |
| • | limits on who may call stockholder meetings; |
| • | requirements on any stockholder (or group of stockholders acting in concert), other than, prior to the 35% Trigger Date, the Sponsors, who seeks to transact business at a meeting or nominate directors for election to submit a list of derivative interests in any of our company’s securities, including any short interests and synthetic equity interests held by such proposing stockholder; |
| • | requirements on any stockholder (or group of stockholders acting in concert) who seeks to nominate directors for election to submit a list of “related party transactions” with the proposed nominee(s) (as if such nominating person were a registrant pursuant to Item 404 of Regulation S-K, and the proposed nominee was an executive officer or director of the “registrant”); and |
| • | our board of directors is authorized to issue preferred stock without stockholder approval, which could be used to institute a “poison pill” that would work to dilute the stock ownership of a potential hostile acquiror, effectively preventing acquisitions that have not been approved by our board of directors. |
45
Our certificate of incorporation authorizes our board of directors to issue up to 100,000,000 shares of preferred stock. The preferred stock may be issued in one or more series, the terms of which may be determined by our board of directors at the time of issuance or fixed by resolution without further action by the stockholders. These terms may include voting rights, preferences as to dividends and liquidation, conversion rights, redemption rights, and sinking fund provisions. The issuance of preferred stock could diminish the rights of holders of our common stock, and therefore could reduce the value of our common stock. In addition, specific rights granted to holders of preferred stock could be used to restrict our ability to merge with, or sell assets to, a third party. The ability of our board of directors to issue preferred stock could delay, discourage, prevent, or make it more difficult or costly to acquire or effect a change in control, thereby preserving the current stockholders’ control.
Certain rights of the holders of the Series A preferred stock, if issued, could delay or prevent an otherwise beneficial takeover or takeover attempt of the Company.
Certain rights of the holders of the Series A preferred stock could make it more difficult or more expensive for a third party to acquire us. For example, if a fundamental change were to occur on or prior to , 20 , holders of the Series A preferred stock, if issued, may have the right to convert their Series A preferred stock, in whole or in part, at an increased conversion rate and will also be entitled to receive a make-whole amount equal to the present value of all remaining dividend payments on their Series A preferred stock as described in the certificate of designations governing the Series A preferred stock. These features of the Series A preferred stock could increase the cost of acquiring us or otherwise discourage a third party from acquiring us or removing incumbent management.
Our certificate of incorporation designates the Court of Chancery of the State of Delaware as the sole and exclusive forum for certain types of actions and proceedings that may be initiated by our stockholders, which could limit our stockholders’ ability to obtain a favorable judicial forum for disputes with us or our directors, officers or other employees.
Our certificate of incorporation provides that, unless we consent in writing to the selection of an alternative forum, the Court of Chancery of the State of Delaware will, to the fullest extent permitted by law, be the exclusive forum for: (a) any derivative action or proceeding brought on our behalf; (b) any action asserting a claim for breach of a fiduciary duty owed by any of our directors, officers, employees or agents to us or our stockholders; (c) any action asserting a claim arising pursuant to any provision of the Delaware General Corporation Law (the “DGCL”), our certificate of incorporation or our bylaws; or (d) any action asserting a claim governed by the internal affairs doctrine. Any person or entity purchasing or otherwise acquiring any interest in shares of our capital stock is deemed to have received notice of and consented to the foregoing provisions. This choice of forum provision may limit a stockholder’s ability to bring a claim in a judicial forum that it finds more favorable for disputes with us or our directors, officers or other employees, which may discourage such lawsuits against us and our directors, officers and employees. Alternatively, if a court were to find this choice of forum provision inapplicable to, or unenforceable in respect of, one or more of the specified types of actions or proceedings, we may incur additional costs associated with resolving such matters in other jurisdictions, which could adversely affect our business, financial condition or results of operations. Because the applicability of the exclusive forum provision is limited to the extent permitted by law, we do not intend that the exclusive forum provision would apply to suits brought to enforce any duty or liability created by the Exchange Act or any other claim for which the federal courts have exclusive jurisdiction. Additionally, unless we consent in writing to the selection of an alternative forum, the federal district courts of the United States of America shall be the exclusive forum for the resolution of any action asserting a cause of action arising under the Securities Act. Investors cannot waive compliance with the federal securities laws and the rules and regulations thereunder. Although we believe this provision benefits us by providing increased consistency in the application of Delaware law in the types of lawsuits to which it applies, the provision may have the effect of discouraging lawsuits against our directors and officers.
46
If equity research analysts do not publish research or reports about our business or if they issue unfavorable commentary or downgrade our common stock, the market price of our common stock could decline.
The trading market for our common stock likely will be influenced by the research and reports that equity and debt research analysts publish about the industry, us and our business. The market price of our common stock could decline if one or more securities analysts downgrade our shares or if those analysts issue a sell recommendation or other unfavorable commentary or cease publishing reports about us or our business. If one or more of the analysts who elect to cover us downgrade our shares, the market price of our common stock would likely decline.
Our ability to pay dividends to our stockholders is restricted by applicable laws and regulations and requirements under certain of our securities and debt agreements, including the ABL Facility and ACI Notes.
Holders of our common stock are only entitled to receive such cash dividends as our board, in its sole discretion, may declare out of funds legally available for such payments. Effective fiscal 2020, we have established a dividend policy pursuant to which we intend to pay a dividend on our common stock in an amount of $ per share, starting with the first full quarter following completion of this offering. Our board of directors may change or eliminate the payment of future dividends to our common stockholders at its discretion, without notice to our stockholders. Any future determination relating to our dividend policy will be dependent on a variety of factors, including our financial condition, earnings, legal requirements, our general liquidity needs, and other factors that our board deems relevant. Our ability to declare and pay dividends to our stockholders is subject to certain laws, regulations, and policies, including minimum capital requirements and, as a Delaware corporation, we are subject to certain restrictions on dividends under the DGCL. Under the DGCL, our board of directors may not authorize payment of a dividend unless it is either paid out of our surplus, as calculated in accordance with the DGCL, or if we do not have a surplus, it is paid out of our net profits for the fiscal year in which the dividend is declared and/or the preceding fiscal year. In addition, so long as any shares of our Series A preferred stock remain outstanding, no dividend or distribution may be declared or paid on our common stock unless all accrued and unpaid dividends have been paid on our Series A preferred stock, subject to exceptions, such as dividends on our common stock payable solely in shares of our common stock. Finally, our ability to pay dividends to our stockholders may be limited by covenants in any financing arrangements that we are currently a party, including the ABL Facility and ACI Notes, to or may enter into in the future. As a consequence of these various limitations and restrictions, we may not be able to make, or may have to reduce or eliminate at any time, the payment of dividends on our common stock. See “Description of Indebtedness.” Any change in the level of our dividends or the suspension of the payment thereof could have a material adverse effect on the market price of our common stock. See “Dividend Policy.”
You may be diluted by the future issuance of additional common stock in connection with our equity incentive plans, acquisitions or otherwise.
After this offering, we will have shares of common stock authorized but unissued under our certificate of incorporation. We will be authorized to issue these shares of common stock and options, rights, warrants and appreciation rights relating to common stock for consideration and on terms and conditions established by our board of directors in its sole discretion, whether in connection with acquisitions or otherwise. We have reserved up to % of the shares of our common stock that will be available as of the consummation of this offering for issuance under existing restricted stock unit awards and for future awards that may be issued under our Phantom Unit Plan (as defined herein). See “Executive Compensation—Incentive Plans” and “Shares Eligible for Future
Sale—S-8
Registration Statement.” Any common stock that we issue, including under our Phantom Unit Plan or other equity incentive plans that we may adopt in the future, would dilute the percentage ownership held by the investors who purchase common stock in this offering.In the future, we may also issue our securities, including shares of our common stock, in connection with investments or acquisitions. We regularly evaluate potential acquisition opportunities, including ones that would
47
be significant to us. The amount of shares of our common stock issued in connection with an investment or acquisition could constitute a material portion of our then-outstanding shares of common stock. Any issuance of additional securities in connection with investments or acquisitions may result in additional dilution to you.
The Series A preferred stock may adversely affect the market price of our common stock.
The market price of our common stock is likely to be influenced by the Series A preferred stock. For example, the market price of our common stock could become more volatile and could be depressed by:
| • | investors’ anticipation of the potential resale in the market of a substantial number of additional shares of our common stock received upon conversion of the Series A preferred stock; |
| • | possible sales of our common stock by investors who view the Series A preferred stock as a more attractive means of equity participation in us than owning shares of our common stock; and |
| • | hedging or arbitrage trading activity that may develop involving the Series A preferred stock and our common stock. |
Our common stock will rank junior to the Series A preferred stock, if issued, with respect to the payment of dividends and amounts payable in the event of our liquidation, dissolution or
winding-up
of our affairs.Our common stock will rank junior to the Series A preferred stock, if issued, with respect to the payment of dividends and amounts payable in the event of our liquidation, dissolution or
winding-up
of our affairs. This means that, unless accumulated and unpaid dividends have been declared and paid, or set aside for payment, on all outstanding shares of the Series A preferred stock, if issued, for all preceding dividend periods, no dividends may be declared or paid on our common stock and we will not be permitted to purchase, redeem or otherwise acquire any of our common stock, subject to limited exceptions. Likewise, in the event of our voluntary or involuntary liquidation, dissolution orwinding-up
of our affairs, no distribution of our assets may be made to holders of our common stock until we have paid to holders of the Series A preferred stock, if issued, a liquidation preference equal to $ per share plus accumulated and unpaid dividends.Holders of the Series A preferred stock, if issued, will have the right to elect two directors in the case of certain dividend arrearages.
Whenever dividends on any shares of the Series A preferred stock have not been declared and paid for the equivalent of six or more dividend periods, whether or not for consecutive dividend periods, the authorized number of directors on our board of directors will, at the next annual meeting of stockholders or at a special meeting of stockholders, if any, automatically be increased by two and the holders of such shares of the Series A preferred stock will be entitled, at our next annual meeting of stockholders or at a special meeting of stockholders, if any, to vote for the election of a total of two additional members of our board of directors, subject to certain terms and limitations. This right to elect directors will dilute the representation of the holders of our common stock on our board of directors and may adversely affect the market price of our common stock.
48
SPECIAL NOTE REGARDING FORWARD-LOOKING STATEMENTS
This prospectus contains forward-looking statements. All statements other than statements of historical facts contained in this prospectus, including statements regarding our future operating results and financial position, business strategy, and plans and objectives of management for future operations, are forward-looking statements. Words such as “believes,” “plans,” “anticipates,” “estimates,” “expects,” “intends,” “aims,” “potential,” “will,” “would,” “could,” “considered,” “likely,” “estimate” and the negatives or variations of these words and similar future or conditional expressions are intended to identify forward-looking statements but are not the exclusive means of identifying such statements.
Statements regarding cost synergies and revenue opportunities (and in each case, the components, amounts and/or percentages thereof) are forward-looking statements. While we believe these expectations, assumptions, estimates and projections are reasonable, such forward-looking statements are only predictions and involve known and unknown risks and uncertainties, many of which are beyond our control. By their nature, forward-looking statements involve risk and uncertainty because they relate to events and depend upon future circumstances that may or may not occur. These risks and uncertainties that could cause actual results to differ materially from those expressed or implied in the forward-looking statements include those related to the coronavirus
(COVID-19)
pandemic, about which there are still many unknowns, including the duration of the pandemic and the extent of its impact. These factors include, but are not limited to, risks and uncertainties discussed in the section of this prospectus entitled “Risk Factors” and the following factors:| • | Coronavirus ( COVID-19 ) related factors, risks and challenges, including among others, the length of time that the pandemic continues, the temporary inability of customers to shop due to illness, quarantine, or other travel restrictions or financial hardship, shifts in demand away from discretionary or higher priced products to lower priced products, or stockpiling or similar pantry-filling activities, reduced workforces which may be caused by, but not limited to, the temporary inability of the workforce to work due to illness, quarantine, or government mandates, potential shortages in supply, or temporary store closures due to reduced workforces or government mandates; |
| • | the competitive nature of the industry in which we conduct our business; |
| • | general business and economic conditions, including the rate of inflation or deflation, consumer spending levels, population, employment and job growth and/or losses in our market; |
| • | our ability to increase identical sales, expand our Own Brand |
| • | our ability to expand or grow our home delivery network and Drive Up & Go curbside pickup services; |
| • | pricing pressures and competitive factors, which could include pricing strategies, store openings, remodels or acquisitions by our competitors; |
| • | labor costs, including benefit plan costs and severance payments, or labor disputes that may arise from time to time and work stoppages that could occur in areas where certain collective bargaining agreements have expired or are on indefinite extensions or are scheduled to expire in the near future; |
| • | disruptions in our manufacturing facilities’ or distribution centers’ operations, disruption of significant supplier relationships, or disruptions to our produce or product supply chains; |
| • | results of any ongoing litigation in which we are involved or any litigation in which we may become involved; |
| • | data privacy and security, the failure of our IT systems, or maintaining, expanding or upgrading existing systems or implementing new systems; |
| • | the effects of government regulation and legislation, including healthcare reform; |
| • | our ability to raise additional capital to finance the growth of our business, including to fund acquisitions; |
49
| • | our ability to service our debt obligations, and restrictions in our debt agreements; |
| • | the impact of private and public third-party payers’ continued reduction in prescription drug reimbursements and the ongoing efforts to limit participation in payor networks, including through mail order; |
| • | plans for future growth and other business development activities; |
| • | our ability to realize anticipated savings from our implementation of new productivity initiatives, the failure of which could adversely affect our financial performance and competitive position; |
| • | changes in tax laws or interpretations that could increase our consolidated tax liabilities; and |
| • | competitive pressures in all markets in which we operate. |
We caution you that the foregoing list may not contain all of the forward-looking statements made in this prospectus.
Consequently, all of the forward-looking statements we make in this prospectus are qualified by the information contained in this prospectus, including, but not limited to, the information contained in this section and the information discussed in the section entitled “Risk Factors.” See the section “Where You Can Find More Information” in this prospectus.
Persons reading this prospectus are cautioned not to place undue reliance on these forward-looking statements, which speak only as of the date hereof and only to events as of the date on which the statements are made. We are not under any obligation, and we expressly disclaim any obligation, to update, alter, or otherwise revise any forward-looking statements, whether written or oral, that may be made from time to time, whether as a result of new information, future events, or otherwise, except as required by law. We may not actually achieve the plans, intentions or expectations disclosed in our forward-looking statements and you should not place undue reliance on our forward-looking statements. Our forward-looking statements do not reflect the potential impact of any future acquisitions, mergers, dispositions, joint ventures or investments we may make.
You should not rely upon forward-looking statements as predictions of future events. We have based the forward-looking statements contained in this prospectus primarily on our current expectations and projections about future events and trends that we believe may affect our business, financial condition, results of operations and prospects. The outcome of the events described in these forward-looking statements is subject to risks, uncertainties and other factors described in the section entitled “Risk Factors” and elsewhere in this prospectus. Moreover, we operate in a very competitive and rapidly changing environment. New risks and uncertainties emerge from time to time and it is not possible for us to predict all risks and uncertainties that could have an impact on the forward-looking statements contained in this prospectus. We cannot assure you that the results, events and circumstances reflected in the forward-looking statements will be achieved or occur, and actual results, events or circumstances could differ materially from those described in the forward-looking statements.
The forward-looking statements made in this prospectus relate only to events as of the date on which the statements are made. We undertake no obligation to update any forward-looking statements made in this prospectus to reflect events or circumstances after the date of this prospectus or to reflect new information or the occurrence of unanticipated events, except as required by law. We may not actually achieve the plans, intentions or expectations disclosed in our forward-looking statements and you should not place undue reliance on our forward-looking statements. Our forward-looking statements do not reflect the potential impact of any future acquisitions, mergers, dispositions, joint ventures or investments we may make.
50
USE OF PROCEEDS
The selling stockholders are selling all of the shares of common stock in this offering, and we will not receive any proceeds from the sale of the shares.
We estimate that the net proceeds to us from the offering of Series A preferred stock, based upon an assumed public offering price per share of our Series A preferred stock of $ , will be approximately $ (or approximately $ if the underwriters in the Series A preferred stock offering exercise their over-allotment option in full), after deducting underwriting discounts and commissions and estimated offering expenses payable by us.
We intend to use the anticipated net proceeds from the offering of Series A preferred stock, together with cash on hand, for the Repurchase. The Repurchase is conditioned upon the consummation of the offering of Series A preferred stock and the receipt of funds therefrom. The initial estimated net proceeds of $ , together with cash on hand, will be used to repurchase an aggregate of shares of outstanding common stock from two of our
Pre-IPO
Stockholders, Albertsons Investor and KIM ACI, at a price equal to the initial public offering price of the shares of common stock sold in this offering, after deducting underwriting discounts and commissions. If the underwriters in the Series A preferred offering exercise their over-allotment option in full, an additional $ in net proceeds will be available and such additional net proceeds, together with cash on hand, will be used to repurchase an additional aggregate of shares of outstanding common stock from our Sponsors, on apro-rata
basis relative to their respective holdings in the Company, at the same price.51
DIVIDEND POLICY
Effective fiscal 2020, we have established a dividend policy pursuant to which we intend to pay a dividend on our common stock in an amount of $ per share, starting with the first full quarter following completion of this offering. Our board of directors may change or eliminate the payment of future dividends to our common stockholders at its discretion, without notice to our stockholders. Any future determination relating to our dividend policy will be made at the sole discretion of our board of directors and will depend on a number of factors, including general and economic conditions, industry standards, our financial condition and operating results, our available cash and current and anticipated cash needs, restrictions under the documentation governing certain of our indebtedness, including our ABL Facility and ACI Notes, capital requirements, regulations, contractual, legal, tax and regulatory restrictions and implications on the payment of dividends by us to our stockholders or by our subsidiaries to us, and such other factors as our board of directors may deem relevant.
So long as any shares of our Series A preferred stock remain outstanding, no dividend or distribution may be declared or paid on our common stock unless all accrued and unpaid dividends have been paid on our Series A preferred stock, subject to exceptions such as dividends on our common stock payable solely in shares of our common stock.
The ability of our board of directors to declare a dividend is also subject to limits imposed by Delaware corporate law. Under Delaware law, our board of directors and the boards of directors of our corporate subsidiaries incorporated in Delaware may declare dividends only to the extent of our “surplus,” which is defined as total assets at fair market value minus total liabilities, minus statutory capital, or if there is no surplus, out of net profits for the fiscal year in which the dividend is declared and/or the preceding fiscal year. See “Risk Factors—Risks Related to This Offering and Owning Our Common Stock—Our ability to pay dividends to our stockholders is restricted by applicable laws and regulations and requirements under certain of our securities and debt agreements, including our ABL Facility and ACI Notes.”
52
CAPITALIZATION
The following table sets forth our cash and cash equivalents and capitalization as of February 29, 2020, on an actual basis and as adjusted to reflect (i) the ABL Borrowing, (ii) the issuance and sale by us of shares of our Series A preferred stock, which is contingent upon the closing of the offering of common stock, at an assumed public offering price of $ per share of Series A preferred stock (assuming no exercise by the underwriters of their over-allotment option in the Series A preferred stock offering) and (iii) the application of the net proceeds of the Series A preferred stock offering as described in “Use of Proceeds.” The as adjusted information below is illustrative only, and our capitalization following the closing of this offering will be adjusted based upon the public offering price for the offering of Series A preferred stock and other terms of the offering of Series A preferred stock determined at pricing and the use of proceeds therefrom. You should read this table together with “Selected Consolidated Financial and Other Data” and “Management’s Discussion and Analysis of Financial Condition and Results of Operations” and our consolidated financial statements and related notes included elsewhere in this prospectus.
As of February 29, 2020 | ||||||||
(dollars in millions) | Actual | As Adjusted | ||||||
Cash and cash equivalents(1) | $ | 471 | $ | |||||
Debt, including current maturities, net of debt discounts and deferred financing costs(2) | ||||||||
ABL Facility(3) | $ | — | $ | |||||
ACI Notes | 6,885 | |||||||
Safeway Notes(4) | 642 | |||||||
NALP Notes(5) | 466 | |||||||
Finance leases | 667 | |||||||
Other financing liabilities(6) | 37 | |||||||
Mortgage notes payable, secured | 18 | |||||||
Total Debt | $ | 8,715 | $ | |||||
Stockholders’ equity | ||||||||
Total preferred stock, $0.01 par value; 30,000,000 shares authorized, no shares issued and outstanding, actual; 100,000,000 shares authorized, shares issued and outstanding, as adjusted | $ | — | $ | |||||
Series A mandatory convertible preferred stock, $0.01 par value; no shares authorized, issued and outstanding, actual; shares authorized, shares issued and outstanding, as adjusted | — | |||||||
Undesignated preferred stock, $0.01 par value; 30,000,000 shares authorized, no shares issued and outstanding, actual; shares authorized, no shares issued and outstanding, as adjusted | — | |||||||
Common stock, $0.01 par value; 1,000,000,000 shares authorized, 279,597,312 shares issued and outstanding, actual; 1,000,000,000 shares authorized, shares issued and outstanding, as adjusted | 2.8 | |||||||
Total stockholders’ equity | $ | 2,278 | $ | |||||
Total capitalization | $ | 10,993 | $ | |||||
| (1) | On an as adjusted basis, gives effect to the proceeds received from the ABL Borrowing. See “Prospectus Summary—Coronavirus (COVID-19) Related Developments.” |
| (2) | Debt discounts and deferred financing costs totaled $41.3 million and $72.9 million, respectively, as of February 29, 2020, on an actual basis. |
| (3) | The ABL Facility provides for a $4.0 billion revolving credit facility. As of February 29, 2020, the aggregate borrowing base on the ABL Facility was approximately $3.9 billion, which was reduced by |
53
| $454.5 million of outstanding standby letters of credit, resulting in a net borrowing base availability of approximately $3.4 billion. As of February 29, 2020, on an as adjusted basis after giving effect to the ABL Borrowing, the aggregate borrowing base on the ABL Facility would be approximately $1.9 billion, which was reduced by $454.5 million of outstanding standby letters of credit, resulting in a net borrowing base availability of approximately $1.4 billion. See “Description of Indebtedness—ABL Facility.” |
| (4) | Consists of the 2020 Safeway Notes, 2021 Safeway Notes, 2027 Safeway Notes (as defined herein) and 2031 Safeway Notes (as defined herein). |
| (5) | Consists of the NALP Medium-Term Notes, 2026 NALP Notes, 2029 NALP Notes, 2030 NALP Notes and 2031 NALP Notes (each as defined herein). |
| (6) | Consists of other financing obligations and the ASC Notes (as defined herein). |
54
DILUTION
All shares of our common stock being sold in this offering were issued and outstanding prior to this offering. If you invest in our common stock in this offering, your ownership interest will be diluted to the extent of the difference between the initial public offering price per share of our common stock and the adjusted net tangible book value (deficit) per share of our common stock after this offering. Dilution results from the fact that the per share offering price of our common stock is substantially in excess of the tangible book value (deficit) per share attributable to the existing equity holders.
Our tangible book value (deficit) represents the amount of total tangible assets less total liabilities, and our tangible book value (deficit) per share represents tangible book value (deficit) divided by the number of shares of common stock outstanding. As of , 2020 our tangible book value (deficit) was approximately $ , or $ per share of our common stock.
After giving effect to (i) the sale by us of the shares of Series A preferred stock in the offering of Series A preferred stock, after deducting the underwriting discounts and commissions and estimated offering expenses payable by us and (ii) the application of the net proceeds from the offering of Series A preferred stock for the Repurchase as set forth under “Use of Proceeds,” our as adjusted net tangible book value (deficit) as of , 2020 would have been $ , or $ per share of our common stock. This amount represents an immediate increase in net tangible book value (or a decrease in net tangible book deficit) of $ per share to existing stockholders and an immediate and substantial dilution in net tangible book value (deficit) of $ per share to investors purchasing shares in this offering at the initial public offering price.
The following table illustrates this dilution on a per share basis:
Initial public offering price per share of common stock (the midpoint of the estimated offering range set forth on the cover page of this prospectus) | $ | |||
Net tangible book value (deficit) per share as of , 2020 | $ | |||
Increase in tangible book (deficit) value per share attributable to investors in this offering | $ | |||
As adjusted net tangible book value (deficit) per share after this offering | $ | |||
Dilution per share to investors in this offering | $ |
Dilution is determined by subtracting as adjusted net tangible book value (deficit) per share of common stock after this offering from the initial public offering price per share of common stock.
If the underwriters exercise in full their over-allotment option to purchase additional shares in the Series A preferred stock offering, the as adjusted net tangible book value (deficit) per share after giving effect to the Series A preferred stock offering and the use of proceeds therefrom would be $ per share. This represents an increase in as adjusted net tangible book value (or a decrease in as adjusted net tangible book deficit) of $ per share to existing stockholders and results in dilution in as adjusted net tangible book value (deficit) of $ per share to investors purchasing shares in this offering at the initial public offering price.
55
SELECTED CONSOLIDATED FINANCIAL AND OTHER DATA
The information below should be read along with “Management’s Discussion and Analysis of Financial Condition and Results of Operations,” “Business” and the historical financial statements and accompanying notes included elsewhere in this prospectus. Our historical results set forth below are not necessarily indicative of results to be expected for any future period.
The selected consolidated financial information set forth below is derived from our annual Consolidated Financial Statements for the periods indicated below, including the Consolidated Balance Sheets at February 29, 2020 and February 23, 2019 and the related Consolidated Statements of Operations and Comprehensive Income and Consolidated Statements of Cash Flows for the 53 weeks ended February 29, 2020 (fiscal 2019), and the 52 weeks ended February 23, 2019 (fiscal 2018) and February 24, 2018 (fiscal 2017) and notes thereto appearing elsewhere in this prospectus.
(dollars in millions, except per share data) | Fiscal 2019 | Fiscal 2018 | Fiscal 2017 | Fiscal 2016 | Fiscal 2015 | |||||||||||||||
Results of Operations | ||||||||||||||||||||
Net sales and other revenue | $ | 62,455.1 | $ | 60,534.5 | $ | 59,924.6 | $ | 59,678.2 | $ | 58,734.0 | ||||||||||
Gross Profit | 17,594.2 | 16,894.6 | 16,361.1 | 16,640.5 | 16,061.7 | |||||||||||||||
Selling and administrative expenses(1) | 16,641.9 | 16,272.3 | 16,208.7 | 16,072.1 | 15,599.3 | |||||||||||||||
(Gain) loss on property dispositions and impairment losses, net(1) | (484.8 | ) | (165.0 | ) | 66.7 | (39.2 | ) | 103.3 | ||||||||||||
Goodwill impairment | — | — | 142.3 | — | — | |||||||||||||||
Operating income (loss) | 1,437.1 | 787.3 | (56.6 | ) | 607.6 | 359.1 | ||||||||||||||
Interest expense, net | 698.0 | 830.8 | 874.8 | 1,003.8 | 950.5 | |||||||||||||||
Loss (gain) on debt extinguishment | 111.4 | 8.7 | (4.7 | ) | 111.7 | — | ||||||||||||||
Other expense (income), net | 28.5 | (104.4 | ) | (9.2 | ) | (44.3 | ) | (49.6 | ) | |||||||||||
Income (loss) before income taxes | 599.2 | 52.2 | (917.5 | ) | (463.6 | ) | (541.8 | ) | ||||||||||||
Income tax expense (benefit) | 132.8 | (78.9 | ) | (963.8 | ) | (90.3 | ) | (39.6 | ) | |||||||||||
Net income (loss) | $ | 466.4 | $ | 131.1 | $ | 46.3 | $ | (373.3 | ) | $ | (502.2 | ) | ||||||||
Balance Sheet (at end of period) | ||||||||||||||||||||
Cash and cash equivalents | $ | 470.7 | $ | 926.1 | $ | 670.3 | $ | 1,219.2 | $ | 579.7 | ||||||||||
Total assets(2) | 24,735.1 | 20,776.6 | 21,812.3 | 23,755.0 | 23,770.0 | |||||||||||||||
Total stockholders’ / member equity(2) | 2,278.1 | 1,450.7 | 1,398.2 | 1,371.2 | 1,613.2 | |||||||||||||||
Total debt, including finance leases(2) | 8,714.7 | 10,586.4 | 11,875.8 | 12,337.9 | 12,226.3 | |||||||||||||||
Net cash provided by operating activities | 1,903.9 | 1,687.9 | 1,018.8 | 1,813.5 | 901.6 | |||||||||||||||
Per Share Data | ||||||||||||||||||||
Basic and diluted net income (loss) per common share | $ | 1.67 | $ | 0.47 | $ | 0.17 | $ | (1.33 | ) | $ | (1.80 | ) | ||||||||
Pro forma net income per common share(3) | $ | |||||||||||||||||||
Weighted-average common shares outstanding (in millions): | ||||||||||||||||||||
Basic and diluted | 280 | 280 | 280 | 280 | 280 | |||||||||||||||
Pro forma weighted average common shares outstanding(3) | ||||||||||||||||||||
| (1) | Certain prior period amounts have been reclassified to conform to the current period presentation, specifically the reclassification of gains and losses from property dispositions and impairment losses from Selling and administrative expenses to (Gain) loss on property dispositions and impairment losses, net. |
| (2) | We adopted Accounting Standards Update (“ASU”) 2016-02, “Leases (Topic 842) |
56
| (3) | Fiscal 2019 pro forma net income per share reflects the effect of the dividend requirement associated with the Series A preferred stock to be issued in the concurrent offering of Series A preferred stock and the Repurchase as if they had taken place on February 24, 2019, the first day of fiscal 2019. Fiscal 2019 historical net income was reduced by $ to reflect the dividend requirement. Pro forma weighted average common shares used in computing pro forma net income per share gives effect to a repurchase of common shares (based upon the midpoint of the estimated offering range set forth on the cover page of this prospectus) from certain Pre-IPO Stockholders using the proceeds from the concurrent offering of Series A Preferred Stock. Assumes no common shares repurchased for the underwriters over-allotment option in the concurrent offering of Series A preferred stock. |
57
MANAGEMENT’S DISCUSSION AND ANALYSIS OF
FINANCIAL CONDITION AND RESULTS OF OPERATIONS
The following discussion and analysis of our financial condition and results of operations should be read in conjunction with our Consolidated Financial Statements and related notes included elsewhere in this prospectus. This discussion contains forward-looking statements based upon current expectations that involve numerous risks and uncertainties. Our actual results may differ materially from those contained in any forward-looking statements.
In this Management’s Discussion and Analysis of Financial Condition and Results of Operations of Albertsons Companies, Inc., the words “Albertsons,” the “Company,” “we,” “us,” “our” and “ours” refer to Albertsons Companies, Inc., together with its subsidiaries.
Overview
We are one of the largest food retailers in the United States, with 2,252 stores across 34 states and the District of Columbia. We operate 20 iconic banners with on average 85 years of operating history, includingand, with approximately 270,000 talented and dedicated employees, as of February 29, 2020, who serve on average more than 33 million customers each week. Additionally, as of February 29, 2020, we operated 1,290operating structure empowers decision making at the local level, which we believe better serves our customers and communities, while also providing the systems, analytics and buying power afforded by an organization with national scale and $62.5 billion in annual sales. Throughout the coronavirus (COVID-19) pandemic, our highest priorities have been the safety of our associates and customers and maintaining the supply of product. During the first eight weeks of fiscal 2020, we have delivered strong sales growth and increases in market share.
Albertsons, Safeway, Vons, Pavilions, Randalls, Tom Thumb, Carrs, Jewel-Osco, Acme, Shaw’s, Star Market, United Supermarkets, Market Street
Haggen
in-store
branded coffee shops, 402 adjacent fuel centers, 23 dedicated distribution centers, 20 manufacturing facilities and various online platforms. Our stores operate inFirst-and-Main
retail locations and have leading market share within attractive and growing geographies. We hold a #1 or #2 position by market share in 68% of the 121 MSAs in which we operate. Our portfolio of well-located, full-service stores provides the foundation of our omni-channel platform, including our rapidly growing Drive Up & Go curbside pickup, home delivery and rush delivery offerings. We seek to tailor our offerings to local demographics and preferences of the markets that we operate in. OurLocally Great, Nationally Strong
Our Company has grown through a series of transformational acquisitions over the last six years, including our merger with Safeway in 2015 which gave us the benefits of national scale. While our banners have rich histories, we are in many ways a young company. We have integrated systems and converted stores and distribution centers to create a common platform. We believe our common platform gives us greater transparency and compatibility across our network, allowing us to better serve our customers and employees while enhancing our supply chain.
We continue to sharpen ourpenetration and expand our omni-channel and digital capabilities. We have invested substantially in our business, deploying approximately $6.8 billion of capital expenditures beginning with fiscal 2015, and we used that capital to remodel existing stores, opportunistically build new stores and enhance our digital capabilities.
in-store
execution, increase ourOwn Brands
We are focused on creating deep and lasting relationships with our customers by offering them an experience that is,and– wherever, whenever and however they choose to shop. We make lifefor our customers through a convenient and consistent shopping experience across our omni-channel network. Merchandising is at our core and we offer anand differentiated product assortment. We believe we are an industry leader in fresh, emphasizing organic, locally sourced and seasonal items as well as value-added services like daily
Easy
Exciting
Friendly
Easy
Exciting
fresh-cut
fruit and vegetables, customized meat cuts and seafood varieties, made-58
from-scratch bakery items, prepared foods, deli and floral. We also continue to grow our innovative and distinctiveportfolio, which achieved over $13.1 billion in sales during fiscal 2019 and reached 25.4% sales penetration. Ourservice is embedded in our culture and enables us to build deep ties with our local communities.
Own Brands
Friendly
Our,andshopping experience, coupled with our nationwide, grocery and fuel rewards programs and pharmacy services, offers a differentiated value proposition to our customers. Theprogram has 20.7 million registered loyalty households which, we believe, provides us with a comprehensive understanding of our core shoppers. These loyalty programs and our omni-channel offerings combine to form an extended loyalty ecosystem that drives increased customer lifetime value through greater purchase frequency, larger basket size and higher customer retention.
Easy
Exciting
Friendly
just for U
just for U
We operate in the $1.1 trillion U.S. food retail industry, a highly fragmented sector with a large number of companies competing locally and a growing array of companies with a national footprint, including traditional supermarkets, pharmacies and drug stores, convenience stores, warehouse clubs and supercenters. The industry has also seen the widespread introduction of “limited assortment” retail stores, as well as local chains and stand-alone stores that cater to the individual cultural preferences of specific neighborhoods. Despite this, large, national grocers have increased market share over time as scale remains an important advantage in offering customers a modern and attractive shopping experience. Between 2013 and 2018, the share of the top 10 food retail companies increased from 44% to 55% on the basis of industry retail sales. While brick and mortar stores account for approximately 95% of industry sales, eCommerce offerings have been expanding as a result of new pure-play internet-based companies as well as established players expanding omni-channel options. Several system enhancements were made to our eCommerce platform in fiscal 2019 that significantly improves the overall customer experience. We created a single
sign-on
and simplified the registration experience. Were-platformed
the ‘Cart’, ‘Checkout’ and ‘Order Edit’ functionality to improve performance. We also integrated a single shoppable homepage allowing customers to easily add to their cart, created more user-friendly search functionality and made product recommendations available. Other trends in the industry include changing consumer tastes, preferences (including those relating to sustainability of product sources) and spending patterns. See “Risk Factors—Risks Related to Our Business and Industry—We may not timely identify or effectively respond to consumer trends, which could negatively affect our relationship with our customers, the demand for our products and services and our market share.”From 2014 through 2019, food retail industry revenues increased by $29 billion, driven in part by economic growth, favorable consumer dynamics and a consumer shift to premium and organic brands. Both inflation and deflation affect our business. After a period of food deflation in 2016 and 2017, the
Food-at-Home
Consumer Price Index increased by 0.4% in 2018 and 0.9% in 2019 and is expected to increase between 0.5% and 1.5% in 2020, and U.S. GDP is expected to increase by 2.1% in 2020.A considerable number of our employees are paid at rates related to the federal minimum wage. Additionally, many of our stores are located in states, including California, where the minimum wage is greater than the federal minimum wage and where a considerable number of employees receive compensation equal to the state’s minimum wage. For example, as of February 29, 2020, we employed approximately 67,000 associates in California, where the current minimum wage was increased to $13.00 per hour effective January 1, 2020, and will gradually increase each year thereafter to $15.00 per hour by January 1, 2022. In Massachusetts, where we employed approximately 10,800 associates as of February 29, 2020, the minimum wage increased to $12.75 per hour, effective January 1, 2020, and will reach $15.00 per hour by 2023. In New Jersey, where we employed approximately 6,600 associates as of February 29, 2020, the minimum wage increased to $11.00 per hour, effective January 1, 2020, and will reach $15.00 per hour by 2024. In Maryland, where we employed approximately 7,100 associates as of February 29, 2020, the minimum wage increased to $11.00 per hour, effective January 1, 2020, and will reach $15.00 per hour by 2025. Moreover, municipalities may set minimum wages above the applicable state standards. For example, the minimum wage in Seattle, Washington, where we employed approximately 1,800 associates as of February 29, 2020, increased to $16.39 per hour effective
59
January 1, 2020 for employers with more than 500 employees nationwide. In Chicago, Illinois, where we employed approximately 6,100 associates as of February 29, 2020, the minimum wage increased to $13.00 per hour effective July 1, 2019. Any further increases in the federal minimum wage or the enactment of additional state or local minimum wage increases could increase our labor costs, which may adversely affect our results of operations and financial condition.
In addition, we participate in various multiemployer pension plans for substantially all employees represented by unions pursuant to collective bargaining agreements that require us to contribute to these plans. Pension expenses for multiemployer pension plans are recognized by us as contributions are made. Generally, benefits are based on a fixed amount for each year of service. Our contributions to these pension plans could change as a result of collective bargaining efforts, which could have a negative effect to our results of operations and financial condition. Our contributions to multiemployer plans were $469.3 million, $451.1 million and $431.2 million during fiscal 2019, fiscal 2018 and fiscal 2017, respectively. See “Risk Factors—Risks Related to Our Business and Industry—Increased pension expenses, contributions and surcharges may have an adverse impact on our financial results.”
We have identified and are in the early stages of implementing a broad range of new, specific productivity initiatives that target $1 billion in annual
run-rate
productivity benefits by the end of fiscal 2022 to help offset cost inflation, fund growth and drive earnings. The initiatives include operational efficiencies such as shrink management and labor efficiencies, purchasing and procurement, improved promotional effectiveness and leveraging corporate overhead, including continued modernization of our IT infrastructure. The savings from these planned productivity initiatives represent management’s estimates and remain subject to risks and uncertainties. While certain projects are well underway and contributing as expected, in other cases, we have temporarily paused some of our initiatives to ensure we are first taking care of our customers and our communities, while focusing on the safety of our associates during the coronavirus (COVID-19) pandemic. See “Risk Factors—Risks Related to Our Business and Industry—Failure to realize anticipated benefits from our productivity initiatives could adversely affect our financial performance and competitive position.”Coronavirus
(COVID-19)
Coronavirus
(COVID-19)
has spread to every state in the United States. This pandemic has severely impacted economic activity, and many states in the United States have reacted to the pandemic by instituting quarantines, mandating business and school closures and restricting travel. We currently operate our stores as an “essential” business under relevant federal, state and local mandates. Since the beginning of fiscal 2020, we have experienced significant increases in customer traffic, product demand and basket size in stores as people adjust to these new circumstances. Consumer staples, paper goods, meat, alcoholic beverages and cleaning supplies are among the products being purchased in significant quantities. There has also been a substantial increase in customer demand and engagement with our eCommerce offerings as a result of the pandemic, including both home delivery and our Drive Up & Go curbside pickup. We have responded to this increased demand for our eCommerce offerings by hiring additional pickers and drivers, retaining additional third-party service providers and expanding our Drive Up & Go offerings. We have also simplified our offerings on our eCommerce websites to focus on the products that are most in demand.
Responding to the pandemic has also significantly increased our expenses. We have stepped up how often we clean and disinfect all departments, restrooms, and other high-touch points of our stores, including check stands and service counters, and hourly disinfecting of high touch areas. This is in addition to our rigorous food safety and sanitations programs already in place. Cart wipes and hand sanitizer stations have been installed in key locations within stores. To meet our requirements for increased labor in order to meet customer demand in store and across eCommerce channels, we have partnered with major companies to provide temporary jobs to their employees who have been furloughed or had their hours cut. We have hired over 55,000 new associates since the beginning of fiscal 2020, partnering with more than 35 companies to help keep Americans working. To the extent that our need for increased labor continues, we will need to hire and train additional employees to fill the roles
60
performed by these temporary employees. Beginning
March 15, 2020, in recognition of their significant efforts, we instituted a temporary increase in pay for all front-line associates of $2 per hour for every hour that they work. We also, through our Albertsons Companies Foundation, have pledged $50 million to hunger relief and previously launched a major fundraiser to help feed families in need during the coronavirus(COVID-19)
pandemic and ensure that they get the food they need.Beyond our doors, we rely on various suppliers and vendors to provide and deliver our product inventory on a continuous basis. We could suffer significant product inventory losses and significant lost revenue in the event of the loss or a shutdown of a major supplier or vendor, disruption of our distribution network, extended power outages, natural disasters or other catastrophic occurrences. Due to the coronavirus
(COVID-19)
pandemic and the resulting dislocation of workplaces and the economy, the ability of vendors to supply required products may be impaired because of the illness or absenteeism in their workforces, government mandated shutdown orders or impaired financial conditions.We expect the ultimate significance of the impact of the pandemic on our financial condition, results of operations, or cash flows will be dictated by the length of time that such circumstances continue, which will depend on the currently unknowable extent and duration of the coronavirus
(COVID-19)
pandemic and the nature and effectiveness of governmental and public actions taken in response. Coronavirus(COVID-19)
also makes it more challenging for management to estimate future performance of our businesses, particularly over the near term.Stores
The following table shows stores operating, acquired, opened and closed during the period presented:
Fiscal 2019 | Fiscal 2018 | Fiscal 2017 | ||||||||||
Stores, beginning of period | 2,269 | 2,318 | 2,324 | |||||||||
Acquired | — | — | 5 | |||||||||
Opened | 14 | 6 | 15 | |||||||||
Closed | (31 | ) | (55 | ) | (26 | ) | ||||||
Stores, end of period | 2,252 | 2,269 | 2,318 | |||||||||
The following table summarizes our stores by size:
Number of Stores | Percent of Total | Retail Square Feet (1) | ||||||||||||||||||||||
Square Footage | February 29, 2020 | February 23, 2019 | February 29, 2020 | February 23, 2019 | February 29, 2020 | February 23, 2019 | ||||||||||||||||||
Less than 30,000 | 204 | 208 | 9.1 | % | 9.2 | % | 4.7 | 4.9 | ||||||||||||||||
30,000 to 50,000 | 784 | 792 | 34.8 | % | 34.9 | % | 32.9 | 33.2 | ||||||||||||||||
More than 50,000 | 1,264 | 1,269 | 56.1 | % | 55.9 | % | 74.7 | 74.9 | ||||||||||||||||
Total Stores | 2,252 | 2,269 | 100.0 | % | 100.0 | % | 112.3 | 113.0 | ||||||||||||||||
| (1) | In millions, reflects total square footage of retail stores operating at the end of the period. |
61
Results of Operations
The following table and related discussion sets forth certain information and comparisons regarding the components of our Consolidated Statements of Operations for fiscal 2019, fiscal 2018 and fiscal 2017, respectively (in millions):
Fiscal 2019 | Fiscal 2018 | Fiscal 2017 | ||||||||||||||||||||||
Net sales and other revenue | $ | 62,455.1 | 100.0 | % | $ | 60,534.5 | 100.0 | % | $ | 59,924.6 | 100.0 | % | ||||||||||||
Cost of sales | 44,860.9 | 71.8 | 43,639.9 | 72.1 | 43,563.5 | 72.7 | ||||||||||||||||||
Gross profit | 17,594.2 | 28.2 | 16,894.6 | 27.9 | 16,361.1 | 27.3 | ||||||||||||||||||
Selling and administrative expenses | 16,641.9 | 26.6 | 16,272.3 | 26.9 | 16,208.7 | 27.0 | ||||||||||||||||||
(Gain) loss on property dispositions and impairment losses, net | (484.8 | ) | (0.7 | ) | (165.0 | ) | (0.3 | ) | 66.7 | 0.1 | ||||||||||||||
Goodwill impairment | — | — | — | — | 142.3 | 0.2 | ||||||||||||||||||
Operating income (loss) | 1,437.1 | 2.3 | 787.3 | 1.3 | (56.6 | ) | — | |||||||||||||||||
Interest expense, net | 698.0 | 1.1 | 830.8 | 1.4 | 874.8 | 1.5 | ||||||||||||||||||
Loss (gain) on debt extinguishment | 111.4 | 0.2 | 8.7 | — | (4.7 | ) | — | |||||||||||||||||
Other expense (income), net | 28.5 | — | (104.4 | ) | (0.2 | ) | (9.2 | ) | — | |||||||||||||||
Income (loss) before income taxes | 599.2 | 1.0 | 52.2 | 0.1 | (917.5 | ) | (1.5 | ) | ||||||||||||||||
Income tax expense (benefit) | 132.8 | 0.2 | (78.9 | ) | (0.1 | ) | (963.8 | ) | (1.6 | ) | ||||||||||||||
Net income | $ | 466.4 | 0.8 | % | $ | 131.1 | 0.2 | % | $ | 46.3 | 0.1 | % | ||||||||||||
Identical Sales, Excluding Fuel
Identical sales include stores operating during the same period in both the current year and the prior year, comparing sales on a daily basis. Direct to consumer internet sales are included in identical sales, and fuel sales are excluded from identical sales. Acquired stores become identical on the
one-year
anniversary date of the acquisition. Identical sales results, on an actual basis, for the past three fiscal years were as follows:Fiscal 2019 | Fiscal 2018 | Fiscal 2017 | ||||||||||
Identical sales, excluding fuel | 2.1 | % | 1.0 | % | (1.3 | )% | ||||||
Net Sales and Other Revenue
Net sales and other revenue increased $1,920.6 million, or 3.2%, from $60,534.5 million in fiscal 2018 to $62,455.1 million in fiscal 2019. The components of the change in Net sales and other revenue for fiscal 2019 were as follows (in millions):
Fiscal 2019 | ||||
Net sales and other revenue for fiscal 2018 | $ | 60,534.5 | ||
Identical sales increase of 2.1% | 1,160.3 | |||
Impact of 53rd week | 1,067.0 | |||
Decrease in sales due to store closures, net of new store openings | (304.6 | ) | ||
Decrease in fuel sales | (25.5 | ) | ||
Other (1) | 23.4 | |||
Net sales and other revenue for fiscal 2019 | $ | 62,455.1 | ||
| (1) | Includes changes in non-identical sales and other miscellaneous revenue. |
62
The primary increase in Net sales and other revenue in fiscal 2019 as compared to fiscal 2018 was driven by our 2.1% increase in identical sales and sales due to the additional 53rd week, partially offset by a reduction in sales related to the closure of 31 stores in fiscal 2019 and a decrease in fuel sales of $25.5 million. Fiscal 2019 identical sales benefited from the growth in online home delivery and Drive Up & Go curbside pickup sales andsales.
Own Brands
Net sales and other revenue increased $609.9 million, or 1.0%, from $59,924.6 million in fiscal 2017 to $60,534.5 million in fiscal 2018. The components of the change in Net sales and other revenue for fiscal 2018 were as follows (in millions):
Fiscal 2018 | ||||
Net sales and other revenue for fiscal 2017 | $ | 59,924.6 | ||
Identical sales increase of 1.0% | 539.6 | |||
Increase in fuel sales | 351.3 | |||
Decrease in sales due to store closures, net of new store openings | (413.6 | ) | ||
Other (1) | 132.6 | |||
Net sales and other revenue for fiscal 2018 | $ | 60,534.5 | ||
| (1) | Includes changes in non-identical sales and other miscellaneous revenue. |
The primary increase in Net sales and other revenue in fiscal 2018 as compared to fiscal 2017 was driven by our 1.0% increase in identical sales and an increase in fuel sales of $351.3 million, partially offset by a reduction in sales related to the closure of 55 stores in fiscal 2018.
Gross Profit
Gross profit represents the portion of Net sales and other revenue remaining after deducting the Cost of sales during the period, including purchase and distribution costs. These costs include inbound freight charges, purchasing and receiving costs, warehouse inspection costs, warehousing costs and other costs associated with our distribution network. Advertising, promotional expenses and vendor allowances are also components of Cost of sales.
Gross profit margin increased 30 basis points to 28.2% in fiscal 2019 compared to 27.9% in fiscal 2018. Excluding the impact of fuel, gross profit margin increased 20 basis points. The increase in fiscal 2019 as compared to fiscal 2018 was primarily attributable to lower shrink expense primarily related to the ongoing inventory management initiatives, improved product mix, including increased penetration inand natural and organic products, lower depreciation and amortization expense and lower advertising costs, partially offset by higher rent expense related to sale leaseback transactions and industry-wide reimbursement rate pressures in pharmacy.
Own Brands
Fiscal 2019 vs. Fiscal 2018 | Basis point increase (decrease) | |||
Lower shrink expense | 16 | |||
Product mix, including increased penetration in Own Brands | 8 | |||
Depreciation and amortization | 7 | |||
Advertising | 5 | |||
Rent expense | (10 | ) | ||
Pharmacy reimbursement rate pressure | (8 | ) | ||
Other | 2 | |||
Total | 20 | |||
63
Gross profit margin increased 60 basis points to 27.9% in fiscal 2018 compared to 27.3% in fiscal 2017. Excluding the impact of fuel, gross profit margin increased 70 basis points. The increase in fiscal 2018 as compared to fiscal 2017 was primarily attributable to lower shrink expense as a percentage of sales, partially due to the completion of our store conversions related to the Safeway acquisition and the implementation of inventory management initiatives, lower advertising costs and improved product mix, including improved sales penetration in.
Own Brands
Fiscal 2018 vs. Fiscal 2017 | Basis point increase (decrease) | |||
Lower shrink expense | 31 | |||
Product mix, including increased Own Brands | 16 | |||
Advertising | 14 | |||
Acquisition synergies | 6 | |||
Other | 3 | |||
Total | 70 | |||
Selling and Administrative Expenses
Selling and administrative expenses consist primarily of store level costs, including wages, employee benefits, rent, depreciation and utilities, in addition to certain back-office expenses related to our corporate and division offices.
Selling and administrative expenses decreased 30 basis points to 26.6% of Net sales and other revenue in fiscal 2019 from 26.9% in fiscal 2018. Excluding the impact of fuel, Selling and administrative expenses as a percentage of Net sales and other revenue decreased 30 basis points during fiscal 2019 compared to fiscal 2018. The decrease during fiscal 2019 compared to fiscal 2018 was primarily attributable to lower integration and acquisition-related costs and lower depreciation and amortization expense, partially offset by an increase in rent expense and occupancy costs related to store properties and investments in strategic initiatives. Lower acquisition and integration-related costs were driven by the substantial completion of the Safeway integration in fiscal 2018, resulting in no store conversions in fiscal 2019 compared to 506 store conversions in fiscal 2018. The integration costs in fiscal 2019 were largely driven by the conversion of back-office related areas and a distribution center.
Fiscal 2019 vs. Fiscal 2018 | Basis point increase (decrease) | |||
Lower integration and acquisition-related costs | (32 | ) | ||
Depreciation and amortization | (11 | ) | ||
Rent expense and occupancy costs | 11 | |||
Strategic initiatives | 9 | |||
Other (1) | (7 | ) | ||
Total | (30 | ) | ||
| (1) | Includes the favorable settlement of the UFCW & Employers Midwest Pension Fund dispute. See Note 11—Employee benefit plans and collective bargaining agreements in our consolidated financial statements, included elsewhere in this prospectus, for more information. |
Selling and administrative expenses decreased 10 basis points to 26.9% of Net sales and other revenue in fiscal 2018 from 27.0% in fiscal 2017. Excluding the impact of fuel, Selling and administrative expenses as a percentage of Net sales and other revenue decreased 10 basis points during fiscal 2018 compared to fiscal 2017. The decrease during fiscal 2018 compared to fiscal 2017 was primarily attributable to lower depreciation and
64
amortization expense and our cost reduction initiatives, partially offset by increased employee wage and benefit costs and higher acquisition and integration costs. Increased employee wage and benefit costs were primarily attributable to incentive pay as a result of improved operating performance. Higher acquisition and integration costs were primarily driven by the 506 store conversions in fiscal 2018 related to the Safeway integration compared to 219 store conversions in fiscal 2017.
Fiscal 2018 vs. Fiscal 2017 | Basis point increase (decrease) | |||
Depreciation and amortization | (27 | ) | ||
Cost reduction initiatives | (18 | ) | ||
Employee wage and benefit costs (primarily incentive pay) | 28 | |||
Other (includes an increase in acquisition and integration costs) | 7 | |||
Total | (10 | ) | ||
(Gain) Loss on Property Dispositions and Impairment Losses, Net
For fiscal 2019, net gain on property dispositions and impairment losses was $484.8 million, primarily driven by gains from the sale of assets of $559.2 million including $463.6 million of gains related to sale leaseback transactions during the second quarter of fiscal 2019, partially offset by $77.4 million of asset impairments including impairment losses of $46.0 million related to certain assets of our meal kit operations and impairment losses related to underperforming stores and certain surplus properties. For fiscal 2018, net gain on property dispositions and impairment losses was $165.0 million, primarily driven by gains from the sale of assets of $240.1 million, partially offset by long-lived asset impairment losses of $36.3 million. For fiscal 2017, net loss on property dispositions and impairment losses was $66.7 million, primarily driven by long-lived asset impairment losses of $100.9 million primarily related to underperforming stores, partially offset by gains from the sale of assets of $63.8 million.
Goodwill Impairment
No goodwill impairment was recorded in fiscal 2019 and fiscal 2018, compared to $142.3 million in fiscal 2017.
Interest Expense, Net
Interest expense, net was $698.0 million in fiscal 2019, $830.8 million in fiscal 2018 and $874.8 million in fiscal 2017. The decrease in Interest expense, net for fiscal 2019 compared to fiscal 2018 is primarily due to lower average outstanding borrowings and lower average interest rates. The weighted average interest rate during fiscal 2019 was 6.4%, excluding amortization of debt discounts and deferred financing costs. The weighted average interest rate during fiscal 2018 and fiscal 2017 was 6.6% and 6.5%, respectively.
65
The following details our components of Interest expense, net for the respective fiscal years (in millions):
Fiscal 2019 | Fiscal 2018 | Fiscal 2017 | ||||||||||
ABL Facility, senior secured and unsecured notes, term loans and debentures | $ | 565.3 | $ | 698.3 | $ | 701.5 | ||||||
Finance lease obligations | 79.8 | 81.8 | 96.3 | |||||||||
Deferred financing costs | 39.8 | 42.7 | 56.1 | |||||||||
Debt discounts | 34.1 | 20.3 | 16 | |||||||||
Other interest (income) expense | (21.0 | ) | (12.3 | ) | 4.9 | |||||||
Interest expense, net | $ | 698.0 | $ | 830.8 | $ | 874.8 | ||||||
Loss (Gain) on Debt Extinguishment
During fiscal 2019, we completed a cash tender offer and early redemption of Safeway notes and NALP Notes with a par value of $437.0 million and a book value of $397.0 million for $415.3 million. We also repurchased NALP Notes on the open market with an aggregate par value of $553.9 million and a book value of $502.0 million for $547.5 million. On February 5, 2020, we repaid $2,349.8 million of aggregate principal amount outstanding under our term loan facilities, which represented the entire outstanding term loan balance. In connection with the term loan repayment, we expensed $15.2 million of previously deferred financing costs and $29.9 million of original issue discount. Including fees, we recognized an aggregate loss on debt extinguishment related to the tender offer, various repurchases of notes and term loan repayment of $111.4 million.
During fiscal 2018, we repurchased Safeway’s 7.45% Senior Debentures due 2027 and 7.25% Debentures due 2031 with a par value of $333.7 million and a book value of $322.4 million, and NALP Notes with a par value of $108.4 million and a book value of $96.4 million for an aggregate of $424.4 million (the “2018 Repurchases”). We also redeemed Safeway’s 5.00% Senior Notes due 2019 (the “2018 Redemption”) for $271.7 million, which included an associated make-whole premium of $3.1 million. In connection with the 2018 Repurchases and the 2018 Redemption, we recorded a loss on debt extinguishment of $8.7 million.
During fiscal 2017, we repurchased NALP Notes with a par value of $160.0 million and a book value of $140.2 million for $135.5 million plus accrued interest of $3.7 million (the “NALP Notes Repurchase”). In connection with the NALP Notes Repurchase, we recorded a gain on debt extinguishment of $4.7 million.
Other Expense (Income), Net
For fiscal 2019, Other expense, net was $28.5 million primarily driven by recognized losses on interest rate swaps, partially offset by
non-service
cost components of net pension and post-retirement expense. For fiscal 2018, Other income, net was $104.4 million primarily driven by adjustments related to acquisition-related contingent consideration, gains related tonon-operating
minority investments andnon-service
cost components of net pension and post-retirement expense. For fiscal 2017, Other income, net was $9.2 million primarily driven by changes in our equity method investment in Casa Ley, changes in the fair value of the contingent value rights (“CVRs”),non-service
cost components of net pension and post-retirement expense and gains and losses on the sale ofnon-operating
minority investments.Income Taxes
Income tax was an expense of $132.8 million in fiscal 2019 and a benefit of $78.9 million in fiscal 2018 and $963.8 million in fiscal 2017. Prior to the Reorganization Transactions, a substantial portion of our businesses and assets were held and operated by limited liability companies, which are generally not subject to entity-level federal or state income taxation. See Note 1—Description of business, basis of presentation and summary of
66
significant accounting policies in our consolidated financial statements, included elsewhere in this prospectus, for a discussion and definition of the “Reorganization Transactions.” On December 22, 2017, the Tax Cuts and Jobs Act (the “Tax Act”) was signed into law, which resulted in a significant ongoing benefit to us, primarily due to the reduction in the corporate tax rate from 35% to 21% and the ability to accelerate depreciation deductions for qualified property purchases.
The components of the change in income taxes for the last three fiscal years were as follows:
Fiscal 2019 | Fiscal 2018 | Fiscal 2017 | ||||||||||
Income tax expense (benefit) at federal statutory rate | $ | 125.8 | $ | 11.0 | $ | (301.5 | ) | |||||
State income taxes, net of federal benefit | 32.3 | 0.7 | (39.8 | ) | ||||||||
Change in valuation allowance | (7.2 | ) | (3.3 | ) | (218.0 | ) | ||||||
Unrecognized tax benefits | 7.7 | (16.2 | ) | (36.5 | ) | |||||||
Member loss | — | — | 83.1 | |||||||||
Charitable donations | (6.9 | ) | (4.4 | ) | — | |||||||
Tax credits | (23.5 | ) | (10.8 | ) | (9.1 | ) | ||||||
Tax Cuts and Jobs Act | — | (56.9 | ) | (430.4 | ) | |||||||
CVR liability adjustment | — | — | (20.3 | ) | ||||||||
Reorganization of limited liability companies | — | — | 46.7 | |||||||||
Nondeductible equity-based compensation expense | 1.0 | 3.8 | 1.6 | |||||||||
Other | 3.6 | (2.8 | ) | (39.6 | ) | |||||||
Income tax expense (benefit) | $ | 132.8 | $ | (78.9 | ) | $ | (963.8 | ) | ||||
As a result of the Tax Act, we recorded a net
non-cash
tax benefit of $56.9 million and $430.4 million in fiscal 2018 and fiscal 2017, respectively, primarily due to the lower corporate tax rate. The income tax benefit in fiscal 2017 includes a net $218.0 millionnon-cash
benefit from the reversal of a valuation allowance, partially offset by an increase of $46.7 million in net deferred tax liabilities from our limited liability companies related to the Reorganization Transactions.Adjusted EBITDA and Adjusted Free Cash Flow
The
Non-GAAP
Measures are performance measures that provide supplemental information we believe is useful to analysts and investors to evaluate our ongoing results of operations, when considered alongside other GAAP measures such as net income, operating income, gross profit and net cash provided by operating activities. TheseNon-GAAP
Measures exclude the financial impact of items management does not consider in assessing our ongoing operating performance, and thereby facilitate review of our operating performance on aperiod-to-period
basis. Other companies may have different capital structures or different lease terms, and comparability to our results of operations may be impacted by the effects of acquisition accounting on our depreciation and amortization. As a result of the effects of these factors and factors specific to other companies, we believe EBITDA, Adjusted EBITDA and Adjusted Free Cash Flow provide helpful information to analysts and investors to facilitate a comparison of our operating performance to that of other companies. We also use Adjusted EBITDA, as further adjusted for additional items defined in our debt instruments, for board of director and bank compliance reporting. The presentation ofNon-GAAP
Measures should not be construed as an inference that our future results will be unaffected by unusual ornon-recurring
items.For fiscal 2019, Adjusted EBITDA was $2.8 billion, or 4.5% of Net sales and other revenue, compared to $2.7 billion, or 4.5% of Net sales and other revenue, for fiscal 2018. The increase in Adjusted EBITDA reflects our identical sales increase and higher gross profit margin, including fuel margins, and the additional week in fiscal 2019, partially offset by incremental rent expense and occupancy costs, largely driven by sale leaseback transactions, and investments in strategic initiatives, including digital and technology.
67
The following is a reconciliation of Net income to Adjusted EBITDA (in millions):
Fiscal 2019 | Fiscal 2018 | Fiscal 2017 | ||||||||||
Net income | $ | 466.4 | $ | 131.1 | $ | 46.3 | ||||||
Depreciation and amortization | 1,691.3 | 1,738.8 | 1,898.1 | |||||||||
Interest expense, net | 698.0 | 830.8 | 874.8 | |||||||||
Income tax expense (benefit) | 132.8 | (78.9 | ) | (963.8 | ) | |||||||
EBITDA | 2,988.5 | 2,621.8 | 1,855.4 | |||||||||
Loss (gain) on interest rate and commodity hedges, net | 50.6 | (1.3 | ) | (6.2 | ) | |||||||
Facility closures and related transition costs (1) | 18.3 | 13.4 | 12.4 | |||||||||
Integration costs (2) | 37.0 | 186.3 | 156.2 | |||||||||
Acquisition-related costs (3) | 23.5 | 73.4 | 61.5 | |||||||||
Loss (gain) on debt extinguishment | 111.4 | 8.7 | (4.7 | ) | ||||||||
Equity-based compensation expense | 32.8 | 47.7 | 45.9 | |||||||||
(Gain) loss on property dispositions and impairment losses, net | (484.8 | ) | (165.0 | ) | 66.7 | |||||||
Goodwill impairment | — | — | 142.3 | |||||||||
LIFO expense | 18.4 | 8.0 | 3.0 | |||||||||
Miscellaneous adjustments (4) | 38.7 | (51.7 | ) | 65.4 | ||||||||
Adjusted EBITDA (5) | $ | 2,834.4 | $ | 2,741.3 | $ | 2,397.9 | ||||||
| (1) | Includes costs related to facility closures and the transition to our decentralized operating model. Fiscal 2019 includes closure costs related to the discontinuation of our meal kit subscription delivery operations. |
| (2) | Related to conversion activities and related costs associated with integrating acquired businesses, primarily the Safeway acquisition. |
| (3) | Includes expenses related to acquisitions (including the mutually terminated merger with Rite Aid Corporation in fiscal 2018) and expenses related to management fees of $13.8 million incurred in each fiscal year in connection with acquisition and financing activities. |
| (4) | Miscellaneous adjustments include the following: |
Fiscal 2019 | Fiscal 2018 | Fiscal 2017 | ||||||||||
Non-cash lease-related adjustments | $ | 21.2 | $ | (13.7 | ) | $ | (5.9 | ) | ||||
Lease and lease-related costs for surplus and closed stores | 21.5 | 19.5 | 23.3 | |||||||||
Net realized and unrealized gain on non-operating investments | (1.1 | ) | (17.2 | ) | (5.1 | ) | ||||||
Adjustments to contingent consideration | — | (59.3 | ) | — | ||||||||
Costs related to initial public offering and reorganization transactions | 4.1 | 1.6 | 8.7 | |||||||||
Changes in our equity method investment in Casa Ley and related CVR adjustments | — | — | 53.8 | |||||||||
Certain legal and regulatory accruals and settlements, net | (22.2 | ) | 4.0 | (13.7 | ) | |||||||
Other (a) | 15.2 | 13.4 | 4.3 | |||||||||
Total miscellaneous adjustments | $ | 38.7 | $ | (51.7 | ) | $ | 65.4 | |||||
| (a) | Primarily includes adjustments for unconsolidated equity investments. |
| (5) | Fiscal 2019 includes an estimated $54 million of incremental Adjusted EBITDA due to the impact of the additional week in fiscal 2019’s 53-week annual period. |
68
The following is a reconciliation of Net cash provided by operating activities to Adjusted Free Cash Flow, which we define as Adjusted EBITDA less capital expenditures (in millions):
Fiscal 2019 | Fiscal 2018 | Fiscal 2017 | ||||||||||
Net cash provided by operating activities | $ | 1,903.9 | $ | 1,687.9 | $ | 1,018.8 | ||||||
Income tax expense (benefit) | 132.8 | (78.9 | ) | (963.8 | ) | |||||||
Deferred income taxes | 5.9 | 81.5 | 1,094.1 | |||||||||
Interest expense, net | 698.0 | 830.8 | 874.8 | |||||||||
Operating lease right-of-use assets amortization | (570.3 | ) | — | — | ||||||||
Changes in operating assets and liabilities | 575.9 | (176.2 | ) | 222.1 | ||||||||
Amortization and write-off of deferred financing costs | (39.8 | ) | (42.7 | ) | (56.1 | ) | ||||||
Acquisition and integration costs | 60.5 | 259.7 | 217.7 | |||||||||
Pension and post-retirement (income) expense, net of contributions | 13.0 | 174.8 | 22.8 | |||||||||
Other adjustments | 54.5 | 4.4 | (32.5 | ) | ||||||||
Adjusted EBITDA | 2,834.4 | 2,741.3 | 2,397.9 | |||||||||
Less: capital expenditures | (1,475.1 | ) | (1,362.6 | ) | (1,547.0 | ) | ||||||
Adjusted Free Cash Flow | $ | 1,359.3 | $ | 1,378.7 | $ | 850.9 | ||||||
Liquidity and Financial Resources
The following table sets forth the major sources and uses of cash and cash equivalents and restricted cash at the end of each period (in millions):
February 29, 2020 | February 23, 2019 | February 24, 2018 | ||||||||||
Cash and cash equivalents and restricted cash at end of period | $ | 478.9 | $ | 967.7 | $ | 680.8 | ||||||
Cash flows provided by operating activities | 1,903.9 | 1,687.9 | 1,018.8 | |||||||||
Cash flows used in investing activities | (378.5 | ) | (86.8 | ) | (469.0 | ) | ||||||
Cash flows used in financing activities | (2,014.2 | ) | (1,314.2 | ) | (1,098.1 | ) | ||||||
Net Cash Provided By Operating Activities
Net cash provided by operating activities was $1,903.9 million during fiscal 2019 compared to net cash provided by operating activities of $1,687.9 million during fiscal 2018. The increase in net cash flow from operating activities during fiscal 2019 compared to fiscal 2018 was primarily due to improvements in Adjusted EBITDA, principally reflecting the results in fiscal 2019 compared to fiscal 2018, lower acquisition and integration costs, lower contributions to defined benefit pension plans and post-retirement benefit plans, a decrease in cash paid for interest and the additional week in fiscal 2019, partially offset by an increase in cash paid for income taxes primarily related to sale leaseback transactions and changes in working capital.
Net cash provided by operating activities was $1,687.9 million during fiscal 2018 compared to net cash provided by operating activities of $1,018.8 million during fiscal 2017. The increase in net cash flow from operating activities during fiscal 2018 compared to fiscal 2017 was primarily due to the increase in Adjusted EBITDA, principally reflecting the results in fiscal 2018 compared to fiscal 2017, and changes in working capital primarily related to accounts payable and accrued liabilities, which includes $42.3 million in payments related to litigation settlements in fiscal 2017, partially offset by $199.3 million in pension contributions in fiscal 2018.
69
Net Cash Used In Investing Activities
Net cash used in investing activities during fiscal 2019 was $378.5 million primarily due to payments for property and equipment, including lease buyouts, of $1,475.1 million, partially offset by proceeds from the sale of assets of $1,096.7 million. Payments for property and equipment included the opening of 14 new stores, completion of 243 upgrades and remodels and continued investment in digital and eCommerce technology. Proceeds from the sale of assets primarily includes the sale and leaseback of 53 store properties and one distribution center for $931.3 million, net of closing costs, during the second quarter of fiscal 2019 and certain other property dispositions during fiscal 2019.
Net cash used in investing activities during fiscal 2018 was $86.8 million primarily due to payments for property and equipment, including lease buyouts, of $1,362.6 million, which includes approximately $70 million of Safeway integration-related capital expenditures, partially offset by proceeds from the sale of assets of $1,252.0 million. Payments for property and equipment included the opening of six new stores, completion of 128 upgrades and remodels and continued investment in digital and eCommerce technology. Asset sale proceeds primarily relate to the sale and leaseback of seven of our distribution center properties during fiscal 2018 and other property dispositions.
Net cash used in investing activities during fiscal 2017 was $469.0 million primarily due to payments for property and equipment, including lease buyouts, of $1,547.0 million, which includes approximately $200 million of Safeway integration-related capital expenditures, and payments for business acquisitions of $148.8 million, partially offset by proceeds from the sale of assets of $939.2 million and proceeds from the sale of our equity method investment in Casa Ley of $344.2 million. Asset sale proceeds primarily relate to the sale and leaseback of 94 store properties during the third and fourth quarters of fiscal 2017.
In fiscal 2020, we expect to spend approximately $1.5 billion in capital expenditures, or approximately 2.4% of our sales in fiscal 2019, as follows, which does not reflect any incremental investments in technology and other initiatives we may consider in light of the coronavirus (COVID-19) pandemic (in millions):
Projected Fiscal 2020 Capital Expenditures | ||||
New stores and remodels | $ | 550.0 | ||
IT | 375.0 | |||
Real estate and expansion capital | 100.0 | |||
Maintenance | 350.0 | |||
Supply chain | 125.0 | |||
Total | $ | 1,500.0 | ||
Net Cash Used In Financing Activities
Net cash used in financing activities was $2,014.2 million in fiscal 2019 consisting of payments on long-term debt and finance leases of $5,785.9 million, partially offset by proceeds from the issuance of long-term debt of $3,874.0 million. Payments on long-term debt principally consisted of the term loan repayments, tender offer and various repurchases of notes, as further discussed below.
Net cash used in financing activities was $1,314.2 million in fiscal 2018 consisting of payments on long-term debt and finance leases of $3,179.8 million, partially offset by proceeds from the issuance of long-term debt of $1,969.8 million. Proceeds from the issuance of long-term debt and payments of long-term debt consisted of the issuance of the 2026 Notes, the issuance and subsequent redemption of the $750.0 million floating rate senior secured notes as a result of the terminated merger with Rite Aid Corporation, borrowings and repayments under our ABL Facility, the repayment of term loans in connection with the refinancing and repurchase of Safeway’s notes.
70
Net cash used in financing activities was $1,098.1 million in fiscal 2017 due primarily to payments on long-term debt and capital lease obligations of $977.8 million, payment of the Casa Ley CVR and a member distribution of $250.0 million, partially offset by proceeds from the issuance of long-term debt.
Debt Management
Total debt, including both the current and long-term portions of finance lease obligations and net of debt discounts and deferred financing costs, decreased $1.9 billion to $8.7 billion as of the end of fiscal 2019 compared to $10.6 billion as of the end of fiscal 2018.
Outstanding debt, including current maturities and net of debt discounts and deferred financing costs, principally consisted of (in millions):
February 29, 2020 | ||||
Notes and debentures | $ | 7,992.6 | ||
Finance leases | 666.7 | |||
Other notes payable and mortgages | 55.4 | |||
Total debt, including finance leases | $ | 8,714.7 | ||
On February 5, 2020, we completed the issuance of $750.0 million in aggregate principal amount of new 2023 Notes, $600.0 million in aggregate principal amount of Additional 2027 Notes and $1,000.0 million in aggregate principal amount of new 2030 Notes (together with the 2023 Notes and Additional 2027 Notes, the “New Notes”). The net proceeds received from the issuance of the New Notes, together with approximately $18 million of cash on hand, were used to prepay in full the $2,349.8 million of aggregate principal amount outstanding of our then existing term loan facility and pay fees and expenses related to the term loan repayment and the issuance of the New Notes.
On November 22, 2019, we completed the issuance of $750.0 million in aggregate principal amount of 2027 Notes. Also on November 22, 2019, we repaid approximately $743 million in aggregate principal amount outstanding under our term loan facilities which was to mature on November 17, 2025, along with accrued and unpaid interest and fees and expenses, with the proceeds from the issuance of the 2027 Notes.
On August 15, 2019, we repaid approximately $1,571 million in aggregate principal amount outstanding under our term loan facilities, along with accrued and unpaid interest and fees and expenses, using cash on hand and proceeds from the issuance of the 2028 Notes (as defined herein). Contemporaneously with the term loan repayment, we refinanced the remaining amounts outstanding with new term loan tranches. The new tranches consisted of $3.1 billion in aggregate principal, of which $1,500.0 million was to mature on November 17, 2025 and $1,600.0 million was to mature on August 17, 2026. The new loans amortized, on a quarterly basis, at a rate of 1.0% per annum of the original principal amount. The new loans bore interest, at the borrower’s option, at a rate per annum equal to either (a) the base rate plus 1.75% or (b) LIBOR plus 2.75%, subject to a 0.75% floor.
Also on August 15, 2019, we completed the issuance of $750.0 million in aggregate principal amount of 2028 Notes. Proceeds from the 2028 Notes were used to partially fund the August 15, 2019 term loan repayment discussed above.
On May 24, 2019, we completed a cash tender offer and early redemption of $34.1 million of Safeway notes and $402.9 million of NALP Notes for an aggregate of $415.3 million in cash plus accrued and unpaid interest. During fiscal 2019, we also repurchased NALP Notes on the open market with an aggregate par value of $553.9 million for $547.5 million in cash plus accrued and unpaid interest.
During the second quarter of fiscal 2019, we completed the sale and leaseback of 53 store properties and one distribution center, through three separate transactions, for an aggregate purchase price, net of closing costs, of
71
$931.3 million. In connection with the sale leaseback transactions, we entered into lease agreements for each of the properties for initial terms ranging from 15 to 20 years. The aggregate initial annual rent payment for the properties is approximately $53 million and includes 1.50% to 1.75% annual rent increases over the initial lease terms. All of the properties qualified for sale leaseback and operating lease accounting, and we recorded total gains of $463.6 million, which is included as a component of (Gain) loss on property dispositions and impairment losses, net. We also recorded operating lease
right-of-use
assets and corresponding operating lease liabilities of $602.5 million.Liquidity and Factors Affecting Liquidity
We estimate our liquidity needs over the next fiscal year to be in the range of $4.0 billion to $4.5 billion, which includes anticipated requirements for working capital, capital expenditures, interest payments and scheduled principal payments of debt, operating leases and finance leases. Based on current operating trends, we believe that cash flows from operating activities and other sources of liquidity, including borrowings under our ABL Facility, will be adequate to meet our liquidity needs for the next 12 months and for the foreseeable future. We believe we have adequate cash flow to continue to maintain our current debt ratings and to respond effectively to competitive conditions. In addition, we may enter into refinancing transactions from time to time. There can be no assurance, however, that our business will continue to generate cash flow at or above current levels or that we will maintain our ability to borrow under our ABL Facility. See “Contractual Obligations” for a more detailed description of our commitments as of the end of fiscal 2019.
As of February 29, 2020, we had no borrowings outstanding under our ABL Facility and total availability of approximately $3.4 billion (net of letter of credit usage). On March 12, 2020, we provided notice to the lenders to borrow $2.0 billion under our ABL Facility (as defined herein) (such borrowing, the “ABL Borrowing”), so that a total of $2.0 billion (excluding $454.5 million in letters of credit) was outstanding immediately following the borrowing. We increased our borrowings under the ABL Facility as a precautionary measure in order to increase our cash position and preserve financial flexibility in light of current uncertainty in the global markets resulting from the coronavirus (COVID-19)
pandemic. In accordance with the terms of the ABL Facility, the proceeds from the ABL Borrowing may in the future be used for working capital, general corporate or other purposes permitted by the ABL Facility, but there is no guarantee how or when we will use the proceeds. For more information on our existing indebtedness, see “Description of Indebtedness.”
Since the beginning of fiscal 2020, we have experienced significant increases in customer traffic, product demand and overall basket size in stores and in our eCommerce business as customers adjust to the circumstances around coronavirus (COVID-19). As a result, identical sales increased 47% during the first four weeks of fiscal 2020 (ending March 28, 2020), and increased 21% during the second four weeks of fiscal 2020 (ending April 25, 2020). Identical sales for the first eight weeks of fiscal 2020 increased 34% compared to the comparable period during fiscal 2019. As a result, our cash balance as of April 25, 2020 was approximately $4.0 billion, which includes the proceeds from the ABL Borrowing, and our Net Debt as of April 25, 2020 was approximately $6.7 billion. The increase in cash balance after adjusting for the ABL Borrowing is primarily attributable to incremental operating cash flows driven by the increased sales performance and from changes in net working capital as a result of inventory reductions. Subject to opportunistic investments,
our Net Debt at the end of fiscal 2020 will be approximately $6.7 billion as we anticipate that incremental cash flow from our business will, subject to seasonal fluctuations, fund capital expenditures, debt service, working capital replenishment and other operating needs. It is too early to predict the permanent impact the coronavirus (COVID-19) pandemic will have on our industry or food-at-home consumption or what the impact on sales will be going forward.
The ABL Facility contains no financial maintenance covenants unless and until (a) excess availability is less than (i) 10% of the lesser of the aggregate commitments and the then-current borrowing base at any time or (ii) $250.0 million at any time or (b) an event of default is continuing. If any such event occurs, we must maintain a fixed charge coverage ratio of 1.0:1.0 from the date such triggering event occurs until such event of default is cured or waived and/or the 30th day that all such triggers under clause (a) no longer exist.
72
During fiscal 2019 and fiscal 2018, there were no financial maintenance covenants in effect under the ABL Facility because the conditions listed above had not been met.
See Note 7 - Long-term debt and finance lease obligations in our consolidated financial statements, included elsewhere in this prospectus, for additional information.
Contractual Obligations
The table below presents our significant contractual obligations as of February 29, 2020 (in millions)(1):
Payments Due Per Year | ||||||||||||||||||||
Total | 2020 | 2021-2022 | 2023-2024 | Thereafter | ||||||||||||||||
Long-term debt (2) | $ | 8,162.2 | $ | 138.0 | $ | 882.3 | $ | 1,268.4 | $ | 5,873.5 | ||||||||||
Estimated interest on long-term debt (3) | 3,145.2 | 460.0 | 908.3 | 807.6 | 969.3 | |||||||||||||||
Operating leases (4) | 9,159.4 | 891.8 | 1,795.0 | 1,504.4 | 4,968.2 | |||||||||||||||
Finance leases (4) | 1,034.0 | 136.2 | 262.1 | 212.4 | 423.3 | |||||||||||||||
Other long-term liabilities (5) | 1,247.4 | 404.0 | 380.2 | 156.0 | 307.2 | |||||||||||||||
Purchase obligations (6) | 530.5 | 152.4 | 119.2 | 107.5 | 151.4 | |||||||||||||||
Total contractual obligations | $ | 23,278.7 | $ | 2,182.4 | $ | 4,347.1 | $ | 4,056.3 | $ | 12,692.9 | ||||||||||
| (1) | The contractual obligations table excludes funding of pension and other postretirement benefit obligations, which totaled $11.0 million in fiscal 2019 and is expected to total $69.5 million in fiscal 2020. This table excludes contributions under various multiemployer pension plans, which totaled $469.3 million in fiscal 2019 and is expected to total approximately $500 million in fiscal 2020. |
| (2) | Long-term debt amounts exclude any debt discounts and deferred financing costs. See Note 7 - Long-term debt and finance lease obligations in our consolidated financial statements, included elsewhere in this prospectus, for additional information. |
| (3) | Amounts include contractual interest payments using the stated fixed interest rate as of February 29, 2020. See Note 7 - Long-term debt and finance lease obligations in our consolidated financial statements, included elsewhere in this prospectus, for additional information. |
| (4) | Represents the minimum rents payable under operating and finance leases, excluding common area maintenance, insurance or tax payments, for which we are obligated. |
| (5) | Consists of self-insurance liabilities, which have not been reduced by insurance-related receivables, deferred cash consideration related to DineInFresh, Inc. (Plated), and the $75.0 million of withdrawal liability settlement related to Safeway’s previous closure of its Dominick’s division. The table excludes the unfunded pension and postretirement benefit obligation of $793.4 million. The amount of unrecognized tax benefits of $373.8 million as of February 29, 2020 has been excluded from the contractual obligations table because a reasonably reliable estimate of the timing of future tax settlements cannot be determined. Excludes contingent consideration because the timing and settlement is uncertain. Also excludes deferred tax liabilities and certain other deferred liabilities that will not be settled in cash. |
| (6) | Purchase obligations include various obligations that have specified purchase commitments. As of February 29, 2020, future purchase obligations primarily relate to fixed asset, marketing and information technology commitments, including fixed price contracts. In addition, not included in the contractual obligations table are supply contracts to purchase product for resale to consumers which are typically of a short-term nature with limited or no purchase commitments. We also enter into supply contracts which typically include either volume commitments or fixed expiration dates, termination provisions and other customary contractual considerations. The supply contracts that are cancelable have not been included above. |
73
Off-Balance
Sheet ArrangementsGuarantees
We are party to a variety of contractual agreements pursuant to which we may be obligated to indemnify the other party for certain matters. These contracts primarily relate to our commercial contracts, operating leases and other real estate contracts, trademarks, intellectual property, financial agreements and various other agreements. Under these agreements, we may provide certain routine indemnifications relating to representations and warranties (for example, ownership of assets, environmental or tax indemnifications) or personal injury matters. The terms of these indemnifications range in duration and may not be explicitly defined. We believe that if we were to incur a loss in any of these matters, the loss would not have a material effect on our financial statements.
We are liable for certain operating leases that were assigned to third parties. If any of these third parties fail to perform their obligations under the leases, we could be responsible for the lease obligation, including as a result of the economic dislocation caused by the response to the coronavirus (COVID-19) pandemic. See Note 13 - Commitments and contingencies and off balance sheet arrangements in our consolidated financial statements, included elsewhere in this prospectus, for additional information. Because of the wide dispersion among third parties and the variety of remedies available, we believe that if an assignee became insolvent it would not have a material effect on our financial condition, results of operations or cash flows.
In the ordinary course of business, we enter into various supply contracts to purchase products for resale and purchase and service contracts for fixed asset and information technology commitments. These contracts typically include volume commitments or fixed expiration dates, termination provisions and other standard contractual considerations.
Letters of Credit
We had letters of credit of $454.5 million outstanding as of February 29, 2020. The letters of credit are maintained primarily to support our performance, payment, deposit or surety obligations. We typically pay bank fees of 1.25% plus a fronting fee of 0.125% on the face amount of the letters of credit.
New Accounting Policies
See Note 1 - Description of business, basis of presentation and summary of significant accounting policies in our consolidated financial statements, included elsewhere in this prospectus, for new accounting pronouncements which have been adopted.
Critical Accounting Policies
The preparation of consolidated financial statements in conformity with GAAP requires management to make estimates and assumptions that affect the reported amounts of assets and liabilities and disclosure of contingent assets and liabilities as of the date of the consolidated financial statements and the reported amounts of revenues and expenses during the reporting period. Actual results could differ from those estimates.
We have chosen accounting policies that we believe are appropriate to report accurately and fairly our operating results and financial position, and we apply those accounting policies in a fair and consistent manner. See Note 1 - Description of business, basis of presentation and summary of significant accounting policies in our consolidated financial statements, included elsewhere in this prospectus, for a discussion of our significant accounting policies.
Management believes the following critical accounting policies reflect its more subjective or complex judgments and estimates used in the preparation of our consolidated financial statements.
74
Self-Insurance Liabilities
We are primarily self-insured for workers’ compensation, property, automobile and general liability. The self-insurance liability is undiscounted and determined actuarially, based on claims filed and an estimate of claims incurred but not yet reported. We have established stop-loss amounts that limit our further exposure after a claim reaches the designated stop-loss threshold. In determining our self-insurance liabilities, we perform a continuing review of our overall position and reserving techniques. Since recorded amounts are based on estimates, the ultimate cost of all incurred claims and related expenses may be more or less than the recorded liabilities.
Any actuarial projection of self-insured losses is subject to a high degree of variability. Litigation trends, legal interpretations, benefit level changes, claim settlement patterns and similar factors influenced historical development trends that were used to determine the current year expense and, therefore, contributed to the variability in the annual expense. However, these factors are not direct inputs into the actuarial projection, and thus their individual impact cannot be quantified.
Long-Lived Asset Impairment
We regularly review our individual stores’ operating performance, together with current market conditions, for indications of impairment. When events or changes in circumstances indicate that the carrying value of an individual store’s assets may not be recoverable, its future undiscounted cash flows are compared to the carrying value. If the carrying value of store assets to be held and used is greater than the future undiscounted cash flows, an impairment loss is recognized to record the assets at fair value. For property and equipment held for sale, we recognize impairment charges for the excess of the carrying value plus estimated costs of disposal over the fair value. Fair values are based on discounted cash flows or current market rates. These estimates of fair value can be significantly impacted by factors such as changes in the current economic environment and real estate market conditions. Long-lived asset impairment losses were $77.4 million, $36.3 million and $100.9 million in fiscal 2019, fiscal 2018 and fiscal 2017, respectively.
Business Combination Measurements
In accordance with applicable accounting standards, we estimate the fair value of acquired assets and assumed liabilities as of the acquisition date of business combinations. These fair value adjustments are input into the calculation of goodwill related to the excess of the purchase price over the fair value of the tangible and identifiable intangible assets acquired and liabilities assumed in the acquisition.
The fair value of assets acquired and liabilities assumed are determined using market, income and cost approaches from the perspective of a market participant. The fair value measurements can be based on significant inputs that are not readily observable in the market. The market approach indicates value for a subject asset based on available market pricing for comparable assets. The market approach used includes prices and other relevant information generated by market transactions involving comparable assets, as well as pricing guides and other sources. The income approach indicates value for a subject asset based on the present value of cash flows projected to be generated by the asset. Projected cash flows are discounted at a required market rate of return that reflects the relative risk of achieving the cash flows and the time value of money. The cost approach, which estimates value by determining the current cost of replacing an asset with another of equivalent economic utility, was used, as appropriate, for certain assets for which the market and income approaches could not be applied due to the nature of the asset. The cost to replace a given asset reflects the estimated reproduction or replacement cost for the asset, adjusted for obsolescence, whether physical, functional or economic.
Goodwill
As of February 29, 2020, our goodwill totaled $1.2 billion, of which $917.3 million related to our acquisition of Safeway. We review goodwill for impairment in the fourth quarter of each year, and also upon the
75
occurrence of triggering events. We perform reviews of each of our reporting units that have goodwill balances. We review goodwill for impairment by initially considering qualitative factors to determine whether it is more likely than not that the fair value of a reporting unit is less than its carrying amount, including goodwill, as a basis for determining whether it is necessary to perform a quantitative analysis. If it is determined that it is more likely than not that the fair value of a reporting unit is less than its carrying amount, a quantitative analysis is performed to identify goodwill impairment. If it is determined that it is not more likely than not that the fair value of the reporting unit is less than its carrying amount, it is unnecessary to perform a quantitative analysis. We may elect to bypass the qualitative assessment and proceed directly to performing a quantitative analysis.
In the second quarter of the fiscal year ended February 24, 2018, there was a sustained decline in the market multiples of publicly traded peer companies. In addition, during the second quarter of the fiscal year ended February 24, 2018, we revised our short-term operating plan. As a result, we determined that an interim review of the recoverability of our goodwill was necessary. Consequently, we recorded a goodwill impairment loss of $142.3 million, substantially all within the Acme reporting unit relating to the November 2015 acquisition of stores from the Great Atlantic & Pacific Tea Company, Inc., due to changes in the estimate of our long-term future financial performance to reflect lower expectations for growth in revenue and earnings than previously estimated. The goodwill impairment loss was based on a quantitative analysis using a combination of a discounted cash flow model (income approach) and a guideline public company comparative analysis (market approach).
Goodwill has been allocated to all of our reporting units, and none of our reporting units have a zero or negative carrying amount of net assets. As of February 29, 2020, there are two reporting units with no goodwill due to the impairment loss recorded during the second quarter of the fiscal year ended February 24, 2018. There are ten reporting units with an aggregate goodwill balance of $1,132.0 million, of which the fair value of each reporting unit was substantially in excess of its carrying value, which indicates a remote likelihood of a future impairment loss. There is one reporting unit with a goodwill balance of $51.3 million where it is reasonably possible that future changes in judgments, assumptions and estimates we made in assessing the fair value of the reporting unit could cause us to recognize impairment charges on a portion of the goodwill balance within the reporting unit. For example, a future decline in market conditions, continued underperformance of this reporting unit or other factors could negatively impact the estimated future cash flows and valuation assumptions used to determine the fair value of this reporting unit and lead to future impairment charges.
The annual evaluation of goodwill performed for our reporting units during the fourth quarters of fiscal 2019, fiscal 2018 and fiscal 2017 did not result in impairment.
Employee Benefit Plans
Substantially all of our employees are covered by various contributory and
non-contributory
pension, profit sharing or 401(k) plans, in addition to defined benefit plans for certain Safeway, Shaw’s and United employees. Certain employees participate in a long-term retention incentive bonus plan. We also provide certain health and welfare benefits, including short-term and long-term disability benefits to inactive disabled employees prior to retirement. Most union employees participate in multiemployer retirement plans pursuant to collective bargaining agreements, unless the collective bargaining agreement provides for participation in plans sponsored by us.We recognize a liability for the underfunded status of the defined benefit plans as a component of pension and post-retirement benefit obligations. Actuarial gains or losses and prior service costs or credits are recorded within Other comprehensive (loss) income. The determination of our obligation and related expense for our sponsored pensions and other post-retirement benefits is dependent, in part, on management’s selection of certain actuarial assumptions in calculating these amounts. These assumptions include, among other things, the discount rate and expected long-term rate of return on plan assets.
The objective of our discount rate assumptions was intended to reflect the rates at which the pension benefits could be effectively settled. In making this determination, we take into account the timing and amount of
76
benefits that would be available under the plans. We have elected to use a full yield curve approach in the estimation of service and interest cost components of net pension and other post-retirement benefit plan expense by applying the specific spot rates along the yield curve used in the determination of the projected benefit obligation to the relevant projected cash flows. We utilized weighted discount rates of 4.17% and 4.12% for our pension plan expenses for fiscal 2019 and fiscal 2018, respectively. To determine the expected rate of return on pension plan assets held by us for fiscal 2019, we considered current and forecasted plan asset allocations as well as historical and forecasted rates of return on various asset categories. Our weighted assumed pension plan investment rate of return was 6.36% and 6.38% for fiscal 2019 and fiscal 2018, respectively. See Note 11 - Employee benefit plans and collective bargaining agreements in our consolidated financial statements, included elsewhere in this prospectus, for more information on the asset allocations of pension plan assets.
Sensitivity to changes in the major assumptions used in the calculation of our pension and other post-retirement plan liabilities is illustrated below (dollars in millions).
Percentage Point Change | Projected Benefit Obligation Decrease / (Increase) | Expense Decrease / (Increase) | ||||||||||
Discount rate | + /- 1.00 | % | $ | 216.1 / $(265.4) | $ | 11.2 / $(11.3) | ||||||
Expected return on assets | + /- 1.00 | % | - / - | $ | 17.3 / $(17.3) | |||||||
In fiscal 2019 and fiscal 2018, we contributed $11.0 million and $199.3 million, respectively, to our pension and post-retirement plans. We expect to contribute $69.5 million to our pension and post-retirement plans in fiscal 2020.
Income Taxes and Uncertain Tax Positions
We review the tax positions taken or expected to be taken on tax returns to determine whether and to what extent a benefit can be recognized in our consolidated financial statements. See Note 10 - Income taxes in our consolidated financial statements, included elsewhere in this prospectus, for the amount of unrecognized tax benefits and other disclosures related to uncertain tax positions. Various taxing authorities periodically examine our income tax returns. These examinations include questions regarding our tax filing positions, including the timing and amount of deductions and the allocation of income to various tax jurisdictions. In evaluating these various tax filing positions, including state and local taxes, we assess our income tax positions and record tax benefits for all years subject to examination based upon management’s evaluation of the facts, circumstances and information available at the reporting date. For those tax positions where it is more likely than not that a tax benefit will be sustained, we have recorded the largest amount of tax benefit with a greater than 50% likelihood of being realized upon ultimate settlement with a taxing authority that has full knowledge of all relevant information. For those income tax positions where it is not more likely than not that a tax benefit will be sustained, no tax benefit has been recognized in our financial statements. A number of years may elapse before an uncertain tax position is examined and fully resolved. As of February 29, 2020, we are no longer subject to federal income tax examinations for fiscal years prior to 2012 and in most states, we are no longer subject to state income tax examinations for fiscal years before 2007. Tax years 2007 through 2018 remain under examination. The assessment of our tax position relies on the judgment of management to estimate the exposures associated with our various filing positions.
Quantitative and Qualitative Disclosures About Market Risk
We are exposed to market risk from a variety of sources, including changes in interest rates and commodity prices. We have from time to time selectively used derivative financial instruments to reduce these market risks. Our market risk exposures related to interest rates and commodity prices are discussed below.
77
Interest Rate Risk and Long-Term Debt
We are exposed to market risk from fluctuations in interest rates. We manage our exposure to interest rate fluctuations through the use of interest rate swaps. At the time of entering into interest rate swap contracts, our risk management objective and strategy is to utilize them to protect us against adverse fluctuations in interest rates by reducing our exposure to variability in cash flows relating to interest payments on a portion of our outstanding debt. We significantly reduced our exposure to changes in LIBOR, which is the designated benchmark we hedge, with the extinguishment of our term loan facility on February 5, 2020. See Note 7 - Long-term debt and finance lease obligations in our consolidated financial statements, included elsewhere in this prospectus, for additional information. In connection with the term loan extinguishment, we discontinued hedge accounting, and changes in the fair value of these instruments are recognized in earnings. We continue to make scheduled payments on the swaps that were previously designated as cash flow hedges of our term loan facility in accordance with the terms of the contracts.
As a result of the term loan extinguishment, our principal exposure to LIBOR now relates to our ABL Facility, and we believe a 100 basis point increase on our variable interest rates would not have a material impact our interest expense.
The table below provides information about our derivative financial instruments and other financial instruments that are sensitive to changes in interest rates, including debt instruments and interest rate swaps. For debt obligations, the table presents principal amounts due and related weighted average interest rates by expected maturity dates. For interest rate swaps, the table presents average notional amounts and weighted average interest rates by expected (contractual) maturity dates (dollars in millions):
Fiscal 2020 | Fiscal 2021 | Fiscal 2022 | Fiscal 2023 | Fiscal 2024 | Thereafter | Total | Fair Value | |||||||||||||||||||||||||
Long-Term Debt | ||||||||||||||||||||||||||||||||
Fixed Rate - Principal payments | $ | 138.0 | $ | 131.2 | $ | 751.1 | $ | 1.2 | $ | 1,267.2 | $ | 5,873.5 | $ | 8,162.2 | $ | 8,486.2 | ||||||||||||||||
Weighted average interest rate (1) | 3.97 | % | 4.76 | % | 3.50 | % | 5.22 | % | 6.66 | % | 5.81 | % | 5.68 | % | ||||||||||||||||||
| (1) | Excludes debt discounts and deferred financing costs. |
Pay Fixed / Receive Variable | ||||||||||||||||||||||||
Fiscal 2020 | Fiscal 2021 | Fiscal 2022 | Fiscal 2023 | Fiscal 2024 | Thereafter | |||||||||||||||||||
Interest Rate Swaps | ||||||||||||||||||||||||
Average Notional amount outstanding | $ | 1,957.0 | $ | 1,653.0 | $ | 593.0 | $ | 49.0 | $ | — | $ | — | ||||||||||||
Average pay rate | 2.82 | % | 2.83 | % | 2.94 | % | 2.94 | % | 0.0 | % | 0.0 | % | ||||||||||||
Average receive rate | .75 | % | .75 | % | .75 | % | .75 | % | 0.0 | % | 0.0 | % | ||||||||||||
Commodity Price Risk
We have entered into fixed price contracts to purchase electricity and natural gas for a portion of our energy needs. We expect to take delivery of these commitments in the normal course of business, and, as a result, these commitments qualify as normal purchases. We also manage our exposure to changes in diesel prices utilized in our distribution process through the use of short-term heating oil derivative contracts. These contracts are economic hedges of price risk and are not designated or accounted for as hedging instruments for accounting purposes. Changes in the fair value of these instruments are recognized in earnings. We do not believe that these energy and commodity swaps would cause a material change to our financial position.
78
BUSINESS
Our Company
We are one of the largest food retailers in the United States, with 2,252 stores across 34 states and the District of Columbia. We operate 20 iconic banners with on average 85 years of operating history, includingand, with approximately 270,000 talented and dedicated employees, as of February 29, 2020, who serve on average more than 33 million customers each week. Additionally, as of February 29, 2020, we operated 1,290operating structure empowers decision making at the local level, which we believe better serves our customers and communities, while also providing the systems, analytics and buying power afforded by an organization with national scale and $62.5 billion in annual sales. Throughout the coronavirus (COVID-19) pandemic, our highest priorities have been the safety of our associates and customers and maintaining the supply of product. During the first 8 weeks of fiscal 2020, we have delivered strong sales growth and increases in market share.
Albertsons, Safeway, Vons, Pavilions, Randalls, Tom Thumb, Carrs, Jewel-Osco, Acme, Shaw’s, Star Market, United Supermarkets, Market Street
Haggen
in-store
branded coffee shops, 402 adjacent fuel centers, 23 dedicated distribution centers, 20 manufacturing facilities and various online platforms. Our stores operate inFirst-and-Main
retail locations and have leading market share within attractive and growing geographies. We hold a #1 or #2 position by market share in 68% of the 121 MSAs in which we operate. Our portfolio of well-located, full-service stores provides the foundation of our omni-channel platform, including our rapidly growing Drive Up & Go curbside pickup, home delivery and rush delivery offerings. We seek to tailor our offerings to local demographics and preferences of the markets that we operate in. OurLocally Great, Nationally Strong
| | |||
We are focused on creating deep and lasting relationships with our customers by offering them an experience that is,and– wherever, whenever and however they choose to shop. We make lifefor our customers through a convenient and consistent shopping experience across our omni-channel network. Merchandising is at our core and we offer anand differentiated product assortment. We believe we are an industry leader in fresh, emphasizing organic, locally sourced and seasonal items as well as value-added services like dailyportfolio, which achieved over $13.1 billion in sales during fiscal 2019 and reached 25.4% sales penetration. Ourservice is embedded in our culture and enables us to build deep ties with our local communities.
Easy
Exciting
Friendly
Easy
Exciting
fresh-cut
fruit and vegetables, customized meat cuts and seafood varieties, made-from-scratch bakery items, prepared foods, deli and floral. We also continue to grow our innovative and distinctiveOwn Brands
Friendly
Our,andshopping experience, coupled with our nationwide, grocery and fuel rewards programs and pharmacy services, offers a differentiated value proposition to our customers. Theprogram has 20.7 million registered loyalty households which, we believe, provides us with a comprehensive understanding of our core shoppers. These loyalty programs and our omni-channel offerings combine to form an extended loyalty ecosystem that drives increased customer lifetime value through greater purchase frequency, larger basket size and higher customer retention.
Easy
Exciting
Friendly
just for U
just for U
Our Company has grown through a series of transformational acquisitions over the last six years, including our merger with Safeway in 2015 which gave us the benefits of national scale. While our banners have rich
79
histories, we are in many ways a young company. We have integrated systems and converted stores and distribution centers to create a common platform. We believe our common platform gives us greater transparency and compatibility across our network, allowing us to better serve our customers and employees while enhancing our supply chain.
We continue to sharpen ourpenetration and expand our omni-channel and digital capabilities. We have invested substantially in our business, deploying approximately $6.8 billion of capital expenditures beginning with fiscal 2015, including the $1.5 billion we spent in fiscal 2019. We used that capital to remodel existing stores, opportunistically build new stores and enhance our digital capabilities. We have also developed and begun to implement specific productivity initiatives across our business that target $1 billion of annual
in-store
execution, increase ourOwn Brands
run-rate
productivity benefits by the end of fiscal 2022 to help offset cost inflation, fund growth and drive earnings. While certain projects are well underway and contributing as expected, in other cases, we have temporarily paused some of our initiatives to ensure we are first taking care of our customers and our communities, while focusing on the safety of our associates during the coronavirus(COVID-19)
pandemic.We have enhanced our management team, adding executives with complementary backgrounds to position us well for the future, including our President and CEO, Vivek Sankaran, who joined the Company from PepsiCo in April 2019. In fiscal 2019, we also added Chris Rupp as Chief Customer & Digital Officer and Mike Theilmann as Chief Human Resources Officer. In addition, we have internally promoted and expanded the roles of certain key members of our leadership team, including Susan Morris, our Chief Operations Officer, and Geoff White, our Chief Merchandising Officer.
Our recent operational initiatives are driving positive financial momentum. We realized strong financial performance in fiscal 2019, generating net sales of $62.5 billion, Adjusted EBITDA of $2.8 billion and Adjusted Free Cash Flow of $1.4 billion. We have achieved nine consecutive quarters of positive identical sales growth. Adjusted EBITDA grew from $2.7 billion in fiscal 2018 to $2.8 billion in fiscal 2019 and we generated a cumulative $6.7 billion in Adjusted Free Cash Flow since the start of fiscal 2015. The momentum we are experiencing gives us confidence that ourandidentity resonates with customers. We believe our strategic framework will enable us to continue delivering profitable growth going forward.
Easy, Exciting
Friendly
Identical Sales | Net Income ($mm) | Adj. EBITDA ($mm) | ||
| | |
Cumulative Adjusted Free Cash Flow (in billions)
80
Drivers of Current Momentum
We have achieved significant near-term momentum in our business through a number of successful and ongoing initiatives, including the following:
Sharpened In-Store Execution.
in-store
execution and enhancing our customer experience to drive profitable growth. We have simplified our merchandising programs, automated ourfront-end
scheduling processes and expanded self-checkout in 533 additional stores during fiscal 2019. These enhancements have been instrumental in improving store-level productivity, allowing us to increase our focus on the customer. To further enhance the customer experience, we remerchandised over 850 stores since the beginning of fiscal 2017, reallocating space to better accentuate high growth fresh categories like produce, meat and seafood, bakery, prepared foods, deli and floral. This, coupled with our robust remodel program, has also allowed us to optimize store layouts and ease shopping patterns to make things simpler for customers and employees.Increased
Own Brands
Penetration.
Own Brands
Own Brands
Own Brands
Leading Omni-Channel Capabilities.
ready-to-eat
offerings. We now offer home delivery services across more than 2,000 of our stores and 12 of the country’s top 15 MSAs by population. The coronavirus (COVID-19) pandemic has significantly increased demand for food-at-home, particularly through our eCommerce offerings. As a result we have accelerated our Drive Up & Go build out and have made several enhancements to our eCommerce platform that we believe will meaningfully improve the overall customer experience and enable us to drive growth and market share. | | |
Investment in Stores and Technology Capabilities.
easy-to-use
customer-facing digital applications.Continued Focus on Productivity
.
run-rate
productivity benefits by the end of fiscal 2022 to help offset cost inflation, fund growth and drive earnings. These initiatives include a focus on enhancing store and distribution center operations, leveraging scale to buy better, increasing promotional effectiveness and leveraging general and administrative costs. For example, we implemented a shrink reduction program centered on the use of technology as well as employee and manager education. As a result, we successfully reduced shrink81
levels by approximately 45 basis points in fiscal 2019 over fiscal 2017. We also believe these productivity initiatives will drive tangible improvements in our customer satisfaction and customer service scores. While certain projects are well underway and contributing as expected, in other cases, we have temporarily paused some of our initiatives to ensure we are first taking care of our customers and our communities, while focusing on the safety of our associates during the coronavirus (COVID-19) pandemic.
Our Competitive Strengths
We are focused on driving deep and lasting relationships with our customers by delivering an
and
shopping experience. We believe the following competitive strengths will help us to achieve our goal:
Robust Portfolio of Stores and Iconic Banners with Leading Market Shares.
| • | Well-Known Banners |
| • | Prime Locations First-and-Main locations, providing our customers with exceptional convenience. Our owned and ground leased stores and distribution centers, which represent approximately 39% of our store and distribution base, have an aggregate appraised value of $11.2 billion. |
| • | Strong Market Share and Local Market Density |
| • | Highly Attractive Markets one-third of the U.S. population and approximately 45% of U.S. GDP. In 60% of the 121 MSAs in which we operate, the projected population growth over the next five years, in aggregate, exceeds the national average by over 60%. |
82
The following illustrative map represents our regional banners and combined store network as of February 29, 2020.

1
Nielsen ACView based on food markets in Company operating geographies as of calendar fourth quarter 2019.Differentiated and Exciting Merchandise Offering.
Exciting
in-store
fresh-cut
fruit,in-store
preparedready-to-cook
vegetables and fresh-made guacamole. In meat and seafood, we featurebest-in-class
full service butcher blocks that highlightcustom-cut
USDA Choice and Prime beef, ground chicken and pork, seasonal smoked meats like sausages and bacon,Open Nature
grass-fed
beef, lamb and wild-caught Alaskan salmon as well as a wide range of responsibly sourced waterfront bistro shrimp. Our bakeries feature scratch-made pastries, artisan breads, and cakesdesigned-to-order
by trained 5 Star decorators. Our prepared foods includeready-to-eat,
ready-to-heat,
andready-to-cook
meal solutions that encompass everything from family favorites to a wide range of world cuisine offerings. Our fresh offerings are complemented by strong specialty assortments. These include our curated wine selections and artisan cheese shops. As our customers demand healthy options and product transparency, we have grown our natural and organic sales nearly twice as fast as the rest of the store during fiscal 2019, with sales penetration of approximately 13% for the same period. | | | | |
83
High-Quality Own Brands That Deliver Great Value.
Own Brands
Own Brands
Own Brands
Own Brands
Value Corner
Signature Reserve
Own Brands
Lucerne
Signature Select
Signature
Café
O Organics
Own Brands
Own Brands
Own Brands
Own Brands
top-line
growth and margin expansion. Sustainability is also a top priority with ourOwn Brands
Own Brands
|
|
Integrated Omni-Channel Solutions.
Drive Up & Go
| • Currently available in approximately 650 locations, with plans to grow to 1,600 locations in the next two years• Easy-to-use mobile app• Convenient, well-signed, curbside pickup |
Home Delivery
| • First launched home delivery services in 2001• Provide home delivery using our own “white glove” delivery service in approximately 60% of our stores• Operate over 1,000 multi-temperature delivery trucks to support home delivery growth• Successful roll out of new eCommerce website and mobile applications to all divisions |
84
Rush Delivery
| • Launched rush delivery in 2017 with Instacart• Delivery within one to two hours in all divisions and covering over 2,000, or nearly 90%, of our stores offered in collaboration with third parties• Partnership with Grubhub and Uber Eats adds delivery offerings for our prepared andready-to-eat options from our stores |
Strong Relationships with Loyal Customers.
just for U
just for U
just for U
Engagement in Enhanced Loyalty Ecosystem Increases Customer Lifetime Value
Note: Charts above based on data from a single market division and reflect indexed annual grocery spend and lifetime value versus store-only shoppers who do not participate in our loyalty ecosystem.
1
Programs are just for U, grocery and fuel rewards, pharmacy services, Drive Up & Go and home delivery.2
Defined as annual average gross profit multiplied by average years shopping.Disciplined Approach to Capital Investment and Strong Adjusted Free Cash Flow and Balance Sheet.
New Best-In-Class Leadership with a Fresh Perspective.
85
Financial Officer, Susan Morris, our Chief Operations Officer, and Geoff White, our recently appointed Chief Merchandising Officer. Geoff most recently served as President of ourteam, where he grew sales penetration to 25.4% in fiscal 2019. In addition, in fiscal 2019, we added Chris Rupp, our Chief Customer & Digital Officer, who brings a mix of retail, eCommerce, and business innovation experience from both Amazon and Microsoft, and Mike Theilmann, our Chief Human Resources Officer, who has nearly 30 years of experience at companies including Yum and Heidrick & Struggles. These enhancements to our leadership team bring us a strong blend of new perspective and industry knowledge.
Own Brands
Our team believes in the power of ourapproach. We empower our operators to take ownership of local merchandising and
Locally Great, Nationally Strong
in-store
execution. This enables our local managers to select the best product assortments for their communities, provide a heightened level of customer service and drive improved store performance. This localized approach has been such an important part of our heritage and success.Our Strategic Framework
We are focused on providing our customers with an
and
shopping experience. We support our identity through a strategic framework that rests on four key pillars:
,
,
and
.
Growth:
We are well-positioned to accelerate the profitable growth of our business through both our stores and our broader omni-channel network:
| • | Achieve More Identical Sales Growth From Our Stores |
| • | Merchandising Excellence Exciting re-merchandised more than 850 stores and plan to expand this successful program. |
| • | Pricing and Promotions |
| • | Operating Excellence in-store efficiency by using technology to optimize labor and improvein-stock and display execution, resulting in enhanced store productivity and customer satisfaction. A number of these initiatives are already underway. In stores where we have introduced computer-assisted ordering and production systems, for example, we have seen a meaningful uplift in sales and improved levels ofin-stocks, inventory and shrink. |
| • | Culture of Exceptional Service in-store technology to achieve labor efficiencies through the automation ofnon-customer-facing tasks. We expect this effort to provide our associates more time to better serve customers, enhancing the shopping experience and driving purchase frequency, larger basket size, customer satisfaction and retention. |
| • | Targeted Store Remodels Easy |
86
Exciting Friendly |
| • | Drive Incremental eCommerce Growth: a strong growth engine that drives incremental sales. We plan to sustain our eCommerce growth through a number of initiatives. First, we will extend our Drive Up & Go pickup service to approximately 1,600 locations in the next two years. The coronavirus (COVID-19) pandemic has driven significant eCommerce volumes that have caused us to accelerate our omni-channel investments and our Drive Up & Go build out. Additionally, we are refreshing our entire digital interface to create a more personalized, easy-to-use and fully-integrated digital experience. We are improving our mobile applications to enable more personalized rewards and services like advanced basket-building tools and product, meal and recipe recommendations. We are further integrating our digital andin-store models to better drive existing customer engagement and new customer trial for our own and third-party delivery. |
| • | Accelerate Own Brand Penetration Own Brands Own Brands Own Brands |
| • | Increase Customer Engagement and Lifetime Value: just for U just for U |
Productivity:
run-rate
productivity benefits by the end of fiscal 2022. This will help us to offset cost inflation, fund growth and drive earnings. Our initiatives include the following:| • | Enhancing Store and DC Operations: non-customer-facing tasks and drive labor productivity. For example, we are working to roll out enhanced demand forecasting and replenishment systems to improve operating efficiency, reduce product waste and optimize labor and inventory levels. We expect to scale these opportunities across the business quickly and efficiently. |
| • | Leveraging Scale to Buy Better: |
| • | Increasing Promotional Effectiveness: |
| • | Leveraging G&A: . |
87
While certain projects are well underway and contributing as expected, in other cases, we have temporarily paused some of our initiatives to ensure we are first taking care of our customers and our communities, while focusing on the safety of our associates during the coronavirus (COVID-19) pandemic.
Technology:
Technology underpins everything we do and is a crucial enabler for our strategy for growth and productivity. Since 2015, we have invested $1.25 billion in technology. We are continuing to modernize the key elements of our firm-wide technology infrastructure, including the following core efforts: transition to the Cloud, modernize edge computing and network infrastructure, expand our enterprise data model in the Cloud, use robotics and process automation, leverage data science and artificial intelligence and continually enhance security. We believe that this modern infrastructure will provide a foundation to accelerate technology-based enhancements for our customers, store operations, merchandising and supply chain:| • | Customers: check-out processes and improve ourat-store pickup experience. For example, we are partnering with Adobe to provide an artificial intelligence-powered solution to personalize the website and mobile application experience. This will enable the customer to see personalized products and information as they browse homepages, categories and product detail pages. |
| • | Store Operations: forecasting and replenishment tools such as computer-assisted ordering and production systems should sharpen our ability to predict store demand and track perpetual inventory, helping us to reduce out-of-stocks, inventory, and shrink. |
Additionally, we have begun to introduce
in-store
micro-fulfilment centers (MFCs) to provide enhanced capabilities for last-mile delivery that leverage our well-located store base as the distribution point for online orders. Early learnings from our partnership with Takeoff Technologies indicate improved picking efficiency by more than seven times compared toin-store
services as well as better inventory management andon-time
delivery. We plan to have 10 more MFCs operating within the next two years, in addition to the two operating today. | |
| • | Merchandising: |
| • | Supply Chain: |
88
| science analytics that will be integrated with our enterprise data model. These elements will work to drive labor productivity and speed efficiencies, while reducing inventory and shrink. |
Talent and Culture:
Our service-oriented frontline associates are at the heart of our Company. As part of our Locally Great, Nationally Strong approach, we will continue to invest in and instill an ownership mentality in our store operators.Across all segments of our business, our associates seek to deliver for our customers, our community, and our Company through their sales and service focus. We seek to celebrate the diversity and inclusiveness of our workforce and focus on improving our communities through sustainability and charitable activities that are an essential part of our business. As we leverage our national scale for efficiencies, we will continue to empower store-level decision makers to take care of our customers and encourage frontline responsibility. We will also continue to nurture an ownership mindset in our stores and ensure that the interests of those who directly manage our customer relationships on a daily basis are aligned with those of our stockholders.
| |
Our Industry
We operate in the $1.1 trillion U.S. food retail industry, a highly fragmented sector with a large number of companies competing locally and a growing array of companies with a national footprint, including traditional supermarkets, pharmacies and drug stores, convenience stores, warehouse clubs and supercenters. The industry has also seen the widespread introduction of “limited assortment” retail stores, as well as local chains and stand-alone stores that cater to the individual cultural preferences of specific neighborhoods. Despite this, large, national grocers have increased market share over time as scale remains an important advantage in offering customers a modern and attractive shopping experience. Between 2013 and 2018, the share of the top 10 food retail companies increased from 44% to 55% on the basis of industry retail sales. While brick and mortar stores account for approximately 95% of industry sales, eCommerce offerings have been expanding as a result of new pure-play internet-based companies as well as established players expanding omni-channel options. Other trends in the industry include changing consumer tastes, preferences (including those relating to sustainability of product sources) and spending patterns. See “Risk Factors—Risks Related to Our Business and Industry—We may not timely identify or effectively respond to consumer trends, which could negatively affect our relationship with our customers, the demand for our products and services and our market share.”
From 2014 through 2019, food retail industry revenues increased by $29 billion, driven in part by economic growth, favorable consumer dynamics and a consumer shift to premium and organic brands. Both inflation and deflation affect our business. After a period of food deflation in 2016 and 2017, the
Food-at-Home
Consumer Price Index increased by 0.4% in 2018 and 0.9% in 2019 and is expected to increase between 0.5% and 1.5% in 2020, and U.S. GDP is expected to increase by 2.1% in 2020. In addition to macroeconomic factors, the following trends, in particular, are expected to drive sales across the industry:| • | Customer Focus on Fresh, Natural and Organic Offerings. |
89
| quality of their fresh, natural, meal replacement and organic offerings. This, in turn, has resulted in the increasing convergence of product selections between conventional and alternative format food retailers. |
| • | Omni-Channel Convenience as a Differentiator in-store experience as well as online, home delivery, pickup and digital shopping solutions in order to differentiate themselves from competitors.In-store amenities and services, including store-within-store sites such as restaurants, coffee bars, fuel centers, banks and ATMs, meal kits and prepared meals have become increasingly commonplace. |
| • | Expansion of Private Label Offerings. |
| • | Loyalty Programs and Personalization. in-store. |
Competition
The food and drug retail industry is highly competitive. The principal competitive factors that affect our business are location, quality, price, service, selection, convenience and condition of assets such as our stores. The operating environment for the food and drug retailing industry continues to be characterized by intense competition, aggressive expansion, increasing specialization of retail and online formats, entry of
non-traditional
competitors and consolidation.We face intense competition from other food and/or drug retailers, supercenters, club stores, online retailers, specialty and niche supermarkets, “limited assortment” stores, drug stores, general merchandisers, wholesale stores, discount stores, convenience stores, natural food stores, farmers’ markets, local chains and stand-alone stores that cater to the individual cultural preferences of specific neighborhoods, restaurants and a growing number of internet-based home delivery and meal solution companies. We and our competitors engage in price and
non-price
competition which, from time to time, has adversely affected our operating margins.For more information on the competitive pressures that we face, see “Risk Factors—Risks Related to Our Business and Industry—Competition in our industry is intense, and our failure to compete successfully may adversely affect our profitability and results of operations” and “Risk Factors—Risks Related to Our Business and Industry—We may not timely identify or effectively respond to consumer trends, which could negatively affect our relationship with our customers, the demand for our products and services and our market share.”
Seasonality
Our business is generally not seasonal in nature, but a larger share of annual revenues may be generated in our fourth quarter due to the major holidays in November and December.
Employees
We believe that our relations with our employees are good. As of February 29, 2020, we employed approximately 270,000 full- and part-time employees, including approximately 185,000 covered by collective bargaining agreements. During fiscal 2019, collective bargaining agreements covering approximately 57,000
90
employees were renegotiated. Collective bargaining agreements covering approximately 45,000 employees have expired or are scheduled to expire in fiscal 2020. We have sought to actively manage our participation in multiemployer pension plans through negotiations with union officials, pension plan trustees, other contributing employers and the PBGC. During fiscal 2019, we reached a collective bargaining agreement covering our Acme division that freezes new benefit accruals under the UFCW and Food Industry Employers
Tri-State
Pension Plan. The new agreement provides for future retirement benefits to be provided by a 401(k) defined contribution plan, and partially funded by reductions in health care costs. We also reached an agreement for our Seattle division with union representatives, plan trustees and another major contributing employer to freeze new benefit accruals under the Sound Retirement Trust Pension Plan. The new agreement provides for future retirement benefits to be provided under a new variable defined benefit plan that reduces our exposure to investment underperformance, and partially funded by reductions in health care contributions. We also agreed to a new collective bargaining agreement with various local unions relating to our Southern California division that is expected to enable the Southern California UFCW Union Joint Pension Plan to achievenon-distressed,
or “Green,” status under the PPA within six years.We are the second largest contributing employer to FELRA and to MAP. FELRA is currently projected by FELRA to become insolvent in the first quarter of 2021. We continue to fund all of our required contributions to FELRA and MAP. On March 5, 2020, we agreed with the two applicable local unions to new collective bargaining agreements pursuant to which we contribute to FELRA and MAP. See “Risk Factors—Risks Related to Our Business and Industry—A significant majority of our employees are unionized, and our relationship with unions, including labor disputes or work stoppages, could have an adverse impact on our operations and financial results” and “Risk Factors—Risks Related to Our Business and Industry—Increased pension expenses, contributions and surcharges may have an adverse impact on our financial results.”
Properties
As of February 29, 2020, we operated 2,252 stores located in 34 states and the District of Columbia as shown in the following table:
Location | Number of stores | Location | Number of stores | Location | Number of stores | |||||||||||
Alaska | 26 | Iowa | 1 | North Dakota | 1 | |||||||||||
Arizona | 134 | Louisiana | 16 | Oregon | 122 | |||||||||||
Arkansas | 1 | Maine | 21 | Pennsylvania | 50 | |||||||||||
California | 592 | Maryland | 65 | Rhode Island | 8 | |||||||||||
Colorado | 105 | Massachusetts | 76 | South Dakota | 3 | |||||||||||
Connecticut | 4 | Montana | 38 | Texas | 208 | |||||||||||
Delaware | 18 | Nebraska | 5 | Utah | 6 | |||||||||||
District of Columbia | 11 | Nevada | 50 | Vermont | 19 | |||||||||||
Hawaii | 23 | New Hampshire | 26 | Virginia | 38 | |||||||||||
Idaho | 42 | New Jersey | 73 | Washington | 219 | |||||||||||
Illinois | 183 | New Mexico | 34 | Wyoming | 14 | |||||||||||
Indiana | 4 | New York | 16 | |||||||||||||
The following table summarizes our stores by size as of February 29, 2020:
Square Footage | Number of stores | Percent of total | ||||||
Less than 30,000 | 204 | 9.1 | % | |||||
30,000 to 50,000 | 784 | 34.8 | % | |||||
More than 50,000 | 1,264 | 56.1 | % | |||||
Total stores | 2,252 | 100.0 | % | |||||
91
We own or ground lease approximately 39% of our operating stores and 52% of our industrial properties (distribution centers, warehouses and manufacturing plants). Our total owned and ground leased properties have a value of approximately $11.2 billion, based on appraisals of our real estate conducted by Cushman and Wakefield, Inc. during fiscal 2019, after taking into account asset sales of properties since the respective dates of the appraisals.
Our corporate headquarters are located in Boise, Idaho. We own our headquarters. The premises is approximately 250,000 square feet in size. In addition to our corporate headquarters, we have corporate offices in Pleasanton, California and Phoenix, Arizona. We believe our properties are well maintained, in good operating condition and suitable for operating our business.
Segments
We are engaged in the operation of food and drug retail stores that offer grocery products, general merchandise, health and beauty care products, pharmacy, fuel and other items and services. Our retail operating divisions are geographically based, have similar economic characteristics and similar expected long-term financial performance. Our operating segments and reporting units are made up of 13 divisions, which are reported in one reportable segment. Each reporting unit constitutes a business for which discrete financial information is available and for which management regularly reviews the operating results. Across all operating segments, the Company operates primarily one store format. Each division offers, through its stores and eCommerce channels, the same general mix of products with similar pricing to similar categories of customers, have similar distribution methods, operate in similar regulatory environments and purchase merchandise from similar or the same vendors.
Products
Our stores offer grocery products, general merchandise, health and beauty care products, pharmacy, fuel and other items and services. We are not dependent on any individual supplier; only one third-party supplier represented more than 5% of our sales for fiscal 2019. The following table represents sales revenue by similar type of product (in millions). Year over year increases in volume reflect acquisitions as well as identical sales growth.:
Fiscal 2019 | Fiscal 2018 | Fiscal 2017 | ||||||||||||||||||||||
Amount (1) | % of Total | Amount (1) | % of Total | Amount (1) | % of Total | |||||||||||||||||||
Non-perishables (2) | $ | 27,165.3 | 43.5 | % | $ | 26,371.8 | 43.6 | % | $ | 26,522.0 | 44.3 | % | ||||||||||||
Perishables (3) | 25,681.8 | 41.1 | % | 24,920.9 | 41.2 | % | 24,583.7 | 41.0 | % | |||||||||||||||
Pharmacy | 5,236.8 | 8.4 | % | 4,986.6 | 8.2 | % | 5,002.6 | 8.3 | % | |||||||||||||||
Fuel | 3,430.4 | 5.5 | % | 3,455.9 | 5.7 | % | 3,104.6 | 5.2 | % | |||||||||||||||
Other (4) | 940.8 | 1.5 | % | 799.3 | 1.3 | % | 711.7 | 1.2 | % | |||||||||||||||
Total (5) | $ | 62,455.1 | 100.0 | % | $ | 60,534.5 | 100.0 | % | $ | 59,924.6 | 100.0 | % | ||||||||||||
| (1) | eCommerce related sales are included in the categories to which the revenue pertains. |
| (2) | Consists primarily of general merchandise, grocery and frozen foods. |
| (3) | Consists primarily of produce, dairy, meat, deli, floral and seafood. |
| (4) | Consists primarily of wholesale revenue to third parties, commissions and other miscellaneous revenue. |
| (5) | Fiscal 2019 includes approximately $1.1 billion of incremental Net sales and other revenue due to the additional 53rd week. |
92
Distribution
As of February 29, 2020, we operated 23 strategically located distribution centers, approximately 39% of which are owned or ground-leased. Our distribution centers collectively provide approximately 65% of all products to our retail operating areas.
Merchandising and Manufacturing
We offer more than 12,000 high-quality products under ourportfolio. Ourproducts resonate well with our shoppers as evidenced bysales of over $13.1 billion in fiscal 2019. Year over year, we have demonstrated significant progress and increased sales penetration ofby 30 basis points to 25.4%, excluding pharmacy, fuel and
Own Brands
Own Brands
Own Brands
Own Brands
in-store
branded coffee sales.Own Brands
Own Brands
O Organics
Open Nature
Own Brands
As measured by units for fiscal 2019, 10.2% of ourmerchandise was manufactured in Company-owned facilities, and the remainder of ourmerchandise was purchased from third parties. We closely monitorportfolio. As of February 29, 2020, we operated 20 food production plants. These plants consisted of seven milk plants, four soft drink bottling plants, three bakery plants, two ice cream product plants, two grocery/prepared food plants, one ice plant and one soup plant.
Own Brands
Own Brands
make-versus-buy
decisions on internally sourced products to optimize their quality and profitability. In addition, we believe that our scale will provide opportunities to leverage our fixed manufacturing costs in order to drive innovation across ourOwn Brands
Marketing, Advertising and Online Sales
Our marketing efforts involve collaboration between our national marketing and merchandising team and local divisions and stores. We augment the local division teams with corporate resources and are focused on providing expertise, sharing best practices and leveraging scale in partnership with leading consumer packaged goods vendors. Our corporate teams support divisions by providing strategic guidance in order to drive key areas of our business, including pharmacy, general merchandise and our. Our local marketing teams set brand strategy and communicate brand messages through our integrated digital and physical marketing and advertising channels. We operate in 121 MSAs and are ranked #1 or #2 by market share in 68% of these markets. We maintain price competitiveness through systematic, selective and thoughtful price investment to drive customer traffic and basket size. We also use ourloyalty program, including both personalized deals and digital coupons as well as gas and grocery rewards, to target promotional activity and improve our customers’ experience. We have 20.7 million households currently enrolled in our loyalty program, through which we generate almost 400 million personalized promotions per week. We have achieved significant success with active participants in ourprogram, which have sales approximately 3.8x larger than
Own Brands
just for U
just for U
non-participants.
We have recently deployed and are continuing to refine cloud-based enterprise solutions to quickly process proprietary customer, product and transaction data and efficiently provide our local managers with targeted marketing strategies for customers in their communities. By leveraging customer and transaction information with data driven analytics, our “personalized deal engine” is able to select, out of the thousands of different promotions offered by our suppliers, the offers that we expect will be most compelling to each of our93
more than 33 million weekly customers. In addition, we use data analytics to optimize shelf assortment and space in our stores by continually and systematically reviewing the performance of each product.
Raw Materials
Various agricultural commodities constitute the principal raw materials used by us in the manufacture of our food products. We believe that raw materials for our products are not in short supply, and all are readily available from a wide variety of independent suppliers.
Environmental Laws
Our operations are subject to regulation under environmental laws, including those relating to waste management, air emissions and underground storage tanks. In addition, as an owner and operator of commercial real estate, we may be subject to liability under applicable environmental laws for
clean-up
of contamination at our facilities. Compliance with, andclean-up
liability under, these laws has not had and is not expected to have a material adverse effect upon our business, financial condition, liquidity or operating results. See “—Legal Proceedings” and “Risk Factors—Risks Related to Our Business and Industry—Unfavorable changes in, failure to comply with or increased costs to comply with environmental laws and regulations could adversely affect us. The storage and sale of petroleum products could cause disruptions and expose us to potentially significant liabilities.”Legal Proceedings
We are subject from time to time to various claims and lawsuits arising in the ordinary course of business, including lawsuits involving trade practices, lawsuits alleging violations of state and/or federal wage and hour laws (including alleged violations of meal and rest period laws and alleged misclassification issues), real estate disputes as well as other matters. Some of these suits purport or may be determined to be class actions and/or seek substantial damages. It is the opinion of our management that although the amount of liability with respect to certain of the matters described herein cannot be ascertained at this time, any resulting liability of these and other matters, including any punitive damages, will not have a material adverse effect on our business or financial condition.
We continually evaluate our exposure to loss contingencies arising from pending or threatened litigation and believe we have made provisions where the loss contingency can be reasonably estimated and an adverse outcome is probable. Nonetheless, assessing and predicting the outcomes of these matters involves substantial uncertainties. Management currently believes that the aggregate range of reasonably possible loss for our exposure in excess of the amount accrued is expected to be immaterial to us. It remains possible that despite management’s current belief, material differences in actual outcomes or changes in management’s evaluation or predictions could arise that could have a material effect on our financial condition, results of operations or cash flows.
Office of Inspector General:
Civil Investigative Demands:
94
relating to our influenza vaccination programs. The investigation concerns whether our provision of store coupons to our customers who received influenza vaccinations in our store pharmacies constituted an improper benefit to those customers under the federal Medicare and Medicaid programs. We believe that our provision of the store coupons to our customers is an allowable incentive to encourage vaccinations. We cooperated with the U.S. Attorney in the investigation. We are currently unable to determine the probability of the outcome of this matter or the range of possible loss, if any.
We have received a civil investigative demand dated February 28, 2020 from the United States Attorney for the Southern District of New York in connection with a False Claims Act investigation relating to our dispensing practices regarding insulin pen products. The investigation seeks documents regarding our policies, practices and procedures, as well as dispensing data, among other things. We will cooperate with the U.S. Attorney in the investigation. We are currently unable to determine the probability of the outcome of this matter or the range of possible loss, if any.
Terraza/Lorenz:
False Claims Act
United States ex rel. Schutte and Yarberry v. SuperValu, New Albertson’s, Inc., et al,
United States ex rel. Proctor v. Safeway
95
matters and believe each of these cases is without merit. We have recorded an estimated liability for these matters.
We were also subject to another FCA qui tam action entitled United States ex rel.. In that case, the relators alleged that Albertsons overcharged federal healthcare programs by not providing the government, as a part of its usual and customary prices to the government, the benefit of discounts given to customers who enrolled in the Albertsons discount-club program. The complaint was originally filed under seal and amended on June 20, 2017. On December 17, 2018, the case was dismissed, without prejudice.
Zelickowski v. Albertson’s LLC
Alaska Attorney General’s Investigation:
Opioid Litigation:
State of New Mexico v. Purdue Pharma L.P., et al.
California Air Resources Board:
FACTA:
Martin v. Safeway
96
MANAGEMENT
Executive Officers and Directors
The following table sets forth information regarding our executive officers and directors upon completion of this offering:
Name | Age † | Position | ||||
Vivek Sankaran | 57 | President, Chief Executive Officer and Director | ||||
James L. Donald | 66 | Co-Chairman | ||||
Leonard Laufer (c) | 54 | Co-Chairman | ||||
Susan Morris | 51 | Executive Vice President and Chief Operations Officer | ||||
Anuj Dhanda | 57 | Executive Vice President and Chief Information Officer | ||||
Robert B. Dimond | 58 | Executive Vice President and Chief Financial Officer | ||||
Michael Theilmann | 56 | Executive Vice President and Chief Human Resources Officer | ||||
Geoff White | 54 | Executive Vice President and Chief Merchandising Officer | ||||
Christine Rupp | 51 | Executive Vice President and Chief Customer and Digital Officer | ||||
Justin Ewing | 51 | Executive Vice President, Corporate Development and Real Estate | ||||
Robert A. Gordon | 68 | Executive Vice President, General Counsel and Secretary | ||||
Sharon L. Allen* (a)(b) | 68 | Director | ||||
Steven A. Davis* (d)(e) | 61 | Director | ||||
Kim Fennebresque* (b)(d) | 70 | Director | ||||
Allen M. Gibson* (a) | 54 | Director | ||||
Hersch Klaff (e) | 66 | Director | ||||
Jay L. Schottenstein | 65 | Director | ||||
Alan H. Schumacher* (d) | 73 | Director | ||||
Lenard B. Tessler (a)(b) | 67 | Director | ||||
B. Kevin Turner (c) | 55 | Vice Chairman | ||||
| † | As of May 4, 2020 |
| * | Independent Director |
| (a) | Member, Nominating and Corporate Governance Committee |
| (b) | Member, Compensation Committee |
| (c) | Member, Technology Committee |
| (d) | Member, Audit and Risk Committee |
| (e) | Member, Compliance Committee |
Biographies
Vivek Sankaran
President, Chief Executive Officer and Director.
Frito-Lay
North America(“Frito-Lay”).
There he led PepsiCo, Inc.’s (“PepsiCo”) snack and convenient foods business. Prior to that, Mr. Sankaran served as President and Chief Operating Officer ofFrito-Lay
from April 2016 to December 2018; Chief Operating Officer ofFrito-Lay
from February 2016 to April 2016; Chief Commercial Officer, North America of PepsiCo from 2014 to February 2016, where he led PepsiCo’s cross-divisional performance across its North American customers; Chief Customer Officer ofFrito-Lay
from 2012 to 2014; Senior Vice President and General Manager ofFrito-Lay’s
South business unit from 2011 to 2012; and Senior Vice President, Corporate Strategy and Development of PepsiCo from 2009 to 2010. Before joining PepsiCo in 2009, Mr. Sankaran was a partner at McKinsey and Company, where he served various Fortune 100 companies, bringing a strong focus on strategy and operations. Mr. Sankaranco-led
the firm’s North American purchasing and supply management practice and was on the leadership team of the North American retail practice. Mr. Sankaran has an MBA from the University of Michigan, a master’s degree in manufacturing from the97
Georgia Institute of Technology and a bachelor’s degree in mechanical engineering from the Indian Institute of Technology in Chennai.
James L. Donald
Co-Chairman
Co-Chairman
since April 2019. Prior to that, Mr. Donald served as our President and Chief Executive Officer since September 2018 and, prior to that, served as President and Chief Operating Officer since joining ACI in March 2018. Previously, Mr. Donald served as Chief Executive Officer and Director of Extended Stay America, Inc., a large North American owner and operator of hotels, and its subsidiary, ESH Hospitality, Inc. (together with Extended Stay America, Inc., “ESH”), from February 2012 to July 2015, and as Senior Advisor of ESH from August 2015 to December 2015. Prior to joining ESH, Mr. Donald served as President, Chief Executive Officer and Director of Starbucks Corporation, President and Chief Executive Officer of regional food and drug retailer Haggen Food & Pharmacy, Chairman, President and Chief Executive Officer of regional food and drug retailer Pathmark Stores, Inc., and in a variety of other senior and executive roles atWal-Mart
Stores, Inc., Safeway Inc. and Albertson’s, Inc. Mr. Donald began his grocery and retail career in 1971 with Publix Super Markets, Inc. Mr. Donald has served on the board of directors of Nordstrom, Inc., a leading fashion retailer, since April 2020, on the Advisory Board of Jacobs Holding AG, a Switzerland-based global investment firm, since 2015, and as a member of the board of directors at Barry Callebaut AG, a Switzerland-based manufacturer of chocolate and cocoa, from 2008 to 2018.Leonard Laufer
Co-Chairman
Co-Chairman
since April 2019 and has been a member of our board of directors since October 2018. Mr. Laufer has served as Senior Managing Director at Cerberus and Chief Executive Officer of Cerberus Technology Solutions (“CTS”) since May 2018. From March 2013 to May 2018, Mr. Laufer served as Managing Director and Head of Intelligent Solutions at JPMorgan Chase & Co. Prior to JPMorgan and from March 1997 to February 2013, Mr. Lauferco-founded
and served as Chief Executive Officer and Managing Member of Argus Information and Advisory Services, LLC a provider of informational and analytical solutions to the payment industry that was purchased by Verisk Analytics in August 2012. Mr. Laufer’s leadership roles at Cerberus and his knowledge of technology and information solutions provides critical skills for our board of directors to oversee our strategic planning and operations.Susan Morris
Executive Vice President and Chief Operations Officer.
Anuj Dhanda
Executive Vice President and Chief Information Officer.
Robert B. Dimond
Executive Vice President and Chief Financial Officer.
98
Wild Oats, Group Vice President and Chief Financial Officer for the western region of Kroger, Group Vice President and Chief Financial Officer of Fred Meyer, Inc. and as Vice President, Administration and Controller for Smith’s Food and Drug Centers Inc., a regional supermarket chain. Mr. Dimond is a Certified Public Accountant.
Michael Theilmann
Executive Vice President & Chief Human Resources Officer
Geoff White
Executive Vice President and Chief Merchandising Officer
Own
Brands
Christine Rupp
Executive Vice President and Chief Customer and Digital Officer
,
Justin Ewing
Executive Vice President, Corporate Development and Real Estate
Robert A. Gordon
Executive Vice President, General Counsel and Secretary
Sharon L. Allen
Director
99
worked at Deloitte for nearly 40 years in various leadership roles, including partner and regional managing partner, and was previously responsible for audit and consulting services for a number of Fortune 500 and large private companies. Ms. Allen is currently an independent director of Bank of America Corporation. Ms. Allen has also served as a director of First Solar, Inc. since 2013. Ms. Allen is a Certified Public Accountant (Retired). Ms. Allen’s extensive leadership, accounting and audit experience broadens the scope of our board of directors’ oversight of our financial performance and reporting and provides our board of directors with valuable insight relevant to our business.
Steven A. Davis
Director.
drive-in
restaurants, since January 2017, Marathon Petroleum Corporation, a petroleum refiner, marketer, retailer and transporter, since 2013, Walgreens Boots Alliance, Inc. (formerly Walgreens Co.), apharmacy-led
wellbeing enterprise, from 2009 to 2015, and CenturyLink, Inc. (formerly Embarq Corporation), a provider of communication services, from 2006 to 2009. Prior to joining Bob Evans Farms, Inc. in 2006, Mr. Davis served in a variety of restaurant and consumer packaged goods leadership positions, including president of Long John Silver’s LLC and A&W Restaurants, Inc. In addition, he held executive and operational positions at Yum! Brands, Inc.’s Pizza Hut division and at Kraft General Foods Inc. Mr. Davis has served as a member of the international board of directors for the Juvenile Diabetes Research Foundation since June 2016. Mr. Davis brings to our board of directors extensive leadership experience. In particular, Mr. Davis’ leadership of retail and food service companies and pharmacies provides our board of directors with valuable insight relevant to our business.Kim Fennebresque
Director
co-head
of investment banking at Lazard Frères & Co. He has also held various positions at First Boston Corporation, an investment bank acquired by Credit Suisse. Mr. Fennebresque’s extensive experience as a director of several public companies and history of leadership in the financial services industry brings corporate governance expertise and a diverse viewpoint to the deliberations of our board of directors.Allen M. Gibson
Director
100
charitable foundation, since July 2016. Mr. Gibson also serves on the advisory committee of several investment funds, including Cerberus Investment Partners V and Cerberus Investment Partners VI. Centaurus Capital LP is an investor in certain Cerberus funds. Mr. Gibson’s knowledge of capital markets enhances the ability of our board of directors to make prudent financial judgments.
Hersch Klaff
Director.
Jay L. Schottenstein
Director
Alan H. Schumacher
Director.
school-bus
manufacturer Blue Bird Corporation, Quality Distribution Inc., a chemical bulk tank truck operator, and Noranda Aluminum Holding Corporation, a producer of aluminum. Mr. Schumacher was a member of the Federal Accounting Standards Advisory Board from 2002 through June 2012. The board of directors has determined that the simultaneous service on more than three audit committees of public companies by Mr. Schumacher does not impair his ability to serve on our audit and risk committee nor does it represent or in any way create a conflict of interest for our company. Mr. Schumacher’s experience as a board director of several public companies, and his deep understanding of accounting principles, provides our board of directors with experience to oversee our accounting and financial reporting.Lenard B. Tessler
Director
in-depth
knowledge of our company and its acquisition strategy, provides critical skills for our board of directors to oversee our strategic planning and operations.101
B. Kevin Turner
Vice Chairman
Wal-Mart,
from 2002 to 2005. Between 1985 and 2002, Mr. Turner held a number of positions of increasing responsibility withWal-Mart,
including Executive Vice President and Global Chief Information Officer from 2001 to 2002. Mr. Turner’s strategic and operational leadership skills and expertise in online worldwide sales, global operations, supply chain, merchandising, branding, marketing, information technology and public relations provide our board of directors with valuable insight relevant to our business.Family Relationships
None of our officers or directors has any family relationship with any director or other officer. “Family relationship” for this purpose means any relationship by blood, marriage or adoption, not more remote than first cousin.
Corporate Governance
Code of Business Conduct and Ethics
We have adopted a code of business conduct and ethics that applies to all of our employees, officers and directors, including those officers responsible for financial reporting.
Corporate Governance Guidelines
We have adopted corporate governance guidelines in accordance with the corporate governance rules of the NYSE, as applicable, that serve as a flexible framework within which our board of directors and its committees operate. These guidelines cover a number of areas, including the size and composition of the board, board membership criteria and director qualifications, director responsibilities, board agenda, roles of the Chairman of our board of directors and Chief Executive Officer, executive sessions, standing board committees, board member access to management and independent advisors, director communications with third parties, director compensation, director orientation and continuing education, evaluation of senior management and management succession planning.
Board Composition
Our business and affairs are currently managed by our board of directors. Our board of directors currently has 12 members. As presently situated, the board of directors is comprised of three members of management, four directors affiliated with our Sponsors and five independent directors. Members of the board of directors will be elected at our annual meeting of stockholders to serve for a term of one year or until their successors have been elected and qualified, subject to prior death, resignation, retirement or removal from office.
Director Independence
Our board of directors has affirmatively determined that Sharon L. Allen, Steven A. Davis, Kim Fennebresque, Allen M. Gibson and Alan H. Schumacher are independent directors under the applicable rules of the NYSE and as such term is defined in Rule
10A-3(b)(1)
under the Exchange Act.102
Board Leadership Structure
Our board of directors does not have a formal policy on whether the roles of Chief Executive Officer and Chairman of the board of directors should be separate. Presently, Vivek Sankaran serves as our Chief Executive Officer and James L. Donald and Leonard Laufer are our
Co-Chairmen.
Our board of directors has considered its leadership structure and believes at this time that the Company and its stockholders are best served by having these positions divided. Dividing these roles allows for increased focus, as each person can devote their attention to one job, while fostering accountability and effective decision-making. By dividing these roles, each person is better able to successfully address both internal and external issues affecting the Company. While the roles of Chief Executive Officer and Chairman will remain separate, havingCo-Chairmen
allows each to draw on their extensive knowledge and expertise to set the agenda for and ensure the appropriate focus on issues of concern to the board of directors.Our board of directors expects to periodically review its leadership structure to ensure that it continues to meet our needs.
Role of Board in Risk Oversight
While the full board of directors has the ultimate oversight responsibility for the risk management process, its committees oversee risk in certain specified areas. In particular, our audit and risk committee oversees management of enterprise risks as well as financial risks. Our compensation committee is responsible for overseeing the management of risks relating to our executive compensation plans and arrangements and the incentives created by the compensation awards it administers. Our technology committee is responsible for overseeing the management of our research and development and IT structure and risks associated with IT and cybersecurity. Our nominating and corporate governance committee oversees risks associated with corporate governance. Further, our compliance committee, which is partially comprised of board members, is responsible for overseeing the management of the compliance and regulatory risks we face and risks associated with business conduct and ethics. Pursuant to our board of directors’ instruction, management regularly reports on applicable risks to the relevant committee or the full board of directors, as appropriate, with additional review or reporting on risks conducted as needed or as requested by our board of directors and its committees.
Board of Directors Meetings
During fiscal 2019, the board of directors met 15 times, the audit and risk committee met seven times, the compensation committee met seven times and the nominating and corporate governance committee did not meet. All of our directors attended at least 75% of the aggregate number of meetings of the board and committees of the board on which the director served, except for Mr. Gibson who attended 73% of the meetings and Mr. Schottenstein who attended 67% of the meetings.
Controlled Company
Upon completion of this offering, our Sponsors, as a group, will control a majority of our outstanding common stock. As a result, we are a “controlled company” within the meaning of the NYSE corporate governance standards. Under NYSE rules, a company of which more than 50% of the voting power is held by an individual, group or another company is a “controlled company” and may elect not to comply with certain NYSE corporate governance requirements, including:
| • | the requirement that a majority of the board of directors consist of independent directors; |
| • | the requirement that we have a nominating and corporate governance committee that is composed entirely of independent directors with a written charter addressing the committee’s purpose and responsibilities; |
| • | the requirement that we have a compensation committee that is composed entirely of independent directors with a written charter addressing the committee’s purpose and responsibilities; and |
| • | the requirement for an annual performance evaluation of the nominating and corporate governance committee and the compensation committee. |
103
Following this offering, we intend to utilize these exemptions. As a result, we will not have a majority of independent directors nor will our nominating and corporate governance and compensation committees consist entirely of independent directors. Accordingly, you will not have the same protections afforded to stockholders of companies that are subject to all of the NYSE corporate governance requirements.
In the event that we cease to be a controlled company within the meaning of these rules, we will be required to comply with these provisions after specified transition periods.
More specifically, if we cease to be a controlled company within the meaning of these rules, we will be required to (i) satisfy the majority independent board requirement within one year of our status change, and (ii) have (a) at least one independent member on each of our nominating and corporate governance committee and compensation committee by the date of our status change, (b) at least a majority of independent members on each committee within 90 days of the date of our status change and (c) fully independent committees within one year of the date of our status change.
Board Committees
Our board of directors has assigned certain of its responsibilities to permanent committees consisting of board members appointed by it. Our board of directors has an audit and risk committee, compensation committee, technology committee and nominating and corporate governance committee, each of which have the responsibilities described below. The composition of each of the committees described below is set forth as of the completion of this offering.
Audit and Risk Committee
Our audit and risk committee consists of Steven A. Davis, Kim Fennebresque and Alan H. Schumacher, with Mr. Schumacher serving as chair of the committee. The committee assists the board of directors in its oversight responsibilities relating to the integrity of our financial statements, our compliance with legal and regulatory requirements (to the extent not otherwise handled by our compliance committee), our independent auditor’s qualifications and independence, and the establishment and performance of our internal audit function and the performance of the independent auditor. We have three independent directors serving on our audit and risk committee. Our board of directors has determined that Mr. Schumacher has the attributes necessary to qualify him as an “audit committee financial expert” as defined by applicable rules of the SEC. Our board of directors has adopted a written charter under which the audit and risk committee operates.
Compensation Committee
Our compensation committee consists of Sharon L. Allen, Kim Fennebresque and Lenard B. Tessler, with Mr. Fennebresque serving as chair of the committee. The compensation committee of the board of directors is authorized to review our compensation and benefits plans to ensure they meet our corporate objectives, approve the compensation structure of our executive officers and evaluate our executive officers’ performance and advise on salary, bonus and other incentive and equity compensation. Our board of directors has adopted a written charter under which the compensation committee operates.
Technology Committee
Our technology committee consists of Leonard Laufer and B. Kevin Turner, with both serving as
co-chair
of the committee. The purpose of the technology committee is to, among other things, meet with our science and technology leaders to review our internal research and technology development activities and provide input as it deems appropriate, review technologies that we consider for implementation, review our development of our technical goals and research and development strategies. Our board of directors has adopted a written charter under which the technology committee operates.104
Nominating and Corporate Governance Committee
Our nominating and corporate governance committee consists of Sharon L. Allen, Allen M. Gibson and Lenard B. Tessler, with Ms. Allen serving as chair of the committee. The nominating and corporate governance committee is primarily concerned with identifying individuals qualified to become members of our board of directors, selecting the director nominees for the next annual meeting of the stockholders, selection of the director candidates to fill any vacancies on our board of directors and the development of our corporate governance guidelines and principles. The nominating and corporate governance committee does not maintain a policy for considering nominees but believes the members of the committee have sufficient background and experience to review nominees competently. While the board of directors is solely responsible for the selection and nomination of directors, the nominating and corporate governance committee may consider nominees recommended by stockholders as deemed appropriate. The nominating and corporate governance committee evaluates each potential nominee in the same manner regardless of the source of the potential nominee’s recommendation. Our board of directors has adopted a written charter under which the nominating and corporate governance committee operates.
Compensation Committee Interlocks and Insider Participation
None of the members of our compensation committee is or has at any time during the past year been an officer or employee of ours. None of our executive officers serves as a member of the compensation committee or board of directors of any other entity that has an executive officer serving as a member of our board of directors or compensation committee.
Other Committees
Compliance Committee
Our compliance committee (a
non-board
committee) consists of two directors, Hersch Klaff and Steven A. Davis, and twonon-directors,
Lisa A. Gray and Ronald Kravit, with Ms. Gray serving as chair of the committee. Ms. Gray serves as Vice Chairman of Cerberus Operations and Advisory Company, LLC (“COAC”), an affiliate of Cerberus, and Mr. Kravit served as Senior Managing Director and head of real estate investing at Cerberus until his retirement in December 2018. The purpose of the compliance committee is to assist the Company in implementing and overseeing our compliance programs, policies and procedures that are designed to respond to the various compliance and regulatory risks facing our Company, and monitor our performance with respect to such programs, policies and procedures.Director Compensation
Chairman Emeritus Agreement with Robert G. Miller
Robert G. Miller served as a member of our board of directors during fiscal 2019 and as Chairman Emeritus following his appointment on April 25, 2019. Mr. Miller previously served as our Executive Chairman from January 2015 to April 2019, and as Chief Executive Officer from June 2006 to January 2015 and again from April 2015 to September 2018. As Chairman Emeritus, Mr. Miller was entitled, pursuant to a chairman emeritus agreement, dated March 25, 2019, to receive a quarterly fee of $300,000 per fiscal quarter from April 25, 2019 through the end of fiscal 2019. On December 16, 2019, the chairman emeritus agreement was extended to provide that Mr. Miller is entitled to receive a quarterly fee of $300,000 per fiscal quarter from March 1, 2020 through the end of fiscal 2020. The chairman emeritus agreement also entitled Mr. Miller to the use of corporate aircraft for up to 50 hours per year for himself, his family members and guests at no cost to him, other than to pay income tax on such usage at the lowest permissible rate. While Mr. Miller was also entitled to receive director’s fees to the same extent, and on the same basis, as the director’s fees paid to directors appointed by our Sponsors, because the directors appointed by our Sponsors were not paid director’s fees during fiscal 2019, Mr. Miller similarly did not receive director’s fees during fiscal 2019.
105
Independent Directors
Our independent directors received compensation for their service on our board of directors or any board committees in fiscal 2019. We reimburse all of our directors for reasonable documented
out-of-pocket
expenses incurred by them in connection with attendance at board of directors and committee meetings.For fiscal 2019, all of our independent directors received an annual cash fee in the amount of $125,000 and additional annual fees for serving as a committee chair and/or member as follows:
Name | Committee Position | Additional Annual Fee | ||||
Sharon L. Allen | Chair of Nominating and Governance Committee | $ | 10,000 | |||
Member of Nominating and Governance Committee | $ | 10,000 | ||||
Member of Compensation Committee | $ | 20,000 | ||||
Steven A. Davis | Member of Audit and Risk Committee | $ | 25,000 | |||
Member of Compliance Committee | $ | 20,000 | ||||
Kim Fennebresque | Chair of Compensation Committee | $ | 20,000 | |||
Member of Compensation Committee | $ | 20,000 | ||||
Member of Audit and Risk Committee | $ | 25,000 | ||||
Alan H. Schumacher | Chair of Audit and Risk Committee | $ | 25,000 | |||
Member of Audit and Risk Committee | $ | 25,000 | ||||
In February 2019, our board of directors approved awards of 3,788 Phantom Units (as defined herein) to each of Messrs. Davis, Fennebresque, Gibson and Schumacher and Ms. Allen with a grant date fair value of $125,004. These Phantom Units became 100% vested on February 29, 2020.
See “Executive Compensation—Incentive Plans—Phantom Unit Plan” for additional information regarding the Phantom Unit Plan.
Six members of our board of directors, Robert G. Miller, Sharon L. Allen, Steven A. Davis, Kim Fennebresque, Allen M. Gibson and Alan H. Schumacher received compensation for their service on our board of directors during fiscal 2019, as set forth in the table below.
(in dollars) Name | Fees earned or Paid in Cash ($) | Unit Awards ($)(1) | Option Awards | Non-Equity Incentive Plan Compensation | Change in Pension Value and Nonqualified Deferred Compensation Earnings | All Other Compensation | Total ($) | |||||||||||||||||||||
Sharon L. Allen | 165,000 | 125,004 | — | — | — | — | 290,004 | |||||||||||||||||||||
Steven A. Davis | 170,000 | 125,004 | — | — | — | — | 295,004 | |||||||||||||||||||||
Kim Fennebresque | 190,000 | 125,004 | — | — | — | — | 315,004 | |||||||||||||||||||||
Allen M. Gibson | 125,000 | 125,004 | — | — | — | — | 250,004 | |||||||||||||||||||||
Robert G. Miller | 1,039,286 | — | — | — | — | — | 1,039,286 | |||||||||||||||||||||
Allen H. Schumacher | 175,000 | 125,004 | — | — | — | — | 300,004 | |||||||||||||||||||||
| (1) | Reflects the grant date fair value calculated in accordance with Accounting Standards Codification 718, Compensation-Stock Compensation, (“ASC 718”). |
106
As of February 29, 2020, the aggregate number of outstanding vested and unvested Phantom Units held by each independent director was:
Name | Number of Vested Phantom Units | Number of Unvested Phantom Units | ||||||
Sharon L. Allen | 3,788 | — | ||||||
Steven A. Davis | 3,788 | — | ||||||
Kim Fennebresque | 3,788 | — | ||||||
Allen M. Gibson | 3,788 | — | ||||||
Alan H. Schumacher | 3,788 | — | ||||||
107
EXECUTIVE COMPENSATION
Compensation Discussion and Analysis
This Compensation Discussion and Analysis is designed to provide an understanding of our compensation philosophy and objectives, compensation-setting process, and the compensation of our named executive officers during fiscal 2019 (“NEOs”). Our NEOs for fiscal 2019 were:
| • | Vivek Sankaran, our President and Chief Executive Officer; |
| • | James L. Donald, our former President and Chief Executive Officer and current Co-Chairman; |
| • | Robert B. Dimond, our Executive Vice President and Chief Financial Officer; |
| • | Susan Morris, our Executive Vice President and Chief Operations Officer; |
| • | Christine Rupp, our Executive Vice President and Chief Customer and Digital Officer; |
| • | Michael Theilmann, our Executive Vice President and Chief Human Resources Officer; and |
| • | Shane Sampson, our former Chief Marketing and Merchandising Officer. |
Compensation Philosophy and Objectives
Our general compensation philosophy is to provide programs that attract, retain and motivate our executive officers who are critical to our long-term success. We strive to provide a competitive compensation package to our executive officers to reward achievement of our business objectives and align their interests with the interests of our equityholders. We have sought to accomplish these goals through a combination of short- and long-term compensation components that are linked to our annual and long-term business objectives and strategies. To focus our executive officers on the fulfillment of our business objectives, a significant portion of their compensation is performance-based.
The Role of the Compensation Committee
The compensation committee is responsible for determining the compensation of our executive officers. The compensation committee’s responsibilities include determining and approving the compensation of the Chief Executive Officer and reviewing and approving the compensation of all other executive officers.
Compensation Setting Process
Our compensation program has reflected our operations as a private company. In determining the compensation for our executive officers, we relied largely upon the experience of our management and our board of directors with input from our Chief Executive Officer.
Our board of directors has delegated to the compensation committee responsibility for administering our executive compensation programs. As part of the administration of our executive compensation programs, the Chief Executive Officer provides the compensation committee with his assessment of the other NEOs’ performance and other factors used in developing his recommendation for their compensation, including salary adjustments, cash incentives and equity grants.
We have engaged a compensation consultant to provide assistance in determining the compensation of our executive officers. Such assistance may include establishing a peer group and formal benchmarking process to ensure that our executive compensation program is competitive and offers the appropriate retention and performance incentives.
108
Components of the NEO Compensation Program for Fiscal 2019
We use various compensation elements to provide an overall competitive total compensation and benefits package to the NEOs that is tied to creating value, commensurate with our results, and aligns with our business strategy. Set forth below are the key elements of the compensation program for the NEOs for fiscal 2019:
| • | base salary that reflects compensation for the NEO’s role and responsibilities, experience, expertise and individual performance; |
| • | quarterly bonus based on division performance; |
| • | annual bonus based on our financial performance for the fiscal year; |
| • | incentive compensation based on the value of our equity; |
| • | severance protection; and |
| • | other benefits that are provided to all employees, including healthcare benefits, life insurance, retirement savings plans and disability plans. |
Base Salary
We provide our NEOs with a base salary to compensate them for services rendered during the fiscal year. Base salaries for the NEOs are determined on the basis of each executive’s role and responsibilities, experience, expertise and individual performance. While our NEOs are not eligible for automatic annual salary increases, in fiscal 2019, we made adjustments to the annual base salaries of two NEOs from their base salaries in effect at the end of fiscal 2018:
Name | Fiscal 2018 Base Salary ($) | Fiscal 2019 Base Salary Rate ($) | ||||||
Vivek Sankaran (1) | — | 1,500,000 | ||||||
James L. Donald | 1,500,000 | 1,500,000 | ||||||
Robert B. Dimond | 775,000 | 850,000 | ||||||
Susan Morris | 850,000 | 900,000 | ||||||
Christine Rupp (1) | — | 750,000 | ||||||
Michael Theilmann (1) | — | 600,000 | ||||||
Shane Sampson | 900,000 | 900,000 | ||||||
| 1. | Mr. Sankaran joined ACI on April 25, 2019, followed by Mr. Theilmann and Ms. Rupp on August 19, 2019 and December 1, 2019, respectively. |
Bonuses
Performance-Based Bonus Plans
We recognize that our corporate management employees shoulder responsibility for supporting our operations and achieving positive financial results. Therefore, we believe that a substantial percentage of each executive officer’s annual compensation should be tied directly to the achievement of performance goals.
2019 Bonus Plan
.| • | a quarterly bonus component based on the performance achieved by each of our divisions for each fiscal quarter in fiscal 2019 (each, a “Quarterly Division Bonus”), other than our United Supermarkets division and Haggen stores; and |
109
| • | an annual bonus component based on performance for the full fiscal 2019 year (the “Annual Corporate Bonus”). |
The goals set under the 2019 Bonus Plan were designed to be challenging and difficult to achieve, but still within a realizable range so that achievement was both uncertain and objective. We believe that this methodology created a strong link between our NEOs and our financial performance.
The Quarterly Division Bonus component and the Annual Corporate Bonus component each constituted 50% of each NEO’s target bonus opportunity for fiscal 2019. Each NEO’s target bonus opportunity for fiscal 2019 under the 2019 Bonus Plan was set at 100% (150% for Mr. Sankaran) of the NEO’s annual base salary. We believe that the target bonus opportunity for our NEOs is appropriate based on their positions and responsibilities, as well as their individual ability to impact our financial performance, and places a proportionately larger percentage of total annual pay for our NEOs at risk based on our performance.
Quarterly Division Bonus
.At the beginning of each fiscal quarter, the management of each division participating in the 2019 Bonus Plan, with approval from our corporate management, established the division’s EBITDA goal for the applicable fiscal quarter with threshold, plan, target and maximum goals. After the end of the fiscal quarter, our corporate finance team calculated the financial results for each retail division and reported the Quarterly Division Bonus percentage earned, if any. A division earned between 0% to 100% of the bonus target amount for achievement of EBITDA for the fiscal quarter between the threshold and target levels. If the division exceeded 100% of target EBITDA for a fiscal quarter, the amount in excess of target EBITDA would be earned in proportion to the maximum goals, subject to a cap based on achievement of division sales goals for such fiscal quarter as follows:
Quarterly Sales Goal Percentage Achieved | Maximum Percentage of Quarterly Division Bonus Target Earned | |||
Below 99% | 100 | % | ||
99%-99.99% | 150 | % | ||
100% or greater | 200 | % | ||
The bonuses earned by the NEOs for each fiscal quarter were determined by adding together the percentage of the Quarterly Division Bonus target amounts earned for all of the divisions and dividing the sum by the number of our divisions participating in the 2019 Bonus Plan for such quarter. Most of our divisions participated in the 2019 Bonus Plan during fiscal 2019. The compensation committee determines the level of achievement for each fiscal quarter, which, in turn, determines the amount of the bonus that each NEO will receive each fiscal quarter.
Annual Corporate Bonus.
110
100% of the Annual Corporate Bonus could be earned at achievement of 100% of the Adjusted EBITDA target, with interim percentages earned for achievement between levels. If achievement exceeded 100% of the Adjusted EBITDA target, 10% of the excess Adjusted EBITDA would be added to the bonus pool, but payout was capped at 200% on the Annual Corporate Bonus component of the NEO’s target bonus opportunity for fiscal 2019. Based on our achievement of Adjusted EBITDA of $2,834.4 million in fiscal 2019, 105% of the target, the compensation committee determined that 160.14% of the Annual Corporate Bonus component of each NEO’s fiscal 2019 target bonus opportunity was earned.
The NEOs earned the following amounts under the 2019 Bonus Plan:
Name | Aggregate Quarterly Division Bonus for Fiscal 2019 Earned ($) | Annual Corporate Bonus for Fiscal 2019 Earned ($) | Aggregate Bonus for Fiscal 2019 Earned ($) | |||||||||
Vivek Sankaran | 1,058,184 | 1,559,055 | 2,617,239 | |||||||||
James L. Donald | 840,583 | 1,224,147 | 2,064,730 | |||||||||
Robert B. Dimond | 476,330 | 693,683 | 1,170,013 | |||||||||
Susan Morris | 504,350 | 734,488 | 1,238,838 | |||||||||
Christine Rupp | 93,750 | 150,131 | 243,881 | |||||||||
Michael Theilmann | 179,464 | 258,688 | 438,152 | |||||||||
Shane Sampson | 259,487 | 388,032 | 647,519 | |||||||||
Special Bonuses
In addition to the annual cash incentive program, we may from time to time pay our NEOs discretionary bonuses as determined by the board of directors or the compensation committee to provide for additional retention or upon special circumstances. In connection with the commencement of their respective employments with us in fiscal 2019, Mr. Sankaran, Ms. Rupp and Mr. Theilmann each received a
sign-on
bonus. Mr. Sankaran received asign-on
retention award of $10.0 million consisting of three separate payments-$5.0 million was paid on the commencement of his employment and, subject to his continued employment, $2.5 million is payable on April 25, 2020 and $2.5 million is payable on April 25, 2021. Ms. Rupp received asign-on
bonus of $2.0 million consisting of two payments-$1.5 million was paid in December 2019 and, subject to her continued employment, the remaining $500,000 is payable on December 1, 2020. Mr. Theilmann’ssign-on
bonus consisted of a single payment on August 19, 2019 of $950,000.Incentive Plans
Phantom Unit Plan
The Company maintains the Albertsons Companies, Inc. Phantom Unit Plan (formerly, the AB Acquisition LLC Phantom Unit Plan) (the “Phantom Unit Plan”), an equity-based incentive plan, which provides for grants of “Phantom Units” to certain employees, directors and consultants. Each Phantom Unit provides a participant with a contractual right to receive, upon vesting, one management incentive unit in each of the Company’s parents, Albertsons Investor and KIM ACI. The holder of management incentive units is entitled to participate, on a pro rata basis, in the distributions from each of Albertsons Investor and KIM ACI following aggregate distributions of $2.293 billion (on a combined basis from both Albertsons Investor and KIM ACI), based on the holder’s respective ownership percentage in Albertsons Investor and KIM ACI. Upon the consummation of this offering, all outstanding Phantom Units will be converted to restricted stock units that, upon vesting, will be settled in shares of our common stock. The restricted stock units will be subject to the Albertsons Companies, Inc. Restricted Stock Unit Plan (“Restricted Stock Unit Plan”) that will have substantially the same terms as, and will supersede, the Phantom Unit Plan except that no new awards may be granted thereunder. As of the date of this prospectus, there are outstanding awards of Phantom Units that, based on an initial public offering price of $ per share, the midpoint of the estimated offering range set forth on the cover page of this prospectus, would convert into restricted stock units.
111
2016-2017 NEO Phantom Unit Grants
Mr. Sampson was granted 132,456 Phantom Units on July 19, 2017 and Ms. Morris was granted 132,456 Phantom Units on each of April 28, 2016 and January 11, 2018 (such grants of Phantom Units to these NEOs, the “2016-2017 NEO Phantom Unit Grants”).
Fifty percent of the 2016-2017 NEO Phantom Unit Grants are time-based units that are subject to the NEO’s continued service through each applicable vesting date (the “2016-2017 Time-Based Units”). The remaining 50% of the 2016-2017 NEO Phantom Unit Grants are performance units that are subject to both the NEO’s continued service through each applicable vesting date and to the achievement of annual performance targets (the “2016-2017 Performance Units”). The portion of the 2016-2017 Performance Units subject to vesting on February 29, 2020 were subject to our achievement of an annual Adjusted EBITDA target for fiscal 2019 of $2.7 billion. The 2016-2017 NEO Phantom Unit Grants were granted with the right to receive a tax bonus that entitles the NEO to receive a bonus equal to 4% of the fair value of the management incentive units paid to the participant in respect of vested Phantom Units. Following the consummation of this offering, the 2016-2017 Performance Units will vest solely based on the NEO’s continued employment, and any 2016-2017 Performance Units with respect to a missed year will be forfeited. In addition, following the consummation of this offering, if an NEO’s employment is terminated by us without “cause” or due to the NEO’s death or disability, all 2016-2017 Time-Based Units and 2016-2017 Performance Units not previously forfeited would become 100% vested.
Donald Initial Phantom Unit Grants
Upon the commencement of his employment on March 1, 2018, Mr. Donald was granted 214,219 Phantom Units. Fifty percent of such Phantom Units vested on the last day of fiscal 2018 and the remaining 50% of such Phantom Units vested on the last day of fiscal 2019. Mr. Donald’s award entitled him to receive a tax bonus equal to 4% of the fair value of the management incentive units paid to him in respect of vested Phantom Units.
Time-Based Phantom Unit Awards
During fiscal 2018 and fiscal 2019, our NEOs were granted Phantom Units that vest based on the NEOs continued service in
one-third
increments on each of three anniversaries of the grant date (the “Time-Based Phantom Unit Awards”). On September 11, 2018, Mr. Donald was granted a Time-Based Phantom Unit Award of 125,000 Phantom Units, and on November 9, 2018, each of Messrs. Sampson and Dimond and Ms. Morris was granted a Time-Based Phantom Unit Award of 39,297 Phantom Units. On September 11, 2019, Mr. Donald was granted an additional Time-Based Phantom Unit Award of 121,212 Phantom Units, and on October 29, 2019, Mr. Theilmann was granted a Time-Based Phantom Unit Award of 22,728 Phantom Units. On February 7, 2020, Ms. Rupp was granted a Time-Based Phantom Unit Award of 51,282 Phantom Units. In addition, following a change of control, if an NEO’s employment is terminated by us without “cause” or due to the NEO’s death or disability, all Time-Based Phantom Units not previously forfeited would become 100% vested.Performance-Based Phantom Unit Awards
2019 Performance-Based Phantom Unit Awards. During fiscal 2018 and fiscal 2019, our NEOs were granted awards of Phantom Units that vest subject to the NEO’s continued service through the end of fiscal 2021 and based on the achievement of specified performance in each of fiscal 2019, fiscal 2020 and fiscal 2021 (the “2019 Performance-Based Phantom Unit Awards”).
On September 11, 2018, Mr. Donald was granted a 2019 Performance-Based Phantom Unit Award entitling him to earn a target number of 125,000 Phantom Units. On November 9, 2018, each of Messrs. Sampson and Dimond and Ms. Morris was granted a 2019 Performance-Based Phantom Unit Award entitling the NEO to earn a target number of 39,297 Phantom Units and on October 29, 2019, Mr. Theilmann was granted a 2019 Performance-Based Phantom Unit Award entitling him to earn a target number of 19,179 Phantom Units. On
112
February 7, 2020, Ms. Rupp was granted a 2019 Performance-Based Phantom Unit Award entitling her to earn a target number of 19,201 Phantom Units. Each award recipient may earn between 0% and 120% of
one-third
(or, in the case of Ms. Rupp and Mr. Theilmann, apro-rated
number based on the date the officer commenced employment) of the total target number of Phantom Units subject to the award in each of fiscal 2019, fiscal 2020 and fiscal 2021 based on our achievement of our annual Adjusted EBITDA target for such fiscal year. For an award recipient to earn any Phantom Units in respect of a fiscal year, we must achieve at least 95% of our annual Adjusted EBITDA target for that fiscal year. Performance at 95% of our annual Adjusted EBITDA target would entitle an award recipient to 75% of the target number of Phantom Units for such fiscal year. Any Phantom Units not earned at the end of a fiscal year as a result of the performance criteria not being met are automatically forfeited. If an award recipient’s employment terminates prior to the conclusion of fiscal 2021, the award recipient’s entire 2019 Performance-Based Phantom Unit Award would be forfeited. The Adjusted EBITDA target for fiscal 2019 was $2.7 billion. If a change of control were to occur prior to the end of fiscal 2021, each NEO would (i) retain any 2019 Performance-Based Phantom Unit Awards awarded in respect of any fiscal year completed prior to the change of control and (ii) be awarded a number of Phantom Units equal to the target number of 2019 Performance- Based Phantom Unit Awards for any fiscal year that had either not yet ended or not yet commenced, and such Phantom Units would then vest solely based on the NEO’s continued employment through the last day of fiscal 2021. If, following a change of control, an NEO’s employment were terminated by us without “cause” or due to the NEO’s death or disability, all 2019 Performance-Based Phantom Unit Awards awarded to the NEO would become 100% vested.Donald 2020 Performance-Based Phantom Unit Awards.
one-third
of the target number of the award (i.e., 40,404 Phantom Units) based on our achievement of our annual Adjusted EBITDA target for each such fiscal year. For Mr. Donald to earn any Phantom Units in respect of a fiscal year, we must achieve at least 95% of our annual Adjusted EBITDA target for that fiscal year. Performance at 95% of our annual Adjusted EBITDA target will entitle Mr. Donald to 75% of the target number of Phantom Units for such fiscal year. Any Phantom Units not earned at the end of a fiscal year as a result of the performance criteria not being met are automatically forfeited. If Mr. Donald’s service terminates prior to the conclusion of fiscal 2022, the Donald 2020 Performance-Based Phantom Unit Award will be forfeited. If a change of control were to occur prior to the end of fiscal 2022, Mr. Donald would (i) retain any Donald 2020 Performance-Based Phantom Unit Awards awarded in respect of any fiscal year completed prior to the change of control and (ii) be awarded a number of Phantom Units equal to the target number of Donald 2020 Performance-Based Phantom Unit Awards for any fiscal year that had either not yet ended or not yet commenced, and such Phantom Units would then vest solely based on Mr. Donald’s continued service through the last day of fiscal 2022. If, following a change of control, Mr. Donald’s service were terminated by us without “cause” or due to Mr. Donald’s death or disability, all Donald 2020 Performance-Based Phantom Unit Awards awarded would become 100% vested.Omnibus Incentive Plan
On May 5, 2020, we adopted our 2020 Omnibus Incentive Plan (the “Incentive Plan”); however the Incentive Plan will not become effective until the commencement of this offering, although no awards will be made under it until the closing of this offering. The principal features of the Incentive Plan are summarized below, but the summary is qualified in its entirety by reference to the Incentive Plan itself, which is filed as an exhibit to the registration statement of which this prospectus is a part.
Securities Subject to the Incentive Plan
113
of our common stock covered by the Incentive Plan may be treasury shares, authorized but unissued shares or shares purchased in the open market.
In the event of any termination, expiration, lapse or forfeiture of an award, any shares subject to the award will again be made available for future grants under the Incentive Plan. Any shares of restricted stock repurchased by us at the same price paid for such shares will be made available for issuance again under the Incentive Plan.
Eligibility
Awards under the Incentive Plan
non-qualified
stock options (“NQSOs”) or, solely to eligible employees, incentive stock options designed to comply with the applicable provisions of Section 422 of the Code, stock appreciation rights (“SARs”), restricted stock, restricted stock units, stock and cash awards, or any combination thereof. The terms and conditions of each award will be set forth in a separate agreement.Award Limits
Vesting and Exercise of Awards
Transferability of Awards
Forfeiture and Claw-Back Provisions
114
administrator has the right to require the participant to repay any proceeds, gains or other economic benefit actually or constructively received by the participant or to terminate the award. In addition, all awards (including any proceeds, gains or other economic benefit actually or constructively received by the participant) may be subject to the provisions of any claw-back policy implemented by us, including, without limitation our claw-back policy.
Incentive Plan Benefits
Adjustments for Stock Splits, Recapitalizations, Mergers and Equity Restructurings
split-up,
spin-off
or other transaction that affects our common stock, the Incentive Plan will be equitably adjusted, including the number of available shares, in order to prevent the dilution or enlargement of the benefits or potential benefits intended to be made available under the Incentive Plan or with respect to any award.Administration of the Incentive Plan
Amendment and Termination of the Incentive Plan
Stockholder approval will be specifically required to increase the maximum number of shares of our common stock which may be issued under the Incentive Plan, change the eligibility requirements or decrease the exercise price of any outstanding option or stock appreciation right granted under the Incentive Plan. Our board of directors and the compensation committee may amend the terms of any award theretofore granted, prospectively or retroactively, however, except as otherwise provided in the Incentive Plan, no such amendment will, without the consent of the participant, alter or impair any rights of the participant under such award without the consent of the participant unless the award itself otherwise expressly so provides.
Our board of directors and the compensation committee may suspend or terminate the Incentive Plan at any time. However, in no event may an award be granted pursuant to the Incentive Plan on or after the tenth anniversary of the effective date of the Incentive Plan.
Prohibition on Repricing
split-up,
spin-off,
combination or exchange of shares), the administrator will not, without the approval of the stockholders, authorize the amendment of any outstanding award to reduce its price per share, including any amendment to reduce the exercise price per share of outstanding options or SARs.Employment Agreements
Employment Agreement with Vivek Sankaran
On March 25, 2019, we entered into an employment agreement with Vivek Sankaran (the “Sankaran Employment Agreement”), effective April 25, 2019 (the “Commencement Date”). The Sankaran Employment Agreement provides for an initial term that expires on the third anniversary of the Commencement Date, and thereafter automatically renews for additional
one-year
periods unless either party provides written notice at least 120 days prior to the end of the then-current term.115
Pursuant to the Sankaran Employment Agreement, Mr. Sankaran is entitled to receive an annual base salary of $1,500,000 and is eligible for an annual bonus targeted at 150% of his base salary. Mr. Sankaran also received a
sign-on
retention award of $10.0 million. Fifty percent of Mr. Sankaran’ssign-on
retention award was paid on the Commencement Date, and the remaining 50% is payable as follows: (i) $2.5 million on April 25, 2020 and (ii) $2.5 million on April 25, 2021, subject to his continued employment with us on each such date.On his Commencement Date, Mr. Sankaran was granted profits interests consisting of 584,289 Class
B-1
Units (as defined herein) in Albertsons Investor, 588,315 Class B-1
Units in KIM ACI, 584,289 Class B-2
Units (as defined herein) in Albertsons Investor and 588,315 Class B-2
Units in KIM ACI. The Class B-1
Units and Class B-2
Units entitle Mr. Sankaran to participate, on a pro rata basis, in the distributions from each of Albertsons Investor and KIM ACI following aggregate distributions of $6.5 billion (on a combined basis from both Albertsons Investor and KIM ACI), based on Mr. Sankaran’s ownership percentages in Albertsons Investor and KIM ACI. The only difference between the Class B-1
Units in Albertsons Investor and the Class B-2
Units in Albertsons Investor are the vesting and forfeiture terms. Similarly, the only difference between the Class B-1
Units in KIM ACI and the Class B-2
Units in KIM ACI are the vesting and forfeiture terms. The aggregate fair value of Mr. Sankaran’s Class B-1
Units and Class B-2
Units in Albertsons Investor and Class B-1
Units and Class B-2
Units in KIM ACI was $19.5 million based on a fair value of the Class B-1
Units and Class B-2
Units in Albertsons Investor of $15.04 per unit and a fair value of the Class B-1
Units and Class B-2
Units in KIM ACI of $1.64 per unit (the different fair values are due to the unequal ownership interests in the Company held by Albertsons Investor and KIM ACI).Mr. Sankaran’s Class
B-1
Units in Albertsons Investor have the same vesting terms and conditions as his Class B-1
Units in KIM ACI (collectively, the “Class B-1
Units”) and all of Mr. Sankaran’s Class B-2
Units in Albertsons Investor have the same vesting terms and conditions as his Class B-2
Units in KIM ACI (collectively, the “Class B-2
Units”). Accordingly, for simplification purposes, any reference to a fraction or percentage of Mr. Sankaran’s Class B-1
Units is intended to mean that fraction or percentage of Mr. Sankaran’s Class B-1
Units in Albertsons Investor and Mr. Sankaran’s Class B-1
Units in KIM ACI, respectively, and any reference to a fraction or percentage of Mr. Sankaran’s Class B-2
Units is intended to mean that fraction or percentage of Mr. Sankaran’s Class B-2
Units in Albertsons Investor and Mr. Sankaran’s Class B-2
Units in KIM ACI, respectively.Mr. Sankaran’s Class
B-1
Units will vest in installments on each of the first, second, third, fourth and fifth anniversaries of his Commencement Date. If, prior to a change in control, Mr. Sankaran’s employment terminates due to his death or disability, Mr. Sankaran will become vested in the number of Class B-1
Units that would have vested on the next anniversary of the grant date, prorated based on the number of days of service during the period commencing on the prior anniversary of the grant date and ending on the date of Mr. Sankaran’s termination of employment. If following a change in control, Mr. Sankaran’s employment terminates due to his death or disability, Mr. Sankaran will become fully vested in all unvested Class B-1
Units. If Mr. Sankaran’s employment is terminated by us without “cause” or Mr. Sankaran resigns for “good reason” (as such terms are defined in the Sankaran Employment Agreement), Mr. Sankaran will become vested in the Class B-1
Units that he would have become vested on the next anniversary of the grant date following such termination of employment. If Mr. Sankaran’s employment is terminated by us without cause or Mr. Sankaran resigns for good reason following a change in control or within the180-day
period immediately prior to a change in control, Mr. Sankaran will become fully vested in the Class B-1
Units. If Mr. Sankaran’s employment terminates due to ournon-renewal
of the term, Mr. Sankaran will become vested in any Class B-1
Units that would have vested during the13-month
period following such termination of employment.Mr. Sankaran’s Class
B-2
Units are divided into three equal tranches, each of which will vest in installments: (i) the first tranche, consisting ofone-third
of the Class B-2
Units, vests at the end of each of fiscal 2019, fiscal 2020 and fiscal 2021 (“Tranche One”); (ii) the second tranche, consisting ofone-third
of the Class B-2
Units, vests at the end of each of fiscal 2020, fiscal 2021 and fiscal 2022 (“Tranche Two”); and (iii) the third tranche, consisting ofone-third
of the Class B-2
Units, vests at the end of each of fiscal 2021, fiscal 2022116
and fiscal 2023 (“Tranche Three”), in each case based on our attainment of performance criteria for each applicable fiscal year, and in each case subject to Mr. Sankaran’s continued employment with the Company. With respect to each fiscal year, Mr. Sankaran will vest in between 0% and 100% of the Class
B-2
Units eligible to become vested in that fiscal year based on our achievement of our annual Adjusted EBITDA target for such fiscal year. For Mr. Sankaran to vest in any Class B-2
Units in respect of a fiscal year, we must achieve at least 95% of our annual Adjusted EBITDA target for that fiscal year. Performance at 95% of our annual Adjusted EBITDA target will entitle Mr. Sankaran to 75% of the target number of Class B-2
Units for such fiscal year. Any Class B-2
Units that do not vest at the end of a fiscal year are automatically forfeited. The Adjusted EBITDA target for fiscal 2019 was $2.7 billion.If Mr. Sankaran’s employment is terminated by Mr. Sankaran without good reason: (i) prior to the conclusion of fiscal 2021, Tranche One will be forfeited in its entirety; (ii) prior to the conclusion of fiscal 2022, Tranche Two will be forfeited in its entirety; and (iii) prior to the conclusion of fiscal 2023, Tranche Three will be forfeited in its entirety. If, prior to a change in control, Mr. Sankaran’s employment terminates due to his death or disability, Mr. Sankaran will become vested in the number of Class
B-2
Units that would have vested on the next anniversary of the grant date based on our attainment of performance targets for such fiscal year, prorated based on the number of days of service during the period commencing on the prior anniversary of the grant date and ending on the date of Mr. Sankaran’s termination of employment. If, following a change in control, Mr. Sankaran’s employment terminates due to his death or disability, Mr. Sankaran will become fully vested in all unvested Class B-2
Units (to the extent not previously forfeited) as if the performance targets for future fiscal years had been fully achieved. If Mr. Sankaran’s employment is terminated by us without cause or by Mr. Sankaran for good reason, Mr. Sankaran will become fully vested in any Class B-2
Units that would have become vested at the end of the fiscal year in which such termination occurs, based on the attainment of performance targets for such fiscal year. If Mr. Sankaran’s employment is terminated by us without cause or Mr. Sankaran resigns for good reason following a change in control or within the180-day
period immediately prior to a change in control, Mr. Sankaran will become fully vested in any unvested Class B-2
Units (to the extent not previously forfeited) as if the performance targets for future fiscal years had been fully achieved. If Mr. Sankaran’s employment terminates due to ournon-renewal
of the term, Mr. Sankaran will become vested in any Class B-2
Units that would have vested during the13-month
period following such termination of employment, based on our attainment of performance targets for the fiscal year of such termination.If, in connection with this offering, Mr. Sankaran receives equity in the Company in respect of his Class
B-1
Units and Class B-2
Units which has a value, based on the initial public offering price, of less than $24.0 million (as equitably adjusted downward for any Class B-2
Units that have been previously forfeited as a result of our failure to achieve annual performance criteria), subject to Mr. Sankaran’s continued employment with us through the date of the offering, Mr. Sankaran will, on the date of the offering, be granted an option with a10-year
term to acquire common stock of the Company having a value, determined in accordance with Black-Scholes methodology, equal to the difference between $24.0 million (as equitably adjusted downward) and the value of the equity in the Company that Mr. Sankaran received in connection with this offering in respect of his Class B-1
Units and Class B-2
Units. The option would vest in three equal installments on theone-year,
two-year
and three-year anniversary of the date of grant, subject to his continued employment through each such anniversary of the date of grant. Based on an initial public offering price of $ per share, the midpoint of the estimated offering range set forth on the cover page of this prospectus, Mr. Sankaran’s Class B-1
and Class B-2
Units would convert into shares of restricted common stock of the Company and Mr. Sankaran would receive options to acquire common stock of the Company that has an aggregate value, determined in accordance with Black-Scholes methodology, equal to $ .If Mr. Sankaran’s employment terminates due to his death or disability, subject to his (or his legal representative’s, as appropriate) execution of a release, Mr. Sankaran or his legal representative, as appropriate, would be entitled to receive: (i) the earned but unpaid portion of any bonus earned in respect of any completed performance period prior to the date of termination; (ii) a lump sum payment in an amount equal to 25% of his base salary; (iii) a bonus for the fiscal year of termination based on actual performance metrics for the fiscal year
117
of the Company in which the termination date occurs, but prorated based on the number of days of service during the applicable fiscal year through the termination date; (iv) payment of the unvested or unpaid portions of his
sign-on
retention award; (v) if the option (described above) has been issued, accelerated vesting of the portion of the option that would have become vested upon the next anniversary of the date of grant following the termination date, but prorated based on the number of days of service from the most recent anniversary of the date of grant through the termination date; and (vi) reimbursement of the cost of continuation coverage of group health coverage for a period of 18 months.If Mr. Sankaran’s employment is terminated by us without cause or by Mr. Sankaran for good reason, subject to his execution of a release, Mr. Sankaran would be entitled to receive (i) the earned but unpaid portion of any bonus earned in respect of any completed performance period prior to the date of termination; (ii) a lump sum payment in an amount equal to 200% of the sum of his base salary plus target bonus; (iii) a bonus for the fiscal year of termination based on actual performance metrics for the fiscal year of the Company in which the termination date occurs, but prorated based on the number of days of service during the applicable fiscal year through the termination date; (iv) payment of the unvested or unpaid portions of his
sign-on
retention award; (v) if the option (described above) has been issued, accelerated vesting of the portion of the option that would have become vested upon the next anniversary of the date of grant following the termination date; and (vi) reimbursement of the cost of continuation coverage of group health coverage for a period of 18 months.If Mr. Sankaran’s employment is terminated due to our election not to renew the term of his employment, subject to his execution of a release, Mr. Sankaran would be entitled to receive: (i) the earned but unpaid portion of any bonus earned in respect of any completed performance period prior to the date of termination; (ii) a lump sum payment in an amount equal to 200% of the sum of his base salary plus target bonus; (iii) if the option (described above) has been issued, accelerated vesting of the portion or portions of the option that would have become vested in the
13-month
period following the termination date; and (iv) reimbursement of the cost of continuation coverage of group health coverage for a period of 18 months.Employment Agreement with James L. Donald
On May 22, 2019, we entered into an amended and restated employment agreement with Mr. Donald, (the “Donald Employment Agreement”), effective April 25, 2019. The Donald Employment Agreement extended the term of Mr. Donald’s service with us to February 25, 2023 and updates his duties through such date.
Pursuant to the Donald Employment Agreement, through February 29, 2020, Mr. Donald received an annual base salary of $1,500,000 and remained eligible for a bonus targeted at 100% of his base salary. Thereafter, through the end of the term on February 25, 2023, Mr. Donald will receive an annual base salary of $1.0 million but will no longer be eligible to receive a bonus. As provided in the Donald Employment Agreement, Mr. Donald received an award of 242,424 Phantom Units under our Phantom Unit Plan, of which 50% will vest in three equal installments on each anniversary of the grant date, provided that Mr. Donald remains in his then-current position with us through the applicable vesting date, and 50% will vest on February 25, 2023, provided that (i) Mr. Donald remains in his then-current position with us through such date and (ii) the performance-based conditions specified by the board of directors (or compensation committee) for each of fiscal 2020, fiscal 2021 and fiscal 2022 of the Company have been achieved.
If Mr. Donald’s employment is terminated due to his death or due to disability, he or his legal representative, as appropriate, would be entitled to receive a lump sum payment in an amount equal to 25% of his then base salary. If Mr. Donald’s employment is terminated by us without cause or by Mr. Donald for good reason (as such terms are defined in the Donald Employment Agreement) after February 29, 2020, subject to his execution of a release, Mr. Donald would be entitled to a lump sum payment in an amount equal to his then remaining base salary that would have been payable from the date of termination through February 25, 2023.
118
Employment Agreements with other Executives
During fiscal 2019, each of Messrs. Dimond, Sampson and Theilmann and Mses. Morris and Rupp were subject to a respective employment agreement with the Company (collectively, the “Executive Employment Agreements”). On May 1, 2019, we entered into a new employment agreement with Messrs. Dimond and Sampson and Ms. Morris, respectively, each of which amended and restated such NEO’s respective prior employment agreement with the Company, dated August 1, 2017. In connection with the commencement of Mr. Theilmann’s employment with the Company on August 19, 2019, and Ms. Rupp’s employment with the Company on December 1, 2019, each entered into their respective Executive Employment Agreement.
Each Executive Employment Agreement has a term that ends on January 30, 2023 and provides that the respective NEO is entitled to a specified annual base salary and eligibility for an annual bonus targeted at 100% of his or her annual base salary.
If the executive’s employment terminates due to his or her death or he or she is terminated due to disability, the executive or his or her legal representative, as appropriate, would be entitled to receive a lump sum payment in an amount equal to 25% of his or her base salary. If the executive’s employment is terminated by us without cause or by the executive for good reason, subject to his or her execution of a release, the executive would be entitled to a lump sum payment in an amount equal to 200% of the sum of his or her base salary plus target bonus and reimbursement of the cost of continuation coverage of group health coverage for a period of 12 months.
For the purposes of each Executive Employment Agreement, cause generally means:
| • | conviction of a felony; |
| • | acts of intentional dishonesty resulting or intending to result in personal gain or enrichment at our expense, or our subsidiaries or affiliates; |
| • | a material breach of the executive’s obligations under the applicable Executive Employment Agreement, including, but not limited to, breach of the restrictive covenants or fraudulent, unlawful or grossly negligent conduct by the executive in connection with his or her duties under the applicable Executive Employment Agreement; |
| • | personal conduct by the executive which seriously discredits or damages us, our subsidiaries or our affiliates; or |
| • | contravention of specific lawful direction from the board of directors. |
For the purposes of each Executive Employment Agreement, good reason generally means:
| • | a reduction in the base salary or target bonus; or |
| • | without prior written consent, relocation of the executive’s principal location of work to any location that is in excess of 50 miles from such location on the date of the applicable Executive Employment Agreement. |
Pursuant to Ms. Rupp’s Executive Employment Agreement, Ms. Rupp is entitled to an annual bonus for fiscal 2019 under the 2019 Bonus Plan in an amount determined by the committee and
pro-rated
based on the number of days Ms. Rupp is employed during fiscal 2019. In addition, pursuant to Ms. Rupp’s Executive Employment Agreement, Ms. Rupp is entitled to an annual equity grant valued at $2.0 million, the first of which is to be awarded on our customary grant date following December 1, 2019.Ms. Rupp’s Executive Employment Agreement also entitled Ms. Rupp to a
one-time
incentive award consisting of cash and equity awards as an inducement to begin employment with the Company. The cash portion of the award is equal to $2.0 million, with $1.5 million having been paid on December 1, 2019 and the remaining $500,000 to be paid on December 1, 2020, subject to her continued employment on such date. Ms. Rupp also119
received an award of 51,282 Phantom Units that vests, subject to Ms. Rupp’s continued employment, in three installments - 50% on December 1, 2021, 25% on December 1, 2022 and 25% on December 1, 2023, and an award of 19,201 Phantom Units under the Phantom Unit Plan, which vests at the end of fiscal 2021 based on performance during fiscal 2019, fiscal 2020 and fiscal 2021, and provided Ms. Rupp remains employed through such date.
Sampson Separation Agreement
On August 19, 2019, Mr. Sampson resigned from employment with us, effective September 7, 2019. On August 21, 2019, we entered into a separation agreement (the “Sampson Separation Agreement”) with Mr. Sampson that provides for Mr. Sampson to receive (i) a lump sum payment equal to 200% of the sum of Mr. Sampson’s then-current base salary plus target bonus, (ii) a lump sum payment equal to 50% percent of the annual bonus Mr. Sampson would have received in respect of fiscal 2019 had Mr. Sampson remained employed for the entirety of such fiscal year, payable no later than May 15, 2020, and (iii) reimbursement of the cost of continuation coverage of group health coverage for a period of up to 18 months. As a condition to receiving the payments and benefits under the Sampson Separation Agreement, Mr. Sampson provided a general release of claims in favor of us and our affiliates and agreed to continue to comply with
24-month
post-employmentnon-competition
andnon-solicitation
covenants.Deferred Compensation Plan
Our subsidiaries, Albertsons and NALP, maintain the Albertson’s LLC Makeup Plan and NALP Makeup Plan, respectively (collectively, the “Makeup Plans”). The Makeup Plans are unfunded nonqualified deferred compensation arrangements. Designated employees may elect to defer the receipt of a portion of their base pay, bonus and incentive payments under the Makeup Plans. The amounts deferred are held in a book entry account and are deemed to have been invested by the participant in investment options designated by the participant from among the investment options made available by the committee under the Makeup Plans. Participants are vested in their accounts under the Makeup Plans to the same extent they are vested in their accounts under the 401(k) plan discussed below, except that accounts under the Makeup Plans will become fully vested upon a change of control. No deferral contributions for a year will be credited, however, until the participant has been credited with the maximum amount of elective deferrals permitted by the terms of the 401(k) plans and/or the limitations imposed by the Code. In addition, participants will be credited with an amount equal to the excess of the amount we would contribute to the 401(k) plans as a Company contribution on the participant’s behalf for the plan year without regard to any limitations imposed by the Code based on the participant’s compensation over the amount of our actual Company contributions for the plan year. Generally, payment of the participant’s account under the Makeup Plans will be made in a lump sum following the participant’s separation from service. Participants may receive a distribution of up to 100% of their account during employment in the event of an emergency. Participants in the Makeup Plans are unsecured general creditors. Effective December 31, 2018, the Makeup Plans were frozen except for any deferrals from bonus payments earned during fiscal 2018 but paid in 2019. The Makeup Plans were replaced by the Albertsons Companies Deferred Compensation Plan effective January 1, 2019, which provides for deferral on substantially the same terms as the Makeup Plans.
Our subsidiary, Safeway, maintained the Safeway Executive Deferred Compensation Program II (the “Safeway Plan” and together with the Makeup Plans and Albertsons Companies Deferred Compensation Plan, the “Deferred Compensation Plans”), which was an unfunded nonqualified deferred compensation arrangement. Designated employees may elect to defer the receipt of up to 100% of their base pay, bonus and incentive payments under the Safeway Plan. Effective December 31, 2018, the Safeway Plan was frozen. The Safeway Plan was replaced by the Albertsons Companies Deferred Compensation Plan effective January 1, 2019.
For fiscal 2019, Messrs. Donald, Sankaran, Dimond, Sampson and Theilmann and Mses. Morris and Rupp were eligible to participate in the Albertsons Companies Deferred Compensation Plan. See the table entitled “Nonqualified Deferred Compensation” below for information with regard to the participation of the NEOs in the Deferred Compensation Plans.
120
401(k) Plan
The Albertsons Companies 401(k) Plan (the “ACI 401(k) Plan”) permits eligible employees to make voluntary,
pre-tax
employee contributions up to a specified percentage of compensation, subject to applicable tax limitations. Eligible employees are also permitted to make voluntaryafter-tax
Roth contributions, up to a specified percentage of compensation, subject to applicable tax limitations. We may make a discretionary matching contribution equal to apre-determined
percentage of an employee’s contributions, subject to applicable tax limitations. On December 30, 2018, we implemented a hard freeze ofnon-union
benefits of employees of the Safeway pension plan. All future benefit accruals fornon-union
employees ceased as of this date. Instead,non-union
Safeway pension plan participants are eligible for the discretionary matching contribution under the ACI 401(k) Plan. Union employees continue to accrue benefits in the Safeway pension plan and are not eligible for matching contributions under the ACI 401(k) Plan. Eligible employees who elect to participate in the ACI 401(k) Plan are generally 50% vested upon completion of two years of service and 100% vested after three years of service in any discretionary matching contribution, and fully vested at all times in their employee contributions. The ACI 401(k) Plan is intended to betax-qualified
under Section 401(a) of the Code. Accordingly, contributions to the ACI 401(k) Plan and income earned on plan contributions are not taxable to employees until withdrawn, and our contributions, if any, will be deductible by us when made. Our board of directors determines the discretionary matching contribution rate under the ACI 401(k) Plan for each year. For the 2019 plan year, our board of directors set a matching contribution rate equal to 50% of an employee’s contribution up to 7% of base salary.Other Benefits
The NEOs participate in the health and dental coverage, Company-paid term life insurance, disability insurance, paid time off and paid holidays programs applicable to other employees in their locality. We also maintain a relocation policy applicable to employees who are required to relocate their residence. These benefits are designed to be competitive with overall market practices and are in place to attract and retain the necessary talent in the business.
Perquisites
The NEOs generally are not entitled to any perquisites that are not otherwise available to all of our employees.
Each of Messrs. Sankaran and Donald is entitled to the use of our corporate aircraft for up to 50 hours per year for himself, his family members and guests at no cost to him, other than the payment of income tax on such usage at the lowest permissible rate. Other executives, generally those with the title of executive vice president or above, may request the personal use of a Company-owned aircraft subject to availability.
For fiscal 2019, Messrs. Dimond and Theilmann and Mses. Morris and Rupp were eligible for financial and tax planning services up to a maximum annual amount of $8,000.
Risk Mitigation
Our compensation committee has assessed the risk associated with our compensation practices and policies for employees, including a consideration of the balance between risk-taking incentives and risk-mitigating factors in our practices and policies. The assessment determined that any risks arising from our compensation practices and policies are not reasonably likely to have a material adverse effect on our business or financial condition.
Impact of Accounting and Tax Matters
As a general matter, the compensation committee is responsible for reviewing and considering the various tax and accounting implications of compensation vehicles that we utilize. With respect to accounting matters, the compensation committee examines the accounting cost associated with equity compensation in light of ASC 718.
121
Summary Compensation Table
Name and Principal Position | Year (1) | Salary ($) | Bonus ($)(2) | Unit Awards ($)(3) | Option Awards ($) | Non-Equity Incentive Plan Compensation ($)(4) | Change in Pension Value and Nonqualified Deferred Compensation Earnings ($) | All Other Compensation ($)(5) | Total ($) | |||||||||||||||||||||||||||
(a) | (b) | (c) | (d) | (e) | (f) | (g) | (h) | (i) | (j) | |||||||||||||||||||||||||||
Vivek Sankaran President and Chief Executive Officer (6) | 2019 | 1,280,769 | 5,000,000 | 19,505,086 | — | 2,617,239 | — | 541,798 | 28,944,892 | |||||||||||||||||||||||||||
James L. Donald Co-Chairman, FormerChief Executive Officer (7) | 2019 | 1,528,846 | 218,502 | 9,454,536 | — | 2,064,730 | — | 108,731 | 13,375,345 | |||||||||||||||||||||||||||
2018 | 1,219,231 | 141,385 | 14,814,306 | — | 1,099,814 | — | 71,232 | 17,345,968 | ||||||||||||||||||||||||||||
Robert B. Dimond Executive Vice President and Chief Financial Officer | 2019 | 866,346 | — | — | — | 1,170,014 | — | 34,978 | 2,071,338 | |||||||||||||||||||||||||||
2018 | 800,962 | 76,495 | 2,515,008 | — | 508,674 | — | 52,200 | 3,953,339 | ||||||||||||||||||||||||||||
2017 | 764,904 | 448,734 | — | — | 39,330 | — | 63,768 | 1,316,736 | ||||||||||||||||||||||||||||
Susan Morris Executive Vice President and Chief Operations Officer | 2019 | 917,308 | 135,105 | — | — | 1,238,838 | — | 45,179 | 2,336,430 | |||||||||||||||||||||||||||
2018 | 867,308 | 131,151 | 2,515,008 | — | 550,256 | — | 41,276 | 4,104,999 | ||||||||||||||||||||||||||||
Christine Rupp Executive Vice President and Chief Customer and Digital Officer | 2019 | 184,615 | 1,500,000 | 2,819,320 | — | 243,881 | — | 62,743 | 4,810,559 | |||||||||||||||||||||||||||
Michael Theilmann Executive Vice President and Chief Human Resources Officer | 2019 | 323,077 | 950,000 | 1,634,373 | — | 438,152 | — | 28,917 | 3,374,519 | |||||||||||||||||||||||||||
Shane Sampson Former Chief Marketing and Merchandising Officer (8) | 2019 | 484,615 | 14,280 | — | — | 647,519 | — | 4,230,333 | 5,376,747 | |||||||||||||||||||||||||||
2018 | 900,000 | 146,457 | 2,515,008 | — | 570,078 | — | 56,229 | 4,187,772 | ||||||||||||||||||||||||||||
2017 | 886,538 | 436,403 | 4,968,425 | — | 45,578 | — | 72,574 | 6,409,518 | ||||||||||||||||||||||||||||
| 1. | Reflects a 53-week year ended February 29, 2020 and a52-week year ended February 23, 2019 and February 24, 2018. |
| 2. | Reflects retention bonuses and tax bonuses paid to the NEOs, as set forth in the table below. The retention bonuses for fiscal 2019, fiscal 2018 and fiscal 2017 are further described in “—Compensation Discussion and Analysis.” Tax bonuses for fiscal 2019, fiscal 2018 and fiscal 2017 were paid to the NEOs in connection with the vesting of Phantom Units as described in “—Compensation Discussion and Analysis.” |
Name | Fiscal Year (1) | Retention Bonus ($) | Sign On Bonus ($) | Tax Bonus ($) | ||||||||||||
Vivek Sankaran | 2019 | — | 5,000,000 | — | ||||||||||||
James L. Donald | 2019 | — | — | 218,502 | ||||||||||||
2018 | — | — | 141,385 | |||||||||||||
Robert B. Dimond | 2019 | — | — | — | ||||||||||||
2018 | — | — | 76,495 | |||||||||||||
2017 | 375,000 | — | 73,734 | |||||||||||||
Susan Morris | 2019 | — | — | 135,105 | ||||||||||||
2018 | 21,875 | — | 109,276 | |||||||||||||
Christine Rupp | 2019 | — | 1,500,000 | — | ||||||||||||
Michael Theilmann | 2019 | — | 950,000 | — | ||||||||||||
Shane Sampson | 2019 | — | — | 14,280 | ||||||||||||
2018 | — | — | 146,457 | |||||||||||||
2017 | 310,000 | — | 126,403 | |||||||||||||
| 3. | Reflects the grant date fair value calculated in accordance with ASC 718 of the (a) Class B-1 Units in Albertsons Investor and KIM ACI and Class B-2 Units in Albertsons Investor and KIM ACI granted to Mr. Sankaran in fiscal 2019, and (b) the Phantom Units granted to Mr. Donald in fiscal 2019 and fiscal 2018, to Mr. Dimond in fiscal 2018, to Mr. Sampson in fiscal 2018 and fiscal 2017, to Ms. Morris in fiscal 2018, to Ms. Rupp in fiscal 2019 and to Mr. Theilmann in fiscal 2019. The respective fair value of the Class B-1 Units and Class B-2 Units in Albertsons Investor, Class B-1 Units and Class B-2 Units in KIM ACI and Phantom Units is determined using an option pricing model, adjusted for lack of marketability and using an expected term or time to liquidity based on judgments made by management. |
122
| 4. | Reflects amounts paid to the NEOs under our bonus plan for the applicable fiscal year, as set forth in the table below: |
Name | Fiscal Year (1) | Fiscal Quarterly Bonus ($) | Fiscal Year Annual Bonus ($) | |||||||||
Vivek Sankaran | 2019 | 1,058,184 | 1,559,055 | |||||||||
James L. Donald | 2019 | 840,583 | 1,224,147 | |||||||||
2018 | 485,760 | 614,054 | ||||||||||
Robert B. Dimond | 2019 | 476,330 | 693,683 | |||||||||
2018 | 218,045 | 290,629 | ||||||||||
2017 | 39,330 | — | ||||||||||
Susan Morris | 2019 | 504,350 | 734,488 | |||||||||
2018 | 235,553 | 314,703 | ||||||||||
Christine Rupp | 2019 | 93,750 | 150,131 | |||||||||
Michael Theilmann | 2019 | 179,464 | 258,688 | |||||||||
Shane Sampson | 2019 | 259,487 | 388,032 | |||||||||
2018 | 243,513 | 326,565 | ||||||||||
2017 | 45,578 | — | ||||||||||
| 5. | A detailed breakdown of “All Other Compensation” is provided in the table below: |
Name | Fiscal Year (1) | Aircraft ($)(a) | Relocation ($) | Life Insurance ($)(b) | Other Payments ($) | Financial/ Tax Planning ($) | Makeup Plan Company Contribution ($)(b) | 401(k) Plan Company Contribution ($) | Total ($) | |||||||||||||||||||||||||||
Vivek Sankaran | 2019 | 358,097 | (c) | 100,624 | (d) | 8,937 | — | 74,140 | — | — | 541,798 | |||||||||||||||||||||||||
James L. Donald | 2019 | 38,577 | — | — | 70,154 | (e) | — | — | — | 108,731 | ||||||||||||||||||||||||||
2018 | 71,232 | — | — | — | — | — | — | 71,232 | ||||||||||||||||||||||||||||
Robert B. Dimond | 2019 | — | — | — | — | 3,150 | 26,785 | 5,043 | 34,978 | |||||||||||||||||||||||||||
2018 | — | — | — | — | 3,880 | 39,070 | 9,250 | 52,200 | ||||||||||||||||||||||||||||
2017 | — | — | — | — | 6,715 | 48,053 | 9,000 | 63,768 | ||||||||||||||||||||||||||||
Susan Morris | 2019 | 8,699 | — | — | — | 2,150 | 29,661 | 4,669 | 45,179 | |||||||||||||||||||||||||||
2018 | — | — | — | — | 4,400 | 27,626 | 9,250 | 41,276 | ||||||||||||||||||||||||||||
Christine Rupp | 2019 | — | 62,743 | — | — | — | — | — | 62,743 | |||||||||||||||||||||||||||
Michael Theilmann | 2019 | — | 27,139 | — | — | 1,778 | — | — | 28,917 | |||||||||||||||||||||||||||
Shane Sampson | 2019 | — | — | — | 4,187,756 | (f) | 5,650 | 31,982 | 4,945 | 4,230,333 | ||||||||||||||||||||||||||
2018 | 1,203 | — | — | — | 4,300 | 41,476 | 9,250 | 56,229 | ||||||||||||||||||||||||||||
2017 | 5,698 | — | — | — | 6,065 | 51,811 | 9,000 | 72,574 | ||||||||||||||||||||||||||||
| (a) | Represents the aggregate incremental cost to us for personal use of our aircraft. |
| (b) | Reflects our contributions to the NEO’s Deferred Compensation Plan account in an amount equal to the excess of the amount we would contribute to the ACI 401(k) Plan as a Company contribution on the NEO’s behalf for the plan year without regard to any limitations imposed by the Code based on the NEO’s compensation over the amount of our actual contributions to the ACI 401(k) Plan for the plan year. |
| (c) | Reflects the aggregate incremental cost to us for personal use of our aircraft by Mr. Sankaran during fiscal 2019. |
| (d) | Includes $21,462 of tax gross up in connection with Mr. Sankaran’s relocation benefits. |
| (e) | Represents payments made to Mr. Donald during fiscal 2019 related to accrued paid time off. |
| (f) | Represents the total severance benefits paid to Mr. Sampson in connection with his resignation during fiscal 2019 consisting of (i) a lump sum payment equal to 200% of the sum of Mr. Sampson’s then-current base salary plus target bonus, and (ii) reimbursement of the cost of continuation coverage of group health coverage for a period of up to 18 months. |
| 6. | Mr. Sankaran commenced serving as President and Chief Executive Officer effective April 25, 2019. |
| 7. | Mr. Donald served as President and Chief Executive Officer through April 25, 2019 and then as Co-Chairman. |
| 8. | Mr. Sampson served as Chief Marketing and Chief Merchandising Officer through September 7, 2019. |
123
Grants of Plan Based Awards in Fiscal 2019
Estimated Future Payouts Under Non-Equity IncentivePlan Awards (1) | Estimated Future Payouts Under Equity Incentive Plan Awards (2) | All Other Unit Awards: Number of Units (#) | All Other Option Awards: Number of Securities Underlying Options (#) | Exercise or Base Price of Option Awards ($/Unit) | Grant Date Fair Value of Unit and Option Awards ($) | |||||||||||||||||||||||||||||||||||||||
Name | Grant Date | Threshold ($) | Target ($) | Maximum ($) | Threshold ($) | Target ($) | Maximum ($) | |||||||||||||||||||||||||||||||||||||
Vivek Sankaran | — | 2,250,000 | 4,500,000 | — | — | — | — | — | — | — | ||||||||||||||||||||||||||||||||||
4/25/2019 | — | — | — | — | — | — | 1,168,578 | (3) | — | — | 17,575,413 | (6) | ||||||||||||||||||||||||||||||||
4/25/2019 | — | — | — | — | — | — | 1,176,630 | (4) | — | — | 1,929,673 | (7) | ||||||||||||||||||||||||||||||||
James L. Donald | — | 1,500,000 | 3,000,000 | — | — | — | — | — | — | — | ||||||||||||||||||||||||||||||||||
9/11/2019 | — | — | — | — | 4,727,268 | 5,672,722 | — | — | — | — | ||||||||||||||||||||||||||||||||||
9/11/2019 | — | — | — | — | — | — | 121,212 | (5) | — | — | 4,727,268 | (8) | ||||||||||||||||||||||||||||||||
Robert B. Dimond | — | 850,000 | 1,700,000 | — | — | — | — | — | — | — | ||||||||||||||||||||||||||||||||||
Susan Morris | — | 900,000 | 1,800,000 | — | — | — | — | — | — | — | ||||||||||||||||||||||||||||||||||
Christine Rupp | — | 750,000 | 1,500,000 | — | — | — | — | — | — | — | ||||||||||||||||||||||||||||||||||
2/7/2019 | — | — | — | — | 768,040 | 921,648 | — | — | — | — | ||||||||||||||||||||||||||||||||||
2/7/2019 | — | — | — | — | — | — | 51,282 | (5) | — | — | 2,051,280 | (8) | ||||||||||||||||||||||||||||||||
Michael Theilmann | — | 600,000 | 1,200,000 | — | — | — | — | — | — | — | ||||||||||||||||||||||||||||||||||
10/29/2019 | — | — | — | — | 747,981 | 897,577 | — | — | — | — | ||||||||||||||||||||||||||||||||||
10/29/2019 | — | — | — | — | — | — | 22,728 | (5) | — | — | 886,392 | (8) | ||||||||||||||||||||||||||||||||
Shane Sampson | — | 900,000 | 1,800,000 | — | — | — | — | — | — | — | ||||||||||||||||||||||||||||||||||
| 1. | Amounts represent the range of annual cash incentive awards the NEO was potentially entitled to receive based on the achievement of performance goals for fiscal 2019 under our 2019 Bonus Plan as more fully described in “—Compensation Discussion and Analysis.” The amounts actually paid are reported in the Non-Equity Incentive Plan column of the Summary Compensation table. Pursuant to the 2019 Bonus Plan, performance below a specific threshold will result in no payment with respect to that performance goal. Performance at or above the threshold will result in a payment from $0 up to the maximum bonus amounts reflected in the table. |
| 2. | Amounts represent the value of Phantom Units subject to performance-based Phantom Units granted to the NEOs as described in “—Compensation Discussion and Analysis—Incentive Plans.” |
| 3. | Represents Class B-1 Units and Class B-2 Units in Albertsons Investor. |
| 4. | Represents Class B-1 Units and Class B-2 Units in KIM ACI. |
| 5. | Amounts represent the value of Phantom Units granted to the NEOs as described in “—Compensation Discussion and Analysis—Incentive Plans.” |
| 6. | Reflects the grant date fair value of $15.04 per unit with respect to the Class B-1 Units and Class B-2 Units in Albertsons Investor granted to Mr. Sankaran. One Class B-1 or Class B-2 Unit in Albertsons Investor is not equivalent to one share of Company common stock. The fair value of the Class B-1 Units and Class B-2 Units in Albertsons Investor is calculated in accordance with ASC 718. The fair value of the Phantom Units is determined using an option pricing model, adjusted for lack of marketability and using an expected term or time to liquidity based on judgments made by management. |
| 7. | Reflects the grant date fair value of $1.64 per unit with respect to the Class B-1 Units and Class B-2 Units in KIM ACI granted to Mr. Sankaran. One Class B-1 or Class B-2 Unit in KIM ACI is not equivalent to one share of Company common stock. The fair value of the Class B-1 Units and Class B-2 Units in KIM ACI is calculated in accordance with ASC 718. The fair value of the Phantom Units is determined using an option pricing model, adjusted for lack of marketability and using an expected term or time to liquidity based on judgments made by management. |
| 8. | Reflects the grant date fair value of $39.00 per unit with respect to the Phantom Units granted to Mr. Theilmann on October 29, 2019 and Mr. Donald on September 11, 2019 and $40.00 per unit with respect to the Phantom Units granted to Ms. Rupp on February 7, 2020, as calculated in accordance with ASC 718. One Phantom Unit is not equivalent to one share of Company common stock. The fair value of the Phantom Units is determined using an option pricing model, adjusted for lack of marketability and using an expected term or time to liquidity based on judgments made by management. |
124
Outstanding Equity Awards at February 29, 2020
Option Awards | Unit Awards | |||||||||||||||||||||||||||||||||||
Name | Number of Securities Underlying Unexercised Options (#) Exercisable | Number of Securities Underlying Unexercised Options (#) Unexercisable | Equity Incentive Plan Awards: Number of Securities Underlying Unexercised Unearned Options (#) | Option Exercise Price ($) | Option Expiration Date | Number of Units That Have Not Vested (#) | Fair Value of Units That Have Not Vested ($) | Equity Incentive Plan Awards: Number of Unearned Units or Other Rights That Have Not Vested (#) | Equity Incentive Plan Awards: Fair or Payout Value of Unearned Units or Other Rights That Have Not Vested ($) | |||||||||||||||||||||||||||
Vivek Sankaran | — | — | — | — | — | 1,168,578 | (1) | 21,817,351 | (3) | — | — | |||||||||||||||||||||||||
— | — | — | — | — | 1,176,630 | (2) | 2,388,559 | (4) | — | — | ||||||||||||||||||||||||||
James L. Donald | — | — | — | — | — | 248,287 | (5) | 12,662,637 | (6) | 204,545 | (7) | 10,431,795 | (6) | |||||||||||||||||||||||
Robert B. Dimond | — | — | — | — | — | 39,949 | (5) | 2,037,399 | (6) | 26,198 | (7) | 1,336,098 | (6) | |||||||||||||||||||||||
Susan Morris | — | — | — | — | — | 106,177 | (5) | 5,415,027 | (6) | 26,198 | (7) | 1,336,098 | (6) | |||||||||||||||||||||||
Christine Rupp | — | — | — | — | — | 53,494 | (5) | 2,728,194 | (6) | 17,094 | (7) | 871,794 | (6) | |||||||||||||||||||||||
Michael Theilmann | — | — | — | — | — | 26,956 | (5) | 1,374,756 | (6) | 15,152 | (7) | 772,752 | (6) | |||||||||||||||||||||||
Shane Sampson | — | — | — | — | — | — | — | — | — | |||||||||||||||||||||||||||
| 1. | Reflects 584,289 unvested Class B-1 Units and 584,289 Class B-2 Units in Albertsons Investor that will vest based on Mr. Sankaran’s continued service or a combination of service and the achievement of performance targets, as follows: |
Vesting Date | Number of Class B-1 Units Vesting Basedon Continued Service | Number of Class B-2 Units Vesting Basedon Continued Service and Performance | ||||||
4/25/2020 | 64,921 | — | ||||||
4/25/2021 | 129,842 | — | ||||||
2/26/2022 | — | 194,763 | ||||||
4/25/2022 | 194,763 | — | ||||||
2/25/2023 | — | 194,763 | ||||||
4/25/2023 | 129,842 | — | ||||||
2/24/2024 | — | 194,763 | ||||||
4/25/2024 | 64,921 | — | ||||||
| 2. | Reflects 588,315 unvested Class B-1 Units and 588,315 unvested Class B-2 Units in KIM ACI held by Mr. Sankaran that will vest based on Mr. Sankaran’s continued service or a combination of service and the achievement of performance targets, as follows: |
Vesting Date | Number of Class B-1 Units Vesting Basedon Continued Service | Number of Class B-2 Units Vesting Basedon Continued Service and Performance | ||||||
4/25/2020 | 65,369 | — | ||||||
4/25/2021 | 130,737 | — | ||||||
2/26/2022 | — | 196,105 | ||||||
4/25/2022 | 196,105 | — | ||||||
2/25/2023 | — | 196,105 | ||||||
4/25/2023 | 130,736 | — | ||||||
2/24/2024 | — | 196,105 | ||||||
4/25/2024 | 65,368 | — | ||||||
If, in connection with this offering, Mr. Sankaran receives equity in the Company in respect of Class
B-1
and Class B-2
Units of each of Albertsons Investor and KIM ACI held by Mr. Sankaran that has a value, based on the initial public offering price, of less than $24.0 million (as equitably adjusted downward for any Class B-2
Units that have been previously forfeited as a result of our failure to achieve annual performance criteria), subject to Mr. Sankaran’s continued employment with us through the date of the offering, Mr. Sankaran would be granted an option with a10-year
term to acquire common stock of the Company having a value, determined in accordance with Black-Scholes methodology, equal to the difference between $24.0 million (as equitably adjusted downward) and the value of the equity in the Company that Mr. Sankaran received in connection with this offering in respect of his Class B-1
and Class B-2
Units. Based on an initial public offering price of $ per share, the midpoint of the estimated offering range set forth on the cover page of this prospectus, Mr. Sankaran’s Class B-1
and Class B-2
Units would convert into shares of restricted common stock of the Company and Mr. Sankaran would receive options to acquire common stock of the Company that has an aggregate value, determined in accordance with Black-Scholes methodology, equal to $ .| 3. | Based on a fair value of $18.67 per Class B-1 Unit and Class B-2 Unit in Albertsons Investor as of February 29, 2020. |
125
| 4. | Based on a fair value of $2.03 per Class B-1 Unit and Class B-2 Unit in KIM ACI as of February 29, 2020. |
| 5. | Reflects the number of unvested Phantom Units held by the NEO that will vest based on either continued service of the individual, or a combination of service of the individual and the achievement of performance targets, as follows: |
Name | Vesting Date | Number of Phantom Units Vesting Based on Continued Service | Number of Phantom Units Vesting Based on Continued Service and Performance | |||||||||
James L. Donald | 9/11/2020 | 82,071 | — | |||||||||
9/11/2021 | 82,070 | — | ||||||||||
2/26/2022 | 43,742 | — | ||||||||||
9/11/2022 | 40,404 | — | ||||||||||
Robert B. Dimond | 11/9/2020 | 13,099 | — | |||||||||
11/9/2021 | 13,099 | — | ||||||||||
2/26/2022 | 13,751 | — | ||||||||||
Susan Morris | 11/9/2020 | 13,099 | — | |||||||||
2/27/2021 | 16,557 | 16,557 | ||||||||||
11/9/2021 | 13,099 | — | ||||||||||
2/26/2022 | 30,308 | 16,557 | ||||||||||
Michael Theilmann | 8/19/2020 | 7,576 | — | |||||||||
8/19/2021 | 7,576 | — | ||||||||||
2/26/2022 | 4,228 | — | ||||||||||
8/19/2022 | 7,576 | — | ||||||||||
Christine Rupp | 12/1/2021 | 25,641 | — | |||||||||
2/26/2022 | 2,212 | — | ||||||||||
12/1/2022 | 12,820 | — | ||||||||||
12/1/2023 | 12,821 | — | ||||||||||
| 6. | Based on a per unit price of $51.00, the aggregate value of one management incentive unit in each of Albertsons Investor and KIM ACI as of February 29, 2020. |
| 7. | Reflects the target number of unvested Phantom Units held by the NEO that could vest on February 26, 2022, subject to the NEO’s continued employment through such date, with the actual number of Phantom Units that could vest (up to a maximum of 120% of the target) based on our achievement of performance targets for fiscal 2020 and fiscal 2021, respectively. In the case of Mr. Donald, this also reflects a target number of 121,212 unvested Phantom Units held by Mr. Donald that could vest on February 26, 2023, subject to Mr. Donald’s continued employment through such date, with the actual number of Phantom Units that could vest (up to a maximum of 120% of the target) based on our achievement of performance targets for fiscal 2020, fiscal 2021 and fiscal 2022, respectively. Depending on the attainment of the performance targets for a particular fiscal year, an NEO’s Phantom Units, if any, in respect of that fiscal year will become vested based only on the NEO’s continued service and would be included in this table in the column entitled “Number of Units that have not vested.” |
Option Exercises and Units Vested in Fiscal 2019
Name | Number of Shares Acquired on Exercise (#) | Value Realized on Exercise ($) | Number of Units Acquired on Vesting (#)(1) | Value Realized on Vesting ($)(2) | ||||||||||||
(a) | (b) | (c) | (d) | (e) | ||||||||||||
Vivek Sankaran | — | — | — | — | ||||||||||||
James L. Donald | — | — | 148,776 | 7,087,572 | ||||||||||||
Robert B. Dimond | — | — | 13,099 | 510,861 | ||||||||||||
Susan Morris | — | — | 79,327 | 3,888,489 | ||||||||||||
Christine Rupp | — | — | — | — | ||||||||||||
Michael Theilmann | — | — | — | — | ||||||||||||
Shane Sampson | — | — | 10,818 | 356,994 | ||||||||||||
| 1. | Reflects the vesting of Phantom Units on February 29, 2020, as described in “—Compensation Discussion and Analysis.” |
| 2. | The value realized upon vesting of the Phantom Units is based on a per unit price of one investor incentive unit in each of Albertsons Investor and KIM ACI on the vesting date. |
126
Nonqualified Deferred Compensation
The following table shows the executive and Company contributions, earnings and account balances for the NEOs under the Deferred Compensation Plans during fiscal 2019. The Deferred Compensation Plans are nonqualified deferred compensation arrangements intended to comply with Section 409A of the Code. See “—Compensation Discussion and Analysis” for a description of the terms and conditions of the Deferred Compensation Plans. The aggregate balance of each participant’s account consists of amounts that have been deferred by the participant, Company contributions, plus earnings (or minus losses). We do not deposit any amounts into any trust or other account for the benefit of plan participants. In accordance with tax requirements, the assets of the Deferred Compensation Plans are subject to claims of our creditors.
Name | Executive Contributions in Last FY ($)(1) | Registrant Contributions in Last FY ($)(2) | Aggregate Earnings in Last FY ($)(3) | Aggregate Withdrawals/ Distributions ($) | Aggregate Balance at Last FYE ($) | |||||||||||||||
(a) | (b) | (c) | (d) | (e) | (f) | |||||||||||||||
Vivek Sankaran | — | — | — | — | — | |||||||||||||||
James L. Donald | — | — | — | — | — | |||||||||||||||
Robert B. Dimond | 25,062 | 26,785 | 60,764 | — | 776,221 | |||||||||||||||
Susan Morris | 27,025 | 29,661 | 54,165 | — | 541,415 | |||||||||||||||
Christine Rupp | — | — | — | — | — | |||||||||||||||
Michael Theilmann | — | — | — | — | — | |||||||||||||||
Shane Sampson | 27,855 | 31,982 | 17,963 | 518,741 | — | |||||||||||||||
| 1. | All executive contributions represent amounts deferred by each NEO under a Deferred Compensation Plan and are included as compensation in the Summary Compensation Table under “Salary,” “Bonus” and “Non-Equity Incentive Plan Compensation.” |
| 2. | All registrant contributions are reported under “All Other Compensation” in the Summary Compensation Table. |
| 3. | These amounts are not reported in the Summary Compensation Table as none of the earnings are based on interest above the market rate. |
Phantom Unit Plan
Our Phantom Unit Plan provides for grants of “Phantom Units” to employees, directors and consultants. Each Phantom Unit provides the participant with a contractual right to receive upon vesting one management incentive unit in Albertsons Investor and one management incentive unit in KIM ACI.
The Phantom Unit Plan provides that we may provide for a participant’s Phantom Unit award to include a separate right to receive a tax bonus. A tax bonus entitles a participant to receive a bonus equal to 4% of the fair market value of the management incentive units paid to the participant in respect of vested Phantom Units. Tax bonuses may be paid in cash, management incentive units or a combination thereof.
The Phantom Unit Plan provides that, unless otherwise provided in an award agreement, in the event of the termination of a participant’s service for any reason, any unvested Phantom Units and any rights to a future tax bonus will be forfeited without the payment of consideration. In the event of the termination of a participant’s service for cause (as defined in the participant’s employment agreement), unless otherwise provided in an award agreement, any management incentive units issued with respect to a vested Phantom Unit and any rights to a future tax bonus will be forfeited without the payment of consideration.
Upon the consummation of the offering, all outstanding Phantom Units will be converted to restricted stock units that will be settled upon vesting in shares of our common stock. The restricted stock units will be subject to a Restricted Stock Unit Plan that will have substantially the same terms as, and will supersede, the Phantom Unit Plan except that no new awards may be granted thereunder. As of the date of this prospectus, there are outstanding awards of Phantom Units that, based on an initial public offering price of $ per share, the midpoint of the estimated offering range set forth on the cover page of this prospectus, would convert into restricted stock units.
127
Potential Payments Upon Termination or Change of Control
The tables below describe and estimate the amounts and benefits that the NEOs would have been entitled to receive upon a termination of their employment in certain circumstances or, if applicable, upon a change of control, assuming such events occurred as of February 29, 2020 (based on the plans and arrangements in effect on such date). The estimated payments are not necessarily indicative of the actual amounts any of the NEOs would have received in such circumstances. The tables exclude compensation amounts accrued through February 29, 2020 that would be paid in the normal course of continued employment, such as accrued but unpaid salary, payment for accrued but unused vacation and vested account balances under our retirement plans that are generally available to all of our salaried employees.
Vivek Sankaran
Payments and Benefits | Death or Disability ($) | For Cause or Without Good Reason ($) | Without Cause or for Good Reason ($) | Change in Control – Without Cause or for Good Reason ($) | ||||||||||||
Cash Payments | 5,375,000 | (1) | — | 7,500,000 | (2) | 7,500,000 | (2) | |||||||||
Health Benefits (3) | 14,087 | — | 14,087 | 14,087 | ||||||||||||
Total | 5,389,087 | — | 7,514,087 | 7,514,087 | ||||||||||||
| 1. | Reflects a lump sum cash payment in an amount equal to the sum of (i) any earned but unpaid bonus with respect to any completed performance period prior to the date of termination, (ii) a lump sum payment in an amount equal to 25% of Mr. Sankaran’s base salary, (iii) a bonus for the fiscal year of termination based on actual performance metrics for the fiscal year in which termination occurs, but prorated based on the number of days of service during the applicable fiscal year through the termination date and (iv) payment of the unvested or unpaid portions of the sign-on retention award. |
| 2. | Reflects a lump sum cash payment equal to the sum of (i) any earned but unpaid bonus with respect to any completed performance period prior to the date of termination, (ii) a lump sum payment in an amount equal to 200% of the sum of Mr. Sankaran’s base salary plus target bonus, (iii) a bonus for the fiscal year of termination based on actual performance metrics for the fiscal year in which termination occurs, but prorated based on the number of days of service during the applicable fiscal year through the termination date and (iv) payment of the unvested or unpaid portions of the sign-on retention award. |
| 3. | Reflects the cost of reimbursement for up to 18 months continuation of health coverage. |
James L. Donald
Payments and Benefits | Death or Disability ($) | For Cause or Without Good Reason | Without Cause or for Good Reason ($) | Change in Control – Without Cause or for Good Reason ($) | ||||||||||||
Cash Payments | 375,000 | (1) | — | 6,000,000 | (2) | 6,000,000 | (2) | |||||||||
Health Benefits | — | — | 20,825 | (3) | 20,825 | (3) | ||||||||||
Total | 375,000 | — | 6,020,825 | 6,020,825 | ||||||||||||
| 1. | Reflects a lump sum cash payment in an amount equal to 25% of Mr. Donald’s base salary. |
| 2. | Reflects a lump sum cash payment equal to the sum of Mr. Donald’s base salary and target bonus for 24 months. |
| 3. | Reflects the cost of reimbursement for up to 18 months continuation of health coverage. |
128
Robert B. Dimond
Payments and Benefits | Death or Disability ($) | For Cause or Without Good Reason | Without Cause or for Good Reason ($) | Change in Control – Without Cause or for Good Reason ($) | ||||||||||||
Cash Payments | 212,500 | (1) | — | 3,400,000 | (2) | 3,400,000 | (2) | |||||||||
Health Benefits | — | — | 13,822 | (3) | 13,822 | (3) | ||||||||||
Total | 212,500 | — | 3,413,822 | 3,413,822 | ||||||||||||
| 1. | Reflects a lump sum cash payment in an amount equal to 25% of Mr. Dimond’s base salary. |
| 2. | Reflects a lump sum cash payment equal to the sum of Mr. Dimond’s base salary and target bonus for 24 months. |
| 3. | Reflects the cost of reimbursement for up to 12 months continuation of health coverage. |
Susan Morris
Payments and Benefits | Death or Disability ($) | For Cause or Without Good Reason | Without Cause or for Good Reason ($) | Change in Control – Without Cause or for Good Reason ($) | ||||||||||||
Cash Payments | 225,000 | (1) | — | 3,600,000 | (2) | 3,600,000 | (2) | |||||||||
Health Benefits | — | — | 7,889 | (3) | 7,889 | (3) | ||||||||||
Total | 225,000 | — | 3,607,889 | 3,607,889 | ||||||||||||
| 1. | Reflects a lump sum cash payment in an amount equal to 25% of Ms. Morris’s base salary. |
| 2. | Reflects a lump sum cash payment equal to the sum of Ms. Morris’s base salary and target bonus for 24 months. |
| 3. | Reflects the cost of reimbursement for up to 12 months continuation of health coverage. |
Christine Rupp
Payments and Benefits | Death or Disability ($) | For Cause or Without Good Reason | Without Cause or for Good Reason ($) | Change in Control – Without Cause or for Good Reason ($) | ||||||||||||
Cash Payments | 187,500 | (1) | — | 3,000,000 | (2) | 3,000,000 | (2) | |||||||||
Health Benefits | — | — | 7,738 | (3) | 7,738 | (3) | ||||||||||
Total | 187,500 | — | 3,007,738 | 3,007,738 | ||||||||||||
| 1. | Reflects a lump sum cash payment in an amount equal to 25% of Ms. Rupp’s base salary. |
| 2. | Reflects a lump sum cash payment equal to the sum of Ms. Rupp’s base salary and target bonus for 24 months. |
| 3. | Reflects the cost of reimbursement for up to 12 months continuation of health coverage. |
Michael Theilmann
Payments and Benefits | Death or Disability ($) | For Cause or Without Good Reason | Without Cause or for Good Reason ($) | Change in Control – Without Cause or for Good Reason ($) | ||||||||||||
Cash Payments | 150,000 | (1) | — | 2,400,000 | (2) | 2,400,000 | (2) | |||||||||
Health Benefits | — | — | 10,862 | (3) | 10,862 | (3) | ||||||||||
Total | 150,000 | — | 2,410,862 | 2,410,862 | ||||||||||||
129
| 1. | Reflects a lump sum cash payment in an amount equal to 25% of Mr. Theilmann’s base salary. |
| 2. | Reflects a lump sum cash payment equal to 200% of Mr. Theilmann’s base salary plus target annual bonus. |
| 3. | Reflects the cost of reimbursement for up to 12 months continuation of health coverage. |
In addition to the foregoing, Mr. Sankaran would become vested in a portion of his Class
B-1
Units and Class B-2
Units in Albertsons Investor and KIM ACI as set forth in the table below (based on a per unit price of $18.67, the value of one Class B-1
Unit and Class B-2
Unit in Albertsons Investor and based on a per unit price of $2.03, the value of one Class B-1
Unit and Class B-2
Unit in KIM ACI as of February 29, 2020).Units | Death or Disability ($) | For Cause or Without Good Reason ($) | Without Cause or for Good Reason ($) | Change in Control – Without Cause or for Good Reason ($) | Change in Control – Death or Disability ($) | |||||||||||||||
Albertsons Investor Class B-1 Units | 1,029,434 | — | 1,212,075 | 10,908,676 | 10,908,676 | |||||||||||||||
Albertsons Investor Class B-2 Units | 1,212,075 | — | 1,212,075 | 10,908,676 | 10,908,676 | |||||||||||||||
KIM ACI Class B-1 Units | 112,702 | — | 132,698 | 1,194,279 | 1,194,279 | |||||||||||||||
KIM ACI Class B-2 Units | 132,698 | — | 132,698 | 1,194,279 | 1,194,279 | |||||||||||||||
Total | 2,486,909 | — | 2,689,546 | 24,205,910 | 24,205,910 | |||||||||||||||
In addition to the foregoing, each of Messrs. Donald, Dimond and Theilmann and Mses. Morris and Rupp would have been entitled to full vesting of his or her unvested Phantom Units in the amounts set forth in the table below (based on a per unit price of $51.00, the aggregate value of one incentive unit in each of Albertsons Investor and KIM ACI as of February 29, 2020) if following a change of control the respective NEO’s employment terminated due to death or disability or by us without cause on February 29, 2020.
NEO | Number of Vesting Phantom Units (#) | Value of Vesting Phantom Units ($) | Tax Bonus ($) | |||||||||
James L. Donald | 452,832 | 23,094,432 | — | |||||||||
Robert B. Dimond | 66,147 | 3,373,497 | — | |||||||||
Susan Morris | 132,375 | 6,751,125 | 135,105 | |||||||||
Christine Rupp | 70,588 | 3,599,988 | — | |||||||||
Michael Theilmann | 42,108 | 2,147,508 | — | |||||||||
130
CERTAIN RELATIONSHIPS AND RELATED PARTY TRANSACTIONS
The following discussion is a brief summary of certain material arrangements, agreements and transactions we have with related parties. It does not include all of the provisions of our material arrangements, agreements and transactions with related parties, does not purport to be complete and is qualified in its entirety by reference to the arrangements, agreements and transactions described. We enter into transactions with our Sponsors and other entities owned by, or affiliated with, our Sponsors in the ordinary course of business. These transactions include, amongst others, professional advisory, consulting and other corporate services.
Our board of directors has adopted a written policy (the “Related Party Policy”) and procedures for the review, approval or ratification of “Related Party Transactions” by the independent members of the audit and risk committee of our board of directors. For purposes of the Related Party Policy, a “Related Party Transaction” is any transaction, arrangement or relationship or series of similar transactions, arrangements or relationships (including the incurrence or issuance of any indebtedness or the guarantee of indebtedness) in which (1) the aggregate amount involved will or may be reasonably expected to exceed $120,000 in any fiscal year, (2) we or any of our subsidiaries is a participant and (3) any related party has or will have a direct or indirect material interest.
We paid COAC, an affiliate of Cerberus, fees totaling approximately $0.3 million, $0.5 million and $0.5 million for fiscal 2019, fiscal 2018 and fiscal 2017, respectively, for consulting services provided in connection with improving our operations.
We paid CTS, an affiliate of Cerberus, fees totaling approximately $4.4 million for fiscal 2019 for information technology advisory and implementation services in connection with modernizing our information systems. We paid no fees to CTS in fiscal 2018 and fiscal 2017.
Several of our board members are employees of our Sponsors (excluding Kimco), and funds managed by one or more affiliates of our Sponsors indirectly own a substantial portion of our equity through their respective ownership of Albertsons Investor and KIM ACI.
On August 19, 2019, Shane Sampson, who served as our Executive Vice President and Chief Marketing & Merchandising Officer, voluntarily resigned from the Company, effective September 7, 2019, and, on August 21, 2019, entered into the Sampson Separation Agreement. Pursuant to the Sampson Separation Agreement, in consideration for Mr. Sampson’s release of claims, we agreed to treat Mr. Sampson’s resignation in the same manner as if he were terminated without cause and to provide Mr. Sampson with the severance payments and benefits under his employment agreement. Pursuant to the Sampson Separation Agreement, Mr. Sampson acknowledged and agreed that he remains subject to the
24-month
post-terminationnon-competition
andnon-solicitation
provisions set forth in his employment agreement.On July 2, 2019, we closed a sale and leaseback transaction for a distribution center with a counterparty which is also an investor in certain funds managed by Cerberus, including funds that are indirect equityholders of the Company. We received gross sales proceeds of approximately $278 million and entered into a lease agreement for the distribution center for an initial term of 15 years with an initial annual rent payment for the property of approximately $12 million.
On January 3, 2019, we closed a three-store sale and leaseback transaction with entities affiliated with Kimco. We received gross sales proceeds of approximately $31 million and entered into lease agreements for each of the three stores for initial terms of 20 years with an initial annual rent payment for the properties of approximately $2 million.
On January 1, 2019, we terminated a store lease with an entity affiliated with Kimco. We received a termination fee of $5.5 million and entered into a use restriction agreement that restricts use of the premises for a supermarket or grocery store until the earlier of August 31, 2027 or the date we no longer operate a supermarket or grocery store at two benefited properties for at least two years (excluding force majeure).
131
Stock Repurchases
We intend to use the anticipated net proceeds, together with cash on hand, from the offering of Series A preferred stock for the Repurchase. The Repurchase is conditioned upon the consummation of the offering of Series A preferred stock and the receipt of funds therefrom. The initial estimated net proceeds of $ , together with cash on hand, will be used to repurchase an aggregate of shares of outstanding common stock from two of our
Pre-IPO
Stockholders, Albertsons Investor and KIM ACI, at a price equal to the initial public offering price of the shares of common stock sold in this offering, after deducting underwriting discounts and commissions. Furthermore, the proceeds received by Albertsons Investor and KIM ACI from the Repurchase will be distributed to their members, which include our Sponsors and certain members of our management. As well, if the underwriters in the Series A preferred offering exercise their over-allotment option in full, an additional $ in net proceeds will be available and such additional net proceeds, together with cash on hand, will be used to repurchase an additional aggregate of shares of outstanding common stock from our Sponsors, on apro-rata
basis relative to their respective holdings in the Company, at the same price.During fiscal 2018, we repurchased 1,772,018 shares of common stock allocable to certain current and former members of management (the “Management Holders”) for $25.8 million in cash. The shares are classified as treasury stock on the Consolidated Balance Sheet included elsewhere in this prospectus. The shares repurchased represented a portion of the shares allocable to management. Proceeds from the repurchase were used by the Management Holders to repay outstanding loans of the Management Holders with a third party financial institution. As there is no current active market for shares of our common stock, the shares were repurchased at a negotiated price between us and the Management Holders.
Management Fees
Pursuant to our governing documents and that of our predecessor, AB Acquisition, we paid annual management fees of $13.75 million to our Sponsors for fiscal 2016, fiscal 2017, fiscal 2018 and fiscal 2019. In exchange for the management fees, our Sponsors have provided strategic advice to management, including with respect to acquisitions and financings. For fiscal 2020, all management fees owed by us to our Sponsors will be paid quarterly and any remaining obligations will terminate at the closing of this offering.
Stockholders’ Agreement
As of the closing of this offering, we will enter into the Stockholders’ Agreement. The Stockholders’ Agreement will provide for designation rights for the Sponsors to nominate directors to the board of directors. Pursuant to the Stockholders’ Agreement, we will be required to appoint to our board of directors individuals designated by and voted for by our Sponsors. If Cerberus (or a permitted transferee or assignee) has beneficial ownership of at least 20% of our then-outstanding common stock, it shall have the right to designate four directors to our board of directors. If Cerberus (or a permitted transferee or assignee) owns less than 20% but at least 10% of our then-outstanding common stock, it shall have the right to designate two directors to our board of directors. If Cerberus (or a permitted transferee or assignee) owns less than 10% but at least 5% of our then-outstanding common stock, it shall have the right to designate one director to our board of directors. If Klaff Realty (or a permitted transferee or assignee) owns at least 5% of our then-outstanding common stock, it shall have the right to designate one director to our board of directors. If Schottenstein Stores (or a permitted transferee or assignee) owns at least 5% of our then-outstanding common stock, it shall have the right to designate one director to our board of directors.
Registration Rights Agreement
As of the closing of this offering, we will enter into a registration rights agreement with each of our stockholders as of immediately prior to the closing of this offering (the
“Pre-IPO
Stockholders”). Pursuant to the registration rights agreement, we will grant certainPre-IPO
Stockholders certain registration rights with respect132
to the registrable securities. These rights will include certain demand registration rights for our Sponsors, as well as “piggyback” registration rights for certain
Pre-IPO
Stockholders. The registration rights only apply to registrable securities, and shares cease to be registrable securities under certain conditions including (i) they are sold pursuant to an effective registration statement, (ii) they are sold pursuant to Rule 144 under the Securities Act, or (iii) they are eligible to be resold without regard to the volume or public information requirements of Rule 144 and the resale of such shares is not prohibited by thelock-up
agreements described below. The registration rights are subject to certain delay, suspension and cutback provisions.The registration rights agreement includes customary indemnification and contribution provisions. All fees, costs and expenses related to registrations generally will be borne by us, other than underwriting discounts and commissions attributable to the sale of registrable securities.
The
Pre-IPO
Stockholders may be required to deliverlock-up
agreements to underwriters in connection with registered offerings of shares.Demand Registration Rights for Non-Shelf Registered Offerings
S-3,
our Sponsors will be limited to a single demand right for an underwritten offering pursuant to a registration statement on FormS-1.
Such registration statement would be required to include at least 5% of the total number of shares of our common stock outstanding immediately prior to this offering, which we refer to as thepre-IPO
common stock, or all of the remaining registrable securities of the demanding holder, and such request will require the consent of the holders of at least a majority of the outstanding registrable securities.Shelf Registration Rights
S-3,
the registration rights agreement will grant our Sponsors certain rights to demand that we file a shelf registration statement covering any registrable securities thatPre-IPO
Stockholders are permitted to sell pursuant to thelock-up
agreements with us described below or any otherlock-up
restrictions. The number of shares covered by the shelf registration statement may also be reduced by us based on any advice of any potential underwriters, after consultation with us, to limit such number of shares.Demand Registration Rights for Shelf Takedowns
S-1
described above), any such takedown demand would be required to include at least 5% of the registrablepre-IPO
common stock or all of the remaining registrable securities of the demanding holder. Sponsors lose their remaining demand registration rights when they, together with their affiliates, but not including any portfolio companies, cease to beneficially own at least 5% of our common stock. Further, we are not required to effect more than one demand registration in any30-day
period (with such30-day
period commencing on the closing date of any underwritten offering pursuant to a preceding demand registration).“Piggyback” Registration Rights
Pre-IPO
Stockholders “piggyback” registration rights. If we register any of our shares of common stock, either for our own account or for the account of other stockholders, including an exercise of demand rights, certainPre-IPO
Stockholders will be entitled, subject to certain exceptions, to include its shares of common stock in the registration. To the extent that the managing underwriters in an offering advise that the number of shares proposed to be included in the offering exceeds the amount that can be sold without adversely affecting the distribution, the number of shares included in the offering will be limited as follows:| • | in the case of an offering pursuant to a demand under the registration rights agreement, (1) the stockholders that are parties to the registration rights agreement will have first priority to include their registrable securities, (2) we will have second priority to the extent that we elect to sell any shares for our own account and (3) any other holders with registration rights will have third priority; and |
133
| • | in the case of any offering not pursuant to a demand under the registration rights agreement, (1) we will have first priority to the extent that we elect to sell any shares for our own account, (2) the stockholders that are parties to the registration rights agreement will have second priority to include their registrable securities and (3) any other holders with registration rights will have third priority. |
Underwriter Lock-ups
lock-up
agreements to the underwriters of such offering to restrict transfers of their common stock. The restrictions will apply for up to 90 days in connection with or prior to the second underwritten offering demanded pursuant to the registration rights agreement and up to 45 days in connection with any offering thereafter.Suspension Periods
provided
12-month
period andprovided
further
12-month
period.Lock-Up
AgreementsPrior to the closing of this offering, certain
Pre-IPO
Stockholders will deliver alock-up
agreement to us. Pursuant to thelock-up
agreements, for a period of six months after the closing of this offering (the “FirstLock-Up
Period”), suchPre-IPO
Stockholders will agree, subject to certain exceptions, that they will not offer, sell, contract to sell, pledge, grant any option to purchase, make any short sale or otherwise dispose of any shares of common stock or any options or warrants to purchase common stock, or any securities convertible into, exchangeable for or that represent the right to receive common stock, owned by them (whether directly or by means of beneficial ownership) immediately prior to the closing of this offering.Lock-Up
PeriodsBeginning six months after the closing of this offering and for a period of six months (the “Second
Lock-Up
Period”), suchPre-IPO
Stockholders will be permitted to sell up to 25% of the shares of common stock held by suchPre-IPO
Stockholders as of immediately after the closing of this offering and after giving effect to the Repurchase in a registered, underwritten offering pursuant to the registration rights agreement, and may be permitted to sell additional shares to the extent that the managing underwriters of such registered, underwritten offering conclude that additional shares may be sold in such offering without adversely affecting the distribution.For a period of six months after the end of the Second
Lock-Up
Period (the “ThirdLock-Up
Period”), suchPre-IPO
Stockholders will be permitted to sell up to 50% of the shares of common stock held by suchPre-IPO
Stockholders as of immediately after the closing of this offering and after giving effect to the Repurchase, minus the amounts sold in the SecondLock-Up
Period, in a registered, underwritten offering pursuant to the registration rights agreement, and may be permitted to sell additional shares to the extent that the managing underwriters of such registered, underwritten offering conclude that additional shares may be sold in such offering without adversely affecting the distribution.For a period of six months after the end of the Third
Lock-Up
Period (the “FourthLock-Up
Period”), suchPre-IPO
Stockholders will be permitted to sell up to 75% of the shares of common stock held by suchPre-IPO
134
Stockholders as of immediately after the closing of this offering and after giving effect to the Repurchase, minus the amounts sold in the Second
Lock-Up
Period and ThirdLock-Up
Period, in a registered, underwritten offering pursuant to the registration rights agreement, and may be permitted to sell additional shares to the extent that the managing underwriters of such registered, underwritten offering conclude that additional shares may be sold in such offering without adversely affecting the distribution.After the end of the Fourth
Lock-Up
Period, the restrictions of thelock-up
agreements will expire.In addition, to the extent that any
Pre-IPO
Stockholder elects not to participate in a registered, underwritten offering described above or does not elect to sell the maximum number of shares as described above (not including any increase in the number of shares based on the advice of the managing underwriters), suchPre-IPO
Stockholders may sell an equivalent number of shares in anon-underwritten
registered shelf-takedown or an unregistered offering pursuant to Rule 144 or another exemption from registration under the Securities Act.Exceptions
lock-up
agreement, (2) to any trust for the direct or indirect benefit of the undersigned or the immediate family of the undersigned, provided that the trustee of the trust agrees to be bound in writing by the restrictions of thelock-up
agreement, andprovided
further
Pre-IPO
Stockholders or any investment fund or other entity controlled or managed by suchPre-IPO
Stockholders or their affiliates, (but in each case under this clause (3), not including a portfolio company), provided that such person agrees to be bound in writing by the restrictions of thelock-up
agreement, (4) to a nominee or custodian of a person or entity to whom a disposition or transfer would be permissible under clauses (2) through (3) above provided that such person agrees to be bound in writing by the restrictions of thelock-up
agreement, (5) pursuant to an order of a court or regulatory agency, (6) the pledge, hypothecation or other granting of a security interest in suchPre-IPO
Stockholder’s shares to one or more banks or financial institutions as bona fide collateral or security for any loan, advance or extension of credit and any transfer upon foreclosure upon such shares or thereafter or (7) with our prior written consent.Prorata Release
Pre-IPO
Stockholder is permitted by us to sell or otherwise transfer or dispose of any shares of common stock for value (whether in one or multiple releases) then the same percentage of shares of common stock held by the otherPre-IPO
Stockholders subject to thelock-up
agreements will be immediately and fully released on the same terms from any remaininglock-up
restrictions set forth in thelock-up
agreements, subject to a number of exceptions listed therein.135
PRINCIPAL AND SELLING STOCKHOLDERS
The following table sets forth information regarding the beneficial ownership of our common stock as of , 2020, after giving effect to the Distribution and this offering and after giving effect to the Repurchase, by:
| • | the selling stockholders; |
| • | each person who is known by us to beneficially own 5% or more of our outstanding shares of capital stock; |
| • | each member of our board of directors; |
| • | each of our named executive officers; and |
| • | all of our directors and executive officers as a group. |
Beneficial ownership is determined in accordance with the rules of the SEC and generally includes voting or investment power with respect to securities. None of the persons listed in the following table owns any securities that are convertible into common stock at his or her option currently or within 60 days of our listing date on the NYSE. Unless otherwise indicated, the address for each selling stockholder, 5% stockholder, director and executive officer listed below is c/o Albertsons Companies, Inc., 250 Parkcenter Blvd., Boise, Idaho 83706.
Common Stock Beneficially Owned Immediately Prior to the Completion of this Offering(1) | Number of Shares of Common Stock Being Offered | Number of Shares of Common Stock Being Offered Pursuant to Underwriters’ Option | Shares of Common Stock Beneficially Owned After This Offering | Shares of Common Stock Beneficially Owned After The Repurchase | ||||||||||||||||||||||||||||||||||||||||||||
No Exercise of Underwriters’ Option to Purchase Additional Shares | Full Exercise of Underwriters’ Option to Purchase Additional Shares | No Exercise of Underwriters’ Option to Purchase Additional Shares | Full Exercise of Underwriters’ Option to Purchase Additional Shares | |||||||||||||||||||||||||||||||||||||||||||||
Name of Beneficial Owner | Number of Shares | Percen- tage | Number of Shares | Percen- tage | Number of Shares | Percen- tage | Number of Shares | Percen- tage | Number of Shares | Percen- tage | ||||||||||||||||||||||||||||||||||||||
Selling Stockholders: | ||||||||||||||||||||||||||||||||||||||||||||||||
Cerberus Capital Management, L.P.(2) | % | % | % | % | % | |||||||||||||||||||||||||||||||||||||||||||
Klaff Realty, L.P.(3) | % | % | % | % | % | |||||||||||||||||||||||||||||||||||||||||||
Schottenstein Stores Corp.(4) | % | % | % | % | % | |||||||||||||||||||||||||||||||||||||||||||
Funds affiliated with Lubert-Adler (5) | % | % | % | % | % | |||||||||||||||||||||||||||||||||||||||||||
Kimco Realty Corporation(6) | % | % | % | % | % | |||||||||||||||||||||||||||||||||||||||||||
Colfin Safe Holdings, LLC(7) | % | % | % | % | % | |||||||||||||||||||||||||||||||||||||||||||
Mexico Foods Holdings LLC(8) | % | % | % | % | % | |||||||||||||||||||||||||||||||||||||||||||
SK Retail Investment LLC(9) | % | % | % | % | % | |||||||||||||||||||||||||||||||||||||||||||
Robert G. Miller | % | % | % | % | % | |||||||||||||||||||||||||||||||||||||||||||
Justin Dye | % | % | % | % | % | |||||||||||||||||||||||||||||||||||||||||||
Howard Cohen | % | % | % | % | % | |||||||||||||||||||||||||||||||||||||||||||
Richard Navarro | % | % | % | % | % | |||||||||||||||||||||||||||||||||||||||||||
Robert Butler | % | % | % | % | % | |||||||||||||||||||||||||||||||||||||||||||
Andrew Scoggin | % | % | % | % | % | |||||||||||||||||||||||||||||||||||||||||||
Robert Edwards | % | % | % | % | % | |||||||||||||||||||||||||||||||||||||||||||
Paul Rowan | % | % | % | % | % | |||||||||||||||||||||||||||||||||||||||||||
Shane Sampson | % | % | % | % | % | |||||||||||||||||||||||||||||||||||||||||||
Mark Bates | % | % | % | % | % | |||||||||||||||||||||||||||||||||||||||||||
Wayne Denningham | % | % | % | % | % | |||||||||||||||||||||||||||||||||||||||||||
Justin Ewing | % | % | % | % | % | |||||||||||||||||||||||||||||||||||||||||||
Shane Dorcheus | % | % | % | % | % | |||||||||||||||||||||||||||||||||||||||||||
Susan Morris | % | % | % | % | % | |||||||||||||||||||||||||||||||||||||||||||
136
Common Stock Beneficially Owned Immediately Prior to the Completion of this Offering(1) | Number of Shares of Common Stock Being Offered | Number of Shares of Common Stock Being Offered Pursuant to Underwriters’ Option | Shares of Common Stock Beneficially Owned After This Offering | Shares of Common Stock Beneficially Owned After The Repurchase | ||||||||||||||||||||||||||||||||||||||||||||
No Exercise of Underwriters’ Option to Purchase Additional Shares | Full Exercise of Underwriters’ Option to Purchase Additional Shares | No Exercise of Underwriters’ Option to Purchase Additional Shares | Full Exercise of Underwriters’ Option to Purchase Additional Shares | |||||||||||||||||||||||||||||||||||||||||||||
Name of Beneficial Owner | Number of Shares | Percen- tage | Number of Shares | Percen- tage | Number of Shares | Percen- tage | Number of Shares | Percen- tage | Number of Shares | Percen- tage | ||||||||||||||||||||||||||||||||||||||
Other Pre-IPO Stockholders(10) | % | % | % | % | % | |||||||||||||||||||||||||||||||||||||||||||
5% Stockholders: | ||||||||||||||||||||||||||||||||||||||||||||||||
Albertsons Investor Holdings LLC(11) | % | % | % | % | % | |||||||||||||||||||||||||||||||||||||||||||
KIM ACI, LLC(12) | % | % | % | % | % | |||||||||||||||||||||||||||||||||||||||||||
Directors: | ||||||||||||||||||||||||||||||||||||||||||||||||
Vivek Sankaran | % | % | % | % | % | |||||||||||||||||||||||||||||||||||||||||||
James L. Donald | ||||||||||||||||||||||||||||||||||||||||||||||||
Leonard Laufer | ||||||||||||||||||||||||||||||||||||||||||||||||
Sharon L. Allen | % | % | % | % | % | |||||||||||||||||||||||||||||||||||||||||||
Steven A. Davis | % | % | % | % | % | |||||||||||||||||||||||||||||||||||||||||||
Kim Fennebresque | % | % | % | % | % | |||||||||||||||||||||||||||||||||||||||||||
Allen M. Gibson | % | % | % | % | % | |||||||||||||||||||||||||||||||||||||||||||
Hersch Klaff(3) | % | % | % | % | % | |||||||||||||||||||||||||||||||||||||||||||
Jay L. Schottenstein(4) | % | % | % | % | % | |||||||||||||||||||||||||||||||||||||||||||
Alan H. Schumacher | % | % | % | % | % | |||||||||||||||||||||||||||||||||||||||||||
Lenard B. Tessler | % | % | % | % | % | |||||||||||||||||||||||||||||||||||||||||||
B. Kevin Turner | % | % | % | % | % | |||||||||||||||||||||||||||||||||||||||||||
Named Executive Officers: | ||||||||||||||||||||||||||||||||||||||||||||||||
Vivek Sankaran | ||||||||||||||||||||||||||||||||||||||||||||||||
James L. Donald | % | % | % | % | % | |||||||||||||||||||||||||||||||||||||||||||
Robert B. Dimond | % | % | % | % | % | |||||||||||||||||||||||||||||||||||||||||||
Susan Morris | % | % | % | % | % | |||||||||||||||||||||||||||||||||||||||||||
Christine Rupp | ||||||||||||||||||||||||||||||||||||||||||||||||
Michael Theilmann | ||||||||||||||||||||||||||||||||||||||||||||||||
Shane Sampson | % | % | % | % | % | |||||||||||||||||||||||||||||||||||||||||||
All directors and executive officers as a group(3) (20 Persons) | % | % | % | % | % | |||||||||||||||||||||||||||||||||||||||||||
| * | Represents less than 1%. |
| (1) | Percentage of shares beneficially owned prior to this offering is based on shares of our common stock outstanding as of our listing date on the NYSE. |
| (2) | Stephen Feinberg exercises voting and investment authority and may be deemed to have beneficial ownership of shares, or % of our outstanding common stock prior to this offering and % upon the completion of this offering. Messrs. Laufer and Tessler are affiliated with Cerberus. The address for Cerberus is 875 Third Avenue, New York, New York 10022. |
| (3) | Mr. Klaff is affiliated with Klaff Realty, whose affiliated entities have beneficial ownership of shares, or % of our outstanding common stock prior to this offering and % upon the completion of this offering. The address for Klaff Realty is 35 E. Wacker Drive, Suite 2900, Chicago, Illinois 60601. |
| (4) | Mr. Schottenstein is affiliated with Schottenstein Stores, whose affiliated entities have beneficial ownership of shares, or % of our outstanding common stock prior to this offering and % upon the completion of this offering. The address for Schottenstein Stores is 4300 E. Fifth Avenue, Columbus, Ohio 43219. |
| (5) | Consists of shares of common stock held directly by L-A V ABS, LLC (“L-A V ABS”), shares of common stock held directly by Lubert-Adler Real Estate Fund V, L.P. (“L-A RE Fund V”), shares of common stock held directly by Lubert-Adler Real Estate Fund VI, L.P. (“L-A RE Fund VI”), shares of common stock held directly by Lubert-Adler Real Estate Fund VI-A, L.P. (“L-A RE Fund VI-A”), shares of common stock held directly by Lubert-Adler Real Estate Fund VI-B, L.P. (“L-A RE Fund VI-B”) shares of common stock held directly by L-A Saturn Acquisition, L.P. (“L-A Saturn”), and shares of common stock held directly by L-A Asset Management Services, L.P. (“L-A Asset Management Services”) after giving effect to the Distribution. L-A V ABS is managed by its members, Dean S. Adler and Gerald A. Ronon, who can be removed and replaced by L-A RE Fund V, the controlling member of L-A V ABS, with the consent of ABS Opportunities, LLC. Lubert-Adler Group V, L.P. (“L-A Group V”) is the general partner of L-A RE Fund V, and Lubert-Adler Group V, LLC (“L-A Group V LLC”) is the general partner of L-A Group V. Lubert-Adler Group VI, L.P. (“L-A Group VI”) is the general partner of L-A RE Fund VI and L-A RE Fund VI-A, and Lubert-Adler Group VI, LLC (“L-A Group VI LLC”) is the general partner of L-A Group VI. Lubert-Adler Group VI-B, L.P. (“L-A Group VI-B”) is the general partner of L-A RE Fund VI-B, and Lubert-Adler Group VI-B, LLC (“L-A Group VI-B LLC”) is the general partner of L-A Group VI-B. L-A Group Saturn, LLC (“L-A Group Saturn”) is the general partner of L-A Saturn. Lubert-Adler GP - West, LLC (“L-A |
137
| GP - West”) is the general partner of L-A Asset Management Services. Ira M. Lubert and Dean S. Adler are the members of L-A Group V LLC, L-A Group VI LLC, L-A Group VI-B LLC, L-A Group Saturn and L-A GP - West. As a result, each of Mr. Lubert, Mr. Adler, L-A Group V LLC, L-A Group VI LLC, L-A Group VI-B LLC, L-A Group V, L-A Group VI, L-A Group VI-B, L-A Group Saturn and L-A GP - West may be deemed to share beneficial ownership of the shares. Each of the foregoing persons expressly disclaims beneficial ownership of the shares except to the extent of his or its pecuniary interest therein. The address for L-A RE Fund V, L-A RE Fund VI, L-A RE Fund VI-A and L-A RE Fund VI-B, L-A Group V, L-A Group V LLC, L-A Group VI, L-A Group VI LLC, L-A Group VI-B and L-A Group VI-B LLC is 2400 Market Street, Suite 301, Philadelphia, PA 19103-3033. The address for L-A Saturn and L-A Group Saturn is The FMC Tower, 2929 Walnut Street, Suite 1530, Philadelphia, Pennsylvania 19104. The address for L-A Asset Management Services and L-A GP - West is 435 Devon Park Drive, Building 500, Wayne, PA 19087. The address for L-A V ABS is 171 17th Street NW, Suite 1575, Atlanta GA 30363. The address for Ira M. Lubert, Dean S. Adler and Gerald A. Ronon is 2400 Market Street, Suite 301, Philadelphia, PA 19103-3033. |
| (6) | The address for Kimco is 3333 New Hyde Park Road, Suite 100, New Hyde Park, New York 11042. |
| (7) | The address for Colfin Safe Holdings, LLC is c/o Colony NorthStar, Inc., 712 Fifth Avenue, 35th Floor, New York, New York 10019. |
| (8) | The address for Mexico Foods Holdings LLC is 2600 McCree Road, Suite 100, Garland, Texas 75041. |
| (9) | The address for SK Retail Investment LLC is c/o Kimco Realty Corporation, Attention: Ray Edwards and Bruce Rubenstein, 3333 New Hyde Park Road, Suite 100, New Hyde Park, New York 10042. |
| (10) | All of such persons beneficially own, in the aggregate, less than 1% of the common stock outstanding prior to this offering. |
| (11) | Albertsons Investor is held by a private investor group, including affiliates of our Sponsors and certain members of management. The address for Albertsons Investor is 250 Parkcenter Blvd., Boise, ID 83706. |
| (12) | KIM ACI is controlled indirectly by Kimco. The address for KIM ACI is c/o Kimco Realty Corporation, Attention: Ray Edwards and Bruce Rubenstein, 3333 New Hyde Park Road, Suite 100, New Hyde Park, New York 11042. |
138
CONCURRENT OFFERING OF SERIES A PREFERRED STOCK
Concurrently with this offering of common stock, we plan to offer shares of our Series A preferred stock, and we have granted the underwriters of the offering of Series A preferred stock a
30-day
option to purchase up to additional shares of Series A preferred stock to cover over-allotments. There are currently no shares of Series A preferred stock outstanding. We cannot assure you that the offering of Series A preferred stock will be completed or, if completed, on what terms it will be completed. The closing of this offering is conditioned upon the closing of the offering of Series A preferred stock and the closing of our offering of Series A preferred stock is conditioned upon the closing of this offering.The following summary of the terms of the Series A preferred stock is subject to, and qualified in its entirety by reference to, the provisions of the certificate of designations for the Series A preferred stock.
Conversion
Unless converted earlier as described below, each share of the Series A preferred stock will automatically convert on the mandatory conversion date, which is expected to be , 202 , into a number of shares of our common stock equal to the conversion rate described below.
The “Conversion Rate,” which is the number of shares of our common stock issuable upon conversion of each share of the Series A preferred stock on the mandatory conversion date (excluding any shares of our common stock issued in respect of accrued and unpaid dividends, as described below), will be as follows:
| • | if the Applicable Market Value (as defined herein) of our common stock is greater than $ (the “Threshold Appreciation Price”), then the Conversion Rate will be shares of our common stock per share of the Series A preferred stock (the “Minimum Conversion Rate”), which is approximately equal to $ divided by the Threshold Appreciation Price; |
| • | if the Applicable Market Value of our common stock is less than or equal to the Threshold Appreciation Price but equal to or greater than $ (the “Initial Price”), then the Conversion Rate will be equal to $ divided by the Applicable Market Value of our common stock, rounded to the nearest ten-thousandth of a share; or |
| • | if the Applicable Market Value of our common stock is less than the Initial Price, then the Conversion Rate will be shares of our common stock per share of the Series A preferred stock (the “Maximum Conversion Rate”). |
For the avoidance of doubt, the Conversion Rate per share of the Series A preferred stock will in no event exceed the Maximum Conversion Rate, subject to anti-dilution adjustments described in the certificate of designations setting forth the terms of the Series A preferred stock.
The “Threshold Appreciation Price” is calculated by dividing $ by the Minimum Conversion Rate, and represents approximately % appreciation over the Initial Price. The “Initial Price” is calculated by dividing $ by the Maximum Conversion Rate and initially equals $ , which is the public offering price of common stock in this offering.
“Applicable Market Value” means the Average VWAP per share of our common stock over the Settlement Period.
“Settlement Period” means the 20 consecutive Trading Day (as defined in the certificate of designations) period beginning on, and including, the 21st Scheduled Trading Day (as defined in the certificate of designations) immediately preceding , 202 .
139
“VWAP” per share of our common stock on any Trading Day means the per share volume-weighted average price as displayed on Bloomberg page “ <EQUITY> ” (or its equivalent successor if such page is not available) in respect of the period from the scheduled open of trading until the scheduled close of trading of the primary trading session on such Trading Day (or, if such volume weighted average price is not available, the market value per share of our common stock on such Trading Day as determined, using a volume-weighted average method, by a nationally recognized independent investment banking firm retained by us for this purpose, which may include any of the underwriters for this offering). The “Average VWAP” per share over a certain period means the arithmetic average of the VWAP per share for each Trading Day in the relevant period.
Accordingly, assuming that the market price of our common stock on the mandatory conversion date is the same as the Applicable Market Value of our common stock, the aggregate market value of our common stock that holders of the Series A preferred stock will receive upon mandatory conversion of a share of Series A preferred stock (excluding any shares of our common stock such holders receive in respect of accrued and unpaid dividends) will be:
| • | greater than the $ liquidation preference of the share of Series A preferred stock, if the Applicable Market Value is greater than the Threshold Appreciation Price; |
| • | equal to the $ liquidation preference of the share of Series A preferred stock, if the Applicable Market Value is less than or equal to the Threshold Appreciation Price and greater than or equal to the Initial Price; and |
| • | less than the $ liquidation preference of the share of Series A preferred stock, if the Applicable Market Value is less than the Initial Price. |
At any time prior to , 202 , holders may elect to convert each share of the Series A preferred stock into shares of our common stock at the Minimum Conversion Rate. If holders elect to convert any shares of the Series A preferred stock during a specified period beginning on the effective date of a fundamental change (as defined in the certificate of designations), such shares of the Series A preferred stock will be converted into shares of our common stock at a Conversion Rate including a make-whole amount based on the present value of future dividend payments.
Dividend Rights
Dividends on the Series A preferred stock will be payable on a cumulative basis when, as and if declared by our board of directors, or an authorized committee thereof, at an annual rate of % on the liquidation preference of $ per share of Series A preferred stock. We may pay any declared dividend on the shares of Series A preferred stock (whether for a current dividend period or any prior dividend period, including in connection with the payment of declared and unpaid dividends), determined in our sole discretion (i) in cash; (ii) subject to certain limitations, by delivery of shares of our common stock; or (iii) through any combination of cash and shares of our common stock. Dividend payments on the Series A preferred stock will be made on , , and of each year, commencing on , 202 (each, a “Dividend Payment Date”). If we elect to make any such payment of a declared dividend, or any portion thereof, in shares of our common stock, such shares will be valued for such purpose at 97% of the average volume weighted average price per share of our common stock over the five consecutive trading day period beginning on, and including, the seventh scheduled trading day prior to the applicable Dividend Payment Date (with each term defined in the certificate of designations), subject to certain limitations described in the certificate of designations.
Ranking
Our common stock will rank junior to the Series A preferred stock with respect to the payment of dividends and amounts payable in the event of our liquidation, dissolution or
winding-up
of our affairs. This means that,140
unless accumulated and unpaid dividends have been declared and paid, or set aside for payment, on all outstanding shares of the Series A preferred stock for all preceding dividend periods, no dividends may be declared or paid on our common stock, and no common stock may be purchased, redeemed or otherwise acquired for consideration by us, in each case, subject to certain exceptions. Likewise, in the event of our voluntary or involuntary liquidation,
winding-up
or dissolution, no distribution of our assets may be made to holders of our common stock until we have paid to holders of the Series A preferred stock a liquidation preference equal to $ per share plus accumulated and unpaid dividends.Voting Rights
Except as specifically required by Delaware law or our certificate of incorporation, and except as described below, the holders of Series A preferred stock will have no voting rights or powers.
Whenever dividends on any shares of the Series A preferred stock have not been declared and paid for the equivalent of six or more dividend periods, whether or not for consecutive dividend periods (a “Nonpayment”), the authorized number of directors on our board of directors will, at the next annual meeting of stockholders or at a special meeting of stockholders as provided below, automatically be increased by two and the holders of such shares of the Series A preferred stock, voting together as a single class with holders of any and all other series of Voting Preferred Stock (as defined herein) then outstanding, will be entitled, at our next annual meeting of stockholders or at a special meeting of stockholders, if any, as provided below, to vote for the election of a total of two additional members of our board of directors (the “Preferred Stock Directors”); provided, however, that the election of any such Preferred Stock Directors will not cause us to violate the corporate governance requirements of the NYSE (or any other exchange or automated quotation system on which our securities may be listed or quoted) that requires listed or quoted companies to have a majority of independent directors; and provided, further, that our board of directors shall, at no time, include more than two Preferred Stock Directors.
In the event of a Nonpayment, the holders of record of at least 25% of the shares of the Series A preferred stock and any other series of Voting Preferred Stock may request that a special meeting of stockholders be called to elect such Preferred Stock Directors (provided, however, that if our next annual or a special meeting of stockholders is scheduled to be held within 90 days of the receipt of such request, the election of such Preferred Stock Directors, to the extent otherwise permitted by our bylaws, will, instead, be included in the agenda for and will be held at such scheduled annual or special meeting of stockholders). The Preferred Stock Directors will stand for reelection annually, and at each subsequent annual meeting of the stockholders, so long as the holders of the Series A preferred stock continue to have such voting powers.
At any meeting at which the holders of the Series A preferred stock are entitled to elect Preferred Stock Directors, the holders of record of a majority in voting power of the then outstanding shares of the Series A preferred stock and all other series of Voting Preferred Stock, present in person or represented by proxy, will constitute a quorum and the vote of the holders of a majority in voting power of such shares of the Series A preferred stock and other Voting Preferred Stock so present or represented by proxy at any such meeting at which there shall be a quorum shall be sufficient to elect the Preferred Stock Directors.
As used in this section, “Voting Preferred Stock” means any other class or series of our preferred stock, other than the Series A preferred stock, ranking equally with the Series A preferred stock as to dividends and to the distribution of assets upon liquidation, dissolution or
winding-up
and upon which like voting powers for the election of directors have been conferred and are exercisable. Whether a plurality, majority or other portion in voting power of the Series A preferred stock and any other Voting Preferred Stock have been voted in favor of any matter shall be determined by reference to the respective liquidation preference amounts of the Series A preferred stock and such other Voting Preferred Stock voted.If and when all accumulated and unpaid dividends on the Series A preferred stock have been paid in full, or declared and a sum or number of shares of our common stock sufficient for such payment shall have been set
141
aside for the benefit of the holders thereof on the applicable Regular Record Date (as defined in the certificate of designations) (a “Nonpayment Remedy”), the holders of the Series A preferred stock shall immediately and, without any further action by us, be divested of the foregoing voting powers, subject to the revesting of such powers in the event of each subsequent Nonpayment. If such voting powers for the holders of the Series A preferred stock and all other holders of Voting Preferred Stock have terminated, each Preferred Stock Director then in office shall automatically be disqualified as a director and shall no longer be a director and the term of office of each such Preferred Stock Director so elected will terminate at such time and the authorized number of directors on our board of directors shall automatically decrease by two.
Any Preferred Stock Director may be removed at any time, with or without cause, by the holders of record of a majority in voting power of the outstanding shares of the Series A preferred stock and any other series of Voting Preferred Stock then outstanding (voting together as a single class) when they have the voting powers described above. In the event that a Nonpayment shall have occurred and there shall not have been a Nonpayment Remedy, any vacancy in the office of a Preferred Stock Director (other than prior to the initial election of Preferred Stock Directors after a Nonpayment) may be filled by the written consent of the Preferred Stock Director remaining in office, except in the event that such vacancy is created as a result of such Preferred Stock Director being removed, or if no Preferred Stock Director remains in office, by a vote of the holders of record of a majority in voting power of the outstanding shares of the Series A preferred stock and any other series of Voting Preferred Stock then outstanding (voting together as a single class) when they have the voting powers described above; provided, however, that the election of any such Preferred Stock Directors will not cause us to violate the corporate governance requirements of the NYSE (or any other exchange or automated quotation system on which our securities may be listed or quoted) that requires listed or quoted companies to have a majority of independent directors. The Preferred Stock Directors will each be entitled to one vote per director on any matter that comes before our board of directors for a vote.
The Series A preferred stock will have certain other voting powers with respect to certain amendments to our certificate of incorporation or the certificate of designations establishing the terms of the Series A preferred stock or certain other transactions as described in such certificate of designations.
The foregoing description of the proposed Series A preferred stock is not complete and is subject to, and qualified in its entirety by reference to, the provisions of the certificate of designations establishing the terms of the Series A preferred stock, a copy of which will be filed as an exhibit to the registration statement of which this prospectus forms a part and which may be obtained as described under “Where You Can Find More Information.” In addition, a description of the proposed Series A preferred stock is set forth in the separate prospectus pursuant to which such preferred stock is being offered.
142
DESCRIPTION OF CAPITAL STOCK
General
Our authorized capital stock consists of 1,000,000,000 shares of common stock, par value $0.01 per share, and 100,000,000 shares of preferred stock, par value $0.01 per share, of which shares have been designated as Series A preferred stock.
Upon completion of this offering, there will be shares of our common stock outstanding and upon completion of the offering of Series A preferred stock, there will be shares of our Series A preferred stock outstanding (or shares if the underwriters in the offering of Series A preferred stock exercise their over-allotment option in full), which will be convertible into up to shares of our common stock (or up to shares if the underwriters in the offering of Series A preferred stock exercise their over-allotment option in full), in each case, assuming mandatory conversion based on an applicable market value of our common stock equal to the assumed initial public offering price of $ per share of our common stock, which is the midpoint of the estimated offering range set forth on the cover page of this prospectus, subject to
anti-dilution,
make-whole and other adjustments or any shares of our common stock that may be issued in payment of a dividend, fundamental change dividend make-whole amount or accumulated dividend amount. No other shares of preferred stock will be issued or outstanding immediately after the offering of Series A preferred stock. We expect to use the net proceeds from the offering of Series A preferred stock for the Repurchase. The Repurchase is conditioned upon the consummation of the offering of Series A preferred stock and the receipt of funds therefrom. See “Use of Proceeds.”Common Stock
Dividend Rights
Subject to preferences that may be applicable to any then outstanding preferred stock, holders of our common stock are entitled to receive ratably those dividends, if any, as may be declared from time to time by our board of directors out of legally available funds.
Voting Rights
Each holder of our common stock is entitled to one vote for each share owned of record on all matters voted upon by stockholders. A majority vote is required for all action to be taken by stockholders, except as otherwise provided for in our certificate of incorporation and bylaws or as required by law, including the election of directors in an election that is determined by our board of directors to be a contested election, which requires a plurality. Our certificate of incorporation provides that our board of directors and, prior to the 50% Trigger Date, the Sponsors, voting together, are expressly authorized to make, alter or repeal our bylaws and that our stockholders may only amend our bylaws after the 50% Trigger Date with the approval of at least
two-thirds
of the total voting power of the outstanding shares of our capital stock entitled to vote in any annual election of directors.Liquidation Rights
In the event of our liquidation, dissolution or
winding-up,
the holders of our common stock are entitled to share equally and ratably in our assets, if any, remaining after the payment of all of our debts and liabilities and the liquidation preference of any outstanding preferred stock.Other Rights
Our common stock has no preemptive rights, no cumulative voting rights and no redemption, sinking fund or conversion provisions.
143
Preferred Stock
Our board of directors is authorized, by resolution or resolutions, to issue up to 100,000,000 shares of our preferred stock, of which shares have been designated as Series A preferred stock. Our board of directors is authorized, by resolution or resolutions, to provide, out of the unissued shares of our preferred stock, for one or more series of preferred stock and, with respect to each such series, to fix, without further stockholder approval, the designation, powers, preferences and relative, participating, option or other special rights, including voting powers and rights, and the qualifications, limitations or restrictions thereof, of each series of preferred stock pursuant to Section 151 of the DGCL. Our board of directors could authorize the issuance of preferred stock with terms and conditions that could discourage a takeover or other transaction that some holders of our common stock might believe to be in their best interests or in which holders of common stock might receive a premium for their shares over and above market price. See “Concurrent Offering of Series A Preferred Stock.”
Anti-Takeover Effects of Delaware Law and Our Certificate of Incorporation and Bylaws
Some provisions of Delaware law and of our certificate of incorporation and bylaws could have the effect of delaying, deferring or discouraging another party from acquiring control of the Company. These provisions, which are summarized below, are expected to discourage coercive takeover practices and inadequate takeover bids. These provisions are also designed to encourage persons seeking to acquire control of the Company to first negotiate with our board of directors.
Requirements for Advance Notification of Stockholder Nominations and Proposals
Our bylaws establish advance notice procedures with respect to stockholder proposals, other than proposals made by or at the direction of our board of directors or, prior to the 35% Trigger Date, by the Sponsors, voting together. Our bylaws also establish advance notice procedures with respect to the nomination of candidates for election as directors, other than nominations made by or at the direction of our board of directors or by a committee appointed by our board of directors. These provisions may have the effect of precluding the conduct of certain business at a meeting if the proper procedures are not followed, and may also discourage or deter a potential acquirer from conducting a solicitation of proxies to elect the acquirer’s own slate of directors or otherwise attempting to obtain control of the Company.
Calling Special Stockholder Meetings
Our certificate of incorporation and bylaws provide that special meetings of our stockholders may be called only by our board of directors or by stockholders owning at least 25% in amount of our entire capital stock issued and outstanding, and entitled to vote.
Stockholder Action by Written Consent
The DGCL permits stockholder action by written consent unless otherwise provided by our certificate of incorporation. Our certificate of incorporation precludes stockholder action by written consent after the 50% Trigger Date.
Undesignated Preferred Stock
Our board of directors is authorized to issue, without stockholder approval, preferred stock with such terms as our board of directors may determine. The ability to authorize undesignated preferred stock makes it possible for our board of directors to issue one or more series of preferred stock with voting or other rights or preferences that could impede the success of any attempt to change control of the Company.
Delaware Anti-Takeover Statute
We have elected not to be governed by Section 203 of the DGCL, an anti-takeover law (“Section 203”). This law prohibits a publicly-held Delaware corporation from engaging under certain circumstances in a business
144
combination with any interested stockholder for a period of three years following the date that the stockholder became an interested stockholder, unless:
| • | prior to the date of the transaction, the board of directors of the corporation approved either the business combination or the transaction which resulted in the stockholder becoming an interested stockholder; |
| • | upon consummation of the transaction which resulted in the stockholder becoming an interested stockholder, the interested stockholder owned at least 85% of the voting stock of the corporation outstanding at the time the transaction commenced, excluding for purposes of determining the number of shares outstanding those shares owned by persons who are directors and also officers and by employee stock plans in which employee participants do not have the right to determine confidentially whether shares held subject to the plan will be tendered in a tender or exchange offer; or |
| • | on or subsequent to the date of the transaction, the business combination is approved by our board of directors and authorized at an annual or special meeting of stockholders, and not by written consent, by the affirmative vote of at least two-thirds of the outstanding voting stock which is not owned by the interested stockholder. |
Section 203 defines “business combination” to include: any merger or consolidation involving us and the interested stockholder; any sale, transfer, pledge or other disposition of 10% or more of our assets involving the interested stockholder; in general, any transaction that results in the issuance or transfer by us of any of our stock to the interested stockholder; or the receipt by the interested stockholder of the benefit of any loans, advances, guarantees, pledges or other financial benefits provided by or through us. In general, Section 203 defines an interested stockholder as any entity or person beneficially owning 15% or more of the outstanding voting stock of the corporation and any entity or person affiliated with or controlling or controlled by any such entity or person. A Delaware corporation may opt out of this provision by express provision in its original certificate of incorporation or by amendment to its certificate of incorporation or bylaws approved by its stockholders. We have opted out of this provision. Accordingly, we will not be subject to any anti-takeover effects of Section 203.
Removal of Directors; Vacancies
Our certificate of incorporation provides that, following the 50% Trigger Date, directors may be removed with or without cause upon the affirmative vote of holders of at least
two-thirds
of the total voting power of the outstanding shares of the capital stock of the Company entitled to vote in any annual election of directors or class of directors, voting together as a single class. In addition, our certificate of incorporation provides that vacancies, including those resulting from newly created directorships or removal of directors, may only be filled (i) by the Sponsors, voting together, or by a majority of the directors then in office, prior to the 50% Trigger Date, and (ii) after the 50% Trigger Date, by a majority of the directors then in office, in each case although less than a quorum, or by a sole remaining director. This may deter a stockholder from increasing the size of our board of directors and gaining control of the board of directors by filling the remaining vacancies with its own nominees.Limitation on Director’s Liability
Our certificate of incorporation and bylaws will indemnify our directors to the fullest extent permitted by the DGCL. The DGCL permits a corporation to limit or eliminate a director’s personal liability to the corporation or the holders of its capital stock for breach of duty. This limitation is generally unavailable for acts or omissions by a director which (i) were in bad faith, (ii) were the result of active and deliberate dishonesty and were material to the cause of action so adjudicated or (iii) involved a financial profit or other advantage to which such director was not legally entitled. The DGCL also prohibits limitations on director liability for acts or omissions which resulted in a violation of a statute prohibiting certain dividend declarations, certain payments to stockholders after dissolution and particular types of loans. The effect of these provisions is to eliminate the rights of our company and our stockholders (through stockholders’ derivative suits on behalf of our company) to recover
145
monetary damages against a director for breach of fiduciary duty as a director (including breaches resulting from grossly negligent behavior), except in the situations described above. These provisions will not limit the liability of directors under the federal securities laws of the United States.
Credit Facility
Under our ABL Facility, a change of control may lead the lenders to exercise remedies, such as acceleration of their loans, termination of their obligations to fund additional advances and collection against the collateral securing such loan.
Notes
Under the indentures governing certain of our notes, a change of control may require us to offer to repurchase all of the outstanding notes for cash at a price equal to 101% of the principal amount of the notes, plus accrued and unpaid interest, if any, to the date of repurchase.
Choice of Forum
Our certificate of incorporation and bylaws provide that, unless we consent in writing to the selection of an alternative forum, the Court of Chancery of the State of Delaware will, to the fullest extent permitted by law, be the exclusive forum for: (a) any derivative action or proceeding brought on our behalf; (b) any action asserting a breach of a fiduciary duty owed by any of our directors, officers, employees or agents to us or our stockholders; (c) any action asserting a claim pursuant to any provision of the DGCL, our certificate of incorporation or our bylaws; or (d) any action asserting a claim governed by the internal affairs doctrine. However, it is possible that a court could find our forum selection provision to be inapplicable or unenforceable. Because the applicability of the exclusive forum provision is limited to the extent permitted by law, we do not intend that the exclusive forum provision would apply to suits brought to enforce any duty or liability created by the Exchange Act or any other claim for which the federal courts have exclusive jurisdiction. Additionally, unless we consent in writing to the selection of an alternative forum, the federal district courts of the United States of America shall be the exclusive forum for the resolution of any action asserting a cause of action arising under the Securities Act. Investors cannot waive compliance with the federal securities laws and the rules and regulations thereunder.
Stockholders’ Agreement
As of the closing of this offering, we will enter into the Stockholders’ Agreement. The Stockholders’ Agreement will provide for designation rights for the Sponsors to nominate directors to the board of directors. Pursuant to the Stockholders’ Agreement, we will be required to appoint to our board of directors individuals designated by and voted for by our Sponsors. If Cerberus (or a permitted transferee or assignee) has beneficial ownership of at least 20% of our then-outstanding common stock, it shall have the right to designate four directors to our board of directors. If Cerberus (or a permitted transferee or assignee) owns less than 20% but at least 10% of our then-outstanding common stock, it shall have the right to designate two directors to our board of directors. If Cerberus (or a permitted transferee or assignee) owns less than 10% but at least 5% of our then-outstanding common stock, it shall have the right to designate one director to our board of directors. If Klaff Realty (or a permitted transferee or assignee) owns at least 5% of our then-outstanding common stock, it shall have the right to designate one director to our board of directors. If Schottenstein Stores (or a permitted transferee or assignee) owns at least 5% of our then-outstanding common stock, it shall have the right to designate one director to our board of directors. Each Sponsor will agree to vote the common stock owned by them in favor of each other Sponsor’s nominees to the board of directors.
Transfer Agent and Registrar
Upon completion of this offering, the transfer agent and registrar for our common stock will be American Stock Transfer & Trust Company, LLC. Upon completion of the offering of Series A preferred stock, American
146
Stock Transfer & Trust Company, LLC will serve as transfer agent, registrar and conversion and dividend disbursing agent for the Series A preferred stock. The address of the transfer agent and registrar is 6201 15th Avenue, Brooklyn, New York 11219.
Listing
We have been approved to list our common stock on the NYSE under the symbol “ACI.”
147
SHARES ELIGIBLE FOR FUTURE SALE
Immediately prior to this offering, there was no public market for our common stock, and we cannot predict the effect, if any, that market sales of shares of our common stock or the availability of shares of our common stock for sale will have on the market price of our common stock prevailing from time to time. Future sales of our common stock in the public market, or the availability of such shares for sale in the public market, could adversely affect market prices prevailing from time to time. As described below, only a limited number of shares of our common stock will be available for sale shortly after this offering due to contractual and legal restrictions on resale. Nevertheless, sales of our common stock in the public market after such restrictions lapse, or the perception that those sales may occur, could adversely affect the prevailing market price at such time and our ability to raise equity capital in the future.
Following the completion of this offering, shares of our common stock will be outstanding, assuming no exercise of the underwriters’ option to purchase additional shares. Of these outstanding shares, all of the shares of our common stock sold in this offering will be freely tradable, except that any shares purchased in this offering by our affiliates, as that term is defined in Rule 144 under the Securities Act, would only be able to be sold in compliance with the Rule 144 limitations described below.
The remaining outstanding shares of our common stock not sold in this offering will be deemed “restricted securities” as defined in Rule 144 under the Securities Act. Restricted securities may be sold in the public market only if they are registered or if they qualify for an exemption from registration under Rule 144 or Rule 701 under the Securities Act, which rules are summarized below. All of our executive officers, directors and each other Pre-IPO Stockholder (other than certain Pre-IPO Stockholders that agreements with the underwriters under which they will agree, subject to specific exceptions, not to sell any of our stock for 180 days following the date of this prospectus. As a result of these agreements and subject to the provisions of Rule 144 or Rule 701, shares of our common stock will be available for sale in the public market as follows:
each own less than an aggregate of shares of common stock) will have entered into
lock-up
| • | beginning on the date of this prospectus, all shares of our common stock sold in this offering will be immediately available for sale in the public market; and |
| • | beginning 181 days after the date of this prospectus, the remaining shares of our common stock will be eligible for sale in the public market from time to time thereafter, subject in some cases to the volume and other restrictions of Rule 144, as described below. |
Additional shares of common stock will be issuable upon conversion of the shares of Series A preferred stock issued in the offering of Series A preferred stock. All of such shares of common stock will be available for immediate resale in the public market upon conversion, except for any such shares issued to persons who are subject to
lock-up
arrangements, which shares will be subject to the terms of suchlock-up
arrangements.Rule 144
In general, under Rule 144 as currently in effect, once we have been subject to the public company reporting requirements of Section 13 or Section 15(d) of the Exchange Act for at least 90 days, a person who is not deemed to have been one of our affiliates for purposes of the Securities Act at any time during the 90 days preceding a sale and who has beneficially owned the shares of our common stock proposed to be sold for at least six months is entitled to sell those shares without complying with the manner of sale, volume limitation or notice provisions of Rule 144, subject to compliance with the public information requirements of Rule 144. If such a person has beneficially owned the shares proposed to be sold for at least one year, including the holding period of any prior owner other than our affiliates, then that person would be entitled to sell those shares without complying with any of the requirements of Rule 144.
In general, under Rule 144, as currently in effect, our affiliates or persons selling shares of our common stock on behalf of our affiliates are entitled to sell upon expiration of the market standoff agreements and
lock-up
148
agreements described above, within any three-month period, a number of shares that does not exceed the greater of:
| • | 1% of the number of shares of our capital stock then outstanding, which will equal shares immediately after this offering; or |
| • | the average weekly trading volume of our common stock during the four calendar weeks preceding the filing of a notice on Form 144 with respect to that sale. |
Sales under Rule 144 by our affiliates or persons selling shares of our common stock on behalf of our affiliates are also subject to manner of sale provisions and notice requirements and to the availability of current public information about us.
Stockholders’ Agreement
As of the closing of this offering, we will enter into the Stockholders’ Agreement. The Stockholders’ Agreement will provide for designation rights for the Sponsors to nominate directors to the board of directors. Pursuant to the Stockholders’ Agreement, we will be required to appoint to our board of directors individuals designated by and voted for by our Sponsors. If Cerberus (or a permitted transferee or assignee) has beneficial ownership of at least 20% of our then-outstanding common stock, it shall have the right to designate four directors to our board of directors. If Cerberus (or a permitted transferee or assignee) owns less than 20% but at least 10% of our then-outstanding common stock, it shall have the right to designate two directors to our board of directors. If Cerberus (or a permitted transferee or assignee) owns less than 10% but at least 5% of our then-outstanding common stock, it shall have the right to designate one director to our board of directors. If Klaff Realty (or a permitted transferee or assignee) owns at least 5% of our then-outstanding common stock, it shall have the right to designate one director to our board of directors. If Schottenstein Stores (or a permitted transferee or assignee) owns at least 5% of our then-outstanding common stock, it shall have the right to designate one director to our board of directors. Each Sponsor will agree to vote the common stock owned by them in favor of each other Sponsor’s nominees to the board of directors.
Registration Rights Agreement
As of the closing of this offering, we will enter into a registration rights agreement with the
Pre-IPO
Stockholders. Pursuant to the registration rights agreement, we will grant certainPre-IPO
Stockholders certain registration rights with respect to the registrable securities. These rights will include certain demand registration rights for our Sponsors, as well as “piggyback” registration rights for certainPre-IPO
Stockholders. The registration rights only apply to registrable securities, and shares cease to be registrable securities under certain conditions including (i) they are sold pursuant to an effective registration statement, (ii) they are sold pursuant to Rule 144 under the Securities Act, or (iii) they are eligible to be resold without regard to the volume or public information requirements of Rule 144 and the resale of such shares is not prohibited by thelock-up
agreements described below. The registration rights are subject to certain delay, suspension and cutback provisions.The registration rights agreement includes customary indemnification and contribution provisions. All fees, costs and expenses related to registrations generally will be borne by us, other than underwriting discounts and commissions attributable to the sale of registrable securities.
The
Pre-IPO
Stockholders may be required to deliverlock-up
agreements to underwriters in connection with registered offerings of shares.Demand Registration Rights for Non-Shelf Registered Offerings
S-3,
our Sponsors will be limited to a single demand right for an underwritten offering pursuant to a registration statement on FormS-1.
Such registration statement would be required to include at least 5.0% of the149
total number of shares of the
pre-IPO
common stock or all of the remaining registrable securities of the demanding holder, and such request will require the consent of the holders of at least a majority of the outstanding registrable securities.Shelf Registration Rights
S-3,
the registration rights agreement will grant our Sponsors certain rights to demand that we file a shelf registration statement covering any registrable securities thatPre-IPO
Stockholders are permitted to sell pursuant to thelock-up
agreements with us described below or any otherlock-up
restrictions. The number of shares covered by the shelf registration statement may also be reduced by us based on any advice of any potential underwriters, after consultation with us, to limit such number of shares.Demand Registration Rights for Shelf Takedowns
S-1
described above), any such takedown demand would be required to include at least 5% of the registrablepre-IPO
common stock or all of the remaining registrable securities of the demanding holder. Sponsors lose their remaining demand registration rights when they, together with their affiliates, but not including any portfolio companies, cease to beneficially own at least 5% of our common stock. Further, we are not required to effect more than one demand registration in any30-day
period (with such30-day
period commencing on the closing date of any underwritten offering pursuant to a preceding demand registration).“Piggyback” Registration Rights
Pre-IPO
Stockholders “piggyback” registration rights. If we register any of our shares of common stock, either for our own account or for the account of other stockholders, including an exercise of demand rights, certainPre-IPO
Stockholders will be entitled, subject to certain exceptions, to include its shares of common stock in the registration. To the extent that the managing underwriters in an offering advise that the number of shares proposed to be included in the offering exceeds the amount that can be sold without adversely affecting the distribution, the number of shares included in the offering will be limited as follows:| • | in the case of an offering pursuant to a demand under the registration rights agreement, (1) the stockholders that are parties to the registration rights agreement will have first priority to include their registrable securities, (2) we will have second priority to the extent that we elect to sell any shares for our own account and (3) any other holders with registration rights will have third priority; and |
| • | in the case of any offering not pursuant to a demand under the registration rights agreement, (1) we will have first priority to the extent that we elect to sell any shares for our own account, (2) the stockholders that are parties to the registration rights agreement will have second priority to include their registrable securities and (3) any other holders with registration rights will have third priority. |
Underwriter Lock-ups
lock-up
agreements to the underwriters of such offering to restrict transfers of their common stock. The restrictions will apply for up to 90 days in connection with or prior to the second underwritten offering demanded pursuant to the registration rights agreement and up to 45 days in connection with any offering thereafter.Suspension Periods
150
public, the premature disclosure of which we, after consultation with our outside counsel, believes would be detrimental us; that we will not be permitted to impose any such blackout period more than two times in any,, that any such delay will not be more than an aggregate of 120 days in any
provided
12-month
period andprovided
further
12-month
period.Lock-Up
AgreementsPrior to the closing of this offering, certain
Pre-IPO
Stockholders will deliver alock-up
agreement to us. Pursuant to thelock-up
agreements, for the FirstLock-Up
Period suchPre-IPO
Stockholders will agree, subject to certain exceptions, that they will not offer, sell, contract to sell, pledge, grant any option to purchase, make any short sale or otherwise dispose of any shares of common stock or any options or warrants to purchase common stock, or any securities convertible into, exchangeable for or that represent the right to receive common stock, owned by them (whether directly or by means of beneficial ownership) immediately prior to the closing of this offering.Lock-Up
PeriodsFor the Second
Lock-Up
Period, suchPre-IPO
Stockholders will be permitted to sell up to 25% of the shares of common stock held by suchPre-IPO
Stockholders as of immediately after the closing of this offering and after giving effect to the Repurchase in a registered, underwritten offering pursuant to the registration rights agreement, and may be permitted to sell additional shares to the extent that the managing underwriters of such registered, underwritten offering conclude that additional shares may be sold in such offering without adversely affecting the distribution.For the Third
Lock-Up
Period, suchPre-IPO
Stockholders will be permitted to sell up to 50% of the shares of common stock held by suchPre-IPO
Stockholders as of immediately after the closing of this offering and after giving effect to the Repurchase, minus the amounts sold in the SecondLock-Up
Period, in a registered, underwritten offering pursuant to the registration rights agreement, and may be permitted to sell additional shares to the extent that the managing underwriters of such registered, underwritten offering conclude that additional shares may be sold in such offering without adversely affecting the distribution.For the Fourth
Lock-Up
Period, suchPre-IPO
Stockholders will be permitted to sell up to 75% of the shares of common stock held by suchPre-IPO
Stockholders as of immediately after the closing of this offering and after giving effect to the Repurchase, minus the amounts sold in the SecondLock-Up
Period and ThirdLock-Up
Period, in a registered, underwritten offering pursuant to the registration rights agreement, and may be permitted to sell additional shares to the extent that the managing underwriters of such registered, underwritten offering conclude that additional shares may be sold in such offering without adversely affecting the distribution.After the end of the Fourth
Lock-Up
Period, the restrictions of thelock-up
agreements will expire.In addition, to the extent that any
Pre-IPO
Stockholder elects not to participate in a registered, underwritten offering described above or does not elect to sell the maximum number of shares as described above (not including any increase in the number of shares based on the advice of the managing underwriters), suchPre-IPO
Stockholders may sell an equivalent number of shares in anon-underwritten
registered shelf-takedown or an unregistered offering pursuant to Rule 144 or another exemption from registration under the Securities Act.Exceptions
lock-up
agreement, (2) to any trust for the direct or indirect benefit of the undersigned or the immediate family of the undersigned, provided that the trustee of the trust agrees to be bound in writing by the restrictions of thelock-up
agreement, andprovided
further
Pre-IPO
Stockholders or any investment fund or other entity controlled or managed by such151
Pre-IPO
Stockholder or their affiliates, (but in each case under this clause (3), not including a portfolio company), provided that such person agrees to be bound in writing by the restrictions of thelock-up
agreement, (4) to a nominee or custodian of a person or entity to whom a disposition or transfer would be permissible under clauses (2) through (3) above provided that such person agrees to be bound in writing by the restrictions of thelock-up
agreement, (5) pursuant to an order of a court or regulatory agency, (6) the pledge, hypothecation or other granting of a security interest in suchPre-IPO
Stockholder’s shares to one or more banks or financial institutions as bona fide collateral or security for any loan, advance or extension of credit and any transfer upon foreclosure upon such shares or thereafter or (7) with our prior written consent.Prorata Release
Pre-IPO
Stockholder is permitted by us to sell or otherwise transfer or dispose of any shares of common stock for value (whether in one or multiple releases) then the same percentage of shares of common stock held by the otherPre-IPO
Stockholders subject to thelock-up
agreements will be immediately and fully released on the same terms from any remaininglock-up
restrictions set forth in thelock-up
agreements, subject to a number of exceptions listed therein.S-8
Registration StatementWe intend to file a registration statement on Form
S-8
under the Securities Act promptly after the completion of this offering to register shares of our common stock or securities convertible into or exchangeable for shares of our common stock, as well as reserved for future issuance, under our equity compensation plans. The registration statement on FormS-8
is expected to become effective immediately upon filing, and shares of our common stock covered by the registration statement will then become eligible for sale in the public market, subject to the Rule 144 limitations applicable to affiliates, vesting restrictions and any applicable market standoff agreements andlock-up
agreements. See the section captioned “Executive Compensation—Incentive Plans” for a description of our equity compensation plans.152
DESCRIPTION OF INDEBTEDNESS
The following is a summary of the material provisions of the instruments and agreements evidencing the material indebtedness of ACI, Albertsons, Safeway, NALP and certain of their subsidiaries that is currently outstanding. It does not include all of the provisions of our material indebtedness, does not purport to be complete and is qualified in its entirety by reference to the instruments and agreements described.
ABL Facility
On November 16, 2018, ACI entered into an amended and restated senior secured asset-based loan facility (the “ABL Facility”) to, among other things, provide for a $4,000 million senior secured revolving credit facility.
Structure
Maturity
Borrowing Base
Interest
Guarantees
153
Security
Fees
Affirmative and Negative Covenants
Financial Covenants
Events of Default
ACI Indentures
ACI, Albertsons, Safeway and NALP (collectively, the “ACI Lead Issuers”), are the lead issuers under (i) an indenture, dated as of February 5, 2020 and as amended and supplemented from time to time (the “2023 Notes Indenture”), by and among the ACI Lead Issuers and substantially all of our subsidiaries as additional issuers (the “Additional Issuers” and together with the ACI Lead Issuers, the “ACI Issuers”), and Wilmington Trust, National Association, as trustee, under which the ACI Issuers have issued $750 million of 3.50% senior notes due February 15, 2023 (such notes, the “2023 Notes”), (ii) an indenture, dated as of May 31, 2016 and as amended and supplemented from time to time (the “2024 Notes Indenture”), by and among the ACI Lead Issuers, the subsidiary guarantors party thereto and Wilmington Trust, National Association, as trustee, under which the ACI
154
Lead Issuers have issued, $1,250 million of 6.625% senior notes due June 15, 2024 (such notes, the “2024 Notes”), (iii) an indenture, dated as of August 9, 2016 and as amended and supplemented from time to time (the “2025 Notes Indenture”), by and among the ACI Issuers, and Wilmington Trust, National Association, as trustee, under which the ACI Issuers have issued $1,250 million of 5.750% senior notes due September 15, 2025 (such notes, the “2025 Notes”), (iv) an indenture, dated as of February 5, 2019 and as amended and supplemented from time to time (the “2026 Notes Indenture”), by and among the ACI Lead Issuers, the subsidiary guarantors party thereto and Wilmington Trust, National Association, as trustee, under which the ACI Lead Issuers have issued $600 million of 7.5% senior notes due March 15, 2026 (such notes, the “2026 Notes”), (v) an indenture, dated as of November 22, 2019 and as amended and supplemented from time to time (the “2027 Notes Indenture”), by and among the ACI Issuers, and Wilmington Trust, National Association, as trustee, under which the ACI Issuers have issued $1,350 million of 4.625% senior notes due January 15, 2027 (such notes, the “2027 Notes”), (vi) an indenture, dated as of August 15, 2019 and as amended and supplemented from time to time (the “2028 Notes Indenture”), by and among the ACI Issuers, and Wilmington Trust, National Association, as trustee, under which the ACI Issuers have issued $750 million of 5.875% senior notes due February 15, 2028 (such notes, the “2028 Notes”) and (vii) an indenture, dated as of February 5, 2020 and as amended and supplemented from time to time (the “2030 Notes Indenture” and together with the 2023 Notes Indenture, 2024 Notes Indenture, 2025 Notes Indenture, 2026 Notes Indenture, 2027 Notes Indenture and 2028 Notes Indenture, the “ACI Indentures”), by and among the ACI Issuers, and Wilmington Trust, National Association, as trustee, under which the ACI Issuers have issued $1,000 million of 4.875% senior notes due February 15, 2030 (such notes, the “2030 Notes” and together with the 2023 Notes, 2024 Notes, 2025 Notes, 2026 Notes, 2027 Notes and 2028 Notes, the “ACI Notes”).
Interest
Guarantees
Security
Optional Redemption.
2023 Notes
Prior to December 15, 2022, the 2023 Notes may be redeemed in whole or in part at a redemption price equal to 100% of the principal amount thereof plus accrued and unpaid interest thereon, plus an applicable make-whole premium equal to the greater of (i) 1.0% and (ii) the excess of the sum of the present value of 100.00% of the principal amount being redeemed, plus all required interest payments due thereon through December 15, 2022 (exclusive of interest accrued to the date of redemption), discounted to the date of redemption at a rate equal to the then-current interest rate on U.S. Treasury securities of comparable maturities plus 50 basis points and, for the avoidance of doubt, assuming that the interest rate in effect on the date of redemption is the interest rate that will be in effect through December 15, 2022, over the principal amount being redeemed. On or after December 15, 2022, the 2023 Notes may be redeemed in whole or in part at 100.00%.
2024 Notes
The 2024 Notes may be redeemed in whole or in part at the following redemption prices: (i) 104.969% if such notes are redeemed on or prior to June 14, 2020, (ii) 103.313% if such notes are redeemed on or after June 15, 2020 and on or prior to June 14, 2021, (iii) 101.656% if such notes are redeemed on or after June 15, 2021 and on or prior to June 14, 2022, and (iv) at par thereafter.
155
2025 Notes
The 2025 Notes may be redeemed in whole or in part at the following redemption prices: (i) 104.313% if such notes are redeemed on or prior to September 14, 2020, (ii) 102.875% if such notes are redeemed on or after September 15, 2020 and on or prior to September 14, 2021, (iii) 101.438% if such notes are redeemed on or after September 15, 2021 and on or prior to September 14, 2022, and (iv) at par thereafter.
2026 Notes
Prior to March 15, 2022, the 2026 Notes may be redeemed in whole or in part at a redemption price equal to 100% of the principal amount thereof plus accrued and unpaid interest thereon, plus an applicable make-whole premium equal to the greater of (i) 1.0% and (ii) the excess of the sum of the present value of 105.625% of the principal amount being redeemed, plus all required interest payments due thereon through March 15, 2022 (exclusive of interest accrued to the date of redemption), discounted to the date of redemption at a rate equal to the then-current interest rate on U.S. Treasury securities of comparable maturities plus 50 basis points and, for the avoidance of doubt, assuming that the interest rate in effect on the date of redemption is the interest rate that will be in effect through March 15, 2022, over the principal amount being redeemed. In addition, subject to certain conditions, the ACI Issuers may redeem up to 40% of the 2026 Notes before March 15, 2022, with the net cash proceeds from certain equity offerings at a redemption price equal to 107.5% of the principal amount of the 2026 Notes redeemed, plus accrued and unpaid interest to (but excluding) the redemption date.
On or after March 15, 2022, the 2026 Notes may be redeemed in whole or in part at the following redemption prices: (i) 105.625% if such notes are redeemed on or prior to March 14, 2023, (ii) 103.750% if such notes are redeemed on or after March 15, 2023 and on or prior to March 14, 2024, (iii) 101.875% if such notes are redeemed on or after March 15, 2024 and on or prior to March 14, 2025, and (iv) at par thereafter.
2027 Notes
Prior to January 15, 2023, the 2027 Notes may be redeemed in whole or in part at a redemption price equal to 100% of the principal amount thereof plus accrued and unpaid interest thereon, plus an applicable make-whole premium equal to the greater of (i) 1.0% and (ii) the excess of the sum of the present value of 103.469% of the principal amount being redeemed, plus all required interest payments due thereon through January 15, 2023 (exclusive of interest accrued to the date of redemption), discounted to the date of redemption at a rate equal to the then-current interest rate on U.S. Treasury securities of comparable maturities plus 50 basis points and, for the avoidance of doubt, assuming that the interest rate in effect on the date of redemption is the interest rate that will be in effect through January 15, 2023, over the principal amount being redeemed. In addition, subject to certain conditions, the ACI Issuers may redeem up to 40% of the 2027 Notes before January 15, 2023, with the net cash proceeds from certain equity offerings at a redemption price equal to 104.625% of the principal amount of the 2027 Notes redeemed, plus accrued and unpaid interest to (but excluding) the redemption date.
On or after January 15, 2023, the 2027 Notes may be redeemed in whole or in part at the following redemption prices: (i) 103.469% if such notes are redeemed on or prior to January 14, 2024, (ii) 102.313% if such notes are redeemed on or after January 15, 2024 and on or prior to January 14, 2025, (iii) 101.156% if such notes are redeemed on or after January 15, 2025 and on or prior to January 14, 2026, and (iv) at par thereafter.
2028 Notes
Prior to August 15, 2022, the 2028 Notes may be redeemed in whole or in part at a redemption price equal to 100% of the principal amount thereof plus accrued and unpaid interest thereon, plus an applicable make-whole premium equal to the greater of (i) 1.0% and (ii) the excess of the sum of the present value of 104.406% of the principal amount being redeemed, plus all required interest payments due thereon through August 15, 2022 (exclusive of interest accrued to the date of redemption), discounted to the date of redemption at a rate equal to
156
the then-current interest rate on U.S. Treasury securities of comparable maturities plus 50 basis points and, for the avoidance of doubt, assuming that the interest rate in effect on the date of redemption is the interest rate that will be in effect through August 15, 2022, over the principal amount being redeemed. In addition, subject to certain conditions, the ACI Issuers may redeem up to 40% of the 2028 Notes before August 15, 2022, with the net cash proceeds from certain equity offerings at a redemption price equal to 105.875% of the principal amount of the 2028 Notes redeemed, plus accrued and unpaid interest to (but excluding) the redemption date.
On or after August 15, 2022, the 2028 Notes may be redeemed in whole or in part at the following redemption prices: (i) 104.406% if such notes are redeemed on or prior to August 14, 2023, (ii) 102.938% if such notes are redeemed on or after August 15, 2023 and on or prior to August 14, 2024, (iii) 101.469% if such notes are redeemed on or after August 15, 2024 and on or prior to August 14, 2025, and (iv) at par thereafter.
2030 Notes
Prior to February 15, 2025, the 2030 Notes may be redeemed in whole or in part at a redemption price equal to 100% of the principal amount thereof plus accrued and unpaid interest thereon, plus an applicable make-whole premium equal to the greater of (i) 1.0% and (ii) the excess of the sum of the present value of 103.656% of the principal amount being redeemed, plus all required interest payments due thereon through February 15, 2025 (exclusive of interest accrued to the date of redemption), discounted to the date of redemption at a rate equal to the then-current interest rate on U.S. Treasury securities of comparable maturities plus 50 basis points and, for the avoidance of doubt, assuming that the interest rate in effect on the date of redemption is the interest rate that will be in effect through February 15, 2025, over the principal amount being redeemed. In addition, subject to certain conditions, the
Co-Issuers
may redeem up to 40% of the 2030 Notes before February 15, 2025, with the net cash proceeds from certain equity offerings at a redemption price equal to 104.875% of the principal amount of the 2030 Notes redeemed, plus accrued and unpaid interest to (but excluding) the redemption date.On or after February 15, 2025, the 2030 Notes may be redeemed in whole or in part at the following redemption prices: (i) 103.656% if such notes are redeemed on or prior to February 14, 2026, (ii) 102.438% if such notes are redeemed on or after February 15, 2026 and on or prior to February 14, 2027, (iii) 101.219% if such notes are redeemed on or after February 15, 2027 and on or prior to February 14, 2028, and (iv) at par thereafter.
Mandatory Redemption
Repurchase of Notes at the Option of Holders
Covenants
157
subordinated indebtedness; (iv) create liens on assets or agree to restrictions on the creation of liens on assets; (v) engage in mergers or consolidations; and (vi) engage in certain transactions with affiliates.
Events of Default
Safeway Indenture
Safeway is party to an indenture, dated September 10, 1997 (the “Safeway Indenture”), with The Bank of New York, as trustee, under which Safeway has the following four outstanding issues of notes (amounts as of February 29, 2020):
(a) $136,826,000 of 3.95% Senior Notes due August 2020 (the “2020 Safeway Notes”);
(b) $130,020,000 of 4.75% Senior Notes due December 2021 (the “2021 Safeway Notes”);
(c) $120,078,000 of 7.45% Senior Debentures due September 2027 (the “2027 Safeway Notes”); and
(d) $262,099,000 of 7.25% Senior Debentures due February 2031 (the “2031 Safeway Notes”).
The 2020 Safeway Notes, 2021 Safeway Notes, 2027 Safeway Notes and 2031 Safeway Notes are collectively referred to as the “Safeway Notes.”
Interest
Guarantees
Security
Optional Redemption
2020 Safeway Notes: 20 basis points;
2021 Safeway Notes: 45 basis points;
2027 Safeway Notes: 10 basis points; and
2031 Safeway Notes: 25 basis points.
Mandatory Redemption
Repurchase of Notes at the Option of Holders
158
agencies then rating the Safeway Notes below an investment grade rating within 60 days after the change of control or announcement of an intention to effect a change of control), Safeway is required to offer to purchase all of the 2020 Safeway Notes and 2021 Safeway Notes from the holders at a price equal to 101% of the principal amount outstanding plus all accrued interest thereon.
Covenants
Events of Default
NALP Indenture
NALP (as successor to Albertson’s, Inc.) is party to an indenture, dated as of May 1, 1992 with U.S. Bank Trust National Association (as successor to Morgan Guaranty Trust Company of New York) (as supplemented by Supplemental Indenture No. 1, dated as of May 7, 2004; Supplemental Indenture No. 2, dated as of June 1, 2006; and Supplemental Indenture No. 3, dated as of December 29, 2008; collectively, the “NALP Indenture”), under which NALP has the following five outstanding issues of notes (amounts as of February 29, 2020):
(a) $78,911,000 of 6.52% to 7.15% Medium-Term Notes, due July 2027—June 2028 (the “NALP Medium-Term Notes”);
(b) $56,536,000 of 7.75% Debentures due June 2026 (the “2026 NALP Notes”);
(c) $127,206,000 of 7.45% Senior Debentures due August 2029 (the “2029 NALP Notes”);
(d) $135,098,000 of 8.70% Senior Debentures due May 2030 (the “2030 NALP Notes”); and
(e) $108,879,000 of 8.00% Senior Debentures due May 2031 (the “2031 NALP Notes”).
The NALP Medium-Term Notes, 2026 NALP Notes, 2029 NALP Notes, 2030 NALP Notes and 2031 NALP Notes are collectively referred to as the “NALP Notes.”
Interest
Guarantees
Security
Optional Redemption
(i) the 2031 NALP Notes, 30 basis points; and
(ii) the 2029 NALP Notes and 2030 NALP Notes, 20 basis points.
Mandatory Redemption
159
Covenants
Events of Default
American Stores Company Indenture
American Stores Company, LLC (“ASC”), is party to an indenture, dated as of May 1, 1995 with Wells Fargo Bank, National Association (as successor to The First National Bank of Chicago), as trustee (as further supplemented, the “ASC Indenture”), under which ASC has the following three outstanding issues of notes:
(a) $2,902,000 of 8.00% Debentures due June 2026 (the “2026 ASC Notes”);
(b) $756,000 of 7.10% Medium Term Notes due March 2028 (the “2028 ASC MT Notes”); and
(c) $143,000 of 7.5% Debentures due May 2037 (the “2037 ASC Notes”).
The 2026 ASC Notes, the 2028 ASC MT Notes, and the 2037 ASC Notes are collectively referred to as the “ASC Notes.” Interest on the ASC Notes is payable semiannually. The ASC Notes are guaranteed by SuperValu. The 2026 ASC Notes and 2037 ASC Notes are not redeemable prior to maturity. The 2028 ASC MT Notes are redeemable in whole or in part, at the option of ASC, subject to certain conditions. The ASC Notes do not require the making of any mandatory redemption or sinking fund payments.
Concurrently with the acquisition of NALP in March 2013, ASC, SuperValu, and JPMorgan Chase Bank, N.A., as escrow agent, entered into an escrow agreement pursuant to which ASC has deposited into escrow an amount equal to the outstanding principal balance of the ASC Notes plus funds sufficient to pay interest thereon for three years. ASC granted to SuperValu a security interest in its rights under the escrow agreement to secure reimbursement to SuperValu of any amounts paid by SuperValu under its guarantee of the ASC Notes. The ASC Indenture contains, solely for the benefit of the 2037 ASC Notes (but not any other series of the ASC Notes), certain covenants restricting the ability of ASC and its subsidiaries (subject to customary exceptions) to (i) create liens on certain assets, (ii) engage in mergers or consolidations or (iii) enter into sale and leaseback transactions.
160
MATERIAL U.S. FEDERAL INCOME TAX CONSEQUENCES
TO
NON-U.S.
HOLDERS OF OUR COMMON STOCKThe following discussion is a summary of the material U.S. federal income tax consequences to
Non-U.S.
Holders (as defined herein) of the purchase, ownership and disposition of our common stock issued pursuant to this offering, but does not purport to be a complete analysis of all potential U.S. federal income tax effects.The effects of other U.S. federal tax laws, such as estate and gift tax laws, and any applicable state, local or
non-U.S.
tax laws are not discussed.Non-U.S.
Holders should consult their tax advisors regarding the significant U.S. federal estate tax consequences that could apply to an investment in our common stock.This discussion is based on the U.S. Internal Revenue Code of 1986, as amended, or the Code, Treasury Regulations promulgated thereunder, judicial decisions, and published rulings and administrative pronouncements of the IRS, in each case, as in effect as of the date hereof. These authorities may change or be subject to differing interpretations. Any such change or differing interpretation may be applied retroactively in a manner that could adversely affect a
Non-U.S.
Holder of our common stock. We have not sought and will not seek any rulings from the IRS regarding the matters discussed below. There can be no assurance the IRS or a court will not take a contrary position to that discussed below regarding the U.S. federal income tax consequences of the purchase, ownership and disposition of our common stock.This discussion is limited to
Non-U.S.
Holders that hold our common stock as a “capital asset” within the meaning of Section 1221 of the Code (generally, property held for investment). This discussion does not address all U.S. federal income tax consequences relevant to aNon-U.S.
Holder’s particular circumstances, including the impact of the alternative minimum tax or the Medicare contribution tax on net investment income. In addition, it does not address consequences relevant toNon-U.S.
Holders subject to special rules, including, without limitation:| • | U.S. expatriates and former citizens or long-term residents of the United States; |
| • | persons holding our common stock as part of a hedge, straddle or other risk reduction strategy or as part of a conversion transaction or other integrated investment; |
| • | banks, insurance companies, and other financial institutions; |
| • | brokers, dealers or traders in securities, currencies or commodities; |
| • | “controlled foreign corporations,” “passive foreign investment companies,” and corporations that accumulate earnings to avoid U.S. federal income tax; |
| • | partnerships or other entities or arrangements treated as partnerships for U.S. federal income tax purposes (and investors therein); |
| • | tax-exempt entities or governmental entities; |
| • | persons deemed to sell our common stock under the constructive sale provisions of the Code; |
| • | persons who hold or receive our common stock pursuant to the exercise of any employee stock option or otherwise as compensation; |
| • | tax-qualified retirement plans; |
| • | “qualified foreign pension funds” as defined in Section 897(l)(2) of the Code and entities all of the interests of which are held by qualified foreign pension funds; |
| • | persons subject to special tax accounting rules as a result of any item of gross income with respect to the stock being taken into account in an “applicable financial statement” (as defined in the Code); |
| • | regulated investment companies; and |
| • | real estate investment trusts. |
161
If an entity treated as a partnership for U.S. federal income tax purposes holds our common stock, the tax treatment of a partner in the partnership will depend on the status of the partner, the activities of the partnership and certain determinations made at the partner level. Accordingly, partnerships considering an investment in our common stock and the partners in such partnerships should consult their tax advisors regarding the U.S. federal income tax consequences to them.
THIS DISCUSSION IS FOR INFORMATION PURPOSES ONLY AND IS NOT TAX ADVICE. INVESTORS SHOULD CONSULT THEIR TAX ADVISORS WITH RESPECT TO THE APPLICATION OF THE U.S. FEDERAL INCOME TAX LAWS TO THEIR PARTICULAR SITUATIONS AS WELL AS ANY TAX CONSEQUENCES OF THE PURCHASE, OWNERSHIP AND DISPOSITION OF OUR COMMON STOCK ARISING UNDER THE U.S. FEDERAL ESTATE OR GIFT TAX LAWS OR UNDER THE LAWS OF ANY STATE, LOCAL OR
NON-U.S.
TAXING JURISDICTION OR UNDER ANY APPLICABLE INCOME TAX TREATY.Definition of a
Non-U.S.
HolderFor purposes of this discussion, a
“Non-U.S.
Holder” is any beneficial owner of our common stock that is, for U.S. federal income tax purposes, an individual, corporation, estate or trust that is not a U.S. person. A U.S. person is any person that, for U.S. federal income tax purposes, is or is treated as any of the following:| • | an individual who is a citizen or resident of the United States; |
| • | a corporation created or organized under the laws of the United States, any state thereof, or the District of Columbia; |
| • | an estate, the income of which is subject to U.S. federal income tax regardless of its source; or |
| • | a trust that (1) is subject to the primary supervision of a U.S. court and the control of one or more “United States persons” (within the meaning of Section 7701(a)(30) of the Code), or (2) has a valid election in effect to be treated as a United States person for U.S. federal income tax purposes. |
Distributions
As described in the section entitled “Dividend Policy,” effective fiscal 2020, we have established a dividend policy pursuant to which we intend to pay a dividend on our common stock in an amount of $ per share, starting with the first full quarter following completion of this offering. Such distributions will constitute dividends for U.S. federal income tax purposes to the extent paid from our current or accumulated earnings and profits, as determined under U.S. federal income tax principles. Amounts not treated as dividends for U.S. federal income tax purposes will constitute a return of capital and first be applied against and reduce a
Non-U.S.
Holder’s adjusted tax basis in its common stock (determined on ashare-by-share
basis), but not below zero. Any excess will be treated as capital gain and will be treated as described below under “—Sale or Other Taxable Disposition.”Subject to the discussion below on effectively connected income, backup withholding and FATCA (as defined herein), dividends paid to a
Non-U.S.
Holder of our common stock will be subject to U.S. federal withholding tax at a rate of 30% of the gross amount of the dividends (or such lower rate specified by an applicable income tax treaty, provided theNon-U.S.
Holder furnishes a valid IRS FormW-8BEN
orW-8BEN-E
(or other applicable documentation) certifying qualification for the lower treaty rate). ANon-U.S.
Holder that does not timely furnish the required documentation, but that qualifies for a reduced treaty rate, may obtain a refund of any excess amounts withheld by timely filing an appropriate claim for refund with the IRS.Non-U.S.
Holders should consult their tax advisors regarding their entitlement to benefits under any applicable income tax treaty.If dividends paid to a
Non-U.S.
Holder are effectively connected with theNon-U.S.
Holder’s conduct of a trade or business within the United States, theNon-U.S.
Holder will be exempt from the U.S. federal withholding162
tax described above, unless an applicable income tax treaty provides otherwise. To claim the exemption, the
Non-U.S.
Holder generally must furnish to the applicable withholding agent a valid IRS FormW-8ECI,
certifying that the dividends are effectively connected with theNon-U.S.
Holder’s conduct of a trade or business within the United States.Any effectively connected dividends generally will be subject to U.S. federal income tax on a net income basis at the regular graduated rates in the same manner as if the
Non-U.S.
Holder were a U.S. person, unless an applicable income tax treaty provides otherwise. ANon-U.S.
Holder that is a corporation also may be subject to a branch profits tax at a rate of 30% (or such lower rate specified by an applicable income tax treaty) on its effectively connected earnings and profits, as adjusted for certain items.Non-U.S.
Holders should consult their tax advisors regarding any applicable tax treaties that may provide for different rules.Sale or Other Taxable Disposition
Subject to the discussion below on backup withholding and FATCA, a
Non-U.S.
Holder will not be subject to U.S. federal income tax on any gain recognized upon the sale or other taxable disposition of our common stock unless:| • | the gain is effectively connected with the Non-U.S. Holder’s conduct of a trade or business within the United States; |
| • | the Non-U.S. Holder is a nonresident alien individual present in the United States for 183 days or more during the taxable year of the disposition and certain other requirements are met; or |
| • | subject to certain exceptions, our common stock constitutes a U.S. real property interest, or USRPI, by reason of our status as a U.S. real property holding corporation, or USRPHC, for U.S. federal income tax purposes. |
Gain described in the first bullet point above generally will be subject to U.S. federal income tax on a net income basis at the regular graduated rates in the same manner as if the
Non-U.S.
Holder were a U.S. person, unless an applicable income tax treaty provides otherwise. ANon-U.S.
Holder that is a corporation also may be subject to a branch profits tax at a rate of 30% (or such lower rate specified by an applicable income tax treaty) on its effectively connected earnings and profits, as adjusted for certain items.Gain described in the second bullet point above will be subject to U.S. federal income tax at a rate of 30% (or such lower rate specified by an applicable income tax treaty), and may be offset by certain U.S. source capital losses of the
Non-U.S.
Holder (even though the individual is not considered a resident of the United States), provided theNon-U.S.
Holder has timely filed U.S. federal income tax returns with respect to such losses.With respect to the third bullet point above, we believe we currently are not, and do not anticipate becoming, a USRPHC. Because the determination of whether we are a USRPHC depends, however, on the fair market value of our USRPIs relative to the fair market value of our
non-U.S.
real property interests and our other business assets, there can be no assurance we currently are not a USRPHC or will not become one in the future. Even if we are or were to become a USRPHC, gain arising from the sale or other taxable disposition by aNon-U.S.
Holder of our common stock will not be subject to U.S. federal income tax if our common stock is “regularly traded,” as defined by applicable Treasury Regulations, on an established securities market, and suchNon-U.S.
Holder owned, actually and constructively, 5% or less of our common stock throughout the shorter of the five-year period ending on the date of the sale or other taxable disposition or theNon-U.S.
Holder’s holding period.Non-U.S.
Holders should consult their tax advisors regarding potentially applicable income tax treaties that may provide for different rules.163
Information Reporting and Backup Withholding
Payments of dividends on our common stock will not be subject to backup withholding, provided the holder either certifies its
non-U.S.
status, such as by furnishing a valid IRS FormW-8BEN,
W-8BEN-E
orW-8ECI,
or otherwise establishes an exemption. However, information returns are required to be filed with the IRS in connection with any dividends on our common stock paid to theNon-U.S.
Holder, regardless of whether any tax was actually withheld. In addition, proceeds of the sale or other taxable disposition of our common stock within the United States or conducted through U.S. brokers or certainnon-U.S.
brokers with specified connections to the United States may be subject to backup withholding or information reporting, unless the applicable withholding agent receives the certification described above, or the holder otherwise establishes an exemption. Proceeds of a disposition of our common stock conducted through anon-U.S.
office of anon-U.S.
broker without specified connections to the United States generally will not be subject to backup withholding or information reporting.Copies of information returns that are filed with the IRS may also be made available under the provisions of an applicable treaty or agreement to the tax authorities of the country in which the
Non-U.S.
Holder resides or is established.Backup withholding is not an additional tax. Any amounts withheld under the backup withholding rules may be allowed as a refund or a credit against a
Non-U.S.
Holder’s U.S. federal income tax liability, provided the required information is timely furnished to the IRS.Additional Withholding Tax on Payments Made to Foreign Accounts
Withholding taxes may be imposed under Sections 1471 to 1474 of the Code (such Sections commonly referred to as the Foreign Account Tax Compliance Act, or FATCA) on certain types of payments made to
non-U.S.
financial institutions and certain othernon-U.S.
entities. Specifically, a 30% withholding tax may be imposed on dividends on, or (subject to the proposed Treasury Regulations discussed below) gross proceeds from the sale or other disposition of, our common stock paid to a “foreign financial institution” or a“non-financial
foreign entity” (each as defined in the Code), whether such foreign financial institution ornon-financial
foreign entity is the beneficial owner or an intermediary, unless (1) the foreign financial institution undertakes certain diligence, withholding and reporting obligations, (2) thenon-financial
foreign entity either certifies it does not have any “substantial United States owners” (as defined in the Code) or furnishes identifying information regarding each substantial United States owner (including debt holders), or (3) the foreign financial institution ornon-financial
foreign entity otherwise qualifies for an exemption from these rules. If the payee is a foreign financial institution and is subject to the diligence and reporting requirements in (1) above, it must enter into an agreement with the U.S. Department of the Treasury requiring, among other things, that it undertake to identify accounts held by certain “specified United States persons” or “United States owned foreign entities” (each as defined in the Code), annually report certain information about such accounts, and withhold 30% on certain payments tonon-compliant
foreign financial institutions and certain other account holders. Foreign financial institutions located in jurisdictions that have an intergovernmental agreement with the United States governing FATCA may be subject to different rules.Under the applicable Treasury Regulations and administrative guidance, withholding under FATCA generally applies to payments of dividends. While withholding under FATCA would have applied also to payments of gross proceeds from the sale or other disposition of our common stock on or after January 1, 2019, recently proposed Treasury Regulations eliminate FATCA withholding on payments of gross proceeds entirely. Taxpayers generally may rely on these proposed Treasury Regulations until final Treasury Regulations are issued.
Prospective investors should consult their tax advisors regarding the potential application of withholding under FATCA to their investment in our common stock.
164
UNDERWRITING
The Company, the selling stockholders, and the underwriters named below have entered into an underwriting agreement with respect to the shares being offered. Subject to certain conditions, each underwriter has severally agreed to purchase the number of shares indicated in the following table from the selling stockholders. BofA Securities, Inc., Goldman Sachs & Co., J.P. Morgan Securities LLC and Citigroup Global Markets Inc. are the representatives of the underwriters.
Underwriters | Number of Shares | |||
BofA Securities, Inc. | ||||
Goldman Sachs & Co. LLC | ||||
J.P. Morgan Securities LLC | ||||
Citigroup Global Markets Inc. | ||||
Credit Suisse Securities (USA) LLC | ||||
Morgan Stanley & Co. LLC | ||||
Wells Fargo Securities, LLC | ||||
Barclays Capital Inc. | ||||
Deutsche Bank Securities Inc. | ||||
BMO Capital Markets Corp. | ||||
Evercore Group L.L.C. | ||||
Guggenheim Securities, LLC | ||||
Oppenheimer & Co. Inc. | ||||
RBC Capital Markets, LLC | ||||
Telsey Advisory Group LLC | ||||
MUFG Securities Americas Inc. | ||||
Academy Securities, Inc. | ||||
Blaylock Van, LLC | ||||
Total | ||||
The underwriters are committed to take and pay for all of the shares being offered, if any are taken, other than the shares covered by the option described below unless and until this option is exercised.
The underwriters have an option to buy up to an additional shares from the selling stockholders. They may exercise that option for 30 days from the date hereof. If any shares are purchased pursuant to this option, the underwriters will severally purchase shares in approximately the same proportion as set forth in the table above.
The following table shows the per share and total public offering price and proceeds to the selling stockholders and the underwriting discounts and commissions payable to the underwriters in connection with this offering. These amounts are shown assuming both no exercise and full exercise of the underwriters’ option to purchase additional shares.
Total | ||||||||||||
Per Share | No Exercise | Full Exercise | ||||||||||
Public offering price and proceeds to the selling stockholders | $ | $ | $ | |||||||||
Underwriting discounts and commissions | $ | $ | $ | |||||||||
Shares sold by the underwriters to the public will initially be offered at the initial public offering price set forth on the cover of this prospectus. Any shares sold by the underwriters to securities dealers may be sold at a discount of up to $ per share from the initial public offering price. After the initial offering of the shares, the representatives may change the offering price and the other selling terms. The offering of the shares
165
by the underwriters is subject to receipt and acceptance and subject to the underwriters’ right to reject any order in whole or in part.
The Company and its officers, directors and holders of substantially all of the Company’s common stock, including the selling stockholders, have agreed with the underwriters, subject to certain exceptions, not to dispose of or hedge any of their common stock or securities convertible into or exchangeable for shares of common stock during the period from the date of this prospectus continuing through the date that is 180 days after the date of this prospectus, except with the prior written consent of the representatives. Pursuant to these agreements, among other exceptions, we may enter into an agreement providing for the issuance of our common stock in connection with the acquisition, merger or joint venture with another publicly traded entity during the
180-day
restricted period after the date of this prospectus. This agreement does not apply to any existing employee benefit plans. See “Shares Eligible for Future Sale” for a discussion of certain transfer restrictions.At our request, the underwriters have reserved up to 5% of the shares offered by this prospectus for sale within the United States to some of our directors, officers, employees, business associates and related persons. If these persons purchase reserved shares it will reduce the number of shares available for sale to the general public. Any reserved shares that are not so purchased will be offered by the underwriters to the general public on the same terms as the other shares offered by this prospectus.
Prior to the offering, there has been no public market for the shares. The initial public offering price has been negotiated among the Company, the selling stockholders and the representatives. Among the factors to be considered in determining the initial public offering price of the shares, in addition to prevailing market conditions, will be the Company’s historical performance, estimates of the business potential and earnings prospects of the Company, an assessment of the Company’s management and the consideration of the above factors in relation to market valuation of companies in related businesses.
We have been approved to list our common stock on the NYSE under the symbol “ACI.” In order to meet one of the requirements for listing the common stock on the NYSE, the underwriters have undertaken to sell lots of 100 or more shares to a minimum of 400 beneficial holders.
In connection with this offering, the underwriters may purchase and sell shares of common stock in the open market. These transactions may include short sales, stabilizing transactions and purchases to cover positions created by short sales. Short sales involve the sale by the underwriters of a greater number of shares than they are required to purchase in the offering, and a short position represents the amount of such sales that have not been covered by subsequent purchases. A “covered short position” is a short position that is not greater than the amount of additional shares for which the underwriters’ option described above may be exercised. The underwriters may cover any covered short position by either exercising their option to purchase additional shares or purchasing shares in the open market. In determining the source of shares to cover the covered short position, the underwriters will consider, among other things, the price of shares available for purchase in the open market as compared to the price at which they may purchase additional shares pursuant to the option described above. “Naked” short sales are any short sales that create a short position greater than the amount of additional shares for which the option described above may be exercised. The underwriters must cover any such naked short position by purchasing shares in the open market. A naked short position is more likely to be created if the underwriters are concerned that there may be downward pressure on the price of the common stock in the open market after pricing that could adversely affect investors who purchase in the offering. Stabilizing transactions consist of various bids for or purchases of common stock made by the underwriters in the open market prior to the completion of the offering.
The underwriters may also impose a penalty bid. This occurs when a particular underwriter repays to the underwriters a portion of the underwriting discount received by it because the representatives have repurchased shares sold by or for the account of such underwriter in stabilizing or short covering transactions.
166
Purchases to cover a short position and stabilizing transactions, as well as other purchases by the underwriters for their own accounts, may have the effect of preventing or retarding a decline in the market price of the Company’s stock, and together with the imposition of the penalty bid, may stabilize, maintain or otherwise affect the market price of the common stock. As a result, the price of the common stock may be higher than the price that otherwise might exist in the open market. The underwriters are not required to engage in these activities and may end any of these activities at any time. These transactions may be effected on the NYSE, in the
over-the-counter
market or otherwise.The underwriters do not expect sales to discretionary accounts to exceed five percent of the total number of shares offered.
The Company estimates that its share of the total expenses of the offering, excluding underwriting discounts and commissions, will be approximately $ . The Company has agreed to reimburse the underwriters for certain expenses, including the reasonable fees and disbursements of counsel for the underwriters in connection with any required review of the terms of the offering by the Financial Industry Regulatory Authority in an amount not to exceed $35,000.
The Company has agreed to indemnify the several underwriters against certain liabilities, including liabilities under the Securities Act.
The shares may be sold in Canada only to purchasers purchasing, or deemed to be purchasing, as principal that are accredited investors, as defined in National Instrument or subsection 73.3(1) of the (Ontario), and are permitted clients, as defined in National Instrument. Any resale of the shares must be made in accordance with an exemption from, or in a transaction not subject to, the prospectus requirements of applicable securities laws.
45-106
Prospectus Exemptions
Securities Act
31-103
Registration Requirements, Exemptions and Ongoing Registrant Obligations
Securities legislation in certain provinces or territories of Canada may provide a purchaser with remedies for rescission or damages if this prospectus (including any amendment thereto) contains a misrepresentation, provided that the remedies for rescission or damages are exercised by the purchaser within the time limit prescribed by the securities legislation of the purchaser’s province or territory. The purchaser should refer to any applicable provisions of the securities legislation of the purchaser’s province or territory for particulars of these rights or consult with a legal advisor.
Pursuant to section 3A.3 of National Instrument (NI
33-105
Underwriting Conflicts
33-105),
the underwriters are not required to comply with the disclosure requirements of NI33-105
regarding underwriter conflicts of interest in connection with this offering.In relation to each Member State of the European Economic Area which has implemented the Prospectus Directive (each, a “Relevant Member State”), each underwriter has represented and agreed that with effect from and including the date on which the Prospectus Directive is implemented in that Relevant Member State (the “Relevant Implementation Date”) it has not made and will not make an offer of shares to the public in that Relevant Member State prior to the publication of a prospectus in relation to the shares which has been approved by the competent authority in that Relevant Member State or, where appropriate, approved in another Relevant Member State and notified to the competent authority in that Relevant Member State, all in accordance with the Prospectus Directive, except that it may, with effect from and including the Relevant Implementation Date, make an offer of shares to the public in that Relevant Member State at any time:
(a) to legal entities which are authorized or regulated to operate in the financial markets or, if not so authorized or regulated, whose corporate purpose is solely to invest in securities;
(b) to any legal entity which has two or more of (1) an average of at least 250 employees during the last financial year, (2) a total balance sheet of more than
€
43,000,000 and (3) an annual net turnover of more than €
50,000,000, as shown in its last annual or consolidated accounts;167
(c) to fewer than 150 natural or legal persons (other than qualified investors as defined in the Prospectus Directive) subject to obtaining the prior consent of the representatives for any such offer; or
(d) in any other circumstances which do not require the publication by the Company of a prospectus pursuant to Article 3 of the Prospectus Directive.
For the purposes of this provision, the expression an “offer of shares to the public” in relation to any shares in any Relevant Member State means the communication in any form and by any means of sufficient information on the terms of the offer and the shares to be offered so as to enable an investor to decide to purchase or subscribe the shares, as the same may be varied in that Relevant Member State by any measure implementing the Prospectus Directive in that Relevant Member State and the expression Prospectus Directive means Directive 2003/71/EC and includes any relevant implementing measure in each Relevant Member State.
Each underwriter has represented and agreed that:
(a) it has only communicated or caused to be communicated and will only communicate or cause to be communicated an invitation or inducement to engage in investment activity (within the meaning of Section 21 of the Financial Services and Markets Act 2000 (Financial Promotion) Order 2005, as amended (the “FSMA”)) received by it in connection with the issue or sale of the shares in circumstances in which Section 21(1) of the FSMA would not apply to the Company; and
(b) it has complied and will comply with all applicable provisions of the FSMA with respect to anything done by it in relation to the shares in, from or otherwise involving the United Kingdom.
The shares may not be offered or sold by means of any document other than (i) in circumstances which do not constitute an offer to the public within the meaning of the Companies Ordinance (Cap.32, Laws of Hong Kong), or (ii) to “professional investors” within the meaning of the Securities and Futures Ordinance (Cap.571, Laws of Hong Kong) and any rules made thereunder or (iii) in other circumstances which do not result in the document being a “prospectus” within the meaning of the Companies Ordinance (Cap.32, Laws of Hong Kong), and no advertisement, invitation or document relating to the shares may be issued or may be in the possession of any person for the purpose of issue (in each case whether in Hong Kong or elsewhere), which is directed at, or the contents of which are likely to be accessed or read by, the public in Hong Kong (except if permitted to do so under the laws of Hong Kong) other than with respect to shares which are or are intended to be disposed of only to persons outside Hong Kong or only to “professional investors” within the meaning of the Securities and Futures Ordinance (Cap. 571, Laws of Hong Kong) and any rules made thereunder.
This prospectus has not been registered as a prospectus with the Monetary Authority of Singapore. Accordingly, this prospectus and any other document or material in connection with the offer or sale, or invitation for subscription or purchase, of the shares may not be circulated or distributed, nor may the shares be offered or sold, or be made the subject of an invitation for subscription or purchase, whether directly or indirectly, to persons in Singapore other than (i) to an institutional investor under Section 274 of the Securities and Futures Act, Chapter 289 of Singapore (the “SFA”), (ii) to a relevant person, or any person pursuant to Section 275(1A), and in accordance with the conditions, specified in Section 275 of the SFA or (iii) otherwise pursuant to, and in accordance with the conditions of, any other applicable provision of the SFA.
Where the shares are subscribed or purchased under Section 275 of the SFA by a relevant person which is: (a) a corporation (which is not an accredited investor) the sole business of which is to hold investments and the entire share capital of which is owned by one or more individuals, each of whom is an accredited investor; or (b) a trust (where the trustee is not an accredited investor) whose sole purpose is to hold investments and each beneficiary is an accredited investor, shares, debentures and units of shares and debentures of that corporation or the beneficiaries’ rights and interest in that trust shall not be transferable for 6 months after that corporation or that trust has acquired the shares under Section 275 of the SFA except: (1) to an institutional investor under Section 274 of the SFA or to a relevant person, or any person pursuant to Section 275(1A), and in accordance with the conditions, specified in Section 275 of the SFA; (2) where no consideration is given for the transfer; or (3) by operation of law.
168
The securities have not been and will not be registered under the Financial Instruments and Exchange Law of Japan (the “Financial Instruments and Exchange Law”) and each underwriter has agreed that it will not offer or sell any securities, directly or indirectly, in Japan or to, or for the benefit of, any resident of Japan (which term as used herein means any person resident in Japan, including any corporation or other entity organized under the laws of Japan), or to others for
re-offering
or resale, directly or indirectly, in Japan or to a resident of Japan, except pursuant to an exemption from the registration requirements of, and otherwise in compliance with, the Financial Instruments and Exchange Law and any other applicable laws, regulations and ministerial guidelines of Japan.The shares may not be publicly offered in Switzerland and will not be listed on the SIX Swiss Exchange (“SIX”) or on any other stock exchange or regulated trading facility in Switzerland. This document has been prepared without regard to the disclosure standards for issuance prospectuses under art. 652a or art. 1156 of the Swiss Code of Obligations or the disclosure standards for listing prospectuses under art. 27 ff. of the SIX Listing Rules or the listing rules of any other stock exchange or regulated trading facility in Switzerland. Neither this document nor any other offering or marketing material relating to the shares or the offering may be publicly distributed or otherwise made publicly available in Switzerland.
Neither this document nor any other offering or marketing material relating to the offering, the Company, the shares have been or will be filed with or approved by any Swiss regulatory authority. In particular, this document will not be filed with, and the offer of shares will not be supervised by, the Swiss Financial Market Supervisory Authority FINMA (FINMA), and the offer of shares has not been and will not be authorized under the Swiss Federal Act on Collective Investment Schemes (“CISA”). The investor protection afforded to acquirers of interests in collective investment schemes under the CISA does not extend to acquirers of shares.
This prospectus relates to an Exempt Offer in accordance with the Offered Securities Rules of the Dubai Financial Services Authority (“DFSA”). This prospectus is intended for distribution only to persons of a type specified in the Offered Securities Rules of the DFSA. It must not be delivered to, or relied on by, any other person. The DFSA has no responsibility for reviewing or verifying any documents in connection with Exempt Offers. The DFSA has not approved this prospectus nor taken steps to verify the information set forth herein and has no responsibility for the prospectus. The shares to which this prospectus relates may be illiquid and/or subject to restrictions on their resale.
Prospective purchasers of the shares offered should conduct their own due diligence on the shares. If you do not understand the contents of this prospectus you should consult an authorized financial advisor.
No placement document, prospectus, product disclosure statement or other disclosure document has been lodged with the Australian Securities and Investments Commission, in relation to the offering. This prospectus does not constitute a prospectus, product disclosure statement or other disclosure document under the Corporations Act 2001 (the “Corporations Act”), and does not purport to include the information required for a prospectus, product disclosure statement or other disclosure document under the Corporations Act.
Any offer in Australia of the shares may only be made to persons (the “Exempt Investors”) who are “sophisticated investors” (within the meaning of section 708(8) of the Corporations Act), “professional investors” (within the meaning of section 708(11) of the Corporations Act) or otherwise pursuant to one or more exemptions contained in section 708 of the Corporations Act so that it is lawful to offer the shares without disclosure to investors under Chapter 6D of the Corporations Act.
The shares applied for by Exempt Investors in Australia must not be offered for sale in Australia in the period of 12 months after the date of allotment under the offering, except in circumstances where disclosure to investors under Chapter 6D of the Corporations Act would not be required pursuant to an exemption under section 708 of the Corporations Act or otherwise or where the offer is pursuant to a disclosure document which complies with Chapter 6D of the Corporations Act. Any person acquiring shares must observe such Australian
on-sale
restrictions.169
This prospectus contains general information only and does not take account of the investment objectives, financial situation or particular needs of any particular person. It does not contain any securities recommendations or financial product advice. Before making an investment decision, investors need to consider whether the information in this prospectus is appropriate to their needs, objectives and circumstances, and, if necessary, seek expert advice on those matters.
Determination of Offering Price
The initial public offering price for the shares will be determined by negotiations between us, the selling stockholders and the underwriters and may not be indicative of prices that will prevail in the open market following this offering.
Other Relationships
Currently, a member of our board of directors also serves on the board of directors of Bank of America Corporation, the parent company of BofA Securities, Inc.
170
LEGAL MATTERS
The validity of the common stock offered hereby will be passed upon for us by Schulte Roth & Zabel LLP, New York, New York. The underwriters are being represented in connection with this offering by Cahill Gordon & Reindel LLP, New York, New York.
EXPERTS
The consolidated financial statements of Albertsons Companies, Inc. as of February 29, 2020 and February 23, 2019, and for each of the three years in the period ended February 29, 2020, included elsewhere in this prospectus have been audited by Deloitte & Touche LLP, an independent registered public accounting firm, as stated in their report, which appears herein. Such consolidated financial statements have been so included in reliance upon the report of such firm given upon their authority as experts in accounting and auditing.
WHERE YOU CAN FIND ADDITIONAL INFORMATION
We have filed with the SEC a registration statement on Form
S-1
under the Securities Act with respect to the shares of our common stock offered by this prospectus. This prospectus, which constitutes a part of the registration statement, does not contain all of the information set forth in the registration statement, some of which is contained in exhibits to the registration statement as permitted by the rules and regulations of the SEC. For further information with respect to us and our common stock, we refer you to the registration statement, including the exhibits filed as a part of the registration statement. Statements contained in this prospectus concerning the contents of any contract or any other document are not necessarily complete. If a contract or document has been filed as an exhibit to the registration statement, please see the copy of the contract or document that has been filed. Each statement in this prospectus relating to a contract or document filed as an exhibit is qualified in all respects by the filed exhibit. The SEC maintains a website that contains reports, proxy statements and other information about issuers, like us, that file electronically with the SEC. The address of that website is www.sec.gov.As a result of this offering, we will become subject to the information and reporting requirements of the Exchange Act and, in accordance with this law, will file periodic reports, proxy statements and other information with the SEC. Historically, we have voluntarily filed annual, quarterly and current reports and other information with the SEC. These periodic reports, proxy statements and other information are and will be available for inspection and copying at the public reference facilities and website of the SEC referred to above. We also maintain a website at www.albertsonscompanies.com where, upon completion of this offering, you may access these materials free of charge as soon as reasonably practicable after they are electronically filed with, or furnished to, the SEC. The information on or that can be accessed through our website is not a part of this prospectus and the inclusion of our website address in this prospectus is an inactive textual reference only.
171
INDEX TO CONSOLIDATED FINANCIAL STATEMENTS | ||||
Page | ||||
Audited Consolidated Financial Statements | ||||
F-2 | ||||
F-3 | ||||
F-4 | ||||
F-5 | ||||
F-7 | ||||
F-8 | ||||
F-1
REPORT OF INDEPENDENT REGISTERED PUBLIC ACCOUNTING FIRM
To the Board of Directors of Albertsons Companies, Inc.
Opinion on the Financial Statements
We have audited the accompanying consolidated balance sheets of Albertsons Companies, Inc. and its subsidiaries (the “Company”) as of February 29, 2020 and February 23, 2019, the related consolidated statements of operations and comprehensive income, cash flows, and stockholders’/member equity for the 53 weeks ended February 29, 2020, the 52 weeks ended February 23, 2019 and the 52 weeks ended February 24, 2018 and the related notes (collectively referred to as the “financial statements”). In our opinion, the financial statements present fairly, in all material respects, the financial position of the Company as of February 29, 2020 and February 23, 2019, and the results of its operations and its cash flows for each of the three years in the period ended February 29, 2020, in conformity with accounting principles generally accepted in the United States of America.
Change in Accounting Principle
As discussed in Note 1 to the financial statements, effective February 24, 2019, the Company adopted FASB ASC Topic 842, Leases, using the modified retrospective transition method. The impact to the financial statements as the result of this adoption was material.
Basis for Opinion
These financial statements are the responsibility of the Company’s management. Our responsibility is to express an opinion on the Company’s financial statements based on our audits. We are a public accounting firm registered with the Public Company Accounting Oversight Board (United States) (PCAOB) and are required to be independent with respect to the Company in accordance with the U.S. federal securities laws and the applicable rules and regulations of the Securities and Exchange Commission and the PCAOB.
We conducted our audits in accordance with the standards of the PCAOB. Those standards require that we plan and perform the audit to obtain reasonable assurance about whether the financial statements are free of material misstatement, whether due to error or fraud. The Company is not required to have, nor were we engaged to perform, an audit of its internal control over financial reporting. As part of our audits, we are required to obtain an understanding of internal control over financial reporting but not for the purpose of expressing an opinion on the effectiveness of the Company’s internal control over financial reporting. Accordingly, we express no such opinion.
Our audits included performing procedures to assess the risks of material misstatement of the financial statements, whether due to error or fraud, and performing procedures that respond to those risks. Such procedures included examining, on a test basis, evidence regarding the amounts and disclosures in the financial statements. Our audits also included evaluating the accounting principles used and significant estimates made by management, as well as evaluating the overall presentation of the financial statements. We believe that our audits provide a reasonable basis for our opinion.
/s/ Deloitte & Touche LLP
Boise, Idaho
May 5, 2020
We have served as the Company’s auditor since 2006.
F-2
Albertsons Companies, Inc. and Subsidiaries
Consolidated Balance Sheets
(in millions, except share data)
February 29, 2020 | February 23, 2019 | |||||||
ASSETS | ||||||||
Current assets | ||||||||
Cash and cash equivalents | $ | 470.7 | $ | 926.1 | ||||
Receivables, net | 525.3 | 586.2 | ||||||
Inventories, net | 4,352.5 | 4,332.8 | ||||||
Prepaid assets | 255.0 | 316.2 | ||||||
Other current assets | 127.8 | 88.7 | ||||||
Total current assets | 5,731.3 | 6,250.0 | ||||||
Property and equipment, net | 9,211.9 | 9,861.3 | ||||||
Operating lease right-of-use assets | 5,867.4 | — | ||||||
Intangible assets, net | 2,087.2 | 2,834.5 | ||||||
Goodwill | 1,183.3 | 1,183.3 | ||||||
Other assets | 654.0 | 647.5 | ||||||
TOTAL ASSETS | $ | 24,735.1 | $ | 20,776.6 | ||||
LIABILITIES | ||||||||
Current liabilities | ||||||||
Accounts payable | $ | 2,891.1 | $ | 2,918.7 | ||||
Accrued salaries and wages | 1,126.0 | 1,054.7 | ||||||
Current maturities of long-term debt and finance lease obligations | 221.4 | 148.8 | ||||||
Current operating lease obligations | 563.1 | — | ||||||
Current portion of self-insurance liability | 308.9 | 306.8 | ||||||
Taxes other than income taxes | 318.1 | 309.0 | ||||||
Other current liabilities | 475.7 | 414.7 | ||||||
Total current liabilities | 5,904.3 | 5,152.7 | ||||||
Long-term debt and finance lease obligations | 8,493.3 | 10,437.6 | ||||||
Long-term operating lease obligations | 5,402.8 | — | ||||||
Deferred income taxes | 613.8 | 561.4 | ||||||
Long-term self-insurance liability | 838.5 | 839.5 | ||||||
Other long-term liabilities | 1,204.3 | 2,334.7 | ||||||
Commitments and contingencies | ||||||||
STOCKHOLDERS’ EQUITY | ||||||||
Preferred stock, $0.01 par value; 30,000,000 shares authorized, 0 shares issued and outstanding as of February 29, 2020 and February 23, 2019, respectively | — | — | ||||||
Common stock, $0.01 par value; 1,000,000,000 shares authorized, 279,597,312 and 277,882,010 shares issued and outstanding as of February 29, 2020 and February 23, 2019, respectively | 2.8 | 2.8 | ||||||
Additional paid-in capital | 1,827.3 | 1,814.2 | ||||||
Treasury stock, at cost, 1,772,018 shares held as of February 29, 2020 and February 23, 2019, respectively | (25.8 | ) | (25.8 | ) | ||||
Accumulated other comprehensive (loss) income | (118.5 | ) | 91.3 | |||||
Retained earnings (accumulated deficit) | 592.3 | (431.8 | ) | |||||
Total stockholders’ equity | 2,278.1 | 1,450.7 | ||||||
TOTAL LIABILITIES AND STOCKHOLDERS’ EQUITY | $ | 24,735.1 | $ | 20,776.6 | ||||
The accompanying notes are an integral part of these Consolidated Financial Statements.
F-3
Albertsons Companies, Inc. and Subsidiaries
Consolidated Statements of Operations and Comprehensive Income
(in millions, except per share data)
53 weeks ended February 29, 2020 | 52 weeks ended February 23, 2019 | 52 weeks ended February 24, 2018 | ||||||||||
Net sales and other revenue | $ | 62,455.1 | $ | 60,534.5 | $ | 59,924.6 | ||||||
Cost of sales | 44,860.9 | 43,639.9 | 43,563.5 | |||||||||
Gross profit | 17,594.2 | 16,894.6 | 16,361.1 | |||||||||
Selling and administrative expenses | 16,641.9 | 16,272.3 | 16,208.7 | |||||||||
(Gain) loss on property dispositions and impairment losses, net | (484.8 | ) | (165.0 | ) | 66.7 | |||||||
Goodwill impairment | — | — | 142.3 | |||||||||
Operating income (loss) | 1,437.1 | 787.3 | (56.6 | ) | ||||||||
Interest expense, net | 698.0 | 830.8 | 874.8 | |||||||||
Loss (gain) on debt extinguishment | 111.4 | 8.7 | (4.7 | ) | ||||||||
Other expense (income), net | 28.5 | (104.4 | ) | (9.2 | ) | |||||||
Income (loss) before income taxes | 599.2 | 52.2 | (917.5 | ) | ||||||||
Income tax expense (benefit) | 132.8 | (78.9 | ) | (963.8 | ) | |||||||
Net income | $ | 466.4 | $ | 131.1 | $ | 46.3 | ||||||
Other comprehensive income (loss), net of tax: | ||||||||||||
(Loss) gain on interest rate swaps | (3.4 | ) | (15.5 | ) | 47.0 | |||||||
Recognition of pension (loss) gain | (210.5 | ) | (83.1 | ) | 92.2 | |||||||
Foreign currency translation adjustment | 0.3 | (0.3 | ) | 65.0 | ||||||||
Other | 3.8 | (0.9 | ) | (0.3 | ) | |||||||
Other comprehensive (loss) income | $ | (209.8 | ) | $ | (99.8 | ) | $ | 203.9 | ||||
Comprehensive income | $ | 256.6 | $ | 31.3 | $ | 250.2 | ||||||
Net income per common share | ||||||||||||
Basic net income per common share . | $ | 1.67 | $ | 0.47 | $ | 0.17 | ||||||
Diluted net income per common share | 1.67 | 0.47 | 0.17 | |||||||||
Weighted average common shares outstanding | ||||||||||||
Basic | 279.6 | 280.1 | 279.7 | |||||||||
Diluted | 280.1 | 280.2 | 279.7 | |||||||||
The accompanying notes are an integral part of these Consolidated Financial Statements.
F-4
Albertsons Companies, Inc. and Subsidiaries
Consolidated Statements of Cash Flows
(in millions)
53 weeks ended February 29, 2020 | 52 weeks ended February 23, 2019 | 52 weeks ended February 24, 2018 | ||||||||||
Cash flows from operating activities: | ||||||||||||
Net income | $ | 466.4 | $ | 131.1 | $ | 46.3 | ||||||
Adjustments to reconcile net income to net cash provided by operating activities: | ||||||||||||
(Gain) loss on property dispositions and impairment losses, net | (484.8 | ) | (165.0 | ) | 66.7 | |||||||
Goodwill impairment | — | — | 142.3 | |||||||||
Depreciation and amortization | 1,691.3 | 1,738.8 | 1,898.1 | |||||||||
Operating lease right-of-use assets amortization | 570.3 | — | — | |||||||||
LIFO expense | 18.4 | 8.0 | 3.0 | |||||||||
Deferred income tax | (5.9 | ) | (81.5 | ) | (1,094.1 | ) | ||||||
Pension and post-retirement benefits (income) expense | (2.0 | ) | 24.5 | (0.9 | ) | |||||||
Contributions to pension and post-retirement benefit plans | (11.0 | ) | (199.3 | ) | (21.9 | ) | ||||||
Loss (gain) on interest rate swaps and commodity hedges, net | 50.6 | (1.3 | ) | (6.2 | ) | |||||||
Amortization and write-off of deferred financing costs | 39.8 | 42.7 | 56.1 | |||||||||
Loss (gain) on debt extinguishment | 111.4 | 8.7 | (4.7 | ) | ||||||||
Equity-based compensation expense | 32.8 | 47.7 | 45.9 | |||||||||
Other operating activities | 2.5 | (42.7 | ) | 110.3 | ||||||||
Changes in operating assets and liabilities, net of effects of acquisition of businesses: | ||||||||||||
Receivables, net | 60.8 | 28.8 | 21.7 | |||||||||
Inventories, net | (38.1 | ) | 80.3 | 45.6 | ||||||||
Accounts payable, accrued salaries and wages and other accrued liabilities | 85.3 | 98.4 | (158.2 | ) | ||||||||
Operating lease liabilities | (584.4 | ) | — | — | ||||||||
Self-insurance assets and liabilities | (4.0 | ) | (48.7 | ) | (55.3 | ) | ||||||
Other operating assets and liabilities | (95.5 | ) | 17.4 | (75.9 | ) | |||||||
Net cash provided by operating activities | 1,903.9 | 1,687.9 | 1,018.8 | |||||||||
Cash flows from investing activities: | ||||||||||||
Business acquisitions, net of cash acquired | — | — | (148.8 | ) | ||||||||
Payments for property, equipment and intangibles, including payments for lease buyouts | (1,475.1 | ) | (1,362.6 | ) | (1,547.0 | ) | ||||||
Proceeds from sale of assets | 1,096.7 | 1,252.0 | 939.2 | |||||||||
Proceeds from sale of Casa Ley | — | — | 344.2 | |||||||||
Other investing activities | (0.1 | ) | 23.8 | (56.6 | ) | |||||||
Net cash used in investing activities | (378.5 | ) | (86.8 | ) | (469.0 | ) | ||||||
F-5
Albertsons Companies, Inc. and Subsidiaries
Consolidated Statements of Cash Flows
(in millions)
53 weeks ended February 29, 2020 | 52 weeks ended February 23, 2019 | 52 weeks ended February 24, 2018 | ||||||||||
Cash flows from financing activities: | ||||||||||||
Proceeds from issuance of long-term debt | $ | 3,874.0 | $ | 1,969.8 | $ | 290.0 | ||||||
Payments on long-term borrowings | (5,676.6 | ) | (3,082.3 | ) | (870.6 | ) | ||||||
Payments of obligations under finance leases | (109.3 | ) | (97.5 | ) | (107.2 | ) | ||||||
Payments for debt financing costs | (53.2 | ) | (27.0 | ) | (1.5 | ) | ||||||
Payment of Casa Ley contingent value right | — | — | (222.0 | ) | ||||||||
Employee tax withholding on vesting of phantom units | (18.8 | ) | (15.3 | ) | (17.5 | ) | ||||||
Member distributions | — | — | (250.0 | ) | ||||||||
Purchase of treasury stock, at cost | — | (25.8 | ) | — | ||||||||
Proceeds from financing leases | — | — | 137.6 | |||||||||
Other financing activities | (30.3 | ) | (36.1 | ) | (56.9 | ) | ||||||
Net cash used in financing activities | (2,014.2 | ) | (1,314.2 | ) | (1,098.1 | ) | ||||||
Net (decrease) increase in cash and cash equivalents and restricted cash | (488.8 | ) | 286.9 | (548.3 | ) | |||||||
Cash and cash equivalents and restricted cash at beginning of period | 967.7 | 680.8 | 1,229.1 | |||||||||
Cash and cash equivalents and restricted cash at end of period | $ | 478.9 | $ | 967.7 | $ | 680.8 | ||||||
Reconciliation of capital investments: | ||||||||||||
Payments for property and equipment, including payments for lease buyouts | $ | (1,475.1 | ) | $ | (1,362.6 | ) | $ | (1,547.0 | ) | |||
Payments for lease buyouts | 7.7 | 18.9 | 26.5 | |||||||||
Total payments for capital investments, excluding lease buyouts | $ | (1,467.4 | ) | $ | (1,343.7 | ) | $ | (1,520.5 | ) | |||
Supplemental cash flow information: | ||||||||||||
Non-cash investing and financing activities were as follows: | ||||||||||||
Additions of finance lease obligations, excluding business acquisitions | $ | — | $ | 6.0 | $ | 31.0 | ||||||
Purchases of property and equipment included in accounts payable | 230.8 | 243.1 | 179.7 | |||||||||
Interest and income taxes paid: | ||||||||||||
Interest paid, net of amount capitalized | 718.5 | 805.9 | 813.5 | |||||||||
Income taxes paid | 228.8 | 18.2 | 15.8 | |||||||||
The accompanying notes are an integral part of these Consolidated Financial Statements.
F-6
Albertsons Companies, Inc. and Subsidiaries
Consolidated Statements of Stockholders’ / Member Equity
( in millions, except share data)
Albertsons Companies, LLC | Albertsons Companies, Inc. | |||||||||||||||||||||||||||||||||||||||
Member investment | Accumulated other comprehensive income (loss) | (Accumulated deficit) / Retained earnings | Common Stock | Additional paid in capital | Treasury Stock | Accumulated other comprehensive (loss) income | Retained earnings (accumulated deficit) | Total stockholders’ / member equity | ||||||||||||||||||||||||||||||||
Shares | Amount | |||||||||||||||||||||||||||||||||||||||
Balance as of February 25, 2017 | $ | 1,999.3 | $ | (12.8 | ) | $ | (615.3 | ) | — | $ | — | $ | — | $ | — | $ | — | $ | — | $ | 1,371.2 | |||||||||||||||||||
Equity-based compensation prior to Reorganization Transactions | 24.6 | — | — | — | — | — | — | — | — | 24.6 | ||||||||||||||||||||||||||||||
Employee tax withholding on vesting of phantom units prior to Reorganization Transactions | (17.4 | ) | — | — | — | — | — | — | — | — | (17.4 | ) | ||||||||||||||||||||||||||||
Member distribution | (250.0 | ) | — | — | — | — | — | — | — | — | (250.0 | ) | ||||||||||||||||||||||||||||
Other member activity | (1.6 | ) | — | — | — | — | — | — | — | — | (1.6 | ) | ||||||||||||||||||||||||||||
Net loss prior to Reorganization Transactions | — | — | (342.0 | ) | — | — | — | — | — | — | (342.0 | ) | ||||||||||||||||||||||||||||
Other comprehensive income, net of tax prior to Reorganization Transactions | — | 39.3 | — | — | — | — | — | — | — | 39.3 | ||||||||||||||||||||||||||||||
Reorganization Transactions | (1,754.9 | ) | (26.5 | ) | 957.3 | 279,654,028 | 2.8 | 1,752.1 | — | 26.5 | (957.3 | ) | — | |||||||||||||||||||||||||||
Equity-based compensation after Reorganization Transactions | — | — | — | — | — | 21.3 | — | — | — | 21.3 | ||||||||||||||||||||||||||||||
Employee tax withholding on vesting of phantom units after Reorganization Transactions | — | — | — | — | — | (0.1 | ) | — | — | — | (0.1 | ) | ||||||||||||||||||||||||||||
Net income after Reorganization Transactions | — | — | — | — | — | — | — | — | 388.3 | 388.3 | ||||||||||||||||||||||||||||||
Other comprehensive income, net of tax after Reorganization Transactions | — | — | — | — | — | — | — | 164.6 | — | 164.6 | ||||||||||||||||||||||||||||||
Balance as of February 24, 2018 | — | — | — | 279,654,028 | 2.8 | 1,773.3 | — | 191.1 | (569.0 | ) | 1,398.2 | |||||||||||||||||||||||||||||
Equity-based compensation | — | — | — | — | — | 47.7 | — | — | — | 47.7 | ||||||||||||||||||||||||||||||
Employee tax withholding on vesting of phantom units | — | — | — | — | — | (15.3 | ) | — | — | — | (15.3 | ) | ||||||||||||||||||||||||||||
Treasury stock purchases, at cost | — | — | — | (1,772,018 | ) | — | — | (25.8 | ) | — | — | (25.8 | ) | |||||||||||||||||||||||||||
Reorganization Transactions | — | — | — | — | — | 13.1 | — | — | — | 13.1 | ||||||||||||||||||||||||||||||
Other activity | — | — | — | — | — | (4.6 | ) | — | — | 6.1 | 1.5 | |||||||||||||||||||||||||||||
Net income | — | — | — | — | — | — | — | — | 131.1 | 131.1 | ||||||||||||||||||||||||||||||
Other comprehensive loss, net of tax | — | — | — | — | — | — | — | (99.8 | ) | — | (99.8 | ) | ||||||||||||||||||||||||||||
Balance as of February 23, 2019 | — | — | — | 277,882,010 | 2.8 | 1,814.2 | (25.8 | ) | 91.3 | (431.8 | ) | 1,450.7 | ||||||||||||||||||||||||||||
Issuance of common stock to Company’s parents | — | — | — | 1,715,302 | — | — | — | — | — | — | ||||||||||||||||||||||||||||||
Equity-based compensation | — | — | — | — | — | 32.8 | — | — | — | 32.8 | ||||||||||||||||||||||||||||||
Employee tax withholding on vesting of phantom units | — | — | — | — | — | (18.8 | ) | — | — | — | (18.8 | ) | ||||||||||||||||||||||||||||
Adoption of new accounting standards, net of tax | — | — | — | — | — | — | — | 16.6 | 558.0 | 574.6 | ||||||||||||||||||||||||||||||
Net income | �� | — | — | — | — | — | — | — | — | 466.4 | 466.4 | |||||||||||||||||||||||||||||
Other comprehensive loss, net of tax | — | — | — | — | — | — | — | (226.4 | ) | — | (226.4 | ) | ||||||||||||||||||||||||||||
Other activity | — | — | — | — | — | (0.9 | ) | — | — | (0.3 | ) | (1.2 | ) | |||||||||||||||||||||||||||
Balance as of February 29, 2020 | $ | — | $ | — | $ | — | 279,597,312 | $ | 2.8 | $ | 1,827.3 | $ | (25.8 | ) | $ | (118.5 | ) | $ | 592.3 | $ | 2,278.1 | |||||||||||||||||||
The accompanying notes are an integral part of these Consolidated Financial Statements.
F-7
Albertsons Companies, Inc. and Subsidiaries
Notes to Consolidated Financial Statements
NOTE 1—DESCRIPTION OF BUSINESS, BASIS OF PRESENTATION AND SUMMARY OF SIGNIFICANT ACCOUNTING POLICIES
Description of Business
Albertsons Companies, Inc. and its subsidiaries (the “Company” or “ACI”) is a food and drug retailer that, as of February 29, 2020, operated 2,252 retail stores together with 402 associated fuel centers, 23 dedicated distribution centers, 20 manufacturing facilities and various online platforms. The Company’s retail food businesses andand. The Company has no separate assets or liabilities other than its investments in its subsidiaries, and all of its business operations are conducted through its operating subsidiaries.
in-store
pharmacies operate throughout the United States under the bannersAlbertsons, Safeway, Vons, Pavilions, Randalls, Tom Thumb, Carrs, Jewel-Osco, Acme, Shaw’s, Star Market, United Supermarkets, Market Street
Haggen
Basis of Presentation and Reorganization Transactions
The Company’s Consolidated Financial Statements have been prepared in accordance with accounting principles generally accepted in the United States of America (“GAAP”). Intercompany transactions and accounts have been eliminated in consolidation for all periods presented. The Company’s investments in unconsolidated affiliates are recorded using the equity method.
Prior to December 3, 2017, ACI had no material assets or operations. On December 3, 2017, Albertsons Companies, LLC (“ACL”) and its parent, AB Acquisition LLC, a Delaware limited liability company (“AB Acquisition”), completed a reorganization of its legal entity structure whereby the existing equityholders of AB Acquisition each contributed their equity interests in AB Acquisition to Albertsons Investor Holdings LLC (“Albertsons Investor”) and KIM ACI, LLC (“KIM ACI”). In exchange, equityholders received a proportionate share of units in Albertsons Investor and KIM ACI, respectively. Albertsons Investor and KIM ACI then contributed all of the AB Acquisition equity interests they received to ACI in exchange for common stock issued by ACI. As a result, Albertsons Investor and KIM ACI became the parents of ACI, owning all of its outstanding common stock, with AB Acquisition and its subsidiary, ACL, becoming wholly-owned subsidiaries of ACI. On February 25, 2018, ACL merged with and into ACI, with ACI as the surviving corporation (such transactions, collectively, the “Reorganization Transactions”). Prior to February 25, 2018, substantially all of the assets and operations of ACI were those of its subsidiary, ACL. The Reorganization Transactions were accounted for as a transaction between entities under common control and, accordingly, there was no change in the basis of the underlying assets and liabilities. The Consolidated Financial Statements are reflective of the changes that occurred as a result of the Reorganization Transactions. Prior to February 25, 2018, the Consolidated Financial Statements of ACI reflect the net assets and operations of ACL.
Prior Period Reclassifications
Certain prior period amounts have been reclassified to conform to the current period presentation, specifically the reclassification of gains and losses from property dispositions and impairment losses from Selling and administrative expenses to (Gain) loss on property dispositions and impairment losses, net on the Consolidated Statements of Operations and Comprehensive Income.
Significant Accounting Policies
Fiscal year:
F-8
each consist of 12 weeks, and the fiscal year generally consists of 52 weeks. For the fiscal year ended February 29, 2020, the fourth quarter consisted of 13 weeks, and the fiscal year consisted of 53 weeks. For each of the prior years presented, the fiscal year consisted of 52 weeks.
Use of estimates:
Financial
Statements in conformity with GAAP requires management to make estimates and assumptions that affect the reported amounts of assets and liabilities and the disclosure of contingent assets and liabilities at the date of the financial statements and the reported amounts of revenues and expenses for the reporting periods presented. Certain estimates require difficult, subjective or complex judgments about matters that are inherently uncertain. Actual results could differ from those estimates.Cash and cash equivalents:
Restricted cash:
Receivables, net:
Management makes estimates of the uncollectibility of its accounts receivable. In determining the adequacy of the allowances for doubtful accounts, management analyzes the value of collateral, historical collection experience, aging of receivables and other economic and industry factors. It is possible that the accuracy of the estimation process could be materially impacted by different judgments, estimations and assumptions based on the information considered and could result in a further adjustment of receivables. The allowance for doubtful accounts and bad debt expense were not material for any of the periods presented.
Inventories, net:
As of February 29, 2020 and February 23, 2019, approximately 85.6% and 85.9%, respectively, of the Company’s inventories were valued under the
last-in,
first-out
(“LIFO”) method. The Company primarily uses the retail inventory or the item-cost method to determine inventory cost before application of any LIFO adjustment. Under the retail inventory method, inventory cost is determined, before the application of any LIFO adjustment, by applying acost-to-retail
ratio to various categories of similar items to the retail value of those items. Under the item-cost method, the most recent purchase cost is used to determine the cost of inventory before the application of any LIFO adjustment. Replacement or current cost was higher than the carrying amount of inventories valued using LIFO by $143.5 million and $125.1 million as of February 29, 2020 and February 23, 2019, respectively. During fiscal 2019, fiscal 2018 and fiscal 2017, inventory quantities in certain LIFO layers were reduced. These reductions resulted in a liquidation of LIFO inventory quantities carried at lower costs prevailing in prior years as compared with the cost of fiscal 2019, fiscal 2018 and fiscal 2017 purchases. As a result, cost of sales decreased by $12.9 million, $18.1 million and $16.7 million in fiscal 2019, fiscal 2018 and fiscal 2017, respectively. Cost for the remaining inventories, which represents perishable and fuel inventories, was determined using the most recent purchase cost, which approximates thefirst-in,
first-out
(“FIFO”) method. Perishables are counted every four weeks and are carried at the last purchased cost which approximates FIFO cost. Fuel inventories are carried at the last purchased cost, which approximates FIFO cost. The Company records inventory shortages based on actual physical counts at its facilities and also provides allowances for inventory shortages for the period between the last physical count and the balance sheet date.Assets held for sale:
F-9
Consolidated Balance Sheets. As of February 29, 2020, and February 23, 2019, immaterial amounts of assets and liabilities held for sale are recorded in other current assets and other current liabilities, respectively.
Property and equipment, net:
Property and equipment under finance leases are recorded at the lower of the present value of the future minimum lease payments or the fair value of the asset and are amortized on the straight-line method over the lesser of the lease term or the estimated useful life. Interest capitalized on property under construction was immaterial for all periods presented.
Leases:
right-of-use
(“ROU”) assets, current operating lease obligations and long-term operating lease obligations on the Consolidated Balance Sheets. Finance leases are included in Property and equipment, net, current maturities of long-term debt and finance lease obligations and long-term debt and finance lease obligations on the Consolidated Balance Sheets. Operating lease assets represent the Company’s right to use an underlying asset for the lease term, and lease liabilities represent the Company’s obligation to make lease payments arising from the lease. Lease liabilities are based on the present value of remaining lease payments over the lease term. As the rate implicit in the Company’s leases is not readily determinable, the Company’s applicable incremental borrowing rate, which is estimated to approximate the interest rate on a collateralized basis with similar terms, is used in calculating the present value of the sum of the lease payments. Operating lease assets are based on the lease liability, adjusted for any prepayments, lease incentives and initial direct costs incurred. The typical real estate lease period is 15 to 20 years with renewal options for varying terms and, to a limited extent, options to purchase. The Company includes renewal options that are reasonably certain to be exercised as part of the lease term.The Company has lease agreements with
non-lease
components that relate to the lease components. Certain leases contain percent rent based on sales, escalation clauses or payment of executory costs such as property taxes, utilities, insurance and maintenance.Non-lease
components primarily relate to common area maintenance.Non-lease
components and the lease components to which they relate are accounted for together as a single lease component for all asset classes. The Company recognizes lease payments for short-term leases as expense either straight-line over the lease term or as incurred depending on whether lease payments are fixed or variable.Impairment of long-lived assets:
Intangible assets, net:
F-10
lived intangible assets for impairment in accordance with its policy for long-lived assets. Intangible assets with indefinite useful lives, which are not amortized, consist of restricted covenants and liquor licenses. The Company reviews intangible assets with indefinite useful lives and tests for impairment annually on the first day of the fourth quarter and also if events or changes in circumstances indicate the occurrence of a triggering event. The review consists of comparing the estimated fair value of the cash flows generated by the asset to the carrying value of the asset.
Business combination measurements:
The fair value of assets acquired and liabilities assumed are determined using market, income and cost approaches from the perspective of a market participant. The fair value measurements can be based on significant inputs that are not readily observable in the market. The market approach indicates value for a subject asset based on available market pricing for comparable assets. The market approach used includes prices and other relevant information generated by market transactions involving comparable assets, as well as pricing guides and other sources. The income approach indicates value for a subject asset based on the present value of cash flows projected to be generated by the asset. Projected cash flows are discounted at a required market rate of return that reflects the relative risk of achieving the cash flows and the time value of money. The cost approach, which estimates value by determining the current cost of replacing an asset with another of equivalent economic utility, was used for certain assets for which the market and income approaches could not be applied due to the nature of the asset. The cost to replace a given asset reflects the estimated reproduction or replacement cost for the asset, adjusted for obsolescence, whether physical, functional or economic.
Goodwill:
During the second quarter of fiscal 2017, there was a sustained decline in the market multiples of publicly traded peer companies. In addition, during the second quarter of fiscal 2017, the Company revised its short-term operating plan. As a result, the Company determined that an interim review of its recoverability of goodwill was necessary. Consequently, during the second quarter of fiscal 2017, the Company recorded a goodwill impairment loss of $142.3 million, substantially all within the Acme reporting unit relating to the November 2015 acquisition of stores from The Great Atlantic and Pacific Tea Company, Inc., due to changes in the estimate of its long-term future financial performance to reflect lower expectations for growth in revenue and earnings than previously estimated. The goodwill impairment loss was based on a quantitative analysis using a combination of a discounted cash flow model (income approach) and a guideline public company comparative analysis (market approach).
Business combination measurements:
F-11
purchase price over the fair value of the tangible and identifiable intangible assets acquired and liabilities assumed in the acquisition.
The fair value of assets acquired and liabilities assumed are determined using market, income and cost approaches from the perspective of a market participant. The fair value measurements can be based on significant inputs that are not readily observable in the market. The market approach indicates value for a subject asset based on available market pricing for comparable assets. The market approach used includes prices and other relevant information generated by market transactions involving comparable assets, as well as pricing guides and other sources. The income approach indicates value for a subject asset based on the present value of cash flows projected to be generated by the asset. Projected cash flows are discounted at a required market rate of return that reflects the relative risk of achieving the cash flows and the time value of money. The cost approach, which estimates value by determining the current cost of replacing an asset with another of equivalent economic utility, was used for certain assets for which the market and income approaches could not be applied due to the nature of the asset. The cost to replace a given asset reflects the estimated reproduction or replacement cost for the asset, adjusted for obsolescence, whether physical, functional or economic.
Investment in unconsolidated affiliates:
El Rancho:
Casa Ley:
₱
6.5 billion Mexican pesos (approximately $348.4 million in U.S. dollars). In connection with the sale, the Company recorded a loss, net of $25.0 million in the third quarter of fiscal 2017, which is included in Other income, driven by the change in the fair value of the assets held for sale and the change in fair value of the related Casa Ley contingent value rights (“CVRs”). Net proceeds from the sale were used to distribute approximately $222 million in cash (or approximately $0.934 in cash per Casa Ley CVR) pursuant to the terms of the Casa Ley CVR agreement.Company-Owned life insurance policies (“COLI”):
Derivatives:
F-12
instruments are highly effective in offsetting the changes in the fair value or cash flow of the hedged items. If it is determined that a derivative is not highly effective as a hedge or ceases to be highly effective, the Company discontinues hedge accounting prospectively.
The Company has also entered into contracts to purchase electricity and natural gas at fixed prices for a portion of its energy needs. The Company expects to take delivery of the electricity and natural gas in the normal course of business. Contracts that qualify for the normal purchase exception under derivatives and hedging accounting guidance are not recorded at fair value. Energy purchased under these contracts is expensed as delivered. The Company also manages its exposure to changes in diesel prices utilized in the Company’s distribution process through the use of short-term heating oil derivative contracts. These contracts are economic hedges of price risk and are not designated or accounted for as hedging instruments for accounting purposes. Changes in the fair value of these instruments are recognized in current period earnings.
Self-Insurance liabilities
The Company has reinsurance receivables of $22.5 million and $20.3 million recorded within Receivables, net and $43.9 million and $41.1 million recorded within Other assets as of February 29, 2020 and February 23, 2019, respectively. The self-insurance liabilities and related reinsurance receivables are recorded gross.
Changes in self-insurance liabilities consisted of the following (in millions):
February 29, 2020 | February 23, 2019 | |||||||
Beginning balance | $ | 1,146.3 | $ | 1,217.7 | ||||
Expense | 323.4 | 323.5 | ||||||
Claim payments | (295.6 | ) | (279.3 | ) | ||||
Other reductions (1) | (26.7 | ) | (115.6 | ) | ||||
Ending balance | 1,147.4 | 1,146.3 | ||||||
Less current portion | (308.9 | ) | (306.8 | ) | ||||
Long-term portion | $ | 838.5 | $ | 839.5 | ||||
| (1) | Primarily reflects actuarial adjustments for claims experience and systematic adjustments to the fair value of assumed self-insurance liabilities from acquisitions. |
Benefit plans and Multiemployer plans:
non-contributory
pension, profit sharing or 401(k) plans, in addition to dedicated defined benefit plans for certain Safeway Inc. (“Safeway”), Shaw’s and United Supermarkets, LLC (“United”) employees. Certain employees participate in a long-term retention incentive bonus plan. The Company also provides certain health and welfare benefits, including short-term and long-term disability benefits to inactive disabled employees prior to retirement.The Company recognizes a liability for the underfunded status of the defined benefit plans as a component of Other long-term liabilities. Actuarial gains or losses and prior service costs or credits are recorded within
F-13
Other
comprehensive (loss) income. The determination of the Company’s obligation and related expense for its sponsored pensions and other post-retirement benefits is dependent, in part, on management’s selection of certain actuarial assumptions in calculating these amounts. These assumptions include, among other things, the discount rate and expected long-term rate of return on plan assets.Most union employees participate in multiemployer retirement plans pursuant to collective bargaining agreements, unless the collective bargaining agreement provides for participation in plans sponsored by the Company. Pension expense for the multiemployer plans is recognized as contributions are funded.
Revenue recognition
The Company records a contract liability when it sells its own proprietary gift cards. The Company records a sale when the customer redeems the gift card. The Company’s gift cards do not expire. The Company reduces the contract liability and records revenue for the unused portion of gift cards (“breakage”) in proportion to its customers’ pattern of redemption, which the Company determined to be the historical redemption rate. The Company’s contract liability related to gift cards was $52.2 million as of February 29, 2020 and $55.9 million as of February 23, 2019.
Disaggregated Revenues
The following table represents sales revenue by type of similar product (in millions):
Fiscal 2019 | Fiscal 2018 | Fiscal 2017 | ||||||||||||||||||||||
Amount (1) | % of Total | Amount (1) | % of Total | Amount (1) | % of Total | |||||||||||||||||||
Non-perishables (2) | $ | 27,165.3 | 43.5 | % | $ | 26,371.8 | 43.6 | % | $ | 26,522.0 | 44.3 | % | ||||||||||||
Perishables (3) | 25,681.8 | 41.1 | % | 24,920.9 | 41.2 | % | 24,583.7 | 41.0 | % | |||||||||||||||
Pharmacy | 5,236.8 | 8.4 | % | 4,986.6 | 8.2 | % | 5,002.6 | 8.3 | % | |||||||||||||||
Fuel | 3,430.4 | 5.5 | % | 3,455.9 | 5.7 | % | 3,104.6 | 5.2 | % | |||||||||||||||
Other (4) | 940.8 | 1.5 | % | 799.3 | 1.3 | % | 711.7 | 1.2 | % | |||||||||||||||
Total (5) | $ | 62,455.1 | 100.0 | % | $ | 60,534.5 | 100.0 | % | $ | 59,924.6 | 100.0 | % | ||||||||||||
| (1) | eCommerce related sales are included in the categories to which the revenue pertains. |
| (2) | Consists primarily of general merchandise, grocery and frozen foods. |
| (3) | Consists primarily of produce, dairy, meat, deli, floral and seafood. |
| (4) | Consists primarily of wholesale revenue to third parties, commissions and other miscellaneous revenue. |
| (5) | Fiscal 2019 includes approximately $1.1 billion of incremental Net sales and other revenue due to the additional 53rd week. |
F-14
Cost of sales and vendor allowances:
The Company receives vendor allowances or rebates (“Vendor Allowances”) for a variety of merchandising initiatives and buying activities. The terms of the Company’s Vendor Allowances arrangements vary in length but are primarily expected to be completed within a quarter. The Company records Vendor Allowances as a reduction of Cost of sales when the associated products are sold. Vendor Allowances that have been earned as a result of completing the required performance under terms of the underlying agreements but for which the product has not yet been sold are recognized as reductions of inventory. The reduction of inventory for these Vendor Allowances was $72.0 million and $74.8 million as of February 29, 2020 and February 23, 2019, respectively.
Advertising costs are included in Cost of sales and are expensed in the period the advertising occurs. Cooperative advertising funds are recorded as a reduction of Cost of sales when the advertising occurs. Advertising costs were $405.6 million, $422.3 million and $497.5 million, net of cooperative advertising allowances of $91.9 million, $101.3 million and $81.1 million for fiscal 2019, fiscal 2018 and fiscal 2017, respectively.
Selling and administrative expenses:
Income taxes:
Deferred taxes are provided for the net tax effects of temporary differences between the financial reporting and income tax basis of assets and liabilities using enacted tax rates in effect for the year in which the differences are expected to reverse. The effect of a change in tax rates on deferred tax assets and liabilities is recognized in income in the period that includes the enactment date. Valuation allowances are established where management determines that it is more likely than not that some portion or all of a deferred tax asset will not be realized. The Company reviews tax positions taken or expected to be taken on tax returns to determine whether and to what extent a tax benefit can be recognized. The Company evaluates its positions taken and establishes liabilities in accordance with the applicable accounting guidance for uncertain tax positions. The Company reviews these liabilities as facts and circumstances change and adjusts accordingly. The Company recognizes any interest and penalties associated with uncertain tax positions as a component of Income tax expense. The Tax Act requires a U.S. shareholder of a controlled foreign corporation to provide U.S. taxes on its share of global
intangible
low-taxed
income (“GILTI”). The current and deferred tax impact of GILTI is not material to the Company. Accordingly, the Company will report the tax impact of GILTI as a period cost and not provide deferred taxes for the basis difference that would be expected to reverse as GILTI.The Company is contractually indemnified by SUPERVALU INC. (“SuperValu”) for any tax liability of New Albertsons L.P. (“NALP”) arising from tax years prior to the NALP acquisition. The Company is also contractually obligated to pay SuperValu any tax benefit it receives in a tax year after the NALP acquisition as a result of an indemnification payment made by SuperValu. An indemnification asset and liability, where necessary, has been recorded to reflect this arrangement.
F-15
Segments
Recently adopted accounting standards:
2016-02,
”Leases (Topic 842)
Lease
2016-02
requires recognition of aRight-of-use
asset and liability for future lease payments for contracts that meet the definition of a lease and requires disclosure of certain information about leasing arrangements. On July 30, 2018, the FASB issued ASU2018-11,
“Leases (Topic 842): Targeted Improvements
The Company adopted the guidance effective February 24, 2019 by recognizing and measuring leases at the adoption date with a cumulative effect of initially applying the guidance recognized at the date of initial application and as a result did not restate the prior periods presented in the Consolidated Financial Statements. The Company elected certain practical expedients permitted under the transitional guidance, including retaining historical lease classification, evaluating whether any expired contracts are or contain leases, and not applying hindsight in determining the lease term. The Company also elected the practical expedient to not separate lease and
non-lease
components within the lessee lease transaction for all classes of assets. Lastly, the Company elected the short-term lease exception for all classes of assets, and therefore does not apply the recognition requirements for leases of 12 months or less.The adoption of the standard resulted in the recognition of an operating lease ROU asset of $5.3 billion and an operating lease liability of $5.4 billion. Included in the measurement of the new operating lease ROU asset is the reclassification of certain balances, including those historically recorded as lease exit cost liabilities, deferred rent and beneficial and unfavorable lease interests. The adoption also resulted in a cumulative effect transitional adjustment of $776.0 million ($574.6 million, net of tax) to retained earnings related to the elimination of $865.8 million deferred gains on sale leaseback transactions, partially offset by the recognition of $87.3 million in impairment losses on operating lease assets and the removal of $17.2 million and $14.7 million, respectively, of assets and liabilities related to finance lease obligations under previously existing
build-to-suit
accounting arrangements. Several other immaterial reclassifications of historical asset and liability line items were also recorded in the Company’s Consolidated Balance Sheets upon adoption.In February 2018, the FASB issued ASU.” This ASU allows a reclassification from accumulated other comprehensive income to retained earnings for stranded tax effects resulting from the Tax Cuts and Jobs Act. The Company adopted this guidance in the first quarter of fiscal 2019 and applied the amendments in the period of adoption. The adoption of this standard resulted in a $16.6 million adjustment to both Retained earnings (accumulated deficit) and Accumulated other comprehensive income. The standard did not have a material impact on the Company’s Consolidated Statements of Operations and the Consolidated Statements of Cash Flows.
2018-02,
“Income Statement—Reporting Comprehensive Income (Topic 220): Reclassification of Certain Tax Effects from Accumulated Other Comprehensive Income
F-16
Recently issued accounting standards:
2019-12,
”Simplifying the Accounting for Income Taxes
step-up
in the tax basis of goodwill. The ASU will take effect for public entities for annual reporting periods beginning after December 15, 2020, and interim periods within those fiscal years. Early adoption is permitted. The Company is currently evaluating the effect of this standard on its Consolidated Financial Statements.NOTE 2—ACQUISITIONS
Fiscal 2017
Plated
On September 20, 2017, the Company acquired DineInFresh, Inc. (“Plated”), a provider of meal kit services, for purchase consideration of $219.5 million, consisting of cash consideration of $117.3 million, deferred cash consideration with a fair value of $42.1 million, and contingent consideration with a fair value of $60.1 million on the acquisition date. The Plated acquisition was accounted for under the acquisition method of accounting. The purchase price was allocated to the fair values of the identifiable assets and liabilities, with any excess of purchase price over the fair value recognized as goodwill. Net assets acquired primarily consisted of intangible assets and goodwill valued at $67.1 million and $146.2 million, respectively. Intangible assets acquired consisted of trademarks and tradenames, customer lists and software. The goodwill was primarily attributable to synergies the Company expected to achieve related to the acquisition and was allocated to the Company’s operating segments which are its reporting units. In connection with the acquisition, the Company also expensed $6.3 million related to unvested equity awards of Plated. The goodwill is not deductible for tax purposes. Pro forma results are not presented as the acquisition was not considered material to the Company. Third-party acquisition-related costs were immaterial for fiscal 2017 and were expensed as incurred as a component of Selling and administrative expenses. As of February 29, 2020, there was $25.0 million remaining to be paid in deferred consideration and no amount is expected to be paid in contingent consideration.
MedCart
On May 31, 2017, the Company acquired MedCart Specialty Pharmacy for $34.5 million, including the cost of acquired inventory. The acquisition was accounted for under the acquisition method of accounting and resulted in $11.6 million of goodwill that is deductible for tax purposes. Pro forma results are not presented, as the acquisition was not considered material to the Company.
NOTE 3—PROPERTY AND EQUIPMENT
Property and equipment, net consisted of the following (in millions):
February 29, 2020 | February 23, 2019 | |||||||
Land | $ | 2,119.2 | $ | 2,382.7 | ||||
Buildings | 4,720.0 | 4,968.4 | ||||||
Property under construction | 669.3 | 652.2 | ||||||
Leasehold improvements | 1,706.6 | 1,468.3 | ||||||
Fixtures and equipment | 5,802.4 | 5,132.1 | ||||||
Property and equipment under finance leases | 882.5 | 970.8 | ||||||
Total property and equipment | 15,900.0 | 15,574.5 | ||||||
Accumulated depreciation and amortization | (6,688.1 | ) | (5,713.2 | ) | ||||
Total property and equipment, net | $ | 9,211.9 | $ | 9,861.3 | ||||
F-17
Depreciation expense was $
1,244.7 million, $
1,257.7 million and $
1,330.5 million for fiscal 2019, fiscal 2018 and fiscal 2017, respectively. Amortization expense related to finance lease assets was $
90.2 million, $
101.4 million and $
120.2 million in fiscal 2019, fiscal 2018 and fiscal 2017, respectively. Fixed asset impairment losses of $
21.8 million, $
31.0 million and $
78.8 million were recorded as a component of (Gain) loss on property dispositions and impairment losses, net in fiscal 2019, fiscal 2018 and fiscal 2017, respectively. The impairment losses primarily relate to assets in underperforming stores, certain surplus properties and fiscal 2019 also includes certain leasehold interests and equipment related to the Plated meal kit subscription and delivery business.
NOTE 4—INTANGIBLE ASSETS
The Company’s Intangible assets, net consisted of the following (in millions):
February 29, 2020 | February 23, 2019 | |||||||||||||||||||||||||||
Estimated useful lives (Years) | Gross carrying amount | Accumulated amortization | Net | Gross carrying amount | Accumulated amortization | Net | ||||||||||||||||||||||
Trade names | 40 | $ | 1,912.1 | $ | (264.6 | ) | $ | 1,647.5 | $ | 1,959.1 | $ | (231.7 | ) | $ | 1,727.4 | |||||||||||||
Beneficial lease rights (1) | 12 | — | — | — | 892.0 | (410.6 | ) | 481.4 | ||||||||||||||||||||
Customer prescription files | 5 | 1,472.1 | (1,440.9 | ) | 31.2 | 1,483.4 | (1,276.1 | ) | 207.3 | |||||||||||||||||||
Internally developed software | 3 | 780.0 | (465.2 | ) | 314.8 | 672.4 | (348.1 | ) | 324.3 | |||||||||||||||||||
Other intangible assets (2) | 3 to 6 | 51.7 | (44.1 | ) | 7.6 | 22.4 | (14.4 | ) | 8.0 | |||||||||||||||||||
Total finite-lived intangible assets | 4,215.9 | (2,214.8 | ) | 2,001.1 | 5,029.3 | (2,280.9 | ) | 2,748.4 | ||||||||||||||||||||
Liquor licenses and restricted covenants | Indefinite | 86.1 | — | 86.1 | 86.1 | — | 86.1 | |||||||||||||||||||||
Total intangible assets, net | $ | 4,302.0 | $ | (2,214.8 | ) | $ | 2,087.2 | $ | 5,115.4 | $ | (2,280.9 | ) | $ | 2,834.5 | ||||||||||||||
| (1) | Upon adoption of ASU 2016-02—“Leases (Topic 842)”, beneficial lease rights were reclassified and included in operating leaseright-of-use assets. See Note 1—Description of business, basis of presentation and summary of significant accounting policies for additional information. |
| (2) | Other intangible assets includes covenants not to compete, specialty accreditation and licenses and patents. |
Amortization expense for intangible assets was $355.8 million, $379.7 million and $447.4 million for fiscal 2019, fiscal 2018 and fiscal 2017, respectively. Estimated future amortization expense associated with the net carrying amount of intangibles with finite lives is as follows (in millions):
Fiscal Year | Amortization Expected | |||
2020 | $ | 159.4 | ||
2021 | 137.8 | |||
2022 | 120.0 | |||
2023 | 85.8 | |||
2024 | 59.7 | |||
Thereafter | 1,438.4 | |||
Total | $ | 2,001.1 | ||
F-18
Intangible asset impairment losses of $34.1 million, $5.3 million and $22.1 million were recorded as a component of (Gain) loss on property dispositions and impairment losses, net, in fiscal 2019, fiscal 2018 and fiscal 2017, respectively. The fiscal 2019 impairment loss was driven by the continued under performance of the Plated meal kit subscription and delivery operations and primarily relates to the Plated tradename, and to a lesser extent, certain other Plated intangible assets. The fair value was determined using an income approach which included a relief-from-royalty method and relied on inputs with unobservable market prices including the assumed revenue growth rate, royalty rate, discount rate and estimated tax rate. Fiscal 2018 and fiscal 2017 impairment losses primarily relate to underperforming stores, and fiscal 2017 also includes a $12.8 million loss related to information technology assets in connection with the Company’s development of a new digital platform.
NOTE 5—FAIR VALUE MEASUREMENTS
The accounting guidance for fair value established a framework for measuring fair value and established a three-level valuation hierarchy for disclosure of fair value measurement. The valuation hierarchy is based upon the transparency of inputs to the valuation of an asset or liability at the measurement date. The three levels are defined as follows:
Level 1 - | Quoted prices in active markets for identical assets or liabilities; | |||
Level 2 - | Inputs other than quoted prices included within Level 1 that are either directly or indirectly observable; | |||
Level 3 - | Unobservable inputs in which little or no market activity exists, requiring an entity to develop its own assumptions that market participants would use to value the asset or liability. |
Fair value is defined as the price that would be received to sell an asset or paid to transfer a liability in an orderly transaction between market participants at the measurement date.
The following table presents assets and liabilities which are measured at fair value on a recurring basis as of February 29, 2020 (in millions):
Fair Value Measurements | ||||||||||||||||
Total | Quoted prices in active markets for identical assets (Level 1) | Significant observable inputs (Level 2) | Significant unobservable inputs (Level 3) | |||||||||||||
Assets: | ||||||||||||||||
Cash equivalents: | ||||||||||||||||
Money Market | $ | 2.0 | $ | 2.0 | $ | — | $ | — | ||||||||
Short-term investments (1) | 13.5 | 5.0 | 8.5 | — | ||||||||||||
Non-current investments(2) | 85.9 | 26.8 | 59.1 | — | ||||||||||||
Total | $ | 101.4 | $ | 33.8 | $ | 67.6 | $ | — | ||||||||
Liabilities: | ||||||||||||||||
Derivative contracts (3) | $ | 66.4 | $ | — | $ | 66.4 | $ | — | ||||||||
Total | $ | 66.4 | $ | — | $ | 66.4 | $ | — | ||||||||
| (1) | Primarily relates to Mutual Funds (Level 1) and Corporate Bonds (Level 2). Included in Other current assets. |
| (2) | Primarily relates to investments in publicly traded stock (Level 1) and U.S. Treasury Notes and Corporate Bonds (Level 2). Included in Other assets. |
| (3) | Primarily relates to interest rate swaps. Included in Other current liabilities. |
F-19
The following table presents assets and liabilities which are measured at fair value on a recurring basis as of February 23, 2019 (in millions):
Fair Value Measurements | ||||||||||||||||
Total | Quoted prices in active markets for identical assets (Level 1) | Significant observable inputs (Level 2) | Significant unobservable inputs (Level 3) | |||||||||||||
Assets: | ||||||||||||||||
Cash equivalents: | ||||||||||||||||
Money Market | $ | 489.0 | $ | 489.0 | $ | — | $ | — | ||||||||
Short-term investments (1) | 23.1 | 21.0 | 2.1 | — | ||||||||||||
Non-current investments(2) | 84.2 | 30.5 | 53.7 | — | ||||||||||||
Total | $ | 596.3 | $ | 540.5 | $ | 55.8 | $ | — | ||||||||
Liabilities: | ||||||||||||||||
Derivative contracts (3) | $ | 21.1 | $ | — | $ | 21.1 | $ | — | ||||||||
Total | $ | 21.1 | $ | — | $ | 21.1 | $ | — | ||||||||
| (1) | Primarily relates to Mutual Funds. Included in Other current assets. |
| (2) | Primarily relates to investments in publicly traded stock (Level 1) and U.S. Treasury Notes and Corporate Bonds (Level 2). Included in Other assets. |
| (3) | Primarily relates to interest rate swaps. Included in Other current liabilities. |
Contingent consideration obligations are a Level 3 measurement based on cash flow projections and other assumptions for the milestone performance targets. Changes in fair value of the contingent consideration are recorded in the consolidated statements of operations within Other expense (income), net.
The estimated fair value of the Company’s debt, including current maturities, was based on Level 2 inputs, being market quotes or values for similar instruments, and interest rates currently available to the Company for the issuance of debt with similar terms and remaining maturities as a discount rate for the remaining principal payments. As of February 29, 2020, the fair value of total debt was $8,486.2 million compared to a carrying value of $8,162.2 million, excluding debt discounts and deferred financing costs. As of February 23, 2019, the fair value of total debt was $9,801.2 million compared to the carrying value of $10,086.3 million, excluding debt discounts and deferred financing costs.
Assets Measured at Fair Value on a Nonrecurring Basis
The Company measures certain assets at fair value on a
non-recurring
basis, including long-lived assets and goodwill, which are evaluated for impairment. Long-lived assets include store-related assets such as property and equipment, operating lease assets and certain intangible assets. The inputs used to determine the fair value of long-lived assets and a reporting unit are considered Level 3 measurements due to their subjective nature.As described elsewhere in these Consolidated Financial Statements, the Company recorded a goodwill impairment loss of $142.3 million during fiscal 2017. No goodwill impairment losses were recorded during fiscal 2019 and fiscal 2018. The Company also recorded long-lived asset impairment losses of $77.4 million, $36.3 million and $100.9 million during fiscal 2019, fiscal 2018 and fiscal 2017, respectively.
NOTE 6—DERIVATIVE FINANCIAL INSTRUMENTS
The aggregate notional amount of all Swaps as of February 29, 2020 and February 23, 2019, were $2,023.0 million and $2,123.2 million, of which NaN and $2,065.2 million are designated as cash flow hedges, respectively, as defined by GAAP.
F-20
On February 5, 2020, the Company repaid in full the Albertsons Term Loans (as defined in Note 7—Long-term debt and finance lease obligations ) using cash on hand and proceeds from the issuance of new notes (as further discussed in Note 7—Long-term debt and finance lease obligations). Consequently, the Company discontinued cash flow hedge accounting for the interest rate swap agreements that were entered into to hedge the interest rate risk on the then existing variable rate term loans. In accordance with hedge accounting guidance, the net unrealized loss of $37.1 million, associated with the discontinued hedging relationship, recorded within Accumulated other comprehensive (loss) income, was reclassified into Other expense (income), net in the Consolidated Statement of Operations and Comprehensive Income.
Activity related to the Swaps consisted of the following (in millions):
Amount of (loss) income recognized from derivatives | ||||||||||||||||
Swaps designated as hedging instruments | Fiscal 2019 | Fiscal 2018 | Fiscal 2017 | Location of (loss) income recognized from Swaps | ||||||||||||
Designated interest rate swaps | $ | (3.4 | ) | $ | (15.5 | ) | $ | 47.0 | Other comprehensive income (loss), net of tax | |||||||
Amount of (loss) income recognized from derivatives | ||||||||||||||||
Swaps not designated as hedging instruments | Fiscal 2019 | Fiscal 2018 | Fiscal 2017 | Location of (loss) income recognized Swaps | ||||||||||||
Undesignated, ineffective or discontinued portion of interest rate swaps | $ | (47.9 | ) | $ | $ | 0.6 | Other expense (income), net | |||||||||
NOTE 7—LONG-TERM DEBT AND FINANCE LEASE OBLIGATIONS
The Company’s long-term debt as of February 29, 2020 and February 23, 2019, net of debt discounts of $41.3 million and $197.0 million, respectively, and deferred financing costs of $72.9 million and $65.2 million, respectively, consisted of the following (in millions):
February 29, 2020 | February 23, 2019 | |||||||
Senior Unsecured Notes due 2023, 2024, 2025, 2026, 2027, 2028 and 2030 interest rate of 3.50%, 6.625%, 5.750%, 7.5%, 4.625%, 5.875% and 4.875%, respectively | $ | 6,884.5 | $ | 3,071.6 | ||||
Albertsons Term Loans, interest range of 4.45% to 5.69% | — | 4,610.7 | ||||||
Safeway Inc. Notes due 2020 to 2031, interest rate range of 3.95% to 7.45% | 642.1 | 675.3 | ||||||
New Albertson’s L.P. Notes due 2026 to 2031, interest rate range of 6.52% to 8.70% | 466.0 | 1,322.3 | ||||||
Other notes payable, unsecured | 37.2 | 125.4 | ||||||
Mortgage notes payable, secured | 18.2 | 18.8 | ||||||
Finance lease obligations (see Note 8) | 666.7 | 762.3 | ||||||
Total debt | 8,714.7 | 10,586.4 | ||||||
Less current maturities | (221.4 | ) | (148.8 | ) | ||||
Long-term portion | $ | 8,493.3 | $ | 10,437.6 | ||||
F-21
As of February 29, 2020, the future maturities of long-term debt, excluding finance lease obligations, debt discounts and deferred financing costs, consisted of the following (in millions):
2020 | $ | 138.0 | ||
2021 | 131.2 | |||
2022 | 751.1 | |||
2023 | 1.2 | |||
2024 | 1,267.2 | |||
Thereafter | 5,873.5 | |||
Total | $ | 8,162.2 | ||
The Company’s term loans (the “Albertsons Term Loans”) had, and the ABL Facility and certain of the outstanding notes and debentures have, restrictive covenants, subject to the right to cure in certain circumstances, calling for the acceleration of payments due in the event of a breach of a covenant or a default in the payment of a specified amount of indebtedness due under certain debt arrangements. There are no restrictions on the Company’s ability to receive distributions from its subsidiaries to fund interest and principal payments due under the ABL Facility, the Albertsons Term Loans and the Company’s senior unsecured notes (the “Senior Unsecured Notes”). Each of the ABL Facility, Albertsons Term Loans and the Senior Unsecured Notes restrict the ability of the Company to pay dividends and distribute property to the Company’s stockholders. As a result, all of the Company’s consolidated net assets are effectively restricted with respect to their ability to be transferred to the Company’s stockholders. Notwithstanding the foregoing, the ABL Facility, the Albertsons Term Loans and the Senior Unsecured Notes each contain customary exceptions for certain dividends and distributions, including the ability to make cumulative distributions under the Albertsons Term Loans and Senior Unsecured Notes of up to the greater of $1.0 billion or 4.0% of the Company’s total assets (which is measured at the time of such distribution) and the ability to make distributions if certain payment conditions are satisfied under the ABL Facility. During fiscal 2017, the Company utilized the foregoing exception in connection with distributions to equity holders (as described in Note 9—Stockholders’ Equity). The Company was in compliance with all such covenants and provisions as of and for the fiscal year ended February 29, 2020.
Albertsons Term Loans
As of February 25, 2017, the Albertsons Term Loans under the Albertsons term loan agreement totaled $6,013.9 million, excluding debt discounts and deferred financing costs. The Albertsons Term Loans consisted of a Term
B-4
Loan of $3,271.8 million with an interest rate of LIBOR, subject to a 0.75% floor, plus 3.00%, a TermB-5
Loan of $1,142.1 million with an interest rate of LIBOR, subject to a 0.75% floor, plus 3.25%, and a TermB-6
Loan of $1,600.0 million with an interest rate of LIBOR, subject to a 0.75% floor, plus 3.25%.On June 16, 2017, the Company repaid $250.0 million of the existing term loans. In connection with the repayment, the Company wrote off $7.6 million of previously deferred financing costs and original issue discount. The amounts expensed were included as a component of Interest expense, net.
On June 27, 2017, the Company entered into a repricing amendment to the term loan agreement which established 3 new term loan tranches. The new tranches consisted of $3,013.6 million of a new Term
B-4
Loan, $1,139.3 million of a new TermB-5
Loan and $1,596.0 million of a new TermB-6
Loan. The (i) new TermB-4
Loan had a maturity date of August 25, 2021, and had an interest rate of LIBOR, subject to a 0.75% floor, plus 2.75%, (ii) new TermB-5
Loan had a maturity date of December 21, 2022, and had an interest rate of LIBOR, subject to a 0.75% floor, plus 3.00%, and (iii) new TermB-6
Loan had a maturity date of June 22, 2023, and had an interest rate of LIBOR, subject to a 0.75% floor, plus 3.00%. The repricing amendment to the term loans was accounted for as a debt modification. In connection with the term loan amendment, the Company expensed $3.9 million of newly incurred financing costs and also expensed $17.8 million of previously deferred financing costs associated with the original term loans. The amounts expensed were included as a component of Interest expense, net.F-22
On November 16, 2018, the Company repaid approximately $976 million in aggregate principal amount of the $2,976.0 million term loan tranche
B-4
(the “2017 TermB-4
Loan”) along with accrued and unpaid interest on such amount and fees and expenses related to the Term Loan Repayment and the 2018 TermB-7
Loan (each as defined below), for which the Company used approximately $610 million of cash on hand and approximately $410 million of borrowings under the ABL Facility (such repayment, the “Term Loan Repayment”). Substantially concurrently with the Term Loan Repayment, the Company amended the Company’s Second Amended and Restated Term Loan Agreement, dated as of August 25, 2014 and effective as of January 30, 2015 (as amended, the “Term Loan Agreement”), to establish a new term loan tranche and amend certain provisions of the Term Loan Agreement. The new tranche consisted of $2,000.0 million of new termB-7
loans (the “2018 TermB-7
Loan”). The 2018 TermB-7
Loan, together with cash on hand, was used to repay in full the remaining principal amount outstanding under the 2017 TermB-4
Loan (the “2018 Term Loan Refinancing”). The 2018 Term Loan Refinancing was accounted for as a debt modification or extinguishment on a lender by lender basis. In connection with the 2018 Term Loan Refinancing and Term Loan Repayment, the Company expensed $4.1 million of newly incurred financing costs and capitalized $3.6 million of new incurred financing costs and $15.0 million of original issue discount. For previously deferred financing costs and original issue discount associated with the 2017 TermB-4
Loan, the Company expensed $12.9 million of financing costs and $8.6 million of original issue discount. The amounts expensed were included as a component of Interest expense, net. The 2018 TermB-7
Loan had a maturity date of November 17, 2025. The 2018 TermB-7
Loan amortized, on a quarterly basis, at a rate of 1.0% per annum of the original principal amount of the 2018 TermB-7
Loan (which payments will be reduced as a result of the application of prepayments in accordance with the terms therewith). The 2018 TermB-7
Loan bore interest, at the borrower’s option, at a rate per annum equal to either (a) the base rate plus 2.00% or (b) LIBOR, subject to a 0.75% floor, plus 3.0%.On August 15, 2019, the Company repaid $1,570.6 million of aggregate principal amount outstanding under its term loan facilities, along with accrued and unpaid interest and fees and expenses, for which the Company used approximately $864 million of cash on hand and proceeds from the issuance of the 2028 Notes (as defined below) (such repayment, the
“2019-1
Term Loan Repayment”). Contemporaneously with the2019-1
Term Loan Repayment, the Company refinanced the remaining amounts outstanding with new term loan tranches. The new tranches consisted of $3,100.0 million in aggregate principal, of which $1,500.0 million had a maturity date of November 17, 2025 and $1,600.0 million had a maturity date of August 17, 2026. For newly incurred financing costs and original issue discount, the Company expensed $4.2 million of financing costs and recorded $4.4 million of financing costs and $15.5 million of original issue discount as a reduction of the principal amount. For previously deferred financing costs and original issue discount, the Company expensed $15.5 million of financing costs and $13.3 million of original issue discount. The amounts expensed were included as a component of Interest expense, net.The new loans amortized, on a quarterly basis, at a rate of 1.0% per annum of the original principal amount (which payments would have been reduced as a result of the application of prepayments in accordance with the terms therewith). The new loans bore interest, at the borrower’s option, at a rate per annum equal to either (a) the base rate plus 1.75% or (b) LIBOR, subject to a 0.75% floor, plus 2.75%.
On November 22, 2019, the Company repaid $742.5 million of aggregate principal amount outstanding under its term loan facility, along with accrued and unpaid interest and fees and expenses, with the proceeds from the issuance of the 2027 Notes (as defined below) (such repayment, the
“2019-2
Term Loan Repayment”). In connection with the2019-2
Term Loan Repayment, the Company expensed $5.1 million of previously deferred financing costs and $14.3 million of original issue discount. The amounts expensed were included as a component of Interest expense, net.On February 5, 2020, the Company repaid $2,349.8 million of aggregate principal amount outstanding under its term loan facilities, which represented the entire outstanding term loan balance, along with accrued and unpaid interest and fees and expenses, with cash on hand and the proceeds from the issuance of the New Notes (as defined below) (such repayment, the
“2019-3
Term Loan Repayment”). In connection with the2019-3
TermF-23
Loan Repayment, the Company expensed $15.2 million of previously deferred financing costs and $29.9 million of original issue discount. The amounts expensed, along with related fees, were included as a component of Loss (gain) on debt extinguishment.
The Albertsons Term Loan facilities were guaranteed by Albertsons’ existing and future direct and indirect wholly owned domestic subsidiaries that were not borrowers, subject to certain exceptions. The Albertsons Term Loan facilities were secured by, subject to certain exceptions, (i) a first-priority lien on substantially all of the assets of the borrowers and guarantors (other than accounts receivable, inventory and related assets of the proceeds thereof (the “Albertsons ABL Priority Collateral”)) and (ii) a second-priority lien on substantially all of the Albertsons ABL Priority Collateral.
Asset-Based Loan Facility
On November 16, 2018, the Company’s existing ABL Facility, which provides for a $4,000.0 million senior secured revolving credit facility, was amended and restated in connection with the 2018 Term Loan Refinancing to extend the maturity date of the facility to November 16, 2023. The ABL Facility has an interest rate of LIBOR plus a margin ranging from 1.25% to 1.75% and also provides for a letters of credit (“LOC”)
sub-facility
of $1,975.0 million. In connection with the ABL Facility amendment, the Company capitalized $13.5 million of financing costs.During fiscal 2018, borrowings of $610.0 million under the ABL Facility were used in connection with the Term Loan Repayment and the Safeway Notes Repurchase (as defined below). The $610.0 million was repaid on December 2, 2018.
As of February 29, 2020 and February 23, 2019, there were 0 outstanding borrowings and the ABL LOC
sub-facility
had $454.5 million and $520.8 million letters of credit outstanding, respectively.On March 12, 2020, the Company provided notice to the lenders to borrow $2.0 billion under the ABL Facility (the “ABL Borrowing”), so that a total of $2.0 billion (excluding $454.5 million in letters of credit) was outstanding immediately following the ABL Borrowing. The interest rate at the time of the ABL Borrowing under the ABL Facility was approximately 2.0% (which represents
30-day
LIBOR plus 125 basis points). The Company increased its borrowings under the ABL Facility as a precautionary measure in order to increase its cash position and preserve financial flexibility in light of current uncertainty in the global markets resulting from the coronavirus(COVID-19)
pandemic. In accordance with the terms of the ABL Facility, the proceeds from the ABL Borrowing may in the future be used for working capital, general corporate or other purposes permitted by the ABL Facility.
The ABL Facility is guaranteed by the Company’s existing and future direct and indirect wholly owned domestic subsidiaries that are not borrowers, subject to certain exceptions. The ABL Facility is secured by, subject to certain exceptions, (i) a first-priority lien on substantially all of the ABL Facility priority collateral and (ii) a second-priority lien on substantially all other assets (other than real property). Following the
2019-3
Term Loan Repayment, the ABL Facility has a first-priority lien on substantially all other assets (other than real property). The ABL Facility contains no financial covenant unless and until (a) excess availability is less than (i) 10.0% of the lesser of the aggregate commitments and the then-current borrowing base at any time or is (ii) $250.0 million at any time or (b) an event of default is continuing. If any of such events occur, the Company must maintain a fixed charge coverage ratio of 1.0 to 1.0 from the date such triggering event occurs until such event of default is cured or waived and/or the 30th day that all such triggers under clause (a) no longer exist.Senior Unsecured Notes
On May 31, 2016, Albertsons Companies, LLC and substantially all of its subsidiaries completed the issuance of $1,250.0 million in aggregate principal amount of 6.625% Senior Unsecured Notes (the “2024
F-24
Notes”)
which
will
mature on June 15, 2024. Interest on the 2024 Notes is payable semi-annually in arrears on June 15 and December 15 of each year, commencing on December 15, 2016. The 2024 Notes are also fully and unconditionally guaranteed, jointly and severally, by each of the subsidiaries that are additional issuers under the indenture governing such notes.
On August 9, 2016, Albertsons Companies, LLC and substantially all of its subsidiaries completed the issuance of $1,250.0 million in aggregate principal amount of 5.750% Senior Unsecured Notes (the “2025 Notes”) which will mature on March 15, 2025. Interest on the 2025 Notes is payable semi-annually in arrears on March 15 and September 15 of each year, commencing on March 15, 2017. The 2025 Notes are also fully and unconditionally guaranteed, jointly and severally, by each of the subsidiaries that are additional issuers under the indenture governing such notes.
On February 5, 2019, the Company and substantially all of its subsidiaries completed the issuance of $600.0 million in aggregate principal amount of 7.5% Senior Unsecured Notes which will mature on March 15, 2026 (the “2026 Notes”). Interest on the 2026 Notes is payable semi-annually in arrears on March 15 and September 15 of each year, commencing on September 15, 2019. The 2026 Notes have not been and will not be registered with the SEC. The 2026 Notes are also fully and unconditionally guaranteed, jointly and severally, by substantially all of our subsidiaries that are not issuers under the indenture governing such notes. A portion of the proceeds from the 2026 Notes was used to fully redeem the Safeway 5.00% Senior Notes due in 2019.
On August 15, 2019, the Company and substantially all of its subsidiaries completed the issuance of $750.0 million in aggregate principal amount of 5.875% Senior Unsecured Notes which will mature on February 15, 2028 (the “2028 Notes”). Interest on the 2028 Notes is payable semi-annually in arrears on February 15 and August 15 of each year, commencing on February 15, 2020. The 2028 Notes have not been and will not be registered with the SEC. The 2028 Notes are also fully and unconditionally guaranteed, jointly and severally, by substantially all of the Company’s subsidiaries that are not issuers under the indenture governing such notes. Proceeds from the 2028 Notes were used to partially fund the
2019-1
Term Loan Repayment.On November 22, 2019, the Company and substantially all of its subsidiaries completed the issuance of $750.0 million in aggregate principal amount of 4.625% Senior Unsecured Notes which will mature on January 15, 2027 (the “2027 Notes”). Interest on the 2027 Notes is payable semi-annually in arrears on January 15 and July 15 of each year, commencing on July 15, 2020. The 2027 Notes have not been and will not be registered with the SEC. The 2027 Notes are also fully and unconditionally guaranteed, jointly and severally, by substantially all of the Company’s subsidiaries that are not issuers under the indenture governing such notes. Proceeds from the 2027 Notes were used to fund the
2019-2
Term Loan Repayment.On February 5, 2020, the Company completed the issuance of $750.0 million in aggregate principal amount of new 3.50% senior notes due February 15, 2023 (the “2023 Notes”), $600.0 million in aggregate principal amount of additional 2027 Notes (the “Additional 2027 Notes”) and $1,000.0 million in aggregate principal amount of new 4.875% senior notes due February 15, 2030 (the “2030 Notes” and together with the 2023 Notes and Additional 2027 Notes, the “New Notes”). The net proceeds received from the issuance of the New Notes, together with approximately $18 million of cash on hand, were used to (i) to fund the
2019-3
Term Loan Repayment and (ii) pay fees and expenses related to the2019-3
Term Loan Repayment and the issuance of the New Notes.The Additional 2027 Notes were issued as “additional securities” under the indenture governing the outstanding 2027 Notes (the “Existing 2027 Notes”). The Additional 2027 Notes are expected to be treated as a single class with the Existing 2027 Notes for all purposes and have the same terms as those of the Existing 2027 Notes.
Interest on the 2023 Notes and 2030 Notes is payable semi-annually in arrears on February 15 and August 15 of each year, commencing on August 15, 2020.
F-25
The New Notes have not been and will not be registered with the SEC. The New Notes are also fully and unconditionally guaranteed, jointly and severally, by substantially all of the Company’s subsidiaries that are not issuers under the indenture governing such notes.
The Company, an issuer and direct or indirect parent of each of the other issuers of the 2023 Notes, the 2024 Notes, the 2025 Notes, the 2026 Notes, the 2027 Notes (and Additional 2027 Notes), the 2028 Notes and the 2030 Notes, has no independent assets or operations. All of the direct or indirect subsidiaries of the Company, other than subsidiaries that are issuers, or guarantors, as applicable, of the 2023 Notes, the 2024 Notes, the 2025 Notes, the 2026 Notes, the 2027 Notes (and Additional 2027 Notes), the 2028 Notes and the 2030 Notes are minor, individually and in the aggregate.
Safeway Notes
During fiscal 2018, Safeway repurchased its 7.45% Senior Debentures due 2027 and 7.25% Debentures due 2031 with a par value of $333.7 million and a book value of $322.4 million for $333.7 million plus accrued interest of $7.7 million (the “Safeway Notes Repurchase”). The Company recognized a loss on debt extinguishment related to the Safeway Notes Repurchase of $11.3 million.
On February 6, 2019, a portion of the net proceeds from the issuance of the 2026 Notes were used to fully redeem $268.6 million of principal of Safeway 5.00% Senior Notes due 2019, and to pay an associated make-whole premium of $3.1 million and accrued interest of $6.4 million (the “2019 Redemption”). The Company recognized a loss on debt extinguishment related to the 2019 Redemption of $3.1 million.
On May 24, 2019, the Company completed a cash tender offer and early redemption of Safeway notes with a par value of $34.1 million and a book value of $33.3 million for $32.6 million, plus accrued and unpaid interest of $0.7 million (the “Safeway Tender”). Including related fees, the Company recognized a loss on debt extinguishment related to the Safeway Tender of $0.5 million.
NALP Notes
During fiscal 2017, the Company repurchased NALP Notes with a par value of $160.0 million and a book value of $140.2 million for $135.5 million plus accrued interest of $3.7 million (the “2017 NALP Notes Repurchase”). In connection with the 2017 NALP Notes Repurchase, the Company recorded a gain on debt extinguishment of $4.7 million.
During fiscal 2018, the Company repurchased NALP Notes with a par value of $108.4 million and a book value of $96.4 million for $90.7 million plus accrued interest of $1.2 million (the “2018 NALP Notes Repurchase”). In connection with the 2018 NALP Notes Repurchase, the Company recorded a gain on debt extinguishment of $5.7 million.
On May 24, 2019, the Company completed a cash tender offer and early redemption of NALP Notes with a par value of $402.9 million and a book value of $363.7 million for $382.7 million, plus accrued and unpaid interest of $8.2 million (the “NALP Notes Tender”). Including related fees, the Company recognized a loss on debt extinguishment related to the NALP Notes Tender of $19.1 million.
Also during fiscal 2019, the Company repurchased NALP Notes on the open market with an aggregate par value of $553.9 million and a book value of $502.0 million for $547.5 million plus accrued and unpaid interest of $11.3 million (the “NALP Notes Repurchase”). Including related fees, the Company recognized a loss on debt extinguishment related to the NALP Notes Repurchase of $46.2 million.
Merger Related Financing
On June 25, 2018, in connection with the Merger Agreement, the Company issued $750.0 million in aggregate principal amount of floating rate senior secured notes (the “Floating Rate Notes”) at an issue price of
F-26
99.5%. As
a result of the Termination Agreement with Rite Aid on August 8, 2018, the Company redeemed all of the Floating Rate Notes at a redemption price equal to 99.5% of the aggregate principal amount of the notes, plus accrued and unpaid interest.Deferred Financing Costs and Interest Expense, Net
Financing costs incurred to obtain all financing other than ABL Facility financing are recognized as a direct reduction from the carrying amount of the debt liability and amortized over the term of the related debt using the effective interest method. Financing costs incurred to obtain ABL Facility financing are capitalized and amortized over the term of the related debt facilities using the straight-line method. Deferred financing costs associated with ABL Facility financing are included in Other assets and were $35.4 million and $45.1 million as of February 29, 2020 and February 23, 2019, respectively.
During fiscal 2019, total amortization of deferred financing costs of $39.8 million included $20.6 million of deferred financing costs written off in connection with the Albertsons Term Loan amendment and reductions. During fiscal 2018, total amortization of deferred financing costs of $42.7 million included $12.9 million of deferred financing costs written off in connection with the Albertsons Term Loan amendment and reductions. During fiscal 2017, total amortization of deferred financing costs of $56.1 million included $22.2 million of deferred financing costs written off in connection with the Albertsons Term Loan amendments and reductions.
Interest expense, net consisted of the following (in millions):
Fiscal 2019 | Fiscal 2018 | Fiscal 2017 | ||||||||||
ABL Facility, senior secured and unsecured notes, term loans and debentures | $ | 565.3 | $ | 698.3 | $ | 701.5 | ||||||
Finance lease obligations | 79.8 | 81.8 | 96.3 | |||||||||
Deferred financing costs | 39.8 | 42.7 | 56.1 | |||||||||
Debt discounts | 34.1 | 20.3 | 16.0 | |||||||||
Other interest (income) expense | (21.0 | ) | (12.3 | ) | 4.9 | |||||||
Interest expense, net | $ | 698.0 | $ | 830.8 | $ | 874.8 | ||||||
NOTE 8—LEASES
The components of total lease cost, net consisted of the following (in millions):
Classification | Fiscal 2019 | |||||
Operating lease cost (1) | Cost of sales and Selling and administrative expenses (3) | $ | 1,011.6 | |||
Finance lease cost | ||||||
Amortization of lease assets | Cost of sales and Selling and administrative expenses (3) | 90.4 | ||||
Interest on lease liabilities | Interest expense, net | 79.8 | ||||
Variable lease cost (2) | Cost of sales and Selling and administrative expenses (3) | 402.9 | ||||
Sublease income | Net sales and other revenue | (111.8 | ) | |||
Total lease cost, net | $ | 1,472.9 | ||||
| (1) | Includes short-term lease cost, which is immaterial. |
| (2) | Represents variable lease costs for both operating and finance leases. Includes contingent rent expense and other non-fixed lease related costs, including property taxes, common area maintenance and property insurance. |
| (3) | Supply chain-related amounts are included in Cost of sales. |
F-27
Balance sheet information related to leases as of February 29, 2020 consisted of the following (in millions):
Classification | February 29, 2020 | |||||
Assets | ||||||
Operating | Operating lease right-of-use assets | $ | 5,867.4 | |||
Finance | Property and equipment, net | 430.7 | ||||
Total lease assets | $ | 6,298.1 | ||||
Liabilities | ||||||
Current | ||||||
Operating | Current operating lease obligations | $ | 563.1 | |||
Finance | Current maturities of long-term debt and finance lease obligations | 83.4 | ||||
Long-term | ||||||
Operating | Long-term operating lease obligations | 5,402.8 | ||||
Finance | Long-term debt and finance lease obligations | 583.3 | ||||
Total lease liabilities | $ | 6,632.6 | ||||
The following table presents cash flow information and the weighted average lease term and discount rate for leases (dollars in millions):
Fiscal 2019 | ||||
Gains on sale leaseback transactions, net | $ | 487.1 | ||
Cash paid for amounts included in the measurement of lease liabilities: | ||||
Operating cash flows from operating leases | 995.8 | |||
Operating cash flows from finance leases | 79.8 | |||
Financing cash flows from finance leases | 109.3 | |||
Right-of-use assets obtained in exchange for operating lease obligations | 1,195.2 | |||
Right-of-use assets obtained in exchange for finance lease obligations | — | |||
Impairment of right-of-use operating lease assets | 15.4 | |||
Impairment of right-of-use finance lease assets | 6.1 | |||
Weighted average remaining lease term—operating leases | 12.1 years | |||
Weighted average remaining lease term—finance leases | 9.0 years | |||
Weighted average discount rate—operating leases | 7.0 | % | ||
Weighted average discount rate—finance leases | 13.7 | % | ||
F-28
Future minimum lease payments for operating and finance lease obligations as of February 29, 2020 consisted of the following (in millions):
Lease Obligations | ||||||||
Fiscal year | Operating Leases | Finance Leases | ||||||
2020 | $ | 891.8 | $ | 136.2 | ||||
2021 | 926.8 | 136.7 | ||||||
2022 | 868.2 | 125.4 | ||||||
2023 | 797.8 | 116.0 | ||||||
2024 | 706.6 | 96.4 | ||||||
Thereafter | 4,968.2 | 423.3 | ||||||
Total future minimum obligations | 9,159.4 | 1,034.0 | ||||||
Less interest | (3,193.5 | ) | (367.3 | ) | ||||
Present value of net future minimum lease obligations | 5,965.9 | 666.7 | ||||||
Less current portion | (563.1 | ) | (83.4 | ) | ||||
Long-term obligations | $ | 5,402.8 | $ | 583.3 | ||||
The Company subleases certain property to third parties. Future minimum tenant operating lease payments
remaining
under thesenon-cancelable
operating leases as of February 29, 2020 was $340.1 million.During the second quarter of fiscal 2019, the Company, through 3 separate transactions, completed the sale and leaseback of 53 store properties and 1 distribution center for an aggregate purchase price, net of closing costs, of $931.3 million. In connection with the sale leaseback transactions, the Company entered into lease agreements for each of the properties for initial terms ranging from 15 to 20 years. The aggregate initial annual rent payment for the properties is approximately $53 million and includes 1.50% to 1.75% annual rent increases over the initial lease terms. All of the properties qualified for sale leaseback and operating lease accounting, and the Company recorded total gains of $463.6 million, which is included as a component of (Gain) loss on property dispositions and impairment losses, net. The Company also recorded operating lease
right-of-use assets
and corresponding operating lease liabilities of $602.5 million.Future minimum lease payments for operating and capital lease obligations as of February 23, 2019 under the previous lease accounting standard consisted of the following (in millions):
Lease Obligations | ||||||||
Fiscal year | Operating Leases | Capital Leases | ||||||
2019 | $ | 879.7 | $ | 170.5 | ||||
2020 | 840.5 | 151.3 | ||||||
2021 | 783.2 | 134.9 | ||||||
2022 | 723.6 | 123.1 | ||||||
2023 | 651.0 | 114.1 | ||||||
Thereafter | 4,338.6 | 509.1 | ||||||
Total future minimum obligations | $ | 8,216.6 | 1,203.0 | |||||
Less interest | (440.7 | ) | ||||||
Present value of net future minimum lease obligations | 762.3 | |||||||
Less current portion | (97.3 | ) | ||||||
Long-term obligations | $ | 665.0 | ||||||
F-29
Rent expense and tenant rental income under operating leases under the previous lease accounting standard consisted of the following (in millions):
Fiscal 2018 | Fiscal 2017 | |||||||
Minimum rent | $ | 853.5 | $ | 831.6 | ||||
Contingent rent | 10.3 | 12.0 | ||||||
Total rent expense | 863.8 | 843.6 | ||||||
Tenant rental income | (107.2 | ) | (98.8 | ) | ||||
Total rent expense, net of tenant rental income | $ | 756.6 | $ | 744.8 | ||||
During fiscal 2018, the Company, through 3 separate transactions, completed the sale and leaseback of 7 of the Company’s distribution centers for an aggregate purchase price, net of closing costs, of approximately $950 million. In connection with the sale leasebacks, the Company entered into lease agreements for each of the properties for initial terms of 15 to 20 years. The aggregate initial annual rent payment for the properties was approximately $55 million and includes 1.50% to 1.75% annual rent increases over the initial lease terms. The Company qualified for sale leaseback and operating lease accounting on all of the distribution centers, and the Company recorded total deferred gains of $362.5 million. Under the previous lease accounting standard, the deferred gains were being amortized over the respective lease periods and, upon adoption of ASC Topic 842 on February 24, 2019, the related unamortized deferred gains were recognized as a transitional adjustment to retained earnings.
During fiscal 2017, the Company sold 94 of the Company’s store properties for an aggregate purchase price, net of closing costs, of approximately $962 million. In connection with the sale and leaseback, the Company entered into lease agreements for each of the properties for initial terms of 20 years with varying multiple five-year renewal options. The aggregate initial annual rent payments for the 94 properties was approximately $65 million, with scheduled rent increases occurring generally every one or five years over the initial
20-year
term. The Company qualified for sale leaseback and operating lease accounting on 80 of the store properties and recorded total deferred gains of $360.1 million. The remaining 14 stores did not qualify for sale leaseback accounting primarily due to continuing involvement with adjacent properties that had not been legally subdivided from the store properties. Subsequently, 12 of the 14 properties qualified for sale leaseback and operating lease accounting as the properties had been legally subdivided. Under the previous lease accounting standard, the deferred gains were being amortized over the respective lease periods and, upon adoption of ASC Topic 842 on February 24, 2019, the related unamortized deferred gains were recognized as a transitional adjustment to retained earnings.NOTE 9—STOCKHOLDERS’ EQUITY
Equity-Based Compensation
The Company maintains the Albertsons Companies, Inc. Phantom Unit Plan (formerly, the AB Acquisition LLC Phantom Unit Plan) (the “Phantom Unit Plan”), an equity-based incentive plan, which provides for grants of phantom units (“Phantom Units”) to certain employees, directors and consultants. Prior to the Reorganization Transactions, the Phantom Unit Plan was maintained by its former parent, AB Acquisition, and each Phantom Unit provided the participant with a contractual right to receive, upon vesting, 1 incentive unit in AB Acquisition. Subsequent to the Reorganization Transactions, each Phantom Unit now provides the participant with a contractual right to receive, upon vesting, 1 management incentive unit in each of the Company’s parents, Albertsons Investor and KIM ACI, that collectively own all of the outstanding shares of the Company. The Phantom Units vest over a service period, or upon a combination of both a service period and achievement of certain performance-based thresholds. The fair value of the Phantom Units is determined using an option pricing model, adjusted for lack of marketability and using an expected term or time to liquidity based on judgments made by management.
F-30
During fiscal 2019, the Company granted 0.6 million Phantom Units to its employees and directors, consisting of 0.4 million new awards issued and granted in fiscal 2019 and 0.2 million previously issued awards of performance-based Phantom Units that were deemed granted upon the establishment of the fiscal 2019 performance target and that would vest upon both the achievement of such performance target and continued service through the last day of fiscal 2019. The 0.4 million new awards issued and granted in fiscal 2019 include 0.3 million Phantom Units that have solely time-based vesting and 0.1 million performance-based Phantom Units that were deemed granted upon the establishment of the fiscal 2019 annual performance target and that would vest upon both the achievement of such performance target and continued service through the last day of fiscal 2019. The 0.6 million Phantom Units deemed granted have an aggregate grant date value of $20.0 million.
Equity-based compensation expense recognized by the Company related to Phantom Units was $28.9 million, $47.7 million and $45.9 million in fiscal 2019, fiscal 2018 and fiscal 2017, respectively. The Company recorded an income tax benefit related to Phantom Units of $7.5 million, $12.9 million and $15.6 million related to equity-based compensation in fiscal 2019, fiscal 2018 and fiscal 2017, respectively.
As of February 29, 2020, the Company had $30.2 million of unrecognized compensation cost related to 0.9 million unvested Phantom Units. That cost is expected to be recognized over a weighted average period of 2.0 years. The aggregate fair value of Phantom Units that vested in fiscal 2019 was $29.3 million.
On April 25, 2019, upon the commencement of employment, the Company’s President and Chief Executive Officer was granted direct equity interests in each of the Company’s parents, Albertsons Investor and KIM ACI. These equity interests generally vest over five years, with 50% based solely on a service period and 50% upon a service period and achievement of certain performance-based thresholds. The fair value of the equity interests is determined using an option pricing model, adjusted for lack of marketability and using an expected term or time to liquidity based on judgments made by management. The fair value of the equity interests deemed granted in fiscal 2019 was approximately $10.8 million, which excludes approximately 40% of the equity units that vest based upon the achievement of future fiscal year annual performance targets that will only be deemed granted for accounting purposes upon the establishment of such respective future fiscal year annual performance targets. Equity-based compensation expense recognized by the Company related to these equity interests was $3.9 million for fiscal 2019. As of February 29, 2020, there was $6.9 million of unrecognized costs related to the equity interests deemed granted. That cost is expected to be recognized over a weighted average period of 4.0 years.
Treasury Stock
During fiscal 2018, the Company repurchased 1,772,018 shares of common stock allocable to certain current and former members of management (the “management holders”) for $25.8 million in cash. The shares are classified as treasury stock on the Consolidated Balance Sheet. The shares repurchased represented a portion of the shares allocable to management. Proceeds from the repurchase were used by the management holders to repay outstanding loans of the management holders with a third-party financial institution. As there is no current active market for shares of the Company’s common stock, the shares were repurchased at a negotiated price between the Company and the management holders.
Distribution
On June 30, 2017, the Company’s predecessor, Albertsons Companies, LLC, made a cash distribution of $250.0 million to its equityholders, which resulted in a modification of certain vested awards. As a result of the modification, equity-based compensation expense recognized for fiscal 2017 includes $2.4 million of additional expense.
F-31
NOTE 10—INCOME TAXES
The components of income tax expense (benefit) consisted of the following (in millions):
Fiscal 2019 | Fiscal 2018 | Fiscal 2017 | ||||||||||
Current | ||||||||||||
Federal (1) | $ | 87.2 | $ | 9.0 | $ | 54.0 | ||||||
State (2) | 49.2 | (6.7 | ) | 26.5 | ||||||||
Foreign | 2.3 | 0.3 | 49.8 | |||||||||
Total Current | 138.7 | 2.6 | 130.3 | |||||||||
Deferred | ||||||||||||
Federal | (14.1 | ) | (77.9 | ) | (807.7 | ) | ||||||
State | (1.1 | ) | (3.6 | ) | (216.6 | ) | ||||||
Foreign | 9.3 | — | (69.8 | ) | ||||||||
Total Deferred | (5.9 | ) | (81.5 | ) | (1,094.1 | ) | ||||||
Income tax expense (benefit) | $ | 132.8 | $ | (78.9 | ) | $ | (963.8 | ) | ||||
| (1) | Federal current tax expense net of $66.8 million, $12.8 million and $22.4 million tax benefit of net operating losses (“NOL”) in fiscal 2019, fiscal 2018 and fiscal 2017, respectively. |
| (2) | State current tax expense net of $22.6 million, $9.5 million and $9.6 million tax benefit of NOLs in fiscal 2019, fiscal 2018 and fiscal 2017, respectively. |
The difference between the actual tax provision and the tax provision computed by applying the statutory federal income tax rate to income (loss) before income taxes was attributable to the following (in millions):
Fiscal 2019 | Fiscal 2018 | Fiscal 2017 | ||||||||||
Income tax expense (benefit) at federal statutory rate | $ | 125.8 | $ | 11.0 | $ | (301.5 | ) | |||||
State income taxes, net of federal benefit | 32.3 | 0.7 | (39.8 | ) | ||||||||
Change in valuation allowance | (7.2 | ) | (3.3 | ) | (218.0 | ) | ||||||
Tax Cuts and Jobs Act | — | (56.9 | ) | (430.4 | ) | |||||||
Unrecognized tax benefits | 7.7 | (16.2 | ) | (36.5 | ) | |||||||
Member loss | — | — | 83.1 | |||||||||
Charitable donations | (6.9 | ) | (4.4 | ) | — | |||||||
Tax Credits | (23.5 | ) | (10.8 | ) | (9.1 | ) | ||||||
CVR liability adjustment | — | — | (20.3 | ) | ||||||||
Reorganization of limited liability companies | — | — | 46.7 | |||||||||
Nondeductible equity-based compensation expense | 1.0 | 3.8 | 1.6 | |||||||||
Other | 3.6 | (2.8 | ) | (39.6 | ) | |||||||
Income tax expense (benefit) | $ | 132.8 | $ | (78.9 | ) | $ | (963.8 | ) | ||||
The valuation allowance activity on deferred tax assets was as follows (in millions):
February 29, 2020 | February 23, 2019 | February 24, 2018 | ||||||||||
Beginning balance | $ | 139.5 | $ | 134.9 | $ | 387.6 | ||||||
Additions charged to income tax expense | 3.5 | 3.5 | 141.0 | |||||||||
Reductions credited to income tax expense | (10.7 | ) | (6.8 | ) | (359.0 | ) | ||||||
Changes to other comprehensive income or loss and other | 2.8 | 7.9 | (34.7 | ) | ||||||||
Ending balance | $ | 135.1 | $ | 139.5 | $ | 134.9 | ||||||
F-32
The Tax Act, enacted in December 2017, resulted in significant changes to U.S. income tax and related laws. The Company is impacted by a number of aspects of the Tax Act, most notably the reduction in the top U.S. corporate income tax rate from 35% to 21%, a
one-time
transition tax on the accumulated unremitted foreign earnings and profits of the Company’s foreign subsidiaries and 100% expensing of certain qualified property acquired and placed in service after September 27, 2017.The SEC staff issued Staff Accounting Bulletin No. 118 (“SAB 118”), which allowed companies to record a provisional amount during a measurement period not to extend beyond one year from the date of enactment, which ended in the fourth quarter of fiscal 2018. In fiscal 2017, the Company recorded a provisional
non-cash
tax benefit of $430.4 million. In fiscal 2018, the Company recorded $56.9 million of additional tax benefit, primarily to account for refinement of transition tax and the remeasurement of deferred taxes. The Company completed its analysis of the Tax Act in fiscal 2018 based on currently available technical guidance. The Company will continue to assess further guidance issued by the Internal Revenue Service (“IRS”) and record the impact of such guidance, if any, in the year issued.In connection with the Reorganization Transactions, the Company recorded deferred tax liabilities in excess of deferred tax assets of $46.7 million in fiscal 2017 for the limited liability companies held by AB Acquisition and taxed previously to the members.
Also in connection with the Reorganization Transactions, the Company reorganized its Subchapter C corporation subsidiaries which allows the Company to use deferred tax assets, which previously had offsetting valuation allowance, against future taxable income of certain other Subchapter C subsidiaries that have a history of taxable income and are projected to continue to have future taxable income. The Company reassessed its valuation allowance based on available negative and positive evidence to estimate if sufficient taxable income will be generated to use existing deferred tax assets. On the basis of this evaluation, the Company released a substantial portion of its valuation allowance against its net deferred tax assets, resulting in a $218.0 million
non-cash
tax benefit in fiscal 2017. The Company continues to maintain a valuation allowance against net deferred tax assets in jurisdictions where it is not more likely than not to be realized.Prior to the Reorganization Transactions, taxes on income from limited liability companies held by AB Acquisition were payable by the members in accordance with their respective ownership percentages, resulting in tax expense of $83.1 million in fiscal 2017 for losses benefited by the members.
F-33
Deferred income taxes reflect the net tax effects of temporary differences between the bases of assets and liabilities for financial reporting and income tax purposes. The Company’s deferred tax assets and liabilities consisted of the following (in millions):
February 29, 2020 | February 23, 2019 | |||||||
Deferred tax assets: | ||||||||
Compensation and benefits | $ | 135.7 | $ | 132.0 | ||||
Net operating loss | 117.0 | 165.9 | ||||||
Pension & postretirement benefits | 235.5 | 195.6 | ||||||
Reserves | 24.7 | 1.5 | ||||||
Self-Insurance | 263.5 | 259.7 | ||||||
Tax credits | 41.7 | 64.2 | ||||||
Lease obligations | 1,728.2 | 192.5 | ||||||
Other | 119.1 | 58.7 | ||||||
Gross deferred tax assets | 2,665.4 | 1,070.1 | ||||||
Less: valuation allowance | (135.1 | ) | (139.5 | ) | ||||
Total deferred tax assets | 2,530.3 | 930.6 | ||||||
Deferred tax liabilities: | ||||||||
Debt discounts | 15.6 | 62.8 | ||||||
Depreciation and amortization | 1,249.1 | 1,068.6 | ||||||
Inventories | 346.8 | 346.5 | ||||||
Operating lease assets | 1,521.7 | — | ||||||
Other | 10.9 | 14.1 | ||||||
Total deferred tax liabilities | 3,144.1 | 1,492.0 | ||||||
Net deferred tax liability | $ | (613.8 | ) | $ | (561.4 | ) | ||
Noncurrent deferred tax asset | $ | — | $ | — | ||||
Noncurrent deferred tax liability | (613.8 | ) | (561.4 | ) | ||||
Total | $ | (613.8 | ) | $ | (561.4 | ) | ||
The Company assesses the available positive and negative evidence to estimate if sufficient future taxable income will be generated to use the existing deferred tax assets. On the basis of this evaluation, as of February 29, 2020, a valuation allowance of $135.1 million has been recorded for the portion of the deferred tax asset that is not more likely than not to be realized, consisting primarily of carryovers in jurisdictions where the Company has minimal presence or does not expect to have future taxable income. The Company will continue to evaluate the need to adjust the valuation allowance. The amount of the deferred tax asset considered realizable, however, could be adjusted depending on the Company’s performance in certain subsidiaries or jurisdictions.
The Company currently has federal and state NOL carryforwards of $32.3 million and $1,696.8 million, respectively, which will begin to expire in 2020 and continue through the fiscal year ending February 2040. As of February 29, 2020, the Company had $41.7 million of state credit carryforwards, the majority of which will expire in 2023. The Company had 0 federal credit carryforwards as of February 29, 2020.
F-34
Changes in the Company’s unrecognized tax benefits consisted of the following (in millions):
Fiscal 2019 | Fiscal 2018 | Fiscal 2017 | ||||||||||
Beginning balance | $ | 376.2 | $ | 356.0 | $ | 418.0 | ||||||
Increase related to tax positions taken in the current year | 0.9 | 1.6 | 65.4 | |||||||||
Increase related to tax positions taken in prior years | 3.0 | 35.1 | 4.6 | |||||||||
Decrease related to tax position taken in prior years | (2.2 | ) | (0.4 | ) | (70.0 | ) | ||||||
Decrease related to settlements with taxing authorities | (4.1 | ) | (8.3 | ) | (17.5 | ) | ||||||
Decrease related to lapse of statute of limitations | — | (7.8 | ) | (44.5 | ) | |||||||
Ending balance | $ | 373.8 | $ | 376.2 | $ | 356.0 | ||||||
Included in the balance of unrecognized tax benefits as of February 29, 2020, February 23, 2019 and February 24, 2018 are tax positions of $268.2 million, $267.7 million and $249.0 million, respectively, which would reduce the Company’s effective tax rate if recognized in future periods. Of the $268.2 million that could impact tax expense, the Company has recorded $7.9 million of indemnification assets that would offset any future recognition. As of February 29, 2020, the Company is no longer subject to federal income tax examinations for the fiscal years prior to 2012 and in most states, is no longer subject to state income tax examinations for fiscal years before 2007. The Company recognizes accrued interest and penalties related to unrecognized tax benefits as a component of income tax expense. The Company recognized expense related to interest and penalties, net of settlement adjustments, of $9.6 million, $1.8 million and $4.6 million for fiscal 2019, fiscal 2018 and fiscal 2017, respectively.
In fiscal 2017, the Company adopted the IRS safe harbor rule for taxpayers operating retail establishments for determining whether expenditures paid or incurred to remodel or refresh a qualified building are deductible. As a result of adopting this safe harbor, the Company reduced $70.1 million of uncertain tax benefit in fiscal 2017, and there was no impact on the tax provision due to an offsetting deferred adjustment. The Company believes it is reasonably possible that the reserve for uncertain tax positions may be reduced by approximately $137.6 million in the next 12 months due to ongoing tax examinations and expiration of statutes of limitations.
NOTE 11—EMPLOYEE BENEFIT PLANS AND COLLECTIVE BARGAINING AGREEMENTS
Pension Plans
The Company sponsors a defined benefit pension plan (the “Safeway Plan”) for substantially all of its employees under the Safeway banners not participating in multiemployer pension plans. Effective April 1, 2015, the Company implemented a soft freeze of the Safeway Plan. A soft freeze means that all existing employees as of March 31, 2015 then participating remained in the Safeway Plan, but any new
non-union
employees hired after that date would instead earn retirement benefits under an enhanced 401(k) program. On December 30, 2018, the Company implemented a hard freeze ofnon-union
benefits of employees of the Safeway Plan and all future benefit accruals fornon-union
employees ceased as of that date. Instead,non-union
participants earned retirement benefits under the Company’s 401(k) plans. The Safeway Plan continues to remain fully open to union employees and past service benefits, including future interest credits, fornon-union
employees continue to be accrued under the Safeway Plan. The hard freeze resulted in an immaterial curtailment charge in fiscal 2018.The Company sponsors a defined benefit pension plan (the “Shaw’s Plan”) covering union employees under the Shaw’s banner. Under the United banner, the Company sponsors a frozen plan (the “United Plan”) covering certain United employees and an unfunded Retirement Restoration Plan that provides death benefits and supplemental income payments for certain United senior executives after retirement.
F-35
Other Post-Retirement Benefits
In addition to the Company’s pension plans, the Company provides post-retirement medical and life insurance benefits to certain employees. Retirees share a portion of the cost of the post-retirement medical plans. The Company pays all the cost of the life insurance plans. The plans are unfunded.
The following table provides a reconciliation of the changes in the retirement plans’ benefit obligation and fair value of assets over the
two-year
period ended February 29, 2020 and a statement of funded status as of February 29, 2020 and February 23, 2019 (in millions):Pension | Other Post-Retirement Benefits | |||||||||||||||
February 29, 2020 | February 23, 2019 | February 29, 2020 | February 23, 2019 | |||||||||||||
Change in projected benefit obligation: | ||||||||||||||||
Beginning balance | $ | 2,325.8 | $ | 2,351.8 | $ | 23.8 | $ | 26.9 | ||||||||
Service cost | 14.7 | 52.4 | 0.6 | 1.0 | ||||||||||||
Interest cost | 80.6 | 85.8 | 0.7 | 0.5 | ||||||||||||
Actuarial loss (gain) | 315.1 | 0.5 | (2.6 | ) | (2.4 | ) | ||||||||||
Plan participant contributions | — | — | 0.4 | 0.4 | ||||||||||||
Benefit payments (including settlements) | (218.9 | ) | (167.8 | ) | (2.0 | ) | (2.6 | ) | ||||||||
Plan amendments | (1.1 | ) | 3.1 | — | — | |||||||||||
Ending balance | $ | 2,516.2 | $ | 2,325.8 | $ | 20.9 | $ | 23.8 | ||||||||
Change in fair value of plan assets: | ||||||||||||||||
Beginning balance | $ | 1,847.0 | $ | 1,814.0 | $ | — | $ | — | ||||||||
Actual return on plan assets | 106.2 | 3.6 | — | — | ||||||||||||
Employer contributions | 9.4 | 197.2 | 1.6 | 2.1 | ||||||||||||
Plan participant contributions | — | — | 0.4 | 0.4 | ||||||||||||
Benefit payments (including settlements) | (218.9 | ) | (167.8 | ) | (2.0 | ) | (2.5 | ) | ||||||||
Ending balance | $ | 1,743.7 | $ | 1,847.0 | $ | — | $ | — | ||||||||
Components of net amount recognized in financial position: | ||||||||||||||||
Other current liabilities | $ | (6.7 | ) | $ | (6.7 | ) | $ | (2.5 | ) | $ | (2.1 | ) | ||||
Other long-term liabilities | (765.8 | ) | (472.1 | ) | (18.4 | ) | (21.7 | ) | ||||||||
Funded status | $ | (772.5 | ) | $ | (478.8 | ) | $ | (20.9 | ) | $ | (23.8 | ) | ||||
Amounts recognized in Accumulated other comprehensive (loss) income consisted of the following (in millions):
Pension | Other Post-Retirement Benefits | |||||||||||||||
February 29, 2020 | February 23, 2019 | February 29, 2020 | February 23, 2019 | |||||||||||||
Net actuarial loss (gain) | $ | 170.4 | $ | (140.6 | ) | $ | (10.3 | ) | $ | (8.2 | ) | |||||
Prior service cost | 1.6 | 3.1 | 1.9 | 5.6 | ||||||||||||
| $ | 172.0 | $ | (137.5 | ) | $ | (8.4 | ) | $ | (2.6 | ) | ||||||
F-36
Information for the Company’s pension plans, all of which have an accumulated benefit obligation in excess of plan assets as of February 29, 2020 and February 23, 2019, is shown below (in millions):
February 29, 2020 | February 23, 2019 | |||||||
Projected benefit obligation | $ | 2,516.2 | $ | 2,325.8 | ||||
Accumulated benefit obligation | 2,513.4 | 2,323.9 | ||||||
Fair value of plan assets | 1,743.7 | 1,847.0 | ||||||
The following table provides the components of net pension and post retirement (income) expense for the retirement plans and other changes in plan assets and benefit obligations recognized in Other comprehensive (loss) income (in millions):
Pension | Other Post-Retirement Benefits | |||||||||||||||
Fiscal 2019 | Fiscal 2018 | Fiscal 2019 | Fiscal 2018 | |||||||||||||
Components of net expense: | ||||||||||||||||
Estimated return on plan assets | $ | (110.1 | ) | $ | (112.6 | ) | $ | — | $ | — | ||||||
Service cost | 14.7 | 52.4 | 0.6 | 1.0 | ||||||||||||
Interest cost | 80.6 | 85.8 | 0.7 | 0.5 | ||||||||||||
Amortization of prior service cost | 0.4 | 0.1 | 3.7 | 3.7 | ||||||||||||
Amortization of net actuarial loss (gain) | 0.5 | (6.3 | ) | (0.5 | ) | (0.2 | ) | |||||||||
Loss due to settlement accounting | 7.4 | — | — | — | ||||||||||||
Loss due to curtailment accounting | — | 0.1 | — | — | ||||||||||||
(Income) expense, net | (6.5 | ) | 19.5 | 4.5 | 5.0 | |||||||||||
Changes in plan assets and benefit obligations recognized in Other comprehensive (loss) income: | ||||||||||||||||
Net actuarial loss (gain) | 318.9 | 109.4 | (2.6 | ) | (2.4 | ) | ||||||||||
Settlement loss | (7.4 | ) | — | — | — | |||||||||||
Curtailment loss | — | (0.1 | ) | — | — | |||||||||||
Amortization of net actuarial (loss) gain | (0.5 | ) | 6.3 | 0.5 | 0.2 | |||||||||||
Prior service cost | (1.1 | ) | 3.1 | — | — | |||||||||||
Amortization of prior service cost | (0.4 | ) | (0.1 | ) | (3.7 | ) | (3.7 | ) | ||||||||
Total recognized in Other comprehensive (loss) income | 309.5 | 118.6 | (5.8 | ) | (5.9 | ) | ||||||||||
Total net expense and changes in plan assets and benefit obligations recognized in Other comprehensive (loss) income | $ | 303.0 | $ | 138.1 | $ | (1.3 | ) | $ | (0.9 | ) | ||||||
Prior service costs are amortized on a straight-line basis over the average remaining service period of active participants. When the accumulation of actuarial gains and losses exceeds 10% of the greater of the projected benefit obligation and the fair value of plan assets, the excess is amortized over either the average remaining lifetime of all participants or the average remaining service period of active participants. No significant prior service costs or estimated net actuarial gain or loss is expected to be amortized from Other comprehensive (loss) income into periodic benefit cost during fiscal 2020.
F-37
Assumptions
The weighted average actuarial assumptions used to determine
year-end
projected benefit obligations for pension plans were as follows:February 29, 2020 | February 23, 2019 | |||||||
Discount rate | 2.83 | % | 4.17 | % | ||||
Rate of compensation increase | 3.02 | % | 2.87 | % | ||||
The weighted average actuarial assumptions used to determine net periodic benefit costs for pension plans were as follows:
February 29, 2020 | February 23, 2019 | |||||||
Discount rate | 4.17 | % | 4.12 | % | ||||
Expected return on plan assets: | 6.36 | % | 6.38 | % | ||||
On February 29, 2020, the Company adopted the latest Society of Actuaries’ mortality table for private pension plans for calculating the Company’s 2019
year-end
benefit obligations. This table assumes a slight improvement in life expectancy in the future compared to theRP-2014
mortality table used for calculating the Company’s 2018year-end
benefit obligations and 2019 expense. Similarly, on February 29, 2020, the Company adopted the newMP-2019
mortality improvement projection scale which assumes an improvement in life expectancy at a marginally slower rate than theMP-2018
projection scale. The change in mortality assumption and future mortality improvement resulted in an immaterial decrease in the Company’s current year benefit obligations and future expenses.The Company has adopted and implemented an investment policy for the defined benefit pension plans that incorporates a strategic long-term asset allocation mix designed to meet the Company’s long-term pension requirements. This asset allocation policy is reviewed annually and, on a regular basis, actual allocations are rebalanced to the prevailing targets. The investment policy also emphasizes the following key objectives: (1) maintaining a diversified portfolio among asset classes and investment styles; (2) maintaining an acceptable level of risk in pursuit of long-term economic benefit; (3) maximizing the opportunity for value-added returns from active investment management while establishing investment guidelines and monitoring procedures for each investment manager to ensure the characteristics of the portfolio are consistent with the original investment mandate; and (4) maintaining adequate controls over administrative costs.
The following table summarizes actual allocations for the Safeway Plan which had approximately $1,445 million in plan assets as of February 29, 2020:
Plan Assets | ||||||||||||
Asset category | Target | February 29, 2020 | February 23, 2019 | |||||||||
Equity | 65 | % | 64.0 | % | 62.5 | % | ||||||
Fixed income | 35 | % | 39.2 | % | 35.6 | % | ||||||
Cash and other | — | % | (3.2 | )% | 1.9 | % | ||||||
Total | 100 | % | 100.0 | % | 100.0 | % | ||||||
F-38
The following table summarizes the actual allocations for the Shaw’s Plan which had approximately $264 million in plan assets as of February 29, 2020:
Plan Assets | ||||||||||||
Asset category | Target | February 29, 2020 | February 23, 2019 | |||||||||
Equity | 65 | % | 64.5 | % | 60.5 | % | ||||||
Fixed income | 35 | % | 35.4 | % | 35.9 | % | ||||||
Cash and other | — | % | 0.1 | % | 3.6 | % | ||||||
Total | 100 | % | 100.0 | % | 100.0 | % | ||||||
The following table summarizes the actual allocations for the United Plan which had approximately $35 million in plan assets as of February 29, 2020:
Plan Assets | ||||||||||||
Asset category | Target (1) | February 29, 2020 | February 23, 2019 | |||||||||
Equity | 50 | % | 47.8 | % | 50.3 | % | ||||||
Fixed income | 50 | % | 50.4 | % | 50.0 | % | ||||||
Cash and other | — | % | 1.8 | % | (0.3 | )% | ||||||
Total | 100 | % | 100.0 | % | 100.0 | % | ||||||
| (1) | The target market value of equity securities for the United Plan is 50% of plan assets. If the equity percentage exceeds 60% or drops below 40%, the asset allocation is adjusted to target. |
Expected return on pension plan assets is based on historical experience of the Company’s portfolios and the review of projected returns by asset class on broad, publicly traded equity and fixed-income indices, as well as target asset allocation.
Pension Plan Assets
The fair value of the Company’s pension plan assets as of February 29, 2020, excluding pending transactions of $95.1 million payable to an intermediary agent, by asset category are as follows (in millions):
Fair Value Measurements | ||||||||||||||||||||
Asset category | Total | Quoted Prices in Active Markets for Identical Assets (Level 1) | Significant Observable Inputs (Level 2) | Significant Unobservable Inputs (Level 3) | Assets Measured at NAV | |||||||||||||||
Cash and cash equivalents (1) | $ | 6.3 | $ | 3.4 | $ | 2.9 | $ | — | $ | — | ||||||||||
Short-term investment collective trust (2) | 37.4 | — | 37.4 | — | — | |||||||||||||||
Common and preferred stock: (3) | ||||||||||||||||||||
Domestic common and preferred stock | 167.8 | 167.8 | — | — | — | |||||||||||||||
International common stock | 57.8 | 57.8 | — | — | — | |||||||||||||||
Collective trust funds (2) | 710.6 | — | — | — | 710.6 | |||||||||||||||
Corporate bonds (4) | 135.9 | — | 135.9 | — | — | |||||||||||||||
Mortgage- and other asset-backed securities (5) | 45.0 | — | 45.0 | — | — | |||||||||||||||
Mutual funds (6) | 272.0 | 138.4 | 22.7 | — | 110.9 | |||||||||||||||
U.S. government securities (7) | 359.0 | — | 359.0 | — | — | |||||||||||||||
Other securities (8) | 47.0 | — | 12.1 | — | 34.9 | |||||||||||||||
Total | $ | 1,838.8 | $ | 367.4 | $ | 615.0 | $ | — | $ | 856.4 | ||||||||||
F-39
| (1) | The carrying value of these items approximates fair value. |
| (2) | These investments are valued based on the Net Asset Value (“NAV”) of the underlying investments and are provided by the fund issuers. There are no unfunded commitments or redemption restrictions for these funds. Funds meeting the practical expedient are included in the Assets Measured at NAV column. |
| (3) | The fair value of common stock is based on the exchange quoted market prices. When quoted prices are not available for identical stock, an industry valuation model is used which maximizes observable inputs. |
| (4) | The fair value of corporate bonds is generally based on yields currently available on comparable securities of the same or similar issuers with similar credit ratings and maturities. When quoted prices are not available for identical or similar bonds, the fair value is based upon an industry valuation model, which maximizes observable inputs. |
| (5) | The fair value of mortgage- and other asset-backed securities is generally based on yields currently available on comparable securities of the same or similar issuers with similar credit ratings and maturities. When quoted prices are not available for comparable securities, the fair value is based upon an industry valuation model which maximizes observable inputs. |
| (6) | These investments are open-ended mutual funds that are registered with the SEC which are valued using the NAV. The NAV of the mutual funds is a published price in an active market. The NAV is determined once a day after the closing of the exchange based upon the underlying assets in the fund, less the fund’s liabilities, expressed on a per-share basis. There are no unfunded commitments, or redemption restrictions for these funds, and the funds are required to transact at the published price. |
| (7) | The fair value of U.S. government securities is based on quoted market prices when available. When quoted prices are not available, the fair value of U.S. government securities is based on yields currently available on comparable securities or on an industry valuation model which maximizes observable inputs. |
| (8) | Level 2 Other securities, which consist primarily of U.S. municipal bonds, foreign government bonds and foreign agency securities are valued based on yields currently available on comparable securities of issuers with similar credit ratings. Also included in Other securities is a commingled fund valued based on the NAV of the underlying investments and is provided by the issuer and exchange-traded derivatives that are valued based on quoted prices in an active market for identical derivatives, assets and liabilities. Funds meeting the practical expedient are included in the Assets Measured at NAV column. Exchange-traded derivatives are valued based on quoted prices in an active market for identical derivatives assets and liabilities. Non-exchange-traded derivatives are valued using industry valuation models, which maximize observable inputs, such as interest-rate yield curve data, foreign exchange rates and applicable spot and forward rates. |
F-40
The fair value of the Company’s pension plan assets as of February 23, 2019, excluding pending transactions of $79.5 million payable to an intermediary agent, by asset category are as follows (in millions):
Fair Value Measurements | ||||||||||||||||||||
Asset category | Total | Quoted Prices in Active Markets for Identical Assets (Level 1) | Significant Observable Inputs (Level 2) | Significant Unobservable Inputs (Level 3) | Assets Measured at NAV | |||||||||||||||
Cash and cash equivalents (1) | $ | 10.8 | $ | 1.6 | $ | 9.2 | $ | — | $ | — | ||||||||||
Short-term investment collective trust (2) | 73.3 | — | 73.3 | — | — | |||||||||||||||
Common and preferred stock: (3) | ||||||||||||||||||||
Domestic common and preferred stock | 254.5 | 254.5 | — | — | — | |||||||||||||||
International common stock | 64.0 | 64.0 | — | — | — | |||||||||||||||
Collective trust funds (2) | 649.9 | — | — | — | 649.9 | |||||||||||||||
Corporate bonds (4) | 126.0 | — | 126.0 | — | — | |||||||||||||||
Mortgage- and other asset-backed securities (5) | 42.8 | — | 42.8 | — | — | |||||||||||||||
Mutual funds (6) | 257.2 | 139.9 | 29.2 | — | 88.1 | |||||||||||||||
U.S. government securities (7) | 362.5 | — | 362.5 | — | — | |||||||||||||||
Other securities (8) | 85.5 | — | 51.6 | — | 33.9 | |||||||||||||||
Total | $ | 1,926.5 | $ | 460.0 | $ | 694.6 | $ | — | $ | 771.9 | ||||||||||
| (1) | The carrying value of these items approximates fair value. |
| (2) | These investments are valued based on the NAV of the underlying investments and are provided by the fund issuers. There are no unfunded commitments or redemption restrictions for these funds. Funds meeting the practical expedient are included in the Assets Measured at NAV column. |
| (3) | The fair value of common stock is based on the exchange quoted market prices. When quoted prices are not available for identical stock, an industry valuation model is used which maximizes observable inputs. |
| (4) | The fair value of corporate bonds is generally based on yields currently available on comparable securities of the same or similar issuers with similar credit ratings and maturities. When quoted prices are not available for identical or similar bonds, the fair value is based upon an industry valuation model, which maximizes observable inputs. |
| (5) | The fair value of mortgage- and other asset-backed securities is generally based on yields currently available on comparable securities of the same or similar issuers with similar credit ratings and maturities. When quoted prices are not available for comparable securities, the fair value is based upon an industry valuation model which maximizes observable inputs. |
| (6) | These investments are open-ended mutual funds that are registered with the SEC which are valued using the NAV. The NAV of the mutual funds is a published price in an active market. The NAV is determined once a day after the closing of the exchange based upon the underlying assets in the fund, less the fund’s liabilities, expressed on a per-share basis. There are no unfunded commitments, or redemption restrictions for these funds, and the funds are required to transact at the published price. |
| (7) | The fair value of U.S. government securities is based on quoted market prices when available. When quoted prices are not available, the fair value of U.S. government securities is based on yields currently available on comparable securities or on an industry valuation model which maximizes observable inputs. |
| (8) | Level 2 Other securities, which consist primarily of U.S. municipal bonds, foreign government bonds and foreign agency securities are valued based on yields currently available on comparable securities of issuers with similar credit ratings. Also included in Other securities is a commingled fund valued based on the NAV of the underlying investments and is provided by the issuer and exchange-traded derivatives that are valued based on quoted prices in an active market for identical derivatives, assets and liabilities. Funds meeting the practical expedient are included in the Assets Measured at NAV column. Exchange-traded derivatives are valued based on quoted prices in an active market for identical derivatives assets and liabilities. Non-exchange-traded derivatives are valued using industry valuation models, which maximize observable inputs, such as interest-rate yield curve data, foreign exchange rates and applicable spot and forward rates. |
F-41
Contributions
In fiscal 2019, fiscal 2018 and fiscal 2017, the Company contributed $11.0 million, $199.3 million and $21.9 million, respectively, to its pension and post-retirement plans. The Company’s funding policy for the defined benefit pension plan is to contribute the minimum contribution required under the Employee Retirement Income Security Act of 1974, as amended, and other applicable laws as determined by the Company’s external actuarial consultant. At the Company’s discretion, additional funds may be contributed to the defined benefit pension plans. The Company’s fiscal 2018 contributions include $150.0 million of additional discretionary contributions to reduce the Pension Benefit Guaranty Corporation (“PBGC”) premium costs and improve the overall funded status of the plans. The Company expects to contribute $69.5 million to its pension and post-retirement plans in fiscal 2020. The Company will recognize contributions in accordance with applicable regulations, with consideration given to recognition for the earliest plan year permitted.
Estimated Future Benefit Payments
The following benefit payments, which reflect expected future service as appropriate, are expected to be paid (in millions):
Pension Benefits | Other Benefits | |||||||
2020 | $ | 238.6 | $ | 2.6 | ||||
2021 | 190.9 | 2.4 | ||||||
2022 | 186.5 | 2.2 | ||||||
2023 | 193.0 | 1.9 | ||||||
2024 | 225.6 | 1.7 | ||||||
2025 – 2029 | 705.9 | 6.0 | ||||||
Multiemployer Pension Plans
The Company contributes to various multiemployer pension plans. These multiemployer plans generally provide retirement benefits to participants based on their service to contributing employers. The benefits are paid from assets held in trust for that purpose. Plan trustees typically are responsible for determining the level of benefits to be provided to participants, the investment of the assets and plan administration. Expense is recognized in connection with these plans as contributions are funded.
The risks of participating in these multiemployer plans are different from the risks associated with single-employer plans in the following respects:
| • | Assets contributed to the multiemployer plan by one employer may be used to provide benefits to employees of other participating employers. |
| • | If a participating employer stops contributing to the plan, the unfunded obligations of the plan may be borne by the remaining participating employers. |
| • | With respect to some multiemployer plans, if the Company chooses to stop participating, or makes market exits or store closures or otherwise has participation in the plan fall below certain levels, the Company may be required to pay the plan an amount based on the underfunded status of the plan, referred to as withdrawal liability. The Company records the actuarially determined liability at an undiscounted amount. |
The Company’s participation in these plans is outlined in the table below. The
EIN-Pension
Plan Number column provides the Employer Identification Number (“EIN”) and the three-digit plan number, if applicable. Unless otherwise noted, the most recent Pension Protection Act of 2006 (“PPA”) zone status available for fiscal 2019 and fiscal 2018 is for the plan’s year ending at December 31, 2018 and December 31, 2017, respectively. The zone status is based on information received from the plans and is certified by each plan’s actuary. The FIP/RP Status Pending/Implemented column indicates plans for which a funding improvement plan (“FIP”) or a rehabilitation plan (“RP”) is either pending or has been implemented by the plan trustees.F-42
The following tables contain information about the Company’s multiemployer plans. Certain plans have been aggregated in the Other funds line in the following table, as the contributions to each of these plans are not individually material.
EIN - PN | Pension Protection Act zone status (1) | Company’s 5% of total plan contributions | FIP/RP status pending/implemented | |||||||||||||||||||||
Pension fund | 2019 | 2018 | 2018 | 2017 | ||||||||||||||||||||
UFCW-Northern California Employers Joint Pension Trust Fund | 946313554 - 001 | Red | Red | Yes | Yes | Implemented | ||||||||||||||||||
Western Conference of Teamsters Pension Plan | 916145047 - 001 | Green | Green | No | No | No | ||||||||||||||||||
Southern California United Food & Commercial Workers Unions and Food Employers Joint Pension Plan (4) | 951939092 - 001 | Red | Red | Yes | Yes | Implemented | ||||||||||||||||||
Food Employers Labor Relations Association and United Food and Commercial Workers Pension Fund | 526128473 - 001 | Red | Red | Yes | Yes | Implemented | ||||||||||||||||||
Sound Retirement Trust (6) | 916069306 - 001 | Red | Green | Yes | Yes | Implemented | ||||||||||||||||||
Bakery and Confectionery Union and Industry International Pension Fund | 526118572 - 001 | Red | Red | Yes | Yes | Implemented | ||||||||||||||||||
UFCW Union and Participating Food Industry Employers Tri-State Pension Fund | 236396097 - 001 | Red | Red | Yes | Yes | Implemented | ||||||||||||||||||
Rocky Mountain UFCW Unions & Employers Pension Plan | 846045986 - 001 | Green | Green | Yes | Yes | No | ||||||||||||||||||
UFCW Local 152 Retail Meat Pension Fund (5) | 236209656 - 001 | Red | Red | Yes | Yes | Implemented | ||||||||||||||||||
Desert States Employers & UFCW Unions Pension Plan | 846277982 - 001 | Green | Green | Yes | Yes | No | ||||||||||||||||||
UFCW International Union - Industry Pension Fund (5) | 516055922 - 001 | Green | Green | Yes | Yes | No | ||||||||||||||||||
Mid Atlantic Pension Fund | 461000515 - 001 | Green | Green | Yes | Yes | No | ||||||||||||||||||
Retail Food Employers and UFCW Local 711 Pension Trust Fund | 516031512 - 001 | Red | Yellow | Yes | Yes | Implemented | ||||||||||||||||||
Oregon Retail Employees Pension Trust | 936074377 - 001 | Green | Green | Yes | Yes | No | ||||||||||||||||||
Intermountain Retail Store Employees Pension Trust (7) | 916187192 - 001 | Red | Red | Yes | Yes | Implemented | ||||||||||||||||||
F-43
Contributions of Company (in millions) | Surcharge imposed (2) | Expiration date of collective bargaining agreements | Total collective bargaining agreements | Most significant collective bargaining agreement(s)(3) | ||||||||||||||||||||||||||||
Pension fund | 2019 | 2018 | 2017 | Count | Expiration | |||||||||||||||||||||||||||
UFCW-Northern California Employers Joint Pension Trust Fund | $ | 103.8 | $ | 104.4 | $ | 110.2 | No | 10/13/2018 to 10/9/2021 | 71 | 50 | 10/13/2018 | |||||||||||||||||||||
Western Conference of Teamsters Pension Plan | 64.9 | 63.7 | 61.2 | No | 9/14/2019 to 10/7/2023 | 50 | 15 | 9/20/2020 | ||||||||||||||||||||||||
Southern California United Food & Commercial Workers Unions and Food Employers Joint Pension Plan (4) | 116.1 | 108.4 | 92.4 | No | 3/11/2018 to 3/6/2022 | 45 | 43 | 3/6/2022 | ||||||||||||||||||||||||
Food Employers Labor Relations Association and United Food and Commercial Workers Pension Fund | 18.8 | 20.4 | 20.4 | No | 10/26/2019 to 4/15/2020 | 21 | 16 | 10/26/2019 | ||||||||||||||||||||||||
Sound Retirement Trust (6) | 44.3 | 39.1 | 32.1 | No | 10/13/2018 to 3/18/2023 | 128 | 25 | 5/8/2022 | ||||||||||||||||||||||||
Bakery and Confectionery Union and Industry International Pension Fund | 18.5 | 17.4 | 16.6 | No | 9/3/2011 to 5/6/2023 | 103 | 34 | 9/6/2020 | ||||||||||||||||||||||||
UFCW Union and Participating Food Industry Employers Tri-State Pension Fund | 14.9 | 14.0 | 15.8 | No | 2/1/2020 to 1/31/2022 | 6 | 2 | 3/28/2020 | ||||||||||||||||||||||||
Rocky Mountain UFCW Unions & Employers Pension Plan | 12.3 | 10.8 | 10.8 | No | 11/23/2019 to 11/26/2022 | 85 | 27 | 2/19/2022 | ||||||||||||||||||||||||
UFCW Local 152 Retail Meat Pension Fund (5) | 10.9 | 10.8 | 11.0 | No | 5/2/2020 | 4 | 4 | 5/2/2020 | ||||||||||||||||||||||||
Desert States Employers & UFCW Unions Pension Plan | 8.9 | 9.1 | 9.3 | No | 10/24/2020 to 11/5/2022 | 16 | 13 | 10/24/2020 | ||||||||||||||||||||||||
UFCW International Union—Industry Pension Fund (5) | 9.5 | 13.1 | 12.4 | No | 8/3/2019 to 12/16/2023 | 28 | 6 | 5/1/2021 | ||||||||||||||||||||||||
Mid Atlantic Pension Fund | 7.4 | 6.6 | 6.8 | No | 10/26/2019 to 2/22/2020 | 19 | 16 | 10/26/2019 | ||||||||||||||||||||||||
Retail Food Employers and UFCW Local 711 Pension Trust Fund | 7.3 | 7.1 | 6.6 | No | 5/19/2018 to 12/13/2020 | 7 | 2 | 3/2/2019 | ||||||||||||||||||||||||
Oregon Retail Employees Pension Trust | 8.9 | 7.6 | 6.6 | No | 7/31/2021 to 11/12/2022 | 136 | 23 | 1/29/2022 | ||||||||||||||||||||||||
Intermountain Retail Store Employees Pension Trust (7) | 5.8 | 4.8 | 3.8 | No | 5/19/2013 to 12/10/2022 | 54 | 19 | 4/4/2020 | ||||||||||||||||||||||||
Other funds | 17.0 | 13.8 | 15.2 | |||||||||||||||||||||||||||||
Total Company contributions to U.S. multiemployer pension plans | $ | 469.3 | $ | 451.1 | $ | 431.2 | ||||||||||||||||||||||||||
| (1) | PPA established three categories (or “zones”) of plans: (1) “Green Zone” for healthy; (2) “Yellow Zone” for endangered; and (3) “Red Zone” for critical. These categories are based upon the funding ratio of the plan assets to plan liabilities. In general, Green Zone plans have a funding ratio greater than 80%, Yellow Zone plans have a funding ratio between 65%—79%, and Red Zone plans have a funding ratio less than 65%. |
F-44
| (2) | Under the PPA, a surcharge may be imposed when employers make contributions under a collective bargaining agreement that is not in compliance with a rehabilitation plan. As of February 29, 2020, the collective bargaining agreements under which the Company was making contributions were in compliance with rehabilitation plans adopted by the applicable pension fund. |
| (3) | These columns represent the number of most significant collective bargaining agreements aggregated by common expiration dates for each of the Company’s pension funds listed above. |
| (4) | The information for this fund was obtained from the Form 5500 filed for the plan’s year-end at March 31, 2019 and March 31, 2018. |
| (5) | The information for this fund was obtained from the Form 5500 filed for the plan’s year-end at June 30, 2018 and June 30, 2017. |
| (6) | The information for this fund was obtained from the Form 5500 filed for the plan’s year-end at September 30, 2018 and September 30, 2017. |
| (7) | The information for this fund was obtained from the Form 5500 filed for the plan’s year-end at August 31, 2018 and August 31, 2017. |
The Company is the second largest contributing employer to the Food Employers Labor Relations Association and United Food and Commercial Workers Pension Fund (“FELRA”) which is currently projected by FELRA to become insolvent in the first quarter of 2021, and to the
Mid-Atlantic
UFCW and Participating Pension Fund (“MAP”). The Company continues to fund all of its required contributions to FELRA and MAP.On March 5, 2020, the Company agreed with the two applicable local unions to new collective bargaining agreements pursuant to which the Company contributes to FELRA and MAP. In connection with these agreements, to address the pending insolvency of FELRA, the Company and the two local unions, along with the largest contributing employer, agreed to combine MAP into FELRA (“Combined Plan”). Upon the formation of the Combined Plan, the Combined Plan will be frozen and the Company will be required to annually pay $23.2 million to the Combined Plan for the next 25 years. After making all 25 years of payments, the Company will receive a release of all withdrawal liability and mass withdrawal liability from FELRA, MAP, the Combined Plan and the PBGC. This payment will replace the Company’s current annual contribution to both MAP and FELRA, which was a combined $26.2 million in fiscal 2019. In addition to the $23.2 million annual payment, the Company will begin to contribute to a new multiemployer pension plan. This new multiemployer plan will be limited to providing benefits to participants in MAP and FELRA in excess of the benefits the PBGC insures under law.
Furthermore, upon formation of the Combined Plan, the Company will establish and contribute to a new variable defined benefit plan that will provide benefits to participants for future services. These agreements are subject to approval by the PBGC and the Company is in discussions with the local unions, the largest contributing employer, and negotiations with the PBGC with respect to these other plans and the Combined Plan. It is possible some provisions of our agreements with local unions may change as a result of negotiations with the PBGC. The Company expects to reach final agreements on formation of the Combined Plan by no later than December 31, 2020. Under the terms of the new collective bargaining agreements, the Company will continue to contribute to FELRA and MAP under the same terms of the previous collective bargaining agreements until approval by the PBGC and formation of the Combined Plan. The Company is currently evaluating the effect of these new agreements to its consolidated financial statements and preliminarily expects to record a material increase to its pension-related liabilities with a corresponding
non-cash
charge to pension expense upon approval by the PBGC.As a part of the Safeway acquisition, the Company assumed withdrawal liabilities related to Safeway’s 2013 closure of its Dominick’s division. The Company recorded a $221.8 million multiemployer pension withdrawal liability related to Safeway’s withdrawal from these plans. One of the plans, the UFCW & Employers Midwest Pension Fund (the “Midwest Plan”), had asserted the Company may be liable for mass withdrawal liability, if the plan has a mass withdrawal, in addition to the liability the Midwest Plan already had assessed. The Company disputed that the Midwest Plan would have the right to assess mass withdrawal liability on the Company and the Company also disputed in arbitration the amount of the withdrawal liability the Midwest Plan had assessed. On
F-45
March 12, 2020, the Company agreed to a settlement of these matters with the Midwest Plan’s Board of Trustees. As a result of the settlement, the Company agreed to pay $75.0 million, in a lump sum, which is expected to be paid in the first quarter of fiscal 2020, and forego any amounts already paid to the Midwest Plan. The Company had previously recorded an estimated withdrawal liability and as a result of the settlement, the Company recorded a gain of $43.3 million to reduce the previously recorded estimated withdrawal liability to the settlement amount. The total amount of the withdrawal liability recorded with respect to the Dominick’s division as of February 29, 2020 was $80.0 million, which includes the $75.0 million settlement amount.
Collective Bargaining Agreements
As of February 29, 2020, the Company had approximately 270,000 employees, of which approximately 185,000 were covered by collective bargaining agreements. During fiscal 2019, collective bargaining agreements covering approximately 57,000 employees were renegotiated. Collective bargaining agreements covering approximately 45,000 employees have expired or are scheduled to expire in fiscal 2020.
Multiemployer Health and Welfare Plans
The Company makes contributions to multiemployer health and welfare plans in amounts specified in the applicable collective bargaining agreements. These plans provide medical, dental, pharmacy, vision, and other ancillary benefits to active employees and retirees as determined by the trustees of each plan. The majority of the Company’s contributions cover active employees and as such, may not constitute contributions to a postretirement benefit plan. However, the Company is unable to separate contribution amounts to postretirement benefit plans from contribution amounts paid to active employee plans. Total contributions to multiemployer health and welfare plans were $1.2 billion, $1.3 billion and $1.2 billion for fiscal 2019, fiscal 2018 and fiscal 2017, respectively.
Defined Contribution Plans and Supplemental Retirement Plans
Many of the Company’s employees are eligible to contribute a percentage of their compensation to defined contribution plans (“401(k) Plans”). Participants in the 401(k) Plans may become eligible to receive a profit-sharing allocation in the form of a discretionary Company contribution based on employee compensation. In addition, the Company may also provide matching contributions based on the amount of eligible compensation contributed by the employee. All Company contributions to the 401(k) Plans are made at the discretion of the Company’s board of directors. The Company provides supplemental retirement benefits through a Company sponsored deferred executive compensation plan, which provides certain key employees with retirement benefits that supplement those provided by the 401(k) Plans. Total contributions for these plans were $63.2 million, $45.1 million and $44.6 million for fiscal 2019, fiscal 2018 and fiscal 2017, respectively.
NOTE 12—RELATED PARTIES
Cerberus
In connection with the Safeway acquisition, the Company entered into a four-year management agreement with Cerberus Capital Management, L.P. and the consortium of investors, which commenced on January 30, 2015, requiring an annual management fee of $13.75 million. The Company made the final payment under the initial management agreement in the fourth quarter of fiscal 2017. The agreement was extended to cover both fiscal 2018 and fiscal 2019, requiring the payment of annual management fees of $13.75 million in each year.
The Company paid Cerberus Operations and Advisory Company, LLC (“COAC”), an affiliate of Cerberus, fees totaling approximately $0.3 million, $0.5 million and $0.5 million for fiscal 2019, fiscal 2018 and fiscal 2017, respectively, for consulting services provided in connection with improving the Company’s operations.
F-
46
The Company paid Cerberus Technology Solutions (“CTS”), an affiliate of Cerberus, fees totaling approximately $4.4 million for fiscal 2019 for information technology advisory and implementation services in connection with modernizing the Company’s information systems. The Company paid no fees to CTS in fiscal 2018 and fiscal 2017.
NOTE 13—COMMITMENTS AND CONTINGENCIES AND OFF BALANCE SHEET ARRANGEMENTS
Guarantees
California Department of Industrial Relations:
Lease Guarantees:
(COVID-19)
pandemic. Because of the wide dispersion among third parties and the variety of remedies available, the Company believes that if an assignee became insolvent, it would not have a material effect on the Company’s financial condition, results of operations or cash flows.The Company also provides guarantees, indemnifications and assurances to others in the ordinary course of its business.
Legal Proceedings
The Company is subject from time to time to various claims and lawsuits arising in the ordinary course of business, including lawsuits involving trade practices, lawsuits alleging violations of state and/or federal wage and hour laws (including alleged violations of meal and rest period laws and alleged misclassification issues), real estate disputes as well as other matters. Some of these suits purport or may be determined to be class actions and/or seek substantial damages. It is the opinion of the Company’s management that although the amount of liability with respect to certain of the matters described herein cannot be ascertained at this time, any resulting liability of these and other matters, including any punitive damages, will not have a material adverse effect on the Company’s business or financial condition.
The Company continually evaluates its exposure to loss contingencies arising from pending or threatened litigation and believes it has made provisions where the loss contingency can be reasonably estimated and an adverse outcome is probable. Nonetheless, assessing and predicting the outcomes of these matters involves substantial uncertainties. Management currently believes that the aggregate range of reasonably possible loss for the Company’s exposure in excess of the amount accrued is expected to be immaterial to the Company. It remains possible that despite management’s current belief, material differences in actual outcomes or changes in management’s evaluation or predictions could arise that could have a material effect on the Company’s financial condition, results of operations or cash flows.
F-47
Office of Inspector General:
Civil Investigative Demands:
The Company has received a civil investigative demand dated February 28, 2020 from the United States Attorney for the Southern District of New York in connection with a False Claims Act investigation relating to the Company’s dispensing practices regarding insulin pen products. The investigation seeks documents regarding the Company’s policies, practices and procedures, as well as dispensing data, among other things. The Company will cooperate with the U.S. Attorney in the investigation. The Company is currently unable to determine the probability of the outcome of this matter or the range of possible loss, if any.
Terraza/Lorenz:
False Claims Act
United States ex rel. Schutte and Yarberry v. SuperValu, New Albertson’s, Inc., et al,
F-48
providing the government, as a part of usual and customary prices, the benefit of discounts given to customers who requested that defendants match competitor prices. The complaint was originally filed under seal and amended on November 30, 2015. On August 5, 2019, the Court granted relator’s motion for partial summary judgment, holding that price matched prices are the usual and customary prices for those drugs. Additional summary judgment motions by both parties are pending. Trial will be set after the Court rules on the pending summary judgment motions. In, also pending in the Central District of Illinois, the relator alleges that Safeway overcharged government healthcare programs by not providing the government, as part of its usual and customary prices, the benefit of discounts given to customers in pharmacy discount programs. On August 26, 2015, the underlying complaint was unsealed. Trial is set for October 27, 2020. In both of the above cases, the government previously investigated the relators’ allegations and declined to intervene. Relators elected to pursue their respective cases on their own and in each case have alleged FCA damages in excess of $100 million before trebling and excluding penalties. The Company is vigorously defending each of these matters and believes each of these cases
United States ex rel. Proctor v. Safeway
is
without merit. The Company has recorded an estimated liability for these matters.The Company was also subject to another FCA qui tam action entitled United States ex rel.. In that case, the relators alleged that Albertson’s LLC (“Albertson’s”) overcharged federal healthcare programs by not providing the government, as a part of its usual and customary prices to the government, the benefit of discounts given to customers who enrolled in the Albertson’s discount-club program. The complaint was originally filed under seal and amended on June 20, 2017. On December 17, 2018, the case was dismissed, without prejudice.
Zelickowski v. Albertson’s LLC
Alaska Attorney General’s Investigation:
Opioid Litigation:
matters--MDL
No. 2804 filed by The Blackfeet Tribe of the Blackfeet Indian Reservation andState of New Mexico v. Purdue Pharma L.P., et al.
--the
Company filed motions to dismiss, which were denied, and the Company has now answered the Complaints. The MDL cases are stayed pending bellwether trials, and the only active matter is the New Mexico action where a September 2021 trial date has been set. The Company is vigorously defending these matters and believes that these cases are without merit. At this early stage in the proceedings, the Company is unable to determine the probability of the outcome of these matters or the range of reasonably possible loss, if any.California Air Resources Board:
F-49
CARB, the Company could be subject to certain fines and penalties. The Company has recorded an estimated liability for this matter.
FACTA:
Martin v. Safeway
Other Commitments
In the ordinary course of business, the Company enters into various supply contracts to purchase products for resale and purchase and service contracts for fixed asset and information technology commitments. These contracts typically include volume commitments or fixed expiration dates, termination provisions and other standard contractual considerations.
NOTE 14—OTHER COMPREHENSIVE INCOME OR LOSS
Total comprehensive earnings are defined as all changes in stockholders’ equity during a period, other than those from investments by or distributions to stockholders/members. Generally, for the Company, total comprehensive income equals net income plus or minus adjustments for interest rate swaps, pension and other post-retirement liabilities and foreign currency translation adjustments.
While total comprehensive earnings are the activity in a period and are largely driven by net earnings in that period, accumulated other comprehensive income or loss (“AOCI”) represents the cumulative balance of other comprehensive income, net of tax, as of the balance sheet date. AOCI is primarily the cumulative balance related to interest rate swaps, pension and other post-retirement benefit adjustments and foreign currency translation adjustments. Changes in the AOCI balance by component are shown below (in millions):
Fiscal 2019 | ||||||||||||||||||||
Total | Interest rate swaps | Pension and Post- retirement benefit plan items | Foreign currency translation adjustments | Other | ||||||||||||||||
Beginning AOCI balance | $ | 91.3 | $ | 3.4 | $ | 88.8 | $ | (1.4 | ) | $ | 0.5 | |||||||||
Cumulative effect of accounting change (1) | 16.6 | 1.2 | 14.9 | — | 0.5 | |||||||||||||||
Other comprehensive (loss) income before reclassifications | (356.2 | ) | (45.8 | ) | (315.2 | ) | 0.3 | 4.5 | ||||||||||||
Amounts reclassified from Accumulated other comprehensive (loss) income | 46.9 | 35.4 | 11.5 | — | — | |||||||||||||||
Tax benefit (expense) | 82.9 | 5.8 | 78.3 | — | (1.2 | ) | ||||||||||||||
Current-period other comprehensive (loss) income, net | (209.8 | ) | (3.4 | ) | (210.5 | ) | 0.3 | 3.8 | ||||||||||||
Ending AOCI balance | $ | (118.5 | ) | $ | — | $ | (121.7 | ) | $ | (1.1 | ) | $ | 4.3 | |||||||
| (1) | Related to the adoption of ASU 2018-02, ”Income Statement—Reporting Comprehensive Income (Topic 220): Reclassification of Certain Tax Effects from Accumulated Other Comprehensive Income. |
F-50
Fiscal 2018 | ||||||||||||||||||||
Total | Interest rate swaps | Pension and Post- retirement benefit plan items | Foreign currency translation adjustments | Other | ||||||||||||||||
Beginning AOCI balance | $ | 191.1 | $ | 18.9 | $ | 171.9 | $ | (1.1 | ) | $ | 1.4 | |||||||||
Other comprehensive loss before reclassifications | (129.8 | ) | (18.6 | ) | (110.0 | ) | (0.3 | ) | (0.9 | ) | ||||||||||
Amounts reclassified from Accumulated other comprehensive (loss) income | (5.6 | ) | (2.3 | ) | (2.7 | ) | — | (0.6 | ) | |||||||||||
Tax benefit | 35.6 | 5.4 | 29.6 | — | 0.6 | |||||||||||||||
Current-period other comprehensive loss, net | (99.8 | ) | (15.5 | ) | (83.1 | ) | (0.3 | ) | (0.9 | ) | ||||||||||
Ending AOCI balance | $ | 91.3 | $ | 3.4 | $ | 88.8 | $ | (1.4 | ) | $ | 0.5 | |||||||||
NOTE 15—NET INCOME PER COMMON SHARE
Basic net income per common share is computed by dividing net income by the weighted average number of common shares outstanding for the period, including common shares to be issued with no prior remaining contingencies prior to issuance. The computation of diluted net income per share reflects the dilutive effects of potentially issuable common shares related to outstanding Phantom Units. Performance-based Phantom Units are considered dilutive when the related performance criterion has been met.
The components of basic and diluted net income per common share were as follows (in millions, except per share data):
Fiscal 2019 | Fiscal 2018 | Fiscal 2017 | ||||||||||
Net Income | $ | 466.4 | $ | 131.1 | $ | 46.3 | ||||||
Weighted average common shares outstanding (1) | 279.6 | 280.1 | 279.7 | |||||||||
Dilutive effect of potential common shares (2) | 0.5 | 0.1 | — | |||||||||
Weighted average common shares and potential dilutive common shares outstanding | 280.1 | 280.2 | 279.7 | |||||||||
Basic net income per common share | $ | 1.67 | $ | 0.47 | $ | 0.17 | ||||||
Diluted net income per common share | 1.67 | 0.47 | 0.17 | |||||||||
| (1) | Fiscal 2019 and fiscal 2018 include 0.6 million and 0.9 million common shares remaining to be issued, respectively. For fiscal 2017, there were no common shares remaining to be issued |
| (2) | There were no potential common shares outstanding that were antidilutive for fiscal 2019 and fiscal 2018. For fiscal 2017, there were 1.3 million potential common shares excluded from the diluted net income per share calculations because they would have been antidilutive |
F-51
NOTE 1
6
QUARTERLY INFORMATION (unaudited)
The summarized quarterly financial data presented below reflects all adjustments, which in the opinion of management, are of a normal and recurring nature and are necessary for a fair statement of the results for the interim periods presented (in millions):
Fiscal 2019 | ||||||||||||||||||||
53 Weeks | Last 13 Weeks | Third 12 Weeks | Second 12 Weeks | First 16 Weeks | ||||||||||||||||
Net sales and other revenue | $ | 62,455.1 | $ | 15,436.8 | $ | 14,103.2 | $ | 14,176.7 | $ | 18,738.4 | ||||||||||
Gross profit | 17,594.2 | 4,418.0 | 3,995.1 | 3,941.5 | 5,239.6 | |||||||||||||||
Operating income | 1,437.1 | 326.6 | 206.6 | 582.4 | 321.5 | |||||||||||||||
Income before income taxes | 599.2 | 90.1 | 67.7 | 376.7 | 64.7 | |||||||||||||||
Income tax expense | 132.8 | 22.3 | 12.9 | 81.9 | 15.7 | |||||||||||||||
Net income | $ | 466.4 | $ | 67.8 | $ | 54.8 | $ | 294.8 | $ | 49.0 | ||||||||||
Basic and diluted net income per common share | $ | 1.67 | $ | 0.24 | $ | 0.20 | $ | 1.05 | $ | 0.18 | ||||||||||
Net income for the second quarter of fiscal 2019 includes the Company’s $463.6 million net gain related to 3 separate sale leaseback transactions, which is included as a component of (Gain) loss on property dispositions and impairment losses, net.
Fiscal 2018 | ||||||||||||||||||||
52 Weeks | Last 12 Weeks | Third 12 Weeks | Second 12 Weeks | First 16 Weeks | ||||||||||||||||
Net sales and other revenue | $ | 60,534.5 | $ | 14,016.6 | $ | 13,840.4 | $ | 14,024.1 | $ | 18,653.4 | ||||||||||
Gross profit | 16,894.6 | 4,058.7 | 3,852.4 | 3,812.8 | 5,170.7 | |||||||||||||||
Operating income | 787.3 | 288.4 | 174.4 | 131.4 | 193.1 | |||||||||||||||
Income (loss) before income taxes | 52.2 | 137.0 | (19.8 | ) | (44.3 | ) | (20.7 | ) | ||||||||||||
Income tax (benefit) expense | (78.9 | ) | 1.4 | (65.4 | ) | (11.9 | ) | (3.0 | ) | |||||||||||
Net income (loss) | $ | 131.1 | $ | 135.6 | $ | 45.6 | $ | (32.4 | ) | $ | (17.7 | ) | ||||||||
Basic and diluted net income (loss) per common share | $ | 0.47 | $ | 0.49 | $ | 0.16 | $ | (0.12 | ) | $ | (0.06 | ) | ||||||||
Net income for the third quarter of fiscal 2018 includes the Company’s provisional SAB 118 adjustment of $60.3 million related to the Tax Cuts and Jobs Act (the “Tax Act”). Net income for the second quarter of fiscal 2018 includes the Company’s $135.8 million net gain on property dispositions and impairment losses.
F-5
2
Shares
Albertsons Companies, Inc.
Common Stock
PRELIMINARY PROSPECTUS
BofA Securities | Goldman Sachs & Co. LLC | J.P. Morgan | Citigroup |
Credit Suisse | Morgan Stanley | Wells Fargo Securities | Barclays | Deutsche Bank Securities |
BMO Capital Markets | Evercore ISI | Guggenheim Securities | Oppenheimer & Co. | RBC Capital Markets |
Telsey Advisory Group | MUFG | Academy Securities | Blaylock Van, LLC |
Until , 2020 (25 days after the date of this prospectus), all dealers that buy, sell, or trade shares of our common stock, whether or not participating in this initial public offering, may be required to deliver a prospectus. This delivery requirement is in addition to the obligation of dealers to deliver a prospectus when acting as underwriters and with respect to their unsold allotments or subscriptions.
The information in this preliminary prospectus is not complete and may be changed. These securities may not be sold until the registration statement filed with the Securities and Exchange Commission is effective. This preliminary prospectus is not an offer to sell nor does it seek an offer to buy these securities in any jurisdiction where the offer or sale is not permitted.
[Alternative Pages for Series A Preferred Stock Prospectus]
Subject to Completion, dated May 5, 2020.
Shares
Albertsons Companies, Inc.
% Series A Mandatory Convertible Preferred Stock
We are offering shares of our % Series A mandatory convertible preferred stock, $0.01 par value (“Series A preferred stock”).
Dividends on our Series A preferred stock will be payable on a cumulative basis when, as and if declared by our board of directors, or an authorized committee of our board of directors, at an annual rate of % on the liquidation preference of $ per share. We may pay declared dividends in cash or, subject to certain limitations, in common stock or any combination of cash and common stock on , , and of each year, commencing on , and to, and including, .
Unless earlier converted, each share of our Series A preferred stock will automatically convert on , 20 into between and shares of our common stock, subject to anti-dilution adjustments. The number of shares of our common stock issuable on conversion will be determined based on the average of the closing prices per share of our common stock over the 40 trading day period ending on the second trading day prior to the mandatory conversion date. At any time prior to , 20 holders may elect to convert each share of our Series A preferred stock into shares of common stock at the minimum conversion rate of shares of common stock per share of Series A preferred stock, subject to anti-dilution adjustments. If you elect to convert any shares of Series A preferred stock during a specified period beginning on the effective date of a fundamental change (as described herein), the conversion rate will be adjusted under certain circumstances and you will also be entitled to a fundamental change dividend make-whole amount (as described herein).
Concurrently with this offering, selling stockholders are also making an initial public offering of our common stock in which they are offering shares of common stock. We currently expect the public offering price of our common stock to be between $ and $ per share. In that offering, the selling stockholders have granted the underwriters of that offering an option to purchase up to an additional shares of common stock to cover over-allotments. The closing of this offering of Series A preferred stock is conditioned upon the closing of the offering of our common stock and the closing of the offering of common stock is conditioned upon the closing of this offering of Series A preferred stock.
Prior to this offering, there has been no public market for the Series A preferred stock. It is currently estimated that the initial public offering price per share will be between $ and $ . We have been approved to list our Series A preferred stock on the New York Stock Exchange, or NYSE, under the symbol “ACI.PRA.”
Investing in our Series A preferred stock involves a high degree of risk. See “Risk Factors” on page 25 to read about factors you should consider before buying shares of the common stock.
Neither the Securities and Exchange Commission nor any other regulatory body has approved or disapproved of these securities or passed upon the accuracy or adequacy of this prospectus. Any representation to the contrary is a criminal offense.
Per Share | Total | |||||||
Public offering price | $ | $ | ||||||
Underwriting discounts and commissions(1) | $ | $ | ||||||
Proceeds, before expenses, to us(1) | $ | $ | ||||||
| (1) | See “Underwriting” for additional information regarding underwriting compensation. |
The underwriters may also purchase up to an additional shares of Series A preferred stock, at the public offering price, less the underwriting discount and commissions, within 30 days from the date of this prospectus.
The underwriters expect to deliver the shares against payment on or about , 2020.
BofA Securities | Goldman Sachs & Co. LLC | J.P. Morgan | Citigroup |
Credit Suisse | Morgan Stanley | Wells Fargo Securities | Barclays | Deutsche Bank Securities |
BMO Capital Markets | RBC Capital Markets | MUFG | ||||||
The date of this prospectus is , 2020.
TABLE OF CONTENTS
vi | ||||
1 | ||||
25 | ||||
49 | ||||
51 | ||||
52 | ||||
53 | ||||
55 | ||||
56 | ||||
58 | ||||
79 | ||||
97 | ||||
108 | ||||
131 | ||||
136 | ||||
138 | ||||
142 | ||||
147 | ||||
152 | ||||
160 | ||||
164 | ||||
170 | ||||
170 | ||||
170 | ||||
F- 1 |
Until , 2020 (25 days after the date of this prospectus), all dealers that buy, sell, or trade shares of our Series A preferred stock, whether or not participating in this initial public offering, may be required to deliver a prospectus. This delivery requirement is in addition to the obligation of dealers to deliver a prospectus when acting as underwriters and with respect to their unsold allotments or subscriptions.
Unless indicated otherwise, the information included in this prospectus assumes that (i) the shares of Series A preferred stock to be sold in this offering are sold at $ per share, which is the midpoint of the estimated offering range set forth on the cover page of this prospectus and (ii) all shares offered in this offering are sold (other than pursuant to the underwriters’ option to purchase additional shares described herein).
We have not, and the underwriters have not, authorized anyone to provide any information other than that contained in this prospectus or in any free writing prospectus prepared by or on behalf of us or to which we have referred you. We and the underwriters take no responsibility for, and can provide no assurance as to the reliability of, any other information that others may give you. We and the underwriters are offering to sell, and seeking offers to buy, shares of our Series A preferred stock only in jurisdictions where offers and sales are permitted. The information in this prospectus is accurate only as of the date of this prospectus, regardless of the time of delivery of this prospectus or any sale of shares of our Series A preferred stock.
i
THE OFFERING
The summary below describes the principal terms of the Series A preferred stock. Certain of the terms and conditions described below are subject to important limitations and exceptions. Refer to the section of this prospectus entitled “Description of Series A Preferred Stock” for a more detailed description of the terms of the Series A preferred stock.
Concurrently with this offering of our Series A preferred stock, selling stockholders are offering shares of our common stock. The closing of this offering of Series A preferred stock is conditioned upon the closing of the offering of our common stock and the closing of the offering of common stock is conditioned upon the closing of this offering of Series A preferred stock.
| Securities we are offering | shares of % Series A mandatory convertible preferred stock, $0.01 par value (the “Series A preferred stock”). |
| Public offering price | $ per share of Series A preferred stock. |
| Option to purchase additional shares of Series A preferred stock | We have granted the underwriters a 30-day option to purchase up to additional shares of our Series A preferred stock to cover over-allotments at the public offering price, less the underwriting discount. |
| Dividends | % of the liquidation preference of $ per share of our Series A preferred stock per year. Dividends will accumulate from the first original issue date and, to the extent that we are legally permitted to pay dividends and our board of directors, or an authorized committee of our board of directors, declares a dividend payable with respect to our Series A preferred stock, we will pay such dividends in cash or, subject to certain limitations, in common stock or any combination of cash and common stock, as determined by us in our sole discretion, on each dividend payment date; provided that any unpaid dividends will continue to accumulate. Dividends that are declared will be payable on the dividend payment dates (as described below) to holders of record on the immediately preceding , , and (each a “record date”), whether or not such holders convert their shares, or such shares are automatically converted, after a record date and on or prior to the immediately succeeding dividend payment date. The expected dividend payable on the first dividend payment date is $ per share. Each subsequent dividend is expected to be $ per share. See “Description of Series A Preferred Stock—Dividends.” |
| If we elect to make any such payment of a declared dividend, or any portion thereof, in shares of our common stock, such shares shall be valued for such purpose at 97% of the average VWAP per share (as defined under “Description of Series A Preferred Stock—Certain Definitions”), of our common stock over the five consecutive trading day period beginning on, and including, the seventh scheduled trading day immediately preceding the applicable dividend payment date (the |
A-1
“average price”). In no event will the number of shares of our common stock delivered in connection with any declared dividend, including any declared dividend payable in connection with a conversion, exceed a number equal to the total dividend payment divided by $ , which amount represents approximately 35% of the initial price (as defined herein), subject to adjustment in a manner inversely proportional to any anti- dilution adjustment to each fixed conversion rate (such dollar amount, as adjusted, the “floor price”). To the extent that the amount of the declared dividend exceeds the product of the number of shares of common stock delivered in connection with such declared dividend and the average price, we will, if we are legally able to do so, pay such excess amount in cash.
| The initial price is $ , which equals the price at which our common stock was initially offered to the public in the concurrent offering of our common stock. |
| Dividend payment dates | , , and of each year, commencing on , 202 and to, and including, the mandatory conversion date. |
| Redemption | Our Series A preferred stock is not redeemable. |
| Mandatory conversion date | , 202 . |
| Mandatory conversion | On the mandatory conversion date, each share of our Series A preferred stock, unless previously converted, will automatically convert into shares of our common stock based on the conversion rate as described below. |
| If we declare a dividend for the dividend period ending on the mandatory conversion date, we will pay such dividend to the holders of record on the immediately preceding record date, as described above. If, prior to the mandatory conversion date, we have not declared all or any portion of the accumulated and unpaid dividends on the Series A preferred stock, the conversion rate will be adjusted so that holders receive an additional number of shares of common stock equal to the amount of accumulated and unpaid dividends that have not been declared (the “additional conversion amount”) divided by the greater of (x) the floor price and (y) 97% of the Average Price (as defined under “Description of Series A Preferred Stock—Method of Payment of Dividends”). To the extent that the additional conversion amount exceeds the product of the number of additional shares and the applicable market value, we will, if we are legally able to do so and to the extent permitted under our indebtedness, declare and pay such excess amount in cash. To the extent that we are not able to pay such excess amount in cash under applicable law and in compliance with our indebtedness, we will not have any obligation to pay such amount in cash or deliver additional shares of our common |
A-2
stock in respect of such amount, and such amount will not form part of the cumulative dividends that may be deemed to accumulate on the shares of Series A preferred stock.
| Conversion rate | The conversion rate for each share of our Series A preferred stock will be not more than shares of common stock and not less than shares of common stock, depending on the applicable market value of our common stock, as described below and subject to certain anti-dilution adjustments. |
| The “applicable market value” of our common stock is the average of the closing prices of our common stock over the 20 consecutive trading day period beginning on, and including, the 21st scheduled trading day immediately preceding the mandatory conversion date. The conversion rate will be calculated as described under “Description of Series A Preferred Stock—Mandatory Conversion,” and the following table illustrates the conversion rate per share of our Series A preferred stock, subject to certain anti-dilution adjustments. |
Applicable market value of our common stock | Conversion rate (number of shares of common stock to be received upon conversion of each share of Series A preferred stock) | |
Greater than $ | shares | |
Equal to or less than $ but greater than or equal to $ | Between $ and $ , determined by dividing $ by the applicable market value | |
Less than $ | shares |
| Early conversion at the option of the holder | At any time prior to , 202 , you may elect to convert your shares of Series A preferred stock in whole or in part at the minimum conversion rate of shares of common stock per share of Series A preferred stock as described under “Description of Series A Preferred Stock—Early Conversion at the Option of the Holder.” This minimum conversion rate is subject to certain anti-dilution adjustments. |
| If, as of the effective date of any early conversion (the “early conversion date”), we have not declared all or any portion of the accumulated and unpaid dividends for all dividend periods ending prior to such early conversion date, the conversion rate will be adjusted so that holders receive an additional number of shares of common stock equal to such amount of accumulated and unpaid dividends that have not been declared, divided by the greater of the floor price and the average VWAP per share of our common stock over the 20 consecutive Trading Day period commencing on, and including, the 21st scheduled trading day immediately preceding the early conversion date. |
A-3
| Conversion at the option of the holder upon fundamental change; fundamental change dividend make-whole amount | If a fundamental change occurs on or prior to , 202 , holders of the Series A preferred stock will have the right during the fundamental change conversion period to convert their shares of Series A preferred stock, in whole or in part (but in no event less than one share of the Series A preferred stock), into shares of our common stock at the fundamental change conversion rate. The fundamental change conversion rate will be determined based on the effective date of the fundamental change and the price paid or deemed paid per share of our common stock in such fundamental change. |
| Holders who convert their Series A preferred stock within the fundamental change conversion period will also receive a fundamental change dividend make-whole amount equal to the present value (calculated using a discount rate of % per annum) of all dividend payments on their shares of the Series A preferred stock (excluding any accumulated dividend amount) for (i) the partial dividend period, if any, from, and including, the fundamental change effective date to, but excluding, the next dividend payment date and (ii) all remaining full dividend periods from, and including, the dividend payment date following the fundamental change effective date to, but excluding, the mandatory conversion date. If we elect to pay the fundamental change dividend make-whole amount in shares of our common stock (or units of exchange property) in lieu of cash, the number of shares of our common stock (or units of exchange property) that we will deliver will equal (x) the fundamental change dividend make-whole amount, divided by |
| In addition, to the extent that the accumulated dividend amount exists as of the fundamental change effective date, holders who convert their Series A preferred stock within the fundamental change conversion period will be entitled to receive such accumulated dividend amount in cash (to the extent we are legally permitted to make such payment in cash and to the extent permitted under the terms of the documents governing our indebtedness) or shares of our common stock or any combination thereof, at our election, upon conversion. If we elect to pay the accumulated dividend amount in shares of our common stock (or units of exchange property) in lieu of cash, the number of shares of our common stock (or units of exchange property) that we will deliver will equal (x) the accumulated dividend amount, divided by |
| To the extent that the sum of the fundamental change dividend make-whole amount and accumulated dividend amount or the dollar amount of any portion thereof paid in shares of our common stock (or units of exchange property) exceeds the product of (x) the number of |
A-4
additional shares we deliver in respect thereof and (y) 97% of the fundamental change stock price, we will, if we are legally able to do so, and to the extent permitted under the terms of the documents governing our indebtedness, pay such excess amount in cash (computed to the nearest cent). Any such payment in cash may not be permitted by our then existing debt instruments, including any restricted payments covenants. To the extent that we are not able to pay such excess amount in cash under applicable law and in compliance with our indebtedness, we will not have any obligation to pay such amount in cash or deliver additional shares of our common stock in respect of such amount.
| See “Description of Series A Preferred Stock—Conversion at the Option of the Holder upon Fundamental Change; Fundamental Change Dividend Make-Whole Amount.” |
| Liquidation preference | $ per share of Series A preferred stock. |
| Voting rights | The holders of the Series A preferred stock do not have voting rights, except with respect to certain fundamental changes in the terms of the Series A preferred stock, in the case of certain dividend arrearages and except as specifically required under Delaware law. See “Description of Series A Preferred Stock—Voting Rights.” |
| Ranking | The Series A preferred stock will rank with respect to dividend rights and rights upon our liquidation, winding-up or dissolution: |
| • | senior to all of our common stock and to each other class of capital stock or series of preferred stock issued in the future unless the terms of that stock expressly provide that it ranks senior to, or on a parity with, the Series A preferred stock; |
| • | on a parity with any class of capital stock or series of preferred stock issued in the future the terms of which expressly provide that it will rank on a parity with the Series A preferred stock; |
| • | junior to each class of capital stock or series of preferred stock issued in the future the terms of which expressly provide that such preferred stock will rank senior to the Series A preferred stock; and |
| • | junior to all of our existing and future debt obligations. |
| In addition, the Series A preferred stock, with respect to dividend rights or rights upon our liquidation, winding-up or dissolution, will be structurally subordinated to existing and future indebtedness of our subsidiaries as well as the capital stock of our subsidiaries held by third parties. |
| Use of proceeds | We will not receive any proceeds from the sale of our common stock by the selling stockholders in the concurrent offering. |
A-5
| See “Use of Proceeds.” |
Lock-Up Agreements | Prior to the closing of the concurrent initial public offering, certain Pre-IPO Stockholders will deliver alock-up agreement to us. Pursuant to thelock-up agreements, for a period of six months after the closing of this offering suchPre-IPO Stockholders will agree, subject to certain exceptions, that they will not offer, sell, contract to sell, pledge, grant any option to purchase, make any short sale or otherwise dispose of any shares of common stock or any options or warrants to purchase common stock, or any securities convertible into, exchangeable for or that represent the right to receive common stock, owned by them (whether directly or by means of beneficial ownership) immediately prior to the closing of this offering. Thereafter, suchPre-IPO Stockholders will be permitted to sell shares of common stock subject to certain restrictions. See “Certain Relationships and Related PartyTransactions—Lock-Up Agreements.” |
| Concurrent common stock offering | Concurrently with this offering of Series A preferred stock, selling stockholders are making an initial public offering of shares of our common stock. In that offering, the selling stockholders have granted the underwriters of that offering a 30-day option to purchase up to an additional shares of common stock to cover over-allotments. The closing of this offering of Series A preferred stock is conditioned upon the closing of the offering of our common stock and the closing of the offering of common stock is conditioned upon the closing of this offering of Series A preferred stock. |
| Risk factors | You should carefully read and consider the information set forth in the section entitled “Risk Factors” beginning on page 25, together with all of the other information set forth in this prospectus, before deciding whether to invest in our Series A preferred stock. |
| Proposed NYSE trading symbol | “ACI.PRA.” |
A-6
Unless otherwise indicated, all information in this prospectus excludes up to shares of Series A preferred stock that we may sell if the underwriters exercise in full their option to purchase additional shares of our Series A preferred stock in this offering and up to shares of our common stock that may be sold by the selling stockholders if the underwriters exercise in full their option to purchase additional shares of our common stock from the selling stockholders in the concurrent initial public offering. The number of shares of common stock that will be outstanding after this offering also excludes up to shares of our common stock (up to shares if the underwriters in this offering exercise their over-allotment option in full), in each case subject to anti-dilution, make-whole and other adjustments, that would be issuable upon conversion of shares of Series A preferred stock.
A-7
Risks Related to this Offering and Owning Our Series A Preferred Stock and Common Stock
You will bear the risk of a decline in the market price of our common stock between the pricing date for the Series A preferred stock and the mandatory conversion date.
The number of shares of our common stock that you will receive upon mandatory conversion is not fixed, but instead will depend on the applicable market value, which is the average of the closing prices of our common stock over the 20 consecutive trading day period beginning on, and including, the 21st scheduled trading day immediately preceding the mandatory conversion date. The aggregate market value of the shares of our common stock that you would receive upon mandatory conversion may be less than the aggregate liquidation preference of your shares of Series A preferred stock. Specifically, if the applicable market value of our common stock is less than the initial price of $ , the market value of the shares of our common stock that you would receive upon mandatory conversion of each Series A preferred stock will be less than the $ liquidation preference, and an investment in the Series A preferred stock would result in a loss. Accordingly, you will bear the risk of a decline in the market price of our common stock. Any such decline could be substantial.
The opportunity for equity appreciation provided by your investment in the Series A preferred stock is less than that provided by a direct investment in our common stock.
The market value of each share of our common stock that you would receive upon mandatory conversion of each share of our Series A preferred stock on the mandatory conversion date will only exceed the liquidation preference of $ per share of Series A preferred stock if the applicable market value of our common stock exceeds the threshold appreciation price of $ . The threshold appreciation price represents an appreciation of approximately % over the initial price. In this event, you would receive on the mandatory conversion date approximately % (which percentage is equal to the initial price divided by the threshold appreciation price) of the value of our common stock that you would have received if you had made a direct investment in our common stock on the date of this prospectus. This means that the opportunity for equity appreciation provided by an investment in our Series A preferred stock is less than that provided by a direct investment in shares of our common stock.
In addition, if the market value of our common stock appreciates and the applicable market value of our common stock is equal to or greater than the initial price but less than or equal to the threshold appreciation price, the aggregate market value of the shares of our common stock that you would receive upon mandatory conversion will only be equal to the aggregate liquidation preference of the Series A preferred stock, and you will realize no equity appreciation on our common stock.
The market price of our common stock, which may fluctuate significantly, may adversely affect the market price for our Series A preferred stock.
We expect that generally the market price of our common stock will affect the market price of our Series A preferred stock more than any other single factor. This may result in greater volatility in the market price of the Series A preferred stock than would be expected for nonconvertible preferred stock. The market price of our common stock will likely fluctuate in response to a number of factors, including our financial condition, operating results and prospects, as well as economic, financial and other factors, such as prevailing interest rates, interest rate volatility, changes in our industry and competitors and government regulations, many of which are beyond our control. For more information regarding such factors, see the section of this prospectus above entitled “—Risks Related to Our Business and Industry.”
In addition, we expect that the market price of the Series A preferred stock will be influenced by yield and interest rates in the capital markets, the time remaining to the mandatory conversion date, our creditworthiness and the occurrence of certain events affecting us that do not require an adjustment to the conversion rate.
A-8
Fluctuations in yield rates in particular may give rise to arbitrage opportunities based upon changes in the relative values of the Series A preferred stock and our common stock. Any such arbitrage could, in turn, affect the market prices of our common stock and the Series A preferred stock.
The adjustment to the conversion rate and the payment of the Fundamental Change Dividend Make-Whole Amount upon the occurrence of certain Fundamental Changes may not adequately compensate you for the lost option value and lost dividends as a result of early conversion upon a Fundamental Change.
If a Fundamental Change (as defined in “Description of Series A Preferred Stock—Conversion at the Option of the Holder upon Fundamental Change; Fundamental Change Dividend Make-Whole Amount”) occurs on or prior to the Mandatory Conversion Date, holders will be entitled to convert their Series A preferred stock during the Fundamental Change Conversion Period at the Fundamental Change Conversion Rate (in each case as defined in “Description of Series A Preferred Stock—Conversion at the Option of the Holder upon Fundamental Change; Fundamental Change Dividend Make-Whole Amount”). The Fundamental Change Conversion Rate represents an adjustment to the conversion rate otherwise applicable unless the Fundamental Change Stock Price (as defined in “Description of Series A Preferred Stock—Conversion at the Option of the Holder upon Fundamental Change; Fundamental Change Dividend Make-Whole Amount”) is less than $ or above $ (in each case, subject to adjustment). In addition, with respect to shares of Series A preferred stock converted during the Fundamental Change Conversion Period, you will also receive, among other consideration, a Fundamental Change Dividend Make-Whole Amount (as defined in “Description of Series A Preferred Stock—Conversion at the Option of the Holder upon Fundamental Change; Fundamental Change Dividend Make-Whole Amount”). We may elect to pay the Fundamental Change Make-Whole Amount by delivery of common stock, subject to the limitations described in “Description of Series A Preferred Stock—Conversion at the Option of the Holder upon Fundamental Change; Fundamental Change Dividend Make-Whole Amount.” If these limitations to the delivery in shares of common stock in payment of the Fundamental Change Dividend Make-Whole Amount are reached, we will pay the shortfall in cash to the extent we are legally permitted to do so and to the extent permitted under the terms of the documents governing our indebtedness. To the extent we are not permitted to pay such shortfall in cash under applicable law and in compliance with our indebtedness, we will not have any obligation to pay such amount in cash or deliver additional shares of our common stock in respect of such amount.
Although this adjustment to the conversion rate and the payment of the Fundamental Change Dividend Make-Whole Amount are designed to compensate you for the lost option value of the Series A preferred stock and lost dividends as a result of a Fundamental Change, they are only an approximation of such lost value and lost dividends and may not adequately compensate you for your actual loss. Furthermore, our obligation to adjust the conversion rate in connection with a Fundamental Change and pay the Fundamental Change Dividend Make-Whole Amount (whether in cash or shares of our common stock or any combination thereof) could possibly be considered a penalty under state law, in which case the enforceability thereof would be subject to general principles of reasonableness and equitable remedies and therefore may not be enforceable in whole or in part.
The conversion rate of the Series A preferred stock may not be adjusted for all dilutive events that may adversely affect the market price of the Series A preferred stock or the common stock issuable upon conversion of the Series A preferred stock.
The number of shares of our common stock that you are entitled to receive upon conversion of the Series A preferred stock is subject to adjustment only for share splits and combinations, share dividends and specified other transactions. See the section of this prospectus entitled “Description of Series A Preferred Stock—Anti-dilution Adjustments” for further discussion of anti-dilution adjustments. However, other events, such as employee stock option grants or offerings of our common stock or securities convertible into common stock (other than those set forth in the section of this prospectus entitled “Description of Series A Preferred Stock—Anti-dilution Adjustments”) for cash or in connection with acquisitions, which may adversely affect the market price of our common stock, may not result in any adjustment. Further, if any of these other events adversely
A-9
affects the market price of our common stock, it may also adversely affect the market price of the Series A preferred stock. In addition, the terms of our Series A preferred stock do not restrict our ability to offer common stock or securities convertible into common stock in the future or to engage in other transactions that could dilute our common stock. We have no obligation to consider the interests of the holders of our Series A preferred stock in engaging in any such offering or transaction.
Purchasers of our Series A preferred stock may be adversely affected upon the issuance of a new series of preferred stock ranking senior to, or a new series of preferred stock ranking equally with, the Series A preferred stock sold in this offering.
The terms of our Series A preferred stock will not restrict our ability to offer a new series of preferred stock that ranks equally with, our Series A preferred stock in the future. We have no obligation to consider the interests of the holders of our Series A preferred stock in engaging in any such offering or transaction.
You will have no rights with respect to our common stock until you convert your Series A preferred stock, but you may be adversely affected by certain changes made with respect to our common stock.
You will have no rights with respect to our common stock, including voting rights, rights to respond to common stock tender offers, if any, and rights to receive dividends or other distributions on our common stock, if any (other than through a conversion rate adjustment), prior to the conversion date with respect to a conversion of your Series A preferred stock, but your investment in our Series A preferred stock may be negatively affected by these events. Upon conversion, you will be entitled to exercise the rights of a holder of common stock only as to matters for which the record date occurs after the conversion date. For example, in the event that an amendment is proposed to our amended and restated certificate of incorporation (“certificate of incorporation”) or our amended and restated bylaws (“bylaws”), as amended requiring stockholder approval and the record date for determining the stockholders of record entitled to vote on the amendment occurs prior to the conversion date, you will not be entitled to vote on the amendment, although you will nevertheless be subject to any changes in the powers, preferences or special rights of our common stock.
You will have no voting rights except under limited circumstances.
You do not have voting rights, except with respect to certain fundamental changes in the terms of the Series A preferred stock, in the case of certain dividend arrearages and except as specifically required by Delaware law. You will have no right to vote for any members of our board of directors except in the case of certain dividend arrearages. If dividends on any shares of the Series A preferred stock have not been declared and paid for the equivalent of six or more dividend periods, whether or not for consecutive dividend periods, the holders of shares of Series A preferred stock, voting together as a single class with holders of any and all other classes or series of our preferred stock ranking equally with the Series A preferred stock either as to dividends or the distribution of assets upon liquidation, dissolution or winding up and having similar voting rights, will be entitled to vote for the election of a total of two additional members of our board of directors, subject to the terms and limitations described in the section of this prospectus entitled “Description of Series A Preferred Stock—Voting Rights.”
Our Series A preferred stock will rank junior to all of our and our subsidiaries’ liabilities, as well as the capital stock of our subsidiaries held by third parties, in the event of a bankruptcy, liquidation or winding up of our or our subsidiaries’ assets.
In the event of a bankruptcy, liquidation or winding up, our assets will be available to pay obligations on our Series A preferred stock only after all of our liabilities have been paid. In addition, our Series A preferred stock will effectively rank junior to all existing and future liabilities of our subsidiaries, as well as the capital stock of our subsidiaries held by third parties. Your rights to participate in the assets of our subsidiaries upon any liquidation or reorganization of any subsidiary will rank junior to the prior claims of that subsidiary’s creditors
A-10
and third party equity holders. In the event of a bankruptcy, liquidation or winding up, there may not be sufficient assets remaining, after paying our and our subsidiaries’ liabilities, to pay amounts due on any or all of our Series A preferred stock then outstanding.
You may be subject to tax upon an adjustment to the conversion rate of the Series A preferred stock even though you do not receive a corresponding cash distribution.
The conversion rate of the Series A preferred stock is subject to adjustment in certain circumstances. Refer to the section of this prospectus entitled “Description of Series A Preferred Stock—Anti-dilution Adjustments.” If, as a result of an adjustment (or failure to make an adjustment), your proportionate interest in our assets or earnings and profits is increased, you may be deemed to have received for U.S. federal income tax purposes a taxable dividend without the receipt of any cash. If you are a
non-U.S.
holder (as defined in the section of this prospectus entitled “Material U.S. Federal Income Tax Consequences to Holders of Our Series A Mandatory Convertible Preferred Stock”), such deemed dividend generally will be subject to U.S. federal withholding tax (currently at a 30% rate, or such lower rate as may be specified by an applicable treaty), which may be set off against subsequent payments on the Series A preferred stock. Refer to the section of this prospectus entitled “Material U.S. Federal Income Tax Consequences to Holders of Our Series A Mandatory Convertible Preferred Stock” for a further discussion of federal tax implications fornon-U.S.
holders.An active trading market for the Series A preferred stock does not exist and may not develop.
The Series A preferred stock is a new issue of securities with no established trading market. We have been approved to list our Series A preferred stock on the NYSE. Listing of the Series A preferred stock on the NYSE does not guarantee that a trading market for the Series A preferred stock will develop or, if a trading market for the Series A preferred stock does develop, the depth or liquidity of that market or the ability of the holders to sell the Series A preferred stock.
The Series A preferred stock may adversely affect the market price of our common stock.
The market price of our common stock is likely to be influenced by the Series A preferred stock. For example, the market price of our common stock could become more volatile and could be depressed by:
| • | investors’ anticipation of the potential resale in the market of a substantial number of additional shares of our common stock received upon conversion of the Series A preferred stock; |
| • | possible sales of our common stock by investors who view the Series A preferred stock as a more attractive means of equity participation in us than owning shares of our common stock; and |
| • | hedging or arbitrage trading activity that may develop involving the Series A preferred stock and our common stock. |
Recent regulatory actions may adversely affect the trading price and liquidity of the Series A preferred stock.
Investors in, and potential purchasers of, the Series A preferred stock who employ, or seek to employ, a convertible arbitrage strategy with respect to the Series A preferred stock may be adversely impacted by regulatory developments that may limit or restrict such a strategy. The SEC and other regulatory and self-regulatory authorities have implemented various rules and may adopt additional rules in the future that restrict and otherwise regulate short selling and
over-the-counter
swaps and security-based swaps, which restrictions and regulations may adversely affect the ability of investors in, or potential purchasers of, the Series A preferred stock to conduct a convertible arbitrage strategy with respect to the Series A preferred stock. This could, in turn, adversely affect the trading price and liquidity of the Series A preferred stock.A-11
If a substantial number of shares becomes available for sale and are sold in a short period of time, the market price of our common stock could decline.
If our
Pre-IPO
Stockholders sell substantial amounts of our common stock in the public market following the concurrent initial public offering of common stock, the market price of our common stock could decrease. The perception in the public market that ourPre-IPO
Stockholders might sell shares of common stock could also create a perceived overhang and depress our market price. Upon completion of the concurrent initial public offering of common stock, we will have shares of common stock outstanding of which shares will be held by ourPre-IPO
Stockholders (assuming that the underwriters do not exercise their option to purchase additional shares from the selling stockholders). Prior to the concurrent initial public offering of common stock, we, our executive officers and directors and each otherPre-IPO
Stockholder and each other Pre-IPO Stockholder (other than certain Pre-IPO Stockholders that each own less than an aggregate of shares of common stock) will have agreed with the underwriters to a“lock-up”
period, meaning that such parties may not, subject to certain exceptions, sell any of their existing shares of our common stock without the prior written consent of representatives of the underwriters for at least days after the date of this prospectus. Thereafter, suchPre-IPO
Stockholders will be permitted to sell shares of common stock subject to certain restrictions, including the restrictions described in “Certain Relationships and Related PartyTransactions—Lock-Up
Agreements.” Pursuant to these agreements, among other exceptions, we may enter into an agreement providing for the issuance of our common stock in connection with the acquisition, merger or joint venture with another publicly traded entity during the180-day
restricted period after the date of this prospectus. In addition, all of ourPre-IPO
Stockholders and independent directors will be subject to the holding period requirement of Rule 144 (“Rule 144”) under the Securities Act, as described in “Shares Eligible for Future Sale.” When thelock-up
agreements expire, these shares will become eligible for sale, in some cases subject to the requirements of Rule 144. The market price for shares of our common stock may drop when the restrictions on resale by ourPre-IPO
Stockholders and independent directors lapse.Further, if this offering is completed, up to shares of common stock (or shares of common stock if the underwriters in this offering exercise their over-allotment option in full), in each case subject to anti-dilution, make-whole and other adjustments, will be issuable upon conversion of the shares of Series A preferred stock. We may also choose to pay dividends on the Series A preferred stock in the form of shares of our common stock, which would be based on the volume weighted average price per share of our common stock over a certain period, subject to certain limitations set forth in the certificate of designations relating to the Series A preferred stock. See “Description of Series A Preferred Stock.”
In addition, our Sponsors will have substantial demand and incidental registration rights, as described in “Certain Relationships and Related Party Transactions—Registration Rights Agreement.” We also intend to file one or more registration statements on Form
S-8
under the Securities Act to register shares of our common stock or securities convertible into or exchangeable for shares of our common stock issued pursuant to our equity plans. Any such FormS-8
registration statements will automatically become effective upon filing. Accordingly, shares registered under such registration statements will be available for sale in the open market. A decline in the market price of our common stock might impede our ability to raise capital through the issuance of additional shares of our common stock or other equity securities.We are controlled by our Sponsors and they may have conflicts of interest with other stockholders in the future.
After the completion of the concurrent initial public offering of common stock, and assuming an offering of shares by the selling stockholders before giving effect to the Repurchase, our Sponsors will control in the aggregate approximately % of our common stock (or % if the underwriters exercise in full their option to purchase additional shares). Assuming shares (based upon the midpoint of the estimated offering range set forth on the cover page of this prospectus) of outstanding common stock are repurchased by us using the net proceeds from this offering (or shares of common stock if the underwriters in this offering exercise their over-allotment option in full), our Sponsors will control in the aggregate approximately
A-12
% of our common stock (or % if the underwriters in this offering exercise their over-allotment option in full). As a result, our Sponsors will continue to be able to control the election of our directors, determine our corporate and management policies and determine, without the consent of our other stockholders, the outcome of any corporate transaction or other matter submitted to our stockholders for approval, including potential mergers or acquisitions, asset sales and other significant corporate transactions. Four of our 12 directors are either employees of, or advisors to, members of our Sponsors, as described under “Management.” Our Sponsors will also have sufficient voting power to amend our organizational documents. The interests of our Sponsors may not coincide with the interests of other holders of our common stock. Additionally, our Sponsors are in the business of making investments in companies and may, from time to time, acquire and hold interests in businesses that compete directly or indirectly with us. Our Sponsors may also pursue, for their own account, acquisition opportunities that may be complementary to our business, and as a result, those acquisition opportunities may not be available to us. So long as our Sponsors continue to own a significant amount of the outstanding shares of our common stock, our Sponsors will continue to be able to strongly influence or effectively control our decisions, including potential mergers or acquisitions, asset sales and other significant corporate transactions.
We are a “controlled company” within the meaning of the NYSE rules and, as a result, will qualify for, and intend to rely on, exemptions from certain corporate governance requirements. You will not have the same protections afforded to stockholders of companies that are subject to such requirements.
Upon completion of the concurrent initial public offering of common stock, our Sponsors, as a group, will control a majority of our outstanding common stock. As a result, we are a “controlled company” within the meaning of the NYSE rules. Under the NYSE rules, a company of which more than 50% of the voting power is held by an individual, group or another company is a “controlled company” and may elect not to comply with certain corporate governance requirements, including:
| • | the requirement that a majority of the board of directors consist of independent directors; |
| • | the requirement that we have a nominating and corporate governance committee that is composed entirely of independent directors with a written charter addressing the committee’s purpose and responsibilities; |
| • | the requirement that we have a compensation committee that is composed entirely of independent directors with a written charter addressing the committee’s purpose and responsibilities; and |
| • | the requirement for an annual performance evaluation of the nominating and corporate governance and compensation committees. |
Following the concurrent initial public offering of common stock, we intend to utilize these exemptions. As a result, we will not have a majority of independent directors nor will our nominating and corporate governance and compensation committees consist entirely of independent directors. Accordingly, you will not have the same protections afforded to stockholders of companies that are subject to all of the NYSE corporate governance requirements.
Certain rights of the holders of the Series A preferred stock, if issued, could delay or prevent an otherwise beneficial takeover or takeover attempt of the Company.
Certain rights of the holders of the Series A preferred stock could make it more difficult or more expensive for a third party to acquire us. For example, if a fundamental change were to occur on or prior to , 20 , holders of the Series A preferred stock, if issued, may have the right to convert their Series A preferred stock, in whole or in part, at an increased conversion rate and will also be entitled to receive a make-whole amount equal to the present value of all remaining dividend payments on their Series A preferred stock as described in the certificate of designations governing the Series A preferred stock. These features of the Series A preferred stock could increase the cost of acquiring us or otherwise discourage a third party from acquiring us or removing incumbent management.
A-13
Provisions in our charter documents, certain agreements governing our indebtedness, the Stockholders’ Agreement and Delaware law could make an acquisition of the Company more difficult and may prevent attempts by our stockholders to replace or remove our current management, even if beneficial to our stockholders.
Provisions in our certificate of incorporation and our bylaws may discourage, delay or prevent a merger, acquisition or other change in control that some stockholders may consider favorable, including transactions in which you might otherwise receive a premium for your shares of our common stock. These provisions could also limit the price that investors might be willing to pay in the future for shares of our common stock, possibly depressing the market price of our common stock.
In addition, these provisions may frustrate or prevent any attempts by our stockholders to replace members of our board of directors. Because our board of directors is responsible for appointing the members of our management team, these provisions could in turn affect any attempt by our stockholders to replace members of our management team. Examples of such provisions are as follows:
| • | from and after such date that our Sponsors and their respective Affiliates (as defined in Rule 12b-2 of the Exchange Act), or any person who is an express assignee or designee of their respective rights under our certificate of incorporation (and such assignee’s or designee’s Affiliates) ceases to own, in the aggregate, at least 50% of the then-outstanding shares of our common stock (the “50% Trigger Date”), the authorized number of our directors may be increased or decreased only by the affirmative vote oftwo-thirds of the then-outstanding shares of our common stock or by resolution of our board of directors; |
| • | prior to the 50% Trigger Date, only our board of directors and the Sponsors are expressly authorized to make, alter or repeal our bylaws and, from and after the 50% Trigger Date, our stockholders may only amend our bylaws with the approval of at least two-thirds of all of the outstanding shares of our capital stock entitled to vote; |
| • | from and after the 50% Trigger Date, the manner in which stockholders can remove directors from the board will be limited; |
| • | from and after the 50% Trigger Date, stockholder actions must be effected at a duly called stockholder meeting and actions by our stockholders by written consent will be prohibited; |
| • | from and after such date that our Sponsors and their respective Affiliates (or any person who is an express assignee or designee of our Sponsors’ respective rights under our certificate of incorporation (and such assignee’s or designee’s Affiliates)) ceases to own, in the aggregate, at least 35% of the then-outstanding shares of our common stock (the “35% Trigger Date”), advance notice requirements for stockholder proposals that can be acted on at stockholder meetings and nominations to our board of directors will be established; |
| • | limits on who may call stockholder meetings; |
| • | requirements on any stockholder (or group of stockholders acting in concert), other than, prior to the 35% Trigger Date, the Sponsors, who seeks to transact business at a meeting or nominate directors for election to submit a list of derivative interests in any of our company’s securities, including any short interests and synthetic equity interests held by such proposing stockholder; |
| • | requirements on any stockholder (or group of stockholders acting in concert) who seeks to nominate directors for election to submit a list of “related party transactions” with the proposed nominee(s) (as if such nominating person were a registrant pursuant to Item 404 of Regulation S-K, and the proposed nominee was an executive officer or director of the “registrant”); and |
| • | our board of directors is authorized to issue preferred stock without stockholder approval, which could be used to institute a “poison pill” that would work to dilute the stock ownership of a potential hostile acquiror, effectively preventing acquisitions that have not been approved by our board of directors. |
A-14
Our certificate of incorporation authorizes our board of directors to issue up to 100,000,000 shares of preferred stock. The preferred stock may be issued in one or more series, the terms of which may be determined by our board of directors at the time of issuance or fixed by resolution without further action by the stockholders. These terms may include voting rights, preferences as to dividends and liquidation, conversion rights, redemption rights, and sinking fund provisions. The issuance of preferred stock could diminish the rights of holders of our common stock, and therefore could reduce the value of our common stock. In addition, specific rights granted to holders of preferred stock could be used to restrict our ability to merge with, or sell assets to, a third party. The ability of our board of directors to issue preferred stock could delay, discourage, prevent, or make it more difficult or costly to acquire or effect a change in control, thereby preserving the current stockholders’ control.
Our certificate of incorporation designates the Court of Chancery of the State of Delaware as the sole and exclusive forum for certain types of actions and proceedings that may be initiated by our stockholders, which could limit our stockholders’ ability to obtain a favorable judicial forum for disputes with us or our directors, officers or other employees.
Our certificate of incorporation provides that, unless we consent in writing to the selection of an alternative forum, the Court of Chancery of the State of Delaware will, to the fullest extent permitted by law, be the exclusive forum for: (a) any derivative action or proceeding brought on our behalf; (b) any action asserting a claim for breach of a fiduciary duty owed by any of our directors, officers, employees or agents to us or our stockholders; (c) any action asserting a claim arising pursuant to any provision of the Delaware General Corporation Law (the “DGCL”), our certificate of incorporation or our bylaws; or (d) any action asserting a claim governed by the internal affairs doctrine. Any person or entity purchasing or otherwise acquiring any interest in shares of our capital stock is deemed to have received notice of and consented to the foregoing provisions. This choice of forum provision may limit a stockholder’s ability to bring a claim in a judicial forum that it finds more favorable for disputes with us or our directors, officers or other employees, which may discourage such lawsuits against us and our directors, officers and employees. Alternatively, if a court were to find this choice of forum provision inapplicable to, or unenforceable in respect of, one or more of the specified types of actions or proceedings, we may incur additional costs associated with resolving such matters in other jurisdictions, which could adversely affect our business, financial condition or results of operations. Because the applicability of the exclusive forum provision is limited to the extent permitted by law, we do not intend that the exclusive forum provision would apply to suits brought to enforce any duty or liability created by the Exchange Act or any other claim for which the federal courts have exclusive jurisdiction. Additionally, unless we consent in writing to the selection of an alternative forum, the federal district courts of the United States of America shall be the exclusive forum for the resolution of any action asserting a cause of action arising under the Securities Act. Investors cannot waive compliance with the federal securities laws and the rules and regulations thereunder. Although we believe this provision benefits us by providing increased consistency in the application of Delaware law in the types of lawsuits to which it applies, the provision may have the effect of discouraging lawsuits against our directors and officers.
If equity research analysts do not publish research or reports about our business or if they issue unfavorable commentary or downgrade our common stock, the market price of our common stock could decline.
The trading market for our common stock likely will be influenced by the research and reports that equity and debt research analysts publish about the industry, us and our business. The market price of our common stock could decline if one or more securities analysts downgrade our shares or if those analysts issue a sell recommendation or other unfavorable commentary or cease publishing reports about us or our business. If one or more of the analysts who elect to cover us downgrade our shares, the market price of our common stock would likely decline.
A-15
Our ability to pay dividends to our stockholders is restricted by applicable laws and regulations and requirements under certain of our securities and debt agreements, including the ABL Facility and ACI Notes.
Holders of our common stock are only entitled to receive such cash dividends as our board, in its sole discretion, may declare out of funds legally available for such payments. Effective fiscal 2020, we have established a dividend policy pursuant to which we intend to pay a dividend on our common stock in an amount of $ per share, starting with the first full quarter following completion of the concurrent initial public offering of common stock. Our board of directors may change or eliminate the payment of future dividends to our common stockholders at its discretion, without notice to our stockholders. Any future determination relating to our dividend policy will be dependent on a variety of factors, including our financial condition, earnings, legal requirements, our general liquidity needs, and other factors that our board deems relevant. Our ability to declare and pay dividends to our stockholders is subject to certain laws, regulations, and policies, including minimum capital requirements and, as a Delaware corporation, we are subject to certain restrictions on dividends under the DGCL. Under the DGCL, our board of directors may not authorize payment of a dividend unless it is either paid out of our surplus, as calculated in accordance with the DGCL, or if we do not have a surplus, it is paid out of our net profits for the fiscal year in which the dividend is declared and/or the preceding fiscal year. In addition, so long as any shares of our Series A preferred stock remain outstanding, no dividend or distribution may be declared or paid on our common stock unless all accrued and unpaid dividends have been paid on our Series A preferred stock, subject to exceptions, such as dividends on our common stock payable solely in shares of our common stock. Finally, our ability to pay dividends to our stockholders may be limited by covenants in any financing arrangements that we are currently a party, including the ABL Facility and ACI Notes, to or may enter into in the future. As a consequence of these various limitations and restrictions, we may not be able to make, or may have to reduce or eliminate at any time, the payment of dividends on our common stock. See “Description of Indebtedness.” Any change in the level of our dividends or the suspension of the payment thereof could have a material adverse effect on the market price of our common stock. See “Dividend Policy.”
You may be diluted by the future issuance of additional common stock in connection with our equity incentive plans, acquisitions or otherwise.
After the concurrent initial public offering of common stock, we will have shares of common stock authorized but unissued under our certificate of incorporation. We will be authorized to issue these shares of common stock and options, rights, warrants and appreciation rights relating to common stock for consideration and on terms and conditions established by our board of directors in its sole discretion, whether in connection with acquisitions or otherwise. We have reserved up to % of the shares of our common stock that will be available as of the consummation of the concurrent initial public offering of common stock for issuance under existing restricted stock unit awards and for future awards that may be issued under our Phantom Unit Plan (as defined herein). See “Executive Compensation—Incentive Plans” and “Shares Eligible for Future
Sale—S-8
Registration Statement.” Any common stock that we issue, including under our Phantom Unit Plan or other equity incentive plans that we may adopt in the future, would dilute the percentage ownership held by the investors who purchase common stock in the concurrent initial public offering of common stock.In the future, we may also issue our securities, including shares of our common stock, in connection with investments or acquisitions. We regularly evaluate potential acquisition opportunities, including ones that would be significant to us. The amount of shares of our common stock issued in connection with an investment or acquisition could constitute a material portion of our then-outstanding shares of common stock. Any issuance of additional securities in connection with investments or acquisitions may result in additional dilution to you.
A-16
DESCRIPTION OF SERIES A PREFERRED STOCK
The following is a summary of certain provisions of the certificate of designations for our % Series A mandatory convertible junior preferred stock, $0.01 par value, which we refer to as our Series A preferred stock. A copy of the certificate of designations and the form of Series A preferred stock share certificate are available upon request from us at the address set forth in the section of this prospectus entitled “Where You Can Find More Information.” The following summary of the terms of the Series A preferred stock is subject to, and qualified in its entirety by reference to, the provisions of the certificate of designations for our Series A preferred stock.
As used in this section, the terms “ACI,” “us,” “we” or “our” refer to Albertsons Companies, Inc. and not any of its subsidiaries.
General
Under our certificate of incorporation, our board of directors is authorized, without further stockholder action, to issue up to 100,000,000 shares of preferred stock, par value $0.01 per share, in one or more series, with such voting powers or without voting powers, and with such designations, and having such relative preferences, participating, optional or other special rights, and qualifications, limitations or restrictions, as shall be set forth in the resolutions providing therefor. As of the date of this prospectus, shares were designated Series A preferred stock and no shares of our preferred stock was outstanding. Upon completion of this offering, there will be shares of our Series A preferred stock outstanding (or shares if the underwriters in the offering of Series A preferred stock exercise their over-allotment option in full), which will be convertible into up to shares of our common stock (or up to shares if the underwriters in the offering of Series A preferred stock exercise their over-allotment option in full), in each case, assuming mandatory conversion based on an applicable market value of our common stock equal to the assumed initial public offering price of $ per share of our common stock, which is the midpoint of the estimated offering price range for the concurrent initial public offering of our common stock, subject to anti-dilution, make-whole and other adjustments or any shares of our common stock that may be issued in payment of a dividend, fundamental change dividend make-whole amount or accumulated dividend amount. No other shares of preferred stock will be issued or outstanding immediately after this offering. We expect to use the net proceeds from this offering for the Repurchase. The Repurchase is conditioned upon the consummation of this offering and the receipt of funds therefrom. See “Use of Proceeds.”
When issued, the Series A preferred stock and any common stock issued upon the conversion of the Series A preferred stock will be fully paid and nonassessable. The holders of the Series A preferred stock will have no preemptive or preferential rights to purchase or subscribe to stock, obligations, warrants or other securities of the Company of any class. American Stock Transfer & Trust Company, LLC will serve as the transfer agent and registrar of our common stock and will serve as transfer agent, registrar and conversion and dividend disbursing agent for the Series A preferred stock.
Ranking
The Series A preferred stock, with respect to dividend rights and/or distribution rights upon our liquidation,
winding-up
or dissolution, as applicable, will rank:| • | senior to (i) our common stock and (ii) each other class or series of our capital stock established after the first original issue date of shares of the Series A preferred stock (which we refer to as the “Initial Issue Date”) the terms of which do not expressly provide that such class or series ranks (x) senior to the Series A preferred stock as to dividend rights or distribution rights upon our liquidation, winding-up or dissolution or (y) on parity with the Series A preferred stock as to dividend rights or distribution rights |
A-17
| upon our liquidation, winding-up or dissolution (we refer to our common stock and all such other classes or series of capital stock, collectively as “Junior Stock”); |
| • | on parity with any class or series of our capital stock established after the Initial Issue Date the terms of which expressly provide that such class or series will rank on parity with the Series A preferred stock as to dividend rights and distribution rights upon our liquidation, winding-up or dissolution (which we refer to collectively as “Parity Stock”); |
| • | junior to each class or series of our capital stock established after the Initial Issue Date the terms of which expressly provide that such class or series will rank senior to the Series A preferred stock as to dividend rights or distribution rights upon our liquidation, winding-up or dissolution (which we refer to collectively as “Senior Stock”); and |
| • | junior to our existing and future indebtedness and other liabilities. |
In addition, with respect to dividend rights and distribution rights upon our liquidation,
winding-up
or dissolution, the Series A preferred stock will be structurally subordinated to any existing and future indebtedness and other liabilities of each of our subsidiaries.Listing
We have been approved to list our common stock and our Series A preferred stock on the NYSE under the symbols “ACI” and “ACI.PRA,” respectively. However, there can be no assurance that the Series A preferred stock will be listed, and if listed, that it will continue to be listed. Listing the Series A preferred stock on the NYSE does not guarantee that a trading market will develop or, if a trading market does develop, the depth or liquidity of that market or the ability of holders to sell their Series A preferred stock easily.
Dividends
Subject to the rights of holders of any class or series of any Senior Stock, holders of the Series A preferred stock will be entitled to receive, when, as and if declared by our board of directors, or an authorized committee thereof, out of funds legally available for payment, in the case of dividends paid in cash, and shares of common stock legally permitted to be issued, in the case of dividends paid in shares of common stock, cumulative dividends at the rate per annum of % of the Liquidation Preference of $ per share of the Series A preferred stock (equivalent to $ per annum per share), payable in cash, by delivery of shares of our common stock or through any combination of cash and shares of our common stock, as determined by us in our sole discretion (subject to the limitations described below). See “—Method of Payment of Dividends.” If declared, dividends on the Series A preferred stock will be payable quarterly on , , and of each year to, and including, , 202 , commencing on , 202 (each, a “Dividend Payment Date”), at such annual rate, and dividends shall accumulate from the most recent date as to which dividends shall have been paid or, if no dividends have been paid, from the Initial Issue Date of the Series A preferred stock, whether or not in any dividend period or periods there have been funds legally available or shares of common stock legally permitted for the payment of such dividends. If declared, dividends will be payable on the relevant Dividend Payment Date to holders of record of the Series A preferred stock as they appear on our stock register at the Close of Business on , , and , as the case may be, immediately preceding the relevant Dividend Payment Date (each, a “Regular Record Date”), whether or not such holders early convert their shares, or such shares are automatically converted, after a Regular Record Date and on or prior to the immediately succeeding Dividend Payment Date; provided that the Regular Record Date for any such dividend shall not precede the date on which such dividend was so declared. These Regular Record Dates will apply regardless of whether a particular Regular Record Date is a Business Day. A “Business Day” means any day other than a Saturday or Sunday or any other day on which commercial banks in New York City are authorized or required by law or executive order to close. If a Dividend Payment Date is not a Business Day, payment will be made on the next succeeding Business Day, without any interest or other payment in lieu of interest accruing with respect to this delay.
A-18
A full dividend period is the period from and including a Dividend Payment Date to, but excluding, the next Dividend Payment Date, except that the initial dividend period will commence on, and include, the Initial Issue Date of the Series A preferred stock and will end on and exclude the , 202 Dividend Payment Date. The amount of dividends payable on each share of Series A preferred stock for each full dividend period (after the initial dividend period) will be computed by dividing the annual dividend rate by four. Dividends payable on the Series A preferred stock for the initial dividend period and any other partial dividend period will be computed based upon the actual number of days elapsed during such period over a
360-day
year (consisting of twelve30-day
months). Accordingly, the dividend on the Series A preferred stock for the initial dividend period, assuming the Initial Issue Date is , 202 will be $ per share of Series A preferred stock (based on the annual dividend rate of % and a Liquidation Preference of $ per share) and will be payable, when, as and if declared, on , 202 , to the holders of record thereof on . The dividend on the Series A preferred stock for each subsequent full dividend period, when, as and if declared, will be $ per share of Series A preferred stock (based on the annual dividend rate of % and a Liquidation Preference of $ per share). Accumulated dividends on shares of the Series A preferred stock will not bear interest, nor shall additional dividends be payable thereon, if they are paid subsequent to the applicable Dividend Payment Date.No dividend will be paid unless and until our board of directors, or an authorized committee of our board of directors, declares a dividend payable with respect to the Series A preferred stock. No dividend will be declared or paid upon, or any sum of cash or number of shares of our common stock set apart for the payment of dividends upon, any outstanding shares of Series A preferred stock with respect to any dividend period unless all dividends for all preceding dividend periods have been declared and paid upon, or a sufficient sum of cash or number of shares of our common stock has been set apart for the payment of such dividends upon, all outstanding shares of Series A preferred stock. Except as described above, dividends on shares of Series A preferred stock converted to common stock will cease to accumulate, and all other rights of holders of the Series A preferred stock will terminate, from and after the Mandatory Conversion Date, the Fundamental Change Conversion Date or the Early Conversion Date (each, as defined below), as applicable.
Our ability to declare and pay cash dividends and to make other distributions with respect to our capital stock, including the Series A preferred stock, may be limited by the terms of our and our subsidiaries’ existing and any future indebtedness, including our ABL Facility and ACI Notes. Any credit facilities, indentures or other financing agreements we enter into in the future may contain covenants that restrict our ability to pay cash dividends on our capital stock, including the Series A preferred stock. In addition, our ability to declare and pay dividends may be limited by applicable Delaware law.
Method of Payment of Dividends
Subject to the limitations described below, we may pay any declared dividend (or any portion of any declared dividend) on the shares of Series A preferred stock (whether or not for a current dividend period or any prior dividend period, including in connection with the payment of declared and unpaid dividends pursuant to the provisions described in “—Mandatory Conversion” and “—Conversion at the Option of the Holder Upon Fundamental Change; Fundamental Change Dividend Make-Whole Amount”), determined in our sole discretion:
| • | in cash; |
| • | by delivery of shares of our common stock; or |
| • | through any combination of cash and shares of our common stock. |
We will make each payment of a declared dividend on the shares of Series A preferred stock in cash, except to the extent we elect to make all or any portion of such payment in shares of our common stock. We will give the holders of the Series A preferred stock notice of any such election and the portion of such payment that will be made in cash and the portion that will be made in shares of our common stock no later than 10 Scheduled
A-19
Trading Days (as defined herein) prior to the Dividend Payment Date for such dividend;, that if we do not provide timely notice of this election, we will be deemed to have elected to pay the relevant dividend in cash. All cash payments to which a holder of the Series A preferred stock is entitled in connection with a declared dividend on the shares of Series A preferred stock will be rounded to the nearest cent.
provided, however
If we elect to make any such payment of a declared dividend, or any portion thereof, in shares of our common stock, such shares will be valued for such purpose, in the case of any dividend payment or portion thereof, at 97% of the Average VWAP (as defined herein) per share of our common stock over the five consecutive Trading Day (as defined herein) period beginning on, and including, the seventh Scheduled Trading Day (as defined herein) prior to the applicable Dividend Payment Date (such average, the “Average Price”). If the five Trading Day period to determine the Average Price ends on or after the relevant Dividend Payment Date (whether because a Scheduled Trading Day is not a Trading Day due to the occurrence of a Market Disruption Event (as defined herein) or otherwise), then the Dividend Payment Date will be postponed until the third Business Day after the final Trading Day of such five Trading Day period provided that no interest or other amounts will accrue as a result of such postponement.
No fractional shares of our common stock will be delivered to the holders of the Series A preferred stock in payment or partial payment of a dividend. We will instead, to the extent we are legally permitted to do so, pay a cash amount (computed to the nearest cent) to each holder that would otherwise be entitled to receive a fraction of a share of our common stock based on the Average Price with respect to such dividend.
To the extent a shelf registration statement is required in our reasonable judgment in connection with the issuance of, or for resales of shares of our common stock issued as payment of a dividend on the shares of Series A preferred stock, including dividends paid in connection with a conversion, we will, to the extent a registration statement covering such shares is not currently filed and effective, use our commercially reasonable efforts to file and maintain the effectiveness of such a shelf registration statement until the earlier of such time as all such shares of common stock have been resold thereunder and such time as all such shares would be freely tradable without registration by holders thereof that are not (and were not at any time during the preceding three months) “affiliates” of ours for purposes of the Securities Act of 1933, as amended, and the rules and regulations thereunder. To the extent applicable, we will also use our commercially reasonable efforts to have such shares of our common stock approved for listing on the NYSE (or if our common stock is not listed on the NYSE, on the principal other U.S. national or regional securities exchange on which our common stock is then listed), and qualified or registered under applicable state securities laws, if required;that we will not be required to qualify as a foreign corporation or to take any action that would subject us to general service of process in any such jurisdiction where we are not presently qualified or where we are not presently subject to taxation as a foreign corporation and such qualification or action would subject us to such taxation.
provided
Notwithstanding the foregoing, in no event will the number of shares of our common stock to be delivered in connection with any declared dividend, including any declared dividend payable in connection with a conversion, exceed a number equal to:
| • | the declared dividend, divided by |
| • | $ (the “Floor Price”), which amount represents 35% of the Initial Price (as defined herein), subject to adjustment in a manner inversely proportional to any anti-dilution adjustment to each Fixed Conversion Rate as set forth below in “—Anti-Dilution Adjustments.” |
To the extent that the amount of any declared dividend exceeds the product of (x) the number of shares of our common stock delivered in connection with such declared dividend and (y) 97% of the Average Price, we will, if we are legally able to do so, and to the extent permitted under the terms of the documents governing our indebtedness, notwithstanding any notice by us to the contrary, pay such excess amount in cash (computed to the nearest cent). Any such payment in cash may not be permitted by our then existing debt instruments. To the extent that we are not able to pay such excess amount in cash under applicable law and in compliance with our
A-20
indebtedness, we will not have any obligation to pay such amount in cash or deliver additional shares of our common stock in respect of such amount, and such amount will not form a part of the cumulative dividends that may be deemed to accumulate on the shares of Series A preferred stock.
Dividend Stopper
So long as any shares of Series A preferred stock remain outstanding, no dividend or distribution shall be declared or paid on our common stock or any other class or series of Junior Stock, and no common stock or any other class or series of Junior Stock shall be purchased, redeemed or otherwise acquired for consideration by us or any of our subsidiaries unless, in each case, all accumulated and unpaid dividends for all preceding dividend periods have been declared and paid in full in cash, shares of our common stock or a combination thereof, or a sufficient sum of cash or number of shares of our common stock has been set apart for the payment of such dividends, on all outstanding shares of Series A preferred stock. The foregoing limitation shall not apply to: (i) any dividend or distribution payable in shares of common stock or other Junior Stock, together with cash in lieu of any fractional share, (ii) purchases, redemptions or other acquisitions of common stock or other Junior Stock in connection with the administration of any benefit or other incentive plan, including any employment contract, in the ordinary course of business, including, without limitation, (x) purchases to offset the Share Dilution Amount pursuant to a publicly announced repurchase plan, provided that any purchases to offset the Share Dilution Amount shall in no event exceed the Share Dilution Amount, (y) the forfeiture of unvested shares of restricted stock or share withholdings or other acquisitions or surrender of shares to which the holder may otherwise be entitled upon exercise, delivery or vesting of equity awards (whether in payment of applicable taxes, the exercise price or otherwise), and (z) the payment of cash in lieu of fractional shares; (iii) purchases or deemed purchases or acquisitions of fractional interests in shares of any of our Existing Junior Convertible Preferred Stock, common stock or other Junior Stock pursuant to the conversion or exchange provisions of such shares of Existing Junior Convertible Preferred Stock, other Junior Stock or any securities exchangeable for or convertible into shares of common stock or other Junior Stock; (iv) any dividends or distributions of rights or common stock or other Junior Stock in connection with a stockholders’ rights plan or any redemption or repurchase of rights pursuant to any stockholders’ rights plan; (v) purchases of common stock or other Junior Stock pursuant to a contractually binding requirement to buy common stock or other Junior Stock, including under a contractually binding stock repurchase plan, in each case, existing prior to the date of this prospectus; (vi) the acquisition by us or any of our subsidiaries of record ownership in common stock or other Junior Stock or Parity Stock for the beneficial ownership of any other persons (other than us or any of our subsidiaries), including as trustees or custodians, and the payment of cash in lieu of fractional shares and (vii) the exchange or conversion of Junior Stock for or into other Junior Stock or of Parity Stock for or into other Parity Stock (with the same or lesser aggregate liquidation preference) or Junior Stock and the payment of cash in lieu of fractional shares.
The phrase “Share Dilution Amount” means the increase in the number of diluted shares of our common stock outstanding (determined in accordance with accounting principles generally accepted in the United States of America and as measured from the Initial Issue Date) resulting from the grant, vesting or exercise of equity-based compensation to directors, employees and agents and equitably adjusted for any stock split, stock dividend, reverse stock split, reclassification or similar transaction.
When dividends on shares of the Series A preferred stock (i) have not been declared and paid in full on any Dividend Payment Date, or (ii) have been declared but a sum of cash or number of shares of our common stock sufficient for payment thereof has not been set aside for the benefit of the holders thereof on the applicable Regular Record Date, no dividends may be declared or paid on any shares of Parity Stock unless dividends are declared on the shares of Series A preferred stock such that the respective amounts of such dividends declared on the shares of Series A preferred stock and such shares of Parity Stock shall be allocated pro rata among the holders of the shares of Series A preferred stock and the holders of any shares of Parity Stock then outstanding. For purposes of calculating the pro rata allocation of partial dividend payments, the Company shall allocate those payments so that the respective amounts of those payments for the declared dividend bear the same ratio to each
A-21
other as all accumulated dividends and all declared and unpaid dividends per share on the shares of Series A preferred stock and such shares of Parity Stock bear to each other (subject to their having been declared by our board of directors, or an authorized committee thereof, out of legally available funds);,, that any unpaid dividends on the Series A preferred stock will continue to accumulate except as described herein. For purposes of this calculation, with respect to
provided
however
non-cumulative
Parity Stock, we will use the full amount of dividends that would be payable for the most recent dividend period if dividends were declared in full on suchnon-cumulative
Parity Stock.Subject to the foregoing, and not otherwise, such dividends as may be determined by our board of directors, or an authorized committee thereof, may be declared and paid (payable in cash, securities or other property) on any securities, including our common stock and other Junior Stock, from time to time out of any funds legally available for such payment, and holders of the Series A preferred stock shall not be entitled to participate in any such dividends.
Redemption
The Series A preferred stock will not be redeemable. However, at our option, we may purchase or exchange the Series A preferred stock from time to time in the open market, by tender or exchange offer or otherwise, without the consent of, or notice to, holders.
Liquidation Preference
In the event of our voluntary or involuntary liquidation,
winding-up
or dissolution, each holder of the Series A preferred stock will be entitled to receive a Liquidation Preference in the amount of $ per share of the Series A preferred stock (the “Liquidation Preference”), plus an amount (the “Liquidation Dividend Amount”) equal to accumulated and unpaid dividends on such shares, whether or not declared, to, but excluding, the date fixed for liquidation, winding-up
or dissolution to be paid out of our assets legally available for distribution to our stockholders, after satisfaction of debt and other liabilities owed to our creditors and holders of shares of any Senior Stock and before any payment or distribution is made to holders of Junior Stock (including our common stock). If, upon our voluntary or involuntary liquidation, winding-up
or dissolution, the amounts payable with respect to (1) the Liquidation Preference plus the Liquidation Dividend Amount on the shares of Series A preferred stock and (2) the liquidation preference of, and the amount of accumulated and unpaid dividends (to, but excluding, the date fixed for liquidation, winding-up
or dissolution) on, all Parity Stock are not paid in full, the holders of the Series A preferred stock and all holders of any such Parity Stock will share equally and ratably in any distribution of our assets in proportion to their respective liquidation preferences and amounts equal to accumulated and unpaid dividends to which they are entitled. After payment to any holder of Series A preferred stock of the full amount of the Liquidation Preference and the Liquidation Dividend Amount for such holder’s shares of Series A preferred stock, such holder of the Series A preferred stock will have no right or claim to any of our remaining assets.Neither the sale, lease nor exchange of all or substantially all of our assets or business (other than in connection with our liquidation,
winding-up
or dissolution), nor our merger or consolidation into or with any other person, will be deemed to be our voluntary or involuntary liquidation,winding-up
or dissolution.Our certificate of incorporation, including the certificate of designations for the Series A preferred stock, will not contain any provision requiring funds to be set aside to protect the Liquidation Preference of the Series A preferred stock even though it is substantially in excess of the par value thereof.
Voting Powers
The holders of the Series A preferred stock will not have any voting rights or powers, except as described below and as specifically required by Delaware law or by our certificate of incorporation from time to time.
A-22
Whenever dividends on any shares of the Series A preferred stock have not been declared and paid for the equivalent of six or more dividend periods, whether or not for consecutive dividend periods (a “Nonpayment”), the authorized number of directors on our board of directors will, at the next annual meeting of stockholders or at a special meeting of stockholders as provided below, automatically be increased by two and the holders of such shares of the Series A preferred stock, voting together as a single class with holders of any and all other series of Voting Preferred Stock (as defined herein) then outstanding, will be entitled, at our next annual meeting of stockholders or at a special meeting of stockholders, if any, as provided below, to vote for the election of a total of two additional members of our board of directors (the “Preferred Stock Directors”);,, that the election of any such Preferred Stock Directors will not cause us to violate the corporate governance requirements of the NYSE (or any other exchange or automated quotation system on which our securities may be listed or quoted) that requires listed or quoted companies to have a majority of independent directors; and,, that our board of directors shall, at no time, include more than two Preferred Stock Directors. In the event of a Nonpayment, the holders of record of at least 25% of the shares of the Series A preferred stock and any other series of Voting Preferred Stock may request that a special meeting of stockholders be called to elect such Preferred Stock Directors (,, that if our next annual or a special meeting of stockholders is scheduled to be held within 90 days of the receipt of such request, the election of such Preferred Stock Directors, to the extent otherwise permitted by our bylaws, will, instead, be included in the agenda for and will be held at such scheduled annual or special meeting of stockholders). The Preferred Stock Directors will stand for reelection annually, at each subsequent annual meeting of the stockholders, so long as the holders of the Series A preferred stock continue to have such voting powers.
provided
however
provided
further
provided
however
At any meeting at which the holders of the Series A preferred stock are entitled to elect Preferred Stock Directors, the holders of record of a majority in voting power of the then outstanding shares of the Series A preferred stock and all other series of Voting Preferred Stock, present in person or represented by proxy, will constitute a quorum and the vote of the holders of a majority in voting power of such shares of the Series A preferred stock and other Voting Preferred Stock so present or represented by proxy at any such meeting at which there shall be a quorum shall be sufficient to elect the Preferred Stock Directors.
As used in this prospectus, “Voting Preferred Stock” means any other class or series of our preferred stock, other than the Series A preferred stock, ranking equally with the Series A preferred stock as to dividends and to the distribution of assets upon liquidation, dissolution or
winding-up
and upon which like voting powers for the election of directors have been conferred and are exercisable. Whether a plurality, majority or other portion in voting power of the Series A preferred stock and any other Voting Preferred Stock have been voted in favor of any matter shall be determined by reference to the respective liquidation preference amounts of the Series A preferred stock and such other Voting Preferred Stock voted.If and when all accumulated and unpaid dividends on the Series A preferred stock have been paid in full, or declared and a sum or number of shares of our common stock sufficient for such payment shall have been set aside for the benefit of the holders thereof on the applicable Regular Record Date (a “Nonpayment Remedy”), the holders of the Series A preferred stock shall immediately and, without any further action by us, be divested of the foregoing voting powers, subject to the revesting of such powers in the event of each subsequent Nonpayment. If such voting powers for the holders of the Series A preferred stock and all other holders of Voting Preferred Stock have terminated, each Preferred Stock Director then in office shall automatically be disqualified as a director and shall no longer be a director and the term of office of each Preferred Stock Director so elected will terminate at such time and the authorized number of directors on our board of directors shall automatically decrease by two.
Any Preferred Stock Director may be removed at any time, with or without cause, by the holders of record of a majority in voting power of the outstanding shares of the Series A preferred stock and any other series of Voting Preferred Stock then outstanding (voting together as a single class) when they have the voting powers described above. In the event that a Nonpayment shall have occurred and there shall not have been a Nonpayment Remedy, any vacancy in the office of a Preferred Stock Director (other than prior to the initial
A-23
election of Preferred Stock Directors after a Nonpayment) may be filled by the written consent of the Preferred Stock Director remaining in office, except in the event that such vacancy is created as a result of such Preferred Stock Director being removed, or if no Preferred Stock Director remains in office, by a vote of the holders of record of a majority in voting power of the outstanding shares of the Series A preferred stock and any other series of Voting Preferred Stock then outstanding (voting together as a single class) when they have the voting powers described above;, that the election of any such Preferred Stock Directors to fill such vacancy will not cause us to violate the corporate governance requirements of the NYSE (or any other exchange or automated quotation system on which our securities may be listed or quoted) that requires listed or quoted companies to have a majority of independent directors. The Preferred Stock Directors will each be entitled to one vote per director on any matter that comes before our board of directors for a vote.
provided, however
So long as any shares of the Series A preferred stock are outstanding, we will not, without the affirmative vote or consent of the holders of record of at least
two-thirds
in voting power of the outstanding shares of the Series A preferred stock and all other series of Voting Preferred Stock at the time outstanding and entitled to vote thereon, voting together as a single class, given in person or by proxy, either in writing without a meeting or by vote at an annual or special meeting of such stockholders:| • | amend or alter the provisions of our certificate of incorporation so as to authorize or create, or increase the authorized number of, any class or series of Senior Stock; |
| • | amend, alter or repeal any provision of our certificate of incorporation or the certificate of designations for the Series A preferred stock so as to adversely affect the special rights, preferences or voting powers of the Series A preferred stock; or |
| • | consummate a binding share exchange or reclassification involving the shares of the Series A preferred stock, or a merger or consolidation of us with another entity, unless in each case: (i) the shares of the Series A preferred stock remain outstanding following the consummation of such binding share exchange, reclassification, merger or consolidation or, in the case of any such merger or consolidation with respect to which we are not the surviving or resulting entity (or the Series A preferred stock is otherwise exchanged or reclassified), are converted or reclassified into or exchanged for preference securities of the surviving or resulting entity or its ultimate parent or the right to receive such securities; and (ii) the shares of the Series A preferred stock that remain outstanding or such shares of preference securities, as the case may be, have such rights, preferences and voting powers that, taken as a whole, are not materially less favorable to the holders thereof than the rights, preferences and voting powers, taken as a whole, of the Series A preferred stock immediately prior to the consummation of such transaction; |
provided
however
provided
further
however
If any amendment, alteration, repeal, share exchange, reclassification, merger or consolidation described above would adversely affect the rights, preferences or voting powers of one or more but not all series of Voting
A-24
Preferred Stock (including the Series A preferred stock for this purpose), then only the series of Voting Preferred Stock, the rights, preferences or voting powers of which are adversely affected and entitled to vote, shall vote as a class in lieu of all other series of Voting Preferred Stock.
Without the consent of the holders of the Series A preferred stock, so long as such action does not adversely affect the special rights, preferences or voting powers of the Series A preferred stock, and limitations and restrictions thereof, we may amend, alter, supplement or repeal any terms of the Series A preferred stock for the following purposes:
| • | to cure any ambiguity, omission or mistake, or to correct or supplement any provision contained in the certificate of designations establishing the terms of the Series A preferred stock that may be defective or inconsistent with any other provision contained in such certificate of designations; |
| • | to make any provision with respect to matters or questions relating to the Series A preferred stock that is not inconsistent with the provisions of our certificate of incorporation or the certificate of designations establishing the terms of the Series A preferred stock; or |
| • | to make any other change that does not adversely affect the rights of any holder of the Series A preferred stock (other than any holder that consents to such change). |
In addition, without the consent of the holders of the Series A preferred stock, we may amend, alter, supplement or repeal any terms of the Series A preferred stock in order to (i) conform the terms thereof to the description of the terms of the Series A preferred stock set forth under “Description of Series A preferred stock” in this prospectus relating to this offering, as supplemented and/or amended by any related pricing term sheet or (ii) file a certificate of correction with respect to the certificate of designations to the extent permitted by Section 103(f) of the Delaware General Corporation Law.
Mandatory Conversion
Each outstanding share of the Series A preferred stock, unless previously converted, will automatically convert on the Mandatory Conversion Date (as defined herein), into a number of shares of our common stock equal to the Conversion Rate described below.
The “Conversion Rate,” which is the number of shares of our common stock issuable upon conversion of each share of the Series A preferred stock on the Mandatory Conversion Date (excluding any shares of our common stock issued in respect of accrued and unpaid dividends, as described below), will be as follows:
| • | if the Applicable Market Value (as defined herein) of our common stock is greater than $ (the “Threshold Appreciation Price”), then the Conversion Rate will be shares of our common stock per share of the Series A preferred stock (the “Minimum Conversion Rate”), which is approximately equal to $ divided by the Threshold Appreciation Price; |
| • | if the Applicable Market Value of our common stock is less than or equal to the Threshold Appreciation Price but equal to or greater than $ (the “Initial Price”), then the Conversion Rate will be equal to $ divided by the Applicable Market Value of our common stock, rounded to the nearest ten-thousandth of a share; or |
| • | if the Applicable Market Value of our common stock is less than the Initial Price, then the Conversion Rate will be shares of our common stock per share of the Series A preferred stock (the “Maximum Conversion Rate”). |
For the avoidance of doubt, the Conversion Rate per share of the Series A preferred stock will in no event exceed the Maximum Conversion Rate, subject to adjustment as described under “—Anti-Dilution Adjustments” below and exclusive of any amounts owing in respect of any Additional Conversion Amount or any accrued and unpaid dividends paid at our election in shares of common stock.
A-25
We refer to the Minimum Conversion Rate and the Maximum Conversion Rate collectively as the “Fixed Conversion Rates.” The Fixed Conversion Rates are subject to adjustment as described under “—Anti-Dilution Adjustments” below. The “Threshold Appreciation Price” is calculated by dividing $ by the Minimum Conversion Rate, and represents approximately % appreciation over the Initial Price. The “Initial Price” is calculated by dividing $ by the Maximum Conversion Rate and initially equals $ .
If we declare a dividend on the Series A preferred stock for the dividend period ending on, but excluding, , 20 , we will pay such dividend to the holders of record as of the immediately preceding Regular Record Date, as described above under “—Dividends.” If, on or prior to , 20 we have not declared all or any portion of the accumulated and unpaid dividends on the Series A preferred stock, the Conversion Rate will be adjusted so that holders receive an additional number of shares of our common stock equal to:
| • | the amount of such undeclared, accumulated and unpaid dividends per share of Series A preferred stock (the “Additional Conversion Amount”), divided by |
| • | the greater of (x) the Floor Price and (y) 97% of the Average Price (calculated using , 20 as the applicable Dividend Payment Date). |
To the extent that the Additional Conversion Amount exceeds the product of such number of additional shares and 97% of the Average Price, we will, if we are legally able to do so, and to the extent permitted under the terms of the documents governing our indebtedness, declare and pay such excess amount in cash (computed to the nearest cent) pro rata per share to the holders of the Series A preferred stock. Any such payment in cash may not be permitted by our then existing debt instruments. To the extent that we are not able to pay such excess amount in cash under applicable law and in compliance with our indebtedness, we will not have any obligation to pay such amount in cash or deliver additional shares of our common stock in respect of such amount, and such amount will not form a part of the cumulative dividends that may be deemed to accumulate on the shares of Series A preferred stock.
Hypothetical Conversion Values Upon Mandatory Conversion
For illustrative purposes only, the following table shows the number of shares of our common stock that a holder of the Series A preferred stock would receive upon mandatory conversion of one share of the Series A preferred stock at various Applicable Market Values for our common stock. The table assumes that there will be no conversion adjustments as described above for any Additional Conversion Amount or as described below in “—Anti-Dilution Adjustments” and that dividends on the Series A preferred stock will be declared and paid in cash (and not in additional shares of our common stock). The actual Applicable Market Value of our common stock may differ from those set forth in the table below. Given an Initial Price of $ and a Threshold Appreciation Price of $ , a holder of the Series A preferred stock
A-26
would receive on the Mandatory Conversion Date the number of shares of our common stock per share of the Series A preferred stock set forth below, subject to the provisions described below with respect to any fractional share of our common stock:
Assumed Applicable Market Value of our common stock | Number of shares of our common stock to be received upon mandatory conversion | Assumed conversion value (calculated as Applicable Market Value multiplied by the number of shares of our common stock to be received upon mandatory conversion) | ||||||
$ | $ | |||||||
$ | $ | |||||||
$ | $ | |||||||
$ | $ | |||||||
$ | $ | |||||||
$ | $ | |||||||
$ | $ | |||||||
$ | $ | |||||||
$ | $ | |||||||
$ | $ | |||||||
Accordingly, assuming that the market price of our common stock on the Mandatory Conversion Date is the same as the Applicable Market Value of our common stock, the aggregate market value of our common stock you receive upon mandatory conversion of a share of Series A preferred stock (excluding any shares of our common stock you receive in respect of accrued and unpaid dividends) will be:
| • | greater than the $ liquidation preference of the share of Series A preferred stock, if the Applicable Market Value is greater than the Threshold Appreciation Price; |
| • | equal to the $ liquidation preference of the share of Series A preferred stock, if the Applicable Market Value is less than or equal to the Threshold Appreciation Price and greater than or equal to the Initial Price; and |
| • | less than the $ liquidation preference of the share of Series A preferred stock, if the Applicable Market Value is less than the Initial Price. |
Certain Definitions
“Applicable Market Value” means the Average VWAP per share of our common stock over the Settlement Period (as defined herein).
“Close of Business” means 5:00 p.m., New York City time.
“Mandatory Conversion Date” means the second Business Day immediately following the last Trading Day of the Settlement Period. The Mandatory Conversion Date is expected to be , 202 . If the Mandatory Conversion Date occurs after , 202 (whether because a Scheduled Trading Day during the Settlement Period is not a Trading Day due to the occurrence of a Market Disruption Event (as defined herein) or otherwise), no interest or other amounts will accrue as a result of such postponement.
“Market Disruption Event” means:
| • | a failure by the Relevant Stock Exchange to open for trading during its regular trading session; or |
| • | the occurrence or existence, prior to 1:00 p.m., New York City time, on any Scheduled Trading Day for our common stock, for more than a one half-hour period in the aggregate during regular trading hours, of any suspension or limitation imposed on trading (by reason of movements in price exceeding limits permitted by the Relevant Stock Exchange or otherwise) in our common stock. |
A-27
“Open of Business” means 9:00 a.m., New York City time.
“Relevant Stock Exchange” means the NYSE or, if our common stock is not then listed on the NYSE, on the principal other U.S. national or regional securities exchange on which our common stock is then listed or, if our common stock is not then listed on a U.S. national or regional securities exchange, on the principal other market on which our common stock is then listed or admitted for trading.
A “Trading Day” means a day on which:
| • | there is no Market Disruption Event; and |
| • | trading in our common stock generally occurs on the Relevant Stock Exchange; |
provided
however
A “Scheduled Trading Day” is any day that is scheduled to be a Trading Day.
“Settlement Period” means the 20 consecutive Trading Day period beginning on, and including, the 21
st
Scheduled Trading Day immediately preceding , 202 .“VWAP” per share of our common stock on any Trading Day means the per share volume-weighted average price as displayed on Bloomberg page “ <EQUITY> ” (or its equivalent successor if such page is not available) in respect of the period from the scheduled open of trading until the scheduled close of trading of the primary trading session on such Trading Day (or, if such volume weighted average price is not available, the market value per share of our common stock on such Trading Day as determined, using a volume-weighted average method, by a nationally recognized independent investment banking firm retained by us for this purpose, which may include any of the underwriters for this offering). The “Average VWAP” per share over a certain period means the arithmetic average of the VWAP per share for each Trading Day in the relevant period.
Early Conversion at the Option of the Holder
Other than during a Fundamental Change Conversion Period (as defined below under “—Conversion at the Option of the Holder upon Fundamental Change; Fundamental Change Dividend Make-Whole Amount”), holders of the Series A preferred stock will have the option to convert their Series A preferred stock, in whole or in part (but in no event less than one share of the Series A preferred stock), at any time prior to , 202 (an “Early Conversion”), into shares of our common stock at the Minimum Conversion Rate of shares of our common stock per share of the Series A preferred stock, subject to adjustment as described under “—Anti-Dilution Adjustments” below.
If, as of the Conversion Date (as defined herein) of any Early Conversion (the “Early Conversion Date”), we have not declared all or any portion of the accumulated and unpaid dividends for all full dividend periods ending on a Dividend Payment Date prior to such Early Conversion Date, the conversion rate for such Early Conversion will be adjusted so that holders converting their Series A preferred stock at such time receive an additional number of shares of our common stock equal to:
| • | such amount of undeclared, accumulated and unpaid dividends per share of Series A preferred stock for such prior full dividend periods (the “Early Conversion Additional Amount”), divided by |
| • | the greater of (x) the Floor Price and (y) the Average VWAP per share of our common stock over the 20 consecutive Trading Day period (the “Early Conversion Settlement Period”) commencing on, and including, the 21 st Scheduled Trading Day immediately preceding the Early Conversion Date (such Average VWAP, the “Early Conversion Average Price”). |
A-28
To the extent that the Early Conversion Additional Amount exceeds the product of such number of additional shares and the Early Conversion Average Price, we will not have any obligation to pay the shortfall in cash or deliver shares of our common stock in respect of such shortfall.
Except as described above, upon any Early Conversion of any Series A preferred stock, we will make no payment or allowance for unpaid dividends on such shares of the Series A preferred stock, unless such Early Conversion Date occurs after the Regular Record Date for a declared dividend and on or prior to the immediately succeeding Dividend Payment Date, in which case such dividend will be paid on such Dividend Payment Date to the holder of record of the converted shares of the Series A preferred stock as of such Regular Record Date, as described in the section above entitled “—Dividends.”
Conversion at the Option of the Holder upon Fundamental Change; Fundamental Change Dividend Make-Whole Amount
General
If a “Fundamental Change” (as defined herein) occurs on or prior to , 202 , holders of the Series A preferred stock will have the right during the Fundamental Change Conversion Period (as defined herein) to:
| (i) | convert their shares of Series A preferred stock, in whole or in part (but in no event less than one share of the Series A preferred stock), into a number of shares of our common stock (or Units of Exchange Property as described below) at the conversion rate specified in the table below (the “Fundamental Change Conversion Rate”); |
| (ii) | with respect to such converted shares, receive a Fundamental Change Dividend Make-Whole Amount (as defined herein) payable in cash or shares of our common stock; and |
| (iii) | with respect to such converted shares, receive the Accumulated Dividend Amount (as defined herein) payable in cash or shares of our common stock, |
subject, in the case of clauses (ii) and (iii), to certain limitations with respect to the number of shares of our common stock that we will be required to deliver, all as described below. Notwithstanding clauses (ii) and (iii) above, if the Regular Record Date for a dividend period for which we have, as of the Fundamental Change Effective Date, declared a dividend occurs before or during the related Fundamental Change Conversion Period, then we will pay such dividend on the relevant Dividend Payment Date to the holders of record on such Regular Record Date, as described in “—Dividends,” and the Accumulated Dividend Amount will not include the amount of such dividend, and the Fundamental Change Dividend Make-Whole Amount will not include the present value of the payment of such dividend.
To exercise this right, holders must submit their shares of Series A preferred stock for conversion at any time during the period (the “Fundamental Change Conversion Period”) beginning on, and including, the Fundamental Change Effective Date and ending at the Close of Business on, and including, the date that is 20 calendar days after the Fundamental Change Effective Date (but, in no event later than , 202 ). A Conversion Date occurring during such Fundamental Change Conversion Period is referred to herein as a “Fundamental Change Conversion Date.” Holders who do not submit their shares for conversion during the Fundamental Change Conversion Period will not be entitled to convert their Series A preferred stock at the relevant Fundamental Change Conversion Rate or to receive the relevant Fundamental Change Dividend Make-Whole Amount or the Accumulated Dividend Amount.
We will notify holders of the Fundamental Change Effective Date no later than the second Business Day immediately following such Fundamental Change Effective Date. If we notify holders of a Fundamental Change later than the second Business Day following the Fundamental Change Effective Date, the Fundamental Change Conversion Period will be extended by a number of days equal to the number of days from, and including, such Fundamental Change Effective Date to, but excluding, the date of the notice;,, that the Fundamental Change Conversion Period will not be extended beyond , 202 .
provided
however
A-29
A “Fundamental Change” will be deemed to have occurred, at any time after the Initial Issue Date of the Series A preferred stock, if any of the following occurs:
(i) the consummation of (A) any recapitalization, reclassification or change of our common stock (other than changes resulting from a subdivision or combination or change in par value) as a result of which our common stock would be converted into, or exchanged for, stock, other securities, other property or assets (including cash or a combination thereof); (B) any consolidation, merger or other combination of us or binding share exchange pursuant to which our common stock will be converted into, or exchanged for, stock, other securities or other property or assets (including cash or a combination thereof); or (C) any sale, lease or other transfer or disposition in one transaction or a series of transactions of all or substantially all of the consolidated assets of ours and our subsidiaries taken as a whole, to any person other than one or more of our wholly-owned subsidiaries;
(ii) any “person” or “group” (as such terms are used for purposes of Sections 13(d) and 14(d) of the Securities Exchange Act of 1934, as amended, and the rules and regulations thereunder (the “Exchange Act”), whether or not applicable), other than us, any of our wholly-owned subsidiaries, a Permitted Holder or any of our or our wholly-owned subsidiaries’ employee benefit plans (or any person or entity acting solely in its capacity as trustee, agent or other fiduciary or administrator of any such plan), filing a Schedule TO or any schedule, form or report under the Exchange Act disclosing that such person or group has become the “beneficial owner” (as defined in Rule
13d-3
under the Exchange Act), directly or indirectly, of more than 50% of the total voting power in the aggregate of all classes of capital stock then outstanding entitled to vote generally in elections of our directors; or(iii) our common stock (or other Exchange Property) ceases to be listed or quoted for trading on the NYSE, the NASDAQ Global Select Market or the NASDAQ Global Market (or another U.S. national securities exchange or any of their respective successors).
“Permitted Holder” means .
However, a transaction or transactions described in clause (i) or clause (ii) above will not constitute a Fundamental Change if at least 90% of the consideration received or to be received by our common stockholders, excluding cash payments for fractional shares or pursuant to statutory appraisal rights, in connection with such transaction or transactions consists of shares of common stock that are listed or quoted on any of the NYSE, the NASDAQ Global Select Market or the NASDAQ Global Market (or any of their respective successors) or will be so listed or quoted when issued or exchanged in connection with such transaction or transactions and as a result of such transaction or transactions such consideration (excluding cash payments for fractional shares or pursuant to statutory appraisal rights) becomes the Exchange Property.
Fundamental Change Conversion Rate
The Fundamental Change Conversion Rate will be determined by reference to the table below and is based on the effective date of such Fundamental Change (the “Fundamental Change Effective Date”) and the price (the “Fundamental Change Stock Price”) paid or deemed paid per share of our common stock in such Fundamental Change. If the holders of our common stock receive only cash in such Fundamental Change, the Fundamental Change Stock Price shall be the cash amount paid per share of common stock. Otherwise, the Fundamental Change Stock Price shall be the Average VWAP per share of our common stock over the 10 consecutive Trading Day period ending on, and including, the Trading Day immediately preceding the Fundamental Change Effective Date.
The Fundamental Change Stock Prices set forth in the first row of the table below (, the column headers) will be adjusted as of any date on which the Fixed Conversion Rates of the Series A preferred stock are adjusted. The adjusted Fundamental Change Stock Prices will equal (i) the Fundamental Change Stock Prices applicable immediately prior to such adjustment,(ii) a fraction, the numerator of which is the Minimum Conversion Rate immediately prior to the adjustment giving rise to the Fundamental Change Stock Price
i.e.
multiplied by
A-30
adjustment and the denominator of which is the Minimum Conversion Rate as so adjusted. Each of the Fundamental Change Conversion Rates in the table below will be subject to adjustment in the same manner and at the same time as each Fixed Conversion Rate as set forth in “—Anti-Dilution Adjustments.”
The following table sets forth the Fundamental Change Conversion Rate per share of the Series A preferred stock for each Fundamental Change Stock Price and Fundamental Change Effective Date set forth below.
Fundamental Change Stock Price | ||||||||||||||||||||||||||||||||||||
$ | $ | $ | $ | $ | $ | $ | $ | $ | ||||||||||||||||||||||||||||
Fundamental Change Effective Date | ||||||||||||||||||||||||||||||||||||
, 202 | ||||||||||||||||||||||||||||||||||||
, 202 | ||||||||||||||||||||||||||||||||||||
, 202 | ||||||||||||||||||||||||||||||||||||
, 202 | ||||||||||||||||||||||||||||||||||||
The exact Fundamental Change Stock Price and Fundamental Change Effective Date may not be set forth in the table, in which case:
| • | if the Fundamental Change Stock Price is between two Fundamental Change Stock Price amounts in the table or the Fundamental Change Effective Date is between two Fundamental Change Effective Dates in the table, the Fundamental Change Conversion Rate will be determined by a straight-line interpolation between the Fundamental Change Conversion Rates set forth for the higher and lower Fundamental Change Stock Price amounts and the earlier and later Fundamental Change Effective Dates, as applicable, based on a 365- or366-day year, as applicable; |
| • | if the Fundamental Change Stock Price is in excess of $ per share (subject to adjustment in the same manner as the Fundamental Change Stock Prices set forth in the first row of the table above), then the Fundamental Change Conversion Rate will be the Minimum Conversion Rate; and |
| • | if the Fundamental Change Stock Price is less than $ per share (subject to adjustment in the same manner as the Fundamental Change Stock Prices set forth in the first row of the table above), then the Fundamental Change Conversion Rate will be the Maximum Conversion Rate. |
Fundamental Change Dividend Make-Whole Amount and Accumulated Dividend Amount
For any shares of the Series A preferred stock that are converted during the Fundamental Change Conversion Period, in addition to the common stock issued upon conversion at the Fundamental Change Conversion Rate, we will, at our option (subject to satisfaction of the requirements described below):
| (a) | pay in cash (computed to the nearest cent), to the extent we are legally permitted to do so and to the extent permitted under the terms of the documents governing our indebtedness, an amount equal to the present value, calculated using a discount rate of % per annum, of all dividend payments (excluding any Accumulated Dividend Amount, and subject to the second sentence under “—General” above) on the Series A preferred stock for (i) the partial dividend period, if any, from, and including, the Fundamental Change Effective Date to, but excluding, the next Dividend Payment Date and (ii) all remaining full dividend periods from, and including, the Dividend Payment Date following the Fundamental Change Effective Date to, but excluding, the Mandatory Conversion Date (the “Fundamental Change Dividend Make-Whole Amount”); |
| (b) | increase the number of shares of our common stock (or Units of Exchange Property) to be issued upon conversion by a number equal to (i) the Fundamental Change Dividend Make-Whole Amount divided by (ii) the greater of (x) the Floor Price and (y) 97% of the Fundamental Change Stock Price; or |
| (c) | pay the Fundamental Change Dividend Make-Whole Amount through any combination of cash and shares of our common stock (or Units of Exchange Property) in accordance with the provisions of clauses (a) and (b) above. |
A-31
As used herein, the term “Accumulated Dividend Amount” means, with respect to any Fundamental Change, the aggregate amount of undeclared, accumulated and unpaid dividends, if any, for dividend periods prior to the relevant Fundamental Change Effective Date, including (but subject to the second sentence under “—General” above) for the partial dividend period, if any, from, and including, the Dividend Payment Date immediately preceding such Fundamental Change Effective Date to, but excluding, such Fundamental Change Effective Date. For the avoidance of doubt, if the Regular Record Date for a dividend period for which we have, as of the Fundamental Change Effective Date, declared a dividend occurs before or during the related Fundamental Change Conversion Period, then we will pay such dividend on the relevant Dividend Payment Date to the holders of record at the Close of Business on such Regular Record Date, as described in “—Dividends,” and the Accumulated Dividend Amount will not include the amount of such dividend, and the Fundamental Change Dividend Make-Whole Amount will not include the present value of such dividend.
The Accumulated Dividend Amount will be payable at our option (subject to satisfaction of the requirements described below):
| • | in cash (computed to the nearest cent), to the extent we are legally permitted to do so and to the extent permitted under the terms of the documents governing our indebtedness; |
| • | in an additional number of shares of our common stock (or Units of Exchange Property) equal to (i) the Accumulated Dividend Amount divided by (ii) the greater of (x) the Floor Price and (y) 97% of the Fundamental Change Stock Price; or |
| • | through a combination of cash and shares of our common stock (or Units of Exchange Property) in accordance with the provisions of the preceding two bullets. |
We will pay the Fundamental Change Dividend Make-Whole Amount and the Accumulated Dividend Amount in cash, except to the extent we elect on or prior to the second Business Day following the Fundamental Change Effective Date to make all or any portion of such payments in shares of our common stock (or Units of Exchange Property).
In addition, if we elect to deliver common stock (or Units of Exchange Property) in respect of all or any portion of the Fundamental Change Dividend Make-Whole Amount or the Accumulated Dividend Amount, to the extent that the Fundamental Change Dividend Make-Whole Amount or the Accumulated Dividend Amount or the dollar amount of any portion thereof paid in common stock (or Units of Exchange Property) exceeds the product of (x) the number of additional shares we deliver in respect thereof and (y) 97% of the Fundamental Change Stock Price, we will, if we are legally able to do so, and to the extent permitted under the terms of the documents governing our indebtedness, pay such excess amount in cash (computed to the nearest cent). Any such payment in cash may not be permitted by our then existing debt instruments, including any restricted payments covenants. To the extent that we are not able to pay such excess amount in cash under applicable law and in compliance with our indebtedness, we will not have any obligation to pay such amount in cash or deliver additional shares of our common stock in respect of such amount.
However, if we are prohibited from paying or delivering, as the case may be, the Fundamental Change Dividend Make-Whole Amount (whether in cash or in shares of our common stock), in whole or in part, due to limitations of applicable Delaware law, then the Fundamental Change Conversion Rate will instead be increased by a number of shares of common stock equal to the cash amount of the aggregate unpaid and undelivered Fundamental Change Dividend Make-Whole Amount, divided by the greater of (i) the Floor Price and (ii) 97% of the Fundamental Change Stock Price. To the extent that the cash amount of the aggregate unpaid and undelivered Fundamental Change Dividend Make-Whole Amount exceeds the product of such number of additional shares and 97% of the Fundamental Change Stock Price, we will not have any obligation to pay the shortfall in cash or deliver additional shares of our common stock in respect of such amount.
A-32
No fractional shares of our common stock (or to the extent applicable, Units of Exchange Property) will be delivered to converting holders of the Series A preferred stock in respect of the Fundamental Change Dividend Make-Whole Amount or the Accumulated Dividend Amount. We will instead pay a cash amount (computed to the nearest cent) to each converting holder that would otherwise be entitled to receive a fraction of a share of our common stock (or to the extent applicable, Units of Exchange Property) based on the Average VWAP per share of our common stock (or to the extent applicable, Units of Exchange Property) over the five consecutive Trading Day period beginning on, and including, the seventh Scheduled Trading Day immediately preceding the Fundamental Change Conversion Date.
Not later than the second Business Day following the Fundamental Change Effective Date, we will notify holders of:
| • | the Fundamental Change Conversion Rate (if we provide notice to holders prior to the anticipated Fundamental Change Effective Date, specifying how the Fundamental Change Conversion Rate will be determined); |
| • | the Fundamental Change Dividend Make-Whole Amount and whether we will pay such amount in cash, shares of our common stock (or to the extent applicable, Units of Exchange Property) or a combination thereof, specifying the combination, if applicable; and |
| • | the Accumulated Dividend Amount as of the Fundamental Change Effective Date and whether we will pay such amount in cash, shares of our common stock (or to the extent applicable, Units of Exchange Property) or a combination thereof, specifying the combination, if applicable. |
Our obligation to deliver shares at the Fundamental Change Conversion Rate in connection with a Fundamental Change and pay the Fundamental Change Dividend Make-Whole Amount (whether in cash, our common stock or any combination thereof) could be considered a penalty under state law, in which case the enforceability thereof would be subject to general principles of reasonableness of economic remedies and therefore may not be enforceable in whole or in part.
Conversion Procedures
Upon Mandatory Conversion
Any outstanding shares of Series A preferred stock will mandatorily and automatically convert into shares of common stock on the Mandatory Conversion Date. You will not be required to pay any transfer or similar taxes or duties relating to the issuance or delivery of our common stock if you exercise your conversion rights, but you will be required to pay any tax or duty that may be payable relating to any transfer involved in the issuance or delivery of the common stock in a name other than your own.
A certificate representing the shares of common stock issuable upon conversion will be issued and delivered to the converting holder, or, if the Series A preferred stock being converted is in global form, the shares of common stock issuable upon conversion shall be delivered to the converting holder through the facilities of DTC, in each case together with delivery by us to the converting holder of any cash to which the converting holder is entitled, only after all applicable taxes and duties, if any, payable by you have been paid in full, and such shares and cash will be delivered on the later of (i) the Mandatory Conversion Date and (ii) the Business Day after you have paid in full all applicable taxes and duties, if any.
The person or persons entitled to receive the shares of our common stock issuable upon mandatory conversion of the Series A preferred stock will be treated as the record holder(s) of such shares as of the Close of Business on the Mandatory Conversion Date. Prior to the Close of Business on the Mandatory Conversion Date, the common stock issuable upon conversion of the Series A preferred stock on the Mandatory Conversion Date will not be deemed to be outstanding for any purpose and you will have no rights, powers or preferences with respect to such common stock, including voting powers, rights to respond to tender offers and rights to receive any dividends or other distributions on the common stock, by virtue of holding the Series A preferred stock.
A-33
Upon Early Conversion or Upon Early Fundamental Change Conversion
If you elect to convert the Series A preferred stock prior to the Mandatory Conversion Date, in the manner described in “—Early Conversion at the Option of the Holder” or “—Conversion at the Option of the Holder upon Fundamental Change; Fundamental Change Dividend Make-Whole Amount” (an “Early Fundamental Change Conversion”), you must observe the following conversion procedures:
| • | If shares of the Series A preferred stock are in global form, to convert the Series A preferred stock you must deliver to DTC the appropriate instruction form for conversion pursuant to DTC’s conversion program. |
| • | If shares of the Series A preferred stock are held in certificated form, you must comply with certain procedures set forth in the certificate of designations for the Series A preferred stock. |
In either case, if required, you must pay all transfer or similar taxes or duties, if any.
The “Conversion Date” will be the date on which you have satisfied the foregoing requirements with respect to an Early Conversion or an Early Fundamental Change Conversion.
You will not be required to pay any transfer or similar taxes or duties relating to the issuance or delivery of our common stock if you exercise your conversion rights, but you will be required to pay any tax or duty that may be payable relating to any transfer involved in the issuance or delivery of the common stock in a name other than your own.
A certificate representing shares of common stock issuable upon conversion will be issued and delivered to the converting holder, or, if the Series A preferred stock being converted is in global form, the shares of common stock issuable upon conversion shall be delivered through the facilities of DTC, in each case together with delivery by us to the converting holder of any cash to which the converting holder is entitled, only after all applicable taxes and duties, if any, payable by you have been paid in full, and such shares and cash will be delivered on the latest of (i) the second Business Day immediately succeeding the Conversion Date, (ii) if applicable, the second Business Day immediately succeeding the last day of the Early Conversion Settlement Period and (iii) the Business Day after you have paid in full all applicable taxes and duties, if any.
The person or persons entitled to receive the shares of common stock issuable upon conversion of the Series A preferred stock will be treated as the record holder(s) of such shares as of the Close of Business on the applicable Conversion Date. Prior to the Close of Business on the applicable Conversion Date, the shares of common stock issuable upon conversion of any shares of the Series A preferred stock will not be deemed to be outstanding for any purpose, and you will have no rights, powers or preferences with respect to such common stock, including voting powers, rights to respond to tender offers for the common stock and rights to receive any dividends or other distributions on the common stock, by virtue of holding the Series A preferred stock.
Fractional Shares
No fractional shares of our common stock will be issued to holders of the Series A preferred stock upon conversion. In lieu of any fractional shares of our common stock otherwise issuable in respect of the aggregate number of shares of the Series A preferred stock of any holder that are converted, that holder will be entitled to receive an amount in cash (computed to the nearest cent) equal to the product of: (i) that same fraction; and (ii) the Average VWAP of our common stock over the five consecutive Trading Day period beginning on, and including, the seventh Scheduled Trading Day immediately preceding the applicable Conversion Date.
Subject to any applicable rules and procedures of DTC, if more than one share of the Series A preferred stock is surrendered for conversion at one time by or for the same holder, the number of full shares of our common stock issuable upon conversion thereof shall be computed on the basis of the aggregate number of shares of the Series A preferred stock so surrendered.
A-34
Anti-Dilution Adjustments
Each Fixed Conversion Rate will be adjusted as described below, except that we will not make any adjustments to the Fixed Conversion Rates if holders of the Series A preferred stock participate (other than in the case of a share split or share combination), at the same time and upon the same terms as holders of our common stock and solely as a result of holding the Series A preferred stock, in any of the transactions described below without having to convert their Series A preferred stock as if they held a number of shares of common stock equal to (i) the Maximum Conversion Rate as of the record date for such transaction,(ii) the number of shares of Series A preferred stock held by such holder.
multiplied by
| (1) | If we exclusively issue shares of our common stock as a dividend or distribution on shares of our common stock, or if we effect a share split or share combination, each Fixed Conversion Rate will be adjusted based on the following formula: |
CR 1 | = | CR 0 | × | OS 1 | ||||||||||||||
OS 0 |
where,
CR 0 = | such Fixed Conversion Rate in effect immediately prior to the Close of Business on the record date (as defined herein) of such dividend or distribution, or immediately prior to the Open of Business on the effective date of such share split or share combination, as applicable; | |||
CR 1 = | such Fixed Conversion Rate in effect immediately after the Close of Business on such record date or immediately after the Open of Business on such effective date, as applicable; | |||
OS 0 = | the number of shares of our common stock outstanding immediately prior to the Close of Business on such record date or immediately prior to the Open of Business on such effective date, as applicable, before giving effect to such dividend, distribution, share split or share combination; and | |||
OS 1 = | the number of shares of our common stock outstanding immediately after giving effect to such dividend, distribution, share split or share combination. |
Any adjustment made under this clause (1) shall become effective immediately after the Close of Business on the record date for such dividend or distribution, or immediately after the Open of Business on the effective date for such share split or share combination, as applicable. If any dividend or distribution of the type described in this clause (1) is declared but not so paid or made, each Fixed Conversion Rate shall be immediately readjusted, effective as of the date our board of directors or a committee thereof determines not to pay such dividend or distribution, to such Fixed Conversion Rate that would then be in effect if such dividend or distribution had not been declared. For the purposes of this clause (1), the number of shares of our common stock outstanding immediately prior to the Close of Business on the record date and the number of shares of our common stock outstanding immediately after giving effect to such dividend, distribution, share split or share combination shall, in each case, not include shares that we hold in treasury. We will not pay any dividend or make any distribution on shares of our common stock that we hold in treasury.
“Effective date” as used in this clause (1) means the first date on which the shares of our common stock trade on the Relevant Stock Exchange, regular way, reflecting the relevant share split or share combination, as applicable.
“Record date” means, with respect to any dividend, distribution or other transaction or event in which the holders of our common stock (or other applicable security) have the right to receive any cash, securities or other property or in which our common stock (or such other security) is exchanged for or converted into any combination of cash, securities or other property, the date fixed for determination of holders of our common stock (or such other security) entitled to receive such cash, securities or other property (whether such date is fixed by our board of directors or a duly authorized committee thereof, statute, contract or otherwise).
A-35
| (2) | If we issue to all or substantially all holders of our common stock any rights, options or warrants entitling them, for a period of not more than 45 calendar days after the announcement date of such issuance, to subscribe for or purchase shares of our common stock at a price per share that is less than the Average VWAP per share of our common stock for the 10 consecutive Trading Day period ending on, and including, the Trading Day immediately preceding the date of announcement of such issuance, each Fixed Conversion Rate will be increased based on the following formula: |
CR 1 | = | CR 0 | × | OS 0 + X | ||||||||||||||
OS 0 + Y |
where,
CR 0 = | such Fixed Conversion Rate in effect immediately prior to the Close of Business on the record date for such issuance; | |||
CR 1 = | such Fixed Conversion Rate in effect immediately after the Close of Business on such record date; | |||
OS 0 = | the number of shares of our common stock outstanding immediately prior to the Close of Business on such record date; | |||
X= | the total number of shares of our common stock issuable pursuant to such rights, options or warrants; and | |||
Y= | the number of shares of our common stock equal to (i) the aggregate price payable to exercise such rights, options or warrants, divided by |
Any increase made under this clause (2) will be made successively whenever any such rights, options or warrants are issued and shall become effective immediately after the Close of Business on the record date for such issuance. To the extent that such rights, options or warrants are not exercised prior to their expiration or shares of common stock are not delivered after the exercise of such rights, options or warrants, each Fixed Conversion Rate shall be decreased to such Fixed Conversion Rate that would then be in effect had the increase with respect to the issuance of such rights, options or warrants been made on the basis of delivery of only the number of shares of common stock actually delivered, if any. If such rights, options or warrants are not so issued, each Fixed Conversion Rate shall be immediately readjusted, effective as of the date our board of directors or a committee thereof determines not to pay such dividend or distribution, to such Fixed Conversion Rate that would then be in effect if such record date for such issuance had not occurred.
For the purpose of this clause (2), in determining whether any rights, options or warrants entitle the holders of our common stock to subscribe for or purchase shares of our common stock at less than such Average VWAP per share for the 10 consecutive trading day period ending on, and including, the Trading Day immediately preceding the date of announcement of such issuance, and in determining the aggregate offering price of such shares of our common stock, there shall be taken into account any consideration received by us for such rights, options or warrants and any amount payable on exercise or conversion thereof, the value of such consideration, if other than cash, to be determined by our board of directors or a committee thereof.
| (3) | If we distribute shares of our capital stock, evidences of our indebtedness, other assets or property of ours or rights, options or warrants to acquire our capital stock or other securities, to all or substantially all holders of our common stock, excluding: |
| • | dividends, distributions or issuances as to which the provisions set forth in clause (1) or (2) shall apply; |
| • | dividends or distributions paid exclusively in cash as to which the provisions set forth in clause (4) below shall apply; |
A-36
| • | any dividends and distributions upon conversion of, or in exchange for, our common stock in connection with a recapitalization, reclassification, change, consolidation, merger or other combination, share exchange, or sale, lease or other transfer or disposition resulting in the change in the conversion consideration as described below under “—Recapitalizations, Reclassifications and Changes of Our Common Stock”; |
| • | except as otherwise described below, rights issued pursuant to a shareholder rights plan adopted by us; and |
| • | spin-offs as to which the provisions set forth below in this clause (3) shall apply; |
then each Fixed Conversion Rate will be increased based on the following formula:
CR 1 | = | CR 0 | × | SP 0 | ||||||||||||||
SP 0 – FMV |
where,
CR 0 = | such Fixed Conversion Rate in effect immediately prior to the Close of Business on the record date for such distribution; | |||
CR 1 = | such Fixed Conversion Rate in effect immediately after the Close of Business on such record date; | |||
SP 0 = | the Average VWAP per share of our common stock over the 10 consecutive Trading Day period ending on, and including, the Trading Day immediately preceding the ex-date (as defined herein) for such distribution; and | |||
FMV = | the fair market value (as determined by our board of directors or a committee thereof in good faith) of the shares of capital stock, evidences of indebtedness, assets, property, rights, options or warrants so distributed, expressed as an amount per share of our common stock on the ex-date for such distribution. |
“Ex-date”
means the first date on which the shares of our common stock trade on the applicable exchange or in the applicable market, regular way, without the right to receive the issuance, dividend or distribution in question, from us or, if applicable, from the seller of our common stock on such exchange or market (in the form of due bills or otherwise) as determined by such exchange or market.Any increase made under the portion of this clause (3) above will become effective immediately after the Close of Business on the record date for such distribution. If such distribution is not so paid or made, each Fixed Conversion Rate shall be immediately readjusted, effective as of the date our board of directors or a committee thereof determines not to pay such dividend or distribution, to be such Fixed Conversion Rate that would then be in effect if such distribution had not been declared.
Notwithstanding the foregoing, if “FMV” (as defined above) is equal to or greater than “SP
0
” (as defined above), or if the difference is less than $1.00, in lieu of the foregoing increase, each holder shall receive, in respect of each share of Series A preferred stock, at the same time and upon the same terms as holders of our common stock, the amount and kind of our capital stock, evidences of our indebtedness, other assets or property of ours or rights, options or warrants to acquire our capital stock or other securities that such holder would have received if such holder owned a number of shares of common stock equal to the Maximum Conversion Rate in effect on the record date for the distribution.If we issue rights, options or warrants that are only exercisable upon the occurrence of certain triggering events, then:
| • | we will not adjust the Fixed Conversion Rates pursuant to the foregoing in this clause (3) until the earliest of these triggering events occurs; and |
A-37
| • | we will readjust the Fixed Conversion Rates to the extent any of these rights, options or warrants are not exercised before they expire or are terminated without exercise by any holder thereof; provided |
With respect to an adjustment pursuant to this clause (3) where there has been a payment of a dividend or other distribution on our common stock of shares of capital stock of any class or series, or similar equity interest, of or relating to a subsidiary or other business unit, that are, or, when issued, will be, listed or admitted for trading on a U.S. national securities exchange, which we refer to as a
“spin-off,”
each Fixed Conversion Rate will be increased based on the following formula:CR 1 | = | CR 0 | × | FMV 0 + MP0 | ||||||||||||||
MP 0 |
where,
CR 0 = | such Fixed Conversion Rate in effect immediately prior to the Close of Business on the last Trading Day of the 10 consecutive Trading Day period commencing on, and including, the ex-date for thespin-off (the “valuation period”); | |||
CR 1 = | such Fixed Conversion Rate in effect immediately after the Close of Business on the last Trading Day of the valuation period; | |||
FMV 0 = | the Average VWAP per share of the capital stock or similar equity interest distributed to holders of our common stock applicable to one share of our common stock over the valuation period; and | |||
MP 0 = | the Average VWAP per share of our common stock over the valuation period. |
The increase to each Fixed Conversion Rate under the preceding paragraph will become effective at the Close of Business on the last Trading Day of the valuation period. Notwithstanding the foregoing, if any date for determining the number of shares of our common stock issuable to a holder occurs during the valuation period, the reference to “10” in the preceding paragraph shall be deemed replaced with such lesser number of Trading Days as have elapsed between the beginning of the valuation period and such determination date for purposes of determining such Fixed Conversion Rate. If such dividend or distribution is not so paid, each Fixed Conversion Rate shall be decreased, effective as of the date our board of directors or a committee thereof determines not to make or pay such dividend or distribution, to be such Fixed Conversion Rate that would then be in effect if such dividend or distribution had not been declared.
| (4) | If any cash dividend or distribution is made to all or substantially all holders of our common stock, other than a regular, quarterly cash dividend that does not exceed $ per share (the “Initial Dividend Threshold”), each Fixed Conversion Rate will be adjusted based on the following formula: |
CR 1 | = | CR 0 | × | SP 0 – T | ||||||||||||||
SP 0 – C |
where,
CR 0 = | such Fixed Conversion Rate in effect immediately prior to the Close of Business on the record date for such dividend or distribution; | |||
CR 1 = | such Fixed Conversion Rate in effect immediately after the Close of Business on the record date for such dividend or distribution; |
A-38
SP 0 = | the Average VWAP per share of our common stock over the 10 consecutive Trading Day period ending on, and including, the Trading Day immediately preceding the ex-date for such distribution; | |||
T = | the Initial Dividend Threshold; provided that if the dividend or distribution is not a regular quarterly cash dividend, the Initial Dividend Threshold shall be deemed to be zero; and | |||
C = | the amount in cash per share we distribute to all or substantially all holders of our common stock. |
The Initial Dividend Threshold is subject to adjustment in a manner inversely proportional to adjustments to the Fixed Conversion Rate; provided that no adjustment will be made to the Initial Dividend Threshold for any adjustment to the Fixed Conversion Rate under this clause (4).
Any increase made under this clause (4) shall become effective immediately after the Close of Business on the record date for such dividend or distribution. If such dividend or distribution is not so paid, each Fixed Conversion Rate shall be decreased, effective as of the date our board of directors or a committee thereof determines not to make or pay such dividend or distribution, to be such Fixed Conversion Rate that would then be in effect if such dividend or distribution had not been declared.
Notwithstanding the foregoing, if “C” (as defined above) is equal to or greater than “SP
0
” (as defined above), or if the difference is less than $1.00, in lieu of the foregoing increase, each holder shall receive, for each share of Series A preferred stock, at the same time and upon the same terms as holders of shares of our common stock, the amount of cash that such holder would have received if such holder owned a number of shares of our common stock equal to the Maximum Conversion Rate on the record date for such cash dividend or distribution.| (5) | If we or any of our subsidiaries make a payment in respect of a tender or exchange offer for our common stock, to the extent that the cash and value of any other consideration included in the payment per share of common stock exceeds the Average VWAP per share of our common stock over the 10 consecutive Trading Day period commencing on, and including, the Trading Day next succeeding the last date on which tenders or exchanges may be made pursuant to such tender or exchange offer (the “expiration date”), each Fixed Conversion Rate will be increased based on the following formula: |
CR 1 | = | CR 0 | × | AC + (SP 1 × OS1 ) | ||||||||||||||
OS 0 × SP1 |
where,
CR 0 = | such Fixed Conversion Rate in effect immediately prior to the Close of Business on the 10 th Trading Day immediately following, and including, the Trading day next succeeding the expiration date; | |||
CR 1 = | such Fixed Conversion Rate in effect immediately after the Close of Business on the 10 th Trading Day immediately following, and including, the Trading day next succeeding the expiration date; | |||
AC = | the aggregate value of all cash and any other consideration (as determined by our board of directors or a committee thereof in good faith) paid or payable for shares purchased in such tender or exchange offer; | |||
OS 0 = | the number of shares of our common stock outstanding immediately prior to the expiration date (prior to giving effect to the purchase of all shares accepted for purchase or exchange in such tender or exchange offer); | |||
OS 1 = | the number of shares of our common stock outstanding immediately after the expiration date (after giving effect to the purchase of all shares accepted for purchase or exchange in such tender or exchange offer); and | |||
SP 1 = | the Average VWAP of our common stock over the 10 consecutive Trading Day period commencing on, and including, the Trading Day next succeeding the expiration date (the “averaging period”). |
A-39
The increase to each Fixed Conversion Rate under the preceding paragraph will become effective at the Close of Business on the 10th Trading Day immediately following, and including, the Trading Day next succeeding the expiration date. Notwithstanding the foregoing, if any date for determining the number of shares of our common stock issuable to a holder occurs within the 10 Trading Days immediately following, and including, the Trading Day next succeeding the expiration date of any tender or exchange offer, the reference to “10” in the preceding paragraph shall be deemed replaced with such lesser number of Trading Days as have elapsed between the expiration date of such tender or exchange offer and such determination date for purposes of determining such Fixed Conversion Rate. For the avoidance of doubt, no adjustment under this clause (5) will be made if such adjustment would result in a decrease in any Fixed Conversion Rate, except as set forth below.
In the event that we or one of our subsidiaries is obligated to purchase shares of common stock pursuant to any such tender offer or exchange offer, but we or such subsidiary is permanently prevented by applicable law from effecting any such purchases, or all such purchases are rescinded, then each Fixed Conversion Rate shall again be adjusted to be such Fixed Conversion Rate that would then be in effect if such tender offer or exchange offer had not been made.
We may, to the extent permitted by law and the rules of NYSE or any other securities exchange on which our common stock or the Series A preferred stock is then listed, increase each Fixed Conversion Rate by any amount for a period of at least 20 Business Days if such increase is irrevocable during such 20 Business Days and our board of directors, or a committee thereof, determines that such increase would be in our best interest. In addition, we may make such increases in each Fixed Conversion Rate as we deem advisable in order to avoid or diminish any income tax to holders of our common stock resulting from any dividend or distribution of shares of our common stock (or issuance of rights or warrants to acquire shares of our common stock) or from any event treated as such for income tax purposes or for any other reason. We may only make such a discretionary adjustment if we make the same proportionate adjustment to each Fixed Conversion Rate.
Holders of the Series A preferred stock may, in certain circumstances, including a distribution of cash dividends to holders of our shares of common stock, be deemed to have received a distribution subject to U.S. Federal income tax as a dividend as a result of an adjustment or the nonoccurrence of an adjustment to the Fixed Conversion Rates. See “Certain United States Federal Income and Estate Tax Consequences.”
If we have a rights plan in effect upon conversion of the Series A preferred stock into common stock, you will receive, in addition to any shares of common stock received in connection with such conversion, the rights under the rights plan. However, if, prior to any conversion, the rights have separated from the shares of common stock in accordance with the provisions of the applicable rights plan, each Fixed Conversion Rate will be adjusted at the time of separation as if we distributed to all or substantially all holders of our common stock, shares of our capital stock, evidences of indebtedness, assets, property, rights, options or warrants as described in clause (3) above, subject to readjustment in the event of the expiration, termination or redemption of such rights. We do not currently have a stockholder rights plan in effect.
Adjustments to the Fixed Conversion Rates will be calculated to the nearest 1/10,000th of a share of our common stock. No adjustment to any Fixed Conversion Rate will be required unless the adjustment would require an increase or decrease of at least 1% of the Fixed Conversion Rate;,, that if an adjustment is not made because the adjustment does not change the Fixed Conversion Rates by at least 1%, then such adjustment will be carried forward and taken into account in any future adjustment. Notwithstanding the foregoing, on each date for determining the number of shares of our common stock issuable to a holder upon any conversion of the Series A preferred stock, we will give effect to all adjustments that we have otherwise deferred pursuant to this sentence, and those adjustments will no longer be carried forward and taken into account in any future adjustment.
provided
however
A-40
The Fixed Conversion Rates will not be adjusted:
| • | upon the issuance of any shares of our common stock pursuant to any present or future plan providing for the reinvestment of dividends or interest payable on our securities and the investment of additional optional amounts in common stock under any plan; |
| • | upon the issuance of any shares of our common stock or rights or warrants to purchase those shares pursuant to any present or future benefit or other incentive plan or program of or assumed by us or any of our subsidiaries; |
| • | upon the issuance of any shares of our common stock pursuant to any option, warrant, right or exercisable, exchangeable or convertible security not described in the preceding bullet and outstanding as of the Initial Issue Date; |
| • | for a change in the par value of our common stock; |
| • | for stock repurchases that are not tender offers referred to in clause (5) of the adjustments above, including structured or derivative transactions or pursuant to a stock repurchase program approved by our board of directors; |
| • | for accumulated dividends on the Series A preferred stock, except as described above under “—Mandatory Conversion,” “—Early Conversion at the Option of the Holder” and “—Conversion at the Option of the Holder upon Fundamental Change; Fundamental Change Dividend Make-Whole Amount”; or |
| • | for any other issuance of shares of our common stock or any securities convertible into or exchangeable for shares of our common stock or the right to purchase shares of our common stock or such convertible or exchangeable securities, except as described above. |
Except as otherwise provided above, we will be responsible for making all calculations called for under the Series A preferred stock. These calculations include, but are not limited to, determinations of the Fundamental Change Share Price, the VWAPs, the Average VWAPs and the Fixed Conversion Rates of the Series A preferred stock and shall be made in good faith.
We will be required, within 10 Business Days after the Fixed Conversion Rates are adjusted, to provide or cause to be provided written notice of the adjustment to the holders of the Series A preferred stock. We will also be required to deliver a statement setting forth in reasonable detail the method by which the adjustment to each Fixed Conversion Rate was determined and setting forth each adjusted Fixed Conversion Rate.
For the avoidance of doubt, if an adjustment is made to the Fixed Conversion Rates, no separate inversely proportionate adjustment will be made to the Initial Price or the Threshold Appreciation Price because the Initial Price is equal to the Maximum Conversion Rate (as adjusted in the manner described herein) and the Threshold Appreciation Price is equal to divided by the Minimum Conversion Rate (as adjusted in the manner described herein).
divided by
Whenever the terms of the Series A preferred stock require us to calculate the VWAP per share of our common stock over a span of multiple days, our board of directors or an authorized committee thereof will make appropriate adjustments in good faith (including, without limitation, to the Applicable Market Value, the Early Conversion Average Price, the Fundamental Change Share Price and the Average Price (as the case may be)) to account for any adjustments to the Fixed Conversion Rates (as the case may be) that become effective, or any event that would require such an adjustment if the
ex-date,
effective date, record date or expiration date (as the case may be) of such event occurs, during the relevant period used to calculate such prices or values (as the case may be).A-41
If:
| • | the record date for a dividend or distribution on shares of our common stock occurs after the end of the 20 consecutive Trading Day period used for calculating the Applicable Market Value and before the Mandatory Conversion Date; and |
| • | that dividend or distribution would have resulted in an adjustment of the number of shares issuable to the holders of the Series A preferred stock had such record date occurred on or before the last Trading Day of such 20-Trading Day period, |
then we will deem the holders of the Series A preferred stock to be holders of record of our common stock for purposes of that dividend or distribution. In this case, the holders of the Series A preferred stock would receive the dividend or distribution on our common stock together with the number of shares of our common stock issuable upon mandatory conversion of the Series A preferred stock.
Recapitalizations, Reclassifications and Changes of Our Common Stock
In the event of:
| • | any consolidation or merger of us with or into another person (other than a merger or consolidation in which we are the surviving corporation and in which the shares of our common stock outstanding immediately prior to the merger or consolidation are not exchanged for cash, securities or other property of us or another person); |
| • | any sale, transfer, lease or conveyance to another person of all or substantially all of our property and assets; |
| • | any reclassification of our common stock into securities, including securities other than our common stock; or |
| • | any statutory exchange of our securities with another person (other than in connection with a merger or acquisition), |
in each case, as a result of which our common stock would be converted into, or exchanged for, stock, other securities or other property or assets (including cash or any combination thereof) (each, a “Reorganization Event”), each share of the Series A preferred stock outstanding immediately prior to such Reorganization Event shall, without the consent of the holders of the Series A preferred stock, become convertible into the kind of stock, other securities or other property or assets (including cash or any combination thereof) that such holder would have been entitled to receive if such holder had converted its Series A preferred stock into common stock immediately prior to such Reorganization Event (such stock, other securities or other property or assets (including cash or any combination thereof), the “Exchange Property,” with each “Unit of Exchange Property” meaning the kind and amount of Exchange Property that a holder of one share of common stock is entitled to receive).
If the transaction causes our common stock to be converted into, or exchanged for, the right to receive more than a single type of consideration (determined based in part upon any form of stockholder election), the Exchange Property into which the Series A preferred stock will be convertible will be deemed to be:
| • | the weighted average of the types and amounts of consideration received by the holders of our common stock that affirmatively make such an election; and |
| • | if no holders of our common stock affirmatively make such an election, the types and amounts of consideration actually received by the holders of our common stock. |
We will notify holders of the Series A preferred stock of the weighted average referred to in the first bullet point in the preceding sentence as soon as practicable after such determination is made.
A-42
The number of Units of Exchange Property we will deliver for each share of the Series A preferred stock converted following the effective date of such Reorganization Event will be determined as if references to our common stock in the description of the conversion rate applicable upon mandatory conversion, Early Conversion and Early Fundamental Change Conversion were to Units of Exchange Property (without interest thereon and without any right to dividends or distributions thereon which have a record date prior to the date such Series A preferred stock is actually converted). For the purpose of determining which bullet of the definition of conversion rate in the second paragraph under “—Mandatory Conversion” will apply upon mandatory conversion, and for the purpose of calculating the conversion rate if the second bullet is applicable, the value of a Unit of Exchange Property will be determined in good faith by our board of directors or an authorized committee thereof (which determination will be final), except that if a Unit of Exchange Property includes common stock or American Depositary Receipts, or “ADRs,” that are traded on a U.S. national securities exchange, the value of such common stock or ADRs will be the average over the 20 consecutive Trading Day period used for calculating the Applicable Market Value of the volume-weighted Average Prices for such common stock or ADRs, as displayed on the applicable Bloomberg screen (as determined in good faith by our board of directors or an authorized committee thereof (which determination will be final)); or, if such price is not available, the average market value per share of such common stock or ADRs over such period as determined, using a volume-weighted average method, by a nationally recognized independent investment banking firm retained by us for this purpose. The provisions of this paragraph will apply to successive Reorganization Events, and the provisions summarized under “—Anti-dilution Adjustments” will apply to any shares of capital stock or ADRs of us or any successor received by the holders of shares of our common stock in any such Reorganization Event.
We (or any successor to us) will, as soon as reasonably practicable (but in any event within 20 calendar days) after the occurrence of any Reorganization Event provide written notice to the holders of the Series A preferred stock of such occurrence and of the kind and amount of cash, securities or other property that constitute the Exchange Property. Failure to deliver such notice will not affect the operation of the provisions described in this section.
It is possible that certain consolidations, mergers, combinations or other transactions could result in tax gains or losses to the holders either as a result of the transaction or the conversion thereafter. Holders are encouraged to consult with their own tax advisors regarding the tax consequences of the ownership, disposition and conversion of the Series A preferred stock.
Notices
We will send all notices or communications to holders of the Series A preferred stock pursuant to the certificate of designations in writing by first class mail, postage prepaid, to the holders’ respective addresses shown on the register for the Series A preferred stock. However, in the case of Series A preferred stock in the form of global securities, we are permitted to send notices or communications to holders pursuant to DTC’s procedures, and notices and communications that we send in this manner will be deemed to have been properly sent to such holders in writing.
Reservation of Shares
We will at all times reserve and keep available out of the authorized and unissued shares of common stock, solely for issuance upon conversion of the Series A preferred stock, the maximum number of shares of our common stock as shall be issuable from time to time upon the conversion of all the shares of the Series A preferred stock then outstanding.
Book-Entry, Delivery and Form
The Series A preferred stock will be issued in global form. DTC or its nominee will be the sole registered holder of the Series A preferred stock. Ownership of beneficial interests in the Series A preferred stock in global
A-43
form will be limited to persons who have accounts with DTC (“Participants”) or persons who hold interests through such Participants. Ownership of beneficial interests in the Series A preferred stock in global form will be shown on, and the transfer of that ownership will be effected only through, records maintained by DTC or its nominee (with respect to interests of Participants) and the records of Participants (with respect to interests of persons other than Participants).
So long as DTC, or its nominee, is the registered owner or holder of a global certificate representing the shares of the Series A preferred stock, DTC or such nominee, as the case may be, will be considered the sole holder of the shares of the Series A preferred stock represented by such global certificate for all purposes under the certificate of designations establishing the terms of the Series A preferred stock. No beneficial owner of an interest in the shares of the Series A preferred stock in global form will be able to transfer that interest except in accordance with the applicable procedures of DTC in addition to those provided for under the certificate of designations establishing the terms of the Series A preferred stock.
Payments of dividends on the global certificate representing the shares of the Series A preferred stock will be made to DTC or its nominee, as the case may be, as the registered holder thereof. None of us, the transfer agent, registrar, conversion or dividend disbursing agent will have any responsibility or liability for any aspect of the records relating to or payments made on account of beneficial ownership interests in a global certificate representing the shares of the Series A preferred stock or for maintaining, supervising or reviewing any records relating to such beneficial ownership interests.
We expect that DTC or its nominee, upon receipt of any payment of dividends in respect of a global certificate representing the shares of the Series A preferred stock, will credit Participants’ accounts with payments in amounts proportionate to their respective beneficial ownership interests in the aggregate Liquidation Preference of such global certificate representing the shares of the Series A preferred stock as shown on the records of DTC or its nominee, as the case may be. We also expect that payments by Participants to owners of beneficial interests in such global certificate representing the shares of the Series A preferred stock held through such Participants will be governed by standing instructions and customary practices, as is now the case with securities held for the accounts of customers registered in the names of nominees for such customers. Such payments will be the responsibility of such Participants.
Transfers between Participants in DTC will be effected in the ordinary way in accordance with DTC rules and will be settled in
same-day
funds.We understand that DTC is:
| • | a limited purpose trust company organized under the laws of the State of New York; |
| • | a “banking organization” within the meaning of New York Banking Law; |
| • | a member of the Federal Reserve System; |
| • | a “clearing corporation” within the meaning of the Uniform Commercial Code; and |
| • | a “Clearing Agency” registered pursuant to the provisions of Section 17A of the Exchange Act. |
DTC was created to hold securities for its Participants and facilitate the clearance and settlement of securities transactions between Participants through electronic book-entry changes in accounts of its Participants, thereby eliminating the need for physical movement of certificates. Participants include:
| • | securities brokers and dealers; |
| • | banks and trust companies; and |
| • | clearing corporations and certain other organizations. |
A-44
Indirect access to the DTC system is available to others such as banks, brokers, dealers and trust companies that clear through or maintain a custodial relationship with a Participant, either directly or indirectly (indirect Participants).
Although DTC is expected to follow the foregoing procedures in order to facilitate transfers of interests in a global security among its Participants, it is under no obligation to perform or continue to perform such procedures, and such procedures may be discontinued at any time. None of us, the transfer agent, registrar, conversion or dividend disbursing agent will have any responsibility for the performance by DTC or its Participants or indirect Participants of their respective obligations under the rules and procedures governing their operations.
If DTC is at any time unwilling or unable to continue as a depositary for the shares of the Series A preferred stock in global form or DTC ceases to be registered as a clearing agency under the Exchange Act, and in either case a successor depositary is not appointed by us within 90 days, we will issue certificated shares in exchange for the global securities.
A-45
MATERIAL U.S. FEDERAL INCOME TAX CONSEQUENCES TO
HOLDERS OF OUR SERIES A MANDATORY CONVERTIBLE PREFERRED STOCK
The following discussion is a summary of the material U.S. federal income tax consequences of the purchase, ownership and disposition of our Series A Mandatory Convertible Preferred Stock (herein referred to as the “Mandatory Convertible Preferred Stock”) issued pursuant to this offering, and the ownership and disposition of shares of our common stock received upon conversion of the Mandatory Convertible Preferred Stock, but does not purport to be a complete analysis of all potential U.S. federal income tax effects.
The effects of other U.S. federal tax laws, such as estate and gift tax laws, and any applicable state, local or
non-U.S.
tax laws are not discussed. Holders should consult their tax advisors regarding the significant U.S. federal estate tax consequences that could apply to an investment in our Mandatory Convertible Preferred Stock or common stock.This discussion is based on the U.S. Internal Revenue Code of 1986, as amended, or the Code, Treasury Regulations promulgated thereunder, judicial decisions, and published rulings and administrative pronouncements of the IRS, in each case, as in effect as of the date hereof. These authorities may change or be subject to differing interpretations. Any such change or differing interpretation may be applied retroactively in a manner that could adversely affect a holder of our Mandatory Convertible Preferred Stock or common stock. We have not sought and will not seek any rulings from the IRS regarding the matters discussed below. There can be no assurance the IRS or a court will not take a contrary position to that discussed below regarding the U.S. federal income tax consequences of the purchase, ownership and disposition of our Mandatory Convertible Preferred Stock or common stock.
This discussion is limited to holders that hold our Mandatory Convertible Preferred Stock or common stock received upon a conversion thereof as a “capital asset” within the meaning of Section 1221 of the Code (generally, property held for investment). This discussion does not address all U.S. federal income tax consequences relevant to a holder’s particular circumstances, including the impact of the alternative minimum tax or the Medicare contribution tax on net investment income. In addition, it does not address consequences relevant to holders subject to special rules, including, without limitation:
| • | U.S. expatriates and former citizens or long-term residents of the United States; |
| • | persons holding our Mandatory Convertible Preferred Stock or common stock as part of a hedge, straddle or other risk reduction strategy or as part of a conversion transaction or other integrated investment; |
| • | banks, insurance companies, and other financial institutions; |
| • | brokers, dealers or traders in securities, currencies or commodities; |
| • | “controlled foreign corporations,” “passive foreign investment companies,” and corporations that accumulate earnings to avoid U.S. federal income tax; |
| • | partnerships or other entities or arrangements treated as partnerships for U.S. federal income tax purposes (and investors therein); |
| • | tax-exempt entities or governmental entities; |
| • | persons deemed to sell our Mandatory Convertible Preferred Stock or common stock under the constructive sale provisions of the Code; |
| • | persons who hold or receive our Mandatory Convertible Preferred Stock or common stock pursuant to the exercise of any employee stock option or otherwise as compensation; |
| • | tax-qualified retirement plans; |
A-46
| • | “qualified foreign pension funds” as defined in Section 897(l)(2) of the Code and entities all of the interests of which are held by qualified foreign pension funds; |
| • | persons subject to special tax accounting rules as a result of any item of gross income with respect to the stock being taken into account in an “applicable financial statement” (as defined in the Code); |
| • | U.S. Holders holding Mandatory Convertible Preferred Stock or common stock through non-U.S. brokers or othernon-U.S. intermediaries; |
| • | regulated investment companies; and |
| • | real estate investment trusts. |
If an entity treated as a partnership for U.S. federal income tax purposes holds our Mandatory Convertible Preferred Stock or common stock, the tax treatment of a partner in the partnership will depend on the status of the partner, the activities of the partnership and certain determinations made at the partner level. Accordingly, partnerships considering an investment in our Mandatory Convertible Preferred Stock or common stock and the partners in such partnerships should consult their tax advisors regarding the U.S. federal income tax consequences to them.
THIS DISCUSSION IS FOR INFORMATION PURPOSES ONLY AND IS NOT TAX ADVICE. INVESTORS SHOULD CONSULT THEIR TAX ADVISORS WITH RESPECT TO THE APPLICATION OF THE U.S. FEDERAL INCOME TAX LAWS TO THEIR PARTICULAR SITUATIONS AS WELL AS ANY TAX CONSEQUENCES OF THE PURCHASE, OWNERSHIP AND DISPOSITION OF OUR MANDATORY CONVERTIBLE PREFERRED STOCK OR COMMON STOCK ARISING UNDER THE U.S. FEDERAL ESTATE OR GIFT TAX LAWS OR UNDER THE LAWS OF ANY STATE, LOCAL OR
NON-U.S.
TAXING JURISDICTION OR UNDER ANY APPLICABLE INCOME TAX TREATY.U.S. Holders
The discussion in this section is addressed to a holder of the Mandatory Convertible Preferred Stock and common stock received in respect thereof that is a U.S. holder for United States federal income tax purposes. A “U.S. holder” means a beneficial owner of shares of the Mandatory Convertible Preferred Stock or our common stock that, for United States federal income tax purposes, is:
| • | an individual who is a citizen or resident of the United States; |
| • | a corporation created or organized in or under the laws of the United States, any state thereof or the District of Columbia; |
| • | an estate the income of which is subject to United States federal income taxation regardless of its source; or |
| • | a trust if it (1) is subject to the primary supervision of a court within the United States and one or more United States persons have the authority to control all substantial decisions of the trust or (2) has a valid election in effect under applicable United States Treasury regulations to be treated as a United States person. |
Dividends
Distributions with respect to the Mandatory Convertible Preferred Stock or our common stock will be taxable as dividends for United States federal income tax purposes when paid to the extent of our current or accumulated earnings and profits as determined for United States federal income tax purposes. To the extent that the amount of such distributions with respect to the Mandatory Convertible Preferred Stock or common stock exceeds our current and accumulated earnings and profits, such excess will be treated first as a
tax-free
return ofA-47
capital to the extent of the U.S. holder’s adjusted tax basis in such Mandatory Convertible Preferred Stock or common stock (determined separately for each share), as the case may be, and thereafter as capital gain from the sale of such Mandatory Convertible Preferred Stock or common stock, as applicable.
Distributions on the Mandatory Convertible Preferred Stock or common stock constituting dividends for United States federal income tax purposes that are paid to holders that are U.S. corporations will qualify for the dividends received deduction if certain holding period and other applicable requirements are met. However, any distribution (or the portion of any distribution) that exceeds our current and accumulated earnings and profits will not be eligible for the dividends received deduction. Dividends paid to a
non-corporate
U.S. holder will qualify for taxation at special rates if certain holding period and other applicable requirements are met.If we make a distribution on our Mandatory Convertible Preferred Stock in the form of our common stock, we intend to treat such distribution as taxable for United States federal income tax purposes in the same manner as distributions of cash described above. The amount of such distribution and a U.S. holder’s tax basis in such common stock will equal the fair market value of such common stock on the distribution date, and a U.S. holder’s holding period for such common stock will begin on the day following the distribution date. Because such distribution would not give rise to any cash from which any applicable withholding tax could be satisfied, if we (or an applicable withholding agent) pay backup withholding on behalf of a U.S. holder (because such U.S. holder failed to establish an exemption from backup withholding), we may, at our option, or an applicable withholding agent may, withhold such taxes from shares of common stock, other assets of or current or subsequent payments of cash to such U.S. holder that are in the custody of such applicable withholding agent.
Extraordinary Dividends
Dividends that exceed certain thresholds in relation to a U.S. holder’s tax basis in the Mandatory Convertible Preferred Stock or our common stock could be characterized as an “extraordinary dividend” under the Code. Ifa corporate U.S. holder receives an extraordinary dividend on stock it has held for two years or less before thedividend announcement date, such corporate U.S. Holder will generally be required to reduce its tax basis in theMandatory Convertible Preferred Stock or common stock, as applicable, with respect to which such dividendwas made by the nontaxed portion of such dividend. If the amount of the reduction exceeds the corporate U.S.Holder’s tax basis in such stock, the excess is treated as taxable gain.
AStock or our common stock as long-term capital losses to the extent of any extraordinary dividends receivedby such
non-corporate
U.S. holder will be required to treat any losses on the sale of Mandatory Convertible Preferrednon-corporate
U.S. Holder that qualify for the preferential tax rate on dividends described above.Sale or Other Disposition
Subject to the following paragraph, a U.S. holder will generally recognize capital gain or loss on a sale or exchange (other than pursuant to a conversion into common stock) of the Mandatory Convertible Preferred Stock or common stock equal to the difference between the amount realized upon the sale or exchange (not including any proceeds attributable to declared and unpaid dividends, which will be taxable as described in “—Dividends” above to U.S. holders of record who have not previously included such dividends in income) and the holder’s adjusted tax basis (determined separately for each share) in the shares sold or exchanged. Such capital gain or loss will be long-term capital gain or loss if the holder’s holding period for the shares sold or exchanged is more than one year. The deductibility of capital losses is subject to limitations.
In the case of a redemption of the Mandatory Convertible Preferred Stock for cash, a redeemed U.S. holder will generally recognize capital gain or loss if the redemption meets at least one of the following requirements: (i) the redemption is “not essentially equivalent to a dividend” as determined for United States federal income tax purposes, (ii) the redemption results in a “complete termination” of the holder’s interest in our stock (preferred
A-48
and common), or (iii) the redemption is “substantially disproportionate” with respect to the holder of Mandatory Convertible Preferred Stock as determined for United States federal income tax purposes. If the redemption satisfies any of these requirements, the redemption will be treated as a sale or exchange of the Mandatory Convertible Preferred Stock and such holder will recognize capital gain or loss (as described in the preceding paragraph). If the redemption does not satisfy any of these requirements, the holder will be treated as having received a distribution on such stock (in an amount that generally will be equal to the amount of cash received in the redemption) with the general consequences described in “—Dividends” above. In such case, the holder’s tax basis in the Mandatory Convertible Preferred Stock that is redeemed would be allocated to the holder’s remaining stock, if any, or possibly to stock owned by him constructively if the holder of Mandatory Convertible Preferred Stock does not continue to own, directly, any of our stock.
Conversion of Mandatory Convertible Preferred Stock into Common Stock
As a general rule, a U.S. holder will not recognize any gain or loss in respect of the receipt of common stock upon the conversion of the Mandatory Convertible Preferred Stock, except to the extent of dividends in arrears and cash received in lieu of a fractional share, as described below. Except to the extent of common stock treated as received in respect of any dividends in arrears as described below, the adjusted tax basis of common stock received on conversion will equal the adjusted tax basis of the Mandatory Convertible Preferred Stock converted (reduced by the portion of adjusted tax basis allocated to any fractional shares of common stock exchanged for cash, as described below), and the holding period of such common stock received on conversion will generally include the period during which the Mandatory Convertible Preferred Stock was held prior to conversion.
Cash received in lieu of a fractional share of common stock will generally be treated as a payment in a taxable exchange for such fractional share, and gain or loss will be recognized on the receipt of cash in an amount equal to the difference between the amount of cash received and the amount of adjusted tax basis allocable to the fractional share. Any cash received attributable to any declared but unpaid dividends on the Mandatory Convertible Preferred Stock will be treated as described above under “—Dividends.” Furthermore, we intend to treat common stock received in respect of declared but unpaid dividends on the Mandatory Convertible Preferred Stock as described above under “—Dividends.” The adjusted tax basis of any common stock received upon conversion that is attributable to accrued and unpaid dividends will equal its fair market value at the time it is distributed and its holding period will begin on the day following the distribution.
You should consult your own tax advisor to determine the specific tax treatment of the receipt of shares in respect of accrued but unpaid dividends or cash in lieu of a fractional share in your particular circumstances. Upon certain conversions of our Mandatory Convertible Preferred Stock, we may, in respect of any such conversion, pay a holder common stock and/or cash in respect of the present value of future dividends (for example, as described under “Description of Series A Preferred Stock—Conversion at the Option of the Holder upon Fundamental Change; Fundamental Change Dividend Make-Whole Amount”). The tax consequences of such payment of cash or common stock are uncertain. Although not free from doubt, we believe that the better view is to treat any such cash or shares of our common stock as additional consideration received in the conversion. If this treatment is correct, then (i) to the extent a U.S. holder realizes gain in the conversion, such gain should be taxable to the extent of any cash received by such U.S. holder, (ii) any such taxable gain generally would be treated as capital gain unless such receipt of cash has the effect of the distribution of a dividend (based on similar principles to those applicable to redemptions of stock for cash (as described above in “Sale or Other Taxable Disposition”)), in which case such gain (to the extent such gain does not exceed a ratable share of our accumulated earnings and profits) should be treated as a dividend and (iii) a U.S. holder’s basis in the shares of common stock received upon conversion (including the shares of our common stock received in respect of future dividends, but excluding the shares of our common stock received in respect of dividend arrearages or declared but unpaid dividends) should equal its basis in the Mandatory Convertible Preferred Stock being converted, increased by any gain recognized by such U.S. holder and reduced by any cash received in respect of any future dividends. For this purpose, a U.S. holder should realize gain on the conversion equal to the excess, if any, of the sum of the cash and the fair market value of shares of our common stock received (including the shares of our
A-49
common stock received in respect of future dividends, but excluding the shares of our common stock in respect of dividend arrearages or declared but unpaid dividends) over such a U.S. holder’s adjusted tax basis in our Mandatory Convertible Preferred Stock immediately prior to conversion. A U.S. holder will not be permitted to recognize any loss realized upon its conversion of our Mandatory Convertible Preferred Stock into our common stock.
U.S. holders should be aware that the tax treatment described in the preceding paragraph is not certain and may be challenged by the IRS, including on grounds that the amount received attributable to future dividends represents a taxable dividend to the extent we have earnings and profits at the time of conversion, as described above under “—Distributions Generally.” U.S. Holders should consult their own tax advisors to determine the specific tax treatment of such additional shares in their particular circumstances.
Adjustment of Conversion Price
The conversion price of the Mandatory Convertible Preferred Stock is subject to adjustment under certain circumstances. A U.S. holder of the Mandatory Convertible Preferred Stock may be treated as having received a constructive distribution includable in such U.S. holder’s income in the manner described under “—Dividends,” above, if and to the extent that certain adjustments in the conversion price increase the proportionate interest of the U.S. holder in our earnings and profits or assets. For example, a decrease in the conversion price to reflect a taxable dividend to holders of common stock will generally give rise to a deemed taxable dividend to the holders of Mandatory Convertible Preferred Stock to the extent of an allocable portion of our current or accumulated earnings and profits. In addition, an adjustment to the conversion price of the Mandatory Convertible Preferred Stock or a failure to make such an adjustment could potentially give rise to constructive distributions to U.S. holders of our common stock. Thus, under certain circumstances, U.S. holders may recognize income in the event of a constructive distribution even though they may not receive any cash or property. Because such constructive distribution would not give rise to any cash from which any applicable withholding tax could be satisfied, if we (or an applicable withholding agent) pay backup withholding on behalf of a U.S. holder (because such U.S. holder failed to establish an exemption from backup withholding), we may, at our option, or an applicable withholding agent may, withhold such taxes from shares of common stock, other assets of or current or subsequent payments of cash to such U.S. holder that are in the custody of such applicable withholding agent. Adjustments to the conversion price made pursuant to a bona fide reasonable adjustment formula which has the effect of preventing dilution in the interest of the U.S. holders of the Mandatory Convertible Preferred Stock, however, generally will not be considered to result in a constructive dividend distribution.
Information Reporting and Backup Withholding on U.S. Holders
In general, information reporting will apply with respect to the payment of dividends on the Mandatory Convertible Preferred Stock or common stock and the payment of proceeds on the sale or other taxable disposition of the Mandatory Convertible Preferred Stock or our common stock, unless a U.S. holder is an exempt recipient such as a corporation. Backup withholding may apply unless the U.S. holder provides proof of an applicable exemption or a correct taxpayer identification number, and otherwise complies with applicable requirements of the backup withholding rules.
Backup withholding is not an additional tax. Any amount withheld under the backup withholding rules from a payment to a holder is allowable as a credit against such holder’s United States federal income tax, which may entitle the holder to a refund, provided that the holder timely provides the required information to the IRS.
Non-U.S.
HoldersThe discussion in this section is addressed to holders of the Mandatory Convertible Preferred Stock and our common stock received in respect thereof that are
non-U.S.
holders. A“non-U.S.
holder” means a beneficial owner of Mandatory Convertible Preferred Stock or common stock received in respect thereof (other than a partnership or entity treated as a partnership for United States federal income tax purposes) that is not a U.S. holder.A-50
Distributions
Distributions (including any constructive distributions taxable as dividends as described below in “—Adjustment of Conversion Price” and any cash paid upon a conversion or redemption that is treated as a dividend) paid to aSale or Other Taxable Disposition.”
non-U.S.
holder with respect to the Mandatory Convertible Preferred Stock or our common stock will constitute dividends for U.S. federal income tax purposes to the extent paid from our current or accumulated earnings and profits, as determined for U.S. federal income tax purposes. Amounts not treated as dividends for U.S. federal income tax purposes will constitute a return of capital and first be applied against and reduce aNon-U.S.
Holder’s adjusted tax basis in its Mandatory Convertible Preferred Stock or common stock, as applicable (determined separately for each share), but not below zero. Any excess will be treated as capital gain and will be treated as described below under “—
Distributions treated as dividends generally will be subject to withholding of United States federal income tax at a 30% rate, or such lower rate as may be specified by an applicable income tax treaty. However, dividends that are effectively connected with the conduct of a trade or business by the
non-U.S.
holder unless an applicable income tax treaty provides otherwise, within the United States generally will not be subject to such withholding tax, provided certain certification and disclosure requirements are satisfied. Instead, unless an applicable income tax treaty provides otherwise, such dividends generally will be subject to United States federal income tax on a net income basis in the same manner as if thenon-U.S.
holder were a United States person as defined under the Code. A corporatenon-U.S.
holder may be subject to an additional “branch profits tax” at a 30% rate (or such lower rate as may be specified by an applicable income tax treaty) on earnings and profits that are effectively connected with its United States trade or business as adjusted for certain items.A
non-U.S.
holder of shares of the Mandatory Convertible Preferred Stock or our common stock who wishes to claim the benefit of an applicable treaty rate and avoid backup withholding, as discussed below, for dividends will be required (a) to complete the applicable Internal Revenue Service, or IRS, FormW-8
and certify under penalty of perjury that such holder is not a United States person as defined under the Code and is eligible for treaty benefits or (b) if shares of the Mandatory Convertible Preferred Stock or our common stock are held through certain foreign intermediaries, to satisfy the relevant certification requirements of applicable United States Treasury regulations. Special certification and other requirements apply to certainnon-U.S.
holders that are pass-through entities rather than corporations or individuals.A
non-U.S.
holder of shares of the Mandatory Convertible Preferred Stock or our common stock eligible for a reduced rate of United States withholding tax pursuant to an income tax treaty may obtain a refund of any excess amounts withheld by timely filing an appropriate claim for refund with the IRS.We may make distributions to holders of our Mandatory Convertible Preferred Stock that are paid in common stock. In general, while not free from doubt, distributions paid in common stock are intended to be treated for U.S. federal income tax purposes as if the holder received a distribution of cash in an amount equal to the fair market value of the distributed common stock on the date of the distributions and thus would generally be subject to the rules applicable to cash distributions (as discussed above). In addition, as discussed above under the heading “—U.S. Holders—Adjustments of Conversion Price,” adjustments to the conversion rate (or a failure to make certain adjustments) can result in constructive distributions to holders of our Mandatory Convertible Preferred Stock which would also generally be subject to the rules applicable to cash distributions (as discussed above). Because constructive dividends or distributions made in common stock will not give rise to any cash from which any applicable United States federal withholding tax can be satisfied, the applicable withholding agent generally will be required to collect U.S. federal withholding tax with respect to any such dividend from cash payments, common stock, or other assets of, or other distributions made to such holder that are in the custody of such applicable withholding agent.
A-51
Sale or Other Disposition
Subject to the discussion of backup withholding below, a
non-U.S.
holder generally will not be subject to United States federal income or withholding tax on income or gain recognized on the sale, exchange or redemption (including the deemed exchange that gives rise to a payment of cash in lieu of a fractional share) of the Mandatory Convertible Preferred Stock or our common stock (not including any amounts attributable to declared and unpaid dividends or a redemption that does not satisfy the requirements to be treated as a sale or exchange (as described above under “U.S. Holders—Sale or Other Disposition”), which will be taxable to anon-U.S.
holder as described above under “—Dividends”) unless:| • | the gain is effectively connected with a trade or business of the non-U.S. holder in the United States; |
| • | the non-U.S. holder is an individual who is present in the United States for 183 days or more in the taxable year of that disposition, and certain other conditions are met; or |
| • | we are or have been a “United States real property holding corporation” (“USRPHC”) for United States federal income tax purposes and certain other conditions are met. |
In the case of a
non-U.S.
holder described in the first bullet point above, unless an applicable income tax treaty provides otherwise, any gain will be subject to United States federal income tax on a net income basis generally in the same manner as if thenon-U.S.
holder were a United States person as defined under the Code, and anon-U.S.
holder that is treated as a corporation for U.S. federal income tax purposes may also be subject to a branch profits tax equal to 30% of its effectively connected earnings and profits, as adjusted for certain items.Except as otherwise provided by an applicable income tax treaty, an individual
non-U.S.
holder described in the second bullet point above will be subject to a 30% tax on any gain derived from the disposition, which may be offset by certain United States source capital losses, even though the individual is not considered a resident of the United States under the Code.With respect to the third bullet point above, we believe we currently are not, and do not anticipate becoming, a USRPHC. Because the determination of whether we are a USRPHC depends, however, on the fair market value of our U.S. real property interests (USRPIs) relative to the fair market value of our
non-U.S.
real property interests and our other business assets, there can be no assurance we currently are not a USRPHC or will not become one in the future. Even if we are or were to become a USRPHC, gain arising from the sale or other taxable disposition by anon-U.S.
holder of our common stock will not be subject to U.S. federal income tax if the Mandatory Convertible Preferred Stock or our common stock is “regularly traded,” as defined by applicable Treasury regulations, on an established securities market, and suchnon-U.S.
holder owned, actually and constructively, no more than 5% of the Mandatory Convertible Preferred Stock or our common stock throughout the shorter of the five-year period ending on the date of the sale or other taxable disposition or thenon-U.S.
holder’s holding period in the applicable stock.Conversion of Mandatory Convertible Preferred Stock into Common Stock
Non-U.S.
Holders generally will not recognize any gain or loss by reason of receiving common stock in exchange for Mandatory Convertible Preferred Stock upon conversion of the Mandatory Convertible Preferred Stock, except gain or loss will be recognized with respect to any cash received in lieu of a fractional share. Any cash received attributable to declared but unpaid dividends on the Mandatory Convertible Preferred Stock will be treated as described above under “—Distributions.” Furthermore, we intend to treat common stock received in respect of declared but unpaid dividends on the Mandatory Convertible Preferred Stock as a taxable distribution, and we intend to withhold tax from such distributions tonon-U.S.
holders as described above under “—Dividends.”Non-U.S.
Holders should consult their own tax advisors to determine the specific tax treatment of the receipt of shares in respect of accrued but unpaid dividends or cash in lieu of a fractional share in their particular circumstances.A-52
Information Reporting and Backup Withholding on
Non-U.S.
HoldersPayments of dividends on our Mandatory Convertible Preferred Stock or common stock will not be subject to backup withholding, provided the holder either certifies its
non-U.S.
status, such as by furnishing a valid IRS FormW-8BEN,
W-8BEN-E
orW-8ECI,
or otherwise establishes an exemption. However, information returns are required to be filed with the IRS in connection with any dividends on our Mandatory Convertible Preferred Stock or common stock paid to thenon-U.S.
holder, regardless of whether any tax was actually withheld. In addition, proceeds of the sale or other taxable disposition of our Mandatory Convertible Preferred Stock or common stock within the United States or conducted through U.S. brokers or certainnon-U.S.
brokers with specified connections to the United States may be subject to backup withholding or information reporting, unless the applicable withholding agent receives the certification described above, or the holder otherwise establishes an exemption. Proceeds of a disposition of our Mandatory Convertible Preferred Stock or common stock conducted through anon-U.S.
office of anon-U.S.
broker without specified connections to the United States generally will not, unless such proceeds are recharacterized as a dividend (as discussed above), be subject to backup withholding or information reporting.Copies of information returns that are filed with the IRS may also be made available under the
provisions of an applicable treaty or agreement to the tax authorities of the country in which the
non-U.S.
holder resides or is established. Backup withholding is not an additional tax. Any amounts withheld under the backup withholding rules may be allowed as a refund or a credit against anon-U.S.
holder’s U.S. federal income tax liability, provided the required information is timely furnished to the IRS.Additional Withholding Tax on Payments Made to Foreign Accounts
Withholding taxes may be imposed under Sections 1471 to 1474 of the Code (such Sections commonly referred to as the Foreign Account Tax Compliance Act, or FATCA) on certain types of payments made to
non-U.S.
financial institutions and certain othernon-U.S.
entities. Specifically, a 30% withholding tax may be imposed on dividends on, or (subject to the proposed Treasury Regulations discussed below) gross proceeds from the sale or other disposition of, our Mandatory Convertible Preferred Stock or common stock paid to a “foreign financial institution” or a“non-financial
foreign entity” (each as defined in the Code), whether such foreign financial institution ornon-financial
foreign entity is the beneficial owner or an intermediary, unless (1) the foreign financial institution undertakes certain diligence, withholding and reporting obligations, (2) thenon-financial
foreign entity either certifies it does not have any “substantial United States owners” (as defined in the Code) or furnishes identifying information regarding each substantial United States owner (including debt holders), or (3) the foreign financial institution ornon-financial
foreign entity otherwise qualifies for an exemption from these rules. If the payee is a foreign financial institution and is subject to the diligence and reporting requirements in (1) above, it must enter into an agreement with the U.S. Department of the Treasury requiring, among other things, that it undertake to identify accounts held by certain “specified United States persons” or “United States owned foreign entities” (each as defined in the Code), annually report certain information about such accounts, and withhold 30% on certain payments tonon-compliant
foreign financial institutions and certain other account holders. Foreign financial institutions located in jurisdictions that have an intergovernmental agreement with the United States governing FATCA may be subject to different rules.Under the applicable Treasury Regulations and administrative guidance, withholding under FATCA generally applies to payments of dividends. While withholding under FATCA would have applied also to payments of gross proceeds from the sale or other disposition of our Mandatory Convertible Preferred Stock or common stock on or after January 1, 2019, recently proposed Treasury Regulations eliminate FATCA withholding on payments of gross proceeds entirely. Taxpayers generally may rely on these proposed Treasury Regulations until final Treasury Regulations are issued. Prospective investors should consult their tax advisors regarding the potential application of withholding under FATCA to their investment in our Mandatory Convertible Preferred Stock or common stock.
A-53
UNDERWRITING
The Company and the underwriters named below have entered into an underwriting agreement with respect to the shares of Series A preferred stock being offered. Subject to certain conditions, each underwriter has severally agreed to purchase the number of shares of Series A preferred stock indicated in the following table from the Company. BofA Securities, Inc., Goldman Sachs & Co., J.P. Morgan Securities LLC and Citigroup Global Markets Inc. are the representatives of the underwriters.
Underwriters | Number of Shares | |||
BofA Securities, Inc. | ||||
Goldman Sachs & Co. LLC | ||||
J.P. Morgan Securities LLC | ||||
Citigroup Global Markets Inc. | ||||
Credit Suisse Securities (USA) LLC | ||||
Morgan Stanley & Co. LLC | ||||
Wells Fargo Securities, LLC | ||||
Barclays Capital Inc. | ||||
Deutsche Bank Securities Inc. | ||||
BMO Capital Markets Corp. | ||||
RBC Capital Markets, LLC | ||||
MUFG Securities Americas Inc. | ||||
Total | ||||
The underwriters are committed to take and pay for all of the shares being offered, if any are taken, other than the shares covered by the option described below unless and until this option is exercised.
The underwriters have an option to buy up to an additional shares from the Company. They may exercise that option for 30 days from the date hereof. If any shares are purchased pursuant to this option, the underwriters will severally purchase shares in approximately the same proportion as set forth in the table above.
The following table shows the per share and total public offering price and proceeds to the Company and the underwriting discounts and commissions payable to the underwriters in connection with this offering. The Company has agreed to pay all underwriting discounts and commissions, transfer taxes and transaction fees, if any, applicable to the sale of the of Series A preferred stock offered hereby. In addition, the Company has agreed to pay reasonable fees and expenses of counsel to the underwriters relating to the review and qualification of this offering by the Financial Industry Regulatory Authority in an aggregate amount not to exceed $35,000. These amounts are shown assuming both no exercise and full exercise of the underwriters’ option to purchase additional shares.
Total | ||||||||||||
Per Share | No Exercise | Full Exercise | ||||||||||
Public offering price | $ | $ | $ | |||||||||
Underwriting discounts and commissions | $ | $ | $ | |||||||||
We estimate that the total expenses for this offering will be approximately $ million.
Shares sold by the underwriters to the public will initially be offered at the public offering price set forth on the cover of this prospectus. Any shares sold by the underwriters to securities dealers may be sold at a discount of up to $ per share from the public offering price. After the initial offering of the shares, the representatives may change the offering price and the other selling terms. The offering of the shares by the underwriters is subject to receipt and acceptance and subject to the underwriters’ right to reject any order in whole or in part.
A-54
The Company and its officers, directors and holders of substantially all of the Company’s common stock, have agreed with the underwriters, subject to certain exceptions, not to dispose of or hedge any of their common stock or securities convertible into or exchangeable for shares of common stock during the period from the date of this prospectus continuing through the date that is 180 days after the date of this prospectus, except with the prior written consent of the representatives. Pursuant to these agreements, among other exceptions, we may enter into an agreement providing for the issuance of our common stock in connection with the acquisition, merger or joint venture with another publicly traded entity during the
180-day
restricted period after the date of this prospectus. This agreement does not apply to any existing employee benefit plans. See “Shares Eligible for Future Sale” for a discussion of certain transfer restrictions.At our request, the underwriters have reserved up to 5% of the shares offered by this prospectus for sale within the United States to some of our directors, officers, employees, business associates and related persons. If these persons purchase reserved shares it will reduce the number of shares available for sale to the general public. Any reserved shares that are not so purchased will be offered by the underwriters to the general public on the same terms as the other shares offered by this prospectus.
Prior to the offering, there has been no public market for the shares. The public offering price has been negotiated among the Company and the representatives. Among the factors to be considered in determining the initial public offering price of the shares, in addition to prevailing market conditions, will be the Company’s historical performance, estimates of the business potential and earnings prospects of the Company, an assessment of the Company’s management and the consideration of the above factors in relation to market valuation of companies in related businesses.
We have been approved to list our Series A preferred stock on the NYSE under the symbol “ACI.PRA.” In order to meet one of the requirements for listing the Series A preferred stock on the NYSE, the underwriters have undertaken to sell lots of 100 or more shares to a minimum of 400 beneficial holders.
In connection with this offering, the underwriters may purchase and sell shares of common stock in the open market. These transactions may include short sales, stabilizing transactions and purchases to cover positions created by short sales. Short sales involve the sale by the underwriters of a greater number of shares than they are required to purchase in the offering, and a short position represents the amount of such sales that have not been covered by subsequent purchases. A “covered short position” is a short position that is not greater than the amount of additional shares for which the underwriters’ option described above may be exercised. The underwriters may cover any covered short position by either exercising their option to purchase additional shares or purchasing shares in the open market. In determining the source of shares to cover the covered short position, the underwriters will consider, among other things, the price of shares available for purchase in the open market as compared to the price at which they may purchase additional shares pursuant to the option described above. “Naked” short sales are any short sales that create a short position greater than the amount of additional shares for which the option described above may be exercised. The underwriters must cover any such naked short position by purchasing shares in the open market. A naked short position is more likely to be created if the underwriters are concerned that there may be downward pressure on the price of the common stock in the open market after pricing that could adversely affect investors who purchase in the offering. Stabilizing transactions consist of various bids for or purchases of common stock made by the underwriters in the open market prior to the completion of the offering.
The underwriters may also impose a penalty bid. This occurs when a particular underwriter repays to the underwriters a portion of the underwriting discount received by it because the representatives have repurchased shares sold by or for the account of such underwriter in stabilizing or short covering transactions.
Purchases to cover a short position and stabilizing transactions, as well as other purchases by the underwriters for their own accounts, may have the effect of preventing or retarding a decline in the market price of the Company’s stock, and together with the imposition of the penalty bid, may stabilize, maintain or otherwise
A-55
affect the market price of the common stock. As a result, the price of the common stock may be higher than the price that otherwise might exist in the open market. The underwriters are not required to engage in these activities and may end any of these activities at any time. These transactions may be effected on the NYSE, in the
over-the-counter
market or otherwise.The underwriters do not expect sales to discretionary accounts to exceed five percent of the total number of shares offered.
The Company estimates that its share of the total expenses of the offering, excluding underwriting discounts and commissions, will be approximately $ .
The Company has agreed to indemnify the several underwriters against certain liabilities, including liabilities under the Securities Act. The shares may be sold in Canada only to purchasers purchasing, or deemed to be purchasing, as principal that are accredited investors, as defined in National Instrument or subsection 73.3(1) of the (Ontario), and are permitted clients, as defined in National Instrument. Any resale of the shares must be made in accordance with an exemption from, or in a transaction not subject to, the prospectus requirements of applicable securities laws.
45-106
Prospectus Exemptions
Securities Act
31-103
Registration Requirements, Exemptions and Ongoing Registrant Obligations
Securities legislation in certain provinces or territories of Canada may provide a purchaser with remedies for rescission or damages if this prospectus (including any amendment thereto) contains a misrepresentation, provided that the remedies for rescission or damages are exercised by the purchaser within the time limit prescribed by the securities legislation of the purchaser’s province or territory. The purchaser should refer to any applicable provisions of the securities legislation of the purchaser’s province or territory for particulars of these rights or consult with a legal advisor.
Pursuant to section 3A.3 of National Instrument (NI
33-105
Underwriting Conflicts
33-105),
the underwriters are not required to comply with the disclosure requirements of NI33-105
regarding underwriter conflicts of interest in connection with this offering.In relation to each Member State of the European Economic Area which has implemented the Prospectus Directive (each, a “Relevant Member State”), each underwriter has represented and agreed that with effect from and including the date on which the Prospectus Directive is implemented in that Relevant Member State (the “Relevant Implementation Date”) it has not made and will not make an offer of shares to the public in that Relevant Member State prior to the publication of a prospectus in relation to the shares which has been approved by the competent authority in that Relevant Member State or, where appropriate, approved in another Relevant Member State and notified to the competent authority in that Relevant Member State, all in accordance with the Prospectus Directive, except that it may, with effect from and including the Relevant Implementation Date, make an offer of shares to the public in that Relevant Member State at any time:
(a) to legal entities which are authorized or regulated to operate in the financial markets or, if not so authorized or regulated, whose corporate purpose is solely to invest in securities;
(b) to any legal entity which has two or more of (1) an average of at least 250 employees during the last financial year, (2) a total balance sheet of more than
€
43,000,000 and (3) an annual net turnover of more than €
50,000,000, as shown in its last annual or consolidated accounts;(c) to fewer than 150 natural or legal persons (other than qualified investors as defined in the Prospectus Directive) subject to obtaining the prior consent of the representatives for any such offer; or
(d) in any other circumstances which do not require the publication by the Company of a prospectus pursuant to Article 3 of the Prospectus Directive.
A-56
For the purposes of this provision, the expression an “offer of shares to the public” in relation to any shares in any Relevant Member State means the communication in any form and by any means of sufficient information on the terms of the offer and the shares to be offered so as to enable an investor to decide to purchase or subscribe the shares, as the same may be varied in that Relevant Member State by any measure implementing the Prospectus Directive in that Relevant Member State and the expression Prospectus Directive means Directive 2003/71/EC and includes any relevant implementing measure in each Relevant Member State.
Each underwriter has represented and agreed that:
(a) it has only communicated or caused to be communicated and will only communicate or cause to be communicated an invitation or inducement to engage in investment activity (within the meaning of Section 21 of the Financial Services and Markets Act 2000 (Financial Promotion) Order 2005, as amended (the “FSMA”)) received by it in connection with the issue or sale of the shares in circumstances in which Section 21(1) of the FSMA would not apply to the Company; and
(b) it has complied and will comply with all applicable provisions of the FSMA with respect to anything done by it in relation to the shares in, from or otherwise involving the United Kingdom.
The shares may not be offered or sold by means of any document other than (i) in circumstances which do not constitute an offer to the public within the meaning of the Companies Ordinance (Cap.32, Laws of Hong Kong), or (ii) to “professional investors” within the meaning of the Securities and Futures Ordinance (Cap.571, Laws of Hong Kong) and any rules made thereunder or (iii) in other circumstances which do not result in the document being a “prospectus” within the meaning of the Companies Ordinance (Cap.32, Laws of Hong Kong), and no advertisement, invitation or document relating to the shares may be issued or may be in the possession of any person for the purpose of issue (in each case whether in Hong Kong or elsewhere), which is directed at, or the contents of which are likely to be accessed or read by, the public in Hong Kong (except if permitted to do so under the laws of Hong Kong) other than with respect to shares which are or are intended to be disposed of only to persons outside Hong Kong or only to “professional investors” within the meaning of the Securities and Futures Ordinance (Cap. 571, Laws of Hong Kong) and any rules made thereunder.
This prospectus has not been registered as a prospectus with the Monetary Authority of Singapore. Accordingly, this prospectus and any other document or material in connection with the offer or sale, or invitation for subscription or purchase, of the shares may not be circulated or distributed, nor may the shares be offered or sold, or be made the subject of an invitation for subscription or purchase, whether directly or indirectly, to persons in Singapore other than (i) to an institutional investor under Section 274 of the Securities and Futures Act, Chapter 289 of Singapore (the “SFA”), (ii) to a relevant person, or any person pursuant to Section 275(1A), and in accordance with the conditions, specified in Section 275 of the SFA or (iii) otherwise pursuant to, and in accordance with the conditions of, any other applicable provision of the SFA.
Where the shares are subscribed or purchased under Section 275 of the SFA by a relevant person which is: (a) a corporation (which is not an accredited investor) the sole business of which is to hold investments and the entire share capital of which is owned by one or more individuals, each of whom is an accredited investor; or (b) a trust (where the trustee is not an accredited investor) whose sole purpose is to hold investments and each beneficiary is an accredited investor, shares, debentures and units of shares and debentures of that corporation or the beneficiaries’ rights and interest in that trust shall not be transferable for 6 months after that corporation or that trust has acquired the shares under Section 275 of the SFA except: (1) to an institutional investor under Section 274 of the SFA or to a relevant person, or any person pursuant to Section 275(1A), and in accordance with the conditions, specified in Section 275 of the SFA; (2) where no consideration is given for the transfer; or (3) by operation of law.
The securities have not been and will not be registered under the Financial Instruments and Exchange Law of Japan (the “Financial Instruments and Exchange Law”) and each underwriter has agreed that it will not offer or sell any securities, directly or indirectly, in Japan or to, or for the benefit of, any resident of Japan (which term
A-57
as used herein means any person resident in Japan, including any corporation or other entity organized under the laws of Japan), or to others for
re-offering
or resale, directly or indirectly, in Japan or to a resident of Japan, except pursuant to an exemption from the registration requirements of, and otherwise in compliance with, the Financial Instruments and Exchange Law and any other applicable laws, regulations and ministerial guidelines of Japan.The shares may not be publicly offered in Switzerland and will not be listed on the SIX Swiss Exchange (“SIX”) or on any other stock exchange or regulated trading facility in Switzerland. This document has been prepared without regard to the disclosure standards for issuance prospectuses under art. 652a or art. 1156 of the Swiss Code of Obligations or the disclosure standards for listing prospectuses under art. 27 ff. of the SIX Listing Rules or the listing rules of any other stock exchange or regulated trading facility in Switzerland. Neither this document nor any other offering or marketing material relating to the shares or the offering may be publicly distributed or otherwise made publicly available in Switzerland.
Neither this document nor any other offering or marketing material relating to the offering, the Company, the shares have been or will be filed with or approved by any Swiss regulatory authority. In particular, this document will not be filed with, and the offer of shares will not be supervised by, the Swiss Financial Market Supervisory Authority FINMA (FINMA), and the offer of shares has not been and will not be authorized under the Swiss Federal Act on Collective Investment Schemes (“CISA”). The investor protection afforded to acquirers of interests in collective investment schemes under the CISA does not extend to acquirers of shares.
This prospectus relates to an Exempt Offer in accordance with the Offered Securities Rules of the Dubai Financial Services Authority (“DFSA”). This prospectus is intended for distribution only to persons of a type specified in the Offered Securities Rules of the DFSA. It must not be delivered to, or relied on by, any other person. The DFSA has no responsibility for reviewing or verifying any documents in connection with Exempt Offers. The DFSA has not approved this prospectus nor taken steps to verify the information set forth herein and has no responsibility for the prospectus. The shares to which this prospectus relates may be illiquid and/or subject to restrictions on their resale.
Prospective purchasers of the shares offered should conduct their own due diligence on the shares. If you do not understand the contents of this prospectus you should consult an authorized financial advisor.
No placement document, prospectus, product disclosure statement or other disclosure document has been lodged with the Australian Securities and Investments Commission, in relation to the offering. This prospectus does not constitute a prospectus, product disclosure statement or other disclosure document under the Corporations Act 2001 (the “Corporations Act”), and does not purport to include the information required for a prospectus, product disclosure statement or other disclosure document under the Corporations Act.
Any offer in Australia of the shares may only be made to persons (the “Exempt Investors”) who are “sophisticated investors” (within the meaning of section 708(8) of the Corporations Act), “professional investors” (within the meaning of section 708(11) of the Corporations Act) or otherwise pursuant to one or more exemptions contained in section 708 of the Corporations Act so that it is lawful to offer the shares without disclosure to investors under Chapter 6D of the Corporations Act.
The shares applied for by Exempt Investors in Australia must not be offered for sale in Australia in the period of 12 months after the date of allotment under the offering, except in circumstances where disclosure to investors under Chapter 6D of the Corporations Act would not be required pursuant to an exemption under section 708 of the Corporations Act or otherwise or where the offer is pursuant to a disclosure document which complies with Chapter 6D of the Corporations Act. Any person acquiring shares must observe such Australian
on-sale
restrictions.A-58
This prospectus contains general information only and does not take account of the investment objectives, financial situation or particular needs of any particular person. It does not contain any securities recommendations or financial product advice. Before making an investment decision, investors need to consider whether the information in this prospectus is appropriate to their needs, objectives and circumstances, and, if necessary, seek expert advice on those matters.
Determination of Offering Price
The public offering price for the shares will be determined by negotiations between us and the underwriters and may not be indicative of prices that will prevail in the open market following this offering.
Other Relationships
Currently, a member of our board of directors also serves on the board of directors of Bank of America Corporation, the parent company of BofA Securities, Inc.
A-59
Shares
Albertsons Companies, Inc.
% Series A Mandatory Convertible Preferred Stock
PRELIMINARY PROSPECTUS
BofA Securities | Goldman Sachs & Co. LLC | J.P. Morgan | Citigroup |
Credit Suisse | Morgan Stanley | Wells Fargo Securities | Barclays | Deutsche Bank Securities |
BMO Capital Markets | RBC Capital Markets | MUFG | ||||||
Until , 2020 (25 days after the date of this prospectus), all dealers that buy, sell, or trade shares of our Series A preferred stock, whether or not participating in this initial public offering, may be required to deliver a prospectus. This delivery requirement is in addition to the obligation of dealers to deliver a prospectus when acting as underwriters and with respect to their unsold allotments or subscriptions.
PART II
INFORMATION NOT REQUIRED IN PROSPECTUS
ITEM 13. OTHER EXPENSES OF ISSUANCE AND DISTRIBUTION.
The following table sets forth all expenses to be paid by us, other than underwriting discounts and commissions, upon completion of this offering. All amounts shown are estimates except for the SEC registration fee and the FINRA filing fee.
SEC registration fee | $ | 25,960 | ||
FINRA filing fee | $ | 225,500 | ||
Exchange listing fee | $ | 295,000 | ||
Printing and engraving expenses | $ | 1,250,000 | ||
Legal fees and expenses | $ | 6,200,000 | ||
Accounting fees and expenses | $ | 500,000 | ||
Blue sky fees and expenses | $ | 15,000 | ||
Transfer agent and registrar fees | $ | 25,000 | ||
Miscellaneous expenses | $ | 2,000,000 | ||
Total | $ | 10,536,460 |
ITEM 14. INDEMNIFICATION OF DIRECTORS AND OFFICERS.
Section 145 of the DGCL authorizes a court to award, or a corporation’s board of directors to grant, indemnity to directors and officers under certain circumstances and subject to certain limitations. The terms of Section 145 of the DGCL are sufficiently broad to permit indemnification under certain circumstances for liabilities, including reimbursement of expenses incurred, arising under the Securities Act.
As permitted by the DGCL, ACI’s certificate of incorporation contains provisions that eliminate the personal liability of its directors for monetary damages for any breach of fiduciary duties as a director.
As permitted by the DGCL, ACI’s bylaws provide that:
| • | ACI is required to indemnify its directors and executive officers to the fullest extent permitted by the DGCL, subject to very limited exceptions; |
| • | ACI may indemnify its other employees and agents as set forth in the DGCL; |
| • | ACI is required to advance expenses, as incurred, to its directors and executive officers in connection with a legal proceeding to the fullest extent permitted by the DGCL, subject to very limited exceptions; and |
| • | the rights conferred in the bylaws are not exclusive. |
ACI has entered, and intends to continue to enter, into separate indemnification agreements with its directors and executive officers to provide these directors and executive officers additional contractual assurances regarding the scope of the indemnification set forth in ACI’s certificate of incorporation and bylaws and to provide additional procedural protections. At present, there is no pending litigation or proceeding involving a director or executive officer of ACI regarding which indemnification is sought. The indemnification provisions in ACI’s certificate of incorporation, bylaws and the indemnification agreements entered into or to be entered into between ACI and each of its directors and executive officers may be sufficiently broad to permit indemnification of ACI’s directors and executive officers for liabilities arising under the Securities Act. ACI currently carries liability insurance for its directors and officers.
II-1
ITEM 15. RECENT SALES OF UNREGISTERED SECURITIES.
Set forth below is information regarding all unregistered securities sold, issued or granted by us within the past three years.
On May 11, 2017, July 19, 2017, August 3, 2017, October 23, 2017, January 11, 2018, February 28, 2018, March 1, 2018, May 21, 2018, August 28, 2018, September 11, 2018, October 10, 2018, November 9, 2018, January 2, 2019, February 24, 2019, July 1, 2019, September 11, 2019, October 29, 2019 and February 7, 2020, we granted 149,013, 264,912, 49,671, 140,733, 132,456, 15,720, 222,498, 75,000, 22,767, 250,000, 100,000, 1,281,416, 13,140, 35,320, 7,653, 242,424, 84,653 and 92,885 Phantom Units, respectively, to certain of our officers, executives, directors and consultants under our Phantom Unit Plan. Each Phantom Unit is generally subject to time- and performance-based vesting, and upon vesting, each Phantom Unit converts into one management incentive unit of each of Albertsons Investor and KIM ACI.
On December 3, 2017, Albertsons Companies, LLC and its parent, AB Acquisition, completed a reorganization of their legal entity structure whereby the existing equityholders of AB Acquisition each contributed their equity interests in AB Acquisition to Albertsons Investor or KIM ACI. In exchange, equityholders received a proportionate share of units in Albertsons Investor and KIM ACI, respectively. Albertsons Investor and KIM ACI then contributed all of the equity interests they received to ACI in exchange for common stock issued by ACI.
On April 25, 2019, upon the commencement of employment, our President and Chief Executive Officer was granted profits interests consisting of 584,289 Class
B-1
Units in Albertsons Investor, 588,315 Class B-1
Units in KIM ACI, 584,289 Class B-2
Units in Albertsons Investor, and 588,315 Class B-2
Units in KIM ACI.On October 21, 2019, we issued 1,547,694 shares of common stock to Albertsons Investor and 167,608 shares of common stock to KIM ACI related to the settlement of Phantom Units upon vesting.
On April 23, 2020, we issued 571,507 shares of common stock to Albertsons Investor and 62,112 shares of common stock to KIM ACI related to the settlement of Phantom Units upon vesting.
Unless otherwise stated, the sales and/or granting of the above securities were deemed to be exempt from registration under the Securities Act in reliance upon Section 4(a)(2) of the Securities Act (or Regulation D promulgated thereunder), or Rule 701 promulgated under Section 3(b) of the Securities Act as transactions by an issuer not involving any public offering or pursuant to benefit plans and contracts relating to compensation as provided under Rule 701. We did not pay or give, directly or indirectly, any commission or other remuneration, including underwriting discounts or commissions, in connection with any of the issuances of securities listed above. The recipients of the securities in each of these transactions represented their intentions to acquire the securities for investment only and not with a view to or for sale in connection with any distribution thereof. All recipients had adequate access, through their employment or other relationship with us or through other access to information provided by us, to information about us. The sales of these securities were made without any general solicitation or advertising.
ITEM 16. EXHIBITS AND FINANCIAL STATEMENT SCHEDULES.
(a) Exhibits
The list of exhibits is set forth under “Exhibit Index” at the end of this registration statement and is incorporated herein by reference.
II-2
(b) Financial Statement Schedules
All financial statement schedules have been omitted because the required information is included in the consolidated financial statements and the notes thereto or the information therein is not applicable.
ITEM 17. UNDERTAKINGS.
The undersigned registrant hereby undertakes to provide to the underwriters at the closing specified in the underwriting agreement certificates in such denominations and registered in such names as required by the underwriters to permit prompt delivery to each purchaser.
Insofar as indemnification for liabilities arising under the Securities Act, may be permitted to directors, officers and controlling persons of the registrant pursuant to the foregoing provisions, or otherwise, the registrant has been advised that in the opinion of the Securities and Exchange Commission such indemnification is against public policy as expressed in the Act and is, therefore, unenforceable. In the event that a claim for indemnification against such liabilities (other than the payment by the registrant of expenses incurred or paid by a director, officer or controlling person of the registrant in the successful defense of any action, suit or proceeding) is asserted by such director, officer or controlling person in connection with the securities being registered, the registrant will, unless in the opinion of its counsel the matter has been settled by controlling precedent, submit to a court of appropriate jurisdiction the question whether such indemnification by it is against public policy as expressed in the Securities Act of 1933, as amended, and will be governed by the final adjudication of such issue.
The undersigned registrant hereby undertakes that:
| (1) | For purposes of determining any liability under the Securities Act, the information omitted from the form of prospectus filed as part of this registration statement in reliance upon Rule 430A and contained in a form of prospectus filed by the Registrant pursuant to Rule 424(b)(1) or (4) or 497(h) under the Securities Act shall be deemed to be part of this registration statement as of the time it was declared effective. |
| (2) | For the purpose of determining any liability under the Securities Act, each post-effective amendment that contains a form of prospectus shall be deemed to be a new registration statement relating to the securities offered therein, and the offering of such securities at that time shall be deemed to be the initial bona fide offering thereof. |
II-3
EXHIBIT INDEX
Exhibit No. | Description | |||
1.1** | ||||
1.2** | ||||
3.1** | ||||
3.2** | ||||
3.3* | ||||
4.1* | ||||
4.2* | ||||
4.3* | ||||
4.4 | ||||
4.5 | ||||
4.6 | ||||
4.7 | ||||
4.8 | ||||
4.9 | ||||
4.10 | ||||
4.11 | ||||
II-4
Exhibit No. | Description | |||
4.11.1 | ||||
4.11.2 | ||||
4.11.3 | ||||
4.11.4 | ||||
4.11.5 | ||||
4.11.6 | ||||
4.11.7 | ||||
4.12 | ||||
II-5
Exhibit No. | Description | |||
4.12.1 | ||||
4.12.2 | ||||
4.12.3 | ||||
4.12.4 | ||||
4.12.5 | ||||
4.12.6* | ||||
4.12.7 | ||||
4.13 | ||||
4.13.1 | ||||
II-6
Exhibit No. | Description | |||
4.14 | ||||
4.15 | ||||
4.16 | ||||
4.17 | ||||
5.1* | ||||
10.1 | ||||
10.2 | ||||
10.3 | ||||
10.4 | ||||
10.5 | ||||
II-7
Exhibit No. | Description | |||
10.6 | ||||
10.7 | ||||
10.8 | ||||
10.9 | ||||
10.10 | ||||
10.11 | ||||
10.12 | ||||
10.13 | ||||
10.14 | ||||
10.15 | ||||
10.16 | ||||
10.17 | ||||
10.18 | ||||
10.19 | ||||
II-8
Exhibit No. | Description | |||
10.20* | ||||
10.21* | ||||
10.22* | ||||
10.23** | ||||
10.24** | ||||
21.1** | ||||
23.1* | ||||
23.2** | ||||
23.3** | ||||
24.1* | ||||
101.INS.** | XBRL Instance Document – the instance document does not appear in the Interactive Data File because iXBRL tags are embedded within the Inline XBRL document | |||
101.SCH.** | XBRL Taxonomy Extension Schema Document | |||
101.CAL.** | XBRL Taxonomy Extension Calculation Linkbase Document | |||
101.DEF.** | XBRL Taxonomy Extension Definition Linkbase Document | |||
101.LAB.** | XBRL Taxonomy Extension Label Linkbase Document | |||
101.PRE.** | XBRL Taxonomy Extension Presentation Linkbase Document | |||
104 | The cover page Interactive Data File (formatted as Inline XBRL and contained in Exhibit 101) | |||
| * | Previously filed on March 6, 2020. |
| ** | Filed herewith. |
II-9
SIGNATURES
Pursuant to the requirements of the Securities Act of 1933, as amended, the registrant has duly caused this registration statement on Form
S-1
to be signed on its behalf by the undersigned, thereunto duly authorized, in Boise, Idaho, on the fifth day of May, 2020.Albertsons Companies, Inc. | ||
By: | /s/ Vivek Sankaran | |
Vivek Sankaran President, Chief Executive Officer and Director (Principal Executive Officer) | ||
Pursuant to the requirements of the Securities Act of 1933, as amended, this registration statement on Form
S-1
has been signed by the following persons in the capacities and on the dates indicated.Signature | Title | Date | ||
/s/ Vivek Sankaran Vivek Sankaran | President, Chief Executive Officer and Director (Principal Executive Officer) | May 5, 2020 | ||
/s/ Robert B. Dimond Robert B. Dimond | Executive Vice President and Chief Financial Officer (Principal Financial Officer) | May 5, 2020 | ||
/s/ Robert B. Larson Robert B. Larson | Senior Vice President and Chief Accounting Officer (Principal Accounting Officer) | May 5, 2020 | ||
/s/ * Robert G. Miller | Chairman Emeritus | May 5, 2020 | ||
/s/ * James L. Donald | Co-Chairman | May 5, 2020 | ||
/s/ * Leonard Laufer | Co-Chairman | May 5, 2020 | ||
/s/ * Dean S. Adler | Director | May 5, 2020 | ||
/s/ * Sharon L. Allen | Director | May 5, 2020 | ||
/s/ * Steven A. Davis | Director | May 5, 2020 | ||
/s/ * Kim Fennebresque | Director | May 5, 2020 |
II-10
Signature | Title | Date | ||
/s/ * Allen M. Gibson | Director | May 5, 2020 | ||
/s/ * Hersch Klaff | Director | May 5, 2020 | ||
/s/ * Jay L. Schottenstein | Director | May 5, 2020 | ||
/s/ * Alan H. Schumacher | Director | May 5, 2020 | ||
/s/ * Lenard B. Tessler | Director | May 5, 2020 | ||
/s/ * B. Kevin Turner | Vice Chairman | May 5, 2020 | ||
/s/ * Scott Wille | Director | May 5, 2020 |
*By: | /s/ Robert B. Dimond | |
Robert B. Dimond, Attorney-in-Fact |
II-11