UNITED STATES
SECURITIES AND EXCHANGE COMMISSION
Washington, D.C. 20549
SCHEDULE 14A
SCHEDULE 14A INFORMATION
PROXY STATEMENT PURSUANT TO SECTION 14(a) OF THE SECURITIES
EXCHANGE ACT OF 1934
Filed by the Registrant þ
Filed by a Party other than the Registrant o
Check the appropriate box:
o | Preliminary Proxy Statement | |
o | Confidential, for Use of the Commission Only (as permitted by Rule 14a-6(e)(2)) | |
þ | Definitive Proxy Statement | |
o | Definitive Additional Materials | |
o | Soliciting Material Pursuant to Section 240.14a-12 | |
| Forest City Realty Trust, Inc. | ||
| (Name of Registrant as Specified In Its Charter) | ||
| (Name of Person(s) Filing Proxy Statement, if other than the Registrant) | ||
Payment of Filing Fee (Check the appropriate box):
| þ | No fee required. | |||
| o | Fee computed on table below per Exchange Act Rules 14a-6(i)(1) and 0-11. | |||
| (1) | Title of each class of securities to which transaction applies: | |||
| (2) | Aggregate number of securities to which transaction applies: | |||
| (3) | Per unit price or other underlying value of transaction computed pursuant to Exchange Act Rule 0-11 (set forth the amount on which the filing fee is calculated and state how it was determined): | |||
| (4) | Proposed maximum aggregate value of transaction: | |||
| (5) | Total fee paid: | |||
| o | Fee paid previously with preliminary materials. | |||
| o | Check box if any part of the fee is offset as provided by Exchange Act Rule 0-11(a)(2) and identify the filing for which the offsetting fee was paid previously. Identify the previous filing by registration statement number, or the Form or Schedule and the date of its filing. | |||
| (1) | Amount Previously Paid: | |||
| (2) | Form, Schedule or Registration Statement No.: | |||
| (3) | Filing Party: | |||
| (4) | Date Filed: | |||
FOREST CITY REALTY TRUST, INC.
Notice of Annual Meeting of Shareholders
To Be Held May 25, 2016
NOTICE IS HEREBY GIVEN that the annual meeting of the shareholders of Forest City Realty Trust, Inc. (the “Company”) will be held in the 6th floor Riverview Room of the Ritz-Carlton Hotel, Tower City Center, 1515 West Third Street, Cleveland, Ohio 44113, on Wednesday, May 25, 2016 at 2:00 p.m., Eastern Daylight Time, for the purpose of considering and acting upon:
| (1) | The election of thirteen (13) directors, nominated by the Board of Directors, each to hold office until the next annual shareholders’ meeting and until a successor is duly elected and qualifies. Four (4) directors will be elected by holders of Class A Common Stock and nine (9) by holders of Class B Common Stock. |
| (2) | The approval (on an advisory, non-binding basis) of the compensation of the Company’s Named Executive Officers, as described in the accompanying proxy statement. |
| (3) | The ratification of the appointment of PricewaterhouseCoopers LLP as independent registered public accounting firm for the Company for the year ending December 31, 2016. |
| (4) | Such other business as may properly come before the meeting or any adjournment or postponement thereof. |
Shareholders of record at the close of business on March 28, 2016 will be entitled to notice of and to vote at such annual meeting or any adjournment or postponement thereof.
BY THE ORDER OF THE BOARD OF DIRECTORS
Geralyn M. Presti, Secretary
Cleveland, Ohio
April 7, 2016
IMPORTANT: It is important that your stock be represented at the meeting. Whether or not you intend to be present, please mark, date and sign the appropriate enclosed proxy or proxies and send them by return mail in the enclosed envelope, which requires no postage if mailed in the United States.
IMPORTANT NOTICE REGARDING THE AVAILABILITY OF PROXY MATERIALS FOR
THE SHAREHOLDER MEETING TO BE HELD ON MAY 25, 2016
The Proxy Statement, Proxy Card, Annual Report on Form 10-K, Summary Annual Report and Supplemental Package are available on the Investor Relations page at www.forestcity.net.
Table of Contents
| Proxy Statement Summary | |
Proposal 1 - Election of Directors | |
| Introduction | |
| Executive Summary | |
| Executive Compensation Core Principles | |
| Target Executive Officer Pay Levels and Relevant Employment Market | |
| Components of the Executive Compensation Program | |
| Additional Executive Compensation Policies | |
| Plan Design as it Pertains to Risk | |
| Tax and Accounting Implications | |
Proposal 3 - Ratification of Independent Registered Public Accounting Firm for the year ending December 31, 2016 | |
Section 16(a) Beneficial Ownership Reporting Compliance | |
| Shareholder Proposals and Director Nominations for the 2017 Annual Meeting | |
| Annex A | |
| Annex B | |
| Annex C | |
i

Proxy Statement Summary
To further assist you in your review of the proxy statement and your consideration of matters to be voted upon at the 2016 Annual Meeting of Shareholders, we call your attention to the following information about Forest City Realty Trust, Inc. (the “Company”). As the following information is just a summary, we encourage you to read the full Annual Report and Proxy Statement before voting.
2016 Annual Meeting of Shareholders
| Date and Time: | Record Date: |
| Wednesday, May 25, 2016 at 2:00 pm E.D.T. | March 28, 2016 |
| Place: | Webcast: |
| 6th floor Riverview Room of the Ritz-Carlton Hotel, | A webcast of the 2016 Annual Meeting will be |
| Tower City Center, 1515 West Third Street, | accessible via the investor relations page of the |
| Cleveland, Ohio 44113 | Company’s website, www.forestcity.net |
Annual Report and Proxy Materials
Available at www.proxyvote.com (for access, use the control number included on your Proxy Card or Notice of Internet Availability of Proxy Materials) or on www.forestcity.net.
Proposals to be Considered and Voted Upon and Board Recommendations
| Proposal | Description | Board Recommendation | Page |
| 1 | Election of Directors. | For All | 7 |
| 2 | Approval (on an advisory, non-binding basis) of the compensation of the Company’s Named Executive Officers, as described in this proxy statement. | For | 66 |
| 3 | Ratification of the appointment of PricewaterhouseCoopers LLP as independent registered public accounting firm for the Company for the year ending December 31, 2016. | For | 71 |
Recent Corporate Actions
| 1. | Successfully completed our merger, effective at 11:59 pm, Eastern Time, on December 31, 2015, in connection with our plan to convert to real estate investment trust (REIT) status commencing with the year ending December 31, 2016. |
| 2. | Implemented a new organizational structure to improve efficiencies and operating margins. |
| 3. | Published our Third Corporate Social Responsibility Report and achieved an MSCI ESG Rating of AA and GRESB Green Star Recognition, and gained inclusion in the MSCI Global Sustainability Index (see page 26). |
| 4. | Qualified and selected for inclusion in the MSCI US REIT Index (RM2). |
| 5. | Reinstituted a quarterly dividend in the first quarter of 2016. |
Election of Directors
| Nominee | Class | Director Since | Independent | Chairman: Charles A. Ratner Lead Director: Scott S. Cowen Director Terms: 1 Year Required Vote: Plurality of votes cast Board Meetings in 2015: 7 Standing Board Committee Meetings: Audit Committee (8); Compensation Committee (5); and Corporate Governance & Nominating Committee (5) Director Attendance: Averaged 93% and no director attended fewer than 70% of the meetings of the Board and those Committees on which the director served | |
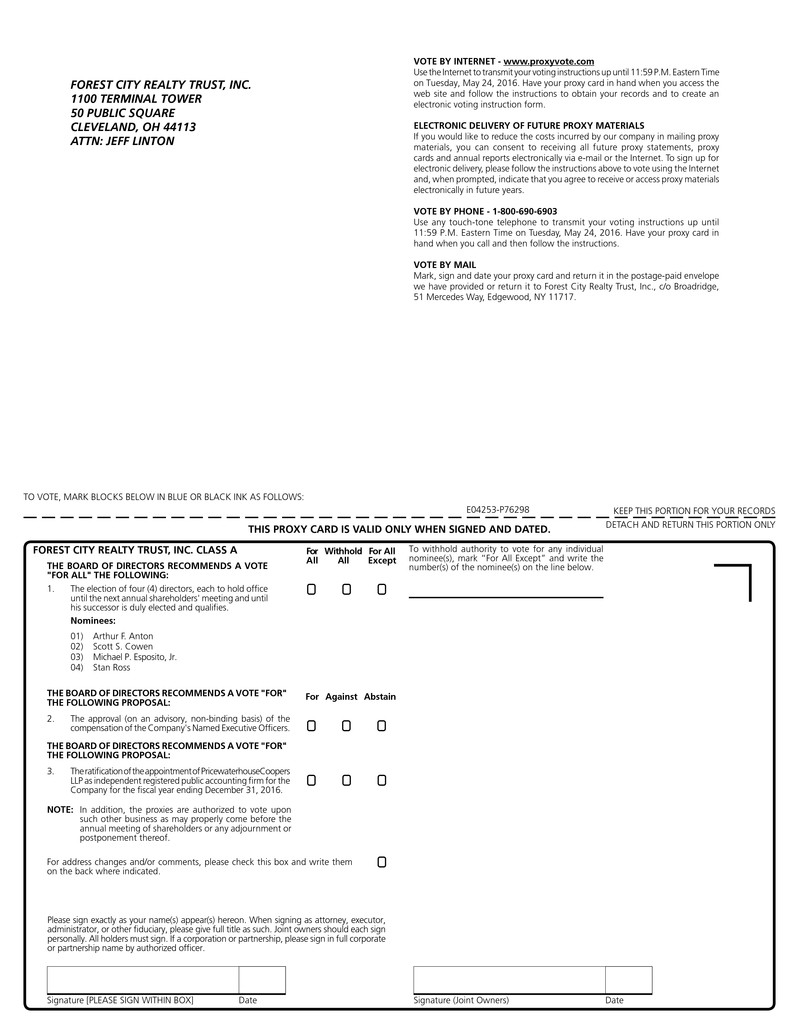
| Arthur F. Anton | A | 2010 | Yes | ||
| Scott S. Cowen | A | 1989 | Yes | ||
| Michael P. Esposito, Jr. | A | 1995 | Yes | ||
| Stan Ross | A | 1999 | Yes | ||
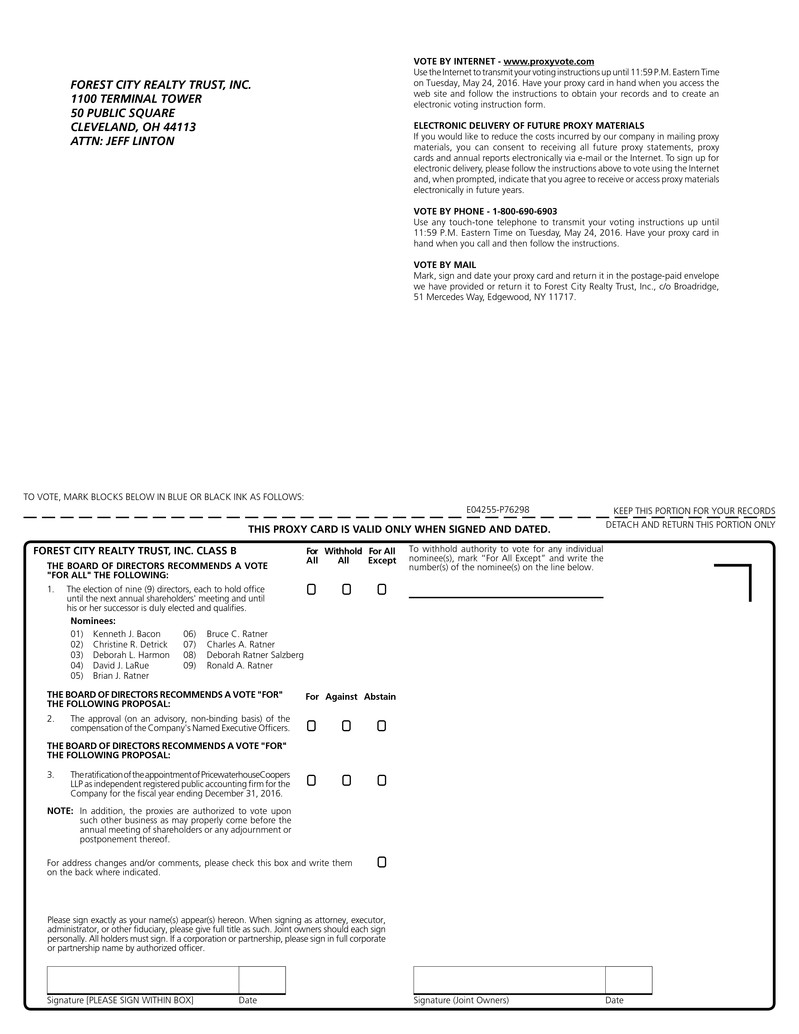
| Kenneth J. Bacon | B | 2012 | Yes | ||
| Christine R. Detrick | B | 2014 | Yes | ||
| Deborah L. Harmon | B | 2008 | Yes | ||
| David J. LaRue | B | 2011 | No | ||
| Brian J. Ratner | B | 1993 | No | ||
| Bruce C. Ratner | B | 2007 | No | ||
| Charles A. Ratner | B | 1972 | No | ||
| Deborah Ratner Salzberg | B | 1995 | No | ||
| Ronald A. Ratner | B | 1985 | No | ||
1
Executive Compensation
Our executive compensation program is intended to support our core values, drive long-term growth and value creation and reinforce our culture of accountability, integrity, responsibility, legal compliance, ethical behavior and transparency.
Key Objectives of our Executive Compensation Program:
| ● | Focus senior management on key business objectives as reflected in our annual business plan and strategic plan to support our ultimate objective of maximizing long-term shareholder value. | ● | Attract and retain highly-talented employees to lead our continued growth and success and reward them for their contributions toward that success. |
| ● | Avoid unnecessary or excessive risk taking. | ● | Provide competitive pay driven by performance to increase long-term shareholder value. |
Key Components of our Executive Compensation Program:
| Component | Component Objective | Performance Linkage |
| Base Salary | Provide base pay commensurate with level of responsibility, experience and individual performance | Partially linked (merit increases tied to individual performance) |
| Annual Short-Term Incentives | Align pay with the achievement of short-term performance goals in support of annual business plan and strategic goals | Strongly linked |
| Long-Term Incentives | Align pay with achievement of longer-term strategic goals and shareholder value creation, enhance retention of senior management and facilitate stock ownership | Minimally to Strongly linked |
| Benefits & Perquisites | Provide for health, welfare and retirement needs at a reasonable cost | Minimally or not linked |
Results of the 2015 Say on Pay Advisory Vote:
We held our annual advisory vote on the compensation of our Named Executive Officers (“NEOs”) (“Say on Pay Vote”) at our annual meeting of shareholders on May 28, 2015. At that meeting, our shareholders overwhelmingly passed a resolution approving the compensation of our NEOs, with approximately 93.7% of the shareholders entitled to vote and present in person or by proxy at the 2015 annual meeting voting in favor of the resolution, including the negative effect of abstentions. Overall, we believe that this level of shareholder support is evidence that our executive compensation program is appropriately structured and aligned with shareholder interests.
Financial Performance Metrics that Impacted Compensation Decisions:
The following table provides comparisons of some of the key financial metrics, as previously reported in our Form 10-K and Supplemental Package for the quarter ended December 31, 2015 furnished on Form 8-K, which we use in evaluating the Company’s performance and which are considered when making compensation decisions:
| Key Metric | Year Ended December 31, | Change | |
| 2015 | 2014 | ||
Funds From Operations (“FFO”) (1) | $505,682,000 | $394,589,000 | 28.2% |
Operating FFO (“OFFO”) (1) | $337,601,000 | $248,404,000 | 35.9% |
FFO per share (on a fully-diluted basis) (1) | $1.98 | $1.75 | 13.1% |
OFFO per share (on a fully-diluted basis) (1) | $1.36 | $1.17 | 16.2% |
Comparable Net Operating Income - (Pro-Rata Consolidation) (1) | $554,490,000 | $528,443,000 | 4.9% |
| (1) | These measures are financial measures not presented in accordance with Generally Accepted Accounting Principles. See pages 33-34 and Annexes A, B and C of this proxy statement for additional information on these measures. |
| Key Metric | Stock Price December 31, | TSR | |||
| 2015 | 2014 | 2013 | 1-Year | 3-Year (1) | |
| Total Shareholder Return (“TSR”): Class A Common Stock | $21.93 | $21.30 | $19.10 | 2.96% | 10.73% |
| (1) | Represents an annualized total shareholder return ($16.15 as of 12/31/2012). |
Please see the Compensation Discussion and Analysis section beginning on page 32 of this Proxy Statement and the Executive Compensation Tables beginning on page 60 for a more detailed description of our executive compensation program and practices.
2
| Forest City Realty Trust, Inc. | |
| 50 Public Square | |
| Cleveland, Ohio 44113 | |
| www.forestcity.net | April 7, 2016 |
Proxy Statement
Solicitation of Proxies
The proxy or proxies accompanying this proxy statement and relating to shares of Class A Common Stock, par value $.01 per share (the “Class A Common Stock”), and Class B Common Stock, par value $.01 per share (the “Class B Common Stock”) (collectively, “Common Stock”), are solicited on behalf of the Board of Directors of Forest City Realty Trust, Inc., a Maryland corporation, for exercise at the annual meeting of shareholders to be held on Wednesday, May 25, 2016 at 2:00 p.m., Eastern Daylight Time, in the 6th floor Riverview Room of the Ritz-Carlton Hotel, Tower City Center, 1515 West Third Street, Cleveland, Ohio 44113 (the “Annual Meeting”). This proxy statement and related form of proxy are being made first available to shareholders on or about April 7, 2016.
At 11:59 p.m., Eastern Time, on December 31, 2015 (the “Effective Time”), pursuant to an Agreement and Plan of Merger, dated as of September 15, 2015 (the “Merger Agreement”), by and among our predecessor, Forest City Enterprises, Inc., an Ohio corporation (“FCE”), Forest City Realty Trust, Inc., a Maryland corporation (“FCRT”), FCILP, LLC, a Delaware limited liability company, and FCE Merger Sub, Inc., an Ohio corporation (“Merger Sub”), Merger Sub merged with and into FCE, with FCE surviving as a wholly-owned subsidiary of FCRT (the “Merger”). The Merger was completed as part of the plan to reorganize the business operations of FCE to facilitate its qualification as a real estate investment trust (“REIT”) for U.S. federal income tax purposes.
Unless otherwise specifically stated or the context otherwise requires, all references in this proxy statement to the “Company,” “Forest City,” “we,” “our,” “us” and similar terms refer to FCE and its consolidated subsidiaries prior to the Effective Time and FCRT and its consolidated subsidiaries as of the Effective Time and thereafter.
Questions and Answers about the Proxy Materials and Annual Meeting
Q. Why am I receiving these proxy materials?
A. These proxy materials are provided in connection with the solicitation of proxies by the Board of Directors of Forest City for exercise at the Annual Meeting. You are receiving these proxy materials because you owned shares of Class A Common Stock or Class B Common Stock of Forest City, which we refer to collectively as Common Stock, at the close of business on March 28, 2016 (the “Record Date”) and that entitles you to notice of and to vote at the Annual Meeting. By use of a proxy, you can authorize your vote whether or not you attend the Annual Meeting. This proxy statement describes the matters on which we would like you to vote and provides information on those matters so that you can make an informed decision.
Q. Why did I receive a notice in the mail regarding the internet availability of proxy materials instead of a full set of printed proxy materials?
A. Pursuant to rules adopted by the Securities and Exchange Commission (the “SEC”), and in furtherance of our sustainability core value, we have elected to furnish our proxy materials to shareholders by providing access to the materials over the Internet instead of printing and mailing full sets of our proxy materials to all shareholders. Accordingly, on April 7, 2016, we sent a Notice of Internet Availability of Proxy Materials (the “Notice”) to the majority of our shareholders. We encourage you to take advantage of the availability of the proxy materials on the Internet in order to help reduce the environmental impact of the Annual Meeting.
Q. How can I get electronic access to the proxy materials?
A. The Company provides access to our proxy materials over the Internet to all shareholders. Proxy materials for the Annual Meeting, including this proxy statement and the 2016 Annual Report and Supplemental Package, are available for viewing by accessing the Investors page on the Company’s website at www.forestcity.net.
3
If you received the Notice, it provides you with instructions how to: access our proxy materials for the Annual Meeting on www.proxyvote.com; authorize a proxy to vote your shares after you have viewed our proxy materials; and request a printed or email copy of the proxy materials.
Whether you received the Notice only or a full set of proxy materials by mail, you may elect to receive the Company’s future proxy materials in electronic format in lieu of paper copies by following the instructions contained in the Notice or proxy card. Doing so will lower our printing and delivery costs and will further assist our efforts to reduce the environmental impact of our Annual Meeting. Your election to receive proxy materials by email will remain in effect until you terminate such election or for so long as the email address you have provided remains valid.
Q. Where and when is the Annual Meeting?
A. The Annual Meeting will be held on the 6th floor Riverview Room of the Ritz-Carlton Hotel, Tower City Center, 1515 West Third Street, Cleveland, Ohio 44113, on May 25, 2016 at 2:00 p.m., Eastern Daylight Time.
Q. Who can attend the Annual Meeting?
A. All owners of Common Stock at the close of business on the Record Date are invited to attend the Annual Meeting. Persons who are not owners of Common Stock may attend only if invited by our board of directors. If you are the beneficial owner of shares of Common Stock held in the name of your broker, bank, trust or other nominee, you must bring proof of ownership (e.g., a current brokerage statement) in order to be admitted to the Annual Meeting.
Q. Who can vote at the Annual Meeting?
A. Only shareholders of record at the close of business on the Record Date or their duly authorized proxies will be entitled to vote at the Annual Meeting. If you are not a shareholder of record but hold shares of Common Stock through your broker, bank, trust or other nominee, you may vote your shares in person only if you obtain a legal proxy from the broker, bank, trust or other nominee that holds your shares authorizing you to vote the shares. We will begin mailing or delivering this proxy statement on or about April 7, 2016 to shareholders of record at the close of business on the Record Date.
Q. How many shares of Common Stock are entitled to vote at the Annual Meeting?
A. As of the Record Date, there were 241,217,983 shares of Class A Common Stock and 18,792,687 shares of Class B Common Stock outstanding and entitled to vote at the Annual Meeting.
Q. What constitutes a quorum?
A. In order to carry out the business of the Annual Meeting, we must have a quorum. This means that the presence, in person or by proxy, of shareholders entitled to cast a majority of all the votes entitled to be cast on any matter at the Annual Meeting is required in order to carry out the business of the Annual Meeting. Broker non-votes and abstentions will be counted for purposes of determining whether a quorum is present.
Q. What will I be voting on at the Annual Meeting?
A. At the Annual Meeting, Forest City shareholders will consider and vote upon the following proposals:
| • | Proposal 1: Election of Class A and Class B Directors. The holders of Class A Common Stock will be entitled as a class to elect four (4) Class A directors and the holders of Class B Common Stock will be entitled as a class to elect nine (9) Class B directors. Arthur F. Anton, Scott S. Cowen, Michael P. Esposito, Jr. and Stan Ross have been nominated for election to serve as Class A directors. Kenneth J. Bacon, Christine R. Detrick, Deborah L. Harmon, David J. LaRue, Brian J. Ratner, Bruce C. Ratner, Charles A. Ratner, Deborah Ratner Salzberg and Ronald A. Ratner have been nominated for election to serve as Class B directors. |
| • | Proposal 2: Approval (on an advisory, non-binding basis) of the compensation of the Company’s Named Executive Officers, as described in this proxy statement. |
| • | Proposal 3: Ratification of the appointment of PricewaterhouseCoopers LLP as independent registered public accounting firm for the Company for the year ending December 31, 2016. |
4
Q. What vote is required to approve each of the proposals?
A. At the Annual Meeting, the required vote to approve the following proposals shall be:
| • | Proposal 1: Election of Class A and Class B Directors. The nominees receiving the greatest number of votes cast at the Annual Meeting will be elected. A proxy card marked “Withhold All” or “For All Except” with respect to the election of one or more directors will not be voted with respect to the director or directors indicated. Abstentions and broker non-votes, if any, will not be counted as votes cast for purposes of the election of directors and will have no effect on the result of the vote. In addition, brokers may not exercise their discretion to vote uninstructed shares for the election of directors. Therefore, if your shares are to be represented by a broker at the Annual Meeting, you must give specific instructions to your broker for your shares to be voted on the election of directors. |
| • | Proposal 2: Approval (on an advisory, non-binding basis) of the compensation of the Company’s Named Executive Officers. The affirmative vote of a majority of all of the votes cast at the Annual Meeting is required for approval of this proposal. Abstentions and broker non-votes will not be counted as votes cast and, as a result, will have no effect on the result of the vote on this proposal. In addition, brokers may not exercise their discretion to vote uninstructed shares for this proposal. Therefore, if your shares are to be represented by a broker at the Annual Meeting, you must give specific instructions to your broker for your shares to be voted on Proposal 2. |
| • | Proposal 3: Ratification of the appointment of PricewaterhouseCoopers LLP as independent registered public accounting firm for the Company for the year ending December 31, 2016. The affirmative vote of a majority of all of the votes cast at the Annual Meeting is required for approval of this proposal. Abstentions will not be counted as votes cast and, as a result, will have no effect on the result of the vote for this proposal. |
Q. What are the board of directors’ voting recommendations?
A. Our board of directors recommends that you vote “FOR” each of the proposals, specifically:
| • | “FOR” all Class A and Class B Director Nominees named in this proxy statement; |
| • | “FOR” the approval of the compensation of the Company’s Named Executive Officers, as described in this proxy statement; and |
| • | “FOR” the ratification of the appointment of PricewaterhouseCoopers LLP as independent registered public accounting firm for the Company for the year ending December 31, 2016. |
Q. What voting rights do I have as a shareholder?
A. At the Annual Meeting, the holders of Class A Common Stock and Class B Common Stock are entitled to one vote per share in connection with the election of Class A Directors and Class B Directors, respectively.
Except for the election of directors, the holders of Class A Common Stock and Class B Common Stock will vote together on all other matters presented at the Annual Meeting and will be entitled to one (1) vote per share of Class A Common Stock and ten (10) votes per share of Class B Common Stock held as of the close of business on the Record Date.
Q. How do I vote?
A. If you are a shareholder of record at the close of business on the Record Date, you may vote in person at the Annual Meeting or authorize a proxy to vote your shares, in which case you may:
| • | Submit a proxy by Mail: sign, date and mail in your proxy card using the accompanying envelope; |
| • | Submit a proxy by Telephone: submit a proxy by calling 1-800-690-6903; or |
| • | Submit a proxy via the Internet: connect to the Internet site www.proxyvote.com and follow the directions provided. |
Detailed instructions for using the telephone and Internet options for voting by proxy are set forth on the proxy card accompanying this proxy statement. Because the Internet and telephone services authenticate shareholders by use of a control number, you must have the proxy card available in order to use these services to authorize a proxy to vote. Proxies submitted by telephone or Internet must be received by 11:59 p.m., Eastern Daylight Time, on May 24, 2016. If you choose to authorize a proxy to vote by telephone or Internet, you do not need to return the proxy card.
5
If you elect to vote by proxy, the proxy holders will vote your shares based on your directions. If you submit your proxy card but do not properly direct how your shares of Common Stock should be voted, the proxy holders will vote “FOR” all of the director nominees and “FOR” the other proposals presented in this proxy statement. The proxy holders will use their discretion on any other proposals and matters that may be brought before the Annual Meeting.
If your shares of Common Stock are held in “street name” by a broker, bank, trust or other nominee, then you are not the shareholder of record. In that case, to vote in person at the Annual Meeting, you must obtain a legal proxy from your broker, bank, trust or other nominee and present it at the Annual Meeting.
Q. If my shares are held in “street name” by my broker, bank, trust or other nominee, will my broker, bank, trust or other nominee vote my shares for me?
A. No. If your shares of Common Stock are held in “street name” by your broker, bank, trust or other nominee, you should follow the directions provided by your broker, bank, trust or other nominee. Your broker, bank, trust or other nominee will vote your shares only if you provide instructions on how you would like your shares to be voted.
Q. What do I need to do now?
A. You should carefully read and consider this proxy statement. You should then authorize a proxy to vote your shares by one of the three methods described as soon as possible so that your shares will be represented at the Annual Meeting. If your shares of Common Stock are known to us to be held by you through a broker, bank, trust or other nominee, you should receive a separate voting instruction form with this proxy statement.
Q. Can I revoke or change my vote after I submit a proxy?
A. Yes. In the event you deliver a duly executed proxy and subsequently change your mind on a matter, you may revoke your proxy prior to the close of voting at the Annual Meeting. You may revoke your proxy in any of the following five ways:
| • | Connect to the website at www.proxyvote.com by 11:59 p.m,. Eastern Daylight Time, on May 24, 2016; |
| • | Call 1-800-690-6903 by 11:59 p.m., Eastern Daylight Time, on May 24, 2016; |
| • | Deliver a duly executed proxy bearing a later date; |
| • | Deliver a written revocation to the Secretary; or |
| • | Vote in person at the Annual Meeting. |
You will not revoke a proxy merely by attending the Annual Meeting. To revoke a proxy, you must take one of the actions described above.
Q. Who is paying for this proxy solicitation?
A. The expense of soliciting proxies, including the cost of preparing, assembling and mailing the notice, proxy statement and proxy, will be borne by us. In addition to solicitation by mail, we may make arrangements with brokers and other custodians, nominees and fiduciaries to send proxies and proxy materials to their principals and we may reimburse them for their expense in so doing. Our officers and other regular employees may, if necessary, request the return of proxies by telephone, email or facsimile or in person, and will not receive any special compensation for taking such actions.
Q. Can shareholders make proposals for the 2016 Annual Meeting?
A. From time to time, shareholders present proposals that may be proper subjects for inclusion in the proxy statement and for consideration at an annual meeting. To be included in the proxy statement for the Annual Meeting, the Company must have received proposals no later than December 11, 2015. To date, the Company has not received any shareholder proposals for the 2016 Annual Meeting. See “Shareholder Proposals and Director Nominations for the 2017 Annual Meeting” for a detailed discussion of the deadlines for shareholder proposals and director nominations for next year’s annual meeting of shareholders.
Q. Where can I find the voting results of the Annual Meeting?
A. We plan to announce preliminary voting results at the Annual Meeting and publish final results on a Form 8-K filed with the SEC promptly after the Annual Meeting.
6
Proposal 1 - Election of Directors
It is intended that proxies will be voted for the election of the nominees named below as our directors unless authority is withheld. All elected directors will serve until the next annual shareholders’ meeting and until their respective successors are duly elected and qualify. In the event any one or more of such nominees unexpectedly becomes unavailable for election, proxies will be voted in the discretion of the proxy holder. All nominees are presently our directors.
At January 31, 2016, the Ratner, Miller and Shafran families, which include members of our current Board of Directors and certain executive officers not including Bruce C. Ratner (“Family Interests”), owned 3.8% of the Class A Common Stock and 92.4% of the Class B Common Stock. RMS, Limited Partnership (“RMSLP”), which owned 68.6% of the Class B Common Stock outstanding as of the Record Date (March 28, 2016), is a limited partnership comprised of the Family Interests, with seven individual general partner positions, currently consisting of: Samuel H. Miller, Co-Chairman Emeritus; Charles A. Ratner, Chairman of the Board of Directors; Ronald A. Ratner, our Executive Vice President and Director; Brian J. Ratner, our Executive Vice President and Director; Deborah Ratner Salzberg, our Executive Vice President and Director; Joan K. Shafran, a former Director; and Abraham Miller. Charles A. Ratner, James A. Ratner and Ronald A. Ratner are brothers. Albert B. Ratner, our Co-Chairman Emeritus, is the father of Brian J. Ratner and Deborah Ratner Salzberg and is first cousin to Charles A. Ratner, James A. Ratner, Ronald A. Ratner, Bruce C. Ratner and Joan K. Shafran. Samuel H. Miller was married to Ruth Ratner Miller (now deceased), a sister of Albert B. Ratner, and is the father of Abraham Miller.
Under the partnership agreement of RMSLP, the voting power of the general partners representing a family branch is determined by dividing the interest of the family branch they represent by the aggregate interests of all family branches. The voting power of the general partner or general partners representing a family branch may not be divided or apportioned but must be voted together as a whole. If the general partners representing a family branch are unable to agree on how to vote that branch, the total voting power of the other general partners is computed without reference to the voting power otherwise available to that family branch. General partners holding 60% of the total voting power (excluding the voting power of a family branch, if any, unable to agree on how to vote on a particular matter) of RMSLP determine how to vote the Class B Common Stock held by RMSLP.
Effective December 20, 2013, the general partners of RMSLP voted to distribute five million (5,000,000) shares of Class B Common Stock to certain of its limited partners (the “Limited Partner Recipients”). The distributed shares are subject to the Ratner, Miller and Shafran Shareholder’s Agreement, dated as of December 20, 2013 (the “Shareholder Agreement”). The distribution did not change the investment intent of the Family Interests with regards to ownership of Class B Common Stock. The Shareholder Agreement contains transfer restrictions that provide a right of first refusal to the other members of the Ratner, Miller and Shafran families. In addition, the Shareholder Agreement requires the Limited Partner Recipients to vote the distributed shares consistent with the partnership agreement of RMSLP.
The following table sets forth the shares of Class B Common Stock held by RMSLP at January 31, 2016, which under the partnership agreement are voted by the general partners of RMSLP, who under Rule 13d-3 of the Securities Exchange Act of 1934, are deemed to be the beneficial owners of those shares of Class B Common Stock:
| Family Branch | Name of General Partners | Shares of Class B Common Stock Held Through RMSLP | Percent of RMSLP’s Holdings of Class B Common Stock | ||
| Max Ratner | Charles A. Ratner | 6,493,853 | 50.4 | % | |
| Ronald A. Ratner | |||||
| Albert Ratner | Brian J. Ratner | 3,552,483 | 27.6 | % | |
| Deborah Ratner Salzberg | |||||
| Samuel H. Miller | Samuel H. Miller | 719,488 | 5.5 | % | |
| Nathan Shafran | Joan K. Shafran | 1,355,651 | 10.5 | % | |
| Ruth Miller | Abraham Miller | 767,118 | 6.0 | % | |
| Total | 12,888,593 | 100.0 | % | ||
7
Director Qualifications and Experience
The Corporate Governance and Nominating Committee of our Board of Directors performs an annual assessment of the skills and the experience needed to maintain a well-rounded, diverse and effective Board and summarizes such assessment in a tabular matrix. The Committee uses the matrix to assess the current composition of the Board and to identify qualifications and experience for potential nominees. When identifying nominees for the Board, the Committee conducts a targeted effort to identify and recruit individuals who have the qualifications and experience identified through this process. The following is a tabular summary of the most recently conducted matrix assessment for the full Board.
| Director Qualifications and Experience | Percentage of Directors Identified as having Advanced or Good Qualifications or Experience | |
Financial Expertise and Literacy is important because it assists our directors in understanding and overseeing our financial reporting and internal controls. | 92% | |
Capital Markets experience and knowledge is important in evaluating opportunities in the financial markets to raise capital. | 100% | |
Talent Management and Succession Planning experience is valuable in helping us attract, motivate and retain top candidates for positions at the Company. | 100% | |
Organizational Design and Change Management experience with organizational structure design and implementation of organizational change is important to our adaptability to industry trends. | 92% | |
Real Estate knowledge and experience is important in reviewing and understanding our business strategy. | 85% | |
Government and Government Relations experience is relevant because we operate as a publicly-traded company that is directly affected by governmental policies. | 85% | |
Political Acumen and External Relations knowledge and experience is important in aligning with issues, candidates and entities whose missions align with ours. | 92% | |
Corporate Governance experience supports our goals of strong Board and management accountability, transparency and protection of shareholder interests. | 100% | |
Legal experience and acumen provide critical thinking, analysis and understanding of the regulations applicable to us. | 85% | |
Risk Management experience is critical to the Board's role in overseeing the risks facing our business. | 77% | |
Strategic Planning experience is important to provide guidance for our strategic initiatives and oversight of the planning and implementation of our strategic plan. | 100% | |
Marketing experience is relevant as it seeks to identify and develop new real estate development and management markets. | 85% | |
Stakeholder and Community Engagement experience is important to facilitate communication and create long-term value for our stakeholders and the communities in which we operate. | 92% | |
Academic/Education experience is important because it brings perspective regarding organizational management and academic research relevant to our business and strategy. | 85% | |
Business Ethics experience is important given the critical role that ethics plays in the success of our business. | 100% | |
Business Head Administration experience is important since directors with administration experience typically possess strong leadership qualities and the ability to identify those qualities in others. | 100% | |
Business Operations experience provides a practical understanding of developing, implementing and assessing our operational plan and business strategy. | 100% | |
8
Director Nominee Biographies
Set forth below are each nominee’s name, age, year first elected as a director, principal occupation, professional history and public company directorships held currently and during the past five years, and detailed information about the qualifications, experience, attributes and skills that led to the conclusion that such person should serve as our director.
NOMINEES FOR ELECTION AS CLASS A DIRECTORS
 | Arthur F. Anton Principal Occupation and Business Experience Since 2003, Mr. Anton has been the chief executive officer of Swagelok, a privately-held domestic and international developer and provider of fluid system solutions with annual sales of approximately $1.8 billion. In addition, since October 2015, Mr. Anton has served as the Chairman of the Board of Swagelok. Prior to his current positions, Mr. Anton served Swagelok as the president and chief operating officer from 2001 to 2003, executive vice president from 2000 to 2001, and chief financial officer from 1998 to 2001. Prior to joining Swagelok, Mr. Anton was a partner at the accounting and consulting firm of Ernst & Young LLP, where he consulted with companies in the manufacturing, energy, service and other industries. He is a board member of two additional publicly-traded companies, including Olympic Steel, Inc. since 2009, a metal service center, and The Sherwin-Williams Company since 2006, a paint and building material manufacturing and distribution company. He is also a board member and chairman of the Finance Committee of University Hospitals of Cleveland. Key Experience, Attributes and Skills Mr. Anton’s leadership experience, both as a chief executive and chief financial officer, and his deep understanding of corporate strategy and vast financial acumen, make him a tremendous asset for Forest City and our Board of Directors. Through his experience serving on other public company boards, Mr. Anton is able to provide guidance on best practices, risk management and corporate governance strategies. | |
Age: 58 Director Since: 2010 Independent Board Committees: -Audit -Compensation Other Current Registered Company Directorships: -Olympic Steel, Inc. -The Sherwin-Williams Company | ||
9
 | Scott S. Cowen Principal Occupation and Business Experience Dr. Cowen has been the President Emeritus and Distinguished University Chair of Tulane University since July 2014. From July 1998 to July 2014, Dr. Cowen served as the President of Tulane University. While serving as President of Tulane University, he led the school, as well as the City of New Orleans, through the aftermath of Hurricane Katrina, and developed unique and exceptional skills in crisis management. In recognition of his leadership skills, he received the Carnegie Award for Academic Leadership as well as the TIAA-CREF Hesburgh Award for Leadership Excellence in Higher Education and was named one of the “Ten Best College Presidents” in America by Time magazine. Prior to 1998, Dr. Cowen was dean at the Weatherhead School of Management at Case Western Reserve University, where he was also a professor for 23 years. Dr. Cowen is currently a board member of three additional publicly-traded companies, including Newell Rubbermaid, Inc. since 1999, a consumer products corporation, Barnes & Noble, Inc. since April 2014, a leading bookseller and content, commerce and technology company, and NACCO Industries, Inc. since May 2014, a mining, small appliances and specialty retail holding company. In addition, Mr. Cowen served as a board member of American Greetings Corporation, formerly a publicly-traded greeting card company, from 1989 to 2013. Mr. Cowen has also served as a Senior Advisor for the Boston Consulting Group since January 2015. In 2010, President Barack Obama appointed him to the White House Council for Community Solutions, which advised the president on the best ways to mobilize citizens, nonprofits, businesses and government to address community needs. Mr. Cowen recently became a member of the board of trustees of Case Western Reserve University. Key Experience, Attributes and Skills An award-winning educator and leader, Dr. Cowen has consulted for dozens of companies, from start-ups to the Fortune 100. His impressive background and service on the boards of public companies has given him expertise in strategic planning, financial management, external reporting, organizational behavior, crisis management and corporate governance. During his tenure on our Board of Directors, Dr. Cowen has contributed valuable strategic oversight and has developed an in-depth knowledge of the real-estate industry, in general, and Forest City, in particular. | |
Lead Director Age: 69 Director Since: 1989 Independent Board Committees: -Compensation (Chair) -Corporate Governance and Nominating Other Current Registered Company Directorships: -Newell Rubbermaid, Inc. -Barnes & Noble, Inc. -NACCO Industries, Inc. | ||
 | Michael P. Esposito, Jr. Principal Occupation and Business Experience Mr. Esposito has been the non-executive chairman of Syncora Holdings Ltd., a guarantee insurance company, since 2006, and served as the non-executive chairman of Primus Guaranty Ltd., seller of credit protection, from 2002 to November 2014. In 1995, Mr. Esposito retired from The Chase Manhattan Bank, N.A. as the executive vice president, chief control, compliance and administrative officer after serving 34 years with the company in various positions, including principal accounting officer, corporate controller and chief financial officer. In 2007, he retired as the non-executive chairman of XL Capital Ltd., an insurance company. Mr. Esposito’s prior experience also included leadership positions within the Bank Administration Institute, American Bankers Association, Conference Board, and the Advisory Council to the Financial Accounting Standards Board. Key Experience, Attributes and Skills Mr. Esposito brings significant financial experience and expertise to our Board of Directors, including service with other publicly-traded companies. He provides valuable guidance on best practices in areas such as risk management, financial management, corporate governance, capital management and debt management. Mr. Esposito has chaired a strong Audit Committee of our Board of Directors, consistently receiving high ratings from proxy advisory firms relating to low Audit risk. | |
Age: 76 Director Since: 1995 Independent Board Committees: -Audit (Chair) -Compensation | ||
10
 | Stan Ross Principal Occupation and Business Experience Mr. Ross, a retired certified public accountant, holds multiple positions at the University of Southern California, including chairman of the board of the Lusk Center for Real Estate and distinguished fellow of the School of Policy, Planning & Development. He is the retired vice chairman of real estate industry services for Ernst & Young LLP, where he was a member of the firm’s management committee. Mr. Ross is a life trustee and governor of the Urban Land Institute, and trustee emeritus of his alma mater, Baruch College, from which he holds an honorary Doctor of Laws degree. He was also a member of the auditing standards board of the American Institute of Certified Public Accountants. Mr. Ross serves as senior advisor to The Irvine Company, a diversified private real estate company, and on the board of the American Jewish University. Key Experience, Attributes and Skills Mr. Ross brings substantial real estate experience and financial expertise to Forest City’s Board of Directors. As a nationally recognized real estate expert, he provides thoughtful and far-reaching insight into current economic and industry trends, domestic and global practices, and challenges facing the real estate sector. Mr. Ross’ expertise in accounting, tax and strategic planning for real estate companies has been invaluable to our Board of Directors throughout his tenure, particularly during the economic downturn. | |
Age: 80 Director Since: 1999 Independent Board Committees: -Audit -Compensation | ||
NOMINEES FOR ELECTION AS CLASS B DIRECTORS
 | Kenneth J. Bacon Principal Occupation and Business Experience Mr. Bacon co-founded RailField Partners, a financial advisory and asset management firm based in Washington, D.C., in 2012. Mr. Bacon began his career with Kidder Peabody and later transitioned to Morgan Stanley, where his focus was mortgage finance and related products. In 1990, he joined Resolution Trust Corporation as Director of Policy for the Oversight Board, and was later named Director of Securitization. Three years later, Mr. Bacon joined the Federal National Mortgage Association (Fannie Mae) as Senior Vice President, Northeast Region. In 1998, he was selected to lead Fannie Mae’s American Communities Fund. In 2000, he became Senior Vice President (with promotion in 2005 to Executive Vice President) of the organization’s Multifamily Division. He retired from Fannie Mae in 2012. Mr. Bacon is a board member of three additional publicly-traded companies, including Comcast Corporation since 2002, a global media and technology company, Ally Financial Inc. since February 2015, a financial service company, and Welltower Inc., a healthcare property REIT, since January 2016. He is also a board member of the National Multifamily Housing Council and serves on the advisory board of the Stanford Center on Longevity. Key Experience, Attributes and Skills Mr. Bacon brings significant financial, asset management and real estate experience to our Board of Directors. His varied professional officer roles, as well as his board service with other publicly-traded companies and real estate industry organizations, make him a tremendous asset to Forest City and to our Board. In addition, he provides recommendations on best practices in areas such as governmental affairs, the financial industry and the non-profit, educational and philanthropic communities. | |
Age: 61 Director Since: 2012 Independent Board Committees: -Audit -Corporate Governance and Nominating Other Current Registered Company Directorships: -Comcast Corporation -Ally Financial Inc. -Welltower, Inc. | ||
11
 | Christine R. Detrick Principal Occupation and Business Experience Ms. Detrick is a former Director, Head of Americas Financial Services Practice, and Senior Advisor at Bain & Company, where she served in such capacity from 2002 to 2011. Ms. Detrick began her career in the insurance industry at Progressive Corporation and Chubb Corporation, before joining McKinsey & Company in its New York office in 1984. In 1988, she was a founding partner of First Financial Partners, Inc., a venture capital firm specializing in savings and loan institutions, where she served as CEO in a turnaround setting for a failing savings and loan bank acquired by the firm. In 1992, she was recruited to the financial services practice at A.T. Kearney where she became the Global Head of Financial Services and served on the firm’s board of management and board of directors. Ms. Detrick is currently a board member of one additional publicly-traded company, Reinsurance Group of America, Incorporated, a global life reinsurance company, since 2014, and one company registered under the Investment Company Act of 1940, The Hartford Mutual Funds, Inc, a family of mutual funds, since February 2016. Key Experience, Attributes and Skills Ms. Detrick is a seasoned business executive with more than 30 years of experience leading and advising financial services companies and investors. She brings a wealth of executive-level experience in strategy, planning, governance, risk management and other areas that make her a strong, independent director and a tremendous asset to Forest City and the Board of Directors. | |
Age: 57 Director Since: November, 2014 Independent Board Committee: -Corporate Governance and Nominating Other Current Registered Company Directorships: -Reinsurance Group of America, Incorporated -The Hartford Mutual Funds, Inc. | ||
 | Deborah L. Harmon Principal Occupation and Business Experience Ms. Harmon is a co-founder and the Chief Executive Officer of Artemis Real Estate Partners, LLC, a real estate investment firm that manages $1.8 billion of institutional capital across the core plus, value add and opportunistic risk spectrum in a variety of real estate strategies. With over 25 years of experience in the real estate industry, she is responsible for establishing, implementing and overseeing strategic direction of Artemis. Prior to co-founding Artemis, she spent 17 years with the J.E. Robert Companies, Inc. (“JER”), a real estate investment firm where she was last President and Chief Investment Officer. Before joining JER, Ms. Harmon was a Managing Director at Bankers Trust Company in New York City where she worked in both the corporate finance and real estate groups handling a $2.0 billion portfolio of real estate developers and national corporations. Ms. Harmon currently serves on the board of Pension Real Estate Association; as a trustee of Urban Land Institute; the advisory boards of Caravel Management and BlackIvy Group; the investment committee of Sidwell Friends School; and the executive committee of the Zell/Lurie Real Estate Center at The Wharton School of the University of Pennsylvania. She also serves on the Board and Executive Committee of Women for Women International and, since 2009, as Commissioner for the White House Fellows program appointed by President Barack Obama. Ms. Harmon is a member of the Council on Foreign Relations and The Economic Club of Washington D.C. Key Experience, Attributes and Skills With more than 25 years in the management and investment of real estate funds, Ms. Harmon has extensive knowledge of the real estate investment and financial markets. She has expertise in real estate acquisition, capital markets, valuation, capital raising, strategic planning, implementation and oversight, and institutional portfolio management. She provides valuable guidance regarding the capital markets in which the Company operates, as well as the competitive environment in which we must raise capital. | |
Age: 56 Director Since: 2008 Independent Board Committee: -Corporate Governance and Nominating (Chair) | ||
12
 | David J. LaRue Principal Occupation and Business Experience Mr. LaRue has been our President and Chief Executive Officer since June 2011. He is also an officer of various subsidiaries of the Company. Prior to becoming President and Chief Executive Officer, Mr. LaRue served as Executive Vice President and Chief Operating Officer from March 2010 through June 2011. Mr. LaRue served as President and Chief Operating officer of Forest City Commercial Group, Inc. (now known as Forest City Commercial Group, LLC) from 2003 to March 2010, and as Executive Vice President of Forest City Rental Properties, Inc. (now known as Forest City Properties, LLC) from 1997 through 2003. Prior to joining Forest City in 1986, Mr. LaRue was an internal auditor and financial analyst with The Sherwin-Williams Company. Mr. LaRue served on the board of CubeSmart (formerly known as U-Store-It Trust), a publicly-traded real estate investment trust focused on self-storage facilities, from 2004 through May 2013. Mr. LaRue is a member of the NAREIT Board of Governors; a member of the Board of the Real Estate Roundtable; and a member of the Board and Executive Committee for the International Council of Shopping Centers. In addition, Mr. LaRue is a member of the Board of Trustees and Chair of the Capital Committee of the Friends of the Cleveland School of the Arts; a trustee and member of the Finance Committee of the Lawrence School; a member of the Board of Directors of St. Edward High School; and a member of the Board of Directors of the Greater Cleveland Partnership. Key Experience, Attributes and Skills Under Mr. LaRue’s leadership as our President and Chief Executive Officer, Forest City successfully executed a merger transaction in connection with its anticipated conversion to REIT status and continues to make significant progress on achieving its strategic objectives of focusing on core products in core markets, building a sustainable capital structure and achieving operational excellence. As an employee of the Company since 1986, Mr. LaRue brings vast experience in virtually every aspect of our business, along with broad strategic, operational and financial acumen to the Board of Directors. | |
Age: 54 Director Since: 2011 Forest City Executive | ||
 | Brian J. Ratner Principal Occupation and Business Experience Mr. Ratner has been our Executive Vice President since 2001 and is an officer and/or director of various subsidiaries of the Company. In particular, Mr. Ratner serves as President of Forest City Texas, LLC and leads our operations in Dallas, a core market for the Company. Mr. Ratner is active with numerous community, charitable, educational and professional organizations, including the Rock and Roll Hall of Fame and Museum, and membership on the board of trustees of Case Western Reserve University, the board of directors of the Jewish Federation of Greater Dallas and the board of governors of the Greater Dallas Symphony Orchestra. Key Experience, Attributes and Skills As a member of one of our founding families and a large shareholder with over 25 years of experience at Forest City, Mr. Ratner brings a depth of experience and knowledge of the real estate industry to the Board of Directors. His execution of transactions in our core market of Dallas brings regional market insight to our Board of Directors. In addition, he is a former practicing attorney and his legal experience and acumen provide critical thinking and analysis to the Board. | |
Age: 59 Director Since: 1993 Forest City Executive | ||
13
 | Bruce C. Ratner Principal Occupation and Business Experience Mr. Ratner has been our Executive Vice President since November 2006 and is Executive Chairman of Forest City Ratner Companies, the New York City subsidiary of Forest City. He also serves as an officer and/or director of various other subsidiaries of Forest City. Previously, Mr. Ratner served as Chief Executive Officer of Forest City Ratner Companies from 1987 through April 2013. Prior to joining Forest City, Mr. Ratner served as New York City’s Commissioner of Consumer Affairs during the administration of Mayor Ed Koch. He also served in the administration of former New York Mayor John Lindsay. He was also an Assistant Clinical Professor of Law at the New York University Law School. Mr. Ratner has served on many boards and is currently the Chairman of the Board of the Museum of Jewish Heritage - A Living Memorial to the Holocaust, and on the boards of the Memorial Sloan-Kettering Cancer Center and the Weill Cornell Medical College and a former board member of the Metropolitan Museum of Art. Key Experience, Attributes and Skills As a member of one of our founding families, a large shareholder, and the leader of our operations in one of our most important core markets, Mr. Ratner brings a wealth of experience in the real estate industry to the Board of Directors. His experience in city government also brings knowledge of the perspectives of major municipalities, and his legal training and acumen bring critical thinking and analysis to the Board. | |
Age: 71 Director Since: 2007 Forest City Executive | ||
 | Charles A. Ratner Principal Occupation and Business Experience Mr. Ratner has been the Chairman of our Board of Directors since June 2011. Previously, Mr. Ratner served as president and chief executive officer of the Company from 1995 through June 2011, and served as president and chief operating officer from 1993 to 1995. He is also an officer and/or director of various subsidiaries of Forest City. Mr. Ratner is currently a board member of one additional publicly-traded company, RPM, Inc. since 2005, a specialty coatings and sealants company. In addition, Mr. Ratner served as a board member of American Greetings Corporation, formerly a publicly-traded greeting card company, from 2000 to 2013. He is active with numerous community, charitable and professional organizations, including membership on the Board of Directors of the Cleveland Foundation and the United Jewish Communities. He also serves on the Board of Trustees of the Musical Arts Association, Mandel Associated Foundations, the Jewish Federation of Cleveland, and the David and Inez Myers Foundation and the Executive Committee of the Jewish Federation of Cleveland. Key Experience, Attributes and Skills As a member of one of our founding families, our former Chief Executive Officer and a large shareholder with over 40 years of experience at Forest City, Mr. Ratner brings a wealth of leadership experience and knowledge of the Company and the real estate industry to the Board of Directors. | |
Chairman Age: 74 Director Since: 1972 Chairman Since: 2011 Forest City Executive Other Current Registered Company Directorship: -RPM, Inc. | ||
14
 | Deborah Ratner Salzberg Principal Occupation and Business Experience Ms. Ratner Salzberg has been our Executive Vice President since June 2013 and is an officer and/or director of various subsidiaries of the Company. She also serves as president of Forest City Washington, Inc., a subsidiary of the Company, and leads our operations in the Washington D.C., metropolitan area, one of the Company’s core markets. Ms. Ratner Salzberg has been a board member of CubeSmart (formerly known as U-Store-It Trust) since 2013, a publicly-traded real estate investment trust focused on self-storage facilities. Ms. Ratner Salzberg is active with numerous District of Columbia community, charitable and professional organizations, including membership on the board of the Jewish Federation of Greater Washington, the board of trustees of Kenyon College, the board of directors of Capital Bank, N.A., the District of Columbia Building Industry Association and the Meyer Foundation. Key Experience, Attributes and Skills As a member of one of our founding families and a large shareholder with more than 30 years of experience at Forest City, Ms. Ratner Salzberg brings a wealth of experience and knowledge of the real estate industry and public-private partnerships to the Board of Directors. Her execution of transactions in our core market of the greater metropolitan area of Washington D.C. brings regional insight to our Board of Directors. In addition, her legal education provides critical thinking and analysis to the Board of Directors. | |
Age: 62 Director Since: 1995 Forest City Executive Other Current Registered Company Directorship: -CubeSmart | ||
 | Ronald A. Ratner Principal Occupation and Business Experience Mr. Ratner has been our Executive Vice President - Development since January 2016 and Executive Vice President since March 1988. He is also an officer and/or director of various subsidiaries of the Company. Mr. Ratner is active with numerous community, educational, charitable and professional organizations, including membership on the United States Holocaust Memorial Museum Council and the National Multi Housing Council, and the board of trustees of the Cleveland Clinic and Enterprise Community Partners. Key Experience, Attributes and Skills As a member of one of our founding families and a large shareholder with over 40 years of experience at Forest City, Mr. Ratner brings vast experience and knowledge of the real estate industry to the Board of Directors. In addition, as an architect by educational background, he brings vision and creativity to Board deliberations. | |
Age: 69 Director Since: 1985 Forest City Executive | ||
Voting
The nominees receiving the greatest number of votes cast will be elected. A proxy card marked “Withhold All” or “For All Except” with respect to the election of one or more directors will not be voted with respect to the director or directors indicated. Abstentions and broker non-votes, if any, will not be counted as votes cast for purposes of the election of directors and will have no effect on the result of the vote. We have been advised that the shares owned by RMSLP and otherwise owned by the Family Interests will be voted for the election of the directors nominated. If such shares are so voted, then such vote will be sufficient to elect the nominees voted on by the Class B Common Stock shareholders.
THE BOARD OF DIRECTORS UNANIMOUSLY RECOMMENDS A VOTE FOR EACH NOMINEE FOR DIRECTOR NAMED IN THIS PROXY STATEMENT.
15
CO-CHAIRMEN EMERITI
 | Samuel H. Miller Principal Occupation and Business Experience Mr. Miller has been our Co-Chairman Emeritus since June 2011. Mr. Miller was a Forest City director from 1960 through June 2011. He was a co-chairman of our Board from June 1995 through June 2011 and our treasurer from 1992 through June 2011. He previously served as chairman of the board from June 1993 to June 1995 and vice chairman and chief operating officer prior to June 1993. Mr. Miller was inducted into the Cleveland International Hall of Fame in 2013 and is active with numerous community, educational, charitable and professional organizations, including the Cleveland Clinic Foundation, Ashland University, Baldwin Wallace College, John Carroll University, Notre Dame College, the Catholic Diocese of Cleveland Foundation, and serves as a co-chairman emeritus and director and chair of the investment committee of Medical Mutual of Ohio. Key Experience, Attributes and Skills A large shareholder with significant experience in the real-estate industry and over 60 years of experience at Forest City, Mr. Miller provides us with leadership, experience, knowledge and vision. | |
Age: 94 Co-Chairman of the Board Service: 1995 - 2011 Director Service: 1960 - 2011 | ||
 | Albert B. Ratner Principal Occupation and Business Experience Mr. Ratner has been our Co-Chairman Emeritus since June 2011. Mr. Ratner was a Forest City director from 1960 through June 2011. He was a co-chairman of our Board from June 1995 through June 2011. He previously served as chief executive officer from 1975 to June 1995, vice chairman from June 1993 to June 1995, and president prior to June 1993. Mr. Ratner is active with numerous community, charitable and professional organizations, including service as an executive committee member and lifetime trustee of the Jewish Community Federation of Cleveland, an honorary trustee of Shoes & Clothes for Kids, an advisory committee member of the Rock and Roll Hall of Fame and Foundation, an advisory board member of Ginn Academy, a member of the Ohio Governor’s Executive Workforce Board, and a member of the board of directors of Global Cleveland. Key Experience, Attributes and Skills As a member of one of our founding families with significant experience in the real-estate industry and over 60 years of experience at Forest City, including former service as our chief executive officer, Mr. Ratner provides us with leadership, experience, knowledge and vision. | |
Age: 88 Co-Chairman of the Board Service: 1995 - 2011 Director Service: 1960 - 2011 | ||
16
The following table sets forth the beneficial ownership of shares of Class A and Class B Common Stock as of January 31, 2016 of each current director, nominee, and the other Named Executive Officers (as named in the Summary Compensation Table), as well as all directors and executive officers as a group.
| Number of Shares of Common Stock Beneficially Owned | |||||||||||||||
Class A Common | Percent of | Class A Assuming Conversion of Class B by the | Percent of | Class B Common | Percent of | ||||||||||
| Name | Stock(a)(c) | Class(a) | Beneficial Owner(b)(c) | Class(b) | Stock | Class | |||||||||
| Arthur F. Anton | 52,507 | (1) | 0.02 | % | 52,507 | 0.02 | % | — | 0.00 | % | |||||
| Scott S. Cowen | 78,416 | (2) | 0.03 | % | 78,416 | 0.03 | % | — | 0.00 | % | |||||
| Michael P. Esposito, Jr. | 199,514 | (3) | 0.08 | % | 199,514 | 0.08 | % | — | 0.00 | % | |||||
| Stan Ross | 104,492 | (4) | 0.04 | % | 104,492 | 0.04 | % | — | 0.00 | % | |||||
| Kenneth J. Bacon | 28,443 | (5) | 0.01 | % | 28,443 | 0.01 | % | — | 0.00 | % | |||||
| Christine R. Detrick | 11,851 | (6) | 0.00 | % | 11,851 | 0.00 | % | — | 0.00 | % | |||||
| Deborah L. Harmon | 42,729 | (7) | 0.02 | % | 42,729 | 0.02 | % | — | 0.00 | % | |||||
| David J. LaRue | 560,738 | (8) | 0.23 | % | 562,173 | 0.23 | % | 1,435 | 0.00 | % | |||||
| Brian J. Ratner | 1,913,865 | (9) | 0.79 | % | 15,421,342 | (9)(10) | 6.06 | % | 13,507,477 | (10) | 71.83 | % | |||
| Bruce C. Ratner | 1,011,048 | (11) | 0.42 | % | 1,011,048 | 0.42 | % | — | 0.00 | % | |||||
| Charles A. Ratner | 679,571 | (12) | 0.28 | % | 15,164,518 | (12)(13) | 5.93 | % | 14,484,947 | (13) | 77.03 | % | |||
| Deborah Ratner Salzberg | 2,016,047 | (14) | 0.84 | % | 15,797,028 | (14)(15) | 6.20 | % | 13,780,981 | (15) | 73.28 | % | |||
| Ronald A. Ratner | 1,019,911 | (16) | 0.42 | % | 15,720,193 | (16)(17) | 6.15 | % | 14,700,282 | (17) | 78.17 | % | |||
| OTHER NAMED EXECUTIVE OFFICERS | |||||||||||||||
| Robert G. O’Brien | 579,413 | (18) | 0.24 | % | 579,413 | 0.24 | % | — | 0.00 | % | |||||
| James A. Ratner | 1,312,345 | (19) | 0.54 | % | 2,915,845 | (19)(20) | 1.20 | % | 1,603,500 | (20) | 8.53 | % | |||
ALL DIRECTORS, NOMINEES AND EXECUTIVE OFFICERS AS A GROUP (19 in number) | 7,563,440 | (21) | 3.11 | % | 23,936,055 | (21)(22) | 9.22 | % | 16,372,615 | (22) | 87.06 | % | |||
| (1) | Includes 3,180 shares of restricted stock and 28,754 shares that were issuable upon the exercise of stock options vested at January 31, 2016 or that will vest within 60 days thereafter. |
| (2) | Includes 6,361 shares of restricted stock and 32,566 shares that were issuable upon the exercise of stock options vested at January 31, 2016 or that will vest within 60 days thereafter. |
| (3) | Includes 6,361 shares of restricted stock and 70,962 shares that were issuable upon the exercise of stock options vested at January 31, 2016 or that will vest within 60 days thereafter. |
| (4) | Includes 3,180 shares of restricted stock and 52,617 shares that were issuable upon the exercise of stock options vested at January 31, 2016 or that will vest within 60 days thereafter. |
| (5) | Includes 3,180 shares of restricted stock and 12,469 shares that were issuable upon the exercise of stock options vested at January 31, 2016 or that will vest within 60 days thereafter. |
| (6) | Includes 2,233 shares of restricted stock and 7,060 shares that were issuable upon the exercise of stock options vested at January 31, 2016 or that will vest within 60 days thereafter. |
| (7) | Includes 6,361 shares of restricted stock and 21,741 shares that were issuable upon the exercise of stock options vested at January 31, 2016 or that will vest within 60 days thereafter. |
| (8) | David J. LaRue has beneficial ownership of 47,116 shares of Class A Common Stock held in a trust for which he has sole power of voting and disposition and 9,400 shares held in custodial accounts. Includes 32,900 shares of restricted stock and 263,702 shares that were issuable upon the exercise of stock options vested at January 31, 2016 or that will vest within 60 days thereafter. |
| (9) | Brian J. Ratner has beneficial ownership of 1,802,029 shares of Class A Common Stock held in trusts and foundations: 1,771,229 shares for which he is trustee and has shared power of voting and disposition and 30,800 shares for which he has sole power of voting and disposition. Mr. Ratner has beneficial ownership of 25,000 shares held in trusts for which he is trust advisor and has shared power of voting and disposition. Includes 25,644 shares of restricted stock and 61,192 shares that were issuable upon the exercise of stock options vested at January 31, 2016 or that will vest within 60 days thereafter. |
17
| (10) | Brian J. Ratner has beneficial ownership of 533,172 shares of Class B Common Stock held in trusts: 497,934 shares for which he is trustee and has shared power of voting and disposition and 35,238 shares for which he has sole power of voting and disposition. Mr. Ratner has beneficial ownership of 85,712 shares held in trusts for which he is trust advisor and has shared power of voting and disposition. Mr. Ratner’s beneficial ownership of the remaining 12,888,593 shares of Class B Common Stock reflects his status as a general partner of RMSLP. Does not reflect the following shares of which Mr. Ratner disclaims beneficial ownership: 1,153,126 shares of Class B Common Stock held in trusts for which he is trustee, which shares are held in the Max Ratner Family Branch of RMSLP. See discussion of RMSLP on page 7. |
| (11) | Bruce C. Ratner and certain individuals and entities affiliated with Bruce C. Ratner hold 1,940,788 Class A Common Units (“Units”) in Forest City Master Associates III, LLC that were obtained in a transaction designed to increase Forest City’s ownership interest in 30 properties and service companies that were owned jointly by us and Bruce C. Ratner at the time of such transaction. See “Transactions With Bruce C. Ratner and His Affiliates” under the “Certain Relationships and Related Transactions” section of this proxy statement for a more detailed description of the transaction. The Units may be exchanged for an equal number of shares of our Class A Common Stock or, at our option, for cash equal to the then-current market price of our Class A Common Stock. Bruce C. Ratner claims beneficial ownership in 973,548 Units: 849,768 Units held by him and 123,780 Units held in a trust for which he is trustee. Bruce C. Ratner disclaims beneficial ownership in 748,615 Units held in trusts in which he is not trustee and 218,625 Units held directly by others. Bruce C. Ratner claims beneficial ownership of 15,000 shares of Class A Common Stock held in a custodial account. |
| (12) | Charles A. Ratner has beneficial ownership of 363,198 shares of Class A Common Stock held in trusts for which he is trustee and has shared power of voting and disposition. Mr. Ratner has beneficial ownership of 125,391 shares held in trusts for which he is trust adviser and has shared power of voting and disposition. Includes 190,982 shares that were issuable upon the exercise of stock options vested at January 31, 2016 or that will vest within 60 days thereafter. |
| (13) | Charles A. Ratner has beneficial ownership of 969,393 shares of Class B Common Stock held in trusts for which he is trustee and has shared power of voting and disposition. Mr. Ratner has beneficial ownership of 626,961 shares held in trusts for which he is trust advisor and has shared power of voting and disposition. Mr. Ratner’s beneficial ownership of the remaining 12,888,593 shares of Class B Common Stock reflects his status as a general partner of RMSLP. Does not reflect the following shares of which Mr. Ratner disclaims beneficial ownership: 314,478 shares of Class B Common Stock held in trusts for which he is trustee, which shares are held in the Albert Ratner Family Branch of RMSLP. See discussion of RMSLP on page 7. |
| (14) | Deborah Ratner Salzberg has beneficial ownership of 1,900,640 shares of Class A Common Stock held in trusts and foundations: 1,348,271 shares for which she is trustee and has shared power of voting and disposition and 552,369 shares for which she has sole power of voting and disposition. Ms. Ratner Salzberg has beneficial ownership of 32,352 shares held in trusts for which she is trust advisor and has shared power of voting and disposition. Includes 21,508 shares of restricted stock and 61,547 shares that were issuable upon the exercise of stock options vested at January 31, 2016 or that will vest within 60 days thereafter. |
| (15) | Deborah Ratner Salzberg has beneficial ownership of 806,676 shares of Class B Common Stock held in trusts: 369,082 shares for which she is trustee and has shared power of voting and disposition and 437,594 shares for which she has sole power of voting and disposition. Ms. Ratner Salzberg has beneficial ownership of 85,712 shares held in trusts for which she is trust advisor and has shared power of voting and disposition. Ms. Ratner Salzberg’s beneficial ownership of the remaining 12,888,593 shares of Class B Common Stock reflects her status as a general partner of RMSLP. Does not reflect the following shares of which Ms. Ratner Salzberg disclaims beneficial ownership: 1,726,930 shares of Class B Common Stock held in trusts for which she is trustee, of which 1,525,575 shares are held in the Max Ratner Family Branch of RMSLP and 201,355 shares are held in the Ruth Miller Family Branch of RMSLP. See discussion of RMSLP on page 7. |
| (16) | Ronald A. Ratner has beneficial ownership of 746,288 shares of Class A Common Stock held in trusts: 525,395 shares for which he is trustee and has shared power of voting and disposition and 220,893 shares for which he has sole power of voting and disposition. Mr. Ratner has beneficial ownership of 78,408 shares held in trusts for which he is trust advisor and has shared power of voting and disposition. Includes 13,539 shares of restricted stock and 181,676 shares that were issuable upon the exercise of stock options vested at January 31, 2016 or that will vest within 60 days thereafter. |
| (17) | Ronald A. Ratner has beneficial ownership of 1,332,785 shares of Class B Common Stock held in trusts: 1,182,785 shares for which he is trustee and has shared power of voting and disposition and 150,000 shares for which he has sole power of voting and disposition. Mr. Ratner has beneficial ownership of 478,904 shares held in trusts for which he is trust advisor and has shared power of voting and disposition. Mr. Ratner’s beneficial ownership of the remaining 12,888,593 shares of Class B Common Stock reflects his status as a general partner of RMSLP. See discussion of RMSLP on page 7. |
| (18) | Robert G. O’Brien has beneficial ownership of 109,224 shares of Class A Common Stock held in trusts: 75,811 shares for which he is trustee and has sole power of voting and disposition and 33,413 shares for which he is trust advisor and has shared power of voting and disposition. Includes 120,346 shares of restricted stock and 187,017 shares that were issuable upon the exercise of stock options vested at January 31, 2016 or that will vest within 60 days thereafter. |
| (19) | James A. Ratner has beneficial ownership of 860,277 shares of Class A Common Stock held in trusts: 858,393 shares for which he is trustee and has shared power of voting and disposition and 1,884 shares for which he has sole power of voting and disposition. Mr. Ratner has beneficial ownership of 256,853 shares held in trusts for which he is trust advisor and has shared power of voting and disposition. Includes 13,539 shares of restricted stock and 181,676 shares that were issuable upon the exercise of stock options vested at January 31, 2016 or that will vest within 60 days thereafter. |
| (20) | James A. Ratner has beneficial ownership of 1,603,500 shares of Class B Common Stock held in trusts which he is trustee and has shared power of voting and disposition. Does not reflect the following shares of which Mr. Ratner disclaims beneficial ownership: 2,682,997 shares of Class B Common Stock held in trusts for which he is trustee and 563,103 shares held in trusts for which he is trust advisor, of which 2,407,746 shares are held in the Max Ratner Family Branch of RMSLP and 838,354 shares are held in the Albert Ratner Family Branch of RMSLP. See discussion of RMSLP on page 7. |
| (21) | These shares of Class A Common Stock represent all the shares in which beneficial ownership is claimed by these persons. Shares for which beneficial ownership have been claimed by more than one person have been counted only once in this category. Includes 344,643 shares of restricted stock, 1,451,074 shares that were issuable upon the exercise of stock options vested at January 31, 2016 or that will vest within 60 days thereafter, and 973,548 Class A Common Units (see note 11 above). |
| (22) | These shares of Class B Common Stock represent all the shares in which beneficial ownership is claimed by these persons. Included in this total are 12,888,593 shares of Class B Common Stock that are held by RMSLP. Shares for which beneficial ownership have been claimed by more than one person have been counted only once in this category. |
| (a) | Does not reflect potential conversion of Class B Common Stock to Class A Common Stock. |
| (b) | Reflects potential conversion of all Class B Common Stock held by the person listed to Class A Common Stock. Shares of Class B Common Stock are convertible pursuant to their terms into shares of Class A Common Stock at any time on a one-for-one basis. |
| (c) | This column includes Class A stock options, if any, that were exercisable on January 31, 2016 or that will be exercisable within 60 days after such date. |
18
Voting Agreement: On November 8, 2006, we entered into a Voting Agreement with RMSLP, Powell Partners Limited, Joseph Shafran, and Bruce C. Ratner (the “Voting Agreement”). Pursuant to the terms of the Voting Agreement, the Board of Directors appointed Bruce C. Ratner as a Class B director. Additionally, RMSLP, Powell Partners Limited and Joseph Shafran have agreed to vote the shares owned by them for the election of Bruce C. Ratner to the Board of Directors at each meeting of our shareholders. If such shares are voted in accordance with the Voting Agreement, then such vote will be sufficient to elect Bruce C. Ratner as a Class B director. The Voting Agreement will terminate under any of the following three circumstances: (i) Bruce C. Ratner’s death or his physical or mental incapacity that prevents him from performing all duties required of our directors; (ii) Bruce C. Ratner and his affiliates no longer hold at least 1.5 million Class A Common Units in Forest City Master Associates III, LLC (or stock issued upon exchange of the Class A Common Units) while he is employed by us or at least 2.5 million Class A Common Units (or stock issued upon exchange of the Class A Common Units) if he is no longer employed by us; or (iii) Bruce C. Ratner materially breaches his non-compete agreement with us or any written policy generally applicable to all members of our Board of Directors. See “Transactions With Bruce C. Ratner and His Affiliates” under the “Certain Relationships and Related Transactions” section of this proxy statement for further discussion about Forest City Master Associates III, LLC.
Director Compensation
The director compensation policy was amended effective January 1, 2016 as shown in the following chart along side the policy that was in effect during 2015. Compensation is paid to nonemployee directors only. Directors who are also our employees receive no additional compensation for service as directors. All of our nonemployee directors are also independent directors.
| Nonemployee Director Compensation Policy | 2015 Amount | Effective 1/1/16 Amount |
Annual Board Retainer (1) | $60,000 | $65,000 |
Annual Stock Award (2) | $110,000 | $125,000 |
Annual Retainer to “Lead Director” | $15,000 | $25,000 |
| Annual Retainer to Committee Chairman for: | ||
| Audit Committee | $24,000 | $30,000 |
| Compensation Committee | $16,000 | $20,000 |
| Corporate Governance and Nominating Committee | $12,000 | $15,000 |
| Annual Retainer to Committee Members (other than Chairman) for: | ||
| Audit Committee | $12,000 | $15,000 |
| Compensation Committee | $8,000 | $10,000 |
| Corporate Governance and Nominating Committee | $6,000 | $7,500 |
| Other Fees for: | (fees per day) | (fees per day) |
Attending other formal meetings in their capacity as directors not held on the same day as a board meeting or board committee meeting, such as Executive Committee and strategic planning meetings. | $1,500 | $1,500 |
| Attending special meetings or performing special services in their capacity as members of a board committee, in each case as determined and approved by the applicable committee. | $1,500 | $1,500 |
Director Stock Ownership Requirement: (3) | ||
| Nonemployee directors have up to five years to accumulate ownership of our common stock in an amount of at least five times the annual board retainer, using a fixed number of shares approach to be reviewed at least once every three years and based upon the 90-day average price leading up to a December 31 measurement date. The shares may be acquired through direct acquisition, exercise of stock options, vesting of restricted stock, accumulation of phantom stock in their deferred compensation plan and 60% of unvested restricted stock. | ||
| (1) | We pay annual retainers in quarterly installments. |
| (2) | Nonemployee directors may choose between stock options and/or restricted stock in 25% multiples. For 2015, the default selection was a 50%-50% mix if no choice was made. Effective January 1, 2016, the default selection is 100% restricted stock. Equity grants to independent directors have one-year cliff vesting. The number of Class A Common Stock options granted is determined by dividing the amount of the award allocated to stock options by the Black-Scholes fair value, and the number of shares of restricted Class A Common Stock is determined by dividing the amount of the award allocated to restricted stock by the closing price of the Cass A Common Stock on the date of grant. The computed number of options and restricted shares are rounded down to eliminate fractional shares. |
| (3) | As of December 31, 2015, the most recent measurement date, all of our nonemployee directors, except Kenneth J. Bacon and Christine R. Detrick, met the stock ownership requirement of 16,430 shares. Mr. Bacon has accumulated more than 89% toward his requirement and will have until December 31, 2018 to meet the requirement. Ms. Detrick has accumulated more than 23% toward her requirement and will have until November 19, 2019 to meet the requirement. |
The Deferred Compensation Plan for Nonemployee Directors permits nonemployee members of the Board of Directors to defer 50% or 100% of their annual board retainer. Directors electing to participate select either a cash investment option or stock investment option for fees deferred during the year. Fees deferred to the stock investment option are deemed to be invested in phantom shares of our Class A Common Stock. Dividends earned on phantom shares are deemed to be reinvested in more shares.
19
After the participant ceases to be our director, the phantom shares accumulated in the participant’s account will be paid out in shares of Class A Common Stock or cash, as elected by the participant. In the aggregate, there were 14,962 phantom shares accumulated in participants’ accounts as of December 31, 2015. Participants may make an annual election as of each December 31 to reallocate their account balances between the two investment options. The Plan does not limit the number of shares that can be issued under the stock investment option.
The Corporate Governance and Nominating Committee bi-annually reviews the policy of nonemployee director compensation and annually reviews stock ownership requirements.
The information presented in the following table is for the year ended December 31, 2015. All other directors not listed are our employees and receive no compensation in their capacity as director.
Director Compensation Table
| Name | Fees Earned or Paid in Cash ($) | Stock Awards ($) (1) | Option Awards ($) (2) | Change in Pension Value and Nonqualified Deferred Compensation Earnings ($) (3) | All Other Compensation ($) (4) | Total ($) | ||||||||||||
| Arthur F. Anton | $ | 80,000 | $ | 54,976 | $ | 54,999 | $ | — | $ | — | $ | 189,975 | ||||||
| Kenneth J. Bacon | $ | 78,000 | $ | 54,976 | $ | 54,999 | $ | 866 | $ | — | $ | 188,841 | ||||||
| Scott S. Cowen | $ | 100,000 | $ | 109,978 | $ | — | $ | — | $ | — | $ | 209,978 | ||||||
| Christine R. Detrick | $ | 67,500 | $ | 54,976 | $ | 54,999 | $ | — | $ | — | $ | 177,475 | ||||||
| Michael P. Esposito, Jr. | $ | 105,500 | $ | 109,978 | $ | — | $ | 1,197 | $ | — | $ | 216,675 | ||||||
| Deborah L. Harmon | $ | 69,000 | $ | 109,978 | $ | — | $ | — | $ | — | $ | 178,978 | ||||||
| Stan Ross | $ | 80,000 | $ | 54,976 | $ | 54,999 | $ | — | $ | — | $ | 189,975 | ||||||
| (1) | Restricted stock grants are valued at their grant-date fair value based on the closing price of the Class A Common Stock on the date of grant computed in accordance with accounting guidance for share-based payments. During the year ended December 31, 2015, we granted restricted stock having a grant-date fair value of $24.62 per share as follows: Mr. Anton, 2,233; Mr. Bacon, 2,233; Dr. Cowen, 4,467; Ms. Detrick, 2,233; Mr. Esposito, 4,467; Ms. Harmon, 4,467; and Mr. Ross, 2,233. The aggregate number of shares of unvested restricted stock outstanding as of December 31, 2015 was as follows: Mr. Anton, 3,180; Mr. Bacon, 3,180; Dr. Cowen, 6,361; Ms. Detrick, 2,233; Mr. Esposito, 6,361; Ms. Harmon, 6,361; and Mr. Ross, 3,180. |
| (2) | Stock option grants are valued at their grant-date fair value that is computed using the Black-Scholes option-pricing model. The assumptions used in the fair value calculations in 2015 are described in Footnote O, “Stock-Based Compensation,” to our consolidated financial statements for the year ended December 31, 2015, which are included in our Annual Report on Form 10-K filed with the SEC. During the year ended December 31, 2015, we granted stock options having a grant-date fair value of $7.7902 per share as follows: Mr. Anton, 7,060; Mr. Bacon, 7,060; Ms. Detrick, 7,060; and Mr. Ross, 7,060. The options have an exercise price of $24.62, which was the closing price of the underlying Class A Common Stock on the date of grant. The aggregate number of stock options outstanding as of December 31, 2015 was as follows: Mr. Anton, 30,273; Mr. Bacon, 13,988; Dr. Cowen, 32,566; Ms Detrick, 7,060; Mr. Esposito, 70,962; Ms. Harmon, 21,741; and Mr. Ross, 54,136. |
| (3) | Amounts deferred under the Deferred Compensation Plan for Nonemployee Directors under the cash investment option earn interest at a rate equal to the average of the Moody’s Long-Term Corporate Bond Yields for Aaa, Aa and A, plus 0.5% (“Moody’s Rates”). The rate is updated every calendar quarter using the first published Moody’s Rates of the new quarter. Interest rates ranged from 4.08% to 4.89% during the year ended December 31, 2015. Interest is compounded quarterly. The amounts shown in this column represent the amount of above-market earnings on each director’s nonqualified deferred compensation balances. The amount of above-market earnings was computed to be the amount by which the actual earnings exceeded what the earnings would have been had we used 120% times the Federal Long-Term Rates published by the Internal Revenue Service in accordance with Section 1274(d) of the Internal Revenue Code. |
| (4) | All other compensation does not include our incremental cost for the use of our chartered airplane service by directors for attending board of directors meetings and committee meetings because such use is deemed to be a business expense. The total incremental cost of airplane usage by all directors for business purposes amounted to $64,093 for the year ended December 31, 2015. |
20
Principal Security Holders
Unless otherwise indicated, the following table sets forth the security ownership as of January 31, 2016 of all other persons who beneficially own more than 5% of our Common Stock.
| Number of Shares of Common Stock Beneficially Owned | ||||||
| Name and Address | Class A Common Stock (a) | Percent of Class (a) | Class A Assuming Conversion of Class B by the Beneficial Owner (b) | Percent of Class (b) | Class B Common Stock | Percent of Class |
| The Vanguard Group | 30,237,739 (1) | 12.55% | 30,237,739 (1) | 12.55% | — | 0.00% |
| 100 Vanguard Boulevard | ||||||
| Malvern, PA 19355 | ||||||
| Scopia Capital Management LP | 17,735,795 (2) | 7.36% | 17,735,795 (2) | 7.36% | — | 0.00% |
| 152 West 57th Street, 33rd Floor | ||||||
| New York, NY 10019 | ||||||
| BlackRock, Inc. | 12,507,909 (3) | 5.19% | 12,507,909 (3) | 5.19% | — | 0.00% |
| 55 East 52nd Street | ||||||
| New York, NY 10055 | ||||||
| FMR LLC | 12,407,740 (4) | 5.15% | 12,407,740 (4) | 5.15% | — | 0.00% |
| 245 Summer Street | ||||||
| Boston, MA 02210 | ||||||
| Ratner, Miller & Shafran Family Interests | 9,048,616(5) | 3.75% | 26,421,745(5) | 10.20% | 17,373,129(5) | 92.38% |
| (see page 7) | ||||||
| Terminal Tower | ||||||
| 50 Public Square, Suite 1600 | ||||||
| Cleveland, OH 44113 | ||||||
| (1) | The Vanguard Group has sole voting power of 506,743 shares of Class A Common Stock, sole dispositive power of 29,881,379 shares of Class, A Common Stock, shared voting power of 190,500 shares of Class A Common Stock and shared dispositive power of 356,360 shares of Class A Common Stock. The number of shares of Class A Common Stock represents shares beneficially owned at February 29, 2016 as disclosed in Schedule 13G filed with the SEC by the principal security holder. |
| (2) | Scopia Capital Management LP has shared voting and dispositive power of 17,735,795 shares of Class A Common Stock. The number of shares of Class A Common Stock represents shares beneficially owned at December 31, 2015 as disclosed in Schedule 13G/A filed with the SEC by the principal security holder. |
| (3) | BlackRock, Inc. has sole voting power of 11,668,163 shares of Class A Common Stock and sole dispositive power of 12,507,909 shares of Class A Common Stock. The number of shares of Class A Common Stock represents shares beneficially owned at December 31, 2015 as disclosed in Schedule 13G filed with the SEC by the principal security holder. |
| (4) | FMR LLC has sole voting power of 2,120,694 shares of Class A Common Stock and sole dispositive power of 12,407,740 shares of Class A Common Stock. The number of shares of Class A Common Stock represents shares beneficially owned at December 31, 2015 as disclosed in Schedule 13G/A filed with the SEC by the principal security holder. |
| (5) | The Ratner, Miller and Shafran families have an ownership interest in the Company as reflected in the principal security holders table. These securities are beneficially owned by members of these families either individually or through a series of trusts, foundations and custodianships. Of the shares of Class B Common Stock listed, RMSLP owns 12,888,593 shares, which represent 68.54% of the Class B Common Stock outstanding at January 31, 2016. |
Certain members of the Ratner family are currently directors and have been nominated for election to serve on our Board of Directors. (See information regarding current directors and director nominees previously disclosed in this proxy statement regarding the beneficial ownership of Common Stock by these individuals). Samuel H. Miller, Abraham Miller and Joan K. Shafran are each general partners of RMSLP, but are not directors, director nominees or Named Executive Officers. Samuel H. Miller has beneficial ownership of 1,120,319 shares of Class A Common Stock, of which 1,110,020 are held in trusts and a foundation: 648,505 shares for which he has sole power of voting and disposition and 461,515 shares for which he is a trustee with shared power of voting and disposition. Samuel H. Miller has beneficial ownership of 278,718 shares of Class B Common Stock held in trusts in which he is trustee and has sole power of voting and disposition. Abraham Miller has beneficial ownership of 275,423 shares of Class A Common Stock held in trusts: 37,154 shares for which he is a trustee with shared power of voting and disposition and 238,269 shares for which he has sole power of voting and disposition. Abraham Miller has beneficial ownership of 147,433 shares of Class B Common Stock held in trusts: 36,255 shares for which he is trustee and has shared power of voting and disposition and 111,178 shares for which he has sole power of voting and disposition. Joan K. Shafran has beneficial ownership of 217,543 shares of Class A Common Stock held in trusts, foundations and partnerships: 128,018 shares for which she has sole power of voting and disposition and 89,525 shares for which she has shared
21
power of voting and disposition. Joan K. Shafran has beneficial ownership of 13,500 shares of Class B Common Stock held in partnerships in which she has shared power of voting and disposition. As general partners of RMSLP, Samuel H. Miller, Abraham Miller and Joan K. Shafran each have beneficial ownership of the 12,888,593 shares of Class B Common Stock owned by RMSLP. See discussion of RMSLP under “Election of Directors” on page 7 for additional details.
| (a) | Does not reflect potential conversion of Class B Common Stock to Class A Common Stock. |
| (b) | Reflects potential conversion of all Class B Common Stock held by the principal security holder listed to Class A Common Stock. Shares of Class B Common Stock are convertible into shares of Class A Common Stock at anytime on a one-for-one basis. |
Corporate Governance
We are managed by our senior management under the direction of the Board. The Board operates within a comprehensive plan of corporate governance and has adopted, and periodically reviews, policies and procedures to guide it in the discharge of its oversight responsibilities. Those policies and procedures are summarized in this section. Copies of the Corporate Governance Guidelines adopted by our Board, its committee charters, the Forest City Realty Trust, Inc. Code of Legal and Ethical Conduct (“Code of Legal and Ethical Conduct”) and other relevant information are set forth or explained in greater detail on our website at www.forestcity.net. References to our website are for your convenience; however, the information contained on our website is not incorporated into this proxy statement or any other report we file with the Securities and Exchange Commission (the “SEC”).
The Board also routinely compares our corporate governance policies and practices to those suggested by various groups or authorities active in corporate governance, including proxy advisory firms, as well as the requirements of the SEC, including the Sarbanes-Oxley Act of 2002, the Dodd-Frank Wall Street Reform and Consumer Protection Act and the listing standards of the New York Stock Exchange (“NYSE”). These reviews specifically focus on the following areas of corporate governance:
| • | our Corporate Governance Guidelines in general; |
| • | our current Board composition, size and compensation; |
| • | our Board and Board committee operation and charters; |
| • | certain procedures relating to our Code of Legal and Ethical Conduct; |
| • | our director nomination process; |
| • | our shareholder communications process; and |
| • | director continuing education. |
We will continue to adopt further changes in the future that the Board believes are in the best interests of the company and long-term shareholder value creation.
Corporate Governance Guidelines
The Board believes in establishing a corporate culture of accountability, integrity, responsibility, legal compliance, ethical behavior and transparency through the careful selection and evaluation of senior management and members of the Board and by carrying out the responsibilities of the Board with honesty and integrity. Our Corporate Governance and Nominating Committee performed its annual review of our Corporate Governance Guidelines, as well as the Board committee charters and Code of Legal and Ethical Conduct, and did not recommend any substantive changes.
Our Corporate Governance Guidelines, among other matters, provide for Audit, Compensation, and Corporate Governance and Nominating Committees; all members of the Audit, Compensation and Corporate Governance and Nominating Committees to be independent directors as determined in accordance with applicable standards, rules, laws and regulations, including but not limited to, standards and rules promulgated by the NYSE; regular sessions of independent directors; an annual self-assessment process for the Board and its committees; succession planning; new director orientation; and continuing director education. These guidelines, as amended, largely document practices and principles already in place at the Board level and are available on our website at www.forestcity.net.
Board Leadership Structure
The Board has chosen to separate the positions of chairman of the Board and chief executive officer. We believe this structure is optimal for us because it provides a checks and balances process between the chairman and the chief executive officer. This
22
separation provides strong leadership for the Board and the Company through the chairman, while also positioning our chief executive officer as our leader in the eyes of our employees and other stakeholders. The Board has no formal policy that requires the separation or combination of the chairman and chief executive officer roles. Our chairman of the Board also serves in an executive officer capacity. Because our chairman serves in an executive officer capacity, the Company has chosen to have an independent lead director, as well.
The chairman’s role, among other responsibilities, is to provide overall leadership to the Board; ensure that the Board fulfills its advisory, oversight and corporate governance responsibilities; lead the Board in its oversight of the Company’s long-term strategic plan and initiatives, annual operating plans, and risks; in consultation with the chief executive officer, develop a schedule of Board and Board committee meetings, establish the agenda for Board meetings, and assess the need for special meetings of the Board; chair the meetings of the Board and the annual meeting of shareholders; interview Board candidates, along with the Corporate Governance and Nominating Committee and chief executive officer, and recommend Board candidates to the Corporate Governance and Nominating Committee; facilitate communications and serve as the principal liaison on Board-related issues between the chief executive officer and the lead director; assess and advise the chief executive officer as to the quality, quantity and timeliness of the flow of information from Company management to the Board; review with the Corporate Governance and Nominating Committee and the chief executive officer recommendations regarding Board committee structure, membership and chairperson selections; engage in communications with shareholders, the investment community and other external constituencies, as appropriate; act as a mentor to the chief executive officer; chair the search committee for chief executive officer succession planning, as appropriate; and perform other powers and duties as may be prescribed by the Board.
The chief executive officer’s role, among other responsibilities, is to provide day-to-day leadership for the Company; establish, direct and lead the vision, mission, core values and long-term strategic plan and initiatives of the Company; establish and direct annual and long-term business and financial plans and objectives for the Company and its business units; direct and lead programs and initiatives regarding talent and leadership development, and senior management succession planning; direct and lead the development of programs and initiatives that promote organizational development and growth; direct and lead the efforts to ensure the integrity of the Company’s financial statements and reporting, compliance with applicable laws and ethical business conduct; identify, assess and manage the Company’s exposure to enterprise risks, compliance with health and safety standards and minimization of the Company’s environmental impact; generally serve as the Company’s chief spokesperson; participate in investor relations; facilitate Board governance and administration; regularly meet with the lead director and individual Board members from time to time; and perform other powers and duties as may be prescribed by the Chairman or the Board.
Our independent directors meet in an executive session following each regularly scheduled Board meeting. In accordance with our Corporate Governance Guidelines, Dr. Scott S. Cowen, as an independent, non-management director, is the lead director over all of those sessions. The role of the independent lead director and the executive sessions is to provide balance between the different perspectives of the independent directors and the management directors and maintain proper independent oversight of management. In addition, the lead director’s role, among other responsibilities, is to chair meetings of the Board at which the chairman is not present; as appropriate, engage in communications with shareholders, the investment community and other external constituencies; keep the Board focused on strategic decisions and matters of significance for the long-term success of the Company; facilitate communications and serve as the principal liaison on Board-related issues between the chief executive officer, the chairman and the independent directors; authorize the retention of independent legal advisors, consultants and other advisors that report to the Board on Board-related issues; and perform other powers and duties as may be prescribed by the independent directors from time to time.
While we recognize that different board leadership structures may be appropriate for companies in different situations, we believe our current leadership structure, with the separation of duties and responsibilities between the chairman, the chief executive officer, and the lead director, is the optimal structure for us at this time.
The Board’s Role in Risk Oversight
Our Board plays an important role in our risk oversight and identification of potential risks. While management is responsible for the day-to-day management of the risks we face, our Board and its committees oversee and identify risks through their direct decision-making authority with respect to significant matters and the oversight of management.
Risk oversight is administered by our Board (or a Committee thereof) through:
| • | The review and discussion of regular periodic reports to the Board and its Committees on topics relating to the risks we face, including, among others, national and international market and industry conditions, cash projections, internal financial measures, occupancy rates, the status of current and anticipated development projects, compliance with debt covenants, management of debt maturities, the ability to refinance, tax matters, access to debt and equity capital markets, |
23
changes in interest rates, competition, regulatory matters, cybersecurity, existing and potential legal claims against us and various other matters of risk relating to our business;
| • | The required approval by the Board (or a Committee thereof) of significant transactions and decisions, including, among others, executive compensation plans, equity and capital transactions, strategic planning, budget and the appointment of, succession planning for and retention of senior management; |
| • | The direct oversight by the Board (or a Committee thereof) of the Company’s overall risk management program, including the mitigation of risk through development and training of our employees, pertaining to specific areas of our business, enterprise risk management and strategic, industry, business and other significant risks facing the Company; and |
| • | Regular periodic reports to the Board from our internal and external auditors, internal legal department and other outside consultants regarding various areas of potential risk. |
Our Board relies on management and our internal audit group to bring significant matters impacting us to the Board’s attention. Management is responsible for identifying the Company’s significant strategic business risks and other risks, developing risk management strategies and policies to mitigate such risks, and integrating risk management into the Company’s decision-making process and strategy. To that end, the Company has implemented an enterprise risk management program where management identifies, monitors and controls such risks and exposures. This risk management structure helps ensure that necessary information regarding significant risks and exposures is transmitted across the Company’s leadership, including the appropriate Board Committees and the Board of Directors.
Our Board discharges many of its responsibilities and oversight functions with respect to risk through its Audit, Compensation, and Corporate Governance and Nominating Committees. The Audit Committee is the lead committee for the Board’s risk oversight functions through its oversight of the enterprise risk management system and its review of our: financial statements and preparation thereof, including internal controls over financial reporting; fraud risks identified by management and internal and external auditors; management of financial risk; risk assessments; enterprise risk management program; cybersecurity risks; and compliance with our internal policies, such as policies related to data privacy, information technology, conflict of interest, Regulation FD, anti-corruption, insider trading and social media. In addition, the Audit Committee oversees our Code of Legal and Ethical Conduct, including an annual update on the content, implementation, operation and effectiveness of our ethics program and the administration of our whistleblower procedures. The Compensation Committee establishes the appropriate compensation incentives and is responsible for assessing whether our compensation programs and policies encourage inappropriate risk taking. The Corporate Governance and Nominating Committee is responsible for advising the Board on matters of organizational and governance structure for effective oversight. See “Meetings and Committees of the Board of Directors” for further discussion of the roles and responsibilities of each of the Committees.
Because all of these Committees are comprised of independent directors, our independent directors have a significant role in the Board’s risk oversight function. As part of the oversight process, each Committee regularly receives reports from members of senior management on areas of material risk to us that are under the purview of that Committee to enable it to understand our risk identification, risk management and risk mitigation strategies. While each Committee is responsible for evaluating and overseeing certain risks, the entire Board is apprised of such risks through regular Committee reports. This enables the Board and its Committees to assume joint accountability and to coordinate the risk oversight role, particularly with respect to risk interrelationships.
Because of the Board’s role in our risk oversight program, the Board believes that any leadership structure that it adopts must allow it to effectively oversee the management of the risks relating to our operations. The Board recognizes that there are different leadership structures that could allow the Board to effectively oversee the management of the risks relating to our operations, and while the Board believes its current leadership structure enables it to effectively manage such risks, it was not the primary reason the Board selected its current leadership structure over other potential alternatives. See the discussion under the heading “Board Leadership Structure” above for a discussion of why the Board has determined that its current leadership structure is appropriate.
Independence Determinations
We are considered a “controlled company” under the NYSE corporate governance rules because, as of January 31, 2016, the Family Interests controlled 92.4% of Class B votes, which has the power to elect a majority of our Board of Directors. See the section of this proxy statement entitled “Election of Directors” for a description of the Family Interests. As a matter of good corporate governance, the Board of Directors is composed of a majority of independent directors despite not being required to do so under the NYSE rules due to our “controlled company” status. Furthermore, the Board has determined that all members of our Compensation, Corporate Governance and Nominating and Audit Committees are independent after considering all applicable standards for independence established by the NYSE for membership on such Committees.
24
The Board unanimously determined that Messrs. Anton, Bacon, Cowen, Esposito and Ross and Mss. Detrick and Harmon are neither affiliated persons of ours, nor do they have any material relationship with us (other than their role as our director) and, therefore, qualify as independent directors within the meaning of all applicable laws and regulations, including the independence standards of the NYSE.
In making these independence determinations, the Board considered all of the factors that automatically compromise director independence as specified in the respective independence standards of the SEC and the NYSE, including but not limited to charitable contributions to any charitable organization in which such director serves as a trustee or director, and determined that none of those conditions existed. In addition, the Board considered whether any direct or indirect material relationship, beyond those factors that automatically compromise director independence, existed between either us and/or our management and/or any of their respective affiliates or family members or otherwise between each director or any family member of such director or any entity with which such director or family member of such director was employed or otherwise affiliated. For those directors for whom the Board determined there was a relationship, with respect to each of the most recent three completed fiscal years, the Board evaluated the following:
| • | Matching charitable contributions to various non-profit organizations with which Messrs. Anton, Bacon, Cowen, Esposito or Ross, or Mss. Detrick or Harmon are affiliated and determined that the amount of the contribution to any such organization in each of the past three fiscal years was below the limits set forth in our independence standards. |
The Board determined, for those directors identified as independent above, that any relationship that existed was not material and did not compromise that director’s independence from management. Accordingly, all of these directors are independent under SEC and NYSE requirements, as well as our own Corporate Governance Guidelines.
Communications with the Board
Our Lead Director receives and responds to communications from shareholders and he, along with our other independent Board members, have met and may continue to meet with our shareholders from time to time.
We have established procedures to permit confidential and anonymous (if desired) submissions to the Lead Director regarding concerns about our conduct. Interested parties may make their concerns about us known to the independent or non-management directors by directly mailing Dr. Scott S. Cowen, the Lead Director, a statement of concerns marked “Confidential” and addressed as follows:
Dr. Scott S. Cowen, Lead Director
c/o General Counsel
“Confidential”
Forest City Realty Trust, Inc.
Terminal Tower
50 Public Square, Suite 1360
Cleveland, Ohio 44113
Code of Legal and Ethical Conduct
We require that all directors, officers and employees adhere to our Code of Legal and Ethical Conduct in addressing the legal and ethical issues encountered in conducting their work. The Code of Legal and Ethical Conduct requires, among other things, that our employees avoid conflicts of interest, comply with all laws and other legal requirements and otherwise act with integrity.
We require all directors, management personnel, and employees to annually review and acknowledge compliance with our Code of Legal and Ethical Conduct. Furthermore, all newly hired employees are required to acknowledge receipt and compliance with the Code of Legal and Ethical Conduct. In addition, those with supervisory duties are also required to acknowledge their responsibility for both informing and monitoring compliance with the Code of Legal and Ethical Conduct on the part of employees under their supervision. In 2015, 100% of our directors, officers and employees acknowledged compliance with the Code of Legal and Ethical Conduct.
The Board adopted a Senior Financial Officers Code of Ethical Conduct as an addendum to the Code of Legal and Ethical Conduct. The Senior Financial Officers Code of Ethical Conduct formalizes the general standards of honesty, integrity and judgment that we expect of our senior financial officers. We require our senior financial officers to annually acknowledge receipt of and compliance with the Senior Financial Officers Code of Ethical Conduct.
25
In addition, the Board adopted a Supplier Code of Conduct in 2012. The Supplier Code of Conduct formalizes our expectations of suppliers and sets forth legal, moral and ethical standards and guidelines by which we expect our suppliers to abide. In 2014, the Board adopted substantial enhancements to the Supplier Code of Conduct to add additional standards related to health and human safety, and labor and human rights; and enhanced provisions related to gifts and gratuities.
We have implemented an anonymous hotline monitored by an external, third-party firm. Our Audit Committee has adopted a policy statement entitled “Employee Complaint Procedures for Accounting and Auditing Matters” establishing procedures to investigate complaints.
Copies of the Code of Legal and Ethical Conduct and the Supplier Code of Conduct are available on the Company’s website at www.forestcity.net.
Corporate Social Responsibility
Since 2013, we have published annual corporate social responsibility (“CSR”) reports according to the Global Reporting Initiative (“GRI”) framework, a widely recognized and standardized set of principles for the preparation of CSR reports. To strengthen our commitment to our CSR efforts, during 2015 we conducted an assessment to determine which CSR topics are of highest priority to manage and measure. As part of this effort, we considered the CSR impacts for our core markets, gathered input from critical external stakeholders, and weighed inputs based upon the strength of evidence and stakeholder prioritization. This process informed our CSR strategy going forward and compelled us to continue advancing our commitment to transparency via external reporting. In 2016, we expect to issue our first GRI G4 report, emphasizing the prioritization and management of the greatest impacts along our value chain, as well as our related CSR governance mechanisms.
As a result of our CSR reporting and efforts, our MSCI ESG (Environmental, Social Governance) rating improved from BB in 2013 to its current rating of AA, and we are now included in MSCI’s Global Sustainability Index Series. In 2015, we participated in the Global Real Estate Sustainability Benchmark (GRESB) survey for the first time, earning a Green Star for performance, placing us among the top quadrant of respondents. GRESB is an industry-driven organization committed to assessing the sustainability performance of real estate assets and portfolios around the world.
To view our latest CSR report, visit http://csr.forestcity.net.
Lobbying Policy and Political Activity Procedures
We are committed to being a responsible corporate citizen and, from time to time, participate in the public policy arena on a wide range of issues that are important to our shareholders, customers, lenders, partners and employees. We have adopted a formalized lobbying policy and set of procedures, as well as corporate political contribution procedures. The procedures set forth guidelines on the engagement of lobbyists and participation in lobbying activities, ensures compliance with lobbying and political contribution regulations and aids the Board’s oversight of our political activities.
Meetings and Committees of the Board of Directors
The Board
The authorized size of the Board of Directors is currently set at thirteen (13) members. Since December 2012, a majority of the members of our Board are independent, consisting of seven independent members and six non-independent members. Of the six non-independent members, five directors are members of the Ratner families and all six are members of management. Biographical information and information about the Board Committees on which our director nominees serve are set forth in the “Election of Directors” section of this proxy statement and in this section, under “Committees of the Board.”
During the year ended December 31, 2015, our Board of Directors held four regular meetings and three special meetings. All directors attended at least 75% of the aggregate of the meetings of the Board and those Committees on which and during which time each director served, with the exception of Bruce Ratner, who attended 71.4%. In total, the average board meeting attendance during 2015 was 93%. We have a policy that members of the Board are expected to attend the annual meeting of shareholders when the annual meeting of shareholders coincides with a Board meeting. The exception to this attendance requirement is when the two meetings are not consecutively scheduled. All thirteen directors attended the 2015 annual meeting of shareholders.
In addition to the regular and special meetings, our Board of Directors held seven informational sessions during 2015. Members of management and external advisors often attended these sessions. At the informational sessions, the Board discussed the progress of the Company’s strategic plan, conversion to REIT status and internal reorganization. Along with the Board meetings, the informational sessions provided Board members with education and relevant management reports from which the Board could
26
perform its oversight duties, make well-informed decisions and offer guidance to the Company during 2015, a year of significant organizational transformation. Further, the additional meetings and discussions enhanced the Board’s ability to fulfill its fiduciary duties to shareholders and the Company.
Led by Dr. Scott S. Cowen, our Lead Director, the independent members of the Board meet in an executive session following each regularly scheduled Board meeting.
Committees of the Board
The Board’s policy is to conduct its specific oversight tasks through committees, with the objective of freeing the Board as a whole to focus on strategic business and significant risk oversight and matters that by law or good business practice require the attention of the full Board. Our Board has established three standing committees, functioning in the following areas:
| • | audit and financial reporting; |
| • | management compensation, succession plan and progress, and review of diversity plan and progress; and |
| • | nominations, corporate governance, succession plan and progress and review of diversity plan and progress. |
The following table indicates the members of each Board Committee during the year ended December 31, 2015:
| Name | Audit | Compensation | Corporate Governance and Nominating |
| Arthur F. Anton | Member | Member | |
| Kenneth J. Bacon | Member | Member | |
Scott S. Cowen (1) | Chair | Member | |
| Christine R. Detrick | Member | ||
| Michael P. Esposito, Jr. | Chair | Member | |
Deborah L. Harmon (2) | Chair | ||
| Stan Ross | Member | Member | |
| (1) | Dr. Cowen served as the Interim Chair of the Corporate Governance and Nominating Committee from November 19, 2014 to May 28, 2015. |
| (2) | Ms. Harmon was appointed Chair of the Corporate Governance and Nominating Committee on May 28, 2015. |
Each of our standing Committees operates under a written charter that is annually reviewed by the respective committees and recommended by the Corporate Governance and Nominating Committee and approved by the Board. The Committee Charters for each of our standing Committees can be viewed on our website at www.forestcity.net. Each Board Committee is authorized to retain outside advisors.
Audit Committee: Our Audit Committee is presently composed of four nonemployee, independent directors. The Board has determined that each member of the Audit Committee qualifies as an audit committee “financial expert” in accordance with the requirements of Section 407 of the Sarbanes-Oxley Act of 2002 and the SEC rules implementing that section. The Audit Committee’s purpose is to assist the Board in fulfilling its oversight responsibilities with respect to the following:
| • | integrity and adequacy of our financial reporting systems and business process controls, including our system of internal controls, accounting controls and disclosure controls; |
| • | compliance with legal, ethical and regulatory requirements including, but not limited to, the requirements of the Sarbanes-Oxley Act of 2002; |
| • | review of the Company’s quarterly financial statements and audited financial statements, including footnotes, management’s discussion and analysis and all related disclosures to be filed with the SEC, as well as the earnings press releases, supplemental packages and any financial information or earnings guidance provided to analysts or rating agencies; |
| • | correspondence with regulators or government agencies and any complaints or concerns regarding the Company’s financial statements or accounting policies; |
27
| • | appointment, oversight, retention, termination, approval of compensation and evaluation of the qualifications, performance and independence of the independent registered public accounting firm, as well as the approval of all non-audit engagements of such firm and the participation in the selection of the lead audit and lead reviewing partners of such firm; |
| • | approval of the annual internal audit plan and respective department budget; |
| • | evaluation of our internal audit function, including the annual performance evaluation of and approval of the compensation to our chief internal auditor; |
| • | review and approval of our hedging strategy and the use of swaps and other derivative instruments, and review and approval, at least annually, of our decisions to enter into swaps, including those subject to the “end-user exception” under the Commodity Exchange Act; |
| • | oversight of our enterprise risk management including information technology security and related cybersecurity risks; and |
| • | production of the Audit Committee’s report, made pursuant to the Securities Exchange Act of 1934, to be included in the proxy statement relating to our annual meeting of shareholders. |
The Audit Committee meets with the independent registered public accounting firm on a quarterly basis and periodically as deemed necessary. In addition, the Audit Committee has implemented a policy for “Employee Complaint Procedures for Accounting and Auditing Matters,” which establishes procedures for the receipt, retention, treatment and internal investigation of complaints regarding accounting, internal accounting controls, or auditing matters and the confidential, anonymous submission by employees of concerns regarding questionable accounting or auditing matters.
Our shareholders will have the opportunity to ratify the appointment of our independent registered public accounting firm at the Annual Meeting (see “Ratification of Independent Registered Public Accounting Firm” in this proxy statement). Although this ratification is not required by law, the Board believes that shareholders should have an opportunity to express their views on the subject.
The Audit Committee met eight times during the year ended December 31, 2015.
A copy of the Audit Committee Report is included elsewhere in this proxy statement. The Audit Committee Charter, as amended, is available on our website at www.forestcity.net.
Compensation Committee: Our Compensation Committee is presently composed of four nonemployee, independent directors. The Compensation Committee’s purpose is to assist the Board in carrying out its oversight responsibilities relating to the following matters:
| • | establishment and oversight of the compensation of our senior management and executive officers, including our Chairman of the Board, in light of the executive compensation program’s goals and objectives; |
| • | goals, objectives and policies of our executive compensation plans, including a review of such matters at least annually; |
| • | together with the Corporate Governance and Nominating Committee, succession planning activities for our CEO and other senior executives, including the development of procedures for succession planning, review and evaluation, at least annually, of the succession plan and progress, and oversight of the execution of the succession plan; |
| • | diversity planning activities, including the review, at least annually, of the diversity plan and progress for the Company; |
| • | our equity incentive plans, including approval of grants or awards under such plans; |
| • | our cash incentive plans for executive officers and senior management, including approval of the goals under such plans and the results achieved relative to such goals; |
| • | approval of employment agreements with and severance or other termination payments proposed to be made to any Named Executive Officer (“NEO”); |
28
| • | risks associated with our compensation programs and monitoring of such risks; |
| • | review and consideration of the advisory shareholder votes on executive compensation; |
| • | retention or termination of compensation consultants or other advisors and whether such arrangements raise any conflict of interest with the Company or otherwise impact the consultant’s or advisor’s independence; |
| • | the Compensation Discussion & Analysis prepared by our management, including the review and recommendation of the inclusion of such disclosure in the proxy statement relating to our annual meeting of shareholders; |
| • | production of the Compensation Committee Report, made pursuant to the Securities Exchange Act of 1934, to be included in the proxy statement relating to our annual meeting of shareholders; |
| • | annual oversight and approval of the salary increase budget and periodic review and guidance on our benefit strategy and/or plans; |
| • | internal controls on incentive payments made under the executive compensation program; |
| • | regulatory compliance with respect to compensation matters; and |
| • | oversight of the administrative responsibilities associated with incentive and benefit plans. |
The Compensation Committee also annually evaluates the performance of our CEO based on objective and subjective criteria, including an assessment of business performance, accomplishment of long-term strategic objectives, and management development.
The Compensation Committee administers our executive compensation program. All members of the Compensation Committee are “outside directors” as defined under Internal Revenue Code Section 162(m) (“Section 162(m)”), “nonemployee directors” as defined in Rule 16b-3 under the Securities Exchange Act of 1934, as amended, and “independent directors” under the NYSE listing standards.
In reviewing and designing the various components of our executive compensation program, the Compensation Committee periodically draws upon the expertise of our Chairman of the Board, CEO, CFO and executive officer of Human Resources (“HR Executive”) who typically attend the Compensation Committee meetings, as well as external independent consultants. Our CEO provides advice and counsel to the Compensation Committee regarding alignment of performance measures under our Executive Short-Term Incentive Plan (“STIP”) and our Long-Term Incentive Plan (“LTIP”) relative to our annual business and strategic plans, may discuss the performance of key executives, including NEOs, who report to him in the determination of their incentive awards as well as any merit increases or pay adjustments, offers guidance and recommendations on succession and management development activities and discusses the impact of design of our incentive programs (including equity awards) on our ability to attract and retain key personnel. Our HR Executive provides information pertaining to our compensation programs and in connection with succession planning and talent reviews. Our CFO, who attended Compensation Committee meetings during fiscal year 2015 as requested, periodically provides an accounting and analysis of the financial results of performance measures under the STIP and the LTIP. Our General Counsel also attended meetings during the year as requested by the Compensation Committee. The Compensation Committee periodically meets in executive sessions to discuss and approve, among other matters, the compensation of the CEO and the Chairman.
The Compensation Committee has the authority to retain, oversee, terminate, and approve fees for any compensation consultant used to assist in the evaluation of compensation for executive officers and other members of senior management. It may also obtain advice and assistance from internal or external legal, accounting, or other advisors.
The Compensation Committee has retained Pearl Meyer (“Pearl Meyer”) as its independent consultant to provide guidance on various aspects of our executive compensation program. Pearl Meyer reports directly to the Compensation Committee, only provides compensation consulting services to the Company, and regularly participates in committee meetings. In early 2016, the Compensation Committee considered and assessed all relevant factors, including but not limited to, those set forth in Rule 10C-1(b)(4)(i) through (vi) under the Securities Exchange Act of 1934, that could give rise to a potential conflict of interest with respect to Pearl Meyer’s work. Based on this review, we are not aware of any conflict of interest that has been raised by the work performed by Pearl Meyer.
The Compensation Committee met five times during the year ended December 31, 2015.
29
A copy of the Compensation Committee Report is included in this proxy statement following the “Compensation Discussion & Analysis” section. The Compensation Committee Charter, as amended, is available on our website at www.forestcity.net.
Corporate Governance and Nominating Committee: Our Corporate Governance and Nominating Committee is composed of four nonemployee, independent directors. The Corporate Governance and Nominating Committee’s purpose is to assist the Board in carrying out its oversight responsibilities relating to corporate governance matters, including the composition of the Board. The Corporate Governance and Nominating Committee’s purpose is to assist the Board in carrying out its oversight responsibilities relating to the following matters:
| • | identification of individuals qualified to become Board members and the director nominees for the next annual meeting of shareholders; |
| • | recommendation of director nominees for each Committee; |
| • | our organizational and governance structure, including the development and recommendation to the Board of the Corporate Governance Guidelines applicable to us; |
| • | development and recommendation of our Code of Legal and Ethical Conduct; |
| • | together with the Compensation Committee, succession planning activities for our CEO and other senior executives, including the development of procedures for succession planning, review and evaluation, at least annually, of the succession plan and progress, and oversight of the execution of the succession plan; |
| • | diversity planning activities, including the review, at least annually, of the diversity plan and progress for the Company; |
| • | review the Board’s performance and evaluation of the Board, its Committees and management; |
| • | nonemployee Board member compensation and stock ownership requirements; |
| • | determination, on an annual basis, of which members of senior management qualify as officers subject to Section 16 of the Securities Exchange Act of 1934; |
| • | continuing education for directors; |
| • | review and approval of related party transactions; |
| • | charitable and political activities, including corporate political spending and lobbying activities; |
| • | analysis and identification of Audit Committee “financial experts” and the “financial literacy” of the Audit Committee members; and |
| • | independence of our Audit Committee and Compensation Committee members. |
The Corporate Governance and Nominating Committee utilizes a variety of methods for identifying and evaluating nominees for director. The Committee regularly reviews the appropriate size of the Board and whether any vacancies on the Board are expected due to retirement or otherwise. In the event that vacancies are anticipated, or otherwise arise, the Committee considers various potential candidates for director. The Corporate Governance and Nominating Committee may consider candidates recommended by shareholders, as well as from other sources, such as current directors or officers, professional search firms or other appropriate sources. The Committee may choose not to consider an unsolicited recommendation if no vacancy exists on the Board of Directors, and the Corporate Governance and Nominating Committee does not perceive a need to increase the size of the Board of Directors.
Third-party consultants are retained from time to time by the Corporate Governance and Nominating Committee to identify potential candidates. If retained, third-party consultants would be used primarily to identify potential candidates, conduct customary background and reference checks and recommend potential candidates to the Committee in accordance with criteria furnished by the Committee. On occasion, at the request of the Chair of the Committee, third-party consultants may also conduct preliminary screening and interviews to assess candidate suitability in accordance with criteria furnished by the Committee.
30
Our Corporate Governance Guidelines contain Board membership criteria that apply to the Corporate Governance and Nominating Committee’s recommended nominees for a position on our Board of Directors. Under these criteria, members of the Board shall demonstrate the qualities of integrity and high ethical standards, have the ability to communicate clearly and persuasively, express opinions, raise questions and make informed, independent judgments. A director shall possess knowledge, experience and skills in a minimum of one specialty area, such as: knowledge of the real estate industry (development, management, operations, marketing, competition, etc.); accounting and finance; corporate management; strategic planning; and international, legal or governmental expertise. The Committee considers other qualifications in recommending nominees for a position on the Board of Directors, including diversity in gender, ethnic background, geographic origin or personal and professional experience. The Company maintains a core value of diversity and inclusion and the Committee embraces this core value as one of the primary considerations in seeking director nominees. The willingness and ability to work with other members of our Board of Directors in an open and constructive manner and the ability to devote sufficient time to prepare for and attend Board meetings are required. Service on other boards of public companies should be limited to no more than four, subject to the Board of Directors’ review.
The Committee has adopted a matrix approach that tracks each director’s and director nominee’s qualifications and experience in a tabular format to assist the Committee in maintaining a well-rounded, diverse and effective Board of Directors. In addition, the matrix approach helps the Committee identify any qualifications and experience for potential director nominees that would help improve the composition of and add value to the Board of Directors. A tabular summary of the most recently conducted matrix assessment is provided under “Director Qualifications and Experience” included within the “Proposal 1: Election of Directors” section of this proxy statement.
The Corporate Governance and Nominating Committee met five times during the year ended December 31, 2015.
The Corporate Governance and Nominating Committee periodically meets in executive sessions following its meetings, without the presence of management, to discuss, among other matters, issues pertaining to the nomination and governance function of the Board.
The Corporate Governance and Nominating Committee Charter, as amended, is available on our website at www.forestcity.net.
Compensation Committee Interlocks and Insider Participation
The Compensation Committee of the Board of Directors consists entirely of nonemployee, independent directors. No member of the Compensation Committee is a current or former officer or employee of ours or any of our subsidiaries, and no director had interlocking relationships with any other entities of the type that would be required to be disclosed in this proxy statement.
31
Compensation Discussion & Analysis
Introduction
This Compensation Discussion and Analysis (“CD&A”) provides an overview of our executive compensation program and 2015 fiscal year pay determinations for our NEOs as identified below:
| Name | Title |
| David J. LaRue | President and Chief Executive Officer |
| Robert G. O’Brien | Executive Vice President and Chief Financial Officer |
| James A. Ratner | Executive Vice President - Development |
| Ronald A. Ratner | Executive Vice President - Development |
| Deborah Ratner Salzberg | Executive Vice President and President of Forest City Washington, LLC |
Our management is responsible for the preparation of this CD&A.
Executive Summary
Our Company is principally engaged in the ownership, development, management and acquisition of commercial and residential real estate throughout the United States. Founded in 1920 and having been publicly-traded since 1960, we are headquartered in Cleveland, Ohio, with offices throughout the United States. As of December 31, 2015, we had approximately $10.0 billion in consolidated assets, 2,695 full-time and 214 part-time employees, annual consolidated revenues of $978.2 million, and an equity market capitalization of $5.7 billion. Effective at 11:59 p.m., Eastern Time, on December 31, 2015 (the “Effective Time”), we completed our merger in connection with our conversion to real estate investment trust (REIT) status. As such, the Company intends to elect REIT status for its taxable year ending December 31, 2016, upon filing the 2016 Form 1120-REIT with the Internal Revenue Service on or before September 15, 2017.
We attribute our long-term success in large part to our highly talented and experienced employees as well as our core values which reinforce our Company’s culture:
| • | integrity and openness; |
| • | entrepreneurial spirit; |
| • | teamwork; |
| • | diversity and inclusion; |
| • | community involvement; |
| • | sustainability and stewardship; and |
| • | accountability. |
Our executive compensation program is intended to support these values, drive long-term growth and shareholder value creation and reinforce our culture of accountability, integrity, responsibility, legal compliance, ethical behavior and transparency. The following discussion summarizes our executive compensation program’s key objectives and primary components which are designed to meet the needs of our Company, our shareholders and our employees:
| • | Focusing senior management on key business objectives as reflected in our annual business plan and strategic plan that support our ultimate objective of maximizing long-term shareholder value; |
| • | Providing competitive pay that is driven by performance to increase long-term shareholder value; |
| • | Attracting and retaining highly-talented employees to lead our continued growth and success and rewarding them for their contributions toward that success; and |
| • | Avoiding unnecessary or excessive risk taking. |
To achieve these objectives, our executive compensation program includes the following primary components:
| • | Competitive base salaries reflective of each executive’s responsibility level, experience and individual performance over time; |
32
| • | Performance-based annual incentives tied to the attainment of specified business objectives at the corporate, department, regional and/or individual levels; |
| • | Long-term incentives linked to strategic goals and long-term shareholder value creation; and |
| • | Competitive benefits that meet the needs of our employees and their families at a reasonable shared cost. |
The following table provides comparisons of some of the key financial metrics, as previously reported in our Form 10-K and Supplemental Package for the quarter ended December 31, 2015 furnished on Form 8-K, which we use in evaluating the Company’s performance and which the Compensation Committee considers when making compensation decisions:
| Key Metric | Year Ended December 31, | ||
| 2015 | 2014 | Change | |
| Funds From Operations (“FFO”) | $505,682,000 | $394,589,000 | 28.2% |
| Operating FFO (“OFFO”) | $337,601,000 | $248,404,000 | 35.9% |
| FFO per Share (on a fully-diluted basis) | $1.98 | $1.75 | 13.1% |
| OFFO per share (on a fully-diluted basis) | $1.36 | $1.17 | 16.2% |
| Comparable Net Operating Income (“Comparable NOI”) - pro-rata consolidation | $554,490,000 | $528,443,000 | 4.9% |
| Key Metric | Stock Price December 31, | TSR | |||
| 2015 | 2014 | 2013 | 1-Year | 3-Year (1) | |
| Total Shareholder Return (“TSR”): Class A Common Stock | $21.93 | $21.30 | $19.10 | 2.96% | 10.73% |
| (1) | Represents an annualized total shareholder return. ($16.15 as of 12/31/2012) |
FFO, OFFO and Comparable NOI are financial measures not presented in accordance with Generally Accepted Accounting Principles (“GAAP”) that we believe provide our investors with additional information about our core businesses necessary to understand our operating results. FFO, as defined by the National Association of Real Estate Investment Trusts (“NAREIT”), is net earnings excluding the following items at our proportional share: i) gain (loss) on full or partial disposition of rental properties; divisions and other investments (net of tax); ii) non-cash charges for real estate depreciation and amortization; iii) impairment of depreciable real estate (net of tax); and iv) cumulative or retrospective effect of change in accounting principle (net of tax). A reconciliation of net earnings (loss), the most comparable GAAP measure to FFO, is provided in Annex A to this proxy statement.
OFFO is an additional financial measure of our performance that we report. Operating FFO is defined as FFO adjusted to exclude: i) activity related to our land held for divestiture (including impairment charges); ii) impairment of non-depreciable real estate; iii) write-offs of abandoned development projects and demolition costs; iv) income recognized on state and federal historic and other tax credits; v) gains or losses from extinguishment of debt; vi) change in fair market value of non-designated hedges; vii) gains or losses on change in control of interests; viii) the adjustment to recognize rental revenues and rental expense using the straight-line method; ix) participation payments to ground lessors on refinancing of our properties; x) other transactional items; xi) the Brooklyn Nets pre-tax FFO; and xii) income taxes on FFO. A reconciliation of FFO to OFFO is provided in Annex A to this proxy statement.
Comparable NOI is defined as net operating income (“NOI”) from stabilized properties opened and operated in both of the periods compared. Management analyzes Comparable NOI using the pro-rata consolidation method because it provides operating data at our ownership share, and we publicly disclose and discuss our performance using this method of consolidation to complement our GAAP disclosures. NOI is defined as revenues less operating expenses of consolidated and unconsolidated subsidiaries within our Commercial Group and our Residential Group, except for revenues and cost of sales associated with sales of land held in these segments. The activities of the Land Development Group and Corporate Activities do not involve the operations of our rental property portfolio and therefore are not included in NOI.
FFO, OFFO and Comparable NOI should not be considered to be alternatives to net earnings computed under GAAP as an indicator of our operating performance and may not be directly comparable to similarly titled measures reported by other companies.
33
Reconciliations of Comparable NOI to NOI, and earnings (loss) before income taxes, the most comparable GAAP measure, to NOI are provided in Annex B to this proxy statement and a reconciliation of Comparable NOI (full consolidation) to Comparable NOI (pro-rata consolidation) is provided in Annex C to this proxy statement.
We achieved a number of key strategic accomplishments in 2015. Our most significant accomplishment was our completion of the merger in connection with our plan to convert to REIT status commencing with the year ending December 31, 2016. We also acquired our partner’s 49% interest in seven life-science office properties and two parking facilities at University Park at MIT, a mixed-use life science office campus in Cambridge, Massachusetts.
Major Actions Taken With Respect to Our Compensation Programs
Working with Pearl Meyer (“Pearl Meyer”), its independent advisor, our Compensation Committee made some adjustments to our compensation plans and programs for 2015 to ensure continued competitiveness and alignment with key program objectives and with best practices in the area of governance. In this regard, the Compensation Committee relied in part on market data and advice provided by Pearl Meyer. Pearl Meyer periodically reviews our executive compensation programs in support of our desire to maintain strong pay for performance linkage, alignment with shareholder interests and greater transparency.
| • | Base Pay Adjustments: As part of an ongoing review of executive pay levels, Pearl Meyer annually reviews the compensation levels of certain of our senior executive officers relative to benchmark information, and recommends pay changes when warranted. The Compensation Committee approved an increase in the base salary of David J. LaRue to $675,000 effective January 1, 2015. This was Mr. LaRue’s first salary increase since assuming the CEO role in 2011 and was in recognition that his pay was well below the market data presented for CEO positions at other peer companies. Robert G. O’Brien also received a salary increase of 3% in 2015 consistent with benchmark data. This represented Mr. O’Brien’s first increase in base salary since 2011. Deborah Ratner Salzberg also received a 3% increase in 2015. |
In early 2016 Pearl Meyer completed an additional review of Mr. LaRue’s pay package using updated proxy information for peer group companies, along with salary survey data. Based on this information and a recommendation from Pearl Meyer, the Compensation Committee increased Mr. LaRue’s annual salary to $750,000 effective March 1, 2016 to bring his base salary more in line with, while still slightly below, 50th percentile market values for CEOs at comparable organizations. Mr. O’Briens’s annual salary was also increased to $600,000 effective March 1, 2016. Deborah Ratner Salzberg received a 3.5% merit increase effective March 1, 2016.
| • | Short-Term Incentives: To enhance transparency and consistent with our strategic objectives, we used multiple metrics in connection with the Short-Term Incentive Plan (STIP) for 2015. Our NEOs were provided with an incentive opportunity based on an OFFO per share target of $1.27 and a Debt Yield (defined as Total Net Operating Income divided by Total Debt (Non-recourse Mortgage Debt plus Corporate Debt), net of cash available, cash voluntarily reserved at properties and cash invested) target of 9.68%. Additionally, to improve line of sight, one of our NEOs, Deborah Ratner Salzberg, had a portion of her total STIP award determined by her performance relative to individual goals. For each of the two corporate goals, the threshold level of performance necessary to achieve any award was set at 90% of the target. Actual performance of 120% or more of the goal for each corporate metric would result in a maximum award (200% of target) being achieved. |
For the performance year ended December 31, 2015, our OFFO per share was $1.36, resulting in 127.69% of the target award being earned for that performance component. For the Debt Yield metric, actual performance was 9.87% resulting in 107.84% of the target award being earned for that performance component. This performance resulted in the following awards being approved by the Compensation Committee under the STIP for the 2015 performance period: $1,033,388 for David J. LaRue, $667,139 for Robert G. O’Brien, $588,825 for James A. Ratner, $588,825 for Ronald J. Ratner and $444,801 for Deborah Ratner Salzberg. Further information regarding the actual award payments earned by each of our NEOs and the calibration schedules used to determine the awards is contained in the “Short-Term Incentives” portion of the “Components of the Executive Compensation Program” section of this CD&A.
| • | Long-Term Performance Cash Incentives (Cash LTIP): All of our current NEOs are eligible to receive long-term cash incentives (“Cash LTIP” awards) tied to multi-year performance periods that align with our strategic planning cycle. |
For the Cash LTIP cycle that began on February 1, 2012 and ended on December 31, 2015, each of our NEOs was eligible to earn an award based on 1% of the excess, if any, of cumulative FFO, as adjusted, over $1 billion, subject to the Compensation Committee’s ability to exercise negative discretion to reduce Cash LTIP payments, taking other qualitative or quantitative factors into account. Additionally, any awards earned could not exceed $1.5 million per covered executive.
34
For the 2012 to 2015 performance period, actual cumulative FFO was $1.21 billion resulting in a maximum award opportunity of $1.5 million per NEO, subject to the exercise of negative discretion by the Compensation Committee.
The Compensation Committee did exercise its discretion, resulting in 2012 - 2015 Cash LTIP awards of $375,000 for David J. LaRue, $190,000 for Robert G. O’Brien, $155,000 for James A. Ratner, $155,000 for Ronald J. Ratner and $60,000 for Deborah Ratner Salzberg. Further information on the factors considered by the Compensation Committee in arriving at these award amounts is contained in the “Cash LTIP” portion of the “Components of the Executive Compensation Program” section of this CD&A.
For the performance cycle beginning in 2015, the Compensation Committee approved two changes to the Cash LTIP. First, the Cash LTIP performance period was reduced from a four-year cycle to a three-year cycle, in order to be consistent with practices at other real estate companies and to coincide with the timeframe of our revised strategic planning period. Secondly, the Committee approved the use of two equally weighted metrics to be used in connection with this cycle; one based on a cumulative FFO per share target and the other on a growth in Net Asset Value target.
Further information on the Cash LTIP cycles currently in effect is contained in the “Components of Executive Compensation Program” section of this CD&A.
| • | Equity Program: All of our NEOs are eligible to receive annual equity grants to reward long-term shareholder value creation and to further align our executive compensation program with shareholder interests. In 2015, all of our NEOs received grants of performance shares and restricted stock. Previously, certain of our NEOs had received stock options instead of restricted shares. The Compensation Committee approved a change in our equity grant approach for our NEOs in 2015 after taking into consideration data from Pearl Meyer which indicated a majority of peer companies used restricted stock grants in lieu of stock options for their NEOs, and also in recognition of our Company’s pending transition to REIT status. Additionally, the Compensation Committee views restricted stock as more effective than stock options in enhancing retention and managing equity plan dilution. |
A performance share cycle began on February 1, 2012 and ended on December 31, 2015. Each of our NEOs was eligible to earn shares that vest based on the TSR of our Class A Common Stock relative to companies in the NAREIT All Equity REIT Index (“NAREIT Index”). Consistent with our desire to set meaningful, yet challenging goals, and to reward relative outperformance in terms of long-term shareholder value creation, the Compensation Committee had approved a vesting schedule which required 60th percentile performance in order to earn a target performance share award. Actual relative performance of Forest City’s TSR during the measurement period was in excess of the 63rd percentile resulting in 124.67% of target awards being earned. Information relating to the actual number of performance shares which vested for each NEO is contained in this CD&A.
For performance shares granted in 2015, awards will vest based on the TSR of our Class A Common Stock relative to companies in the NAREIT Index for the period from January 1, 2015 through December 31, 2017. As with our Cash LTIP cycle, our performance share period was adjusted to three years to coincide with practices at other peer companies and to align with our revised strategic planning cycle.
To further encourage the achievement of key strategic objectives associated our conversion to REIT status and long-term shareholder value creation, the Compensation Committee approved a one-time special Outperformance Plan award opportunity for eligible senior executives, including each of our NEOs, to be paid only if certain absolute annualized total shareholder return requirements are met over a three-year period from 2015 - 2017. Further information regarding this opportunity is contained in the “Outperformance Plan Award Opportunity” under the “Equity” section of this proxy statement.
During 2015, the Compensation Committee approved equity grants to LTIP participants under our 1994 Stock Plan, as amended and restated (the “Stock Plan”), consistent with our value-based formula approach. The number of stock options, restricted shares and performance shares including, those under the one-time Outperformance Plan award opportunity, granted to LTIP participants including our NEOs, and our independent Directors, represented a run rate (defined as total shares issued divided by total common shares outstanding) of approximately 0.75%. This run rate includes an assumed target level performance share grant and Outperformance Plan award for participating executives.
| • | Executive Stock Ownership Requirements Policy: In early 2016, the Compensation Committee reviewed our Executive Stock Ownership Requirements Policy (“Executive Stock Ownership Policy”) and made modifications to the required number of shares our NEOs and other senior executives must hold. Notably, the ownership requirement for David J. |
35
LaRue was set at a share equivalent translating into six times the value of his current base salary. Further information on this change and the requirements for each of our NEOs is included later in this CD&A.
| • | Peer Group Changes: Consistent with its intent to periodically review the peer group used in assessing market pay levels and practices and the alignment of NEO compensation with Company performance, the Committee approved a slight change to the members of our peer group used for compensation benchmarking purposes. These modifications were made consistent with our desire to ensure our peer group continues to consist of companies similar in asset type and size, revenue, and which operate in similar geographies. Further information on peer group selection is included in the “Target Executive Officer Pay Levels and Relevant Employment Market” section of this CD&A. |
| • | Risk Assessment: The Audit and Compensation Committees jointly reviewed the results of a risk analysis prepared by management during early 2016, as well as comments by Pearl Meyer pertaining to management’s assessment. Based on this review, the Audit and Compensation Committees concluded that our compensation programs and practices do not create risks that are reasonably likely to have a material adverse effect on the Company. The risk assessment is discussed in further detail under the “Plan Design as it Pertains to Risk” section of this CD&A. |
We believe the compensation of our NEOs for fiscal year 2015 was consistent with our philosophy and overall performance.
Say on Pay Voting Results and Impacts
We held our annual advisory vote on the compensation of our NEOs (“Say on Pay Vote”) at our annual meeting of shareholders on May 28, 2015. At that meeting, our shareholders overwhelmingly passed a resolution approving the compensation of our NEOs, with approximately 93.7% of the shareholders entitled to vote and present in person or by proxy at the 2015 annual meeting voting in favor of the resolution, including the negative effect of abstentions. Overall, the Compensation Committee believes that this level of shareholder support is evidence that our executive compensation program is appropriately structured and aligned with shareholder interests.
The Compensation Committee remains mindful of the need to provide a competitive compensation program that is appropriately aligned with overall performance and with our annual and strategic business plans. In addition, we continue to strive to align our programs more directly with the interests of our shareholders. This is evidenced by a number of changes which have been made to our executive compensation program and corporate governance practices over the past several years, such as the introduction of performance share grants tied to a relative TSR metric, primary emphasis on “at risk” variable pay, revisions to the Executive Stock Ownership Policy, adoption of a clawback policy and adoption of a Securities Hedging and Pledging Policy.
Our Commitment to Sound Corporate Governance
| What We Do | What We Don’t Do |
| Use performance-based incentives tied to multiple metrics and challenging goals | Provide multi-year pay guarantees |
| Place primary emphasis on performance contingent long-term incentives | Offer excessive perquisites with employment agreements |
| Use tally sheets | Reprice Stock Options without shareholder approval |
| Apply Executive Stock Ownership Guidelines | Provide tax gross ups on awards |
| Have Clawback Policy | Pay dividends on unearned performance shares |
| Have Hedging and Pledging Policy | Provide uncapped performance awards |
Executive Compensation Core Principles
To guide the development and use of specific compensation elements and to support the key objectives outlined in the “Executive Summary” section of this CD&A, we use the following set of principles.
| • | Pay for performance: Our executive compensation program emphasizes variable incentive pay tied to challenging performance goals, with no awards earned for results below designated threshold levels. Our decision to set relative TSR target performance at the 60th percentile versus comparator companies for performance share grants is one example of how this translates into plan design. |
| • | A majority of pay for top executives should be contingent on performance and tied to multiple time periods: Any awards earned by our NEOs under the STIP are tied to our annual business plan and generally structured to consider the tax |
36
deductibility of payments, with the Compensation Committee taking Company and/or individual performance, along with market target award levels provided by Pearl Meyer, into account when determining any amounts earned. Similarly, the LTIP consists primarily of performance components tied to long-term shareholder value creation. Awards under the cash-based portion of the LTIP will only be earned if warranted, in the Compensation Committee’s assessment of performance over a multi-year period (generally consistent with our strategic planning cycle). Any performance share awards will only be earned if our relative TSR meets or exceeds certain targets. Pay levels vary with our actual performance results.
The following charts illustrate the percentage of the 2015 target total direct compensation opportunity of each major pay component for our NEOs. We define target total direct compensation as base salary plus target STIP and LTIP award opportunities. As illustrated, a majority of target total direct compensation, ranging from 52% to 63% for NEOs, is “at risk”, or not guaranteed pay, since it is tied to performance. Consistent with competitive practice, a greater percentage of David J. LaRue’s target total direct compensation opportunity is “at risk” and tied to long-term incentives, as compared with other NEOs, reflecting his role as President and CEO. A smaller percentage of total direct compensation is at risk for Deborah Ratner Salzberg, commensurate with her role as our EVP and President of Forest City Washington, LLC.
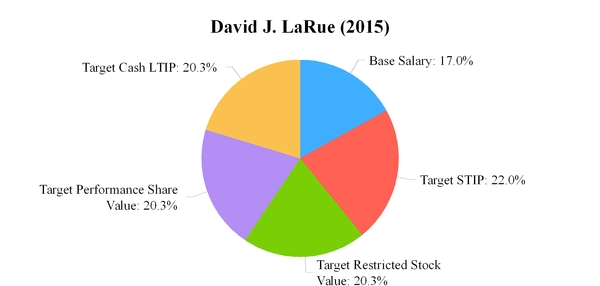
At risk pay represents 63% of target 2015 Total Direct Compensation
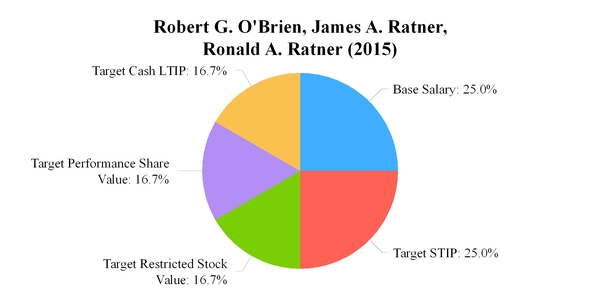
At risk pay represents 58% of target 2015 Total Direct Compensation
37
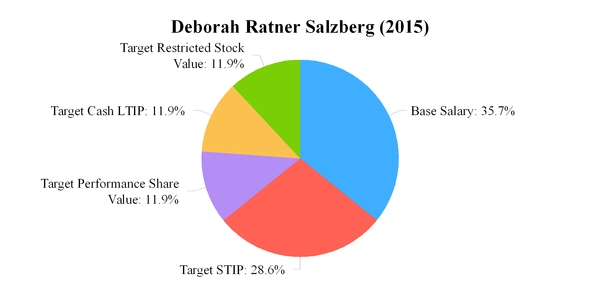
At risk pay represents 52% of target 2015 Total Direct Compensation
Variable “at risk” pay includes the STIP, Cash LTIP and performance shares. Not reflected in the target amounts shown above is a special non-recurring Outperformance Plan equity opportunity as well as an additional restricted stock award to Robert G. O’Brien, both discussed later in this CD&A.
| • | Long-term incentives are emphasized to align executive and shareholder interests: As illustrated above, our executive compensation program generally places greater emphasis on long-term incentives as compared with short-term incentives, to focus senior management on long-term strategic goals and shareholder value creation. Long-term incentives represent approximately 61% of target total direct compensation for David J. LaRue and approximately 36% to 50% of target total direct compensation for other NEOs. We currently use a combination of equity-based and cash-based long-term award vehicles to minimize potential shareholder dilution that would result from the sole use of equity plans. |
| • | Total compensation should be fair, competitive and communicated: Pay levels are periodically reviewed to determine if they are externally competitive and internally equitable. Annual notification of performance goals and corresponding award opportunities for the incentive compensation plans is provided to participants along with periodic updates of performance relative to goals. |
| • | Our executive compensation program should not encourage the taking of excessive risks that could be detrimental to the interests of our shareholders: We believe our use of short-term and long-term incentives, with multiple types of award vehicles, performance criteria, measurement periods and stock ownership guidelines, clawback provisions, and stock hedging/pledging policies, do not encourage our NEOs and other senior executives to take unreasonable risks relating to our business. A formal risk assessment is reviewed annually by our Audit and Compensation Committees. |
Target Executive Officer Pay Levels and Relevant Employment Market
We use targeted pay levels to reinforce core principles and key objectives under our executive compensation program: Our base salaries, short-term and long-term incentives are targeted competitively to attract and retain talented and experienced executives. With our emphasis on performance-based incentive compensation, actual total direct pay can be above or below targeted levels based on our actual versus planned performance results and level of stock price appreciation.
In assessing pay competitiveness for our executive officers, we periodically review published compensation surveys for the real estate industry (reflecting data for both public and private companies), including the:
| • | NAREIT Compensation Survey; |
| • | National Multi-Housing Council’s National Apartment Survey; |
| • | CEL & Associates National Real Estate Compensation and Benefits Survey; |
| • | AON Hewitt’s TCM Management and Professional Survey; and |
| • | Mercer’s U.S. Benchmark Database. |
38
We use survey data as a guide to benchmark the pay practices and levels for our executives relative to jobs with similar duties as described in the surveys. We review base salary, short-term and long-term incentive opportunities to determine if our pay practices remain in line with our overall executive pay strategy and key objectives. We also review proxy statement pay data for a designated group of publicly-traded industry peers as compiled by Pearl Meyer. The Compensation Committee uses this data to help determine whether our pay practices are competitive and whether our mix of pay components is appropriate in light of our strategic plans.
We periodically review the companies in our peer group for their similarity in sales, asset size and/or market capitalization. Given that we have diversified real estate holdings, we give significant consideration to ensure that the peer companies chosen represent a cross-section of the industry, including retail, office and residential development and management companies. The following companies were included in the compensation peer group based on our most recent review:
| Alexandria Real Estate Equities, Inc. | Equity Residential |
| Apartment Investment & Management Co. | Federal Realty Investment Trust |
| AvalonBay Communities, Inc. | Kimco Realty Corporation |
| Boston Properties, Inc. | The Macerich Company |
| CBL & Associates Properties, Inc. | SL Green Realty Corp. |
| DDR Corp. | UDR, Inc. |
| Duke Realty Corporation | Vornado Realty Trust |
This peer group is similar to the one used in the past several years, except it excludes BioMed Realty Trust, Inc. which was recently acquired. When benchmarking CEO compensation, the Compensation Committee excludes peer companies whose pay practices are significantly higher than other peers.
As of December 31, 2015, total assets for this peer group ranged between $4.8 billion and $23.0 billion, with our total assets of $10.0 billion being slightly below the peer group median of $10.3 billion. The equity market capitalization for the peer group as of December 31, 2015 ranged from between $2.1 billion and $29.7 billion, with our market capitalization being below the 25th percentile. Our consolidated net revenues of $978.2 million were slightly below the peer group median net revenues of $1.1 billion.
Components of the Executive Compensation Program
The primary components of our total rewards strategy within our executive compensation program are shown below. A more detailed description for each component follows
| Compensation Component | Component Objective | Paid in | Performance Linkage |
| Base Salary - Direct Compensation | Provide base pay commensurate with level of responsibility, experience and individual performance | Cash | Partially linked (merit increases tied to individual performance) |
| Short-Term Incentives - Direct Compensation | Align pay with achievement of short-term performance goals in support of annual business plan and strategic goals | Cash | Strongly linked |
| Long-Term Incentives - Direct Compensation | Align pay with achievement of longer-term strategic goals and shareholder value creation, enhance retention of senior management, and facilitate stock ownership | Cash Performance Shares | Strongly linked |
| Restricted Stock | Minimally linked | ||
| Benefits & Perquisites - Indirect Compensation | Provide for health, welfare and retirement needs at a reasonable shared cost | Health Care Life and Disability Retirement Plans Perquisites | Minimally or not linked |
Base Salary: Base salary is reflective of each executive’s level of responsibility, experience, individual performance and contributions to our overall success. It also impacts annual and long-term incentive award opportunities that are expressed as a percentage of base salary.
Base salaries are targeted competitively consistent with our overall compensation philosophy and may be adjusted for senior executives and management within certain high cost of living locations (such as New York and California) to reflect geographic
39
pay differentials. Deborah Ratner Salzberg, who is based in the Washington, D.C. area, is the only current NEO whose base salary is reflective of a geographic pay differential.
In determining base salary levels for our NEOs, other than the CEO, the Compensation Committee considers a number of factors including:
| • | Pay practices of comparable real estate organizations; |
| • | Recommendations from our CEO; and |
| • | An assessment of each executive’s performance and their contributions toward our success. |
The CEO’s base salary is determined by examining pay practices at comparable real estate companies and based on the CEO’s overall performance relative to objectives. Annualized base salaries for each NEO as of year-end 2015 are shown below:
| Named Executive Officer | 2015 Fiscal Year Annualized Base Salary |
| David J. LaRue | $675,000 |
| Robert G. O’Brien | $566,500 |
| James A. Ratner | $500,000 |
| Ronald A. Ratner | $500,000 |
| Deborah Ratner Salzberg | $425,000 |
With the exception of Deborah Ratner Salzberg, who does not have an employment agreement with us, the annualized base salaries for all NEOs shown above were consistent with the terms of their employment agreements. David J. LaRue’s base salary was increased from $600,000 to $675,000, effective January 1, 2015, representing his first increase since assuming the President and CEO role in 2011. Even with this increase, Mr. LaRue’s base salary remained well below median market values for comparable organizations as reported in Pearl Meyer’s market pay analysis. As a result, in early 2016, the Compensation Committee reviewed an updated pay analysis for Mr. LaRue’s position which indicated his base salary remained low compared to benchmark data, and agreed to increase his base salary to $750,000 effective March 1, 2016. Robert G. O’Brien also received a 3% base salary increase effective March 2015, reflecting a merit increase. Mr. O’Brien had not received a base salary increase since early 2011. Effective March 1, 2016, Mr. O’Brien’s base salary was increased to $600,000, reflecting his 2016 merit increase. Ms. Ratner Salzberg received a merit increase of 3% effective March 2015 and a 3.5% merit increase effective March 2016.
Short-Term Incentives: Our NEOs and other eligible senior executives and managers participate in the STIP. The STIP’s primary objective is to motivate senior executives and managers to achieve specified business objectives over the short-term that lead to long-term value creation. Actual awards earned, if any, can be considerably above or below target levels based on our actual performance.
Our CEO, in consultation with other members of the senior management team, recommends a threshold performance level that must be achieved for any payment to be earned under the STIP. For 2015 two equally weighted company-wide metrics, OFFO per share and Debt Yield, were used to determine the award opportunity under the STIP for each of our NEOs. Given her responsibility for a specific region of the company as President of Forest City Washington, LLC, 25% of Deborah Ratner Salzberg’s STIP opportunity was based on individual performance and the remaining 75% based on the two corporate-wide components. For each performance component, the actual award could range from 0% to 200% of target.
The Compensation Committee selected OFFO per share and Debt Yield as the STIP metrics since they reflect the ongoing operating performance of our portfolio and are key indicators of continuing operating results in planning and executing our business strategy.
40
The calibration schedules used to determine the actual awards under the 2015 STIP are shown below:
Operating FFO per Share
| Performance Level | Corresponding OFFO per share | Percent of Target Achieved | Percent of Target Award Earned |
| Below Threshold | Below $1.14 | Below 90% | 0% |
| Threshold | $1.14 | 90% | 25% |
| Target Range Low | $1.21 | 95% | 80% |
| Target | $1.27 | 100% | 100% |
| Target Range high | $1.40 | 110% | 140% |
| Maximum | $1.52 and above | 120% | 200% |
Debt Yield
| Performance Level | Corresponding Debt Yield | Percent of Target Achieved | Percent of Target Award Earned |
| Below Threshold | Below 8.71% | Below 90% | 0% |
| Threshold | 8.71% | 90% | 25% |
| Target Range Low | 9.20% | 95% | 80% |
| Target | 9.68% | 100% | 100% |
| Target Range high | 10.65% | 110% | 140% |
| Maximum | 11.62% | 120% | 200% |
Approved actual performance for each of the two company-wide STIP metrics is shown in the following table:
| 2015 STIP Metric | Target | Actual Performance | Percent of Target Award Earned Per Component |
| OFFO per share | $1.27 | $1.36 | 127.69% |
| Debt Yield | 9.68% | 9.87% | 107.84% |
| (1) | OFFO per share is adjusted from FFO to exclude the following but is not limited to: Tax Credits; Project write-offs; Prepayment/Early Extinguishment of Debt; Net Gain in Change in Control of Interest; Impairment of Land Group projects; Land Sales; and Organizational Transformation and Severance Costs. The above number is divided by weighted average total common shares outstanding on an “as converted” basis. |
| (2) | Debt Yield is total Net Operating Income divided by Total Debt (Non-recourse Mortgage Debt plus Corporate Debt), net of cash available, cash voluntarily reserved at properties and cash invested, where NOI excludes: NOI from Targeted Sales; Material land sales; and Organizational Transformation and Severance Costs. |
The following table reflects the actual 2015 STIP award earned by each of our NEOs (as a dollar amount and as a percentage of target), as determined by the Compensation Committee. The table also sets out the target STIP award levels that were established for each NEO.
| Named Executive Officer | 2015 STIP Target Award as a Percentage of Base Salary | 2015 STIP Actual Award as a Percentage of Target | 2015 STIP Target Award | 2015 STIP Actual Award Earned |
| David J. LaRue | 130% | 117.8% | $877,500 | $1,033,388 |
| Robert G. O’Brien | 100% | 117.8% | $566,500 | $667,139 |
| James A. Ratner | 100% | 117.8% | $500,000 | $588,825 |
| Ronald A. Ratner | 100% | 117.8% | $500,000 | $588,825 |
| Deborah Ratner Salzberg* | 80% | 130.8% | $340,000 | $444,801 |
| * | Actual 2015 STIP award was determined as follows: 37.5% OFFO per share; 37.5% Debt Yield; and 25% individual performance relative to agreed upon objectives. Actual individual performance was 170% of target. The Compensation Committee approved this rating understanding this portion of Deborah Ratner Salzberg’s 2015 STIP payment may not be tax deductible compensation. |
41
Long-Term Incentives: Our long-term incentives align pay with long-term strategic goals and shareholder value creation. They also enhance our retention of senior executives and managers, and facilitate stock ownership. Our long-term incentives consist primarily of two components which promote a balanced focus on objectives under the strategic plan in support of long-term value creation:
| • | Cash LTIP awards; and |
| • | Equity provided through the use of restricted stock and/or performance shares. |
The following table summarizes the opportunities in effect for performance periods beginning in 2015:
| Cash LTIP Award Opportunity | Equity Grant Opportunity |
| New performance cycle begins each year | Annual Performance share grant opportunity to NEOs which vests based on relative TSR, generally at the end of a three-year performance period |
| Performance cycle generally runs for three years | Annual Restricted Stock grant to promote enhanced ownership stake and improve retention and which vests over a three-year period |
Award earned based on actual versus planned performance for cumulative FFO per share and compound annual growth rate in Net Asset Value (NAV) | |
In determining award levels for NEOs, the Compensation Committee gives consideration to competitive market practice, employee responsibility level, and internal equity.
As reflected in the table below, the targeted value mix of LTIP awards in 2015 for all of our NEOs was equally weighted between performance shares, restricted stock and a performance cash award opportunity. We believe this provides an appropriate balance between the components of the LTIP. Performance shares will only be earned if our total shareholder return relative to a broad group of REIT comparators warrants. The Cash LTIP is dependent on attainment of defined financial goals. Actual awards earned, if any, for these two components can be above or below target levels based on our actual versus planned performance relative to strategic goals and stock price appreciation.
| Named Executive Officer | 2015 Fiscal Year Target Award Equivalents* | |||
| Total Annualized LTIP Award as a Percent of Base Salary | Absolute Percentage in the form of Performance Shares (vesting determined at the end of the performance period) | Absolute Percentage in the form of Restricted Stock | Absolute Percentage in the form of Cash LTIP (payment determined at the end of the performance period) | |
| David J. LaRue | 360% | 120.00% | 120.00% | 120.00% |
| Robert G. O’Brien | 200% | 66.66% | 66.66% | 66.66% |
| James A. Ratner | 200% | 66.66% | 66.66% | 66.66% |
| Ronald A. Ratner | 200% | 66.66% | 66.66% | 66.66% |
| Deborah Ratner Salzberg | 100% | 33.33% | 33.33% | 33.33% |
* This table does not include any performance shares in connection with a special Outperformance Plan award opportunity or any additional restricted stock award granted to Robert G. O’Brien.
Cash LTIP
The Cash LTIP provides for overlapping performance periods that will begin each year. Prior to 2015, these performance periods were for up to 48 months to correspond with our Company’s then existing strategic planning periods. Effective with the performance cycle beginning in 2015, the performance period has been changed to a three-year cycle to correspond with our 2015 - 2017 strategic planning period. The potential target award for each performance period is calculated using the target award multiplied by the base salary of the participant as of the beginning of the performance period.
42
Cash LTIP Performance Cycles
The following illustrates key attributes of the Cash LTIP performance cycles currently in effect. Results pertaining to a 47-month cycle ending December 31, 2015 are discussed in further detail in this section. Each of our current NEOs is eligible to participate in the Cash LTIP.
February 1, 2013 to December 31, 2016 Performance Cycle | January 1, 2014 to December 31, 2017 Performance Cycle | January 1, 2015 to December 31, 2017 Performance Cycle | |
| Duration of performance period* | 47 months | 48 months | 36 months |
| Award Calculation | 1.5% of excess, if any, of cumulative FFO, as adjusted over $1 billion, not to exceed $1.75 million | 1.5% of excess, if any, of cumulative FFO, as adjusted over $1 billion, not to exceed $1.75 million | Cumulative FFO per share and Net Asset Value growth relative to approved targets |
| Actual Awards Earned Subject to | Exercise of negative discretion by Compensation Committee taking other quantitative and/or qualitative factors into account | Exercise of negative discretion by Compensation Committee taking other quantitative and/or qualitative factors into account | Final results relative to targets and calibrations approved by the Compensation Committee |
| Awards Earned (if any) will be paid in | Early 2017 | Early 2018 | Early 2019 |
* Duration of first performance cycle shown is affected by the Company’s change from a January 31st fiscal year end to a December 31st fiscal year end in 2013 and the resulting 11-month 2013 transition period.
With the intention of qualifying any potential Cash LTIP payments as performance-based under Section 162(m), the Compensation Committee approved a maximum award opportunity for each performance cycle as shown in the previous table, subject to the Compensation Committee’s exercise of negative discretion in determining any final award earned. Any actual amounts earned by each NEO for the 2013 - 2016 and the 2014 - 2017 performance cycles will be based on the aforementioned cumulative FFO performance level, excluding the effects of any impairment related to the disposition of our Land business unit, and will take into account certain other qualitative and/or quantitative factors as determined by the Compensation Committee.
2012 - 2015 Cash LTIP Performance Cycle
For the 47-month Cash LTIP performance cycle ended December 31, 2015, the performance metric used was 1.0% of the excess, if any, of cumulative FFO, as adjusted over $1 billion with the award to any NEO not to exceed $1.5 million. Actual cumulative FFO performance for the 2012 - 2015 performance cycle was $1.21 billion resulting in a maximum potential Cash LTIP award capped at $1.5 million per NEO, subject to exercise of negative discretion by the Compensation Committee.
The Compensation Committee exercised discretion in determining the 2012 - 2015 Cash LTIP awards for each NEO as shown below.
| Named Executive Officer | Maximum Cash LTIP Award earned for 2012 - 2015 Performance Cycle | Actual 2012 - 2015 Cash LTIP Award as determined by Compensation Committee |
| David J. LaRue | $1,500,000 | $375,000 |
| Robert G. O’Brien | $1,500,000 | $190,000 |
| James A. Ratner | $1,500,000 | $155,000 |
| Ronald A. Ratner | $1,500,000 | $155,000 |
| Deborah Ratner Salzberg | $1,500,000 | $60,000 |
In determining the 2012 - 2015 Cash LTIP awards for each NEO, the Compensation Committee considered the following:
| • | Annualized benchmark target award levels for each NEO’s position; |
| • | Cumulative FFO per share for the performance period was $5.20, slightly above the targeted level of $5.17; and |
| • | Individual accomplishments for each NEO as outlined in the following table: |
43
| Named Executive Officer | Accomplishments | |
| David J. LaRue | • | Executed on strategic goals of focusing on core products in core markets, building a sustainable capital structure and operational excellence |
| • | Led strategic initiatives that resulted in strong performance from our total operating portfolio | |
| • | Reduced development exposure while activating development pipeline with Greenland Atlantic Yards, LLC, a subsidiary of Shanghai-based Greenland Holdings Group Company Limited (“Greenland”), affiliated entities of QIC, one of the largest institutional investment managers in Australia (“QIC”), and Arizona State Retirement System (“ASRS”) | |
| • | Established Strategic Capital and Operating Partnerships with ASRS/QIC/Greenland | |
| • | Led REIT conversion and restructuring efforts of the enterprise | |
| • | Identified opportunities to expand operating margins by approximately $40 million | |
| • | Strategy execution resulted in stock performance over the 60th percentile versus NAREIT Index | |
| Robert G. O’Brien | • | Executed on strategic goals of focusing on core products in core markets, building a sustainable capital structure and operational excellence |
| • | Led strategic initiatives that resulted in major improvement in balance sheet metrics. Leverage ratio improved to 46.5% from 72.7% with overall reduction in debt totaling $2.3 billion | |
| • | Established Strategic Capital and Operating Partnerships with ASRS/QIC/Greenland | |
| • | Led REIT conversion focused on the financial aspects and participated in restructuring efforts of the enterprise | |
| • | Achieved rating agency upgrade at Standard & Poor’s and a positive outlook with Moody’s | |
| • | Participated in strategic analysis to increase shareholder value resulting in recommendation for REIT conversion | |
| James A. Ratner | • | Executed on strategic goals of focusing on core products in core markets, building a sustainable capital structure and operational excellence |
| • | Led strategic initiatives that resulted in strong performance from our commercial operating portfolio | |
| • | Reduced development exposure while activating development pipeline with Greenland and QIC. Overall development ratio decreased | |
| • | Participated and established Strategic Capital and Operating Partnership with QIC and expanded this relationship from eight to 11 properties | |
| • | Led restructuring efforts of the operating and development functions | |
| • | Identified opportunities to expand operating margins and reduced development overhead | |
| • | Participated in strategic analysis to increase shareholder value resulting in recommendation for REIT conversion | |
| Ronald A. Ratner | • | Executed on strategic goals of focusing on core products in core markets, building a sustainable capital structure and operational excellence |
| • | Led strategic initiatives that resulted in strong performance from our residential operating portfolio | |
| • | Reduced development exposure while activating development pipeline with Greenland and ASRS. Overall development ratio decreased | |
| • | Participated and established Strategic Capital and Operating Partnership with ASRS | |
| • | Led restructuring efforts of the operating and development functions | |
| • | Identified opportunities to expand operating margins and reduced development overhead | |
| • | Participated in strategic analysis to increase shareholder value resulting in recommendation for REIT conversion | |
| • | Achieved successful multi-year land sales and development at Stapleton | |
| Deborah Ratner Salzberg | • | Participated in the execution of our strategic goal of focusing on core products in core markets |
| • | Executed on development plan in the D.C. market adding over 910 units of residential apartment units and approximately 180,000 square feet of commercial (office and residential) space | |
| • | Participated in restructuring efforts of the development functions | |
| • | Identified opportunities to reduce development overhead | |
| • | Participated in strategic analysis to increase shareholder value resulting in recommendation for REIT conversion | |
44
Equity
We typically grant equity awards under the LTIP following the release of full year earnings for the prior fiscal year. Equity awards may be granted to NEOs as well as other senior executives and managers of significant subsidiaries, as determined by the Compensation Committee, based on an evaluation of their duties and overall performance, including current and potential contributions to our success. We use different award tiers based on recommendations by Pearl Meyer that take into consideration market pay practices to determine the mix of equity opportunities.
The amount of equity granted in 2015 was based on target award opportunities, as disclosed above and as called for under our LTIP. The number of stock options and restricted shares provided to our outside Directors, and restricted shares and performance shares granted to our NEOs and other senior executives and managers who participate in the LTIP, represented a run rate (defined as total shares granted divided by total common shares outstanding) of approximately 0.75%. This run rate included an assumed target level performance share grant for participating executives. Also included in this run rate is an assumed target level performance share grant associated with a special non-recurring Outperformance Plan award opportunity discussed in further detail below.
Restricted Stock
In 2015 and in anticipation of our conversion to REIT status, the Compensation Committee accepted a recommendation from Pearl Meyer to convert the portion of equity grants previously granted to most of our NEOs in the form of stock options to restricted stock. In accepting this recommendation, the Compensation Committee considered the significantly higher prevalence of restricted stock grants over stock options among REITs and the potential to further enhance retention and more effectively manage equity plan dilution by granting restricted stock in lieu of stock options. Beginning with grants made in 2015, restricted shares will vest over a three-year period as follows:
| • | 25% vest on the first anniversary of the date of grant; |
| • | 25% vest on the second anniversary of the date of grant; and |
| • | 50% vest on the third anniversary of the date of grant. |
In addition to the restricted stock grants provided as a percentage of salary, Robert G. O’Brien was also provided with an additional discretionary grant of 17,262 restricted shares in 2015 to enhance retention.
Performance Share Grant Opportunity Cycles
Each of our NEOs received performance share grants in 2012, 2013, 2014 and 2015 allowing them to earn shares of our Class A Common Stock based on our TSR relative to a broad comparator group of REITs included in the NAREIT Index, as determined over a multi-year performance period. Comparator companies include all REITs in the NAREIT Index at both the start and the end of each applicable performance cycle. TSR is defined as change in stock price over the performance period, plus any dividends paid, for our Class A Common Stock compared to that of comparator companies. Results pertaining to a 47-month cycle ending December 31, 2015 are discussed in further detail in this section. The following illustrates key attributes of the three performance share grant cycles currently outstanding.
| February 1, 2013 to December 31, 2016 Performance Cycle | January 1, 2014 to December 31, 2017 Performance Cycle | January 1, 2015 to December 31, 2017 Performance Cycle | |
| Duration of performance period* | 47 months | 48 months | 36 months |
| Performance Share Award earned to be determined using | TSR of Forest City's Class A Common Stock relative to NAREIT Index comparators | TSR of Forest City's Class A Common Stock relative to NAREIT Index comparators | TSR of Forest City's Class A Common Stock relative to NAREIT Index comparators |
| Number of Performance Shares which can vest | 0% to 200% of Target Amounts based on vesting schedule | 0% to 200% of Target Amounts based on vesting schedule | 0% to 200% of Target Amounts based on vesting schedule |
| Vesting of Performance Shares earned (if any) will occur upon Compensation Committee approval in | 2017 | 2018 | 2019 |
* Duration of first performance cycle shown is affected by the Company’s move from a January 31st fiscal year end to a December 31st fiscal year end in 2013 and the resulting 11-month transition period.
45
The Compensation Committee believes that the use of relative TSR as the sole performance metric for determining how many performance shares (if any) vest is appropriate since it effectively aligns the compensation of our senior officers, including NEOs, with shareholder results, recognizing that shareholders have other real estate company investment opportunities. The Compensation Committee also believes that the use of a relative TSR metric for performance share vesting, coupled with those metrics used in calculating any Cash LTIP award, provides an appropriate balance between externally and internally focused long-term value creation measures for our LTIP.
The Compensation Committee approved the use of the following vesting schedule for each of the performance share grants made in 2012 through 2015:
| Forest City’s TSR Relative to NAREIT Index Comparator Companies | Percentage of Target Performance Shares Earned |
Below 40th Percentile | 0% of target share amount will vest |
40th Percentile | 25% of target share amount will vest |
50th Percentile | 50% of target share amount will vest |
60th Percentile | 100% of target share amount will vest |
75th Percentile or greater | 200% of target share amount will vest |
Under the approved grants, TSR over the performance period must be at the 60th percentile versus companies in the NAREIT Index in order to earn a target number of performance shares. The use of the 60th percentile target performance hurdle is consistent with our pay for performance philosophy and our desire to set challenging goals.
As with the Cash LTIP award opportunity, performance share grants are based on a target percentage of each NEO’s base pay. For the 2015-2017 performance cycle, the Compensation Committee used the closing price of our Class A Common Stock on the grant date to determine the target number of performance shares which a participating executive could earn. As noted in prior years’ proxy statements, the value derived under a Monte Carlo simulation model for accounting expense recognition purposes may differ from the grant date value used to determine the target number of performance shares granted.
The Compensation Committee approved the use of the closing price on the date of grant of $24.62 to determine 2015 grant levels, to align with intended target award values. The final Monte Carlo simulation for the 2015 grants yielded a $33.04 per share value for expense recognition purposes.
The following table summarizes the differences in value associated with the performance share grant opportunity for the 2015 - 2017 performance period.
| Named Executive Officer | Number of Target Performance Shares Granted for 2015 - 2017 Performance Period | Calculated Target Value Based on Grant Date Stock Price | Calculated Accounting Value based on Final Monte Carlo Simulation and as reported in Grants of Plan-Based Awards Table | |||||||
| David J. LaRue | 32,900 | $ | 809,998 | $ | 1,087,016 | |||||
| Robert G. O’Brien | 15,339 | $ | 377,646 | $ | 506,801 | |||||
| James A. Ratner | 13,539 | $ | 333,330 | $ | 447,329 | |||||
| Ronald A. Ratner | 13,539 | $ | 333,330 | $ | 447,329 | |||||
| Deborah Ratner Salzberg | 5,752 | $ | 141,614 | $ | 190,046 | |||||
2012 - 2015 Performance Share Cycle
For the 47-month performance cycle ending December 31, 2015, the cummulative TSR for Forest City Class A Common Stock was 67%, which resulted from our Class A Common Stock achieving 63.7th percentile performance ranking relative to companies in the NAREIT Index. Using interpolation and the vesting schedule shown above results in 124.67% of a target share award being earned. The resulting number of shares which vested for each of our NEOs in connection with the 2012 - 2015 performance cycle is shown below.
46
| Named Executive Officer | Target Performance Share Award for the 2012 - 2015 Performance Cycle | Actual Performance Share Award Earned based on Relative TSR Results for the 2012 - 2015 Performance Cycle (124.67% of Target Share Award) | ||||
| David J. LaRue | 48,846 | 60,896 | ||||
| Robert G. O’Brien | 24,875 | 31,011 | ||||
| James A. Ratner | 20,352 | 25,372 | ||||
| Ronald A. Ratner | 20,352 | 25,372 | ||||
| Deborah Ratner Salzberg | 7,954 | 9,916 | ||||
Outperformance Plan Award Opportunity
Given our conversion to REIT status and the corresponding required organizational transformation, the Compensation Committee approved a one-time performance share grant opportunity for select senior executives, including each of our NEOs, through a special Outperformance Plan award opportunity. To align this opportunity directly with shareholder interests, the number of performance shares that will vest, if any, will be based on the absolute annualized TSR of Forest City’s Class A Common Stock from January 1, 2015 through December 31, 2017 with no payouts for results below a minimum threshold return requirement. TSR calculations will be based on average closing prices of Forest City’s Class A Common Stock for the ten days leading up to the beginning and end of the three-year performance period. The actual award which can be earned could range from 0% to 300% of the target share amounts.
No award will be earned for a three year annualized TSR of 8% or less, with a target share award being earned for annualized TSR of 10.5%, and a maximum award being earned for annualized TSR of 16% or more. Any award earned is subject to a reduction of up to 25% if the annualized TSR for Forest City’s Class A Common Stock is less than the annualized TSR of the companies in the NAREIT Index for the same performance period. To further enhance retention, 50% of any earned performance shares will vest at the end of the three-year performance period, with the remaining 50% paid after one additional year of continued service.
The target number of performance shares associated with the Outperformance Plan award opportunity calculated grant date value of $25.31 and associated expense based on a Monte Carlo simulation derived value of $31.63 per share is as follows:
| Named Executive Officer | Number of Target Outperformance Award Opportunity Performance Shares Granted for 2015 - 2017 Performance Period | Calculated Target Value Based on Grant Date Price | Calculated Accounting Value based on Final Monte Carlo Simulation and as reported in Grants of Plan-Based Awards Table | ||||||
| David J. LaRue | 50,000 | $ | 1,265,500 | $ | 1,581,500 | ||||
| Robert G. O’Brien | 40,000 | $ | 1,012,400 | $ | 1,265,200 | ||||
| James A. Ratner | 20,000 | $ | 506,200 | $ | 632,600 | ||||
| Ronald A. Ratner | 20,000 | $ | 506,200 | $ | 632,600 | ||||
| Deborah Ratner Salzberg | 14,000 | $ | 354,340 | $ | 442,820 | ||||
If actual performance as of December 31, 2015, persisted for the remainder of the three-year performance cycle, the realizable value of Outperformance Plan performance shares would be $0 since our Company’s annualized absolute TSR was below the 8% threshold return requirement.
Benefits and Other Perquisites: Consistent with our pay for performance philosophy, we do not offer our NEOs a large number of perquisites or supplemental benefits. Our NEOs, as well as other members of senior management, receive customary benefits such as group term life insurance. Likewise, these individuals are eligible to participate in a qualified 401(k) retirement plan, which provides for an employer matching contribution of up to $3,500 per year. We do not maintain a qualified defined benefit pension plan.
To supplement retirement benefits and enhance retention, all NEOs also participate in an unfunded nonqualified supplemental retirement plan administered by the Compensation Committee, which historically provided for discretionary annual accruals that only begin to vest after 10 years of service, with full vesting after 15 years of service. Effective with the 2008 fiscal year, no new
47
participants were admitted into this plan and no additional annual contributions will be made on behalf of NEOs, other senior executives or managers. All participating NEOs are fully vested in their benefits at this time.
Our NEOs are also eligible for a taxable health care subsidy payment. NEOs may use the health care subsidy to purchase health care coverage under one of our Company’s sponsored health care plans available to our associates and to partially defray the costs associated with out-of-pocket health care expenses. The amount of the annual health care subsidy payment for each of David J. LaRue and Robert G. O’Brien is $30,000. For James A. Ratner, Ronald A. Ratner and Deborah Ratner Salzberg, the annual health care subsidy payment is $25,000. These amounts are not subject to a tax gross-up, nor are they included in each NEO’s base salary. Therefore, these payments are not considered when determining short-term or long-term incentive opportunities for each executive.
We also provide our NEOs with the premium cost associated with a long-term care policy. Each NEO is also offered a monthly auto allowance for personal use. Certain NEOs also receive reimbursements for club dues or parking allowances. The value of these items is included in the All Other Compensation column of the Summary Compensation Table included in this proxy statement.
Additionally, a death benefit is provided to each of our NEOs, except for Deborah Ratner Salzberg. The benefit is equal to five times the annual salary of each executive at the time of death and is paid to his designated beneficiaries in the form of salary continuation for a period of five years in the event the executive dies while in our employment. Further information on the value of these benefits is provided in the “Potential Payments upon Termination or Change of Control” section of this proxy statement.
Additional Executive Compensation Policies
Executive Stock Ownership Requirements Policy: The Compensation Committee adopted the Executive Stock Ownership Requirements Policy (“Executive Stock Ownership Policy”) in 2010 to align our compensation programs more closely to shareholder interests. The Executive Stock Ownership Policy was most recently amended in February 2016 and covers our NEOs as well as additional senior executives now subject to the requirements. Covered executives are required to meet a fixed share requirement which will be recalibrated at least once every three years. The following table lists the revised share requirements under the amended Executive Stock Ownership Policy for each NEO as of February 2016.
| Named Executive Officer | Multiple of Base Salary used to Determine the Initial Fixed Share Requirement | Fixed Share Ownership Requirement |
| David J. LaRue | 6 times | 200,000 shares |
| Robert G. O’Brien | 4 times | 100,000 shares |
| James A. Ratner | 4 times | 100,000 shares |
| Ronald A. Ratner | 4 times | 100,000 shares |
| Deborah Ratner Salzberg | 1.5 times | 30,000 shares |
* The amended fixed share guidelines were based on a 90-day average closing price through December 31, 2015 of $21.50 per share.
Covered executives must meet the share ownership requirements under the Executive Stock Ownership Policy by December 31, 2018. If the executive does not meet the requirements during the first five years of being subject to the guidelines, he/she will be required to hold 50% of net-after-tax shares received from equity grants until the ownership requirements are met. If a covered executive does not meet the requirements as of December 31, 2018, or if later, five years from the time of first being subject to the guidelines, he/she will be required to hold 100% of net after-tax shares received from equity grants until the ownership requirements are met. These requirements further enhance the alignment of our senior executives’ ownership interests with those of our shareholders and simplify administration.
The Compensation Committee monitors compliance with the ownership requirements on an annual basis. As of December 31, 2015, each of our NEOs subject to the Executive Stock Ownership Policy had met their previous and their newly amended stock ownership requirements.
Clawback Policy: Since 2011 we have maintained a recoupment policy for compensation paid to certain executive officers, including our NEOs, who are covered by the Executive Stock Ownership Policy under the following circumstances:
| • | The payment, grant or vesting of such compensation was based on the achievement of financial results that were subsequently the subject of a restatement of our financial statements filed with the SEC, or the amount of the award was based upon the achievement of metrics which subsequently were determined to have been misstated; |
48
| • | The Compensation Committee determines, in its sole discretion, exercised in good faith, that the officer engaged in fraud or misconduct that caused or contributed to the need for the restatement or caused or contributed to the misstatement of the metrics; |
| • | The misstatement was discovered within three years of the filing of the financials; and |
| • | The Compensation Committee determines, in its sole discretion, that it is in the best interests of our Company and its shareholders for the officer to repay or forfeit all or any portion of their compensation. |
The Compensation Committee intends to periodically review our existing Clawback Policy and, as appropriate, conform it to the requirements under the Dodd-Frank Wall Street Reform and Consumer Protection Act after the SEC issues final guidance on this matter.
Securities Hedging and Pledging Policy: To further align our policies with emerging best practices in the area of governance, the Board of Directors in 2013 approved a Securities Hedging and Pledging Policy (“Hedging and Pledging Policy”). The Hedging and Pledging Policy prohibits Directors and executive officers of the Company and its subsidiaries from:
| • | Owning financial instruments or participating in investment strategies that represent a direct hedge of the economic risk of owning our shares of Class A or Class B Common Stock (collectively, our “Common Stock”) or any securities that give the holder any rights to acquire any of our Common Stock; |
| • | Holding a margin account, or otherwise pledging as collateral, any of our securities granted to them as equity compensation; and |
| • | Engaging in pledging of our securities except in limited circumstances and upon the prior approval of our Audit Committee. Under no circumstances will a person subject to the Hedging and Pledging Policy be permitted to pledge our securities unless he or she complies with the minimum ownership level required under the stock ownership guidelines applicable to such person in effect at both the time of the pledge and on a pro-forma basis after taking the effect of the pledge into account. In determining whether to grant its approval of a pledge, the Audit Committee will take into account multiple factors it deems relevant in order to determine that the pledge is not significant from a corporate governance standpoint. |
Employment Agreements: We have entered into employment agreements with David J. LaRue and Robert G. O’Brien. Effective January 1, 2016, Messrs. LaRue and O’Brien entered into new employment agreements with Forest City Employer, LLC in connection with our conversion to REIT status. Each agreement continues for additional periods of one year until termination by the Company or the covered officer pursuant to the conditions designated in the respective agreement, including by death, disability, by the Company with or without cause, by the executive with or without “good reason” or upon non-renewal of the then current employment term.
Under the agreements, Messrs. LaRue and O’Brien receive initial base salaries, subject to annual adjustments based upon the performance by the respective officers and the Company, as well as industry standards. They remain eligible to participate in the executive versions of the STIP and the LTIP in accordance with the terms established by our Compensation Committee from time to time.
Subject to certain limitations contained in the employment agreements, Messrs. LaRue and O’Brien will be eligible for severance payments and benefits upon termination. Following termination, each officer generally will be entitled to:
| • | The earned and unpaid portions of his annual base salary, incentive compensation under the STIP and LTIP for the last completed performance period prior to termination, and accrued and unused paid-time-off through the date of termination; and |
| • | Any other amounts or benefits required to be paid, provided or which he is eligible to receive. |
Also, subject to the conditions set forth in the employment agreements, including the requirement to release all claims against the Company, following termination due to disability, by the Company without cause or by the executive for “good reason,” as defined in the employment agreements and summarized below, Messrs. LaRue and O’Brien generally shall be entitled to additional severance as more fully described under the “Other Benefits and Perquisites” portion of the “Potential Payments Upon Termination” section of this proxy statement.
49
“Good reason” is defined to include: 1) a material reduction in the duties or responsibilities of the executive (including any change in officer status); 2) a material reduction by the Company of the executive’s base salary, targeted STIP or LTIP opportunity or total direct compensation opportunity (defined as a reduction of more than 10% during the items of the employment agreement); 3) a material change (by more than 50 miles) in the geographic location of the executive’s principal work location; or 4) a material breach of the agreement by the Company.
Pursuant to the employment agreements, Messrs. LaRue and O’Brien each agreed to certain non-solicitation and non-competition provisions applicable during the terms of their respective employments with the Company and for a two-year period following thereafter. In addition, the employment agreements also contain customary non-disparagement and confidentiality provisions applicable during and after the respective terms of their employment with the Company.
The employment agreements, however, do not contain change of control provisions nor do they provide for excessive perquisites or benefits. In addition, the agreements do not provide for tax gross-ups associated with severance payments.
The Compensation Committee approved the employment agreements with Messrs. LaRue and O’Brien to improve retention and to protect our Company in the event an individual executive decides to voluntarily terminate their employment for “good reason.”
Messrs. LaRue and O’Brien are also party to death benefits agreements, which provide that if the executive dies while employed by the Company, the Company will pay a death benefit to the executive’s designated beneficiary or estate for a period of five years after the executive’s death. The benefit will equal the executive’s annual salary at the time of death.
James A. Ratner and Ronald A. Ratner also have employment agreements with Forest City Employer, LLC which became effective January 1, 2016 that provide for a minimum base salary and death benefits (equivalent to those provided to Messrs. LaRue and O’Brien) and are renewable for one-year periods unless otherwise terminated. In addition, the agreements for James A. Ratner and Ronald A. Ratner contain a non-compete provision.
Deborah Ratner Salzberg does not have an employment agreement with us.
Plan Design as it Pertains to Risk
The Audit and Compensation Committees reviewed the results of a risk assessment at a joint meeting in February 2016. The risk assessment was conducted by representatives of human resources and senior management in connection with the requirements set forth by the SEC to assess whether our compensation programs, policies and systems encourage inappropriate risk-taking. The Compensation Committee’s compensation consultant, Pearl Meyer, was also asked to review the prepared document and provided an independent analysis which concurred overall with management’s assessment.
In conducting our analysis, we used materials provided by outside legal counsel and Pearl Meyer. We used a compensation risk scorecard to evaluate our executive compensation programs, policies and systems relative to a number of risk factors including: pay opportunity; pay mix; performance goals, metrics and targets; external reference to peers and market practices; and use of appropriate checks and balances. Based on this review, the Audit and Compensation Committees concluded that our overall compensation approaches, practices and systems do not create risks that are reasonably likely to have a material adverse effect on our Company. In making this determination, the Audit and Compensation Committees considered that our compensation approaches are in line with competitive and best practices, are based on multiple measures tied to appropriate business results and are structured to encourage a balanced focus on both short-term and long-term performance without encouraging inappropriate risk-taking on the part of participants. Several specific examples of programs and policies designed to discourage inappropriate risk-taking include the use of incentive award opportunity caps, stock ownership guidelines and share holding requirements, a clawback policy and a securities hedging and pledging policy. The Compensation Committee also periodically reviews tally sheets to gauge potential realizable values for NEOs under the various executive compensation programs, as well as potential award payouts under various termination of employment scenarios, and compliance with stock ownership requirements.
Tax and Accounting Implications
Deductibility of Executive Compensation: Section 162(m) limits the amount of compensation provided to certain executive officers that publicly-traded companies can deduct to $1.0 million per “covered employee” unless it qualifies as “performance-based” (as defined under Section 162(m)). In order to qualify as “performance-based”, compensation must be based solely on pre-established objective goals under a shareholder approved plan, with no positive discretion permitted when determining award payouts. The Compensation Committee’s policy with respect to Section 162(m) is to consider tax deductibility while also maintaining the flexibility to structure the executive compensation program to support Company and shareholder interests, even if some compensation is not fully tax deductible. In general and with minimal exceptions, the STIP and the Cash LTIP, and performance share grants, are all intended to qualify as performance-based compensation under Section 162(m), unless the Compensation Committee decides it is not in the best interests of our company and shareholders. However, the Compensation Committee reserves the right to provide compensation that does not qualify as performance-based under Section 162(m).
50
Compensation Committee Report
The Compensation Committee (the “Compensation Committee”) of the Board of Directors (the “Board”) of Forest City Realty Trust, Inc., a Maryland corporation, has reviewed and discussed the Compensation Discussion & Analysis required by Item 402(b) of Regulation S-K with management and, based on such review and discussion, the Compensation Committee recommended to the Board that the Compensation Discussion & Analysis be included in the proxy statement for Forest City Realty Trust Inc.’s 2016 Annual Meeting of Shareholders.
| Scott S. Cowen (Chairman) | Arthur F. Anton | Michael P. Esposito, Jr. | Stan Ross |
The foregoing Compensation Committee Report shall not be deemed incorporated by reference by any general statement incorporating by reference this proxy statement into any filing under the Securities Act of 1933 or under the Securities Exchange Act of 1934, except to the extent that we specifically incorporate the information by reference, and shall not otherwise be deemed filed under such Acts.
Potential Payments upon Termination or Change of Control
The following discussion outlines the payments that would be provided to our NEOs in the event of termination, retirement, death, disability or change of control as of December 31, 2015.
Under our various plans described in the CD&A and below (with the exception of the Elective Deferred Compensation and Nonqualified Supplemental Retirement Plans), in order to be eligible for payment upon retirement, a NEO must be at least 65 years old and have served the Company or its subsidiaries for five or more years.
Our Stock Plan provides that, in the event of a change of control, the Compensation Committee, in its sole discretion, may provide for or take such actions, if any, as it deems necessary or desirable with respect to any award that is outstanding as of the date of the change of control. Those actions could include, for example: (i) accelerated vesting, settlement and/or exercisability of an award, (ii) payment of cash in exchange for the cancellation of an award, (iii) cancellation of “underwater” option rights and/or appreciation rights without any payment therefor, or (iv) issuance of substitute awards that substantially preserve the value, rights and benefits of any affected awards.
Short-Term Incentive Plan
| Name | Termination Event | ||||||||||||||||||||
| Retirement | Voluntary for Good Reason | Involuntary without Cause | Involuntary with Cause | Death | Disability | Change of Control | |||||||||||||||
| David J. LaRue | $ | — | $ | — | $ | — | $ | — | $ | — | $ | — | $ | — | |||||||
| Robert G. O’Brien | $ | — | $ | — | $ | — | $ | — | $ | — | $ | — | $ | — | |||||||
| James A. Ratner | $ | — | $ | — | $ | — | $ | — | $ | — | $ | — | $ | — | |||||||
| Ronald A. Ratner | $ | — | $ | — | $ | — | $ | — | $ | — | $ | — | $ | — | |||||||
| Deborah Ratner Salzberg | $ | — | $ | — | $ | — | $ | — | $ | — | $ | — | $ | — | |||||||
No additional STIP payment beyond that earned under the Plan for the 2015 performance period and referenced in the CD&A to this proxy would be provided for retirement, involuntary termination without cause, involuntary termination with cause, death, disability or in the event of a change in control. Since the performance period end would have coincided with each of the previously listed termination events as of December 31, 2015, no additional payments under the STIP would have been earned.
Under the terms of their employment agreements, David J. LaRue and Robert G. O’Brien would have been eligible to receive a STIP award upon termination due to disability, involuntary termination without cause or voluntary termination by the executive for “good reason”, subject to an executed release of claims. Since the STIP payment for the 2015 performance period would have been earned as of the termination date, no additional amounts would have been provided under this Plan.
51
Cash-Based Long-Term Incentive Plan (2012 - 2015 Performance Cycle)
| Name | Termination Event | ||||||||||||||||||||
| Retirement | Voluntary for Good Reason | Involuntary without Cause | Involuntary with Cause | Death | Disability | Change of Control | |||||||||||||||
| David J. LaRue | $ | — | $ | — | $ | — | $ | — | $ | — | $ | — | $ | — | |||||||
| Robert G. O’Brien | $ | — | $ | — | $ | — | $ | — | $ | — | $ | — | $ | — | |||||||
| James A. Ratner | $ | — | $ | — | $ | — | $ | — | $ | — | $ | — | $ | — | |||||||
| Ronald A. Ratner | $ | — | $ | — | $ | — | $ | — | $ | — | $ | — | $ | — | |||||||
| Deborah Ratner Salzberg | $ | — | $ | — | $ | — | $ | — | $ | — | $ | — | $ | — | |||||||
As with the 2015 STIP, no additional payment would be due to any NEO for the 2012 - 2015 Cash LTIP cycle assuming termination for any of the reasons shown above, since these payments would have been already earned irrespective of a termination event on the last day of the performance cycle. The actual amounts earned for this performance period are included in the CD&A portion of this proxy.
Under the terms of their employment agreements, David J. LaRue and Robert G. O’Brien would have been eligible to receive a 2012 - 2015 Cash LTIP award upon termination due to disability, involuntary termination without cause or voluntary termination by the executive for “good reason”, subject to an executed release of claims. Since the Cash LTIP payment for the 2012 - 2015 performance period would have been earned as of the termination date, no additional amounts would have been provided under this Plan.
Cash-Based Long-Term Incentive Plan (2013 - 2016 Performance Cycle)
| Name | Termination Event | ||||||||||||||||||
| Retirement | Voluntary for Good Reason | Involuntary without Cause | Involuntary with Cause | Death | Disability | Change of Control | |||||||||||||
| David J. LaRue | $ | — | $ | 357,626 | $ | 357,626 | $ | — | $ | 536,170 | $ | 357,626 | At discretion of Committee | ||||||
| Robert G. O’Brien | $ | — | $ | 182,124 | $ | 182,124 | $ | — | $ | 273,050 | $ | 182,124 | At discretion of Committee | ||||||
| James A. Ratner | $ | 165,567 | $ | — | $ | 165,567 | $ | — | $ | 248,227 | $ | 248,227 | At discretion of Committee | ||||||
| Ronald A. Ratner | $ | 165,567 | $ | — | $ | 165,567 | $ | — | $ | 248,227 | $ | 248,227 | At discretion of Committee | ||||||
| Deborah Ratner Salzberg | $ | — | $ | — | $ | 60,028 | $ | — | $ | 89,997 | $ | 89,997 | At discretion of Committee | ||||||
Cash-Based Long-Term Incentive Plan (2014 - 2017 Performance Cycle)
| Name | Termination Event | ||||||||||||||||||
| Retirement | Voluntary for Good Reason | Involuntary without Cause | Involuntary with Cause | Death | Disability | Change of Control | |||||||||||||
| David J. LaRue | $ | — | $ | — | $ | 360,000 | $ | — | $ | 360,000 | $ | 360,000 | At discretion of Committee | ||||||
| Robert G. O’Brien | $ | — | $ | — | $ | 183,333 | $ | — | $ | 183,333 | $ | 183,333 | At discretion of Committee | ||||||
| James A. Ratner | $ | 166,667 | $ | — | $ | 166,667 | $ | — | $ | 166,667 | $ | 166,667 | At discretion of Committee | ||||||
| Ronald A. Ratner | $ | 166,667 | $ | — | $ | 166,667 | $ | — | $ | 166,667 | $ | 166,667 | At discretion of Committee | ||||||
| Deborah Ratner Salzberg | $ | — | $ | — | $ | 60,427 | $ | — | $ | 60,427 | $ | 60,427 | At discretion of Committee | ||||||
52
Cash-Based Long-Term Incentive Plan (2015 - 2017 Performance Cycle)
| Name | Termination Event | ||||||||||||||||||
| Retirement | Voluntary for Good Reason | Involuntary without Cause | Involuntary with Cause | Death | Disability | Change of Control | |||||||||||||
| David J. LaRue | $ | — | $ | — | $ | — | $ | — | $ | 270,000 | $ | 270,000 | At discretion of Committee | ||||||
| Robert G. O’Brien | $ | — | $ | — | $ | — | $ | — | $ | 125,889 | $ | 125,889 | At discretion of Committee | ||||||
| James A. Ratner | $ | 111,111 | $ | — | $ | — | $ | — | $ | 111,111 | $ | 111,111 | At discretion of Committee | ||||||
| Ronald A. Ratner | $ | 111,111 | $ | — | $ | — | $ | — | $ | 111,111 | $ | 111,111 | At discretion of Committee | ||||||
| Deborah Ratner Salzberg | $ | — | $ | — | $ | — | $ | — | $ | 47,222 | $ | 47,222 | At discretion of Committee | ||||||
Under the terms of the LTIP, eligible NEOs would be able to receive a pro-rated Cash LTIP payment in the event of retirement, death or disability provided the executive had completed at least one year of the performance period. In the event of retirement, a pro-rated payment could be earned based on the actual results of the 2013 - 2016, the 2014 - 2017 and the 2015 - 2017 performance cycles and determined after the end of each cycle, provided the executive was retirement eligible (age 65 or older and with five or more years of service) as of their termination date. As of December 31, 2015, only James A. Ratner and Ronald A. Ratner would have met the definition of retirement and would have been eligible for such pro-rated payments. In the event of death or disability as of December 31, 2015, the executive or their estate would have been eligible to receive a pro-rated payment of 35/47ths of a full award for the 2013 - 2016 cycle, one-half of a full award for the 2014-2017 cycle, and one-third of a full award for the 2015 - 2017 cycle, in each case based on the target level of performance The Compensation Committee would retain discretion to reduce the amount of any payment earned.
In the event of involuntary termination without cause, each NEO would be eligible to receive a pro-rated award at the end of each performance period based on actual performance for that cycle only if at least half of the performance period had elapsed, as would have been the case with the 2013 - 2016 and the 2014 - 2017 performance cycles. Since less than half of the performance period for the 2015 - 2017 cycle had elapsed as of December 31, 2015, our NEOs would not have been eligible for an award due to this termination reason. Except as otherwise noted below, for voluntary terminations or involuntary terminations with cause, each NEO would not be eligible to receive a pro-rated award under the terms of the Cash LTIP. In terms of change of control, no specific payment trigger provisions exist under the Cash LTIP or in any employment agreements we have with our NEOs, but the Compensation Committee retains discretion to award a payment if so inclined.
Under the terms of their employment agreements, David J. LaRue and Robert G. O’Brien would be able to receive a Cash LTIP award based on actual performance if they terminated their employment due to disability, involuntarily without cause or voluntarily by the executive for “good reason” but only if their termination occurred within the second half of the performance cycle, subject to an executed release of claims. Since more than half of the 2013 - 2016 performance cycle had elapsed by December 31, 2015, David J. LaRue and Robert G. O’Brien would be eligible for such pro-rated awards based on actual performance at the end of the cycle. Since less than half of the performance periods for each of the 2014 - 2017 and the 2015 - 2017 cycles had elapsed as of December 31, 2015, no payment would have been earned under the employment agreements. In the event of termination due to disability, the provisions of the Cash LTIP would have superseded those under the employment agreements for each of David J. LaRue and Robert G. O’Brien and a pro-rated payment at target could have been earned for each of the two cycles.
As of December 31, 2015 the estimated performance for the 2013- 2016 cycle was such that approximately two-thirds of a target payment would have been earned before pro-ration. For the 2014 - 2017 and the 2015 - 2017 cycles, a target level of performance was assumed.
53
Equity Awards - Unvested Stock Options Granted 2012 to Present
| Termination Event | ||||||||||||||
Retirement (1) | Voluntary for Good Reason (2) | Involuntary without Cause (2) | Involuntary with Cause | Death (3) | Disability (2) | Change of Control | ||||||||
| David J. LaRue | $0, forfeited | $692,039 | $692,039 | $0, forfeited | $0, forfeited | $692,039 | At discretion of Committee | |||||||
| Robert G. O’Brien | $0, forfeited | $352,424 | $352,424 | $0, forfeited | $0, forfeited | $352,424 | At discretion of Committee | |||||||
| James A. Ratner | $307,414 | $0, forfeited | $0, forfeited | $0, forfeited | $307,414 | $0, forfeited | At discretion of Committee | |||||||
| Ronald A. Ratner | $307,414 | $0, forfeited | $0, forfeited | $0, forfeited | $307,414 | $0, forfeited | At discretion of Committee | |||||||
| Deborah Ratner Salzberg | — | — | — | — | — | — | — | |||||||
| (1) | All stock options accelerate vesting upon retirement as defined under the Stock Plan. An executive has the remaining term of option life in which to exercise. |
| (2) | Per the terms of the Stock Plan and stock option agreements, all unvested options are forfeited. Notwithstanding the limitations in the Stock Plan and the stock option agreements, per the terms of the employment agreements for Messrs. LaRue and O’Brien, their unvested stock options would vest in the event of disability, involuntary termination without cause or voluntary termination by the executive for “good reason”, subject to an executed release of claims. Although neither James A. Ratner or Ronald A. Ratner would vest in their stock options through a “good reason” provision, each would vest in the amounts shown under the Retirement column if they left voluntarily since each had attained retirement age as of December 31, 2015. |
| (3) | All stock options accelerate vesting upon death, provided the executive was at least age 65 at time of death. The executive’s estate would have one year from date of the executive’s death in which to exercise vested options. |
In terms of stock option awards, we determined the dollar value amounts shown above based on the intrinsic value of the unvested options using the closing price of our Class A Common Stock as of December 31, 2015. Upon retirement, NEOs would vest in all stock options granted as part of the fiscal year 2012 through fiscal year 2015 grants. NEOs who terminated their employment due to retirement would be able to exercise these options for the remaining period of their ten-year option life.
In the event of death, unvested stock options would only accelerate provided the executive was retirement eligible. As of December 31, 2015, each of James A. Ratner and Ronald A. Ratner were retirement eligible and held unvested stock options that would vest upon death. The estate of any deceased executive who is retirement eligible would have one year from the date of death in which to exercise any vested stock options. Unvested options held by David J. LaRue and Robert G. O’Brien would not vest upon death, since each of these executives were not retirement eligible as of December 31, 2015. Deborah Ratner Salzberg did not have any unvested stock options as of December 31, 2015.
Under the terms of the Stock Plan, the stock option agreements and the employment agreements entered into with certain of our NEOs, no options would vest solely upon a change of control. However, as noted earlier in this section, the Compensation Committee would have discretion to vest shares upon a change of control under the Stock Plan.
Equity Awards - Restricted Stock
| Name | Termination Event | ||||||
Retirement (1) | Voluntary for Good Reason (2) | Involuntary without Cause (3) | Involuntary with Cause (4) | Death (3) | Disability (3) | Change of Control (5) | |
| David J. LaRue | $0, forfeited | $721,497 | $721,497 | $0, forfeited | $721,497 | $721,497 | $0 |
| Robert G. O’Brien | $0, forfeited | $2,639,188 | $2,639,188 | $0, forfeited | $2,639,188 | $2,639,188 | $632,308 |
| James A. Ratner | $296,910 | $0, forfeited | $296,910 | $0, forfeited | $296,910 | $296,910 | $0 |
| Ronald A. Ratner | $296,910 | $0, forfeited | $296,910 | $0, forfeited | $296,910 | $296,910 | $0 |
| Deborah Ratner Salzberg | $0, forfeited | $0, forfeited | $471,670 | $0, forfeited | $471,670 | $471,670 | $87,216 |
| (1) | All previously unvested restricted shares would vest, provided the executive was of retirement age as defined under the Stock Plan, subject to Compensation Committee approval. |
| (2) | Per the terms of the Stock Plan and restricted stock agreements, all unvested restricted shares are forfeited. Notwithstanding the limitations in the Stock Plan and in the restricted stock agreements, per the terms of the employment agreements for David J. LaRue and Robert G. O’Brien, their unvested restricted shares would vest in the event of termination by the executive for “good reason”, subject to an executed release of claims. Although neither James A. Ratner or Ronald A. Ratner would vest in their restricted shares through a “good reason” provision, each would vest in the amounts shown under the Retirement column if they left voluntarily since each had attained retirement age as of December 31, 2015. |
| (3) | Per the terms of the restricted stock agreements, all previously unvested restricted shares would vest. |
54
| (4) | Per the terms of the restricted stock agreements, all unvested restricted shares are forfeited. |
| (5) | Per the terms of restricted stock agreements prior to March 2013, all previously unvested restricted shares would vest. Agreements entered into since March 2013 specify that the Compensation Committee could exercise discretion as it pertains to vesting in the event of a change of control. The amounts shown only represent the accelerated value of any unvested restricted shares granted prior to March 2013. |
All of our NEOs had unvested restricted stock as of December 31, 2015. The intrinsic value of unvested restricted stock that would vest in the event of retirement, involuntary termination without cause, voluntary termination for good reason, death, disability or change of control is shown in the previous table. In the event of their retirement as of December 31, 2015, the shares of restricted stock of each of David J. LaRue, Robert G. O’Brien and Deborah Ratner Salzberg would not have vested, and would therefore be forfeited since none of these individuals had attained retirement eligibility.
Under the terms of the restricted stock agreements, all restricted shares granted prior to March 13, 2013 would vest in the event of a change of control as defined in those agreements. As noted earlier in the section, a change of control provision was included in the amended Stock Plan approved by shareholders in 2013 which allows for vesting to occur only at the discretion of the Compensation Committee. This applies to grants made on or after March 2013.
Equity Awards - Performance Shares (2013 - 2016 Performance Cycle)
| Name | Termination Event | ||||||||||||||||||
| Retirement | Voluntary for Good Reason | Involuntary without Cause | Involuntary with Cause | Death | Disability | Change of Control | |||||||||||||
| David J. LaRue | $ | — | $ | 272,107 | $ | 272,107 | $ | — | $ | 632,834 | $ | 272,107 | At discretion of Committee | ||||||
| Robert G. O’Brien | $ | — | $ | 138,554 | $ | 138,554 | $ | — | $ | 322,261 | $ | 138,554 | At discretion of Committee | ||||||
| James A. Ratner | $ | 125,966 | $ | — | $ | 125,966 | $ | — | $ | 292,963 | $ | 292,963 | At discretion of Committee | ||||||
| Ronald A. Ratner | $ | 125,966 | $ | — | $ | 125,966 | $ | — | $ | 292,963 | $ | 292,963 | At discretion of Committee | ||||||
| Deborah Ratner Salzberg | $ | — | $ | — | $ | 45,658 | $ | — | $ | 106,207 | $ | 106,207 | At discretion of Committee | ||||||
Equity Awards - Performance Shares (2014 - 2017 Performance Cycle)
| Name | Termination Event | ||||||||||||||||||
| Retirement | Voluntary for Good Reason | Involuntary without Cause | Involuntary with Cause | Death | Disability | Change of Control | |||||||||||||
| David J. LaRue | $ | — | $ | — | $ | 113,795 | $ | — | $ | 421,495 | $ | 421,495 | At discretion of Committee | ||||||
| Robert G. O’Brien | $ | — | $ | — | $ | 57,939 | $ | — | $ | 214,651 | $ | 214,651 | At discretion of Committee | ||||||
| James A. Ratner | $ | 52,676 | $ | — | $ | 52,676 | $ | — | $ | 195,133 | $ | 195,133 | At discretion of Committee | ||||||
| Ronald A. Ratner | $ | 52,676 | $ | — | $ | 52,676 | $ | — | $ | 195,133 | $ | 195,133 | At discretion of Committee | ||||||
| Deborah Ratner Salzberg | $ | — | $ | — | $ | 19,605 | $ | — | $ | 72,676 | $ | 72,676 | At discretion of Committee | ||||||
55
Equity Awards - Performance Shares (2015 - 2017 Performance Cycle)
| Name | Termination Event | ||||||||||||||||||
| Retirement | Voluntary for Good Reason | Involuntary without Cause | Involuntary with Cause | Death | Disability | Change of Control | |||||||||||||
| David J. LaRue | $ | — | $ | — | $ | — | $ | — | $ | 240,484 | $ | 240,484 | At discretion of Committee | ||||||
| Robert G. O’Brien | $ | — | $ | — | $ | — | $ | — | $ | 112,260 | $ | 112,260 | At discretion of Committee | ||||||
| James A. Ratner | $ | 120,725 | $ | — | $ | — | $ | — | $ | 98,970 | $ | 98,970 | At discretion of Committee | ||||||
| Ronald A. Ratner | $ | 120,725 | $ | — | $ | — | $ | — | $ | 98,970 | $ | 98,970 | At discretion of Committee | ||||||
| Deborah Ratner Salzberg | $ | — | $ | — | $ | — | $ | — | $ | 42,040 | $ | 42,040 | At discretion of Committee | ||||||
Under the terms of the performance share grants, eligible NEOs would be able to receive a pro-rated performance share award in the event of retirement, death or disability provided the executive had completed at least one year of the performance period. In the event of retirement, a pro-rated award could be earned based on the actual results of the 2013 - 2016, the 2014 - 2017 and the 2015 - 2017 performance cycles and determined after the end of each cycle, provided the executive was retirement eligible (age 65 or older and with five or more years of service) as of their termination date. As of December 31, 2015, only James A. Ratner and Ronald A. Ratner had met the definition of retirement and would be eligible for such pro-rated payments. In the event of death or disability as of December 31, 2015, the executive or their estate would be eligible to receive a pro-rated award of 35/47ths of a target share award for the 2013 - 2016 cycle, one-half of a target share award for the 2014 - 2017 cycle, and one-third of a target share award for the 2015 - 2017 cycle. The Compensation Committee would retain discretion to reduce the amount of any award earned.
In the event of involuntary termination without cause, each NEO would be eligible to receive a pro-rated share award at the end of each performance period based on actual performance for that cycle only if at least half of the performance period had elapsed as was the case with the 2013 - 2016 and 2014 - 2017 performance cycles. Since less than half of the performance period for the 2015 - 2017 cycle had elapsed as of December 31, 2015, our NEOs would not have been eligible for an award due to this termination reason. Except as otherwise noted below, for voluntary terminations or involuntary terminations with cause, none of the NEOs would have been eligible to receive a pro-rated performance share award. In terms of change of control, no specific payment trigger provisions exist under the Stock Plan or performance share agreements or in any employment agreements we have with our NEOs, but the Compensation Committee retains discretion to award a payment if so inclined.
Under the terms of their employment agreements, David J. LaRue and Robert G. O’Brien would be able to vest in a performance share award based on actual performance if they terminated their employment due to disability, involuntarily without cause or voluntarily by the executive for “good reason” but only if their termination occurred within the second half of the performance cycle, subject to an executed release of claims. Since more than half of the 2013 - 2016 performance cycle had elapsed by December 31, 2015, David J. LaRue and Robert G. O’Brien would have been eligible for such pro-rated awards based on actual performance at the end of the cycle. Since for each of the 2014 - 2017 and the 2015 - 2017 performance cycles more than half of the cycle had not elapsed as December 31, 2015, no payment would have been earned under the employment agreements. In the event of termination due to disability, the provisions pertaining to the performance share grants would have superseded those under the employment agreements for each of David J. LaRue and Robert G. O’Brien and a pro-rated award at target could have been earned for each of the two cycles.
As of December 31, 2015 before pro-rations, performance for the 2013- 2016 cycle was such that approximately 43% of a target share award would have been earned, for the 2014 - 2017 cycle the estimated performance was such that 27% of a target share award would have vested, and for the 2015 - 2017 cycle the estimated performance was such that 122% of a target share award would have been earned.
56
Elective Deferred Compensation
| Name | Termination Event | ||||||||||||||||||||
| Retirement | Voluntary | Involuntary without Cause | Involuntary with Cause | Death (1) | Disability | Change of Control | |||||||||||||||
| David J. LaRue | $ | 626,275 | $ | 626,275 | $ | 626,275 | $ | 626,275 | $ | 626,275 | $ | 626,275 | $ | 626,275 | |||||||
| Robert G. O’Brien | $ | 552,946 | $ | 552,946 | $ | 552,946 | $ | 552,946 | $ | 552,946 | $ | 552,946 | $ | 552,946 | |||||||
| James A. Ratner | $ | 360,941 | $ | 360,941 | $ | 360,941 | $ | 360,941 | $ | 360,941 | $ | 360,941 | $ | 360,941 | |||||||
| Ronald A. Ratner | $ | 1,260,430 | $ | 1,260,430 | $ | 1,260,430 | $ | 1,260,430 | $ | 1,260,430 | $ | 1,260,430 | $ | 1,260,430 | |||||||
| Deborah Ratner Salzberg | $ | 94,341 | $ | 94,341 | $ | 94,341 | $ | 94,341 | $ | 94,341 | $ | 94,341 | $ | 94,341 | |||||||
| (1) | Paid to estate. |
In the event of retirement, voluntary termination, involuntary termination with or without cause, death, disability or change of control, each of the participating NEOs, or their beneficiaries, would be eligible to receive their nonqualified deferred compensation balances, which include their elective deferrals plus any aggregate earnings, as indicated in the table above. In all circumstances, payments of elective deferrals will be paid in accordance with each NEO’s election.
Nonqualified Supplemental Retirement Plan
| Name | Termination Event | ||||||||||||||||||
Retirement (1) | Voluntary (1) | Involuntary without Cause (1) | Involuntary with Cause (2) | Death (3) | Disability (1) | Change of Control | |||||||||||||
| David J. LaRue | $ | 174,928 | $ | 174,928 | $ | 174,928 | At discretion of Committee | $ | 174,928 | $ | 174,928 | $ | — | ||||||
| Robert G. O’Brien | $ | 174,928 | $ | 174,928 | $ | 174,928 | At discretion of Committee | $ | 174,928 | $ | 174,928 | $ | — | ||||||
| James A. Ratner | $ | 528,154 | $ | 528,154 | $ | 528,154 | At discretion of Committee | $ | 528,154 | $ | 528,154 | $ | — | ||||||
| Ronald A. Ratner | $ | 526,705 | $ | 526,705 | $ | 526,705 | At discretion of Committee | $ | 526,705 | $ | 526,705 | $ | — | ||||||
| Deborah Ratner Salzberg | $ | 38,765 | $ | 38,765 | $ | 38,765 | At discretion of Committee | $ | 38,765 | $ | 38,765 | $ | — | ||||||
| (1) | Paid if vested. |
| (2) | Paid at the discretion of the Compensation Committee. |
| (3) | Paid to estate if vested. |
Nonqualified Supplemental Retirement Plan benefit payments would typically be made over a ten-year period. In the event of death, payment would be made in the form of a lump-sum. In case of an involuntary termination with cause, all or a portion of the supplemental retirement benefit may be forfeited at the discretion of the Compensation Committee. All NEOs had vested in this benefit as of December 31, 2015 and would be eligible to receive the payments shown. However, David J. LaRue and Robert G. O’Brien each were under age 60 as of this date, and hence do not qualify for commencement of any payments under the plan at this time.
Death Benefits
| Name | Termination Event | ||||||||||||||||||||
Retirement (1) | Voluntary (1) | Involuntary without Cause (1) | Involuntary with Cause (1) | Death (2) | Disability (1) | Change of Control (3) | |||||||||||||||
| David J. LaRue | $ | — | $ | — | $ | — | $ | — | $ | 3,375,000 | $ | — | $ | — | |||||||
| Robert G. O’Brien | $ | — | $ | — | $ | — | $ | — | $ | 2,832,500 | $ | — | $ | — | |||||||
| James A. Ratner | $ | — | $ | — | $ | — | $ | — | $ | 2,500,000 | $ | — | $ | — | |||||||
| Ronald A. Ratner | $ | — | $ | — | $ | — | $ | — | $ | 2,500,000 | $ | — | $ | — | |||||||
| Deborah Ratner Salzberg | $ | — | $ | — | $ | — | $ | — | $ | — | $ | — | $ | — | |||||||
| (1) | Ceases eligibility. |
| (2) | Equivalent to five year salary continuation paid to estate in the event of death while actively employed by the Company. |
| (3) | No payment. |
In the event of death while employed by the Company, the estates of each of our NEOs, with the exception of Deborah Ratner Salzberg, would be able to receive a death benefit equal to five years’ worth of salary continuation as shown in the above table.
57
Other Benefits and Perquisites
The Company maintains a severance plan with salary continuation benefits calculated based on years of service. The amounts shown in the following table for James A. Ratner, Ronald A. Ratner and Deborah Ratner Salzberg were calculated based on each NEO’s tenure with our Company as of December 31, 2015. Under the severance plan, salary continuation would only be paid for involuntary termination without cause.
In lieu of the severance benefits provided under the severance plan, per the terms of their employment agreements, David J. LaRue and Robert G. O’Brien would be entitled to severance in the event of termination due to disability, involuntary termination without cause, or voluntary termination by the executive for “good reason.” Under these termination scenarios and subject to the execution of a release of claims, Messrs. LaRue and O’Brien would be eligible to receive the amounts shown in the table which follows. The employment agreements do not provide for tax gross-ups associated with severance payments.
The amounts shown in the following table reflect the severance each NEO would be entitled to in the event of a termination on December 31, 2015.
Severance
| Name | Termination Event | ||||||||||||||||||||
Retirement (1) | Voluntary for Good Reason (1) | Involuntary without Cause (1)(2) | Involuntary with Cause | Death | Disability (1) | Change of Control | |||||||||||||||
| David J. LaRue | $ | — | $ | 2,906,480 | $ | 2,906,480 | $ | — | $ | — | $ | 2,906,480 | $ | — | |||||||
| Robert G. O’Brien | $ | — | $ | 2,112,225 | $ | 2,112,225 | $ | — | $ | — | $ | 2,112,225 | $ | — | |||||||
| James A. Ratner | $ | — | $ | — | $ | 788,462 | $ | — | $ | — | $ | — | $ | — | |||||||
| Ronald A. Ratner | $ | — | $ | — | $ | 807,692 | $ | — | $ | — | $ | — | $ | — | |||||||
| Deborah Ratner Salzberg | $ | — | $ | — | $ | 506,731 | $ | — | $ | — | $ | — | $ | — | |||||||
| (1) | Per their employment agreements, the severance amounts shown for David J. LaRue and Robert G. O’Brien include the following: |
| Employment Agreement Provision | David J. LaRue | Robert G. O’Brien | ||||||
| Two Times Base Salary | $ | 1,350,000 | $ | 1,133,000 | ||||
| Two times Average of Prior three years’ STIP | $ | 1,488,925 | $ | 911,426 | ||||
| Two times an amount equal to 12 monthly medical and dental COBRA premiums and long-term care premiums based on the level of coverage in effect immediately prior to the date of termination. | $ | 67,554 | $ | 67,799 | ||||
The severance amounts shown for Messrs. LaRue and O’Brien do not include the value of accelerated restricted stock/performance shares or stock options as of December 31, 2015 on the basis of terminations resulting from disability, involuntarily without cause or voluntarily by the executive for “good reason”. Instead, these amounts are included in the “Equity Awards - Unvested Stock Options Granted 2012 to 2015”, “Equity Awards-Performance Shares”, and “Equity Awards - Restricted Stock” tables of this “Potential Payments Upon Termination or Change of Control” section of the proxy statement. Similarly, the value of any STIP or 2012 - 2015 Cash LTIP amounts payable to Messrs. LaRue and O’Brien resulting from their employment agreements is shown in the CD&A portion of the proxy. Any amounts attributable to the 2013 - 2016, the 2014 - 2017 and the 2015 - 2017 Cash LTIP cycles are included in the “Cash-Based Long-Term Incentive Plan” tables of this “Potential Payments Upon Termination or Change of Control” section of the proxy statement.
| (2) | Per the terms of the severance plan for our associates, the severance amounts shown for James A. Ratner, Ronald A. Ratner and Deborah Ratner Salzberg are calculated on the basis of years of service with the Company. |
Payment of premiums associated with long-term care insurance would cease upon termination, retirement or death for James A. Ratner, Ronald A. Ratner and Deborah Ratner Salzberg. However, the executive and/or his/her surviving dependents could elect to continue coverage at their own expense. Continuation of medical, dental and vision coverage under COBRA would be available for a period of up to 18 months for all eligible associates including our NEOs.
58
Summary of All Potential Payments Upon Termination
The following table summarizes all payments to NEOs that we would have made for various termination events as of December 31, 2015. As noted previously, certain of these payments would have been earned by our executives as part of the completion of the performance period. These amounts are included in the totals below.
| Name | Termination Event | ||||||||||||||||||||
| Retirement | Voluntary for Good Reason | Involuntary without Cause | Involuntary with Cause | Death | Disability | Change of Control | |||||||||||||||
| David J. LaRue | $ | 801,203 | $ | 5,750,952 | $ | 6,224,747 | $ | 626,275 | $ | 7,358,683 | $ | 7,042,931 | $ | 626,275 | |||||||
| Robert G. O’Brien | $ | 727,874 | $ | 6,152,389 | $ | 6,393,661 | $ | 552,946 | $ | 7,431,006 | $ | 6,788,522 | $ | 1,185,254 | |||||||
| James A. Ratner | $ | 2,236,131 | $ | 889,095 | $ | 2,485,343 | $ | 360,941 | $ | 5,106,490 | $ | 2,299,076 | $ | 360,941 | |||||||
| Ronald A. Ratner | $ | 3,134,171 | $ | 1,787,135 | $ | 3,402,613 | $ | 1,260,430 | $ | 6,004,530 | $ | 3,197,116 | $ | 1,260,430 | |||||||
| Deborah Ratner Salzberg | $ | 133,106 | $ | 133,106 | $ | 1,297,225 | $ | 94,341 | $ | 1,023,345 | $ | 1,023,345 | $ | 181,557 | |||||||
59
Executive Compensation Tables
The following tables present compensation information for our Principal Executive Officer (“PEO”), Principal Financial Officer (“PFO”) and the three other most highly compensated executive officers (collectively, our “NEOs”). The Company changed its fiscal year-end from January 31 to December 31 effective December 31, 2013. The information presented in the following executive compensation tables for the fiscal year 2013 represents the 11-month period ended December 31, 2013.
Summary Compensation Table
| Name and Principal | Salary | Bonus | Stock Awards | Option Awards | Non-Equity Incentive Plan Compensation | Change in Pension Value and Nonqualified Deferred Compensation Earnings | All Other Compensation | Total | ||||||||||||||||||||
| Position | Year | ($) | ($) | ($)(2) | ($)(3) | ($)(4) | ($)(5) | ($)(6) | ($) | |||||||||||||||||||
| Annual | Long-Term | |||||||||||||||||||||||||||
David J. LaRue President and Chief Executive Officer (PEO) | 2015 | $ | 675,000 | $ | — | $ | 3,478,514 | $ | — | $ | 1,033,388 | $ | 375,000 | $ | 10,710 | $ | 54,799 | $ | 5,627,411 | |||||||||
| 2014 | $ | 600,000 | $ | 450,000 | $ | 700,779 | $ | 719,989 | $ | 1,200,000 | $ | — | $ | 7,946 | $ | 52,412 | $ | 3,731,126 | ||||||||||
| 2013 | $ | 553,846 | $ | — | $ | 688,993 | $ | 719,994 | $ | — | $ | — | $ | 8,230 | $ | 69,947 | $ | 2,041,010 | ||||||||||
| 2012 | $ | 600,000 | $ | — | $ | 1,013,066 | $ | 719,994 | $ | 875,000 | $ | — | $ | 10,103 | $ | 70,209 | $ | 3,288,372 | ||||||||||
| Robert G. O’Brien Executive Vice President and Chief Financial Officer (PFO) | 2015 | $ | 563,327 | $ | — | $ | 2,574,638 | $ | — | $ | 667,139 | $ | 190,000 | $ | 9,725 | $ | 55,501 | $ | 4,060,330 | |||||||||
| 2014 | $ | 550,000 | $ | 412,500 | $ | 781,854 | $ | 366,662 | $ | 700,000 | $ | — | $ | 7,214 | $ | 53,264 | $ | 2,871,494 | ||||||||||
| 2013 | $ | 507,692 | $ | — | $ | 1,200,863 | $ | 366,656 | $ | — | $ | — | $ | 7,438 | $ | 70,634 | $ | 2,153,283 | ||||||||||
| 2012 | $ | 550,000 | $ | — | $ | 1,365,905 | $ | 366,661 | $ | 800,000 | $ | — | $ | 9,170 | $ | 69,375 | $ | 3,161,111 | ||||||||||
James A. Ratner Executive Vice President | 2015 | $ | 500,000 | $ | — | $ | 1,413,259 | $ | — | $ | 588,825 | $ | 155,000 | $ | 11,777 | $ | 52,112 | $ | 2,720,973 | |||||||||
| 2014 | $ | 500,000 | $ | 375,000 | $ | 324,421 | $ | 333,324 | $ | 550,000 | $ | — | $ | 8,715 | $ | 51,862 | $ | 2,143,322 | ||||||||||
| 2013 | $ | 461,538 | $ | — | $ | 318,973 | $ | 333,328 | $ | — | $ | — | $ | 8,324 | $ | 72,903 | $ | 1,195,066 | ||||||||||
| 2012 | $ | 450,000 | $ | — | $ | 422,100 | $ | 299,997 | $ | 610,000 | $ | — | $ | 11,051 | $ | 73,271 | $ | 1,866,419 | ||||||||||
Ronald A. Ratner Executive Vice President | 2015 | $ | 500,000 | $ | — | $ | 1,413,259 | $ | — | $ | 588,825 | $ | 155,000 | $ | 23,846 | $ | 52,163 | $ | 2,733,093 | |||||||||
| 2014 | $ | 500,000 | $ | 375,000 | $ | 324,421 | $ | 333,324 | $ | 575,000 | $ | — | $ | 17,684 | $ | 48,842 | $ | 2,174,271 | ||||||||||
| 2013 | $ | 461,538 | $ | — | $ | 318,973 | $ | 333,328 | $ | — | $ | — | $ | 18,025 | $ | 71,958 | $ | 1,203,822 | ||||||||||
| 2012 | $ | 450,000 | $ | — | $ | 422,100 | $ | 299,997 | $ | 650,000 | $ | — | $ | 22,470 | $ | 72,542 | $ | 1,917,109 | ||||||||||
Deborah Ratner Salzberg Executive Vice President (1) | 2015 | $ | 422,596 | $ | — | $ | 774,480 | $ | — | $ | 444,801 | $ | 60,000 | $ | 1,777 | $ | 49,374 | $ | 1,753,028 | |||||||||
| (1) | Deborah Ratner Salzberg was not a Named Executive Officer in 2012, 2013 and 2014. |
| (2) | Represents the aggregate grant-date fair value of restricted stock awards and performance shares computed in accordance with accounting guidance for share-based payments. The grant-date fair value of restricted stock awards is equal to the closing price of the Class A Common Stock on the date of grant. The grant-date fair value of performance shares, which have a market condition, is based on a Monte Carlo simulation. The amounts in this column for 2015 reflect the aggregate grant-date fair value of restricted stock awards granted to: David J. LaRue - $809,998; Robert G. O’Brien - $802,637; James A. Ratner $333,330; Ronald A. Ratner - $333,330; and Deborah Ratner Salzberg - $141,614; and the aggregate grant-date fair value of performance shares granted to: David J. LaRue - $2,668,516; Robert G. O’Brien - $1,772,001; James A. Ratner - $1,079,929; Ronald A. Ratner -$1,079,929; and Deborah Ratner Salzberg - $632,866. At the maximum number of shares achievable, the aggregate grant-date fair value of the performance shares granted in 2015 would have been: David J. LaRue - $6,918,532; Robert G. O’Brien - $4,809,201; James A. Ratner - $2,792,457; Ronald A. Ratner - $2,792,457; and Deborah Ratner Salzberg - $1,708,552. |
| (3) | Represents the aggregate grant-date fair value of stock options computed in accordance with accounting guidance for share-based payments. The fair value of stock options is estimated using the Black-Scholes option pricing model. The assumptions used in the fair value calculations are described in Note O, “Stock-Based Compensation”, to our consolidated financial statements for the year ended December 31, 2015, which are included in our Annual Report on Form 10-K filed with the SEC. |
| (4) | Represents the cash awards earned during the year shown under our STIP and LTIP by the NEO. The awards are paid in the following year. The STIP and LTIP programs are discussed in greater detail in the CD&A section of this proxy statement. |
| (5) | Represents the amount of above-market earnings on the NEO’s nonqualified deferred compensation balances which are reported in the Nonqualified Deferred Compensation table included in this section of the proxy statement. The earnings credited to each NEO’s nonqualified deferred compensation accounts were earned at the same rates as all other participants in the same plans. The amount of above-market earnings was computed to be the amount by which the actual earnings exceeded what the earnings would have been had we used 120% times the Federal Long-Term Rates published by the Internal Revenue Service in accordance with Section 1274(d) of the Internal Revenue Code. |
60
Executive Compensation Tables (continued)
| (6) | The detail of All Other Compensation is shown in the following table: |
David J. LaRue | Robert G. O’Brien | James A. Ratner | Ronald A. Ratner | Deborah Ratner Salzberg | |||||||||||
| All Other Compensation | ($) | ($) | ($) | ($) | ($) | ||||||||||
| Matching contribution to 401(k) plan | $ | 3,500 | $ | 3,500 | $ | 3,500 | $ | 3,500 | $ | 3,500 | |||||
| Imputed income of group term life insurance | $ | 1,242 | $ | 2,322 | $ | 4,944 | $ | 4,953 | $ | 3,564 | |||||
| Auto allowance | $ | 12,960 | $ | 12,960 | $ | 12,960 | $ | 12,960 | $ | 12,960 | |||||
| Executive health subsidy | $ | 30,000 | $ | 30,000 | $ | 25,000 | $ | 25,000 | $ | 25,000 | |||||
| Long-term care insurance premiums | $ | 3,777 | $ | 3,899 | $ | 5,708 | $ | 5,750 | $ | 4,350 | |||||
| Club dues | $ | 500 | $ | — | $ | — | $ | — | $ | — | |||||
| Parking allowance | $ | 2,820 | $ | 2,820 | $ | — | $ | — | $ | — | |||||
| Total | $ | 54,799 | $ | 55,501 | $ | 52,112 | $ | 52,163 | $ | 49,374 | |||||
Prior to January 1, 2016, our employment agreements with James A. Ratner and Ronald A. Ratner, effective February 1, 2013, provided for annual salaries of $500,000 and $500,000, respectively. These agreements were automatically renewable for one-year terms unless otherwise terminated and provided that upon the death of such executive while in the employ of the Company, their beneficiary would receive an annual death benefit for five years equal to their annual base salary at time of death.
Prior to January 1, 2016, our employment agreements with David J. LaRue and Robert G. O’Brien, effective June 10, 2011, had an initial term of three years and were automatically renewable for one-year terms unless otherwise terminated. The agreements provide for an annual base salary of at least $600,000 for David J. LaRue and at least $550,000 for Robert G. O’Brien, subject to adjustments at the discretion of the Compensation Committee. In 2015, the Compensation Committee adjusted the base salary of David J. LaRue to $675,000, effective January 1, 2015, and the base salary of Robert G. O’Brien to $566,500, effective March 1, 2015. Both David J. LaRue and Robert G. O’Brien have separate death benefit agreements providing that upon their death while in the employ of the Company, their beneficiary will receive an annual death benefit for five years equal to their annual base salary at the time of death.
Upon the effective date of our merger in connection with our planned conversion to REIT status, the employment agreements with Messrs. LaRue, O’Brien, J. Ratner and R. Ratner were superseded by new agreements effective January 1, 2016, with terms substantially similar to the prior agreements. The new agreements are discussed in greater detail in the CD&A section of this proxy statement.
61
Executive Compensation Tables (continued)
For a discussion of the terms of the awards in the following table, see the CD&A section of this proxy statement.
Grants of Plan-Based Awards
| Grant Date | All Other Stock Awards: Number of Shares of Stock or Units | All Other Option Awards: Number of Securities Underlying Options | Exercise or Base Price of Option Awards | Grant Date Fair Value of Stock and Option Awards | |||||||||||||||||
Estimated Future Payouts Under Non-Equity Incentive Plan Awards (1) | Estimated Future Payouts Under Equity Incentive Plan Awards (2) | ||||||||||||||||||||
| Name | Threshold | Target | Maximum | Threshold | Target | Maximum | |||||||||||||||
| ($) | ($) | ($) | (#) | (#) | (#) | (#) | (#) | ($/Sh) | ($) (3) | ||||||||||||
| David J. LaRue | 3/26/2015 | $ | — | $ | — | $ | — | 8,225 | 32,900 | 65,800 | — | — | $ | — | $ | 1,087,016 | |||||
| 3/26/2015 | $ | — | $ | — | $ | — | — | — | — | 32,900 | — | $ | — | $ | 809,998 | ||||||
| 3/27/2015 | $ | — | $ | — | $ | — | 20,000 | 50,000 | 150,000 | — | — | $ | — | $ | 1,581,500 | ||||||
| STIP | $ | 219,375 | $ | 877,500 | $ | 1,755,000 | — | — | — | — | — | $ | — | $ | — | ||||||
| LTIP | $ | 405,000 | $ | 810,000 | $ | 1,620,000 | — | — | — | — | — | $ | — | $ | — | ||||||
| Robert G. O'Brien | 3/26/2015 | $ | — | $ | — | $ | — | 3,834 | 15,339 | 30,678 | — | — | $ | — | $ | 506,801 | |||||
| 3/26/2015 | $ | — | $ | — | $ | — | — | — | — | 32,601 | — | $ | — | $ | 802,637 | ||||||
| 3/27/2015 | $ | — | $ | — | $ | — | 16,000 | 40,000 | 120,000 | — | — | $ | — | $ | 1,265,200 | ||||||
| STIP | $ | 141,625 | $ | 566,500 | $ | 1,133,000 | — | — | — | — | — | $ | — | $ | — | ||||||
| LTIP | $ | 188,833 | $ | 377,667 | $ | 755,333 | — | — | — | — | — | $ | — | $ | — | ||||||
| James A. Ratner | 3/26/2015 | $ | — | $ | — | $ | — | 3,384 | 13,539 | 27,078 | — | — | $ | — | $ | 447,329 | |||||
| 3/26/2015 | $ | — | $ | — | $ | — | — | — | — | 13,539 | — | $ | — | $ | 333,330 | ||||||
| 3/27/2015 | $ | — | $ | — | $ | — | 8,000 | 20,000 | 60,000 | — | — | $ | — | $ | 632,600 | ||||||
| STIP | $ | 125,000 | $ | 500,000 | $ | 1,000,000 | — | — | — | — | — | $ | — | $ | — | ||||||
| LTIP | $ | 166,667 | $ | 333,333 | $ | 666,667 | — | — | — | — | — | $ | — | $ | — | ||||||
| Ronald A. Ratner | 3/26/2015 | $ | — | $ | — | $ | — | 3,384 | 13,539 | 27,078 | — | — | $ | — | $ | 447,329 | |||||
| 3/26/2015 | $ | — | $ | — | $ | — | — | — | — | 13,539 | — | $ | — | $ | 333,330 | ||||||
| 3/27/2015 | $ | — | $ | — | $ | — | 8,000 | 20,000 | 60,000 | — | — | $ | — | $ | 632,600 | ||||||
| STIP | $ | 125,000 | $ | 500,000 | $ | 1,000,000 | — | — | — | — | — | $ | — | $ | — | ||||||
| LTIP | $ | 166,667 | $ | 333,333 | $ | 666,667 | — | — | — | — | — | $ | — | $ | — | ||||||
| Deborah Ratner Salzberg | 3/26/2015 | $ | — | $ | — | $ | — | 1,438 | 5,752 | 11,504 | — | — | $ | — | $ | 190,046 | |||||
| 3/26/2015 | $ | — | $ | — | $ | — | — | — | — | 5,752 | — | $ | — | $ | 141,614 | ||||||
| 3/27/2015 | $ | — | $ | — | $ | — | 5,600 | 14,000 | 42,000 | — | — | $ | — | $ | 442,820 | ||||||
| STIP | $ | 63,750 | $ | 340,000 | $ | 680,000 | — | — | — | — | — | $ | — | $ | — | ||||||
| LTIP | $ | 70,833 | $ | 141,667 | $ | 283,333 | — | — | — | — | — | $ | — | $ | — | ||||||
| (1) | The STIP cash award for the year ended December 31, 2015 for David J. LaRue, Robert G. O’Brien, James A. Ratner and Ronald A. Ratner was based on two equally weighted Company-wide metrics: Operating FFO per Share and Debt Yield. For Deborah Ratner Salzberg, 37.5% of her STIP award was based on Operating FFO per Share, 37.5% on Debt Yield, and 25% on performance relative to individual objectives. The threshold payment of 25% of a target dollar award for each Company-wide metric was based on achievement of 90% of the goal for that metric. The maximum award for each of the metrics is 200% of the target. |
The LTIP cash award is for the performance period from January 1, 2015 through December 31, 2017. The award will be determined by two equally weighted Company-wide metrics: Cumulative FFO per Share and Compound Annual Growth in Net Asset Value. The threshold payment of 50% of a target dollar award for each Company-wide metric is based on achievement of 90% of the goal for that metric The maximum award for each of the metrics is 200% of the target.
| (2) | The amounts shown in these columns relate to performance shares granted in 2015 for the performance period from January 1, 2015 through December 31, 2017. The performance shares were granted at target and the ultimate number of shares earned can range from 0% to 200% for the March 26, 2015 grant and 0% to 300% for the March 27, 2015 grant depending upon the degree the performance goals are met at the end of the performance period. The performance metric is TSR relative to our peers. The threshold level represents 25% of target for the March 26, 2015 grant and 40% of target for the March 27, 2015 grant. The maximum level represents 200% of target for the March 26, 2015 grant and 300% for the March 27, 2015 grant. |
| (3) | The grant-date fair value of restricted stock awards was $24.62 per share, which equaled the closing price of the Class A Common Stock on the date of grant. The grant-date fair values of the performance share grants (at target) were based on Monte Carlo simulations and were calculated to be $33.04 for the March 26, 2015 grant and $31.63 for the March 27, 2015 grant. |
62
Executive Compensation Tables (continued)
Outstanding Equity Awards at Fiscal Year-End
| Name | Grant Date | Option Awards (1) | Stock Awards | ||||||||||||
| Number of Securities Underlying Unexercised Options Exercisable as of December 31, 2015 | Number of Securities Underlying Unexercised Options Unexercisable as of December 31, 2015 | Option Exercise Price | Option Expiration Date | Number of Shares or Units of Stock That Have Not Vested | Market Value of Shares or Units of Stock That Have Not Vested | Equity Incentive Plan Awards | |||||||||
| Number of Unearned Shares, Units or Other Rights That Have Not Vested | Market or Payout Value of Unearned Shares, Units or Other Rights That Have Not Vested | ||||||||||||||
| (#) | (#) | ($) | (#) (2) | ($) (3) | (#) (4) | ($) (5) | |||||||||
| David J. LaRue | 4/4/2006 | 25,200 | — | $ | 46.37 | 4/4/2016 | — | $ | — | — | $ | — | |||
| 3/29/2007 | 25,200 | — | $ | 65.35 | 3/29/2017 | — | $ | — | — | $ | — | ||||
| 6/18/2008 | 28,059 | — | $ | 36.38 | 6/18/2018 | — | $ | — | — | $ | — | ||||
| 4/21/2009 | 14,030 | — | $ | 7.80 | 4/21/2019 | — | $ | — | — | $ | — | ||||
| 4/14/2010 | 36,035 | — | $ | 15.89 | 4/14/2020 | — | $ | — | — | $ | — | ||||
| 4/13/2011 | 64,277 | — | $ | 17.72 | 4/13/2021 | — | $ | — | — | $ | — | ||||
| 4/11/2012 | 38,972 | 38,973 | $ | 14.74 | 4/11/2022 | — | $ | — | 60,896 | $ | 1,335,449 | ||||
| 4/8/2013 | 16,407 | 49,223 | $ | 17.60 | 4/8/2023 | — | $ | — | 38,751 | $ | 848,809 | ||||
| 3/28/2014 | — | 62,090 | $ | 18.73 | 3/28/2024 | — | $ | — | 38,441 | $ | 843,011 | ||||
| 3/26/2015 | — | — | $ | — | — | 32,900 | $ | 721,497 | 65,800 | $ | 1,442,994 | ||||
| 3/27/2015 | — | — | $ | — | — | — | $ | — | 20,000 | $ | 438,600 | ||||
| Robert G. O’Brien | 4/4/2006 | 25,200 | — | $ | 46.37 | 4/4/2016 | — | $ | — | — | $ | — | |||
| 3/29/2007 | 25,200 | — | $ | 65.35 | 3/29/2017 | — | $ | — | — | $ | — | ||||
| 6/18/2008 | 28,059 | — | $ | 36.38 | 6/18/2018 | — | $ | — | — | $ | — | ||||
| 4/21/2009 | 7,011 | — | $ | 7.80 | 4/21/2019 | — | $ | — | — | $ | — | ||||
| 4/14/2010 | 26,893 | — | $ | 15.89 | 4/14/2020 | — | $ | — | — | $ | — | ||||
| 4/13/2011 | 38,547 | — | $ | 17.72 | 4/13/2021 | — | $ | — | — | $ | — | ||||
| 4/11/2012 | 19,847 | 19,847 | $ | 14.74 | 4/11/2022 | 28,833 | $ | 632,308 | 31,011 | $ | 680,071 | ||||
| 4/8/2013 | 8,355 | 25,067 | $ | 17.60 | 4/8/2023 | 36,222 | $ | 794,348 | 19,734 | $ | 432,767 | ||||
| 3/28/2014 | — | 31,620 | $ | 18.73 | 3/28/2024 | 22,690 | $ | 497,592 | 19,576 | $ | 429,302 | ||||
| 3/26/2015 | — | — | $ | — | — | 32,601 | $ | 714,940 | 30,678 | $ | 672,769 | ||||
| 3/27/2015 | — | — | $ | — | — | — | $ | — | 16,000 | $ | 350,880 | ||||
| James A. Ratner | 4/4/2006 | 25,200 | — | $ | 46.37 | 4/4/2016 | — | $ | — | — | $ | — | |||
| 3/29/2007 | 25,200 | — | $ | 65.35 | 3/29/2017 | — | $ | — | — | $ | — | ||||
| 6/18/2008 | 17,721 | — | $ | 36.38 | 6/18/2018 | — | $ | — | — | $ | — | ||||
| 4/21/2009 | 21,797 | — | $ | 7.80 | 4/21/2019 | — | $ | — | — | $ | — | ||||
| 4/14/2010 | 36,635 | — | $ | 15.89 | 4/14/2020 | — | $ | — | — | $ | — | ||||
| 4/13/2011 | 24,103 | — | $ | 17.72 | 4/13/2021 | — | $ | — | — | $ | — | ||||
| 4/11/2012 | 16,238 | 16,239 | $ | 14.74 | 4/11/2022 | — | $ | — | 25,372 | $ | 556,408 | ||||
| 4/8/2013 | 7,596 | 22,788 | $ | 17.60 | 4/8/2023 | — | $ | — | 17,940 | $ | 393,424 | ||||
| 3/28/2014 | — | 28,745 | $ | 18.73 | 3/28/2024 | — | $ | — | 17,796 | $ | 390,266 | ||||
| 3/26/2015 | — | — | $ | — | — | 13,539 | $ | 296,910 | 27,078 | $ | 593,821 | ||||
| 3/27/2015 | — | — | $ | — | — | — | $ | — | 8,000 | $ | 175,440 | ||||
| Ronald A. Ratner | 4/4/2006 | 25,200 | — | $ | 46.37 | 4/4/2016 | — | $ | — | — | $ | — | |||
| 3/29/2007 | 25,200 | — | $ | 65.35 | 3/29/2017 | — | $ | — | — | $ | — | ||||
| 6/18/2008 | 17,721 | — | $ | 36.38 | 6/18/2018 | — | $ | — | — | $ | — | ||||
| 4/21/2009 | 21,797 | — | $ | 7.80 | 4/21/2019 | — | $ | — | — | $ | — | ||||
| 4/14/2010 | 36,635 | — | $ | 15.89 | 4/14/2020 | — | $ | — | — | $ | — | ||||
| 4/13/2011 | 24,103 | — | $ | 17.72 | 4/13/2021 | — | $ | — | — | $ | — | ||||
| 4/11/2012 | 16,238 | 16,239 | $ | 14.74 | 4/11/2022 | — | $ | — | 25,372 | $ | 556,408 | ||||
| 4/8/2013 | 7,596 | 22,788 | $ | 17.60 | 4/8/2023 | — | $ | — | 17,940 | $ | 393,424 | ||||
| 3/28/2014 | — | 28,745 | $ | 18.73 | 3/28/2024 | — | $ | — | 17,796 | $ | 390,266 | ||||
| 3/26/2015 | — | — | $ | — | — | 13,539 | $ | 296,910 | 27,078 | $ | 593,821 | ||||
| 3/27/2015 | — | — | $ | — | — | — | $ | — | 8,000 | $ | 175,440 | ||||
| Deborah Ratner Salzberg | 4/4/2006 | 15,000 | — | $ | 46.37 | 4/4/2016 | — | $ | — | — | $ | — | |||
| 3/29/2007 | 15,000 | — | $ | 65.35 | 3/29/2017 | — | $ | — | — | $ | — | ||||
| 6/18/2008 | 9,599 | — | $ | 36.38 | 6/18/2018 | — | $ | — | — | $ | — | ||||
| 4/21/2009 | 4,800 | — | $ | 7.80 | 4/21/2019 | — | $ | — | — | $ | — | ||||
| 4/14/2010 | 8,002 | — | $ | 15.89 | 4/14/2020 | — | $ | — | — | $ | — | ||||
| 4/13/2011 | 9,146 | — | $ | 17.72 | 4/13/2021 | — | $ | — | — | $ | — | ||||
| 4/11/2012 | — | — | $ | — | — | 3,977 | $ | 87,216 | 9,916 | $ | 217,458 | ||||
| 4/8/2013 | — | — | $ | — | — | 5,150 | $ | 112,940 | 6,504 | $ | 142,633 | ||||
| 3/28/2014 | — | — | $ | — | — | 6,629 | $ | 145,374 | 6,629 | $ | 145,374 | ||||
| 3/26/2015 | — | — | $ | — | — | 5,752 | $ | 126,141 | 11,504 | $ | 252,283 | ||||
| 3/27/2015 | — | — | $ | — | — | — | $ | — | 5,600 | $ | 122,808 | ||||
63
Executive Compensation Tables (continued)
| (1) | All the option awards vest 25% at the second anniversary, 25% at the third anniversary and 50% at the fourth anniversary of the grant date. |
| (2) | The shares in this column represent restricted stock awards. For grants prior to 2015, shares vest 25% at the second anniversary, 25% at the third anniversary and 50% at the fourth anniversary of the grant date. For the 2015 grant, shares vest 25% at the first anniversary, 25% at the second anniversary and 50% at the third anniversary of the grant date. |
| (3) | The market value of shares in this column is based on the closing price of our Class A Common Stock of $21.93 on December 31, 2015. |
| (4) | The shares in this column represent the underlying shares of Class A Common Stock issuable upon the payout of performance shares. The 2012 grant vested in February 2016 and is presented here at its actual payout of 124.67% of target. The 2013 and 2014 grants assume a payout at 100% of target. The March 26, 2015 grant assumes a payout at maximum (at 200% of target) and the March 27, 2015 grant assumes a payout at threshold (at 40% of target). The performance shares granted on April 11, 2012 have a performance period from February 1, 2012 through December 31, 2015, the performance shares granted on April 8, 2013 have a performance period from February 1, 2013 through December 31, 2016, the performance shares granted on March 28, 2014 have a performance period from January 1, 2014 through December 31, 2017, and the performance shares granted on March 26 and 27, 2015 have a performance period from January 1, 2015 through December 31, 2017. The vesting and actual payout of the performance shares will be determined after the end of the respective performance periods. |
| (5) | This column reports the product of the number of unearned performance shares multiplied by the closing market price of our Class A Common Stock of $21.93 on the December 31, 2015. |
Option Exercises and Stock Vested
For the year ended December 31, 2015
| Option Awards | Stock Awards | |||||||
| Name | Number of Shares Acquired on Exercise | Value Realized on Exercise | Number of Shares Acquired on Vesting | Value Realized on Vesting | ||||
| (#) | ($) | (#) | ($) (1) | |||||
| David J. LaRue | — | $ | — | 34,989 | $ | 880,323 | ||
| Robert G. O’Brien | 21,804 | $ | 165,289 | 59,362 | $ | 1,501,398 | ||
| James A. Ratner | — | $ | — | 2,540 | $ | 63,906 | ||
| Ronald A. Ratner | — | $ | — | 2,540 | $ | 63,906 | ||
| Deborah Ratner Salzberg | — | $ | — | 6,596 | $ | 167,052 | ||
| (1) | The value realized on vesting represents the product of the number of shares vested and the closing price of the Class A Common Stock on the vesting date. |
Nonqualified Deferred Compensation
For the year ended December 31, 2015
| Name | Executive Contributions in Last FY | Registrant Contributions in Last FY | Aggregate Earnings in Last FY | Aggregate Withdrawals/ Distributions | Aggregate Balance at Last FYE | ||||||||||
($) (1) | ($) (2) | ($) (3) | ($) | ($) (4) | |||||||||||
| David J. LaRue | $ | — | $ | — | $ | 34,605 | $ | — | $ | 801,203 | |||||
| Robert G. O’Brien | $ | — | $ | — | $ | 31,429 | $ | — | $ | 727,874 | |||||
| James A. Ratner | $ | — | $ | — | $ | 38,228 | $ | — | $ | 889,095 | |||||
| Ronald A. Ratner | $ | — | $ | — | $ | 77,117 | $ | — | $ | 1,787,135 | |||||
| Deborah Ratner Salzberg | $ | — | $ | — | $ | 5,744 | $ | — | $ | 133,106 | |||||
| (1) | The NEOs may defer a portion of their annual salary, bonus or short-term incentive compensation, up to a maximum of $100,000 per year, under our elective deferred compensation plan for executives. Amounts deferred under this plan earn interest at a rate equal to the average of the Moody’s Long-Term Corporate Bond Yields for Aaa, Aa and A, plus 0.5% (“Moody’s Rates”). The rate is updated every calendar quarter using the first published Moody’s rates of the new quarter. Interest rates ranged from 4.08% to 4.89% during the year ended December 31, 2015. Interest is credited to the executives’ accounts biweekly and compounded quarterly. The cumulative deferrals and earnings thereon will be paid to the NEOs in accordance with the elections they made defining the time of payment and form of payment. |
| (2) | The NEOs participate in the Unfunded Nonqualified Supplemental Retirement Plan for a select group of executives and other members of management. The plan provides for the accrual of a discretionary contribution by us to the executive’s account plus interest on the account balance. The Company suspended the discretionary contributions in 2008, and there have been no contributions since that time. Interest is credited as of the end of the fiscal year and is computed on the beginning-of-year account balance at a rate equal to the average of the quarterly Moody’s Rates used in our elective deferred compensation plan for executives (see note 1). The interest rate used for the year ended December 31, 2015 was 4.47%. Participants in the plan become 50% vested in the accumulated benefits after 10 years of service and then 10% after each of the next five years of service until becoming 100% vested after 15 years of service. All of the NEOs are participants and are 100% vested. Benefits are payable in installments over a 10-year period upon the later of the date of termination or the attainment of age 60. |
64
Executive Compensation Tables (continued)
| (3) | The amount of earnings reported in this column that are deemed to be above-market earnings are reported in the Summary Compensation Table, and are as follows: David J. LaRue - $10,710; Robert G. O’Brien - $9,725; James A. Ratner - $11,777; Ronald A. Ratner - $23,846; and Deborah Ratner Salzberg - $1,777. |
| (4) | Prior years’ accumulation of executive contributions and our contributions included in this column have been reported in prior years’ Summary Compensation Tables to the extent these NEOs were required to be disclosed. Accumulated earnings from prior years included in this column have not been reported in prior years’ Summary Compensation Tables, except for above-market earnings. |
Equity Compensation Plan Information
The information presented in the following table is as of December 31, 2015.
| Plan category | Number of securities to be issued upon exercise of outstanding options, warrants and rights | Weighted-average exercise price of outstanding options, warrants and rights | Number of securities remaining available for future issuance under equity compensation plans (excluding securities reflected in the first column) | ||
Equity compensation plan approved by security holders (1) | 3,308,259 | $34.26 | 5,579,656 | ||
Equity compensation plan not approved by security holders (2) | 14,962 | — | — | ||
| Total | 3,323,221 | 5,579,656 | |||
| (1) | Our Stock Plan was approved by the shareholders in 1994 and was last amended and restated by shareholder approval on June 13, 2013 and further amended on December 17, 2013 and assumed by Forest City Realty Trust, Inc., effective January 1, 2016. The Compensation Committee of the Board of Directors administers the plan. Under the plan, we may award Class A stock options, restricted shares/units and performance shares to our employees and nonemployee directors. The maximum number of shares that may be awarded under the plan is 21,750,000. The maximum award to an individual during any calendar year is 500,000 stock options, 500,000 of the aggregate performance-based restricted shares and performance shares. Also, the aggregate grant-date fair value of awards granted to a nonemployee director during any calendar year is limited to $250,000. Anti-dilution provisions in the plan adjust the share maximums, outstanding awarded options and related exercise prices for stock splits or stock dividends. Each option grant has a maximum term of 10 years. The Compensation Committee determines vesting schedules for each award. |
| (2) | This represents phantom shares of Class A Common Stock accumulated by our nonemployee directors under their deferred compensation plan. Their plan is described in the “Director Compensation” section of this proxy statement. |
65
Proposal 2 - Approval (on an advisory, non-binding basis) of the compensation of the Company’s Named Executive Officers
As required by Section 14A of the Securities and Exchange Act of 1934 and the Dodd-Frank Wall Street Reform and Consumer Protection Act, we are providing our shareholders with an opportunity to vote to approve, on an advisory, non-binding basis, the compensation of our NEOs as disclosed in this proxy statement in accordance with the compensation disclosure rules of the SEC.
As described in detail under the heading “Compensation Discussion & Analysis” (“CD&A”), we seek to closely align the interests of our NEOs with the interests of our shareholders. Our compensation programs are designed to reward our NEOs for the achievement of short-term and long-term strategic and operational goals that lead to long-term value creation, while at the same time avoiding the encouragement of unnecessary or excessive risk-taking. Please read the CD&A in this proxy statement for additional and more detailed descriptions of our executive compensation programs.
During 2015, the Compensation Committee’s independent compensation advisor, Pearl Meyer, reviewed the existing executive compensation program and reaffirmed that the program is fundamentally sound, reinforces key business objectives, and provides for competitive pay opportunities that are aligned with short-term and strategic objectives in support of long-term value creation.
This is evidenced by the following policies and practices listed below.
| • | Our Company has adopted additional measures to further strengthen our governance practices: |
| • | Our Stock Plan prohibits all repricing of options and cash repurchases of underwater options without prior shareholder approval. |
| • | Our Board of Directors approved our Securities Hedging and Pledging Policy, which has been in place since mid-2013. Further information is included under the “Additional Executive Compensation Policies” portion of the CD&A section of this proxy. |
| • | Approximately 20 key executives are subject to stock ownership guidelines and added stock holding requirements as outlined under the “Additional Executive Compensation Policies” portion of the CD&A section of this proxy. This includes our President & CEO, David J. LaRue, whose requirements were recently increased to a share equivalent of six times his base salary. |
| • | We have maintained a clawback policy for compensation paid to certain executive officers since 2011, including our NEOs. Additional information is included under the “Additional Executive Compensation Policies” portion of the CD&A section of this proxy. |
| • | The majority of the total direct compensation opportunity for our key executives including our NEOs continues to be variable “at risk” pay. Over 60% of our CEO David J. LaRue’s target total direct compensation opportunity is comprised of “at risk” pay. Over 60% is tied to long-term incentives and equity. Similarly, Robert G. O’Brien, James A. Ratner and Ronald A. Ratner each have a total direct compensation opportunity in which 58% is represented by “at risk” pay. At least half of their target total direct compensation opportunity is based on long-term incentives and equity. Approximately half of Deborah Ratner Salzberg’s total direct compensation opportunity consists of “at risk” pay, commensurate with her role as Executive Vice President and President of Forest City Washington, LLC. |
| • | Performance share grants are provided to our NEOs in support of greater pay alignment with shareholder interests. Performance share grants will vest based on a relative total shareholder return metric (defined as change in stock price plus dividends paid) comparing the returns of our Class A Common Stock to that of all companies in the NAREIT All Equity REIT Index. In support of creating meaningful and challenging goals, the Compensation Committee approved a requirement whereby a target level of performance shares will vest only if our TSR ranks in the 60th percentile relative to companies in the NAREIT Index for a multi-year performance period coinciding with our strategic planning cycles. |
| • | During 2015, the Compensation Committee approved equity grants to our NEOs and other senior executives and managers who participate in our LTIP. These grants were made in connection with a value-based percentage of pay formula approach that had been developed by Pearl Meyer, the Compensation Committee’s independent advisor. The number of shares granted to NEOs and other senior executives and managers who participate in the LTIP, and our outside Directors, represented a run rate (defined as total shares issued divided by total shares of common stock outstanding) of approximately 0.75%. This run rate was within acceptable parameters for our industry as determined by benchmark data and shareholder advisory firms. |
66
| • | In early 2016, as well as in prior years, our Audit and Compensation Committees collectively reviewed the results of a risk analysis prepared by our management and which was separately reviewed by the Compensation Committee’s independent compensation advisor, and concluded that our compensation programs and policies do not create inappropriate risks that are likely to have a material adverse effect on the Company. In arriving at this conclusion the Audit and Compensation Committees considered a number of risk factors as well as mitigation strategies that have been implemented, including compensation clawback provisions and the use of stock ownership requirements. The risk analysis is discussed in greater detail in the CD&A. |
The vote on this resolution is not intended to address any specific element of compensation; rather, the vote relates to the compensation of our NEOs, as described in this proxy statement in accordance with the compensation disclosure rules of the SEC. The vote is advisory, which means that the vote is not binding on the Company, our Board of Directors or the Compensation Committee. To the extent there is any significant vote against our NEOs’ compensation as disclosed in this proxy statement, the Compensation Committee will evaluate whether any actions are necessary to address the concerns of shareholders.
As announced in our Current Report on Form 8-K filed with the SEC on June 14, 2011 and consistent with the shareholders’ vote on the matter, the Board of Directors determined to hold an advisory vote to approve the compensation of our NEOs every year until the next vote on the frequency of such advisory vote, which is expected to occur at our 2017 annual meeting of shareholders.
The affirmative vote of a majority of all of the votes cast at the Annual Meeting is required for approval of this Proposal 2.
Accordingly, we ask our shareholders to vote on the following resolution at the Annual Meeting:
“RESOLVED, that the Company’s shareholders approve, on an advisory, non-binding basis, the compensation of the Company’s NEOs, as disclosed in the Company’s Proxy Statement for the 2016 Annual Meeting of Shareholders pursuant to the compensation disclosure rules of the Securities and Exchange Commission, including the Compensation Discussion and Analysis, the 2015 Summary Compensation Table and the other related tables and disclosures.”
THE BOARD OF DIRECTORS UNANIMOUSLY RECOMMENDS A VOTE FOR THE APPROVAL (ON AN ADVISORY, NON-BINDING BASIS) OF THE COMPENSATION OF OUR NEOs, AS DISCLOSED IN THIS PROXY STATEMENT.
67
Certain Relationships and Related Transactions
We require each of our directors and executive officers to complete a questionnaire on an annual basis, which includes questions regarding related person transactions. In addition, we have a formal policy with respect to related person transactions that requires the Corporate Governance and Nominating Committee to review and approve any transaction greater than $120,000 in which we were or will be a participant and in which a related person had or will have a direct or indirect material interest. Related persons include any of our executive officers, directors or nominees for director and their immediate family members, any shareholder owning in excess of 5% of our Common Stock or an entity in which any of the foregoing has a substantial ownership interest. In reviewing and approving a related person transaction, the Corporate Governance and Nominating Committee considers, among other things, if the transaction is on terms comparable to those that could be obtained in arm’s length dealings with an unrelated third party. All related person transactions are disclosed to the Corporate Governance and Nominating Committee.
The Compensation Committee, comprised solely of independent directors and which uses the advice of outside counsel and compensation consultants, annually reviews the salaries and incentives paid to the executive officers disclosed under the section entitled “Family Relationships” below.
The transactions with Bruce C. Ratner and his affiliates set forth below were contemplated as part of the restructuring of the ownership interests held by Bruce C. Ratner and the conditions under which such transactions would take place were provided for in a master contribution and sale agreement (the “Master Contribution and Sale Agreement”). Because of the importance and nature of the Master Contribution and Sale Agreement, the transaction was specifically reviewed and approved during the year ended January 31, 2007 by a special committee of the Board comprised solely of independent directors.
Transactions with RMS Investment Corp.: During 2014, we entered into an agreement with RMS Investment Corp. (“RMSIC”) and Van Aken Shopping Center, Ltd (“VASC”), an affiliate of RMSIC, to provide various real estate services to RMSIC and VASC for the planning and redevelopment of a shopping center located in Shaker Heights, Ohio. Pursuant to the agreement, RMSIC and VASC reimburse us at fair market rates for the real estate services provided. To date, we have provided services under the agreement in the amount of $101,931 and we anticipate that the aggregate value of our services will exceed $120,000.
During 2014 and 2015, RMSIC executed lease extensions for office space at Terminal Tower, an office building in Cleveland, Ohio, for one-year terms commencing January 1, 2015 and January 1, 2016, respectively. The renewal rate for both leases was $11,193 per month. RMSIC is controlled by the four children of Charles A. Ratner, the Chairman of our Board; the two children of James Ratner, our Executive Vice President - Development; the two children of Ronald Ratner, our Executive Vice President - Development and Director; Deborah Ratner Salzberg, our Executive Vice President and Director; Brian J. Ratner, our Executive Vice President and Director; the four children of Ruth Miller, the deceased sister of Albert B. Ratner, a Co-Chairman Emeritus of our Board; and Samuel H. Miller, a Co-Chairman Emeritus of our Board, as trustee. The lease rates and terms are consistent with the lease rates, terms and promotions available to the general public in effect at the time the lease extensions were entered into. The aggregate amount of lease payments due from RMSIC to the Company on or after the beginning of the Company’s 2015 fiscal year is approximately $268,632.
Family Relationships: Brian J. Ratner, our Executive Vice President and Director, is the son of Albert B. Ratner, who serves as a Co-Chairman Emeritus of our Board, and brother of Deborah Ratner Salzberg, our Executive Vice President and Director. During the year ended December 31, 2015, Brian Ratner earned a salary of $450,000, an annual incentive (STIP) of $257,966 and a long term incentive (LTIP) of $75,000. Mr. Ratner is also eligible for equity awards on the same basis as other senior management.
James LaRue, brother of David J. LaRue, our President, CEO and Director, is employed as Director - Asset Management Property Oversight of Forest City Commercial Management, LLC, one of our subsidiaries. Kevin L. Ratner and Jonathan Ratner, sons of Charles A. Ratner, are employed, respectively, as President of Forest City Residential West, LLC, one of our subsidiaries, and as Senior Vice President - Residential Asset Management. None of these individuals are executive officers of the Company. The compensation, perquisites and benefits provided to these three individuals were substantially comparable to those provided to other employees with similar qualifications, responsibilities and experience. During the year ended December 31, 2015, each of James LaRue, Kevin L. Ratner and Jonathan Ratner earned compensation, including perquisites and benefits, paid by the Company in excess of $120,000, but none earned as much as the lowest compensated NEO as disclosed in the “Summary Compensation Table” section of this proxy statement.
Employment Agreements: In addition to the employment agreements with certain NEOs as disclosed in the narrative section to the Summary Compensation Table elsewhere in this proxy statement, we have entered into employment agreements with Charles A. Ratner, our Chairman of the Board, Albert B. Ratner, our Co-Chairman Emeritus, Samuel H. Miller, our Co-Chairman Emeritus, and Bruce C. Ratner, our Executive Vice President and Director.
68
The employment agreements with Charles A. Ratner, Albert B. Ratner and Samuel H. Miller provide for annual salaries of $400,000, $425,000 and $375,000, respectively, and that upon death while such individual is actively employed with the Company, his beneficiary(ies) will receive annual death benefits of $500,000, $475,000 and $425,000, respectively, for five years. The employment agreements are renewable annually. Although Messrs. C. Ratner, A. Ratner and Miller do not participate in a formal bonus plan, an annual bonus may be awarded on a discretionary basis as reviewed by the Compensation Committee. During the year ended December 31, 2015, Messrs. A. Ratner and Miller did not receive any cash bonuses or equity-based awards. On February 18, 2015, the Compensation Committee of the Board approved a one-time, discretionary cash bonus of $400,000 to Charles A. Ratner. Each of the foregoing individuals is also eligible for benefits and perquisites on the same basis as other senior management.
The employment agreement with Bruce C. Ratner provides for an annual salary of $450,000. The employment agreement is renewable annually. Mr. Ratner is eligible to receive a bonus and equity-based awards, as well as benefits and perquisites commensurate with other senior management executives. During the year ended December 31, 2015, Mr. Ratner did not receive a cash bonus or any equity-based awards.
Non-Compete Arrangement: Pursuant to his employment agreement, Bruce C. Ratner agreed that during his employment with us, and for a two-year period following thereafter, he will not engage in any activity that competes with our business. If we terminate Mr. Ratner’s employment without cause, the two-year period will be reduced to one year. Mr. Ratner also agreed that he will not directly or indirectly induce any of our employees, or any of our affiliates, to terminate their employment or other relationships with us and will not employ or offer employment to any person who was employed by us or our subsidiaries unless such person has ceased to be employed by us or our affiliates for a period of at least one year. Mr. Ratner owns, and will continue to own, a certain property that was not transferred to us. This property may be managed, developed, expanded, operated and sold independently of our business. Should Mr. Ratner sell the property, he may purchase additional property, to effectuate a Section 1031 tax deferred exchange under the Internal Revenue Code, with the prior approval of the Audit Committee. Except for this property or any potential purchase of property to effect a tax-deferred transaction or any transaction approved by the Audit Committee, Mr. Ratner will engage in all business activities of the type conducted by us only through and on behalf of us, as long as he is employed by us.
Transactions With Bruce C. Ratner and His Affiliates: During the fiscal year ended January 31, 2007, we entered into the Master Contribution and Sale Agreement with Bruce C. Ratner pursuant to which the parties agreed to restructure their ownership interests in a total of 30 retail, office and residential operating properties and certain service companies that were owned jointly by us and Mr. Ratner. Pursuant to the Master Contribution and Sale Agreement, Mr. Ratner, certain entities and individuals affiliated with him, including members of his family and/or trusts for the benefit of such family members (“BCR Entities”), and certain entities affiliated with Forest City (“FCE Entities”) either contributed their interests in these operating properties and service companies to Forest City Master Associates III, LLC (“Master III”), a limited liability company that is owned jointly by the FCE Entities and the BCR Entities but is controlled by us, or in some cases, the BCR Entities transferred their interests for cash consideration.
In connection with the Master Contribution and Sale Agreement, the parties and their respective affiliates also entered into several additional related agreements, including a Registration Rights Agreement, a Tax Protection Agreement and the Master III Operating Agreement. Under the Master III Operating Agreement, we issued Mr. Ratner and the BCR Entities 3,894,232 Class A Common Units (“Units”) in Master III. Certain of the BCR Entities exchanged 247,477 of the Units for cash and shares of our Class A Common Stock in July 2008, 673,565 of the Units for shares of our Class A Common Stock in June 2014 and 1,032,402 of the Units for shares of our Class A Common Stock in September 2015. During the year ended December 31, 2015, the BCR Entities received no preferred payments or dividends on the remaining Units.
Under the terms of the Master Contribution and Sale Agreement we agreed with Mr. Ratner and the BCR Entities to a method for valuing and possibly restructuring certain properties that were under development. Each of the development projects shall remain owned jointly until the individual development project has been completed and achieves “stabilization.” When a development project achieves “stabilization,” it will be valued, either by negotiation, through arbitration or by obtaining a bona fide third-party offer. Once each project’s value has been determined, we may, in our discretion, cause that project to be contributed to Master III in exchange for additional Units, sold to Master III for cash, sold to the third party or remain jointly owned by us and Mr. Ratner.
During 2008, two of the development properties, New York Times, an office building located in Manhattan, New York, and Twelve MetroTech Center, an office building located in Brooklyn, New York, achieved stabilization, and, in accordance with the terms of the Master Contribution and Sale Agreement, we caused the respective FCE Entities to acquire the interest of the BCR Entities in those two properties for cash. Under the terms of the redemption agreements, the applicable BCR Entities assigned their interests in the two projects to the respective FCE Entities and will receive approximately $121,000,000 over a 15-year period. During the year ended December 31, 2015, no redemption distribution installment payments were paid.
Under the Master Contribution and Sale Agreement, certain of the FCE Entities agreed to indemnify Mr. Ratner and various BCR Entities against taxes payable in connection with a disposition of Quartermaster Plaza, a specialty retail center in Philadelphia,
69
Pennsylvania. As a result of the March 2014 sale of the property, the Company has made tax indemnity payments in the aggregate amount of $1,645,517, of which $1,235,000 was paid as of December 31, 2014, with the balance paid during the year ended December 31, 2015. Of the aggregate amount paid, Mr. Ratner received $32,746 and certain members of Mr. Ratner’s family and/or trusts for the benefit of such family members received $1,612,771.
During the year ended December 31, 2014, in accordance with the Master Contribution and Sale Agreement, we accrued an $11,000,000 development fee payable to Mr. Ratner related to Westchester’s Ridge Hill, a regional mall in Yonkers, New York, as certain milestones had been reached in the development and operation of the property. In January 2016, we paid the $11,000,000 development fee to Mr. Ratner. In December 2015, we caused certain of our affiliates to acquire the BCR Entities’ interests in Westchester’s Ridge Hill, for $10.
In January 2016, we closed on the sale of 625 Fulton Avenue, a development site in Brooklyn, New York. Pursuant to the terms of the Master Contribution and Sale Agreement, we are required to make a $6,238,000 tax indemnity payment to the BCR Entities, of which amount Mr. Ratner will receive $124,760. The payment, which will be accrued during the three months ending March 31, 2016, is expected to be paid in four quarterly installments commencing in April 2016, with the last installment due in January 2017.
One remaining development property, the air rights for any future residential vertical development at East River Plaza, continued to be owned or otherwise pursued jointly by the relevant FCE Entities and BCR Entities. The operating agreement related to such property generally requires the FCE Entities to provide all equity contributions for the property on behalf of the FCE Entities and BCR Entities and entitles the FCE Entities to a preferred return on the outstanding balance of such advances made on behalf of the BCR entities prior to the BCR Entities sharing in cash distributions.
Apartment Leases: Bruce C. Ratner has leased two apartments at 8 Spruce Street. The first lease commenced March 15, 2012 and, following a two-year renewal term that commenced on April 1, 2013 at a rate of $13,312 per month, was renewed for an additional one-year term commencing on April 1, 2015 at a rate of $13,445 per month. On May 31, 2015, the first lease was surrendered. The second lease commenced May 15, 2013 and was renewed for an additional two-year term that commenced on April 1, 2014 at a rate of $7,219 per month with an option to renew. The second lease is not expected to be renewed by Mr. Ratner. The lease rates and terms are consistent with the lease rates and terms available to the general public in effect at the time the leases and renewals were entered into. The aggregate amount of lease payments due and expected to be due from Mr. Ratner to the Company since the beginning of the Company’s 2015 fiscal year is $175,111.
Transactions with BrownFlynn, Ltd: During 2012, we engaged BrownFlynn, Ltd (“BrownFlynn”) for various services relating to our corporate social responsibility activities, communications and reporting. We engaged BrownFlynn for additional services in March 2014. In February 2015, we entered into a new agreement with BrownFlynn for the continuation of certain services included in the 2014 engagement, as well as additional services. Barbara Brown, sister of Robert G. O’Brien, our Executive Vice President and Chief Financial Officer, is a principal and co-owner of BrownFlynn. The aggregate amount due and expected to be due to BrownFlynn since the beginning of the Company’s 2015 fiscal year is approximately $249,000.
During 2013, BrownFlynn executed a lease agreement for office space at Terminal Tower. The lease commenced on May 30, 2014 for a term of 126 calendar months at an initial rate of $8,511 per month with two options to renew for five-year terms. During the initial term, the rate will increase approximately 2% after each 12-month period to a maximum rate of $10,374 per month. The lease rates and terms are consistent with the lease rates and terms available to the general public in effect at the time the lease was entered into. The aggregate amount of lease payments due from BrownFlynn to the Company on or after the beginning of the Company’s 2015 fiscal year is approximately $1,120,993.
70
Proposal 3 - Ratification of the Appointment of PricewaterhouseCoopers, LLP as Independent Registered Public Accounting Firm for the year ending December 31, 2016
The Audit Committee is directly responsible for the appointment, compensation (including approval of the audit fee), retention and oversight of the independent registered public accounting firm retained to audit our financial statements. The Audit Committee appointed PricewaterhouseCoopers LLP (“PWC”) as the independent registered public accounting firm for Forest City for the year ending December 31, 2016. PWC has served as the Company’s independent auditor since 1989.
Although shareholder approval of this appointment is not required by our Bylaws or otherwise, the Board is submitting this proposal as a matter of good corporate governance. The Board believes shareholders should have the opportunity to express their views on the selection of our independent auditor. If the appointment is not ratified, the Audit Committee will consider the voting results in determining whether or not to retain PWC. Even if the appointment is ratified, the Audit Committee, in its sole discretion, may change the appointment at any time during the year, if it determines that such a change is in the best interest of the Company and its shareholders.
In connection with appointing PWC, the Audit Committee annually reviews their independence and performance in deciding whether to retain PWC. During this review, the Audit Committee considers, among others, the following factors:
| • | PWC’s qualifications, reputation for integrity and competence in the areas of accounting and auditing and the real estate industry; |
| • | PWC’s independence and objectivity; |
| • | PWC’s familiarity of our business and financial affairs; |
| • | the appropriateness of PWC’s fees for audit and non-audit services, both on an absolute basis and as compared to peer firms; |
| • | PWC’s tenure as the Company’s independent registered accounting firm; |
| • | data related to audit quality and performance, including PWC’s recent Public Company Accounting Oversight Board inspection reports; |
| • | PWC’s historical and recent performance of our integrated audit; and |
| • | the results of a report from PWC describing all relationships between the independent auditor and the Company. |
In connection with the Audit Committee’s oversight role of the independent auditor, the Audit Committee also:
| • | meets independently, at least quarterly, with PWC, senior management and internal audit personnel; |
| • | interviews and approves the lead engagement partner with each rotation; and |
| • | reviews and approves the scope and related fees of non-audit services, paying particular attention to the impact of PWC’s independence. |
The Audit Committee believes the continued retention of PWC to serve as our independent auditor is in the best interest of the Company and its shareholders.
PWC has indicated that a representative will attend the Annual Meeting to respond to appropriate questions from shareholders. Their representative will also have the opportunity to make a statement at the meeting.
The affirmative vote of a majority of all of the votes cast at the Annual Meeting is required for the ratification of PricewaterhouseCoopers LLP as our independent registered public accounting firm for the year ending December 31, 2016. Abstentions will not be counted as votes cast and, as a result, will have no effect on the result of the vote for this proposal.
THE BOARD OF DIRECTORS UNANIMOUSLY RECOMMENDS THAT OUR SHAREHOLDERS VOTE FOR THE RATIFICATION OF THE APPOINTMENT OF PRICEWATERHOUSECOOPERS LLP AS OUR INDEPENDENT REGISTERED PUBLIC ACCOUNTING FIRM.
71
Audit Committee Report
The Audit Committee (the “Audit Committee”) of the Board of Directors (the “Board”) of Forest City Realty Trust, Inc., a Maryland corporation (the “Company”), assists the Board in fulfilling its responsibility for oversight of the accounting, financial reporting, data processing, regulatory and internal control environments and the appointment, oversight and approval of the compensation of the Company’s independent registered accounting firm. Management has the primary responsibility for establishing and maintaining adequate internal financial controls, for preparing the financial statements and for the public financial reporting process. The Company’s independent registered public accounting firm is responsible for expressing opinions on the conformity of the Company’s audited financial statements with generally accepted accounting principles and on the effectiveness of the Company’s internal control over financial reporting.
The Audit Committee meets at least quarterly, to review all financial information prior to its release and inclusion in the Company’s public filings. The Audit Committee meets independently with management, internal audit and the independent registered public accounting firm at least quarterly, or on a more frequent basis if requested by any of the applicable parties.
The Audit Committee has received and reviewed the written disclosures and letter of independence from PricewaterhouseCoopers LLP, as required by the Public Company Accounting Oversight Board and has discussed with PricewaterhouseCoopers LLP their independence. The Audit Committee has also considered whether the non-audit services provided by PricewaterhouseCoopers LLP are compliant with maintaining their independence.
The Audit Committee has discussed with PricewaterhouseCoopers LLP their judgments as to the quality, not just the acceptability, of the Company’s accounting principles and underlying estimates in its financial statements, and the matters required to be discussed by the Auditing Standards No. 16, “Communication with Audit Committees”.
The Audit Committee has reviewed and discussed our audited financial statements as of and for the year ended December 31, 2015, management’s report on the design and effectiveness of our internal controls over financial reporting as of December 31, 2015, and PricewaterhouseCoopers LLP’s audit of internal control over financial reporting with management and the independent registered public accounting firm.
Based on the review and discussions described in this report, and subject to the limitations on the role and responsibilities of the Audit Committee referred to above and in the Audit Committee Charter, the Audit Committee recommended to the Board that the audited financial statements and management’s report on the design and effectiveness of internal controls over financial reporting be included in the Company’s Annual Report on Form 10-K for the year ended December 31, 2015, for filing with the Securities and Exchange Commission.
The Audit Committee reviews and reassesses the adequacy of its charter on an annual basis. All members of the Audit Committee are independent directors and meet the independence requirements for audit committees under the New York Stock Exchange Rules and the Securities Exchange Act of 1934.
| Michael P. Esposito, Jr. (Chairman) | Arthur F. Anton | Kenneth J. Bacon | Stan Ross |
The foregoing Audit Committee Report shall not be deemed incorporated by reference by any general statement incorporating by reference this proxy statement into any filing under the Securities Act of 1933 or under the Securities Exchange Act of 1934, except to the extent that we specifically incorporate the information by reference, and shall not otherwise be deemed filed under such Acts.
72
Independent Registered Public Accounting Firm Fees and Services
The Audit Committee of the Board of Directors considers and pre-approves any audit, non-audit and tax services to be performed by our independent registered public accounting firm. The Audit Committee has considered whether the non-audit services are compatible with maintaining the independence of the independent registered public accounting firm.
The aggregate fees billed (or expected to be billed) to us for professional services rendered by PricewaterhouseCoopers LLP, all of which have been approved by the Audit Committee, for the years ended December 31, 2015 and 2014, are as follows:
| Years Ended | ||||||
| December 31, 2015 | December 31, 2014 | |||||
| Audit fees | $ | 4,678,000 | $ | 4,447,975 | ||
| Audit-related fees | 937,845 | 605,966 | ||||
| Tax fees | 2,280,034 | 457,540 | ||||
| All other fees | 7,096 | 6,696 | ||||
| Total | $ | 7,902,975 | $ | 5,518,177 | ||
Audit fees: Professional services relating to audits of our annual consolidated financial statements and internal controls over financial reporting, reviews of our quarterly SEC filings, issuance of comfort letters, consents and income tax provision procedures.
Audit-related fees: Audit and other assurance services relating to individual real estate properties that are required primarily under mortgage or partnership agreements and accounting related REIT conversion services (2015 - $344,845). There were no fees for services relating to financial information design and implementation.
Tax fees: Professional services relating primarily to tax compliance, consulting fees and tax related REIT conversion services (2015 - $2,170,211).
All other fees: Other fees include annual subscriptions to accounting research tools.
Section 16(a) Beneficial Ownership Reporting Compliance
Section 16(a) of the Securities Exchange Act of 1934 requires our directors, executive officers, and beneficial owners of more than 10% of a registered class of our equity securities to file with the SEC and the NYSE initial reports of beneficial ownership and reports of changes in ownership of common shares and other equity securities of ours. Executive officers, directors and owners of more than 10% of the common shares are required by SEC regulations to furnish us with copies of all forms they file pursuant to Section 16(a).
To our knowledge, based solely on review of the copies of such reports furnished to us and written representations that no other reports were required during the year ended December 31, 2015, all Section 16(a) filing requirements applicable to our executive officers, directors and greater than 10% beneficial owners were complied with, with the exception of one late Form 4 report by each of Deborah Harmon, our Director, Robert G. O’Brien, our Executive Vice President and Chief Financial Officer, and Andrew Passen, our former Executive Vice President of Human Resources. Ms. Harmon’s untimely Form 4 resulted from a late communication of a share withholding from the Plan Administrator for the Deferred Compensation Plan for Non-Employee Directors. Messrs. O’Brien’s and Passen’s untimely Form 4s were due to delayed reports from third-party brokers with respect to sales of Class A Common Stock held in their personal accounts.
73
Shareholder Proposals and Director Nominations for the 2017 Annual Meeting
Pursuant to our current Bylaws, if a shareholder wishes to present other business or nominate a director candidate for consideration by shareholders at the 2017 annual meeting, we must receive proper written notice of any such business or nomination no earlier than 150 days and no later than 120 days prior to the first anniversary of the date the proxy statement for the preceding year’s annual meeting is released to shareholders. As such, any notice given by a shareholder must be delivered to us between November 8, 2016 and 5:00 p.m., Eastern Time, on December 8, 2016 to be presented at the 2017 annual meeting. If the 2017 annual meeting is advanced or delayed by more than 30 days from the first anniversary of the date of this year’s Annual Meeting, we must receive notice no earlier than 150 days prior to the date of such meeting and not later than 5:00 p.m., Eastern Time, on the later of 120 days prior to the date of such annual meeting, as originally convened, or the tenth day following public announcement of the 2017 annual meeting date. If a shareholder fails to give timely notice as required by our current Bylaws, the nominee or proposal will be excluded from consideration at the meeting.
In addition, notice of any shareholder proposal or nomination of a director candidate must contain certain information specified in our Bylaws about the shareholder, its affiliates and any proposed business or nominee, including information about the economic interest of the shareholder, its affiliates and any proposed nominee in Forest City. A holder of Class A Common Stock may only nominate a director to serve as a Class A director. Similarly, a holder of Class B Common Stock may only nominate a director to serve as a Class B director. Any notice of a shareholder proposal or nomination of a director candidate must be addressed to the Corporate Secretary of Forest City at 50 Public Square, Suite 1360, Cleveland, Ohio 44113.
Shareholders interested in presenting a proposal for inclusion in our proxy statement and form of proxy relating to the 2017 annual meeting may do so by following the procedures in Rule 14a-8 under the Securities Exchange Act of 1934, as amended. To be eligible for inclusion, shareholder proposals must be received us at the address listed below not later than December 8, 2016.
Shareholder proposals and director nominations should be submitted to:
Geralyn M. Presti
Executive Vice President, General Counsel and Corporate Secretary
Forest City Realty Trust, Inc.
Terminal Tower
50 Public Square, Suite 1360
Cleveland, Ohio 44113
Other Business
We do not anticipate that matters other than those described in this proxy statement will be brought before the meeting for action, but if any other matters should properly come before the meeting, it is intended that votes thereon will be cast pursuant to said proxies in accordance with the discretion of the proxy holders.
BY ORDER OF THE BOARD OF DIRECTORS
/s/ Geralyn M. Presti
Geralyn M. Presti, Secretary
Cleveland, Ohio
April 7, 2016
74
Forest City Realty Trust, Inc. and Subsidiaries
Annex A
Reconciliation of Net Earnings (Loss) (GAAP) to Funds From Operations (“FFO”) (non-GAAP)
| Years Ended December 31, | ||||||
| 2015 | 2014 | |||||
| (in thousands) | ||||||
| Net earnings (loss) attributable to Forest City Realty Trust, Inc. | $ | 496,042 | $ | (7,595 | ) | |
| Depreciation and Amortization—Real Estate Groups | 337,740 | 296,382 | ||||
| Gain on disposition of full or partial interests in rental properties | (22,039 | ) | (110,717 | ) | ||
| Impairment of depreciable rental properties | 447,587 | 278,222 | ||||
| Income tax expense (benefit) adjustments — current and deferred | ||||||
| Gain on disposition of full or partial interests in rental properties | 8,549 | 44,988 | ||||
| Impairment of depreciable rental properties | (173,590 | ) | (106,691 | ) | ||
| One-time adjustment to deferred taxes related to REIT conversion | (588,607 | ) | — | |||
| FFO attributable to Forest City Realty Trust, Inc. | $ | 505,682 | $ | 394,589 | ||
Reconciliation of FFO to Operating FFO
| Years Ended December 31, | ||||||
| 2015 | 2014 | |||||
| (in thousands) | ||||||
| FFO attributable to Forest City Realty Trust, Inc. | $ | 505,682 | $ | 394,589 | ||
| Impairment of non-depreciable real estate | 17,691 | 1,736 | ||||
| Write-offs of abandoned development projects and demolition costs | 19,609 | 1,655 | ||||
| Tax credit income | (14,807 | ) | (5,803 | ) | ||
| (Gain) loss on extinguishment of debt | 65,103 | 5,322 | ||||
| Change in fair market value of nondesignated hedges | (4,850 | ) | 1,964 | |||
| Net gain on change in control of interests | (486,279 | ) | (230,660 | ) | ||
| Straight-line rent adjustments | (4,497 | ) | (5,329 | ) | ||
| Participation payments | 1,013 | 2,544 | ||||
| Net loss on disposition of partial interest in development project | — | 16,919 | ||||
| REIT conversion and reorganization costs | 48,125 | 5,697 | ||||
| Nets Pre-tax FFO | 40,760 | 3,181 | ||||
| Income tax expense (benefit) on FFO | 150,051 | 56,589 | ||||
| Operating FFO attributable to Forest City Realty Trust, Inc. | $ | 337,601 | $ | 248,404 | ||
A-1
Forest City Realty Trust, Inc. and Subsidiaries
Annex B
Reconciliation of Comparable Net Operating Income to total Net Operating Income
Net Operating Income (in thousands) | |||||||||||||||||||
| Year Ended December 31, 2015 | Year Ended December 31, 2014 | ||||||||||||||||||
| Full Consolidation | Comparable | Non-Comparable | Total | Comparable | Non-Comparable | Total | |||||||||||||
| Retail | $ | 171,823 | $ | 12,528 | $ | 184,351 | $ | 163,511 | $ | 15,738 | $ | 179,249 | |||||||
| Office | 238,925 | 19,883 | 258,808 | 227,491 | 5,949 | 233,440 | |||||||||||||
| Apartments | 164,678 | 23,822 | 188,500 | 156,570 | (1,223 | ) | 155,347 | ||||||||||||
| Subsidized Senior Housing | — | 17,841 | 17,841 | — | 16,255 | 16,255 | |||||||||||||
| Military Housing | — | 26,614 | 26,614 | — | 23,020 | 23,020 | |||||||||||||
| Straight-line rent adjustments | — | 4,580 | 4,580 | — | 5,525 | 5,525 | |||||||||||||
| Participation payments | — | (1,013 | ) | (1,013 | ) | — | (2,544 | ) | (2,544 | ) | |||||||||
| Other | — | (62,970 | ) | (62,970 | ) | — | (66,066 | ) | (66,066 | ) | |||||||||
| Grand Total | $ | 575,426 | $ | 41,285 | $ | 616,711 | $ | 547,572 | $ | (3,346 | ) | $ | 544,226 | ||||||
Reconciliation of Earnings (Loss) Before Income Taxes (GAAP) to Net Operating Income (non-GAAP)
| Years Ended | |||||||||||||
| December 31, 2015 | December 31, 2014 | ||||||||||||
| (in thousands) | |||||||||||||
| Loss before income taxes (GAAP) | $ | (65,051 | ) | $ | (103,486 | ) | |||||||
| Equity in earnings | $ | 22,313 | $ | 40,792 | |||||||||
| Exclude non-NOI activity from unconsolidated entities: | |||||||||||||
| Land and non-rental activity, net | (3,756 | ) | (284 | ) | |||||||||
| Interest and other income | (1,779 | ) | (883 | ) | |||||||||
| Write offs of abandoned development projects | 10,191 | — | |||||||||||
| Depreciation and amortization | 88,455 | 92,140 | |||||||||||
| Interest expense and extinguishment of debt | 98,166 | 113,938 | |||||||||||
| Total NOI from unconsolidated entities | $ | 213,590 | 213,590 | $ | 245,703 | 245,703 | |||||||
| Land sales | (79,169 | ) | (68,102 | ) | |||||||||
| Cost of land sales | 31,413 | 23,457 | |||||||||||
| Land Development Group other revenues | (8,254 | ) | (9,758 | ) | |||||||||
| Land Development Group operating expenses | 9,753 | 10,650 | |||||||||||
| Corporate general and administrative expenses | 48,374 | 45,419 | |||||||||||
| REIT conversion and reorganization costs | 48,125 | 5,697 | |||||||||||
| Write-offs of abandoned development projects and demolition costs | 9,534 | 1,655 | |||||||||||
| Interest and other income | (37,739 | ) | (42,780 | ) | |||||||||
| Interest expense | 157,166 | 194,176 | |||||||||||
| (Gain) loss on extinguishment of debt | 65,086 | 1,179 | |||||||||||
| Net loss on disposition of partial interest in development project | — | 20,298 | |||||||||||
| Net gain on disposition of full or partial interest in rental properties | (1,746 | ) | (30,281 | ) | |||||||||
| Net gain on change in control of interests | (486,279 | ) | (230,660 | ) | |||||||||
| Impairment of real estate | 451,434 | 277,095 | |||||||||||
| Depreciation and amortization | 252,925 | 196,167 | |||||||||||
| Amortization of mortgage procurement costs | 7,549 | 7,797 | |||||||||||
| Net operating income (Non-GAAP) | $ | 616,711 | $ | 544,226 | |||||||||
B-1
Forest City Realty Trust, Inc. and Subsidiaries
Annex C - Reconciliation of Comparable Net Operating Income (Full Consolidation) to Comparable Net Operating Income (Pro-Rata Consolidation)
Net Operating Income (in thousands) | |||||||||||||||||||||||||||||
| Year Ended December 31, 2015 | Year Ended December 31, 2014 | % Change | |||||||||||||||||||||||||||
Full Consolidation | Less Noncontrolling Interest | Plus Discontinued Operations | Pro-Rata Consolidation (Non-GAAP) | Full Consolidation | Less Noncontrolling Interest | Plus Discontinued Operations | Pro-Rata Consolidation (Non-GAAP) | Full Consolidation | Pro-Rata Consolidation (Non-GAAP) | ||||||||||||||||||||
| Retail | |||||||||||||||||||||||||||||
| Comparable | |||||||||||||||||||||||||||||
| Adjusted revenues | $ | 312,495 | $ | — | $ | — | $ | 312,495 | $ | 301,246 | $ | — | $ | — | $ | 301,246 | 3.7 | % | 3.7 | % | |||||||||
| Adjusted operating expenses | 140,672 | — | — | 140,672 | 137,735 | — | — | 137,735 | 2.1 | % | 2.1 | % | |||||||||||||||||
| Comparable NOI | 171,823 | — | — | 171,823 | 163,511 | — | — | 163,511 | 5.1 | % | 5.1 | % | |||||||||||||||||
| Non-Comparable NOI | 12,528 | — | — | 12,528 | 15,738 | (34 | ) | 3,678 | 19,450 | ||||||||||||||||||||
| Total | 184,351 | — | — | 184,351 | 179,249 | (34 | ) | 3,678 | 182,961 | ||||||||||||||||||||
| Office Buildings | |||||||||||||||||||||||||||||
| Comparable | |||||||||||||||||||||||||||||
| Adjusted revenues | 419,412 | 19,793 | — | 399,619 | 403,894 | 18,977 | — | 384,917 | 3.8 | % | 3.8 | % | |||||||||||||||||
| Adjusted operating expenses | 180,487 | 9,988 | — | 170,499 | 176,403 | 9,826 | — | 166,577 | 2.3 | % | 2.4 | % | |||||||||||||||||
| Comparable NOI | 238,925 | 9,805 | — | 229,120 | 227,491 | 9,151 | — | 218,340 | 5.0 | % | 4.9 | % | |||||||||||||||||
| Non-Comparable NOI | 19,883 | 186 | — | 19,697 | 5,949 | 193 | (43 | ) | 5,713 | ||||||||||||||||||||
| Total | 258,808 | 9,991 | — | 248,817 | 233,440 | 9,344 | (43 | ) | 224,053 | ||||||||||||||||||||
| Apartments | |||||||||||||||||||||||||||||
| Comparable | |||||||||||||||||||||||||||||
| Adjusted revenues | 288,464 | 17,608 | — | 270,856 | 278,765 | 16,304 | — | 262,461 | 3.5 | % | 3.2 | % | |||||||||||||||||
| Adjusted operating expenses | 123,786 | 6,477 | — | 117,309 | 122,195 | 6,326 | — | 115,869 | 1.3 | % | 1.2 | % | |||||||||||||||||
| Comparable NOI | 164,678 | 11,131 | — | 153,547 | 156,570 | 9,978 | — | 146,592 | 5.2 | % | 4.7 | % | |||||||||||||||||
| Non-Comparable NOI | 23,822 | 13,619 | — | 10,203 | (1,223 | ) | (8,847 | ) | — | 7,624 | |||||||||||||||||||
| Total | 188,500 | 24,750 | — | 163,750 | 155,347 | 1,131 | — | 154,216 | |||||||||||||||||||||
| Arena | — | — | 21,864 | 21,864 | — | — | 21,739 | 21,739 | |||||||||||||||||||||
| Subsidized Senior Housing | 17,841 | — | — | 17,841 | 16,255 | — | — | 16,255 | |||||||||||||||||||||
| Military Housing | 26,614 | 732 | — | 25,882 | 23,020 | 47 | — | 22,973 | |||||||||||||||||||||
| Straight-line rent adjustments | 4,580 | 162 | 79 | 4,497 | 5,525 | 139 | (57 | ) | 5,329 | ||||||||||||||||||||
| Participation payments | (1,013 | ) | — | — | (1,013 | ) | (2,544 | ) | — | — | (2,544 | ) | |||||||||||||||||
| Other | (62,970 | ) | (3,114 | ) | — | (59,856 | ) | (66,066 | ) | (913 | ) | — | (65,153 | ) | |||||||||||||||
| Total NOI | |||||||||||||||||||||||||||||
| Comparable | |||||||||||||||||||||||||||||
| Adjusted revenues | 1,020,371 | 37,401 | — | 982,970 | 983,905 | 35,281 | — | 948,624 | 3.7 | % | 3.6 | % | |||||||||||||||||
| Adjusted operating expenses | 444,945 | 16,465 | — | 428,480 | 436,333 | 16,152 | — | 420,181 | 2.0 | % | 2.0 | % | |||||||||||||||||
| Comparable NOI | 575,426 | 20,936 | — | 554,490 | 547,572 | 19,129 | — | 528,443 | 5.1 | % | 4.9 | % | |||||||||||||||||
| Non-Comparable NOI | 41,285 | 11,585 | 21,943 | 51,643 | (3,346 | ) | (9,415 | ) | 25,317 | 31,386 | |||||||||||||||||||
| Grand Total | $ | 616,711 | $ | 32,521 | $ | 21,943 | $ | 606,133 | $ | 544,226 | $ | 9,714 | $ | 25,317 | $ | 559,829 | |||||||||||||
C-1