UNITED STATES
SECURITIES AND EXCHANGE COMMISSION
Washington, D.C. 20549
_____________________________________________________________
Form 10-Q
_____________________________________________________________
(Mark One)
|
| |
| ý | QUARTERLY REPORT PURSUANT TO SECTION 13 OR 15 (d) OF THE SECURITIES EXCHANGE ACT OF 1934 |
For the quarterly period ended June 30, 2017
|
| |
| ¨ | TRANSITION REPORT PURSUANT TO SECTION 13 OR 15 (d) OF THE SECURITIES EXCHANGE ACT OF 1934 |
For the transition period from to
Commission file number 1-37671
_____________________________________________________________
FOREST CITY REALTY TRUST, INC.
(Exact name of registrant as specified in its charter)
_____________________________________________________________
|
| | | | |
Maryland (State or other jurisdiction of incorporation or organization) | | | | 47-4113168 (I.R.S. Employer Identification No.) |
| | | | | |
Terminal Tower Suite 1100 | | 50 Public Square Cleveland, Ohio | | 44113 |
| (Address of principal executive offices) | | (Zip Code) |
216-621-6060
(Registrant’s telephone number, including area code)
(Former name, former address and former fiscal year, if changed since last report)
_____________________________________________________________
Indicate by check mark whether the registrant (1) has filed all reports required to be filed by Section 13 or 15(d) of the Securities Exchange Act of 1934 during the preceding 12 months (or for such shorter period that the registrant was required to file such reports), and (2) has been subject to such filing requirements for the past 90 days. Yes ý No ¨
Indicate by check mark whether the registrant has submitted electronically and posted on its corporate Web site, if any, every Interactive Data File required to be submitted and posted pursuant to Rule 405 of Regulation S-T (§232.405 of this chapter) during the preceding 12 months (or for such shorter period that the registrant was required to submit and post such files). Yes ý No ¨
Indicate by check mark whether the registrant is a large accelerated filer, an accelerated filer, a non-accelerated filer, smaller reporting company, or an emerging growth company. See the definitions of “large accelerated filer,” “accelerated filer,” “smaller reporting company” and “emerging growth company” in Rule 12b-2 of the Exchange Act. (Check one):
|
| | | |
| Large accelerated filer | ý | Accelerated filer | ¨ |
| Non-accelerated filer | ¨ (Do not check if a smaller reporting company)
| Smaller reporting company | ¨ |
| | | Emerging growth company | ¨ |
If an emerging growth company, indicate by check mark if the registrant has elected not to use the extended transition period for complying with any new or revised financial accounting standards provided pursuant to Section 13(a) of the Exchange Act. ¨
Indicate by check mark whether the registrant is a shell company (as defined in Rule 12b-2 of the Exchange Act). Yes ¨ No ý
Indicate the number of shares outstanding, including unvested restricted stock, of each of the issuer’s classes of common stock, as of the latest practicable date.
|
| |
| Class | Outstanding at July 31, 2017 |
| Class A Common Stock, $.01 par value | 266,766,419 shares |
Forest City Realty Trust, Inc. and Subsidiaries
Table of Contents
PART I – FINANCIAL INFORMATION
Item 1. Financial Statements
Forest City Realty Trust, Inc. and Subsidiaries
Consolidated Balance Sheets
(Unaudited)
|
| | | | | | |
| | June 30, 2017 | |
| | (Unaudited) | December 31, 2016 |
| | (in thousands) |
| Assets | | |
| Real Estate | | |
| Completed rental properties | $ | 7,261,574 |
| $ | 7,112,347 |
|
| Projects under construction and development | 648,631 |
| 734,980 |
|
| Land inventory | 73,555 |
| 68,238 |
|
| Total Real Estate | 7,983,760 |
| 7,915,565 |
|
| Less accumulated depreciation | (1,506,397 | ) | (1,442,006 | ) |
| Real Estate, net – (variable interest entities $2,303.7 million and $2,270.3 million, respectively) | 6,477,363 |
| 6,473,559 |
|
| Cash and equivalents – (variable interest entities $69.7 million and $59.3 million, respectively) | 172,339 |
| 174,619 |
|
| Restricted cash – (variable interest entities $45.2 million and $46.5 million, respectively) | 143,237 |
| 149,300 |
|
| Accounts receivable, net – (variable interest entities $61.6 million and $72.2 million, respectively) | 210,215 |
| 208,563 |
|
| Notes receivable – (variable interest entities $188.0 million and $154.3 million, respectively) | 418,230 |
| 383,163 |
|
| Investments in and advances to unconsolidated entities | 543,167 |
| 564,779 |
|
| Other assets – (variable interest entities $64.8 million and $72.2 million, respectively) | 256,758 |
| 274,614 |
|
| Total Assets | $ | 8,221,309 |
| $ | 8,228,597 |
|
| Liabilities and Equity | | |
| Liabilities | | |
| Nonrecourse mortgage debt and notes payable, net – (variable interest entities $1,429.5 million and $1,437.8 million, respectively) | $ | 3,158,280 |
| $ | 3,120,833 |
|
| Revolving credit facility | — |
| — |
|
| Term loan, net | 333,468 |
| 333,268 |
|
| Convertible senior debt, net | 112,410 |
| 112,181 |
|
| Accounts payable, accrued expenses and other liabilities – (variable interest entities $245.7 million and $241.9 million, respectively) | 656,805 |
| 726,724 |
|
| Cash distributions and losses in excess of investments in unconsolidated entities | 123,807 |
| 150,592 |
|
| Total Liabilities | 4,384,770 |
| 4,443,598 |
|
| Commitments and Contingencies | — |
| — |
|
| Equity | | |
| Stockholders’ Equity | | |
| Preferred stock – $.01 par value, respectively; 20,000,000 shares authorized, no shares issued | — |
| — |
|
| Common stock – $.01 par value | | |
| Class A, 371,000,000 shares authorized, 265,233,926 and 239,937,796 shares issued and outstanding, respectively | 2,652 |
| 2,399 |
|
| Class B, convertible, 0 and 56,000,000 shares authorized, 0 and 18,788,169 shares issued and outstanding, respectively | — |
| 188 |
|
| Total common stock | 2,652 |
| 2,587 |
|
| Additional paid-in capital | 2,502,269 |
| 2,483,275 |
|
| Retained earnings | 863,133 |
| 812,386 |
|
| Stockholders’ equity before accumulated other comprehensive loss | 3,368,054 |
| 3,298,248 |
|
| Accumulated other comprehensive loss | (11,867 | ) | (14,410 | ) |
| Total Stockholders’ Equity | 3,356,187 |
| 3,283,838 |
|
| Noncontrolling interest | 480,352 |
| 501,161 |
|
| Total Equity | 3,836,539 |
| 3,784,999 |
|
| Total Liabilities and Equity | $ | 8,221,309 |
| $ | 8,228,597 |
|
The accompanying notes are an integral part of these consolidated financial statements.
2
Forest City Realty Trust, Inc. and Subsidiaries
Consolidated Statements of Operations
(Unaudited)
|
| | | | | | | | | | | | | |
| | Three Months Ended June 30, | | Six Months Ended June 30, |
| | 2017 | 2016 | | 2017 | 2016 |
| | (in thousands, except per share data) |
| Revenues | | | | | |
| Rental | $ | 165,964 |
| $ | 162,546 |
| | $ | 328,413 |
| $ | 325,729 |
|
| Tenant recoveries | 28,132 |
| 28,644 |
| | 54,064 |
| 60,234 |
|
| Service and management fees | 11,363 |
| 12,511 |
| | 21,490 |
| 21,193 |
|
| Parking and other | 13,221 |
| 14,041 |
| | 24,959 |
| 29,398 |
|
| Land sales | 17,762 |
| 8,221 |
| | 23,522 |
| 12,154 |
|
| Military Housing | — |
| — |
| | — |
| 3,518 |
|
| Total revenues | 236,442 |
| 225,963 |
| | 452,448 |
| 452,226 |
|
| Expenses | | | | | |
| Property operating and management | 78,158 |
| 81,435 |
| | 156,951 |
| 171,355 |
|
| Real estate taxes | 21,357 |
| 21,600 |
| | 42,557 |
| 46,066 |
|
| Ground rent | 3,766 |
| 3,447 |
| | 7,654 |
| 7,086 |
|
| Cost of land sales | 7,694 |
| 1,702 |
| | 9,695 |
| 2,042 |
|
| Military Housing operating | — |
| — |
| | — |
| 2,730 |
|
| Corporate general and administrative | 14,018 |
| 16,750 |
| | 29,601 |
| 33,862 |
|
| Organizational transformation and termination benefits | 6,863 |
| 5,681 |
| | 11,388 |
| 14,401 |
|
| | 131,856 |
| 130,615 |
| | 257,846 |
| 277,542 |
|
| Depreciation and amortization | 65,747 |
| 62,418 |
| | 129,302 |
| 125,629 |
|
| Write-offs of abandoned development projects and demolition costs | 1,596 |
| — |
| | 1,596 |
| — |
|
| Impairment of real estate | — |
| 2,100 |
| | — |
| 14,564 |
|
| Total expenses | 199,199 |
| 195,133 |
| | 388,744 |
| 417,735 |
|
| Operating income | 37,243 |
| 30,830 |
| | 63,704 |
| 34,491 |
|
| | | | | | |
| Interest and other income | 9,896 |
| 11,031 |
| | 20,168 |
| 20,685 |
|
| Interest expense | (28,901 | ) | (32,435 | ) | | (56,876 | ) | (67,070 | ) |
| Amortization of mortgage procurement costs | (1,507 | ) | (1,416 | ) | | (2,729 | ) | (3,081 | ) |
| Loss on extinguishment of debt | — |
| — |
| | (2,843 | ) | (29,084 | ) |
| Earnings (loss) before income taxes and earnings from unconsolidated entities | 16,731 |
| 8,010 |
| | 21,424 |
| (44,059 | ) |
| Earnings from unconsolidated entities | | | | | |
| Equity in earnings | 6,261 |
| 8,551 |
| | 15,539 |
| 19,087 |
|
| Net gain on disposition of interest in unconsolidated entities | 35,253 |
| 12,613 |
| | 52,954 |
| 12,613 |
|
| | 41,514 |
| 21,164 |
| | 68,493 |
| 31,700 |
|
| Earnings (loss) before income taxes | 58,245 |
| 29,174 |
| | 89,917 |
| (12,359 | ) |
| Income tax expense (benefit) of taxable REIT subsidiaries | | | | | |
| Current | 4,462 |
| 327 |
| | 4,513 |
| 1,249 |
|
| Deferred | — |
| (135 | ) | | — |
| 393 |
|
| | 4,462 |
| 192 |
| | 4,513 |
| 1,642 |
|
| Earnings (loss) before gains on disposal of real estate | 53,783 |
| 28,982 |
| | 85,404 |
| (14,001 | ) |
| Net gain (loss) on disposition of interest in development project | — |
| — |
| | (113 | ) | 136,117 |
|
| Net gain (loss) on disposition of full or partial interest in rental properties, net of tax | 4,526 |
| (623 | ) | | 13,829 |
| 89,018 |
|
| Earnings from continuing operations | 58,309 |
| 28,359 |
| | 99,120 |
| 211,134 |
|
| Discontinued operations, net of tax | | | | | |
| Operating loss from rental property | — |
| — |
| | — |
| (1,126 | ) |
| Gain on disposition of disposal group | — |
| — |
| | — |
| 64,553 |
|
| Equity in earnings (loss) | — |
| — |
| | — |
| (822 | ) |
| | — |
| — |
| | — |
| 62,605 |
|
| Net earnings | 58,309 |
| 28,359 |
| | 99,120 |
| 273,739 |
|
| Noncontrolling interests, gross of tax | |
| | | |
| Earnings from continuing operations attributable to noncontrolling interests | (1,556 | ) | (1,760 | ) | | (1,450 | ) | (3,881 | ) |
| Loss from discontinued operations attributable to noncontrolling interests | — |
| — |
| | — |
| 776 |
|
| | (1,556 | ) | (1,760 | ) | | (1,450 | ) | (3,105 | ) |
| Net earnings attributable to Forest City Realty Trust, Inc. | $ | 56,753 |
| $ | 26,599 |
| | $ | 97,670 |
| $ | 270,634 |
|
| | | | | | |
| Basic earnings per common share | | | | | |
| Earnings from continuing operations attributable to common stockholders | $ | 0.22 |
| $ | 0.10 |
| | $ | 0.37 |
| $ | 0.79 |
|
| Earnings from discontinued operations attributable to common stockholders | — |
| — |
| | — |
| 0.24 |
|
| Net earnings attributable to common stockholders | $ | 0.22 |
| $ | 0.10 |
| | $ | 0.37 |
| $ | 1.03 |
|
| Diluted earnings per common share | | | | | |
| Earnings from continuing operations attributable to common stockholders | $ | 0.22 |
| $ | 0.10 |
| | $ | 0.37 |
| $ | 0.78 |
|
| Earnings from discontinued operations attributable to common stockholders | — |
| — |
| | — |
| 0.24 |
|
| Net earnings attributable to common stockholders | $ | 0.22 |
| $ | 0.10 |
| | $ | 0.37 |
| $ | 1.02 |
|
The accompanying notes are an integral part of these consolidated financial statements.
3
Forest City Realty Trust, Inc. and Subsidiaries
Consolidated Statements of Comprehensive Income (Loss)
(Unaudited)
|
| | | | | | |
| | Three Months Ended June 30, |
| | 2017 | 2016 |
| | (in thousands) |
| Net earnings | $ | 58,309 |
| $ | 28,359 |
|
| Other comprehensive income: | | |
| Foreign currency translation adjustments | — |
| 11 |
|
| Unrealized net gains on interest rate derivative contracts | 837 |
| 6,508 |
|
| Total other comprehensive income | 837 |
| 6,519 |
|
| Comprehensive income | 59,146 |
| 34,878 |
|
| Comprehensive income attributable to noncontrolling interest | (1,559 | ) | (1,764 | ) |
| Total comprehensive income attributable to Forest City Realty Trust, Inc. | $ | 57,587 |
| $ | 33,114 |
|
| | | |
| | Six Months Ended June 30, |
| | 2017 | 2016 |
| | (in thousands) |
| Net earnings | $ | 99,120 |
| $ | 273,739 |
|
| Other comprehensive income: | | |
| Foreign currency translation adjustments | — |
| 95 |
|
| Unrealized net gains on interest rate derivative contracts | 2,550 |
| 8,584 |
|
| Total other comprehensive income | 2,550 |
| 8,679 |
|
| Comprehensive income | 101,670 |
| 282,418 |
|
| Comprehensive income attributable to noncontrolling interest | (1,457 | ) | (3,113 | ) |
| Total comprehensive income attributable to Forest City Realty Trust, Inc. | $ | 100,213 |
| $ | 279,305 |
|
The accompanying notes are an integral part of these consolidated financial statements.
4
Forest City Realty Trust, Inc. and Subsidiaries
Consolidated Statements of Equity
(Unaudited)
|
| | | | | | | | | | | | | | | | | | | | | | | | | |
| | | | | | | | Accumulated | | |
| | Common Stock | Additional | | Other | | |
| | Class A | Class B | Paid-In | Retained | Comprehensive | Noncontrolling | |
| | Shares | Amount | Shares | Amount | Capital | Earnings | (Loss) Income | Interest | Total |
| | (in thousands)
|
| Balances at December 31, 2015 | 238,949 |
| $ | 2,389 |
| 18,805 |
| $ | 188 |
| $ | 2,524,420 |
| $ | 1,059,240 |
| $ | (67,905 | ) | $ | 456,224 |
| $ | 3,974,556 |
|
| Net loss, net of $776 loss attributable to redeemable noncontrolling interest | | | | | | (158,402 | ) | | 6,078 |
| (152,324 | ) |
| Other comprehensive income | | | | | | | 53,495 |
| 15 |
| 53,510 |
|
| Common stock dividends | | | | | | (88,452 | ) | | | (88,452 | ) |
| Conversion of Class B common stock to Class A common stock | 17 |
| — |
| (17 | ) | — |
| | | | | — |
|
| Cost incurred for planned conversion of Class B to Class A common stock | | | | | (3,896 | ) | | | | (3,896 | ) |
| Restricted stock and performance shares vested | 1,267 |
| 12 |
| | | (12 | ) | | | | — |
|
| Repurchase of Class A common stock | (390 | ) | (3 | ) | | | (7,942 | ) | | | | (7,945 | ) |
| Exercise of stock options | 86 |
| 1 |
| | | 1,157 |
| | | | 1,158 |
|
| Stock-based compensation | | | | | 25,463 |
| | | | 25,463 |
|
| Issuance of Class A common stock in exchange for 2016 Senior Notes | 9 |
| — |
| | | 186 |
| | | | 186 |
|
| Acquisition of partners’ noncontrolling interest in consolidated subsidiaries | | | | | (56,101 | ) | | | 19,916 |
| (36,185 | ) |
| Contributions from noncontrolling interests | | | | | | | | 50,506 |
| 50,506 |
|
| Distributions to noncontrolling interests | | | | | | | | (31,578 | ) | (31,578 | ) |
| Balances at December 31, 2016 | 239,938 |
| $ | 2,399 |
| 18,788 |
| $ | 188 |
| $ | 2,483,275 |
| $ | 812,386 |
| $ | (14,410 | ) | $ | 501,161 |
| $ | 3,784,999 |
|
| Net earnings | | | | | | 97,670 |
| | 1,450 |
| 99,120 |
|
| Other comprehensive income | | | | | | | 2,543 |
| 7 |
| 2,550 |
|
| Common stock dividends | | | | | | (46,923 | ) | | | (46,923 | ) |
| Conversion of Class B common stock to Class A common stock | 24,612 |
| 246 |
| (18,788 | ) | (188 | ) | (58 | ) | | | | — |
|
| Cost incurred for conversion of Class B to Class A common stock | | | | | (9,305 | ) | | | | (9,305 | ) |
| Restricted stock vested | 703 |
| 7 |
| | | (7 | ) | | | | — |
|
| Repurchase of Class A common stock | (229 | ) | (2 | ) | | | (5,049 | ) | | | | (5,051 | ) |
| Exercise of stock options | 54 |
| 1 |
| | | 845 |
| | | | 846 |
|
| Issuance of Class A common stock under the deferred compensation plan for non-employee directors | 13 |
| — |
| | | 309 |
| | | | 309 |
|
| Stock-based compensation | | | | | 14,041 |
| | | | 14,041 |
|
| Exchange of 2006 Class A Common Units for Class A common stock | 143 |
| 1 |
| | | 7,287 |
| | | (7,288 | ) | — |
|
| Acquisition of partners’ noncontrolling interest in consolidated subsidiaries | | | | | 10,931 |
| | | (10,931 | ) | — |
|
| Contributions from noncontrolling interests | | | | | | | | 15,770 |
| 15,770 |
|
| Distributions to noncontrolling interests | | | | | | | | (19,817 | ) | (19,817 | ) |
Balances at June 30, 2017 (Unaudited) | 265,234 |
| $ | 2,652 |
| — |
| $ | — |
| $ | 2,502,269 |
| $ | 863,133 |
| $ | (11,867 | ) | $ | 480,352 |
| $ | 3,836,539 |
|
The accompanying notes are an integral part of these consolidated financial statements.
5
Forest City Realty Trust, Inc. and Subsidiaries
Consolidated Statements of Cash Flows
(Unaudited)
|
| | | | | | |
| | Six Months Ended June 30, |
| | 2017 | 2016 |
| | (in thousands) |
| Net earnings | $ | 99,120 |
| $ | 273,739 |
|
| Depreciation and amortization | 129,302 |
| 125,629 |
|
| Amortization of mortgage procurement costs | 2,729 |
| 3,081 |
|
| Impairment of real estate | — |
| 14,564 |
|
| Write-offs of abandoned development projects | 1,596 |
| — |
|
| Loss on extinguishment of debt | 2,843 |
| 29,084 |
|
| Net (gain) loss on disposition of interest in development project | 113 |
| (136,117 | ) |
| Net gain on disposition of full or partial interest in rental properties, net of tax | (13,829 | ) | (89,018 | ) |
| Deferred income tax expense | — |
| 393 |
|
| Earnings from unconsolidated entities | (68,493 | ) | (31,700 | ) |
| Stock-based compensation expense | 9,741 |
| 10,612 |
|
| Amortization and mark-to-market adjustments of derivative instruments | (399 | ) | 3,534 |
|
| Operating distributions from unconsolidated entities | 44,202 |
| 35,598 |
|
| Non-cash operating expenses and deferred taxes included in discontinued operations | — |
| (309 | ) |
| Loss from unconsolidated entities included in discontinued operations | — |
| 1,400 |
|
| Gain on disposition of disposal group included in discontinued operations, net of tax | — |
| (64,553 | ) |
| Increase in land inventory | (2,790 | ) | (3,775 | ) |
| (Increase) decrease in accounts receivable | (19,748 | ) | 3,822 |
|
| (Increase) decrease in other assets | (4,083 | ) | 4,695 |
|
| Decrease in accounts payable, accrued expenses and other liabilities | (17,127 | ) | (87,506 | ) |
| Net cash provided by operating activities | 163,177 |
| 93,173 |
|
| Cash flows from investing activities | | |
| Capital expenditures | (201,554 | ) | (303,737 | ) |
| Capital expenditures of assets included in discontinued operations | — |
| (690 | ) |
| Payment of lease procurement costs | (6,129 | ) | (3,145 | ) |
| Increase in notes receivable | (24,379 | ) | (26,321 | ) |
| Payments on notes receivable | — |
| 58,000 |
|
| Decrease in restricted cash | 6,063 |
| 16,668 |
|
| Cash held at Arena upon disposition | — |
| (28,041 | ) |
| Proceeds from disposition of rental properties or development project | 30,183 |
| 507,226 |
|
| Contributions to unconsolidated entities | (42,744 | ) | (93,087 | ) |
| Distributions from unconsolidated entities | 63,988 |
| 20,758 |
|
| Net cash (used in) provided by investing activities | (174,572 | ) | 147,631 |
|
| Cash flows from financing activities | | |
| Proceeds from nonrecourse mortgage debt and notes payable | 112,902 |
| 170,933 |
|
| Principal payments on nonrecourse mortgage debt and notes payable | (44,411 | ) | (57,234 | ) |
| Redemption of Senior Notes due 2018 & 2020 | — |
| (157,644 | ) |
| Payments to noteholders related to exchange of convertible senior notes | — |
| (24,376 | ) |
| Transaction costs related to exchange of convertible senior notes | — |
| (2,460 | ) |
| Payment of costs incurred for conversion of Class B to Class A common stock | (2,405 | ) | — |
|
| Payment of deferred financing costs | (2,130 | ) | (4,221 | ) |
| Repurchase of Class A common stock | (5,051 | ) | (7,198 | ) |
| Exercise of stock options | 846 |
| 1,158 |
|
| Dividends paid to stockholders | (46,923 | ) | (57,211 | ) |
| Acquisitions of noncontrolling interests | — |
| (38,968 | ) |
| Contributions from noncontrolling interests | 15,770 |
| 40,430 |
|
| Distributions to noncontrolling interests | (19,483 | ) | (11,914 | ) |
| Net cash provided by (used in) financing activities | 9,115 |
| (148,705 | ) |
| Net (decrease) increase in cash and equivalents | (2,280 | ) | 92,099 |
|
| Cash and equivalents at beginning of period (including cash held for sale - 2016) | 174,619 |
| 293,720 |
|
| Cash and equivalents at end of period | $ | 172,339 |
| $ | 385,819 |
|
The accompanying notes are an integral part of these consolidated financial statements.
6
Forest City Realty Trust, Inc. and Subsidiaries
Notes to Consolidated Financial Statements
(Unaudited)
A. Accounting Policies
General
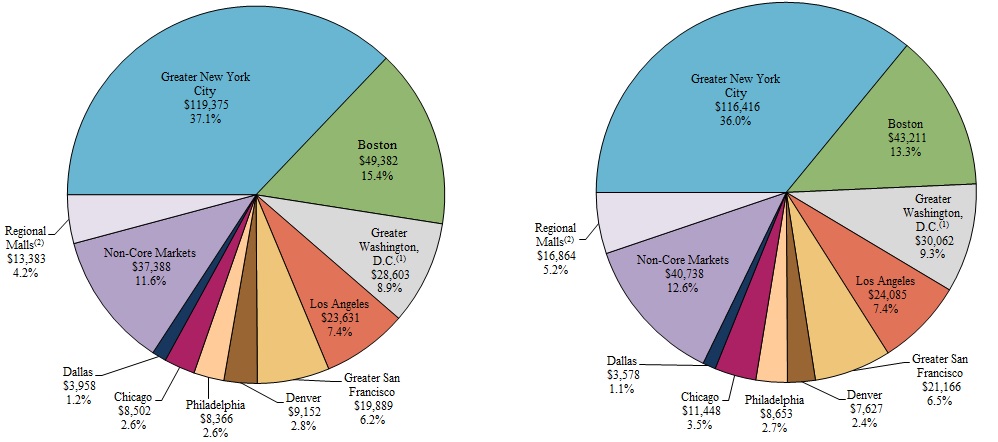
Forest City Realty Trust, Inc. (with its subsidiaries, the “Company”) principally engages in the operation, development, management and acquisition of office, apartment and retail real estate and land throughout the United States. The Company had approximately $8.2 billion of consolidated assets in 20 states and the District of Columbia at June 30, 2017. The Company’s core markets include Boston, Chicago, Dallas, Denver, Los Angeles, Philadelphia, and the greater metropolitan areas of New York City, San Francisco and Washington D.C. The Company has regional offices in Boston, Dallas, Denver, Los Angeles, New York City, San Francisco, Washington, D.C., and the Company’s corporate headquarters in Cleveland, Ohio.
Basis of Presentation
The accompanying consolidated financial statements have been prepared in accordance with accounting principles generally accepted in the United States of America (“GAAP”) for interim financial information and the instructions to Form 10-Q, and should be read in conjunction with the consolidated financial statements and related notes included in the Company’s annual report on Form 10-K for the year ended December 31, 2016. The results of interim periods are not necessarily indicative of results for the full year or any subsequent period. In management’s opinion, all adjustments (consisting solely of normal recurring matters) necessary for a fair statement of financial position, results of operations and cash flows as of and for the periods presented have been included.
Company Operations
The Company believes it is organized in a manner that enables it to qualify, and intends to operate in a manner allowing it to continue to qualify, as a REIT for federal income tax purposes. As such, the Company intends to elect REIT status for its taxable year ended December 31, 2016, upon filing the 2016 Form 1120-REIT with the Internal Revenue Service on or before October 15, 2017.
The Company holds substantially all of its assets, and conducts substantially all of its business, through Forest City Enterprises, L.P. (the “Operating Partnership”). The Company is the sole general partner of the Operating Partnership and, as of June 30, 2017, the Company owns all of the limited partnership interests in the Operating Partnership.
The Company holds and operates certain of its assets through one or more taxable REIT subsidiaries (“TRSs”). A TRS is a subsidiary of a REIT subject to applicable corporate income tax. The Company’s use of TRSs enables it to continue to engage in certain businesses while complying with REIT qualification requirements and allows the Company to retain income generated by these businesses for reinvestment without the requirement of distributing those earnings. The primary businesses held in TRSs include 461 Dean Street, an apartment building in Brooklyn, New York, South Bay Galleria and Antelope Valley Mall, regional malls in Redondo Beach, California and Palmdale, California, respectively, Pacific Park Brooklyn project, land development operations, Barclays Center arena (sold in January 2016), the Nets (sold in January 2016), and military housing operations (sold in February 2016). In the future, the Company may elect to reorganize and transfer certain assets or operations from its TRSs to other subsidiaries, including qualified REIT subsidiaries.
Segments
The Company is organized around real estate operations, real estate development and corporate support functions.
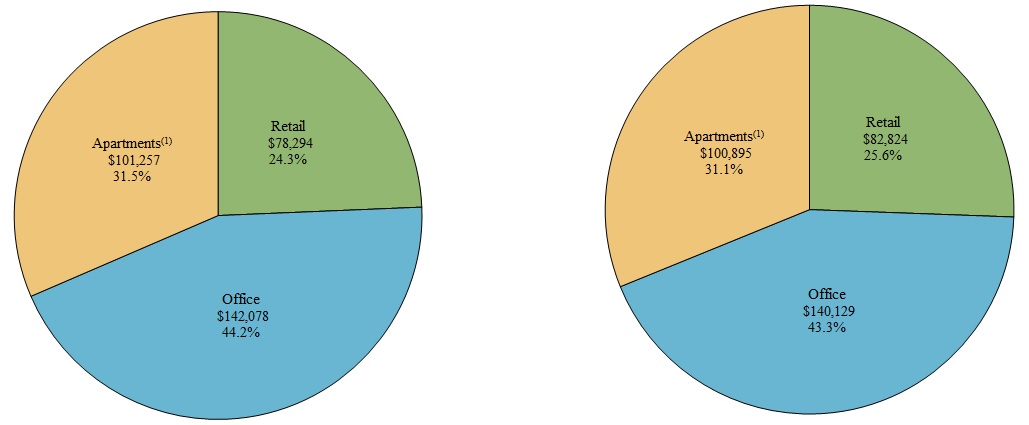
Real Estate Operations represents the performance of the Company’s core rental real estate portfolio and is comprised of the following reportable operating segments:
| |
| • | Office - owns, acquires and operates office and life science buildings. |
| |
| • | Apartments - owns, acquires and operates upscale and middle-market apartments, adaptive re-use developments and subsidized senior housing. |
| |
| • | Retail - owns, acquires and operates amenity retail within our mixed-use projects, regional malls and specialty/urban retail centers. |
The remaining reportable operating segments consist of the following:
| |
| • | Development - develops and constructs office and life science buildings, apartments, condominiums, amenity retail, regional malls, specialty/urban retail centers and mixed-use projects. The Development segment includes recently opened operating properties prior to stabilization and the horizontal development and sale of land to residential, commercial and industrial customers primarily at its Stapleton project in Denver, Colorado. |
Forest City Realty Trust, Inc. and Subsidiaries
Notes to Consolidated Financial Statements
(Unaudited)
| |
| • | Corporate - provides executive oversight to the company and various support services for Operations, Development and Corporate employees. |
| |
| • | Other - owned and operated several non-core investments, including the Barclays Center, a sports and entertainment arena located in Brooklyn, New York (“Arena”) (sold in January 2016), the Company’s equity method investment in the Brooklyn Nets (the “Nets”) (sold in January 2016), and military housing operations (sold in February 2016). |
Segment Transfers
The Development segment includes projects in development and projects under construction along with recently opened operating properties prior to stabilization. Projects will be reported in their applicable operating segment (Office, Apartments or Retail) beginning on January 1 of the year following stabilization. Therefore, the Development segment will continue to report results from recently opened properties until the year-end following initial stabilization. The Company generally defines stabilized properties as achieving 92% or greater occupancy or having been open and operating for one or two years, depending on the size of the project. Once a stabilized property is transferred to the applicable Operations segment on January 1, it will be considered “comparable” beginning on the following January 1.
Use of Estimates
The preparation of consolidated financial statements in conformity with GAAP requires the Company to make estimates and assumptions in certain circumstances that affect amounts reported in the accompanying consolidated financial statements and related notes. Some of the critical estimates made by the Company include, but are not limited to, determination of the primary beneficiary of variable interest entities (“VIEs”), estimates of useful lives for long-lived assets, reserves for collection on accounts and notes receivable and other investments, gain on change of control of interests, impairment of real estate and other-than-temporary impairments on equity method investments. Actual results could differ from those estimates.
Reclassifications
The Company recently completed an internal reorganization and began presenting new reportable operating segments during the three months ended September 30, 2016. The prior period has been recast to conform to the current period presentation.
Concurrent with the Company’s internal reorganization, certain functions previously performed within the old business unit structure were centralized into the corporate segment. The Company analyzed the allocation methodology of the new corporate functions and the historic corporate functions and how it relates to support services provided to the new segments within the Company’s new organizational structure. As a result of this analysis, certain expenses previously recorded in the old business units and reported on the property operating and management expenses financial statement line item are recorded in the corporate segment and included in the corporate general and administrative expense financial statement line item. To conform to the current year presentation, $800,000 and $2,260,000 have been reclassed from property operating and management expenses to corporate general and administrative expenses for the three and six months ended June 30, 2016, respectively.
Certain other prior period amounts in the accompanying consolidated financial statements have been reclassified to conform to the current year’s presentation.
Variable Interest Entities
As of June 30, 2017, the Company determined it was the primary beneficiary of 46 VIEs. The creditors of the consolidated VIEs do not have recourse to the Company’s general credit. As of June 30, 2017, the Company determined it was not the primary beneficiary of 41 VIEs and accounts for these interests as equity method investments. The maximum exposure to loss of these unconsolidated VIEs is limited to the Company’s investment balance of $150,000,000 as of June 30, 2017.
New Accounting Guidance
The following accounting pronouncements were adopted during the six months ended June 30, 2017:
In March 2016, the Financial Accounting Standards Board (“FASB”) issued an amendment to the accounting guidance to simplify several aspects of the accounting for share-based payment transactions, including the income tax consequences, classification of awards as either equity or liabilities, and classification on the statement of cash flows. This guidance is effective for annual periods beginning after December 15, 2016, and interim periods within those annual periods. The adoption of this guidance effective January 1, 2017 did not have a material impact on the Company’s consolidated financial statements.
In August 2016, the FASB issued an amendment to the accounting guidance on the classification of certain transactions on the statement of cash flows where diversity in practice currently exists. The guidance addresses certain specific cash flow issues, including, but not limited to, debt prepayment or debt extinguishment costs and distributions received from equity method investments. This guidance is effective for fiscal years, and for interim reporting periods within those fiscal years, beginning after December 15, 2017. Early
Forest City Realty Trust, Inc. and Subsidiaries
Notes to Consolidated Financial Statements
(Unaudited)
adoption is permitted, and the Company has elected to adopt this guidance effective January 1, 2017. The adoption of this guidance did not have a material impact on the Company’s Consolidated Statements of Cash Flows.
In January 2017, the FASB issued an amendment to the accounting guidance for business combinations to clarify the definition of a business. The objective of this guidance is to assist entities with evaluating whether transactions should be accounted for as acquisitions (or disposals) of assets or businesses. This guidance is effective for annual periods beginning after December 15, 2017, and interim periods within those annual periods. Early adoption is permitted, and the Company has elected to adopt this guidance effective January 1, 2017. The impact on the Company’s consolidated financial statements resulting from the adoption of this guidance will depend on the Company’s level of acquisitions, but will most likely increase the number of acquisitions accounted for as asset acquisitions rather than business combinations.
The following new accounting pronouncements will be adopted on their respective effective dates:
In May 2014, the FASB issued an amendment to the accounting guidance for revenue from contracts with customers. The core principle of this guidance is an entity should recognize revenue to depict the transfer of promised goods or services to customers in an amount that reflects the consideration to which the entity expects to be entitled in exchange for those goods or services. The guidance defines steps an entity should apply to achieve the core principle. This guidance is effective for annual reporting periods beginning after December 15, 2017 and interim reporting periods within that annual period and allows for both retrospective and modified retrospective methods of adoption. Early adoption was permitted for annual periods beginning after December 15, 2016. The Company intends to adopt the guidance using the modified retrospective method. Rental revenue from lease contracts represents a significant portion of our total revenues and is a specific scope exception provided by this guidance. However, common area maintenance and other tenant reimbursable expenses provided to the lessee are considered a non-lease component and will be required to be separated from rental revenue and recorded on a separate financial statement line item upon adoption of the new accounting guidance on leases discussed below. Certain of our other revenue streams, such as management, development and other fee arrangements, as well as recognition of gains on full or partial sales of real estate may be impacted by the new guidance. The Company has finalized a project plan, including determination of each applicable revenue stream required to be analyzed within the scope of this accounting guidance. The Company has completed its analysis of management fee income and has concluded the adoption will not have any impact on the method of revenue recognition of these revenues.The Company continues the process of reviewing various customer revenue contracts (primarily consisting of parking and other revenues) to analyze the overall impact the adoption will have on the Company’s Statement of Operations.
In February 2016, the FASB issued an amendment to the accounting guidance on leases. This guidance sets out the principles for the recognition, measurement, presentation and disclosure of leases for both parties to a contract (i.e., lessees and lessors). The new guidance requires lessees to apply a dual approach, classifying leases as either finance or operating leases based on the principle of whether or not the lease is effectively a financed purchase by the lessee. This classification will determine whether lease expense is recognized based on an effective interest method or on a straight line basis over the term of the lease, respectively. A lessee is also required to record a right-of-use asset and a lease liability for all leases with a term of greater than 12 months regardless of their classification. Leases with a term of 12 months or less will be accounted for similar to existing guidance for operating leases today. The new standard requires lessors to account for leases using an approach that is substantially equivalent to existing guidance for sales-type leases, direct financing leases and operating leases. The guidance is expected to impact the Company’s consolidated financial statements as the Company has certain operating and land lease arrangements for which it is the lessee. The new guidance supersedes the previous leases accounting standard. This guidance is effective for fiscal years, and for interim reporting periods within those fiscal years, beginning after December 15, 2018. Early adoption is permitted. The adoption of the new guidance is expected to have an impact on the consolidated financial statements as the Company has material ground lease arrangements, as well as other lease agreements. In addition, the Company believes it will be precluded from capitalizing its internal leasing costs, as the costs are not expected to be directly incremental to the successful execution of a lease, as required by the new guidance. The Company is in the process of evaluating the impact of this guidance.
In November 2016, the FASB issued an amendment to the accounting guidance on the classification and presentation of changes in restricted cash on the statement of cash flows. The guidance requires restricted cash to be included with cash and cash equivalents when reconciling the beginning-of-period and end-of-period total amounts shown in the statement of cash flows. This guidance is effective for fiscal years, and for interim reporting periods within those fiscal years, beginning after December 15, 2017. Early adoption is permitted. The guidance should be adopted using a retrospective transition method. The Company is currently in the process of evaluating the impact of adopting this guidance on its Consolidated Statements of Cash Flows.
In February 2017, the FASB issued an amendment to the accounting guidance on the derecognition of nonfinancial assets. The guidance clarifies the definition of an in substance nonfinancial asset and the recognition of gains and losses from the transfer of nonfinancial assets and for partial sales of nonfinancial assets, which would include real estate. This guidance is effective for fiscal years, and for interim reporting periods within those fiscal years, beginning after December 15, 2017. Early adoption is permitted. The Company is in the process of evaluating the impact of this guidance.
Forest City Realty Trust, Inc. and Subsidiaries
Notes to Consolidated Financial Statements
(Unaudited)
Related Party Transactions
The Company and certain of its affiliates entered into a Master Contribution and Sale Agreement (the “Master Contribution Agreement”) with Bruce C. Ratner (“Mr. Ratner”), Executive Vice President, and certain entities and individuals affiliated with Mr. Ratner (the “BCR Entities”) in August 2006 to purchase their interests in a total of 30 retail, office and residential operating properties and service companies in the Greater New York City metropolitan area. The Company issued Class A Common Units (“2006 Units”) in a jointly-owned, limited liability company in exchange for their interests. The 2006 Units may be exchanged for one of the following forms of consideration at the Company’s sole discretion: (i) an equal number of shares of the Company’s Class A common stock or, (ii) cash based on a formula using the average closing price of the Class A common stock at the time of conversion or, (iii) a combination of cash and shares of the Company’s Class A common stock. The Company has no rights to redeem or repurchase the 2006 Units. Pursuant to the Master Contribution Agreement, certain projects under development would remain owned jointly until each project was completed and achieved “stabilization.” Upon stabilization, each project would be valued and the Company, in its discretion, would choose among various ownership options for the project. In connection with the Master Contribution Agreement, the parties entered into the Tax Protection Agreement (the “Tax Protection Agreement”). The Tax Protection Agreement indemnified the BCR Entities included in the initial closing against taxes payable by reason of any subsequent sale of certain operating properties and expires in November 2018.
Pursuant to the Master Contribution Agreement, 2006 Units not exchanged are entitled to a distribution preference payment equal to the dividends paid on an equivalent number of shares of the Company’s common stock. The Company recorded $162,000 and $334,000 during the three and six months ended June 30, 2017, respectively, and $116,000 and $427,000 during the three and six months ended June 30, 2016, respectively, related to the distribution preference payment, which is classified as noncontrolling interest expense on the Company’s Consolidated Statement of Operations.
As a result of the January 2017 sale of Shops at Bruckner Boulevard, an unconsolidated specialty retail center in Bronx, New York, the Company accrued $482,000 related to a tax indemnity payment due to the BCR Entities in accordance with the terms of the Tax Protection Agreement. The Company paid the BCR Entities $241,000 during the three months ended June 30, 2017 and expects to remit the remaining amounts in quarterly installments.
As a result of the January 2016 sale of 625 Fulton Avenue, a development site in Brooklyn, New York, the Company accrued $6,238,000 related to a tax indemnity payment due to the BCR Entities in accordance with the terms of the Tax Protection Agreement. Installments totaling $4,680,000 were paid during the year ended December 31, 2016. The remaining amount was included in accounts payable, accrued expenses and other liabilities at December 31, 2016 and was paid in January 2017.
In March 2017, certain BCR Entities exchanged 142,879 of the 2006 Units. The Company issued 142,879 shares of its Class A common stock for the exchanged 2006 Units. The Company accounted for the exchange as a purchase of noncontrolling interests, resulting in a reduction of noncontrolling interests of $7,288,000, an increase to Class A common stock of $1,000 and a combined increase to additional paid-in capital of $7,287,000, accounting for the fair value of common stock issued and the difference between the fair value of consideration exchanged and the historical cost basis of the noncontrolling interest balance. At June 30, 2017 and December 31, 2016, 1,797,909 and 1,940,788 of the 2006 Units were outstanding, respectively.
In December 2016, the Company’s Board of Directors approved, and the Company entered into a reclassification agreement with RMS Limited Partnership (“RMS”), the former controlling stockholder of the Company's Class B shares (the “Reclassification Agreement”). The Reclassification Agreement provided that, at the Effective Time, as defined in the Agreement, following the satisfaction of the conditions thereto, each share of Class B Common Stock issued and outstanding immediately prior to the Effective Time would be reclassified and exchanged into 1.31 shares of Class A Common Stock, with a right to cash in lieu of fractional shares (the “Reclassification”). At the Company’s Annual Meeting of Stockholders held on June 9, 2017, the stockholders approved the Reclassification. See Note I – Capital Stock for additional information.
In October 2016, the Company entered into a Reimbursement Agreement with RMS (the “Reimbursement Agreement”). The Company agreed to reimburse RMS (together with its officers, directors, employees, beneficiaries, trustees, representatives and agents)(“Reimbursed Persons”) for reasonable and documented fees and out-of-pocket expenses of RMS’s financial, legal and public relations advisors incurred in evaluating and negotiating the Reclassification. In addition, the Company agreed to reimburse the Reimbursed Persons for (i) reasonable costs and expenses incurred in connection with any Proceeding (as defined in the Reimbursement Agreement) to which such Reimbursed Person is a party or otherwise involved in and (ii) any losses, damages or liabilities actually and reasonably suffered or incurred in any such Proceeding by a Reimbursed Person. Amounts incurred subject to the Reimbursement Agreement were approximately $4,060,000 and $1,207,000 during the six months ended June 30, 2017 and the year ended December 31, 2016, respectively. See Note I – Capital Stock for additional information.
Forest City Realty Trust, Inc. and Subsidiaries
Notes to Consolidated Financial Statements
(Unaudited)
Accumulated Other Comprehensive Loss
The following table summarizes the components of accumulated other comprehensive income (loss) (“accumulated OCI”):
|
| | | | | | |
| | June 30, 2017 | December 31, 2016 |
| | (in thousands) |
Unrealized losses on interest rate derivative contracts (1) | $ | 11,923 |
| $ | 14,473 |
|
| Noncontrolling interest | (56 | ) | (63 | ) |
| Accumulated Other Comprehensive Loss | $ | 11,867 |
| $ | 14,410 |
|
| |
| (1) | Includes unrealized losses on interest rate swaps accounted for as hedges held by certain of the Company’s equity method investees. |
The following table summarizes the changes, net of noncontrolling interest, of accumulated OCI by component:
|
| | | | | | | | | |
| | Foreign Currency Translation | Interest Rate Contracts | Total |
| | (in thousands) |
| Six Months Ended June 30, 2017 | | | |
| Balance, January 1, 2017 | $ | — |
| $ | (14,410 | ) | $ | (14,410 | ) |
| Gain recognized in accumulated OCI | — |
| (336 | ) | (336 | ) |
| Loss reclassified from accumulated OCI | — |
| 2,879 |
| 2,879 |
|
| Total other comprehensive income | — |
| 2,543 |
| 2,543 |
|
| Balance, June 30, 2017 | $ | — |
| $ | (11,867 | ) | $ | (11,867 | ) |
| Six Months Ended June 30, 2016 | | | |
| Balance, January 1, 2016 | $ | (95 | ) | $ | (67,810 | ) | $ | (67,905 | ) |
| Gain (loss) recognized in accumulated OCI | 95 |
| (11,590 | ) | (11,495 | ) |
| Loss reclassified from accumulated OCI | — |
| 20,166 |
| 20,166 |
|
| Total other comprehensive income | 95 |
| 8,576 |
| 8,671 |
|
| Balance, June 30, 2016 | $ | — |
| $ | (59,234 | ) | $ | (59,234 | ) |
The following table summarizes losses reclassified from accumulated OCI and their location on the Consolidated Statements of Operations:
|
| | | | | |
| Accumulated OCI Components | Loss Reclassified from Accumulated OCI | | Location on Consolidated Statements of Operations |
| | (in thousands) | | |
| Six Months Ended June 30, 2017 | | | |
| Interest rate contracts | $ | 1,510 |
| | Interest expense |
| Interest rate contracts | 1,376 |
| | Earnings from unconsolidated entities |
| | 2,886 |
| | Total before noncontrolling interest |
| | (7 | ) | | Noncontrolling interest |
| | $ | 2,879 |
| | Loss reclassified from accumulated OCI |
| Six Months Ended June 30, 2016 | | | |
| Interest rate contracts | $ | 18,436 |
| | Interest expense |
| Interest rate contracts | 113 |
| | Net gain on disposition of full or partial interest in rental properties, net of tax |
| Interest rate contracts | 1,625 |
| | Earnings from unconsolidated entities |
| | 20,174 |
| | Total before noncontrolling interest |
| | (8 | ) | | Noncontrolling interest |
| | $ | 20,166 |
| | Loss reclassified from accumulated OCI |
Forest City Realty Trust, Inc. and Subsidiaries
Notes to Consolidated Financial Statements
(Unaudited)
Noncontrolling Interest
During the three months ended June 30, 2017, the Company exercised a promote option in the Arizona State Retirement System joint venture agreement, whereby the Company increased its ownership in the joint venture from 25.00% to 29.63%, as a result of the funds cumulative financial performance and estimated value creation. The non-cash transaction resulted in a decrease to noncontrolling interest and a corresponding increase to additional paid-in capital of $10,931,000.
The Company owned an equity interest in Barclays Center arena and the Nets through the Company’s consolidated subsidiary Nets Sports & Entertainment (“NS&E”). During the six months ended June 30, 2016, subsequent to the sale of Barclays Center and the Nets, the Company purchased NS&E’s partners’ interest for $38,951,000. This cash payment together with the partners’ historical noncontrolling interest debit balance resulted in a decrease to additional paid-in capital as reflected on the Consolidated Statement of Equity.
Organizational Transformation and Termination Benefits
The following table summarizes the components of organizational transformation and termination benefits:
|
| | | | | | | | | | | | | |
| | Three Months Ended June 30, | | Six Months Ended June 30, |
| | 2017 | 2016 | | 2017 | 2016 |
| | (in thousands) |
| Termination benefits | $ | 4,585 |
| $ | 2,612 |
| | $ | 8,737 |
| $ | 7,563 |
|
| Shareholder activism costs | 2,278 |
| — |
| | 2,651 |
| — |
|
| Reorganization costs | — |
| 2,978 |
| | — |
| 5,975 |
|
| REIT conversion costs | — |
| 91 |
| | — |
| 863 |
|
| Total | $ | 6,863 |
| $ | 5,681 |
| | $ | 11,388 |
| $ | 14,401 |
|
For the periods presented, the Company experienced workplace reductions and recorded the associated termination benefits expenses (outplacement and severance payments based on years of service and other defined criteria) for each occurrence.
Shareholder activism costs are comprised of advisory, legal and other professional fees associated with activism matters. Reorganization costs consist primarily of consulting and other professional fees related to the 2016 restructuring of the organization by function (operations, development and corporate support). REIT conversion costs consist primarily of legal, accounting, consulting and other professional fees. The Company has segregated these costs along with termination benefits and reported these amounts as organizational transformation and termination benefits in the Consolidated Statements of Operations and reported in the Corporate segment.
The following table summarizes the activity in the accrued severance balance for termination benefits:
|
| | | | | | | | | | | | | |
| | Three Months Ended June 30, | | Six Months Ended June 30, |
| | 2017 | 2016 | | 2017 | 2016 |
| | (in thousands)
|
| Accrued severance benefits, beginning balance | $ | 9,058 |
| $ | 11,722 |
| | $ | 9,969 |
| $ | 16,338 |
|
| Termination benefits expense | 4,585 |
| 2,612 |
| | 8,737 |
| 7,563 |
|
| Payments | (1,933 | ) | (3,057 | ) | | (6,996 | ) | (12,624 | ) |
| Accrued severance benefits, ending balance | $ | 11,710 |
| $ | 11,277 |
| | $ | 11,710 |
| $ | 11,277 |
|
Forest City Realty Trust, Inc. and Subsidiaries
Notes to Consolidated Financial Statements
(Unaudited)
Supplemental Non-Cash Disclosures
The following table summarizes the impact to the applicable balance sheet line items as a result of various non-cash transactions. Non-cash transactions primarily include dispositions of operating properties whereby the nonrecourse mortgage debt is assumed by the buyer or otherwise extinguished at closing, exchanges of 2006 Units or senior notes for Class A common stock, changes in consolidation methods of fully consolidated properties due to the occurrence of triggering events including, but not limited to, disposition of a partial interest in rental properties, change in construction payables and other capital expenditures, notes receivable from the sale of rental properties or development project, redemption of redeemable noncontrolling interest, adoption of new accounting guidance for debt issuance costs and capitalization of stock-based compensation granted to employees directly involved with the development and construction of real estate.
|
| | | | | | |
| | Six Months Ended June 30, |
| | 2017 | 2016 |
| | (in thousands) |
| Non-cash changes to balance sheet - Investing Activities | | |
| Projects under construction and development | $ | (14,157 | ) | $ | (35,689 | ) |
| Completed rental properties | (61,695 | ) | (1,178,704 | ) |
| Restricted cash | — |
| (12,265 | ) |
| Notes receivable | 2,500 |
| 275,700 |
|
| Investments in and advances to affiliates - due to dispositions or change in control | 603 |
| 125,732 |
|
| Investments in and advances to affiliates - other activity | 166 |
| 1,720 |
|
| Total non-cash effect on investing activities | $ | (72,583 | ) | $ | (823,506 | ) |
| Non-cash changes to balance sheet - Financing Activities | | |
| Nonrecourse mortgage debt and notes payable, net | $ | (46,054 | ) | $ | (843,595 | ) |
| Convertible senior debt, net | — |
| (125 | ) |
| Class A common stock | 59 |
| — |
|
| Additional paid-in capital | 15,868 |
| (13,659 | ) |
| Redeemable noncontrolling interest | — |
| (159,202 | ) |
| Noncontrolling interest | (18,545 | ) | 19,179 |
|
| Total non-cash effect on financing activities | $ | (48,672 | ) | $ | (997,402 | ) |
B. Notes Receivable
The following table summarizes the Company’s interest bearing notes receivable:
|
| | | | | | | | |
| | June 30, 2017 | December 31, 2016 | Maturity Date | Weighted Average Interest Rate |
| | (in thousands) | | |
| Stapleton | $ | 182,537 |
| $ | 141,034 |
| Various | 8.57% |
| The Nets sale | 125,100 |
| 125,100 |
| January 2021 | 4.50% |
| Barclays Center sale | 92,600 |
| 92,600 |
| January 2019 | 4.50% |
| Other | 17,993 |
| 24,429 |
| Various | 4.93% |
| Total | $ | 418,230 |
| $ | 383,163 |
| | |
Forest City Realty Trust, Inc. and Subsidiaries
Notes to Consolidated Financial Statements
(Unaudited)
C. Nonrecourse Mortgage Debt and Notes Payable, Net
The following table summarizes the nonrecourse mortgage debt and notes payable, net maturities as of June 30, 2017:
|
| | | |
| Years Ending December 31, | |
| | (in thousands) |
| 2017 | $ | 207,166 |
|
| 2018 | 485,570 |
|
| 2019 | 469,018 |
|
| 2020 | 219,130 |
|
| 2021 | 193,259 |
|
| Thereafter | 1,619,746 |
|
| | 3,193,889 |
|
| Net unamortized mortgage procurement costs | (35,609 | ) |
| Total | $ | 3,158,280 |
|
D. Revolving Credit Facility
In November 2015, the Company entered into a Revolving Credit Agreement which provided for total available borrowings of $500,000,000 (increased to $600,000,000 in May 2016) and contains an accordion provision, subject to bank approval, allowing the Company to increase total available borrowings to $750,000,000 (“Revolving Credit Facility”).
The Revolving Credit Facility matures in November 2019, and provides for two six-month extension periods, subject to certain conditions. Borrowings bear interest at the Company’s option at either London Interbank Offered Rate (“LIBOR”) (1.22% at June 30, 2017) plus a margin of 1.15% - 1.85% (1.25% at June 30, 2017) or the Prime Rate (4.25% at June 30, 2017) plus a margin of 0.15% - 0.85% (0.25% at June 30, 2017). In addition, the Revolving Credit Facility is subject to an annual facility fee of 0.20% - 0.35% (0.25% at June 30, 2017) of total available borrowings. Up to $150,000,000 of the available borrowings can be used for letters of credit. The applicable margins and annual facility fee are based on the Company’s total leverage ratio (adjusted quarterly, if applicable).
The Revolving Credit Facility has restrictive covenants, including a prohibition on certain types of dispositions, mergers, consolidations, and limitations on lines of business the Company is allowed to conduct. Additionally, the Revolving Credit Facility contains financial covenants, including the maintenance of a maximum total leverage ratio, maximum secured and unsecured leverage ratios, maximum secured recourse leverage ratio, a minimum fixed charge coverage ratio, and a minimum unencumbered interest coverage ratio (all as specified in the Revolving Credit Agreement). At June 30, 2017, the Company was in compliance with all of these financial covenants.
The following table summarizes available credit on the Revolving Credit Facility:
|
| | | | | | |
| | June 30, 2017 | December 31, 2016 |
| | (in thousands) |
| Total available borrowings | $ | 600,000 |
| $ | 600,000 |
|
| Less: | | |
| Outstanding borrowings | — |
| — |
|
| Letters of credit | 43,018 |
| 44,215 |
|
| Available credit | $ | 556,982 |
| $ | 555,785 |
|
As of June 30, 2017 and December 31, 2016, unamortized debt issuance costs related to the Revolving Credit Facility of $2,278,000 and $2,757,000, respectively, are included in other assets on the Consolidated Balance Sheets.
Forest City Realty Trust, Inc. and Subsidiaries
Notes to Consolidated Financial Statements
(Unaudited)
E. Term Loan, Net
In May 2016, the Company entered into a Term Loan Credit Agreement which provides a $335,000,000 senior unsecured term loan credit facility (“Term Loan”).
The Term Loan matures in May 2021 and bears interest at the Company’s option at either LIBOR (based on the approximate date of the initial borrowings and adjusted monthly thereafter) (1.05% at June 30, 2017) plus a margin of 1.30% - 2.20% (1.45% at June 30, 2017) or the Prime Rate plus a margin of 0.30% - 1.20% (0.45% at June 30, 2017). The applicable margins are based on the Company’s total leverage ratio. Upon the Company obtaining an investment grade credit rating, established by certain debt rating agencies for the Company’s long term, senior, unsecured non-credit enhanced debt (the “Debt Ratings”), the applicable margin will, at the Company’s election, be based on the Company’s then-current Debt Ratings.
The Term Loan contains identical financial covenants as the Revolving Credit Facility as described in Note D – Revolving Credit Facility. Additionally, the Term Loan contains customary events of default provisions, including failure to pay indebtedness, breaches of covenants and bankruptcy or other insolvency events, which could result in the acceleration of all amounts and cancellation of all commitments outstanding under the Term Loan, as well as customary representations and warranties and affirmative and negative covenants.
The following table summarizes outstanding borrowings of the Term Loan, net: |
| | | | | | |
| | June 30, 2017 | December 31, 2016 |
| | (in thousands) |
| Total outstanding borrowings | $ | 335,000 |
| $ | 335,000 |
|
| Net unamortized debt procurement costs | (1,532 | ) | (1,732 | ) |
| Total | $ | 333,468 |
| $ | 333,268 |
|
F. Convertible Senior Debt, Net
The following table summarizes the convertible senior debt, net:
|
| | | | | | |
| | June 30, 2017 | December 31, 2016 |
| | (in thousands) |
| 4.250% Notes due 2018 | $ | 73,216 |
| $ | 73,216 |
|
| 3.625% Notes due 2020 | 40,021 |
| 40,021 |
|
| | 113,237 |
| 113,237 |
|
| Net unamortized debt procurement costs | (827 | ) | (1,056 | ) |
| Total | $ | 112,410 |
| $ | 112,181 |
|
During the six months ended June 30, 2016, the Company entered into separate, privately negotiated exchange agreements with certain holders of the Company’s convertible senior notes. Under the terms of the agreements, holders agreed to exchange certain notes for either shares of Class A common stock or cash payments. Under the accounting guidance for induced conversions of convertible debt, additional amounts paid to induce the holders to exchange the notes were expensed resulting in a loss on extinguishment of debt.
The following table summarizes the convertible senior debt transactions completed during the six months ended June 30, 2016 with no similar transaction occurring during the six months ended June 30, 2017:
|
| | | | | | | | | | | | |
| Agreement Date | Issuance | Aggregate Principal | Class A Common Shares Issued | Cash Payments to Noteholders | Loss on Extinguishment |
| | | (in thousands, except share data) |
| January 20, 2016 | 2016 Senior Notes | $ | 125 |
| 9,298 |
| $ | — |
| $ | 59 |
|
| March 14, 2016 | 2018 Senior Notes | 77,310 |
| — |
| 90,958 |
| 15,370 |
|
| March 17, 2016 | 2018 Senior Notes | 4,000 |
| — |
| 4,707 |
| 795 |
|
| March 14, 2016 | 2020 Senior Notes | 76,334 |
| — |
| 86,858 |
| 12,823 |
|
| Total | $ | 157,769 |
| 9,298 |
| $ | 182,523 |
| $ | 29,047 |
|
Forest City Realty Trust, Inc. and Subsidiaries
Notes to Consolidated Financial Statements
(Unaudited)
Convertible Senior Notes due 2018
Holders may convert their 4.250% Convertible Senior Notes due August 15, 2018 (“2018 Senior Notes”) at their option at any time prior to the close of business on the scheduled trading day immediately preceding the maturity date. Initially, upon conversion, a noteholder would have received 46.1425 shares of Class A common stock per $1,000 principal amount of 2018 Senior Notes (“Conversion Rate”), based on a conversion price of approximately $21.67 per share of Class A common stock, subject to adjustment. In accordance with the 2018 Senior Note Indenture, the second quarter 2016 cash dividend paid by the Company triggered a required adjustment to the Conversion Rate from 46.1425 shares of Class A common stock to 46.6375 shares of Class A common stock effective as of June 10, 2016, the record date for the second quarter 2016 dividend. The second quarter 2017 dividend triggered an additional required adjustment from 46.6375 shares of Class A common stock to 47.2567 shares of Class A common stock effective as of June 9, 2017, the record date for the second quarter 2017 dividend. See Note J – Dividends for detailed information on the Company’s cash dividends.
Convertible Senior Notes due 2020
Holders may convert their 3.625% Convertible Senior Notes due August 15, 2020 (“2020 Senior Notes”) at their option at any time prior to the close of business on the scheduled trading day immediately preceding the maturity date. Initially, upon conversion, a noteholder would have received 41.3129 shares of Class A common stock per $1,000 principal amount of 2020 Senior Notes (“Conversion Rate”), based on a conversion price of approximately $24.21 per share of Class A common stock, subject to adjustment. In accordance with the 2020 Senior Note Indenture, the second quarter 2016 cash dividend paid by the Company triggered a required adjustment to the Conversion Rate from 41.3129 shares of Class A common stock to 41.7561 shares of Class A common stock effective as of June 10, 2016, the record date for the second quarter 2016 dividend. The second quarter 2017 dividend triggered an additional required adjustment from 41.7561 shares of Class A common to 42.3105 shares of Class A common stock effective as of June 9, 2017, the record date for the second quarter 2017 dividend. See Note J – Dividends for detailed information on the Company’s cash dividends.
All of the senior debt are unsecured senior obligations and rank equally with all existing and future unsecured indebtedness; however, they are effectively subordinated to all existing and future secured indebtedness and other liabilities of the Company’s subsidiaries to the extent of the value of the collateral securing that other debt.
Forest City Realty Trust, Inc. and Subsidiaries
Notes to Consolidated Financial Statements
(Unaudited)
G. Derivative Instruments and Hedging Activities
Risk Management Objective of Using Derivatives
The Company maintains an overall interest rate risk management strategy using derivative instruments to minimize significant unplanned impact on earnings and cash flows caused by interest rate volatility. The strategy uses interest rate swaps and caps having indices related to the pricing of specific liabilities. The Company enters into interest rate swaps to convert floating-rate debt to fixed-rate long-term debt, and vice-versa, depending on market conditions. Interest rate swaps are generally for periods of one to ten years. Interest rate caps are generally for periods of one to three years. The use of interest rate caps is consistent with the Company’s risk management objective to reduce or eliminate exposure to variability in future cash flows primarily attributable to increases in interest rates on its floating-rate debt.
Cash Flow Hedges of Interest Rate Risk
The Company’s objectives in using interest rate derivatives are to add stability to interest expense and to manage exposure to interest rate movements. The Company primarily uses interest rate caps and swaps as part of its interest rate risk management strategy. Interest rate caps designated as cash flow hedges involve the receipt of variable-rate amounts from a counterparty if interest rates rise above the strike rate on the contract in exchange for an upfront premium. Interest rate swaps designated as cash flow hedges involve the receipt of variable-rate amounts from a counterparty in exchange for the Company making fixed-rate payments over the life of the agreements without exchange of the underlying notional amount.
The effective portion of changes in the fair value of derivatives designated and qualifying as cash flow hedges is recorded in accumulated OCI and is subsequently reclassified into earnings during the period the hedged forecasted transaction affects earnings. The ineffective portion of the change in fair value is recognized directly in earnings. Ineffectiveness was insignificant during the three and six months ended June 30, 2017 and 2016. As of June 30, 2017, the Company expects it will reclassify amounts recorded in accumulated OCI into earnings as an increase in interest expense of approximately $4,595,000 within the next twelve months. However, the actual amount reclassified could vary due to future changes in the fair value of these derivatives.
Fair Value Hedges of Interest Rate Risk
The Company enters into total rate of return swaps (“TROR”) on various tax-exempt fixed-rate borrowings. The TROR convert borrowings from a fixed rate to a variable rate. The TROR requires the payment of a variable interest rate, generally equivalent to the Securities Industry and Financial Markets Association (“SIFMA”) rate (0.91% at June 30, 2017) plus a spread. Additionally, the Company has guaranteed the fair value of the underlying borrowings. Fluctuation in the value of the TROR is offset by the fluctuation in the value of the underlying borrowings, resulting in minimal financial impact. At June 30, 2017, the aggregate notional amount of TROR designated as fair value hedging instruments is $551,985,000. The underlying TROR borrowings are subject to a fair value adjustment.
Forest City Realty Trust, Inc. and Subsidiaries
Notes to Consolidated Financial Statements
(Unaudited)
Nondesignated Hedges of Interest Rate Risk
The Company uses derivative contracts to hedge certain interest rate risk, even though the contracts do not qualify for, or the Company has elected not to apply, hedge accounting. In these situations, the derivative is recorded at its fair value with changes reflected in earnings.
The Company has certain undesignated TROR where the associated debt is held by an unconsolidated affiliate or unrelated third parties. The change in fair value of these TROR is recognized in earnings. At June 30, 2017, the aggregate notional amount of these TROR is $137,628,000.
In instances where the Company enters into separate derivative instruments effectively hedging the same debt for consecutive annual periods, the duplicate amount of notional is excluded from the following disclosure in an effort to provide information that enables the financial statement user to understand the Company’s volume of derivative activity.
The following table summarizes the fair values and location in the Consolidated Balance Sheets of all derivative instruments:
|
| | | | | | | | | | | | | |
| | Fair Value of Derivative Instruments |
| | Asset Derivatives (included in Other Assets) | | Liability Derivatives (included in Accounts Payable, Accrued Expenses and Other Liabilities) |
| | Current Notional | Fair Value | | Current Notional | Fair Value |
| | (in thousands) |
| | June 30, 2017 |
| Derivatives Designated as Hedging Instruments | | | | | |
| Interest rate swaps | $ | 63,810 |
| $ | 639 |
| | $ | 34,416 |
| $ | 1,353 |
|
| TROR | 315,970 |
| 5,361 |
| | 236,015 |
| 6,297 |
|
| Total | $ | 379,780 |
| $ | 6,000 |
| | $ | 270,431 |
| $ | 7,650 |
|
| Derivatives Not Designated as Hedging Instruments | | | | | |
| Interest rate caps | $ | 69,518 |
| $ | — |
| | $ | — |
| $ | — |
|
| TROR | 100,635 |
| 5,731 |
| | 36,993 |
| 12,072 |
|
| Total | $ | 170,153 |
| $ | 5,731 |
| | $ | 36,993 |
| $ | 12,072 |
|
| | | | | | |
| | December 31, 2016 |
| Derivatives Designated as Hedging Instruments | | | | | |
| Interest rate swaps | $ | 64,248 |
| $ | 593 |
| | $ | 34,666 |
| $ | 1,504 |
|
| TROR | 235,970 |
| 5,008 |
| | 316,015 |
| 12,442 |
|
| Total | $ | 300,218 |
| $ | 5,601 |
| | $ | 350,681 |
| $ | 13,946 |
|
| Derivatives Not Designated as Hedging Instruments | | | | | |
| Interest rate caps | $ | 69,518 |
| $ | — |
| | $ | — |
| $ | — |
|
| TROR | 100,800 |
| 4,117 |
| | 37,044 |
| 12,256 |
|
| Total | $ | 170,318 |
| $ | 4,117 |
| | $ | 37,044 |
| $ | 12,256 |
|
Forest City Realty Trust, Inc. and Subsidiaries
Notes to Consolidated Financial Statements
(Unaudited)
The following table summarizes the impact of gains and losses related to derivative instruments designated as cash flow hedges included in the accumulated OCI section of the Consolidated Balance Sheets and in equity in earnings and interest expense in the Consolidated Statements of Operations:
|
| | | | | | | | | | | |
| | | | Loss Reclassified from Accumulated OCI |
Derivatives Designated as Cash Flow Hedging Instruments | Gain (Loss) Recognized in OCI (Effective Portion) | | Location on Consolidated Statements of Operations | Effective Amount | Ineffective Amount |
| | (in thousands) |
| Three Months Ended June 30, 2017 | | | | | |
| Interest rate caps and interest rate swaps | $ | (577 | ) | | Interest expense | $ | (739 | ) | $ | (8 | ) |
| | | | Earnings from unconsolidated entities | (667 | ) | — |
|
| Total | $ | (577 | ) | | | $ | (1,406 | ) | $ | (8 | ) |
| Six Months Ended June 30, 2017 | | | | | |
| Interest rate caps and interest rate swaps | $ | (336 | ) | | Interest expense | $ | (1,461 | ) | $ | (49 | ) |
| | | | Earnings from unconsolidated entities | (1,376 | ) | — |
|
| Total | $ | (336 | ) | | | $ | (2,837 | ) | $ | (49 | ) |
| | | | | | |
| Three Months Ended June 30, 2016 | | | | | |
| Interest rate caps and interest rate swaps | $ | (3,505 | ) | | Interest expense | $ | (9,195 | ) | $ | (8 | ) |
| | | | Net gain (loss) on disposition of full or partial interest in rental properties, net of tax
| — |
| — |
|
| | | | Earnings from unconsolidated entities | (810 | ) | — |
|
| Total | $ | (3,505 | ) | | | $ | (10,005 | ) | $ | (8 | ) |
| Six Months Ended June 30, 2016 | | | | | |
| Interest rate caps and interest rate swaps | $ | (11,590 | ) | | Interest expense | $ | (18,409 | ) | $ | (27 | ) |
| | | | Net gain (loss) on disposition of full or partial interest in rental properties, net of tax
| (113 | ) | — |
|
| | | | Earnings from unconsolidated entities | (1,625 | ) | — |
|
| Total | $ | (11,590 | ) | | | $ | (20,147 | ) | $ | (27 | ) |
Forest City Realty Trust, Inc. and Subsidiaries
Notes to Consolidated Financial Statements
(Unaudited)
The following table summarizes the impact of gains and losses related to derivative instruments not designated as cash flow hedges in the Consolidated Statements of Operations:
|
| | | | | | | | | | | | | |
| | Net Gain (Loss) Recognized |
| | Three Months Ended June 30, | | Six Months Ended June 30, |
| | 2017 | 2016 | | 2017 | 2016 |
| | (in thousands) |
| Derivatives Designated as Fair Value Hedging Instruments | | | | | |
TROR (1) | $ | 1,147 |
| $ | 306 |
| | $ | 6,498 |
| $ | (623 | ) |
| Derivatives Not Designated as Hedging Instruments | | | | | |
| Interest rate caps and interest rate swaps | $ | — |
| $ | — |
| | $ | — |
| $ | (94 | ) |
| TROR | 300 |
| (581 | ) | | 1,798 |
| (1,981 | ) |
| Total | $ | 300 |
| $ | (581 | ) | | $ | 1,798 |
| $ | (2,075 | ) |
| |
| (1) | The net gain (loss) recognized in interest expense from the change in fair value of the underlying TROR borrowings was $(1,147) and $(6,498) for the three and six months ended June 30, 2017, respectively, and $(306) and $623 for the three and six months ended June 30, 2016, respectively, offsetting the gain (loss) recognized on the TROR. |
Credit-risk-related Contingent Features
The principal credit risk of the Company’s interest rate risk management strategy is the potential inability of a counterparty to cover its obligations. If a counterparty fails to fulfill its obligation, the risk of loss approximates the fair value of the derivative. To mitigate this exposure, the Company generally purchases derivative financial instruments from the financial institution that issues the related debt, from financial institutions with which the Company has other lending relationships, or from financial institutions with a minimum credit rating of AA at the time of the transaction.
Agreements with derivative counterparties contain provisions under which the counterparty could terminate the derivative obligations if the Company defaults on its obligations under the Revolving Credit Agreement and designated conditions are fulfilled. In instances where the Company’s subsidiaries have derivative obligations secured by a mortgage, the derivative obligations could be terminated if the indebtedness between the two parties is terminated, either by loan payoff or default of the indebtedness. In addition, certain subsidiaries have agreements containing provisions whereby the subsidiaries must maintain certain minimum financial ratios. As of June 30, 2017, the Company does not have any derivative contracts containing credit-risk related contingent features, such as a credit rating downgrade, that may trigger collateral to be posted with a counterparty.
The following table summarizes information about collateral posted for derivatives in liability positions as of June 30, 2017:
|
| | | | | | | | | | | | | | |
| | Collateral Information |
| | Notional Amount | Fair Value Prior to Nonperformance Risk | Nonperformance Risk | Collateral Posted | Nature of Collateral | Credit Risk Contingent Feature |
| | (in thousands) | | |
| Property Specific Swaps | $ | 34,416 |
| $ | 1,421 |
| $ | (68 | ) | $ | — |
| Mortgage liens | None |
| TROR | 273,008 |
| 18,342 |
| 27 |
| 58,937 |
| Restricted cash, notes receivable, letters of credit | None |
| Total | $ | 307,424 |
| $ | 19,763 |
| $ | (41 | ) | $ | 58,937 |
| | |
H. Fair Value Measurements
Fair Value Measurements on a Recurring Basis
The Company’s financial assets consist of interest rate caps, interest rate swaps and TROR with positive fair values included in other assets. The Company’s financial liabilities consist of interest rate swaps and TROR with negative fair values included in accounts payable, accrued expenses and other liabilities and borrowings subject to TROR included in nonrecourse mortgage debt and notes payable, net.
Forest City Realty Trust, Inc. and Subsidiaries
Notes to Consolidated Financial Statements
(Unaudited)
The following table summarizes information about financial assets and liabilities measured at fair value on a recurring basis, and indicates the fair value hierarchy of the valuation techniques utilized to determine such fair value:
|
| | | | | | | | | | | | |
| | June 30, 2017 |
| | Level 1 | Level 2 | Level 3 | Total |
| | (in thousands) |
| Interest rate swaps (assets) | $ | — |
| $ | 639 |
| $ | — |
| $ | 639 |
|
| Interest rate swaps (liabilities) | — |
| (1,353 | ) | — |
| (1,353 | ) |
| TROR (assets) | — |
| — |
| 11,092 |
| 11,092 |
|
| TROR (liabilities) | — |
| — |
| (18,369 | ) | (18,369 | ) |
| Fair value adjustment to the borrowings subject to TROR | — |
| — |
| 936 |
| 936 |
|
| Total | $ | — |
| $ | (714 | ) | $ | (6,341 | ) | $ | (7,055 | ) |
| | | | | |
| | December 31, 2016 |
| | (in thousands) |
| Interest rate swaps (assets) | $ | — |
| $ | 593 |
| $ | — |
| $ | 593 |
|
| Interest rate swaps (liabilities) | — |
| (1,504 | ) | — |
| (1,504 | ) |
| TROR (assets) | — |
| — |
| 9,125 |
| 9,125 |
|
| TROR (liabilities) | — |
| — |
| (24,698 | ) | (24,698 | ) |
| Fair value adjustment to the borrowings subject to TROR | — |
| — |
| 7,434 |
| 7,434 |
|
| Total | $ | — |
| $ | (911 | ) | $ | (8,139 | ) | $ | (9,050 | ) |
The following table presents a reconciliation of financial assets and liabilities measured at fair value on a recurring basis using significant unobservable inputs (Level 3):
|
| | | | | | | | | |
| | Net TROR | Fair value adjustment to the borrowings subject to TROR | Total |
| | (in thousands) |
| Six Months Ended June 30, 2017 | | | |
| Balance, January 1, 2017 | $ | (15,573 | ) | $ | 7,434 |
| $ | (8,139 | ) |
| Total realized and unrealized gains (losses): | | | |
| Included in earnings | 8,296 |
| (6,498 | ) | 1,798 |
|
| Balance, June 30, 2017 | $ | (7,277 | ) | $ | 936 |
| $ | (6,341 | ) |
| Six Months Ended June 30, 2016 | | | |
| Balance, January 1, 2016 | $ | (10,785 | ) | $ | 2,810 |
| $ | (7,975 | ) |
| Total realized and unrealized gains (losses): | | | |
| Included in earnings | (2,604 | ) | 623 |
| (1,981 | ) |
| Balance, June 30, 2016 | $ | (13,389 | ) | $ | 3,433 |
| $ | (9,956 | ) |
The following table presents quantitative information about the significant unobservable inputs used to estimate the fair value of financial instruments measured on a recurring basis as of June 30, 2017:
|
| | | | | | |
| | Quantitative Information about Level 3 Fair Value Measurements |
| | Fair Value June 30, 2017 | Valuation Technique | Unobservable Input | Input Values |
| | (in thousands) | | | |
| TROR | $ | (7,277 | ) | Third party bond pricing | Bond valuation | 87.63 - 121.72 |
| Fair value adjustment to the borrowings subject to TROR | $ | 936 |
| Third party bond pricing | Bond valuation | 87.63 - 103.17 |
Third party service providers involved in fair value measurements are evaluated for competency and qualifications. Fair value measurements, including unobservable inputs, are evaluated based on current transactions and experience in the real estate and capital markets.
The impact of changes in unobservable inputs used to determine the fair market value of the credit valuation adjustment, TROR and fair value adjustment to the borrowings subject to TROR are not deemed to be significant.
Forest City Realty Trust, Inc. and Subsidiaries
Notes to Consolidated Financial Statements
(Unaudited)
Fair Value of Other Financial Instruments
The carrying amount of accounts receivable and accounts payable, accrued expenses and other liabilities approximates fair value based upon the short-term nature of the instruments. The carrying amount of notes receivable approximates fair value since the interest rates on these notes approximates current market rates for similar instruments when considering the risk profile and quality of the collateral, if applicable. The Company estimates the fair value of its debt instruments by discounting future cash payments at interest rates the Company believes approximate the current market. Estimated fair value is based upon market prices of public debt, available industry financing data, current treasury rates, recent financing transactions, conversion features on convertible senior debt and loan to value ratios. The fair value of the Company’s debt instruments is classified as Level 3 in the fair value hierarchy.
The following table summarizes the fair value of nonrecourse mortgage debt and notes payable, net (exclusive of the fair value of derivatives), term loan, net and convertible senior debt, net:
|
| | | | | | | | | | | | | |
| | June 30, 2017 | | December 31, 2016 |
| | Carrying Value | Fair Value | | Carrying Value | Fair Value |
| | (in thousands) |
| Nonrecourse mortgage debt and notes payable, net | $ | 3,158,280 |
| $ | 3,157,468 |
| | $ | 3,120,833 |
| $ | 3,105,587 |
|
| Term loan, net | 333,468 |
| 333,639 |
| | 333,268 |
| 333,527 |
|
| Convertible senior debt, net | 112,410 |
| 131,254 |
| | 112,181 |
| 122,795 |
|
| Total | $ | 3,604,158 |
| $ | 3,622,361 |
| | $ | 3,566,282 |
| $ | 3,561,909 |
|
I. Capital Stock
Pursuant to the Reclassification Agreement, the Board submitted a proposal for stockholder approval to eliminate the dual-class share structure at the Company’s 2017 Annual Meeting of Stockholders. This proposal was approved by the stockholders at the Company’s Annual Meeting of Stockholders on June 9, 2017 and became effective following the market close on June 12, 2017. As a result, each share of the 18,788,163 shares of Class B common stock issued and outstanding immediately prior to the Effective Time were reclassified into 1.31 shares of Class A common stock. As such, 24,612,495 additional shares of Class A common stock were issued to the prior Class B common stockholders. Upon completion of this transaction, all outstanding shares of common stock are entitled to one vote per share on all matters brought to the Company’s stockholders, including but not limited to, the election of the entire Board of Directors.
Certain professional and consulting fees, including investment banking success fees incurred directly related to the stock conversion were recorded as a $9,305,000 reduction to additional paid-in capital, in accordance with applicable accounting requirements when raising permanent equity. Amounts include costs paid on behalf of RMS in accordance with the Reimbursement Agreement. See the “Related Party Transactions” section of Note A – Accounting Policies for detailed information of the Reimbursement Agreement.
J. Dividends
Prior to the taxable year ended December 31, 2016, our predecessor, Forest City Enterprises, Inc., operated as a C corporation. A REIT is not permitted to retain earnings and profits (“E&P”) accumulated during the periods when the company or its predecessor was taxed as a C corporation or accumulated by the Company’s or its predecessor’s TRS not converted to a qualified REIT subsidiary. The Company was required to make a distribution to its stockholders that equaled or exceeded its accumulated positive E&P. The 2016 E&P dividend summarized below was based on the estimated cumulative positive E&P of the Company’s predecessor.
Forest City Realty Trust, Inc. and Subsidiaries
Notes to Consolidated Financial Statements
(Unaudited)
The following table summarizes cash dividends declared by the Board of Directors on the Company’s Class A and Class B common stock (in thousands, except per share data):
|
| | | | | | | | | |
| Type | Date Declared | Record Date | Payment Date | Amount Per Share | Total Cash Payment |
| 2017 | | | | | |
| Quarterly | May 17, 2017 | June 9, 2017 | June 23, 2017 | $ | 0.09 |
| $ | 23,482 |
|
| Quarterly | March 1, 2017 | March 13, 2017 | March 27, 2017 | $ | 0.09 |
| $ | 23,441 |
|
| | | | Total | $ | 0.18 |
| $ | 46,923 |
|
| | | | | | |
| 2016 | | | | | |
| Quarterly | November 30, 2016 | December 12, 2016 | December 23, 2016 | $ | 0.06 |
| $ | 15,620 |
|
| Quarterly | August 18, 2016 | September 2, 2016 | September 16, 2016 | $ | 0.06 |
| $ | 15,621 |
|
| Quarterly | May 17, 2016 | June 10, 2016 | June 24, 2016 | $ | 0.06 |
| $ | 15,623 |
|
| Quarterly | February 18, 2016 | March 4, 2016 | March 18, 2016 | $ | 0.06 |
| $ | 15,596 |
|
| E&P | February 18, 2016 | March 4, 2016 | March 18, 2016 | $ | 0.10 |
| $ | 25,992 |
|
| | | | Total | $ | 0.34 |
| $ | 88,452 |
|
K. Stock-Based Compensation
During the six months ended June 30, 2017, the Company granted 26,112 stock options, 672,876 shares of restricted stock and 243,571 performance shares under the Company’s 1994 Stock Plan. The stock options had a grant-date fair value of $4.79, which was computed using the Black-Scholes option-pricing model using the following assumptions: expected term of 5.5 years, expected volatility of 25.1%, risk-free interest rate of 2.12%, and expected dividend yield of 1.69%. The exercise price of the options is $21.83, the closing price of the underlying Class A common stock on the date of grant. The restricted stock had a weighted average grant-date fair value of $21.85 per share, based on the closing price of the Class A common stock on the respective dates of grant. The performance shares had a grant-date fair value of $24.91 per share, which was computed using a Monte Carlo simulation.
At June 30, 2017, $337,000 of unrecognized compensation cost related to stock options is expected to be recognized over a weighted-average period of 9 months, $20,984,000 of unrecognized compensation cost related to restricted stock is expected to be recognized over a weighted-average period of 24 months, and $9,861,000 of unrecognized compensation cost related to performance shares is expected to be recognized over a weighted-average period of 20 months.
The following table summarizes stock-based compensation costs and related deferred income tax benefit recognized in the financial statements:
|
| | | | | | | | | | | | | |
| | Three Months Ended June 30, | | Six Months Ended June 30, |
| | 2017 | 2016 | | 2017 | 2016 |
| | (in thousands) |
| Stock option costs | $ | 137 |
| $ | 229 |
| | $ | 337 |
| $ | 526 |
|
| Restricted stock costs | 3,808 |
| 2,380 |
| | 8,946 |
| 7,928 |
|
| Performance share costs | 2,740 |
| 2,571 |
| | 4,758 |
| 4,717 |
|
| Total stock-based compensation costs | 6,685 |
| 5,180 |
| | 14,041 |
| 13,171 |
|
| Less amount capitalized into qualifying real estate projects | (1,808 | ) | (728 | ) | | (4,300 | ) | (2,559 | ) |
| Amount charged to operating expenses | 4,877 |
| 4,452 |
| | 9,741 |
| 10,612 |
|
| Depreciation expense on capitalized stock-based compensation | 234 |
| 217 |
| | 449 |
| 419 |
|
| Total stock-based compensation expense | $ | 5,111 |
| $ | 4,669 |
| | $ | 10,190 |
| $ | 11,031 |
|
| Deferred income tax benefit | $ | 109 |
| $ | 132 |
| | $ | 277 |
| $ | 321 |
|
The amount of grant-date fair value expensed immediately for awards granted to retirement-eligible grantees during the six months ended June 30, 2017 and 2016 was $867,000 and $1,166,000, respectively.
In connection with the vesting of restricted stock and performance shares during the six months ended June 30, 2017 and 2016, the Company repurchased 229,352 shares and 357,722 shares, respectively, of Class A common stock to satisfy the employees’ related minimum statutory tax withholding requirements. Shares repurchased during the six months ended June 30, 2017 and 2016 were returned to unissued shares with an aggregate cost basis of $5,051,000 and $7,198,000, respectively.
Forest City Realty Trust, Inc. and Subsidiaries
Notes to Consolidated Financial Statements
(Unaudited)
L. Write-Offs of Abandoned Development Projects and Demolition Costs
The Company reviews each project under development to determine whether it is probable the project will be developed. If management determines the project will not be developed, its project costs and other related expenses are written off as an abandoned development project cost. The Company abandons projects under development for a number of reasons, including, but not limited to, changes in local market conditions, increases in construction or financing costs or third party challenges related to entitlements or public financing. The Company recorded $1,596,000 as write-offs of abandoned development projects and demolition costs during the three and six months ended June 30, 2017. The Company incurred no write-offs of abandoned development projects and demolition costs during the three and six months ended June 30, 2016.
The Company incurred $396,000 and $747,000 as write-offs of abandoned development projects and demolition costs of unconsolidated entities during the three and six months ended June 30, 2017, which is included in equity in earnings and represents non-capitalizable demolition costs at a redevelopment property. The Company incurred no write-offs of abandoned development projects and demolition costs of unconsolidated entities for the three and six months ended June 30, 2016.
M. Impairment of Real Estate and Impairment of Unconsolidated Entities
Impairment of Real Estate
The Company reviews its real estate for impairment whenever events or changes indicate its carrying value may not be recoverable. In determining whether the carrying costs are recoverable from estimated future undiscounted cash flows, the Company uses various assumptions including future estimated net operating income, estimated holding periods, risk of foreclosure and estimated cash proceeds upon the disposition of the asset. If the carrying costs are not recoverable, the Company records an impairment charge to reduce the carrying value to estimated fair value. The assumptions used to estimate fair value, which are based on current information, are Level 2 or 3 inputs. If the conditions deteriorate or if plans regarding the assets change, additional impairment charges may occur in future periods.
The following table summarizes the Company’s impairment of real estate included in continuing operations:
|
| | | | | | | | | | | | | |
| | | Three Months Ended June 30, | Six Months Ended June 30, |
| | | 2017 | 2016 | 2017 | 2016 |
| | | (in thousands) |
| Shops at Wiregrass (Regional Mall) | Tampa, Florida | — |
| — |
| $ | — |
| $ | 12,464 |
|
| Other | — |
| 2,100 |
| — |
| 2,100 |
|
| Total | $ | — |
| $ | 2,100 |
| $ | — |
| $ | 14,564 |
|
During the year ended December 31, 2015, the Company decided to pursue the partial sale, through a joint venture, of Shops at Wiregrass. At March 31, 2016, negotiations and buyer due diligence were substantially complete and closing of the transaction remained subject to receipt of a third party consent. The advanced status of the transaction at March 31, 2016 triggered management to further update its undiscounted cash flow analysis including its probability weighted estimated holding period. As a result, the estimated probability weighted undiscounted cash flows no longer exceeded the carrying value, requiring the Company to adjust the carrying value to its estimated fair value during the three months ended March 31, 2016. The Company received the third party consent and closed on the disposition of 49% of its equity interest in October 2016.
Impairment of Real Estate - Fair Value Information
The following table presents quantitative information about the significant unobservable inputs used to determine the fair value of the impairment of real estate for the six months ended June 30, 2016:
|
| | | | | | |
| | Quantitative Information about Level 3 Fair Value Measurements |
| | Fair Value | Valuation Technique | Unobservable Input | Range of Input Values |
| | (in thousands) | | | |
| June 30, 2016 | | | | |
| Impairment of real estate | $ | 141,497 |
| Indicative bids | Indicative bids | N/A (1) |
| |
| (1) | This fair value measurement was derived from a bona fide purchase offer from a third party prospective buyer, subject to the Company’s corroboration for reasonableness. |
Forest City Realty Trust, Inc. and Subsidiaries
Notes to Consolidated Financial Statements
(Unaudited)
Impairment of Unconsolidated Entities
The Company reviews its portfolio of unconsolidated entities for other-than-temporary impairments whenever events or changes indicate its carrying value in the investments may be in excess of fair value. An equity method investment’s value is impaired if management’s estimate of its fair value is less than the carrying value and the difference is deemed to be other-than-temporary. In estimating fair value, assumptions that may be used include comparable sale prices, market discount rates, market capitalization rates and estimated future discounted cash flows specific to the geographic region and property type, all of which are considered Level 3 inputs. For recently opened properties, assumptions also include the timing of initial property lease up. In the event initial property lease up assumptions differ from actual results, estimated future discounted cash flows may vary, resulting in impairment charges in future periods. There were no impairments of unconsolidated entities recorded during the three and six months ended June 30, 2017 and 2016.
N. Loss on Extinguishment of Debt
For the three and six months ended June 30, 2017, the Company recorded $0 and $2,843,000, respectively, as a loss on extinguishment of debt primarily related to a loss on extinguishment of nonrecourse mortgage debt at Illinois Science and Technology Park, office buildings in Skokie, Illinois that were sold during the first quarter of 2017. For the three and six months ended June 30, 2016, the Company recorded $0, and $29,084,000, respectively, as loss on extinguishment of debt. The loss on extinguishment of debt recorded for 2016 primarily relates to separate, privately negotiated exchange transactions involving a portion of the Company’s 2016, 2018 and 2020 Senior Notes. See Note F – Convertible Senior Debt, Net for detailed information.
O. Net Gain on Disposition of Interest in Unconsolidated Entities
The following table summarizes the net gain on disposition of interest in unconsolidated entities which are included in earnings (loss)from unconsolidated entities.
|
| | | | | | | | | | | | | | |
| | | Three Months Ended June 30, | | Six Months Ended June 30, |
| | | 2017 | 2016 | | 2017 | 2016 |
| | | (in thousands) |
| Federally assisted housing apartments | Various | $ | 34,953 |
| $ | — |
| | $ | 44,302 |
| $ | — |
|
| Shops at Bruckner Boulevard (Specialty Retail Center) | Bronx, New York | — |
| — |
| | 8,183 |
| — |
|
| Steinway Street Theaters (Specialty Retail Center) | Queens, New York | — |
| 12,613 |
| | — |
| 12,613 |
|
| Other | 300 |
| — |
| | 469 |
| — |
|
| | $ | 35,253 |
| $ | 12,613 |
| | $ | 52,954 |
| $ | 12,613 |
|
During the six months ended June 30, 2017, the Company completed the sale of unconsolidated federally assisted housing (“FAH”) apartment communities, consisting of 3,975 units. The dispositions resulted in net cash proceeds of $53,522,000.
During the six months ended June 30, 2017, the Company sold its entire ownership interest in Shops at Bruckner Boulevard, an unconsolidated specialty retail center in Bronx, New York. The sale generated net cash proceeds of $8,863,000 at the Company’s ownership share, of which $5,464,000 was not distributed to the Company and remained in the Company’s joint venture to be used for anticipated 2017 debt paydowns.
During the three months ended June 30, 2016, the Company sold its entire ownership interest in Steinway Street Theaters, an unconsolidated specialty retail center Queens, New York. The disposition resulted in net cash proceeds of $14,059,000.
P. Income Taxes
The Company has historically filed a consolidated United States federal tax return, which includes all of its wholly owned subsidiaries. For its taxable year ended December 31, 2016, the Company intends to file as a REIT, which it will accomplish by filing the 2016 Form 1120-REIT with the Internal Revenue Service on or before October 15, 2017. The Company’s TRSs will file as C corporations. The Company also files individual separate income tax returns in various states.
As a REIT, the Company is required to annually distribute to its stockholders an amount equal to at least 90% of its REIT taxable income (computed without regard to the dividends paid deduction and net capital gain and net of any available net operating losses). The Company may be subject to certain state gross income and franchise taxes, as well as taxes on any undistributed income and federal and state corporate taxes on any income earned by its TRSs. In addition, the Company could be subject to corporate income taxes related to assets held by the REIT which are sold during the five year period following the date of conversion, to the extent such sold assets had a built-in gain on the date of conversion.
Forest City Realty Trust, Inc. and Subsidiaries
Notes to Consolidated Financial Statements
(Unaudited)
Income tax expense was $4,462,000 and $4,513,000 for the three and six months ended June 30, 2017, respectively, and $192,000 and $1,642,000 for the three and six months ended June 30, 2016, respectively. The Company did not recognize any federal corporate income tax on its earnings in the REIT for any of the periods presented. During the six months ended June 30, 2016, the Company reversed $83,645,000 of deferred tax assets associated with the Military Housing, Westchester’s Ridge Hill, the Nets and Barclays Center disposals.
At December 31, 2016, the TRS had a federal net operating loss carryforward for tax purposes of $204,752,000 available to use on its tax return expiring in the years ending December 31, 2029 through 2036, and charitable contribution deduction carryforward of $1,940,000 expiring in the years ending December 31, 2017 through 2021. At December 31, 2016, the Company had a federal net operating loss carryforward of $180,698,000 available to use on its REIT tax return expiring in the years ending December 31, 2029 through 2036.
Q. Net Gain (Loss) on Disposition of Interest in Development Project
In January 2016, the Company completed the sale of 625 Fulton Avenue, a development site in Brooklyn, New York. The transaction resulted in net cash proceeds of $151,776,000, of which $93,776,000 was received at closing and the remaining $58,000,000 was received during the three months ended June 30, 2016. The Company recorded a net pre-tax gain on disposition of interest in development project of $136,687,000 during the six months ended June 30, 2016.
R. Net Gain on Disposition of Full or Partial Interest in Rental Properties, Net of Tax
The following table summarizes the net gain (loss) on disposition of full or partial interest in rental properties, net of tax:
|
| | | | | | | | | | | | | | |
| | | Three Months Ended June 30, | | Six Months Ended June 30, |
| | | 2017 | 2016 | | 2017 | 2016 |
| | | (in thousands) |
| Specialty Retail Centers: | | | | | | |
| Fairmont Cinema | San Jose, California | $ | 4,128 |
| $ | — |
| | $ | 4,128 |
| $ | — |
|
| Avenue at Tower City Center & Tower City Parking | Cleveland, Ohio | 500 |
| — |
| | 500 |
| 14,207 |
|
| Office Buildings: | | | | | | |
| Illinois Science and Technology Park (4 buildings) | Skokie, Illinois | — |
| — |
| | 3,771 |
| — |
|
| Aperture Center | Albuquerque, New Mexico | — |
| — |
| | — |
| (171 | ) |
| Military Housing | Various | — |
| — |
| | — |
| 141,675 |
|
| QIC Joint Venture-Westchester’s Ridge Hill (Regional Mall) | Yonkers, New York | — |
| — |
| | — |
| 343 |
|
| Johns Hopkins Parking Garage | Baltimore, Maryland | — |
| (623 | ) | | — |
| (623 | ) |
| Other | 90 |
| — |
| | 5,622 |
| — |
|
| | | 4,718 |
| (623 | ) | | 14,021 |
| 155,431 |
|
| Income tax effect | (192 | ) | — |
| | (192 | ) | (66,413 | ) |
| | | $ | 4,526 |
| $ | (623 | ) | | $ | 13,829 |
| $ | 89,018 |
|
The 2016 income tax effect on the net gain on disposition of full or partial interest in rental properties, net of tax primarily relates to the deferred taxes recognized upon the partial disposition of Westchester’s Ridge Hill, a formerly wholly owned regional mall in Yonkers, New York, and the disposal of military housing entities, as these assets were held by our TRS and remained subject to federal income tax.
Military Housing
During the six months ended June 30, 2016, the Company completed the sale of its interests in entities that develop and manage military family housing. The sale generated net cash proceeds of $208,305,000. These entities were primarily service providers generating fee revenue. The primary assets acquired by the buyer were intangible assets of approximately $29,000,000 and investments in unconsolidated entities, net, of approximately $14,600,000.
Forest City Realty Trust, Inc. and Subsidiaries
Notes to Consolidated Financial Statements
(Unaudited)
QIC Joint Venture
Westchester’s Ridge Hill
During the six months ended June 30, 2016, the Company entered into a joint venture agreement with outside partners, affiliated entities of QIC, one of the largest institutional investment managers in Australia. The outside partner invested in and received 51% of our equity interests in Westchester’s Ridge Hill. The Company received net cash proceeds of $75,448,000 along with the buyer assuming debt of $169,369,000, representing 51% of the nonrecourse mortgage debt of the property. Based on the amount of cash received, the outside partner’s minimum initial investment requirement was met and the transaction qualified for full gain recognition related to the partial sale. The property is adequately capitalized and does not contain the characteristics of a VIE. Based on the substantive participating rights in all significant decision making areas held by the outside partner with regards to the joint venture, the Company concluded it appropriate to deconsolidate the entity and account for it under the equity method of accounting.
Ballston Quarter
On April 1, 2016, the Company formed and entered into a joint venture with outside partners, affiliated entities of QIC. The Company contributed its equity interest in Ballston Quarter, a formerly wholly-owned regional mall in Arlington, Virginia, and certain residential development rights to the joint venture. The outside partner invested $36,269,000 of cash directly into the joint venture and assumed debt of $20,825,000, representing 49% of the nonrecourse mortgage debt of the property. The transaction does not meet the requirements to be recognized as a sale for accounting purposes as the Company formed and entered into a joint venture and has a commitment to re-invest its entire cash proceeds received from the sale as a part of a major redevelopment plan of the asset. Upon closing, the entity was deemed to have insufficient equity and was assessed for consolidation purposes using the VIE model. Based on this and the substantive participating rights in all significant decision making areas of the outside partner, the Company concluded it appropriate to deconsolidate the entity and account for its interest under the equity method of accounting at historical cost.
S. Discontinued Operations
On January 29, 2016, the Company completed the sale of its 55% ownership interest in Barclays Center and 20% equity method ownership interest in the Nets (collectively, the “Disposal Group”). The sales price for our equity interest in Barclays Center was $162,600,000, generating net cash proceeds of $60,924,000 and a note receivable of $92,600,000, which bears interest at 4.50% per annum payable semi-annually and matures in 2019. In addition, the buyer assumed the gross debt totaling $457,745,000. The sales price for our equity interest in the Nets was $125,100,000 payable entirely in the form of a note receivable, which bears interest at 4.50% per annum payable at maturity in 2021.
The following tables summarize the operating results related to discontinued operations:
|
| | | |
| | Six Months Ended June 30, 2016 |
| | (in thousands) |
| Revenues | $ | 14,792 |
|
| Expenses | |
| Operating expenses | 12,540 |
|
| Depreciation and amortization | 23 |
|
| | 12,563 |
|
| Interest expense | (3,540 | ) |
| Amortization of mortgage procurement costs | (61 | ) |
| Loss before income taxes and loss from unconsolidated entities | (1,372 | ) |
| Loss from unconsolidated entities | (1,400 | ) |
| Loss before income taxes | (2,772 | ) |
| Income tax benefit | (824 | ) |
| Loss before gain on disposal group | (1,948 | ) |
| Gain on disposition of disposal group, net of tax | 64,553 |
|
| Earnings from discontinued operations | 62,605 |
|
| Noncontrolling interest | |
| Operating loss from disposal group | (776 | ) |
| Earnings from discontinued operations attributable to Forest City Realty Trust, Inc. | $ | 63,381 |
|
Forest City Realty Trust, Inc. and Subsidiaries
Notes to Consolidated Financial Statements
(Unaudited)
The following table summarizes the gain on disposition of Disposal Group, net of tax:
|
| | | |
| | Six Months Ended June 30, 2016 |
| | (in thousands) |
| The Nets | $ | 136,247 |
|
| Barclays Center | (56,481 | ) |
| | 79,766 |
|
Income tax effect (1) | (15,213 | ) |
| | $ | 64,553 |
|
| |
| (1) | Primarily represents non-cash deferred taxes recognized upon the reversal of the deferred tax asset used to offset the taxable gain on the sales of assets held by the TRS. |
T. Earnings Per Share
The Company’s restricted stock is considered a participating security pursuant to the two-class method for computing earnings per share (“EPS”). The 2006 Units, which are reflected as noncontrolling interests in the Consolidated Balance Sheets, are considered convertible participating securities as they are entitled to participate in dividends paid to the Company’s common stockholders. The 2006 Units are included in the computation of basic EPS using the two-class method and are included in the computation of diluted EPS using the if-converted method. The Class A common stock issuable in connection with conversion of the 2016 Senior Notes, 2018 Senior Notes and 2020 Senior Notes is included in the computation of diluted EPS using the if-converted method.
The reconciliation of the basic and diluted EPS computations is shown in the following table:
|
| | | | | | | | | | | | | |
| | Three Months Ended June 30, | | Six Months Ended June 30, |
| | 2017 | 2016 | | 2017 | 2016 |
Numerators (in thousands) | | | | | |
| Earnings from continuing operations attributable to Forest City Realty Trust, Inc. | $ | 56,753 |
| $ | 26,599 |
| | $ | 97,670 |
| $ | 207,253 |
|
| Distributed and undistributed earnings allocated to participating securities | (564 | ) | (257 | ) | | (943 | ) | (2,570 | ) |
| Earnings from continuing operations attributable to common stockholders ‑ Basic | $ | 56,189 |
| $ | 26,342 |
| | $ | 96,727 |
| $ | 204,683 |
|
| Interest on convertible debt | 362 |
| — |
| | — |
| 2,282 |
|
| Earnings from continuing operations attributable to common stockholders ‑ Diluted | $ | 56,551 |
| $ | 26,342 |
| | $ | 96,727 |
| $ | 206,965 |
|
| Net earnings attributable to Forest City Realty Trust, Inc. | $ | 56,753 |
| $ | 26,599 |
| | $ | 97,670 |
| $ | 270,634 |
|
| Distributed and undistributed earnings allocated to participating securities | (564 | ) | (257 | ) | | (943 | ) | (3,488 | ) |
| Net earnings attributable to common stockholders ‑ Basic | $ | 56,189 |
| $ | 26,342 |
| | $ | 96,727 |
| $ | 267,146 |
|
| Interest on convertible debt | 362 |
| — |
| | — |
| 2,282 |
|
| Net earnings attributable to common stockholders ‑ Diluted | $ | 56,551 |
| $ | 26,342 |
| | $ | 96,727 |
| $ | 269,428 |
|
| Denominators | | | | | |
| Weighted average shares outstanding ‑ Basic | 260,569,749 |
| 258,645,220 |
| | 259,688,409 |
| 258,298,148 |
|
| Effect of stock options and performance shares | 750,968 |
| 360,478 |
| | 576,980 |
| 405,501 |
|
| Effect of convertible debt | 1,693,309 |
| — |
| | — |
| 5,032,691 |
|
Weighted average shares outstanding ‑ Diluted (1) | 263,014,026 |
| 259,005,698 |
| | 260,265,389 |
| 263,736,340 |
|
| Earnings Per Share | | | | | |
| Earnings from continuing operations attributable to common stockholders ‑ Basic | $ | 0.22 |
| $ | 0.10 |
| | $ | 0.37 |
| $ | 0.79 |
|
| Earnings from continuing operations attributable to common stockholders ‑ Diluted | $ | 0.22 |
| $ | 0.10 |
| | $ | 0.37 |
| $ | 0.78 |
|
| Net earnings attributable to common stockholders ‑ Basic | $ | 0.22 |
| $ | 0.10 |
| | $ | 0.37 |
| $ | 1.03 |
|
| Net earnings attributable to common stockholders ‑ Diluted | $ | 0.22 |
| $ | 0.10 |
| | $ | 0.37 |
| $ | 1.02 |
|
| |
| (1) | Incremental shares from restricted stock and convertible securities aggregating 5,825,998 and 7,750,242 and for the three and six months ended June 30, 2017, respectively, and 7,607,238 and 5,547,034 for the three and six months ended June 30, 2016, respectively, were not included in the computation of diluted EPS because their effect is anti-dilutive. Weighted-average options, restricted stock and performance shares of 1,260,537 and 1,713,883 for the three and six months ended June 30, 2017, respectively, and 2,510,245 and 2,843,459 for the three and six months ended June 30, 2016, respectively, were not included in the computation of diluted EPS because their effect is anti-dilutive under the treasury stock method. |
Forest City Realty Trust, Inc. and Subsidiaries
Notes to Consolidated Financial Statements
(Unaudited)
U. Segment Information
The Company recently completed an internal reorganization and began presenting reportable segments based on this new structure for the reporting period ended September 30, 2016. The new structure is organized around the Company’s real estate operations, real estate development and corporate support service functions. The prior period has been recast to conform to the current period’s reportable segment presentation.
The following tables summarize financial data for the Company’s reportable operating segments. All amounts are presented in thousands. |
| | | | | | | | | | | | | | | | | | | | | | | | | |
| | June 30, 2017 | December 31, 2016 | | | | | | | |
| | Identifiable Assets | | | | | | |
| Office | $ | 3,084,640 |
| $ | 3,192,840 |
| | | | | | | |
| Apartments | 2,359,686 |
| 2,406,768 |
| | | | | | | |
| Retail | 505,567 |
| 521,015 |
| | | | | | | |
| Total Operations | 5,949,893 |
| 6,120,623 |
| | | | | | | |
| Development | 1,950,746 |
| 1,799,138 |
| | | | | | | |
| Corporate | 320,670 |
| 308,836 |
| | | | | | | |
| | $ | 8,221,309 |
| $ | 8,228,597 |
| | | | | | | |
| | | | | | | | | | |
| | Three Months Ended June 30, | Six Months Ended June 30, | | Three Months Ended June 30, | Six Months Ended June 30, |
| | 2017 | 2016 | 2017 | 2016 | | 2017 | 2016 | 2017 | 2016 |
| | Revenues | | Operating Expenses |
| Office | $ | 117,383 |
| $ | 120,565 |
| $ | 230,922 |
| $ | 236,173 |
| | $ | 44,738 |
| $ | 48,451 |
| $ | 87,514 |
| $ | 94,349 |
|
| Apartments | 72,314 |
| 73,873 |
| 144,412 |
| 145,041 |
| | 32,190 |
| 32,283 |
| 66,094 |
| 68,912 |
|
| Retail | 15,044 |
| 15,935 |
| 29,794 |
| 41,126 |
| | 10,596 |
| 9,017 |
| 21,350 |
| 26,065 |
|
| Total Operations | 204,741 |
| 210,373 |
| 405,128 |
| 422,340 |
| | 87,524 |
| 89,751 |
| 174,958 |
| 189,326 |
|
| Development | 31,701 |
| 15,590 |
| 47,320 |
| 26,368 |
| | 23,451 |
| 18,433 |
| 41,899 |
| 37,223 |
|
| Corporate | — |
| — |
| — |
| — |
| | 20,881 |
| 22,431 |
| 40,989 |
| 48,263 |
|
| Other | — |
| — |
| — |
| 3,518 |
| | — |
| — |
| — |
| 2,730 |
|
| | $ | 236,442 |
| $ | 225,963 |
| $ | 452,448 |
| $ | 452,226 |
| | $ | 131,856 |
| $ | 130,615 |
| $ | 257,846 |
| $ | 277,542 |
|
| | | | | | | | | | |
| | Depreciation and Amortization | | Capital Expenditures |
| Office | $ | 34,912 |
| $ | 34,643 |
| $ | 68,911 |
| $ | 69,046 |
| | $ | 12,999 |
| $ | 4,524 |
| $ | 27,301 |
| $ | 14,025 |
|
| Apartments | 19,359 |
| 18,614 |
| 38,010 |
| 37,351 |
| | 6,186 |
| 3,746 |
| 10,106 |
| 5,701 |
|
| Retail | 2,450 |
| 5,207 |
| 5,515 |
| 12,234 |
| | 1,746 |
| 2,400 |
| 2,161 |
| 4,441 |
|
| Total Operations | 56,721 |
| 58,464 |
| 112,436 |
| 118,631 |
| | 20,931 |
| 10,670 |
| 39,568 |
| 24,167 |
|
| Development | 8,369 |
| 3,659 |
| 15,535 |
| 6,246 |
| | 83,595 |
| 126,764 |
| 161,622 |
| 279,570 |
|
| Corporate | 657 |
| 295 |
| 1,331 |
| 626 |
| | 343 |
| — |
| 364 |
| — |
|
| Other | — |
| — |
| — |
| 126 |
| | — |
| — |
| — |
| — |
|
| | $ | 65,747 |
| $ | 62,418 |
| $ | 129,302 |
| $ | 125,629 |
| | $ | 104,869 |
| $ | 137,434 |
| $ | 201,554 |
| $ | 303,737 |
|
The Company uses Adjusted Earnings Before Interest, Taxes, Depreciation and Amortization ("EBITDA") to report its operating results by segment. Adjusted EBITDA, a non-GAAP measure, is defined as net earnings excluding the following items at the Company's ownership: i) non-cash charges for depreciation and amortization; ii) interest expense; iii) amortization of mortgage procurement costs; iv) income taxes; v) impairment of real estate; vi) gains or losses from extinguishment of debt; vii) gains or losses on full or partial disposition of rental properties, development projects and other investments; viii) gains or losses on change in control of interests; ix) other transactional items, including organizational transformation and termination benefits; and x) the Nets pre-tax EBITDA.
The Company believes that Adjusted EBITDA is an appropriate measure to assess operating performance by segment as it represents ongoing key operating components of each segment without regard to how the business is financed. The Company’s Chief Executive Officer, the chief operating decision maker, uses Adjusted EBITDA, as presented, to assess performance of the Company’s real estate assets by reportable operating segment because it provides information on the financial performance of the core real estate portfolio operations, development, corporate general and administrative expenses and interest and other income derived from the Company's investments. Adjusted EBITDA measures the profitability of each real estate segment in operations based on the process of collecting rent and paying operating expenses and represents the equivalent of Net Operating Income (“NOI”), a non-GAAP measure, as all property level interest expense is reported in the Corporate segment. NOI by operating segment is discussed in the Net Operating Income section of the Management’s Discussion and Analysis of Financial Condition and Results of Operations (“MD&A”) of this Form 10-Q. For the development segment, adjusted EBITDA measures the profitability of our land development sales activity and any recently opened unstabilized properties, offset by development expenses that do not qualify for capitalization. Interest expense is monitored and evaluated by the chief operating decision maker on an overall company-wide basis and is not a factor in evaluating individual segment performance.
Forest City Realty Trust, Inc. and Subsidiaries
Notes to Consolidated Financial Statements
(Unaudited)
The reconciliations of net earnings (loss) to Adjusted EBITDA by segment are shown in the following tables. All amounts are presented in thousands.
|
| | | | | | | | | | | | | | | | | | | | | | | | |
| Three Months Ended June 30, 2017 | Office | Apartments | Retail | Total Operations | Development | Corporate | Other | Total |
| Net earnings (loss) attributable to Forest City Realty Trust, Inc. | $ | 39,585 |
| $ | 62,488 |
| $ | 27,036 |
| $ | 129,109 |
| $ | (5,295 | ) | $ | (67,061 | ) | $ | — |
| $ | 56,753 |
|
| Depreciation and amortization | 35,769 |
| 22,601 |
| 16,790 |
| 75,160 |
| 6,272 |
| 657 |
| — |
| 82,089 |
|
| Interest expense | — |
| — |
| — |
| — |
| — |
| 48,857 |
| — |
| 48,857 |
|
| Amortization of mortgage procurement costs | — |
| — |
| — |
| — |
| — |
| 1,909 |
| — |
| 1,909 |
|
| Income tax expense | — |
| — |
| — |
| — |
| — |
| 4,654 |
| — |
| 4,654 |
|
| Loss on extinguishment of debt | — |
| — |
| — |
| — |
| — |
| 2 |
| — |
| 2 |
|
| Net (gain) loss on disposition of full or partial interests in rental properties | — |
| (90 | ) | (4,628 | ) | (4,718 | ) | — |
| — |
| — |
| (4,718 | ) |
| Gain on disposition of unconsolidated entities | — |
| (34,596 | ) | — |
| (34,596 | ) | — |
| — |
| — |
| (34,596 | ) |
| Organizational transformation and termination benefits | — |
| — |
| — |
| — |
| — |
| 6,863 |
| — |
| 6,863 |
|
| Adjusted EBITDA Attributable to Forest City Realty Trust, Inc. | $ | 75,354 |
| $ | 50,403 |
| $ | 39,198 |
| $ | 164,955 |
| $ | 977 |
| $ | (4,119 | ) | $ | — |
| $ | 161,813 |
|
| | | | | | | | | |
| Three Months Ended June 30, 2016 | Office | Apartments | Retail | Total Operations | Development | Corporate | Other | Total |
| Net earnings (loss) attributable to Forest City Realty Trust, Inc. | $ | 37,390 |
| $ | 26,535 |
| $ | 35,027 |
| $ | 98,952 |
| $ | (2,694 | ) | $ | (69,659 | ) | $ | — |
| $ | 26,599 |
|
| Depreciation and amortization | 34,569 |
| 23,200 |
| 19,019 |
| 76,788 |
| 2,459 |
| 295 |
| — |
| 79,542 |
|
| Interest expense | — |
| — |
| — |
| — |
| — |
| 54,890 |
| — |
| 54,890 |
|
| Amortization of mortgage procurement costs | — |
| — |
| — |
| — |
| — |
| 2,031 |
| — |
| 2,031 |
|
| Income tax expense | — |
| — |
| — |
| — |
| — |
| 192 |
| — |
| 192 |
|
| Impairment of consolidated real estate | — |
| 2,100 |
| — |
| 2,100 |
| — |
| — |
| — |
| 2,100 |
|
| Loss on extinguishment of debt | — |
| — |
| — |
| — |
| — |
| 849 |
| — |
| 849 |
|
| Net (gain) loss on disposition of full or partial interests in rental properties | 623 |
| — |
| — |
| 623 |
| — |
| — |
| — |
| 623 |
|
| Gain on disposition of unconsolidated entities | — |
| — |
| (12,613 | ) | (12,613 | ) | — |
| — |
| — |
| (12,613 | ) |
| Organizational transformation and termination benefits | — |
| — |
| — |
| — |
| — |
| 5,681 |
| — |
| 5,681 |
|
| Adjusted EBITDA Attributable to Forest City Realty Trust, Inc. | $ | 72,582 |
| $ | 51,835 |
| $ | 41,433 |
| $ | 165,850 |
| $ | (235 | ) | $ | (5,721 | ) | $ | — |
| $ | 159,894 |
|
Forest City Realty Trust, Inc. and Subsidiaries
Notes to Consolidated Financial Statements
(Unaudited)
|
| | | | | | | | | | | | | | | | | | | | | | | | |
| Six Months Ended June 30, 2017 | Office | Apartments | Retail | Total Operations | Development | Corporate | Other | Total |
| Net earnings (loss) attributable to Forest City Realty Trust, Inc. | $ | 81,894 |
| $ | 104,004 |
| $ | 58,394 |
| $ | 244,292 |
| $ | (15,872 | ) | $ | (130,750 | ) | $ | — |
| $ | 97,670 |
|
| Depreciation and amortization | 70,631 |
| 45,092 |
| 32,640 |
| 148,363 |
| 11,446 |
| 1,331 |
| — |
| 161,140 |
|
| Interest expense | — |
| — |
| — |
| — |
| — |
| 96,688 |
| — |
| 96,688 |
|
| Amortization of mortgage procurement costs | — |
| — |
| — |
| — |
| — |
| 3,741 |
| — |
| 3,741 |
|
| Income tax expense | — |
| — |
| — |
| — |
| — |
| 4,705 |
| — |
| 4,705 |
|
| Loss on extinguishment of debt | — |
| — |
| — |
| — |
| — |
| 4,468 |
| — |
| 4,468 |
|
| Net (gain) loss on disposition of full or partial interests in rental properties | (3,771 | ) | (5,622 | ) | (4,628 | ) | (14,021 | ) | — |
| — |
|
| (14,021 | ) |
| Gain on disposition of unconsolidated entities | — |
| (44,114 | ) | (8,183 | ) | (52,297 | ) | — |
| — |
| — |
| (52,297 | ) |
| Organizational transformation and termination benefits | — |
| — |
| — |
| — |
| — |
| 11,388 |
| — |
| 11,388 |
|
| Adjusted EBITDA Attributable to Forest City Realty Trust, Inc. | $ | 148,754 |
| $ | 99,360 |
| $ | 78,223 |
| $ | 326,337 |
| $ | (4,426 | ) | $ | (8,429 | ) | $ | — |
| $ | 313,482 |
|
| | | | | | | | | |
| Six Months Ended June 30, 2016 | Office | Apartments | Retail | Total Operations | Development | Corporate | Other | Total |
| Net earnings (loss) attributable to Forest City Realty Trust, Inc. | $ | 72,458 |
| $ | 49,317 |
| $ | 60,459 |
| $ | 182,234 |
| $ | 125,429 |
| $ | (259,217 | ) | $ | 222,188 |
| $ | 270,634 |
|
| Depreciation and amortization | 68,933 |
| 46,045 |
| 39,128 |
| 154,106 |
| 4,154 |
| 626 |
| 302 |
| 159,188 |
|
| Interest expense | — |
| — |
| — |
| — |
| — |
| 113,615 |
| — |
| 113,615 |
|
| Amortization of mortgage procurement costs | — |
| — |
| — |
| — |
| — |
| 4,437 |
| — |
| 4,437 |
|
| Income tax expense | — |
| — |
| — |
| — |
| — |
| 83,014 |
| — |
| 83,014 |
|
| Impairment of consolidated real estate | — |
| 2,100 |
| 12,464 |
| 14,564 |
| — |
| — |
| — |
| 14,564 |
|
| Loss on extinguishment of debt | — |
| — |
| — |
| — |
| — |
| 29,933 |
| — |
| 29,933 |
|
| Net gain on disposition of interest in development project | — |
| — |
| — |
| — |
| (136,687 | ) | — |
| — |
| (136,687 | ) |
| Net gain on disposition of full or partial interests in rental properties | 609 |
| — |
| (14,550 | ) | (13,941 | ) | — |
| — |
| (141,675 | ) | (155,616 | ) |
| Gain on disposition of unconsolidated entities | — |
| — |
| (12,613 | ) | (12,613 | ) | — |
| — |
| — |
| (12,613 | ) |
| Organizational transformation and termination benefits | — |
| — |
| — |
| — |
| — |
| 14,401 |
| — |
| 14,401 |
|
| Discontinued operations: | | | | | | | | |
| Depreciation and Amortization - Real Estate | — |
| — |
| — |
| — |
| — |
| — |
| 35 |
| 35 |
|
| Loss on disposition of rental properties | — |
| — |
| — |
| — |
| — |
| — |
| 56,481 |
| 56,481 |
|
| Net gain on disposition of partial interest in other investment - Nets | — |
| — |
| — |
| — |
| — |
| — |
| (136,247 | ) | (136,247 | ) |
| Nets pre-tax EBITDA | — |
| — |
| — |
| — |
| — |
| — |
| 1,400 |
| 1,400 |
|
| Adjusted EBITDA Attributable to Forest City Realty Trust, Inc. | $ | 142,000 |
| $ | 97,462 |
| $ | 84,888 |
| $ | 324,350 |
| $ | (7,104 | ) | $ | (13,191 | ) | $ | 2,484 |
| $ | 306,539 |
|
Item 2. Management’s Discussion and Analysis of Financial Condition and Results of Operations
The following Management’s Discussion and Analysis of Financial Condition and Results of Operations (“MD&A”) of Forest City Realty Trust, Inc. and subsidiaries should be read in conjunction with the financial statements and footnotes thereto contained in the annual report on Form 10-K for the year ended December 31, 2016.
RESULTS OF OPERATIONS
Corporate Description
We principally engage in the operation, development, management and acquisition of office, apartment and retail real estate and land throughout the United States. We have approximately $8.2 billion of consolidated assets in 20 states and the District of Columbia at June 30, 2017. Our core markets include Boston, Chicago, Dallas, Denver, Los Angeles, Philadelphia, and the greater metropolitan areas of New York City, San Francisco and Washington D.C. We have regional offices in Boston, Dallas, Denver, Los Angeles, New York City, San Francisco, Washington, D.C., and our corporate headquarters in Cleveland, Ohio.
Company Milestones
Significant milestones achieved during the second quarter of 2017 include:
| |
| • | The approval by the stockholders of the reclassification of the Company’s former Class B Common Stock to Class A Common Stock. In connection with the reclassification, each share of Class B Common Stock outstanding and issued immediately prior to the Effective Time was reclassified and exchanged into 1.31 shares of Class A Common Stock; |
| |
| • | Completed the sale of sixteen of our unconsolidated federally assisted housing (“FAH”) apartment communities, consisting of 2,606 units. These dispositions resulted in net cash proceeds of $35,400,000. With the second quarter of 2017 sales, year to date 2017 FAH sales total twenty-two apartment communities, consisting of 3,975 units, and have generated $53,522,000 of net cash proceeds; |
| |
| • | Completed the phased opening of 535 Carlton, an apartment community in Brooklyn, New York; |
| |
| • | Declared and paid a $0.09 per share cash dividend on our Class A and Class B common stock for the second quarter of 2017, representing an increase of $0.03 per share (50%) from the second quarter of 2016; |
| |
| • | The appointment by the Board of Directors, effective April 21, 2017, of Z. Jamie Behar as an independent Director to fill a vacancy on the Board of Directors; |
| |
| • | The election of Craig Macnab, as an independent Director at the Company’s June 9, 2017 Annual Meeting of Stockholders; and |
| |
| • | Exercised our promote option in the Arizona State Retirement System agreement, increasing our ownership from 25% to approximately 30%, as a result of the funds cumulative financial performance and estimated value creation in a non-cash transaction. |
Net Operating Income
Net Operating Income (“NOI”), a non-GAAP measure, reflects our share of the core operations of our rental real estate portfolio, prior to any financing activity. NOI is defined as revenues less operating expenses at our ownership within our Office, Apartments, Retail, and Development segments, except for revenues and cost of sales associated with sales of land held in these segments. The activities of our Corporate and Other segments do not involve the operations of our rental property portfolio and therefore are excluded from our NOI. Our historical total NOI dollars included our partner’s noncontrolling interest in the revenues and operating expenses of our consolidated subsidiaries. Beginning in the three months ended December 31, 2016, we began excluding these noncontrolling interest amounts to only report total NOI dollars at our ownership share. The prior period was adjusted for comparability purposes. We had consistently removed NOI from non-controlling interests from our comparable NOI percentage calculation, so this calculation does not require adjustment.
We believe NOI provides important information about our core operations and, along with earnings before income taxes, is necessary to understand our business and operating results. Because NOI excludes general and administrative expenses, interest expense, depreciation and amortization, revenues and cost of sales associated with sales of land, other non-property income and losses, and gains and losses from property dispositions, it provides a performance measure that, when compared year over year, reflects the revenues and expenses directly associated with owning and operating office, apartment and retail real estate and the impact to operations from trends in occupancy rates, rental rates and operating costs, providing a perspective on operations not immediately apparent from net income. We use NOI to evaluate our operating performance on a portfolio basis since NOI allows us to evaluate the impact that factors such as occupancy levels, lease structure, rental rates, and tenant mix have on our financial results. Investors can use NOI as supplementary information to evaluate our business. In addition, management believes NOI provides useful information to the investment community about our financial and operating performance when compared to other REITs since NOI is generally recognized as a standard measure of performance in the real estate industry. NOI is not intended to be a performance measure that should be regarded as an alternative to, or more meaningful than, our GAAP measures, and may not be directly comparable to similarly-titled measures reported by other companies.
Reconciliation of Earnings (Loss) Before Income Taxes (GAAP) to Net Operating Income (non-GAAP) (in thousands):
|
| | | | | | | | | | | | | |
| | Three Months Ended June 30, | | Six Months Ended June 30, |
| | 2017 | 2016 | | 2017 | 2016 |
| Earnings (loss) before income taxes (GAAP) | $ | 58,245 |
| $ | 29,174 |
| | $ | 89,917 |
| $ | (12,359 | ) |
| Earnings from unconsolidated entities | (41,514 | ) | (21,164 | ) | | (68,493 | ) | (31,700 | ) |
| Earnings (loss) before income taxes and earnings from unconsolidated entities | 16,731 |
| 8,010 |
| | 21,424 |
| (44,059 | ) |
| Land sales | (17,762 | ) | (8,221 | ) | | (23,522 | ) | (12,154 | ) |
| Cost of land sales | 7,694 |
| 1,702 |
| | 9,695 |
| 2,042 |
|
| Other land development revenues | (1,862 | ) | (2,228 | ) | | (2,967 | ) | (4,144 | ) |
| Other land development expenses | 2,034 |
| 2,397 |
| | 4,598 |
| 4,745 |
|
| Corporate general and administrative expenses | 14,018 |
| 16,750 |
| | 29,601 |
| 33,862 |
|
| Organizational transformation and termination benefits | 6,863 |
| 5,681 |
| | 11,388 |
| 14,401 |
|
| Depreciation and amortization | 65,747 |
| 62,418 |
| | 129,302 |
| 125,629 |
|
| Write-offs of abandoned development projects and demolition costs | 1,596 |
| — |
| | 1,596 |
| — |
|
| Impairment of real estate | — |
| 2,100 |
| | — |
| 14,564 |
|
| Interest and other income | (9,896 | ) | (11,031 | ) | | (20,168 | ) | (20,685 | ) |
| Interest expense | 28,901 |
| 32,435 |
| | 56,876 |
| 67,070 |
|
| Amortization of mortgage procurement costs | 1,507 |
| 1,416 |
| | 2,729 |
| 3,081 |
|
| Loss on extinguishment of debt | — |
| — |
| | 2,843 |
| 29,084 |
|
NOI related to unconsolidated entities (1) | 53,629 |
| 56,253 |
| | 108,729 |
| 111,498 |
|
NOI related to noncontrolling interest (2) | (10,483 | ) | (9,434 | ) | | (20,154 | ) | (17,522 | ) |
NOI related to discontinued operations (3) | — |
| — |
| | — |
| 1,198 |
|
| Net Operating Income (Non-GAAP) | $ | 158,717 |
| $ | 158,248 |
| | $ | 311,970 |
| $ | 308,610 |
|
| |
|
| | | |
| (1) NOI related to unconsolidated entities: | | | | | |
| Equity in earnings (GAAP) | $ | 6,261 |
| $ | 8,551 |
| | $ | 15,539 |
| $ | 19,087 |
|
| Exclude non-NOI activity from unconsolidated entities: | | | | | |
| Land and non-rental activity, net | (443 | ) | (1,730 | ) | | (1,579 | ) | (2,671 | ) |
| Interest and other income | (451 | ) | (390 | ) | | (1,976 | ) | (755 | ) |
| Write offs of abandoned development projects and demolition costs | 396 |
| — |
| | 747 |
| — |
|
| Depreciation and amortization | 23,938 |
| 23,469 |
| | 47,027 |
| 45,143 |
|
| Interest expense and extinguishment of debt | 23,928 |
| 26,353 |
| | 48,971 |
| 50,694 |
|
| NOI related to unconsolidated entities | $ | 53,629 |
| $ | 56,253 |
| | $ | 108,729 |
| $ | 111,498 |
|
| | | | | | |
| (2) NOI related to noncontrolling interest: | | | | | |
| Earnings from continuing operations attributable to noncontrolling interests (GAAP) | $ | (1,556 | ) | $ | (1,760 | ) | | $ | (1,450 | ) | $ | (3,881 | ) |
| Exclude non-NOI activity from noncontrolling interests: | | | | | |
| Land and non-rental activity, net | 1,132 |
| 713 |
| | 1,378 |
| 1,062 |
|
| Interest and other income | 448 |
| 392 |
| | 972 |
| 769 |
|
| Depreciation and amortization | (7,194 | ) | (5,730 | ) | | (14,177 | ) | (10,249 | ) |
| Interest expense and extinguishment of debt | (3,970 | ) | (3,049 | ) | | (7,534 | ) | (5,038 | ) |
| Gain (loss) on disposition of full or partial interests in rental properties and interest in unconsolidated entities | 657 |
| — |
| | 657 |
| (185 | ) |
| NOI related to noncontrolling interest | $ | (10,483 | ) | $ | (9,434 | ) | | $ | (20,154 | ) | $ | (17,522 | ) |
| | | | | | |
| (3) NOI related to discontinued operations: | | | | | |
| Operating loss from discontinued operations, net of tax (GAAP) | $ | — |
| $ | — |
| | $ | — |
| $ | (1,126 | ) |
| Less loss from discontinued operations attributable to noncontrolling interests | — |
| — |
| | — |
| 776 |
|
| Exclude non-NOI activity from discontinued operations (net of noncontrolling interest): | | | | | |
| Depreciation and amortization | — |
| — |
| | — |
| 56 |
|
| Interest expense | — |
| — |
| | — |
| 1,738 |
|
| Income tax benefit | — |
| — |
| | — |
| (246 | ) |
| NOI related to discontinued operations | $ | — |
| $ | — |
| | $ | — |
| $ | 1,198 |
|
Comparable NOI
We use comparable NOI, a non-GAAP measure, as a metric to evaluate the performance of our office, apartment and retail properties. This measure provides a same-store comparison of operating results of all stabilized properties that are open and operating in all periods presented. Non-capitalizable development costs and unallocated management and service company overhead, net of service fee revenues, are not directly attributable to an individual operating property and are considered non-comparable NOI. In addition, certain income and expense items at the property level, such as lease termination income, real estate tax assessments or rebates, certain litigation expenses incurred and any related legal settlements and NOI impacts of changes in ownership percentages, are excluded from comparable NOI. Retained properties in lease-up or are otherwise considered non-comparable are disclosed in the Segment Operating Results of the MD&A of this Form 10-Q. Other properties and activities such as Arena, federally assisted housing, military housing, straight-line rent adjustments and participation payments as a result of refinancing transactions are not evaluated on a comparable basis and the NOI from these properties and activities is considered non-comparable NOI.
Comparable NOI is an operating statistic defined as NOI from stabilized properties operated in all periods presented. We believe comparable NOI is useful because it measures the performance of the same properties on a period-to-period basis and is used to assess operating performance and resource allocation of the operating properties. While property dispositions, acquisitions or other factors impact net earnings in the short term, we believe comparable NOI presents a consistent view of the overall performance of our operating portfolio from period to period.
The following is a reconciliation of comparable NOI to total NOI.
|
| | | | | | | | | | | | | | | | | | | | | |
| | Net Operating Income (in thousands) | |
| | Three Months Ended June 30, 2017 | | Three Months Ended June 30, 2016 | Comparable |
| | Comparable | Non-Comparable | Total | | Comparable | Non-Comparable | Total | NOI % Change |
| Office | $ | 66,089 |
| $ | 6,043 |
| $ | 72,132 |
| | $ | 65,175 |
| $ | 5,015 |
| $ | 70,190 |
| 1.4 | % |
| Apartments | 47,485 |
| 87 |
| 47,572 |
| | 46,425 |
| (183 | ) | 46,242 |
| 2.3 | % |
| Retail | 36,577 |
| 2,354 |
| 38,931 |
| | 36,930 |
| 3,449 |
| 40,379 |
| (1.0 | )% |
| Federally Assisted Housing | — |
| 3,996 |
| 3,996 |
| | — |
| 4,791 |
| 4,791 |
| |
Other NOI (1): | | | | | | | | |
| Straight-line rent adjustments | — |
| 3,845 |
| 3,845 |
| | — |
| 3,131 |
| 3,131 |
| |
| Other Operations | — |
| (1,521 | ) | (1,521 | ) | | — |
| 1,192 |
| 1,192 |
| |
| | 150,151 |
| 14,804 |
| 164,955 |
| | 148,530 |
| 17,395 |
| 165,925 |
| 1.1 | % |
| Recently-Opened Properties/Redevelopment | — |
| 744 |
| 744 |
| | — |
| 625 |
| 625 |
| |
Development Segment (2) | — |
| (6,982 | ) | (6,982 | ) | | — |
| (8,302 | ) | (8,302 | ) | |
| Grand Total | $ | 150,151 |
| $ | 8,566 |
| $ | 158,717 |
| | $ | 148,530 |
| $ | 9,718 |
| $ | 158,248 |
| 1.1 | % |
| | | | | |
| | Six Months Ended June 30, 2017 | | Six Months Ended June 30, 2016 | Comparable |
| | Comparable | Non-Comparable | Total | | Comparable | Non-Comparable | Total | NOI % Change |
| Office | $ | 130,903 |
| $ | 11,175 |
| $ | 142,078 |
| | $ | 130,226 |
| $ | 9,903 |
| $ | 140,129 |
| 0.5 | % |
| Apartments | 92,853 |
| 123 |
| 92,976 |
| | 91,867 |
| (1,311 | ) | 90,556 |
| 1.1 | % |
| Retail | 74,347 |
| 3,947 |
| 78,294 |
| | 75,237 |
| 7,587 |
| 82,824 |
| (1.2 | )% |
| Federally Assisted Housing | — |
| 8,281 |
| 8,281 |
| | — |
| 10,339 |
| 10,339 |
| |
Other NOI (1): | | | | | | | | |
| Straight-line rent adjustments | — |
| 6,643 |
| 6,643 |
| | — |
| 4,979 |
| 4,979 |
| |
| Other Operations | — |
| (1,935 | ) | (1,935 | ) | | — |
| (4,368 | ) | (4,368 | ) | |
| | 298,103 |
| 28,234 |
| 326,337 |
| | 297,330 |
| 27,129 |
| 324,459 |
| 0.3 | % |
| Recently-Opened Properties/Redevelopment | — |
| (508 | ) | (508 | ) | | — |
| 1,254 |
| 1,254 |
| |
Development Segment (2) | — |
| (13,859 | ) | (13,859 | ) | | — |
| (19,605 | ) | (19,605 | ) | |
| Other Segment | — |
| — |
| — |
| | — |
| 2,502 |
| 2,502 |
| |
| Grand Total | $ | 298,103 |
| $ | 13,867 |
| $ | 311,970 |
| | $ | 297,330 |
| $ | 11,280 |
| $ | 308,610 |
| 0.3 | % |
| |
| (1) | Includes straight-line rent adjustments, participation payments as a result of refinancing transactions on our properties and management and service company overhead, net of service fee revenue. |
| |
| (2) | Includes straight-line adjustments, non-capitalizable development overhead and other costs on our development projects. |
NOI by Product Type
(dollars in thousands)
|
| | | | |
| Six Months Ended June 30, 2017 | | Six Months Ended June 30, 2016 |
|
| | | | | | | | |
| NOI by Product Type | $ | 321,629 |
| | NOI by Product Type | $ | 323,848 |
|
Other NOI (2): | | | Other NOI (2): | |
| Straight-line rent adjustments | 6,643 |
| | Straight-line rent adjustments | 4,979 |
|
| Other Operations | (1,935 | ) | | Other Operations | (4,368 | ) |
| | 4,708 |
| | | 611 |
|
| Recently-Opened Properties/Redevelopment | (508 | ) | | Recently-Opened Properties/Redevelopment | 1,254 |
|
Development Segment (3) | (13,859 | ) | | Development Segment (3) | (19,605 | ) |
| Other Segment | — |
| | Other Segment | 2,502 |
|
| Grand Total NOI | $ | 311,970 |
| | Grand Total NOI | $ | 308,610 |
|
| |
| (1) | Includes limited-distribution federally assisted housing. |
| |
| (2) | Includes straight-line rent adjustments, participation payments as a result of refinancing transactions on our properties and management and service company overhead, net of service fee revenues. |
| |
| (3) | Includes straight-line adjustments, non-capitalizable development overhead and other costs on our development projects. |
NOI by Core Market
(dollars in thousands)
|
| | |
| Six Months Ended June 30, 2017 | | Six Months Ended June 30, 2016 |
|
| | | | | | | | |
| NOI by Market in Operations | $ | 321,629 |
| | NOI by Market in Operations | $ | 323,848 |
|
Other NOI (3): | | | Other NOI (3): | |
| Straight-line rent adjustments | 6,643 |
| | Straight-line rent adjustments | 4,979 |
|
| Other Operations | (1,935 | ) | | Other Operations | (4,368 | ) |
| | 4,708 |
| | | 611 |
|
| Recently-Opened Properties/Redevelopment | (508 | ) | | Recently-Opened Properties/Redevelopment | 1,254 |
|
Development Segment (4) | (13,859 | ) | | Development Segment (4) | (19,605 | ) |
| Other Segment | — |
| | Other Segment | 2,502 |
|
| Grand Total NOI | $ | 311,970 |
| | Grand Total NOI | $ | 308,610 |
|
| |
| (1) | Includes Richmond, Virginia. |
| |
| (2) | Represents Regional Malls located in Non-Core Markets. Regional Malls located in Core Markets are included in their applicable Core Markets. |
| |
| (3) | Includes straight-line rent adjustments, participation payments as a result of refinancing transactions on our properties and management and service company overhead, net of service fee revenues. |
| |
| (4) | Includes straight-line adjustments, non-capitalizable development overhead and other costs on our development projects. |
FFO
Funds From Operations (“FFO”), a non-GAAP measure, along with net earnings, provides an investor important information about our core operations. While property dispositions, acquisitions or other factors impact net earnings in the short-term, we believe FFO presents a consistent view of the overall financial performance of our business from period-to-period since the core of our business is the recurring operations of our portfolio of real estate assets. Management believes that the exclusion from FFO of gains and losses from the sale of operating real estate assets allows investors and analysts to readily identify the operating results of the Company’s core assets and assists in comparing those operating results between periods. Implicit in historical cost accounting for real estate assets in accordance with GAAP is the assumption that the value of real estate assets diminishes ratably over time. Since real estate values have historically risen or fallen with market conditions, many real estate investors and analysts have considered presentations of operating results for real estate companies using historical cost accounting alone to be insufficient. Because FFO excludes depreciation and amortization of real estate assets and impairment of depreciable real estate, management believes that FFO, along with the required GAAP presentations, provides another measurement of the Company’s performance relative to its competitors and an additional basis on which to make decisions involving operating, financing and investing activities than the required GAAP presentations alone would provide.
FFO is defined by NAREIT as net earnings excluding the following items at our ownership: i) gain (loss) on full or partial disposition of rental properties, divisions and other investments (net of tax); ii) non-cash charges for real estate depreciation and amortization; iii) impairment of depreciable real estate (net of tax); and iv) cumulative or retrospective effect of change in accounting principle (net of tax).
The table below reconciles net earnings, the most comparable GAAP measure, to FFO, a non-GAAP measure.
|
| | | | | | | | | | | | | |
| | Three Months Ended June 30, | | Six Months Ended June 30, |
| | 2017 | 2016 | | 2017 | 2016 |
| | (in thousands) |
| Net earnings attributable to Forest City Realty Trust, Inc. (GAAP) | $ | 56,753 |
| $ | 26,599 |
| | $ | 97,670 |
| $ | 270,634 |
|
Depreciation and Amortization—real estate (1) | 81,400 |
| 78,788 |
| | 159,749 |
| 157,650 |
|
| Gain on disposition of full or partial interests in rental properties | (39,314 | ) | (11,990 | ) | | (66,318 | ) | (111,748 | ) |
| Impairment of depreciable rental properties | — |
| 2,100 |
| | — |
| 14,564 |
|
Income tax expense adjustment — current and deferred (2): | | | | | |
| Gain on disposition of full or partial interests in rental properties | 4,642 |
| 236 |
| | 4,642 |
| 55,272 |
|
| FFO attributable to Forest City Realty Trust, Inc. (Non-GAAP) | $ | 103,481 |
| $ | 95,733 |
| | $ | 195,743 |
| $ | 386,372 |
|
| | | | | | |
| FFO Per Share - Diluted | | | | | |
Numerator (in thousands): | | | | | |
| FFO attributable to Forest City Realty Trust, Inc. | $ | 103,481 |
| $ | 95,733 |
| | $ | 195,743 |
| $ | 386,372 |
|
| If-Converted Method (adjustments for interest): | | | | | |
| 4.250% Notes due 2018 | 778 |
| 778 |
| | 1,556 |
| 2,250 |
|
| 3.625% Notes due 2020 | 362 |
| 362 |
| | 725 |
| 1,280 |
|
| FFO for per share data | $ | 104,621 |
| $ | 96,873 |
| | $ | 198,024 |
| $ | 389,902 |
|
| Denominator: | | | | | |
| Weighted average shares outstanding—Basic | 260,569,749 |
| 258,645,220 |
| | 259,688,409 |
| 258,298,148 |
|
| Effect of stock options, restricted stock and performance shares | 1,319,110 |
| 995,175 |
| | 1,320,011 |
| 1,239,960 |
|
| Effect of convertible debt | 5,153,256 |
| 5,031,753 |
| | 5,153,256 |
| 7,804,478 |
|
| Effect of convertible 2006 Class A Common Units | 1,797,909 |
| 1,940,788 |
| | 1,853,955 |
| 1,940,788 |
|
| Weighted average shares outstanding - Diluted | 268,840,024 |
| 266,612,936 |
| | 268,015,631 |
| 269,283,374 |
|
| FFO Per Share - Diluted | $ | 0.39 |
| $ | 0.36 |
| | $ | 0.74 |
| $ | 1.45 |
|
| |
| (1) | The following table provides detail of depreciation and amortization: |
|
| | | | | | | | | | | | | |
| | Three Months Ended June 30, | | Six Months Ended June 30, |
| | 2017 | 2016 | | 2017 | 2016 |
| | (in thousands) |
| Full Consolidation | $ | 65,747 |
| $ | 62,418 |
| | $ | 129,302 |
| $ | 125,629 |
|
| Non-Real Estate | (689 | ) | (754 | ) | | (1,391 | ) | (1,573 | ) |
| Real Estate Full Consolidation | 65,058 |
| 61,664 |
| | 127,911 |
| 124,056 |
|
| Real Estate related to noncontrolling interest | (6,853 | ) | (5,463 | ) | | (13,549 | ) | (9,790 | ) |
| Real Estate Unconsolidated | 23,195 |
| 22,587 |
| | 45,387 |
| 43,349 |
|
| Real Estate Discontinued Operations | — |
| — |
| | — |
| 35 |
|
| Real Estate at Company share | $ | 81,400 |
| $ | 78,788 |
| | $ | 159,749 |
| $ | 157,650 |
|
| |
| (2) | The following table provides detail of income tax expense (benefit): |
|
| | | | | | | | | | | | | |
| | Three Months Ended June 30, | | Six Months Ended June 30, |
| | 2017 | 2016 | | 2017 | 2016 |
| | (in thousands) |
| Income tax expense on FFO | | | | | |
| Operating Earnings: | | | | | |
| Current taxes | $ | 12 |
| $ | 91 |
| | $ | 63 |
| $ | 3,720 |
|
| Deferred taxes | — |
| (135 | ) | | — |
| 24,022 |
|
| Total income tax expense on FFO | 12 |
| (44 | ) | | 63 |
| 27,742 |
|
| | | | | | |
| Income tax expense (benefit) on non-FFO | | | | | |
| Disposition of full or partial interests in rental properties: | | | | | |
| Current taxes | $ | 4,642 |
| $ | 236 |
| | $ | 4,642 |
| $ | (4,351 | ) |
| Deferred taxes | — |
| — |
| | — |
| 59,623 |
|
| Total income tax expense on non-FFO | 4,642 |
| 236 |
| | 4,642 |
| 55,272 |
|
| Grand Total | $ | 4,654 |
| $ | 192 |
| | $ | 4,705 |
| $ | 83,014 |
|
Operating FFO
Operating FFO, a non-GAAP measure, is an additional measure an investor may use to evaluate our operating performance. We believe it is appropriate to adjust FFO for significant items driven by transactional activity and factors relating to the financial and real estate markets, rather than factors specific to the on-going operating performance of our properties. We use Operating FFO as an indicator of continuing operating results in planning and executing our business strategy. Operating FFO should not be considered to be an alternative to net earnings computed under GAAP as an indicator of our operating performance and may not be directly comparable to similarly titled measures reported by other companies.
We define Operating FFO as FFO adjusted to exclude: i) impairment of non-depreciable real estate; ii) write-offs of abandoned development projects and demolition costs; iii) income recognized on state and federal historic and other tax credits; iv) gains or losses from extinguishment of debt; v) change in fair market value of nondesignated hedges; vi) gains or losses on change in control of interests; vii) the adjustment to recognize rental revenues and rental expense using the straight-line method; viii) participation payments to ground lessors on refinancing of our properties; ix) other transactional items; x) the Nets pre-tax FFO; and xi) income taxes on FFO.
The table below reconciles FFO to Operating FFO.
|
| | | | | | | | | | | | | |
| | Three Months Ended June 30, | | Six Months Ended June 30, |
| | 2017 | 2016 | | 2017 | 2016 |
| | (in thousands) |
| FFO attributable to Forest City Realty Trust, Inc. | $ | 103,481 |
| $ | 95,733 |
| | $ | 195,743 |
| $ | 386,372 |
|
| Write-offs of abandoned development projects and demolition costs | 1,992 |
| — |
| | 2,343 |
| — |
|
| Tax credit income | (2,521 | ) | (2,936 | ) | | (5,212 | ) | (5,944 | ) |
| Loss on extinguishment of debt | 2 |
| 849 |
| | 4,468 |
| 29,933 |
|
| Change in fair market value of nondesignated hedges | (301 | ) | 590 |
| | (1,803 | ) | 1,986 |
|
| Net gain on disposition of interest in development project | — |
| — |
| | — |
| (136,687 | ) |
| Net gain on disposition of partial interest in other investment - Nets | — |
| — |
| | — |
| (136,247 | ) |
| Straight-line rent adjustments | (3,993 | ) | (3,350 | ) | | (6,935 | ) | (5,211 | ) |
| Organizational transformation and termination benefits | 6,863 |
| 5,681 |
| | 11,388 |
| 14,401 |
|
| Nets pre-tax FFO | — |
| — |
| | — |
| 1,400 |
|
| Income tax expense (benefit) on FFO | 12 |
| (44 | ) | | 63 |
| 27,742 |
|
| Operating FFO attributable to Forest City Realty Trust, Inc. | $ | 105,535 |
| $ | 96,523 |
| | $ | 200,055 |
| $ | 177,745 |
|
| | | | | | |
If-Converted Method (adjustments for interest) (in thousands): | | | | | |
| 4.250% Notes due 2018 | 778 |
| 778 |
| | 1,556 |
| 2,250 |
|
| 3.625% Notes due 2020 | 362 |
| 362 |
| | 725 |
| 1,280 |
|
| Operating FFO attributable to Forest City Realty Trust, Inc. (If-Converted) | $ | 106,675 |
| $ | 97,663 |
| | $ | 202,336 |
| $ | 181,275 |
|
| | | | | | |
| Weighted average shares outstanding—Basic | 260,569,749 |
| 258,645,220 |
| | 259,688,409 |
| 258,298,148 |
|
| Effect of stock options, restricted stock and performance shares | 1,319,110 |
| 995,175 |
| | 1,320,011 |
| 1,239,960 |
|
| Effect of convertible debt | 5,153,256 |
| 5,031,753 |
| | 5,153,256 |
| 7,804,478 |
|
| Effect of convertible 2006 Class A Common Units | 1,797,909 |
| 1,940,788 |
| | 1,853,955 |
| 1,940,788 |
|
| Weighted average shares outstanding - Diluted | 268,840,024 |
| 266,612,936 |
| | 268,015,631 |
| 269,283,374 |
|
| Operating FFO per share - Diluted | $ | 0.40 |
| $ | 0.37 |
| | $ | 0.75 |
| $ | 0.67 |
|
Operations
Office and Retail
Comparable leased occupancy is 97.0% and 93.5% for office and retail, respectively, as of June 30, 2017 compared with 97.8% and 94.2%, respectively, as of June 30, 2016. Leased occupancy percentage is calculated by dividing the sum of the total tenant occupied space under the lease and vacant space under lease by total gross leasable area (“GLA”). Retail and office occupancy as of June 30, 2017 and 2016 represents leased occupancy at the end of the quarter. Occupancy data includes leases with original terms of one year or less. Comparable occupancy relates to stabilized properties opened and operated in both the three months ended June 30, 2017 and 2016.
We monitor office and retail leases expiring in the short to mid-term. Management’s plan to obtain lease renewals for expiring retail and office leases includes signing of lease extensions, if available, and active marketing for available or soon to be available space to new or existing tenants in the normal course of business.
Office Buildings
The following table represents those new leases and GLA signed on the same space in which there was a former tenant and existing tenant renewals along with all other new leases signed within the rolling 12-month period.
|
| | | | | | | | | | | | | | | | | | | | | | | |
| | Same-Space Leases | | Other New Leases | | |
| Quarter | Number of Leases Signed | GLA Signed | Contractual Rent Per SF (1) | Expired Rent Per SF (1) | Cash Basis % Change over Prior Rent | | Number of Leases Signed | GLA Signed | Contractual Rent Per SF (1) | | Total GLA Signed |
| Q3 2016 | 9 |
| 79,348 |
| $ | 28.02 |
| $ | 26.52 |
| 5.7 | % | | 5 |
| 8,227 |
| $ | 22.71 |
| | 87,575 |
|
| Q4 2016 | 12 |
| 88,740 |
| $ | 20.36 |
| $ | 21.46 |
| (5.1 | )% | | 3 |
| 3,549 |
| $ | 25.27 |
| | 92,289 |
|
| Q1 2017 | 15 |
| 148,260 |
| $ | 62.17 |
| $ | 51.85 |
| 19.9 | % | | 5 |
| 13,128 |
| $ | 25.04 |
| | 161,388 |
|
| Q2 2017 | 20 |
| 290,759 |
| $ | 64.60 |
| $ | 57.69 |
| 12.0 | % | | 5 |
| 27,326 |
| $ | 42.07 |
| | 318,085 |
|
| Total | 56 |
| 607,107 |
| $ | 52.76 |
| $ | 46.89 |
| 12.5 | % | | 18 |
| 52,230 |
| $ | 33.60 |
| | 659,337 |
|
| | | | | | | | | | | | |
Retail Centers
The following tables represent those new leases and GLA signed and rent per square foot (“SF”) on the same space in which there was a former tenant and existing tenant renewals.
Regional Malls
|
| | | | | | | | | | | | | | | | | |
| Quarter | Number of Leases Signed | | GLA Signed | | Contractual Rent Per SF (1) | | Expired Rent Per SF (1) | | Cash Basis % Change over Prior Rent | |
| Q3 2016 | 26 |
| | 79,205 |
| | $ | 63.15 |
| | $ | 56.31 |
| | 12.1 | % | |
| Q4 2016 | 14 |
| | 53,130 |
| | $ | 153.75 |
| | $ | 137.47 |
| | 11.8 | % | |
| Q1 2017 | 12 |
| | 36,475 |
| | $ | 140.81 |
| | $ | 110.97 |
| | 26.9 | % | |
| Q2 2017 | 22 |
| | 70,685 |
| | $ | 69.77 |
| | $ | 58.09 |
| | 20.1 | % | |
| Total | 74 |
| | 239,495 |
| | $ | 97.03 |
| | $ | 83.16 |
| | 16.7 | % | |
| | | | | | | | | | | |
Specialty Retail Centers
|
| | | | | | | | | | | | | | | | | |
| Quarter | Number of Leases Signed | | GLA Signed | | Contractual Rent Per SF (1) | | Expired Rent Per SF (1) | | Cash Basis % Change over Prior Rent | |
| Q3 2016 | 2 |
| | 5,131 |
| | $ | 82.06 |
| | $ | 78.17 |
| | 5.0 | % | |
| Q4 2016 | — |
| | — |
| | $ | — |
| | $ | — |
| | 0.0 | % | |
| Q1 2017 | — |
| | — |
| | $ | — |
| | $ | — |
| | 0.0 | % | |
| Q2 2017 | 1 |
| | 7,463 |
| | $ | 45.00 |
| | $ | 58.52 |
| | (23.1 | )% | |
| Total | 3 |
| | 12,594 |
| | $ | 60.10 |
| | $ | 66.53 |
| | (9.7 | )% | |
| | | | | | | | | | | |
| |
| (1) | Office and Retail contractual rent per square foot includes base rent and fixed additional charges for common area maintenance and real estate taxes as of rental commencement. Retail contractual rent per square foot also includes fixed additional marketing/promotional charges. For all expiring leases, contractual rent per square foot includes any applicable escalations. |
Apartments
Comparable economic occupancy for Apartments is 94.1% and 94.5% for the six months ended June 30, 2017 and 2016, respectively. Economic apartment occupancy is calculated by dividing gross potential rent (“GPR”) less vacancy by GPR. GPR is calculated based on actual rents per lease agreements for occupied apartment units and at market rents for vacant apartment units. Market rental rates are determined using a variety of factors which include availability of specific apartment unit types (one bedroom, two bedroom, etc.), seasonality factors and rents offered by competitive properties for similar apartment types in the same geographic market. Comparable economic occupancy relates to stabilized properties that operated in both the six months ended June 30, 2017 and 2016.
The following tables present leasing information of our apartment communities. Prior period amounts may differ from data as reported in previous quarters since the properties that qualify as comparable change from period to period.
Quarterly Comparison
|
| | | | | | | | | | | | | | | | | | |
| | | | Monthly Average Apartment Rental Rates (2) | | Economic Apartment Occupancy |
| Comparable Apartment | Leasable Units | | Three Months Ended June 30, | | | Three Months Ended June 30, | |
Communities (1) | at Company % (3) | | 2017 | 2016 | % Change | | 2017 | 2016 | % Change |
| Core Markets | 8,812 |
| | $ | 2,021 |
| $ | 1,999 |
| 1.1 | % | | 95.0 | % | 95.3 | % | (0.3 | )% |
| Non-Core Markets | 7,954 |
| | $ | 999 |
| $ | 979 |
| 2.0 | % | | 93.5 | % | 93.4 | % | 0.1 | % |
| Total Comparable Apartments | 16,766 |
| | $ | 1,536 |
| $ | 1,514 |
| 1.5 | % | | 94.6 | % | 94.7 | % | (0.1 | )% |
| | | | | | | | | | |
Year-to-Date Comparison
|
| | | | | | | | | | | | | | | | | | |
| | | | Monthly Average Apartment Rental Rates (2) | | Economic Apartment Occupancy |
| Comparable Apartment | Leasable Units | | Six Months Ended
June 30, | | | Six Months Ended
June 30, | |
Communities (1) | at Company % (3) | | 2017 | 2016 | % Change | | 2017 | 2016 | % Change |
| Core Markets | 8,812 |
| | $ | 2,015 |
| $ | 1,992 |
| 1.2 | % | | 94.7 | % | 95.2 | % | (0.5 | )% |
| Non-Core Markets | 7,954 |
| | $ | 997 |
| $ | 976 |
| 2.2 | % | | 92.6 | % | 92.7 | % | (0.1 | )% |
| Total Comparable Apartments | 16,766 |
| | $ | 1,531 |
| $ | 1,509 |
| 1.5 | % | | 94.1 | % | 94.5 | % | (0.4 | )% |
| | | | | | | | | | |
Sequential Comparison |
| | | | | | | | | | | | | | | | | | |
| | | | Monthly Average Apartment Rental Rates (2) | | Economic Apartment Occupancy |
| | | | Three Months Ended | | | Three Months Ended | |
| Comparable Apartment | Leasable Units | | June 30, | March 31, | | | June 30, | March 31, | |
Communities (1) | at Company % (3) | | 2017 | 2017 | % Change | | 2017 | 2017 | % Change |
| Core Markets | 8,812 |
| | $ | 2,021 |
| $ | 2,008 |
| 0.6 | % | | 95.0 | % | 94.4 | % | 0.6 | % |
| Non-Core Markets | 7,954 |
| | $ | 999 |
| $ | 994 |
| 0.5 | % | | 93.5 | % | 91.7 | % | 1.8 | % |
| Total Comparable Apartments | 16,766 |
| | $ | 1,536 |
| $ | 1,526 |
| 0.7 | % | | 94.6 | % | 93.6 | % | 1.0 | % |
| | | | | | | | | | |
| |
| (1) | Includes stabilized apartment communities completely opened and operated in the periods presented. These apartment communities include units leased at affordable apartment rates which provide a discount from average market rental rates. For the three months ended June 30, 2017, 15.1% of leasable units in core markets and 4.9% of leasable units in non-core markets were affordable housing units. Excludes limited-distribution federally assisted housing units. |
| |
| (2) | Represents GPR less concessions. |
| |
| (3) | Leasable units represent our share of comparable leasable units at the apartment community. |
Segment Operating Results - Quarterly Comparison
The following tables present revenues, operating expenses and equity in earnings by segment for the three months ended June 30, 2017 compared with the three months ended June 30, 2016. Other results of operations are discussed on a consolidated basis. All amounts in the following tables are presented in thousands.
|
| | | | | | | | | | | | | | | | | | |
| | Office | Apartments | Retail | Total Operations | Development | Total |
| Revenues for the three months ended June 30, 2016 | $ | 120,565 |
| $ | 73,873 |
| $ | 15,935 |
| $ | 210,373 |
| $ | 15,590 |
| $ | 225,963 |
|
| Increase (decrease) due to: | | | | | | |
| Comparable portfolio | 7,379 |
| 908 |
| 155 |
| 8,442 |
| — |
| 8,442 |
|
Non-comparable properties (1) | (600 | ) | 612 |
| (275 | ) | (263 | ) | 5,576 |
| 5,313 |
|
| Change in consolidation method due to partial sale or acquisition | — |
| — |
| (3,851 | ) | (3,851 | ) | — |
| (3,851 | ) |
| Recently disposed properties | (7,128 | ) | (714 | ) | (117 | ) | (7,959 | ) | — |
| (7,959 | ) |
| Land sales | — |
| — |
| — |
| — |
| 9,541 |
| 9,541 |
|
| Other | (2,833 | ) | (2,365 | ) | 3,197 |
| (2,001 | ) | 994 |
| (1,007 | ) |
| Revenues for the three months ended June 30, 2017 | $ | 117,383 |
| $ | 72,314 |
| $ | 15,044 |
| $ | 204,741 |
| $ | 31,701 |
| $ | 236,442 |
|
|
| | | | | | | | | | | | | | | | | | | | | |
| | Office | Apartments | Retail | Total Operations | Development | Corporate | Total |
| Operating expenses for the three months ended June 30, 2016 | $ | 48,451 |
| $ | 32,283 |
| $ | 9,017 |
| $ | 89,751 |
| $ | 18,433 |
| $ | 22,431 |
| $ | 130,615 |
|
| Increase (decrease) due to: | | | | | | | |
| Comparable portfolio | 2,999 |
| 264 |
| 40 |
| 3,303 |
| — |
| — |
| 3,303 |
|
Non-comparable properties (1) | (271 | ) | 203 |
| (188 | ) | (256 | ) | 1,439 |
| — |
| 1,183 |
|
| Change in consolidation method due to partial sale or acquisition | — |
| — |
| (1,474 | ) | (1,474 | ) | — |
| — |
| (1,474 | ) |
| Recently disposed properties | (4,425 | ) | (598 | ) | (323 | ) | (5,346 | ) | — |
| — |
| (5,346 | ) |
| Land cost of sales | — |
| — |
| — |
| — |
| 5,992 |
| — |
| 5,992 |
|
| Organizational transformation and termination benefits | — |
| — |
| — |
| — |
| — |
| 1,182 |
| 1,182 |
|
| Development, management, corporate and other | (2,016 | ) | 38 |
| 3,524 |
| 1,546 |
| (2,413 | ) | (2,732 | ) | (3,599 | ) |
| Operating expenses for the three months ended June 30, 2017 | $ | 44,738 |
| $ | 32,190 |
| $ | 10,596 |
| $ | 87,524 |
| $ | 23,451 |
| $ | 20,881 |
| $ | 131,856 |
|
|
| | | | | | | | | | | | | | | | | | | | | |
| | Office | Apartments | Retail | Total Operations | Development | Corporate | Total |
| Equity in earnings (loss) for the three months ended June 30, 2016 | $ | 2,181 |
| $ | 10,239 |
| $ | 20,703 |
| $ | 33,123 |
| $ | 2,273 |
| $ | (26,845 | ) | $ | 8,551 |
|
| Increase (decrease) due to: | | | | | | | |
| Comparable portfolio | 400 |
| 28 |
| (254 | ) | 174 |
| — |
| — |
| 174 |
|
Non-comparable properties (1) | 1,191 |
| — |
| — |
| 1,191 |
| (2,890 | ) | — |
| (1,699 | ) |
| Recently disposed equity method properties | — |
| 361 |
| (513 | ) | (152 | ) | — |
| — |
| (152 | ) |
| Change in consolidation method due to partial sale or acquisition | — |
| — |
| 583 |
| 583 |
| — |
| — |
| 583 |
|
| Land | — |
| — |
| — |
| — |
| (2,366 | ) | — |
| (2,366 | ) |
| Subsidized senior housing | — |
| 433 |
| — |
| 433 |
| — |
| — |
| 433 |
|
| Other | (37 | ) | (361 | ) | (109 | ) | (507 | ) | (1,381 | ) | 2,625 |
| 737 |
|
| Equity in earnings (loss) for the three months ended June 30, 2017 | $ | 3,735 |
| $ | 10,700 |
| $ | 20,410 |
| $ | 34,845 |
| $ | (4,364 | ) | $ | (24,220 | ) | $ | 6,261 |
|
| |
| (1) | The following table presents the increases (decreases) in revenues, operating expenses and equity in earnings (loss) for properties in lease-up or recently stabilized but not comparable and other consolidated non-comparable properties: |
|
| | | | | | | | | | |
| | | Three Months Ended June 30, 2017 vs. 2016 |
| Property | Quarter Opened | Revenues | Operating Expenses | Equity in Earnings (Loss) |
| Operations | | | | |
| Office: | | | | |
| Properties recently stabilized: | | | | |
| 300 Massachusetts Ave | Q1-16 | $ | — |
| $ | — |
| $ | 1,191 |
|
| Non-comparable property: | | | | |
26 Landsdowne Street (1) | 154 |
| (64 | ) | — |
|
Post Office Plaza (2) | (754 | ) | (207 | ) | — |
|
| Total Office | $ | (600 | ) | $ | (271 | ) | $ | 1,191 |
|
| | | | | |
| Apartments: | | | | |
| Properties recently stabilized: | | | | |
| Aster Town Center North | Q4-15/Q1-16 | $ | 612 |
| $ | 203 |
| $ | — |
|
| Total Apartments | $ | 612 |
| $ | 203 |
| $ | — |
|
| | | | | |
| Retail: | | | | |
| Non-comparable property: | | | | |
Boulevard Mall (3) | $ | (275 | ) | $ | (188 | ) | $ | — |
|
| Total Retail | $ | (275 | ) | $ | (188 | ) | $ | — |
|
| | | | | |
| Development | | | | |
| Properties in lease-up: | | | | |
| 1812 Ashland Ave | Q2-16 | $ | 1,420 |
| $ | 371 |
| $ | — |
|
| 535 Carlton | Q1-17/Q4-17 | — |
| — |
| (406 | ) |
| 461 Dean Street | Q3-16/Q4-16 | 461 |
| (538 | ) | — |
|
| Blossom Plaza | Q2-16 | 1,143 |
| 488 |
| — |
|
| Eliot on 4th | Q1-17 | 57 |
| 602 |
| — |
|
| Kapolei Lofts | Q3-15/Q3-16 | 1,095 |
| 92 |
| — |
|
| NorthxNorthwest | Q4-16/Q1-17 | 169 |
| 295 |
| — |
|
| The Bixby | Q3-16/Q4-16 | — |
| — |
| (47 | ) |
| The Yards - Arris | Q1-16 | 1,682 |
| 234 |
| — |
|
| Non-comparable property: | | | | |
Ballston Quarter (4) | — |
| 114 |
| (1,141 | ) |
| Transfers from development (2016) to operations (2017): | | | | |
| 300 Massachusetts Ave | Q1-16 | — |
| — |
| (1,296 | ) |
| Aster Town Center North | Q4-15/Q1-16 | (451 | ) | (219 | ) | — |
|
| Total Development | $ | 5,576 |
| $ | 1,439 |
| $ | (2,890 | ) |
| |
| (1) | 26 Landsdowne Street, an office building in Cambridge, Massachusetts, is classified as a non-comparable property due to its upcoming planned redevelopment expected to begin in Q3 2017. |
| |
| (2) | Post Office Plaza, an office building in Cleveland, Ohio, is classified as a non-comparable property as we have decided not to make additional investments into this office building located in a non-core market and it is targeted for disposition. |
| |
| (3) | Boulevard Mall, a regional mall in Amherst, New York, is classified as a non-comparable property due to our intention to execute a deed-in-lieu transaction with the Special Servicer who currently holds the nonrecourse mortgage on the property. |
| |
| (4) | Effective April 1, 2016, Ballston Quarter, a regional mall in Arlington, Virginia, changed from the full consolidation method of accounting to the equity method of accounting. Ballston Quarter is classified as a non-comparable property due to its current redevelopment. |
Office
The decreases in revenues and operating expenses related to recent disposals are primarily due to the sale of Illinois Science & Technology Park, office buildings in Skokie, Illinois (Q1-2017), and Terminal Tower, an office building in Cleveland, Ohio (Q3-2016).
Apartments
The decreases in revenues and operating expenses related to recent disposals are primarily due to the sale of Grand Lowry Lofts, an apartment community in Denver, Colorado (Q4-2016).
Retail
The decreases in revenues and operating expenses along with the increase in equity in earnings related to the change in consolidation method are due to the change from full consolidation to equity method accounting upon the formation of a joint venture with an outside partner for Shops at Wiregrass, a regional mall in Tampa, Florida (Q4-2016).
Development
The decrease in operating expenses related to the development management and service functions is primarily due to reduced overhead costs as a result of our recent reorganization, as well as the centralization of certain functions now performed at Corporate and reported as Corporate expenses.
Corporate
The increase in organizational transformation and termination benefits is a result of the transactional nature of these project costs and workplace reduction events. See additional information on termination benefits in the following Segment Operating Results - Year to Date Comparison discussion.
The decrease in other operating expenses is primarily due to general and administrative overhead reduction partially offset by an increase in costs as a result of certain functions being centralized as a result of the recent reorganization in the prior year and now reported as Corporate expenses that were previously recorded in the Office, Apartments, Retail and Development segments. The equity in earnings (loss) reported in the Corporate segment relates solely to interest expense on our equity method investments, as all interest expense is reported in the Corporate segment.
Segment Operating Results - Year-to-Date Comparison
The following tables present revenues, operating expenses and equity in earnings by segment for the six months ended June 30, 2017 compared with the six months ended June 30, 2016. Other results of operations are discussed on a consolidated basis. All amounts in the following tables are presented in thousands.
|
| | | | | | | | | | | | | | | | | | | | | |
| | Office | Apartments | Retail | Total Operations | Development | Other | Total |
| Revenues for the six months ended June 30, 2016 | $ | 236,173 |
| $ | 145,041 |
| $ | 41,126 |
| $ | 422,340 |
| $ | 26,368 |
| $ | 3,518 |
| $ | 452,226 |
|
| Increase (decrease) due to: | | | | | | | |
| Comparable portfolio | 10,423 |
| 1,455 |
| 1,265 |
| 13,143 |
| — |
| — |
| 13,143 |
|
Non-comparable properties (1) | (1,215 | ) | 1,205 |
| (976 | ) | (986 | ) | 9,041 |
| — |
| 8,055 |
|
| Change in consolidation method due to partial sale or acquisition | — |
| — |
| (10,234 | ) | (10,234 | ) | — |
| — |
| (10,234 | ) |
| Recently disposed properties | (12,688 | ) | (1,136 | ) | (4,696 | ) | (18,520 | ) | — |
| (3,518 | ) | (22,038 | ) |
| Land sales | — |
| — |
| — |
| — |
| 11,368 |
| — |
| 11,368 |
|
| Other | (1,771 | ) | (2,153 | ) | 3,309 |
| (615 | ) | 543 |
| — |
| (72 | ) |
| Revenues for the six months ended June 30, 2017 | $ | 230,922 |
| $ | 144,412 |
| $ | 29,794 |
| $ | 405,128 |
| $ | 47,320 |
| $ | — |
| $ | 452,448 |
|
|
| | | | | | | | | | | | | | | | | | | | | | | | |
| | Office | Apartments | Retail | Total Operations | Development | Corporate | Other | Total |
| Operating expenses for the six months ended June 30, 2016 | $ | 94,349 |
| $ | 68,912 |
| $ | 26,065 |
| $ | 189,326 |
| $ | 37,223 |
| $ | 48,263 |
| $ | 2,730 |
| $ | 277,542 |
|
| Increase (decrease) due to: | | | | | | | | |
| Comparable portfolio | 4,776 |
| 677 |
| 422 |
| 5,875 |
| — |
| — |
| — |
| 5,875 |
|
Non-comparable properties (1) | (652 | ) | 399 |
| (176 | ) | (429 | ) | 3,416 |
| — |
| — |
| 2,987 |
|
| Change in consolidation method due to partial sale or acquisition | — |
| — |
| (4,057 | ) | (4,057 | ) | — |
| — |
| — |
| (4,057 | ) |
| Recently disposed properties | (8,246 | ) | (1,204 | ) | (4,861 | ) | (14,311 | ) | — |
| — |
| (2,730 | ) | (17,041 | ) |
| Land cost of sales | — |
| — |
| — |
| — |
| 7,653 |
| — |
| — |
| 7,653 |
|
| Organizational transformation and termination benefits | — |
| — |
| — |
| — |
| — |
| (3,013 | ) | — |
| (3,013 | ) |
| Development, management, corporate and other | (2,713 | ) | (2,690 | ) | 3,957 |
| (1,446 | ) | (6,393 | ) | (4,261 | ) | — |
| (12,100 | ) |
| Operating expenses for the six months ended June 30, 2017 | $ | 87,514 |
| $ | 66,094 |
| $ | 21,350 |
| $ | 174,958 |
| $ | 41,899 |
| $ | 40,989 |
| $ | — |
| $ | 257,846 |
|
|
| | | | | | | | | | | | | | | | | | | | | | | | |
| | Office | Apartments | Retail | Total Operations | Development | Corporate | Other | Total |
| Equity in earnings (loss) for the six months ended June 30, 2016 | $ | 3,663 |
| $ | 20,826 |
| $ | 42,933 |
| $ | 67,422 |
| $ | 3,076 |
| $ | (51,733 | ) | $ | 322 |
| $ | 19,087 |
|
| Increase (decrease) due to: | | | | | | | | |
| Comparable portfolio | 319 |
| 686 |
| (530 | ) | 475 |
| — |
| — |
| — |
| 475 |
|
Non-comparable properties (1) | 2,397 |
| — |
| — |
| 2,397 |
| (5,201 | ) | — |
| — |
| (2,804 | ) |
| Recently disposed equity method properties | — |
| — |
| (1,115 | ) | (1,115 | ) | — |
| — |
| (322 | ) | (1,437 | ) |
| Change in consolidation method due to partial sale or acquisition | — |
| — |
| 1,953 |
| 1,953 |
| — |
| — |
| — |
| 1,953 |
|
| Land | — |
| — |
| — |
| — |
| (2,389 | ) | — |
| — |
| (2,389 | ) |
| Subsidized senior housing | — |
| (264 | ) | — |
| (264 | ) | — |
| — |
| — |
| (264 | ) |
| Other | 919 |
| (285 | ) | (587 | ) | 47 |
| (2,227 | ) | 3,098 |
| — |
| 918 |
|
| Equity in earnings (loss) for the six months ended June 30, 2017 | $ | 7,298 |
| $ | 20,963 |
| $ | 42,654 |
| $ | 70,915 |
| $ | (6,741 | ) | $ | (48,635 | ) | $ | — |
| $ | 15,539 |
|
| |
| (1) | The following table presents the increases (decreases) in revenues, operating expenses and equity in earnings (loss) for properties in lease-up or recently stabilized but not comparable and other consolidated non-comparable properties: |
|
| | | | | | | | | | |
| | | Six Months Ended June 30, 2017 vs. 2016 |
| Property | Quarter Opened | Revenues | Operating Expenses | Equity in Earnings (Loss) |
| Operations | | | | |
| Office: | | | | |
| Properties recently stabilized: | | | | |
| 300 Massachusetts Ave | Q1-16 | $ | — |
| $ | — |
| $ | 2,397 |
|
| Non-comparable property: | | | | |
26 Landsdowne Street (1) | 395 |
| (164 | ) | — |
|
Post Office Plaza (2) | (1,610 | ) | (488 | ) | — |
|
| Total Office | $ | (1,215 | ) | $ | (652 | ) | $ | 2,397 |
|
| | | | | |
| Apartments: | | | | |
| Properties recently stabilized: | | | | |
| Aster Town Center North | Q4-15/Q1-16 | $ | 1,205 |
| $ | 399 |
| $ | — |
|
| Total Apartments | $ | 1,205 |
| $ | 399 |
| $ | — |
|
| | | | | |
| Retail: | | | | |
| Non-comparable property: | | | | |
Boulevard Mall (3) | $ | (976 | ) | $ | (176 | ) | $ | — |
|
| Total Retail | $ | (976 | ) | $ | (176 | ) | $ | — |
|
| | | | | |
| Development | | | | |
| Properties in lease-up: | | | | |
| 1812 Ashland Ave | Q2-16 | $ | 2,552 |
| $ | 749 |
| $ | — |
|
| 535 Carlton | Q1-17/Q4-17 | — |
| — |
| (659 | ) |
| 461 Dean Street | Q3-16/Q4-16 | 786 |
| 1,172 |
| — |
|
| Blossom Plaza | Q2-16 | 2,096 |
| 1,068 |
| — |
|
| Eliot on 4th | Q1-17 | 57 |
| 812 |
| — |
|
| Kapolei Lofts | Q3-15/Q3-16 | 2,308 |
| 302 |
| — |
|
| NorthxNorthwest | Q4-16/Q1-17 | 309 |
| 635 |
| — |
|
| The Bixby | Q3-16/Q4-16 | — |
| — |
| (191 | ) |
| The Yards - Arris | Q1-16 | 3,540 |
| 162 |
| — |
|
| Non-comparable property: | | | | |
Ballston Quarter (4) | (1,950 | ) | (1,062 | ) | (2,585 | ) |
| Transfers from development (2016) to operations (2017): | | | | |
| 300 Massachusetts Ave | Q1-16 | — |
| — |
| (1,766 | ) |
| Aster Town Center North | Q4-15/Q1-16 | (657 | ) | (422 | ) | — |
|
| Total Development | $ | 9,041 |
| $ | 3,416 |
| $ | (5,201 | ) |
| |
| (1) | 26 Landsdowne Street, an office building in Cambridge, Massachusetts, is classified as a non-comparable property due to its upcoming planned redevelopment expected to begin in Q3 2017. |
| |
| (2) | Post Office Plaza, an office building in Cleveland, Ohio, is classified as a non-comparable property as we have decided not to make additional investments into this office building located in a non-core market and it is targeted for disposition. |
| |
| (3) | Boulevard Mall, a regional mall in Amherst, New York, is classified as a non-comparable property due to our intention to execute a deed-in-lieu transaction with the Special Servicer who currently holds the nonrecourse mortgage on the property. |
| |
| (4) | Effective April 1, 2016, Ballston Quarter, a regional mall in Arlington, Virginia, changed from the full consolidation method of accounting to the equity method of accounting. The decreases in revenues and operating expenses relate to the period prior to the consolidation change while the change in equity in earnings relates to the period subsequent. Ballston Quarter is classified as a non-comparable property due to its current redevelopment. |
Office
The decreases in revenues and operating expenses related to recent disposals are primarily due to the sale of Illinois Science & Technology Park, office buildings in Skokie, Illinois (Q1-2017), and Terminal Tower, an office building in Cleveland, Ohio (Q3-2016). The decrease in operating expenses related to property and asset management is primarily due to reduced overhead costs as a result of our recent reorganization, as well as the centralization of certain functions now performed at Corporate and reported as Corporate expenses.
Apartments
The decreases in revenues and operating expenses related to recent disposals are primarily due to the sale of Grand Lowry Lofts, an apartment community in Denver, Colorado (Q4-2016). The decrease in operating expenses related to property and asset management is primarily due to reduced overhead costs as a result of our recent reorganization, as well as the centralization of certain functions now performed at Corporate and reported as Corporate expenses.
Retail
The decreases in revenues and operating expenses along with the increase in equity in earnings related to the change in consolidation method are due to the change from full consolidation to equity method accounting upon the formation of a joint venture with an outside partner for Westchester’s Ridge Hill, a regional mall in Yonkers, New York (Q1-2016), and Shops at Wiregrass, a regional mall in Tampa, Florida (Q4-2016). The decreases in revenues and operating expenses related to recent disposals are primarily due to the sale of Avenue at Tower City Center, a specialty retail center in Cleveland, Ohio, and related parking facility assets (Q1-2016), as a result of our ongoing strategy to sell operating assets in non-core markets.
Development
The decrease in operating expenses related to the development management and service functions is primarily due to reduced overhead costs as a result of our recent reorganization, as well as the centralization of certain functions now performed at Corporate and reported as Corporate expenses.
Corporate
The decrease in other operating expenses is primarily due to general and administrative overhead reduction partially offset by an increase in costs as a result of certain functions being centralized as a result of the recent reorganization in the prior year and now reported as Corporate expenses that were previously recorded in the Office, Apartments, Retail and Development segments. The equity in earnings (loss) reported in the Corporate segment relates solely to interest expense on our equity method investments, as all interest expense is reported in the Corporate segment.
The decrease in organizational transformation and termination benefits is a result of the transactional nature of these project costs. The following table summarizes the components of organizational transformation and termination benefits:
|
| | | | | | | | | | | | | |
| | Three Months Ended June 30, | | Six Months Ended June 30, |
| | 2017 | 2016 | | 2017 | 2016 |
| | (in thousands) |
| Termination benefits | $ | 4,585 |
| $ | 2,612 |
| | $ | 8,737 |
| $ | 7,563 |
|
| Shareholder activism costs | 2,278 |
| — |
| | 2,651 |
| — |
|
| Reorganization costs | — |
| 2,978 |
| | — |
| 5,975 |
|
| REIT conversion costs | — |
| 91 |
| | — |
| 863 |
|
| Total | $ | 6,863 |
| $ | 5,681 |
|
| $ | 11,388 |
| $ | 14,401 |
|
For the periods presented, we experienced workplace reductions and recorded the associated termination benefits expenses (outplacement and severance payments based on years of service and other defined criteria) for each occurrence.
Shareholder activism costs are comprised of advisory, legal and other professional fees associated with activism matters. Reorganization costs consist primarily of consulting and other professional fees related to the 2016 restructuring of the organization by function (operations, development and corporate support). REIT conversion costs consist primarily of legal, accounting, consulting and other professional fees. We have segregated these costs along with termination benefits and reported these amounts as organizational transformation and termination benefits in the Consolidated Statements of Operations and reported in the Corporate segment.
REIT conversion costs and professional fees associated with the reorganization were complete as of December 31, 2016. Shareholder activism costs, if any, and termination benefits associated with the completion of the reorganization will continue to be reported on this line item.
Other
The fluctuations in revenues, operating expenses and equity in earnings related to recent disposals are due to the sale of our interests in entities that develop and manage military family housing (Q1-2016).
Depreciation and Amortization
Depreciation and amortization expense was $65,747,000 and $129,302,000 for the three and six months ended June 30, 2017, respectively, and $62,418,000 and $125,629,000 for the three and six months ended June 30, 2016, respectively. The increase from the prior periods is primarily attributable to new property openings in 2016 and 2017 offset by the sale of full or partial interest in rental properties in 2016.
Impairment of Real Estate and Impairment of Unconsolidated Entities
See Note M – Impairment of Real Estate and Impairment of Unconsolidated Entities in the Notes to Consolidated Financial Statements in Item 1 of this Form 10‑Q for detailed information.
Interest and Other Income
Interest and other income was $9,896,000 and $20,168,000 for the three and six months ended June 30, 2017, respectively, and $11,031,000 and $20,685,000 for the three and six months ended June 30, 2016, respectively. The net decrease for the three and six months ended June 30, 2017 compared with the three and six months ended June 30, 2016 is primarily related to a reduction in available income tax credits resulting in decreased income recognition on the allocation of state and federal historic preservation, low income housing and new market tax credits. Interest and other income is partially offset by increased interest income on notes receivable related to the Nets and Barclays Center sales for the six months ended June 30, 2017 compared with the prior year.
Interest Expense
The following table presents interest expense for the three months ended June 30, 2017 compared with the three months ended June 30, 2016 and the six months ended June 30, 2017 compared with the six months ended June 30, 2016. All amounts are presented in thousands.
|
| | | | | | |
| | Three Months Ended | Six Months Ended |
| | June 30, 2016 and 2017 |
| Interest expense for the three and six months ended June 30, 2016 | $ | 32,435 |
| $ | 67,070 |
|
| Increase (decrease) due to: | | |
| Comparable portfolio | (9,622 | ) | (19,445 | ) |
| Non-comparable properties | 1,528 |
| 3,387 |
|
| Change in consolidation method due to partial sale or acquisition | (1,018 | ) | (3,311 | ) |
| Recently disposed properties | (644 | ) | (1,184 | ) |
| Capitalized interest | 5,101 |
| 11,600 |
|
| Mark-to-market adjustments on non-designated swaps | (932 | ) | (4,028 | ) |
| Corporate recourse debt | 2,053 |
| 2,787 |
|
| Interest expense for the three and six months ended June 30, 2017 | $ | 28,901 |
| $ | 56,876 |
|
The decrease in interest expense for both periods for the comparable portfolio is primarily due to the paydown of the $640,000,000 nonrecourse mortgage note for the New York Times (Q4-2016). The decrease in interest expense related to the change in consolidation method is due to the change from full consolidation to equity method accounting upon the formation of a joint venture with an outside partner in Westchester’s Ridge Hill (Q1-2016) and Shops at Wiregrass (Q4-2016). The increase in interest expense related to capitalized interest is due to the decrease in number of projects under construction and development as we completed those projects. The increase in interest expense from corporate recourse debt is due to the borrowing on our Term Loan (Q4-2016) in which those proceeds, along with additional cash on hand, were used to payoff the nonrecourse mortgage note for the New York Times.
Amortization of Mortgage Procurement Costs
Amortization of mortgage procurement costs was $1,507,000 and $2,729,000 for the three and six months ended June 30, 2017, respectively, and $1,416,000 and $3,081,000, for the three and six months ended June 30, 2016, respectively. The decrease for the six months ended June 30, 2017 as compared to the prior year period is primarily due to our ongoing deleveraging strategy.
Loss on Extinguishment of Debt
See Note N – Loss on Extinguishment of Debt and Note F – Convertible Senior Debt, Net in the Notes to Consolidated Financial Statements in Item 1 of this Form 10‑Q for detailed information.
Net Gain on Disposition of Interest in Unconsolidated Entities
See Note O– Net Gain on Disposition of Interest in Unconsolidated Entities in the Notes to Consolidated Financial Statements in Item 1 of this Form 10‑Q for detailed information.
Net Gain (Loss) on Disposition of Interest in Development Project
See Note Q – Net Gain (Loss) on Disposition of Interest in Development Project in the Notes to Consolidated Financial Statements in Item 1 of this Form 10‑Q for detailed information.
Net Gain on Disposition of Full or Partial Interest in Rental Properties, Net of Tax
See Note R – Net Gain on Disposition of Full or Partial Interest in Rental Properties, Net of Tax in the Notes to Consolidated Financial Statements in Item 1 of this Form 10‑Q for detailed information.
Discontinued Operations
See Note S – Discontinued Operations in the Notes to Consolidated Financial Statements in Item 1 of this Form 10-Q for detailed information.
Net Earnings Attributable to Forest City Realty Trust, Inc.
Net earnings attributable to Forest City Realty Trust, Inc. for the three months ended June 30, 2017 was $56,753,000 versus net earnings of $26,599,000 for the three months ended June 30, 2016. The variance to the prior year period is primarily attributable to the following fluctuations, which are pre-tax, include unconsolidated investment activity and are net of noncontrolling interests:
Asset Dispositions - $24,691,000
| |
| • | $27,324,000 related to increased gains on disposition of full or partial interest in rental properties and unconsolidated investments in 2017 compared to 2016; |
| |
| • | $(5,949,000) related to a combined fluctuation in revenues and operating expenses at properties in which we disposed of our full or partial interest during 2017 and 2016; and |
| |
| • | $3,316,000 related to increased land sales in 2017 compared with 2016, primarily at our Stapleton project. |
Financing Transactions - $6,880,000
| |
| • | $10,180,000 primarily related to a decrease in interest expense on nonrecourse mortgage debt due to the payoff of the $640,000,000 nonrecourse mortgage debt for the New York Times building in Q4 2016 partially offset by interest expense incurred on the Term Loan which we borrowed in full in November 2016 to payoff the mortgage debt on the New York Times; |
| |
| • | $(5,101,000) related to an increase in interest expense in 2017 compared with 2016 due to decreased capitalized interest on projects under construction and development as we decreased our construction pipeline; |
| |
| • | $954,000 related to the change in fair market value of certain derivatives not qualifying for hedge accounting between the comparable periods, which was marked to market through interest expense; and |
| |
| • | $847,000 related to decreased losses on extinguishment of debt compared with 2016. |
Operations - $6,960,000
| |
| • | $6,126,000 related to a combined fluctuation in revenues and operating expenses in our comparable portfolio in 2017 compared to 2016; |
| |
| • | $2,016,000 related to a combined fluctuation in revenues and operating expenses for operations and development properties in lease-up or recently stabilized but not comparable and other non-comparable properties at June 30, 2017; and |
| |
| • | $(1,182,000) related to higher organizational transformation and termination benefits in 2017 compared with 2016. |
Non-Cash Transactions - $(2,439,000)
| |
| • | $(2,457,000) related to an increase in depreciation and amortization expense in 2017 compared with 2016 primarily attributable to new property openings in 2016 and 2017 offset by the sale of full or partial interest in rental properties in 2016; |
| |
| • | $2,100,000 related to decreased impairment of real estate in 2017 compared to 2016; and |
| |
| • | $(1,992,000) related to increased write-offs of abandoned development projects and demolition costs in 2017 compared with 2016. |
Income Taxes
| |
| • | $(4,462,000) primarily due to increased state income tax expense related to gains on asset dispositions. |
Net earnings attributable to Forest City Realty Trust, Inc. for the six months ended June 30, 2017 was $97,670,000 versus net earnings of $270,634,000 for the six months ended June 30, 2016. The variance to the prior year period is primarily attributable to the following fluctuations, which are pre-tax, include unconsolidated investment activity and are net of noncontrolling interests:
Asset Dispositions - $(327,619,000)
| |
| • | $(181,677,000) related to decreased gains on disposition of full or partial interest in rental properties and unconsolidated investments in 2017 compared to 2016; |
| |
| • | $(136,687,000) related to the net gain on disposition of the development site 625 Fulton Avenue in 2016; |
| |
| • | $(12,843,000) related to a combined fluctuation in revenues and operating expenses at properties in which we disposed of our full or partial interest during 2017 and 2016; and |
| |
| • | $3,588,000 related to increased land sales in 2017 compared with 2016, primarily at our Stapleton project. |
Financing Transactions - $42,392,000
| |
| • | $25,465,000 related to decreased losses on extinguishment of debt compared with 2016 primarily due to separate, privately negotiated exchange transactions involving a portion of our Senior Notes due 2016, 2018 and 2020 in 2016; |
| |
| • | $24,471,000 primarily related to decreases in interest expense on nonrecourse mortgage debt due to the payoff of the $640,000,000 nonrecourse mortgage debt for the New York Times building in Q4 2016 and on corporate debt due to separate, privately negotiated exchange transactions involving certain of our Senior Notes due 2016, 2018 and 2020 in 2016. The decreases were offset by interest expense incurred on the Term Loan which we borrowed in full in November 2016 to payoff the mortgage debt on the New York Times; |
| |
| • | $(11,600,000) related to an increase in interest expense in 2017 compared with 2016 due to decreased capitalized interest on projects under construction and development as we decreased our construction pipeline; and |
| |
| • | $4,056,000 related to the change in fair market value of certain derivatives not qualifying for hedge accounting between the comparable periods, which was marked to market through interest expense. |
Operations - $22,842,000
| |
| • | $10,806,000 primarily related to lower corporate general and administrative expenses and decreased costs in our operations and development management and service entities; |
| |
| • | $7,573,000 related to a combined fluctuation in revenues and operating expenses in our comparable portfolio in 2017 compared to 2016; |
| |
| • | $3,013,000 related to lower organizational transformation and termination benefits in 2017 compared with 2016; and |
| |
| • | $1,450,000 related to a combined fluctuation in revenues and operating expenses for operations and development properties in lease-up or recently stabilized but not comparable and other non-comparable properties at June 30, 2017. |
Non-Cash Transactions - $10,304,000
| |
| • | $14,564,000 related to decreased impairment of real estate in 2017 compared to 2016; |
| |
| • | $(2,343,000) related to increased write-offs of abandoned development projects and demolition costs in 2017 compared with 2016; and |
| |
| • | $(1,917,000) related to to an increase in depreciation and amortization expense in 2017 compared with 2016 primarily attributable to new property openings in 2016 and 2017 offset by the sale of full or partial interest in rental properties in 2016. |
Income Taxes
| |
| • | $78,309,000 due to decreased income tax expense primarily due to gains on sale of assets owned by our TRS in 2016. The tax expense in 2016 is primarily non-cash as it largely relates to the utilization of the deferred tax asset to offset the taxable gain on the various sales. |
Phased Openings and Projects Under Construction
June 30, 2017
In addition to the growth in our operating portfolio through improved NOI at our existing properties, we have used development as a primary source of growth in our real estate operations. The following tables summarize phased openings and projects currently under construction as of June 30, 2017 and properties we have opened during the six months ended June 30, 2017.
|
| | | | | | | | | | | | | | | | | | | | | |
| | | | | | | | | | | | | |
| | | Anticipated | | | | | | | | | | |
| | | Opening | Legal | Consolidated (C)
| Cost at | Cost Incurred to Date (b) | No. of | | | | Lease % |
| | Location | Date | Ownership % | Unconsolidated (U) | Completion (a) | Consolidated | Unconsolidated | Units | | GLA | | (c) |
| | | | | | (in millions) | | | | | |
| 2017 Phased Openings | | | | | | | | | | | | |
| Apartments | | | | | | | | | | | | |
| Greenland Joint Venture: | | | | | | | | | | | |
| 550 Vanderbilt (condominiums) (d) | Brooklyn, NY | Q1-17/Q3-17 | 30 | % | U | $ | 362.7 |
| $ | 0.0 |
| $ | 325.1 |
| 278 |
| | 7,000 |
| |
|
| Pacific Park Parking (e) | Brooklyn, NY | Q1-17/Q3-17 | 30 | % | U | 46.2 |
| 0.0 |
| 36.3 |
| — |
| | — |
| | |
| | | | | | $ | 408.9 |
| $ | 0.0 |
| $ | 361.4 |
| 278 |
| | 7,000 |
| | |
| | | | | | | | | | | | | |
| Projects Under Construction | | | | | | | | | | | |
| Apartments: | | | | | | | | | | | | |
| Arizona State Retirement System Joint Venture: | | | | | | | | | | | |
| Axis | Los Angeles, CA | Q3-17/Q2-18 | 30 | % | C | $ | 140.4 |
| $ | 132.7 |
| $ | 0.0 |
| 391 |
| | 15,000 |
| | |
| Ardan | Dallas, TX | Q1-18/Q2-18 | 30 | % | C | 122.1 |
| 60.1 |
| 0.0 |
| 389 |
| | 4,250 |
| | |
| | | | | | $ | 262.5 |
| $ | 192.8 |
| $ | 0.0 |
| 780 |
| | 19,250 |
| | |
| Greenland Joint Venture: | | | | | | | | | | | |
| 38 Sixth Ave | Brooklyn, NY | Q3-17 | 30 | % | U | 202.7 |
| 0.0 |
| 153.9 |
| 303 |
| | 28,000 |
| | |
| | | | | | | | | | | | | |
| Mint Town Center | Denver, CO | Q3-17/Q4-17 | 95 | % | C | 93.1 |
| 68.8 |
| 0.0 |
| 399 |
| | 7,000 |
| | |
| VYV | Jersey City, NJ | Q3-17/Q1-18 | 50 | % | U | 214.3 |
| 0.0 |
| 183.7 |
| 421 |
| | 9,000 |
| | |
| Ballston Quarter Residential | Arlington, VA | Q3-18/Q1-19 | 51 | % | U | 181.9 |
| 0.0 |
| 43.0 |
| 406 |
| | 53,000 |
| | |
| The Yards - The Guild (f) | Washington, D.C. | Q4-18 | 0 | % | C | 91.1 |
| 25.8 |
| 0.0 |
| 191 |
| | 6,000 |
| | |
| Capper 769 | Washington, D.C. | Q1-19 | 25 | % | U | 72.3 |
| 0.0 |
| 14.6 |
| 179 |
| | — |
| | |
| | | | | | $ | 1,117.9 |
| $ | 287.4 |
| $ | 395.2 |
| 2,679 |
| | 122,250 |
| | |
| Retail: | | | | | | | | | | | | |
| The Yards - District Winery | Washington, D.C. | Q4-17 | 100 | % | C | $ | 10.6 |
| $ | 9.1 |
| $ | 0.0 |
| — |
| | 16,150 |
| | 100% |
| Ballston Quarter Redevelopment | Arlington, VA | Q3-18 | 51 | % | U | 86.7 |
| 0.0 |
| 35.9 |
| — |
| | 307,000 |
| | 42% |
| | | | | | $ | 97.3 |
| $ | 9.1 |
| $ | 35.9 |
| — |
| | 323,150 |
| | |
| Total Projects Under Construction | $ | 1,215.2 |
| $ | 296.5 |
| $ | 431.1 |
| | | | | |
See footnotes on the following page.
Property Openings
June 30, 2017
|
| | | | | | | | | | | | | | | | |
| | | | | | | | | | | |
| | Location | Date Opened | Legal Ownership % | Consolidated (C) Unconsolidated (U) | Cost at Completion (a) | No. of Units | | GLA | Lease % (c) |
| | | | | | (in millions) | | | | | |
| 2017 Property Openings | | | | | | | | | | |
| Office: | | | | | | | | | | |
| The Bridge at Cornell Tech | Roosevelt Island, NY | Q2-17 | 100 | % | C | $ | 164.1 |
| — |
| | 235,000 |
| | 50 | % |
| | | | | | | | | | | |
| Apartments: | | | | | | | | | | |
| Greenland Joint Venture: | | | | | | | | | |
| 535 Carlton | Brooklyn, NY | Q1-17/Q2-17 | 30 | % | U | $ | 168.1 |
| 298 |
| | — |
| | 36 | % |
| | | | | | | | | | | |
| 461 Dean Street | Brooklyn, NY | Q3-16/Q1-17 | 100 | % | C | 195.6 |
| 363 |
| | 4,000 |
| | 77 | % |
| The Bixby. | Washington, D.C. | Q3-16/Q2-17 | 25 | % | U | 59.2 |
| 195 |
| | — |
| | 99 | % |
| Arizona State Retirement System Joint Venture: | | | | | | | | | |
| Eliot on 4th (g) | Washington, D.C. | Q1-17/Q3-17 | 30 | % | C | $ | 143.7 |
| 365 |
| | 5,000 |
| | 39 | % |
| NorthxNorthwest | Philadelphia, PA | Q4-16/Q1-17 | 30 | % | C | 115.0 |
| 286 |
| | — |
| | 24 | % |
| | | | | | $ | 258.7 |
| 651 |
| | 5,000 |
| | |
| | | | | | $ | 681.6 |
| 1,507 |
| | 9,000 |
| | |
| Total Property Openings | $ | 845.7 |
| | | | | |
| |
| (a) | Represents estimated project costs to achieve stabilization. Amounts exclude capitalized interest not allocated to the underlying joint venture. |
| |
| (b) | Represents total capitalized project costs incurred to date, including all capitalized interest related to the development project. |
| |
| (c) | Lease commitments as of July 23, 2017. |
| |
| (d) | Costs Incurred to Date at 550 Vanderbilt represents total cumulative capitalized project costs incurred to date, gross of cost of goods sold related to applicable condominium units. |
| |
| (e) | Expected to include 370 parking spaces. |
| |
| (f) | Represents an apartment community under construction in which the Company has a 0% legal ownership interest. However, the Company is the project developer, on a fee basis. In addition, the Company has issued a project completion guarantee to the first mortgagee and is funding a portion of the construction costs through a mezzanine loan to the owner. As a result, the Company determined it was the primary beneficiary of this variable interest entity and has consolidated the project. |
| |
| (g) | As of June 30, 2017, construction on Eliot on 4th is complete. The property is open and has received partial tenant certificates of occupancy, 333 of 365, and is awaiting remaining tenant certificates of occupancy. |
FINANCIAL CONDITION AND LIQUIDITY
Apartment performance has begun to moderate due to increased supply throughout many areas in the United States, especially in some gateway cities. The increased supply has put pressure on near-term occupancy levels and rental growth. Office and retail performance to varying degrees is dependent on product type and geographic market. Access to bank credit and capital remains open with banks and permanent lenders originating new loans for real estate projects. Originations of new loans for commercial mortgage backed securities have slowed recently due to increased market volatility. Lenders continue favoring high quality operating assets in strong markets. While banks continue to originate construction loans for apartment projects, construction loans for office or retail projects remain difficult to obtain, unless the project has substantial pre-leasing in place or higher than historical equity commitments from the developer.
Sources of Funds
Our principal sources of funds are cash provided by operations including land sales, our revolving credit facility, our term loan, nonrecourse mortgage debt and notes payable, dispositions of operating properties or development projects through sales or equity joint ventures, proceeds from the issuance of senior notes, common or preferred equity and other financing arrangements. We have consistently disposed of assets in an effort to recycle capital and reposition our portfolio. Over the last five years, we have generated cash proceeds from dispositions of full or partial interests in rental properties, development projects and other investments averaging well in excess of $400,000,000 per year. Given the diversity of our portfolio by market and product type, we believe the market for property dispositions will continue to be available. We believe the current market conditions will allow us to continue our historical strategy to recycle capital and reposition the portfolio through asset sales or equity joint ventures.
Our strategic plan drives our capital strategy and business focus on core products located in core markets. In order to achieve our strategic goals, we believe we can maximize cash provided by operations by concentrating our portfolio in the markets we believe are best positioned for long term growth. Additionally, we evaluate each individual asset in our operating and development portfolio to identify those having the best opportunity to provide capital through full or partial sale in conjunction with our strategy of focusing on core products located in core markets. This process may result in reductions to estimated holding periods and the total estimated undiscounted cash flows used for impairment calculations on our individual consolidated real estate assets. In some cases, this may result in estimated undiscounted cash flows being less than the carrying value of the consolidated asset and necessitating an impairment charge to write down the asset to its estimated fair value.
In addition, our capital strategy includes evaluating potential equity joint ventures to provide capital through the sales of partial interests of operating properties or to reduce our equity requirements and development risk on development opportunities. Entering into joint ventures could result in us granting joint control or losing control of the asset and, accordingly, the asset would no longer be consolidated. Upon deconsolidation, our investment balance in the joint venture would be compared to estimated fair value and recorded at the lesser of fair value or book value. Additionally, evaluation for other than temporary impairment on a quarterly basis would be required. This could result in future impairments, some of which could be significant, that would not otherwise be required if the real estate asset remained consolidated.
Strategic Alternatives for our Retail Portfolio
In August 2016, we announced that our Board of Directors authorized a process to review strategic alternatives for a portion of our retail portfolio. We have been exploring a range of options. Assuming we identify and are able to transact on a chosen alternative, or alternatives, our intent would be to dispose of these retail assets in a tax-deferred manner and redeploy the equity from our retail portfolio into apartment and office assets that align with our focus on primarily core markets and urban, mixed-use placemaking projects, including amenity retail. If we successfully execute on the redeployment strategy, we would expect to generate larger than average proceeds from dispositions and more acquisition activity in the next 12-36 months than historical results.
As part of the strategic review, we continue to have discussions with certain strategic partners and other potential buyers for several of the retail assets. As a result, we updated our impairment analysis on our retail assets, which resulted in the recording of a significant impairment charge during the year ended December 31, 2016 related to two of our consolidated assets. As we continue to review strategic alternatives for our retail portfolio, we may be required to further update our undiscounted cash flow impairment analysis of fully consolidated assets, including probability weighted estimated holding periods. Changes in these estimates and assumptions may result in future impairments.
We continue to have productive negotiations with two of our existing partners in our regional mall and specialty retail portfolios. These negotiations have resulted in executed transaction agreements with both QIC and Madison International for the disposition of 7 of our regional mall assets and 11 of our specialty retail assets, respectively. We expect these transactions to close in the fourth quarter of 2017, pending lender and other third-party approvals, and the completion of due diligence and final approvals by QIC’s investors, which is expected by September 30, 2017.
Based on the executed transaction agreements, the economics of the potential transactions reflect an average cap rate of five percent on 2016 net operating income of approximately $110,000,000 and total debt of approximately $1,000,000,000. If we are able to execute on these agreements, we would expect to recognize a significant GAAP gain on the disposal of our retail portfolio. However, there can be no assurance that any transaction could be consummated on the terms described above or at all. In addition, there can be no assurance that any transaction, if consummated, could be executed in a tax deferred manner.
Use of Funds
Our principal uses of funds include the financing of our real estate operating and development projects, capital expenditures for our existing operating portfolio, principal and interest payments on our nonrecourse mortgage debt and notes payable, revolving credit facility, term loan and senior notes, our ongoing quarterly payments of common stock dividends and selective operating asset acquisitions, including joint venture partner acquisitions. As noted in the retail portfolio discussion, if we can execute on tax-deferred sales of our retail assets, we would expect to have an increased number of asset acquisitions compared to our historical activity.
Our capital strategy seeks to isolate the operating and financial risk at the property level to reduce risk on and of our equity capital. We typically do not cross-collateralize our mortgage debt and notes payable outside of a single identifiable project. As such, a majority of our operating and development properties are separately encumbered with nonrecourse mortgage debt or notes payable, which provides protection by allowing the lender to look only to the single asset securing the lender in the event of a default.
As discussed above, a majority of our assets are separately encumbered. Since 2011, our capital strategy has focused on reducing our overall leverage level. During 2015, we began establishing an unencumbered asset pool. The New York Times office building in Manhattan, New York represents the most significant property in our unencumbered asset pool. The properties in our unencumbered asset pool generated NOI of $28,174,000 during the six months ended June 30, 2017. We believe this change in financing strategy is consistent with our deleveraging efforts and provides us greater financial flexibility. We intend to add unencumbered assets to this pool during 2017 and beyond, as we continue to make progress on our deleveraging goals.
We use taxable and tax-exempt nonrecourse debt for our real estate projects. For real estate projects financed with tax-exempt debt, we generally utilize variable-rate debt. For construction loans, we generally pursue variable-rate financings with maturities ranging from two to five years. For those real estate projects financed with taxable debt, we generally seek long-term, fixed-rate financing for those operating projects whose loans mature or are projected to open and achieve stabilized operations.
Prior to operating as a REIT in 2016, we operated as a C corporation and retained substantially all of our internally generated cash. This cash, together with refinancing and property sale proceeds, has historically provided us with the necessary liquidity to take advantage of investment opportunities. The economic downturn and its impact on the lending and capital markets reduced our ability to finance development and acquisition opportunities and modified the required rates of return to make new investment opportunities appealing. As a result of these market changes, we have established self-imposed limitations on entering into new development activities.
We continue to make progress on certain other pre-development projects, primarily multifamily projects located in core markets. The cash required to fund our equity in projects under construction and development plus cash necessary to extend or pay down our near-term debt maturities is anticipated to exceed our cash from operations. As a result, we intend to extend maturing debt or repay it with net proceeds from property sales, equity joint ventures, borrowings on our revolving credit facility, term loan or future debt or equity financing.
The Nets and Barclays Center - Disposal
In January 2016, we sold our equity interest in the Nets and Barclays Center. Proceeds were received in a combination of cash and notes receivable. The sales price for our equity interest in Barclays Center was $162,600,000, generating net cash proceeds of $60,924,000 and a note receivable of $92,600,000, which bears interest at 4.50% per annum payable semi-annually and matures in 2019. In addition, the buyer assumed the gross debt that amounted to $457,745,000.
The sales price for our equity interest in the Nets was $125,100,000 payable entirely in the form of a note receivable, which bears interest at 4.50% per annum payable at maturity and matures in 2021.
461 Dean Street
461 Dean Street is an apartment building in Brooklyn, New York adjacent to the Barclays Center at the Pacific Park Brooklyn project. This modular construction project opened during the year ended December 31, 2016. We had a fixed price contract (the “CM Contract”) with Skanska USA to construct the apartment building. In 2014, Skanska USA ceased construction and we terminated the CM Contract for cause. Each party has filed lawsuits relating primarily to the project’s delays and associated additional completion costs. We continue to vigorously pursue legal action against Skanska USA for damages related to their default of the CM Contract. However, there is no assurance that we will be successful in recovering these damages or defending against Skanska USA’s claim.
Nonrecourse Mortgage Financings
As of June 30, 2017, we had $207,166,000 of nonrecourse mortgage financings with scheduled maturities during the year ending December 31, 2017, of which $17,877,000 represents regularly scheduled amortization payments. We are currently in negotiations to refinance and/or extend the remaining nonrecourse debt. We cannot give assurance as to the ultimate result of these negotiations. As with all nonrecourse mortgages, if we are unable to negotiate an extension or otherwise refinance the mortgage, we could go into default and the lender could commence foreclosure proceedings on the single collateralized asset, which would likely result in a loss of the asset or an impairment which could be significant.
During the six months ended June 30, 2017, the $91,109,000 nonrecourse mortgage encumbering Boulevard Mall, a regional mall in Amherst, New York, matured and was transferred to a special servicer who subsequently delivered a default notice to us. We are in the process of working with the special servicer to execute a deed-in-lieu transaction. During the year ended December 31, 2016, we recorded an impairment of $52,510,000 on Boulevard Mall. At June 30, 2017, our basis in the property was $58,753,000. The loss of this asset would not have a significant impact to our financial condition, cash flows or liquidity.
As of June 30, 2017, our share of nonrecourse mortgage debt and notes payable, net recorded on our unconsolidated subsidiaries amounted to $2,401,340,000, of which $90,983,000 ($9,382,000 represents scheduled principal payments) is scheduled to mature during the year ending December 31, 2017. Subsequent to June 30, 2017, we have addressed $23,549,000 of these maturities through closed transactions and loan commitments. Negotiations are ongoing to address the remaining 2017 maturities, but we cannot give assurance that we will obtain these financings on favorable terms or at all.
2017 Liquidity Transactions
During the six months ended June 30, 2017, we completed the following transactions, which increased liquidity, reduced debt resulting in lower future fixed charges for interest, and strengthened our balance sheet.
| |
| • | We completed the sale of twenty-two of our unconsolidated federally assisted housing apartment communities, consisting of 3,975 units. The dispositions resulted in net cash proceeds of $53,522,000. |
| |
| • | We completed the sale of Illinois Science & Technology Park, office buildings in Skokie, Illinois, generating net cash proceeds of $16,494,000 after paying off the nonrecourse mortgage debt of $51,274,000. |
| |
| • | We completed the sale of Shops at Bruckner Boulevard, an unconsolidated specialty retail center in Bronx, New York, generating net cash proceeds of $8,863,000 at our ownership share, of which $5,464,000 was not distributed to us and remained in our joint venture to be used for anticipated 2017 debt paydowns. |
We continue to explore options to strengthen our balance sheet and enhance our liquidity, but can give no assurance that we can accomplish any of these other options on terms favorable to us or at all. If we cannot enhance our liquidity, it could adversely impact our growth and result in further curtailment of development activities.
Dividends
We have been operating, and plan to continue operating, in a manner consistent with REIT qualification rules since January 1, 2016. We intend to distribute at least 100% of our taxable income to avoid paying federal tax. Our REIT taxable income typically will not include income earned by our TRSs except to the extent the TRSs pay dividends to us.
The following table summarizes cash dividends declared by the Board of Directors on our Class A and Class B common stock (in thousands, except per share data):
|
| | | | | | | | | |
| Type | Date Declared | Record Date | Payment Date | Amount Per Share | Total Cash Payment |
| 2017 | | | | | |
| Quarterly | May 17, 2017 | June 9, 2017 | June 23, 2017 | $ | 0.09 |
| $ | 23,482 |
|
| Quarterly | March 1, 2017 | March 13, 2017 | March 27, 2017 | $ | 0.09 |
| $ | 23,441 |
|
| | | | Total | $ | 0.18 |
| $ | 46,923 |
|
| | | | | | |
| 2016 | | | | | |
| Quarterly | November 30, 2016 | December 12, 2016 | December 23, 2016 | $ | 0.06 |
| $ | 15,620 |
|
| Quarterly | August 18, 2016 | September 2, 2016 | September 16, 2016 | $ | 0.06 |
| $ | 15,621 |
|
| Quarterly | May 17, 2016 | June 10, 2016 | June 24, 2016 | $ | 0.06 |
| $ | 15,623 |
|
| Quarterly | February 18, 2016 | March 4, 2016 | March 18, 2016 | $ | 0.06 |
| $ | 15,596 |
|
| E&P | February 18, 2016 | March 4, 2016 | March 18, 2016 | $ | 0.10 |
| $ | 25,992 |
|
| | | | Total | $ | 0.34 |
| $ | 88,452 |
|
The amount, timing and frequency of future dividends is at the sole discretion of our Board of Directors and will be declared based upon various factors, many of which are beyond our control, including, our financial condition and operating cash flows, the amount required to maintain REIT status and reduce any income taxes that we otherwise would be required to pay, limitations on dividends in our existing and future debt instruments, our ability to utilize net operating losses to offset, in whole or in part, our dividend requirements, limitations on our ability to fund dividends using cash generated through our TRSs and other factors that our Board of Directors may deem relevant.
Financial Covenants
Our revolving credit facility and term loan contain certain identical restrictive financial covenants. A summary of the key financial covenants as defined in the agreements, all of which we are compliant with at June 30, 2017, follows:
|
| | | |
| | Requirement | As of |
| Credit Facility Financial Covenants | Per Agreements | June 30, 2017 |
| Maximum Total Leverage Ratio | ≤65% | 47.90 | % |
| Maximum Secured Leverage Ratio | ≤55% | 44.28 | % |
| Maximum Secured Recourse Leverage Ratio | ≤15% | 0.00 | % |
| Maximum Unsecured Leverage Ratio | ≤60% | 18.10 | % |
| Minimum Fixed Charge Coverage Ratio | ≥1.50x | 2.06 | x |
| Minimum Unencumbered Interest Coverage Ratio | ≥1.50x | 8.15 | x |
Revolving Credit Facility
See Note D – Revolving Credit Facility in the Notes to Consolidated Financial Statements in Item 1 of this Form 10-Q for detailed information.
Term Loan, Net
See Note E – Term Loan, Net in the Notes to Consolidated Financial Statements in Item 1 of this Form 10-Q for detailed information.
Convertible Senior Debt, Net
See Note F – Convertible Senior Debt, Net in the Notes to Consolidated Financial Statements in Item 1 of this Form 10-Q for detailed information.
Cash Flows
Operating Activities
Net cash provided by operating activities was $163,177,000 and $93,173,000 for the six months ended June 30, 2017 and 2016, respectively. The net increase in cash provided by operating activities is the result of reduced interest payments as a result of our deleveraging strategy, cost reductions throughout the organization and other changes in operating assets and liabilities between the comparable periods.
Investing Activities
Net cash (used in) provided by investing activities was $(174,572,000) and $147,631,000 for the six months ended June 30, 2017 and 2016, respectively, and consisted of the following:
|
| | | | | | |
| | Six Months Ended June 30, |
| | 2017 | 2016 |
| | (in thousands) |
| Capital expenditures: | | |
| Construction and development costs: | | |
Mint Town Center, an apartment community under construction in Denver, Colorado | (27,410 | ) | (9,128 | ) |
| Axis, an apartment community under construction in Los Angeles, California | (25,412 | ) | (14,134 | ) |
The Bridge at Cornell Tech, an office building under construction in Roosevelt Island, New York | (21,214 | ) | (33,533 | ) |
Ardan, an apartment community under construction in Dallas, Texas | (18,663 | ) | (12,179 | ) |
The Yards - The Guild, an apartment community under construction in Washington, D.C. | (14,574 | ) | (9,884 | ) |
| Eliot on 4th | (10,258 | ) | (9,017 | ) |
| 461 Dean Street | (8,035 | ) | (36,366 | ) |
The Yards - Arris, an apartment community in Washington, D.C. | (2,235 | ) | (20,938 | ) |
Kapolei Lofts, an apartment community in Kapolei, Hawaii | (1,344 | ) | (30,948 | ) |
Blossom Plaza, an apartment community in Los Angeles, California | (1,105 | ) | (16,826 | ) |
NorthxNorthwest, an apartment community in Philadelphia, Pennsylvania | — |
| (29,124 | ) |
| Other | (31,372 | ) | (57,493 | ) |
Total construction and development costs (1) | (161,622 | ) | (279,570 | ) |
| Operating properties: | | |
| Office Segment | (9,555 | ) | (3,609 | ) |
| Apartment Segment | (10,106 | ) | (5,700 | ) |
| Retail Segment | (392 | ) | (2,743 | ) |
| | (20,053 | ) | (12,052 | ) |
| Tenant improvements: | | |
| Office Segment | (17,746 | ) | (10,417 | ) |
| Retail Segment | (1,769 | ) | (1,698 | ) |
| | (19,515 | ) | (12,115 | ) |
| Total operating properties | (39,568 | ) | (24,167 | ) |
| Corporate Segment | (364 | ) | — |
|
| Total capital expenditures | $ | (201,554 | ) | $ | (303,737 | ) |
| Capital expenditures of assets included in discontinued operations: | | |
| Arena | — |
| (690 | ) |
Payment of lease procurement costs (2) | (6,129 | ) | (3,145 | ) |
| Increase in notes receivable | (24,379 | ) | (26,321 | ) |
| Payments on notes receivable | — |
| 58,000 |
|
| Decrease in restricted cash used for investing purposes: | | |
| Illinois Science & Technology Park | $ | 3,077 |
| $ | — |
|
The Yards - Foundry Lofts, an apartment community in Washington, D.C. | 1,994 |
| — |
|
| Westchester’s Ridge Hill | — |
| 4,936 |
|
The Yards - Twelve12, an apartment community in Washington, D.C. | — |
| 3,847 |
|
| Other | 992 |
| 7,885 |
|
| Total decrease in restricted cash used for investing purposes | $ | 6,063 |
| $ | 16,668 |
|
| Cash held at Arena upon disposition | — |
| (28,041 | ) |
| Proceeds from disposition of full or partial interest in rental properties or development project: | | |
| Illinois Science & Technology Park | $ | 16,494 |
| $ | — |
|
Fairmont Cinema in San Jose, California | 4,387 |
| — |
|
| Disposition of entities that manage and develop military housing | — |
| 208,305 |
|
625 Fulton Avenue, a development site in Brooklyn, New York | — |
| 93,776 |
|
Disposition of partial interest in Westchester’s Ridge Hill | — |
| 75,448 |
|
| Barclays Center | — |
| 60,924 |
|
Avenue at Tower City Center and Tower City Parking | — |
| 55,015 |
|
| Johns Hopkins Parking Garage | — |
| 11,186 |
|
Aperture Center, an office building in Albuquerque, New Mexico | — |
| 2,572 |
|
| Other | 9,302 |
| — |
|
| Total proceeds from disposition of full or partial interest in rental properties or development project | $ | 30,183 |
| $ | 507,226 |
|
Investing Activities (continued)
|
| | | | | | |
| | Six Months Ended June 30, |
| | 2017 | 2016 |
| | (in thousands) |
| Change in investments in and advances to unconsolidated entities—(contributions to) or distributions from investment: | | |
| Disposition: | | |
| Federally assisted housing apartment communities (22) | $ | 53,522 |
| $ | — |
|
| Shops at Bruckner Boulevard | 3,399 |
| — |
|
| Renewable energy facilities | 3,372 |
| — |
|
Steinway Street Theaters, New York | — |
| 14,059 |
|
| Apartment projects: | | |
Pacific Park Brooklyn joint venture | (25,676 | ) | (48,835 | ) |
VYV, an apartment community under construction in Jersey City, New Jersey | (4,288 | ) | (18,373 | ) |
Cobblestone Court, an apartment community in Painesville, Ohio, refinancing proceeds | 3,695 |
| — |
|
| Retail projects: | | |
| Regional retail mall joint venture, primarily to fund rehabilitation and expansion projects | (11,221 | ) | (4,242 | ) |
Westchester’s Ridge Hill, primarily to fund a restricted cash construction escrow account | — |
| (8,607 | ) |
Atlantic Center, a specialty retail center in Brooklyn, New York | — |
| (4,383 | ) |
| Office project: | | |
300 Massachusetts Ave, an office building in Cambridge, Massachusetts | — |
| 6,699 |
|
| The Nets, a National Basketball Association member | — |
| (3,883 | ) |
| Other | (1,559 | ) | (4,764 | ) |
| Total change in investments in and advances to unconsolidated entities | $ | 21,244 |
| $ | (72,329 | ) |
| Net cash (used in) provided by investing activities | $ | (174,572 | ) | $ | 147,631 |
|
| |
| (1) | We capitalized internal costs related to projects under construction and development of $16,652 and $16,077, including compensation related costs of $14,776 and $14,266, for the six months ended June 30, 2017 and 2016, respectively. Total capitalized internal costs represent approximately 8.3% and 5.3% of total capital expenditures for the six months ended June 30, 2017 and 2016, respectively. |
| |
| (2) | We capitalized internal costs related to leasing activities of $683 and $1,612, including compensation related costs of $529 and $1,393, for the six months ended June 30, 2017 and 2016, respectively. |
Financing Activities
Net cash provided by (used in) financing activities was $9,115,000 and $(148,705,000) for the six months ended June 30, 2017 and 2016, respectively. The Company is committed to continued deleveraging of the balance sheet. The significant debt reduction activity during the six months ended June 30, 2017 related to the sale of Illinois Science & Technology Park and the related extinguishment of its $51,274,000 nonrecourse mortgage. However, this debt extinguishment occurred simultaneously at closing of the property disposition, and therefore is reflected as a non-cash cash flow transaction and not reflected in the Consolidated Statement of Cash Flows.
During the six months ended June 30, 2016, we had increased deleveraging activity as we used cash to pay off a portion of our 2018 and 2020 Senior Notes and for the acquisitions of certain noncontrolling interests subsequent to the sale of Barclays Center and the Nets. In addition, since we operated as a REIT for the first time in 2016, we were required to pay our one-time estimated E&P distribution to our stockholders amounting to $25,992,000.
LEGAL PROCEEDINGS
We are involved in various claims and lawsuits incidental to our business, and management and legal counsel believe these claims and lawsuits will not have a material adverse effect on our consolidated financial statements.
NEW ACCOUNTING GUIDANCE
See the “New Accounting Guidance” section of Note A – Accounting Policies in the Notes to Consolidated Financial Statements in Item 1 of this Form 10-Q for detailed information.
INFORMATION RELATED TO FORWARD-LOOKING STATEMENTS
This Form 10-Q, together with other statements and information publicly disseminated by us, contains “forward-looking statements” within the meaning of Section 27A of the Securities Act of 1933, as amended, and Section 21E of the Securities Exchange Act of 1934, as amended. Such statements reflect management’s current views with respect to financial results related to future events and are based on assumptions and expectations that may not be realized and are inherently subject to risks and uncertainties, many of which cannot be predicted with accuracy and some of which might not even be anticipated. Future events and actual results, financial or otherwise, may differ, perhaps materially, from the results discussed in the forward-looking statements. Risk factors discussed in Item 1A of our Form 10-K for the year ended December 31, 2016 and other factors that might cause differences, some of which could be material, include, but are not limited to, our ability to carry out future transactions and strategic investments, as well as the acquisition related costs, unanticipated difficulties realizing expected benefits expected when entering into a transaction, our ability to qualify or to remain qualified as a REIT, our ability to satisfy REIT distribution requirements, the impact of issuing equity, debt or both, and selling assets to satisfy our future distributions required as a REIT or to fund capital expenditures, future growth and expansion initiatives, the impact of the amount and timing of any future distributions, the impact from complying with REIT qualification requirements limiting our flexibility or causing us to forego otherwise attractive opportunities beyond rental real estate operations, the impact of complying with the REIT requirements related to hedging, our lack of experience operating as a REIT, legislative, administrative, regulatory or other actions affecting REITs, including positions taken by the Internal Revenue Service, the possibility that our Board of Directors will unilaterally revoke our REIT election, the possibility that the anticipated benefits of qualifying as a REIT will not be realized, or will not be realized within the expected time period, the impact of current lending and capital market conditions on our liquidity, our ability to finance or refinance projects or repay our debt, the impact of the slow economic recovery on the ownership, development and management of our commercial real estate portfolio, general real estate investment and development risks, litigation risks, vacancies in our properties, risks associated with developing and managing properties in partnership with others, competition, our ability to renew leases or re-lease spaces as leases expire, illiquidity of real estate investments, our ability to identify and transact on chosen strategic alternatives for a portion of our retail portfolio, bankruptcy or defaults of tenants, anchor store consolidations or closings, the impact of terrorist acts and other armed conflicts, our substantial debt leverage and the ability to obtain and service debt, the impact of restrictions imposed by our revolving credit facility, term loan and senior debt, exposure to hedging agreements, the level and volatility of interest rates, the continued availability of tax-exempt government financing, our ability to receive payment on the notes receivable issued by Onexim in connection with their purchase of our interests in the Barclays Center and the Nets, the impact of credit rating downgrades, effects of uninsured or underinsured losses, effects of a downgrade or failure of our insurance carriers, environmental liabilities, competing interests of our directors and executive officers, the ability to recruit and retain key personnel, risks associated with the sale of tax credits, downturns in the housing market, the ability to maintain effective internal controls, compliance with governmental regulations, increased legislative and regulatory scrutiny of the financial services industry, changes in federal, state or local tax laws and international trade agreements, volatility in the market price of our publicly traded securities, inflation risks, cybersecurity risks, cyber incidents, shareholder activism efforts, conflicts of interest, risks related to our organizational structure including operating through our Operating Partnership and our UPREIT structure, as well as other risks listed from time to time in our SEC filings, including but not limited to, our annual and quarterly reports. We have no obligation to revise or update any forward-looking statements, other than as imposed by law, as a result of future events or new information. Readers are cautioned not to place undue reliance on such forward-looking statements.
Item 3. Quantitative and Qualitative Disclosures About Market Risk
Our market risk includes the inability to obtain construction loans, refinance existing construction loans into long-term fixed-rate nonrecourse financing, refinance existing nonrecourse financing at maturity, obtain renewals or replacement of credit enhancement devices, such as letters of credit, or otherwise obtain funds by selling real estate assets or by raising equity. We also have interest-rate exposure on our current variable-rate debt portfolio. During the construction period, we have historically used variable-rate debt to finance developmental projects. At June 30, 2017, our outstanding variable-rate debt, including borrowings under our revolving credit facility and term loan, consisted of $991,973,000 of taxable debt and $606,234,000 of tax-exempt debt. Upon opening and achieving stabilized operations, we have historically procured long-term fixed-rate financing for our rental properties. If we are unable to procure long-term fixed-rate financing, we would pursue extending maturities with existing lenders. Additionally, we are exposed to interest rate risk upon maturity of our long-term fixed-rate financings. The total weighted average interest rate includes the impact of interest rate swaps, caps and long-term contracts in place as of June 30, 2017.
Interest Rate Exposure
The following table summarizes the composition of nonrecourse debt, net:
|
| | | | | | | | | | | | |
| June 30, 2017 | Operating Properties | Development Projects | Total | | Total Weighted Average Rate |
| | (dollars in thousands) | | |
| Fixed Rate | $ | 1,861,441 |
| $ | 32,100 |
| $ | 1,893,541 |
| | 4.39 | % |
| Variable Rate | | | | | |
| Taxable | 519,672 |
| 138,833 |
| 658,505 |
| | 3.31 | % |
| Tax-Exempt | 606,234 |
| — |
| 606,234 |
| | 1.87 | % |
| | $ | 2,987,347 |
| $ | 170,933 |
| $ | 3,158,280 |
| | 3.68 | % |
| Total gross commitment from lenders | $ | 406,608 |
| | | |
To mitigate short-term variable interest rate risk, we have purchased interest rate hedges for our variable-rate debt as follows:
Taxable (Priced off of LIBOR Index)
|
| | | | |
| | Swaps |
| | Notional | Average Base |
| Period Covered | Amount | Rate |
| | (dollars in thousands) |
| 07/01/17 - 12/31/17 | $ | 98,226 |
| 1.87% |
| 01/01/18 - 05/08/24 | 97,450 |
| 1.87% |
Tax-Exempt (Priced off of Securities Industry and Financial Markets Association (“SIFMA”) Index)
|
| | | | |
| | Caps |
| | Notional | Average Base |
| Period Covered | Amount | Rate |
| | (dollars in thousands) |
| 07/01/17 - 12/31/17 | $ | 69,518 |
| 5.89% |
| 01/01/18 - 12/31/18 | 41,118 |
| 5.81% |
| 01/01/19 - 3/24/19 | 8,808 |
| 6.96% |
The tax-exempt caps generally were purchased in conjunction with lender hedging requirements that require the borrower to protect against significant fluctuations in interest rates. Except for those requirements, we generally do not hedge tax-exempt debt due to its historically low interest rates.
Sensitivity Analysis to Changes in Interest Rates
Including the effect of the protection provided by the interest rate swaps, caps and long-term contracts in place as of June 30, 2017, a 100 basis point increase in taxable interest rates (including properties accounted for under the equity method, corporate debt and the effect of interest rate floors) would increase the annual pre-tax interest cost for the next 12 months of our variable-rate debt by approximately $8,789,000 at June 30, 2017. Although tax-exempt rates generally move in an amount smaller than corresponding changes in taxable interest rates, a 100 basis point increase in tax-exempt rates (including properties accounted for under the equity method) would increase the annual pre-tax interest cost for the next 12 months of our tax-exempt variable-rate debt by approximately $6,700,000 at June 30, 2017. This analysis includes a portion of our taxable and tax-exempt variable-rate debt related to construction loans for which the interest expense is capitalized.
We enter into total rate of return swaps (“TROR”) on various tax-exempt fixed-rate borrowings. The TROR convert borrowings from a fixed rate to a variable rate. The TROR requires the payment of a variable interest rate, generally equivalent to the SIFMA rate (0.91% at June 30, 2017) plus a spread. Additionally, we have guaranteed the fair value of the underlying borrowings. Fluctuation in the value of the TROR is offset by the fluctuation in the value of the underlying borrowings, resulting in minimal financial impact. At June 30, 2017, the aggregate notional amount of TROR designated as fair value hedging instruments is $551,985,000. The underlying TROR borrowings are subject to a fair value adjustment. In addition, we have TROR with notional amounts aggregating $137,628,000 that are not designated as fair value hedging instruments, but are subject to interest rate risk.
We estimate the fair value of our hedging instruments based on interest rate market and bond pricing models. At June 30, 2017 and December 31, 2016, we recorded interest rate caps, swaps and TROR with positive fair values of approximately $11,731,000 and $9,718,000, respectively, in other assets. At June 30, 2017 and December 31, 2016, we recorded interest rate swaps and TROR that had a negative fair value of approximately $19,722,000 and $26,202,000, respectively, in accounts payable, accrued expenses and other liabilities.
We estimate the fair value of our long-term debt instruments by market rates, if available, or by discounting future cash payments at interest rates that approximate the current market. Estimated fair value is based upon market prices of public debt, available industry financing data, current treasury rates and recent financing transactions. Based on these parameters, the table below contains the estimated fair value of our long-term debt, net (exclusive of the fair value of derivatives) at June 30, 2017.
|
| | | | | | | | | | | |
| | Carrying Value | | Fair Value | | Fair Value with 100 bp Decrease in Market Rates |
| | (in thousands) |
| Fixed | $ | 2,005,951 |
| | $ | 2,027,279 |
| | $ | 2,193,026 |
|
| Variable | | | | | |
| Taxable | 991,973 |
| | 991,267 |
| | 993,042 |
|
| Tax-Exempt | 606,234 |
| | 603,815 |
| | 604,624 |
|
| Total Variable | $ | 1,598,207 |
| | $ | 1,595,082 |
| | $ | 1,597,666 |
|
| Total Long-Term Debt | $ | 3,604,158 |
| | $ | 3,622,361 |
| | $ | 3,790,692 |
|
The following table provides information about our long-term debt instruments that are sensitive to changes in interest rates.
Item 3. Quantitative and Qualitative Disclosures About Market Risk (continued)
June 30, 2017
|
| | | | | | | | | | | | | | | | | | | | | | | | | | | | | | | | | |
| | Expected Maturity Date | | | | |
| | Year Ending December 31, | | | | |
| Long-Term Debt | 2017 | | 2018 | | 2019 | | 2020 | | 2021 | | Period Thereafter | Net Unamortized Procurement Costs | Total Outstanding | | Fair Market Value |
| | (dollars in thousands) | | |
| Fixed: | | | | | | | | | | | | | | | |
| Fixed-rate debt | $ | 170,387 |
| | $ | 208,235 |
| | $ | 107,423 |
| | $ | 160,563 |
| | $ | 171,208 |
| | $ | 1,089,488 |
| $ | (13,763 | ) | $ | 1,893,541 |
| | $ | 1,896,025 |
|
| Weighted average interest rate | 6.04 | % | | 4.52 | % | | 4.06 | % | | 5.03 | % | | 4.65 | % | | 3.99 | % | | 4.39 | % | | |
Convertible senior debt (1) | — |
| | 73,216 |
| | — |
| | 40,021 |
| | — |
| | — |
| (827 | ) | 112,410 |
| | 131,254 |
|
| Weighted average interest rate | — | % | | 4.25 | % | | — | % | | 3.63 | % | | — | % | | — | % | | 4.03 | % | | |
| Total Fixed-Rate Debt | 170,387 |
| | 281,451 |
| | 107,423 |
| | 200,584 |
| | 171,208 |
| | 1,089,488 |
| (14,590 | ) | 2,005,951 |
| | 2,027,279 |
|
| Variable: | | | | | | | | | | | | | | | |
| Variable-rate debt | 36,779 |
| | 176,560 |
| | 353,095 |
| | 58,567 |
| | 22,051 |
| | 21,424 |
| (9,971 | ) | 658,505 |
| | 657,628 |
|
Weighted average interest rate (2) | 3.84 | % | | 3.62 | % | | 2.99 | % | | 3.58 | % | | 4.66 | % | | 3.42 | % | | 3.31 | % | | |
| Tax-exempt | — |
| | 100,775 |
| | 8,500 |
| | — |
| | — |
| | 508,834 |
| (11,875 | ) | 606,234 |
| | 603,815 |
|
Weighted average interest rate (2) | — | % | | 1.85 | % | | 3.90 | % | | — | % | | — | % | | 1.84 | % | | 1.87 | % | | |
Revolving credit facility (1) | — |
| | — |
| | — |
| | — |
| | — |
| | — |
| | — |
| | — |
|
Weighted average interest rate (2) | — | % | | — | % | | — | % | | — | % | | — | % | | — | % | | — | % | | |
Term loan (1) | — |
| | — |
| | — |
| | — |
| | 335,000 |
| | — |
| (1,532 | ) | 333,468 |
| | 333,639 |
|
Weighted average interest rate (2) | — | % | | — | % | | — | % | | — | % | | 2.50 | % | | — | % | | 2.50 | % | | |
| Total Variable-Rate Debt | 36,779 |
| | 277,335 |
| | 361,595 |
| | 58,567 |
| | 357,051 |
| | 530,258 |
| (23,378 | ) | 1,598,207 |
| | 1,595,082 |
|
| Total Long-Term Debt | $ | 207,166 |
| | $ | 558,786 |
| | $ | 469,018 |
| | $ | 259,151 |
| | $ | 528,259 |
| | $ | 1,619,746 |
| $ | (37,968 | ) | $ | 3,604,158 |
| | $ | 3,622,361 |
|
| Weighted average interest rate | 5.65 | % | | 3.72 | % | | 3.25 | % | | 4.48 | % | | 3.29 | % | | 3.31 | % | | 3.58 | % | | |
| |
| (1) | Represents recourse debt. |
| |
| (2) | Weighted average interest rate is based on current market rates as of June 30, 2017. |
Item 4. Controls and Procedures
The Company maintains a set of disclosure controls and procedures designed to ensure that information required to be disclosed by the Company in reports that it files or furnishes under the Securities Exchange Act of 1934 (“Securities Exchange Act”) is recorded, processed, summarized and reported within the time periods specified in Securities and Exchange Commission rules and forms and that such information is accumulated and communicated to the Company’s management, including the Chief Executive Officer (“CEO”) and Chief Financial Officer (“CFO”), as appropriate, to allow timely decisions regarding required disclosure. As of the end of the period covered by this quarterly report, an evaluation of the effectiveness of the Company’s disclosure controls and procedures, as defined in Rules 13a-15(e) and 15d-15(e) under the Securities Exchange Act, was carried out under the supervision and with the participation of the Company’s management, which includes the CEO and CFO. Based on that evaluation, the CEO and CFO have concluded that the Company’s disclosure controls and procedures were effective as of June 30, 2017.
There have been no changes in the Company’s internal control over financial reporting that occurred during the quarter ended June 30, 2017 that have materially affected, or are reasonably likely to materially affect, the Company’s internal control over financial reporting.
In connection with the rules, the Company continues to review and document its disclosure controls and procedures, including the Company’s internal control over financial reporting, and may from time to time make changes aimed at enhancing their effectiveness and ensuring that the Company’s systems evolve with the business.
PART II — OTHER INFORMATION
Item 1. Legal Proceedings
The Company is involved in various claims and lawsuits incidental to its business, and management and legal counsel believe these claims and lawsuits will not have a material adverse effect on the Company’s consolidated financial statements.
Item 2. Unregistered Sales of Equity Securities and Use of Proceeds
(a) and (b) – Not applicable.
(c) – Repurchase of equity securities during the quarter.
|
| | | | | | | | | | | | | |
| | Issuer Purchases of Equity Securities |
| Period | Total Number of Shares Purchased | | Average Price Paid Per Share | | Total Number of Shares Purchased as Part of Publicly Announced Plans or Programs | | Maximum Dollar Amount of shares that May Yet Be Purchased Under the Plans or Programs |
| Class A Common Stock | | | | | | | |
| April 1 through April 30, 2017 | | | | | | | |
Common Stock Repurchase Program (1) | — |
| | $ | — |
| | — |
| | $ | 100,000,000 |
|
Employee Transactions (2) | 67,027 |
| | $ | 22.17 |
| | — |
| | |
| May 1 through May 31, 2017 | | | | | | | |
Common Stock Repurchase Program (1) | — |
| | $ | — |
| | — |
| | $ | 100,000,000 |
|
Employee Transactions (2) | — |
| | $ | — |
| | — |
| | |
| June 1 through June 30, 2017 | | | | | | | |
Common Stock Repurchase Program (1) | — |
| | $ | — |
| | — |
| | $ | 100,000,000 |
|
Employee Transactions (2) | 5,021 |
| | $ | 24.26 |
| | — |
| | |
| Total | | | | | | | |
Common Stock Repurchase Program (1) | — |
| | $ | — |
| | — |
| | $ | 100,000,000 |
|
Employee Transactions (2) | 72,048 |
| | $ | 22.32 |
| | — |
| | |
| |
| (1) | On November 18, 2015, our Board of Directors approved a $100,000,000 common stock repurchase program. The repurchase program authorizes us to repurchase shares of our Class A common stock and Class B common stock (prior to June 12, 2017, the effective date of the Reclassification) on the open market or otherwise in amounts and at such times and prices as our Chairman, Chief Executive Officer or Chief Financial Officer shall determine. The repurchase program has no set expiration date. |
| |
| (2) | Class A common stock repurchased to satisfy the minimum tax withholding requirements relating to restricted stock vesting. |
Item 6. Exhibits
|
| | |
Exhibit Number | | Description of Document |
| | | |
| - | Articles of Amendment and Restatement of Forest City Realty Trust, Inc., effective June 12, 2017, incorporated by reference to Exhibit 3.1 to the Company’s Form 8-K filed on June 12, 2017 (File No. 1-37671). |
| | | |
| - | Amended and Restated Bylaws of Forest City Realty Trust, Inc., effective June 12, 2017, incorporated by reference to Exhibit 3.2 to the Company’s Form 8-K filed on June 12, 2017 (File No. 1-37671). |
| | | |
| - | Forest City Realty Trust, Inc. Amended and Restated Board of Directors Compensation Policy, effective May 17, 2017. |
| | | |
| - | Form of Change of Control Agreement, incorporated by reference to Exhibit 10.1 to the Company’s Form 8-K filed on June 14, 2017 (File No. 1-37671). |
| | | |
| - | Form of Letter Agreement Regarding Severance Plan Enhancements, incorporated by reference to Exhibit 10.2 to the Company’s Form 8-K filed on June 14, 2017 (File No. 1-37671). |
| | | |
| - | Forest City Employer, LLC Severance Plan, incorporated by reference to Exhibit 10.3 to the Company’s Form 8-K filed on June 14, 2017 (File No. 1-37671). |
| | | |
| - | Principal Executive Officer’s Certification pursuant to Section 302 of the Sarbanes-Oxley Act of 2002. |
| | | |
| - | Principal Financial Officer’s Certification pursuant to Section 302 of the Sarbanes-Oxley Act of 2002. |
| | | |
| - | Certification pursuant to 18 U.S.C. Section 1350, as adopted pursuant to Section 906 of the Sarbanes-Oxley Act of 2002. |
| | | |
| *101 | - | The following financial information from Forest City Realty Trust, Inc.’s Quarterly Report on Form 10-Q for the quarter ended June 30, 2017, formatted in XBRL (eXtensible Business Reporting Language): (i) Consolidated Balance Sheets (unaudited); (ii) Consolidated Statements of Operations (unaudited); (iii) Consolidated Statements of Comprehensive Income (Loss) (unaudited); (iv) Consolidated Statements of Equity (unaudited); (v) Consolidated Statements of Cash Flows (unaudited); and (vi) Notes to Consolidated Financial Statements (unaudited).
|
|
| |
| + | Management contract or compensatory arrangement. |
| * | Filed herewith. |
| ** | Furnished herewith. |
SIGNATURES
Pursuant to the requirements of the Securities Exchange Act of 1934, the registrant has duly caused this report to be signed on its behalf by the undersigned thereunto duly authorized.
|
| | | |
| | | | FOREST CITY REALTY TRUST, INC. (Registrant) |
| | | | |
| Date: | August 3, 2017 | | /s/ ROBERT G. O’BRIEN |
| | | | Name: Robert G. O’Brien |
| | | | Title: Executive Vice President and Chief Financial Officer |
| | | | |
| Date: | August 3, 2017 | | /s/ CHARLES D. OBERT |
| | | | Name: Charles D. Obert |
| | | | Title: Executive Vice President, Chief Accounting Officer and Corporate Controller |