UNITED STATES
SECURITIES AND EXCHANGE COMMISSION
Washington, D.C. 20549
Form 10-K/A
Amendment No. 1
(Mark One)
| ý | ANNUAL REPORT PURSUANT TO SECTION 13 OR 15 (d) OF THE SECURITIES EXCHANGE ACT OF 1934 |
For the fiscal year ended December 31, 2017
| ¨ | TRANSITION REPORT PURSUANT TO SECTION 13 OR 15 (d) OF THE SECURITIES EXCHANGE ACT OF 1934 |
For the transition period from _______ to _______
Commission file number 1-37671
| FOREST CITY REALTY TRUST, INC. | |||
| (Exact name of registrant as specified in its charter) | |||
| Maryland | 47-4113168 | ||
(State or other jurisdiction of incorporation or organization) | (I.R.S. Employer Identification No.) | ||
Key Tower Suite 3100 | 127 Public Square Cleveland, Ohio | 44114 | |
| (Address of principal executive offices) | (Zip Code) | ||
| Registrant’s telephone number, including area code | 216-621-6060 | ||
| Securities registered pursuant to Section 12(b) of the Act: | |||
| Title of each class | Name of each exchange on which registered | ||
| Class A Common Stock ($.01 par value) | New York Stock Exchange | ||
Securities registered pursuant to Section 12(g) of the Act: None
Indicate by check mark if the registrant is a well-known seasoned issuer, as defined in Rule 405 of the Securities Act.
YES ý NO ¨
Indicate by check mark if the registrant is not required to file reports pursuant to Section 13 or Section 15(d) of the Act.
YES ¨ NO ý
Indicate by check mark whether the registrant (1) has filed all reports required to be filed by Section 13 or 15(d) of the Securities Exchange Act of 1934 during the preceding 12 months (or for such shorter period that the registrant was required to file such reports), and (2) has been subject to such filing requirements for the past 90 days.
YES ý NO ¨
Indicate by check mark whether the registrant has submitted electronically and posted on its corporate Web site, if any, every Interactive Data File required to be submitted and posted pursuant to Rule 405 of Regulation S-T (§232.405 of this chapter) during the preceding 12 months (or for such shorter period that the registrant was required to submit and post such files).
YES ý NO ¨
Indicate by check mark if disclosure of delinquent filers pursuant to Item 405 of Regulation S-K is not contained herein, and will not be contained, to the best of registrant’s knowledge, in definitive proxy or information statements incorporated by reference in Part III of this Form 10-K or any amendment to this Form 10-K. ¨
Indicate by check mark whether the registrant is a large accelerated filer, an accelerated filer, a non-accelerated filer, or a smaller reporting company, or an emerging growth company. See the definitions of “large accelerated filer,” “accelerated filer” and “smaller reporting company” and "emerging growth company" in Rule 12b-2 of the Exchange Act: (Check one):
| Large accelerated filer | ý | Accelerated filer | ¨ |
| Non-accelerated filer | ¨ (Do not check if a smaller reporting company) | Smaller reporting company | ¨ |
| Emerging growth company | ¨ | ||
If an emerging growth company, indicate by check mark if the registrant has elected not to use the extended transition period for complying with any new or revised financial accounting standards provided pursuant to Section 13(a) of the Exchange Act. ¨
Indicate by check mark whether the registrant is a shell company (as defined in Rule 12b-2 of the Exchange Act).
YES ¨ NO ý
The aggregate market value of the outstanding common equity held by non-affiliates as of the last business day of the registrant’s most recently completed second fiscal quarter was $5,864,717,541.
The number of shares of registrant’s Class A common stock outstanding on April 25, 2018 was 267,192,318.
DOCUMENTS INCORPORATED BY REFERENCE
None.
| TABLE OF CONTENTS | ||
Explanatory Paragraph
This Amendment No. 1 to Form 10-K (this "Form 10-K/A") amends the Annual Report on Form 10-K for the fiscal year ended December 31, 2017 originally filed on February 22, 2018 (the "Original Filing") by Forest City Realty Trust, Inc., a Maryland corporation ("Forest City", the "Company", "we" or "us"). We are filing this Form 10-K/A to present the information required by Part III of the Form 10-K as we will not file our definitive proxy statement within 120 days of the end of our fiscal year ended December 31, 2017.
Except as described above, no other changes have been made to the Original Filing. The Original Filing continues to speak as of the date of the Original Filing, and we have not updated the disclosures contained therein to reflect any events which occurred at a date subsequent to the filing of the Original Filing.
PART III
Item 10. Directors, Executive Officers and Corporate Governance
Directors of the Registrant
Set forth below are each director's name, age, year first elected as a director, principal occupation, professional history and public company directorships held currently and during the past five years, and detailed information about the qualifications, experience, attributes and skills that led to the conclusion that such person should serve as our director.
 | Kenneth J. Bacon Principal Occupation and Business Experience Mr. Bacon co-founded RailField Partners, a financial advisory and asset management firm based in Washington, D.C., in 2012. Mr. Bacon retired from the Federal National Mortgage Association (Fannie Mae) in 2012 after nearly 20 years with the company. Mr. Bacon joined Fannie Mae as senior vice president, Northeast Region. In 1998, he was selected to lead Fannie Mae’s American Communities Fund. In 2000, he became senior vice president of the organization’s Multifamily Division and in 2005 he was promoted to executive vice president of the division. Prior to Fannie Mae, Mr. Bacon served as director of policy for the Oversight Board at Resolution Trust Corporation, and was later named director of securitization. Prior to this, he worked at Morgan Stanley, where his focus was mortgage finance and related products. Mr. Bacon began his career with Kidder Peabody. Mr. Bacon is a board member of three other publicly-traded companies: Comcast Corporation, a global media and technology company, where he has been a director since 2002; Ally Financial Inc., a financial service company, where he has been a director since 2015; and Welltower Inc., a healthcare property REIT, where he has been a director since January 2016. He is also a board member of the National Multifamily Housing Council and serves on the Advisory Board of the Stanford Center on Longevity. Mr. Bacon has a B.A. from Stanford University, a M.Sc. from the London School of Economics, and an MBA from the Harvard Graduate School of Business. Key Experience, Attributes and Skills Mr. Bacon brings significant financial, asset management and real estate experience to our Board of Directors. His varied professional officer roles as well as his board service with other publicly-traded companies and real estate industry organizations, make him a tremendous asset to Forest City and our Board. In addition, he provides recommendations on best practices in areas such as governmental affairs, the financial industry and the non-profit, educational and philanthropic communities. | |
Age: 63 Director Since: 2012 Independent Board Committee: - Audit Other Current Registered Company Directorships: - Comcast Corporation - Ally Financial Inc. - Welltower, Inc. | ||
1
 | Z. Jamie Behar Principal Occupation and Business Experience Ms. Behar served as Managing Director, Real Estate & Alternative Investments for GM Investment Management Corp. (GMIMCo), the asset management arm of General Motors Company, from 2005 to 2015. While at GMIMCo, she managed GMIMCo’s clients’ real estate investment portfolios, including both private market and publicly traded security investments, as well as their alternative investment portfolios, totaling approximately $12 billion at peak portfolio value. She was also a member of GMIMCo’s Board of Directors, the Investment Management Committee, the Private Equity Investment Approval Committee and the Risk Management Committee. Ms. Behar is currently a board member of two additional publicly-traded companies: Gramercy Property Trust, a REIT that specializes in acquiring and managing single-tenant, net-leased industrial and office properties, where she has been a director since 2015 and serves as a member of the Investment Committee and Audit Committee; and Sunstone Hotel Investors, Inc., a U.S. hotel company, where she has been a director since 2004 and serves as Chair of the Nominating & Corporate Governance Committee and as a member of the Audit Committee. She also serves as a board member of Broadstone Real Estate Access Fund, a registered, closed-end management investment company, where she has been a director since January 2018 and serves as Chair of the Nominating and Corporate Governance Committee. Ms. Behar previously served on the Board of Directors of Desarrolladora Homex, S.A. de C.V., a publicly-traded home development company located in Mexico, from 2004 to 2013, where she served on the Audit Committee. Ms. Behar was a member of the Board of Directors of the Pension Real Estate Association (PREA) from March 2008 through March 2014, having held the position of Board Chair from March 2010 to March 2011, and was a member of the Real Estate Investment Advisory Council of the National Association of Real Estate Investment Trusts (NAREIT) from its inception through 2015. Ms. Behar holds a B.S.E. from The Wharton School, University of Pennsylvania, an MBA from Columbia University Graduate School of Business, and the CFA Charter. Key Experience, Attributes and Skills Ms. Behar has significant real estate company board experience and is a seasoned business executive and CFA with extensive investment experience in a diverse range of public and private real estate equity and debt, and other private equity, portfolios. She brings a wealth of executive and board-level experience in investment strategy, financial management, corporate governance and other areas, making her an outstanding member of our Board. | |
Age: 60 Director Since: 2017 Independent Board Committees: - Audit - Corporate Governance and Nominating Other Current Registered Company Directorships: - Gramercy Property Trust - Sunstone Hotel Investors, Inc. - Broadstone Real Estate Access Fund | ||
2
 | Michelle Felman Principal Occupation and Business Experience Ms. Felman founded JAM Holdings, an investment and advisory firm, in 2016. Prior to founding JAM Holdings, Ms. Felman served as an executive vice president - Co-Head of Acquisitions and Capital Markets at Vornado Realty Trust, a publicly traded REIT, from 1997 to 2010 and remained a consultant for VNO through December 2012. She began her career at Morgan Stanley in the Investment Banking Division and later joined GE Capital as a Managing Director of Business Development. Ms. Felman is a board member of Partners Group Holdings AG, a registered, global private equity firm, where she serves as the Chair of the Investment Oversight Committee. She is also a Trustee of Choice Properties, a publicly traded retail REIT in Canada, which was spun off by Loblaws Companies Limited, where she serves on the Governance and Compensation committees. Ms. Felman has resigned from Choice Properties, effective May 2, 2018. Ms. Felman also serves on the boards of Reonomy, a private real estate technology company, and Cumming Corp, a global project management and cost consulting company, and on the Advisory Board at Turner Impact Capital, a social impact platform that focuses on healthcare, charter schools and workforce housing. Until 2017, Ms. Felman was a member of the Executive Committee of the Zell Lurie Center at Wharton Business School, where she also served as a visiting professor. Ms. Felman has a bachelor’s degree in economics from the University of California and an MBA from Wharton Business School at the University of Pennsylvania. Key Experience, Attributes and Skills Ms. Felman brings over 30 years of investment and strategic advisory experience in the real estate industry to our Board of Directors. Her background in investment banking and as the Chair of the Investment Oversight Committee at a global private equity firm has provided her tremendous experience with strategy and risk management, and she brings a track record of creating value to stockholders. | |
Age: 55 Director Since: April 2018 Independent Board Committee: - Compensation Other Current Registered Company Directorship: - Partners Group Holdings AG | ||
3
 | Jerome J. Lande Principal Occupation and Business Experience Jerome J. Lande has served as the Head of Special Situations at Scopia Capital Management LP, an institutional alternative asset management firm and one of Forest City’s largest stockholders, since April 2016 and as a Partner since January 2017. Previously, Mr. Lande co-founded Coppersmith Capital Management LLC, an asset management firm focused on equity investing and active engagement for long-term value creation, in April 2012 and served as Managing Partner until April 2016. Prior to co-founding Coppersmith, from December 1998 to December 2011, Mr. Lande was a partner of MCM Management LLC, the general partner of MMI Investments, LP, a small-cap investment fund that employed private equity investing methodologies in public equities, where he oversaw research, trading and activism. He also served as Corporate Development Officer of Key Components, Inc., a global diversified industrial manufacturer, from 1999 until its acquisition in 2004. Mr. Lande is currently a director of two additional publicly traded companies: CONMED Corporation, a global medical technology company, since April 2014, where he serves as a member of the Compensation and Strategy Committees; and Itron, Inc., a technology company offering products and services in energy and water resource management, since December 2015, where he serves as a member of the Audit/Finance and Value Enhancement committees. Mr. Lande has a bachelor’s degree from Cornell University. Key Experience, Attributes and Skills Mr. Lande brings significant investment acumen as a result of his 20 years of professional experience, in both public and private markets, to our Board of Directors. Mr. Lande’s expertise on corporate governance and transactional matters, as well as his extensive experience in optimizing corporate strategy, operational performance, business configurations and stockholder value creation, provides unique and valuable insight to our Board. Arrangement Regarding Selection as a Director Pursuant to the agreement, dated March 22, 2018, between Forest City Realty Trust, Inc. and Scopia Capital Management LP and certain of its affiliates, Scopia recommended Mr. Lande as its appointee as director and he was appointed by the Board effective April 16, 2018. | |
Age: 42 Director Since: April 2018 Independent Board Committee: - Corporate Governance and Nominating Other Current Registered Company Directorships: - CONMED Corporation - Itron, Inc. | ||
4
 | David J. LaRue Principal Occupation and Business Experience Mr. LaRue has been the president and chief executive officer of Forest City since June 2011. He is also an officer of various subsidiaries of Forest City. Prior to becoming president and chief executive officer, Mr. LaRue served as executive vice president and chief operating officer from March 2010 to June 2011. Mr. LaRue served as president and chief operating officer of Forest City Commercial Group, Inc. (now known as Forest City Commercial Group, LLC) from 2003 to March 2010 and as executive vice president of Forest City Rental Properties, Inc. (now known as Forest City Properties, LLC) from 1997 to 2003. Prior to joining Forest City in 1986, Mr. LaRue was an internal auditor and financial analyst with the Sherwin-Williams Company. Mr. LaRue served on the Board of CubeSmart, a publicly-traded real estate investment trust focused on self-storage facilities, from 2004 to May 2013. Mr. LaRue is a member of the Board of Trustees and chair of the Capital Committee of the Friends of the Cleveland School of the Arts; a trustee and member of the Finance Committee of the Lawrence School; a member of the Board of Directors of St. Edward High School; and a member of the Board of Directors of the Greater Cleveland Partnership. Mr. LaRue’s prior industry service includes being a member of the Board of Trustees of the International Council of Shopping Centers (ICSC), including service as its chairman in 2013; a member of the Board of Advisors of the National Association of the Real Estate Investment Trust (NAREIT); and a member of the Board of Directors of The Real Estate Round Table. Key Experience, Attributes and Skills Under Mr. LaRue’s leadership as president and chief executive officer, Forest City successfully executed a merger transaction in connection with its conversion to REIT status, and continues to make significant progress achieving its strategic objectives of focusing on core products in core markets, building a sustainable capital structure and achieving operational excellence. As an employee of Forest City since 1986, Mr. LaRue brings vast experience in virtually every aspect of our business, along with broad strategic, operational and financial acumen to the Board of Directors. | |
Age: 56 Director Since: 2011 Forest City Executive | ||
5
 | Adam S. Metz Principal Occupation and Business Experience Mr. Metz served as Managing Director and Head of International Real Estate at The Carlyle Group, a private equity, alternative asset management and financial services corporation, from September 2013 to April 2018. From March 2011 to August 2013, Mr. Metz served as Senior Advisor to TPG Capital's Real Estate Group, where he worked on all facets of the business including the sourcing of deals, asset management, financing, fundraising and developing strategy. Prior to joining TPG, he was the Chief Executive Officer of General Growth Properties, Inc., from 2008 to 2010, where he led the company through one of the largest and most successful bankruptcy and restructurings in REIT history. In 2002, he co-founded Polaris Capital LLC, where he served as a partner until 2008. Previously, Mr. Metz held executive positions at Rodamco, North America NV, Urban Shopping Centers, Inc., and JMB Realty. Mr. Metz began his career serving in the Commercial Real Estate Lending Group at the First National Bank of Chicago. Mr. Metz served as a director of Parkway Properties, a former NYSE-listed REIT that invested in Sun Belt office buildings, from June 2012 to November 2016, where he was a member of the Audit and Compensation committees. He currently serves on the advisory board of the Cornell Baker Program in Real Estate (Cornell University) and the Kellogg Real Estate Advisory Board (Northwestern University). He also serves on the board of trustees of the Smithsonian Hirshhorn Museum and Sculpture Garden. Mr. Metz is currently a member of Real Estate Roundtable, International Council of Shopping Centers, the Urban Land Institute and the University of Southern California Lusk Center for Real Estate. Mr. Metz has a Master of Management degree from the Kellogg School of Management at Northwestern University, and a bachelor’s degree from Cornell University. Key Experience, Attributes and Skills Mr. Metz brings more than 30 years of real estate experience, both in the U.S. and abroad, to our Board of Directors. Possessing experience in numerous property sectors as an executive leader and director, Mr. Metz brings a track record of creating value for stockholders. | |
Age: 56 Director Since: April 2018 Independent Board Committees: - Audit - Compensation | ||
 | Gavin T. Molinelli Principal Occupation and Business Experience Gavin T. Molinelli has served as a Partner and Director of Starboard Value LP, an investment adviser and one of Forest City’s largest stockholders, since 2011. Prior to Starboard Value LP’s formation, Mr. Molinelli was Investment Analyst and Vice President at Ramius LLC, a privately owned hedge fund sponsor, from February 2009 to 2011, where he also served as an associate from October 2006 to February 2009. Prior to joining Ramius LLC, Mr. Molinelli was a member of the Technology Investment Banking group at Banc of America Securities LLC from June 2005 to September 2006. During the past five years, Mr. Molinelli has served on two additional publicly traded company boards, including: Depomed, Inc., a pharmaceutical company, from March 2017 to August 2017, where he served as a member of the Compensation and Nominating and Corporate Governance committees; and Wausau Paper Corp., a provider of away-from-home towel and tissue products, from July 2014 until it was acquired by SCA Tissue North America LLC in January 2016, where he served as a member of the Compensation and Corporate Governance committees. Mr. Molinelli has a bachelor’s degree from Washington and Lee University. Key Experience, Attributes and Skills Mr. Molinelli’s financial acumen, investor perspective, strategic planning expertise and past publicly traded company directorships provide our Board with important insight. Through his service in multiple managerial and leadership roles, Mr. Molinelli brings a track record of creating stockholder value Arrangement Regarding Selection as a Director Pursuant to the agreement, dated March 22, 2018, between Forest City Realty Trust, Inc. and Starboard Value LP and certain of its affiliates, Starboard recommended Mr. Molinelli as its appointee as director and he was appointed by the Board effective April 16, 2018. | |
Age: 34 Director Since: April 2018 Independent Board Committees: - Compensation - Corporate Governance and Nominating (Chair) | ||
6
 | Marran H. Ogilvie Principal Occupation and Business Experience Marran H. Ogilvie has served as an advisor to the Creditors’ Committee for the Lehman Brothers International (Europe) Administration since 2008 and currently serves as an independent board member of several companies. Ms. Ogilvie was a member of Ramius, LLC (merged with Cowen Group, Inc. in 2009), an alternative investment management firm, where she served in various capacities from 1994 to 2010, including as Chief of Staff from 2009 to 2010, Chief Operating Officer, Partner and Member of the Management Committee from 2007 to 2009 and General Counsel and Chief Compliance Officer from 1997 to 2007. Ms. Ogilvie also serves as a board member of four additional publicly traded companies: Evolution Petroleum, a developer and producer of oil and gas reserves, since December 2017, where she serves as a member of the Audit Committee; Ferro Corporation, a supplier of functional coatings and color solutions, since October 2017, where she serves as a member of the Audit and Nominating and Governance Committees; Four Corners Property Trust, Inc., a REIT, since November 2015, where she chairs the Audit and Nominating and Governance Committees and serves on the Compensation Committee; and Bemis Company, Inc., a flexible packaging company, since March 2018. She previously served as a director for Southwest Bancorp, a regional commercial bank, from September 2011 to April 2015; Zais Financial Corp., a REIT, from February 2013 to October 2016; Seventy Seven Energy Inc., an oil field services company, from July 2014 to July 2016; the Korea Fund, a closed-end investment company, from November 2012 to December 2017; and LSB Industries, Inc., a manufacturing company, from April 2015 to April 2018. In addition to her public company board experience, Ms. Ogilvie serves as a member of the Executive Board of A Chance to Change, a civic organization serving families in Oklahoma, and as a member of the Board of Directors of Oklahoma Contemporary Arts Center. Ms. Ogilvie has a Juris Doctor degree from the St. John’s University School of Law and a bachelor’s degree from the University of Oklahoma. Key Experience, Attributes and Skills A financial expert, Ms. Ogilvie brings extensive knowledge of capital markets, investment management and banking to our Board of Directors. Her legal background provides critical thinking and analysis to the Board. In building and managing successful international financial services businesses, Ms. Ogilvie’s experience in regulatory and legal issues, complex structures, strategic planning and business operations is a tremendous asset to our Board. | |
Age: 49 Director Since: April 2018 Independent Board Committees: - Audit - Corporate Governance and Nominating Other Current Registered Company Directorships: - Evolution Petroleum - Ferro Corporation - Four Corners Property Trust, Inc. - Bemis Company, Inc. | ||
7
 | Mark S. Ordan Principal Occupation and Business Experience Mark S. Ordan has served as Chief Executive Officer of Quality Care Properties, a publicly traded real estate company and one of the largest actively managed companies focused on post-acute, skilled nursing and memory care/assisted living properties, since its spin-off from HCP, Inc. in October 2016. He served as a consultant to HCP from March 2016 to October 2016. Mr. Ordan previously served as Executive Chairman of Washington Prime Group, a publicly traded retail REIT, from January 2015 through June 2016, after serving as Chief Executive Officer from May 2014 to January 2015. From 2008 to 2013, he was Chief Executive Officer of Sunrise Senior Living, LLC, the successor to the management business of Sunrise Senior Living, Inc., a publicly traded real estate company, where he led a restructuring of the business and oversaw the sale of the company to Health Care REIT, Inc. in January 2013. From October 2006 to May 2007, Mr. Ordan was Chief Executive Officer and President of The Mills Corporation, a publicly traded developer, owner and operator of regional shopping malls and retail entertainment centers, after serving as chief operating officer from February 2006 to October 2006. While at The Mills Corporation, he also served as a director from December 2006 to May 2007. Previously, Mr. Ordan held executive positions at Sutton Place Group, LLC; High Noon Always, Inc.; Chatwell Health Management; and Fresh Fields Markets, Inc. Mr. Ordan began his career as a an Analyst in the Equities Division of Goldman Sachs & Co. Mr. Ordan is currently a director of two additional publicly traded companies: Quality Care Properties, Inc., a REIT, since October 2016, where he serves as Chairman; and VEREIT, Inc., a REIT, since 2015, where he serves as a member of the Audit and Compensation committees. In addition, he has served as Senior Advisor to HCP, Inc., a publicly traded REIT that primarily invests in real estate serving the U.S. healthcare industry, since 2016. In addition to his prior publicly traded company board service as a Chairman of Washington Prime Group, in the past five years, Mr. Ordan has served as a director of Harris Teeter Supermarkets, Inc., a supermarket chain, from February 2014 to January 2015. In addition to his public company board experience, Mr. Ordan serves on the U.S. Chamber of Commerce Executive Committee and as a board member of the Chesapeake Bay Foundation. Mr. Ordan has an MBA from Harvard Business School and a bachelor’s degree from Vassar College. Key Experience, Attributes and Skills Mr. Ordan brings extensive corporate leadership and a diversified set of real estate industry experience to our Board of Directors. His background as a Chief Executive Officer and director of multiple public companies provides advanced knowledge of strategic planning, capital markets, government relations, corporate governance and risk management to our Board. Mr. Ordan brings a track record of creating value for stockholders. | |
Age: 59 Director Since: April 2018 Independent Board Committee: - Compensation (Chair) Other Current Registered Company Directorships: - Quality Care Properties, Inc. - VEREIT, Inc. | ||
8
 | James A. Ratner Principal Occupation and Business Experience Mr. Ratner has been the non-executive chairman of the Forest City Board of Directors since December 31, 2016. Previously, Mr. Ratner served as executive vice president of the Company from March 1988 to December 2016, including service as our executive vice president - development from January 2016 to December 2016. He has also served as an officer and/or director of various subsidiaries of Forest City. Mr. Ratner has served as a board member of Hamilton Beach (previously NACCO Industries, Inc.), a publicly-traded mining, small appliances and specialty retail holding company, since 2012. Mr. Ratner is active with numerous community, charitable and professional organizations, including membership on the Board of Trustees of Case Western Reserve University, The Cleveland Museum of Art and The Playhouse Square Foundation, where he serves as Chair. Mr. Ratner holds a bachelor’s degree from Columbia University and an MBA from Harvard University. Key Experience, Attributes and Skills As a member of one of Forest City’s founding families, our former executive vice president - development and a large shareholder with over 40 years of experience at the Company, Mr. Ratner brings a wealth of leadership experience and knowledge of the Company and the real estate industry to the Board of Directors. Family Relationships James A. Ratner, our Chairman of the Board, and Ronald A. Ratner, our Executive Vice President - Development, are brothers. | |
Chairman Age: 73 Director Since: December 2016 Former Director Service: 1985 - 2012 Other Current Registered Company Directorship: - Hamilton Beach (previously NACCO Industries, Inc.) | ||
 | William R. Roberts Principal Occupation and Business Experience William R. Roberts has served as President and Chief Executive Officer of the W.R. Roberts Company since 2012. At W.R. Roberts Company, Mr. Roberts provides business counseling services in the areas of operations, executive coaching, business development and strategic planning. From 1980 to December 2011, Mr. Roberts served in various positions with Verizon Communications, Inc. and various predecessor companies to Verizon, including service as regional president for Verizon Washington, D.C., Maryland and Virginia from 2010 to 2011, regional president for Verizon Washington, D.C. and Maryland from 2007 to 2010, president and chief executive officer of Verizon Public Policy Initiatives from 2000 to 2007, as well as various positions of increasing responsibility in Operations, Human Resources, Marketing, Public Affairs, and Government Relations from 1980 to 2000. Mr. Roberts serves on the Board of Directors of MedStar Health, the largest not-for-profit healthcare system in Maryland and the Washington, D.C., region, where he has been a director since 2004, served as immediate past Chairman of the Board and serves as Vice Chairman of the Executive Compensation Committee. In addition, he serves as an independent member of the board of UMUC Ventures, which provides an innovative business model for higher education that brings services and products to help higher education institutions compete and keep the costs of education affordable. Mr. Roberts has also served as Board Chairman for the Maryland Chamber of Commerce, National Aquarium in Baltimore and the Baltimore branch of the Federal Reserve Bank of Richmond. Mr. Roberts holds numerous honors and distinctive recognitions, including two honorary doctorate degrees. In 2012, he was inducted into the Maryland Chamber of Commerce Business Hall of Fame. Mr. Roberts has a bachelor’s degree from Morgan State University. Key Experience, Attributes and Skills Mr. Roberts brings more than 35 years of corporate leadership experience in a wide variety of different roles with two Fortune 25 companies to our Board of Directors. His expertise in consumer marketing, strategic planning, labor relations, business operations, public policy, and regulatory and governmental affairs provides significant insight and experience to our Board. | |
Age: 62 Director Since: April 2018 Independent Board Committee: - Compensation | ||
9
 | Robert A. Schriesheim Principal Occupation and Business Experience Robert A. Schriesheim is chairman of Truax Partners LLC, through which he advises and partners with institutional investors and serves as a board member in public and private companies typically undergoing broad transformations. From August 2011 to October 2016, he served as the Executive Vice President and Chief Financial Officer of Sears Holdings Corporation, a publicly traded retail company, and served as a Corporate Advisor until January 2017. From January 2010 to October 2010, Mr. Schriesheim was Senior Vice President and Chief Financial Officer of Hewitt Associates, a global human resources consulting and outsourcing company that was acquired by Aon in October 2010. From 2006 to 2009, he was Executive Vice President and Chief Financial Officer and, until its 2011 acquisition by Infor and Golden Gate Capital, a board member of Lawson Software, a publicly traded ERP software provider. Previously, Mr. Schriesheim was a Venture Partner with ARCH Development Partners, LLC, a seed stage venture capital fund, and earlier he held executive positions at Global TeleSystems, Inc., SBC Equity Partners, Inc., Ameritech, AC Nielsen Company, and Brooke Group, Ltd. Mr. Schriesheim is a director of three additional publicly traded companies, including: Houlihan Lokey, Inc., a global investment banking firm, since its initial public offering in August 2015, where he chairs the Audit Committee and serves as a member of the Compensation Committee; NII Holdings Inc. (formerly Nextel International), a provider of wireless communications services in Latin America, since August 2015, where he chairs the Audit Committee and serves as a member of the Corporate Governance and Nominating Committee; and Skyworks Solutions, Inc., a global provider of semiconductors to the mobile communications industry, since May 2006, where he chairs the Audit Committee. He also serves on the board of two privately held companies, including First Advantage, a portfolio company of the private equity firm Symphony Technology Group, LLC, which provides analytics and outsourced talent acquisition solutions on a global basis; and Outcome Health, a digital media company operating a patient point-of-care health intelligence platform. Mr. Schriesheim has an MBA from the University of Chicago Booth School of Business, and a bachelor’s degree from Princeton University. Key Experience, Attributes and Skills Mr. Schriesheim brings extensive corporate leadership and financial acumen to our Board of Directors. He has a track record of creating stockholder value during his distinguished career, having been the CFO of four publicly traded companies, as a member of nine publicly traded company boards and several more private company boards. His expertise in capital markets, strategy, operations and governance oversight is a tremendous asset to our Board. | |
Age: 57 Director Since: April 2018 Independent Board Committees: - Audit (Chair) - Corporate Governance and Nominating Other Current Registered Company Directorships: - Houlihan Lokey, Inc. - NII Holdings Inc. - Skyworks Solutions, Inc. | ||
10
Executive Officers of the Registrant
The following list was previously included in Part I of the Annual Report on Form 10-K. The names and ages of and positions held by the executive officers of the Company are presented in the following list. Each individual has been appointed to serve for the period which ends on the date of the 2018 Annual Meeting of Stockholders.
| Name | Age | Current Position |
| David J. LaRue | 56 | President, Chief Executive Officer and Director |
| Robert G. O’Brien | 60 | Executive Vice President and Chief Financial Officer |
| Duane F. Bishop | 55 | Executive Vice President and Chief Operating Officer |
| Charles D. Obert | 52 | Executive Vice President, Chief Accounting Officer and Corporate Controller |
| Emily J. Holiday | 41 | Executive Vice President - Human Resources |
| Ketan Patel | 47 | Executive Vice President, General Counsel and Secretary |
Brian J. Ratner (1) | 60 | Executive Vice President and Director |
Ronald A. Ratner (2) | 70 | Executive Vice President - Development and Director |
Deborah Ratner Salzberg (1) | 64 | Executive Vice President and Director |
| • | David J. LaRue has been Chief Executive Officer and President since June 2011. |
| • | Robert G. O’Brien has been Executive Vice President and Chief Financial Officer since April 2008. |
| • | Duane F. Bishop has been Executive Vice President and Chief Operating Officer since January 1, 2016. He previously served as the Executive Vice President and Chief Operating Officer of the Company’s Commercial Group from 2011 to December 31, 2015. |
| • | Charles D. Obert has been Chief Accounting Officer and Corporate Controller since September 2011 and Executive Vice President since March 1, 2017. He previously served as a Senior Vice President from September 2011 through February 28, 2017. |
| • | Emily J. Holiday has been Executive Vice President - Human Resources since March 1, 2017. She previously served as Senior Vice President - Human Resources from January 1, 2016 through February 28, 2017, Director - Talent Management from October 2014 through December 2015 and Vice President - Procurement from April 2011 through October 2014. |
| • | Ketan Patel has been Executive Vice President, General Counsel and Secretary since May 17, 2017. He previously served as Vice President, Corporate Secretary and Chief Ethics Officer of FirstEnergy Corp., a major Midwestern electric utility company, from July 2016 to May 17, 2017, where he served as a primary liaison to its board and managed a team of 150 associates across the company’s real estate and facilities, corporate and records and information compliance departments. From November 2012 through June 2016, he served as Director, Real Estate and Facilities of FirstEnergy Corp. |
| • | Brian J. Ratner has been Executive Vice President since June 2001. He has been President of Forest City Texas, LLC, a subsidiary of the Company, since 2011. |
| • | Ronald A. Ratner has been Executive Vice President - Development since January 1, 2016 and Executive Vice President since March 1988. |
| • | Deborah Ratner Salzberg has been Executive Vice President since June 2013. She has been President of Forest City Washington, LLC, a subsidiary of the Company, since 2002. |
| (1) | Brian J. Ratner and Deborah Ratner Salzberg are siblings. |
| (2) | James A. Ratner, the Company’s non-executive Chairman of the Board, and Ronald A. Ratner are brothers. |
Section 16(a) Beneficial Ownership Reporting Compliance
Section 16(a) of the Exchange Act requires our directors, executive officers, and beneficial owners of more than 10% of a registered class of our equity securities to file with the Securities and Exchange Commission (the "SEC") and the New York Stock Exchange (the "NYSE") initial reports of beneficial ownership and reports of changes in ownership of common shares and other equity securities of ours. Executive officers, directors and owners of more than 10% of the common shares are required by SEC regulations to furnish us with copies of all forms they file pursuant to Section 16(a).
To our knowledge, based solely on our review of the copies of such reports filed with the SEC and written representations that no other reports were required during the year ended December 31, 2017, all Section 16(a) filing requirements applicable to our executive officers, directors and greater than 10% beneficial owners were complied with, except as follows: due to technical difficulties experienced with the Section 16 filing software used for reporting, a Form 4 for Ronald Ratner was filed one day late; due to the untimely reporting of transaction details by the filer’s representatives, a Form 4 for Ronald Ratner was not timely; and due to transaction details regarding an in-kind exchange of convertible securities not being made available until after a Form 4 was due, a Form 4 for Bruce Ratner was not timely.
11
Audit Committee
The Company’s Board of Directors has a standing Audit Committee. As of December 31, 2017, the Audit Committee’s membership was as follows: Michael P. Esposito, Jr. (Chair), Arthur F. Anton, Kenneth J. Bacon, and Z. Jamie Behar. Effective April 2018, Messrs. Esposito and Anton resigned from the Company's Board and all committees on which they served. Also effective April 2018, following their appointments to the Board, Robert A. Schriesheim was appointed as Chair of the Audit Committee and Adam S. Metz and Marran H. Ogilvie were appointed as members. The Board has determined that each member of the Audit Committee qualifies as an audit committee “financial expert” in accordance with the requirements of Section 407 of the Sarbanes-Oxley Act of 2002 and the SEC rules implementing that section. As of the date of this Form 10-K/A, Marran H. Ogilvie and Robert A. Schriesheim each serve on the audit committees of three additional publicly-traded companies. As such, the Board has taken their simultaneous service in consideration and determined that such service will not impair the ability of Ms. Ogilvie and Mr. Schriesheim to effectively serve on the Company's Audit Committee.
Code of Legal and Ethical Conduct
We require that all directors, officers and employees adhere to our Code of Legal and Ethical Conduct in addressing the legal and ethical issues encountered in conducting their work. The Code of Legal and Ethical Conduct requires, among other things, that our employees avoid conflicts of interest, comply with all laws and other legal requirements and otherwise act with integrity.
We require all directors, officers, and employees to annually review and acknowledge compliance with our Code of Legal and Ethical Conduct. Furthermore, all newly hired employees are required to acknowledge receipt and compliance with the Code of Legal and Ethical Conduct. In addition, those with supervisory duties are also required to acknowledge their responsibility for both informing and monitoring compliance with the Code of Legal and Ethical Conduct on the part of employees under their supervision. In 2017, 100% of our directors, officers and employees acknowledged compliance with the Code of Legal and Ethical Conduct.
The Board adopted a Senior Financial Officers Code of Ethical Conduct as an addendum to the Code of Legal and Ethical Conduct. The Senior Financial Officers Code of Ethical Conduct formalizes the general standards of honesty, integrity and judgment that we expect of our senior financial officers. We require our senior financial officers to annually acknowledge receipt of and compliance with the Senior Financial Officers Code of Ethical Conduct. In 2017, 100% of our senior financial officers acknowledged compliance with the Senior Financial Officers Code of Ethical Conduct.
In addition, the Board adopted a Supplier Code of Conduct in 2012. The Supplier Code of Conduct formalizes our expectations of suppliers and sets forth legal, moral, ethical and environmental standards and guidelines by which we expect our suppliers to abide. In 2014, the Board adopted substantial enhancements to the Supplier Code of Conduct to add additional standards related to health and human safety, and labor and human rights; and enhanced provisions related to gifts and gratuities.We have implemented an anonymous hotline monitored by an external, third-party firm. Our Audit Committee has adopted a policy statement entitled “Employee Complaint Procedures for Accounting and Auditing Matters” establishing procedures to investigate complaints.
The Company intends to disclose on its website any amendment to, or waiver of, any provision of the Code of Legal and Ethical Conduct applicable to its directors and executive officers that would otherwise be required to be disclosed under the rules of the SEC or NYSE.
Copies of the Code of Legal and Ethical Conduct and the Supplier Code of Conduct are available on the Company’s website at www.forestcity.net. The Code of Legal and Ethical Conduct is also available in print, free of charge, to any stockholder upon written request addressed to Corporate Secretary, Forest City Realty Trust, Inc., 127 Public Square, Suite 3100, Cleveland, Ohio 44114.
12
Item 11. Executive Compensation
Director Compensation
Our director compensation policy is outlined in the following chart and includes the compensation paid to our independent non-employee directors. Compensation is paid to nonemployee directors only. Directors who are also our employees receive no additional compensation for service as directors. All of our nonemployee directors serving on the Board during 2017, except James A. Ratner, were independent.
| Nonemployee Director Compensation Policy | Amount (1) |
Annual Board Retainer | $65,000 |
Annual Stock Award (2) | $125,000 |
Annual Retainer to “Lead Director” | $25,000 |
| Annual Retainer to Committee Chairman for: | |
| Audit Committee | $30,000 |
| Compensation Committee | $20,000 |
| Corporate Governance and Nominating Committee | $15,000 |
| Annual Retainer to Committee Members (other than Chairman) for: | |
| Audit Committee | $15,000 |
| Compensation Committee | $10,000 |
| Corporate Governance and Nominating Committee | $7,500 |
| Other Fees for: | (fees per day) |
| Attending other formal meetings in their capacity as directors not held on the same day as a board meeting or board committee meeting, such as Executive Committee and strategic planning meetings. | $1,500 |
| Attending special meetings or performing special services in their capacity as members of a board committee, in each case as determined and approved by the applicable committee. | $1,500 |
Director Stock Ownership Requirement: (3) | |
| Nonemployee directors have up to five years to accumulate ownership of our Common Stock in an amount of at least five times the annual board retainer, using a fixed number of shares approach to be reviewed at least once every three years and based upon the 90-day average price leading up to a December 31 measurement date. The shares may be acquired through direct acquisition, exercise of stock options, vesting of restricted stock, accumulation of stock units stock in their deferred compensation account and 60% of unvested restricted stock. | |
| (1) | We pay annual retainers in quarterly installments. At the request of Mr. Lande, his cash director fees are paid directly to Scopia Capital Management LP, his employer and the beneficial owner of greater than 5% of the Company’s Common Stock, pursuant to internal compensation policies of Scopia. |
| (2) | Nonemployee directors may choose between stock options and/or restricted stock in 25% multiples. The default selection is 100% restricted stock. Equity grants to independent directors have one-year cliff vesting. Pursuant to our 1994 Stock Plan, as amended, the aggregate grant-date fair value of awards granted to a nonemployee director during any calendar year is limited to $250,000. The number of stock options granted is determined by dividing the amount of the award allocated to stock options by the Black-Scholes fair value, and the number of shares of restricted stock is determined by dividing the amount of the award allocated to restricted stock by the closing price of the Common Stock on the date of grant. The computed number of options and restricted shares are rounded down to eliminate fractional shares. Directors who are appointed to the Board after the annual equity grant are provided a prorated grant based on the date they are appointed to the Board. Mr. Lande has elected to waive any equity compensation payable to him, pursuant to internal compensation policies of Scopia, his employer and the beneficial owner of greater than 5% of the Company’s Common Stock. |
| (3) | As of January 31, 2018, all of our then current non-employee directors who presently remain on our Board, except Z. Jamie Behar, met the stock ownership requirement of 16,430 shares. Ms. Behar has until 2022 to meet the requirement and our newly appointed non-employee directors will have until 2023 to meet their requirements. |
The Deferred Compensation Plan for Nonemployee Directors (the “Deferred Compensation Plan”) permits nonemployee members of the Board of Directors to defer 50% or 100% of their annual board retainer. Directors electing to participate select either a cash investment option or stock investment option for fees deferred during the year. Fees deferred to the stock investment option are deemed to be invested in stock units of our Common Stock. Dividends earned on stock units are deemed to be reinvested in more shares. After the participant ceases to be our director, the stock units accumulated in the participant’s account will be paid out in shares of Common Stock or cash, as elected by the participant. Prior to her resignation, Deborah Harmon was the only participant who held stock units under the Deferred Compensation Plan to select the stock investment option. As of April 16, 2018, there were 5,785 stock units accumulated in Ms. Harmon’s account. Participants may make an annual election as of each December 31 to reallocate their account balances between the two investment options. The Deferred Compensation Plan does not limit the amount of stock that can be issued under the stock investment option.
The Corporate Governance and Nominating Committee bi-annually reviews the policy of nonemployee director compensation and annually reviews stock ownership requirements.
13
Effective as of 11:59 p.m., Eastern Time, on December 31, 2016, James A. Ratner resigned his position of Executive Vice President - Development to serve as non-executive Chairman of the Board. The Board approved an annual retainer of $150,000 and an annual equity award having a grant-date fair market value of $250,000 for his service as non-executive Chairman of the Board beginning in 2017. In approving these amounts, the Corporate Governance and Nominating Committee considered the benchmark data provided by Pearl Meyer (“Pearl Meyer”) pertaining to non-executive chairs at comparable REITs as well as within the general industry, Mr. Ratner’s unique expertise and experience which he brought to the role, and that Mr. Ratner was expected to devote significantly more hours annually to his role than typical non-executive board chairs.
The information presented in the following table is for the year ended December 31, 2017. All other individuals who served as directors during 2017, but are not listed, were our employees and received no compensation in their capacity as director during 2017.
Director Compensation Table
| Name | Fees Earned or Paid in Cash ($) (1) | Stock Awards ($) (2) | Option Awards ($) (3) | Change in Pension Value and Nonqualified Deferred Compensation Earnings ($) (4) | All Other Compensation ($) (5) | Total ($) | ||||||||||||
| Arthur F. Anton | $ | 112,500 | $ | 124,999 | $ | — | $ | — | $ | — | $ | 237,499 | ||||||
| Kenneth J. Bacon | $ | 89,000 | $ | 124,999 | $ | — | $ | 514 | $ | — | $ | 214,513 | ||||||
| Z. Jamie Behar | $ | 89,625 | $ | 114,983 | $ | — | $ | — | $ | — | $ | 204,608 | ||||||
| Scott S. Cowen | $ | 138,750 | $ | 124,999 | $ | — | $ | — | $ | — | $ | 263,749 | ||||||
| Christine R. Detrick | $ | 82,500 | $ | 124,999 | $ | — | $ | — | $ | — | $ | 207,499 | ||||||
| Michael P. Esposito, Jr. | $ | 105,000 | $ | 124,999 | $ | — | $ | 434 | $ | — | $ | 230,433 | ||||||
| Deborah L. Harmon | $ | 76,250 | $ | — | $ | 124,998 | $ | 626 | $ | — | $ | 201,874 | ||||||
| Craig Macnab | $ | 59,250 | $ | 98,999 | $ | — | $ | — | $ | — | $ | 158,249 | ||||||
| James A. Ratner | $ | 150,000 | $ | 249,997 | $ | — | $ | — | $ | — | $ | 399,997 | ||||||
| Stan Ross | $ | 45,000 | $ | 124,999 | $ | — | $ | — | $ | — | $ | 169,999 | ||||||
| (1) | Includes fees earned during 2017 by members of the Transaction Committee established by the Board of Directors in connection with the process to review potential operating, strategic, financial and structural alternatives for the Company for the purpose of enhancing stockholder value (the “Strategic Alternatives Review”). Members of the Transaction Committee attended meetings during 2017 as follows: Mr. Anton, 10; Ms. Behar, 10; Dr. Cowen, 9; and Mr. Macnab, 9. Ms. Behar earned $15,000 and Dr. Cowen and Mr. Macnab each earned $13,500 ($1,500 per meeting) during 2017. Mr. Anton, as Chair, earned $22,500 ($2,250 per meeting) during 2017. |
| (2) | Restricted stock grants are valued at their grant-date fair value based on the closing price of the Common Stock on the date of grant computed in accordance with accounting guidance for share-based payments. During the year ended December 31, 2017, we granted restricted stock having a grant-date fair value of $21.83 per share as follows: Mr. Anton, 5,726; Mr. Bacon, 5,726; Dr. Cowen, 5,726; Ms. Detrick, 5,726; Mr. Esposito, 5,726; Mr. Ratner, 11,452; and Mr. Ross, 5,726. In May 2017, we granted 5,217 shares of restricted stock to Ms. Behar having a grant-date fair value of $22.04. In June 2017, we granted 4,064 shares of restricted stock to Mr. Macnab having a grant-date fair value of $24.36. The aggregate number of shares of unvested restricted stock outstanding as of December 31, 2017 was as follows: Mr. Anton, 5,726; Mr. Bacon, 5,726; Ms. Behar, 5,217; Dr. Cowen, 5,726; Ms. Detrick, 5,726; Mr. Esposito, 5,726; Mr. Macnab, 4,064; and Mr. Ratner, 27,176. |
| (3) | Stock option grants are valued at their grant-date fair value that is computed using the Black-Scholes option-pricing model. The assumptions used in the fair value calculations in 2017 are described in Footnote Q, “Stock-Based Compensation,” to our consolidated financial statements for the year ended December 31, 2017, which are included in our Annual Report on Form 10-K filed with the SEC. During the year ended December 31, 2017, we granted 26,112 stock options having a grant-date fair value of $4.79 per share to Ms. Harmon. The options have an exercise price of $21.83, which was the closing price of the underlying Common Stock on the date of grant. The aggregate number of stock options outstanding as of December 31, 2017 was as follows: Mr. Anton, 30,273; Mr. Bacon, 13,988; Dr. Cowen, 10,966; Ms. Detrick, 7,060; Mr. Esposito, 49,362; Ms. Harmon, 51,462; and Mr. Ratner, 191,862. |
| (4) | Amounts deferred under the Deferred Compensation Plan under the cash investment option earn interest at a rate equal to the average of the Moody’s Long-Term Corporate Bond Yields for Aaa, Aa and A, plus 0.5% (“Moody’s Rates”). The rate is updated every calendar quarter using the first published Moody’s Rates of the new quarter. Interest rates ranged from 4.27% to 4.55% during the year ended December 31, 2017. Interest is compounded quarterly. The amounts shown in this column represent the amount of above-market earnings on each director’s nonqualified deferred compensation balances. The amount of above-market earnings was computed to be the amount by which the actual earnings exceeded what the earnings would have been had we used 120% times the Federal Long-Term Rates published by the Internal Revenue Service in accordance with Section 1274(d) of the Internal Revenue Code. |
| (5) | All other compensation does not include our incremental cost for the use of our chartered airplane service by directors for attending board of directors meetings and committee meetings because such use is deemed to be a business expense. The total incremental cost of airplane usage by all directors for business purposes amounted to $82,092 for the year ended December 31, 2017. |
14
Compensation Committee Interlocks and Insider Participation
The Compensation Committee of the Board of Directors consists entirely of nonemployee, independent directors. No member of the Compensation Committee is a current or former officer or employee of ours or any of our subsidiaries, and no director had interlocking relationships with any other entities of the type that would be required to be disclosed.
Compensation Discussion & Analysis
Introduction
This Compensation Discussion and Analysis ("CD&A") provides an overview of our executive compensation program and 2017 fiscal year pay determinations for our Named Executive Officers ("NEOs") as identified below:
| Name | Title |
| David J. LaRue | President and Chief Executive Officer |
| Robert G. O'Brien | Executive Vice President and Chief Financial Officer |
| Ronald A. Ratner | Executive Vice President - Development |
| Duane F. Bishop | Executive Vice President - Chief Operating Officer |
| Brian J. Ratner | Executive Vice President - Division |
Executive Summary
Our Company is principally engaged in the ownership, development, management and acquisition of commercial and residential real estate throughout the United States. Founded in 1920 and having been publicly-traded since 1960, we are headquartered in Cleveland, Ohio, with offices throughout the United States. As of December 31, 2017, we had approximately $8.1 billion in consolidated assets, 1,473 full-time and 75 part-time employees, annual consolidated revenues of $912 million, and an equity market capitalization of $6.4 billion.
We attribute our long-term success in large part to our highly talented and experienced employees as well as the following core values which reinforce our Company's culture:
| • | integrity and openness; |
| • | entrepreneurial spirit; |
| • | teamwork; |
| • | diversity and inclusion; |
| • | community involvement; |
| • | sustainability and stewardship; and |
| • | accountability. |
Our executive compensation program is intended to support these values, drive long-term growth and stockholder value creation and reinforce our culture, using the following set of principles.
| • | Pay for performance: The guiding principle of our compensation philosophy is that pay should be linked to performance and that the interests of executives and stockholders should be aligned. Our executive compensation program emphasizes variable incentive pay tied to challenging performance goals, with no awards earned for results below designated threshold levels. The following table summarizes incentive award determinations for performance cycles ending in 2017: |
15
| Compensation Component | Performance Cycle | Performance Goals | Performance and Payout Levels |
| Short-term Incentive Plan ("STIP") | 2017 | Operating Funds from Operations per Share Net Debt/Adjusted EBITDA Ratio | • Performance: We exceeded the target performance level for each goal• Payout: Ranged from 127% to 136% of an executive's target award opportunity |
| Cash Long-Term Incentive Plan ("LTIP") | 2014 - 2017 | Cumulative Funds from Operations (“FFO") per Share Total Return, which is an internal measure of value creation | • Performance: We exceeded the target performance level for cumulative FFO per share but failed to achieve the threshold performance level for Total Return• Payout: approximately 94% of each executive's target opportunity |
| Cash LTIP | 2015 -2017 | Cumulative FFO per Share Net Asset Value Growth per Share | • Performance: We exceeded the target performance level for cumulative FFO per share but failed to achieve the threshold performance level for Net Asset Value Growth per share• Payout: approximately 75% of each executive's target opportunity |
| Performance Shares | 2014 - 2017 | Total stockholder return ("TSR") relative to the NAREIT Index | • Performance: Our TSR was below the threshold performance level (40th percentile) relative to the NAREIT Index• Payout: Forfeited without payout |
| Performance Shares | 2015 - 2017 | TSR relative to the NAREIT Index | • Performance: Our TSR was slightly above the threshold performance level relative to the NAREIT Index• Payout: 38% of each executive's target opportunity |
| Out-Performance Plan | 2015 - 2017 | Annualized TSR | • Performance: Annualized TSR was below the threshold performance level• Payout: Forfeited without payout |
| • | A majority of pay for top executives should be contingent on performance and tied to multiple time periods: Our core compensation program consists of base salary, STIP and LTIP (restricted shares, performance shares and Cash LTIP). As illustrated in the charts below, a majority of target total direct compensation, ranging from 60% to 68% for NEOs, is allocated to STIP, performance shares and Cash LTIP, which are "at risk", or not guaranteed pay, since they are tied to performance. Consistent with market practice, a greater percentage of David J. LaRue's target total direct compensation opportunity is "at risk" and tied to long-term incentives, as compared with other NEOs, reflecting his role as President and CEO. Based on a review conducted by Pearl Meyer, the Compensation Committee's independent consultant, the target pay mix for our NEOs was comparable with the median mix for executive officers at comparable organizations. |
16

At risk pay represents 68% of target 2017 Total Direct Compensation
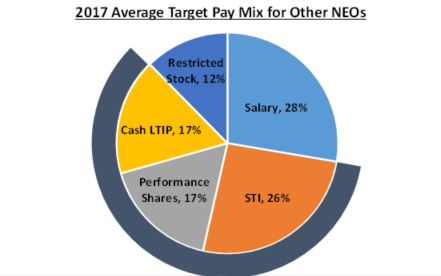
At risk pay represents 60% of target 2017 Total Direct Compensation
| • | Long-term incentives are emphasized to align executive and stockholder interests: As illustrated above, our executive compensation program places greater emphasis on long-term incentives as compared with short-term incentives, to focus senior management on long-term strategic goals and stockholder value creation. Long-term incentives represent approximately 61% of target total direct compensation for David J. LaRue and 46% of target total direct compensation on average for other NEOs. We currently use a combination of equity-based and cash-based long-term award vehicles to minimize potential stockholder dilution that would result from the sole use of equity grants. |
| • | Total compensation should be fair, competitive and communicated: Our base salaries and short-term and long-term incentives are targeted competitively to attract and retain talented and experienced executives. With our emphasis on performance-based incentive compensation, actual total direct pay can be above or below targeted levels based on our actual versus planned performance results and level of stock price appreciation. |
| • | Our executive compensation program should not encourage the taking of excessive risks that could be detrimental to the interests of our stockholders: We believe our use of short-term and long-term incentives, with multiple types of award vehicles, performance criteria, measurement periods and stock ownership guidelines, clawback provisions, and stock hedging/pledging policies, do not encourage our NEOs and other senior executives to take unreasonable risks relating to our business. A comprehensive formal risk assessment is reviewed annually by our Compensation Committee. |
Say on Pay Voting Results and Impacts
We held our annual advisory vote on the compensation of our NEOs ("Say on Pay Proposal") at our annual meeting of stockholders on June 9, 2017. At that meeting, approximately 97.4% of the stockholders entitled to vote and present in person or by proxy
17
voted in favor of the Say on Pay Proposal. Overall, the Compensation Committee believes that this overwhelming level of stockholder support is evidence that our executive compensation program is appropriately structured and aligned with stockholder interests.
The Compensation Committee intends to provide a competitive compensation program that is appropriately aligned with our annual and strategic business plans and the interests of our stockholders. This is evidenced by a number of changes which have been made to our executive compensation program and corporate governance practices over time, such as the use of performance share grants tied to a relative TSR metric, greater transparency of metrics used under the Cash LTIP, primary emphasis on "at risk" variable pay, revisions to the Executive Stock Ownership Policy, adoption of a Clawback Policy and adoption of a Securities Hedging and Pledging Policy.
Our Commitment to Sound Corporate Governance
| What We Do | What We Don't Do |
| Use performance-based incentives tied to multiple metrics and challenging goals | Provide multi-year pay guarantees |
| Place primary emphasis on performance contingent long-term incentives | Offer excessive perquisites with employment agreements |
| Use tally sheets | Reprice stock options without stockholder approval |
| Apply Executive Stock Ownership Policy | Provide tax gross ups on awards |
| Have Clawback Policy | Pay dividends on unearned performance shares |
| Have Hedging and Pledging Policy | Provide uncapped performance awards |
Components of the Executive Compensation Program
The primary components of our total rewards strategy within our executive compensation program are shown below. A more detailed description for each component follows.
| Compensation Component | Component Objective | Paid in | Performance Linkage |
| Base Salary - Direct Compensation | Provide base pay commensurate with level of responsibility, experience and individual performance | Cash | Partially linked (merit increases tied to individual performance) |
| Short-Term Incentives - Direct Compensation | Align pay with achievement of short-term performance goals in support of annual business plan and strategic goals | Cash | Strongly linked |
| Long-Term Incentives - Direct Compensation | Align pay with achievement of longer-term strategic goals and stockholder value creation, enhance retention of senior management, and facilitate stock ownership | Cash and Performance Shares | Strongly linked |
| Restricted Stock | Minimally linked | ||
| Benefits & Perquisites - Indirect Compensation | Provide for health, welfare and retirement needs at a reasonable shared cost | Health Care Life and Disability Retirement Plans Perquisites | Minimally or not linked |
Base Salary: Base salary is reflective of each executive's level of responsibility, experience, individual performance and contributions to our overall success. It also impacts annual and long-term incentive award opportunities that are expressed as a percentage of base salary.
We did not make any changes to the base salaries of our NEOs in 2017, other than for Brian Ratner, who received a 3% merit increase.
Short-Term Incentives: Our NEOs and other eligible senior executives participate in the STIP. The STIP's primary objective is to motivate senior executives to achieve specified business objectives over the short-term that lead to long-term value creation. Actual awards earned, if any, can be considerably above or below target levels based on our actual performance.
18
For 2017, the STIP opportunity for each NEO was based on two equally-weighted company-wide metrics: Operating Funds From Operations ("Operating FFO") per share and Net Debt/Adjusted EBITDA, with one exception: Brian J. Ratner. To further enhance his line of sight, 25% of Brian J. Ratner’s STIP opportunity was based on individual performance which focused on various on-going and potential Development projects and the remaining 75% was based on the two equally-weighted corporate-wide components. For each performance component, the actual award could range from 0% to 200% of target.
The Compensation Committee selected Operating FFO per share and Net Debt/Adjusted EBITDA ratio as the STIP metrics since they reflect the ongoing operating performance of our portfolio and are key indicators of continuing operating results in planning and executing our business strategy. The calculation of Operating FFO is defined in the "Operating FFO per Share" section of this Form 10-K/A. The number is divided by fully diluted weighted average total common shares outstanding to arrive at Operating FFO per share. Net Debt/Adjusted EBITDA Ratio is defined in the "Net Debt/Adjusted EBITDA Ratio" section of this Form 10-K/A.
The calibration schedules used to determine the actual awards under the 2017 STIP are shown below.
Operating FFO per Share
We define Operating FFO as FFO adjusted to exclude: i) impairment of non-depreciable real estate; ii) write-offs of abandoned development projects and demolition costs; iii) income recognized on state and federal historic and other tax credits; iv) gains or losses from extinguishment of debt; v) change in fair market value of nondesignated hedges; vi) gains or losses on change in control of interests; vii) the adjustment to recognize rental revenues and rental expense using the straight-line method; viii) participation payments to ground lessors on refinancing of our properties; ix) other transactional items; x) the Nets pre-tax FFO; and xi) income taxes on FFO.
The 2017 target level of Operating FFO per share ($1.40 per share) was set above the 2016 target level of $1.33 per share but below the 2016 actual result of $1.46 per share. The 2017 target assumed that we would engage in a number of strategic asset dispositions, including the sale of our federally assisted housing apartment communities, the sale of various regional mall retail assets to Queensland Investment Corporation and the specialty retail transaction with Madison International. The budgeted impact of these liquidity transactions was partially offset by budgeted earnings generated through strategic initiatives, particularly those focused on overhead reduction and margin enhancement, along with the impact of new openings and a reduction in debt.
| Performance Level | Corresponding Operating FFO per Share | Percent of Target Achieved | Percent of Target Award Earned |
| Below Threshold | Below $1.26 | Below 90% | 0% |
| Threshold | $1.26 | 90% | 25% |
| Target Range Low | $1.33 | 95% | 80% |
| $1.40 | 100% | 100% | |
| Target Range High | $1.54 | 110% | 140% |
| Maximum | $1.68 and above | 120% | 200% |
Net Debt/Adjusted EBITDA Ratio
Net Debt to Adjusted EBITDA, a non-GAAP measure, is defined as total debt, net at our share (total debt includes outstanding borrowings on our revolving credit facility, term loan facility, convertible senior debt, net, nonrecourse mortgages and notes payable, net) less cash and equivalents, at our share, divided by Adjusted EBITDA.
EBITDA, a non-GAAP measure, is defined as net earnings excluding the following items at our share: i) non-cash charges for depreciation and amortization; ii) interest expense; iii) amortization of mortgage procurement costs; and iv) income taxes. We use EBITDA as the starting point in order to calculate Adjusted EBITDA as described below.
We define Adjusted EBITDA, a non-GAAP measure, as EBITDA attributable to the Company adjusted to exclude: i) impairment of non-depreciable real estate; ii) gains or losses from extinguishment of debt; and iii) other transactional items, including organizational transformation and termination benefits.
19
The 2017 target level of Net Debt/Adjusted EBITDA ratio (8.00) was set below the 2016 target level of 8.62 and the 2016 actual result of 8.92 (i.e., it was more rigorous than the 2016 target and 2016 actual results).
| Performance Level | Corresponding Net Debt/Adjusted EBITDA Ratio | Percent of Target Achieved | Percent of Target Award Earned |
| Below Threshold | Above 8.89 | Below 90% | 0% |
| Threshold | 8.89 | 90% | 25% |
| Target Range Low | 8.42 | 95% | 80% |
| Target | 8.00 | 100% | 100% |
| Target Range High | 7.27 | 110% | 140% |
| Maximum | 6.67 | 120% | 200% |
Approved actual performance for each of the two company-wide STIP metrics is shown in the following table:
| 2017 STIP Metric | Target | Actual Performance | Percent of Target Award Earned Per Component |
| Operating FFO per share | $1.40 | $1.54 | 140.00% |
| Net Debt/Adjusted EBITDA Ratio | 8.00 | 7.40 | 132.43% |
The following table reflects the actual 2017 STIP award earned by each of our NEOs (as a percentage of target and a dollar amount). The table also sets out the target STIP award levels that were established for each NEO, which remained unchanged from 2016.
| Named Executive Officer | 2017 STIP Target Award as a Percentage of Base Salary | 2017 STIP Target Award | 2017 STIP Actual Award as a Percentage of Target | 2017 STIP Actual Award Earned |
| David J. LaRue | 130% | $975,000 | 136.22% | $1,328,096 |
| Robert G. O'Brien | 100% | $583,000 | 136.22% | $794,133 |
| Ronald A. Ratner | 100% | $500,000 | 136.22% | $681,075 |
| Duane F. Bishop | 100% | $500,000 | 136.22% | $681,075 |
| Brian J. Ratner | 80% | $378,216 | 127.16%* | $480,944 |
*Brian Ratner attained the target performance level (100%) for his individual goals, which comprised 25% of his STIP opportunity.
Long-Term Incentives: Our long-term incentives align pay with long-term strategic goals and stockholder value creation. They also enhance our retention of senior executives and managers, and facilitate stock ownership. Our long-term incentives consist primarily of two components which promote a balanced focus on objectives under the strategic plan in support of long-term value creation:
| • | Cash LTIP awards; and |
| • | Equity provided through the use of performance shares and restricted stock. |
In determining award levels for NEOs, the Compensation Committee gives consideration to competitive market practice, employee responsibility level, and internal equity.
20
As reflected in the table below, the targeted value mix of LTIP awards in 2017 for all of our NEOs, except Brian J. Ratner, was weighted 37.5% in the form of a Cash LTIP opportunity, 37.5% for a performance share grant opportunity and 25% for restricted stock. We believe this increased emphasis on performance-based LTI (with Cash LTIP and performance shares collectively comprising 75% of the total annual opportunity), provides an appropriate balance and further demonstrates our commitment to aligning NEO pay with long-term value creation. Brian J. Ratner's 2017 target value mix was equally weighted among all three award vehicles.
The table also sets out the target LTIP award levels that were established for each NEO, which remained unchanged from 2016.
| Named Executive Officer | 2017 Fiscal Year Target Award Equivalents (as a Percentage of Base Salary) | |||
| Total Annualized LTIP Award as a Percent of Base Salary | Absolute Percentage in the form of Performance Shares (vesting determined at the end of the 2017 - 2019 performance period) | Absolute Percentage in the form of Restricted Stock | Absolute Percentage in the form of Cash LTIP (payment determined at the end of the 2017 - 2019 performance period) | |
| David J. LaRue | 375% | 140.625% | 93.75% | 140.625% |
| Robert G. O'Brien | 200% | 75.00% | 50.00% | 75.00% |
| Ronald A. Ratner | 200% | 75.00% | 50.00% | 75.00% |
| Duane F. Bishop | 200% | 75.00% | 50.00% | 75.00% |
| Brian J. Ratner | 100% | 33.330% | 33.33% | 33.33% |
Cash LTIP
The Cash LTIP provides for annual grants with three-year rolling performance periods. The potential target award for each performance period is calculated using the target award multiplied by the base salary of the participant as of the beginning of the performance period.
The following illustrates key attributes of the Cash LTIP for the 2016-2018 and the 2017-2019 performance cycles:
January 1, 2016 to December 31, 2018 Performance Cycle | January 1, 2017 to December 31, 2019 Performance Cycle | |
| Duration of performance period | 36 months | 36 months |
| Award Funding Calculation | Cumulative FFO per share and Net Asset Value growth per Share relative to approved targets | Cumulative FFO per share and Net Asset Value Growth per Share relative to approved targets |
| Actual Awards Earned Subject to | Final results relative to targets and calibrations approved by the Compensation Committee | Final results relative to targets and calibrations approved by the Compensation Committee |
| Awards Earned (if any) will be paid in | Early 2019 | Early 2020 |
2014 - 2017 Cash LTIP Performance Cycle
The maximum payout for designated participants under the 2014 - 2017 Cash LTIP cycle equaled 1.5% of the excess, if any, of cumulative FFO, as adjusted over $1 billion, with the award to any eligible NEO not to exceed $1.75 million. Actual cumulative FFO performance for the 2014 - 2017 performance cycle was $1.538 billion resulting in a maximum potential Cash LTIP award of $1.75 million per eligible NEO, subject to exercise of negative discretion by the Compensation Committee.
When determining actual payout levels for the 2014 - 2017 Cash LTIP cycle, the Compensation Committee considered the Company's performance relative to two equally-weighted metrics: cumulative FFO per share and an internal measure of value creation, Total Return. The calculation of FFO is defined in the "Cumulative FFO per Share" section of this Form 10-K/A. FFO is divided by fully diluted weighted average total common shares outstanding to arrive at FFO per share. Total Return is defined as change in net asset value plus or minus cash generated or used. The calibration schedules for these two metrics were as follows:
21
Cumulative FFO per Share
FFO is defined by NAREIT as net earnings excluding the following items at our ownership: i) gain (loss) on full or partial disposition of rental properties, divisions and other investments (net of tax); ii) non-cash charges for real estate depreciation and amortization; iii) impairment of depreciable real estate (net of tax); and iv) cumulative or retrospective effect of change in accounting principle (net of tax).
| Performance Level | Corresponding Cumulative FFO per share 2014 - 2017 Performance Cycle | Percent of Target Achieved | Percent of Target Award Earned |
| Below Threshold | Below $4.77 | Below 90% | 0% |
| Threshold | $4.77 | 90% | 50% |
| Target | $5.30 | 100% | 100% |
| Maximum | $6.36 | 120% | 200% |
Total Return
| Performance Level | Corresponding Total Return 2014 - 2017 Performance Cycle | Percent of Target Achieved | Percent of Target Award Earned |
| Below Threshold | Below 8.91% | Below 90% | 0% |
| Threshold | 8.91% | 90% | 50% |
| Target | 9.90% | 100% | 100% |
| Maximum | 11.88% | 120% | 200% |
Actual cumulative FFO per share for the 2014 - 2017 Cash LTIP cycle was $6.23 versus a target of $5.30, which resulted in a payout of 187.74% of target for this component of the award. Actual Total Return was well below the 90% threshold performance levels resulting in no payout for this component. As a result, the Compensation Committee approved total payment of 93.87% of the target Cash LTIP award for each NEO for the 2014 - 2017 performance cycle.
The following table reflects the actual 2014 - 2017 Cash LTIP award earned by each of our NEOs (as a percentage of target and a dollar amount).
| Named Executive Officer | 2014 - 2017 Cash LTIP Target Award | Actual Performance as a Percentage of Target | Actual Award Earned* |
| David J. LaRue | $720,000 | 93.87% | $700,000 |
| Robert G. O'Brien | $366,667 | 93.87% | $350,000 |
| Ronald A. Ratner | $333,333 | 93.87% | $320,000 |
| Duane F. Bishop | $141,667 | 93.87% | $135,000 |
| Brian J. Ratner | $150,000 | 93.87% | $145,000 |
*Actual payouts were subject to rounding conventions applied by the Compensation Committee.
22
2015 - 2017 Cash LTIP Performance Cycle
When determining actual payout levels for the 2015 - 2017 Cash LTIP cycle, the Compensation Committee considered the Company's performance relative to two equally-weighted metrics, cumulative FFO per share and Net Asset Value Growth per share. The calculation of FFO is defined in the "Cumulative FFO per Share" section of this Form 10-K/A. FFO is divided by fully diluted weighted average total common shares outstanding to arrive at FFO per share. Net Asset Value Growth per share is defined as change in a company's fair value minus its total liabilities, divided by its number of shares outstanding. The calibration schedules for these two metrics were as follows:
Cumulative FFO per Share
| Performance Level | Corresponding Cumulative FFO per share 2015 - 2017 Performance Cycle | Percent of Target Achieved | Percent of Target Award Earned |
| Below Threshold | Below $3.67 | Below 90% | 0% |
| Threshold | $3.67 | 90% | 50% |
| Target | $4.08 | 100% | 100% |
| Maximum | $4.90 | 120% | 200% |
Net Asset Value per share
| Performance Level | Corresponding Net Asset Value per share 2015 - 2017 Performance Cycle | Percent of Target Achieved | Percent of Target Award Earned |
| Below Threshold | Below $8.87 | Below 90% | 0% |
| Threshold | $8.87 | 90% | 50% |
| Target | $9.85 | 100% | 100% |
| Maximum | $11.82 | 120% | 200% |
Actual cumulative FFO per share for the 2015 - 2017 Cash LTIP cycle was $4.48 versus a target of $4.08, which resulted in a payout of 148.78% for this component. Actual Net Asset Value per share was $4.81 versus a target of $9.85, which resulted in no payout for this component. As a result, the Compensation Committee approved total payment of 74.39% of the target Cash LTIP award for each NEO for the 2015 - 2017 performance cycle.
The following table reflects the actual 2015 - 2017 Cash LTIP award earned by each of our NEOs (as a percentage of target and a dollar amount).
| Named Executive Officer | 2015 - 2017 Cash LTIP Target Award | Actual Performance as a Percentage of Target | Actual Award Earned* |
| David J. LaRue | $810,000 | 74.39% | $603,000 |
| Robert G. O'Brien | $377,667 | 74.39% | $281,000 |
| Ronald A. Ratner | $333,333 | 74.39% | $248,000 |
| Duane F. Bishop | $141,667 | 74.39% | $106,000 |
| Brian J. Ratner | $150,000 | 74.39% | $112,000 |
*Actual payouts were subject to rounding conventions applied by the Compensation Committee.
Equity Grant Practices
We typically grant equity awards under the LTIP following the release of full year earnings for the prior fiscal year.
The amount of equity granted in 2017 was based on target award opportunities, as disclosed above.
23
| Run Rate |
The number of stock options and restricted stock provided to our outside directors, and restricted shares and performance shares granted to our NEOs and other senior executives and managers who participate in the LTIP, represented a run rate (defined as total shares granted divided by total common shares outstanding) of approximately 0.4%. This run rate included an assumed target level performance share grant for participating executives. |
Restricted Stock
Each of our NEOs is eligible for restricted stock grants, which are made to recognize performance, enhance retention, and promote long-term stock ownership in conjunction with stock ownership requirements. Restricted stock will vest over a three-year period as follows:
| • | 25% vest on the first anniversary of the date of grant; |
| • | 25% vest on the second anniversary of the date of grant; and |
| • | 50% vest on the third anniversary of the date of grant. |
Performance Share Grant Opportunity Cycles
Each of our NEOs received performance share grants in 2014, 2015, 2016 and 2017 allowing them to earn shares of our Common Stock based on our TSR relative to a broad comparator group of REITs included in the NAREIT All Equity REIT Index, as determined over a multi-year performance period. Comparator companies include all REITs in the NAREIT Index at both the start and the end of each applicable performance cycle. TSR is defined as change in stock price over the performance period, plus any dividends paid, for our Common Stock compared to that of comparator companies. TSR calculations for Forest City and all comparator companies are based on average closing prices for the twenty trading days leading up to the beginning and end of each performance share cycle.
The following illustrates key attributes of the performance share grant cycles commencing and outstanding as of January 1, 2017.
| January 1, 2016 to December 31, 2018 Performance Cycle | January 1, 2017 to December 31, 2019 Performance Cycle | |
| Duration of performance period | 36 months | 36 months |
| Performance Share Award earned to be determined using | TSR of Forest City's Common Stock relative to NAREIT Index comparators | TSR of Forest City's Common Stock relative to NAREIT Index comparators |
| Number of Performance Shares which can vest | 0% to 200% of Target Amounts based on vesting schedule | 0% to 200% of Target Amounts based on vesting schedule |
| Awards Earned (if any) will be paid in | Early 2019 | Early 2020 |
The Compensation Committee believes that the use of relative TSR as a performance metric is appropriate since it effectively aligns the compensation of our NEOs with stockholder results, recognizing that stockholders have other real estate company investment opportunities. The Compensation Committee also believes that the use of a relative TSR metric, coupled with those metrics used in calculating any Cash LTIP award, provides an appropriate balance between externally and internally focused long-term value creation measures for our LTIP.
The Compensation Committee approved the use of the following vesting schedule for each of the performance share grants made in 2014 through 2017:
| Forest City's TSR Relative to NAREIT Index Comparator Companies | Percentage of Target Performance Shares Earned |
| Below 40th Percentile | 0% of target share amount will vest |
| 40th Percentile | 25% of target share amount will vest |
| 50th Percentile | 50% of target share amount will vest |
| 60th Percentile | 100% of target share amount will vest |
| 75th Percentile or greater | 200% of target share amount will vest |
24
TSR over the performance period must be at the 60th percentile versus companies in the NAREIT Index in order to earn a target number of performance shares. The use of the 60th percentile target performance hurdle is consistent with our pay for performance philosophy and our desire to set challenging goals.
As with the Cash LTIP award opportunity, performance share grants are based on a target percentage of each NEO's base pay.
2014 - 2017 Performance Share Cycle
The cumulative TSR for our Common Stock was 31.4% for the 2014 - 2017 performance cycle, which resulted in a 31.50 percentile ranking relative to companies in the NAREIT Index. Consistent with our pay for performance philosophy, since the minimum threshold performance required was the 40th percentile, no performance shares were earned for the 2014 - 2017 performance cycle.
2015 - 2017 Performance Share Cycle
The cumulative TSR for our Common Stock was 17.9% for the 2015 - 2017 performance cycle, which resulted in a 45.20 percentile ranking relative to companies in the NAREIT Index. As a result, the Compensation Committee approved a payout of 38% of the target number of performance shares for each NEO for the 2015 - 2017 performance cycle.
| Named Executive Officer | Target Performance Share Award for the 2015 - 2017 Performance Cycle | Actual Performance as a Percentage of Target | Actual Performance Share Award Earned |
| David J. LaRue | 32,900 | 38% | 12,502 |
| Robert G. O'Brien | 15,339 | 38% | 5,829 |
| Ronald A. Ratner | 13,539 | 38% | 5,145 |
| Duane F. Bishop | 6,275 | 38% | 2,385 |
| Brian J. Ratner | 5,926 | 38% | 2,252 |
Outperformance Plan Award Opportunity
Given our conversion to REIT status in 2016 and the corresponding required organizational transformation, the Compensation Committee approved a one-time performance share grant for select senior executives, including each of our NEOs, through a special Outperformance Plan award opportunity. The number of performance shares that could vest was based on the absolute annualized TSR of our Common Stock for the 2015-2017 performance cycle. No award could be earned if our three-year annualized TSR was 8% or less, with a target annualized TSR of 10.5%, and a maximum annualized TSR of 16% or more. The actual award payout ranged from 0% to 300% of the target share amounts.
The annualized TSR of our Common Stock for the 2015-2017 performance cycle was 5.52%. Consistent with our Company's pay for performance philosophy, since the minimum threshold performance required was 8%, no performance shares vested for the Outperformance Plan.
Benefits and Other Perquisites
Consistent with our pay for performance philosophy, we do not offer our NEOs a large number of perquisites or supplemental benefits. Our NEOs, as well as other members of senior management, receive customary benefits such as group term life insurance. Likewise, these individuals are eligible to participate in a qualified 401(k) retirement plan, which provides for an employer matching contribution of up to $3,500 per year. We do not maintain a qualified defined benefit pension plan.
To supplement retirement benefits and enhance retention, all NEOs also participate in an unfunded nonqualified supplemental retirement plan administered by the Compensation Committee, which historically provided for discretionary annual accruals that only begin to vest after 10 years of service, with full vesting after 15 years of service. Effective with the 2008 fiscal year, no new participants were admitted into this plan and no additional annual contributions will be made on behalf of NEOs, other senior executives or managers. All participating NEOs are fully vested in their benefits at this time.
Our NEOs are also eligible for a taxable health care subsidy payment. NEOs may use the health care subsidy to purchase health care coverage under one of our Company's sponsored health care plans available to our associates and to partially defray the costs associated with out-of-pocket health care expenses. The amount of the annual health care subsidy payment for each of David J.
25
LaRue and Robert G. O'Brien is $30,000. For each of Ronald A. Ratner, Duane F. Bishop and Brian J. Ratner the annual health care subsidy payment is $25,000. These amounts are not subject to a tax gross-up, nor are they included in each NEO's base salary. Therefore, these payments are not considered when determining short-term or long-term incentive opportunities for each executive.
With the exception of Duane F. Bishop, we also provide our NEOs with the premium cost associated with a long-term care policy. Each NEO is also offered a monthly auto allowance for personal use. Certain NEOs also receive reimbursements for club dues or parking allowances. The value of these items is included in the All Other Compensation column of the Summary Compensation Table included in this Form 10-K/A.
Additionally, a death benefit is provided to each of our NEOs, except for Duane F. Bishop and Brian J. Ratner. The benefit is equal to five times the annual salary of each executive at the time of death and is paid to his designated beneficiaries in the form of salary continuation for a period of five years in the event the executive dies while in our employment. Further information on the value of these benefits is provided in the "Potential Payments upon Termination or Change of Control" section of this Form 10-K/A.
Additional Executive Compensation Policies
Executive Stock Ownership Requirements Policy: The Compensation Committee adopted the Executive Stock Ownership Requirements Policy ("Executive Stock Ownership Policy") in 2010 to align our compensation programs more closely to stockholder interests. The Executive Stock Ownership Policy was most recently amended in February 2016 and covers our NEOs as well as additional senior executives now subject to the requirements. Covered executives are required to meet a fixed share requirement which will be recalibrated at least once every three years. The following table lists the revised share requirements under the amended Executive Stock Ownership Policy for each NEO as such requirements were revised in February 2017.
| Named Executive Officer | Multiple of Base Salary used to Determine the Initial Fixed Share Requirement | Fixed Share Ownership Requirement |
| David J. LaRue | 6 times | 200,000 shares |
| Robert G. O'Brien | 4 times | 100,000 shares |
| Ronald A. Ratner | 4 times | 100,000 shares |
| Duane F. Bishop | 4 times | 100,000 shares |
| Brian J. Ratner | 4 times | 100,000 shares |
* The amended fixed share guidelines were based on a 90-day average closing price through December 31, 2015 of
$21.50 per share.
Covered executives must meet the share ownership requirements under the Executive Stock Ownership Policy by December 31, 2018. If the executive does not meet the requirements during the first five years of being subject to the guidelines, he/she will be required to hold 50% of net-after-tax shares received from equity grants until the ownership requirements are met. If a covered executive does not meet the requirements as of December 31, 2018, or if later, five years from the time of first being subject to the guidelines, he/she will be required to hold 100% of net after-tax shares received from equity grants until the ownership requirements are met. These requirements further enhance the alignment of our senior executives' ownership interests with those of our stockholders and simplify administration.
The Compensation Committee monitors compliance with the ownership requirements on an annual basis. Each of David J. LaRue, Robert G. O’Brien, Ronald A. Ratner, Duane F. Bishop and Brian J. Ratner has met his stock ownership requirements.
Clawback Policy: Since 2011, we have maintained a recoupment policy for compensation paid to certain executive officers, including our NEOs, who are covered by the Executive Stock Ownership Policy under the following circumstances:
| • | The payment, grant or vesting of such compensation was based on the achievement of financial results that were subsequently the subject of a restatement of our financial statements filed with the SEC, or the amount of the award was based upon the achievement of metrics which subsequently were determined to have been misstated; |
| • | The Compensation Committee determines, in its sole discretion, exercised in good faith, that the officer engaged in fraud or misconduct that caused or contributed to the need for the restatement or caused or contributed to the misstatement of the metrics; |
26
| • | The misstatement was discovered within three years of the filing of the financials; and |
| • | The Compensation Committee determines, in its sole discretion, that it is in the best interests of our Company and its stockholders for the officer to repay or forfeit all or any portion of his/her excess compensation. |
The Compensation Committee intends to periodically review our existing Clawback Policy and, as appropriate, conform it to the requirements under the Dodd-Frank Wall Street Reform and Consumer Protection Act once the SEC issues any final guidance on this matter.
Securities Hedging and Pledging Policy: To further align our policies with best practices in the area of governance, the Board of Directors in 2013 approved a Securities Hedging and Pledging Policy ("Hedging and Pledging Policy"). The Hedging and Pledging Policy prohibits directors and executive officers of the Company and its subsidiaries from:
| • | Owning financial instruments or participating in investment strategies that represent a direct hedge of the economic risk of owning our Common Stock or any securities that give the holder any rights to acquire any of our Common Stock; |
| • | Holding a margin account, or otherwise pledging as collateral, any of our securities granted to them as equity compensation; and |
| • | Engaging in pledging of our securities except in limited circumstances and upon the prior approval of our Audit Committee. Under no circumstances will a person subject to the Hedging and Pledging Policy be permitted to pledge our securities unless he or she complies with the minimum ownership level required under the stock ownership guidelines applicable to such person in effect at both the time of the pledge and on a pro-forma basis after taking the effect of the pledge into account. In determining whether to grant its approval of a pledge, the Audit Committee will take into account multiple factors it deems relevant in order to determine that the pledge is not significant from a corporate governance standpoint. |
Employment Agreements
Effective January 1, 2016, Messrs. LaRue and O'Brien entered into new employment agreements with Forest City Employer, LLC in connection with our conversion to REIT status. Each agreement continues for additional periods of one year until termination by the Company or the covered officer. The Compensation Committee approved the employment agreements with Messrs. LaRue and O'Brien to improve retention and to protect our Company in the event an individual executive decides to voluntarily terminate their employment for "good reason."
Under the agreements, Messrs. LaRue and O'Brien receive initial base salaries, subject to annual adjustments based upon the performance by the respective officers and the Company, as well as industry standards. They remain eligible to participate in the executive versions of the STIP and the LTIP in accordance with the terms established by our Compensation Committee from time to time.
The employment agreements provide for severance benefits if the executive's employment is terminated (i) by the Company for "Disability" or other than for "Cause", or (ii) by the executive for "Good Reason", as such terms are defined in the agreements. The employment agreements, however, do not contain change of control provisions nor do they provide for excessive perquisites or benefits. In addition, the agreements do not provide for tax gross-ups associated with severance payments. Please refer to the "Potential Payments upon Termination or Change of Control" section of this Form 10-K/A for a description of the severance benefits payable under the employment agreements.
Pursuant to the employment agreements, Messrs. LaRue and O'Brien each agreed to certain non-solicitation and non-competition provisions applicable during the terms of their respective employments with the Company and for a two-year period following thereafter. In addition, the employment agreements also contain customary non-disparagement and confidentiality provisions applicable during and after the respective terms of their employment with the Company.
Ronald A. Ratner is subject to an employment agreement with Forest City Employer, LLC, which became effective January 1, 2016. It provides for a minimum base salary and death benefit (equivalent to those provided to Messrs. LaRue and O'Brien) and is renewable for one-year periods unless otherwise terminated. In addition, the agreement contains a non-compete provision.
Duane F. Bishop and Brian J. Ratner do not have an employment agreement with us.
27
Severance Plan
Each of Ronald A. Ratner, Duane F. Bishop and Brian J. Ratner are eligible to participate in the Severance Plan, which provides severance protections for eligible full and part-time associates of the Company whose employment may be terminated in qualifying circumstances. Severance benefits under the Severance Plan include salary continuation benefits, which generally are calculated based on the associate's years of service at the time of a qualifying termination. An associate's entitlement to severance benefits under the Severance Plan is conditioned upon his or her release of claims against the Company.
In order to provide severance enhancements under the Severance Plan for Ronald A. Ratner, Duane F. Bishop and Brian J. Ratner, and certain other executives, on June 9, 2017, the Board of Directors of the Company approved a form of letter agreement between Forest City Employer, LLC and the other executives subject to the severance enhancements. Pursuant to the letter agreement, if the executive's employment is terminated prior to January 1, 2020 under circumstances that would entitle the executive to benefits under the Severance Plan, he or she will be provided with continuation benefits under the Severance Plan for a period of no less than 78 weeks.
Change in Control Agreements
On June 9, 2017, the Board of Directors approved Change of Control Agreements for Ronald A. Ratner, Duane F. Bishop and Brian J. Ratner.
The Change of Control Agreements have an initial term of two years, with automatic one-year annual renewals unless either party to the agreement provides written notice of an intent not to renew at least 180 days prior to the scheduled expiration of the Change of Control Agreement. However, in the event that a "change of control" of the Company (as defined in the Company's 1994 Stock Plan) occurs during the term of a Change of Control Agreement, the term of the agreement would automatically be extended for two years following the change of control.
The Change of Control Agreement provides for severance benefits if, within two years after a change of control, the executive's employment is terminated (i) by the Company for "Disability" or other than for "Cause", or (ii) by the executive for "Good Reason", as such terms are defined in the Change of Control Agreement. The Change of Control Agreements do not provide for tax gross-ups associated with severance payments. Please refer to the "Potential Payments upon Termination or Change of Control" section of this Form 10-K/A for a description of the severance benefits payable under the Change of Control Agreements.
The rights of an executive to receive severance benefits under the applicable Change of Control Agreement are conditioned upon the executive's release of claims against the Company and the executive's compliance with confidentiality and non-disparagement agreements and covenants restricting his or her competition with the Company and solicitation of Company employees or customers for one year after termination of employment.
Compensation Peer Group
In assessing pay competitiveness for our executive officers, we periodically review published compensation surveys for the real estate industry (reflecting data for both public and private companies), including the:
| • | NAREIT Compensation Survey; |
| • | National Multi-Housing Council's National Apartment Survey; |
| • | CEL & Associates National Real Estate Compensation and Benefits Survey; |
| • | Mercer's U.S. Real Estate Compensation Survey; and |
| • | Mercer's Benchmark Database. |
We use survey data as a guide to benchmark the pay practices and levels for our executives relative to jobs with similar duties as described in the surveys. We review base salary and short-term and long-term incentive opportunities to determine if our pay practices remain in line with our overall executive pay strategy and key objectives. We also review proxy statement pay data for a designated group of publicly-traded industry peers as compiled by Pearl Meyer. The Compensation Committee uses this data to help determine whether our pay practices are competitive and whether our mix of pay components is appropriate in light of our strategic plans.
We periodically review the companies in our peer group for their similarity in sales, asset size and/or market capitalization. Given that we have diversified real estate holdings, we select peer companies that represent a cross-section of the industry, including retail, office and residential development and management companies. The following companies were included in the compensation peer group based on our most recent review:
28
| Alexandria Real Estate Equities, Inc. | Equity Residential |
| Apartment Investment & Management Co. | Federal Realty Investment Trust |
| AvalonBay Communities, Inc. | Kimco Realty Corporation |
| Boston Properties, Inc. | The Macerich Company |
| CBL & Associates Properties, Inc. | SL Green Realty Corp. |
| DDR Corp. | UDR, Inc. |
| Duke Realty Corporation | Vornado Realty Trust |
When benchmarking CEO compensation, the Compensation Committee excludes peer companies whose pay practices are significantly higher than other peers.
The peer group used in February 2017 to set compensation levels was identical to the one used in 2016. Total assets for this peer group as of October 31, 2016 ranged between $6.1 billion and $21.2 billion, with our total assets of $8.5 billion being between the 25th and 50th percentiles of the peer group. The equity market capitalization for the peer group as of October 31, 2016 ranged from between $1.8 billion and $23.5 billion, with our market capitalization being below the 25th percentile. Our consolidated net revenues were at the peer group 25th percentile.
Plan Design as it Pertains to Risk
The Compensation Committee reviewed the results of a risk assessment at a meeting in February 2018. The risk assessment was conducted by representatives of human resources and senior management in connection with the requirements set forth by the SEC to assess whether our compensation programs, policies and systems encourage inappropriate risk-taking. The Compensation Committee's compensation consultant, Pearl Meyer, was also asked to review the prepared document and provided an independent analysis, the results of which concurred overall with management's assessment.
In conducting our analysis, we used materials provided by outside legal counsel and Pearl Meyer. We used a compensation risk scorecard to evaluate our executive compensation programs, policies and systems relative to a number of risk factors including: pay opportunity; pay mix; performance goals, metrics and targets; external reference to peers and market practices; and use of appropriate checks and balances. Based on this review, the Compensation Committee concluded that our overall compensation approaches, practices and systems do not create risks that are reasonably likely to have a material adverse effect on our Company. In making this determination, the Compensation Committee considered that our compensation approaches are in line with competitive and best practices, are based on multiple measures tied to appropriate business results and are structured to encourage a balanced focus on both short-term and long-term performance without encouraging inappropriate risk-taking on the part of participants. Several specific examples of programs and policies designed to discourage inappropriate risk-taking include the use of incentive award opportunity caps, the Executive Stock Ownership Policy, the Clawback Policy and the Securities Hedging and Pledging Policy. The Compensation Committee also periodically reviews tally sheets to gauge potential realizable values for NEOs under the various executive compensation programs, as well as potential award payouts under various termination of employment scenarios, and compliance with stock ownership requirements.
Tax Implications
Section 162(m) limits the amount of compensation provided to certain executive officers that publicly-traded companies can deduct to $1.0 million per "covered employee" unless it qualifies as "performance-based" (as defined under Section 162(m)). In order to qualify as "performance-based", compensation must be based solely on pre-established objective goals under a stockholder approved plan, with no positive discretion permitted when determining award payouts. In making compensation decisions in 2017 and prior years, the Compensation Committee often sought to structure our incentive compensation arrangements with the intention that such arrangements would qualify for an exemption from Section 162(m) as "performance-based". However, the Compensation Committee never adopted a policy that would have required all compensation to be deductible because the Committee wanted to preserve the ability to pay compensation to our executives in appropriate circumstances, even if such compensation would not be deductible under Section 162(m).
The Tax Cuts and Jobs Act, which was enacted on December 22, 2017, includes a number of significant changes to Section 162(m), such as the repeal of the performance-based compensation exemption and the expansion of the definition of "covered employees" (for example, by including the Chief Financial Officer and certain former NEOs as covered employees). As a result of these changes, except as otherwise provided in the transition relief provisions of the Tax Cuts and Jobs Act, compensation paid to any of our covered employees generally will not be deductible in 2018 or future years, to the extent that it exceeds $1 million. Due to uncertainties regarding the scope of transition relief under the Tax Cuts and Jobs Act, there can be no guarantee that any
29
compensation paid to our covered employees will be or remain exempt from Section 162(m) to the extent it exceed $1 million. In light of the sweeping nature of the changes to Section 162(m), the Committee expects that, after 2017, the tax-deductible portion of our executive compensation program will decrease.
Compensation Committee Report
The Compensation Committee (the "Compensation Committee") of the Board of Directors (the "Board") of Forest City Realty Trust, Inc., a Maryland corporation, has reviewed and discussed the Compensation Discussion & Analysis required by Item 402(b) of Regulation S-K with management and, based on such review and discussion, the Compensation Committee recommended to the Board that the Compensation Discussion & Analysis be included in the Form 10-K/A and proxy statement for Forest City Realty Trust Inc.'s 2018 Annual Meeting of Stockholders.
Mark S. Ordan (Chair)
Michelle Felman
Adam S. Metz
Gavin T Molinelli
William R. Roberts
The foregoing Compensation Committee Report shall not be deemed incorporated by reference by any general statement incorporating by reference this Form 10-K/A into any filing under the Securities Act of 1933 or under the Securities Exchange Act of 1934, except to the extent that we specifically incorporate the information by reference, and shall not otherwise be deemed filed under such Acts.
CEO Pay Ratio Disclosure
As required by Section 953(b) of the Dodd-Frank Wall Street Reform and Consumer Protection Act of 2010 and Item 402(u) of Regulation S-K, we are providing the following information with respect to our last completed fiscal year. The pay ratio information provided below is a reasonable estimate calculated in a manner consistent with Item 402(u) of Regulation S-K.
For our 2017 fiscal year:
| • | The median of the annual total compensation of all of our employees, excluding the CEO, was estimated to be $58,975; |
| • | The annual total compensation of our CEO, as reported in the Summary Compensation Table of this Form 10-K/A, was $5,354,489; and |
| • | The ratio of the annual total compensation of our CEO to the median of the annual total compensation of all other employees was estimated to be 91 to 1. |
In determining the pay ratio information provided above, we first identified our median employee for the 2017 fiscal year by using the following methodology, assumptions, adjustments and estimates, as permitted by Item 402(u) of Regulation S-K:
| • | We selected December 31, 2017 as the date upon which we would identify our median employee, and, from our tax and payroll records, we compiled a list of all full-time, part-time, temporary and seasonal employees who were employed on that date. |
•The number of employees on December 31, 2017 was 1,548 (1,473 full time and 75 part time).
| • | We used base salary paid during the 2017 fiscal year as a consistently applied compensation measure to identify our median employee from the remaining employees on the list. Compensation levels were annualized for any new hires during 2017. |
Once our median employee was identified in the manner described above, we calculated the annual total compensation of the median employee using the same methodology that we used to determine the annual total compensation of the CEO, as reported in the Summary Compensation Table.
The $58,975 annual total compensation of our median employee, as reported above, includes $56,265 in base wages, $1,000 bonus compensation, and $1,710 in all other compensation (consisting of 401(k) employer match) provided to the median employee with respect to fiscal 2017, all determined in accordance with methodology used for reporting the compensation of our NEOs in the Summary Compensation Table in this Form 10-K/A.
It should be noted that the pay ratio disclosure rules of Item 402(u) of Regulation S-K provide reporting companies with a great deal of flexibility in determining the methodology used to identify the median employee, in calculating the median employee's
30
annual total compensation and in estimating the ratio of the annual total compensation of the CEO to the median of the annual total compensation of all other employees. As such, our methodology may differ materially from the methodology used by other companies to prepare their pay ratio disclosures, which may contribute to a lack of comparability between our pay ratio and the pay ratio reported by other companies, including those within our industry.
Potential Payments upon Termination or Change of Control
The Company has entered into agreements and maintains plans and arrangements that require it to pay or provide compensation and benefits to the NEOs in the event of certain terminations of employment or a change in control. The estimated amount payable or provided to each of the NEOs in each situation is summarized below. These estimates are based on the assumption that the various triggering events occurred on the last day of 2017, along with other material assumptions noted below. The actual amounts that would be paid to these executives upon termination or a change in control can only be determined at the time the actual triggering event occurs.
The amount of compensation and benefits described below does not take into account compensation and benefits that a NEO has earned as of December 31, 2017 and prior to the applicable triggering event (unless those benefits are enhanced or accelerated). As a result, it does not provide information on the payout of the 2017 STIP or the Cash LTIP and performance shares for performance cycles that ended in 2017, as those awards were earned as of December 31, 2017, in accordance with their terms, regardless of whether the executive terminated employment or a change in control occurred on that date. Please refer to the “Non-Equity Incentive Plan Compensation” column of the “Summary Compensation Table” for the STIP and Cash LTIP payouts earned in 2017, and the “Option Exercises and Stock Vested” table for payouts under the performance shares earned in 2017. Please also refer to the “Nonqualified Deferred Compensation” table for a summary of each NEO’s deferred compensation balance.
| Name | Termination Event | Cash Severance | Cash-Based Long-Term Incentive Plan (1) | Unvested Stock Option (2) | Restricted Stock (3) | Performance Share Awards (4) | Other Benefits (5) | Total | ||||||||||||||
| David J. LaRue | Retirement | $ | — | $ | — | $ | — | $ | — | $ | — | $ | — | $ | — | |||||||
| Voluntary for Good Reason | $ | 3,874,238 | $ | 703,125 | $ | 160,503 | $ | 1,764,848 | $ | 802,514 | $ | — | $ | 7,305,227 | ||||||||
| Involuntary without Cause | $ | 3,874,238 | $ | 703,125 | $ | 160,503 | $ | 1,764,848 | $ | 802,514 | $ | — | $ | 7,305,227 | ||||||||
| Involuntary with Cause | $ | — | $ | — | $ | — | $ | — | $ | — | $ | — | $ | — | ||||||||
| Death | $ | — | $ | 1,054,688 | $ | — | $ | 1,764,848 | $ | 1,957,195 | $ | 3,750,000 | $ | 8,526,730 | ||||||||
| Disability | $ | 3,874,238 | $ | 1,054,688 | $ | — | $ | 1,764,848 | $ | 1,957,195 | $ | — | $ | 8,650,968 | ||||||||
| Change of Control | $ | — | At discretion of Committee | At discretion of Committee | At discretion of Committee | At discretion of Committee | $ | — | $ | — | ||||||||||||
| For Good Reason or Without Cause After Change in Control | $ | 3,874,238 | $ | 703,125 | $ | 160,503 | $ | 1,764,848 | $ | 802,514 | $ | — | $ | 7,305,227 | ||||||||
| Robert G. O'Brien | Retirement | $ | — | $ | — | $ | — | $ | — | $ | — | $ | — | $ | — | |||||||
| Voluntary for Good Reason | $ | 2,644,751 | $ | 291,500 | $ | 81,738 | $ | 1,236,682 | $ | 342,391 | $ | — | $ | 4,597,062 | ||||||||
| Involuntary without Cause | $ | 2,644,751 | $ | 291,500 | $ | 81,738 | $ | 1,236,682 | $ | 342,391 | $ | — | $ | 4,597,062 | ||||||||
| Involuntary with Cause | $ | — | $ | — | $ | — | $ | — | $ | — | $ | — | $ | — | ||||||||
| Death | $ | — | $ | 437,250 | $ | — | $ | 1,236,682 | $ | 821,085 | $ | 2,915,000 | $ | 5,410,016 | ||||||||
| Disability | $ | 2,644,751 | $ | 437,250 | $ | — | $ | 1,236,682 | $ | 821,085 | $ | — | $ | 5,139,767 | ||||||||
| Change of Control | $ | — | At discretion of Committee | At discretion of Committee | At discretion of Committee | At discretion of Committee | $ | — | $ | — | ||||||||||||
| For Good Reason or Without Cause After Change in Control | $ | 2,644,751 | $ | 291,500 | $ | 81,738 | $ | 1,236,682 | $ | 342,391 | $ | — | $ | 4,597,062 | ||||||||
31
| Name | Termination Event | Cash Severance | Cash-Based Long-Term Incentive Plan (1) | Unvested Stock Option (2) | Restricted Stock (3) | Performance Share Awards (4) | Other Benefits (5) | Total | ||||||||||||||
| Ronald A. Ratner | Retirement (6) | $ | — | $ | 375,000 | At discretion of Committee | At discretion of Committee | $ | 695,888 | $ | — | $ | 1,070,888 | |||||||||
| Voluntary for Good Reason | $ | — | $ | — | $ | — | $ | — | $ | — | $ | — | $ | — | ||||||||
| Involuntary without Cause | $ | 1,000,000 | $ | 250,000 | $ | 74,308 | $ | 649,506 | $ | 285,334 | $ | 72,355 | $ | 2,331,504 | ||||||||
| Involuntary with Cause | $ | — | $ | — | $ | — | $ | — | $ | — | $ | — | $ | — | ||||||||
| Death | $ | — | $ | 375,000 | $ | 74,308 | $ | 649,506 | $ | 695,888 | $ | 2,500,000 | $ | 4,294,703 | ||||||||
| Disability | $ | — | $ | 375,000 | $ | — | $ | 649,506 | $ | 695,888 | $ | — | $ | 1,720,395 | ||||||||
| Change of Control | $ | — | At discretion of Committee | At discretion of Committee | At discretion of Committee | At discretion of Committee | $ | — | $ | — | ||||||||||||
| For Good Reason or Without Cause After Change in Control | $ | 2,224,183 | $ | 250,000 | $ | 74,308 | $ | 649,506 | $ | 695,888 | $ | 97,355 | $ | 3,991,242 | ||||||||
| Duane F. Bishop | Retirement | $ | — | $ | — | $ | — | $ | — | $ | — | $ | — | $ | — | |||||||
| Voluntary for Good Reason | $ | — | $ | — | $ | — | $ | — | $ | — | $ | — | $ | — | ||||||||
| Involuntary without Cause | $ | 951,923 | $ | 250,000 | $ | — | $ | 558,519 | $ | 285,334 | $ | 72,355 | $ | 2,118,131 | ||||||||
| Involuntary with Cause | $ | — | $ | — | $ | — | $ | — | $ | — | $ | — | $ | — | ||||||||
| Death | $ | — | $ | 375,000 | $ | — | $ | 558,519 | $ | 695,888 | $ | — | $ | 1,629,407 | ||||||||
| Disability | $ | — | $ | 375,000 | $ | — | $ | 558,519 | $ | 695,888 | $ | — | $ | 1,629,407 | ||||||||
| Change of Control | $ | — | At discretion of Committee | At discretion of Committee | At discretion of Committee | At discretion of Committee | $ | — | $ | — | ||||||||||||
| For Good Reason or Without Cause After Change in Control | $ | 2,106,576 | $ | 250,000 | $ | — | $ | 558,519 | $ | 695,888 | $97,355 | $ | 3,708,339 | |||||||||
| Brian J. Ratner | Retirement | $ | — | $ | — | $ | — | $ | — | $ | — | $ | — | $ | — | |||||||
| Voluntary for Good Reason | $ | — | $ | — | $ | — | $ | — | $ | — | $ | — | $ | — | ||||||||
| Involuntary without Cause | $ | 872,806 | $ | 102,000 | $ | — | $ | 474,176 | $ | 474,176 | $ | 35,098 | $ | 1,958,256 | ||||||||
| Involuntary with Cause | $ | — | $ | — | $ | — | $ | — | $ | — | $ | — | $ | — | ||||||||
| Death | $ | — | $ | 154,529 | $ | — | $ | 474,176 | $ | 474,176 | $ | — | $ | 1,102,881 | ||||||||
| Disability | $ | — | $ | 154,529 | $ | — | $ | 474,176 | $ | 474,176 | $ | — | $ | 1,102,881 | ||||||||
| Change of Control | $ | — | At discretion of Committee | At discretion of Committee | At discretion of Committee | At discretion of Committee | $ | — | $ | — | ||||||||||||
| For Good Reason or Without Cause After Change in Control | $ | 1,701,199 | $ | 102,000 | $ | — | $ | 474,176 | $ | 474,176 | $ | 60,098 | $ | 2,811,650 | ||||||||
| (1) | The pro-rated cash LTIP is included at the "target" performance level for all termination events. | |||||||||||||||||||||
| (2) | For each option share that becomes vested, reflects the excess of the closing price of the underlying shares on December 29, 2017 over the exercise price of the stock option. | |||||||||||||||||||||
| (3) | Reflects the closing price of the underlying shares on December 29, 2017 multiplied by the number of shares that become vested. | |||||||||||||||||||||
| (4) | Reflects the closing price of the underlying shares on December 29, 2017 multiplied by the number of shares that become vested. The pro-rated performance shares that become vested are included at the "target" performance level for all termination events. | |||||||||||||||||||||
| (5) | Reflects the cost of the company of subsidized premiums for continued medical coverage during the applicable severance period, plus the value of outplacement benefit, as applicable. | |||||||||||||||||||||
| Also reflects the death benefit arrangement for the NEOs (other than Duane F. Bishop and Brian J. Ratner) equal to five years of salary continuation. | ||||||||||||||||||||||
| (6) | Ronald A. Ratner is the only NEO who is "retirement-eligible". | |||||||||||||||||||||
32
Summary of Various Plans and Arrangements
Following is a summary of the vesting provisions for our Cash LTIP awards and various outstanding equity awards held by the NEOs. None of these awards would automatically vest solely upon a change in control - in other words, the awards have a "double trigger" vesting feature.
| Award | Death and Disability | Retirement (age 65 with 5 years of service) | Termination without Cause | Termination for Good Reason |
| Cash LTIP and Performance Shares | Pro-rated payout at the “target” performance level if the NEO had completed at least one year of the performance period | Pro-rated payout at the “actual” performance level if the NEO had completed at least one year of the performance period | Pro-rated payout at the “actual” performance level if the NEO had completed at least one half of the performance period | Pro-rated payout at the “actual” performance level if the NEO had completed at least one year of the performance period (and with respect to Messrs. B. Ratner and Bishop, only if the termination for good reason occurs within 2 years after a change in control) |
| Restricted Stock | Accelerated vesting in full | Accelerated vesting in full with consent of the Compensation Committee | Accelerated vesting in full | Accelerated vesting in full (and with respect to Messrs. B. Ratner and Bishop, only if the termination for good reason occurs within 2 years after a change in control) |
| Stock Options | No vesting | Accelerated vesting in full with consent of the Compensation Committee | Accelerated vesting in full (and with respect to Messrs. B. Ratner and Bishop, only if the termination without cause occurs within 2 years after a change in control) | Accelerated vesting in full (and with respect to Messrs. B. Ratner and Bishop, only if the termination for good reason occurs within 2 years after a change in control) |
Severance Plan
Each of Ronald A. Ratner, Duane F. Bishop and Brian J. Ratner are eligible to participate in the Severance Plan, which provides severance protections for eligible full and part-time associates of the Company whose employment may be terminated in qualifying circumstances. Severance benefits under the Severance Plan include salary continuation benefits, which generally are calculated based on the associate’s years of service at the time of a qualifying termination and subsidized medical coverage. An associate’s entitlement to severance benefits under the Severance Plan is conditioned upon his or her release of claims against the Company.
In order to provide severance enhancements under the Severance Plan for Ronald A. Ratner and certain other executives, on June 9, 2017, the Board of Directors of the Company approved a form of letter agreement between Forest City Employer, LLC and the executives subject to the severance enhancements. Pursuant to the letter agreement, if the executive’s employment is terminated prior to January 1, 2020 under circumstances that would entitle the executive to benefits under the Severance Plan, he or she will be provided with continuation benefits under the Severance Plan for a period of no less than 78 weeks.
Employment Agreements
In lieu of the severance benefits provided under the severance plan, per the terms of their employment agreements, David J. LaRue and Robert G. O’Brien would be entitled to the following severance benefits in the event the executive’s employment is terminated (i) by the Company for “Disability” or other than for “Cause”, or (ii) by the executive for “Good Reason”, as such terms are defined in the employment agreements:
| • | Two times the sum of (i) his then current annual base salary, (ii) the average of the annual incentives payable to him under the STIP for the previous three full fiscal years prior to the date of termination, and (iii) an amount equal to 12 monthly |
33
medical and dental COBRA premiums and long-term care premiums based on the level of coverage in effect for him immediately prior to the date of termination;
| • | The annual incentive that would have been payable to him under the STIP for the fiscal year during which his termination occurs, prorated through the date of termination; |
| • | Provided that the termination of employment occurs after at least one-half of the applicable performance period has lapsed, pro-rata vesting of any outstanding performance-based long-term cash and equity incentive awards; and |
| • | Accelerated vesting of any outstanding and unvested restricted shares, restricted share units and stock options held by him (excluding equity awards of which the number of shares earned depends upon performance) with any vested stock options remaining outstanding for the remainder of their term. |
Change of Control Agreements
On June 9, 2017, the Board of Directors approved Change of Control Agreements for Ronald A. Ratner, Duane F. Bishop, and Brian J. Ratner.
The Change of Control Agreements have an initial term of two years, with automatic one-year annual renewals unless either party to the agreement provides written notice of an intent not to renew at least 180 days prior to the scheduled expiration of the Change of Control Agreement. However, in the event that a “change of control” of the Company occurs during the term of a Change of Control Agreement, the term of the agreement would automatically be extended for two years following the change of control.
The Change of Control Agreements provide for the following severance benefits if, within two years after a change of control, the executive’s employment is terminated (i) by the Company for “Disability” or other than for “Cause”, or (ii) by the executive for “Good Reason”, as such terms are defined in the Change of Control Agreement:
| • | A lump sum cash severance payment equal to two times the sum of the executive’s base salary and average annual bonus for the last three fiscal years prior to the change of control; |
| • | Continued medical, dental and vision insurance benefits for 18 months after termination, with the Company subsidizing 65% of the applicable COBRA premiums; |
| • | Provided that the termination of employment occurs after at least one-half of the applicable performance period has lapsed, pro-rata vesting of any outstanding performance-based short-term and long-term cash and equity incentive awards (but not in duplication of any vesting that the executive otherwise might receive in the event of his or her disability or retirement); |
| • | Accelerated vesting in full (without pro-ration) of any outstanding restricted share or restricted share unit awards that otherwise are subject to a vesting schedule based solely on continued service; and |
| • | Outplacement services for a period of up to one year after termination, at a cost to the Company of not more than $25,000. |
The Change of Control Agreements also provide that the Company will reimburse the executive for legal fees and expenses that may be incurred to enforce the Change of Control Agreement, if the executive prevails on at least one material claim.
Death Benefits
In the event of death while employed by the Company, the estates of each of our NEOs, with the exception of Duane F. Bishop and Brian J. Ratner, would receive a death benefit equal to five years’ worth of salary continuation.
34
Executive Compensation Tables
The following tables present compensation information for our Principal Executive Officer (“PEO”), Principal Financial Officer (“PFO”) and the three other most highly compensated executive officers (collectively, our “NEOs”).
Summary Compensation Table
| Name and Principal Position | Salary | Stock Awards | Non-Equity Incentive Plan Compensation | Change in Pension Value and Nonqualified Deferred Compensation Earnings | All Other Compensation | Total | ||||||||||||||||
| Year | ($) | ($)(3) | ($)(4) | ($)(5) | ($)(6) | ($) | ||||||||||||||||
| Annual | Long-Term | |||||||||||||||||||||
David J. LaRue President and Chief Executive Officer (PEO) | 2017 | $ | 750,000 | $ | 1,906,599 | $ | 1,328,096 | $ | 1,303,000 | $ | 10,718 | $ | 56,076 | $ | 5,354,489 | |||||||
| 2016 | $ | 735,577 | $ | 1,572,961 | $ | 1,104,431 | $ | 200,000 | $ | 12,828 | $ | 55,499 | $ | 3,681,296 | ||||||||
| 2015 | $ | 675,000 | $ | 3,478,514 | $ | 1,033,388 | $ | 375,000 | $ | 10,710 | $ | 54,799 | $ | 5,627,411 | ||||||||
| Robert G. O’Brien Executive Vice President and Chief Financial Officer (PFO) | 2017 | $ | 583,000 | $ | 790,418 | $ | 794,133 | $ | 631,000 | $ | 9,732 | $ | 57,458 | $ | 2,865,741 | |||||||
| 2016 | $ | 580,480 | $ | 671,101 | $ | 660,393 | $ | 100,000 | $ | 11,647 | $ | 55,621 | $ | 2,079,242 | ||||||||
| 2015 | $ | 563,327 | $ | 2,574,638 | $ | 667,139 | $ | 190,000 | $ | 9,725 | $ | 55,501 | $ | 4,060,330 | ||||||||
Ronald A. Ratner Executive Vice President | 2017 | $ | 500,000 | $ | 677,901 | $ | 681,075 | $ | 568,000 | $ | 23,865 | $ | 53,140 | $ | 2,503,981 | |||||||
| 2016 | $ | 500,000 | $ | 559,253 | $ | 566,375 | $ | 90,000 | $ | 28,560 | $ | 52,163 | $ | 1,796,351 | ||||||||
| 2015 | $ | 500,000 | $ | 1,413,259 | $ | 588,825 | $ | 155,000 | $ | 23,846 | $ | 52,163 | $ | 2,733,093 | ||||||||
Duane F. Bishop Executive Vice President and Chief Operating Officer (1) | 2017 | $ | 500,000 | $ | 677,901 | $ | 681,075 | $ | 241,000 | $ | 771 | $ | 47,565 | $ | 2,148,312 | |||||||
| 2016 | $ | 497,116 | $ | 559,253 | $ | 572,238 | $ | 38,144 | $ | 920 | $ | 50,642 | $ | 1,718,313 | ||||||||
Brian J. Ratner Executive Vice President (2) | 2017 | $ | 470,122 | $ | 337,369 | $ | 480,944 | $ | 257,000 | $ | 3,338 | $ | 47,374 | $ | 1,596,147 | |||||||
| (1) | Duane F. Bishop was not a Named Executive Officer in 2015. |
| (2) | Brian J. Ratner was not a Named Executive Officer in 2015 and 2016. |
| (3) | Represents the aggregate grant-date fair value of restricted stock awards and performance shares computed in accordance with accounting guidance for share-based payments. The grant-date fair value of restricted stock awards is equal to the closing price of the Common Stock on the date of grant. The grant-date fair value of performance shares, which have a market condition, is based on a Monte Carlo simulation. The amounts in this column for 2017 reflect the aggregate grant-date fair value of restricted stock awards granted to: David J. LaRue - $703,122; Robert G. O’Brien - $291,496; Ronald A. Ratner - $249,997; Duane F. Bishop - $249,997; and Brian J. Ratner - $157,569; and the aggregate grant-date fair value of performance shares granted to: David J. LaRue - $1,203,477; Robert G. O’Brien - $498,922; Ronald A. Ratner - $427,904; Duane F. Bishop - $427,904; and Brian J. Ratner - $179,800. At the maximum number of shares achievable, the aggregate grant-date fair value of the performance shares granted in 2017 would have been: David J. LaRue - $2,406,954; Robert G. O’Brien - $997,845; Ronald A. Ratner - $855,808; Duane F. Bishop - $855,808; and Brian J. Ratner - $359,601. |
| (4) | Represents the cash awards earned during the year shown under our STIP and LTIP by the NEO. The awards are paid in the following year. The STIP and LTIP programs are discussed in greater detail in the CD&A section of this Form 10-K/A. |
| (5) | Represents the amount of above-market earnings on the NEO’s nonqualified deferred compensation balances which are reported in the Nonqualified Deferred Compensation table included in this section of the Form 10-K/A. The earnings credited to each NEO’s nonqualified deferred compensation accounts were earned at the same rates as all other participants in the same plans. The amount of above-market earnings was computed to be the amount by which the actual earnings exceeded what the earnings would have been had we used 120% times the Federal Long-Term Rates published by the Internal Revenue Service in accordance with Section 1274(d) of the Internal Revenue Code. |
| (6) | The detail of All Other Compensation is shown in the following table: |
David J. LaRue | Robert G. O’Brien | Ronald A. Ratner | Duane F. Bishop | Brian J. Ratner | |||||||||||
| All Other Compensation | ($) | ($) | ($) | ($) | ($) | ||||||||||
| Matching contribution to 401(k) plan | $ | 3,500 | $ | 3,500 | $ | 3,500 | $ | 3,500 | $ | 3,500 | |||||
| Imputed income of group term life insurance | $ | 2,322 | $ | 3,564 | $ | 5,717 | $ | 2,322 | $ | 3,564 | |||||
| Auto allowance | $ | 12,960 | $ | 12,960 | $ | 12,960 | $ | 12,960 | $ | 12,960 | |||||
| Executive health subsidy | $ | 30,000 | $ | 30,000 | $ | 25,000 | $ | 25,833 | $ | 25,000 | |||||
| Long-term care insurance premiums | $ | 4,344 | $ | 4,484 | $ | 5,963 | $ | — | $ | 2,350 | |||||
| Parking allowance | $ | 2,950 | $ | 2,950 | $ | — | $ | 2,950 | $ | — | |||||
| Total | $ | 56,076 | $ | 57,458 | $ | 53,140 | $ | 47,565 | $ | 47,374 | |||||
35
Executive Compensation Tables (continued)
Our employment agreement with Ronald A. Ratner, effective January 1, 2016, provides for annual salary of $500,000. This agreement is automatically renewable for one-year terms unless otherwise terminated and provide that upon the death of such executive while in the employ of the Company, his beneficiary would receive an annual death benefit for five years equal to his annual base salary at time of death.
Our employment agreements with David J. LaRue and Robert G. O’Brien, effective January 1, 2016, are automatically renewable for one-year terms unless otherwise terminated. The agreements provide for an annual base salary of at least $675,000 for David J. LaRue and at least $566,500 for Robert G. O’Brien, subject to adjustments at the discretion of the Compensation Committee. In 2016, the Compensation Committee adjusted the base salary of David J. LaRue to $750,000, effective February 28, 2016, and the base salary of Robert G. O’Brien to $583,000, effective February 28, 2016. Both David J. LaRue and Robert G. O’Brien have separate death benefit agreements providing that upon their death while in the employ of the Company, their beneficiary will receive an annual death benefit for five years equal to their annual base salary at the time of death.
For a discussion of the terms of the awards in the following table, see the CD&A section of this Form 10-K/A.
Grants of Plan-Based Awards in 2017
Estimated Future Payouts Under Non-Equity Incentive Plan Awards (1) | Estimated Future Payouts Under Equity Incentive Plan Awards (2) | All Other Stock Awards: Number of Shares of Stock or Units | Grant Date Fair Value of Stock and Option Awards | ||||||||||||||||||
| Name | Grant Date | Threshold | Target | Maximum | Threshold | Target | Maximum | ||||||||||||||
| ($) | ($) | ($) | (#) | (#) | (#) | (#) | ($) (3) | ||||||||||||||
| David J. LaRue | 3/24/2017 | $ | — | $ | — | $ | — | 12,078 | 48,313 | 96,626 | — | $ | 1,203,477 | ||||||||
| 3/24/2017 | $ | — | $ | — | $ | — | — | — | — | 32,209 | $ | 703,122 | |||||||||
| STIP | $ | 243,750 | $ | 975,000 | $ | 1,950,000 | — | — | — | — | $ | — | |||||||||
| LTIP | $ | 527,344 | $ | 1,054,688 | $ | 2,109,375 | — | — | — | — | $ | — | |||||||||
| Robert G. O’Brien | 3/24/2017 | $ | — | $ | — | $ | — | 5,007 | 20,029 | 40,058 | — | $ | 498,922 | ||||||||
| 3/24/2017 | $ | — | $ | — | $ | — | — | — | — | 13,353 | $ | 291,496 | |||||||||
| STIP | $ | 145,750 | $ | 583,000 | $ | 1,166,000 | — | — | — | — | $ | — | |||||||||
| LTIP | $ | 218,625 | $ | 437,250 | $ | 874,500 | — | — | — | — | $ | — | |||||||||
| Ronald A. Ratner | 3/24/2017 | $ | — | $ | — | $ | — | 4,294 | 17,178 | 34,356 | — | $ | 427,904 | ||||||||
3/24/2017 | $ | — | $ | — | $ | — | — | — | — | 11,452 | $ | 249,997 | |||||||||
| STIP | $ | 125,000 | $ | 500,000 | $ | 1,000,000 | — | — | — | — | $ | — | |||||||||
| LTIP | $ | 125,000 | $ | 375,000 | $ | 750,000 | — | — | — | — | $ | — | |||||||||
| Duane F. Bishop | 3/24/2017 | $ | — | $ | — | $ | — | 4,294 | 17,178 | 34,356 | — | $ | 427,904 | ||||||||
3/24/2017 | $ | — | $ | — | $ | — | — | — | — | 11,452 | $ | 249,997 | |||||||||
| STIP | $ | 125,000 | $ | 500,000 | $ | 1,000,000 | — | — | — | — | $ | — | |||||||||
| LTIP | $ | 187,500 | $ | 375,000 | $ | 750,000 | — | — | — | — | $ | — | |||||||||
| Brian J. Ratner | 3/24/2017 | $ | — | $ | — | $ | — | 1,804 | 7,218 | 14,436 | — | $ | 179,800 | ||||||||
3/24/2017 | $ | — | $ | — | $ | — | — | — | — | 7,218 | $ | 157,569 | |||||||||
| STIP | $ | 94,554 | $ | 378,216 | $ | 756,432 | — | — | — | — | $ | — | |||||||||
| LTIP | $ | 78,794 | $ | 157,588 | $ | 315,177 | — | — | — | — | $ | — | |||||||||
| (1) | The STIP cash award for the year ended December 31, 2017 for David J. LaRue, Robert G. O’Brien, Ronald A. Ratner and Duane F. Bishop was based on two equally weighted Company-wide metrics: Operating FFO per share and Net Debt to Adjusted EBITDA. For Brian J. Ratner, 37.5% of his STIP award was based on Operating FFO per share, 37.5% on Net Debt to Adjusted EBITDA, and 25% on performance relative to individual objectives. The threshold payment of 25% of a target dollar award for each Company-wide metric was based on achievement of 90% of the goal for that metric. The maximum award for each of the metrics is 200% of the target. The LTIP cash award is for the performance period from January 1, 2017 through December 31, 2019. The award will be determined by two equally weighted Company-wide metrics: Cumulative FFO per share and Compound Annual Growth in Net Asset Value per share. The threshold payment of 50% of a target dollar award for each Company-wide metric is based on achievement of 90% of the goal for that metric. The maximum award for each of the metrics is 200% of the target. |
| (2) | The amounts shown in these columns relate to performance shares granted in 2017 for the performance period from January 1, 2017 through December 31, 2019. The performance shares were granted at target and the ultimate number of shares earned can range from 0% to 200% depending upon the degree the performance goals are met at the end of the performance period. The performance metric is TSR relative to our peers. The threshold level represents 25% of target and the maximum level represents 200% of target. |
| (3) | The grant-date fair value of restricted stock awards was $21.83 per share, which equaled the closing price of our Common Stock on the date of grant. The grant-date fair value of the performance share grant (at target) was based on a Monte Carlo simulation and was calculated to be $24.91. |
36
Executive Compensation Tables (continued)
Outstanding Equity Awards at Fiscal Year-End
| Name | Grant Date | Option Awards (1) | Stock Awards | ||||||||||||
| Number of Securities Underlying Unexercised Options Exercisable as of December 31, 2017 | Number of Securities Underlying Unexercised Options Unexercisable as of December 31, 2017 | Option Exercise Price | Option Expiration Date | Number of Shares or Units of Stock That Have Not Vested | Market Value of Shares or Units of Stock That Have Not Vested | Equity Incentive Plan Awards | |||||||||
| Number of Unearned Shares, Units or Other Rights That Have Not Vested | Market or Payout Value of Unearned Shares, Units or Other Rights That Have Not Vested | ||||||||||||||
| (#) | (#) | ($) | (#) (2) | ($) (3) | (#) (4) | ($) (5) | |||||||||
| David J. LaRue | 6/18/2008 | 28,059 | — | $ | 36.38 | 6/18/2018 | — | $ | — | — | $ | — | |||
| 4/14/2010 | 16,638 | — | $ | 15.89 | 4/14/2020 | — | $ | — | — | $ | — | ||||
| 4/13/2011 | 64,277 | — | $ | 17.72 | 4/13/2021 | — | $ | — | — | $ | — | ||||
| 4/11/2012 | 77,945 | — | $ | 14.74 | 4/11/2022 | — | $ | — | — | $ | — | ||||
| 4/8/2013 | 65,630 | — | $ | 17.60 | 4/8/2023 | — | $ | — | — | $ | — | ||||
| 3/28/2014 | 31,045 | 31,045 | $ | 18.73 | 3/28/2024 | — | $ | — | — | $ | — | ||||
| 3/26/2015 | — | — | $ | — | — | 16,450 | $ | 396,445 | 12,502 | $ | 301,298 | ||||
| 3/27/2015 | — | — | $ | — | — | — | $ | — | — | $ | — | ||||
| 3/23/2016 | — | — | $ | — | — | 25,184 | $ | 606,934 | 12,591 | $ | 303,443 | ||||
| 3/24/2017 | — | — | $ | — | — | 32,209 | $ | 776,237 | 96,626 | $ | 2,328,687 | ||||
| Robert G. O’Brien | 6/18/2008 | 28,059 | — | $ | 36.38 | 6/18/2018 | — | $ | — | — | $ | — | |||
| 4/21/2009 | 7,011 | — | $ | 7.80 | 4/21/2019 | — | $ | — | — | $ | — | ||||
| 4/14/2010 | 26,893 | — | $ | 15.89 | 4/14/2020 | — | $ | — | — | $ | — | ||||
| 4/13/2011 | 38,547 | — | $ | 17.72 | 4/13/2021 | — | $ | — | — | $ | — | ||||
| 4/11/2012 | 39,694 | — | $ | 14.74 | 4/11/2022 | — | $ | — | — | $ | — | ||||
| 4/8/2013 | 33,422 | — | $ | 17.60 | 4/8/2023 | — | $ | — | — | $ | — | ||||
| 3/28/2014 | 15,810 | 15,810 | $ | 18.73 | 3/28/2024 | 11,345 | $ | 273,415 | — | $ | — | ||||
| 3/26/2015 | — | — | $ | — | — | 16,301 | $ | 392,854 | 5,829 | $ | 140,479 | ||||
| 3/27/2015 | — | — | $ | — | — | — | $ | — | — | $ | — | ||||
| 3/23/2016 | — | — | $ | — | — | 10,745 | $ | 258,955 | 5,372 | $ | 129,465 | ||||
| 3/24/2017 | — | — | $ | — | — | 13,353 | $ | 321,807 | 40,058 | $ | 965,398 | ||||
| Ronald A. Ratner | 6/18/2008 | 17,721 | — | $ | 36.38 | 6/18/2018 | — | $ | — | — | $ | — | |||
| 4/21/2009 | 21,797 | — | $ | 7.80 | 4/21/2019 | — | $ | — | — | $ | — | ||||
| 4/14/2010 | 36,635 | — | $ | 15.89 | 4/14/2020 | — | $ | — | — | $ | — | ||||
| 4/13/2011 | 24,103 | — | $ | 17.72 | 4/13/2021 | — | $ | — | — | $ | — | ||||
| 4/11/2012 | 32,477 | — | $ | 14.74 | 4/11/2022 | — | $ | — | — | $ | — | ||||
| 4/8/2013 | 30,384 | — | $ | 17.60 | 4/8/2023 | — | $ | — | — | $ | — | ||||
| 3/28/2014 | 14,372 | 14,373 | $ | 18.73 | 3/28/2024 | — | $ | — | — | $ | — | ||||
| 3/26/2015 | — | — | $ | — | — | 6,770 | $ | 163,157 | 5,145 | $ | 123,995 | ||||
| 3/27/2015 | — | — | $ | — | — | — | $ | — | — | $ | — | ||||
| 3/23/2016 | — | — | $ | — | — | 8,954 | $ | 215,791 | 4,477 | $ | 107,896 | ||||
| 3/24/2017 | — | — | $ | — | — | 11,452 | $ | 275,993 | 34,356 | $ | 827,980 | ||||
| Duane F. Bishop | 6/18/2008 | 7,107 | — | $ | 36.38 | 6/18/2018 | — | $ | — | — | $ | — | |||
| 3/28/2014 | — | — | $ | — | — | 4,149 | $ | 99,991 | — | $ | — | ||||
| 3/26/2015 | — | — | $ | — | — | 2,963 | $ | 71,408 | 2,252 | $ | 54,273 | ||||
| 3/27/2015 | — | — | $ | — | — | — | $ | — | — | $ | — | ||||
| 3/23/2016 | — | — | $ | — | — | 8,954 | $ | 215,791 | 4,477 | $ | 107,896 | ||||
| 3/24/2017 | — | — | $ | — | — | 11,452 | $ | 275,993 | 34,356 | $ | 827,980 | ||||
| Brian J. Ratner | 6/18/2008 | 9,492 | — | $ | 36.38 | 6/18/2018 | — | $ | — | — | $ | — | |||
| 4/21/2009 | 4,746 | — | $ | 7.80 | 4/21/2019 | — | $ | — | — | $ | — | ||||
| 4/14/2010 | 7,913 | — | $ | 15.89 | 4/14/2020 | — | $ | — | — | $ | — | ||||
| 4/13/2011 | 9,041 | — | $ | 17.72 | 4/13/2021 | — | $ | — | — | $ | — | ||||
| 3/28/2014 | — | — | $ | — | — | 4,004 | $ | 96,496 | — | $ | — | ||||
| 3/26/2015 | — | — | $ | — | — | 3,138 | $ | 75,626 | 2,385 | $ | 57,479 | ||||
| 3/27/2015 | — | — | $ | — | — | — | $ | — | — | $ | — | ||||
| 3/23/2016 | — | — | $ | — | — | 5,480 | $ | 132,068 | 1,826 | $ | 44,007 | ||||
| 3/24/2017 | — | — | $ | — | — | 7,218 | $ | 173,954 | 14,436 | $ | 347,908 | ||||
| (1) | All the option awards shown vest 25% at the second anniversary, 25% at the third anniversary and 50% at the fourth anniversary of the grant date. |
| (2) | The shares in this column represent restricted stock awards. For the 2014 grants, shares vest 25% at the second anniversary, 25% at the third anniversary and 50% at the fourth anniversary of the grant date. For the 2015, 2016 and 2017 grants, shares vest 25% at the first anniversary, 25% at the second anniversary and 50% at the third anniversary of the grant date. |
| (3) | The market value of shares in this column is based on the closing price of our Common Stock of $24.10 on December 29, 2017. |
37
Executive Compensation Tables (continued)
| (4) | The shares in this column represent the underlying shares of Common Stock issuable upon the payout of performance shares. The March 28, 2014 and March 27, 2015 grants vested in February 2018 and are presented here at their actual payout of 0% of target because the minimum performance goals for these grants were not achieved. The March 26, 2015 grant vested in February 2018 and is presented here at its actual payout of 38% of target. The March 23, 2016 grant assumes a payout at threshold (at 25% of target). The March 24, 2017 grant assumes a payout at maximum (at 200% of target). The performance shares granted on March 28, 2014 have a performance period from January 1, 2014 through December 31, 2017, the performance shares granted on March 26 and 27, 2015 have a performance period from January 1, 2015 through December 31, 2017, the performance shares granted on March 23, 2016 have a performance period from January 1, 2016 through December 31, 2018 and the performance shares granted on March 24, 2017 have a performance period from January 1, 2017 through December 31, 2019. The vesting and actual payout of the performance shares will be determined after the end of the respective performance periods. |
| (5) | This column reports the product of the number of unearned performance shares multiplied by the closing market price of our Common Stock of $24.10 on December 29, 2017. |
Option Exercises and Stock Vested
For the year ended December 31, 2017:
| Option Awards | Stock Awards | |||||||
| Name | Number of Shares Acquired on Exercise | Value Realized on Exercise | Number of Shares Acquired on Vesting | Value Realized on Vesting | ||||
| (#) | ($) | (#) | ($) (1) | |||||
| David J. LaRue | 10,255 | $ | 96,534 | 16,619 | $ | 361,618 | ||
| Robert G. O’Brien | — | $ | — | 41,552 | $ | 916,338 | ||
Ronald A. Ratner | — | $ | — | 6,369 | $ | 138,618 | ||
| Duane F. Bishop | — | $ | — | 10,198 | $ | 223,549 | ||
| Brian J. Ratner | — | $ | — | 9,669 | $ | 212,435 | ||
| (1) | The value realized on vesting represents the product of the number of shares vested and the closing price of the Common Stock on the vesting date. |
Nonqualified Deferred Compensation
For the year ended December 31, 2017:
| Name | Executive Contributions in Last FY | Registrant Contributions in Last FY | Aggregate Earnings in Last FY | Aggregate Withdrawals/ Distributions | Aggregate Balance at Last FYE | ||||||||||
($) (1) | ($) (2) | ($) (3) | ($) | ($) (4) | |||||||||||
| David J. LaRue | $ | — | $ | — | $ | 37,332 | $ | — | $ | 872,982 | |||||
| Robert G. O’Brien | $ | — | $ | — | $ | 33,905 | $ | — | $ | 793,065 | |||||
| Ronald A. Ratner | $ | — | $ | — | $ | 83,183 | $ | — | $ | 1,947,086 | |||||
Duane F. Bishop | $ | — | $ | — | $ | 2,703 | $ | — | $ | 63,846 | |||||
Brian J. Ratner | $ | — | $ | — | $ | 11,680 | $ | — | $ | 275,023 | |||||
| (1) | The NEOs may defer a portion of their annual salary, bonus or short-term incentive compensation, up to a maximum of $100,000 per year, under our elective deferred compensation plan for executives. Amounts deferred under this plan earn interest at a rate equal to the average of the Moody’s Rates. The rate is updated every calendar quarter using the first published Moody’s rates of the new quarter. Interest rates ranged from 4.27% to 4.55% during the year ended December 31, 2017. Interest is credited to the executives’ accounts biweekly and compounded quarterly. The cumulative deferrals and earnings thereon will be paid to the NEOs in accordance with the elections they made defining the time of payment and form of payment. |
(2) The NEOs participate in the Unfunded Nonqualified Supplemental Retirement Plan for a select group of executives and other members of management. The plan provides for the accrual of a discretionary contribution by us to the executive’s account plus interest on the account balance. The Company suspended the discretionary contributions in 2008, and there have been no contributions since that time. Interest is credited as of the end of the fiscal year and is computed on the beginning-of-year account balance at a rate equal to the average of the quarterly Moody’s Rates used in our elective deferred compensation plan for executives (see note 1). The interest rate used for the year ended December 31, 2017 was 4.42%. Participants in the plan become 50% vested in the accumulated benefits after 10 years of service and then after each of the next five years of service until becoming 100% vested after 15 years of service. All of the NEOs are participants and are 100% vested. Benefits are payable in installments over a 10-year period upon the later of the date of termination or the attainment of age 60.
(3) The amount of earnings reported in this column that are deemed to be above-market earnings are reported in the Summary Compensation Table, and are as follows: David J. LaRue - $10,718; Robert G. O’Brien - $9,732; Ronald A. Ratner - $23,865; Duane F. Bishop - $771; and Brian J. Ratner - $3,338.
(4) Prior years’ accumulation of executive contributions and our contributions included in this column have been reported in prior years’ Summary Compensation Tables to the extent these NEOs were required to be disclosed. Accumulated earnings from prior years included in this column have not been reported in prior years’ Summary Compensation Tables, except for above-market earnings.
38
Item 12. Security Ownership of Certain Beneficial Owners and Management and Related Stockholder Matters
Security Ownership of Certain Beneficial Owners and Management
The following table sets forth the beneficial ownership of shares of Common Stock as of January 31, 2018 of each director and the other NEOs (as named in the "Summary Compensation Table" included elsewhere in this Form 10-K/A), as well as all directors and executive officers as a group. Unless otherwise indicated, each beneficial owner listed below has sole voting and dispositive power of the securities that he or she owns.
| Number of Shares of Common Stock Beneficially Owned | |||||
| Name | Common Stock | Percent of Class | |||
| Kenneth J. Bacon | 41,657 | (1) | 0.02 | % | |
| Z. Jamie Behar | 5,217 | (2) | — | % | |
| Michelle Felman | — | (3) | — | % | |
| Jerome J. Lande | — | (3)(4) | — | % | |
| David J. LaRue | 721,754 | (5) | 0.27 | % | |
| Adam S. Metz | — | (3) | — | % | |
| Gavin T. Molinelli | — | (3)(6) | — | % | |
| Marran H. Ogilvie | — | (3) | — | % | |
| Mark S. Ordan | — | (3) | — | % | |
| James A. Ratner | 6,639,164 | (7) | 2.49 | % | |
| William R. Roberts | — | (3) | — | % | |
| Robert A. Schriesheim | — | (3) | — | % | |
| OTHER NAMED EXECUTIVE OFFICERS | |||||
| Ronald A. Ratner | 7,734,069 | (8) | 2.90 | % | |
| Brian J. Ratner | 4,669,876 | (9) | 1.75 | % | |
| Robert G. O'Brien | 575,197 | (10) | 0.22 | % | |
| Duane F. Bishop | 60,287 | (11) | 0.02 | % | |
ALL DIRECTORS AND EXECUTIVE OFFICERS AS A GROUP (20 in number) | 18,571,863 | (12) | 6.96 | % | |
| (1) | Includes 5,726 shares of restricted stock and 13,988 shares that were issuable upon the exercise of stock options became exercisable at January 31, 2018. |
| (2) | Includes 5,217 shares of restricted stock. |
| (3) | Newly appointed director as of April 16, 2018. |
| (4) | Jerome J. Lande was appointed to our Board pursuant to the Scopia Agreement. Mr. Lande is a partner of Scopia but does not have voting or investment power over and disclaims beneficial ownership of the Common Stock owned by Scopia. |
| (5) | David J. LaRue has beneficial ownership of 47,872 shares of Common Stock held in a trust for which he has sole power of voting and disposition and 9,734 shares held in custodial accounts. Includes 73,843 shares of restricted stock and 314,639 shares that were issuable upon the exercise of stock options vested at January 31, 2018 or that will vest within 60 days thereafter. |
| (6) | Gavin T. Molinelli was appointed to our Board pursuant to the Starboard Agreement. Mr. Molinelli is a partner of Starboard but does not have voting or investment power over and disclaims beneficial ownership of the Common Stock owned by Starboard. |
| (7) | James A. Ratner has beneficial ownership of 6,296,922 shares of Common Stock held in trusts for which he is trustee and has shared power of voting and disposition. Mr. Ratner has beneficial ownership of 123,204 shares held in trusts for which he is trust advisor and has shared power of voting and disposition. Includes 27,176 shares of restricted stock and 191,862 shares that were issuable upon the exercise of stock options vested at January 31, 2018 or that will vest within 60 days thereafter. |
| (8) | Ronald A. Ratner has beneficial ownership of 6,901,370 shares of Common Stock held in trusts: 5,882,250 shares for which he is trustee and has shared power of voting and disposition and 1,019,120 shares for which he has sole power of voting and disposition. Mr. Ratner has beneficial ownership of 613,661 shares held in trusts for which he is trust advisor and has shared power of voting and disposition. Includes 27,176 shares of restricted stock and 191,862 shares that were issuable upon the exercise of stock options vested at January 31, 2018 or that will vest within 60 days thereafter. |
| (9) | Brian J. Ratner has beneficial ownership of 4,481,562 shares of Common Stock held in trusts and foundations: 4,457,383 shares for which he is trustee and has shared power of voting and disposition and 24,179 shares for which he has sole power of voting and disposition. Mr. Ratner has beneficial ownership of 137,282 shares held in trusts for which he is trust advisor and has shared power of voting and disposition. Includes 19,840 shares of restricted stock and 31,192 shares that were issuable upon the exercise of stock options vested at January 31, 2018 or that will vest within 60 days thereafter. |
| (10) | Robert G. O’Brien has beneficial ownership of 85,950 shares of Common Stock held in trusts: 48,307 shares for which he is trustee and has sole power of voting and disposition and 37,643 shares for which he is trust advisor and has shared power of voting and disposition. Includes 51,744 shares of restricted stock and 205,246 shares that were issuable upon the exercise of stock options vested at January 31, 2018 or that will vest within 60 days thereafter. |
| (11) | Includes 27,518 shares of restricted stock and 7,107 shares that were issuable upon the exercise of stock options vested at January 31, 2018 or that will vest within 60 days thereafter. |
| (12) | These shares of Common Stock represent all the shares in which beneficial ownership is claimed by these persons. Shares for which beneficial ownership have been claimed by more than one person have been counted only once in this category. Includes 282,610 shares of restricted stock and 987,443 shares that were issuable upon the exercise of stock options vested at January 31, 2018 or that will vest within 60 days thereafter. |
39
Unless otherwise indicated, the following table sets forth the security ownership as of December 31, 2017 of all other persons, known to the Company, who beneficially own more than 5% of our Common Stock.
| Name and Address | Shares of Common Stock Beneficially Owned | Percent of Class |
| The Vanguard Group | 38,149,693(1) | 14.30% |
| 100 Vanguard Boulevard | ||
| Malvern, PA 19355 | ||
| Scopia Capital Management LP | 22,087,803(2) | 8.28% |
| 152 West 57th Street, 33rd Floor | ||
| New York, NY 10019 | ||
| BlackRock, Inc. | 16,920,433(3) | 6.34% |
| 55 East 52nd Street | ||
| New York, NY 10055 | ||
| Starboard Value LP | 15,272,223(4) | 5.73% |
| 777 Third Avenue, 18th Floor | ||
| New York, NY 10017 | ||
| Senator Investment Group LP | 15,000,000(5) | 5.62% |
| 510 Madison Avenue, 28th Floor | ||
| New York, NY 10022 | ||
| Vanguard Specialized Funds - Vanguard REIT Index Fund | 14,369,205(6) | 5.39% |
| 100 Vanguard Boulevard | ||
| Malvern, PA 19355 | ||
| (1) | The Vanguard Group has sole voting power of 419,079 shares, sole dispositive power of 37,707,916 shares, shared voting power of 324,317 shares and shared dispositive power of 441,777 shares. The number of shares represents shares beneficially owned at December 31, 2017 as disclosed in Schedule 13G/A filed with the SEC by the principal security holder. |
| (2) | Scopia Capital Management LP has shared voting and dispositive power of 22,087,803 shares. The number of shares represents shares beneficially owned at April 17, 2018 as disclosed in Schedule 13D/A filed with the SEC by the principal security holder. |
| (3) | BlackRock, Inc. has sole voting power of 15,905,596 shares and sole dispositive power of 16,920,433 shares. The number of shares represents shares beneficially owned at December 31, 2017 as disclosed in Schedule 13G/A filed with the SEC by the principal security holder. |
| (4) | Starboard Value LP has sole voting and dispositive power of 15,272,223 shares. The number of shares represents shares beneficially owned at March 26, 2018 as disclosed in Schedule 13D filed with the SEC by the principal security holder. |
| (5) | Senator Investment Group LP has shared voting and dispositive power of 15,000,000 shares. The number of shares represents shares beneficially owned at December 31, 2017 as disclosed in Schedule 13G/A filed with the SEC by the principal security holder. |
| (6) | Vanguard Specialized Funds - Vanguard REIT Index Fund has sole voting power of 14,369,205 shares. The number of shares represents shares beneficially owned at December 31, 2017 as disclosed in Schedule 13G/A filed with the SEC by the principal security holder. |
40
Equity Compensation Plan Information
The information presented in the following table is as of December 31, 2017:
| Plan category | Number of securities to be issued upon exercise of outstanding options, warrants and rights | Weighted-average exercise price of outstanding options, warrants and rights | Number of securities remaining available for future issuance under equity compensation plans (excluding securities reflected in the first column) | |
Equity compensation plan approved by security holders (1) | 1,817,758 | $19.62 | 5,499,394 | |
Equity compensation plan not approved by security holders (2) | 5,736 | — | — | |
| Total | 1,823,494 | 5,499,394 | ||
| (1) | Our Stock Plan was approved by the stockholders in 1994 and was last amended and restated by stockholder approval on June 13, 2013, further amended on December 17, 2013 and assumed by Forest City Realty Trust, Inc., effective January 1, 2016. The Compensation Committee of the Board of Directors administers the plan. Under the plan, we may award stock options, restricted shares/units and performance shares to our employees and nonemployee directors. The maximum number of shares that may be awarded under the plan is 21,750,000. The maximum award to an individual during any calendar year is 500,000 stock options and 500,000 of the aggregate performance-based restricted shares and performance shares. Also, the aggregate grant-date fair value of awards granted to a nonemployee director during any calendar year is limited to $250,000. Anti-dilution provisions in the plan adjust the share maximums, outstanding awarded options and related exercise prices for stock splits or stock dividends. Each option grant has a maximum term of 10 years. The Compensation Committee determines vesting schedules for each award. |
| (2) | This represents stock units accumulated by our nonemployee directors under their deferred compensation plan. Their plan is described in the “Director Compensation” section of this Form 10-K/A. |
41
Item 13. Certain Relationships and Related Transactions, and Director Independence
Certain Relationships & Related Transactions
We require each of our directors and executive officers to complete a questionnaire on an annual basis, which includes questions regarding related person transactions. In addition, as a component of our internal control process, we require certain members of management to complete a related party questionnaire on a quarterly basis, requesting identification of and information regarding any known related party transactions. We have a formal policy with respect to related person transactions that requires the Corporate Governance and Nominating Committee to review and approve any transaction greater than $120,000 in which we were or will be a participant and in which a related person had or will have a direct or indirect material interest.
Related persons include any of our executive officers, directors and their immediate family members, any stockholder owning in excess of 5% of our Common Stock and any family members of any such stockholder or an entity in which any of the foregoing has a substantial ownership interest. In reviewing and approving a related person transaction, the Corporate Governance and Nominating Committee considers, among other things, if the transaction is on terms comparable to those that could be obtained in arm’s length dealings with an unrelated third party. All related person transactions are disclosed to the Corporate Governance and Nominating Committee.
The Compensation Committee, comprised solely of independent directors and which uses the advice of outside counsel and compensation consultants, annually reviews the salaries and incentives paid to the executive officers disclosed under the section entitled “Family Relationships” below.
The transactions with Bruce C. Ratner and his affiliates set forth below were contemplated as part of the restructuring of the ownership interests held by Bruce C. Ratner and the conditions under which such transactions would take place were provided for in a master contribution and sale agreement (the “Master Contribution and Sale Agreement”). Because of the importance and nature of the Master Contribution and Sale Agreement, the transaction was specifically reviewed and approved during the year ended January 31, 2007 by a special committee of the Board comprised solely of independent directors.
The Reclassification Agreement
On December 5, 2016, we entered into a Reclassification Agreement with RMS. Pursuant to the Reclassification Agreement, on June 12, 2017 (the “Effective Time”), each share of Class B Common Stock issued and outstanding immediately prior to the Effective Time was reclassified and exchanged into 1.31 shares of Common Stock, with a right to cash in lieu of fractional shares (the “Reclassification”). Consistent with the Reclassification Agreement, RMS converted 18,788,163 shares of Class B Common Stock into 24,612,495 shares of Common Stock.
The Reimbursement Agreement
On October 24, 2016, we entered into a Reimbursement Agreement with RMS, Limited Partnership (“RMS”), a limited partnership comprised of the Ratner, Miller and Shafran family interests, with seven individual general partner positions, currently consisting of: Samuel H. Miller, Co-Chairman Emeritus; Charles A. Ratner; Ronald A. Ratner, our Executive Vice President and former director; Brian J. Ratner, our Executive Vice President and former director; Deborah Ratner Salzberg, our Executive Vice President and former director; Joan K. Shafran, a former director; and Abraham Miller. Charles A. Ratner, James A. Ratner, our Chairman of the Board, and Ronald A. Ratner are brothers. Albert B. Ratner, our Co-Chairman Emeritus, is the father of Brian J. Ratner and Deborah Ratner Salzberg and is first cousin to Charles A. Ratner, James A. Ratner, Ronald A. Ratner, Bruce C. Ratner and Joan K. Shafran. Samuel H. Miller was married to Ruth Ratner Miller (now deceased), a sister of Albert B. Ratner, and is the father of Abraham Miller. On the terms and subject to the conditions set forth therein, we agreed to reimburse RMS, including its officers, directors, employees, beneficiaries, trustees, representatives and agents (each a "Reimbursed Person” and together, the “Reimbursed Persons”) for certain costs, fees, expenses, losses, damages and liabilities incurred in connection with the Reclassification. Specifically, we agreed to reimburse the Reimbursed Persons for reasonable and documented fees and out-of-pocket expenses of RMS’s financial, legal and public relations advisors incurred in evaluating and negotiating the Reclassification. In addition, we agreed to reimburse the Reimbursed Persons for (i) reasonable costs and expenses incurred by each Reimbursed Person in connection with any Proceeding (as defined in the Reimbursement Agreement) to which such Reimbursed Person is a party or otherwise involved in and (ii) any losses, damages or liabilities actually and reasonably suffered or incurred in any such Proceeding by a Reimbursed Person. During the year ended December 31, 2017, we incurred and paid an aggregate amount of $4,060,000 in reimbursements to RMS.
Stockholder Agreements
On March 22, 2018, Forest City Realty Trust, Inc. entered into agreements with Starboard Value LP and certain of its affiliates (collectively, “Starboard”) (the “Starboard Agreement”) and with Scopia Capital Management LP and certain of its affiliates (collectively, “Scopia”) (the “Scopia Agreement” and together with the Starboard Agreement, the “Agreements”). Pursuant to the
42
Agreements with Starboard and Scopia, each of which is a beneficial owner of greater than five percent of our Common Stock, we agreed to reimburse Starboard and Scopia for their reasonable, documented out-of-pocket fees and expenses incurred in connection with their involvement at the Company, including, but not limited to, the negotiation and the execution of the respective Agreements, provided that such reimbursement will not exceed $200,000 in the aggregate for either Starboard or Scopia. To date, we have reimbursed Starboard in the amount of $187,912.
Family Relationships
Deborah Ratner Salzberg, an Executive Vice President, is the sister of Brian J. Ratner, an Executive Vice President and a named executive officer, and the daughter of Albert B. Ratner, who serves as a Co-Chairman Emeritus of our Board. During the year ended December 31, 2017, Deborah Ratner Salzberg earned a salary of $453,071, an annual incentive (STIP) of $515,273 and a long term incentive (LTIP) of $225,684. Ms. Ratner Salzberg is also eligible for equity awards on the same basis as other senior management.
James LaRue, brother of David J. LaRue, our President, Chief Executive Officer and Director, is employed as Director - Asset Management of Forest City Commercial Management, LLC, one of our subsidiaries. James LaRue is not an executive officer of the Company. The compensation, perquisites and benefits provided to James LaRue were substantially comparable to those provided to other employees with similar qualifications, responsibilities and experience. During the year ended December 31, 2017, James LaRue earned compensation, including perquisites and benefits, paid by the Company in excess of $120,000, but less than the lowest compensated NEO as disclosed in the “Summary Compensation Table” included in this Form 10-K/A.
Employment Agreements
In addition to the employment agreements with certain NEOs as disclosed in the narrative section to the Summary Compensation Table elsewhere in this Form 10-K/A, we currently have employment agreements with Albert B. Ratner, our Co-Chairman Emeritus, Samuel H. Miller, our Co-Chairman Emeritus, and Bruce C. Ratner, who served as an Executive Vice President through December 31, 2017.
The employment agreements with Albert B. Ratner and Samuel H. Miller provided for annual salaries of $425,000 and $375,000, respectively, through December 31, 2017. Effective January 1, 2018, Messrs. A. Ratner and S. Miller entered into new employment agreements that provide for annual salaries of $50,000 and that upon death while such individual is actively employed with the Company, Messrs. A. Ratner’s and S. Miller’s beneficiary(ies) will receive annual death benefits of $475,000 and $425,000, respectively, for five years. The employment agreements are renewable annually. Although Messrs. A. Ratner, and S. Miller do not participate in a formal bonus plan, an annual bonus may be awarded on a discretionary basis as reviewed by the Compensation Committee. During the year ended December 31, 2017, Messrs. A. Ratner and S. Miller did not receive any cash bonuses or equity-based awards. Each of the foregoing individuals was also eligible for benefits and perquisites on the same basis as other senior management.
The employment agreement with Bruce C. Ratner provided for an annual salary of $450,000 through December 31, 2017 and was amended, effective January 1, 2018, to provide for an annual salary of $50,000. The employment agreement, as amended, is renewable annually. Under the employment agreement, as amended, Mr. Ratner is not entitled to participate in the Company’s bonus plans or receive equity-based awards, but may receive benefits commensurate with other Company associates.
Non-Compete Arrangement
Pursuant to his employment agreement, as amended, Bruce C. Ratner agreed that during his employment with us, and for a two-year period following thereafter, he will not engage in any activity that competes with our business. If we terminate Mr. Ratner’s employment without cause, the two-year period will be reduced to one year. Mr. Ratner also agreed that he will not directly or indirectly induce any of our employees, or any of our affiliates, to terminate their employment or other relationships with us and will not employ or offer employment to any person who was employed by us or our subsidiaries unless such person has ceased to be employed by us or our affiliates for a period of at least one year. Mr. Ratner owns, and will continue to own, a certain property that was not transferred to us. This property may be managed, developed, expanded, operated and sold independently of our business. Should Mr. Ratner sell the property, he may purchase additional property, to effectuate a Section 1031 tax deferred exchange under the Internal Revenue Code, with the prior approval of the Audit Committee. Except for this property or any potential purchase of property to effect a tax-deferred transaction or any transaction approved by the Audit Committee, Mr. Ratner will engage in all business activities of the type conducted by us only through and on behalf of us, as long as he is employed by us.
Transactions with Bruce C. Ratner and His Affiliates
During the fiscal year ended January 31, 2007, we entered into the Master Contribution and Sale Agreement with Bruce C. Ratner pursuant to which the parties agreed to restructure their ownership interests in a total of 30 retail, office and residential operating
43
properties and certain service companies that were owned jointly by us and Mr. Ratner. Pursuant to the Master Contribution and Sale Agreement, Mr. Ratner, certain entities and individuals affiliated with him, including members of his family and/or trusts for the benefit of such family members (“BCR Entities”), and certain entities affiliated with Forest City (“FCE Entities”) either contributed their interests in these operating properties and service companies to Forest City Master Associates III, LLC (“Master III”), a limited liability company that is owned jointly by the FCE Entities and the BCR Entities but is controlled by us, or in some cases, the BCR Entities transferred their interests for cash consideration.
In connection with the Master Contribution and Sale Agreement, the parties and their respective affiliates also entered into several additional related agreements, including a Registration Rights Agreement, a Tax Protection Agreement and the Master III Operating Agreement. Under the Master III Operating Agreement, we issued Mr. Ratner and the BCR Entities 3,894,232 Common Units (“Units”) in Master III. Certain of the BCR Entities exchanged 247,477 of the Units for cash and shares of our Common Stock in July 2008, 673,565 of the Units for shares of our Common Stock in June 2014, 1,032,402 of the Units for shares of our Common Stock in September 2015, 142,879 of the Units for shares of our Common Stock in March 2017 and 686,865 of the Units as part of an in-kind exchange transaction for 500 Sterling Place in August 2017, as more fully described below. At December 31, 2017, 1,111,044 of the Units were outstanding.
In August 2017, certain BCR Entities exchanged 686,865 of the Units for an in-kind distribution of the Company’s ownership interest in 500 Sterling Place, a previously 100% owned apartment community in Brooklyn, New York. The agreed upon value of the exchanged property was based on an independent third party appraisal and the parties agreed to use $20 as the basis in determining the number of Units to be exchanged. In September 2017, the Company made a $222,000 payment to the BCR entities for the overpayment of estimated closing costs related to the August 2017 in-kind exchange transaction.
During the year ended December 31, 2017, the BCR Entities received a distribution preference pursuant to the Master Contribution and Sale Agreement in the amount of $669,520 as a result of the dividends paid on shares of the Company’s Common Stock, of which amount, Mr. Ratner’s interest was $358,368.
Under the terms of the Master Contribution and Sale Agreement, we agreed with Mr. Ratner and the BCR Entities to a method for valuing and possibly restructuring certain properties that were under development. Each of the development projects shall remain owned jointly until the individual development project has been completed and achieves “stabilization.” When a development project achieves “stabilization,” it will be valued, either by negotiation, through arbitration or by obtaining a bona fide third-party offer. Once each project’s value has been determined, we may, in our discretion, cause that project to be contributed to Master III in exchange for additional Units, sold to Master III for cash, sold to the third party or remain jointly owned by us and Mr. Ratner.
During 2008, two of the development properties, New York Times, an office building located in Manhattan, New York, and Twelve MetroTech Center, an office building located in Brooklyn, New York, achieved stabilization, and, in accordance with the terms of the Master Contribution and Sale Agreement, we caused the respective FCE Entities to acquire the interest of the BCR Entities in those two properties for cash. Under the terms of the redemption agreements, the applicable BCR Entities assigned their interests in the two projects to the respective FCE Entities and will receive approximately $121,000,000 over a 15-year period.
During the year ended December 31, 2017, the Company made a payment of $997,410 which represented Mr. Ratner’s share of the retainage release of a development fee earned (and accrued by the Company) during 2005 on a fee project for building the Kings County Supreme Court for New York City. The retainage was being held until the final certificate of occupancy was issued. The Company obtained the final certificate of occupancy and collected the retainage during the year ended December 31, 2017, at which time Mr. Ratner’s share was distributed to the BCR Entities, of which amount, Mr. Ratner’s interest was $99,747.
In January 2016, we closed on the sale of 625 Fulton Avenue, a development site in Brooklyn, New York. Pursuant to the terms of the Master Contribution and Sale Agreement, we were required to make a $6,238,000 tax indemnity payment to the BCR Entities, of which amount Mr. Ratner will receive $124,760. The payment, which was accrued during the three months ending March 31, 2016, was paid in four quarterly installments of $1,559,382 commencing in April 2016, with the last installment paid in January 2017.
In January 2017, we closed on the sale of Shops at Bruckner Boulevard, a retail shopping center in Bronx, New York. Pursuant to the terms of the Master Contribution and Sale Agreement, we were required to make a $482,000 tax indemnity payment to the BCR Entities. The payment, which accrued during the three months ended March 31, 2017, was paid in full during the year ended December 31, 2017.
One remaining development property, the air rights for any future residential vertical development at East River Plaza, continues to be owned or otherwise pursued jointly by the relevant FCE Entities and BCR Entities. The operating agreement related to such property generally requires the FCE Entities to provide all equity contributions for the property on behalf of the FCE Entities and BCR Entities and entitles the FCE Entities to a preferred return on the outstanding balance of such advances made on behalf of the BCR Entities prior to the BCR Entities sharing in cash distributions.
44
Transactions with BrownFlynn, Ltd.
Since 2012, we have engaged BrownFlynn, Ltd. (“BrownFlynn”) for various services relating to our corporate social responsibility activities, communications and reporting. Barbara Brown, sister of Robert G. O’Brien, our Executive Vice President and Chief Financial Officer, is a principal and co-owner of BrownFlynn. The aggregate amount due and expected to be due to BrownFlynn since the beginning of the Company’s 2017 fiscal year is approximately $337,910.
Life Insurance Transaction
During 2017, Charles A. Ratner, brother of Ronald A. Ratner, our Executive Vice President - Development, and James A. Ratner, our Chairman of the Board, purchased a life insurance policy from the Company for $826,000, which represented the book value and net cash surrender value of the policy at the time of the transaction.
Board Independence
The Board of Directors is composed of a majority of independent directors and the Board has affirmatively determined that all directors who served as members of our Audit, Compensation, and Corporate Governance and Nominating Committees during 2017 or presently are independent after considering all applicable standards for independence established by the NYSE for membership on such committees.
The Board unanimously determined that the non-employee directors who served during 2017, with the exception of James A. Ratner, including Messrs. Anton, Bacon, Cowen, Esposito, Macnab and Ross and Mss. Behar, Detrick and Harmon, as well as all directors who were appointed to our Board effective April 16, 2018, including Messrs. Lande, Metz, Molinelli, Ordan, Roberts and Schriesheim, and Mss. Felman and Ogilvie are neither affiliated persons of ours, nor do they have any material relationship with us (other than their role as our director) and, therefore, qualify as independent directors within the meaning of all applicable laws and regulations, including the independence standards of the NYSE.
In making these independence determinations, the Board considered all of the factors that automatically compromise director independence as specified in the respective independence standards of the SEC and the NYSE, including but not limited to charitable contributions to any charitable organization in which such director serves as a trustee or director, and determined that none of those conditions existed. In addition, the Board considered whether any direct or indirect material relationship, beyond those factors that automatically compromise director independence, existed between either us and/or our management and/or any of their respective affiliates or family members or otherwise between each director or any family member of such director or any entity with which such director or family member of such director was employed or otherwise affiliated. For those directors for whom the Board determined there was a relationship, with respect to each of the most recent three completed fiscal years, the Board evaluated the following:
| • | Matching charitable contributions to various non-profit organizations with which Messrs. Anton, Bacon, Cowen, Esposito, Macnab or Ross, or Mss. Behar, Detrick or Harmon are affiliated and determined that the amount of the contribution to any such organization in each of the past three fiscal years was below the limits set forth in our independence standards. |
The Board affirmatively determined, for those directors identified as independent above, that any relationship that existed was not material and did not compromise that director’s independence from management. Accordingly, all of these directors are independent under SEC and NYSE requirements, as well as our own Corporate Governance Guidelines.
45
Item 14. Principal Accountant Fees and Services
The Audit Committee of the Board of Directors considers and pre-approves any audit, non-audit and tax services to be performed by our independent registered public accounting firm. The Audit Committee has considered whether the non-audit services are compatible with maintaining the independence of the independent registered public accounting firm.
The aggregate fees billed (or expected to be billed) to us for professional services rendered by PricewaterhouseCoopers LLP, all of which have been approved by the Audit Committee, for the years ended December 31, 2017 and 2016, are as follows:
| Years Ended | ||||||
| December 31, 2017 | December 31, 2016 | |||||
| Audit fees | $ | 4,139,900 | $ | 4,163,400 | ||
| Audit-related fees | 243,000 | 419,606 | ||||
| Tax fees | 469,579 | 661,205 | ||||
| All other fees | 7,096 | 7,096 | ||||
| Total | $ | 4,859,575 | $ | 5,251,307 | ||
Audit fees: Professional services relating to audits of our annual consolidated financial statements and internal controls over financial reporting, reviews of our quarterly SEC filings, issuance of consents and income tax provision procedures.
Audit-related fees: Audit and other assurance services relating to individual real estate properties that are required primarily under mortgage or partnership agreements, procedures in connection with the adoption of the new revenue recognition standard (2017 - $160,000) and accounting related REIT conversion services (2016 - $70,106). There were no fees for services relating to financial information design and implementation.
Tax fees: Professional services relating primarily to tax compliance, consulting fees and tax related REIT conversion services (2016 - $163,388).
All other fees: Other fees include annual subscriptions to accounting research tools.
46
PART IV
Item 15. Exhibits and Financial Statement Schedules
The following exhibits are included in this Form 10-K/A (and are numbered in accordance with Item 601 of Regulations S-K).
| * | Filed herewith. |
47
SIGNATURES
Pursuant to the requirements of Section 13 or 15(d) of the Securities Exchange Act of 1934, the Registrant has duly caused this report to be signed on its behalf by the undersigned, thereunto duly authorized.
FOREST CITY REALTY TRUST, INC. (Registrant) | ||||
| Date: | April 30, 2018 | BY: | /s/ David J. LaRue | |
| David J. LaRue, President and Chief Executive Officer | ||||