Wells Fargo Commercial Mortgage Trust 2015-C30
Filed: 20 Jul 15, 12:00am
| FREE WRITING PROSPECTUS | ||
| FILED PURSUANT TO RULE 433 | ||
| REGISTRATION FILE NO.: 333-195164-11 | ||

Free Writing Prospectus
Structural and Collateral Term Sheet
$740,314,909
(Approximate Aggregate Cut-off Date Balance of Mortgage Pool)
$644,999,000
(Approximate Aggregate Principal Balance of Offered Certificates)
Wells Fargo Commercial Mortgage Trust 2015-C30
as Issuing Entity
Wells Fargo Commercial Mortgage Securities, Inc.
as Depositor
Wells Fargo Bank, National Association
Rialto Mortgage Finance, LLC
C-III Commercial Mortgage LLC
Basis Real Estate Capital II, LLC
National Cooperative Bank, N.A.
as Sponsors and Mortgage Loan Sellers
Commercial Mortgage Pass-Through Certificates
Series 2015-C30
July 20, 2015
| WELLS FARGO SECURITIES | |||
| Lead Manager and Sole Bookrunner | |||
| Deutsche Bank Securities Co-Manager | Morgan Stanley Co-Manager |
STATEMENT REGARDING THIS FREE WRITING PROSPECTUS
The depositor has filed a registration statement (including a prospectus) with the Securities and Exchange Commission (‘‘SEC’’) (SEC File No. 333-195164) for the offering to which this communication relates. Before you invest, you should read the prospectus in the registration statement and other documents the depositor has filed with the SEC for more complete information about the depositor, the issuing entity and this offering. You may get these documents for free by visiting EDGAR on the SEC Web site at www.sec.gov. Alternatively, the depositor, any underwriter, or any dealer participating in the offering will arrange to send you the prospectus after filing if you request it by calling toll free 1-800-745-2063 (8 a.m. – 5 p.m. EST) or by emailing wfs.cmbs@wellsfargo.com.
Nothing in this document constitutes an offer of securities for sale in any jurisdiction where the offer or sale is not permitted. The information contained herein is preliminary as of the date hereof, supersedes any such information previously delivered to you and will be superseded by any such information subsequently delivered and ultimately by the final prospectus relating to the securities. These materials are subject to change, completion, supplement or amendment from time to time.
This free writing prospectus has been prepared by the Underwriters for information purposes only and does not constitute, in whole or in part, a prospectus for the purposes of Directive 2003/71/EC (as amended) and/or Part VI of the Financial Services and Markets Act 2000 as amended or other offering document.
STATEMENT REGARDING ASSUMPTIONS AS TO SECURITIES, PRICING ESTIMATES AND OTHER INFORMATION
The attached information contains certain tables and other statistical analyses (the “Computational Materials”) which have been prepared in reliance upon information furnished by the Mortgage Loan Sellers. Numerous assumptions were used in preparing the Computational Materials, which may or may not be reflected herein. As such, no assurance can be given as to the Computational Materials’ accuracy, appropriateness or completeness in any particular context; or as to whether the Computational Materials and/or the assumptions upon which they are based reflect present market conditions or future market performance. The Computational Materials should not be construed as either projections or predictions or as legal, tax, financial or accounting advice. You should consult your own counsel, accountant and other advisors as to the legal, tax, business, financial and related aspects of a purchase of these securities. Any weighted average lives, yields and principal payment periods shown in the Computational Materials are based on prepayment and/or loss assumptions, and changes in such prepayment and/or loss assumptions may dramatically affect such weighted average lives, yields and principal payment periods. In addition, it is possible that prepayments or losses on the underlying assets will occur at rates higher or lower than the rates shown in the attached Computational Materials. The specific characteristics of the securities may differ from those shown in the Computational Materials due to differences between the final underlying assets and the preliminary underlying assets used in preparing the Computational Materials. The principal amount and designation of any security described in the Computational Materials are subject to change prior to issuance. None of Wells Fargo Securities, LLC, Deutsche Bank Securities Inc. or Morgan Stanley & Co. LLC, or any of their respective affiliates, make any representation or warranty as to the actual rate or timing of payments or losses on any of the underlying assets or the payments or yield on the securities. The information in this presentation is based upon management forecasts and reflects prevailing conditions and management’s views as of this date, all of which are subject to change. In preparing this presentation, we have relied upon and assumed, without independent verification, the accuracy and completeness of all information available from public sources or which was provided to us by or on behalf of the Mortgage Loan Sellers or which was otherwise reviewed by us.
This free writing prospectus contains certain forward-looking statements. If and when included in this free writing prospectus, the words “expects”, “intends”, “anticipates”, “estimates” and analogous expressions and all statements that are not historical facts, including statements about our beliefs or expectations, are intended to identify forward-looking statements. Any forward-looking statements are made subject to risks and uncertainties which could cause actual results to differ materially from those stated. Those risks and uncertainties include, among other things, declines in general economic and business conditions, increased competition, changes in demographics, changes in political and social conditions, regulatory initiatives and changes in customer preferences, many of which are beyond our control and the control of any other person or entity related to this offering. The forward-looking statements made in this free writing prospectus are made as of the date stated on the cover. We have no obligation to update or revise any forward-looking statement.
Wells Fargo Securities is the trade name for the capital markets and investment banking services of Wells Fargo & Company and its subsidiaries, including but not limited to Wells Fargo Securities, LLC, a member of NYSE, FINRA, NFA and SIPC, Wells Fargo Prime Services, LLC, a member of FINRA, NFA and SIPC, and Wells Fargo Bank, N.A. Wells Fargo Securities, LLC and Wells Fargo Prime Services, LLC are distinct entities from affiliated banks and thrifts.
IMPORTANT NOTICE REGARDING THE OFFERED CERTIFICATES
The Offered Certificates referred to in these materials and the asset pool backing them are subject to modification or revision (including the possibility that one or more classes of certificates may be split, combined or eliminated at any time prior to issuance or availability of a final prospectus) and are offered on a “when, as and if issued” basis. Prospective investors should understand that, when considering the purchase of the Offered Certificates, a contract of sale will come into being no sooner than the date on which the relevant class of certificates has been priced and the underwriters have confirmed the allocation of certificates to be made to investors; any “indications of interest” expressed by any prospective investor, and any “soft circles” generated by the underwriters, will not create binding contractual obligations for such prospective investors, on the one hand, or the underwriters, the depositor or any of their respective agents or affiliates, on the other hand.
As a result of the foregoing, a prospective investor may commit to purchase certificates that have characteristics that may change, and each prospective investor is advised that all or a portion of the certificates referred to in these materials may be issued without all or certain of the characteristics described in these materials. The underwriters’ obligation to sell certificates to any prospective investor is conditioned on the certificates and the transaction having the characteristics described in these materials. If the underwriters determine that a condition is not satisfied in any material respect, such prospective investor will be notified, and neither the depositor nor the underwriters will have any obligation to such prospective investor to deliver any portion of the Offered Certificates which such prospective investor has committed to purchase, and there will be no liability between the underwriters, the depositor or any of their respective agents or affiliates, on the one hand, and such prospective investor, on the other hand, as a consequence of the non-delivery.
Each prospective investor has requested that the underwriters provide to such prospective investor information in connection with such prospective investor’s consideration of the purchase of the certificates described in these materials. These materials are being provided to each prospective investor for informative purposes only in response to such prospective investor’s specific request. The underwriters described in these materials may from time to time perform investment banking services for, or solicit investment banking business from, any company named in these materials. The underwriters and/or their affiliates or respective employees may from time to time have a long or short position in any security or contract discussed in these materials.
The information contained herein supersedes any previous such information delivered to any prospective investor and will be superseded by information delivered to such prospective investor prior to the time of sale.
IMPORTANT NOTICE RELATING TO AUTOMATICALLY-GENERATED EMAIL DISCLAIMERS
Any legends, disclaimers or other notices that may appear at the bottom of any email communication to which this free writing prospectus is attached relating to (1) these materials not constituting an offer (or a solicitation of an offer), (2) no representation that these materials are accurate or complete and may not be updated or (3) these materials possibly being confidential, are not applicable to these materials and should be disregarded. Such legends, disclaimers or other notices have been automatically generated as a result of these materials having been sent via Bloomberg or another system.
THE INFORMATION IN THIS STRUCTURAL AND COLLATERAL TERM SHEET IS NOT COMPLETE AND MAY BE AMENDED PRIOR TO THE TIME OF SALE. THIS TERM SHEET IS NOT AN OFFER TO SELL THESE SECURITIES AND IT IS NOT A SOLICITATION OF AN OFFER TO BUY THESE SECURITIES IN ANY JURISDICTION WHERE THE OFFER OR SALE IS NOT PERMITTED.
| 2 |
| Wells Fargo Commercial Mortgage Trust 2015-C30 | Certificate Structure |
I. Certificate Structure
| Class | Expected Ratings (Fitch/Moody’s/Morningstar)(1) | Approximate Initial Certificate Principal Balance or Notional Amount(2) | Approx. Initial | Pass-Through Rate Description | Weighted Average Life (Years)(4) | Expected Principal Window(4) | Certificate Principal to Value Ratio(5) | Certificate Principal U/W NOI Debt Yield(6) | |
| Offered Certificates | |||||||||
| A-1 | AAAsf/Aaa(sf)/AAA | $38,940,000 | 30.000% | (7) | 2.79 | 09/15 - 06/20 | 44.5% | 18.1% | |
| A-2 | AAAsf/Aaa(sf)/AAA | $4,385,000 | 30.000% | (7) | 4.84 | 06/20 - 06/20 | 44.5% | 18.1% | |
| A-3 | AAAsf/Aaa(sf)/AAA | $150,000,000 | 30.000% | (7) | 9.83 | 03/25 - 06/25 | 44.5% | 18.1% | |
| A-4 | AAAsf/Aaa(sf)/AAA | $263,131,000 | (8) | 30.000% | (7) | 9.92 | 06/25 - 07/25 | 44.5% | 18.1% |
| A-SB | AAAsf/Aaa(sf)/AAA | $61,764,000 | 30.000% | (7) | 7.31 | 06/20 - 03/25 | 44.5% | 18.1% | |
| A-S(9) | AAAsf/Aa2(sf)/AAA | $51,822,000 | 23.000% | (7) | 9.93 | 07/25 - 07/25 | 49.0% | 16.5% | |
| X-A | AAAsf/NR/AAA | $570,042,000 | (10) | N/A | Variable(11) | N/A | N/A | N/A | N/A |
| X-B | NR/NR/AAA | $74,957,000 | (12) | N/A | Variable(13) | N/A | N/A | N/A | N/A |
| B(9) | AA-sf/NR/AA- | $43,493,000 | 17.125% | (7) | 9.93 | 07/25 - 07/25 | 52.7% | 15.3% | |
| C(9) | A-sf/NR/A- | $31,464,000 | 12.875% | (7) | 9.93 | 07/25 - 07/25 | 55.4% | 14.5% | |
| PEX(9) | A-sf/NR/A- | $126,779,000 | 12.875% | (7) | 9.93 | 07/25 - 07/25 | 55.4% | 14.5% | |
| Non-Offered Certificates | |||||||||
| X-E | BB-sf/NR/AAA | $16,657,000 | (14) | N/A | Variable(15) | N/A | N/A | N/A | N/A |
| X-FG | NR/NR/AAA | $16,657,000 | (16) | N/A | Variable(17) | N/A | N/A | N/A | N/A |
| X-H | NR/NR/AAA | $22,209,909 | (18) | N/A | Variable(19) | N/A | N/A | N/A | N/A |
| A-4FL | AAAsf/Aaa(sf)/AAA(20) | $263,131,000 | (21)(22) | 30.000% | LIBOR plus [ ](23) | 9.92 | 06/25 - 07/25 | 44.5% | 18.1% |
| A-4FX | AAAsf/Aaa(sf)/AAA | $0 | (21)(22) | 30.000% | (7) | 9.92 | 06/25 - 07/25 | 44.5% | 18.1% |
| D | BBB-sf/NR/BBB- | $39,792,000 | 7.500% | (7) | 9.93 | 07/25 - 08/25 | 58.9% | 13.7% | |
| E | BB-sf/NR/BB- | $16,657,000 | 5.250% | (7) | 10.01 | 08/25 - 08/25 | 60.3% | 13.4% | |
| F | B-sf/NR/B+ | $8,328,000 | 4.125% | (7) | 10.01 | 08/25 - 08/25 | 61.0% | 13.2% | |
| G | NR/NR/B- | $8,329,000 | 3.000% | (7) | 10.01 | 08/25 - 08/25 | 61.7% | 13.1% | |
| H | NR/NR/NR | $22,209,909 | 0.000% | (7) | 10.01 | 08/25 - 08/25 | 63.6% | 12.7% | |
| Notes: | |
| (1) | The expected ratings presented are those of Fitch Ratings, Inc. (“Fitch”), Moody’s Investors Service, Inc. (“Moody’s”) and Morningstar Credit Ratings, LLC (“Morningstar”) which the depositor hired to rate the offered certificates. One or more other nationally recognized statistical rating organizations that were not hired by the depositor may use information they receive pursuant to Rule 17g-5 under the Securities Exchange Act of 1934, as amended (the “Exchange Act”) or otherwise, to rate or provide market reports and/or published commentary related to the offered certificates. We cannot assure you as to what ratings a non-hired nationally recognized statistical rating organization would assign or that its reports will not express differing, possibly negative, views of the mortgage loans and/or the offered certificates. The ratings of each class of offered certificates address the likelihood of the timely distribution of interest and, except in the case of the Class X-A and Class X-B certificates, the ultimate distribution of principal due on those classes on or before the Rated Final Distribution Date. See “Risk Factors—Risks Related to the Offered Certificates—Ratings of the Certificates Have Substantial Limitations” and “Ratings” in the free writing prospectus, dated July 20, 2015 (the “Free Writing Prospectus”). Fitch and Moody’s have informed us that the “sf” designation in their ratings represents an identifier for structured finance product ratings. |
| (2) | The principal balances and notional amounts set forth in the table are approximate. The actual initial principal balances and notional amounts may be larger or smaller depending on the aggregate cut-off date principal balance of the mortgage loans definitively included in the pool of mortgage loans, which aggregate cut-off date principal balance may be as much as 5% larger or smaller than the amount presented in the Free Writing Prospectus. |
| (3) | The approximate initial credit support with respect to the Class A-1, A-2, A-3, A-4, A-4FL, A-4FX and A-SB Certificates represents the approximate credit enhancement for the Class A-1, A-2, A-3, A-4, A-4FL, A-4FX and A-SB Certificates in the aggregate. The percentage indicated under the column “Approx. Initial Credit Support” with respect to the Class C Certificates and the Class PEX Certificates represents the approximate credit support for the Class C regular interest. |
| (4) | Weighted Average Lives and Expected Principal Windows are calculated based on an assumed prepayment rate of 0% CPR and the “Structuring Assumptions” described on Annex B to the Free Writing Prospectus. |
| (5) | The Certificate Principal to Value Ratio for each Class of Certificates (other than the Class A-1, A-2, A-3, A-4, A-4FL, A-4FX, A-SB and PEX Certificates) is calculated as the product of (a) the weighted average Cut-off Date LTV Ratio for the mortgage loans and (b) a fraction, the numerator of which is the total initial Certificate Balance of such Class of Certificates and all Classes of Principal Balance Certificates (other than the Class PEX Certificates) senior to such Class of Certificates and the denominator of which is the total initial Certificate Balance of all of the Principal Balance Certificates (other than the Class PEX Certificates). The Certificate Principal to Value Ratios for each of the Class A-1, A-2, A-3, A-4, A-4FL, A-4FX and A-SB Certificates are calculated in the aggregate for those Classes as if they were a single Class and is calculated as the product of (a) the weighted average Cut-off Date LTV Ratio for the mortgage loans and (b) a fraction, the numerator of which is the total initial aggregate Certificate Balances of such Classes of Certificates and the denominator of which is the total initial Certificate Balance of all of the Principal Balance Certificates (other than the Class PEX Certificates). The Certificate Principal to Value Ratio of the Class PEX Certificates is equal to the Certificate Principal to Value Ratio of the Class C Certificates. In any event, however, excess mortgaged property value associated with a mortgage loan will not be available to offset losses on any other mortgage loan (unless such mortgage loans are cross-collateralized and the cross-collateralization remains in effect). |
| (6) | The Certificate Principal U/W NOI Debt Yield for each Class of Certificates (other than the Class A-1, A-2, A-3, A-4, A-4FL, A-4FX, A-SB and PEX Certificates) is calculated as the product of (a) the weighted average U/W NOI Debt Yield for the mortgage loans and (b) a fraction, the numerator of which is the total initial Certificate Balance of all of the Classes of Principal Balance Certificates (other than the Class PEX Certificates) and the denominator of which is the total initial Certificate Balance for such Class of Certificates and all Classes of Principal Balance Certificates (other than the Class PEX Certificates) senior to such Class of Certificates. The Certificate Principal U/W NOI Debt Yield for each of the Class A-1, A-2, A-3, A-4, A-4FL, A-4FX and A-SB Certificates is calculated in the aggregate for those Classes as if they were a single Class and is calculated as the product of (a) the weighted average U/W NOI Debt Yield for the mortgage loans and (b) a fraction, the numerator of which is the total initial Certificate Balance of all of the Classes of Principal Balance Certificates (other than the Class PEX Certificates) and the denominator of which is the total aggregate initial Certificate Balances for the Class A-1, A-2, A-3, A-4, A-4FL, A-4FX and A-SB Certificates. The Certificate Principal U/W NOI Debt Yield of the Class PEX Certificates is equal to the Certificate Principal U/W NOI Debt Yield for the Class C Certificates. In any event, however, cash flow from each mortgaged property supports only the related mortgage loan and will not be available to support any other mortgage loan (unless such mortgage loans are cross-collateralized and the cross-collateralization remains in effect). |
THE INFORMATION IN THIS STRUCTURAL AND COLLATERAL TERM SHEET IS NOT COMPLETE AND MAY BE AMENDED PRIOR TO THE TIME OF SALE. THIS TERM SHEET IS NOT AN OFFER TO SELL THESE SECURITIES AND IT IS NOT A SOLICITATION OF AN OFFER TO BUY THESE SECURITIES IN ANY JURISDICTION WHERE THE OFFER OR SALE IS NOT PERMITTED.
| 3 |
| Wells Fargo Commercial Mortgage Trust 2015-C30 | Certificate Structure |
| (7) | The pass-through rates for the Class A-1, A-2, A-3, A-4, A-4FX, A-SB, D, E, F, G and H Certificates and the Class A-4FX, A-S, B and C regular interests in each case will be one of the following: (i) a fixed rateper annum, (ii) the weighted average of the net mortgage interest rates on the mortgage loans for the related distribution date, (iii) a variable rateper annum equal to the lesser of (a) a fixed rate and (b) the weighted average of the net mortgage interest rates on the mortgage loans for the related distribution date or (iv) a variable rateper annum equal to the weighted average of the net mortgage interest rates on the mortgage loans for the related distribution date minus a specified percentage. For purposes of the calculation of the weighted average of the net mortgage interest rates on the mortgage loans for each distribution date, the mortgage interest rates will be adjusted as necessary to a 30/360 basis. The Class PEX Certificates will not have a pass-through rate, but will be entitled to receive the sum of the interest distributable on the Class PEX Components. The pass-through rate for the Class A-S Certificates, the Class A-S regular interest and the Class PEX Component A-S will, at all times, be the same. The pass-through rate for the Class B Certificates, the Class B regular interest and the Class PEX Component B will, at all times, be the same. The pass-through rate for the Class C Certificates, the Class C regular interest and the Class PEX Component C will, at all times, be the same. |
| (8) | Represents the maximum initial principal balance of the Class A-4 Certificates that will be issued on the closing date. The aggregate initial principal balance of the Class A-4, A-4FL and A-4FX Certificates will be $263,131,000. |
| (9) | The Class A-S, B, C and PEX Certificates are “Exchangeable Certificates”. On the closing date, the upper-tier REMIC of the issuing entity will issue the Class A-S, B and C regular interests (each a “regular interest”) which will have outstanding principal balances on the closing date of $51,822,000, $43,493,000 and $31,464,000, respectively. The regular interests will be held in a grantor trust for the benefit of the holders of the Class A-S, B, C and PEX Certificates. The Class A-S, B, C and PEX Certificates will, at all times, represent undivided beneficial ownership interests in a grantor trust that will hold those regular interests. Each class of the Class A-S, B and C Certificates will, at all times, represent an undivided beneficial ownership interest in a percentage of the outstanding certificate principal balance of the regular interest with the same alphabetical class designation. The Class PEX Certificates will, at all times, represent an undivided beneficial ownership interest in the remaining percentages of the outstanding certificate principal balances of the Class A-S, B and C regular interests and which portions of those regular interests are referred to in this Term Sheet as the Class PEX Component A-S, Class PEX Component B and Class PEX Component C (collectively, the “Class PEX Components”). Following any exchange of Class A-S, B and C Certificates for Class PEX Certificates or any exchange of Class PEX Certificates for Class A-S, B and C Certificates as described in the Free Writing Prospectus, the percentage interest of the outstanding certificate principal balances of the Class A-S, B and C regular interests that is represented by the Class A-S, B, C and PEX Certificates will be increased or decreased accordingly. The initial certificate principal balance of each of the Class A-S, B and C Certificates shown in the table represents the maximum certificate principal balance of such class without giving effect to any exchange. The initial certificate principal balance of the Class PEX Certificates is equal to the aggregate of the initial certificate principal balance of the Class A-S, B and C Certificates and represents the maximum certificate principal balance of the Class PEX Certificates that could be issued in an exchange. The certificate principal balances of the Class A-S, B and C Certificates to be issued on the closing date will be reduced, in required proportions, by an amount equal to the certificate principal balance of the Class PEX Certificates issued on the closing date. Distributions and allocations of payments and losses with respect to the Exchangeable Certificates are described in this Term Sheet under “Allocations and Distributions on the Class A-S, B, C and PEX Certificates” and under “Description of the Offered Certificates—Distributions” in the Free Writing Prospectus. The maximum certificate principal balance of the Class PEX Certificates is set forth in the table but is not included in the certificate principal balance of the certificates set forth on the cover page of this Term Sheet or on the top of the cover page of the Free Writing Prospectus. |
| (10) | The Class X-A Certificates are notional amount certificates. The Notional Amount of the Class X-A Certificates will be equal to the aggregate principal balance of the Class A-1, A-2, A-3, A-4 and A-SB Certificates and the Class A-4FX and A-S regular interests outstanding from time to time (without regard to any exchange of the Class A-S, B and C Certificates for the Class PEX Certificates). The Class X-A Certificates will not be entitled to distributions of principal. |
| (11) | The pass-through rate for the Class X-A Certificates for any distribution date will be aper annum rate equal to the excess, if any, of (a) the weighted average of the net mortgage interest rates on the mortgage loans for the related distribution date, over (b) the weighted average of the pass-through rates on the Class A-1, A-2, A-3, A-4 and A-SB Certificates and the Class A-4FX and A-S regular interests for the related distribution date, weighted on the basis of their respective aggregate principal balances outstanding immediately prior to that distribution date. For purposes of the calculation of the weighted average of the net mortgage interest rates on the mortgage loans for each distribution date, the mortgage interest rates will be adjusted as necessary to a 30/360 basis. |
| (12) | The Class X-B Certificates are notional amount certificates. The Notional Amount of the Class X-B Certificates will be equal to the aggregate principal balance of the Class B and C regular interests outstanding from time to time (without regard to any exchange of the Class A-S, B and C Certificates for the Class PEX Certificates). The Class X-B Certificates will not be entitled to distributions of principal. |
| (13) | The pass-through rate for the Class X-B Certificates for any distribution date will be aper annum rate equal to the excess, if any, of (a) the weighted average of the net mortgage interest rates on the mortgage loans for the related distribution date, over (b) the weighted average of the pass-through rates on the Class B and C regular interests for the related distribution date, weighted on the basis of their respective aggregate principal balances outstanding immediately prior to that distribution date. For purposes of the calculation of the weighted average of the net mortgage interest rates on the mortgage loans for each distribution date, the mortgage interest rates will be adjusted as necessary to a 30/360 basis. |
| (14) | The Class X-E Certificates are notional amount certificates. The Notional Amount of the Class X-E Certificates will be equal to the principal balance of the Class E Certificates outstanding from time to time. The Class X-E Certificates will not be entitled to distributions of principal. |
| (15) | The pass-through rate for the Class X-E Certificates for any distribution date will be aper annum rate equal to the excess, if any, of (a) the weighted average of the net mortgage interest rates on the mortgage loans for the related distribution date, over (b) the pass-through rate on the Class E Certificates for the related distribution date. For purposes of the calculation of the weighted average of the net mortgage interest rates on the mortgage loans for each distribution date, the mortgage interest rates will be adjusted as necessary to a 30/360 basis. |
| (16) | The Class X-FG Certificates are notional amount certificates. The Notional Amount of the Class X-FG Certificates will be equal to the aggregate principal balance of the Class F and G Certificates outstanding from time to time. The Class X-FG Certificates will not be entitled to distributions of principal. |
| (17) | The pass-through rate for the Class X-FG Certificates for any distribution date will be aper annum rate equal to the excess, if any, of (a) the weighted average of the net mortgage interest rates on the mortgage loans for the related distribution date, over (b) the weighted average of the pass-through rates on the Class F and G Certificates for the related distribution date, weighted on the basis of their respective aggregate principal balances outstanding immediately prior to that distribution date. For purposes of the calculation of the weighted average of the net mortgage interest rates on the mortgage loans for each distribution date, the mortgage interest rates will be adjusted as necessary to a 30/360 basis. |
| (18) | The Class X-H Certificates are notional amount certificates. The Notional Amount of the Class X-H Certificates will be equal to the principal balance of the Class H Certificates outstanding from time to time. The Class X-H Certificates will not be entitled to distributions of principal. |
| (19) | The pass-through rate for the Class X-H Certificates for any distribution date will be aper annum rate equal to the excess, if any, of (a) the weighted average of the net mortgage interest rates on the mortgage loans for the related distribution date, over (b) the pass-through rate on the Class H Certificates for the related distribution date. For purposes of the calculation of the weighted average of the net mortgage interest rates on the mortgage loans for each distribution date, the mortgage interest rates will be adjusted as necessary to a 30/360 basis. |
| (20) | The ratings assigned to the Class A-4FL Certificates reflect only the receipt of up to the fixed rate of interest at a rate equal to the pass-through rate for the Class A-4FX regular interest. The ratings of Fitch, Moody’s and Morningstar do not address any shortfalls or delays in payment that investors in the Class A-4FL Certificates may experience as a result of the conversion of the pass-through rate on Class A-4FL Certificates from a floating interest rate to a fixed rate. See “Ratings” in the Private Placement Memorandum. |
| (21) | The aggregate initial principal balance of the Class A-4, A-4FL and A-4FX Certificates will be $263,131,000. The aggregate principal balance of the Class A-4FL and A-4FX Certificates will at all times equal the principal balance of the Class A-4FX regular interest. The maximum initial principal balance of the Class A-4FL certificates is $263,131,000. The principal balance of the Class A-4FX certificates will initially be $0. The maximum initial principal balance of the Class A-4FX regular interest is $263,131,000. |
| (22) | The Class A-4FL Certificates will evidence a beneficial interest in a grantor trust that includes the Class A-4FX regular interest and an interest rate swap contract. Under some circumstances, holders of the Class A-4FL Certificates may exchange all or a portion of their certificates for a like principal amount of Class A-4FX Certificates having the same pass-through rate as the Class A-4FX regular interest. The aggregate principal balance of the Class A-4FL Certificates may be adjusted from time to time as a result of such an exchange. |
| (23) | The pass-through rate applicable to the Class A-4FL Certificates on each distribution date will be aper annum rate equal to LIBOR plus a specified percentage; provided, however, that under certain circumstances (generally involving a default or termination under the related interest rate swap contract), the pass-through rate applicable to the Class A-4FL Certificates may convert to a fixed rate equal to the pass-through rate on the Class A-4FX regular interest. The initial LIBOR rate will be determined two LIBOR business days prior to the Closing Date, and subsequent LIBOR rates for the Class A-4FL Certificates will be determined two LIBOR business days before the start of the related interest accrual period. |
THE INFORMATION IN THIS STRUCTURAL AND COLLATERAL TERM SHEET IS NOT COMPLETE AND MAY BE AMENDED PRIOR TO THE TIME OF SALE. THIS TERM SHEET IS NOT AN OFFER TO SELL THESE SECURITIES AND IT IS NOT A SOLICITATION OF AN OFFER TO BUY THESE SECURITIES IN ANY JURISDICTION WHERE THE OFFER OR SALE IS NOT PERMITTED.
| 4 |
| Wells Fargo Commercial Mortgage Trust 2015-C30 | Issue Characteristics |
II. Transaction Highlights
Mortgage Loan Sellers:
| Mortgage Loan Seller | Number of Mortgage Loans | Number of Mortgaged Properties | Aggregate Cut-off Date Balance | % of Cut-off Date Pool Balance | ||||||||
| Wells Fargo Bank, National Association | 29 | 33 | $317,294,563 | 42.9 | % | |||||||
| Rialto Mortgage Finance, LLC | 14 | 22 | 191,491,726 | 25.9 | ||||||||
| C-III Commercial Mortgage LLC | 31 | 34 | 108,072,533 | 14.6 | ||||||||
| Basis Real Estate Capital II, LLC | 8 | 10 | 73,712,232 | 10.0 | ||||||||
| National Cooperative Bank, N.A. | 19 | 19 | 49,743,856 | 6.7 | ||||||||
| Total | 101 | 118 | $740,314,909 | 100.0 | % | |||||||
Loan Pool:
| Cut-off Date Balance: | $740,314,909 |
| Number of Mortgage Loans: | 101 |
| Average Cut-off Date Balance per Mortgage Loan: | $7,329,851 |
| Number of Mortgaged Properties: | 118 |
| Average Cut-off Date Balance per Mortgaged Property(1): | $6,273,855 |
| Weighted Average Mortgage Interest Rate: | 4.531% |
| Ten Largest Mortgage Loans as % of Cut-off Date Pool Balance: | 45.7% |
| Weighted Average Original Term to Maturity or ARD (months): | 120 |
| Weighted Average Remaining Term to Maturity or ARD (months): | 119 |
| Weighted Average Original Amortization Term (months)(2): | 355 |
| Weighted Average Remaining Amortization Term (months)(2): | 355 |
| Weighted Average Seasoning (months): | 1 |
| (1) | Information regarding mortgage loans secured by multiple properties is based on an allocation according to relative appraised values or the allocated loan amounts or property-specific release prices set forth in the related loan documents or such other allocation as the related mortgage loan seller deemed appropriate. |
| (2) | Excludes any mortgage loan that does not amortize. |
Credit Statistics:
| Weighted Average U/W Net Cash Flow DSCR(1): | 2.10x |
| Weighted Average U/W Net Operating Income Debt Yield(1): | 12.7% |
| Weighted Average Cut-off Date Loan-to-Value Ratio(1): | 63.6% |
| Weighted Average Balloon or ARD Loan-to-Value Ratio(1): | 54.5% |
| % of Mortgage Loans with Additional Subordinate Debt(2): | 14.2% |
| % of Mortgage Loans with Single Tenants(3): | 5.1% |
| (1) | With respect to the Somerset Park Apartments mortgage loan, which is part of a loan combination, loan-to-value ratio, debt service coverage ratio and debt yield calculations include the relatedpari passu companion loan(s) (unless otherwise stated). For mortgaged properties securing residential cooperative mortgage loans, the debt service coverage ratio or debt yield for each such mortgaged property is calculated using underwritten net cash flow for the related residential cooperative property which is the projected net cash flow reflected in the most recent appraisal obtained by or otherwise in the possession of the related mortgage loan seller as of the cut-off date, and the loan-to-value ratio is calculated based upon the appraised value of the residential cooperative property determined as if such residential cooperative property is operated as a residential cooperative. The information for each mortgaged property that relates to a mortgage loan that is cross-collateralized or cross-defaulted with other mortgage loans is based upon the principal balance of that mortgage loan, except that the applicable loan-to-value ratio, debt service coverage ratio, and debt yield for each such mortgage loan is based upon the ratio or yield (as applicable) for the aggregate indebtedness evidenced by all loans in the group. On an individual basis, without regard to the cross-collateralization feature, any mortgage loan that is part of a cross-collateralized group of mortgage loans may have a higher loan-to-value ratio, lower debt service coverage ratio and/or lower debt yield than is presented herein. See Annex A-1 and Annex B to the Free Writing Prospectus. |
| (2) | Fifteen (15) of the mortgage loans, each of which is secured by a residential cooperative property, currently have in place subordinate secured lines of credit to the related mortgage borrowers that permit future advances (such loans, collectively, the “Subordinate Coop LOCs”). The percentage figure expressed as “% of Mortgage Loans with Additional Subordinate Debt” is determined as a percentage of cut-off date principal balance and does not take into account future subordinate debt (whether or not secured by the mortgaged property), if any, that may be permitted under the terms of any mortgage loan or the Pooling and Servicing Agreement. See “Description of the Mortgage Pool—Subordinate and/or Other Financing” and “Additional Debt Financing for Mortgage Loans Secured by Residential Cooperatives” in the Free Writing Prospectus. |
| (3) | Excludes mortgage loans that are secured by multiple single tenant properties and includes mortgage loans secured by multiple single tenant properties where each property is occupied by the same tenant or tenants that are affiliates of one another. |
THE INFORMATION IN THIS STRUCTURAL AND COLLATERAL TERM SHEET IS NOT COMPLETE AND MAY BE AMENDED PRIOR TO THE TIME OF SALE. THIS TERM SHEET IS NOT AN OFFER TO SELL THESE SECURITIES AND IT IS NOT A SOLICITATION OF AN OFFER TO BUY THESE SECURITIES IN ANY JURISDICTION WHERE THE OFFER OR SALE IS NOT PERMITTED.
| 5 |
| Wells Fargo Commercial Mortgage Trust 2015-C30 | Issue Characteristics |
Loan Structural Features:
Amortization:Based on the Cut-off Date Pool Balance, 88.9% of the mortgage pool (96 mortgage loans) has scheduled amortization, as follows:
46.3% (37 mortgage loans) provides for an interest-only period followed by an amortization period; and
42.6% (59 mortgage loans) requires amortization during the entire loan term.
Interest-Only:Based on the Cut-off Date Pool Balance, 11.1% of the mortgage pool (five mortgage loans) provides for interest-only payments during the entire loan term. The Weighted Average Cut-off Date Loan-to-Value Ratio and Weighted Average U/W Net Cash Flow DSCR for those mortgage loans are 65.8% and 3.30x, respectively.
Hard Lockboxes: Based on the Cut-off Date Pool Balance, 7.2% of the mortgage pool (seven mortgage loans) has hard lockboxes in place.
Reserves:The mortgage loans require amounts to be escrowed monthly as follows (excluding any mortgage loans with springing provisions):
| Real Estate Taxes: | 88.7% of the pool |
| Insurance: | 41.1% of the pool |
| Capital Replacements: | 80.5% of the pool |
| TI/LC: | 74.3% of the pool(1) |
| (1) | The percentage of Cut-off Date Balance for mortgage loans with TI/LC reserves is based on the aggregate principal balance allocable to loans that include retail, office, industrial and mixed use properties. One mortgage loan identified on the Annex A-1 to the Free Writing Prospectus as “510-512 Bienville Street”, representing 1.0% of the aggregate Cut-off Date Balance, is secured by a multifamily property and has an initial TI/LC Reserve in the amount of $14,959. Such mortgage loan is not included in the TI/LC percentage above. |
Call Protection/Defeasance: Based on the Cut-off Date Pool Balance, the mortgage pool had the following call protection and defeasance features:
90.5% of the mortgage pool (75 mortgage loans) features a lockout period, then defeasance only until an open period;
6.4% of the mortgage pool (18 mortgage loans) features no lockout period, but requires the greater of a prepayment premium or yield maintenance, then a prepayment premium until an open period;
3.1% of the mortgage pool (eight mortgage loans) features a lockout period, then the greater of a prepayment premium or yield maintenance until an open period;
Please refer to Annex A-1 to the Free Writing Prospectus for further information regarding individual loan call protection.
THE INFORMATION IN THIS STRUCTURAL AND COLLATERAL TERM SHEET IS NOT COMPLETE AND MAY BE AMENDED PRIOR TO THE TIME OF SALE. THIS TERM SHEET IS NOT AN OFFER TO SELL THESE SECURITIES AND IT IS NOT A SOLICITATION OF AN OFFER TO BUY THESE SECURITIES IN ANY JURISDICTION WHERE THE OFFER OR SALE IS NOT PERMITTED.
| 6 |
| Wells Fargo Commercial Mortgage Trust 2015-C30 | Issue Characteristics |
III. Issue Characteristics
| Securities Offered: | $644,999,000 approximate monthly pay, multi-class, commercial mortgage REMIC pass-through certificates consisting of eleven classes (Classes A-1, A-2, A-3, A-4, A-SB, A-S, B, C, PEX, X-A and X-B), which are offered pursuant to a registration statement filed with the SEC. | |
| Mortgage Loan Sellers: | Wells Fargo Bank, National Association (“WFB”), Rialto Mortgage Finance, LLC (“RMF”), C-III Commercial Mortgage LLC (C-III), Basis Real Estate Capital II, LLC (“Basis”) and National Cooperative Bank, N.A. (“NCB”) | |
| Sole Lead Bookrunning Manager: | Wells Fargo Securities, LLC | |
| Co-Managers: | Deutsche Bank Securities Inc. and Morgan Stanley & Co. LLC | |
| Rating Agencies: | Fitch Ratings, Inc., Moody’s Investors Service, Inc. and Morningstar Credit Ratings, LLC | |
| Master Servicers: | Wells Fargo Bank, National Association and National Cooperative Bank, N.A. | |
| Special Servicers: | CWCapital Asset Management LLC and National Cooperative Bank, N.A. | |
| Certificate Administrator: | Wells Fargo Bank, National Association | |
| Trustee: | Wilmington Trust, National Association | |
| Trust Advisor: | Pentalpha Surveillance LLC | |
| Initial Majority Subordinate Certificateholder: | Ellington Management Group, LLC or an affiliate | |
| Cut-off Date: | The Cut-off Date with respect to each mortgage loan is the due date for the monthly debt service payment that is due in August 2015 (or, in the case of any mortgage loan that has its first due date in September 2015, the date that would have been its due date in August 2015 under the terms of that mortgage loan if a monthly debt service payment were scheduled to be due in that month). | |
| Expected Closing Date: | On or about August 12, 2015. | |
| Determination Dates: | The 11th day of each month (or if that day is not a business day, the next succeeding business day), commencing in September 2015. | |
| Distribution Dates: | The fourth business day following the Determination Date in each month, commencing in September 2015. | |
| Rated Final Distribution Date: | The Distribution Date in September 2058. | |
| Interest Accrual Period: | With respect to any Distribution Date, the calendar month immediately preceding the month in which such Distribution Date occurs. | |
| Day Count: | The Offered Certificates will accrue interest on a 30/360 basis. | |
| Minimum Denominations: | $10,000 for each Class of Offered Certificates (other than the Class X-A and X-B Certificates) and $1,000,000 for the Class X-A and X-B Certificates. Investments may also be made in any whole dollar denomination in excess of the applicable minimum denomination. | |
| Clean-up Call: | 1% | |
| Delivery: | DTC, Euroclear and Clearstream Banking | |
| ERISA/SMMEA Status: | Each Class of Offered Certificates is expected to be eligible for exemptive relief under ERISA. No Class of Offered Certificates will be SMMEA eligible. | |
| Risk Factors: | THE CERTIFICATES INVOLVE CERTAIN RISKS AND MAY NOT BE SUITABLE FOR ALL INVESTORS. SEE THE “RISK FACTORS” SECTION OF THE FREE WRITING PROSPECTUS. | |
| Bond Analytics Information: | The Certificate Administrator will be authorized to make distribution date settlements, CREFC® reports and certain supplemental reports (other than confidential information) available to certain financial modeling and data provision services, including Bloomberg, L.P., Trepp, LLC, Intex Solutions, Inc., Markit Group Limited, Interactive Data Corp., BlackRock Financial Management, Inc., CMBS.com, Inc. and Thomson Reuters Corporation. |
THE INFORMATION IN THIS STRUCTURAL AND COLLATERAL TERM SHEET IS NOT COMPLETE AND MAY BE AMENDED PRIOR TO THE TIME OF SALE. THIS TERM SHEET IS NOT AN OFFER TO SELL THESE SECURITIES AND IT IS NOT A SOLICITATION OF AN OFFER TO BUY THESE SECURITIES IN ANY JURISDICTION WHERE THE OFFER OR SALE IS NOT PERMITTED.
| 7 |
| Wells Fargo Commercial Mortgage Trust 2015-C30 | Characteristics of the Mortgage Pool |
IV. Characteristics of the Mortgage Pool(1)
A. Ten Largest Mortgage Loans
| Mortgage Loan Seller | Mortgage Loan Name | City | State | Number of Mortgage Loans / Mortgaged Properties | Mortgage Loan Cut-off Date Balance ($) | % of Cut-off Date Pool Balance (%) | Property Type | Number of SF, Rooms, Units or Beds | Cut-off Date Balance Per SF, Room, Unit or Bed ($) | Cut-off Date LTV Ratio (%) | Balloon or ARD LTV Ratio (%) | U/W NCF DSCR (x) | U/W NOI Debt Yield (%) | ||||||||||||||||||
| RMF | Somerset Park Apartments | Troy | MI | 1 / 1 | $73,500,000 | 9.9 | % | Multifamily | 2,226 | $80,863 | 72.1 | % | 72.1 | % | 1.77 | x | 8.4 | % | |||||||||||||
| WFB | Riverpark Square | Spokane | WA | 1 / 1 | 60,000,000 | 8.1 | Retail | 374,490 | 160 | 54.5 | 46.1 | 1.73 | 10.9 | ||||||||||||||||||
| WFB | Simmons Tower | Little Rock | AR | 1 / 1 | 44,106,462 | 6.0 | Office | 623,354 | 71 | 74.9 | 56.0 | 1.45 | 11.7 | ||||||||||||||||||
| WFB | Hilton Garden Inn - Downtown Denver | Denver | CO | 1 / 1 | 34,876,763 | 4.7 | Hospitality | 221 | 157,813 | 56.2 | 41.3 | 2.08 | 15.4 | ||||||||||||||||||
| WFB | Kent Office Portfolio | Various | NJ | 1 / 2 | 26,500,000 | 3.6 | Office | 240,546 | 110 | 59.8 | 50.9 | 1.82 | 12.3 | ||||||||||||||||||
| RMF | Sawmill Crossing Apartments | Columbus | OH | 1 / 1 | 22,000,000 | 3.0 | Multifamily | 364 | 60,440 | 70.9 | 62.2 | 1.41 | 9.1 | ||||||||||||||||||
| WFB | Residence Inn Charlotte | Charlotte | NC | 1 / 1 | 21,942,896 | 3.0 | Hospitality | 150 | 146,286 | 68.6 | 55.3 | 1.77 | 11.8 | ||||||||||||||||||
| RMF | Capitol Place Apartments | West Sacramento | CA | 1 / 1 | 21,800,000 | 2.9 | Multifamily | 192 | 113,542 | 68.4 | 65.2 | 1.22 | 7.9 | ||||||||||||||||||
| Basis | Pennbrook Apartments | Philadelphia | PA | 1 / 1 | 18,300,000 | 2.5 | Multifamily | 218 | 83,945 | 70.9 | 60.8 | 1.20 | 7.5 | ||||||||||||||||||
| Basis | Cross Gates Apartments Portfolio | Slidell | LA | 1 / 3 | 15,483,256 | 2.1 | Multifamily | 296 | 52,308 | 72.0 | 59.1 | 1.28 | 8.7 | ||||||||||||||||||
| Top Three Total/Weighted Average | 3 / 3 | $177,606,462 | 24.0 | % | 66.8 | % | 59.3 | % | 1.68 | x | 10.1 | % | |||||||||||||||||||
| Top Five Total/Weighted Average | 5 / 6 | $238,983,225 | 32.3 | % | 64.5 | % | 55.8 | % | 1.75 | x | 11.1 | % | |||||||||||||||||||
| Top Ten Total/Weighted Average | 10 / 13 | $338,509,378 | 45.7 | % | 66.1 | % | 57.2 | % | 1.65 | x | 10.5 | % | |||||||||||||||||||
| Non-Top Ten Total/Weighted Average | 91 / 105 | $401,805,532 | 54.3 | % | 61.5 | % | 52.3 | % | 2.48 | x | 14.5 | % | |||||||||||||||||||
| (1) | With respect to the Somerset Park Apartments mortgage loan, which is part of a loan combination, loan-to-value ratio, debt service coverage ratio and debt yield calculations include the relatedpari passu companion loan(s) (unless otherwise stated). |
THE INFORMATION IN THIS STRUCTURAL AND COLLATERAL TERM SHEET IS NOT COMPLETE AND MAY BE AMENDED PRIOR TO THE TIME OF SALE. THIS TERM SHEET IS NOT AN OFFER TO SELL THESE SECURITIES AND IT IS NOT A SOLICITATION OF AN OFFER TO BUY THESE SECURITIES IN ANY JURISDICTION WHERE THE OFFER OR SALE IS NOT PERMITTED.
| 8 |
| Wells Fargo Commercial Mortgage Trust 2015-C30 | Characteristics of the Mortgage Pool |
B. Summary ofPari Passu Loan Combinations
| Property Name | Mortgage Loan Seller | Related Notes in Loan Group (Original Balance) | Holder of Note | Lead Servicer for the Entire Loan Combination | Current Master Servicer Under Related Securitization Servicing Agreement | Current Special Servicer Under Related Securitization Servicing Agreement |
| Somerset Park Apartments | RMF | $73,500,000 | WFCM 2015-C30 | Yes | Wells Fargo Bank, National Association | CWCapital Asset Management LLC |
| RMF | $106,500,000 | (1) | No | TBD | TBD |
| (1) | The relatedpari passu companion loans (Notes A-1-2, A-1-3, A-2-2 and A-2-3) are currently held by RMF and are expected to be contributed to one or more future securitizations. No assurance can be provided that the Notes A-1-2, A-1-3, A-2-2 and A-2-3 will not be split further. |
C. Mortgage Loans with Additional Secured and Mezzanine Financing(1)
| Loan No. | Mortgage Loan Seller | Mortgage Loan Name | Mortgage Loan Cut-off Date Balance ($) | % of Cut-off Date Balance (%) | Sub Debt Cut-off Date Balance ($) | Mezzanine Debt Cut-off Date Balance ($) | Total Debt Interest Rate (%)(2) | Mortgage Loan U/W NCF DSCR (x) | Total Debt U/W NCF DSCR (x) | Mortgage Loan Cut- off Date U/W NOI Debt Yield (%) | Total Debt Cut-off Date U/W NOI Debt Yield (%) | Mortgage Loan Cut-off Date LTV Ratio (%) | Total Debt Cut-off Date LTV Ratio (%) | ||||||||||||||||||||||
| 3 | WFB | Simmons Tower(3) | $44,106,462 | 6.0 | % | $0 | $28,437,194 | 5.760 | % | 1.45 | x | 0.91 | x | 11.7 | % | 7.1 | % | 74.9 | % | 123.2 | % | ||||||||||||||
| 6 | RMF | Sawmill Crossing Apartments | 22,000,000 | 3.0 | 0 | 4,000,000 | 5.730 | 1.41 | 1.04 | 9.1 | 7.7 | 70.9 | 83.7 | ||||||||||||||||||||||
| Total/Weighted Average | $66,106,462 | 8.9 | % | $0 | $32,437,194 | 5.750 | % | 1.44 | x | 0.95 | x | 10.8 | % | 7.3 | % | 73.6 | % | 110.1 | % | ||||||||||||||||
| (1) | In addition, fifteen (15) of the mortgage loans, each of which are secured by residential cooperative properties, currently have in place Subordinate Coop LOCs that permit future advances. See “Description of the Mortgage Pool—Subordinate and/or Other Financing” and “—Additional Debt Financing for Mortgage Loans Secured by Residential Cooperatives” in the Free Writing Prospectus. |
| (2) | Total Debt Interest Rate for any specified mortgage loan reflects the weighted average of the interest rates on the respective components of the total debt. |
| (3) | The equity interests in the Simmons Tower Mortgage Loan borrower and certain affiliates have been pledged to secure additional mezzanine indebtedness of $28,437,194, which is held by an affiliate. Mezzanine debt payments are only required to be paid to the extent there is excess cash flow available after all required payments under the Simmons Tower Mortgage Loan, and unpaid principal and interest will be deferred and added to unpaid principal, with the balance due at maturity. See “Description of the Mortgage Pool—Additional Indebtedness—Existing Secured Financing and Mezzanine and Similar Financing” in the Free Writing Prospectus and the “Simmons Tower” large loan description in this Structural and Collateral Term Sheet. |
THE INFORMATION IN THIS STRUCTURAL AND COLLATERAL TERM SHEET IS NOT COMPLETE AND MAY BE AMENDED PRIOR TO THE TIME OF SALE. THIS TERM SHEET IS NOT AN OFFER TO SELL THESE SECURITIES AND IT IS NOT A SOLICITATION OF AN OFFER TO BUY THESE SECURITIES IN ANY JURISDICTION WHERE THE OFFER OR SALE IS NOT PERMITTED.
| 9 |
| Wells Fargo Commercial Mortgage Trust 2015-C30 | Characteristics of the Mortgage Pool |
D. Previous Securitization History(1)
| Loan No. | Mortgage Loan Seller | Mortgage Loan or Mortgaged Property Name | City | State | Property Type | Mortgage Loan or Mortgaged Property Cut-off Date Balance ($) | % of Cut-off Date Pool Balance (%) | Previous Securitization | ||||||||||
| 2 | WFB | Riverpark Square | Spokane | WA | Retail | $60,000,000 | 8.1 | % | GCCFC 2005-GG5 | |||||||||
| 3 | WFB | Simmons Tower | Little Rock | AR | Office | 44,106,462 | 6.0 | JPMCC 2005-LDP4 | ||||||||||
| 5.01 | WFB | Princeton Corporate Plaza | Monmouth Junction | NJ | Office | 24,500,000 | 3.3 | JPMCC 2005-LDP4 | ||||||||||
| 5.02 | WFB | One Naylon Place | Livingston | NJ | Office | 2,000,000 | 0.3 | JPMCC 2005-LDP4 | ||||||||||
| 7 | WFB | Residence Inn Charlotte | Charlotte | NC | Hospitality | 21,942,896 | 3.0 | COMM 2005-C6 | ||||||||||
| 8 | RMF | Capitol Place Apartments | West Sacramento | CA | Multifamily | 21,800,000 | 2.9 | BACM 2007-1 | ||||||||||
| 13 | RMF | Plaza Diamond Bar | Diamond Bar | CA | Mixed Use | 11,000,000 | 1.5 | MLMT 2005-CIP1 | ||||||||||
| 15 | RMF | Sheridan Professional Centre | Cooper City | FL | Office | 10,325,370 | 1.4 | GCCFC 2005-GG5 | ||||||||||
| 17 | RMF | Best Western Brooklyn | Brooklyn | NY | Hospitality | 10,000,000 | 1.4 | BSCMS 2005-PWR8 | ||||||||||
| 19 | CIIICM | Trafalgar Square Apartments | Greenville | NC | Multifamily | 10,000,000 | 1.4 | CD 2006-CD2 | ||||||||||
| 22 | WFB | Superior Mini Storage - Reno | Reno | NV | Self Storage | 8,577,365 | 1.2 | MSC 2005-T19 | ||||||||||
| 23 | RMF | Holiday Inn Express - Concord | Concord | NC | Hospitality | 8,240,473 | 1.1 | BACM 2005-4 | ||||||||||
| 24 | RMF | Bristol Retail Portfolio | Bristol | Various | Retail | 8,180,883 | 1.1 | CSFB 2005-C3 | ||||||||||
| 25 | WFB | Stor-N-Loc Self Storage | Santa Rosa | CA | Self Storage | 8,000,000 | 1.1 | GECMC 2005-C3 | ||||||||||
| 28 | Basis | Tipp City Plaza | Tipp City | OH | Retail | 6,700,000 | 0.9 | BSCMS 2005-PWR7 | ||||||||||
| 29 | WFB | Stater Brothers - Hesperia | Hesperia | CA | Retail | 6,698,000 | 0.9 | WBCMT 2005-C16 | ||||||||||
| 30 | WFB | Stater Brothers - Hook | Victorville | CA | Retail | 6,570,000 | 0.9 | WBCMT 2005-C16 | ||||||||||
| 31 | WFB | Stater Brothers - Bear Valley | Victorville | CA | Retail | 6,188,000 | 0.8 | WBCMT 2005-C16 | ||||||||||
| 32 | WFB | Stater Brothers - Ridgecrest | Ridgecrest | CA | Retail | 6,113,000 | 0.8 | WBCMT 2005-C17 | ||||||||||
| 34 | NCB | Park Towers Owners, Inc. | Brooklyn | NY | Multifamily | 5,989,605 | 0.8 | CSFB 2005-C5 | ||||||||||
| 35 | WFB | Scotts Valley Junction | Scotts Valley | CA | Retail | 5,984,673 | 0.8 | GCCFC 2005-GG5 | ||||||||||
| 40.01 | CIIICM | Aaron Storage | Dandridge | TN | Self Storage | 1,756,800 | 0.2 | LBUBS 2005-C5 | ||||||||||
| 40.02 | CIIICM | A Tech Self Storage | Augusta | GA | Mixed Use | 1,699,100 | 0.2 | LBUBS 2005-C5 | ||||||||||
| 44 | CIIICM | Superior Self Storage | Gold River | CA | Self Storage | 4,500,000 | 0.6 | BACM 2005-4 | ||||||||||
| 45 | CIIICM | Western Way MHC | Tucson | AZ | Manufactured Housing Community | 4,325,000 | 0.6 | GECMC 2005-C3 | ||||||||||
| 46 | CIIICM | Walgreens Rochester Hills | Rochester Hills | MI | Retail | 4,284,000 | 0.6 | LBUBS 2005-C5 | ||||||||||
| 50 | WFB | All American Mini Storage | Claremont | CA | Self Storage | 4,050,000 | 0.5 | MSC 2006-T23 | ||||||||||
| 55 | WFB | Napa Pointe | Napa | CA | Industrial | 3,710,000 | 0.5 | MSC 2006-HQ8 | ||||||||||
| 61 | NCB | Briar Hill Owners Corp. | Briarcliff Manor | NY | Multifamily | 3,297,340 | 0.4 | MSC 2007-IQ13 | ||||||||||
| 63 | NCB | 12 Westchester Avenue Tenants Corp. | White Plains | NY | Multifamily | 3,195,690 | 0.4 | MSC 2006-IQ11 | ||||||||||
| 65 | WFB | Maple Del Manor | Ravenna | OH | Manufactured Housing Community | 3,096,379 | 0.4 | MLMT 2005-LC1 | ||||||||||
| 67 | WFB | Garden Lane Apartments | Shakopee | MN | Multifamily | 2,931,649 | 0.4 | WBCMT 2005-C20 | ||||||||||
THE INFORMATION IN THIS STRUCTURAL AND COLLATERAL TERM SHEET IS NOT COMPLETE AND MAY BE AMENDED PRIOR TO THE TIME OF SALE. THIS TERM SHEET IS NOT AN OFFER TO SELL THESE SECURITIES AND IT IS NOT A SOLICITATION OF AN OFFER TO BUY THESE SECURITIES IN ANY JURISDICTION WHERE THE OFFER OR SALE IS NOT PERMITTED.
| 10 |
| Wells Fargo Commercial Mortgage Trust 2015-C30 | Characteristics of the Mortgage Pool |
| Loan No. | Mortgage Loan Seller | Mortgage Loan or Mortgaged Property Name | City | State | Property Type | Mortgage Loan or Mortgaged Property Cut-off Date Balance ($) | % of Cut-off Date Pool Balance (%) | Previous Securitization | ||||||||||
| 69 | NCB | Suburbia Owners, Inc. | Farmingdale | NY | Multifamily | 2,791,797 | 0.4 | CSMC 2006-C1 | ||||||||||
| 79 | CIIICM | Planet Self Storage - Lindenwold | Lindenwold | NJ | Self Storage | 2,300,000 | 0.3 | BSCMS 2005-PW10 | ||||||||||
| 82 | NCB | Croyden Apts. Inc. | Elmhurst | NY | Multifamily | 2,095,951 | 0.3 | MSC 2005-IQ10 | ||||||||||
| 84 | NCB | 175 East 79 Tenants Corp. | New York | NY | Multifamily | 2,000,000 | 0.3 | CSFB 2004-C4 | ||||||||||
| 86 | NCB | Hartwell Station | Hartwell | GA | Retail | 1,997,737 | 0.3 | CSFB 2005-C6 | ||||||||||
| 87 | CIIICM | Weiman’s MHC | Houston | TX | Manufactured Housing Community | 1,951,000 | 0.3 | LNSTR 2014-2 | ||||||||||
| 88 | WFB | Calloway Road Storage Center | Tyler | TX | Self Storage | 1,797,996 | 0.2 | MLMT 2005-LC1 | ||||||||||
| 90 | NCB | Brooks Holding Corp. | New York | NY | Multifamily | 1,598,782 | 0.2 | MSC 2007-IQ16 | ||||||||||
| 94 | CIIICM | Mustang MHC | Alvin | TX | Manufactured Housing Community | 1,318,000 | 0.2 | LASL 2006-MF4 | ||||||||||
| 95 | NCB | 157 East 75th Street Corporation | New York | NY | Multifamily | 1,298,166 | 0.2 | MSC 2006-IQ11 | ||||||||||
| 97 | WFB | Central Self Storage - Warner | Chandler | AZ | Self Storage | 1,246,736 | 0.2 | MSC 2005-T19 | ||||||||||
| 98 | NCB | 838 Greenwich St. Corp. | New York | NY | Multifamily | 1,246,476 | 0.2 | CSMC 2006-C1 | ||||||||||
| 101 | NCB | Whitney Realty Corp. | New York | NY | Multifamily | 847,585 | 0.1 | MSC 2005-IQ10 | ||||||||||
| Total | $352,252,911 | 47.6 | % | |||||||||||||||
| (1) | The table above represents the most recent securitization with respect to the mortgaged property securing the related mortgage loan, based on information provided by the related borrower or obtained through searches of a third-party database. While the above mortgage loans may have been securitized multiple times in prior transactions, mortgage loans are only listed in the above chart if the mortgage loan in this securitization paid off a mortgage loan in another securitization. The information has not otherwise been confirmed by the mortgage loan sellers. |
THE INFORMATION IN THIS STRUCTURAL AND COLLATERAL TERM SHEET IS NOT COMPLETE AND MAY BE AMENDED PRIOR TO THE TIME OF SALE. THIS TERM SHEET IS NOT AN OFFER TO SELL THESE SECURITIES AND IT IS NOT A SOLICITATION OF AN OFFER TO BUY THESE SECURITIES IN ANY JURISDICTION WHERE THE OFFER OR SALE IS NOT PERMITTED.
| 11 |
| Wells Fargo Commercial Mortgage Trust 2015-C30 | Characteristics of the Mortgage Pool |
E. Mortgage Loans with Scheduled Balloon Payments and Related Classes
| Class A-2(1) | ||||||||||||||||
| Loan No. | Mortgage Loan Seller | Mortgage Loan Name | State | Property Type | Mortgage Loan Cut-off Date Balance ($) | % of Cut-off Date Pool Balance (%) | Mortgage Loan Balance at Maturity ($) | % of Class A-2 Certificate Principal Balance (%)(2) | SF | Loan per SF ($) | U/W NCF DSCR (x) | U/W NOI Debt Yield (%) | Cut-off Date LTV Ratio (%) | Balloon or ARD LTV Ratio (%) | Rem. IO Period (mos.) | Rem. Term to Maturity (mos.) |
| 54 | WFB | Pavlik Professional Center | FL | Office | $3,750,000 | 0.5% | $3,492,709 | 79.7% | 17,095 | $219 | 1.55x | 10.0% | 72.1% | 67.2% | 10 | 58 |
| Total/Weighted Average | $3,750,000 | 0.5% | $3,492,709 | 79.7% | 1.55x | 10.0% | 72.1% | 67.2% | 10 | 58 | ||||||
| (1) | The table above presents the mortgage loan(s) whose balloon payments would be applied to pay down the principal balance of the Class A-2 Certificates, assuming a 0% CPR and applying the “Structuring Assumptions” described in the Free Writing Prospectus, including the assumptions that (i) none of the mortgage loans in the pool experience prepayments prior to maturity (or, in the case of an ARD loan, its anticipated repayment date), defaults or losses; (ii) there are no extensions of maturity dates of any mortgage loans in the pool; and (iii) each mortgage loan in the pool is paid in full on its stated maturity date (or, in the case of an ARD loan, its anticipated repayment date). Each Class of Certificates, including the Class A-2 Certificates, evidences undivided ownership interests in the entire pool of mortgage loans. Debt service coverage ratio, debt yield and loan-to-value ratio information takes no account of subordinate debt (whether or not secured by the mortgaged property), if any, that is allowed under the terms of any mortgage loan. See Annex A-1 to the Free Writing Prospectus. |
| (2) | Reflects the percentage equal to the Mortgage Loan Balance at Maturity divided by the initial Class A-2 Certificate Principal Balance. |
THE INFORMATION IN THIS STRUCTURAL AND COLLATERAL TERM SHEET IS NOT COMPLETE AND MAY BE AMENDED PRIOR TO THE TIME OF SALE. THIS TERM SHEET IS NOT AN OFFER TO SELL THESE SECURITIES AND IT IS NOT A SOLICITATION OF AN OFFER TO BUY THESE SECURITIES IN ANY JURISDICTION WHERE THE OFFER OR SALE IS NOT PERMITTED.
| 12 |
(THIS PAGE INTENTIONALLY LEFT BLANK)
THE INFORMATION IN THIS STRUCTURAL AND COLLATERAL TERM SHEET IS NOT COMPLETE AND MAY BE AMENDED PRIOR TO THE TIME OF SALE. THIS TERM SHEET IS NOT AN OFFER TO SELL THESE SECURITIES AND IT IS NOT A SOLICITATION OF AN OFFER TO BUY THESE SECURITIES IN ANY JURISDICTION WHERE THE OFFER OR SALE IS NOT PERMITTED.
| 13 |
| Wells Fargo Commercial Mortgage Trust 2015-C30 | Characteristics of the Mortgage Pool |
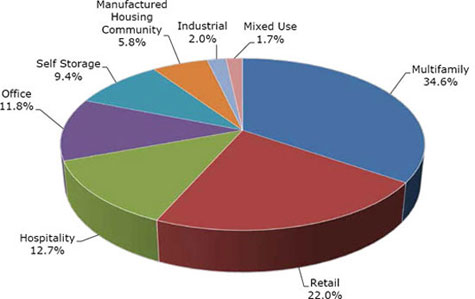
F. Property Type Distribution(1)
| Property Type | Number of Mortgaged Properties | Aggregate Cut-off Date Balance ($) | % of Cut-off Date Balance (%) | Weighted Average Cut-off Date LTV Ratio (%) | Weighted Average Balloon or ARD LTV Ratio (%) | Weighted Average U/W NCF DSCR (x) | Weighted Average U/W NOI Debt Yield (%) | Weighted Average U/W NCF Debt Yield (%) | Weighted Average Mortgage Rate (%) | ||||||||||
| Multifamily | 38 | $256,447,112 | 34.6 | % | 59.5 | % | 54.2 | % | 3.01 | x | 15.9 | % | 15.6 | % | 4.486 | % | |||
| Garden | 17 | 180,058,880 | 24.3 | 69.8 | 64.4 | 1.52 | 8.6 | 8.3 | 4.634 | ||||||||||
| Cooperative | 18 | 47,746,119 | 6.4 | 15.9 | 13.7 | 9.70 | 47.8 | 47.8 | 3.806 | ||||||||||
| Student Housing | 1 | 18,300,000 | 2.5 | 70.9 | 60.8 | 1.20 | 7.5 | 7.4 | 4.640 | ||||||||||
| Mid-Rise | 1 | 7,200,000 | 1.0 | 71.4 | 60.1 | 1.22 | 7.9 | 7.8 | 4.900 | ||||||||||
| Low Rise | 1 | 3,142,113 | 0.4 | 38.3 | 31.1 | 1.80 | 11.6 | 11.0 | 4.520 | ||||||||||
| Retail | 30 | 162,878,142 | 22.0 | 64.9 | 55.3 | 1.53 | 10.0 | 9.2 | 4.458 | ||||||||||
| Regional Mall | 1 | 60,000,000 | 8.1 | 54.5 | 46.1 | 1.73 | 10.9 | 10.1 | 4.130 | ||||||||||
| Single Tenant | 7 | 37,571,746 | 5.1 | 74.6 | 63.2 | 1.28 | 8.3 | 7.9 | 4.595 | ||||||||||
| Unanchored | 13 | 25,936,486 | 3.5 | 70.2 | 60.0 | 1.45 | 10.1 | 9.2 | 4.801 | ||||||||||
| Anchored | 4 | 22,959,673 | 3.1 | 64.2 | 54.0 | 1.48 | 10.3 | 9.3 | 4.772 | ||||||||||
| Shadow Anchored | 5 | 16,410,237 | 2.2 | 73.5 | 65.2 | 1.53 | 10.0 | 9.1 | 4.367 | ||||||||||
| Hospitality | 6 | 94,050,680 | 12.7 | 62.0 | 48.9 | 1.88 | 13.6 | 11.9 | 4.534 | ||||||||||
| Limited Service | 3 | 53,117,236 | 7.2 | 59.9 | 46.1 | 1.99 | 14.4 | 12.9 | 4.500 | ||||||||||
| Extended Stay | 1 | 21,942,896 | 3.0 | 68.6 | 55.3 | 1.77 | 11.8 | 10.6 | 4.340 | ||||||||||
| Full Service | 2 | 18,990,548 | 2.6 | 60.1 | 49.2 | 1.67 | 13.6 | 10.6 | 4.855 | ||||||||||
| Office | 6 | 87,104,000 | 11.8 | 70.0 | 55.5 | 1.57 | 11.6 | 10.2 | 4.711 | ||||||||||
| CBD | 1 | 44,106,462 | 6.0 | 74.9 | 56.0 | 1.45 | 11.7 | 10.2 | 4.960 | ||||||||||
| R&D | 2 | 26,500,000 | 3.6 | 59.8 | 50.9 | 1.82 | 12.3 | 10.8 | 4.340 | ||||||||||
| Medical | 2 | 14,075,370 | 1.9 | 73.3 | 62.1 | 1.49 | 10.0 | 9.2 | 4.647 | ||||||||||
| Suburban | 1 | 2,422,168 | 0.3 | 73.4 | 59.6 | 1.54 | 10.6 | 9.5 | 4.590 | ||||||||||
| Self Storage | 19 | 69,670,435 | 9.4 | 66.3 | 56.7 | 1.57 | 9.8 | 9.5 | 4.524 | ||||||||||
| Self Storage | 19 | 69,670,435 | 9.4 | 66.3 | 56.7 | 1.57 | 9.8 | 9.5 | 4.524 | ||||||||||
| Manufactured Housing Community | 15 | 42,905,440 | 5.8 | 65.9 | 54.7 | 1.59 | 10.1 | 9.9 | 4.679 | ||||||||||
| Manufactured Housing Community | 15 | 42,905,440 | 5.8 | 65.9 | 54.7 | 1.59 | 10.1 | 9.9 | 4.679 | ||||||||||
| Industrial | 2 | 14,560,000 | 2.0 | 67.8 | 61.6 | 1.51 | 9.8 | 9.1 | 4.438 | ||||||||||
| Flex | 2 | 14,560,000 | 2.0 | 67.8 | 61.6 | 1.51 | 9.8 | 9.1 | 4.438 | ||||||||||
| Mixed Use | 2 | 12,699,100 | 1.7 | 71.2 | 64.7 | 1.51 | 10.2 | 9.5 | 4.754 | ||||||||||
| Office/Retail | 1 | 11,000,000 | 1.5 | 71.9 | 66.1 | 1.50 | 10.1 | 9.4 | 4.750 | ||||||||||
| Self Storage/Office | 1 | 1,699,100 | 0.2 | 66.7 | 55.8 | 1.59 | 10.5 | 10.0 | 4.780 | ||||||||||
| Total/Weighted Average: | 118 | $740,314,909 | 100.0 | % | 63.6 | % | 54.5 | % | 2.10 | x | 12.7 | % | 12.0 | % | 4.531 | % | |||
| (1) | Because this table presents information relating to the mortgaged properties and not the mortgage loans, (a) the information for mortgage loans secured by more than one mortgaged property (other than through cross-collateralization with other mortgage loans) is based on allocated amounts (allocating the mortgage loan principal balance to each of those properties according to the relative appraised values of the mortgaged properties or the allocated loan amounts or property-specific release prices set forth in the related mortgage loan documents or such other allocation as the related mortgage loan seller deemed appropriate), and (b) the information for each mortgaged property that relates to a mortgage loan that is cross-collateralized or cross-defaulted with other mortgage loans is based upon the principal balance of that mortgage loan, except that the applicable loan-to-value ratio, debt service coverage ratio and debt yield for each such mortgage loan is based upon the ratio or yield (as applicable) for the aggregate indebtedness evidenced by all loans in the group. On an individual basis, without regard to the cross-collateralization feature, any mortgage loan that is part of a cross-collateralized group of mortgage loans may have a higher loan-to-value ratio, lower debt service coverage ratio and/or lower debt yield than is presented herein. For mortgaged properties securing residential cooperative mortgage loans, the debt service coverage ratio or debt yield for each such mortgaged property is calculated using underwritten net cash flow for the related residential cooperative property which is the projected net cash flow reflected in the most recent appraisal obtained by or otherwise in the possession of the related mortgage loan seller as of the cut-off date and the loan-to-value ratio is calculated based upon the appraised value of the residential cooperative property determined as if such residential cooperative property is operated as a residential cooperative. With respect to the Somerset Park Apartments mortgage loan, which is part of a loan combination, loan-to-value ratio, debt service coverage ratio and debt yield calculations include the related pari passu companion loan(s) (unless otherwise stated). See Annex A-1 to the Free Writing Prospectus. |
THE INFORMATION IN THIS STRUCTURAL AND COLLATERAL TERM SHEET IS NOT COMPLETE AND MAY BE AMENDED PRIOR TO THE TIME OF SALE. THIS TERM SHEET IS NOT AN OFFER TO SELL THESE SECURITIES AND IT IS NOT A SOLICITATION OF AN OFFER TO BUY THESE SECURITIES IN ANY JURISDICTION WHERE THE OFFER OR SALE IS NOT PERMITTED.
| 14 |
| Wells Fargo Commercial Mortgage Trust 2015-C30 | Characteristics of the Mortgage Pool |
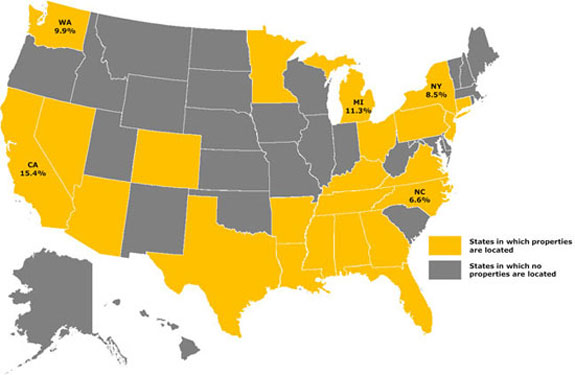
G. Geographic Distribution(1)(2)
| Location | Number of Mortgaged Properties | Aggregate Cut- off Date Balance ($) | % of Cut-off Date Balance (%) | Weighted Average Cut-off Date LTV Ratio (%) | Weighted Average Balloon or ARD LTV Ratio (%) | Weighted Average U/W NCF DSCR (x) | Weighted Average U/W NOI Debt Yield (%) | Weighted Average U/W NCF Debt Yield (%) | Weighted Average Mortgage Rate (%) | ||||||||||
| California | 15 | 113,655,786 | 15.4 | % | 67.7 | % | 60.4 | % | 1.41 | x | 9.1 | % | 8.6 | % | 4.573 | % | |||
| Southern | 9 | 58,811,113 | 7.9 | 69.7 | 61.2 | 1.38 | 9.1 | 8.5 | 4.626 | ||||||||||
| Northern | 6 | 54,844,673 | 7.4 | 65.6 | 59.5 | 1.44 | 9.2 | 8.7 | 4.516 | ||||||||||
| Michigan | 5 | 83,803,427 | 11.3 | 71.8 | 70.4 | 1.73 | 8.6 | 8.3 | 4.570 | ||||||||||
| Washington | 6 | 73,190,000 | 9.9 | 54.5 | 45.8 | 1.65 | 10.4 | 9.7 | 4.226 | ||||||||||
| New York | 20 | 63,071,119 | 8.5 | 28.8 | 24.2 | 7.74 | 38.9 | 38.7 | 4.008 | ||||||||||
| North Carolina | 5 | 48,727,114 | 6.6 | 70.9 | 58.2 | 1.64 | 10.9 | 10.0 | 4.448 | ||||||||||
| Arkansas | 1 | 44,106,462 | 6.0 | 74.9 | 56.0 | 1.45 | 11.7 | 10.2 | 4.960 | ||||||||||
| Ohio | 6 | 43,401,379 | 5.9 | 69.1 | 59.0 | 1.47 | 9.9 | 9.2 | 4.702 | ||||||||||
| Florida | 6 | 38,869,620 | 5.3 | 70.5 | 59.4 | 1.47 | 9.9 | 9.2 | 4.766 | ||||||||||
| Other(3) | 54 | 231,490,001 | 31.3 | 65.2 | 54.2 | 1.61 | 11.0 | 10.1 | 4.600 | ||||||||||
| Total/Weighted Average | 118 | $740,314,909 | 100.0 | % | 63.6 | % | 54.5 | % | 2.10 | x | 12.7 | % | 12.0 | % | 4.531 | % | |||
| (1) | The mortgaged properties are located in 23 states. |
| (2) | Because this table presents information relating to the mortgaged properties and not the mortgage loans, (a) the information for mortgage loans secured by more than one mortgaged property (other than through cross-collateralization with other mortgage loans) is based on allocated amounts (allocating the mortgage loan principal balance to each of those properties according to the relative appraised values of the mortgaged properties or the allocated loan amounts or property-specific release prices set forth in the related mortgage loan documents or such other allocation as the related mortgage loan seller deemed appropriate), and (b) the information for each mortgaged property that relates to a mortgage loan that is cross-collateralized or cross-defaulted with other mortgage loans is based upon the principal balance of that mortgage loan, except that the applicable loan-to-value ratio, debt service coverage ratio and debt yield for each such mortgage loan is based upon the ratio or yield (as applicable) for the aggregate indebtedness evidenced by all loans in the group. On an individual basis, without regard to the cross-collateralization feature, any mortgage loan that is part of a cross-collateralized group of mortgage loans may have a higher loan-to-value ratio, lower debt service coverage ratio and/or lower debt yield than is presented herein. For mortgaged properties securing residential cooperative mortgage loans, the debt service coverage ratio or debt yield for each such mortgaged property is calculated using underwritten net cash flow for the related residential cooperative property which is the projected net cash flow reflected in the most recent appraisal obtained by or otherwise in the possession of the related mortgage loan seller as of the cut-off date and the loan-to-value ratio is calculated based upon the appraised value of the residential cooperative property determined as if such residential cooperative property is operated as a residential cooperative. With respect to the Somerset Park Apartments mortgage loan, which is part of a loan combination, loan-to-value ratio, debt service coverage ratio and debt yield calculations include the related pari passu companion loan(s) (unless otherwise stated). See Annex A-1 to the Free Writing Prospectus. |
| (3) | Includes 15 other states. |
THE INFORMATION IN THIS STRUCTURAL AND COLLATERAL TERM SHEET IS NOT COMPLETE AND MAY BE AMENDED PRIOR TO THE TIME OF SALE. THIS TERM SHEET IS NOT AN OFFER TO SELL THESE SECURITIES AND IT IS NOT A SOLICITATION OF AN OFFER TO BUY THESE SECURITIES IN ANY JURISDICTION WHERE THE OFFER OR SALE IS NOT PERMITTED.
| 15 |
| Wells Fargo Commercial Mortgage Trust 2015-C30 | Characteristics of the Mortgage Pool |
H. Characteristics of the Mortgage Pool(1)
| CUT-OFF DATE BALANCE | |||||
| Range of Cut-off Date Balances ($) | Number of Mortgage Loans | Aggregate Cut- off Date Balance | % of Cut-off Date Balance | ||
| 847,585 - 1,000,000 | 2 | $1,710,085 | 0.2% | ||
| 1,000,001 - 2,000,000 | 18 | 28,220,719 | 3.8 | ||
| 2,000,001 - 3,000,000 | 16 | 40,136,485 | 5.4 | ||
| 3,000,001 - 4,000,000 | 16 | 55,132,009 | 7.4 | ||
| 4,000,001 - 5,000,000 | 10 | 43,370,817 | 5.9 | ||
| 5,000,001 - 6,000,000 | 6 | 33,464,278 | 4.5 | ||
| 6,000,001 - 7,000,000 | 6 | 38,294,000 | 5.2 | ||
| 7,000,001 - 8,000,000 | 3 | 22,700,000 | 3.1 | ||
| 8,000,001 - 9,000,000 | 4 | 33,989,269 | 4.6 | ||
| 9,000,001 - 10,000,000 | 5 | 49,500,000 | 6.7 | ||
| 10,000,001 - 15,000,000 | 5 | 55,287,870 | 7.5 | ||
| 15,000,001 - 20,000,000 | 2 | 33,783,256 | 4.6 | ||
| 20,000,001 - 30,000,000 | 4 | 92,242,896 | 12.5 | ||
| 30,000,001 - 50,000,000 | 2 | 78,983,225 | 10.7 | ||
| 50,000,001 - 70,000,000 | 1 | 60,000,000 | 8.1 | ||
| 70,000,001 - 73,500,000 | 1 | 73,500,000 | 9.9 | ||
| Total: | 101 | $740,314,909 | 100.0% | ||
| Average: | $7,329,851 | ||||
UNDERWRITTEN NOI DEBT SERVICE COVERAGE RATIO | |||||
| Range of U/W NOI DSCRs (x) | Number of Mortgage Loans | Aggregate Cut- off Date Balance | % of Cut-off Date Balance | ||
| 1.22 - 1.30 | 5 | $63,034,000 | 8.5% | ||
| 1.31 - 1.40 | 16 | 94,351,232 | 12.7 | ||
| 1.41 - 1.50 | 9 | 49,435,947 | 6.7 | ||
| 1.51 - 1.60 | 13 | 56,267,226 | 7.6 | ||
| 1.61 - 1.70 | 12 | 109,992,082 | 14.9 | ||
| 1.71 - 1.80 | 9 | 30,556,464 | 4.1 | ||
| 1.81 - 1.90 | 7 | 157,792,113 | 21.3 | ||
| 1.91 - 2.00 | 5 | 45,229,823 | 6.1 | ||
| 2.01 - 2.25 | 4 | 39,786,403 | 5.4 | ||
| 2.26 - 2.50 | 2 | 44,876,763 | 6.1 | ||
| 3.01 - 3.50 | 2 | 7,987,922 | 1.1 | ||
| 3.51 - 4.00 | 1 | 3,297,340 | 0.4 | ||
| 4.01 - 31.18 | 16 | 37,707,593 | 5.1 | ||
| Total: | 101 | $740,314,909 | 100.0% | ||
| Weighted Average: | 2.21x | ||||
UNDERWRITTEN NCF DEBT SERVICE COVERAGE RATIO | |||||
| Range of U/W NCF DSCRs (x) | Number of Mortgage Loans | Aggregate Cut- off Date Balance | % of Cut-off Date Balance | ||
| 1.20 | 1 | $18,300,000 | 2.5% | ||
| 1.21 - 1.30 | 17 | 118,805,232 | 16.0 | ||
| 1.31 - 1.40 | 8 | 40,515,000 | 5.5 | ||
| 1.41 - 1.50 | 18 | 139,164,804 | 18.8 | ||
| 1.51 - 1.60 | 13 | 55,600,357 | 7.5 | ||
| 1.61 - 1.70 | 8 | 37,499,194 | 5.1 | ||
| 1.71 - 1.80 | 9 | 198,152,922 | 26.8 | ||
| 1.81 - 1.90 | 3 | 33,921,379 | 4.6 | ||
| 1.91 - 2.00 | 2 | 9,440,473 | 1.3 | ||
| 2.01 - 2.25 | 3 | 39,922,694 | 5.4 | ||
| 3.01 - 3.50 | 2 | 7,987,922 | 1.1 | ||
| 3.51 - 4.00 | 1 | 3,297,340 | 0.4 | ||
| 4.01 - 31.18 | 16 | 37,707,593 | 5.1 | ||
| Total: | 101 | $740,314,909 | 100.0% | ||
| Weighted Average: | 2.10x | ||||
| LOAN PURPOSE | |||
| Loan Purpose | Number of Mortgage Loans | Aggregate Cut- off Date Balance | % of Cut-off Date Balance |
| Refinance | 83 | $589,363,602 | 79.6% |
| Acquisition | 17 | 147,309,258 | 19.9 |
| Various | 1 | 3,642,049 | 0.5 |
| Total: | 101 | $740,314,909 | 100.0% |
| MORTGAGE RATE | |||
| Range of Mortgage Rates (%) | Number of Mortgage Loans | Aggregate Cut- off Date Balance | % of Cut-off Date Balance |
| 3.680 - 3.750 | 7 | $21,069,664 | 2.8% |
| 3.751 - 4.000 | 9 | 21,646,475 | 2.9 |
| 4.001 - 4.250 | 7 | 83,472,029 | 11.3 |
| 4.251 - 4.500 | 20 | 163,321,143 | 22.1 |
| 4.501 - 4.750 | 35 | 277,490,406 | 37.5 |
| 4.751 - 5.000 | 16 | 148,715,645 | 20.1 |
| 5.001 - 5.250 | 4 | 20,130,548 | 2.7 |
| 5.251 - 5.500 | 3 | 4,469,000 | 0.6 |
| Total: | 101 | $740,314,909 | 100.0% |
| Weighted Average: | 4.531% | ||
| UNDERWRITTEN NOI DEBT YIELD | |||
| Range of U/W NOI Debt Yields (%) | Number of Mortgage Loans | Aggregate Cut- off Date Balance | % of Cut-off Date Balance |
| 7.5 - 8.0 | 6 | $69,147,000 | 9.3% |
| 8.1 - 9.0 | 19 | 170,423,179 | 23.0 |
| 9.1 - 10.0 | 23 | 132,262,726 | 17.9 |
| 10.1 - 11.0 | 17 | 121,197,584 | 16.4 |
| 11.1 - 12.0 | 8 | 100,812,851 | 13.6 |
| 12.1 - 13.0 | 4 | 41,611,479 | 5.6 |
| 13.1 - 14.0 | 2 | 9,440,473 | 1.3 |
| 14.1 - 15.0 | 2 | 11,550,000 | 1.6 |
| 15.1 - 16.0 | 2 | 39,069,705 | 5.3 |
| 16.1 - 18.0 | 2 | 7,092,319 | 1.0 |
| 18.1 - 124.6 | 16 | 37,707,593 | 5.1 |
| Total: | 101 | $740,314,909 | 100.0% |
| Weighted Average: | 12.7% | ||
| UNDERWRITTEN NCF DEBT YIELD | |||
| Range of U/W NCF Debt Yields (%) | Number of Mortgage Loans | Aggregate Cut- off Date Balance | % of Cut-off Date Balance |
| 7.4 - 8.0 | 17 | $121,621,975 | 16.4% |
| 8.1 - 9.0 | 17 | 178,332,030 | 24.1 |
| 9.1 - 10.0 | 24 | 114,883,638 | 15.5 |
| 10.1 - 11.0 | 17 | 215,034,318 | 29.0 |
| 11.1 - 12.0 | 3 | 20,327,400 | 2.7 |
| 12.1 - 13.0 | 1 | 3,495,931 | 0.5 |
| 13.1 - 14.0 | 2 | 36,076,763 | 4.9 |
| 14.1 - 15.0 | 1 | 1,550,000 | 0.2 |
| 15.1 - 16.0 | 1 | 4,192,942 | 0.6 |
| 16.1 - 18.0 | 2 | 7,092,319 | 1.0 |
| 18.1 - 124.6 | 16 | 37,707,593 | 5.1 |
| Total: | 101 | $740,314,909 | 100.0% |
| Weighted Average: | 12.0% | ||
(1) Information regarding mortgage loans that are cross-collateralized or cross-defaulted with other mortgage loans is based upon the individual loan balances, except that the applicable loan-to-value ratio, debt service coverage ratio and debt yield for each such mortgage loan is based upon the ratio or yield (as applicable) for the aggregate indebtedness evidenced by all loans in the group. On an individual basis, without regard to the cross-collateralization feature, any mortgage loan that is part of a cross-collateralized group of mortgage loans may have a higher loan-to-value ratio, lower debt service coverage ratio and/or lower debt yield than is presented herein. For mortgaged properties securing residential cooperative mortgage loans, the debt service coverage ratio or debt yield for each such mortgaged property is calculated using underwritten net cash flow for the related residential cooperative property which is the projected net cash flow reflected in the most recent appraisal obtained by or otherwise in the possession of the related mortgage loan seller as of the cut-off date and the loan-to-value ratio is calculated based upon the appraised value of the residential cooperative property determined as if such residential cooperative property is operated as a residential cooperative. With respect to the Somerset Park Apartments mortgage loan, which is part of a loan combination, loan-to-value ratio, debt service coverage ratio and debt yield calculations include the related pari passu companion loan(s) (unless otherwise stated). See Annex A-1 to the Free Writing Prospectus. Prepayment provisions for each mortgage loan reflects the entire life of the loan (from origination to maturity or ARD). |
THE INFORMATION IN THIS STRUCTURAL AND COLLATERAL TERM SHEET IS NOT COMPLETE AND MAY BE AMENDED PRIOR TO THE TIME OF SALE. THIS TERM SHEET IS NOT AN OFFER TO SELL THESE SECURITIES AND IT IS NOT A SOLICITATION OF AN OFFER TO BUY THESE SECURITIES IN ANY JURISDICTION WHERE THE OFFER OR SALE IS NOT PERMITTED.
| 16 |
| Wells Fargo Commercial Mortgage Trust 2015-C30 | Characteristics of the Mortgage Pool |
| ORIGINAL TERM TO MATURITY OR ARD | |||||
| Original Terms to Maturity or ARD (months) | Number of Mortgage Loans | Aggregate Cut- off Date Balance | % of Cut-off Date Balance | ||
| 60 | 1 | $3,750,000 | 0.5 | % | |
| 120 | 100 | 736,564,909 | 99.5 | ||
| Total: | 101 | $740,314,909 | 100.0 | % | |
| Weighted Average: | 120 months | ||||
REMAINING TERM TO MATURITY OR ARD | |||||
| Range of Remaining Terms to Maturity or ARD (months) | Number of Mortgage Loans | Aggregate Cut- off Date Balance | % of Cut-off Date Balance | ||
| 58 | 1 | $3,750,000 | 0.5 | % | |
| 115 - 120 | 100 | 736,564,909 | 99.5 | ||
| Total: | 101 | $740,314,909 | 100.0 | % | |
| Weighted Average: | 119 months | ||||
ORIGINAL AMORTIZATION TERM(2) | |||||
| Range of Original Amortization Terms (months) | Number of Mortgage Loans | Aggregate Cut- off Date Balance | % of Cut-off Date Balance | ||
| Non-Amortizing | 5 | $82,350,000 | 11.1 | % | |
| 300 | 4 | 82,720,464 | 11.2 | ||
| 360 | 87 | 558,930,777 | 75.5 | ||
| 480 | 5 | 16,313,668 | 2.2 | ||
| Total: | 101 | $740,314,909 | 100.0 | % | |
| Weighted Average(3): | 355 months | ||||
(2) The original amortization term shown for any mortgage loan that is interest-only for part of its term does not include the number of months in its interest-only period and reflects only the number of months as of the commencement of amortization remaining from the end of such interest-only period. (3) Excludes the non-amortizing mortgage loans.
| |||||
| REMAINING AMORTIZATION TERM(4) | |||||
| Range of Remaining Amortization Terms (months) | Number of Mortgage Loans | Aggregate Cut- off Date Balance | % of Cut-off Date Balance | ||
| Non-Amortizing | 5 | $82,350,000 | 11.1 | % | |
| 297 - 300 | 4 | 82,720,464 | 11.2 | ||
| 355 - 360 | 87 | 558,930,777 | 75.5 | ||
| 478 - 480 | 5 | 16,313,668 | 2.2 | ||
| Total: | 101 | $740,314,909 | 100.0 | % | |
| Weighted Average(5): | 355 months | ||||
(4) The remaining amortization term shown for any mortgage loan that is interest-only for part of its term does not include the number of months in its interest-only period and reflects only the number of months as of the commencement of amortization remaining from the end of such interest-only period. (5) Excludes the non-amortizing mortgage loans.
| |||||
| LOCKBOXES | |||||
| Type of Lockbox | Number of Mortgage Loans | Aggregate Cut- off Date Balance | % of Cut-off Date Balance | ||
| Springing (Without Established Account) | 55 | $447,052,836 | 60.4 | % | |
| Soft/Springing Cash Management | 3 | 113,606,462 | 15.3 | ||
| None | 34 | 100,886,611 | 13.6 | ||
| Hard/Springing Cash Management | 3 | 27,700,000 | 3.7 | ||
| Hard/Upfront Cash Management | 4 | 25,569,000 | 3.5 | ||
| Springing (With Established Account) | 1 | 18,300,000 | 2.5 | ||
| Soft/Upfront Cash Management | 1 | 7,200,000 | 1.0 | ||
| Total: | 101 | $740,314,909 | 100.0 | % | |
PREPAYMENT PROVISION SUMMARY | |||||
| Prepayment Provision | Number of Mortgage Loans | Aggregate Cut- off Date Balance | % of Cut-off Date Balance | ||
| Lockout/Defeasance/Open | 75 | $669,881,211 | 90.5 | % | |
| Lockout/GTR YM or 1%/Open | 8 | 22,687,579 | 3.1 | ||
| GTR YM or 1% / 1% / Open | 18 | 47,746,119 | 6.4 | ||
| Total: | 101 | $740,314,909 | 100.0 | % | |
| CUT-OFF DATE LOAN-TO-VALUE RATIO | ||||
| Range of Cut-off Date LTV Ratios (%) | Number of Mortgage Loans | Aggregate Cut- off Date Balance | % of Cut-off Date Balance | |
| 2.3 - 25.0 | 14 | $33,110,857 | 4.5 | % |
| 25.1 - 30.0 | 3 | 7,894,076 | 1.1 | |
| 30.1 - 35.0 | 1 | 3,794,979 | 0.5 | |
| 35.1 - 40.0 | 2 | 7,335,056 | 1.0 | |
| 50.1 - 55.0 | 8 | 80,494,322 | 10.9 | |
| 55.1 - 60.0 | 10 | 92,504,069 | 12.5 | |
| 60.1 - 65.0 | 7 | 36,759,165 | 5.0 | |
| 65.1 - 70.0 | 18 | 131,134,102 | 17.7 | |
| 70.1 - 75.0 | 38 | 347,288,283 | 46.9 | |
| Total: | 101 | $740,314,909 | 100.0 | % |
| Weighted Average | 63.6% | |||
| BALLOON OR ARD LOAN-TO-VALUE RATIO | ||||
| Range of Balloon LTV Ratios (%) | Number of Mortgage Loans | Aggregate Cut- off Date Balance | % of Cut-off Date Balance | |
| 2.3 - 20.0 | 14 | $33,110,857 | 4.5 | % |
| 20.1 - 25.0 | 3 | 8,339,055 | 1.1 | |
| 25.1 - 30.0 | 1 | 3,350,000 | 0.5 | |
| 30.1 - 35.0 | 2 | 7,335,056 | 1.0 | |
| 35.1 - 45.0 | 11 | 63,235,395 | 8.5 | |
| 45.1 - 50.0 | 6 | 84,783,361 | 11.5 | |
| 50.1 - 55.0 | 13 | 79,882,374 | 10.8 | |
| 55.1 - 60.0 | 16 | 145,303,043 | 19.6 | |
| 60.1 - 65.0 | 28 | 184,963,268 | 25.0 | |
| 65.1 - 70.0 | 6 | 56,512,500 | 7.6 | |
| 70.1 - 72.1 | 1 | 73,500,000 | 9.9 | |
| Total: | 101 | $740,314,909 | 100.0 | % |
| Weighted Average | 54.5% | |||
| AMORTIZATION TYPE | ||||||
| Type of Amortization | Number of Mortgage Loans | Aggregate Cut- off Date Balance | % of Cut-off Date Balance | |||
| Interest-only, Amortizing Balloon | 33 | $316,911,400 | 42.8 | % | ||
| Amortizing Balloon | 59 | 315,484,509 | 42.6 | |||
| Interest-only, Balloon | 5 | 82,350,000 | 11.1 | |||
| Interest-only, Amortizing ARD | 4 | 25,569,000 | 3.5 | |||
| Total: | 101 | $740,314,909 | 100.0 | % | ||
ORIGINAL TERM OF INTEREST-ONLY PERIOD FOR PARTIAL IO LOANS | ||||||
| Range of IO Term (months) | Number of Mortgage Loans | Aggregate Cut- off Date Balance | % of Cut-off Date Balance | |||
| 11 - 12 | 5 | $29,509,900 | 4.0 | % | ||
| 24 | 14 | 171,948,000 | 23.2 | |||
| 36 | 9 | 58,175,000 | 7.9 | |||
| 48 | 3 | 21,397,500 | 2.9 | |||
| 60 | 5 | 39,650,000 | 5.4 | |||
| 84 | 1 | 21,800,000 | 2.9 | |||
| Total: | 37 | $342,480,400 | 46.3 | % | ||
| Weighted Average | 34 months | |||||
SEASONING | ||||||
| Seasoning (months) | Number of Mortgage Loans | Aggregate Cut- off Date Balance | % of Cut-off Date Balance | |||
| 0 | 19 | $68,721,500 | 9.3 | % | ||
| 1 | 49 | 486,439,299 | 65.7 | |||
| 2 | 28 | 171,518,404 | 23.2 | |||
| 3 | 4 | 11,150,875 | 1.5 | |||
| 5 | 1 | 2,484,832 | 0.3 | |||
| Total: | 101 | $740,314,909 | 100.0 | % | ||
| Weighted Average | 1 month | |||||
THE INFORMATION IN THIS STRUCTURAL AND COLLATERAL TERM SHEET IS NOT COMPLETE AND MAY BE AMENDED PRIOR TO THE TIME OF SALE. THIS TERM SHEET IS NOT AN OFFER TO SELL THESE SECURITIES AND IT IS NOT A SOLICITATION OF AN OFFER TO BUY THESE SECURITIES IN ANY JURISDICTION WHERE THE OFFER OR SALE IS NOT PERMITTED.
| 17 |
| Wells Fargo Commercial Mortgage Trust 2015-C30 | Certain Terms and Conditions |
V. Certain Terms and Conditions
| Interest Entitlements: | The interest entitlement of each Class of Offered Certificates on each Distribution Date generally will be the interest accrued during the related Interest Accrual Period on the related Certificate Principal Balance or Notional Amount at the related pass-through rate, net of any prepayment interest shortfalls allocated to that Class for such Distribution Date as described below. If prepayment interest shortfalls arise from voluntary prepayments (without applicable Special Servicer consent) on particular non-specially serviced mortgage loans during any collection period, the applicable Master Servicer is required to make a compensating interest payment to offset those shortfalls, generally up to an amount equal to the portion of its master servicing fees that accrue at one basis pointper annum. The remaining amount of prepayment interest shortfalls will be allocated to reduce the interest entitlement on all Classes of Certificates (other than the Class X-A, X-B, X-E, X-FG and X-H Certificates),pro rata, based on their respective amounts of accrued interest for the related Distribution Date (except with respect to the allocation among the Class A-S, B, C and PEX Certificates as described below under “Allocations and Distributions on the Class A-S, B, C and PEX Certificates”). If a Class receives less than the entirety of its interest entitlement on any Distribution Date, then the shortfall, excluding any shortfall due to prepayment interest shortfalls, will be added to its interest entitlement for the next succeeding Distribution Date. Interest entitlements on the Class D Certificates and the Class C and B regular interests, in that order, may be reduced by certain Trust Advisor expenses (subject to the discussion below under “Allocations and Distributions on the Class A-S, B, C and PEX Certificates”). |
| Principal Distribution Amount: | The Principal Distribution Amount for each Distribution Date generally will be the aggregate amount of principal received or advanced in respect of the mortgage loans, net of any non-recoverable advances and interest thereon that are reimbursed to the applicable Master Servicer, the applicable Special Servicer or the Trustee during the related collection period. Non-recoverable advances and interest thereon are reimbursable from principal collections and advances before reimbursement from other amounts. The Principal Distribution Amount may also be reduced, with a corresponding loss, to the Class D Certificates and the Class C, B and A-S regular interests, then to the Class A-1, A-2, A-3, A-4 and A-SB Certificates and Class A-4FX regular interest (with any losses on the Class A-1, A-2, A-3, A-4 and A-SB Certificates and Class A-4FX regular interest allocatedpro rata according to their respective Certificate Principal Balances immediately prior to that Distribution Date), in that order, in connection with certain Trust Advisor expenses to the extent that interest entitlements on the Class B and C regular interests and the Class D Certificates are insufficient to absorb the effect of the expense on any particular Distribution Date. For a discussion on the allocation of amounts distributable in respect of the Class A-S, B and C regular interests, see “Allocations and Distributions on the Class A-S, B, C and PEX Certificates” below. |
| Distributions: | On each Distribution Date, funds available for distribution from the mortgage loans, net of specified trust fees, expenses and reimbursements will generally be distributed in the following amounts and order of priority (in each case to the extent of remaining available funds): |
1. Class A-1, A-2, A-3, A-4, A-SB, X-A, X-B, X-E, X-FG and X-H Certificates and Class A-4FX regular interest: To interest on the Class A-1, A-2, A-3, A-4, A-SB, X-A, X-B, X-E, X-FG and X-H Certificates and the Class A-4FX regular interest,pro rata, according to their respective interest entitlements. | |
2. Class A-1, A-2, A-3, A-4 and A-SB Certificates and Class A-4FX regular interest: To principal on the Class A-1, A-2, A-3, A-4 and A-SB Certificates and the Class A-4FX regular interest in the following amounts and order of priority: (i) first, to principal on the Class A-SB Certificates, in an amount up to the Principal Distribution Amount for such Distribution Date until their Certificate Principal Balance is reduced to the Class A-SB Planned Principal Balance for such Distribution Date; (ii) second, to principal on the Class A-1 Certificates until their Certificate Principal Balance is reduced to zero, up to the remainder of the Principal Distribution Amount for such Distribution Date; (iii) third, to principal on the Class A-2 Certificates until their Certificate Principal Balance is reduced to zero, up to the remainder of the Principal Distribution Amount for such Distribution Date; (iv) fourth, to principal on the Class A-3 Certificates until their Certificate Principal Balance is reduced to zero, up to the remainder of the Principal Distribution Amount for such Distribution Date; (v) fifth, on apro rata basis, to principal on the Class A-4 Certificates and the Class A-4FX regular interest until their respective Certificate Principal Balances are reduced to zero, up to the remainder of the Principal Distribution Amount for such Distribution Date; and (vi) sixth, to principal on the Class A-SB Certificates until their Certificate Principal Balance is reduced to zero, up to the remainder of the Principal Distribution Amount for such Distribution Date. However, if the Certificate Principal Balance of each and every Class of Principal Balance Certificates, |
THE INFORMATION IN THIS STRUCTURAL AND COLLATERAL TERM SHEET IS NOT COMPLETE AND MAY BE AMENDED PRIOR TO THE TIME OF SALE. THIS TERM SHEET IS NOT AN OFFER TO SELL THESE SECURITIES AND IT IS NOT A SOLICITATION OF AN OFFER TO BUY THESE SECURITIES IN ANY JURISDICTION WHERE THE OFFER OR SALE IS NOT PERMITTED.
| 18 |
| Wells Fargo Commercial Mortgage Trust 2015-C30 | Certain Terms and Conditions |
other than the Class A-1, A-2, A-3, A-4 and A-SB Certificates and the Class A-4FX regular interest, has been reduced to zero as a result of the allocation of Mortgage Loan losses and expenses and any of the Class A-1, A-2, A-3, A-4 and A-SB Certificates and Class A-4FX regular interest remains outstanding, then the Principal Distribution Amount will be distributed on the Class A-1, A-2, A-3, A-4 and A-SB Certificates and the Class A-4FX regular interest,pro rata, based on their respective outstanding Certificate Principal Balances, until their Certificate Principal Balances have been reduced to zero. | |
3. Class A-1, A-2, A-3, A-4 and A-SB Certificates and Class A-4FX regular interest: To reimburse the holders of the Class A-1, A-2, A-3, A-4 and A-SB Certificates and the Class A-4FX regular interest,pro rata, for any previously unreimbursed losses (other than certain Trust Advisor expenses) on the mortgage loans that were previously allocated in reduction of the Certificate Principal Balances of such Classes. | |
4. Class A-S regular interest: To make distributions on the Class A-S regular interest as follows: (a) first, to interest on Class A-S regular interest in the amount of the interest entitlement for that Class; (b) next, to the extent of the portion of the Principal Distribution Amount remaining after distributions in respect of principal to each Class with a higher distribution priority (in this case, the Class A-1, A-2, A-3, A-4 and A-SB Certificates and the Class A-4FX regular interest), to principal on the Class A-S regular interest until its principal balance is reduced to zero; and (c) next, to reimburse the holders of the Class A-S regular interest for any previously unreimbursed losses (other than certain Trust Advisor expenses) on the mortgage loans that were previously allocated to that Class in reduction of its principal balance.
5. Class B regular interest: To make distributions on the Class B regular interest as follows: (a) first, to interest on Class B regular interest in the amount of the interest entitlement for that Class; (b) next, to the extent of the portion of the Principal Distribution Amount remaining after distributions in respect of principal to each Class with a higher distribution priority (in this case, the Class A-1, A-2, A-3, A-4 and A-SB Certificates and the Class A-4FX and A-S regular interests), to principal on the Class B regular interest until its principal balance is reduced to zero; and (c) next, to reimburse the holders of the Class B regular interest for any previously unreimbursed losses (other than certain Trust Advisor expenses) on the mortgage loans that were previously allocated to that Class in reduction of its principal balance.
6. Class C regular interest: To make distributions on the Class C regular interest as follows: (a) first, to interest on Class C regular interest in the amount of the interest entitlement for that Class; (b) next, to the extent of the portion of the Principal Distribution Amount remaining after distributions in respect of principal to each Class with a higher distribution priority (in this case, the Class A-1, A-2, A-3, A-4 and A-SB Certificates and the Class A-4FX, A-S and B regular interests), to principal on the Class C regular interest until its principal balance is reduced to zero; and (c) next, to reimburse the holders of the Class C regular interest for any previously unreimbursed losses (other than certain Trust Advisor expenses) on the mortgage loans that were previously allocated to that Class in reduction of its principal balance. | |
7. Class D Certificates: To make distributions on the Class D Certificates as follows: (a) first, to interest on Class D Certificates in the amount of the interest entitlement for that Class; (b) next, to the extent of the portion of the Principal Distribution Amount remaining after distributions in respect of principal to each Class with a higher distribution priority (in this case, the Class A-1, A-2, A-3, A-4 and A-SB Certificates and the Class A-4FX, A-S, B and C regular interests), to principal on the Class D Certificates until its principal balance is reduced to zero; and (c) next, to reimburse the holders of the Class D Certificates for any previously unreimbursed losses (other than certain Trust Advisor expenses) on the mortgage loans that were previously allocated to that Class in reduction of its principal balance. | |
8. After the Class A-1, A-2, A-3, A-4 and A-SB Certificates, the Class A-4FX, A-S, B and C regular interests and the Class D Certificates are paid all amounts to which they are entitled, the remaining funds available for distribution will be used to pay interest, principal and loss reimbursement amounts (other than certain Trust Advisor expenses) on the Class E, F, G and H Certificates sequentially in that order in a manner analogous to the Class D Certificates. |
THE INFORMATION IN THIS STRUCTURAL AND COLLATERAL TERM SHEET IS NOT COMPLETE AND MAY BE AMENDED PRIOR TO THE TIME OF SALE. THIS TERM SHEET IS NOT AN OFFER TO SELL THESE SECURITIES AND IT IS NOT A SOLICITATION OF AN OFFER TO BUY THESE SECURITIES IN ANY JURISDICTION WHERE THE OFFER OR SALE IS NOT PERMITTED.
| 19 |
| Wells Fargo Commercial Mortgage Trust 2015-C30 | Certain Terms and Conditions |
| Allocations and Distributions on the Class A-S, B, C and PEX Certificates: | On the closing date, the upper-tier REMIC of the issuing entity will issue the Class A-S, Class B and Class C regular interests (each a “regular interest”) which will have outstanding principal balances on the closing date of $51,822,000, $43,493,000 and $31,464,000, respectively. The regular interests will be held in a grantor trust for the benefit of the holders of the Class A-S, B, C and PEX Certificates. The Class A-S, B, C and PEX Certificates will, at all times, represent undivided beneficial ownership interests in a grantor trust that will hold those regular interests. Each class of the Class A-S, B and C Certificates will, at all times, represent an undivided beneficial ownership interest in a percentage of the outstanding principal balance of the regular interest with the same alphabetical class designation. The Class PEX Certificates will, at all times, represent an undivided beneficial ownership interest in the remaining percentages of the outstanding principal balances of the Class A-S, B and C regular interests and which percentage interests are referred to in this Term Sheet as the “Class PEX Component A-S”, “Class PEX Component B” and “Class PEX Component C”, respectively (collectively, the “Class PEX Components”).
Interest, principal, prepayment premiums, yield maintenance charges and voting rights that are allocated to the Class A-S, B or C regular interest will be distributed or allocated, as applicable, as between the Class A-S, B or C Certificates, as applicable, on the one hand, and Class PEX Component A-S, Class PEX Component B or Class PEX Component C, as applicable (and correspondingly, the Class PEX Certificates), on the other hand,pro rata, based on their respective percentage interests in the Class A-S, Class B or Class C regular interests, as applicable. In addition, any losses (including, without limitation, as a result of Trust Advisor expenses) that are allocated to the Class A-S, Class B or Class C regular interest will correspondingly be allocated as between the Class A-S, B or C Certificates, as applicable, on the one hand, and Class PEX Component A-S, Class PEX Component B or Class PEX Component C, as applicable (and correspondingly, the Class PEX Certificates), on the other hand,pro rata, based on their respective percentage interests in the Class A-S, Class B or Class C regular interest, as applicable. For a complete description of the allocations and distributions with respect to the Class A-S regular interest, the Class B regular interest and the Class C regular interest (and correspondingly the Class A-S, B, C and PEX Certificates and the Class PEX Component A-S, Class PEX Component B and Class PEX Component C), see “Description of the Offered Certificates” in the Free Writing Prospectus. See “Material Federal Income Tax Consequences” in the Free Writing Prospectus for a discussion of the tax treatment of the Exchangeable Certificates. |
Exchanging Certificates through Combination and Recombination:
| If you own Class A-S, B and C Certificates, you will be able to exchange them for a proportionate interest in the Class PEX Certificates, and vice versa, as described in the Free Writing Prospectus. You can exchange your Exchangeable Certificates by notifying the Certificate Administrator. If Exchangeable Certificates are outstanding and held by certificateholders, those certificates will receive principal and interest that would otherwise have been payable on the same proportion of certificates exchanged therefor if those certificates were outstanding and held by certificateholders. Any such allocations of principal and interest between classes of Exchangeable Certificates will have no effect on the principal or interest entitlements of any other class of certificates. The Free Writing Prospectus describes the available combinations of Exchangeable Certificates eligible for exchange. |
THE INFORMATION IN THIS STRUCTURAL AND COLLATERAL TERM SHEET IS NOT COMPLETE AND MAY BE AMENDED PRIOR TO THE TIME OF SALE. THIS TERM SHEET IS NOT AN OFFER TO SELL THESE SECURITIES AND IT IS NOT A SOLICITATION OF AN OFFER TO BUY THESE SECURITIES IN ANY JURISDICTION WHERE THE OFFER OR SALE IS NOT PERMITTED.
| 20 |
| Wells Fargo Commercial Mortgage Trust 2015-C30 | Certain Terms and Conditions |
| Allocation of Yield Maintenance and Prepayment Premiums: | If any yield maintenance charge or prepayment premium is collected during any particular collection period with respect to any mortgage loan, then on the distribution date corresponding to that collection period, the certificate administrator will pay that yield maintenance charge or prepayment premium (net of liquidation fees payable therefrom) in the following manner: (1) to each of the Class A-1, A-2, A-3, A-4, A-SB and D Certificates and Class A-4FX, A-S, B and C regular interests, the product of (a) such yield maintenance charge or prepayment premium, (b) the related Base Interest Fraction (as defined in the Free Writing Prospectus) for such class or regular interest, and (c) a fraction, the numerator of which is equal to the amount of principal distributed to such class or regular interest for that distribution date, and the denominator of which is the total amount of principal distributed to all Principal Balance Certificates (other than the Class A-4FX and A-4FL Certificates and the Exchangeable Certificates) and the Class A-4FX, A-S, B and C regular interests for that distribution date, and (2) to the Class X-A Certificates, the excess, if any, of (a) the product of (i) such yield maintenance charge or prepayment premium and (ii) a fraction, the numerator of which is equal to the amount of principal distributed to the Class A-1, A-2, A-3, A-4, A-SB Certificates and Class A-4FX and A-S regular interest for that distribution date, and the denominator of which is the total amount of principal distributed to all Principal Balance Certificates (other than the Class A-4FX and A-4FL Certificates and the Exchangeable Certificates) and the Class A-4FX, A-S, B and C regular interests for that distribution date, over (b) the amount of such yield maintenance charge or prepayment premium distributed to the Class A-1, A-2, A-3, A-4, A-SB Certificates and Class A-4FX and A-S regular interests as described above, and (3) to the Class X-B Certificates, any remaining such yield maintenance charge or prepayment premium not distributed as described above. No prepayment premiums or yield maintenance charges will be distributed to the holders of the Class X-E, X-FG, X-H, E, F, G, H, V or R Certificates. For a description of when prepayment premiums and yield maintenance charges are generally required on the mortgage loans, see Annex A-1 to the Free Writing Prospectus. See also “Risk Factors—Prepayments and Repurchases of the Mortgage Assets Will Affect the Timing of Your Cash Flow and May Affect Your Yield” in the prospectus attached to the Free Writing Prospectus. Prepayment premiums and yield maintenance charges will be distributed on each Distribution Date only to the extent they are actually received on the mortgage loans as of the related Determination Date. |
| Realized Losses: | The Certificate Principal Balances of the Class A-1, A-2, A-3, A-4, A-SB, D, E, F, G and H Certificates, and the Class A-4FX, A-S, B and C regular interests will be reduced without distribution on any Distribution Date as a write-off to the extent of any losses realized on the mortgage loans allocated to such Class or regular interest on such Distribution Date. Such losses (other than certain Trust Advisor expenses) will be applied in the following order, in each case until the related Certificate Principal Balance is reduced to zero: first, to Class H; second, to Class G; third, to Class F; fourth, to Class E; fifth, to Class D; sixth, to the Class C regular interest; seventh, to the Class B regular interest; eighth, to the Class A-S regular interest; and, finally,pro rata, to Classes A-1, A-2, A-3, A-4 and A-SB Certificates and the Class A-4FX regular interest based on their outstanding Certificate Principal Balances. Certain Trust Advisor expenses (if not absorbed by reductions of interest entitlements on the Class D Certificates and the Class C and B regular interests) will be applied as write-offs in a similar manner, except that such write-offs will be applied only to the Class D Certificates, the Class C, B and A-S regular interests, and the Class A-1, A-2, A-3, A-4 and A-SB Certificates and the Class A-4FX regular interest (with any write-offs on the Class A-1, A-2, A-3, A-4 and A-SB Certificates and the Class A-4FX regular interest to be allocatedpro rata according to their respective Certificate Principal Balances immediately prior to that Distribution Date), in that order. Any realized losses allocated to the Class A-S, B and C regular interests will, in turn, be allocated to the Class A-S, B, C and PEX Certificates as described above in “Allocations and Distributions on the Class A-S, B, C and PEX Certificates”.
The notional amount of the Class X-A Certificates will be reduced by the amount of all losses that are allocated to the Class A-1, A-2, A-3, A-4 or A-SB Certificates or the Class A-4FX or A-S regular interests as write-offs in reduction of their Certificate Principal Balances. The notional amount of the Class X-B Certificates will be reduced by the amount of all losses that are allocated to the Class B and C regular interests as write-offs in reduction of their Certificate Principal Balances. The notional amount of the Class X-E Certificates will be reduced by the amount of all losses that are allocated to the Class E Certificates as write-offs in reduction of its Certificate Principal Balance. The notional amount of the Class X-FG Certificates will be reduced by the amount of all losses that are allocated to the Class F or Class G Certificates as write-offs in reduction of their Certificate Principal Balances. The notional amount of the Class X-H Certificates will be reduced by the amount of all losses that are allocated to the Class H Certificates as write-offs in reduction of its Certificate Principal Balance. |
| Debt Service Advances: | The related Master Servicer or, if such Master Servicer fails to do so, the Trustee, will be obligated to advance delinquent debt service payments (other than balloon payments and default interest) and assumed debt service payments on the mortgage loans (including thepari passu mortgage loan but not its relatedpari passucompanion loans), except to the extent any such advance is deemed non-recoverable from collections on the related mortgage loan. In addition, if an |
THE INFORMATION IN THIS STRUCTURAL AND COLLATERAL TERM SHEET IS NOT COMPLETE AND MAY BE AMENDED PRIOR TO THE TIME OF SALE. THIS TERM SHEET IS NOT AN OFFER TO SELL THESE SECURITIES AND IT IS NOT A SOLICITATION OF AN OFFER TO BUY THESE SECURITIES IN ANY JURISDICTION WHERE THE OFFER OR SALE IS NOT PERMITTED.
| 21 |
| Wells Fargo Commercial Mortgage Trust 2015-C30 | Certain Terms and Conditions |
| Appraisal Reduction Amount exists for a given mortgage loan, the interest portion of any debt service advance for such mortgage loan will be reduced, which will have the effect of reducing the amount of interest available for distribution to the Certificates in reverse alphabetical order of their Class designations (except that interest payments on the Class A-1, A-2, A-3, A-4, A-SB, X-A, X-B, X-E, X-FG and X-H Certificates and the Class A-4FX regular interest would be affected on apari passu basis). | |
| Servicing Advances: | The related Master Servicer or, if such Master Servicer fails to do so, the Trustee, will be obligated to make servicing advances with respect to each mortgage loan it services, including the payment of delinquent property taxes, insurance premiums and ground rent, except to the extent that those advances are deemed non-recoverable from collections on the related mortgage loan. The applicable Master Servicer will have the primary obligation to make any servicing advances with respect to the Somerset Park Apartments loan combination. |
Appraisal Reduction Amounts:
| An Appraisal Reduction Amount generally will be created in the amount, if any, by which the principal balance of a required appraisal loan (which is a mortgage loan with respect to which certain defaults, modifications or insolvency events have occurred as further described in the Free Writing Prospectus) plus other amounts overdue or advanced in connection with such mortgage loan exceeds 90% of the appraised value of the related mortgaged property plus certain escrows and reserves (including letters of credit) held with respect to the mortgage loan.
A mortgage loan will cease to be a required appraisal loan when the same has ceased to be a specially serviced mortgage loan (if applicable), has been brought current for at least three consecutive months and no other circumstances exist that would cause such mortgage loan to be a required appraisal loan.
Appraisal Reduction Amounts will affect the amount of debt service advances on the related mortgage loan. Appraisal Reduction Amounts will also be taken into account in the determination of the identity of the Class whose majority constitutes the “majority subordinate certificateholder” and is entitled to appoint the subordinate class representative. |
Clean-Up Call and Exchange Termination:
| On each Distribution Date occurring after the aggregate unpaid principal balance of the mortgage loans is reduced below 1% of the initial aggregate principal balance of the mortgage loans as of the Cut-off Date, certain specified persons will have the option to purchase all of the remaining mortgage loans (and the trust’s interest in all property acquired through exercise of remedies in respect of any mortgage loan) at the price specified in the Free Writing Prospectus. Exercise of the option will terminate the trust and retire the then-outstanding certificates.
If the aggregate Certificate Principal Balances of each of the Class A-1, A-2, A-3, A-4, A-SB, PEX and D Certificates and the Class A-4FX, A-S, B and C regular interests have been reduced to zero, the trust may also be terminated in connection with an exchange of all the then-outstanding certificates, for the mortgage loans and REO properties then remaining in the issuing entity, but all of the holders of those Classes of outstanding certificates would have to voluntarily participate in the exchange.
|
| Liquidation Loan Waterfall: | Following the liquidation of any loan or property, the net liquidation proceeds generally will be applied (after reimbursement of advances and certain trust fund expenses), first, as a recovery of accrued interest, other than delinquent interest that was not advanced as a result of Appraisal Reduction Amounts, second, as a recovery of principal until all principal has been recovered, and then as a recovery of delinquent interest that was not advanced as a result of Appraisal Reduction Amounts. Please see “Description of the Offered Certificates—Distributions—Application of Mortgage Loan Collections” in the Free Writing Prospectus. |
| Majority Subordinate Certificateholder and Subordinate Class Representative: | A subordinate class representative may be appointed by the “majority subordinate certificate-holder”, which will be the holder(s) of a majority of: (a) during a “subordinate control period”, the most subordinate class among the Class E, F, G and H Certificates that has a Certificate Principal Balance, as notionally reduced by any Appraisal Reduction Amounts allocable to that class, that is at least equal to 25% of its total initial principal balance and (b) during a “collective consultation period”, the most subordinate class among the Class E, F, G and H Certificates that has a total principal balance, without regard to Appraisal Reduction Amounts, that is at least equal to 25% of its initial Certificate Principal Balance. The majority subordinate certificateholder will have a continuing right to appoint, remove or replace the subordinate class representative in its sole discretion. This right may be exercised at any time and from time to time. See “Servicing of the Mortgage Loans and Administration of the Trust Fund—The Majority Subordinate Certificateholder and the Subordinate Class Representative” in the Free Writing Prospectus. |
Control and Consultation: | The rights of various parties to replace each Special Servicer and approve or consult with respect to major actions of each Special Servicer will vary according to defined periods. A “subordinate control period” will exist as long as the Class E Certificates have a Certificate Principal Balance, |
THE INFORMATION IN THIS STRUCTURAL AND COLLATERAL TERM SHEET IS NOT COMPLETE AND MAY BE AMENDED PRIOR TO THE TIME OF SALE. THIS TERM SHEET IS NOT AN OFFER TO SELL THESE SECURITIES AND IT IS NOT A SOLICITATION OF AN OFFER TO BUY THESE SECURITIES IN ANY JURISDICTION WHERE THE OFFER OR SALE IS NOT PERMITTED.
| 22 |
| Wells Fargo Commercial Mortgage Trust 2015-C30 | Certain Terms and Conditions |
| net of any Appraisal Reduction Amounts allocable to that class, that is not less than 25% of the initial principal balance of that class (unless a senior consultation period is deemed to occur generally or with respect to a particular mortgage loan, pursuant to clause (ii) of the definition of “senior consultation period”). In general, during a subordinate control period, (i) the subordinate class representative will be entitled to grant or withhold approval of asset status reports prepared, and material servicing actions proposed, by either Special Servicer, and (ii) the majority subordinate certificateholder, or the subordinate class representative on its behalf, will be entitled to terminate and replace each Special Servicer with or without cause, and appoint itself or another person as the applicable successor special servicer. It will be a condition to such appointment that Fitch, Moody’s and Morningstar confirm that the appointment would not result in a qualification, downgrade or withdrawal of any of their then-current ratings of certificates. A “collective consultation period” will exist as long as the Class E Certificates have a Certificate Principal Balance that both (i) as notionally reduced by any Appraisal Reduction Amounts allocable to that class, is less than 25% of its initial principal balance and (ii) without regard to any Appraisal Reduction Amounts allocable to that class, is 25% or more of its initial Certificate Principal Balance (unless a senior consultation period is deemed to occur generally or with respect to a particular mortgage loan, pursuant to clause (ii) of the definition of “senior consultation period”). In general, during a collective consultation period, each Special Servicer will be required to consult with the Trust Advisor (in addition to the subordinate class representative, during a collective consultation period) in connection with asset status reports and material special servicing actions. A “senior consultation period” will exist as long as either (i) the Class E certificates have an aggregate principal balance, without regard to any Appraisal Reduction Amounts allocable to that class, that is less than 25% of its initial principal balance or (ii) during such time as the Class E certificates are the most subordinate class of control-eligible certificates that have a then outstanding principal balance, net of Appraisal Reduction Amounts, at least equal to 25% of its initial principal balance, the then-majority subordinate certificateholder has irrevocably waived its right to appoint a subordinate class representative and to exercise any of the rights of the majority subordinate certificateholder or cause the exercise of the rights of the subordinate class representative and such rights have not been reinstated to a successor majority subordinate certificateholder as set forth in the pooling and servicing agreement. In general, during a senior consultation period, each Special Servicer must seek to consult with the Trust Advisor in connection with asset status reports and material special servicing actions, and, in general, no subordinate class representative will be recognized or have any right to terminate either Special Servicer or approve, direct or consult with respect to servicing matters. With respect to the Somerset Park Apartments loan combination, the rights of the subordinate class representative described above will be subject to the consultation rights of the holder of a relatedpari passu companion loan described under “Loan Combinations” below.
Notwithstanding any contrary description set forth above, with respect to the Somerset Park Apartments mortgage loan, (a) the holder(s) of thepari passu companion loan(s) in the related loan combination (including any subordinate class representative or special servicer under any securitization of suchpari passu companion loan) will have consultation rights with respect to asset status reports and material special servicing actions involving the related loan combination, as provided for in the related intercreditor agreement and as described in the Free Writing Prospectus, and those rights will be in addition to the rights of the subordinate class representative in this transaction described above; and (b) the existence of a subordinate control period, collective consultation period or senior consultation period under the WFCM 2015-C30 pooling and servicing agreement will not limit the consultation rights of the holder(s) of the relatedpari passu companion loan(s).
Notwithstanding any contrary description set forth above, in the event that, with respect to any mortgage loan, the majority subordinate certificateholder or the subordinate class representative is a borrower, a manager of a related mortgaged property, an affiliate of any borrower or manager of a related mortgaged property, or an agent, principal, partner, member, joint venturer, limited partner, employee, representative, director, trustee, advisor or investor in or of a borrower, a manager of the related mortgaged property or an affiliate of any borrower, the majority subordinate certificateholder and the subordinate class representative will have no right to receive asset status reports, to grant or withhold approval of, or consult with respect to, asset status reports prepared, and material servicing actions proposed, by the applicable Special Servicer, with respect to such mortgage loan. |
THE INFORMATION IN THIS STRUCTURAL AND COLLATERAL TERM SHEET IS NOT COMPLETE AND MAY BE AMENDED PRIOR TO THE TIME OF SALE. THIS TERM SHEET IS NOT AN OFFER TO SELL THESE SECURITIES AND IT IS NOT A SOLICITATION OF AN OFFER TO BUY THESE SECURITIES IN ANY JURISDICTION WHERE THE OFFER OR SALE IS NOT PERMITTED.
| 23 |
| Wells Fargo Commercial Mortgage Trust 2015-C30 | Certain Terms and Conditions |
| Replacement of Special Servicer by General Vote of Certificateholders: | During any “collective consultation period” or “senior consultation period”, each Special Servicer may be terminated and replaced upon the affirmative direction of certificate owners holding not less than 75% of the appraisal-reduced voting rights of all certificates, following a proposal from certificate owners holding not less than 25% of the appraisal-reduced voting rights of all certificates. The certificateholders who initiate a vote on a termination and replacement of either Special Servicer without cause must cause Fitch, Moody’s and Morningstar to confirm the then-current ratings of the certificates (or decline to review the matter) and cause the payment of the fees and expenses incurred in the replacement. |
| Appraisal Remedy: | Solely for purposes of determining whether a “subordinate control period” is in effect, whenever either Special Servicer obtains an appraisal or updated appraisal under the pooling and servicing agreement, the subordinate class representative, with respect to the mortgage loans serviced by either Special Servicer will have the right (at its or their expense) to direct such Special Servicer to hire a qualified appraiser to prepare a second appraisal of the mortgaged property. The applicable Special Servicer must thereafter determine whether, based on its assessment of such second appraisal, any recalculation of the Appraisal Reduction Amount is warranted. The Appraisal Reduction Amount, whether based on the first or the second appraisal, will become effective following the second appraisal, except that the Appraisal Reduction Amount based on the first appraisal shall become effective if the subordinate class representative declines to demand a second appraisal within a specified number of business days, or if a second appraisal is not received within 90 days after the direction of the subordinate class representative. In addition, for the same purposes, if there is a material change in the mortgaged property securing any mortgage loan for which an Appraisal Reduction Amount has been calculated, the majority certificateholder of the Class E, F, G or H Certificates or other designated certificateholders will be entitled (at its expense) to present an additional appraisal to such Special Servicer, which will generally be required to recalculate the Appraisal Reduction Amount based upon such additional appraisal. This latter right may not be exercised more frequently than once in any 12-month period for each mortgage loan for which an Appraisal Reduction Amount was calculated and can only be exercised during a subordinate control period or a collective consultation period as further described in the Free Writing Prospectus. |
| Sale of Defaulted Assets: | There will be no “fair value” purchase option. Instead, the pooling and servicing agreement will authorize each Special Servicer to sell defaulted mortgage loans serviced by such Special Servicer to the highest bidder in a manner generally similar to sales of REO properties. The sale of a defaulted loan for less than par plus accrued interest and certain other fees and expenses owed on the loan will be subject to consent or consultation rights of the subordinate class representative and/or Trust Advisor and, in the case of the Somerset Park Apartments mortgage loan, consultation rights of the holder(s) of the relatedpari passu companion loan(s), as described in the Free Writing Prospectus. |
| “As-Is” Appraisals: | Appraisals must be conducted on an “as-is” basis, and must be no more than 9 months old, for purposes of determining Appraisal Reduction Amounts, market value in connection with REO sales, etc. Required appraisals may consist of updates of prior appraisals. Internal valuations by the applicable Special Servicer are permitted if the principal balance of a mortgage loan is less than $2,000,000. |
| Trust Advisor: | The Trust Advisor will perform certain review duties that will generally include a limited annual review of and report regarding each Special Servicer to the Certificate Administrator. The review and report generally will be based on: (a) during a collective consultation period or senior consultation period, any asset status reports and additional information delivered to the Trust Advisor by either Special Servicer with respect to any mortgage loan serviced by such Special Servicer, and/or (b) during a senior consultation period, in addition to the applicable information described above, a meeting with each Special Servicer to conduct a limited review of such Special Servicer’s operational practices on a platform basis in light of the servicing standard. In addition, during any collective consultation period or senior consultation period, each Special Servicer must seek to consult with the Trust Advisor (in addition to the subordinate class representative during a collective consultation period) in connection with material special servicing actions with respect to specially serviced mortgage loans serviced by such Special Servicer. Furthermore, under certain circumstances, but only during a senior consultation period, the Trust Advisor may recommend the replacement of a Special Servicer, in which case the Certificate Administrator will deliver notice of such recommendation to the certificateholders, and certificateholders with specified percentages of the voting rights may direct the replacement of such Special Servicer at their expense.
The Trust Advisor may be removed and replaced without cause upon the affirmative direction of certificates owners holding not less than 75% of the appraisal-reduced voting rights of all certificates, following a proposal from certificate owners holding not less than 25% of the appraisal-reduced voting rights of all certificates. The certificateholders who initiate a vote on a |
THE INFORMATION IN THIS STRUCTURAL AND COLLATERAL TERM SHEET IS NOT COMPLETE AND MAY BE AMENDED PRIOR TO THE TIME OF SALE. THIS TERM SHEET IS NOT AN OFFER TO SELL THESE SECURITIES AND IT IS NOT A SOLICITATION OF AN OFFER TO BUY THESE SECURITIES IN ANY JURISDICTION WHERE THE OFFER OR SALE IS NOT PERMITTED.
| 24 |
| Wells Fargo Commercial Mortgage Trust 2015-C30 | Certain Terms and Conditions |
| termination and replacement of the Trust Advisor without cause must cause Fitch, Moody’s and Morningstar to confirm the then-current ratings of the certificates (or decline to review the matter) and cause the payment of the fees and expenses incurred in the replacement. During any “subordinate control period”, the proposed replacement trust advisor will be subject to the subordinate class representative’s consent (such consent not to be unreasonably withheld). If a proposed termination and replacement of the Trust Advisor is not consummated within 180 days following the initial request of the certificateholders who requested a vote, the proposed termination and replacement shall have no further force or effect. The Trust Advisor generally may be discharged from its duties if and when the Class A-1, A-2, A-3, A-4, A-4FL, A-4FX, A-SB, A-S, B, C, PEX and D Certificates are retired. | |
| Certain Fee Offsets: | If a workout fee is earned by either Special Servicer following a loan default with respect to any mortgage loan that it services, then certain limitations will apply to the collection and retention of a modification fee from the borrower. The modification fee generally must not exceed 1% of the principal balance of the loan as modified. In addition, if the loan re-defaults within a specified period of months and other conditions are satisfied, any subsequent workout or liquidation fee on that loan must be reduced by a portion of the previously-collected modification fee. Furthermore, workout fees, liquidation fees and modification fees collected with respect to any workout, liquidation and/or partial liquidation of a mortgage loan or loan combination that is serviced by a Special Servicer will be subject to an aggregate cap equal to the greater of (i) $1,000,000 and (ii) 1.00% of the stated principal balance of the subject mortgage loan or loan combination. |
| Deal Website: | The Certificate Administrator will be required to maintain a deal website which will include, among other items: (a) summaries of asset status reports prepared by each Special Servicer, (b) inspection reports, (c) appraisals, (d) various “special notices” described in the Free Writing Prospectus, (e) the “Investor Q&A Forum” and (f) a voluntary “Investor Registry”. Investors may access the deal website following execution of a certification and confidentiality agreement. |
| Initial Majority Subordinate Certificateholder: | It is expected that Ellington Management Group, LLC or an affiliate will be the initial majority subordinate certificateholder. |
| Loan Combinations: | The mortgaged property identified on Annex A-1 to the Free Writing Prospectus as Somerset Park Apartments secures both a mortgage loan to be included in the trust fund and one or more other mortgage loans that will not be included in the trust fund, which will bepari passuin right of payment with the trust mortgage loan. The Somerset Park Apartments loan combination will be principally serviced under the pooling and servicing agreement.
As of the closing date, thepari passu companion loans in such loan combinations will be held by the parties identified above under “IV. Characteristics of the Mortgage Pool—B. Summary ofPari Passu Loan Combinations”. |
THE INFORMATION IN THIS STRUCTURAL AND COLLATERAL TERM SHEET IS NOT COMPLETE AND MAY BE AMENDED PRIOR TO THE TIME OF SALE. THIS TERM SHEET IS NOT AN OFFER TO SELL THESE SECURITIES AND IT IS NOT A SOLICITATION OF AN OFFER TO BUY THESE SECURITIES IN ANY JURISDICTION WHERE THE OFFER OR SALE IS NOT PERMITTED.
| 25 |
(THIS PAGE INTENTIONALLY LEFT BLANK)
THE INFORMATION IN THIS STRUCTURAL AND COLLATERAL TERM SHEET IS NOT COMPLETE AND MAY BE AMENDED PRIOR TO THE TIME OF SALE. THIS TERM SHEET IS NOT AN OFFER TO SELL THESE SECURITIES AND IT IS NOT A SOLICITATION OF AN OFFER TO BUY THESE SECURITIES IN ANY JURISDICTION WHERE THE OFFER OR SALE IS NOT PERMITTED.
| 26 |
SOMERSET PARK APARTMENTS |
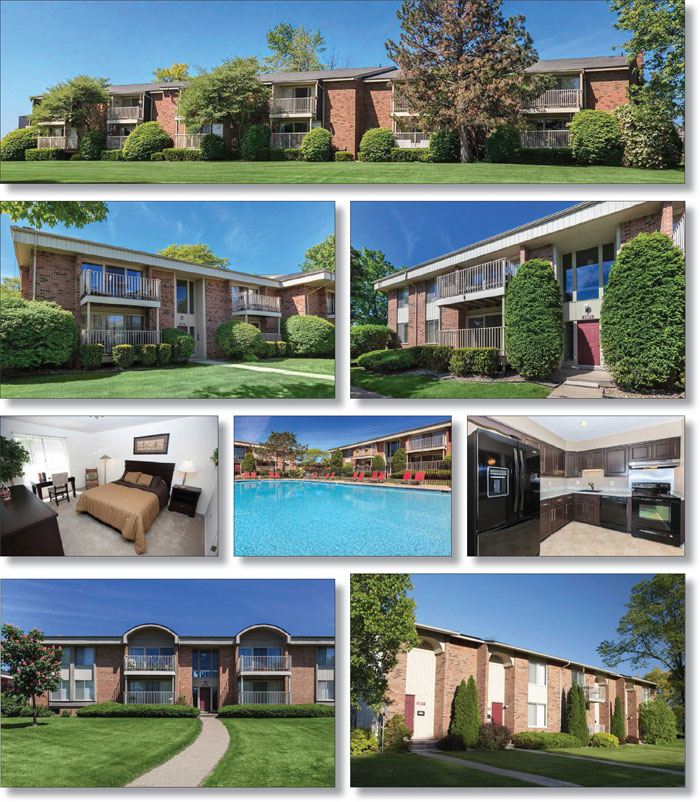
THE INFORMATION IN THIS STRUCTURAL AND COLLATERAL TERM SHEET IS NOT COMPLETE AND MAY BE AMENDED PRIOR TO THE TIME OF SALE. THIS TERM SHEET IS NOT AN OFFER TO SELL THESE SECURITIES AND IT IS NOT A SOLICITATION OF AN OFFER TO BUY THESE SECURITIES IN ANY JURISDICTION WHERE THE OFFER OR SALE IS NOT PERMITTED.
| 27 |
SOMERSET PARK APARTMENTS |
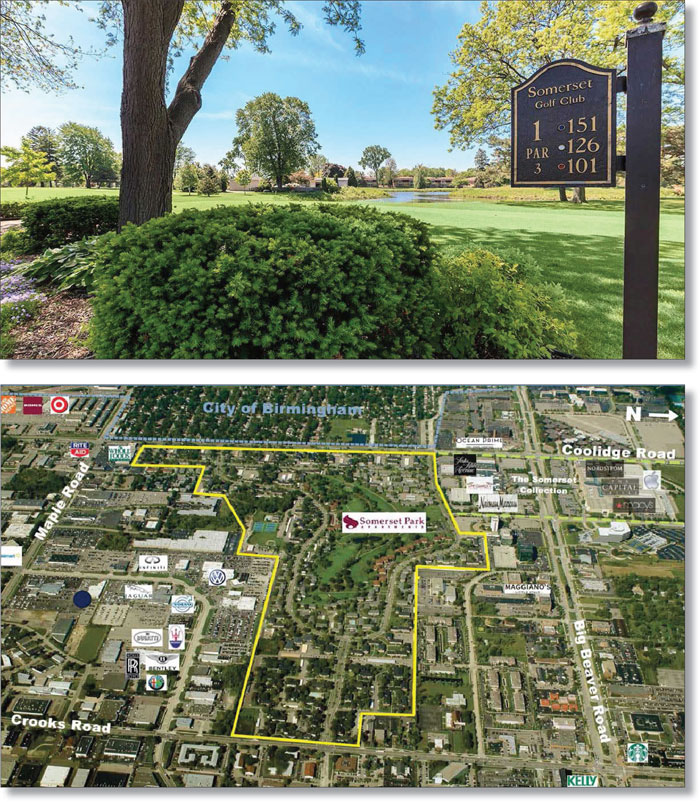
THE INFORMATION IN THIS STRUCTURAL AND COLLATERAL TERM SHEET IS NOT COMPLETE AND MAY BE AMENDED PRIOR TO THE TIME OF SALE. THIS TERM SHEET IS NOT AN OFFER TO SELL THESE SECURITIES AND IT IS NOT A SOLICITATION OF AN OFFER TO BUY THESE SECURITIES IN ANY JURISDICTION WHERE THE OFFER OR SALE IS NOT PERMITTED.
| 28 |
SOMERSET PARK APARTMENTS |

THE INFORMATION IN THIS STRUCTURAL AND COLLATERAL TERM SHEET IS NOT COMPLETE AND MAY BE AMENDED PRIOR TO THE TIME OF SALE. THIS TERM SHEET IS NOT AN OFFER TO SELL THESE SECURITIES AND IT IS NOT A SOLICITATION OF AN OFFER TO BUY THESE SECURITIES IN ANY JURISDICTION WHERE THE OFFER OR SALE IS NOT PERMITTED.
| 29 |
| No. 1 – Somerset Park Apartments | ||||||||
| Loan Information | Property Information | |||||||
| Mortgage Loan Seller: | Rialto Mortgage Finance, LLC | Single Asset/Portfolio: | Single Asset | |||||
Credit Assessment (Fitch/Moody’s/Morningstar): | NR/NR/NR | Property Type: | Multifamily | |||||
| Original Principal Balance(1): | $73,500,000 | Specific Property Type: | Garden | |||||
| Cut-off Date Principal Balance(1): | $73,500,000 | Location: | Troy, MI | |||||
| % of Initial Pool Balance: | 9.9% | Size: | 2,226 Units | |||||
| Loan Purpose: | Acquisition | Cut-off Date Principal Balance Per Unit(1): | $80,863 | |||||
| Borrower Names(2): | Various | Year Built/Renovated: | 1964/2015 | |||||
| Sponsors: | Marc S. Solomon; Mark S. Rosen | Title Vesting: | Fee | |||||
| Mortgage Rate: | 4.550% | Property Manager: | Self-managed | |||||
| Note Date: | June 30, 2015 | 3rdMost Recent Occupancy (As of): | 88.6% (12/31/2012) | |||||
| Anticipated Repayment Date: | NAP | 2ndMost Recent Occupancy (As of): | 85.2% (12/31/2013) | |||||
| Maturity Date: | July 6, 2025 | Most Recent Occupancy (As of): | 89.0% (12/31/2014) | |||||
| IO Period: | 120 months | Current Occupancy (As of): | 90.2% (6/1/2015) | |||||
| Loan Term (Original): | 120 months | |||||||
| Seasoning: | 1 month | Underwriting and Financial Information: | ||||||
| Amortization Term (Original): | NAP | |||||||
| Loan Amortization Type: | Interest-only, Balloon | 3rdMost Recent NOI (As of): | $13,621,953 (12/31/2013) | |||||
| Interest Accrual Method: | Actual/360 | 2ndMost Recent NOI (As of): | $14,090,070 (12/31/2014) | |||||
| Call Protection: | L(25),D(88),O(7) | Most Recent NOI (As of): | $14,747,617 (TTM 5/31/2015) | |||||
| Lockbox Type: | Springing (Without Established Account) | |||||||
| Additional Debt(1): | Yes | U/W Revenues: | $24,789,739 | |||||
| Additional Debt Type(1): | Pari Passu;Future Mezzanine | U/W Expenses: | $9,759,082 | |||||
| U/W NOI: | $15,030,657 | |||||||
| U/W NCF: | $14,719,017 | |||||||
| U/W NOI DSCR(1): | 1.81x | |||||||
| Escrows and Reserves(3): | U/W NCF DSCR(1): | 1.77x | ||||||
| U/W NOI Debt Yield(1): | 8.4% | |||||||
| Type: | Initial | Monthly | Cap (If Any) | U/W NCF Debt Yield(1): | 8.2% | |||
| Taxes | $672,715 | $106,780 | NAP | As-Stabilized Appraised Value(4): | $249,750,000 | |||
| Insurance | $0 | Springing | NAP | As-Stabilized Appraisal Valuation Date(4): | May 20, 2016 | |||
| Replacement Reserves | $26,500,000 | $46,375 | NAP | Cut-off Date LTV Ratio(1)(4): | 72.1% | |||
| Environmental Reserve | $1,875 | $0 | NAP | LTV Ratio at Maturity or ARD(1)(4): | 72.1% | |||
| (1) | The Somerset Park Apartments Loan Combination, totaling $180,000,000, is comprised of sixpari passu notes (Notes A-1-1, A-1-2, A-1-3, A-2-1, A-2-2 and A-2-3). The controlling Notes A-1-1 and A-2-1 had a combined original principal balance of $73,500,000, have a combined outstanding principal balance as of the Cut-Off Date of $73,500,000 and will be contributed to the WFCM 2015-C30 Trust. The non-controlling Notes A-1-2, A-1-3, A-2-2 and A-2-3 had a combined original principal balance of $106,500,000, are currently held by Rialto Mortgage Finance, LLC and are expected to be contributed to a future trust or trusts. All statistical financial information related to the balances per unit, loan-to-value ratios, debt service coverage ratios and debt yields are based on the Somerset Park Apartments Loan Combination. |
| (2) | See “The Borrowers” section. |
| (3) | See “Escrows” section. |
| (4) | The “As-Stabilized” Appraised Value assumes the completion of $14.6 million of capital improvements as of May 20, 2016. An upfront replacement reserve of $26.5 million is in place. The appraiser concluded to an “as-is” appraised value of $227,500,000. The Cut-off Date LTV Ratio and LTV Ratio at Maturity based on the “as-is” value are both 79.1%. |
The Mortgage Loan. The mortgage loan is part of a loan combination (the “Somerset Park Apartments Loan Combination”) that is evidenced by sixpari passu promissory notes (the A-1-1, A-1-2, A-1-3, A-2-1, A-2-2 and A-2-3 notes) secured by a first mortgage encumbering a garden-style multifamily property located in Troy, Michigan (the “Somerset Park Apartments Property”). The Somerset Park Apartments Loan Combination was originated on June 30, 2015 by Rialto Mortgage Finance, LLC. The Somerset Park Apartments Loan Combination had an original principal balance of $180,000,000, has an outstanding principal balance as of the Cut-off Date of $180,000,000 and accrues interest at an interest rate of 4.550%per annum. The Somerset Park Apartments Loan Combination had an initial term of 120 months, has a remaining term of 119 months as of the Cut-off Date and requires payments of interest-only through the term of the Somerset Park Apartments Loan Combination. The Somerset Park Apartments Loan Combination matures on July 6, 2025.
Notes A-1-1 and A-2-1, which will be contributed to the WFCM 2015-C30 Trust, had an aggregate original principal balance of $73,500,000, have an aggregate outstanding balance as of the Cut-Off Date of $73,500,000 and collectively represent the controlling interest in the Somerset Park Apartments Loan Combination. Notes A-1-2, A-1-3, A-2-2 and A-2-3 (the “Somerset Park Apartments Companion Loans”), which are currently held by Rialto Mortgage Finance, LLC and are expected to be contributed to a future trust or trusts, had an aggregate original principal balance of $106,500,000 and each represents a non-controlling interest in the Somerset Park Apartments Loan Combination. See “Description of the Mortgage Pool – Loan Combination-The Somerset Park Apartments Loan Combination” in the Free Writing Prospectus. The lender provides no assurances that each of the Notes A-1-2, A-1-3, A-2-2 and A-2-3 will not be split further.
THE INFORMATION IN THIS STRUCTURAL AND COLLATERAL TERM SHEET IS NOT COMPLETE AND MAY BE AMENDED PRIOR TO THE TIME OF SALE. THIS TERM SHEET IS NOT AN OFFER TO SELL THESE SECURITIES AND IT IS NOT A SOLICITATION OF AN OFFER TO BUY THESE SECURITIES IN ANY JURISDICTION WHERE THE OFFER OR SALE IS NOT PERMITTED.
| 30 |
SOMERSET PARK APARTMENTS |
Following the lockout period, the borrower has the right to defease the Somerset Park Apartments Loan Combination in whole, but not in part, on any date prior to January 6, 2025. In addition, the Somerset Park Apartments Loan Combination is prepayable without penalty on or after January 6, 2025.
Sources and Uses
| Sources | Uses | |||||||
| Original loan combination amount | $180,000,000 | 73.2% | Purchase price | $216,000,000 | 87.8% | |||
| Sponsors’ new cash contribution | 65,943,738 | 26.8 | Reserves | 27,174,590 | 11.0 | |||
| Closing costs | 2,769,148 | 1.1 | ||||||
| Total Sources | $245,943,738 | 100.0% | Total Uses | $245,943,738 | 100.0% |
The Property. The Somerset Park Apartments Property is a 2,226-unit garden-style multifamily property consisting of 158 two-story residential buildings situated on approximately 290.0 acres and located in Troy, Michigan. The Somerset Park Apartments Property is located 20 miles northwest of the Detroit central business district and adjacent to Somerset Collection, an upscale, luxury super-regional mall with more than 180 specialty stores. The Somerset Park Apartments Property was constructed from 1964 to 1970 and features 594 one-bedroom units, 1,500 two-bedroom units (including townhomes) and 132 three-bedroom units (including townhomes). The one-bedroom units have floor plans ranging from 700 to 1,100 square feet and average 860 square feet; the two-bedroom units have floor plans ranging from 850 to 1,600 square feet and average 1,172 square feet; the three-bedroom units have floor plans ranging from 924 to 1,800 square feet and average 1,674 square feet; the two-bedroom townhomes have floor plans ranging from 1,276 to 1,550 square feet and average 1,456 square feet and the three-bedroom townhomes have floor plans totaling 1,600 square feet. Overall, unit sizes range from 700 square feet to 1,800 square feet, with an average unit size of 1,124 square feet. Community amenities consist of a nine-hole golf course, a 16-acre park, a 2.5-mile walking path, five swimming pools with sun decks, a fitness center, eight tennis courts, a sand volleyball court, a basketball court, a softball field, cross-county skiing trails, a children’s playground, a leasing office and an activities center. Unit amenities include fully equipped kitchens, ceramic tiled baths, large closets, private patios/balconies, covered parking, ceiling fans, individual alarm systems, and washer/dryer connections. Selected units feature private entrances and walk-in closets. The Somerset Park Apartments Property contains 4,166 surface and carport parking spaces, reflecting an overall parking ratio of 1.9 spaces per unit. As of June 1, 2015, the Somerset Park Apartments Property was 90.2% occupied.
Following the acquisition of the Somerset Park Apartments Property, the borrowers plan to invest $14.6 million by June 2016 and $34.2 million ($15,364 per unit) in total in the Somerset Park Apartments Property for unit interior renovations, the addition of washer and dryers to each unit and the conversion of the two-bedroom/one bathroom units to two-bedroom/two bathroom units. Additional planned renovations include replacement of all unit windows and updates to all common hallways. Renovations are also planned for the common amenities, including updating the leasing office and activities buildings. Interior unit renovations will take place initially in currently vacant units; the currently occupied units will be renovated thereafter as they turn over, and are expected to be completed within five years.
The following table presents certain information relating to the unit mix of the Somerset Park Apartments Property:
Unit Mix Summary(1)
| Unit Type | No. of Units | % of Total Units | Average Unit Size (SF) | Average U/W Monthly Rent per Unit |
| 1 Bedroom / 1 Bath | 594 | 26.7% | 860 | $813 |
| 2 Bedroom / 1 Bath | 1,022 | 45.9% | 1,068 | $942 |
| 2 Bedroom / 2 Bath | 424 | 19.0% | 1,420 | $1,117 |
| 2 Bedroom / 1.5 Bath Townhouse | 54 | 2.4% | 1,456 | $1,294 |
| 3 Bedroom / 2 Bath | 112 | 5.0% | 1,674 | $1,484 |
| 3 Bedroom / 2.5 Bath Townhouse | 20 | 0.9% | 1,600 | $1,510 |
| Total/Weighted Average | 2,226 | 100.0% | 1,124 | $982 |
| (1) | Information obtained from the underwritten rent roll. |
The following table presents historical occupancy percentages at the Somerset Park Apartments Property:
Historical Occupancy
12/31/2012(1) | 12/31/2013(1) | 12/31/2014(1) | 6/1/2015(2) |
| 88.6% | 85.2% | 89.0% | 90.2% |
| (1) | Information obtained from the borrower. |
| (2) | Information obtained from the underwritten rent roll. |
THE INFORMATION IN THIS STRUCTURAL AND COLLATERAL TERM SHEET IS NOT COMPLETE AND MAY BE AMENDED PRIOR TO THE TIME OF SALE. THIS TERM SHEET IS NOT AN OFFER TO SELL THESE SECURITIES AND IT IS NOT A SOLICITATION OF AN OFFER TO BUY THESE SECURITIES IN ANY JURISDICTION WHERE THE OFFER OR SALE IS NOT PERMITTED.
| 31 |
SOMERSET PARK APARTMENTS |
Operating History and Underwritten Net Cash Flow.The following table presents certain information relating to the historical operating performance and underwritten net cash flow at the Somerset Park Apartments Property:
Cash Flow Analysis
| 2012 | 2013 | 2014 | TTM 5/31/2015 | U/W | % of U/W Effective Gross Income | U/W $ per Unit | |||||||||
| Base Rent | $23,527,795 | $24,671,362 | $25,619,513 | $26,164,959 | $23,671,212 | 95.5% | $10,634 | ||||||||
| Grossed Up Vacant Space | 0 | 0 | 0 | 0 | 2,584,442 | 10.4 | 1,161 | ||||||||
| Concessions | 0 | 0 | 0 | 0 | 0 | 0.0 | 0 | ||||||||
| Other Income | 1,029,576 | 1,072,722 | 1,116,409 | 1,203,420 | 1,203,420 | 4.9 | 541 | ||||||||
| Less Vacancy & Credit Loss | (3,148,730) | (3,238,295) | (3,280,155) | (3,302,927) | (2,669,335)(1) | (10.8) | (1,199) | ||||||||
| Effective Gross Income | $21,408,641 | $22,505,789 | $23,455,767 | $24,065,452 | $24,789,739 | 100.0% | $11,136 | ||||||||
| Total Operating Expenses | $8,411,600 | $8,883,836 | $9,365,697 | $9,317,835 | $9,759,082 | 39.4% | $4,384 | ||||||||
|
|
| |||||||||||||
| Net Operating Income | $12,997,041 | $13,621,953 | $14,090,070 | $14,747,617 | $15,030,657 | 60.6% | $6,752 | ||||||||
| Capital Expenditures | 0 | 0 | 0 | 0 | 311,640 | 1.3 | 140 | ||||||||
| Net Cash Flow | $12,997,041 | $13,621,953 | $14,090,070 | $14,747,617 | $14,719,017 | 59.4% | $6,612 | ||||||||
| NOI DSCR | 1.56x | 1.64x | 1.69x | 1.77x | 1.81x | ||||||||||
| NCF DSCR | 1.56x | 1.64x | 1.69x | 1.77x | 1.77x | ||||||||||
| NOI DY | 7.2% | 7.6% | 7.8% | 8.2% | 8.4% | ||||||||||
| NCF DY | 7.2% | 7.6% | 7.8% | 8.2% | 8.2% |
| (1) | The underwritten economic vacancy is 10.2%. The Somerset Park Apartments Property was 90.2% physically occupied as of June 1, 2015. |
Appraisal.As of the appraisal valuation date of May 20, 2015, the Somerset Park Apartments Property had an “as-is” appraised value of $227,500,000. The appraiser also concluded to an “as-stabilized” value of $249,750,000 with an “as-stabilized” valuation date of May 20, 2016. The “as-stabilized” valuation assumes that $14.6 million in renovations are completed by May 2016. $26.5 million of the $34.2 million in aggregate budgeted renovation costs was reserved upfront.
Environmental Matters.According to a Phase I environmental assessment dated June 2, 2015, there was no evidence of any recognized environmental conditions at the Somerset Park Apartments Property.
Market Overview and Competition. The Somerset Park Apartments Property is located in Troy, Michigan, approximately 20.0 miles northwest of the Detroit central business district. The Detroit metropolitan statistical area’s population of 4.3 million accounts for approximately 43.4% of the state of Michigan. Land uses surrounding the Somerset Park Apartments Property consist of retail and commercial developments along the Big Beaver Road corridor (the primary commercial artery for the neighborhood) interspersed with residential development. The Somerset Collection, located directly adjacent to the Somerset Park Apartments Property, is a super-regional mall containing approximately 1.5 million square feet with more than 180 stores and is anchored by Neiman Marcus, Saks Fifth Avenue, Nordstrom and Macy’s. The area’s largest automobile corridor, the Troy Motor Mall, is located just south of the Somerset Park Apartments Property and offers domestic and import brands as well as luxury brands such as Rolls Royce, Bentley, Bugatti and Lamborghini. Additional retailers are located along Big Beaver Road, the primary commercial corridor in the area, including freestanding and in-line retail, bank branches, and restaurants. Big Beaver Road is also a significant office corridor for the area, with approximately half of the 13.0 million square feet of office space found within the Troy office market. Primary regional access to the neighborhood is provided by Interstate 75, located approximately 1.6 miles east of the Somerset Park Apartments Property. Interstate 75 is the primary north/south freeway through the Detroit metropolitan statistical area and connects to Interstate 696, which is the primary east/west freeway through the northern suburbs of Detroit. Lastly, the Somerset Park Apartments Property is situated two blocks south of Big Beaver Road, the primary east/west commercial thoroughfare through Troy. The estimated 2015 population within a one-, three-, and five-mile radius of the Somerset Park Apartments Property is 8,471, 89,070, and 242,570, respectively, and the average household income within the same radii is $84,985, $100,794, and $98,333, respectively.
According to a third party market research report, the Somerset Park Apartments Property is located in the Detroit multifamily market and the Troy/Birmingham multifamily submarket. As of fourth quarter 2014, the Detroit multifamily market contained 214,301 units, with a 3.0% vacancy rate, and average monthly asking rent of $901 per unit. As of fourth quarter 2014, the Troy/Birmingham multifamily submarket contained 8,748 units, with a 2.0% vacancy rate, and average monthly asking rent of $1,137 per unit.
THE INFORMATION IN THIS STRUCTURAL AND COLLATERAL TERM SHEET IS NOT COMPLETE AND MAY BE AMENDED PRIOR TO THE TIME OF SALE. THIS TERM SHEET IS NOT AN OFFER TO SELL THESE SECURITIES AND IT IS NOT A SOLICITATION OF AN OFFER TO BUY THESE SECURITIES IN ANY JURISDICTION WHERE THE OFFER OR SALE IS NOT PERMITTED.
| 32 |
SOMERSET PARK APARTMENTS |
The following table presents certain information relating to comparable multifamily properties for the Somerset Park Apartments Property:
Competitive Set(1)
| Somerset Park Apartments (Subject) | Eagles Landing of Troy | Village Green of Troy | Charter Square Apartments | Buckingham Square Apartments | Amber Creek Village | |
| Location | Troy, MI | Troy, MI | Troy, MI | Troy, MI | Troy, MI | Troy, MI |
| Distance to Subject | - | 3.0 miles | 2.6 miles | 1.9 miles | 4.4 miles | 2.1 miles |
| Property Type | Garden | Garden | Mid-Rise | Garden | Garden | Garden |
| Number of Units | 2,226 | 544 | 168 | 492 | 146 | 91 |
| Average Rent (per unit) | ||||||
| Studio | NAP | NAP | NAP | NAP | NAP | $695-$745 |
| 1BR | $813 | $775-$915 | $850 | $780-$825 | $865-$955 | $795-$895 |
| 2BR | $942-$1,294 | $835-$1,000 | $890-$975 | $885-$910 | $985-$1,280 | $895-$1,345 |
| 3BR | $1,484-$1,510 | NAP | NAP | $1,119-$1,130 | $1,525 | NAP |
| Utilities | Paid by Tenant | Paid by Tenant | Paid by Tenant | Paid by Tenant | Paid by Tenant | Paid by Tenant |
| Total Occupancy | 90% | 97% | 99% | 98% | 98% | 99% |
| (1) | Information obtained from the appraisal and underwritten rent roll. |
The Borrowers.The borrowers, Troy Apts I, LLC, Troy Apts II, LLC, Troy Apts III, LLC and Troy Apts IV, LLC, are tenant-in-common borrowers, each structured as a single purpose entity with two independent directors. Legal counsel to the borrowers delivered a non-consolidation opinion in connection with the origination of the Somerset Park Apartments Loan Combination. Marc S. Solomon and Mark S. Rosen are the guarantors of certain nonrecourse carveouts under the Somerset Park Apartments Loan Combination.
The Sponsors. The sponsors, Marc S. Solomon and Mark S. Rosen, are founders and principals of The Solomon Organization. Mr. Solomon has over 40 years of commercial real estate experience and has participated in commercial real estate transactions in excess of $2.0 billion as a principal. Mr. Rosen, a principal of The Solomon Organization, has over 30 years of commercial real estate experience and has served as a past president of the New Jersey Apartment Association. The Solomon Organization owns and manages over 12,000 multifamily units in Connecticut, Michigan, New Jersey, New York and Pennsylvania.
Escrows.The loan documents provide for upfront escrows in the amount of$672,715 for real estate taxes, $1,875 for an environmental reserve and $26,500,000 for a capital expenditure reserve. The loan documents also provide for ongoing monthly reserves in the amount of $106,780 for real estate taxes and $46,375 for replacement reserves. The loan documents do not require monthly escrows for insurance provided that (i) no event of default has occurred and is continuing; (ii) the Somerset Park Apartments Property is insured via an acceptable blanket insurance policy; and (iii) the borrowers provide the lender with evidence of renewal of the insurance policies and timely proof of payment of the insurance premiums when due.
The $26.5 million upfront capital expenditure reserve will be used for unit interior renovations ($13,680,000), the addition of washer and dryers to each unit ($6,100,000) and the conversion of the two-bedroom/one bathroom units to two-bedroom/two-bathroom units ($3,350,000). Additional renovations include replacement of all unit windows and updates to all common hallways. Improvements are also planned for the common amenities, including updating the leasing office and activities buildings. The borrowers plan to spend approximately $34.2 million ($15,364 per unit) on the renovation, of which $14.6 million is expected to be completed by June 2016. Funds in the capital expenditure reserve will be released as renovations are completed until a balance of $5.0 million is reached, which will not be released to the borrowers until the $26.5 million in capital improvements are completed and the Somerset Park Apartments Property achieves a net operating income debt yield of at least 8.75% based on the trailing twelve months performance.
Lockbox and Cash Management. Upon the occurrence and continuance of a Cash Management Trigger Event (as defined below), the Somerset Park Apartments Loan Combination requires the borrowers to establish a lender-controlled lockbox account. The loan documents also require that all revenues received by the borrowers or the property manager be deposited into the lockbox account within five business days of receipt. Other than during a Cash Sweep Event (as defined below), all excess funds on deposit are disbursed to the borrowers.
A “Cash Management Trigger Event” will commence upon the occurrence of (i) an event of default; or (ii) any bankruptcy action of any of the borrowers, the guarantors or the property manager. A Cash Management Trigger Event will end with respect to clause (i), when such event of default has been cured, and with respect to clause (ii), when such bankruptcy petition has been discharged, stayed, or dismissed, within 90 days for the borrowers or guarantors and 120 days for the property manager, among other conditions. The bankruptcy of the property manager may also be cured by the borrowers replacing the property manager with a qualified manager acceptable to the lender.
A “Cash Sweep Event” will commence upon the occurrence of (i) an event of default; or (ii) any bankruptcy action of any of the borrowers, the guarantors, or the property manager. A Cash Sweep Event will end with respect to clause (i), when such event of default has been cured, and with respect to clause (ii), when such bankruptcy petition has been discharged, stayed, or dismissed, within 90 day for the borrowers or guarantors and 120 days for the property manager, among other conditions. The bankruptcy of the property manager may also be cured by the borrowers replacing the property manager with a qualified manager acceptable to the lender.
Property Management. The Somerset Park Apartments Property is managed by an affiliate of the borrowers.
THE INFORMATION IN THIS STRUCTURAL AND COLLATERAL TERM SHEET IS NOT COMPLETE AND MAY BE AMENDED PRIOR TO THE TIME OF SALE. THIS TERM SHEET IS NOT AN OFFER TO SELL THESE SECURITIES AND IT IS NOT A SOLICITATION OF AN OFFER TO BUY THESE SECURITIES IN ANY JURISDICTION WHERE THE OFFER OR SALE IS NOT PERMITTED.
| 33 |
SOMERSET PARK APARTMENTS |
Assumption.The borrowers have the right to transfer the Somerset Park Apartments Property, provided that no event of default has occurred and is continuing and certain other conditions are satisfied, including, but not limited to (i) the lender’s reasonable determination that the proposed transferee and guarantor satisfy the lender’s credit review and underwriting standards, taking into consideration transferee experience, financial strength and general business standing; (ii) execution of a recourse guaranty and an environmental indemnity by an affiliate of the transferee; and (iii) if requested by the lender, rating agency confirmation from Fitch, Moody’s and Morningstar that the transfer will not result in a downgrade, withdrawal or qualification of the respective ratings assigned to the Series 2015-C30 Certificates and similar confirmations from each rating agency rating securities backed by the Somerset Park Apartments Companion Loans.
Partial Release.Not permitted.
Real Estate Substitution.Not permitted.
Ground Lease. None.
Subordinate and Mezzanine Indebtedness.Provided no event of default has occurred and is continuing, the borrowers have the right to incur mezzanine financing subject to the satisfaction of certain conditions, including, but not limited to (i) the execution of an intercreditor agreement in form and substance acceptable to the lender and each of Fitch, Moody’s and Morningstar; (ii) the combined loan-to-value ratio is not greater than 75.0%; (iii) the combined debt service coverage ratio is not less than 1.25x; and (iv) the lender receives rating agency confirmation from Fitch, Moody’s and Morningstar that the mezzanine financing will not result in a downgrade, withdrawal or qualification of the respective ratings assigned to the Series 2015-C30 Certificates.
Terrorism Insurance.The loan documents require that the “all risk” insurance policy required to be maintained by the borrowers provide coverage for terrorism in an amount equal to the full replacement cost of the Somerset Park Apartments Property, as well as business interruption insurance covering no less than the 18-month period following the occurrence of a casualty event, together with a 12-month extended period of indemnity.
THE INFORMATION IN THIS STRUCTURAL AND COLLATERAL TERM SHEET IS NOT COMPLETE AND MAY BE AMENDED PRIOR TO THE TIME OF SALE. THIS TERM SHEET IS NOT AN OFFER TO SELL THESE SECURITIES AND IT IS NOT A SOLICITATION OF AN OFFER TO BUY THESE SECURITIES IN ANY JURISDICTION WHERE THE OFFER OR SALE IS NOT PERMITTED.
| 34 |
(THIS PAGE INTENTIONALLY LEFT BLANK)
THE INFORMATION IN THIS STRUCTURAL AND COLLATERAL TERM SHEET IS NOT COMPLETE AND MAY BE AMENDED PRIOR TO THE TIME OF SALE. THIS TERM SHEET IS NOT AN OFFER TO SELL THESE SECURITIES AND IT IS NOT A SOLICITATION OF AN OFFER TO BUY THESE SECURITIES IN ANY JURISDICTION WHERE THE OFFER OR SALE IS NOT PERMITTED.
| 35 |
RIVERPARK SQUARE

THE INFORMATION IN THIS STRUCTURAL AND COLLATERAL TERM SHEET IS NOT COMPLETE AND MAY BE AMENDED PRIOR TO THE TIME OF SALE. THIS TERM SHEET IS NOT AN OFFER TO SELL THESE SECURITIES AND IT IS NOT A SOLICITATION OF AN OFFER TO BUY THESE SECURITIES IN ANY JURISDICTION WHERE THE OFFER OR SALE IS NOT PERMITTED.
| 36 |
RIVERPARK SQUARE

THE INFORMATION IN THIS STRUCTURAL AND COLLATERAL TERM SHEET IS NOT COMPLETE AND MAY BE AMENDED PRIOR TO THE TIME OF SALE. THIS TERM SHEET IS NOT AN OFFER TO SELL THESE SECURITIES AND IT IS NOT A SOLICITATION OF AN OFFER TO BUY THESE SECURITIES IN ANY JURISDICTION WHERE THE OFFER OR SALE IS NOT PERMITTED.
| 37 |
RIVERPARK SQUARE
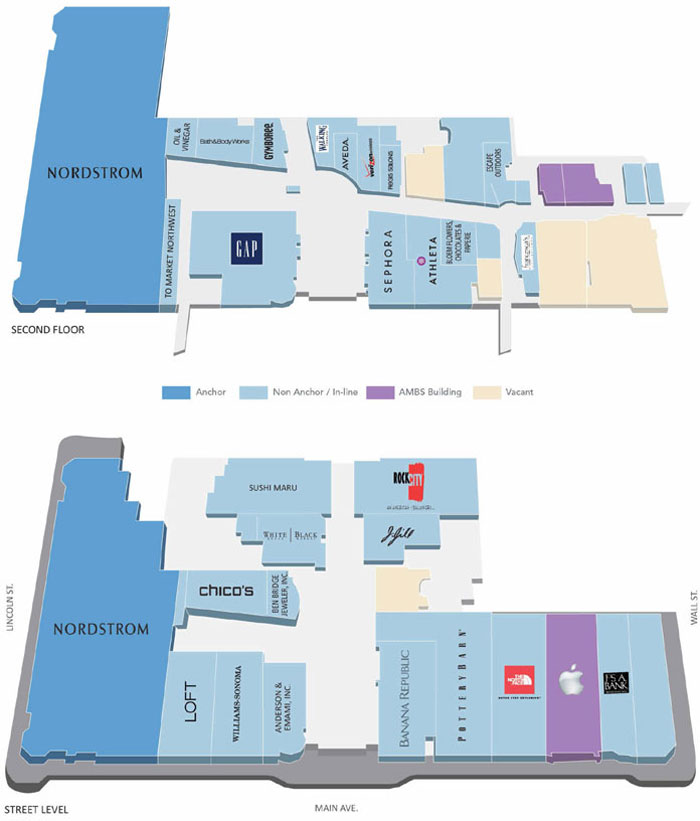
THE INFORMATION IN THIS STRUCTURAL AND COLLATERAL TERM SHEET IS NOT COMPLETE AND MAY BE AMENDED PRIOR TO THE TIME OF SALE. THIS TERM SHEET IS NOT AN OFFER TO SELL THESE SECURITIES AND IT IS NOT A SOLICITATION OF AN OFFER TO BUY THESE SECURITIES IN ANY JURISDICTION WHERE THE OFFER OR SALE IS NOT PERMITTED.
| 38 |
RIVERPARK SQUARE
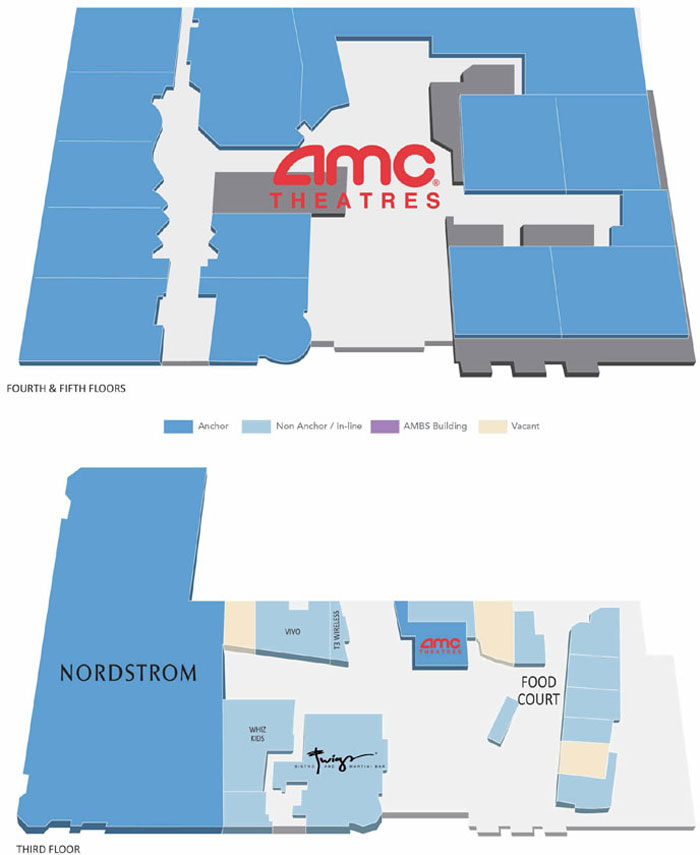
THE INFORMATION IN THIS STRUCTURAL AND COLLATERAL TERM SHEET IS NOT COMPLETE AND MAY BE AMENDED PRIOR TO THE TIME OF SALE. THIS TERM SHEET IS NOT AN OFFER TO SELL THESE SECURITIES AND IT IS NOT A SOLICITATION OF AN OFFER TO BUY THESE SECURITIES IN ANY JURISDICTION WHERE THE OFFER OR SALE IS NOT PERMITTED.
| 39 |
| No. 2 – Riverpark Square | |||||||
| Loan Information | Property Information | ||||||
| Mortgage Loan Seller: | Wells Fargo Bank, National Association | Single Asset/Portfolio: | Single Asset | ||||
Credit Assessment (Fitch/Moody’s/Morningstar): | NR/NR/NR | Property Type: | Retail | ||||
| Original Principal Balance: | $60,000,000 | Specific Property Type: | Regional Mall | ||||
| Cut-off Date Principal Balance: | $60,000,000 | Location: | Spokane, WA | ||||
| % of Initial Pool Balance: | 8.1% | Size(2): | 374,490 SF | ||||
| Loan Purpose: | Refinance | Cut-off Date Principal Balance Per SF: | $160.22 | ||||
| Borrower Name: | River Park Square, L.L.C. | Year Built/Renovated: | 1973/2001 | ||||
| Sponsor: | Cowles Company | Title Vesting: | Fee | ||||
| Mortgage Rate: | 4.130% | Property Manager: | Self-managed | ||||
| Note Date: | July 7, 2015 | 3rdMost Recent Occupancy (As of): | 94.0% (12/31/2012) | ||||
| Anticipated Repayment Date: | NAP | 2ndMost Recent Occupancy (As of): | 97.0% (12/31/2013) | ||||
| Maturity Date: | July 11, 2025 | Most Recent Occupancy (As of): | 97.0% (12/31/2014) | ||||
| IO Period: | 24 months | Current Occupancy (As of): | 95.3% (5/1/2015) | ||||
| Loan Term (Original): | 120 months | ||||||
| Seasoning: | 1 month | Underwriting and Financial Information: | |||||
| Amortization Term (Original): | 360 months | ||||||
| Loan Amortization Type: | Interest-only, Amortizing Balloon | 3rdMost Recent NOI (As of): | $6,744,460 (12/31/2013) | ||||
| Interest Accrual Method: | Actual/360 | 2ndMost Recent NOI (As of): | $6,811,303 (12/31/2014) | ||||
| Call Protection: | L(25),D(91),O(4) | Most Recent NOI (As of): | $6,796,876 (TTM 4/30/2015) | ||||
| Lockbox Type: | Soft/Springing Cash Management | ||||||
| Additional Debt: | None | U/W Revenues: | $11,860,049 | ||||
| Additional Debt Type: | NAP | U/W Expenses: | $5,304,051 | ||||
| U/W NOI: | $6,555,998 | ||||||
| Escrows and Reserves(1): | U/W NCF: | $6,046,393 | |||||
| U/W NOI DSCR: | 1.88x | ||||||
| Type: | Initial | Monthly | Cap (If Any) | U/W NCF DSCR: | 1.73x | ||
| Taxes | $226,542 | $75,514 | NAP | U/W NOI Debt Yield: | 10.9% | ||
| Insurance | $0 | Springing | NAP | U/W NCF Debt Yield: | 10.1% | ||
| Replacement Reserves | $0 | Springing | NAP | As-Is Appraised Value(3): | $110,000,000 | ||
| TI/LC Reserve | $0 | Springing | NAP | As-Is Appraisal Valuation Date(3): | May 29, 2015 | ||
| Outstanding TI Reserve | $5,051,064 | $0 | NAP | Cut-off Date LTV Ratio(3): | 54.5% | ||
| Apple Reserve | $0 | Springing | NAP | LTV Ratio at Maturity or ARD(3): | 46.1% | ||
| (1) | See “Escrows” section. |
| (2) | The square footage includes 13,951 square feet that is leased by the borrower in the AMBS Building, which is owned by an unaffiliated third party, and subleased to certain retail tenants, including Apple, Inc. See “Property” section. |
| (3) | The appraiser concluded to an “As-Stabilized” value of $116,000,000 based on an As-Stabilized valuation date of December 1, 2015. The as-stabilized value is primarily based on the payment of tenant improvement costs related to AMC Theater and Twigs Bistro & Martini Bar, which were reserved upfront. The As-Stabilized Cut-off Date LTV Ratio is 51.7% and the As-Stabilized LTV Ratio at Maturity is 43.7%. |
The Mortgage Loan.The mortgage loan (the “Riverpark Square Mortgage Loan”) is evidenced by a single promissory note that is secured by a first mortgage encumbering a regional mall located in Spokane, Washington (the “Riverpark Square Property”). The Riverpark Square Mortgage Loan was originated on July 7, 2015 by Wells Fargo Bank, National Association. The Riverpark Square Mortgage Loan had an original principal balance of $60,000,000, has an outstanding principal balance as of the Cut-off Date of $60,000,000 and accrues interest at an interest rate of 4.130%per annum. The Riverpark Square Mortgage Loan had an initial term of 120 months, has a remaining term of 119 months as of the Cut-off Date and requires interest-only payments for the first 24 payments following origination, and thereafter, requires payments of principal and interest based on a 30-year amortization schedule. The Riverpark Square Mortgage Loan matures on July 11, 2025.
Following the lockout period, the borrower has the right to defease the Riverpark Square Mortgage Loan in whole, but not in part, on any date before April 11, 2025. In addition, the Riverpark Square Mortgage Loan is prepayable without penalty on or after April 11, 2025.
THE INFORMATION IN THIS STRUCTURAL AND COLLATERAL TERM SHEET IS NOT COMPLETE AND MAY BE AMENDED PRIOR TO THE TIME OF SALE. THIS TERM SHEET IS NOT AN OFFER TO SELL THESE SECURITIES AND IT IS NOT A SOLICITATION OF AN OFFER TO BUY THESE SECURITIES IN ANY JURISDICTION WHERE THE OFFER OR SALE IS NOT PERMITTED.
| 40 |
RIVERPARK SQUARE
Sources and Uses
| Sources | Uses | ||||||||
| Original loan amount | $60,000,000 | 100.0% | Loan payoff(1) | $48,951,818 | 81.6 | % | |||
| Reserves | 5,277,606 | 8.8 | |||||||
| Closing costs | 506,933 | 0.8 | |||||||
| Return of equity | 5,263,643 | 8.8 | |||||||
| Total Sources | $60,000,000 | 100.0% | Total Uses | $60,000,000 | 100.0 | % |
| (1) | The Riverpark Square Property was previously securitized in the GCCFC 2005-GG5 transaction. |
The Property.The Riverpark Square Property is a five-story regional mall totaling 374,490 square feet located in the central business district of Spokane, Washington. Originally built in 1973, the sponsor razed and rebuilt the Riverpark Square Property in two phases in 1999 and 2000, with Phase I consisting of the Nordstrom anchor and retail space west of the atrium (including 14 of AMC Theater’s 20 screens), and Phase II consisting of retail space east of the atrium (including the other six AMC Theater screens).The Riverpark Square Property is comprised of five buildings that are connected via a second floor skyway and features a four-level atrium with glass panel skylights providing ample natural light. The atrium includes the main entrance off Main Avenue, escalator access to the upper floors, and access to the north-south and east-west corridors containing the remainder of the small shop space. The sponsor has a reported total cost basis of approximately $96.5 million.
The Riverpark Square Property is anchored by Nordstrom, located at the west end of the Riverpark Square Property, and AMC Theater, located on the entire fourth and fifth floors, both of which have been in occupancy for over 15 years. Other major tenants include Apple, Inc. (“Apple”), Banana Republic, Pottery Barn and The North Face; however, no other tenant (outside of the anchors) represents more than 4.4% of the net rentable area. There are no other Nordstrom locations in the Inland Northwest region and the nearest Nordstrom store is located approximately 220 miles west of the Riverpark Square Property in Seattle, Washington. AMC Theater recently executed a lease amendment extending its lease for a 15-year term following the completion of an approximate $8.0 million renovation to its space. AMC Theater will fund approximately $4.0 million of the renovations, which include installing new seating, upgrading the sight and sound equipment, updating the concessions area and installing a bar and lounge. The Riverpark Square Property has averaged 95.0% occupancy since 2006, and has generated total sales of approximately $97.3 million in 2011, $106.9 million in 2012, $122.3 million in 2013 and $111.0 million in 2014. Parking at the Riverpark Square Property is provided via a ten-story parking garage containing 1,302 parking spaces and three additional surface lots for a total of 1,305 parking spaces resulting in a parking ratio of 3.5 spaces per 1,000 square feet of net rentable area. As of May 1, 2015, the Riverpark Square Property was 95.3% occupied by 46 tenants.
The overall center includes a 13,951 square foot building (“AMBS Building”) that is integrated as part of the Riverpark Square Property but is owned by an unaffiliated third party and the related income is not considered in the appraised value. The borrower leases the entire AMBS Building and subleases 9,773 square feet to retail tenants, including Apple, and such lease and subleases have been assigned to the lender. The AMBS Building lease expires on January 31, 2031 and is guaranteed by the sponsor. See the “Cash Flow Analysis” section below.
THE INFORMATION IN THIS STRUCTURAL AND COLLATERAL TERM SHEET IS NOT COMPLETE AND MAY BE AMENDED PRIOR TO THE TIME OF SALE. THIS TERM SHEET IS NOT AN OFFER TO SELL THESE SECURITIES AND IT IS NOT A SOLICITATION OF AN OFFER TO BUY THESE SECURITIES IN ANY JURISDICTION WHERE THE OFFER OR SALE IS NOT PERMITTED.
| 41 |
RIVERPARK SQUARE
The following table presents certain information relating to the tenancy at the Riverpark Square Property:
Major Tenants
| Tenant Name | Credit Rating (Fitch/ Moody’s/ S&P)(1) | Tenant NRSF | % of NRSF | Annual U/W Base Rent PSF(2) | Annual U/W Base Rent(2) | % of Total Annual U/W Base Rent | Sales PSF(3) | Occupancy Cost(3) | Lease Expiration Date |
| Anchor Tenant – Collateral | |||||||||
| Nordstrom | BBB+/Baa1/A- | 128,975 | 34.4% | $10.08 | $1,300,000 | 21.9% | $215 | 4.7% | 2/28/2020 |
| AMC Theater | NR/NR/B+ | 80,811 | 21.6% | $15.00 | $1,212,165 | 20.4% | $325,537(4) | 21.2% | 12/31/2030(5) |
| Total Anchor Tenant – Collateral | 209,786 | 56.0% | $11.97 | $2,512,165 | 42.2% | ||||
| Major Tenants – Collateral | |||||||||
| Twigs Bistro & Martini Bar(6) | NR/NR/NR | 7,672 | 2.0% | $28.00(6) | $214,816(6) | 3.6% | $267 | 14.5% | 10/31/2025 |
| Apple(7) | NR/Aa1/AA+ | 7,059(7) | 1.9% | $30.00 | $211,770 | 3.6% | $4,784 | 0.9% | 1/31/2021 |
| Banana Republic | BBB-/Baa3/BBB- | 6,519 | 1.7% | $30.80 | $200,785 | 3.4% | $291 | 14.0% | 1/31/2020 |
| Pottery Barn | NR/NR/NR | 9,600 | 2.6% | $20.59 | $197,664 | 3.3% | $366 | 11.1% | 1/31/2023 |
| The North Face | NR/A3/A | 7,381 | 2.0% | $23.00 | $169,763 | 2.9% | $266 | 13.6% | 1/31/2022(8) |
| Total Major Tenants – Collateral | 38,231 | 10.2% | $26.02 | $994,798 | 16.7% | ||||
| Non-Major Tenants – Collateral | 108,712 | 29.0% | $22.47 | $2,442,587 | 41.1% | ||||
| Occupied Collateral Total | 356,729 | 95.3% | $16.68 | $5,949,550 | 100.0% | ||||
| Vacant Space | 17,761 | 4.7% | |||||||
| Collateral Total | 374,490(7) | 100.0% | |||||||
| (1) | Certain ratings are those of the parent company whether or not the parent guarantees the lease. |
| (2) | Annual U/W Base Rent PSF and Annual U/W Base Rent include contractual rent bumps through February 2016, totaling $57,881. |
| (3) | Sales and occupancy costs are for the trailing 12-month period ending December 31, 2014. |
| (4) | Sales PSF for AMC Theater reflect the sales per screen based on 20 screens. |
| (5) | AMC Theater executed a lease amendment that extends the lease term for 15 years following the completion of a $8.0 million renovation of the AMC Theater space. The renovation is expected to be complete by December 31, 2015. |
| (6) | Twigs Bistro & Martini Bar is currently closed as the tenant completes the build out of its expansion space and rent will recommence on October 8, 2015. All related outstanding tenant improvement expenses and free rent have been reserved upfront. |
| (7) | Apple is located in the AMBS Building that is incorporated with but not owned by the borrower. The borrower leases the entire AMBS Building from an unaffiliated third party and in turn subleases that space to tenants. |
| (8) | The North Face has the right to terminate its lease effective on July 31, 2016 if sales for the trailing 12-month period ending January 31, 2016 do not exceed $350 per square foot. |
The following table presents certain information relating to the historical sales and occupancy costs at the Riverpark Square Property:
Historical Sales (PSF) and Occupancy Costs(1)
| Tenant Name | 2012 | 2013 | 2014 | Current Occupancy Cost |
| Nordstrom | $263 | $250 | $215 | 4.7% |
| AMC Theater | $330,217(2) | $336,187(2) | $325,537(2) | 21.2% |
| Total Comparable In-Line | $532 | $655 | $587 | 11.8% |
| Total Comparable In-Line (without Apple) | $323 | $322 | $324 | 12.5% |
| (1) | Historical Sales (PSF) and Occupancy Costs were provided by the borrower. Tenants who are not required to report sales have been excluded from the chart above. Current Occupancy Cost is based on 2014 sales. |
| (2) | Sales PSF for AMC Theater reflect the sales per screen based on 20 screens. |
THE INFORMATION IN THIS STRUCTURAL AND COLLATERAL TERM SHEET IS NOT COMPLETE AND MAY BE AMENDED PRIOR TO THE TIME OF SALE. THIS TERM SHEET IS NOT AN OFFER TO SELL THESE SECURITIES AND IT IS NOT A SOLICITATION OF AN OFFER TO BUY THESE SECURITIES IN ANY JURISDICTION WHERE THE OFFER OR SALE IS NOT PERMITTED.
| 42 |
RIVERPARK SQUARE
The following table presents certain information relating to the lease rollover schedule at the Riverpark Square Property:
Lease Expiration Schedule(1)(2)
| Year Ending December 31, | No. of Leases Expiring | Expiring NRSF | % of Total NRSF | Cumulative Expiring NRSF | Cumulative % of Total NRSF | Annual U/W Base Rent | Annual U/W Base Rent PSF(3) |
| MTM | 1 | 946 | 0.3% | 946 | 0.3% | $25,000 | $26.43 |
| 2015 | 5 | 11,417 | 3.0% | 12,363 | 3.3% | $242,651 | $21.25 |
| 2016 | 6 | 15,136 | 4.0% | 27,499 | 7.3% | $418,250 | $27.63 |
| 2017 | 8 | 15,157 | 4.0% | 42,656 | 11.4% | $388,989 | $25.66 |
| 2018 | 3 | 11,074 | 3.0% | 53,730 | 14.3% | $232,808 | $21.02 |
| 2019 | 6 | 13,910 | 3.7% | 67,640 | 18.1% | $349,236 | $25.11 |
| 2020 | 6 | 159,031 | 42.5% | 226,671 | 60.5% | $1,693,865 | $10.65 |
| 2021 | 3 | 10,934 | 2.9% | 237,605 | 63.4% | $360,445 | $32.97 |
| 2022 | 2 | 12,080 | 3.2% | 249,685 | 66.7% | $311,976 | $25.83 |
| 2023 | 1 | 9,600 | 2.6% | 259,285 | 69.2% | $197,664 | $20.59 |
| 2024 | 2 | 4,586 | 1.2% | 263,871 | 70.5% | $248,886 | $54.27 |
| 2025 | 2 | 12,047 | 3.2% | 275,918 | 73.7% | $267,616 | $22.21 |
| Thereafter | 1 | 80,811 | 21.6% | 356,729 | 95.3% | $1,212,165 | $15.00 |
| Vacant | 0 | 17,761 | 4.7% | 374,490 | 100.0% | $0 | $0.00 |
| Total/Weighted Average | 46 | 374,490(4) | 100.0% | $5,949,550 | $16.68 |
| (1) | Information obtained from the underwritten rent roll. |
| (2) | Certain tenants may have lease termination options that are exercisable prior to the originally stated expiration date of the subject lease and that are not considered in the Lease Expiration Schedule. |
| (3) | Annual U/W Base Rent PSF excludes vacant space. |
| (4) | The square footage includes 13,951 square feet that is leased by the borrower in the AMBS Building, which is owned by an unaffiliated third party, and subleased to certain retail tenants. |
The following table presents historical occupancy percentages at the Riverpark Square Property:
Historical Occupancy
12/31/2012(1) | 12/31/2013(1) | 12/31/2014(1) | 5/1/2015(2) |
| 94.0% | 97.0% | 97.0% | 95.3% |
| (1) | Information obtained from the borrower. |
| (2) | Information obtained from the underwritten rent roll. |
THE INFORMATION IN THIS STRUCTURAL AND COLLATERAL TERM SHEET IS NOT COMPLETE AND MAY BE AMENDED PRIOR TO THE TIME OF SALE. THIS TERM SHEET IS NOT AN OFFER TO SELL THESE SECURITIES AND IT IS NOT A SOLICITATION OF AN OFFER TO BUY THESE SECURITIES IN ANY JURISDICTION WHERE THE OFFER OR SALE IS NOT PERMITTED.
| 43 |
RIVERPARK SQUARE
Operating History and Underwritten Net Cash Flow.The following table presents certain information relating to the historical operating performance and underwritten net cash flow at the Riverpark Square Property:
Cash Flow Analysis
| 2013 | 2014 | TTM 4/30/2015 | U/W(1) | % of U/W Effective Gross Income | U/W $ per SF | |
| Base Rent | $5,770,801 | $5,947,432 | $5,914,460 | $5,949,550(2) | 50.2% | $15.89 |
| Grossed Up Vacant Space | 0 | 0 | 0 | 581,314 | 3.0 | 0.95 |
| Percentage Rent | 154,424 | 158,293 | 158,342 | 93,076 | 0.8 | 0.25 |
| Total Reimbursables | 2,542,819 | 2,521,259 | 2,519,742 | 2,265,107 | 19.1 | 6.05 |
| Other Income | 237,420 | 208,350 | 213,474 | 249,744 | 2.1 | 0.67 |
| Parking Income | 3,268,855 | 3,331,509 | 3,275,043 | 3,331,509 | 28.1 | 8.90 |
| Less Vacancy & Credit Loss | (20,000) | (65,000) | (20,000) | (610,250)(3) | (5.1) | (1.63) |
| Effective Gross Income | $11,954,318 | $12,101,843 | $12,061,061 | $11,860,049 | 100.0% | $31.67 |
| Total Operating Expenses | $5,209,859
| $5,290,540
| $5,264,185
| $5,304,051
| 44.7%
| $14.16
|
| Net Operating Income | $6,744,460 | $6,811,303 | $6,796,876 | $6,555,998 | 55.3% | $17.51 |
| TI/LC | 0 | 0 | 0 | 427,966 | 3.6 | 1.14 |
| Capital Expenditures | 0 | 0 | 0 | 81,639 | 0.7 | 0.22 |
| Net Cash Flow | $6,744,460 | $6,811,303 | $6,796,876 | $6,046,393 | 51.0% | $16.15 |
| NOI DSCR | 1.93x | 1.95x | 1.95x | 1.88x(1) | ||
| NCF DSCR | 1.93x | 1.95x | 1.95x | 1.73x(1) | ||
| NOI DY | 11.2% | 11.4% | 11.3% | 10.9%(1) | ||
| NCF DY | 11.2% | 11.4% | 11.3% | 10.1%(1) |
| (1) | The U/W net cash flow includes sublease income from the tenants located in the AMBS Building and all expenses associated with the operations and maintenance of the AMBS Building. The U/W NOI DSCR, NCF DSCR, NOI DY and NCF DY excluding all income and expenses related to the AMBS Building are 1.88x, 1.73x, 10.9% and 10.1%, respectively. |
| (2) | U/W Base Rent includes contractual rent increases through February 2016, totaling $57,881. |
| (3) | The underwritten economic vacancy is 8.9% and collection loss is 0.4%. The Riverpark Square Property was 95.3% physically occupied as of May 1, 2015. |
Appraisal. As of the appraisal valuation date of May 29, 2015, the Riverpark Square Property had an “as-is” appraised value of $110,000,000. The appraised value does not include income derived from the AMBS Building. The appraiser also concluded to an “as-stabilized” value of $116,000,000 with an as-stabilized valuation date of December 1, 2015. The as-stabilized value is primarily based on the payment of tenant improvement costs related to AMC Theater and Twigs Bistro & Martini Bar, which were reserved upfront. The as-stabilized Cut-off Date LTV ratio is 51.7% and the as-stabilized LTV ratio at maturity is 43.7%.
Environmental Matters.According to the Phase I environmental assessment dated June 5, 2015, there was no evidence of any recognized environmental conditions at the Riverpark Square Property.
Market Overview and Competition.The Riverpark Square Property is located at the northeast corner of West Main Avenue and North Lincoln Street in the central business district of Spokane, Washington, the second largest city in the state. The Riverpark Square Property is located within 300 yards of the Spokane River, just south of Riverfront Park, a 100-acre park originally created for the 1974 World’s Fair. The city of Spokane recently announced a $64.0 million renovation project to redevelop the Riverfront Park, including updating the playground, relocating the ice rink, constructing a new building for the carrousel and updating the pavilion. The Riverpark Square Property is located approximately 0.3 miles west of the Spokane Convention Center, which recently completed a reported $50.0 million expansion adding approximately 91,000 square feet of exhibit, ballroom, reception, meeting room and back-house space. Conventions already scheduled as a result of the expansion are expected to bring approximately $120.0 million in direct economic impact to the area. Downtown Spokane is densely built-out with a mixture of low- and mid-rise office and retail uses. The 2015 estimated population within a one, three- and five-mile radius of the Riverpark Square Property was 14,318, 102,665 and 210,485, respectively, and the estimated average household income within the same radii was $32,190, $51,360 and $55,601, respectively. The Riverpark Square Property has a primary trade area of 50-miles, with a 2015 estimated population and average household income of 703,680 and $63,718, respectively.
The Riverpark Square Property is located in the Spokane central business district retail submarket within the Spokane metropolitan area which is mostly built-out and has experienced modest new supply over the past several years. According to the appraisal, there are currently no retail projects under construction within the submarket; however, Urban Outfitters has a signed a letter of intent to lease a building adjacent to the Riverpark Square Property. As of the first quarter of 2015, the submarket reported a total inventory of 248 properties totaling approximately 3.8 million square feet with a 7.2% vacancy and average asking rent of $14.85 per square foot on a triple-net basis. The appraiser concluded to a gross market rent for a variety of tenant spaces and, overall, concluded that the in-place rents at the Riverpark Square Property are approximately 10.2% below market rent.
THE INFORMATION IN THIS STRUCTURAL AND COLLATERAL TERM SHEET IS NOT COMPLETE AND MAY BE AMENDED PRIOR TO THE TIME OF SALE. THIS TERM SHEET IS NOT AN OFFER TO SELL THESE SECURITIES AND IT IS NOT A SOLICITATION OF AN OFFER TO BUY THESE SECURITIES IN ANY JURISDICTION WHERE THE OFFER OR SALE IS NOT PERMITTED.
| 44 |
RIVERPARK SQUARE
The following table presents certain information relating to some comparable retail properties for the Riverpark Square Property:
Competitive Set(1)
(Subject) | Northtown Mall | Spokane Valley Mall | Silver Lake Mall | |
| Location | Spokane, WA | Spokane, WA | Spokane, WA | Coeur d’Alene, ID |
| Distance from Subject | -- | 3.0 miles | 10.0 miles | 30.0 miles |
| Property Type | Regional Mall | Super Regional Mall | Regional Mall | Regional Mall |
| Year Built/Renovated | 1973/2001 | 1954/2000 | 2001/NAP | 1989/NAP |
| Anchor Tenants | Nordstrom, AMC Theater | Macy’s, Sears, JC Penney, Kohl’s, Marshalls, Barnes & Noble, Regal Cinemas | Macy’s, JC Penney, Sears, Regal Cinemas | Macy’s, JC Penney, Sears, Sports Authority |
| Total GLA | 374,490 SF | 811,887 SF | 870,000 SF | 325,000 SF |
| Total Occupancy | 95% | 87% | 97% | 96% |
| (1) | Information obtained from the appraisal, third party market research reports and underwritten rent roll. |
The Borrower.The borrower is River Park Square, L.L.C., a Washington limited liability company and a single purpose entity with one independent director. Legal counsel to the borrower delivered a non-consolidation opinion in connection with the origination of the Riverpark Square Mortgage Loan. The Cowles Company is the guarantor of certain nonrecourse carveouts under the Riverpark Square Mortgage Loan.
The Sponsor.The sponsor is the Cowles Company, a fourth generation family-owned enterprise that operates a portfolio of legacy companies and seeks to invest in high growth businesses for the long-term benefit of shareholders, customers, employees and communities in which it operates. In addition to the ownership of the Riverpark Square Property, the Cowles Company real estate division includes Centennial Real Estate Investments, which manages approximately 1.0 million square feet of retail and commercial space in the greater Spokane area and approximately 1,300 acres of raw land zoned for commercial, industrial and residential use in the Spokane Valley.
Escrows.The loan documents provide for upfront reserves of $226,542 for taxes and $5,051,064 for outstanding tenant improvement obligations related to AMC Theater ($4,000,000) and Twigs Bistro & Martini Bar ($1,051,064). Ongoing monthly reserves are required in an amount equal to $75,514 for taxes. Ongoing monthly reserves in an amount equal to $6,803 for replacement reserves and $35,697 for tenant improvements and leasing commissions are suspended as long as no event of default has occurred and the amortizing debt service coverage ratio is at least 1.30x. The loan documents do not require monthly escrows for insurance provided (i) no event of default has occurred and is continuing; (ii) the Riverpark Square Property is insured via an acceptable blanket insurance policy; and (iii) the borrower provides the lender with evidence of renewal of the policies and timely proof of payment of the insurance premiums when due. Upon the occurrence of Apple failing to renew its lease or providing notice of its intention not to renew its lease, the borrower will deposit into the reserve an amount equal to 125.0% of the estimated cost to complete the Apple Restoration Work (as defined below).
“Apple Restoration Work” is defined as the work required under the AMBS Building lease to be performed by the borrower upon the expiration of the Apple lease, which includes the removal of the façade installed on the storefront and re-installation of the elevator, escalators, stairwell and stairs that were removed prior to the Apple tenancy.
Lockbox and Cash Management.The Riverpark Square Mortgage Loan required a lender-controlled lockbox account, which is already in place, and that the borrower and property manager deposits all rents directly into such lockbox account within three business days of receipt. Prior to the occurrence of a Cash Trap Event Period (as defined below), all funds on deposit in the lockbox account are disbursed to the borrower. Upon the occurrence of a Cash Trap Event Period, the borrower or property manager will direct tenants to deposit all rents into the lockbox account and all excess funds on deposit in the lockbox account are swept into a lender-controlled sub-account.
A “Cash Trap Event Period” will commence upon the earlier of (i) the occurrence and continuance of an event of default; (ii) the amortizing flow debt service coverage ratio being less than 1.20x; (iii) the occurrence of a Nordstrom Trigger Period (as defined below); or (iv) the borrower failing to deposit the required amount for the Apple Restoration Work. A Cash Trap Event Period will expire with regard to clause (i), upon the cure of such event of default; with regard to clause (ii), upon the date that the amortizing debt service coverage ratio is equal to or greater than 1.20 for two consecutive calendar quarters; with regard to clause (iii), upon a Nordstrom Trigger Period ending; or with regard to clause (iv), upon the borrower depositing the required amount for the Apple Restoration Work.
A “Nordstrom Trigger Period” will commence upon the occurrence of the earlier of (i) Nordstrom being in material default under its lease; (ii) Nordstrom going dark or failing to be in physical occupancy of its space; (iii) Nordstrom terminating its lease or giving notice of its intention to terminate its lease or the Nordstrom lease failing to be in full force or effect; (iv) Nordstrom filing bankruptcy or similar insolvency or any resulting rent abatement or relief granted without the lender’s consent; or (v) Nordstrom failing to renew its lease prior to March 1, 2019. A Nordstrom Trigger Period will expire with regard to clause (i), upon Nordstrom curing all defaults under the Nordstrom lease; with regard to clause (ii), upon Nordstrom being in occupancy and open for business; with regard to clause (iii), upon Nordstrom revoking or rescinding its termination notice and affirming that the Nordstrom lease is in full force and effect; with regard to clause (iv), upon Nordstrom no longer being insolvent or subject to bankruptcy proceedings and
THE INFORMATION IN THIS STRUCTURAL AND COLLATERAL TERM SHEET IS NOT COMPLETE AND MAY BE AMENDED PRIOR TO THE TIME OF SALE. THIS TERM SHEET IS NOT AN OFFER TO SELL THESE SECURITIES AND IT IS NOT A SOLICITATION OF AN OFFER TO BUY THESE SECURITIES IN ANY JURISDICTION WHERE THE OFFER OR SALE IS NOT PERMITTED.
| 45 |
RIVERPARK SQUARE
reaffirming its lease and Nordstrom is paying full, unabated rent; with regard to clause (v), upon Nordstrom renewing or extending its lease on terms acceptable to the lender; or with regard to all of the above, the borrower leasing the entire Nordstrom space to an acceptable replacement tenant on a lease acceptable to the lender and the replacement tenant is in occupancy, open for business and paying full, unabated rent.
Property Management. The Riverpark Square Property is managed by an affiliate of the borrower.
Assumption.The borrower has a two-time right to transfer the Riverpark Square Property, provided that no event of default has occurred and is continuing and certain other conditions are satisfied, including, but not limited to the following: (i) the lender’s reasonable determination that the proposed transferee and guarantor satisfy the lender’s credit review and underwriting standards, taking into consideration transferee’s experience, financial strength and general business standing; (ii) execution of a recourse guaranty and an environmental indemnity by an affiliate of the transferee; and (iii) if requested by the lender, rating agency confirmation from Fitch, Moody’s and Morningstar that the transfer will not result in a downgrade, withdrawal or qualification of the respective ratings assigned to the Series 2015-C30 Certificates.
Partial Release.Not permitted.
Real Estate Substitution.Not permitted.
Subordinate and Mezzanine Indebtedness.Not permitted.
Ground Lease.None.
Terrorism Insurance.The loan documents require that the “all risk” insurance policy required to be maintained by the borrower provide coverage for terrorism in an amount equal to the full replacement cost of the Riverpark Square Property, as well as business interruption insurance covering no less than the 18-month period following the occurrence of a casualty event, together with a six-month extended period of indemnity.
THE INFORMATION IN THIS STRUCTURAL AND COLLATERAL TERM SHEET IS NOT COMPLETE AND MAY BE AMENDED PRIOR TO THE TIME OF SALE. THIS TERM SHEET IS NOT AN OFFER TO SELL THESE SECURITIES AND IT IS NOT A SOLICITATION OF AN OFFER TO BUY THESE SECURITIES IN ANY JURISDICTION WHERE THE OFFER OR SALE IS NOT PERMITTED.
| 46 |
(THIS PAGE INTENTIONALLY LEFT BLANK)
THE INFORMATION IN THIS STRUCTURAL AND COLLATERAL TERM SHEET IS NOT COMPLETE AND MAY BE AMENDED PRIOR TO THE TIME OF SALE. THIS TERM SHEET IS NOT AN OFFER TO SELL THESE SECURITIES AND IT IS NOT A SOLICITATION OF AN OFFER TO BUY THESE SECURITIES IN ANY JURISDICTION WHERE THE OFFER OR SALE IS NOT PERMITTED.
| 47 |
(THIS PAGE INTENTIONALLY LEFT BLANK)
THE INFORMATION IN THIS STRUCTURAL AND COLLATERAL TERM SHEET IS NOT COMPLETE AND MAY BE AMENDED PRIOR TO THE TIME OF SALE. THIS TERM SHEET IS NOT AN OFFER TO SELL THESE SECURITIES AND IT IS NOT A SOLICITATION OF AN OFFER TO BUY THESE SECURITIES IN ANY JURISDICTION WHERE THE OFFER OR SALE IS NOT PERMITTED.
| 48 |
| SIMMONS TOWER |
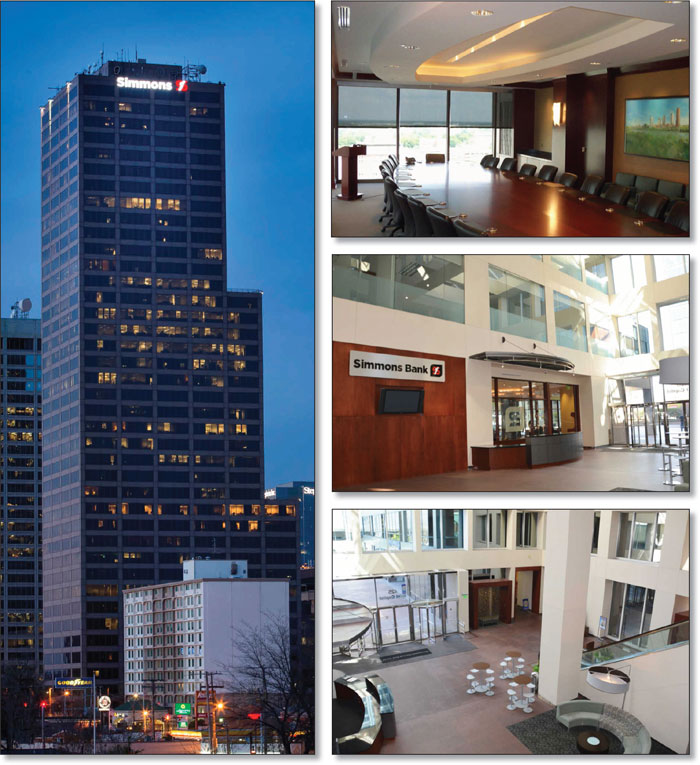
THE INFORMATION IN THIS STRUCTURAL AND COLLATERAL TERM SHEET IS NOT COMPLETE AND MAY BE AMENDED PRIOR TO THE TIME OF SALE. THIS TERM SHEET IS NOT AN OFFER TO SELL THESE SECURITIES AND IT IS NOT A SOLICITATION OF AN OFFER TO BUY THESE SECURITIES IN ANY JURISDICTION WHERE THE OFFER OR SALE IS NOT PERMITTED.
| 49 |
| SIMMONS TOWER |
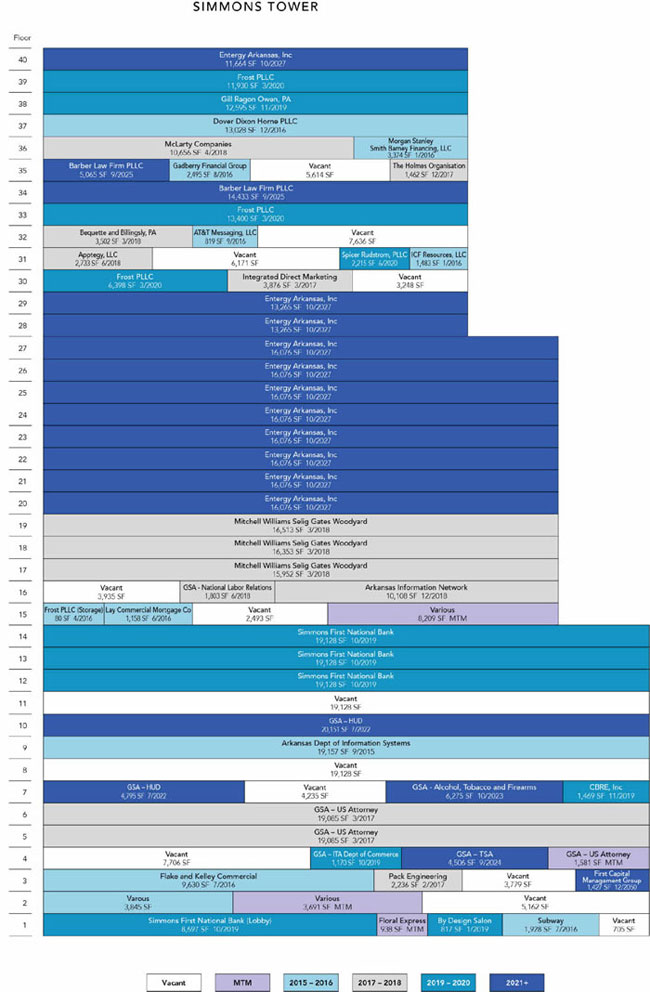
THE INFORMATION IN THIS STRUCTURAL AND COLLATERAL TERM SHEET IS NOT COMPLETE AND MAY BE AMENDED PRIOR TO THE TIME OF SALE. THIS TERM SHEET IS NOT AN OFFER TO SELL THESE SECURITIES AND IT IS NOT A SOLICITATION OF AN OFFER TO BUY THESE SECURITIES IN ANY JURISDICTION WHERE THE OFFER OR SALE IS NOT PERMITTED.
| 50 |
| SIMMONS TOWER |
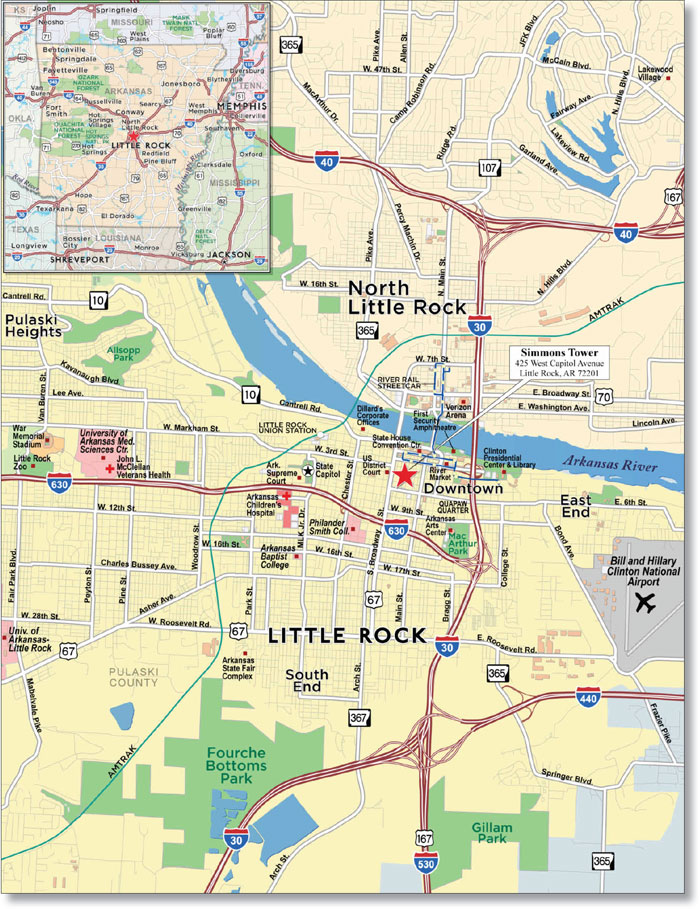
THE INFORMATION IN THIS STRUCTURAL AND COLLATERAL TERM SHEET IS NOT COMPLETE AND MAY BE AMENDED PRIOR TO THE TIME OF SALE. THIS TERM SHEET IS NOT AN OFFER TO SELL THESE SECURITIES AND IT IS NOT A SOLICITATION OF AN OFFER TO BUY THESE SECURITIES IN ANY JURISDICTION WHERE THE OFFER OR SALE IS NOT PERMITTED.
| 51 |
| No. 3 – Simmons Tower | ||||||
| Loan Information | Property Information | |||||
| Mortgage Loan Seller: | Wells Fargo Bank, National Association | Single Asset/Portfolio: | Single Asset | |||
Credit Assessment (Fitch/Moody’s/Morningstar): | NR/NR/NR | Property Type: | Office | |||
| Original Principal Balance: | $44,175,000 | Specific Property Type: | CBD | |||
| Cut-off Date Principal Balance: | $44,106,462 | Location: | Little Rock, AR | |||
| % of Initial Pool Balance: | 6.0% | Size: | 623,354 SF | |||
| Loan Purpose: | Refinance | Cut-off Date Principal Balance Per SF(1): | $70.76 | |||
| Borrower Name: | CADC-1, LLC | Year Built/Renovated: | 1986/2014 | |||
| Sponsors: | John J. Flake; Henry Kelley, Jr. | Title Vesting: | Fee | |||
| Mortgage Rate: | 4.960% | Property Manager: | Self-managed | |||
| Note Date: | July 10, 2015 | 3rdMost Recent Occupancy (As of)(3): | 82.1% (12/31/2012) | |||
| Anticipated Repayment Date: | NAP | 2ndMost Recent Occupancy (As of)(3): | 83.2% (12/31/2013) | |||
| Maturity Date: | July 11, 2025 | Most Recent Occupancy (As of)(3): | 85.4% (12/31/2014) | |||
| IO Period: | None | Current Occupancy (As of): | 85.7% (6/30/2015) | |||
| Loan Term (Original): | 120 months | |||||
| Seasoning: | 1 month | Underwriting and Financial Information: | ||||
| Amortization Term (Original): | 300 months | |||||
| Loan Amortization Type: | Amortizing Balloon | 3rdMost Recent NOI (As of): | $5,145,023 (12/31/2013) | |||
| Interest Accrual Method: | Actual/360 | 2ndMost Recent NOI (As of): | $5,112,107 (12/31/2014) | |||
| Call Protection: | L(25),D(91),O(4) | Most Recent NOI (As of): | $5,080,033 (TTM 3/31/2015) | |||
| Lockbox Type: | Soft/Springing Cash Management | |||||
| Additional Debt(1): | Yes | |||||
| Additional Debt Type(1): | Mezzanine | |||||
| U/W Revenues: | $9,761,370 | |||||
| U/W Expenses: | $4,589,926 | |||||
| U/W NOI: | $5,171,444 | |||||
| U/W NCF: | $4,479,184 | |||||
| Escrows and Reserves(2): | U/W NOI DSCR(1): | 1.68x | ||||
| U/W NCF DSCR(1): | 1.45x | |||||
| Type: | Initial | Monthly | Cap (If Any) | U/W NOI Debt Yield(1): | 11.7% | |
| Taxes | $525,430 | $52,543 | NAP | U/W NCF Debt Yield(1): | 10.2% | |
| Insurance | $0 | Springing | NAP | As-Is Appraised Value: | $58,900,000 | |
| Replacement Reserves | $0 | $10,389 | $374,013 | As-Is Appraisal Valuation Date: | April 23, 2015 | |
| TI/LC Reserve | $0 | $64,933 | $2,337,578 | Cut-off Date LTV Ratio(1): | 74.9% | |
| Tenant Specific TI/LC Reserve | $877,750 | $0 | NAP | LTV Ratio at Maturity or ARD(1): | 56.0% | |
| (1) | See “Subordinate and Mezzanine Indebtedness” section. The equity interests in the Simmons Tower Mortgage Loan borrower and certain affiliates have been pledged to secure additional mezzanine indebtedness of $28,437,194, which is held by an affiliate of the borrower. The LTV ratios, DSCR, debt yields and Cut-off Date Principal Balance per square foot numbers shown in the chart above are based solely on the Simmons Tower Property Mortgage Loan. As of the Cut-off Date, the combined U/W NCF DSCR, the combined LTV ratio and the combined U/W NCF Debt Yield are 0.91x, 123.2% and 6.2%, respectively. Mezzanine debt payments are only required to be paid to the extent there is excess cash flow available after all required payments under the Simmons Tower Mortgage Loan, and unpaid principal and interest will be deferred and added to unpaid principal, with the balance due at maturity.. |
| (2) | See “Escrows” section. |
| (3) | Historical occupancy represents the average over the prior 12-month period. |
The Mortgage Loan. The mortgage loan (the “Simmons Tower Mortgage Loan”) is evidenced by a single promissory note that is secured by a first mortgage encumbering a 40-story office building and an adjacent parking garage located in Little Rock, Arkansas (the “Simmons Tower Property”). The Simmons Tower Mortgage Loan was originated on July 10, 2015 by Wells Fargo Bank, National Association. The Simmons Tower Mortgage Loan had an original principal balance of $44,175,000, has an outstanding principal balance as of the Cut-off Date of $44,106,462 and accrues interest at an interest rate of 4.960%per annum. The Simmons Tower Mortgage Loan had an initial term of 120 months, has a remaining term of 119 months as of the Cut-off Date and requires payments of principal and interest based on a 25-year amortization schedule. The Simmons Tower Mortgage Loan matures on July 11, 2025.
Following the lockout period, the borrower has the right to defease the Simmons Tower Mortgage Loan in whole, but not in part, on any date before April 11, 2025. In addition, the Simmons Tower Mortgage Loan is prepayable without penalty on or after April 11, 2025.
THE INFORMATION IN THIS STRUCTURAL AND COLLATERAL TERM SHEET IS NOT COMPLETE AND MAY BE AMENDED PRIOR TO THE TIME OF SALE. THIS TERM SHEET IS NOT AN OFFER TO SELL THESE SECURITIES AND IT IS NOT A SOLICITATION OF AN OFFER TO BUY THESE SECURITIES IN ANY JURISDICTION WHERE THE OFFER OR SALE IS NOT PERMITTED.
| 52 |
| SIMMONS TOWER |
Sources and Uses
| Sources | Uses | |||||||
| Original loan amount | $44,175,000 | 100.0% | Loan payoff(1) | $41,781,691 | 94.6% | |||
| Reserves | 1,403,180 | 3.2 | ||||||
| Closing costs | 709,815 | 1.6 | ||||||
| Return of equity | 280,314 | 0.6 | ||||||
| Total Sources | $44,175,000 | 100.0% | Total Uses | $44,175,000 | 100.0% | |||
| (1) | The Simmons Tower Property was previously securitized in the JPMCC 2005-LDP4 transaction. |
The Property.The Simmons Tower Property is a 40-story, class A office tower totaling 623,354 square feet with ground floor retail (13,085 square feet; 2.1% of net rentable area) and an attached parking garage located in the Little Rock, Arkansas central business district (“CBD”). Constructed in 1986, the Simmons Tower Property is the tallest building in Little Rock, has a three-story lobby and provides for panoramic views of the Arkansas River and the Little Rock area. Amenities at the Simmons Tower Property include a fitness center, outdoor terraces and balconies, on-site leasing/management office, 24-hour security desk as well as ground floor retail, which includes Simmons First National Bank branch, Subway, a salon, and a flower/sundry shop. Parking is provided via an eight-level 952-space parking structure attached via sky-bridge resulting in a parking ratio of 1.5 spaces per 1,000 rentable square feet. The largest tenant at the Simmons Tower Property, Entergy Arkansas, Inc. (166,963 square feet; 26.8% of the net rentable area; rated Baa2/BBB by Moody’s/S&P), which houses its corporate headquarters at the Simmons Tower Property, has been in occupancy since 1986 and recently extended the term of its lease through October 2027. The second largest tenant, Simmons First National Bank (66,081 square feet; 10.6% of the net rentable area), has been in occupancy at the Simmons Tower Property since 2004 and has notable exterior signage on the building. Given the close proximity to the federal courthouse (across the street), the state capitol (0.8 miles west), and several other government buildings downtown, the Simmons Tower Property appeals to law firms, firms doing business with the state and local governments, and government-affiliated tenants, as evidenced by a tenancy which includes the General Services Administration (“GSA”), the Bureau of Alcohol, Tobacco, Firearms and Explosives, the Department of Commerce, and the U.S. Department of Housing and Urban Development. The Simmons Tower Property has benefited from strong historical occupancy with an average occupancy of 87.0% since 2005. Additionally, the Simmons Tower Property has experienced excellent tenant retention with approximately 70.9% of the net rentable area and 82.4% of underwritten base rent having been at the Simmons Tower Property for at least 10 years. As of June 30, 2015 the Simmons Tower Property was 85.7% leased by 59 tenants.
THE INFORMATION IN THIS STRUCTURAL AND COLLATERAL TERM SHEET IS NOT COMPLETE AND MAY BE AMENDED PRIOR TO THE TIME OF SALE. THIS TERM SHEET IS NOT AN OFFER TO SELL THESE SECURITIES AND IT IS NOT A SOLICITATION OF AN OFFER TO BUY THESE SECURITIES IN ANY JURISDICTION WHERE THE OFFER OR SALE IS NOT PERMITTED.
| 53 |
| SIMMONS TOWER |
The following table presents certain information relating to the tenancy at the Simmons Tower Property:
Major Tenants
| Tenant Name | Credit Rating (Fitch/Moody’s/ S&P)(1) | Tenant NRSF | % of NRSF | Annual U/W Base Rent PSF(2) | Annual U/W Base Rent(2) | % of Total Annual U/W Base Rent | Lease Expiration Date |
| Major Tenants | |||||||
| Entergy Arkansas, Inc.(3) | NR/Baa2/BBB | 166,963 | 26.8% | $17.32(4) | $2,891,499(4) | 32.9% | 10/31/2027(5) |
| Simmons First National Bank | NR/NR/NR | 66,081 | 10.6% | $15.13 | $999,475 | 11.4% | 10/31/2019 |
| Mitchell Williams Selig Gates Woodyard | NR/NR/NR | 48,818 | 7.8% | $15.96 | $779,135 | 8.9% | 3/31/2018 |
| GSA - US Attorney | AAA/Aaa/AA+ | 39,751 | 6.4% | $16.00 | $636,016 | 7.2% | 3/31/2017(6) |
| Frost PLLC | NR/NR/NR | 31,808 | 5.1% | $15.24 | $484,732 | 5.5% | 3/31/2020 |
| Barber Law Firm PLLC(7) | NR/NR/NR | 19,498 | 3.1% | $17.95 | $349,989 | 4.0% | 9/30/2025 |
| Total Major Tenants | 372,919 | 59.8% | $16.47 | $6,140,847 | 69.9% | ||
| Non-Major Tenants(8) | 161,495 | 25.9% | $16.35(8) | $2,641,053 | 30.1% | ||
| Occupied Collateral Total | 534,414 | 85.7% | $16.43 | $8,781,900 | 100.0% | ||
| �� | |||||||
| Vacant Space | 88,940 | 14.3% | |||||
| Collateral Total | 623,354 | 100.0% | |||||
| (1) | Certain ratings are those of the parent company whether or not the parent company guarantees the lease. |
| (2) | Annual U/W Base Rent PSF and Annual U/W Base Rent include a contractual rent step through February 1, 2016 totaling $15,134. |
| (3) | Borrower-affiliated tenant. Entergy Arkansas, Inc. owns an indirect interest in the borrower. |
| (4) | The Annual U/W Base Rent and Annual U/W Base Rent PSF for Entergy Arkansas, Inc. represent the tenant’s average rent through the loan term. Entergy Arkansas Inc.’s current in-place rental rate is $16.49 per square foot. |
| (5) | Entergy Arkansas, Inc. has a one-time right to reduce its space in whole floor increments on November 1, 2020 with 18 months written notice. However, Entergy Arkansas, Inc. may not reduce their total square footage below 100,000 square feet (16.0% of net rentable area). |
| (6) | GSA – US Attorney has the right to terminate the lease at any time with 60 days’ notice. |
| (7) | Barber Law Firm PLLC is in the process of building out its space on the 34th and 35th floors. Barber Law Firm PLLC will take occupancy and begin paying rent on October 1, 2015. All outstanding tenant improvements, leasing commissions and gap rent have been reserved upfront. |
| (8) | Non-Major Tenants includes the conference and break rooms (1,502 square feet or 0.2% of the net rentable area) which do not have associated leases or underwritten rent. Annual U/W Base Rent PSF excluding the conference and break rooms is $16.50 per square foot. |
The following table presents certain information relating to the lease rollover schedule at the Simmons Tower Property:
Lease Expiration Schedule(1)(2)
Year Ending December 31, | No. of Leases Expiring(3) | Expiring NRSF | % of Total NRSF | Cumulative Expiring NRSF | Cumulative % of Total NRSF | Annual U/W Base Rent | Annual U/W Base Rent PSF(4) |
| MTM(5) | 36 | 14,528 | 2.3% | 14,528 | 2.3% | $226,783 | $15.61 |
| 2015 | 7 | 22,531 | 3.6% | 37,059 | 5.9% | $355,679 | $15.79 |
| 2016 | 11 | 34,466 | 5.5% | 71,525 | 11.5% | $588,984 | $17.09 |
| 2017 | 6 | 45,744 | 7.3% | 117,269 | 18.8% | $742,580 | $16.23 |
| 2018 | 11 | 78,790 | 12.6% | 196,059 | 31.5% | $1,293,794 | $16.42 |
| 2019 | 9 | 80,962 | 13.0% | 277,021 | 44.4% | $1,249,860 | $15.44 |
| 2020 | 4 | 33,943 | 5.4% | 310,964 | 49.9% | $523,101 | $15.41 |
| 2021 | 0 | 0 | 0.0% | 310,964 | 49.9% | $0 | $0.00 |
| 2022 | 2 | 24,946 | 4.0% | 335,910 | 53.9% | $399,136 | $16.00 |
| 2023 | 1 | 6,275 | 1.0% | 342,185 | 54.9% | $91,741 | $14.62 |
| 2024 | 1 | 4,506 | 0.7% | 346,691 | 55.6% | $72,096 | $16.00 |
| 2025 | 1 | 19,498 | 3.1% | 366,189 | 58.7% | $349,989 | $17.95 |
| Thereafter | 12 | 168,225 | 27.0% | 534,414 | 85.7% | $2,888,158 | $17.17 |
| Vacant | 0 | 88,940 | 14.3% | 623,354 | 100.0% | $0 | $0.00 |
| Total/Weighted Average | 101 | 623,354 | 100.0% | $8,781,900 | $16.43 |
| (1) | Information obtained from the underwritten rent roll. |
| (2) | Certain tenants may have lease termination options that are exercisable prior to the originally stated expiration date of the subject lease and that are not considered in the Lease Expiration Schedule. |
| (3) | Numerous tenants operate under more than one lease. |
| (4) | Weighted Average Annual U/W Base Rent PSF excludes vacant space. |
| (5) | MTM includes the conference and break rooms which do not have associated leases or underwritten rent. |
THE INFORMATION IN THIS STRUCTURAL AND COLLATERAL TERM SHEET IS NOT COMPLETE AND MAY BE AMENDED PRIOR TO THE TIME OF SALE. THIS TERM SHEET IS NOT AN OFFER TO SELL THESE SECURITIES AND IT IS NOT A SOLICITATION OF AN OFFER TO BUY THESE SECURITIES IN ANY JURISDICTION WHERE THE OFFER OR SALE IS NOT PERMITTED.
| 54 |
| SIMMONS TOWER |
The following table presents historical occupancy percentages at the Simmons Tower Property:
Historical Occupancy
12/31/2012(1) | 12/31/2013(1) | 12/31/2014(1) | 6/30/2015(2) | |||
| 82.1% | 83.2% | 85.4% | 85.7% |
| (1) | Information obtained from the borrower. Historical occupancy represents the average over the prior 12-month period. |
| (2) | Information obtained from the underwritten rent roll. |
Operating History and Underwritten Net Cash Flow. The following table presents certain information relating to the historical operating performance and underwritten net cash flow at the Simmons Tower Property:
Cash Flow Analysis
| 2012 | 2013 | 2014 | TTM 3/31/2015 | U/W | % of U/W Effective Gross Income | U/W $ per SF | |||||||||
| Base Rent | $8,287,145 | $8,464,014 | $8,699,945 | $8,734,275 | $8,781,900 | 90.0% | $14.09 | ||||||||
| Grossed Up Vacant Space | 0 | 0 | 0 | 0 | 1,503,584 | 15.4 | 2.41 | ||||||||
| Total Reimbursables | 91,013 | 101,518 | 84,584 | 44,913 | 55,596 | 0.6 | 0.09 | ||||||||
| Other Income | 224,049 | 227,266 | 239,032 | 221,019 | 221,019 | 2.3 | 0.35 | ||||||||
| Parking Income | 633,080 | 660,263 | 703,017 | 702,855 | 702,855 | 7.2 | 1.13 | ||||||||
| Less Vacancy & Credit Loss | 0 | 0 | 0 | 0 | (1,503,584)(1) | (15.4) | (2.41) | ||||||||
| Effective Gross Income | $9,235,287 | $9,453,061 | $9,726,578 | $9,703,062 | $9,761,370 | 100.0% | $15.66 | ||||||||
| Total Operating Expenses | $4,325,259 | $4,308,038 | $4,614,471 | $4,623,029 | $4,589,926 | 47.0% | $7.36 | ||||||||
| Net Operating Income | $4,910,028 | $5,145,023 | $5,112,107 | $5,080,033 | $5,171,444 | 53.0% | $8.30 | ||||||||
| TI/LC | 0 | 0 | 0 | 0 | 536,421 | 5.5 | 0.86 | ||||||||
| Capital Expenditures | 0 | 0 | 0 | 0 | 155,839 | 1.6 | 0.25 | ||||||||
| Net Cash Flow | $4,910,028 | $5,145,023 | $5,112,107 | $5,080,033 | $4,479,184 | 45.9% | $7.19 | ||||||||
| NOI DSCR | 1.59x | 1.67x | 1.66x | 1.65x | 1.68x | ||||||||||
| NCF DSCR | 1.59x | 1.67x | 1.66x | 1.65x | 1.45x | ||||||||||
| NOI DY | 11.1% | 11.7% | 11.6% | 11.5% | 11.7% | ||||||||||
| NCF DY | 11.1% | 11.7% | 11.6% | 11.5% | 10.2% |
| (1) | The underwritten economic vacancy is 14.6%. The Simmons Tower Property was 85.7% physically occupied as of June 30, 2015. |
Appraisal.As of the appraisal valuation date of April 23 2015, the Simmons Tower Property had an “as-is” appraised value of $58,900,000.
Environmental Matters.According to the Phase I environmental reports dated April 29, 2015 and May 13, 2015, there is one underground storage tank (“UST”) owned by the borrower that is currently used at the Simmons Tower Property. No records of leaks, spills or other releases were identified in the historical records reviewed and the UST is registered as current and compliant. However, based on the age of the UST, it is considered a recognized environmental condition. No further investigation or action is recommended. Additionally, from 1926 to the 1950s, the northeast portion of the Simmons Tower Property was utilized as a gasoline filling station. However, based on the elapsed time since the last observed use as a gasoline station, no further investigation or action is recommended.
Market Overview and Competition.The Simmons Tower Property occupies approximately half a city block in the Little Rock, Arkansas central business district (“CBD”) and is connected via sky-bridge to the adjacent parking garage. The Simmons Tower Property is located on Capitol Avenue, a major east-west thoroughfare which extends from the core of the CBD to the state capital complex, approximately 0.8 miles west of the Simmons Tower Property. The government accounts for 20.6% of the total employment in the Little Rock metropolitan area. Additionally, opposite the northwest corner of the Simmons Tower Property is the Richard Sheppard Arnold United States Federal Courthouse, which underwent a $49.1 million renovation and expansion in 2006, which included construction of a 160,000 square foot, five-story annex with 12 courtrooms, 12 judicial chambers and a subterranean parking garage. The strong presence of federal and state government buildings within close proximity appeals to the tenancy of Simmons Tower Property. Approximately 0.8 miles northeast of Simmons Tower Property, along the Arkansas River, is the River Market District, the cultural center of Little Rock. The River Market District has led the charge in the revitalization of downtown Little Rock and features numerous pavilions, a 30-acre park, and a 7,500-seat amphitheater along with several retail and residential developments and the William J. Clinton Presidential Center and Library. The River Rail Streetcar is in the planning stages of extending the rail line south to the William J. Clinton Presidential Center, which would connect the Little Rock CBD to the residentially-dense North Little Rock. The 2014 estimated population within a one-, three- and five-mile radii of the Simmons Tower Property was 5,694, 48,409 and 120,293, respectively. The average household income within the same one-, three- and five-mile radii was $36,598, $41,682 and $52,772, respectively.
According to the appraisal, the Simmons Tower Property is located in the Little Rock office market and the CBD office submarket, which comprises approximately 4.2 million square feet of office space as of the first quarter of 2015 and accounts for approximately 40.9% of Little Rock’s office inventory. As of the first quarter of 2015, the class A submarket occupancy rate was 98.0% and the average class A asking rent within the submarket was $15.66 per square foot on a gross basis. Based on the mix of different office
THE INFORMATION IN THIS STRUCTURAL AND COLLATERAL TERM SHEET IS NOT COMPLETE AND MAY BE AMENDED PRIOR TO THE TIME OF SALE. THIS TERM SHEET IS NOT AN OFFER TO SELL THESE SECURITIES AND IT IS NOT A SOLICITATION OF AN OFFER TO BUY THESE SECURITIES IN ANY JURISDICTION WHERE THE OFFER OR SALE IS NOT PERMITTED.
| 55 |
| SIMMONS TOWER |
suites and floors, storage space, and retail components at the Simmons Tower Property, the appraiser concluded to a blended market rate of $16.82 per square foot, gross, which is 2.4% above the Simmons Tower Property’s blended rental rate of $16.43 per square foot, gross.
The following table presents certain information relating to comparable office properties for the Simmons Tower Property:
Competitive Set(1)
Simmons (Subject) | Regions Center | Bank of America Plaza | Stephens Building | Riverfront Plaza – Building 5 | Riverfront Plaza – Building 1 & 2 | |
| Location | Little Rock, AR | Little Rock, AR | Little Rock, AR | Little Rock, AR | Little Rock, AR | Little Rock, AR |
| Distance from Subject | -- | 0.1 miles | 0.1 miles | 0.3 miles | 2.6 miles | 2.6 miles |
| Property Type | Office | Office | Office | Office | Office | Office |
| Year Built/Renovated | 1986/NAP | 1975/NAV | 1968/NAV | 1985/NAV | 1982/NAV | 1982/NAV |
| Stories | 40 | 30 | 24 | 25 | 12 | 7 |
| Total GLA | 623,354 SF | 554,491 SF | 268,598 SF | 471,556 SF | 212,165 SF | 180,494 SF |
| Total Occupancy | 86% | 95% | 68% | 99% | 68% | 98% |
| (1) | Information obtained from the appraisal. |
The Borrower.The borrower is CADC-1, LLC, a Delaware limited liability company which is a single purpose entity. Legal counsel to the borrower delivered a non-consolidation opinion in connection with the origination of the Simmons Tower Mortgage Loan. Flake & Kelley Management, Inc. is the guarantor of certain nonrecourse carveouts under the Simmons Tower Mortgage Loan.
The Sponsors.The sponsors are John J. Flake and Henry Kelley, Jr., principals of Flake & Kelley Management, Inc. Flake & Kelley Management, Inc. is a commercial real estate firm based in Little Rock, Arkansas and headquartered at the Simmons Tower Property that specializes in property management, tenant representation, development management, consulting, and investment sales. Founded by John Flake in 1979 and with the inclusion of Hank Kelly in 1984, Flake & Kelley Management, Inc. has established a management portfolio of 5.9 million square feet of office, retail and industrial space. Flake & Kelley Management, Inc. have significant commercial real estate experience, specifically in the downtown Little Rock submarket and have owned, operated, and leased the Simmons Tower Property since development in 1986. John Flake and Henry Kelly, principals of the guarantor, disclosed four prior deeds-in-lieu of foreclosure, one prior bankruptcy and one default. See “Description of the Mortgage Pool –Default History, Bankruptcy Issues and Other Proceedings” in the Free Writing Prospectus.
Escrows.The loan documents provide for upfront reserves in the amount of $525,430 for real estate taxes and $877,750 for tenant improvements, leasing commissions and gap rent associated with the space leased to Barber Law Firm PLLC. The loan documents also provide for ongoing monthly escrows in the amount of $52,543 for real estate taxes, $10,389 for replacement reserves (subject to a cap of $374,013) and $64,933 for tenant improvements and leasing commissions (subject to a cap of $2,337,578). The loan documents do not require monthly escrows for insurance as long as (i) no event of default has occurred and is continuing; (ii) the Simmons Tower Property is insured under an acceptable blanket insurance policy; and (iii) the borrower provides the lender with evidence of renewal of the required policy and timely proof of payment of the insurance premiums when due.
Lockbox and Cash Management.The Simmons Tower Mortgage Loan requires a lender-controlled lockbox account, which is already in place, and that the borrower and property manager deposit all rents directly into such lockbox account within one day of receipt. Prior to the occurrence of a Cash Trap Event Period (as defined below), all funds on deposit in the lockbox account are disbursed to the borrower. During a Cash Trap Event Period, all cash flow is swept to a lender-controlled cash management account.
A “Cash Trap Event Period” will commence upon the earlier of (i) the occurrence and continuance of an event of default or a Simmons Tower Mezzanine Loan (as defined below) event of default; (ii) the amortizing debt service coverage ratio being less than 1.20x at the end of any calendar month or (iii) the earlier to occur of (a) the date on which Entergy Arkansas, Inc. gives notice of its election to reduce its leased space, and (b) May 1, 2019.
A Cash Trap Event Period will expire, with regard to clause (i), upon the cure of such event of default or mezzanine event of default; with regard to clause (ii), the amortizing debt service coverage ratio being equal to or greater than 1.25x for two consecutive calendar quarters; with regard to clause (iii), upon the earlier to occur of (a) if on or before May 1, 2019, Entergy Arkansas, Inc. does not elect to reduce its leased space, or (b) the date on which the excess cash flow funds captured during the Cash Trap Event Period equals an amount no less than $20 per square foot of the amount reduced by Entergy Arkansas, Inc. leased space reduction (provided that a Cash Trap Event Period has not occurred and is not continuing pursuant to clause (i) or (ii) above).
Property Management.The Simmons Tower Property is managed by an affiliate of the borrower.
Assumption.The borrower has the two-time right to transfer the Simmons Tower Property, provided that no event of default has occurred and is continuing and certain other conditions are satisfied, including (i) the mezzanine debt (see “Subordinate and Mezzanine Indebtedness” section) has been paid in full and no additional obligations thereunder remain outstanding; (ii) execution of a recourse guaranty (which includes an environmental indemnity) by an affiliate of the transferee; and (iii) rating agency confirmation from Fitch, Moody’s, and Morningstar that the transfer will not result in a downgrade, withdrawal or qualification of the respective ratings assigned to the Series 2015-C30 Certificates.
THE INFORMATION IN THIS STRUCTURAL AND COLLATERAL TERM SHEET IS NOT COMPLETE AND MAY BE AMENDED PRIOR TO THE TIME OF SALE. THIS TERM SHEET IS NOT AN OFFER TO SELL THESE SECURITIES AND IT IS NOT A SOLICITATION OF AN OFFER TO BUY THESE SECURITIES IN ANY JURISDICTION WHERE THE OFFER OR SALE IS NOT PERMITTED.
| 56 |
| SIMMONS TOWER |
Partial Release.Not permitted.
Real Estate Substitution.Not permitted.
Subordinate and Mezzanine Indebtedness. Rogers-Flake Investments, LLC (the “Simmons Tower Mezzanine Lender”), an affiliate of the Simmons Tower Mortgage Loan borrower and sponsor, has an existing $28,437,194 mezzanine loan (the “Simmons Tower Mezzanine Loan”) to Capitol Avenue Development Company, A Limited Partnership (the “Mezzanine Borrower”). The Mezzanine Borrower is the sole member of the Simmons Tower Mortgage Loan Borrower, and Entergy Arkansas, Inc. owns an approximate 90.0% indirect interest in the Mezzanine Borrower. The Simmons Tower Mezzanine Loan was the result of a restructuring of maturing senior mortgage debt in 1997, which has been maintained to obviate adverse tax consequences. See “Description of the Mortgage Pool –Default History, Bankruptcy Issues and Other Proceedings” in the Free Writing Prospectus. The Simmons Tower Mezzanine Loan has a maturity date of July 20, 2027 and monthly principal and interest payments on the Simmons Tower Mezzanine Loan will accrue and are only required to the extent there is excess cash flow available after all required payments under the Simmons Tower Mortgage Loan, and unpaid principal and interest will be deferred and added to unpaid principal, with the balance due at maturity. The Simmons Tower Mezzanine Loan may only be accelerated if, among other things, (i) there is an event of default under the Simmons Tower Mortgage Loan or (ii) the Entergy Arkansas, Inc. lease expires or is terminated. The rights of the lender under the Simmons Tower Mezzanine Loan are further described under “Description of the Mortgage Pool—Additional Indebtedness—Existing (Secured Financing and Mezzanine and Similar Financing)” in the Free Writing Prospectus. The borrower is not permitted to incur any future subordinate debt.
Terrorism Insurance.The loan documents require that the “all risk” insurance policy required to be maintained by the borrower provide coverage for terrorism in an amount equal to the full replacement cost of the Simmons Tower Property (provided that the borrower is not required to pay terrorism insurance premiums in excess of two times the premium for all risk and business interruption coverage if Terrorism Risk Insurance Program Reauthorization Act is no longer in effect), as well as business interruption insurance covering no less than the 18-month period following the occurrence of a casualty event, together with a six-month extended period of indemnity.
Windstorm Insurance.The loan documents require windstorm insurance covering the full replacement cost of the Simmons Tower Property during the loan term. At the time of closing, the Simmons Tower Property has insurance coverage for windstorm.
THE INFORMATION IN THIS STRUCTURAL AND COLLATERAL TERM SHEET IS NOT COMPLETE AND MAY BE AMENDED PRIOR TO THE TIME OF SALE. THIS TERM SHEET IS NOT AN OFFER TO SELL THESE SECURITIES AND IT IS NOT A SOLICITATION OF AN OFFER TO BUY THESE SECURITIES IN ANY JURISDICTION WHERE THE OFFER OR SALE IS NOT PERMITTED.
| 57 |
| HILTON GARDEN INN – DOWNTOWN DENVER |

THE INFORMATION IN THIS STRUCTURAL AND COLLATERAL TERM SHEET IS NOT COMPLETE AND MAY BE AMENDED PRIOR TO THE TIME OF SALE. THIS TERM SHEET IS NOT AN OFFER TO SELL THESE SECURITIES AND IT IS NOT A SOLICITATION OF AN OFFER TO BUY THESE SECURITIES IN ANY JURISDICTION WHERE THE OFFER OR SALE IS NOT PERMITTED.
| 58 |
| HILTON GARDEN INN – DOWNTOWN DENVER |

THE INFORMATION IN THIS STRUCTURAL AND COLLATERAL TERM SHEET IS NOT COMPLETE AND MAY BE AMENDED PRIOR TO THE TIME OF SALE. THIS TERM SHEET IS NOT AN OFFER TO SELL THESE SECURITIES AND IT IS NOT A SOLICITATION OF AN OFFER TO BUY THESE SECURITIES IN ANY JURISDICTION WHERE THE OFFER OR SALE IS NOT PERMITTED.
| 59 |
| No. 4 – Hilton Garden Inn – Downtown Denver | |||||||
| Loan Information | Property Information | ||||||
| Mortgage Loan Seller: | Wells Fargo Bank, National Association | Single Asset/Portfolio: | Single Asset | ||||
| Credit Assessment (Fitch/Moody’s/Morningstar) | NR/NR/NR | Property Type: | Hospitality | ||||
| Original Principal Balance: | $35,000,000 | Specific Property Type: | Limited Service | ||||
| Cut-off Date Principal Balance: | $34,876,763 | Location: | Denver, CO | ||||
| % of Initial Pool Balance: | 4.7% | Size: | 221 Rooms | ||||
| Loan Purpose: | Refinance | Cut-off Date Principal Balance Per Room: | $157,813 | ||||
| Borrower Name: | Apple Ten SPE Denver, Inc. | Year Built/Renovated: | 2007/2015 | ||||
| Sponsor: | Apple REIT Ten, Inc. | Title Vesting: | Fee | ||||
| Mortgage Rate: | 4.460% | Property Manager: | Stonebridge Realty Advisors, Inc. | ||||
| Note Date: | June 10, 2015 | 3rdMost Recent Occupancy (As of): | 75.7% (12/31/2012) | ||||
| Anticipated Repayment Date: | NAP | 2ndMost Recent Occupancy (As of): | 79.1% (12/31/2013) | ||||
| Maturity Date: | June 11, 2025 | Most Recent Occupancy (As of): | 82.6% (12/31/2014) | ||||
| IO Period: | None | Current Occupancy (As of): | 78.7% (5/31//2015) | ||||
| Loan Term (Original): | 120 months | ||||||
| Seasoning: | 2 months | Underwriting and Financial Information: | |||||
| Amortization Term (Original): | 300 months | ||||||
| Loan Amortization Type: | Amortizing Balloon | 3rdMost Recent NOI (As of): | $5,066,000 (12/31/2013) | ||||
| Interest Accrual Method: | Actual/360 | 2ndMost Recent NOI (As of): | $5,524,000 (12/31/2014) | ||||
| Call Protection: | L(26),D(90),O(4) | Most Recent NOI (As of): | $5,292,320 (TTM 5/31/2015) | ||||
| Lockbox Type: | Springing (Without Established Account) | ||||||
| Additional Debt: | None | ||||||
| Additional Debt Type: | NAP | ||||||
| U/W Revenues: | $13,605,335 | ||||||
| U/W Expenses: | $8,230,850 | ||||||
| U/W NOI: | $5,374,485 | ||||||
| U/W NCF: | $4,830,271 | ||||||
| U/W NOI DSCR: | 2.31x | ||||||
| U/W NCF DSCR: | 2.08x | ||||||
| Escrows and Reserves(1): | U/W NOI Debt Yield: | 15.4% | |||||
| U/W NCF Debt Yield: | 13.8% | ||||||
| Type: | Initial | Monthly | Cap (If Any) | As-Is Appraised Value(2): | $62,100,000 | ||
| Taxes | $44,969 | $44,968 | NAP | As-Is Appraisal Valuation Date(2): | May 6, 2015 | ||
| Insurance | $0 | Springing | NAP | Cut-off Date LTV Ratio(2): | 56.2% | ||
| FF&E Reserve | $0 | $44,591 | NAP | LTV Ratio at Maturity or ARD(2): | 41.3% | ||
| (1) | See “Escrows” section. |
| (2) | See “The Appraisal” section. |
The Mortgage Loan. The mortgage loan (the “Hilton Garden Inn – Downtown Denver Mortgage Loan”) is evidenced by a single promissory note secured by a first mortgage encumbering the fee interest in a limited-service hotel located in Denver, Colorado (the “Hilton Garden Inn – Downtown Denver Property”). The Hilton Garden Inn – Downtown Denver Mortgage Loan was originated on June 10, 2015 by Wells Fargo Bank, National Association. The Hilton Garden Inn – Downtown Denver Mortgage Loan had an original principal balance of $35,000,000, has an outstanding principal balance as of the Cut-off Date of $34,876,763 and accrues interest at an interest rate of 4.460%per annum. The Hilton Garden Inn – Downtown Denver Mortgage Loan had an initial term of 120 months, has a remaining term of 118 months as of the Cut-off Date and requires payments of principal and interest based on a 25-year amortization schedule. The Hilton Garden Inn – Downtown Denver Mortgage Loan matures on June 11, 2025.
Following the lockout period, the borrower has the right to defease the Hilton Garden Inn – Downtown Denver Mortgage Loan in whole, but not in part, on any date before March 11, 2025. In addition, the Hilton Garden Inn – Downtown Denver Mortgage Loan is prepayable without penalty on or after March 11, 2025.
THE INFORMATION IN THIS STRUCTURAL AND COLLATERAL TERM SHEET IS NOT COMPLETE AND MAY BE AMENDED PRIOR TO THE TIME OF SALE. THIS TERM SHEET IS NOT AN OFFER TO SELL THESE SECURITIES AND IT IS NOT A SOLICITATION OF AN OFFER TO BUY THESE SECURITIES IN ANY JURISDICTION WHERE THE OFFER OR SALE IS NOT PERMITTED.
| 60 |
| HILTON GARDEN INN – DOWNTOWN DENVER |
Sources and Uses
| Sources | Uses | ||||||||
| Original loan amount | $35,000,000 | 100.0% | Reserves | $44,969 | 0.1 | % | |||
| Closing costs | 349,374 | 1.0 | |||||||
| Return of equity(1) | 34,605,657 | 98.9 | |||||||
| Total Sources | $35,000,000 | 100.0% | Total Uses | $35,000,000 | 100.0 | % |
| (1) | The Hilton Garden Inn – Downtown Denver Property was previously unencumbered. |
The Property.The Hilton Garden Inn – Downtown Denver Property is comprised of the fee interest in a 221-room, twelve-story, limited-service hotel located in Denver, Colorado, directly across the street from the Colorado Convention Center. Built in 2007, renovated in 2015 and situated on a 0.5-acre site, the Hilton Garden Inn – Downtown Denver Property’s guestroom configuration includes 8 king suites, 138 standard single rooms with king beds, 61 standard double rooms with queen beds, 7 handicap-accessible double rooms with king beds and 7 handicap-accessible single rooms with king beds. Each guestroom features a flat screen television with cable, telephone, wireless internet access, work desk and chair, small refrigerator, microwave oven, nightstand, lounge chair and dresser. Amenities at the Hilton Garden Inn – Downtown Denver Property include 6,656 square feet of meeting and banquet space, an indoor swimming pool, a fitness center, a business center, guest laundry, a sundry shop, DazBog Coffee Café and the recently renovated Territory Kitchen & Bar restaurant, which offers a full breakfast, lunch, dinner and cocktail menu. The Hilton Garden Inn – Downtown Denver Property also features 125 garage parking spaces, equating to a parking ratio of 0.6 spaces per room.
According to the borrower, the Hilton Garden Inn – Downtown Denver Property recently received approximately $2.6 million in renovations between November 2014 and March 2015. Approximately $2.2 million ($9,955 per key) was spent on room upgrades. The franchise agreement with Hilton Worldwide expires in June 2026.
Operating History and Underwritten Net Cash Flow.The following table presents certain information relating to the historical operating performance and the underwritten net cash flow at the Hilton Garden Inn – Downtown Denver Property:
Cash Flow Analysis
| 2012 | 2013 | 2014(1) | TTM 5/31/2015(1) | U/W | % of U/W Total Revenue | U/W $ per Room | |
| Occupancy | 75.7% | 79.1% | 82.6% | 78.7% | 78.7% | ||
| ADR | $156.24 | $155.66 | $164.93 | $174.18 | $174.18 | ||
| RevPAR | $118.35 | $123.15 | $136.22 | $137.00 | $137.00 | ||
| Total Revenue | $11,770,000 | $12,494,000 | $13,542,000 | $13,300,901 | $13,605,335 | 100.0% | $61,563 |
| Total Department Expenses | 3,185,000 | 3,242,000 | 3,535,000 | 3,481,861 | 3,678,497 | 27.0 | 16,645 |
| Gross Operating Profit | $8,585,000 | $9,252,000 | $10,007,000 | $9,819,040 | $9,926,838 | 73.0% | $44,918 |
| Total Undistributed Expenses | 3,455,000 | 3,662,000 | 3,973,000 | 3,986,801 | 4,012,434 | 29.5 | 18,156 |
| Profit Before Fixed Charges | $5,130,000 | $5,590,000 | $6,034,000 | $5,832,239 | $5,914,404 | 43.5% | $26,762 |
| Total Fixed Charges | 486,000 | 524,000 | 510,000 | 539,919 | 539,919 | 4.0 | 2,443 |
| Net Operating Income | $4,644,000 | $5,066,000 | $5,524,000 | $5,292,320 | $5,374,485 | 39.5% | $24,319 |
| FF&E | 0 | 0 | 0 | 0 | 544,213 | 4.0 | 2,463 |
| Net Cash Flow | $4,644,000 | $5,066,000 | $5,524,000 | $5,292,320 | $4,830,271 | 35.5% | $21,856 |
| NOI DSCR | 2.00x | 2.18x | 2.38x | 2.28x | 2.31x | ||
| NCF DSCR | 2.00x | 2.18x | 2.38x | 2.28x | 2.08x | ||
| NOI DY | 13.3% | 14.5% | 15.8% | 15.2% | 15.4% | ||
| NCF DY | 13.3% | 14.5% | 15.8% | 15.2% | 13.8% | ||
| (1) | The decrease in Occupancy from 2014 to the trailing 12-month was due to the renovations that took place at the Hilton Garden Inn – Downtown Denver Property, which caused occupancy to decrease from 82.6% in 2014 to 78.7% as of the trailing-12 month period ending May 31, 2015. The renovation is now complete and management reports that performance has returned to historical levels. |
The Appraisal.As of the appraisal valuation date of May 6, 2015, the Hilton Garden Inn – Downtown Denver Property had an “as-is” appraised value of $62,100,000. The appraiser also concluded to an “as-stabilized” value of $67,800,000 with an “as-stabilized” valuation date of May 6, 2017. The “as-stabilized” valuation assumes the Hilton Garden Inn – Downtown Denver Property will achieve a stabilized occupancy rate of 75.0%, stabilized ADR of $200.36 and stabilized RevPAR of $150.27 by May 6, 2017. The “as-stabilized” value equates to a Cut-off Date LTV Ratio of 51.4% and an LTV Ratio at Maturity of 37.8%.
Environmental Matters. The Phase I environmental site assessment dated May 7, 2015 identified two recognized environmental conditions (“RECs”) related to soil and groundwater contamination, which were caused by a gas station that was located at the Hilton Garden Inn – Downtown Denver Property from approximately 1934 to 1953. These RECs were previously identified in 2004 before the Hilton Garden Inn – Downtown Denver Property was developed, and no further action was recommended at the time. The consultant indicated further soil and groundwater investigation is not achievable based on the configuration of the Hilton Garden Inn – Downtown Denver Property. Due to the difficulty in further soil investigation, an environmental insurance policy was obtained at closing with an aggregate limit of $1.0 million and a thirteen year term. See “Description of the Mortgage Pool—Assessments of Property Value and Condition—Environmental Insurance” in the Free Writing Prospectus.
THE INFORMATION IN THIS STRUCTURAL AND COLLATERAL TERM SHEET IS NOT COMPLETE AND MAY BE AMENDED PRIOR TO THE TIME OF SALE. THIS TERM SHEET IS NOT AN OFFER TO SELL THESE SECURITIES AND IT IS NOT A SOLICITATION OF AN OFFER TO BUY THESE SECURITIES IN ANY JURISDICTION WHERE THE OFFER OR SALE IS NOT PERMITTED.
| 61 |
| HILTON GARDEN INN – DOWNTOWN DENVER |
Market Overview and Competition.The Hilton Garden Inn – Downtown Denver Property is located in downtown Denver, Colorado, approximately 24.8 miles southwest of the Denver International Airport, which is the fifth busiest airport in the nation and the second largest airport in the world by land area. Access to The Hilton Garden Inn – Downtown Denver Property is provided by Interstate 25, which is approximately 1.1 miles west of the Hilton Garden Inn – Downtown Denver Property. Additionally, the East Light Rail Line, a 22.8-mile light rail transit corridor between Union Station in downtown Denver and the Denver International Airport, is scheduled to begin service in 2016, which will also provide access to the Hilton Garden Inn – Downtown Denver Property as Union Station is located approximately one mile north of the Hilton Garden Inn – Downtown Denver Property. The downtown area is the economic core of Denver. According to a third party research report, the Downtown Denver office submarket had a 10.2% vacancy rate as of Q1 2015 and performs well above-average compared to the greater Denver market due to the concentration of large office developments and urban nature of the area. Some of the top corporate accounts at the Hilton Garden Inn – Downtown Denver Property include PricewaterhouseCoopers, Anthem Inc. (previously known as WellPoint Inc.), Baker Hughes, Xcel Energy Inc. and General Electric.
The Hilton Garden Inn – Downtown Denver Property is proximate to numerous demand drivers including the state capital, Civic Center Park, the 16th Street Mall, Larimer Square, Coors Field, the Pepsi Center, the Denver Performing Arts Complex (“DPAC”) and the Colorado Convention Center (“CCC”), which are all less than one-mile away and within walking distance of the Hilton Garden Inn – Downtown Denver Property. The DPAC is located three blocks north of the Hilton Garden Inn – Downtown Denver. The DPAC is the second largest performing arts center in the world after New York City’s Lincoln Center. The DPAC is located on a four-block, 12-acre site containing more than 10,000 seats across ten performance spaces, all connected by an 80-foot tall glass roof. Home to an award-winning theatre company, the DPAC also hosts Broadway touring productions, internationally acclaimed opera, major symphony orchestras, ballet, contemporary dance and more. The CCC is located one block from the Hilton Garden Inn – Downtown Denver Property. The CCC is a multi-purpose meeting facility and underwent a $340.0 million expansion that was completed in December 2004, which expanded the property to 584,000 square feet of exhibit space, 100,000 square feet of meeting rooms, and 85,000 square feet of ballroom space. The expansion also included the 5,000 seat Bellco Theatre, which was designed as one of the most technically advanced theatres of its kind. In 2014, the CCC hosted 76 conventions with approximately 289,326 attendees, which had an estimated economic impact of $576.3 million. This represents an 8.9% increase in economic impact and number of attendees compared to 2013, which had 265,703 attendees and an estimated economic impact of $529.3 million from 84 conventions throughout the year. Over the past five years the number of conventions has increased at an average annual rate of 2.9%, while the economic impact and number of attendees have increased at an average annual rate of 6.7%. The demand segmentation at the Hilton Garden Inn – Downtown Denver Property is equally distributed between 35.0% commercial, 35.0% meeting and group, and 30.0% leisure. A third party hospitality research report identified a competitive set of eight hospitality properties, which contain 2,974 rooms and exhibited an average occupancy, ADR and RevPAR of 76.4%, $174.81 and $133.53, respectively, for the trailing 12-month period ending May 31, 2015.
The following table presents certain information relating to the Hilton Garden Inn – Downtown Denver Property’s competitive set:
Subject and Market Historical Occupancy, ADR and RevPAR(1)
Competitive Set | Hilton Garden Inn – Downtown Denver | Penetration Factor | |||||||
Year | Occupancy | ADR | RevPAR | Occupancy | ADR | RevPAR | Occupancy | ADR | RevPAR |
| 5/31/2015 TTM | 76.4% | $174.81 | $133.53 | 78.6% | $173.42 | $136.39 | 103.0% | 99.2% | 102.1% |
| 5/31/2014 TTM | 74.5% | $160.37 | $119.53 | 82.9% | $156.21 | $129.44 | 111.2% | 97.4% | 108.3% |
| 5/31/2013 TTM | 74.6% | $156.62 | $116.79 | 77.6% | $156.74 | $121.63 | 104.1% | 100.1% | 104.1% |
| (1) | Information obtained from a third party hospitality research report dated June 18, 2015. The competitive set includes: Crowne Plaza Denver, Doubletree The Curtis, Magnolia Hotel Denver, Courtyard Denver Downtown, Hyatt Regency Denver Convention Center, Residence Inn Denver City Center, Hampton Inn & Suites Denver Downtown Convention Center and Homewood Suites Denver Downtown Convention Center. |
The Borrower. The borrower is Apple Ten SPE Denver, Inc., a Virginia corporation and a single purpose entity with one independent director. Legal counsel to the borrower provided a non-consolidation opinion in connection with the origination of the Hilton Garden Inn – Downtown Denver Mortgage Loan. Apple REIT Ten, Inc. is the guarantor of certain nonrecourse carveouts under the Hilton Garden Inn – Downtown Denver Mortgage Loan.
The Sponsor.The sponsor is Apple REIT Ten, Inc., a real estate investment trust formed in 2011 to invest in income producing real estate. As of March 31, 2015, Apple REIT Ten, Inc.’s real estate portfolio was comprised of ownership interests in 53 hotels with 6,762 rooms located throughout 17 states. Apple Hospitality REIT, Inc., an affiliate of Apple REIT Ten, Inc., is a party to three class action lawsuits relating to the merger of Apple REIT Seven, Inc. and Apple REIT Eight, Inc. See “Description of the Mortgage Pool—Litigation Considerations” in the Free Writing Prospectus.
Operating Lessee.An affiliate of the borrower leases and operates the Hilton Garden Inn – Downtown Denver Property pursuant to an operating lease. The operating lessee is a special purpose entity and subordinated the operating lease to the loan documents. The operating lessee assigned the operating lease to the borrower and the borrower assigned the lease to the lender as security for its obligations.
Escrows.The loan documents provide for upfront escrows in the amount of $44,969 for real estate taxes. The loan documents provide for monthly escrows in an amount equal to $44,968 for real estate taxes and for FF&E reserves in an amount equal to one-twelfth of 4.0% of total revenue for the prior fiscal year (initially estimated to be $44,591). Ongoing monthly reserves for insurance are not required as long as (i) no event of default has occurred and is continuing; (ii) the Hilton Garden Inn – Downtown Denver Property is insured by an acceptable blanket insurance policy; and (iii) the borrower provides the lender with evidence of renewal of the insurance policies and timely proof of payment of insurance premiums.
THE INFORMATION IN THIS STRUCTURAL AND COLLATERAL TERM SHEET IS NOT COMPLETE AND MAY BE AMENDED PRIOR TO THE TIME OF SALE. THIS TERM SHEET IS NOT AN OFFER TO SELL THESE SECURITIES AND IT IS NOT A SOLICITATION OF AN OFFER TO BUY THESE SECURITIES IN ANY JURISDICTION WHERE THE OFFER OR SALE IS NOT PERMITTED.
| 62 |
| HILTON GARDEN INN – DOWNTOWN DENVER |
Lockbox and Cash Management.Upon the occurrence of a Cash Trap Event Period (as defined below), the borrower will be required to establish a lender-controlled lockbox account and the borrower and property manager will be required to direct tenants to deposit all rents directly into such lockbox account, and direct all credit card providers to deposit all revenues received into the lockbox account. During a Cash Trap Event Period, all excess funds on deposit in the lockbox account are swept to a lender-controlled cash flow sub-account.
A “Cash Trap Event Period” will commence upon an event of default. A Cash Trap Event Period will be cured upon the cure of such event of default.
Property Management.The Hilton Garden Inn – Downtown Denver Property is managed by Stonebridge Realty Advisors, Inc.
Assumption.The borrower has a two-time right to transfer the Hilton Garden Inn – Downtown Denver Property provided that certain conditions are satisfied, including (i) no event of default has occurred and is continuing; (ii) the lender reasonably determines that the proposed transferee and guarantor satisfy the lender’s credit review and underwriting standards, taking into consideration transferee experience, financial strength and general business standing; and (iii) the lender has received confirmation from Fitch, Moody’s and Morningstar that such assumption will not result in a downgrade, withdrawal or qualification of the respective ratings assigned to the Series 2015-C30 Certificates.
Partial Release.Not permitted.
Real Estate Substitution.Not permitted.
Subordinate and Mezzanine Indebtedness.Not permitted.
Ground Lease.None.
Terrorism Insurance.The loan documents require that the “all risk” insurance policy required to be maintained by the borrower provide coverage for terrorism in an amount equal to the full replacement cost of the Hilton Garden Inn – Downtown Denver Property. The loan documents also require business interruption insurance covering no less than the 18-month period following the occurrence of a casualty event, together with a six-month extended period of indemnity.
THE INFORMATION IN THIS STRUCTURAL AND COLLATERAL TERM SHEET IS NOT COMPLETE AND MAY BE AMENDED PRIOR TO THE TIME OF SALE. THIS TERM SHEET IS NOT AN OFFER TO SELL THESE SECURITIES AND IT IS NOT A SOLICITATION OF AN OFFER TO BUY THESE SECURITIES IN ANY JURISDICTION WHERE THE OFFER OR SALE IS NOT PERMITTED.
| 63 |
| KENT OFFICE PORTFOLIO |
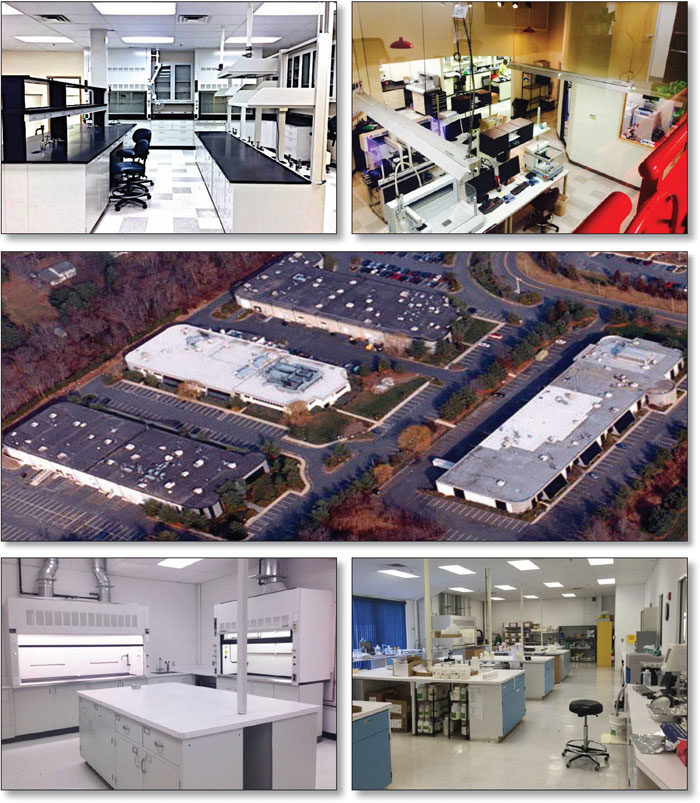
THE INFORMATION IN THIS STRUCTURAL AND COLLATERAL TERM SHEET IS NOT COMPLETE AND MAY BE AMENDED PRIOR TO THE TIME OF SALE. THIS TERM SHEET IS NOT AN OFFER TO SELL THESE SECURITIES AND IT IS NOT A SOLICITATION OF AN OFFER TO BUY THESE SECURITIES IN ANY JURISDICTION WHERE THE OFFER OR SALE IS NOT PERMITTED.
| 64 |
| KENT OFFICE PORTFOLIO |
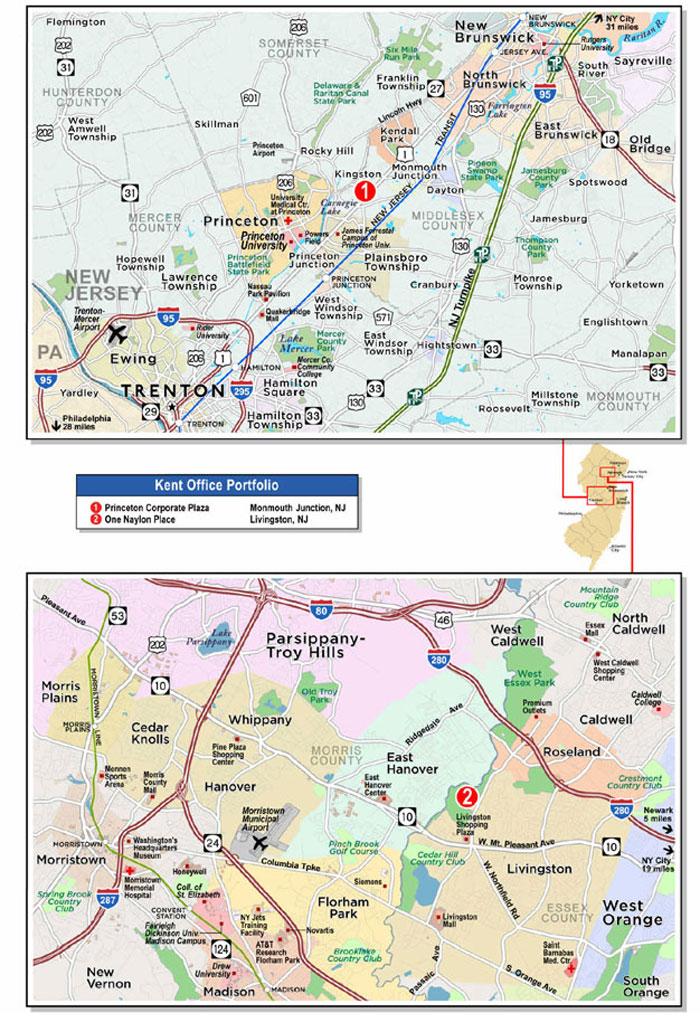
THE INFORMATION IN THIS STRUCTURAL AND COLLATERAL TERM SHEET IS NOT COMPLETE AND MAY BE AMENDED PRIOR TO THE TIME OF SALE. THIS TERM SHEET IS NOT AN OFFER TO SELL THESE SECURITIES AND IT IS NOT A SOLICITATION OF AN OFFER TO BUY THESE SECURITIES IN ANY JURISDICTION WHERE THE OFFER OR SALE IS NOT PERMITTED.
| 65 |
| No. 5 – Kent Office Portfolio | |||||||
| Loan Information | Property Information | ||||||
| Mortgage Loan Seller: | Wells Fargo Bank, National Association | Single Asset/Portfolio: | Portfolio | ||||
Credit Assessment (Fitch/Moody’s/Morningstar): | NR/NR/NR | Property Type: | Office | ||||
| Original Principal Balance: | $26,500,000 | Specific Property Type: | R&D | ||||
| Cut-off Date Principal Balance: | $26,500,000 | Location: | Various – See Table | ||||
| % of Initial Pool Balance: | 3.6% | Size: | 240,546 SF | ||||
| Loan Purpose: | Refinance | Cut-off Date Principal Balance Per SF: | $110.17 | ||||
| Borrower Names: | Princeton Corporate Plaza, LLC; One Naylon Place LLC | Year Built/Renovated: | Various – See Table | ||||
| Sponsor: | Harold Kent | Title Vesting: | Fee | ||||
| Mortgage Rate: | 4.340% | Property Manager: | Self-managed | ||||
| Note Date: | June 30, 2015 | 3rd Most Recent Occupancy (As of): | 90.0% (12/31/2012) | ||||
| Anticipated Repayment Date: | NAP | 2nd Most Recent Occupancy (As of): | 85.0% (12/31/2013) | ||||
| Maturity Date: | July 11, 2025 | Most Recent Occupancy (As of): | 96.4% (12/31/2014) | ||||
| IO Period: | 24 months | Current Occupancy (As of)(3): | 91.7% (Various) | ||||
| Loan Term (Original): | 120 months | ||||||
| Seasoning: | 1 month | Underwriting and Financial Information: | |||||
| Amortization Term (Original): | 360 months | ||||||
| Loan Amortization Type: | Interest-only, Amortizing Balloon | 3rdMost Recent NOI (As of): | $3,179,651 (12/31/2013) | ||||
| Interest Accrual Method: | Actual/360 | 2ndMost Recent NOI (As of): | $3,340,692 (12/31/2014) | ||||
| Call Protection: | L(25),D(91),O(4) | Most Recent NOI (As of): | $3,290,799 (TTM 3/31/2015) | ||||
| Lockbox Type: | Springing (Without Established Account) | ||||||
| Additional Debt: | None | ||||||
| Additional Debt Type: | NAP | ||||||
| U/W Revenues: | $6,733,575 | ||||||
| U/W Expenses: | $3,465,614 | ||||||
| U/W NOI: | $3,267,962 | ||||||
| U/W NCF: | $2,871,488 | ||||||
| Escrows and Reserves(1): | U/W NOI DSCR: | 2.07x | |||||
| U/W NCF DSCR: | 1.82x | ||||||
| Type: | Initial | Monthly | Cap (If Any) | U/W NOI Debt Yield: | 12.3% | ||
| Taxes | $189,256 | $63,086 | NAP | U/W NCF Debt Yield: | 10.8% | ||
| Insurance | $0 | Springing | NAP | As-Is Appraised Value(2): | $44,300,000 | ||
| Replacement Reserves | $700,000 | $5,085 | NAP | As-Is Appraisal Valuation Date(2): | Various | ||
| TI/LC Reserve | $500,000 | $70,159(1) | $1,500,000 | Cut-off Date LTV Ratio: | 59.8% | ||
| Deferred Maintenance | $188,502 | NAP | NAP | LTV Ratio at Maturity or ARD: | 50.9% | ||
| (1) | See “Escrows” section. |
| (2) | See “Appraisal” section. |
| (3) | Current Occupancy is as of May 1, 2015 for Princeton Corporate Plaza and June 30, 2015 for One Naylon Place. |
The Mortgage Loan.The mortgage loan (the “Kent Office Portfolio Mortgage Loan”) is evidenced by a single promissory note that is secured by first mortgages encumbering two office buildings located in New Jersey (the “Kent Office Portfolio Properties”). The Kent Office Portfolio Mortgage Loan was originated on June 30, 2015 by Wells Fargo Bank, National Association. The Kent Office Portfolio Mortgage Loan had an original principal balance of $26,500,000, has an outstanding principal balance as of the Cut-off Date of $26,500,000 and accrues interest at an interest rate of 4.340%per annum. The Kent Office Portfolio Mortgage Loan had an initial term of 120 months, has a remaining term of 119 months as of the Cut-off Date and requires interest-only payments for the first 24 payments following origination and, thereafter, requires payments of principal and interest based on a 30-year amortization schedule. The Kent Office Portfolio Mortgage Loan matures on July 11, 2025.
Following the lockout period, the borrowers have the right to defease the Kent Office Portfolio Mortgage Loan in whole, or in part (see “Partial Release” section), on any date before April 11, 2025. In addition, the Kent Office Portfolio Mortgage Loan is prepayable without penalty on or after April 11, 2025.
THE INFORMATION IN THIS STRUCTURAL AND COLLATERAL TERM SHEET IS NOT COMPLETE AND MAY BE AMENDED PRIOR TO THE TIME OF SALE. THIS TERM SHEET IS NOT AN OFFER TO SELL THESE SECURITIES AND IT IS NOT A SOLICITATION OF AN OFFER TO BUY THESE SECURITIES IN ANY JURISDICTION WHERE THE OFFER OR SALE IS NOT PERMITTED.
| 66 |
| KENT OFFICE PORTFOLIO |
Sources and Uses
| Sources | Uses | |||||||
| Original loan amount | $26,500,000 | 100.0% | Loan payoff(1) | $24,175,749 | 91.2% | |||
| Reserves | 1,577,758 | 6.0 | ||||||
| Closings costs | 577,120 | 2.2 | ||||||
| Return of equity | 169,373 | 0.6 | ||||||
| Total Sources | $26,500,000 | 100.0% | Total Uses | $26,500,000 | 100.0% | |||
| (1) | The Kent Office Portfolio Properties were previously securitized in the JPMCC 2005-LDP4 transaction. |
The Property.The Kent Office Portfolio Properties are comprised of two class B research and development properties located in New Jersey with five buildings located in two business parks approximately 37.7 miles apart. In the aggregate, the Kent Office Portfolio Properties contain 240,546 square feet and were 91.7% occupied as of May 1, 2015 and June 30, 2015.
Princeton Corporate Plaza
The Princeton Corporate Plaza property is a four-building, 214,989 square foot class B+ research and development campus located in Monmouth Junction, New Jersey, approximately 45.1 miles southwest of New York, New York and 45.4 miles northeast of Philadelphia, Pennsylvania in central New Jersey. Originally developed by the sponsor between 1984 and 1989 and situated on a 27.4 acre parcel. The Princeton Corporate Plaza property consists of approximately 45.0% laboratory space with the remaining space consisting of predominantly supporting office uses. Historical occupancy has been stable, ranging from 85.5% to 96.3% and averaging 91.7% over the last ten years. Amenities include a full service café, landscaped grounds and extensive infrastructure to support small- to mid-sized bio-pharmaceutical and research & development companies that cannot afford build-to-suit facilities or extensive tenant improvement buildouts. The Princeton Corporate Plaza property offers “turn-key” lab space featuring fume hoods, lab-specific improvements, dedicated state-of-the-art HVAC and ventilation systems, onsite backup generators, environmental rooms, walk-in freezers and refrigerators. The Princeton Corporate Plaza property is situated on the Princeton-Rutgers Route 1 corridor, otherwise known as “Einstein’s Alley”, a high tech corridor featuring business and industrial parks with research-and technology-based businesses. Parking for the Princeton Corporate Plaza property is provided by 532 surface parking spaces, equating to a parking ratio of 2.5 spaces per 1,000 square feet of rentable area. As of May 1, 2015, the Princeton Corporate Plaza property was 90.7% occupied by 74 tenants.
One Naylon Place
The One Naylon Place property is a single-story, 25,557 square foot class B research and development building located in Livingston, New Jersey, approximately 21.4 miles west of New York, New York and 11.9 miles west of Newark, New Jersey in northern New Jersey. Constructed in 1962 and situated on a 2.4 acre parcel, the One Naylon Place property consists of approximately 82.1% office and laboratory space, with the remaining space consisting of warehouse / flex uses. Three of the four existing tenants have 100% finished office / laboratory space. Two tenants have some lower end lab build out with extra power within their space. The largest tenant is GE Health (46.7% of net rentable area), who has been in occupancy since 1994 and recently renewed for five years in 2015. Parking for the One Naylon Place property is provided by 74 surface parking spaces, equating to a parking ratio of 2.9 spaces per 1,000 square feet of rentable area. As of June 30, 2015, the One Naylon Place property was 100.0% occupied by four tenants.
The following table presents certain information relating to the Kent Office Portfolio Properties:
| Property Name – Location | Allocated Cut-off Date Principal Balance | % of Portfolio Cut-off Date Principal Balance | Current Occupancy | Year Built/ Renovated | Net Rentable Area (SF) | Appraised Value | Allocated LTV | |
| Princeton Corporate Plaza – South Brunswick, NJ | $24,500,000 | 92.5% | 90.7% | 1984/NAP | 214,989 | $40,800,000 | 60.0% | |
| One Naylon Place – Livingston, NJ | $2,000,000 | 7.5% | 100.0% | 1962/NAP | 25,557 | $3,500,000 | 57.1% | |
| Total/Weighted Average | $26,500,000 | 100.0% | 91.7% | 240,546 | $44,300,000 | 59.8% | ||
THE INFORMATION IN THIS STRUCTURAL AND COLLATERAL TERM SHEET IS NOT COMPLETE AND MAY BE AMENDED PRIOR TO THE TIME OF SALE. THIS TERM SHEET IS NOT AN OFFER TO SELL THESE SECURITIES AND IT IS NOT A SOLICITATION OF AN OFFER TO BUY THESE SECURITIES IN ANY JURISDICTION WHERE THE OFFER OR SALE IS NOT PERMITTED.
| 67 |
| KENT OFFICE PORTFOLIO |
The following table presents certain information relating to the tenancies at the Kent Office Portfolio Properties:
Major Tenants(1)
| Tenant Name | Credit Rating (Fitch/Moody’s/S&P) | Tenant NRSF | % of NRSF | Annual U/W Base Rent PSF | Annual U/W Base Rent | % of Total Annual U/W Base Rent | Lease Expiration Date |
| Major Tenants | |||||||
| TyRx | NR/NR/NR | 21,217 | 8.8% | $21.39 | $453,828 | 11.3% | 12/31/2016 |
| Rive | NR/NR/NR | 19,849 | 8.3% | $22.00 | $436,680 | 10.9% | 9/30/2018 |
| Liquid Light | NR/NR/NR | 12,229 | 5.1% | $22.68 | $277,332 | 6.9% | 1/31/2017 |
| Salus | NR/NR/NR | 11,008 | 4.6% | $18.00 | $198,144 | 4.9% | 11/30/2016 |
| Cytosorbents | NR/NR/NR | 11,496 | 4.8% | $17.17 | $197,388 | 4.9% | 5/31/2016 |
| Total Major Tenants | 75,799 | 31.5% | $20.63 | $1,563,372 | 39.0% | ||
| Non-Major Tenants | 144,841 | 60.2% | $16.92 | $2,450,197 | 61.0% | ||
| Occupied Collateral Total | 220,640 | 91.7% | $18.19 | $4,013,569 | 100.0% | ||
| Vacant Space | 19,906 | 8.3% | |||||
| Collateral Total | 240,546 | 100.0% | |||||
| (1) | All tenants in the table are located at the Princeton Corporate Plaza property. |
The following table presents certain information relating to the lease rollover schedule at the Kent Office Portfolio Properties:
Lease Expiration Schedule(1)(2)
Year Ending December 31, | No. of Leases Expiring | Expiring NRSF | % of Total NRSF | Cumulative Expiring NRSF | Cumulative % of Total NRSF | Annual U/W Base Rent | Annual U/W Base Rent PSF(3) |
| MTM | 5(4) | 6,815 | 2.8% | 6,815 | 2.8% | $50,493 | $7.41 |
| 2015 | 19 | 22,579 | 9.4% | 29,394 | 12.2% | $396,584 | $17.56 |
| 2016 | 30 | 85,503 | 35.5% | 114,897 | 47.8% | $1,608,575 | $18.81 |
| 2017 | 14 | 40,786 | 17.0% | 155,683 | 64.7% | $712,317 | $17.46 |
| 2018 | 8 | 46,069 | 19.2% | 201,752 | 83.9% | $902,508 | $19.59 |
| 2019 | 0 | 0 | 0.0% | 201,752 | 83.9% | $0 | $0.00 |
| 2020 | 2 | 18,888 | 7.9% | 220,640 | 91.7% | $343,092 | $18.16 |
| 2021 | 0 | 0 | 0.0% | 220,640 | 91.7% | $0 | $0.00 |
| 2022 | 0 | 0 | 0.0% | 220,640 | 91.7% | $0 | $0.00 |
| 2023 | 0 | 0 | 0.0% | 220,640 | 91.7% | $0 | $0.00 |
| 2024 | 0 | 0 | 0.0% | 220,640 | 91.7% | $0 | $0.00 |
| 2025 | 0 | 0 | 0.0% | 220,640 | 91.7% | $0 | $0.00 |
| Thereafter | 0 | 0 | 0.0% | 220,640 | 91.7% | $0 | $0.00 |
| Vacant | 0 | 19,906 | 8.3% | 240,546 | 100.0% | $0 | $0.00 |
| Total/Weighted Average | 78 | 240,546 | 100.0% | $4,013,569 | $18.19 |
| (1) | Information obtained from the underwritten rent roll. |
| (2) | Certain tenants may have lease termination options that are exercisable prior to the originally stated expiration date of the subject lease and that are not considered in the Lease Expiration Schedule. |
| (3) | Weighted Average Annual U/W Base Rent PSF excludes vacant space. |
| (4) | MTM tenancy includes a 3,885 square foot (1.6% net rentable area) management office, for which no rent was underwritten. |
The following table presents historical occupancy percentages at the Kent Office Portfolio Properties:
Historical Occupancy
12/31/2012(1) | 12/31/2013(1) | 12/31/2014(1) | Various(2) | |||
| 90.0% | 85.0% | 96.4% | 91.7% |
| (1) | Information obtained from the borrower. |
| (2) | Information obtained from the underwritten rent roll. Current occupancy is as of May 1, 2015 for Princeton Corporate Plaza and June 30, 2015 for One Naylon Place. |
THE INFORMATION IN THIS STRUCTURAL AND COLLATERAL TERM SHEET IS NOT COMPLETE AND MAY BE AMENDED PRIOR TO THE TIME OF SALE. THIS TERM SHEET IS NOT AN OFFER TO SELL THESE SECURITIES AND IT IS NOT A SOLICITATION OF AN OFFER TO BUY THESE SECURITIES IN ANY JURISDICTION WHERE THE OFFER OR SALE IS NOT PERMITTED.
| 68 |
| KENT OFFICE PORTFOLIO |
Operating History and Underwritten Net Cash Flow. The following table presents certain information relating to the historical operating performance and underwritten net cash flow at the Kent Office Portfolio Properties:
Cash Flow Analysis
| 2012 | 2013 | 2014 | TTM 3/31/2015 | U/W | % of U/W Effective Gross Income | U/W $ per SF | |||||||||
| Base Rent | $3,668,416 | $3,786,394 | $4,021,117 | $4,023,207 | $4,013,569 | 59.6% | $16.69 | ||||||||
| Grossed Up Vacant Space | 0 | 0 | 0 | 0 | 418,026 | 6.2 | 1.74 | ||||||||
| Total Reimbursables | 2,663,217 | 2,665,936 | 2,875,350 | 2,794,453 | 2,731,332 | 40.6 | 11.35 | ||||||||
| Other Income | 22,806 | 18,321 | 21,052 | 18,901 | 18,901 | 0.3 | 0.08 | ||||||||
| Less Vacancy & Credit Loss | 0 | 0 | 0 | 0 | (448,253)(1) | (6.7) | (1.86) | ||||||||
| Effective Gross Income | $6,354,439 | $6,470,651 | $6,917,519 | $6,836,561 | $6,733,575 | 100.0% | $27.99 | ||||||||
| Total Operating Expenses | $3,278,764 | $3,291,000 | $3,576,827 | $3,545,762 | $3,465,614 | 51.5% | $14.41 | ||||||||
| Net Operating Income | $3,075,675 | $3,179,651 | $3,340,692 | $3,290,799 | $3,267,962 | 48.5% | $13.59 | ||||||||
| TI/LC | 0 | 0 | 0 | 0 | 336,337 | 5.0 | 1.40 | ||||||||
| Capital Expenditures | 0 | 0 | 0 | 0 | 60,137 | 0.9 | 0.25 | ||||||||
| Net Cash Flow | $3,075,675 | $3,179,651 | $3,340,692 | $3,290,799 | $2,871,488 | 42.6% | $11.94 | ||||||||
| NOI DSCR | 1.95x | 2.01x | 2.11x | 2.08x | 2.07x | ||||||||||
| NCF DSCR | 1.95x | 2.01x | 2.11x | 2.08x | 1.82x | ||||||||||
| NOI DY | 11.6% | 12.0% | 12.6% | 12.4% | 12.3% | ||||||||||
| NCF DY | 11.6% | 12.0% | 12.6% | 12.4% | 10.8% |
| (1) | The underwritten economic vacancy is 10.1%. The Kent Office Portfolio Properties were 91.7% physically occupied as of May 1, 2015 and June 30, 2015. |
Appraisal.As of the appraisal valuation date of April 15, 2015, the Princeton Corporate Plaza property had an “as-is” appraised value of $40,800,000 and as of the appraisal valuation date of April 21, 2015, the One Naylon Place property had an “as-is” appraised value of $3,500,000, resulting in an aggregate appraised value $44,300,000.
Environmental Matters.According to the Phase I environmental reports dated April 22, 2015 (the Princeton Corporate Plaza property) and April 27, 2015 (the One Naylon Place property), there was no evidence of any recognized environmental conditions at the Kent Office Portfolio Properties.
Market Overview and Competition.The Kent Office Portfolio Properties are located in central and northern New Jersey in two distinct markets. The New Jersey biopharmaceutical industry remains one of the more robust in the nation. In 2013, New Jersey’s biopharmaceutical employment accounted for 8.8% of the nation’s biopharmaceutical industry workforce (ranked first in the United States) and New Jersey has more scientists per capita than any other state. Despite several large biopharmaceutical company reorganizations, the number of biopharmaceutical businesses in New Jersey has grown by 9.4% since 2008. Pharmaceutical firms with a significant presence in New Jersey include Wyeth, BASF, Bristol-Myers Squibb, Aventis, Hoffmann-LaRoche, Johnson & Johnson, Novartis, Pharmacia and Schering-Plough.
Princeton Corporate Plaza
The Princeton Corporate Plaza property is located in Monmouth Junction, New Jersey, approximately 45.1 miles southwest of New York, New York and 45.4 miles northeast of Philadelphia, Pennsylvania in central New Jersey. The Princeton Corporate Plaza property is situated along Route 1, a major north-south highway traversing South Brunswick and Princeton. The area is known as the Princeton-Rutgers Route 1 corridor and is near the center of “Einstein’s Alley”, a high tech corridor featuring business and industrial parks with research-and technology-based businesses. Compared to California’s Silicon Valley, and touted as the research and technology center of New Jersey, Einstein’s Alley spans five counties: Mercer, Hunterdon, Middlesex, Somerset, and Monmouth and began conceptually in the 1990s as local business owners started thinking about identifying central New Jersey as a region known for its high tech industries and educational institutions. Einstein’s Alley is also a private, non-profit economic development initiative whose purpose is to attract, build and retain technology-based businesses in central New Jersey. Helping companies set up or relocate in New Jersey’s is one of Einstein Alley’s most important initiatives. The Princeton Corporate Plaza property (and the surrounding Einstein’s Alley area) benefits from its proximity to two major research universities: Princeton University (4.8 miles southwest) and Rutgers University (11.8 miles northeast). The estimated 2015 population within a three- and five-mile radius of the Princeton Corporate Plaza property is 33,175 and 117,518, respectively, while the 2015 estimated average household income for the same radii is $141,229 and $138,006, respectively.
According to a third-party market research report, the Princeton Corporate Plaza property is located in the Princeton North office submarket, which is comprised of 5.1 million square feet across 217 buildings. As of the first quarter 2015, the Princeton North office submarket reported a 10.8% vacancy rate and average asking rent of $23.08 per square foot on a gross basis. However, according to the appraisal, the Princeton Corporate Plaza Property is considered life science real estate (which features lab space, specialized building systems, substantial clear heights and appropriate zoning). There are no published reports for the life science real estate industry, but demand for lab space in the area remains strong. According to a survey of 15 comparable properties with a lab component, the average occupancy was 91.0%.
THE INFORMATION IN THIS STRUCTURAL AND COLLATERAL TERM SHEET IS NOT COMPLETE AND MAY BE AMENDED PRIOR TO THE TIME OF SALE. THIS TERM SHEET IS NOT AN OFFER TO SELL THESE SECURITIES AND IT IS NOT A SOLICITATION OF AN OFFER TO BUY THESE SECURITIES IN ANY JURISDICTION WHERE THE OFFER OR SALE IS NOT PERMITTED.
| 69 |
| KENT OFFICE PORTFOLIO |
One Naylon Place
The One Naylon Place property is located in located in Livingston, New Jersey, approximately 21.4 miles west of New York, New York and 11.9 miles west of Newark, New Jersey in northern New Jersey. The One Naylon Place property is located approximately five miles north of Saint Barnabas Medical Center, New Jersey’s oldest non-profit, nonsectarian hospital and one of the largest health care providers in the state. Together, Saint Barnabas Medical Center and the Barnabas Health Ambulatory Care Center provide treatment and services to more than 300,000 outpatients annually. Over 1,500 healthcare professionals are employed by the hospital representing approximately 100 specialties. Primary access to the One Naylon Place property is provided by State Route 10, a four lane highway providing east/west travel. Further, the One Naylon Place property is located 16.2 miles northwest of the Newark Liberty International Airport and is an approximate 45 minute commute to midtown Manhattan. The estimated 2015 population within a three- and five-mile radius of the One Naylon Place property is 48,476 and 148,023, respectively, while the 2015 estimated average household income for the same radii is $151,441 and $143,159, respectively.
According to the appraisal, the One Naylon Place property is located in the Suburban Essex/Eastern Morris office submarket (of the New Jersey office market), which is comprised of 8.2 million square feet. As of the fourth quarter 2014, the Suburban Essex/Eastern Morris submarket reported a 20.3% vacancy rate and average asking rent of $24.47 per square foot on a gross basis. However, the vacancy figure is skewed since the submarket covers such a large area, and is not reflective of the One Naylon Place property. The appraiser identified 14 comparable flex properties (less than 50,000 square feet) within a two-mile radius of the One Naylon Place property. The inventory totaled 285,531 square feet and exhibited an average occupancy of 100.0%.
The following tables present certain information relating to comparable office properties for the Kent Office Portfolio Properties:
Competitive Set – Princeton Corporate Plaza(1)
| Princeton Corporate Plaza (Subject) | 246 W Industrial Way | 100 Philips Parkway | 100 SciPark | 95 Corporate Drive | |
| Location | Monmouth Junction, NJ | Eatontown, NJ | Montvale, NJ | East Windsor, NJ | Bridgewater, NJ |
| Distance from Subject | -- | 34.5 miles | 59.6 miles | 8.4 miles | 22.5 miles |
| Property Type | Office/R&D | Office/R&D | Office/R&D | Office/Lab | Office/Lab |
| Year Built/Renovated | 1984/NAP | 1981/NAP | 1969/1999 | 2009/NAP | 1984/1998 |
| Total GLA | 214,989 SF | 193,836 SF | 78,501 SF | 65,552 SF | 118,000 SF |
| Total Occupancy | 91% | NAV | NAV | NAV | 100% |
| (1) | Information obtained from the appraisal. |
Competitive Set – One Naylon Place(1)
| One Naylon Place (Subject) | 246 W Industrial Way | 7 Becker Farm Road | 100 Executive Drive | 290 West Mount Pleasant Campus | |
| Location | Livingston, NJ | Eatontown, NJ | Roseland, NJ | West Orange, NJ | Livingston, NJ |
| Distance from Subject | -- | 47.6 miles | 2.6 miles | 6.1 miles | 1.7 miles |
| Property Type | Office | Office | Office | Office | Office |
| Year Built/Renovated | 1962/NAP | 1981/NAP | 1981/NAP | 1978/NAP | 1984/NAP |
| Total GLA | 25,557 SF | 193,836 SF | 90,042 SF | 93,285 SF | 386,827 SF |
| Total Occupancy | 100% | NAV | NAV | NAV | NAV |
| (1) | Information obtained from the appraisal. |
The Borrowers.The borrowers are Princeton Corporate Plaza, LLC and One Naylon Place LLC, both New Jersey limited liability companies and single purpose entities each with one independent director. Legal counsel to the borrowers delivered a non-consolidation opinion in connection with the origination of the Kent Office Portfolio Mortgage Loan. Harold Kent is the guarantor of certain nonrecourse carveouts under the Kent Office Portfolio Mortgage Loan.
The Sponsor.The sponsor is Harold Kent, the owner of Kent Management, a real estate service company specializing the development and management of office, R&D and laboratory properties throughout New Jersey. Mr. Kent’s portfolio of seven properties totals approximately 500,000 square feet of commercial space, all of which are located within a 50-mile radius of New York City. Mr. Kent was involved in various loan defaults during the 1990’s that resulted in deeds-in-lieu of foreclosure or “consensual” foreclosures. See “Description of the Mortgage Pool – Default History, Bankruptcy Issues and Other Proceedings” in the Free Writing Prospectus.
Escrows.The loan documents provide for an upfront reserve in the amount of $189,256 for real estate taxes, $700,000 for replacement reserves, $500,000 for tenant improvements and leasing commissions (“TI/LC”) and $188,502 for deferred maintenance. The loan documents also provide for ongoing monthly reserves of $63,086 for real estate taxes and $5,085 for replacement reserves. Monthly TI/LC reserves of $70,159 are required from August 2015 through July 2017 and monthly TI/LC reserves of $34,077 are required thereafter, subject to a capped amount of $1.5 million. The loan documents do not require monthly escrows for insurance as long as (i) no event of default has occurred and is continuing; (ii) the Kent Office Portfolio
THE INFORMATION IN THIS STRUCTURAL AND COLLATERAL TERM SHEET IS NOT COMPLETE AND MAY BE AMENDED PRIOR TO THE TIME OF SALE. THIS TERM SHEET IS NOT AN OFFER TO SELL THESE SECURITIES AND IT IS NOT A SOLICITATION OF AN OFFER TO BUY THESE SECURITIES IN ANY JURISDICTION WHERE THE OFFER OR SALE IS NOT PERMITTED.
| 70 |
| KENT OFFICE PORTFOLIO |
Properties are insured under acceptable blanket insurance policies; and (iii) the borrowers provide the lender with evidence of renewal of the required policies and timely proof of payment of the insurance premiums when due.
Lockbox and Cash Management.Upon the occurrence of a Cash Trap Event Period (as defined below), the borrowers will be required to establish a lender-controlled lockbox account and direct tenants to deposit all rents directly into such lockbox account. Additionally, all revenues and other monies received by the borrowers or property manager relating to the Kent Office Portfolio Properties shall be deposited into the lockbox account within 30 days. During a Cash Trap Event Period, all excess funds on deposit in the lockbox account are swept to a lender-controlled subaccount on a monthly basis.
A “Cash Trap Event Period” will commence upon the earlier of (i) the occurrence and continuance of an event of default; and (ii) the amortizing debt service coverage ratio for the trailing 12-month period falling below 1.25x at the end of any calendar month. A Cash Trap Event Period will expire, with regard to clause (i), upon the cure of such event of default; and with regard to clause (ii), upon the amortizing debt service coverage ratio being equal to or greater than 1.30x for two consecutive calendar quarters.
Property Management.The Kent Office Portfolio Properties is managed by an affiliate of the borrower.
Assumption.The borrower has the two-time right to transfer the Kent Office Portfolio Properties, in whole, but not in part (unless a release and partial defeasance of the One Naylon Place property has occurred), provided that no event of default has occurred and is continuing and certain other conditions are satisfied, including (i) the lender’s reasonable determination that the proposed transferee and guarantor satisfy the lender’s credit review and underwriting standards, taking into consideration transferee experience, financial strength and general business standing; (ii) execution of a recourse guaranty (which includes an environmental indemnity) by an affiliate of the transferee; and (iii) rating agency confirmation from Fitch, Moody’s and Morningstar that the transfer will not result in a downgrade, withdrawal or qualification of the respective ratings assigned to the Series 2015-C30 Certificates.
Partial Release.Following the lockout period, the borrowers are permitted to partially release the One Naylon Place property in connection with a bona-fide sale to an unaffiliated third-party via partial defeasance, subject to certain conditions including (i) no event of default has occurred and is continuing; (ii) partial defeasance equal to the greater of (a) 100% of the net sales proceeds or (b) 120% of the One Naylon Place property’s allocated loan balance; (iii) the loan-to-value with respect to the Princeton Corporate Plaza property will be no greater than the loan-to-value ratio immediately prior to the release; (iv) the amortizing debt service coverage ratio (based on a 30-year amortization schedule) with respect to the Princeton Corporate Plaza property will be no less than the amortizing debt service coverage ratio immediately prior to the release; and (v) if required by the lender, receipt of rating agency confirmation from Fitch, Moody’s and Morningstar that the release will not result in a downgrade, withdrawal or qualification of the respective ratings assigned to the Series 2015-C30 Certificates.
Real Estate Substitution.Not permitted.
Subordinate and Mezzanine Indebtedness. Not permitted.
Ground Lease.None.
Terrorism Insurance. The loan documents require that the “all risk” insurance policy required to be maintained by the borrowers provide coverage for terrorism in an amount equal to the full replacement cost of the Kent Office Portfolio Properties (provided that the borrowers are not required to pay terrorism insurance premiums in excess of two times the premium for all risk and business interruption coverage if the Terrorism Risk Insurance Program Reauthorization Act is no longer in effect), as well as business interruption insurance covering no less than the 12-month period following the occurrence of a casualty event, together with a six-month extended period of indemnity.
THE INFORMATION IN THIS STRUCTURAL AND COLLATERAL TERM SHEET IS NOT COMPLETE AND MAY BE AMENDED PRIOR TO THE TIME OF SALE. THIS TERM SHEET IS NOT AN OFFER TO SELL THESE SECURITIES AND IT IS NOT A SOLICITATION OF AN OFFER TO BUY THESE SECURITIES IN ANY JURISDICTION WHERE THE OFFER OR SALE IS NOT PERMITTED.
| 71 |
| SAWMILL CROSSING APARTMENTS |
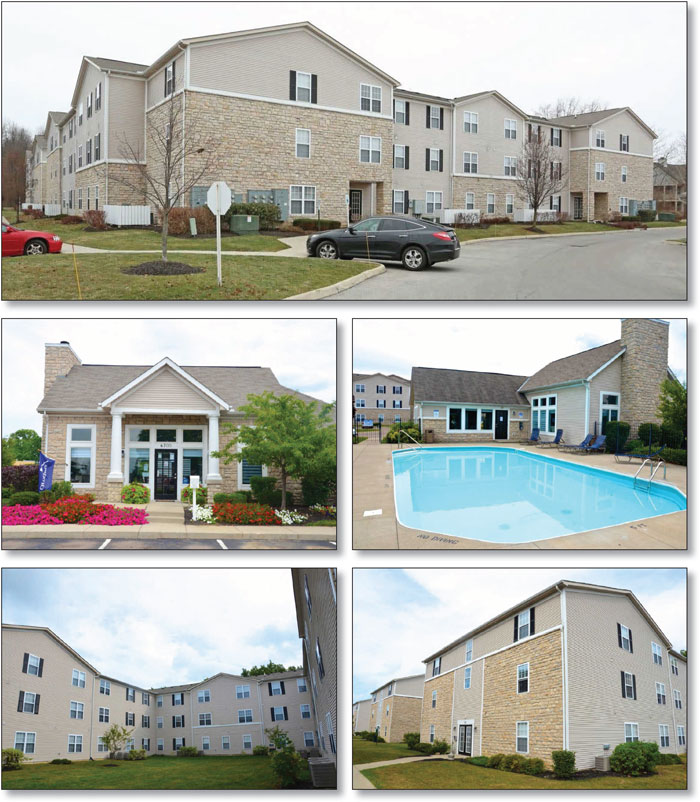
THE INFORMATION IN THIS STRUCTURAL AND COLLATERAL TERM SHEET IS NOT COMPLETE AND MAY BE AMENDED PRIOR TO THE TIME OF SALE. THIS TERM SHEET IS NOT AN OFFER TO SELL THESE SECURITIES AND IT IS NOT A SOLICITATION OF AN OFFER TO BUY THESE SECURITIES IN ANY JURISDICTION WHERE THE OFFER OR SALE IS NOT PERMITTED.
| 72 |
| SAWMILL CROSSING APARTMENTS |
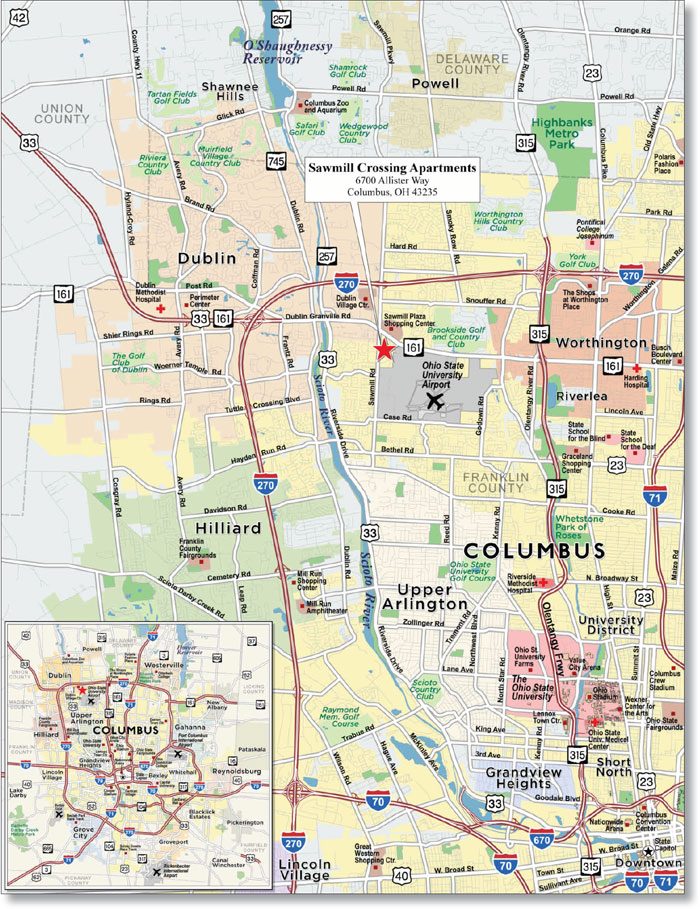
THE INFORMATION IN THIS STRUCTURAL AND COLLATERAL TERM SHEET IS NOT COMPLETE AND MAY BE AMENDED PRIOR TO THE TIME OF SALE. THIS TERM SHEET IS NOT AN OFFER TO SELL THESE SECURITIES AND IT IS NOT A SOLICITATION OF AN OFFER TO BUY THESE SECURITIES IN ANY JURISDICTION WHERE THE OFFER OR SALE IS NOT PERMITTED.
| 73 |
| No. 6 – Sawmill Crossing Apartments | ||||||||
| Loan Information | Property Information | |||||||
| Mortgage Loan Seller: | Rialto Mortgage Finance, LLC | Single Asset/Portfolio: | Single Asset | |||||
| Credit Assessment (Fitch/Moody’s/Morningstar): | NR/NR/NR | Property Type: | Multifamily | |||||
| Original Principal Balance: | $22,000,000 | Specific Property Type: | Garden | |||||
| Cut-off Date Principal Balance: | $22,000,000 | Location: | Columbus, OH | |||||
| % of Initial Pool Balance: | 3.0% | Size: | 364 Units | |||||
| Loan Purpose: | Refinance | Cut-off Date Principal Balance Per Unit: | $60,440 | |||||
| Borrower Name: | Sawmill Crossing Property, LLC | Year Built/Renovated: | 2003/NAP | |||||
| Sponsors: | Brian H. Yeager; Michelle R. Yeager | Title Vesting: | Fee | |||||
| Mortgage Rate: | 4.590% | Property Manager: | Self-managed | |||||
| Note Date: | June 12, 2015 | 3rdMost Recent Occupancy (As of): | 98.1% (5/31/2012) | |||||
| Anticipated Repayment Date: | NAP | 2ndMost Recent Occupancy (As of): | 93.4% (5/31/2013) | |||||
| Maturity Date: | July 6, 2025 | Most Recent Occupancy (As of): | 95.0% (5/31/2014) | |||||
| IO Period: | 36 months | Current Occupancy (As of): | 97.5% (5/18/2015) | |||||
| Loan Term (Original): | 120 Months | |||||||
| Seasoning: | 1 month | Underwriting and Financial Information: | ||||||
| Amortization Term (Original): | 360 months | |||||||
| Loan Amortization Type: | Interest-only, Amortizing Balloon | 3rdMost Recent NOI (As of): | $1,735,291 (12/31/2013) | |||||
| Interest Accrual Method: | Actual/360 | 2ndMost Recent NOI (As of)(3): | $1,850,885 (Ann. 8 12/31/2014) | |||||
| Call Protection: | L(25),D(90),O(5) | Most Recent NOI (As of): | $1,885,987 (TTM 5/31/2015) | |||||
| Lockbox Type: | Springing (Without Established Account) | |||||||
| Additional Debt(1): | Yes | U/W Revenues: | $3,582,964 | |||||
| Additional Debt Type(1): | Mezzanine | U/W Expenses: | $1,580,865 | |||||
| U/W NOI: | $2,002,099 | |||||||
| U/W NCF: | $1,911,099 | |||||||
| U/W NOI DSCR(1): | 1.48x | |||||||
| Escrows and Reserves(2): | U/W NCF DSCR(1): | 1.41x | ||||||
| U/W NOI Debt Yield(1): | 9.1% | |||||||
| Type: | Initial | Monthly | Cap (If Any) | U/W NCF Debt Yield(1): | 8.7% | |||
| Taxes | $45,526 | $43,359 | NAP | As-Is Appraised Value: | $31,050,000 | |||
| Insurance | $29,581 | $4,695 | NAP | As-Is Appraisal Valuation Date: | May 12, 2015 | |||
| Replacement Reserves | $0 | $7,583 | $273,000 | Cut-off Date LTV Ratio(1): | 70.9% | |||
| Performance Reserve | $750,000 | $0 | NAP | LTV Ratio at Maturity or ARD(1): | 62.2% | |||
| (1) | See “Subordinate and Mezzanine Indebtedness” section. The equity interest in the Sawmill Crossing Apartments Mortgage Loan borrower has been pledged to secure mezzanine indebtedness with a principal balance of $4,000,000. The LTV ratios, DSCR, debt yields and Cut-off Date Principal Balance shown in the chart above are based solely on the Sawmill Crossing Apartments Mortgage Loan. As of the Cut-off Date, the combined U/W NCF DSCR, Cut-off Date LTV Ratio and U/W NCF Debt Yield were 1.04x, 83.7% and 7.4%, respectively. |
| (2) | See “Escrows” section. |
| (3) | The December 31, 2014 NOI is annualized from May 2014 through December 2014 due to the Sawmill Crossing Apartments Property being acquired in April 2014. |
The Mortgage Loan. The mortgage loan (the “Sawmill Crossing Apartments Mortgage Loan”) is evidenced by a single promissory note that is secured by a first mortgage encumbering a garden-style multifamily property located in Columbus, Ohio (the “Sawmill Crossing Apartments Property”). The Sawmill Crossing Apartments Mortgage Loan was originated on June 12, 2015 by Rialto Mortgage Finance, LLC. The Sawmill Crossing Apartments Mortgage Loan had an original principal balance of $22,000,000, has an outstanding principal balance as of the Cut-off Date of $22,000,000 and accrues interest at an interest rate of 4.590%per annum. The Sawmill Crossing Apartments Mortgage Loan had an initial term of 120 months, has a remaining term of 119 months as of the Cut-off Date and requires interest-only payments the first 36 payments following origination and, thereafter, requires payments of principal and interest based on a 30-year amortization schedule. The Sawmill Crossing Apartments Mortgage Loan matures on July 6, 2025.
Following the lockout period, the borrower has the right to defease the Sawmill Crossing Apartments Mortgage Loan in whole, but not in part, on any date before March 6, 2025. In addition, the Sawmill Crossing Apartments Loan is prepayable without penalty on or after March 6, 2025.
THE INFORMATION IN THIS STRUCTURAL AND COLLATERAL TERM SHEET IS NOT COMPLETE AND MAY BE AMENDED PRIOR TO THE TIME OF SALE. THIS TERM SHEET IS NOT AN OFFER TO SELL THESE SECURITIES AND IT IS NOT A SOLICITATION OF AN OFFER TO BUY THESE SECURITIES IN ANY JURISDICTION WHERE THE OFFER OR SALE IS NOT PERMITTED.
| 74 |
| SAWMILL CROSSING APARTMENTS |
Sources and Uses
| Sources | Uses | |||||||
| Original loan amount | $22,000,000 | 84.6% | Loan payoff | $18,622,719 | 71.6% | |||
| Mezzanine loan | 4,000,000 | 15.4 | Closing costs | 616,202 | 2.4 | |||
| Reserves | 825,107 | 3.2 | ||||||
| Return of equity | 5,935,973 | 22.8 | ||||||
| Total Sources | $26,000,000 | 100.0% | Total Uses | $26,000,000 | 100.0% |
The Property.The Sawmill Crossing Apartments Property is a 364-unit, garden-style multifamily property consisting of seven, three-story residential buildings situated on 12.8 acres located in Columbus, Ohio. The Sawmill Crossing Apartments Property is located approximately 11.0 miles northwest of the Columbus central business district. The improvements were constructed in 2003. Community amenities include a clubhouse, a pool, a fitness center, storage units, elevators, and detached garages. Unit amenities include fully equipped kitchens and washer/dryer connections. The Sawmill Crossing Apartments Property contains 546 surface parking spaces and 68 detached garage spaces for a total of 614 parking spaces, resulting in an overall parking ratio of 1.7 spaces per unit. As of May 18, 2015, the Sawmill Crossing Apartments Property was 97.5% occupied.
The following table presents certain information relating to the unit mix of the Sawmill Crossing Apartments Property:
Unit Mix Summary(1)
| Unit Type | No. of Units | % of Total Units | Average Unit Size (SF) | Average U/W Monthly Rent per Unit |
| Studio | 14 | 3.8% | 556 | $635 |
| 1 Bedroom/1 Bath | 70 | 19.2% | 672 | $700 |
| 1 Bedroom/1.5 Bath | 14 | 3.8% | 985 | $751 |
| 2 Bedroom/1 Bath | 70 | 19.2% | 998 | $772 |
| 2 Bedroom/2 Bath | 168 | 46.2% | 965 | $788 |
| 2 Bedroom/2.5 Bath | 28 | 7.7% | 1,200 | $923 |
| Total/Weighted Average | 364 | 100.0% | 918 | $771 |
| (1) | Information obtained from the underwritten rent roll. |
The following table presents historical occupancy percentages at the Sawmill Crossing Apartments Property:
Historical Occupancy
5/31/2012(1) | 5/31/2013(1) | 5/31/2014(1) | 5/18/2015(2) | |||
| 98.1% | 93.4% | 95.0% | 97.5% |
| (1) | Information obtained from the borrower. |
| (2) | Information obtained from the underwritten rent roll. |
THE INFORMATION IN THIS STRUCTURAL AND COLLATERAL TERM SHEET IS NOT COMPLETE AND MAY BE AMENDED PRIOR TO THE TIME OF SALE. THIS TERM SHEET IS NOT AN OFFER TO SELL THESE SECURITIES AND IT IS NOT A SOLICITATION OF AN OFFER TO BUY THESE SECURITIES IN ANY JURISDICTION WHERE THE OFFER OR SALE IS NOT PERMITTED.
| 75 |
| SAWMILL CROSSING APARTMENTS |
Operating History and Underwritten Net Cash Flow.The following table presents certain information relating to the historical operating performance and underwritten net cash flow at the Sawmill Crossing Apartments Property:
Cash Flow Analysis
| 2013 | Annualized 8 12/31/2014(1) | TTM 5/31/2015 | U/W | % of U/W Effective Gross Income | U/W $ per Unit | |||||||||||||||
| Base Rent | $3,190,922 | $3,184,625 | $3,188,563 | $3,286,784 | 91.7% | $9,030 | ||||||||||||||
| Grossed Up Vacant Space | 0 | 0 | 0 | 82,625 | 2.3 | 227 | ||||||||||||||
| Concessions | (38,730 | ) | (51,921 | ) | (36,114 | ) | (1,944) | (0.1) | (5 | ) | ||||||||||
| Other Income | 224,924 | 254,182 | 298,124 | 298,124 | 8.3 | 819 | ||||||||||||||
| Less Vacancy & Credit Loss | 0 | 0 | 0 | (82,625)(2) | (2.3) | (227 | ) | |||||||||||||
| Effective Gross Income | $3,377,116 | $3,386,886 | $3,450,573 | $3,582,964 | 100.0% | $9,843 | ||||||||||||||
| Total Operating Expenses | $1,641,825 | $1,536,001 | $1,564,585 | $1,580,865 | 44.1% | $4,343 | ||||||||||||||
| Net Operating Income | $1,735,291 | $1,850,885 | $1,885,987 | $2,002,099 | 55.9% | $5,500 | ||||||||||||||
| Capital Expenditures | 0 | 0 | 0 | 91,000 | 2.5 | 250 | ||||||||||||||
| Net Cash Flow | $1,735,291 | $1,850,885 | $1,885,987 | $1,911,099 | 53.3% | $5,250 | ||||||||||||||
| NOI DSCR | 1.28x | 1.37x | 1.40x | 1.48x | ||||||||||||||||
| NCF DSCR | 1.28x | 1.37x | 1.40x | 1.41x | ||||||||||||||||
| NOI DY | 7.9% | 8.4% | 8.6% | 9.1% | ||||||||||||||||
| NCF DY | 7.9% | 8.4% | 8.6% | 8.7% | ||||||||||||||||
| (1) | The 2014 cash flow represents the annualized period from May 2014 through December 2014 due to the Sawmill Crossing Apartments Property being acquired in April 2014. |
| (2) | The underwritten economic vacancy is 2.5%. The Sawmill Crossing Apartments Property was 97.5% physically occupied as of May 18, 2015. |
Appraisal.As of the appraisal valuation date of May 12, 2015, the Sawmill Crossing Apartments Property had an “as-is” appraised value of $31,050,000.
Environmental Matters.According to a Phase I environmental assessment dated May 27, 2015, there was no evidence of any recognized environmental conditions at the Sawmill Crossing Apartments Property.
Market Overview and Competition.The Sawmill Crossing Apartments Property is located in Columbus, Ohio, approximately 11.0 miles northwest of the Columbus central business district on the eastern border of Columbus and the suburb of Dublin. According to the appraisal, Dublin is home to the headquarters of Wendy’s, Ashland Inc., Cardinal Health, and several other corporations. According to a government agency, the unemployment rate for the Columbus metropolitan statistical area was 4.5% as of February 2015. In comparison, the unemployment rate in Ohio was 5.1%, and the national unemployment rate was 5.5% for the same time period. The Sawmill Crossing Apartments Property is situated along Allister Way, which is just south of West Dublin Granville Road and just east of Sawmill Road, two major thoroughfares in the neighborhood. The intersection of West Dublin Granville Road and Sawmill Road is a major retail hub for the area and is comprised of a mix of power centers, big box retailers and neighborhood centers. Large retail draws include Sun Center, a 527,000 square foot power center anchored by Babies “R” Us, Old Navy, Whole Foods and Bed Bath & Beyond and other big box retailers in the area include Dick’s Sporting Goods, Target, Office Max, PetSmart, Hobby Lobby, Hallmark, Meijer, Kohl’s, Sports Authority, Home Depot, Sam’s Club, Burlington Coat Factory and an AMC Theatres. The area is also heavily developed with numerous freestanding restaurants, banks and service-oriented retailers. The estimated 2015 population within a one-, three- and five-mile radius of the Sawmill Crossing Apartments Property was 10,558, 86,351 and 214,241, respectively, and the average annual household income within the same radii was $75,426, $93,355 and $101,406, respectively.
According to a third party market research report, the Sawmill Crossing Apartments Property is located in the Columbus multifamily market and the Upper Arlington multifamily submarket. As of first quarter 2015, the Columbus multifamily market contained 131,406 units, with a 5.0% vacancy rate and average monthly asking rent of $736 per unit. As of the first quarter of 2015, the Upper Arlington submarket contained 9,767 units, with a 4.0% vacancy rate and average monthly asking rent of $789 per unit.
THE INFORMATION IN THIS STRUCTURAL AND COLLATERAL TERM SHEET IS NOT COMPLETE AND MAY BE AMENDED PRIOR TO THE TIME OF SALE. THIS TERM SHEET IS NOT AN OFFER TO SELL THESE SECURITIES AND IT IS NOT A SOLICITATION OF AN OFFER TO BUY THESE SECURITIES IN ANY JURISDICTION WHERE THE OFFER OR SALE IS NOT PERMITTED.
| 76 |
| SAWMILL CROSSING APARTMENTS |
The following table presents certain information relating to comparable multifamily properties for the Sawmill Crossing Apartments Property:
Competitive Set(1)
| Sawmill Crossing Apartments (Subject) | Arbors of Dublin | Sawmill Ridge | Heathermoor Apartments | Bedford Commons | The Residences at Sawmill Park | Orchard at Wilcox | |||||||||
| Location | Columbus, OH | Dublin, OH | Dublin, OH | Columbus, OH | Dublin, OH | Dublin, OH | Dublin, OH | ||||||||
| Distance to Subject | NAP | 0.7 miles | 0.9 miles | 2.2 miles | 2.2 miles | 1.4 miles | 6.3 miles | ||||||||
| Property Type | Garden | Garden | Garden/Townhouse | Garden/Townhouse | Townhouse | Garden | Garden | ||||||||
| Number of Units | 364 | 288 | 192 | 280 | 112 | 120 | 292 | ||||||||
| Average Rent (per unit) | |||||||||||||||
| Studio | $635 | NAP | NAP | NAP | NAP | NAP | $770 | ||||||||
| 1BR | $700-$751 | $710-$945 | $720 | $620 | NAP | $825 | $850-$960 | ||||||||
| 2BR | $772-$923 | $975 - $999 | $883 | $840 | $1,150-$1,210 | $875-$880 | $1,082-$1,435 | ||||||||
| 3BR | NAP | $1,140 | NAP | NAP | NAP | NAP | $1,645 | ||||||||
| Total Occupancy | 98% | 97% | 99% | 99% | 97% | 98% | 98% |
| (1) | Information obtained from the appraisal and underwritten rent roll. |
The Borrower.The borrower is Sawmill Crossing Property, LLC, a single purpose entity with one independent director. Legal counsel to the borrower delivered a non-consolidation opinion in connection with the origination of the Sawmill Crossing Apartments Mortgage Loan. Brian H. Yeager and Michelle R. Yeager are the guarantors of certain nonrecourse carveouts under the Sawmill Crossing Apartments Mortgage Loan.
The Sponsors.The sponsors, Brian H. Yeager and Michelle R. Yeager, are the co-founders of Champion Real Estate (“Champion”). Champion is a Columbus, Ohio based multifamily investment firm. Mr. Yeager, who serves as president and chief executive officer of Champion, has closed more than $350.0 million of multifamily sales since 2010 and currently oversees Champion’s existing multifamily portfolio of 12 properties totaling 4,525 units. Champion’s real estate holdings are valued at approximately $367.4 million. Ms. Yeager serves as Champion’s chief operations officer and is responsible for Champion’s day-to-day operations.
Escrows.The loan documents provide for upfront escrows in the amount of $45,526 for real estate taxes and $29,581 for insurance. The loan documents also provide for ongoing monthly reserves in the amount of $43,359 for real estate taxes, $4,695 for insurance and $7,583 for replacement reserves (subject to a cap of $273,000).
In connection with the Sawmill Crossing Apartments Mezzanine Loan (as defined below; see “Subordinate and Mezzanine Indebtedness” section), the mezzanine borrower deposited an initial upfront performance reserve of $750,000, which may be returned to the mezzanine borrower if requested within two years of June 12, 2015, provided that the following conditions are satisfied (a) the mezzanine borrower is entitled to only one request for disbursement; (b) (i) no event of default has occurred and is continuing at time of request, and (ii) there has been no previous monetary event of default under the Sawmill Crossing Apartments Mezzanine Loan that was not cured within five days and no more than three monetary defaults have occurred since the origination date; (c) no Cash Management Trigger Event (as defined below) is in effect; (d) the combined amortizing debt service coverage ratio of the Sawmill Crossing Apartments Mezzanine Loan and the Sawmill Crossing Apartments Mortgage Loan is at least 1.10x, provided that if such debt service coverage ratio test is not satisfied, a portion or all of the performance reserve funds may be used to prepay the Sawmill Crossing Apartments Mezzanine Loan by the amount necessary to cause the combined amortizing debt service coverage ratio to equal 1.10x (with the balance of the performance reserve funds being released to the mezzanine borrower if all other conditions are satisfied); and (e) the mezzanine borrower has delivered an officer’s certificate confirming all conditions have been satisfied.
Lockbox and Cash Management.Upon the occurrence and continuance of a Cash Management Trigger Event (as defined below), the Sawmill Crossing Apartments Mortgage Loan requires the borrower to establish a lender-controlled lockbox account. The loan documents also require that all revenues received by the borrower or the property manager be deposited into the lockbox account within three business days (or within one business day if an event of default is continuing) of receipt. All excess funds will be applied as follows (a) if the Cash Management Trigger Event was caused by an event of default under the Sawmill Crossing Apartments Mezzanine Loan (as defined below), to the holder of the mezzanine loan or (b) to the excess cash flow account.
A “Cash Management Trigger Event” will commence upon the occurrence of (i) an event of default or Sawmill Crossing Apartments Mezzanine Loan event of default; (ii) any bankruptcy action of the borrower; (iii) any bankruptcy action of the guarantors; (iv) any bankruptcy action of the manager; or (v) a Cash Management DSCR Trigger Event (as defined below). A Cash Management Trigger Event will end with respect to clause (i), when such event of default or Sawmill Crossing Apartments Mezzanine Loan event of default has been cured; with respect to clauses (ii), (iii) and (iv), when such bankruptcy petition has been discharged, stayed, or dismissed, among other conditions; and with respect to clause (v) once the amortizing debt service coverage ratio is greater than 1.05x for two consecutive quarters.
A “Cash Management DSCR Trigger Event” occurs upon any date the amortizing debt service coverage ratio based on the trailing twelve month period immediately preceding the date of such determination is less than 1.05x.
Property Management.The Sawmill Crossing Apartments Property is managed by an affiliate of the borrower.
Assumption.The borrower has a right to transfer the Sawmill Crossing Apartments Property provided that no event of default has occurred and is continuing and certain other conditions are satisfied, including, but not limited to, (i) the lender’s reasonable
THE INFORMATION IN THIS STRUCTURAL AND COLLATERAL TERM SHEET IS NOT COMPLETE AND MAY BE AMENDED PRIOR TO THE TIME OF SALE. THIS TERM SHEET IS NOT AN OFFER TO SELL THESE SECURITIES AND IT IS NOT A SOLICITATION OF AN OFFER TO BUY THESE SECURITIES IN ANY JURISDICTION WHERE THE OFFER OR SALE IS NOT PERMITTED.
| 77 |
| SAWMILL CROSSING APARTMENTS |
determination that the proposed transferee and guarantor satisfy the lender’s credit review and underwriting standards, taking into consideration transferee experience, financial strength and general business standing; (ii) execution of a recourse guaranty and an environmental indemnity by an affiliate of the transferee; and (iii) if requested by the lender, a rating agency confirmation from Fitch, Moody’s and Morningstar that the transfer will not result in a downgrade, withdrawal or qualification of the respective ratings assigned to the Series 2015-C30 Certificates.
Partial Release.Not permitted.
Real Estate Substitution.Not permitted.
Ground Lease.None.
Subordinate and Mezzanine Indebtedness.Rialto Mortgage Finance, LLC is the holder of a mezzanine loan in the original amount of $4,000,000 (the “Sawmill Crossing Apartments Mezzanine Loan”) from Sawmill Crossing Holdings, LLC, a Delaware limited liability company that directly owns 100.0% of the Sawmill Crossing Apartments Mortgage Loan borrower. The Sawmill Crossing Apartments Mezzanine Loan accrues interest at an interest rate of 12.000%per annum. The Sawmill Crossing Apartments Mezzanine Loan matures on July 6, 2025. The rights of the Sawmill Crossing Apartments Mezzanine Loan lender are further described under “Description of the Mortgage Pool-Subordinate and/or Other Financing-Existing (Secured Financing and Mezzanine and Similar Financing)” in the Free Writing Prospectus.
Terrorism Insurance.The loan documents require that the “all risk” insurance policy required to be maintained by the borrower provide coverage for terrorism in an amount equal to the full replacement cost of the Sawmill Crossing Apartments Property, as well as business interruption insurance covering no less than the 18-month period following the occurrence of a casualty event, together with an 6-month extended period of indemnity.
THE INFORMATION IN THIS STRUCTURAL AND COLLATERAL TERM SHEET IS NOT COMPLETE AND MAY BE AMENDED PRIOR TO THE TIME OF SALE. THIS TERM SHEET IS NOT AN OFFER TO SELL THESE SECURITIES AND IT IS NOT A SOLICITATION OF AN OFFER TO BUY THESE SECURITIES IN ANY JURISDICTION WHERE THE OFFER OR SALE IS NOT PERMITTED.
| 78 |
(THIS PAGE INTENTIONALLY LEFT BLANK)
THE INFORMATION IN THIS STRUCTURAL AND COLLATERAL TERM SHEET IS NOT COMPLETE AND MAY BE AMENDED PRIOR TO THE TIME OF SALE. THIS TERM SHEET IS NOT AN OFFER TO SELL THESE SECURITIES AND IT IS NOT A SOLICITATION OF AN OFFER TO BUY THESE SECURITIES IN ANY JURISDICTION WHERE THE OFFER OR SALE IS NOT PERMITTED.
| 79 |
| RESIDENCE INN CHARLOTTE |
THE INFORMATION IN THIS STRUCTURAL AND COLLATERAL TERM SHEET IS NOT COMPLETE AND MAY BE AMENDED PRIOR TO THE TIME OF SALE. THIS TERM SHEET IS NOT AN OFFER TO SELL THESE SECURITIES AND IT IS NOT A SOLICITATION OF AN OFFER TO BUY THESE SECURITIES IN ANY JURISDICTION WHERE THE OFFER OR SALE IS NOT PERMITTED.
| 80 |
| RESIDENCE INN CHARLOTTE |
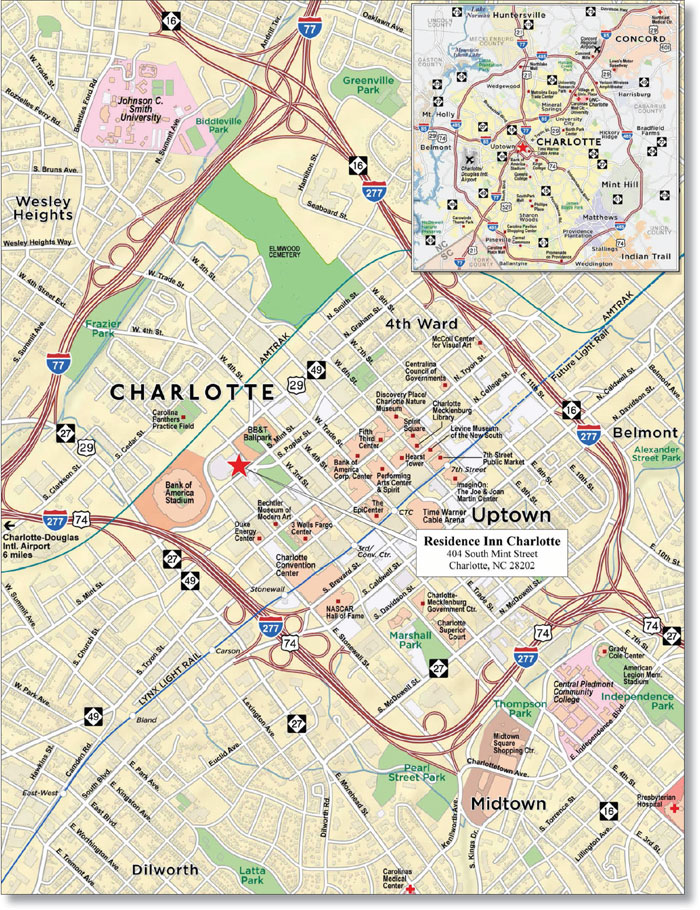
THE INFORMATION IN THIS STRUCTURAL AND COLLATERAL TERM SHEET IS NOT COMPLETE AND MAY BE AMENDED PRIOR TO THE TIME OF SALE. THIS TERM SHEET IS NOT AN OFFER TO SELL THESE SECURITIES AND IT IS NOT A SOLICITATION OF AN OFFER TO BUY THESE SECURITIES IN ANY JURISDICTION WHERE THE OFFER OR SALE IS NOT PERMITTED.
| 81 |
| No. 7 – Residence Inn Charlotte | ||||||||
| Loan Information | Property Information | |||||||
| Mortgage Loan Seller: | Wells Fargo Bank, National Association | Single Asset/Portfolio: | Single Asset | |||||
Credit Assessment (Fitch/Moody’s/Morningstar):
| NR/NR/NR | Property Type: | Hospitality | |||||
| Original Principal Balance: | $22,000,000 | Specific Property Type: | Extended Stay | |||||
| Cut-off Date Principal Balance: | $21,942,896 | Location: | Charlotte, NC | |||||
| % of Initial Pool Balance: | 3.0% | Size: | 150 Rooms | |||||
| Loan Purpose: | Refinance | Cut-off Date Principal Balance Per Room: | $146,286 | |||||
| Borrower Name: | Charlotte Uptown R.I., LLC | Year Built/Renovated: | 2000/2015 | |||||
| Sponsors: | R. Doyle Parrish; C. Eugene Singleton; J. David Beam, III | Title Vesting: | Fee/Leasehold | |||||
| Mortgage Rate: | 4.340% | Property Manager: | Self-managed | |||||
| Note Date: | June 1, 2015 | 3rdMost Recent Occupancy (As of): | 79.7% (12/31/2012) | |||||
| Anticipated Repayment Date: | NAP | 2ndMost Recent Occupancy (As of): | 82.6% (12/31/2013) | |||||
| Maturity Date: | June 1, 2025 | Most Recent Occupancy (As of): | 81.7% (12/31/2014) | |||||
| IO Period: | None | Current Occupancy (As of): | 82.1% (4/30/2015) | |||||
| Loan Term (Original): | 120 months | |||||||
| Seasoning: | 2 months | Underwriting and Financial Information: | ||||||
| Amortization Term (Original): | 360 months | |||||||
| Loan Amortization Type: | Amortizing Balloon | 3rdMost Recent NOI (As of): | $2,528,776 (12/31/2013) | |||||
| Interest Accrual Method: | Actual/360 | 2ndMost Recent NOI (As of): | $2,703,790 (12/31/2014) | |||||
| Call Protection: | L(26),D(90),O(4) | Most Recent NOI (As of): | $2,747,386 (TTM 4/30/2015) | |||||
| Lockbox Type: | Springing (Without Established Account) | |||||||
| Additional Debt: | None | |||||||
| Additional Debt Type: | NAP | |||||||
| U/W Revenues: | $6,681,592 | |||||||
| U/W Expenses: | $4,085,509 | |||||||
| U/W NOI: | $2,596,083 | |||||||
| U/W NCF: | $2,328,819 | |||||||
| Escrows and Reserves(1): | U/W NOI DSCR: | 1.98x | ||||||
| U/W NCF DSCR: | 1.77x | |||||||
| Type: | Initial | Monthly | Cap (If Any) | U/W NOI Debt Yield: | 11.8% | |||
| Taxes | $200,007 | $20,001 | NAP | U/W NCF Debt Yield: | 10.6% | |||
| Insurance | $0 | Springing | NAP | As-Is Appraised Value(2): | $32,000,000 | |||
| FF&E Reserve | $0 | $22,272 | NAP | As-Is Appraisal Valuation Date(2): | April 29, 2015 | |||
| PIP Reserve | $2,250,000 | $0 | NAP | Cut-off Date LTV Ratio(2): | 68.6% | |||
| Key Money Reserve | $0 | Springing | NAP | LTV Ratio at Maturity or ARD(2): | 55.3% | |||
| (1) | See “Escrows” section. |
| (2) | See “The Appraisal” section. |
The Mortgage Loan. The mortgage loan (the “Residence Inn Charlotte Mortgage Loan”) is evidenced by a single promissory note secured by a first mortgage encumbering the fee and leasehold interest in an extended stay hotel located in Charlotte, North Carolina (the “Residence Inn Charlotte Property”). The Residence Inn Charlotte Mortgage Loan was originated on June 1, 2015 by Wells Fargo Bank, National Association. The Residence Inn Charlotte Mortgage Loan had an original principal balance of $22,000,000, has an outstanding principal balance as of the Cut-off Date of $21,942,896 and accrues interest at an interest rate of 4.340%per annum. The Residence Inn Charlotte Mortgage Loan had an initial term of 120 months, has a remaining term of 118 months as of the Cut-off Date and requires payments of principal and interest based on a 30-year amortization schedule. The Residence Inn Charlotte Mortgage Loan matures on June 1, 2025.
Following the lockout period, the borrower has the right to defease the Residence Inn Charlotte Mortgage Loan in whole, but not in part, on any date before March 1, 2025. In addition, the Residence Inn Charlotte Mortgage Loan is prepayable without penalty on or after March 1, 2025.
THE INFORMATION IN THIS STRUCTURAL AND COLLATERAL TERM SHEET IS NOT COMPLETE AND MAY BE AMENDED PRIOR TO THE TIME OF SALE. THIS TERM SHEET IS NOT AN OFFER TO SELL THESE SECURITIES AND IT IS NOT A SOLICITATION OF AN OFFER TO BUY THESE SECURITIES IN ANY JURISDICTION WHERE THE OFFER OR SALE IS NOT PERMITTED.
| 82 |
| RESIDENCE INN CHARLOTTE |
Sources and Uses
| Sources | Uses | |||||||
| Original loan amount | $22,000,000 | 100.0% | Loan payoff(1) | $10,441,147 | 47.5% | |||
| Reserves | 2,450,007 | 11.1 | ||||||
| Closing costs | 85,739 | 0.4 | ||||||
| Return of equity | 9,023,107 | 41.0 | ||||||
| Total Sources | $22,000,000 | 100.0% | Total Uses | $22,000,000 | 100.0% |
| (1) | The Residence Inn Charlotte Property was previously securitized in the COMM 2005-C6 transaction. |
The Property. The Residence Inn Charlotte Property is comprised of the fee and leasehold interests in a 150-room, eleven-story, extended stay hotel located in Charlotte, North Carolina, within the Charlotte central business district. Built in 2000 and situated on a 0.5-acre site, the Residence Inn Charlotte Property’s guestroom configuration includes 81 queen studios, 39 queen one-bedroom units, 10 king one-bedroom suites, 19 queen two-bedroom units and one king penthouse suite. Each guestroom features a flat screen television, dresser, work desk and chair, nightstands, lounge chair, fully equipped kitchenette with small refrigerator, coffee maker and microwave oven. Amenities at the Residence Inn Charlotte Property include approximately 1,200 square feet of meeting space, a fitness center, business center, guest laundry, sundry shop and the Mint Street Pub restaurant, which offers a full dinner and cocktail menu. The Residence Inn Charlotte Property also offers high-speed Wi-Fi, a complimentary breakfast and an evening manager’s reception. The Residence Inn Charlotte Property also features the leasehold interest in 80 garage parking spaces, equating to a parking ratio of 0.5 spaces per room. See “Ground Lease” section.
According to the borrower, the Residence Inn Charlotte Property has been continually updated, with approximately $296,882 invested since 2012, which included lobby, guestroom and common area upgrades. The borrower is planning a $2.3 million renovation program on the Residence Inn Charlotte Property that includes replacing the FF&E in guest rooms, corridors and finishes in public spaces. The current franchise agreement with Marriott International, Inc. expires in February 2021; however, the borrower is currently negotiating to extend the franchise agreement to December 2034. Should the franchise agreement terminate or expire, the Residence Inn Charlotte Mortgage Loan will become full-recourse to the borrower and guarantors until an acceptable replacement franchise agreement is executed.
Operating History and Underwritten Net Cash Flow.The following table presents certain information relating to the historical operating performance and the underwritten net cash flow at the Residence Inn Charlotte Property:
Cash Flow Analysis
2012 |
2013 | 2014 | TTM 4/30/2015 | U/W | % of U/W Total Revenue | U/W $ per Room | ||||||||
| Occupancy | 79.7% | 82.6% | 81.7% | 82.1% | 80.0% | |||||||||
| ADR | $128.04 | $131.90 | $139.39 | $140.72 | $139.39 | |||||||||
| RevPAR | $102.08 | $108.91 | $113.93 | $115.50 | $111.51 | |||||||||
| Total Revenue | $6,182,059 | $6,538,064 | $6,820,172 | $6,902,637 | $6,681,592 | 100.0% | $44,544 | |||||||
| Total Department Expenses | 1,649,993 | 1,713,544 | 1,754,249 | 1,764,150 | 1,736,801 | 26.0 | 11,579 | |||||||
| Gross Operating Profit | $4,532,066 | $4,824,520 | $5,065,923 | $5,138,487 | $4,944,791 | 74.0% | $32,965 | |||||||
| Total Undistributed Expenses | 2,004,333 | 2,012,994 | 2,083,624 | 2,112,499 | 2,063,708 | 30.9 | 13,758 | |||||||
| Profit Before Fixed Charges | $2,527,733 | $2,811,526 | $2,982,299 | $3,025,988 | $2,881,083 | 43.1% | $19,207 | |||||||
| Total Fixed Charges | 262,454 | 282,750 | 278,509 | 278,602 | 285,000 | 4.3 | 1,900 | |||||||
| Net Operating Income | $2,265,279 | $2,528,776 | $2,703,790 | $2,747,386 | $2,596,083 | 38.9% | $17,307 | |||||||
| FF&E | 0 | 0 | 0 | 0 | 267,264 | 4.0 | 1,782 | |||||||
| Net Cash Flow | $2,265,279 | $2,528,776 | $2,703,790 | $2,747,386 | $2,328,819 | 34.9% | $15,525 | |||||||
| NOI DSCR | 1.73x | 1.93x | 2.06x | 2.09x | 1.98x | |||||||||
| NCF DSCR | 1.73x | 1.93x | 2.06x | 2.09x | 1.77x | |||||||||
| NOI DY | 10.3% | 11.5% | 12.3% | 12.5% | 11.8% | |||||||||
| NCF DY | 10.3% | 11.5% | 12.3% | 12.5% | 10.6% | |||||||||
The Appraisal. As of the appraisal valuation date of April 29, 2015, the Residence Inn Charlotte Property had an “as-is” appraised value of $32,000,000. The appraiser also concluded to an “as-complete & stabilized” value of $36,600,000 as of April 29, 2018. The “as-complete & stabilized” valuation assumes that the property improvement plan (“PIP”) has been completed (the $2.3 million PIP cost was reserved at loan closing) and the Residence Inn Charlotte Property is operating at a stabilized RevPAR of $125.55. The “as-complete & stabilized” value equates to a Cut-off Date LTV Ratio of 60.0% and an LTV Ratio at Maturity or ARD of 48.3%.
Environmental Matters.According to the Phase I environmental site assessment dated May 13, 2015, there was no evidence of any recognized environmental conditions at the Residence Inn Charlotte Property.
Market Overview and Competition.The Residence Inn Charlotte Property is located in Charlotte, North Carolina, within the central business district and adjacent to BB&T Ballpark, one block northeast of Bank of America Stadium, two blocks north of the Duke Energy Center, four blocks northwest of the Charlotte Convention Center and seven blocks west of the Time Warner Cable
THE INFORMATION IN THIS STRUCTURAL AND COLLATERAL TERM SHEET IS NOT COMPLETE AND MAY BE AMENDED PRIOR TO THE TIME OF SALE. THIS TERM SHEET IS NOT AN OFFER TO SELL THESE SECURITIES AND IT IS NOT A SOLICITATION OF AN OFFER TO BUY THESE SECURITIES IN ANY JURISDICTION WHERE THE OFFER OR SALE IS NOT PERMITTED.
| 83 |
| RESIDENCE INN CHARLOTTE |
Arena. The Residence Inn Charlotte Property is located in the Uptown area of Charlotte, home to Wells Fargo’s east coast headquarters, along with Bank of America’s and Duke Energy’s corporate headquarters. The Uptown area has a large office and commercial presence consisting mainly of office buildings with street-level restaurants and retail space. Uptown contains approximately 15.9 million square feet of Class A office space and has an overall vacancy rate of 8.2% with an additional 2.9 million square feet under construction or proposed. Some of the top accounts at the Residence Inn Charlotte Property include Duke Energy Corp., Deloitte LLP and Wells Fargo & Co. Further, there are currently 2.1 million square feet of retail in Uptown with another 321,000 square feet planned or under construction. According to the appraisal, two major transit projects are also under construction in the Uptown area: the 9.3 mile LYNX Blue Line extension, scheduled to be completed in 2017, will link Uptown to the University of North Carolina Charlotte, and the City LYNX Gold Line streetcar will open in 2015, linking Uptown to the southern suburbs.
As mentioned, the Residence Inn Charlotte Property is also proximate to numerous demand drivers. The Duke Energy Center and Duke Energy’s headquarters are located two blocks south of the Residence Inn Charlotte Property; Duke Energy is the hotel’s largest corporate account. BB&T Ballpark, a 10,000 seat stadium that opened in April 2014, is home to the Charlotte Knights, Major League Baseball’s Chicago White Sox’s Triple-A affiliate and is located adjacent to the Residence Inn Charlotte Property. Bank of America Stadium, the 73,778 seat home to the National Football League’s Carolina Panthers, is located one block south of the Residence Inn Charlotte Property. Additionally, Time Warner Cable Arena is located 0.7 miles east of the Residence Inn Charlotte Property and is home to the National Basketball Association’s Charlotte Hornets. Collectively, these three venues had a 2014 combined sporting attendance of 2.5 million people, in addition to the other entertainment events and concerts that take place at these locations. Additional demand drivers include the Charlotte Convention Center, which is located 0.4 miles southeast of the Residence Inn Charlotte Property. The 850,000 square foot convention center attracts more than half a million visitors each year and features 280,000 square feet of contiguous exhibit space, 90,000 square feet of meeting and break-out rooms, and a 35,000 square foot ballroom. The convention center is located adjacent to the 150,000 square foot NASCAR Hall of Fame, which features another 40,000 square feet of exhibit space and had a 2014 attendance of 169,724 people. These demand drivers result in approximately 12.0 million annual visitors to the Uptown area. The demand segmentation at the Residence Inn Charlotte Property is 65.0% transient (which includes commercial demand), 25.0% extended stay and 10.0% meeting and group. Marriott International, Inc. is planning on entering into a franchise agreement with a new 182-room AC Hotel and a new 120-room Residence Inn, both to be built at the Epicenter, approximately 0.6 miles east of the Residence Inn Charlotte Property. According to the appraisal, the AC Hotel will have an upscale, service-focused design and is only 50% competitive with the Residence Inn Charlotte Property, therefore, will have a minimal impact on performance. Should construction of these hotels commence, the Residence Inn Charlotte franchise agreement includes a conditional payment (“Key Money”) to the borrower to compensate for any loss in revenue as a result of the increase in competitive room nights (see “Escrows” section). A third party hospitality research report identified a competitive set of eight hospitality properties, which contain 1,676 rooms and exhibited an average occupancy, ADR and RevPAR of 73.5%, $138.35 and $101.66, respectively, for the trailing 12-month period ending April 30, 2015.
The following table presents certain information relating to the Residence Inn Charlotte Property’s competitive set:
Subject and Market Historical Occupancy, ADR and RevPAR(1)
Competitive Set | Residence Inn Charlotte | Penetration Factor | ||||||||||||||
Year | Occupancy | ADR | RevPAR | Occupancy | ADR | RevPAR | Occupancy | ADR | RevPAR | |||||||
| 4/30/2015 TTM | 73.5% | $138.35 | $101.66 | 81.5% | $142.66 | $116.20 | 110.9% | 103.1% | 114.3% | |||||||
| 4/30/2014 TTM | 75.2% | $127.59 | $95.91 | 81.7% | $135.47 | $110.71 | 108.7% | 106.2% | 115.4% | |||||||
| 4/30/2013 TTM | 76.4% | $125.91 | $96.18 | 81.9% | $127.39 | $104.39 | 107.3% | 101.2% | 108.5% | |||||||
| (1) | Information obtained from a third party hospitality research report dated May 19, 2015. The competitive set includes: Fairfield Inn & Suites Charlotte Uptown, Holiday Inn Charlotte Center City, DoubleTree Charlotte, Hilton Garden Inn Charlotte Uptown, Hampton Inn Charlotte Uptown, Courtyard Charlotte City Center, aloft Hotel Charlotte Uptown @ EpiCentre, and Hyatt House Charlotte Center City. |
The Borrower. The borrower is Charlotte Uptown R.I., LLC, a North Carolina limited liability company and a single purpose entity. R. Doyle Parrish, C. Eugene Singleton, and J. David Beam III are the guarantors of certain nonrecourse carveouts under the Residence Inn Charlotte Mortgage Loan.
The Sponsors. The sponsors are R. Doyle Parrish, C. Eugene Singleton, and J. David Beam III. Mr. Parrish and Mr. Singleton founded Summit Hospitality Group (“SHG”), a premier, full-service hotel management and consulting firm with over 25 years of experience developing, building, and operating hospitality assets. Founded in 1988, SHG maintains a portfolio of 18 hotels totaling 2,045 rooms with an estimated market value in excess of $200.0 million. SHG currently employs more than 700 people and operates properties in Raleigh, Charlotte, Chapel Hill, Durham, Winston-Salem, Pinehurst and Wilmington, North Carolina.
Escrows. The loan documents provide for upfront escrows in the amount of $200,007 for real estate taxes and $2.3 million for the PIP. The loan documents provide for monthly escrows in an amount equal to $20,001 for real estate taxes and for FF&E reserves in an amount equal to 4.0% of total revenue for the prior fiscal year (initially estimated to be $22,272). Ongoing monthly reserves for insurance are not required as long as (i) no event of default has occurred and is continuing; (ii) the Residence Inn Charlotte Property is insured by an acceptable blanket insurance policy; and (iii) the borrower provides the lender with evidence of renewal of the insurance policies and timely proof of payment of insurance premiums. In addition, the franchisor will pay the borrower $700,000 as Key Money upon the earlier of (i) 30 days following the commencement of the construction of the vertical structure elements of the first floor of the AC Hotel by Marriott (as mentioned above in the “Market Overview and Competition” section), which will occupy the floors below the proposed Residence Inn; or (ii) September 30, 2015. The borrower is required to deposit the Key Money with the lender and the lender shall disburse funds to the franchisor, in the event the AC Hotel by Marriott and the Residence Inn by Marriott Hotel are not developed, and the franchisor is entitled to repayment from the borrower pursuant to the terms of the franchise agreement.
THE INFORMATION IN THIS STRUCTURAL AND COLLATERAL TERM SHEET IS NOT COMPLETE AND MAY BE AMENDED PRIOR TO THE TIME OF SALE. THIS TERM SHEET IS NOT AN OFFER TO SELL THESE SECURITIES AND IT IS NOT A SOLICITATION OF AN OFFER TO BUY THESE SECURITIES IN ANY JURISDICTION WHERE THE OFFER OR SALE IS NOT PERMITTED.
| 84 |
| RESIDENCE INN CHARLOTTE |
Lockbox and Cash Management.Upon the occurrence of a Cash Trap Event Period (as defined below), the borrower will be required to establish a lender-controlled lockbox account and the borrower and property manager will be required to deposit all rents directly into such lockbox account, and direct all credit card providers to deposit all revenues received into the lockbox account. During a Cash Trap Event Period, all excess funds on deposit in the lockbox account are swept to a lender-controlled cash flow sub-account.
A “Cash Trap Event Period” will commence upon the earlier of (i) the occurrence and continuance of an event of default; (ii) the net cash flow debt yield falling below 8.0%; and (iii) the date 12 calendar months prior to the franchise agreement expiration date. A Cash Trap Event Period will be cured, with regard to clause (i) upon the cure of such event of default; with regard to clause (ii) upon the net cash flow debt yield being equal to or greater than 8.0% for two consecutive quarters; and with regard to clause (iii) if the borrower has entered into (a) a franchise agreement extension or (b) a replacement franchise agreement (acceptable to the lender), and in each event, the borrower has completed any required PIP work.
Property Management. The Residence Inn Charlotte Property is managed by an affiliate of the borrower.
Assumption. The borrower has a two-time right to transfer the Residence Inn Charlotte Property provided that certain conditions are satisfied, including (i) no event of default has occurred and is continuing; (ii) the lender reasonably determines that the proposed transferee and guarantor satisfy the lender’s credit review and underwriting standards, taking into consideration transferee experience, financial strength and general business standing; and (iii) the lender has received confirmation from Fitch, Moody’s and Morningstar that such assumption will not result in a downgrade, withdrawal or qualification of the respective ratings assigned to the Series 2015-C30 Certificates.
Partial Release. Not permitted.
Real Estate Substitution.Not permitted.
Subordinate and Mezzanine Indebtedness. Not permitted.
Right of First Refusal.The franchisor, Marriott International, Inc., has a right of first refusal (“ROFR”) to acquire the Residence Inn Charlotte Property if it or a controlling interest in the borrower is transferred to a competitor, which is not extinguished by foreclosure or deed-in-lieu thereof. The comfort letter provides that, if the lender exercises remedies against the borrower, the lender may appoint an affiliate to acquire the Residence Inn Charlotte Property and to enter into a management or franchise agreement so long as such agreement is not with a competitor or competitor affiliate. The lender affiliate will not be deemed a competitor solely by virtue of its ownership or management of multiple or competing hotels.
Ground Lease. The Residence Inn Charlotte Mortgage Loan borrower has a sub-subleasehold interest in 80 parking spaces in an adjacent multi-level parking garage that contains approximately 2,600 parking spaces. The borrower sub-subleases the parking spaces from Duke Energy. The sub-sublease is dated June 24, 1999 and does not expire. The borrower paid Duke Energy a one-time rental fee of $620,000 for its perpetual use of the 80 parking spaces.
Terrorism Insurance. The loan documents require that the “all risk” insurance policy required to be maintained by the borrower provide coverage for terrorism in an amount equal to the full replacement cost of the Residence Inn Charlotte Property (provided that the borrower is not required to pay terrorism insurance premiums in excess of two times the premium for all risk and business interruption coverage if the Terrorism Risk Insurance Program Reauthorization Act is no longer in effect), as well as business interruption insurance covering no less than the 12-month period following the occurrence of a casualty event, together with a six-month extended period of indemnity.
Windstorm Insurance. The loan documents require windstorm insurance covering the full replacement cost of the Residence Inn Charlotte Property during the loan term. At the time of closing, the Residence Inn Charlotte Property has insurance coverage for windstorm.
THE INFORMATION IN THIS STRUCTURAL AND COLLATERAL TERM SHEET IS NOT COMPLETE AND MAY BE AMENDED PRIOR TO THE TIME OF SALE. THIS TERM SHEET IS NOT AN OFFER TO SELL THESE SECURITIES AND IT IS NOT A SOLICITATION OF AN OFFER TO BUY THESE SECURITIES IN ANY JURISDICTION WHERE THE OFFER OR SALE IS NOT PERMITTED.
| 85 |
| CAPITOL PLACE APARTMENTS |
THE INFORMATION IN THIS STRUCTURAL AND COLLATERAL TERM SHEET IS NOT COMPLETE AND MAY BE AMENDED PRIOR TO THE TIME OF SALE. THIS TERM SHEET IS NOT AN OFFER TO SELL THESE SECURITIES AND IT IS NOT A SOLICITATION OF AN OFFER TO BUY THESE SECURITIES IN ANY JURISDICTION WHERE THE OFFER OR SALE IS NOT PERMITTED.
| 86 |
| CAPITOL PLACE APARTMENTS |

THE INFORMATION IN THIS STRUCTURAL AND COLLATERAL TERM SHEET IS NOT COMPLETE AND MAY BE AMENDED PRIOR TO THE TIME OF SALE. THIS TERM SHEET IS NOT AN OFFER TO SELL THESE SECURITIES AND IT IS NOT A SOLICITATION OF AN OFFER TO BUY THESE SECURITIES IN ANY JURISDICTION WHERE THE OFFER OR SALE IS NOT PERMITTED.
| 87 |
| No. 8 – Capitol Place Apartments | ||||||||
| Loan Information | Property Information | |||||||
| Mortgage Loan Seller: | Rialto Mortgage Finance, LLC | Single Asset/Portfolio: | Single Asset | |||||
Credit Assessment (Fitch/Moody’s/Morningstar): | NR/NR/NR | Property Type: | Multifamily | |||||
| Original Principal Balance: | $21,800,000 | Specific Property Type: | Garden | |||||
| Cut-off Date Principal Balance: | $21,800,000 | Location: | West Sacramento, CA | |||||
| % of Initial Pool Balance: | 2.9% | Size: | 192 Units | |||||
| Loan Purpose: | Refinance | Cut-off Date Principal | $113,542 | |||||
| Borrower Name: | Capitol Place California Partners, LLC | Year Built/Renovated: | 2005/NAP | |||||
| Sponsors: | Jon Wood; Roger Kuula | Title Vesting: | Fee | |||||
| Mortgage Rate: | 4.780% | Property Manager: | Self-managed | |||||
| Note Date: | June 30, 2015 | 3rdMost Recent Occupancy (As of): | 92.2% (12/31/2012) | |||||
| Anticipated Repayment Date: | NAP | 2ndMost Recent Occupancy (As of): | 93.8% (12/31/2013) | |||||
| Maturity Date: | July 6, 2025 | Most Recent Occupancy (As of): | 96.4% (12/31/2014) | |||||
| IO Period: | 84 months | Current Occupancy (As of): | 95.3% (5/14/2015) | |||||
| Loan Term (Original): | 120 months | |||||||
| Seasoning: | 1 month | Underwriting and Financial Information: | ||||||
| Amortization Term (Original): | 360 months | |||||||
| Loan Amortization Type: | Interest-only, Amortizing Balloon | 3rdMost Recent NOI (As of): | $1,301,486 (12/31/2013) | |||||
| Interest Accrual Method: | Actual/360 | 2ndMost Recent NOI (As of): | $1,504,853 (12/31/2014) | |||||
| Call Protection: | L(25),D(91),O(4) | Most Recent NOI (As of): | $1,576,785 (TTM 4/30/2015) | |||||
| Lockbox Type: | Springing (Without Established Account) | |||||||
| Additional Debt: | None | U/W Revenues: | $2,720,989 | |||||
| Additional Debt Type: | NAP | U/W Expenses: | $1,008,379 | |||||
| U/W NOI: | $1,712,610 | |||||||
| U/W NCF: | $1,664,610 | |||||||
| U/W NOI DSCR: | 1.25x | |||||||
| Escrows and Reserves(1): | U/W NCF DSCR: | 1.22x | ||||||
| U/W NOI Debt Yield: | 7.9% | |||||||
| Type: | Initial | Monthly | Cap (If Any) | U/W NCF Debt Yield: | 7.6% | |||
| Taxes | $85,819 | $20,433 | NAP | As-Is Appraised Value: | $31,890,000 | |||
| Insurance | $29,448 | $2,337 | NAP | As-Is Appraisal Valuation Date: | May 15, 2015 | |||
| Replacement Reserves | $0 | $4,000 | NAP | Cut-off Date LTV Ratio: | 68.4% | |||
| Deferred Maintenance | $4,919 | $0 | NAP | LTV Ratio at Maturity or ARD: | 65.2% | |||
| (1) | See “Escrows” section. |
The Mortgage Loan. The mortgage loan (the “Capitol Place Apartments Mortgage Loan”) is evidenced by a single promissory note that is secured by a first mortgage encumbering a garden-style multifamily property located in West Sacramento, California (the “Capitol Place Apartments Property”). The Capitol Place Apartments Mortgage Loan was originated on June 30, 2015 by Rialto Mortgage Finance, LLC. The Capitol Place Apartments Mortgage Loan had an original principal balance of $21,800,000, has an outstanding principal balance as of the Cut-off Date of $21,800,000 and accrues interest at an interest rate of 4.780%per annum. The Capitol Place Apartments Mortgage Loan had an initial term of 120 months, has a remaining term of 119 months as of the Cut-off Date and requires interest-only payments for the first 84 months following origination and, thereafter, requires payments of principal and interest based on a 30-year amortization schedule. The Capitol Place Apartments Mortgage Loan matures on July 6, 2025.
Following the lockout period, the borrower has the right to defease the Capitol Place Apartments Mortgage Loan in whole, but not in part, on any date before April 6, 2025. In addition, the Capitol Place Apartments Mortgage Loan is prepayable without penalty on or after April 6, 2025.
THE INFORMATION IN THIS STRUCTURAL AND COLLATERAL TERM SHEET IS NOT COMPLETE AND MAY BE AMENDED PRIOR TO THE TIME OF SALE. THIS TERM SHEET IS NOT AN OFFER TO SELL THESE SECURITIES AND IT IS NOT A SOLICITATION OF AN OFFER TO BUY THESE SECURITIES IN ANY JURISDICTION WHERE THE OFFER OR SALE IS NOT PERMITTED.
| 88 |
| CAPITOL PLACE APARTMENTS |
Sources and Uses
| Sources | Uses | |||||||
| Original loan amount | $21,800,000 | 100.0% | Loan payoff(1) | $20,238,318 | 92.8% | |||
| Closing costs | 473,157 | 2.2 | ||||||
| Reserves | 120,186 | 0.6 | ||||||
| Return of equity | 968,339 | 4.4 | ||||||
| Total Sources | $21,800,000 | 100.0% | Total Uses | $21,800,000 | 100.0% |
| (1) | The Capitol Place Apartments Property was previously securitized in the BACM 2007-1 transaction. |
The Property.The Capitol Place Apartments Property is a 192-unit, garden-style multifamily property consisting of ten two- and three-story buildings situated on approximately 9.4 acres located in West Sacramento, California, approximately 3.1 miles west of the Sacramento central business district. The improvements were constructed in 2005. Unit amenities include walk-in closets, ceiling fans, extra storage, internet access, window coverings, covered private patio/balcony, and stackable or full size washer/dryer. Community amenities include a swimming pool and spa, clubhouse with fireplace, billiard and game room, TV theatre room and state of the art fitness center. The Capitol Place Apartments Property has a controlled main entry access gate and 24-hour on-site maintenance. The Capitol Place Apartments Property contains 388 surface and carport parking spaces, reflecting an overall parking ratio of 2.0 spaces per unit. As of May 14, 2015, the Capitol Place Apartments Property was 95.3% occupied.
The following table presents certain information relating to the unit mix of the Capitol Place Apartments Property:
Unit Mix Summary(1) (2)
| Unit Type | No. of Units | % of Total Units | Average Unit Size (SF) | Average U/W Monthly Rent per Unit | ||||
| 1 Bedroom / 1 Bath | 22 | 11.5% | 786 | $994 | ||||
| 1 Bedroom / 1 Bath | 9 | 4.7% | 821 | $1,032 | ||||
| 1 Bedroom / 1 Bath | 11 | 5.7% | 821 | $666 | ||||
| 2 Bedroom / 1 Bath | 13 | 6.8% | 946 | $1,128 | ||||
| 2 Bedroom / 1 Bath | 7 | 3.6% | 946 | $959 | ||||
| 2 Bedroom / 1 Bath | 24 | 12.5% | 1,015 | $1,156 | ||||
| 2 Bedroom / 2 Bath | 84 | 43.8% | 1,065 | $1,168 | ||||
| 2 Bedroom / 2 Bath | 22 | 11.5% | 1,097 | $1,254 | ||||
| Total/Weighted Average | 192 | 100.0% | 993 | $1,111 | ||||
| (1) | Information obtained from the underwritten rent roll. |
| (2) | 15% (29 of 192) of the units are required to be made available for low and moderate-income housing pursuant to a regulatory agreement entered into with the city of West Sacramento when the Capitol Place Apartments Property was developed. Eleven one bedroom units are required to be rented to residents with income less than 50% of the area median income, seven two bedroom units are required to be rented to residents with income less than 80% of the area median income and 11 two bedroom units are required to be rented to residents with income less than 110% of the area median income. |
The following table presents historical occupancy percentages at the Capitol Place Apartments Property:
Historical Occupancy
12/31/2012(1) | 12/31/2013(1) | 12/31/2014(1) | 5/14/2015(2) | |||
| 92.2% | 93.8% | 96.4% | 95.3% |
| (1) | Information obtained from the borrower. |
| (2) | Information obtained from the underwritten rent roll. |
THE INFORMATION IN THIS STRUCTURAL AND COLLATERAL TERM SHEET IS NOT COMPLETE AND MAY BE AMENDED PRIOR TO THE TIME OF SALE. THIS TERM SHEET IS NOT AN OFFER TO SELL THESE SECURITIES AND IT IS NOT A SOLICITATION OF AN OFFER TO BUY THESE SECURITIES IN ANY JURISDICTION WHERE THE OFFER OR SALE IS NOT PERMITTED.
| 89 |
| CAPITOL PLACE APARTMENTS |
Operating History and Underwritten Net Cash Flow.The following table presents certain information relating to the historical operating performance and underwritten net cash flow at the Capitol Place Apartments Property:
Cash Flow Analysis
| 2013 | 2014 | TTM 4/30/2015 | U/W | % of U/W Effective Gross Income | U/W $ per Unit | ||||||||||||||
| Base Rent | $2,062,291 | $2,381,942 | $2,450,145 | $2,436,504 | 89.5% | $12,690 | |||||||||||||
| Grossed Up Vacant Space | 0 | 0 | 0 | 126,060 | 4.6 | 657 | |||||||||||||
| Concessions | 0 | 0 | 0 | 0 | 0.0 | 0 | |||||||||||||
| Other Income | 240,858 | 270,134 | 286,987 | 286,987 | 10.5 | 1,495 | |||||||||||||
| Less Vacancy & Credit Loss | 0 | (110,775 | ) | (105,499 | ) | (128,563 | )(1) | (4.7 | ) | (670 | ) | ||||||||
| Effective Gross Income | $2,303,149 | $2,541,301 | $2,631,633 | $2,720,989 | 100.0% | $14,172 | |||||||||||||
| Total Operating Expenses | $1,001,663 | $1,036,448 | $1,054,848 | $1,008,379 | 37.1% | $5,252 | |||||||||||||
| Net Operating Income | $1,301,486 | $1,504,853 | $1,576,785 | $1,712,610 | 62.9% | $8,920 | |||||||||||||
| Capital Expenditures | 0 | 0 | 0 | 48,000 | 1.8 | 250 | |||||||||||||
| Net Cash Flow | $1,301,486 | $1,504,853 | $1,576,785 | $1,664,610 | 61.2% | $8,670 | |||||||||||||
| NOI DSCR | 0.95x | 1.10x | 1.15x | 1.25x | |||||||||||||||
| NCF DSCR | 0.95x | 1.10x | 1.15x | 1.22x | |||||||||||||||
| NOI DY | 6.0% | 6.9% | 7.2% | 7.9% | |||||||||||||||
| NCF DY | 6.0% | 6.9% | 7.2% | 7.6% |
| (1) | The underwritten economic vacancy is 5.0%. The Capitol Place Apartments Property was physically 95.3% occupied as of May 14, 2015. |
Appraisal.As of the appraisal valuation date of May 15, 2015, the Capitol Place Apartments Property had an “as-is” appraised value of $31,890,000.
Environmental Matters.According to a Phase I environmental assessment dated May 26, 2015, there was no evidence of any recognized environmental conditions at the Capitol Place Apartments Property.
Market Overview and Competition.The Capitol Place Apartments Property is located in West Sacramento, California, within the Sacramento metropolitan statistical area (“MSA”), which is the fifth largest MSA in the state and consists of Sacramento, El Dorado, Placer and Yolo Counties. The Capitol Place Apartments Property’s neighborhood is bounded by major regional arteries, including Interstate 5, a north/south thoroughfare two miles east of the Capitol Place Apartments Property, and Interstate 80, an east/west thoroughfare eight miles north of Capitol Place Apartments Property. The Arden Fair Mall, located approximately eight miles east of the Capitol Place Apartments Property, is anchored by Macy’s and Nordstrom and includes over 165 tenants, encompassing 1.1 million square feet. The neighborhood surrounding the Capitol Place Apartments Property consists of a mixture of established single-family and multifamily residential properties supported by retail and industrial commercial development. National retailers located west of the Capitol Place Apartments Property include IKEA (approximately 1.9 miles), Home Depot (approximately 1.5 miles) and Walmart Supercenter (approximately 1.7 miles). The 2015 estimated population within a one-, three-, and five-mile radius of the Capitol Place Apartments Property is 16,785, 108,413 and 245,265, respectively, and the 2015 estimated average household income within the same radii is $46,948, $58,930 and $64,952, respectively.
According to third party market research report, the Capitol Place Apartments Property is located in the Sacramento MSA multifamily market. As of first quarter 2015, the Sacramento MSA multifamily market contained 758 apartment buildings totaling 101,650 units with a 2.3% vacancy rate and average effective rental rate of $1,014 per unit.
The following table presents certain information relating to some comparable multifamily properties for the Capitol Place Apartments Property:
Competitive Set(1)
| Capitol Place Apartments (Subject) | City Park | Harbor Oaks | River Walk Villas | Monticello at Southport Apartments | Capital View | Governor’s Terrace | |||||||||
| Location | West Sacramento, CA | Sacramento, CA | Sacramento, CA | Sacramento, CA | West Sacramento, CA | Sacramento, CA | Sacramento, CA | ||||||||
| Distance to Subject | - | 2.1 miles | 3.2 miles | 2.5 miles | 4.7 miles | 0.5 miles | 1.5 miles | ||||||||
| Property Type | Garden | Garden | Garden | Garden | Garden | Garden | Garden | ||||||||
| Number of Units | 192 | 103 | 474 | 65 | 208 | 40 | 44 | ||||||||
| Average Rent (per unit) | |||||||||||||||
| Studio | NAP | $910 | NAP | NAP | NAP | NAP | $950 | ||||||||
| 1BR | $666-$1,032 | $1,135 | $1,260-$1,265 | $934 | $1,069-$1,129 | $995 | $1,340-$1,365 | ||||||||
| 2BR | $959-$1,254 | $1,235 | $1,280-$1,625 | $1,140 | $1,214-$1,433 | $1,275-$1,395 | $1,450-$1700 | ||||||||
| 3BR | NAP | $1,700 | NAP | NAP | NAP | NAP | NAP | ||||||||
| Utilities | Paid by Tenant | Paid by Tenant | Paid by Tenant | Paid by Tenant | Paid by Tenant | Paid by Tenant | Paid by Tenant | ||||||||
| Total Occupancy | 95% | 96% | 95% | 100% | 94% | 98% | 100% |
| (1) | Information obtained from the appraisal and underwritten rent roll. |
THE INFORMATION IN THIS STRUCTURAL AND COLLATERAL TERM SHEET IS NOT COMPLETE AND MAY BE AMENDED PRIOR TO THE TIME OF SALE. THIS TERM SHEET IS NOT AN OFFER TO SELL THESE SECURITIES AND IT IS NOT A SOLICITATION OF AN OFFER TO BUY THESE SECURITIES IN ANY JURISDICTION WHERE THE OFFER OR SALE IS NOT PERMITTED.
| 90 |
| CAPITOL PLACE APARTMENTS |
The Borrower.The borrower is Capitol Place California Partners, LLC, a single purpose entity with one independent director. Jon Wood and Roger Kuula are the guarantors of certain nonrecourse carveouts under Capitol Place Apartments Mortgage Loan.
The Sponsors.The sponsors, Jon Wood and Roger Kuula, are co-founders of American Capital Group (“ACG”). ACG is a privately-held commercial real estate developer and home builder established in 1986. ACG is headquartered in Bellevue, Washington and operates regional offices in Sacramento, California and Scottsdale, Arizona. ACG has developed and currently maintains a multifamily portfolio of 79 properties totaling approximately 12,092 units located throughout ten western states. Mr. Kuula serves as chairman and chief executive officer of ACG. Mr. Kuula has been directly involved with real estate development, construction and management for more than 30 years. Mr. Wood is responsible for finance, acquisition, development and sales.
Escrows.The loan documents provide for upfront escrows in the amount of $85,819 for real estate taxes, $29,448 for insurance, and $4,919 for deferred maintenance. The loan documents also provide for ongoing monthly reserves in the amount of $20,433 for real estate taxes, $2,337 for insurance premiums and $4,000 for replacement reserves.
Lockbox and Cash Management.Upon the occurrence and continuance of a Cash Management Trigger Event (as defined below) the Capitol Place Apartments Mortgage Loan requires the borrower to establish a lender-controlled lockbox account. The loan documents also require that all revenues received by the borrower or the property manager be deposited into the lockbox account within two business days of receipt. Other than during a Cash Sweep Event (as defined below), all excess funds on deposit are disbursed to the borrower.
A “Cash Management Trigger Event” will commence upon the occurrence of (i) an event of default; or (ii) any bankruptcy action of any of the borrower, the guarantors or the manager. A Cash Management Trigger Event will end with respect to clause (i), when such event of default has been cured; and with respect to clause (ii), when such bankruptcy petition has been discharged, stayed, or dismissed within 30 days for the borrower or guarantors and 120 days for the manager, among other conditions. Clause (ii) may also be cured by the borrower replacing the manager with a qualified manager acceptable to the lender.
A “Cash Sweep Event” will commence upon the occurrence of (i) an event of default; or (ii) any bankruptcy action of any of the borrower, the guarantors or the manager. A Cash Sweep Event will end with respect to clause (i), when such event of default has been cured, and with respect to clause (ii), when such bankruptcy petition has been discharged, stayed, or dismissed within 30 days for the borrower or guarantors and 120 days for the manager, among other conditions. Clause (ii) may also be cured by the borrower replacing the manager with a qualified manager acceptable to the lender.
Property Management.The Capitol Place Apartments Property is managed by an affiliate of the borrower.
Assumption.The borrower has the right to transfer the Capitol Place Apartments Property, provided that no event of default has occurred and is continuing and certain other conditions are satisfied, including, but not limited to (i) the lender’s reasonable determination that the proposed transferee and guarantor satisfy the lender’s credit review and underwriting standards, taking into consideration transferee experience, financial strength and general business standing; (ii) execution of a recourse guaranty and an environmental indemnity by an affiliate of the transferee; and (iii) if requested by the lender, rating agency confirmation from Fitch, Moody’s and Morningstar that the transfer will not result in a downgrade, withdrawal or qualification of the respective ratings assigned to the Series 2015-C30 Certificates.
Partial Release.Not permitted.
Real Estate Substitution.Not permitted.
Subordinate and Mezzanine Indebtedness.Not permitted.
Terrorism Insurance.The loan documents require that the “all risk” insurance policy required to be maintained by the borrower provides coverage for terrorism in an amount equal to the full replacement cost of the Capitol Place Apartments Property, as well as business interruption insurance covering no less than the 18-month period following the occurrence of a casualty event, together with a 12-month extended period of indemnity.
Earthquake Insurance. The loan documents do not require earthquake insurance. The seismic report dated June 9, 2015 indicated a probable maximum loss of 5.0%.
THE INFORMATION IN THIS STRUCTURAL AND COLLATERAL TERM SHEET IS NOT COMPLETE AND MAY BE AMENDED PRIOR TO THE TIME OF SALE. THIS TERM SHEET IS NOT AN OFFER TO SELL THESE SECURITIES AND IT IS NOT A SOLICITATION OF AN OFFER TO BUY THESE SECURITIES IN ANY JURISDICTION WHERE THE OFFER OR SALE IS NOT PERMITTED.
| 91 |
| PENNBROOK APARTMENTS |
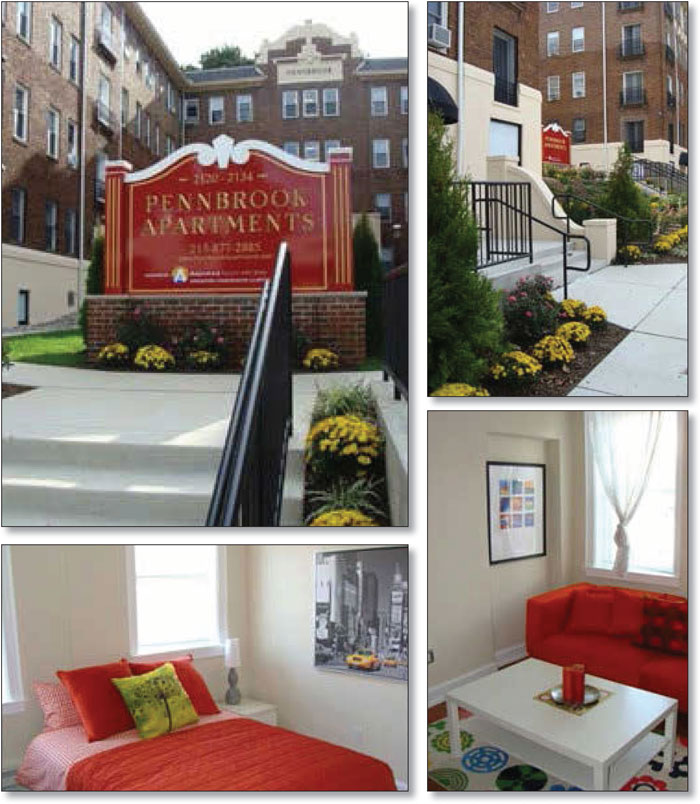
THE INFORMATION IN THIS STRUCTURAL AND COLLATERAL TERM SHEET IS NOT COMPLETE AND MAY BE AMENDED PRIOR TO THE TIME OF SALE. THIS TERM SHEET IS NOT AN OFFER TO SELL THESE SECURITIES AND IT IS NOT A SOLICITATION OF AN OFFER TO BUY THESE SECURITIES IN ANY JURISDICTION WHERE THE OFFER OR SALE IS NOT PERMITTED.
| 92 |
| PENNBROOK APARTMENTS |

THE INFORMATION IN THIS STRUCTURAL AND COLLATERAL TERM SHEET IS NOT COMPLETE AND MAY BE AMENDED PRIOR TO THE TIME OF SALE. THIS TERM SHEET IS NOT AN OFFER TO SELL THESE SECURITIES AND IT IS NOT A SOLICITATION OF AN OFFER TO BUY THESE SECURITIES IN ANY JURISDICTION WHERE THE OFFER OR SALE IS NOT PERMITTED.
| 93 |
| No. 9 – Pennbrook Apartments | |||||||
| Loan Information | Property Information | ||||||
| Mortgage Loan Seller: | Basis Real Estate Capital II, LLC | Single Asset/Portfolio: | Single Asset | ||||
| Credit Assessment (Fitch/Moody’s/Morningstar): | NR/NR/NR | Property Type: | Multifamily | ||||
| Original Principal Balance: | $18,300,000 | Specific Property Type: | Student Housing | ||||
| Cut-off Date Principal Balance: | $18,300,000 | Location: | Philadelphia, PA | ||||
| % of Initial Pool Balance: | 2.5% | Size: | 218 beds | ||||
| Loan Purpose: | Refinance | Cut-off Date Principal Balance Per Bed: | $83,945 | ||||
| Borrower Name: | Aquinas Pennbrook, LP | Year Built/Renovated: | 1926/2009 | ||||
| Sponsor: | Leonard Poncia | Title Vesting: | Fee | ||||
| Mortgage Rate: | 4.640% | Property Manager: | Self-managed | ||||
| Note Date: | June 26, 2015 | 3rd Most Recent Occupancy (As of): | 100.0% (12/31/2012) | ||||
| Anticipated Repayment Date: | NAP | 2nd Most Recent Occupancy (As of): | 100.0% (12/31/2013) | ||||
| Maturity Date: | July 1, 2025 | Most Recent Occupancy (As of): | 100.0% (12/31/2014) | ||||
| IO Period: | 24 months | Current Occupancy (As of): | 100.0% (5/1/2015) | ||||
| Loan Term (Original): | 120 months | ||||||
| Seasoning: | 1 month | Underwriting and Financial Information: | |||||
| Amortization Term (Original): | 360 months | ||||||
| Loan Amortization Type: | Interest-only, Amortizing Balloon | 3rd Most Recent NOI (As of): | $1,363,213 (12/31/2013) | ||||
| Interest Accrual Method: | Actual/360 | 2nd Most Recent NOI (As of): | $1,415,351 (12/31/2014) | ||||
| Call Protection: | L(25),D(91),O(4) | Most Recent NOI (As of): | $1,450,908 (TTM 3/31/2015) | ||||
| Lockbox Type: | Springing (With Established Account) | ||||||
| Additional Debt: | No | U/W Revenues: | $1,706,005 | ||||
| Additional Debt Type: | NAP | U/W Expenses: | $324,644 | ||||
| U/W NOI: | $1,381,361 | ||||||
| U/W NCF: | $1,355,461 | ||||||
| U/W NOI DSCR(2): | 1.22x | ||||||
| U/W NCF DSCR(2): | 1.20x | ||||||
| Escrows and Reserves(1): | U/W NOI Debt Yield(2): | 7.5% | |||||
| U/W NCF Debt Yield(2): | 7.4% | ||||||
| Type: | Initial | Monthly | Cap (If Any) | As-Is Appraised Value: | $25,800,000 | ||
| Taxes | $17,301 | $3,460 | NAP | As-Is Appraisal Valuation Date: | May 8, 2015 | ||
| Insurance | $42,900 | $3,900 | NAP | Cut-off Date LTV Ratio: | 70.9% | ||
| Replacement Reserves | $0 | $2,158 | NAP | LTV Ratio at Maturity or ARD: | 60.8% | ||
| (1) | See “Escrows” section. |
| (2) | St. Joseph’s is charging students an estimated blended rate of $848/bed while the underwritten master lease rent equates to $679/bed (see “Master Lease” section). Based on the estimated blended rent of $848/bed, the U/W NOI DSCR, U/W NCF DSCR, U/W NOI Debt Yield and U/W NCF Debt Yield would be 1.58x, 1.56x, 9.8% and 9.6%, respectively. |
The Mortgage Loan. The mortgage loan (the “Pennbrook Apartments Mortgage Loan”) is evidenced by a single promissory note that is secured by a first mortgage encumbering a 218-bed student housing property located in Philadelphia, Pennsylvania (the “Pennbrook Apartments Property”). The Pennbrook Apartments Mortgage Loan was originated on June 26, 2015 by Basis Real Estate Capital II, LLC. The Pennbrook Apartments Mortgage Loan had an original principal balance of $18,300,000, has an outstanding principal balance as of the Cut-off Date of $18,300,000 and accrues interest at an interest rate of 4.640%per annum. The Pennbrook Apartments Mortgage Loan had an initial term of 120 months, has a remaining term of 119 months as of the Cut-off Date and requires interest-only payments for the first 24 payments following origination and, thereafter, requires payments of principal and interest based on a 30-year amortization schedule. The Pennbrook Apartments Mortgage Loan matures on July 1, 2025.
Following the lockout period, the borrower has the right to defease the Pennbrook Apartments Mortgage Loan in whole, but not in part, on any day before April 1, 2025. In addition, the Pennbrook Apartments Mortgage Loan is prepayable without penalty on or after April 1, 2025.
THE INFORMATION IN THIS STRUCTURAL AND COLLATERAL TERM SHEET IS NOT COMPLETE AND MAY BE AMENDED PRIOR TO THE TIME OF SALE. THIS TERM SHEET IS NOT AN OFFER TO SELL THESE SECURITIES AND IT IS NOT A SOLICITATION OF AN OFFER TO BUY THESE SECURITIES IN ANY JURISDICTION WHERE THE OFFER OR SALE IS NOT PERMITTED.
| 94 |
| PENNBROOK APARTMENTS |
Sources and Uses
| Sources | Uses | |||||||
| Original loan amount | $18,300,000 | 100.0% | Loan payoff | $15,924,950 | 87.0% | |||
| Reserves | 60,201 | 0.3 | ||||||
| Closing costs | 643,445 | 3.5 | ||||||
| Return of equity | 1,671,403 | 9.1 | ||||||
| Total Sources | $18,300,000 | 100.0% | Total Uses | $18,300,000 | 100.0% |
The Property. The Pennbrook Apartments Property is a four-story, student-housing property located in Philadelphia, Pennsylvannia, directly across the street from St. Joseph’s University (“St. Joseph’s”). The Pennbrook Apartments Property is comprised of 74 units with 145 bedrooms and 218 beds; leases are on a per bed basis. Originally constructed in 1926, the Pennbrook Apartments Property was renovated in 2009 for approximately $8.9 million ($40,596 per bed), which included façade updates, complete interior renovations, new mechanicals, new roof and common area updates. The unit mix at the Pennbrook Apartments Property consists of one-, two-, three- , four- and five-bedroom units. The Pennbrook Apartments Property is home to students from St. Joseph’s with a master lease in-place from St. Joseph’s (see “Master Lease” section). St. Joseph’s is a private, co-educational Roman Catholic Jesuit university located in northwestern Philadelphia. St. Joseph’s was founded in 1851 and is the seventh oldest Jesuit university in the United States. St. Joseph’s had an endowment of $209.3 million (as of May 31, 2014) with an operating budget of $223.6 million (for fiscal year 2015) and maintains a credit rating of Aa3/A-/A from Moody’s/S&P/Fitch, respectively, as of June 30, 2015.
The Pennbrook Apartments Property features 38 beds within 30 one-bedroom/one-bathroom units, 90 beds within 30 two-bedroom/one-bathroom units, 30 beds within five three-bedroom/two-bathroom units, 40 beds within five four-bedroom/two-bathroom units and 20 beds within four five-bedroom/two-bathroom units. All units are furnished and have hardwood floors, vinyl tile flooring, updated/modern kitchens and bathrooms and new appliances (electric range/ovens, refrigerators, built-in microwaves, dishwashers and garbage disposals). Common area amenities include a management office, laundry room on each floor, and concrete sidewalks with handicapped accessible ramps. The Pennbrook Apartments Property contains no on-site parking. As of May 1, 2015, the Pennbrook Apartments Property was 100.0% leased. During the academic year 2014-2015 the Pennbrook Apartments Property was 100.0% occupied and is 100.0% preleased for the 2015-2016 academic year.
Master Lease. The initial master lease was signed by St. Joseph’s in December of 2009 for five years and St. Joseph’s has exercised its right to renew three times. Per the sixth amendment executed on June 21, 2015, St. Joseph’s exercised its four-year extension option extending the term of the lease to May 31, 2019. The current annual fixed rent is $1,777,089. The St. Joseph’s lease requires a minimum three-year termination notice (with a rolling four-year term) and annual rent escalations of 3.0% (rent escalations are not included in the underwritten rent). Thereafter, minimum fixed rent will equal the minimum fixed rent for the preceding lease year increased by the average year-over-year percentage rent increase experienced in St. Joseph’s owned and operated student housing for the preceding lease year. St. Joseph’s may extend the lease annually, provided that St. Joseph’s maintains a rolling lease term of at least four lease years. For example, if St. Joseph’s extends the lease next year, the lease will be extended to May 31, 2020. St. Joseph’s is required to give written notice by June 15th of the applicable year. St. Joseph’s is responsible for all leasing activities at the Pennbrook Apartments Property.
The following table presents certain information relating to the unit mix of the Pennbrook Apartments Property:
Unit Mix Summary(1)
| Unit Type | No. of Units | No. of Beds(2) | % of Total Beds | Avg. Unit Size (SF) |
| 1 Bedroom | 30 | 38 | 17.4% | 659 |
| 2 Bedroom | 30 | 90 | 41.3% | 789 |
| 3-Bedroom | 5 | 30 | 13.8% | 1,223 |
| 4-Bedroom | 5 | 40 | 18.3% | 1,260 |
| 5-Bedroom | 4 | 20 | 9.2% | 1,075 |
| Total/Weighted Average | 74 | 218 | 100.0% | 939 |
| (1) | Information obtained from the appraisal. U/W rent per unit type is not available as the master lease rent was underwritten. St. Joseph’s is charging students an estimated blended rate of $848 per bed while the underwritten master lease rent equates to $679 per bed. |
| (2) | Some of the bedrooms contain two beds. | |
The following table presents historical occupancy percentages at the Pennbrook Apartments Property:
Historical Occupancy
12/31/2012(1) | 12/31/2013(1) | 12/31/2014(1) | 5/1/2015(2) | |||
| 100.0% | 100.0% | 100.0% | 100.0% |
| (1) | Information obtained from the historical cash flow statements. Figures are reflective of economic occupancy. |
| (2) | Information obtained from the underwritten rent roll and reflects physical occupancy. |
THE INFORMATION IN THIS STRUCTURAL AND COLLATERAL TERM SHEET IS NOT COMPLETE AND MAY BE AMENDED PRIOR TO THE TIME OF SALE. THIS TERM SHEET IS NOT AN OFFER TO SELL THESE SECURITIES AND IT IS NOT A SOLICITATION OF AN OFFER TO BUY THESE SECURITIES IN ANY JURISDICTION WHERE THE OFFER OR SALE IS NOT PERMITTED.
| 95 |
| PENNBROOK APARTMENTS |
Operating History and Underwritten Net Cash Flow. The following table presents certain information relating to the historical operating performance and underwritten net cash flow at the Pennbrook Apartments Property:
Cash Flow Analysis
| 2013 | 2014 | TTM 4/30/2015 | U/W(1) | % of U/W Effective Gross Income | U/W $ per Bed | |||||||
| Base Rent | $1,654,747 | $1,704,391 | $1,716,954 | $1,777,089 | 104.2% | $8,152 | ||||||
| Grossed Up Vacant Space | 0 | 0 | 0 | 0 | 0.0 | 0 | ||||||
| Concessions | 0 | 0 | 0 | 0 | 0.0 | 0 | ||||||
| Other Income | 0 | 0 | 0 | 0 | 0.0 | 0 | ||||||
| Less Vacancy & Collection Loss | 0 | 0 | 0 | (71,084)(2) | (4.2) | (326) | ||||||
| Effective Gross Income | $1,654,747 | $1,704,391 | $1,716,954 | $1,706,005 | 100.0% | $7,826 | ||||||
| Total Operating Expenses | $291,533 | $289,040 | $266,046 | $324,644 | 19.0% | $1,489 | ||||||
| Net Operating Income | $1,363,213 | $1,415,351 | $1,450,908 | $1,381,361 | 81.0% | $6,337 | ||||||
| Capital Expenditures | 36,786 | 0 | 0 | 25,900 | 1.5 | 119 | ||||||
| Net Cash Flow | $1,326,428 | $1,415,351 | $1,450,908 | $1,355,461 | 79.5% | $6,218 | ||||||
| NOI DSCR | 1.21x | 1.25x | 1.28x | 1.22x | ||||||||
| NCF DSCR | 1.17x | 1.25x | 1.28x | 1.20x | ||||||||
| NOI DY | 7.4% | 7.7% | 7.9% | 7.5% | ||||||||
| NCF DY | 7.2% | 7.7% | 7.9% | 7.4% |
| (1) | The underwritten base rent is the current master lease rent. St. Joseph’s is charging students an estimated blended rate of $848 per bed while the underwritten master lease rent equates to $679 per bed. Based on the estimated blended rate of $848/bed, the U/W NOI DSCR, U/W NCF DSCR, U/W NOI Debt Yield and U/W NCF Debt Yield would be 1.58x, 1.56x, 9.8% and 9.7%, respectively. |
| (2) | The underwritten economic vacancy is 4.0%. The Pennbrook Apartments Property was 100.0% physically occupied as of May 1, 2015. |
Appraisal. As of the appraisal valuation date of May 8, 2015, the Pennbrook Apartments Property had an “as-is” appraised value of $25,800,000.
Environmental Matters.According to a Phase I environmental assessment dated May 12, 2015, there was no evidence of any recognized environmental conditions at the Pennbrook Apartments Property.
Market Overview and Competition.The Pennbrook Apartments Property is located 0.5 miles southwest of St. Joseph’s main campus in the Overbrook area of Philadelphia, Pennsylvania, and is classified as on-campus housing by St. Joseph’s. St. Joseph’s operates a shuttle that runs approximately every 15 minutes from the Pennbrook Apartments Property and surrounding residence halls to other parts of the campus along City Avenue. The Pennbrook Apartments Property is also within walking distance of City Avenue shopping and amenities and is across the street from the Southeastern Pennsylvania Transportation Authority’s Overbrook Train Station, which is an approximate 15-minute train ride from downtown Philadelphia. St. Joseph’s runs four other residential dormitories immediately surrounding the train station. The Overbrook neighborhood was primarily developed between 1900 and 1960 and is mainly residential with many row houses and three- to four-story apartment buildings that are similar to the Pennbrook Apartments Property. It is a dense in-fill location with little available developable land. According to a third-party market research report, the 2015 estimated household population within a one-, three- and five-mile radius of the Pennbrook Apartments Property is 10,589, 101,882, and 284,179, respectively, and the median household income within the same radii is $49,956, $40,461 and $41,121, respectively.
According to the appraisal, the Pennbrook Apartments Property is located in the Bala Cynwyd multifamily submarket, representing an off-campus multifamily market surrounding St. Joseph’s. The submarket consists primarily of smaller walk-up buildings and redeveloped or newly-constructed apartment buildings. According to the appraisal, as of March 31, 2015, the Bala Cynwyd multifamily submarket contained an overall inventory of 4,393 units reflecting a submarket vacancy of 2.7% and an effective rental rate of $1,200 per unit. The effective rents in the submarket have increased at an average rate of 3.1% per year since 2008. The appraisal identified a competitive set of five multifamily properties, which exhibited a 3.1% average vacancy rate and average monthly rent of approximately $1,621 per unit as of May 13, 2015. The appraiser concluded to a market rent of $1,150 per bed (equivalent to approximately $2,876 per unit).
THE INFORMATION IN THIS STRUCTURAL AND COLLATERAL TERM SHEET IS NOT COMPLETE AND MAY BE AMENDED PRIOR TO THE TIME OF SALE. THIS TERM SHEET IS NOT AN OFFER TO SELL THESE SECURITIES AND IT IS NOT A SOLICITATION OF AN OFFER TO BUY THESE SECURITIES IN ANY JURISDICTION WHERE THE OFFER OR SALE IS NOT PERMITTED.
| 96 |
| PENNBROOK APARTMENTS |
The following table presents certain information relating to comparable multifamily properties for the Pennbrook Apartments Property:
Competitive Set(1)(2)
| Pennbrook Apartments (Subject) | Executive House | Lincoln Court | Bala Apartments | The Metropolitan Bala | Drexel Arms | Overbrook Garden | |
| Location | Philadelphia, PA | Philadelphia, PA | Philadelphia, PA | Philadelphia, PA | Philadelphia, PA | Philadelphia, PA | Philadelphia, PA |
| Distance to Subject | -- | 0.2 miles | 0.2 miles | 1.5 miles | 2.1 miles | 0.1 miles | 2.7 miles |
| Property Type | Student Housing | Multifamily | Multifamily | Multifamily | Multifamily | Student Housing | Multifamily |
| Year Built/Renovated | 1926/2009 | 1984/NAV | 1927/NAV | 1931/NAV | 1973/NAV | 1930/NAV | 1927/NAV |
| Number of Beds | 218 | 302 | 58 | 146 | 140 | 24 | 69 |
| Average Rent (per bed)(3) | |||||||
| Studio | NAP | NAP | $755 | $993 | $993 | NAP | $700 |
| 1 Bedroom | $1,150 | $1,498 | $925 | $883 | $1,148 | NAP | $860 |
| 2 Bedroom | $750 | $883 | $618 | $513 | $763 | NAP | $548 |
| 3 Bedroom | $600 | $540 | NAP | $417 | NAP | $850 | NAP |
| 4 Bedroom | $550 | NAP | $525 | $338 | NAP | $850 | NAP |
| 5 Bedroom | $775 | NAP | NAP | NAP | NAP | NAP | NAP |
| Occupancy | 100% | 97% | 100% | 96% | NAV | 94% | NAV |
| (1) | Information obtained from the appraisal and underwritten rent roll. |
| (2) | Competitive set properties, aside from Drexel Arms, are not exclusively for student housing, but contain student populations. |
| (3) | Subject property rents represent estimated market rents as shown in the appraisal. |
The Borrower. The borrower is Aquinas Pennbrook, LP, a Pennsylvania limited partnership. Leonard Poncia is the guarantor of certain nonrecourse carveouts under the Pennbrook Apartments Mortgage Loan.
The Sponsor. The sponsor is Leonard Poncia. Mr. Poncia is the president of Aquinas Realty Partners, a privately held, full-service real estate development company based in the Philadelphia region with a focus on investing in and developing value-add commercial mixed use, retail, residential and office projects. Mr. Poncia’s current portfolio consists of two multifamily properties (not including the Pennbrook Apartments Property) spanning 136 units in Philadelphia, Pennsylvania and Newton, Pennsylvania with an estimated market value of $68.5 million. The Estate of Stephen Girard, a high net worth philanthropic educational fund established in 1831 and administered by the city of Philadelphia primarily to develop and operate Girard College, holds a limited partner share (95.0%) in the borrower.
Escrows. The loan documents provide for upfront reserves of $17,301 for taxes and $42,900 for insurance. The loan documents also provide for ongoing monthly reserves of $3,460 for real estate taxes, $3,900 for insurance premiums and $2,158 for replacement reserves.
Lockbox and Cash Management.The Pennbrook Apartments Mortgage Loan requires a lender-controlled lockbox account, which is already in place. During a Trigger Event Period (as defined below), the borrower and property manager will cause all rents to be deposited directly into the lockbox account, and all funds on deposit in the lockbox account will be swept to a lender-controlled cash management account on a daily basis.
A “Trigger Event Period” will commence upon the earlier of (i) the occurrence and continuance of an event of default; (ii) the amortizing debt service coverage ratio falls below 1.15x for two consecutive calendar quarters; or (iii) St. Joseph’s University (a) files for bankruptcy, (b) provides notices of its intent to terminate its lease early or terminates the lease, (c) defaults under the terms of its lease beyond applicable notice and cure periods or (d) fails to provide timely notice of its intent to renew or extend its lease (with a minimum rolling lease term of four years). A Trigger Event Period will end, with respect to clause (i), upon the cure of such event of default; with respect to clause (ii), upon the date that the amortizing debt service coverage ratio is equal to or greater than 1.20x for two consecutive calendar quarters on a trailing twelve month basis; and with respect to clause (iii) upon the borrower re-leasing the premises to an acceptable replacement tenant which results in the Pennbrook Apartment Property having a net cash flow debt yield of no less than 7.8% and an amortizing debt service coverage ratio of no less than 1.28x, among other conditions as stated in the loan documents.
Property Management.The Pennbrook Apartments Property is managed by an affiliate of the borrower.
Assumption. The borrower has the right to transfer the Pennbrook Apartments Property provided that no event of default has occurred and is continuing and certain other conditions are satisfied, including (i) the lender’s reasonable determination that the proposed transferee and guarantor satisfy the lender’s credit review and underwriting standards, taking into consideration transferee experience, financial strength and general business standing; (ii) the execution of a recourse guaranty and an environmental indemnity by an affiliate of the transferee; and (iii) if requested by the lender, a rating agency confirmation from Fitch, Moody’s and Morningstar that the transfer will not result in a downgrade, withdrawal or qualification of the respective ratings assigned to the Series 2015-C30 Certificates.
Partial Release. Not permitted.
Real Estate Substitution.Not permitted.
Ground Lease. None.
THE INFORMATION IN THIS STRUCTURAL AND COLLATERAL TERM SHEET IS NOT COMPLETE AND MAY BE AMENDED PRIOR TO THE TIME OF SALE. THIS TERM SHEET IS NOT AN OFFER TO SELL THESE SECURITIES AND IT IS NOT A SOLICITATION OF AN OFFER TO BUY THESE SECURITIES IN ANY JURISDICTION WHERE THE OFFER OR SALE IS NOT PERMITTED.
| 97 |
| PENNBROOK APARTMENTS |
Subordinate and Mezzanine Indebtedness. Not permitted.
Terrorism Insurance.The loan documents require that the “all risk” insurance policy required to be maintained by the borrower provides coverage for terrorism in an amount equal to the full replacement cost of the Pennbrook Apartments Property. The loan documents also require business interruption insurance covering no less than the 12-month period following the occurrence of a casualty event, together with a 12-month extended period of indemnity.
THE INFORMATION IN THIS STRUCTURAL AND COLLATERAL TERM SHEET IS NOT COMPLETE AND MAY BE AMENDED PRIOR TO THE TIME OF SALE. THIS TERM SHEET IS NOT AN OFFER TO SELL THESE SECURITIES AND IT IS NOT A SOLICITATION OF AN OFFER TO BUY THESE SECURITIES IN ANY JURISDICTION WHERE THE OFFER OR SALE IS NOT PERMITTED.
| 98 |
(THIS PAGE INTENTIONALLY LEFT BLANK)
THE INFORMATION IN THIS STRUCTURAL AND COLLATERAL TERM SHEET IS NOT COMPLETE AND MAY BE AMENDED PRIOR TO THE TIME OF SALE. THIS TERM SHEET IS NOT AN OFFER TO SELL THESE SECURITIES AND IT IS NOT A SOLICITATION OF AN OFFER TO BUY THESE SECURITIES IN ANY JURISDICTION WHERE THE OFFER OR SALE IS NOT PERMITTED.
| 99 |
| Cross Gates Apartments Portfolio |
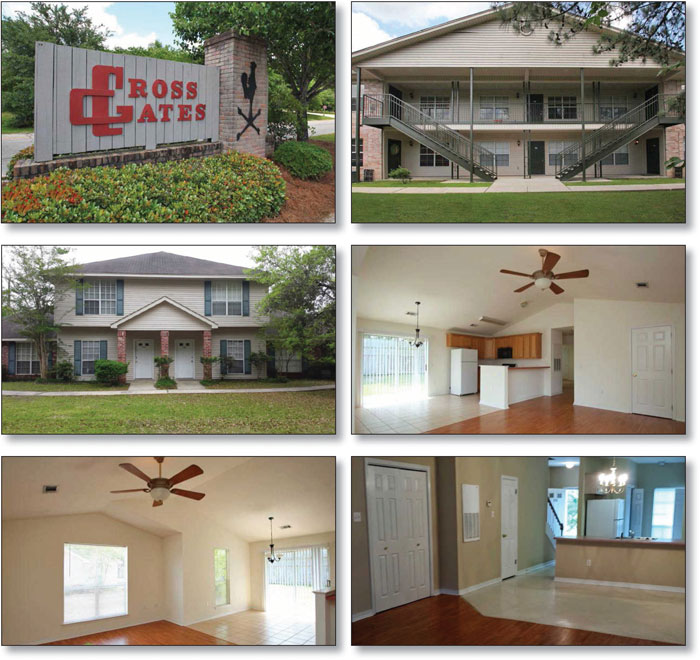
THE INFORMATION IN THIS STRUCTURAL AND COLLATERAL TERM SHEET IS NOT COMPLETE AND MAY BE AMENDED PRIOR TO THE TIME OF SALE. THIS TERM SHEET IS NOT AN OFFER TO SELL THESE SECURITIES AND IT IS NOT A SOLICITATION OF AN OFFER TO BUY THESE SECURITIES IN ANY JURISDICTION WHERE THE OFFER OR SALE IS NOT PERMITTED.
| 100 |
| Cross Gates Apartments Portfolio |
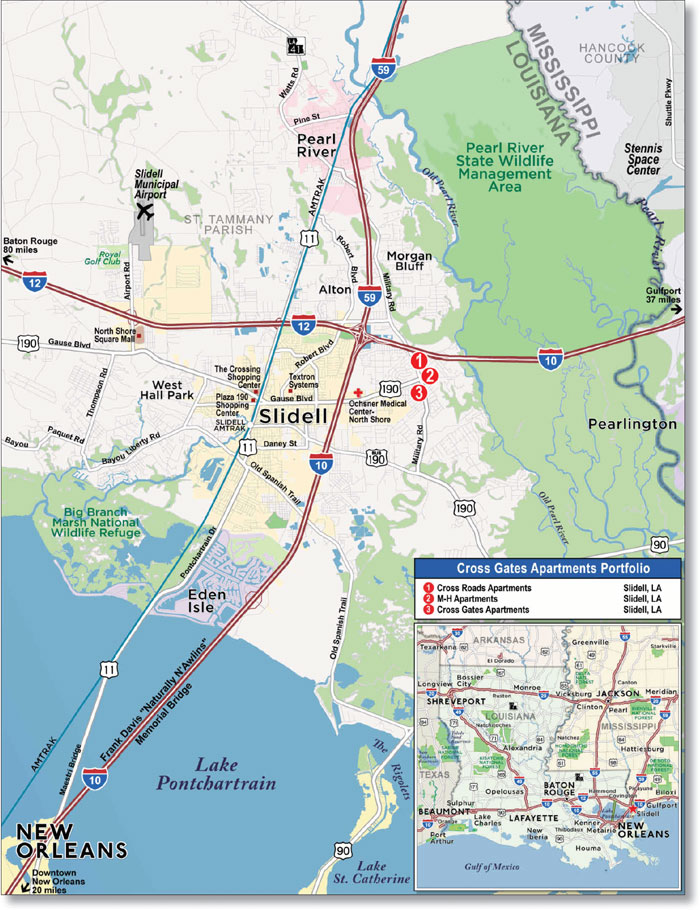
THE INFORMATION IN THIS STRUCTURAL AND COLLATERAL TERM SHEET IS NOT COMPLETE AND MAY BE AMENDED PRIOR TO THE TIME OF SALE. THIS TERM SHEET IS NOT AN OFFER TO SELL THESE SECURITIES AND IT IS NOT A SOLICITATION OF AN OFFER TO BUY THESE SECURITIES IN ANY JURISDICTION WHERE THE OFFER OR SALE IS NOT PERMITTED.
| 101 |
| No. 10 – Cross Gates Apartments Portfolio | ||||||
| Loan Information | Property Information | |||||
| Mortgage Loan Seller: | Basis Real Estate Capital II, LLC | Single Asset/Portfolio: | Portfolio | |||
| Credit Assessment (Fitch/Moody’s/Morningstar): | NR/NR/NR | Property Type: | Multifamily | |||
| Original Principal Balance: | $15,500,000 | Specific Property Type: | Garden | |||
| Cut-off Date Principal Balance: | $15,483,256 | Location: | Slidell, LA | |||
| % of Initial Pool Balance: | 2.1% | Size: | 296 units | |||
| Loan Purpose: | Refinance | Cut-off Date Principal Balance Per Unit: | $52,308 | |||
| Borrower Name: | Slidell Rentals I, L.L.C. | Year Built/Renovated: | Various – See Table | |||
| Sponsor: | Jared J. Caruso-Riecke | Title Vesting: | Fee | |||
| Mortgage Rate: | 4.930% | Property Manager: | Self-managed | |||
| Note Date: | July 1, 2015 | 3rdMost Recent Occupancy(2): | NAV | |||
| Anticipated Repayment Date: | NAP | 2nd Most Recent Occupancy(2): | NAV | |||
| Maturity Date: | July 1, 2025 | Most Recent Occupancy (As of): | 92.0% (12/31/2014) | |||
| IO Period: | None | Current Occupancy (As of): | 98.6% (5/30/2015) | |||
| Loan Term (Original): | 120 months | |||||
| Seasoning: | 1 month | Underwriting and Financial Information: | ||||
| Amortization Term (Original): | 360 months | |||||
| Loan Amortization Type: | Amortizing Balloon | 3rdMost Recent NOI(3): | NAV | |||
| Interest Accrual Method: | Actual/360 | 2ndMost Recent NOI (As of)(3): | $1,301,544 (12/31/2013) | |||
| Call Protection: | L(25),D(94),O(1) | Most Recent NOI (As of)(3): | $1,262,373 (12/31/2014) | |||
| Lockbox Type: | Springing (Without Established Account) | |||||
| Additional Debt: | None | |||||
| Additional Debt Type: | NAP | |||||
| U/W Revenues: | $2,446,382 | |||||
| U/W Expenses: | $1,100,956 | |||||
| U/W NOI: | $1,345,426 | |||||
| U/W NCF: | $1,271,426 | |||||
| U/W NOI DSCR: | 1.36x | |||||
| Escrows and Reserves(1): | U/W NCF DSCR: | 1.28x | ||||
| U/W NOI Debt Yield: | 8.7% | |||||
| Type: | Initial | Monthly | Cap (If Any) | U/W NCF Debt Yield: | 8.2% | |
| Taxes | $196,002 | $21,778 | NAP | As-Is Appraised Value: | $21,500,000 | |
| Insurance | $46,911 | $15,637 | NAP | As-Is Appraisal Valuation Dates: | May 5, 2015 | |
| Replacement Reserves | $0 | $6,167 | NAP | Cut-off Date LTV Ratio: | 72.0% | |
| Deferred Maintenance | $75,750 | $0 | NAP | LTV Ratio at Maturity or ARD: | 59.1% | |
| (1) | See “Escrows” section. |
| (2) | See “Historical Occupancy” section. |
| (3) | See “Cash Flow Analysis” section. |
The Mortgage Loan. The mortgage loan (the “Cross Gates Apartments Portfolio Mortgage Loan”) is evidenced by a single promissory note that is secured by a first mortgage encumbering three garden style multifamily properties totaling 296 units located in Slidell, Louisiana in St. Tammany Parish (the “Cross Gates Apartments Portfolio Properties”). The Cross Gates Apartments Portfolio Mortgage Loan was originated on July 1, 2015 by Basis Real Estate Capital II, LLC. The Cross Gates Apartments Portfolio Mortgage Loan had an original principal balance of $15,500,000, has an outstanding principal balance as of the Cut-off Date of $15,483,256 and accrues interest at an interest rate of 4.930%per annum. The Cross Gates Apartments Portfolio Mortgage Loan had an initial term of 120 months, has a remaining term of 119 months as of the Cut-off Date and requires payments of principal and interest based on a 30-year amortization schedule. The Cross Gates Apartments Portfolio Mortgage Loan matures on July 1, 2025.
Following the lockout period, the borrower has the right to defease the Cross Gates Apartments Portfolio Mortgage Loan in whole, but not in part, on any due date before July 1, 2025. In addition, the Cross Gates Apartments Mortgage Loan is payable without penalty on July 1, 2025.
THE INFORMATION IN THIS STRUCTURAL AND COLLATERAL TERM SHEET IS NOT COMPLETE AND MAY BE AMENDED PRIOR TO THE TIME OF SALE. THIS TERM SHEET IS NOT AN OFFER TO SELL THESE SECURITIES AND IT IS NOT A SOLICITATION OF AN OFFER TO BUY THESE SECURITIES IN ANY JURISDICTION WHERE THE OFFER OR SALE IS NOT PERMITTED.
| 102 |
| Cross Gates Apartments Portfolio |
Sources and Uses
| Sources | Uses | |||||||
| Original loan amount | $15,500,000 | 99.8% | Loan payoff | $14,866,143 | 95.7% | |||
| Sponsor’s new cash contribution | 37,587 | 0.2 | Reserves | 318,663 | 2.1 | |||
| Closing costs | 352,781 | 2.3 | ||||||
| Total Sources | $15,537,587 | 100.0% | Total Uses | $15,537,587 | 100.0% |
The Properties.The Cross Gates Apartments Portfolio Properties consist of three garden-style multifamily properties containing 296 units located in Slidell, St. Tammany Parish, Louisiana, approximately 36.3 miles northeast of the central business district of New Orleans, Louisiana. The Cross Gates Apartments Portfolio Properties were built between 1989 and 2011 and last renovated in 2015. The unit mix is comprised of 169 one-bedroom units, 121 two-bedroom units and six three-bedroom units. All units at the Cross Gates Apartments Portfolio Properties contain balconies/patios, central air conditioning, and in-unit washers and dryers. The Cross Gates Apartments Portfolio Properties are all within 1.5 miles along Military Road and have one leasing office. As of May 30, 2015, the Cross Gates Apartments Portfolio Properties were 98.6% occupied.
The Cross Roads Apartments property consists of seven one- and two-story garden-style multifamily buildings situated on two non-contiguous parcels totaling 9.8 acres in Slidell, Louisiana. Constructed between 1999 and 2011, the Cross Roads Apartments property contains 169 units comprised of 160 one-bedroom units (averaging 640 square feet) and nine two-bedroom units (averaging 1,000 square feet). The property contains 301 parking spaces, resulting in a parking ratio of 1.8 spaces per unit.
The M-H Apartments property consists of seventeen one- and two-story garden-style multifamily buildings situated on two non-contiguous parcels totaling 6.8 acres in Slidell, Louisiana. Constructed between 1989 and 1999, the M-H Apartments property contains 69 units comprised of seven one-bedroom units (averaging 750 square feet), 56 two-bedroom units (averaging 1,150 square feet), and six three-bedroom units (averaging 1,700 square feet). The M-H Apartments property contains 131 parking spaces, resulting in a parking ratio of 1.9 spaces per unit.
The Cross Gates Apartments property consists of 14 one- and two-story garden-style multifamily buildings situated on two non-contiguous parcels totaling 5.0 acres in Slidell, Louisiana. Built in 1989, the Cross Gates Apartments property contains 58 units comprised of two one-bedroom units (averaging 750 square feet) and 56 two-bedroom units (averaging 862 square feet). The Cross Gates Apartments property contains 114 parking spaces, resulting in a parking ratio of 2.0 spaces per unit.
Master Lease.The guarantor of the Cross Gates Apartments Portfolio Mortgage Loan is the tenant under a master lease that has a monthly base rent obligation of $171,020. The master lease automatically renews and is in place every year until such time as all of the 240 month-to-month leases put in place by the previous owner of the Cross Gates Apartments Portfolio Properties are converted to traditional 12-month leases. The master lease base rent is reduced each time a tenant enters into a written lease for any apartment unit at a rent greater than the rent previously received for that unit and for a term of not less than one year, and such tenant takes physical possession of such unit and commences paying full unabated rent.
The following table presents certain information relating to the Cross Gates Apartments Portfolio Properties:
| Property Name | Allocated Cut- off Date Principal Balance | % of Portfolio Cut-off Date Principal Balance | Occupancy | Year Built/ Renovated | No. of Units | Appraised Value | Allocated LTV | |
| Cross Roads Apartments | $8,641,817 | 55.8% | 97.6% | 1999-2011/2015 | 169 | $12,000,000 | 72.0% | |
| M-H Apartments | $3,888,819 | 25.1% | 100.0% | 1989-1999/2008 | 69 | $5,400,000 | 72.0% | |
| Cross Gates Apartments | $2,952,621 | 19.1% | 100.0% | 1989/2008 | 58 | $4,100,000 | 72.0% | |
| Total/Weighted Average | $15,483,256 | 100.0% | 98.6% | 296 | $21,500,000 | 72.0% | ||
The following table presents certain information relating to the unit mix of the Cross Gates Apartments Portfolio Properties:
Unit Mix Summary(1)
| Unit Type | No. of Units | % of Total Units | Average Unit Size (SF) | Average U/W Monthly Base Rent |
| 1 Bedroom / 1 Bathroom | 169 | 57.1% | 652 | $662 |
| 2 Bedroom / 1 Bathroom | 52 | 17.6% | 850 | $723 |
| 2 Bedroom / 2 Bathroom | 69 | 23.3% | 1,135 | $843 |
| 3 Bedroom / 2 Bathroom | 6 | 2.0% | 1,700 | $1,105 |
| Total/Weighted Average | 296 | 100.0% | $724 |
| (1) | Information obtained from the underwritten rent rolls. |
THE INFORMATION IN THIS STRUCTURAL AND COLLATERAL TERM SHEET IS NOT COMPLETE AND MAY BE AMENDED PRIOR TO THE TIME OF SALE. THIS TERM SHEET IS NOT AN OFFER TO SELL THESE SECURITIES AND IT IS NOT A SOLICITATION OF AN OFFER TO BUY THESE SECURITIES IN ANY JURISDICTION WHERE THE OFFER OR SALE IS NOT PERMITTED.
| 103 |
| Cross Gates Apartments Portfolio |
The following table presents historical occupancy percentages at the Cross Gates Apartments Portfolio Properties:
Historical Occupancy
| 12/31/2012(1) | 12/31/2013(1) | 12/31/2014(2) | 5/30/2015(3) | |||
| NAV | NAV | 92.0% | 98.6% |
| (1) | The sponsor acquired the Cross Gates Apartments Portfolio Properties in December 2014 and the previous owner did not provide the 2012 or 2013 occupancy. |
| (2) | Information obtained from the borrower. |
| (3) | Information obtained from the underwritten rent roll. |
Operating History and Underwritten Net Cash Flow.The following table presents certain information relating to the historical operating performance and underwritten net cash flow at the Cross Gates Apartments Portfolio Properties:
Cash Flow Analysis(1)
| 2013 | 2014 | U/W | % of U/W Effective Gross Income | U/W $ per Unit | ||||||||||||
| Base Rent | $2,171,143 | $2,235,899 | $2,570,904 | 105.1% | $8,685 | |||||||||||
| Grossed Up Vacant Space | 0 | 0 | 0 | 0 | 0 | |||||||||||
| Other Income | 39,360 | 26,354 | 26,105 | 1.1 | 88 | |||||||||||
| Less Vacancy & Credit Loss | (8,736 | ) | 0 | (150,626) | (2) | (6.2) | (509 | ) | ||||||||
| Effective Gross Income | $2,201,767 | $2,262,254 | $2,446,382 | 100.0% | $8,265 | |||||||||||
| Total Operating Expenses | $900,223 | $999,881 | $1,100,956 | 45.0% | $3,719 | |||||||||||
| Net Operating Income | $1,301,544 | (3) | $1,262,373 | (3) | $1,345,426 | 55.0% | $4,545 | |||||||||
| Capital Expenditures | 0 | 0 | 74,000 | 3.0 | 250 | |||||||||||
| Net Cash Flow | $1,301,544 | $1,262,373 | $1,271,426 | 52.0% | $4,295 | |||||||||||
| NOI DSCR | 1.33x | 1.27x | 1.36x | |||||||||||||
| NCF DSCR | 1.33x | 1.27x | 1.28x | |||||||||||||
| NOI DY | 8.4% | 8.2% | 8.7% | |||||||||||||
| NCF DY | 8.4% | 8.2% | 8.2% | |||||||||||||
| (1) | The sponsor acquired the Cross Gates Apartments Portfolio Properties in December 2014 and historical financials prior to 2013 were not provided by the seller. |
| (2) | The underwritten economic vacancy is 5.8%. The Cross Gates Apartments Portfolio Properties were 98.6% physically occupied as of May 30, 2015. |
| (3) | The decrease in Net Operating Income from 2013 to 2014 is due to an increase in R&M expenses. |
Appraisal.As of the appraisal valuation date of May 5, 2015, the Cross Gates Apartments Portfolio Properties had an aggregate “as-is” appraised value of $21,500,000.
Environmental Matters.According to Phase I environmental assessments dated May 15, 2015 and May 18, 2015, there was no evidence of any recognized environmental conditions at the Cross Gates Apartments Portfolio Properties.
Market Overview.The Cross Gates Apartments Portfolio Properties are located within 1.4 miles of each other in Slidell, Louisiana in St. Tammany Parish within the New Orleans-Metairie metropolitan statistical area (“MSA”). The Cross Gates Apartments Portfolio Properties are located 36.3 miles northeast of the New Orleans central business district, 34.0 miles northeast of the historic French Quarter (Vieux Carre), 29.2 miles southeast of Covington (parish seat of St. Tammany Parish), and 90.9 miles east of Baton Rouge (state capital of Louisiana). St. Tammany is the most affluent parish in the New Orleans MSA and is referred to as part of the “North Shore” due to its location on Lake Pontchartrain.
According to a third-party market research report, the New Orleans MSA had an estimated population of 1,247,749 in 2014. In addition, the New Orleans MSA population has grown 4.9% since 2010 and is projected to grow by 6.9% by 2019. The number of households within a five-mile radius of the Cross Gates Apartments Portfolio Properties is also expected to increase through 2019 with an annual growth rate of 1.5%. The 2015 estimated average household income within a one-, three- and five-mile radius of the Cross Gates Apartments Portfolio Properties was $104,162, $87,739 and $76,179 respectively. The New Orleans economy is dominated by four major sectors: oil/gas and related activities, tourism, the port and ship/boat building, and aerospace manufacturing. The presence of universities, hospitals, legal/accounting and other professional services, together with key installations of the United States Navy and other military operations in the region adds to its diversified economic base. The New Orleans region is also a major transportation hub and a leader in production of crude oil and natural gas processing facilities.
The Cross Gates Apartments Portfolio Properties are located in the St. Tammany submarket of the overall New Orleans multifamily market. The New Orleans multifamily market had a vacancy rate of 5.6% as of the first quarter of 2015, which represents an 8.2% decrease from the year-end 2013 vacancy rate of 6.1%. Furthermore, the average asking rent for the New Orleans multifamily market as of the first quarter of 2015 was $911 per unit per month, a 4.5% increase from the year-end 2013 average asking rent of $872 per unit per month. As of first quarter of 2015, the St. Tammany multifamily submarket had an occupancy rate of 94.2%. The average submarket rent per unit was $911 as of the first quarter of 2015, an increase of $39 from year-end 2013. No properties in the St. Tammany Parish multifamily submarket are currently offering concessions. There are currently no apartment properties under construction in the immediate area that are expected to compete with the Cross Gates Apartments Portfolio Properties.
THE INFORMATION IN THIS STRUCTURAL AND COLLATERAL TERM SHEET IS NOT COMPLETE AND MAY BE AMENDED PRIOR TO THE TIME OF SALE. THIS TERM SHEET IS NOT AN OFFER TO SELL THESE SECURITIES AND IT IS NOT A SOLICITATION OF AN OFFER TO BUY THESE SECURITIES IN ANY JURISDICTION WHERE THE OFFER OR SALE IS NOT PERMITTED.
| 104 |
| Cross Gates Apartments Portfolio |
The Borrower.The borrower is Slidell Rentals I, L.L.C., a Louisiana limited liability company and single purpose entity. Jared J. Caruso-Riecke is the guarantor of certain nonrecourse carve-outs under the Cross Gates Apartments Portfolio Mortgage Loan.
The Sponsor.The sponsor is Jared J. Caruso-Riecke. Mr. Caruso-Riecke is a lifetime resident of St. Tammany Parish, Louisiana and the Riecke family has a long history of real estate development, construction, and banking in the New Orleans area. Upon graduation from Louisiana State University in Baton Rouge in 1994, Mr. Caruso-Riecke returned home to start his own construction and real estate development companies. Since that time, Mr. Caruso-Riecke has served as the managing member of numerous projects ranging from historical renovation, single and multifamily housing projects, to shopping center developments. Mr. Caruso-Riecke also founded Gulf South Real Estate Management, which manages several hundred apartment units and rental houses, as well as in excess of 100,000 square feet of commercial space.
Escrows.The loan documents provide for upfront reserves in the amount of $196,002 for real estate taxes, $46,911 for insurance, and $75,750 for deferred maintenance. The loan documents also provide for ongoing monthly reserves in the amount of $21,778 for real estate taxes, $15,637 for insurance and $6,167 for replacement reserves.
Recourse.$2,225,000 of the Cross Gates Apartments Portfolio Mortgage Loan is full recourse to the borrower and the guarantor, jointly and severally, until such time as the borrower demonstrates to the lender’s satisfaction, to be determined in the lender’s sole discretion, that the stabilized net operating income (after deduction of contributions to the replacement reserves) for the Cross Gates Apartments Portfolio Properties is at least $1,271,000 for two consecutive years.
Lockbox and Cash Management.Upon the occurrence of a Cash Management Event (as defined below), the borrower is required to establish a lender-controlled cash management account into which the borrower is required to deposit all rents and other income within two business days of receipt and the tenants are directed to deposit directly. During a Cash Sweep Period (as defined below), all excess funds on deposit in the lockbox account are swept to a lender-controlled cash flow subaccount.
A “Cash Management Event” will commence upon the amortizing net cash flow debt service coverage ratio being less than 1.20x for one calendar quarter. A “Cash Sweep Period” will commence upon (i) an event of default, or (ii) the amortizing debt service coverage ratio being less than or equal to 1.15x for the 2 consecutive calendar quarters. A Cash Sweep Period will be cured, with respect to clause (i), when such event of default has been cured; and with respect to clause (ii), when the amortizing net cash flow debt service coverage ratio has been equal to or greater than 1.20x for two consecutive calendar quarters.
Property Management.The Cross Gates Apartments Portfolio Properties are managed by an affiliate of the borrower.
Assumption.The borrower has the right to transfer the Cross Gates Apartments Portfolio Property, provided that no event of default has occurred and is continuing and certain other conditions are satisfied, including (i) the lender’s reasonable determination that the proposed transferee and guarantor satisfy the lender’s credit review and underwriting standards, taking into consideration transferee experience, financial strength and general business standing; (ii) the execution of a recourse guaranty and an environmental indemnity by an affiliate of the transferee; and (iii) if requested by the lender, a rating agency confirmation from Fitch, Moody’s and Morningstar that the transfer will not result in a downgrade, withdrawal or qualification of the respective ratings assigned to the Series 2015-C30 Certificates.
Partial Release.Not Permitted.
Real Estate Substitution.Not permitted.
Ground Lease.None.
Subordinate and Mezzanine Indebtedness.Not permitted.
Terrorism Insurance.The loan documents require that the “all risk” insurance policy required to be maintained by the borrowers provide coverage for terrorism in an amount equal to the full replacement cost of the Cross Gates Apartments Portfolio Properties. The loan documents also require business interruption insurance covering no less than the 12-month period following the occurrence of a casualty event, together with a 12-month extended period of indemnity.
Windstorm Insurance. The loan documents require windstorm insurance covering the full replacement cost of the Cross Gates Apartments Portfolio Properties. At the time of Cross Gates Apartments Portfolio Mortgage Loan closing, the Cross Gates Apartments Portfolio Properties has insurance coverage for windstorm.
THE INFORMATION IN THIS STRUCTURAL AND COLLATERAL TERM SHEET IS NOT COMPLETE AND MAY BE AMENDED PRIOR TO THE TIME OF SALE. THIS TERM SHEET IS NOT AN OFFER TO SELL THESE SECURITIES AND IT IS NOT A SOLICITATION OF AN OFFER TO BUY THESE SECURITIES IN ANY JURISDICTION WHERE THE OFFER OR SALE IS NOT PERMITTED.
| 105 |
| No. 11 – Rivercrest Portfolio | ||||||
| Loan Information | Property Information | |||||
| Mortgage Loan Seller: | Wells Fargo Bank, National Association | Single Asset/Portfolio: | Portfolio | |||
| Credit Assessment (Fitch/Moody’s/Morningstar): | NR/NR/NR | Property Type: | Retail | |||
| Original Principal Balance: | $11,662,500 | Specific Property Type: | Shadow Anchored | |||
| Cut-off Date Principal Balance: | $11,662,500 | Location: | Various – See Table | |||
| % of Initial Pool Balance: | 1.6% | Size: | 106,336 SF | |||
| Loan Purpose: | Acquisition | Cut-off Date Principal Balance Per SF:
| $109.68 | |||
| Borrower Names: | Jackson (Rankin) SRX, LLC; Garner (Garner) SRX, LLC; Villa Rica (Villa Rica) SRX, LLC | Year Built/Renovated: | Various – See Table | |||
| Sponsors: | Stanley Werb; Jonathan Gaines | Title Vesting: | Fee | |||
| Mortgage Rate: | 4.300% | Property Manager: | Self-managed | |||
| Note Date: | June 15, 2015 | 3rdMost Recent Occupancy(3): | NAV | |||
| Anticipated Repayment Date: | NAP | 2ndMost Recent Occupancy(3): | NAV | |||
| Maturity Date: | July 11, 2025 | Most Recent Occupancy(3): | NAV | |||
| IO Period: | 48 months | Current Occupancy (As of)(3): | 89.5% (Various) | |||
| Loan Term (Original): | 120 months | |||||
| Seasoning: | 1 month | Underwriting and Financial Information: | ||||
| Amortization Term (Original): | 360 | |||||
| Loan Amortization Type: | Interest-only, Amortizing Balloon | 3rdMost Recent NOI(4): | NAV | |||
| Interest Accrual Method: | Actual/360 | 2ndMost Recent NOI (As of): | $1,228,113 (12/31/2013) | |||
| Call Protection: | L(25),D(91),O(4) | Most Recent NOI (As of): | $1,091,940 (12/31/2014) | |||
| Lockbox Type: | Springing (Without Established Account) | |||||
| Additional Debt: | None | U/W Revenues: | $1,545,893 | |||
| Additional Debt Type: | NAP | U/W Expenses: | $391,304 | |||
| U/W NOI: | $1,154,588 | |||||
| U/W NCF: | $1,051,352 | |||||
| U/W NOI DSCR: | 1.67x | |||||
| Escrows and Reserves: | U/W NCF DSCR: | 1.52x | ||||
| U/W NOI Debt Yield: | 9.9% | |||||
| Type: | Initial | Monthly | Cap (If Any) | U/W NCF Debt Yield: | 9.0% | |
| Taxes | $101,940 | $16,990 | NAP | As-Is Appraised Value: | $15,550,000 | |
| Insurance(1) | $0 | Springing | NAP | As-Is Appraisal Valuation Date(5): | Various | |
| Replacement Reserves | $0 | $3,450 | NAP | Cut-off Date LTV Ratio: | 75.0% | |
| TI/LC Reserve(2) | $0 | $4,431 | $215,000 | LTV Ratio at Maturity or ARD: | 66.9% | |
| (1) | Ongoing monthly reserves for insurance are not required so long as (i) no event of default has occurred and is continuing; (ii) the Rivercrest Portfolio Properties are insured via an acceptable blanket insurance policy; and (iii) the borrowers provide the lender with evidence of renewal of the insurance policies and timely proof of payment of insurance premiums. |
| (2) | Monthly TI/LC Reserves of $4,431 are required until the reserve has reached the cap of $215,000. The cap does not apply upon (i) the occurrence and continuance of an event of default; (ii) the sponsor or an affiliate of the sponsor not controlling each borrower; or (iii) the net cash flow debt yield falling below 8.75%. |
| (3) | See “Historical Occupancy” section. |
| (4) | See “Cash Flow Analysis” section. |
| (5) | As-Is Appraised Value Valuation Dates range from May 12, 2015 to May 18, 2015. |
The Rivercrest Portfolio mortgage loan is evidenced by a single promissory note that is secured by a first mortgage encumbering the borrowers’ fee interest in three shadow anchored retail properties totaling 106,336 square feet (the “Rivercrest Portfolio Properties”). Built between 1999 and 2008, the Rivercrest Portfolio Properties range in size from 30,636 square feet to 44,300 square feet. The Rivercrest Portfolio Properties include a diverse and granular rent roll with no tenant occupying more than 13.2% of net rentable area and 17.7% of the underwritten base rent is from tenants that have occupied their space for over ten years. All of the Rivercrest Portfolio Properties are shadow anchored by a Wal-Mart Supercenter and are located in Garner, North Carolina; Villa Rica, Georgia; and Flowood, Mississippi. Additionally, all of the Rivercrest Portfolio Properties are located in close proximity to the central business districts of Raleigh, North Carolina; Atlanta, Georgia; and Jackson, Mississippi.
The Rivercrest Portfolio Properties feature 679 surface parking spaces resulting in a parking ratio of 6.4 spaces per 1,000 square feet of rentable area with individual properties ranging from 5.7 to 7.7 spaces per 1,000 square feet of rentable area. In 2015, the population within a three-mile and five-mile radius of each individual property ranged from 18,228 to 45,695 with an average of 31,611 and 37,630 to 140,293 with an average of 77,616, respectively, while median household income within the same radii ranged from $48,447 to $75,696 with an average of $59,155 and $44,469 to $73,435 with an average of $58,271, respectively. As of dates ranging from May 13, 2015 to June 1, 2015, the Rivercrest Portfolio Properties were 89.5% occupied by 28 tenants (under 32 leases) with individual properties ranging from 82.8% to 100.0% occupancy.
THE INFORMATION IN THIS STRUCTURAL AND COLLATERAL TERM SHEET IS NOT COMPLETE AND MAY BE AMENDED PRIOR TO THE TIME OF SALE. THIS TERM SHEET IS NOT AN OFFER TO SELL THESE SECURITIES AND IT IS NOT A SOLICITATION OF AN OFFER TO BUY THESE SECURITIES IN ANY JURISDICTION WHERE THE OFFER OR SALE IS NOT PERMITTED.
| 106 |
| RIVERCREST PORTFOLIO |
Sources and Uses
| Sources | Uses | |||||||
| Original loan amount | $11,662,500 | 80.4% | Purchase price | $14,250,948 | 98.2% | |||
| Sponsor’s new cash contribution | 2,843,412 | 19.6 | Reserves | 101,940 | 0.7 | |||
| Closing costs | 153,024 | 1.1 | ||||||
| Total Sources | $14,505,912 | 100.0% | Total Uses | $14,505,912 | 100.0% |
The following table presents certain information relating to the Rivercrest Portfolio Properties:
| Property Name – Location | Allocated Cut-off Date Principal Balance | % of Portfolio Cut-off Date Principal Balance | Occupancy | Year Built/ Renovated | Net Rentable Area (SF) | Appraised Value | Allocated LTV |
| Shoppes at Garner – Garner, NC | $6,150,000 | 52.7% | 82.8% | 2008/NAP | 44,300 | $8,200,000 | 75.0% |
| Villa Rica Commons – Villa Rica, GA | $3,150,000 | 27.0% | 100.0% | 1999/NAP | 31,400 | $4,200,000 | 75.0% |
| Rankin Center – Flowood, MS | $2,362,500 | 20.3% | 88.3% | 2005/NAP | 30,636 | $3,150,000 | 75.0% |
| Total/Weighted Average | $11,662,500 | 100.0% | 89.5% | 106,336 | $15,550,000 | 75.0% |
The following table presents certain information relating to the tenants at the Rivercrest Portfolio Properties:
Major Tenants
| Tenant Name | Credit Rating (Fitch/Moody’s/ S&P)(1) | Tenant NRSF | % of NRSF | Annual U/W Base Rent PSF | Annual U/W Base Rent | % of Total Annual U/W Base Rent | Sales PSF(2) | Occupancy Cost(2) | Lease Expiration Date | |
| Major Tenants | ||||||||||
| Dollar Tree | NR/Ba2/BB | 14,000 | 13.2% | $10.21 | $143,000 | 11.0% | Various(3) | Various(3) | Various(3) | |
| Fashion Ave.(4) | NR/NR/NR | 7,000 | 6.6% | $12.00 | $84,000 | 6.5% | NAV(5) | NAV(5) | 4/30/2019(6) | |
| Shoe Show | NR/NR/NR | 6,000 | 5.6% | $13.75 | $82,500 | 6.4% | Various(7) | Various(7) | Various(7) | |
| Cato | NR/NR/NR | 7,360 | 6.9% | $10.28 | $75,680 | 5.8% | Various(8) | Various(8) | Various(8) | |
| Gamestop | NR/Ba1/BB+ | 3,700 | 3.5% | $17.60 | $65,125 | 5.0% | NAV(9) | NAV(9) | Various(10) | |
| Total Major Tenants | 38,060 | 35.8% | $11.83 | $450,305 | 34.7% | |||||
| Non-Major Tenants | 57,100 | 53.7% | $14.82 | $845,962 | 65.3% | |||||
| Occupied Collateral Total | 95,160 | 89.5% | $13.62 | $1,296,267 | 100.0% | |||||
| Vacant Space | 11,176 | 10.5% | ||||||||
| Collateral Total | 106,336 | 100.0% | ||||||||
| (1) | Certain ratings are those of the parent company whether or not the parent company guarantees the lease. |
| (2) | Sales PSF and Occupancy Cost are for the year-end 2014 period. Sales PSF and Occupancy Cost for Cato are for the year-end 2013 period. |
| (3) | Dollar Tree leases two spaces: Rankin Center (9,000 square feet, 5.8% U/W base rent, $130 Sales PSF, 10.1% occupancy cost, lease expires 1/31/2021 with one, 5-year renewal option) and Villa Rica Commons (5,000 square feet, 3.9% U/W base rent, lease expires 3/31/2017). The Dollar Tree located at Villa Rica Commons is not required to report sales. |
| (4) | Located at the Shoppes at Garner property. |
| (5) | Fashion Ave. sales are not available. |
| (6) | Fashion Ave. has two, 5-year renewal options. |
| (7) | Shoe Show leases two spaces: Villa Rica Commons (2,500 square feet, 2.0% U/W base rent, lease expires 6/30/2017 with two, 5-year renewal options) and Shoppes at Garner (3,500 square feet, 3.5% U/W base rent, $155 Sales PSF, 12.0% occupancy cost, lease expires 8/31/2018 with two, 5-year renewal options). The Shoe Show located at Villa Rica Commons is currently not required to report sales. |
| (8) | Cato leases two spaces: Rankin Center (4,160 square feet, 3.0% U/W base rent, lease expires 1/31/2016 with three, 5-year renewal options) and Villa Rica Commons (3,200 square feet, 2.2% U/W base rent, $188 Sales PSF, 6.9% occupancy cost, lease expires 1/31/2020). The Cato located at Rankin Center is currently not required to report sales. |
| (9) | Gamestop is not required to report sales. |
| (10) | Gamestop leases two spaces: Rankin Center (2,100 square feet, 2.0% U/W base rent, lease expires 1/31/2017 with one, 2-year renewal option) and Shoppes at Garner (1,600 square feet, 2.4% U/W base rent, lease expires 8/31/2016). |
THE INFORMATION IN THIS STRUCTURAL AND COLLATERAL TERM SHEET IS NOT COMPLETE AND MAY BE AMENDED PRIOR TO THE TIME OF SALE. THIS TERM SHEET IS NOT AN OFFER TO SELL THESE SECURITIES AND IT IS NOT A SOLICITATION OF AN OFFER TO BUY THESE SECURITIES IN ANY JURISDICTION WHERE THE OFFER OR SALE IS NOT PERMITTED.
| 107 |
| RIVERCREST PORTFOLIO |
The following table presents certain information relating to the lease rollover schedule at the Rivercrest Portfolio Properties:
Lease Expiration Schedule(1)(2)
| Year Ending December 31, | No. of Leases Expiring | Expiring NRSF | % of Total NRSF | Cumulative Expiring NRSF | Cumulative % of Total NRSF | Annual U/W Base Rent | Annual U/W Base Rent PSF(3) | |||||||
| MTM | 3 | 6,200 | 5.8% | 6,200 | 5.8% | $81,850 | $13.20 | |||||||
| 2015 | 0 | 0 | 0.0% | 6,200 | 5.8% | $0 | $0.00 | |||||||
| 2016 | 10 | 23,860 | 22.4% | 30,060 | 28.3% | $341,005 | $14.29 | |||||||
| 2017 | 5 | 16,400 | 15.4% | 46,460 | 43.7% | $235,425 | $14.36 | |||||||
| 2018 | 9 | 26,300 | 24.7% | 72,760 | 68.4% | $384,087 | $14.60 | |||||||
| 2019 | 2 | 9,000 | 8.5% | 81,760 | 76.9% | $122,000 | $13.56 | |||||||
| 2020 | 2 | 4,400 | 4.1% | 86,160 | 81.0% | $46,400 | $10.55 | |||||||
| 2021 | 1 | 9,000 | 8.5% | 95,160 | 89.5% | $85,500 | $9.50 | |||||||
| 2022 | 0 | 0 | 0.0% | 95,160 | 89.5% | $0 | $0.00 | |||||||
| 2023 | 0 | 0 | 0.0% | 95,160 | 89.5% | $0 | $0.00 | |||||||
| 2024 | 0 | 0 | 0.0% | 95,160 | 89.5% | $0 | $0.00 | |||||||
| 2025 | 0 | 0 | 0.0% | 95,160 | 89.5% | $0 | $0.00 | |||||||
| Thereafter | 0 | 0 | 0.0% | 95,160 | 89.5% | $0 | $0.00 | |||||||
| Vacant | 0 | 11,176 | 10.5% | 106,336 | 100.0% | $0 | $0.00 | |||||||
| Total/Weighted Average | 32 | 106,336 | 100.0% | $1,296,267 | $13.62 |
| (1) | Information obtained from the underwritten rent roll. |
| (2) | Certain tenants may have lease termination options that are exercisable prior to the originally stated expiration date of the subject lease and that are not considered in the Lease Expiration Schedule. |
| (3) | Weighted Average Annual U/W Base Rent PSF excludes vacant space. |
The following table presents historical occupancy percentages at the Rivercrest Portfolio Properties:
Historical Occupancy
12/31/2012(1) | 12/31/2013(1) | 12/31/2014(1) | Various(2) | |||
| NAV | NAV | NAV | 89.5% |
| (1) | Historical occupancy is not available, as the sponsors acquired the Rivercrest Portfolio Properties between January 2015 and April 2015 and historical information was not provided by the seller. |
| (2) | Information obtained from the underwritten rent roll. Occupancy presented is as of dates ranging from May 13, 2015 to June 1, 2015. |
Operating History and Underwritten Net Cash Flow. The following table presents certain information relating to the historical operating performance and underwritten net cash flow at the Rivercrest Portfolio Properties:
Cash Flow Analysis(1)
| 2013 | 2014 | U/W | % of U/W Effective Gross Income | U/W $ per SF | ||||||
| Base Rent | $1,433,230 | $1,286,597 | $1,296,267 | 83.9% | $12.19 | |||||
| Grossed Up Vacant Space | 0 | 0 | 182,616 | 11.8 | 1.72 | |||||
| Total Reimbursables | 258,103 | 227,780 | 266,754 | 17.3 | 2.51 | |||||
| Other Income | 842 | 257 | 1,500 | 0.1 | 0.01 | |||||
| Less Vacancy & Credit Loss | 0 | 0 | (201,244)(2) | (13.0) | (1.89) | |||||
| Effective Gross Income | $1,692,175 | $1,514,634 | $1,545,893 | 100.0% | $14.54 | |||||
| Total Operating Expenses | $464,062 | $422,694 | $391,304 | 25.3% | $3.68 | |||||
| Net Operating Income | $1,228,113 | $1,091,940 | $1,154,588 | 74.7% | $10.86 | |||||
| TI/LC | 0 | 0 | 61,836 | 4.0 | 0.58 | |||||
| Replacement Reserves | 0 | 0 | 41,400 | 2.7 | 0.39 | |||||
| Net Cash Flow | $1,228,113 | $1,091,940 | $1,051,352 | 68.0% | $9.89 | |||||
| NOI DSCR | 1.77x | 1.58x | 1.67x | |||||||
| NCF DSCR | 1.77x | 1.58x | 1.52x | |||||||
| NOI DY | 10.5% | 9.4% | 9.9% | |||||||
| NCF DY | 10.5% | 9.4% | 9.0% |
| (1) | Trailing-12 month cash flows are not available, as the sponsor acquired the Rivercrest Portfolio Properties between January 2015 and April 2015 and certain historical information was not provided by the seller. |
| (2) | The underwritten economic vacancy is 13.6%. The Rivercrest Portfolio Properties were 89.5% physically occupied as of dates ranging from May 13, 2015 to June 1, 2015. |
THE INFORMATION IN THIS STRUCTURAL AND COLLATERAL TERM SHEET IS NOT COMPLETE AND MAY BE AMENDED PRIOR TO THE TIME OF SALE. THIS TERM SHEET IS NOT AN OFFER TO SELL THESE SECURITIES AND IT IS NOT A SOLICITATION OF AN OFFER TO BUY THESE SECURITIES IN ANY JURISDICTION WHERE THE OFFER OR SALE IS NOT PERMITTED.
| 108 |
(THIS PAGE INTENTIONALLY LEFT BLANK)
THE INFORMATION IN THIS STRUCTURAL AND COLLATERAL TERM SHEET IS NOT COMPLETE AND MAY BE AMENDED PRIOR TO THE TIME OF SALE. THIS TERM SHEET IS NOT AN OFFER TO SELL THESE SECURITIES AND IT IS NOT A SOLICITATION OF AN OFFER TO BUY THESE SECURITIES IN ANY JURISDICTION WHERE THE OFFER OR SALE IS NOT PERMITTED.
| 109 |
| No. 12 – Westgate MHC | ||||||
| Loan Information | Property Information | |||||
| Mortgage Loan Seller: | C-III Commercial Mortgage LLC | Single Asset/Portfolio: | Single Asset | |||
| Credit Assessment (Fitch/Moody’s/Morningstar): | NR/NR/NR | Property Type: | Manufactured Housing Community | |||
| Original Principal Balance: | $11,450,000 | Specific Property Type: | Manufactured Housing Community | |||
| Cut-off Date Principal Balance: | $11,450,000 | Location: | Largo, FL | |||
| % of Initial Pool Balance: | 1.5% | Size: | 263 pads | |||
| Loan Purpose: | Refinance | Cut-off Date Principal Balance Per Pad: | $43,536 | |||
| Borrower Name: | Westgate Park Corp. | Year Built/Renovated: | 1972/NAP | |||
| Sponsor: | Nicole A. Weis | Title Vesting: | Fee | |||
| Mortgage Rate: | 4.760% | Property Manager: | Self-managed | |||
| Note Date: | July 1, 2015 | 3rd Most Recent Occupancy (As of): | 81.0% (12/31/2012) | |||
| Anticipated Repayment Date: | NAP | 2nd Most Recent Occupancy (As of): | 82.0% (12/31/2013) | |||
| Maturity Date: | July 1, 2025 | Most Recent Occupancy (As of): | 82.0% (12/31/2014) | |||
| IO Period: | 24 months | Current Occupancy (As of): | 83.3% (5/1/2015) | |||
| Loan Term (Original): | 120 months | |||||
| Seasoning: | 1 month | Underwriting and Financial Information: | ||||
| Amortization Term (Original): | 360 months | |||||
| Loan Amortization Type: | Interest-only, Amortizing Balloon | 3rd Most Recent NOI (As of): | $939,683 (12/31/2013) | |||
| Interest Accrual Method: | Actual/360 | 2nd Most Recent NOI (As of): | $942,881 (12/31/2014) | |||
| Call Protection: | L(25),D(92),O(3) | Most Recent NOI (As of): | $926,538 (TTM 5/31/2015) | |||
| Lockbox Type: | Springing (Without Established Account) | |||||
| Additional Debt: | None | |||||
| Additional Debt Type: | NAP | U/W Revenues: | $1,455,978 | |||
| U/W Expenses: | $546,015 | |||||
| U/W NOI: | $909,963 | |||||
| U/W NCF: | $896,813 | |||||
| U/W NOI DSCR: | 1.27x | |||||
| Escrows and Reserves: | U/W NCF DSCR: | 1.25x | ||||
| U/W NOI Debt Yield: | 7.9% | |||||
| Type: | Initial | Monthly | Cap (If Any) | U/W NCF Debt Yield: | 7.8% | |
| Taxes | $85,711 | $10,714 | NAP | As-Is Appraised Value: | $16,050,000 | |
| Insurance | $12,564 | $1,571 | NAP | As-Is Appraisal Valuation Date: | May 22, 2015 | |
| Replacement Reserves | $1,096 | $1,096 | NAP | Cut-off Date LTV Ratio: | 71.3% | |
| Liquidity Reserve(1) | $200,000 | $0 | $200,000 | LTV Ratio at Maturity or ARD: | 61.4% | |
| (1) | The Liquidity Reserve may be used for payment of reasonable and appropriate expenses actually incurred by the borrower in connection with the operation and maintenance of the Westgate MHC Property. To the extent the balance of the reserve is less than $200,000 for more than 30 days, the borrower is required to replenish the reserve to $200,000. Upon the Westgate MHC Property achieving a DSCR of at least 1.40x for four consecutive calendar quarters, and provided no event of default has occurred and is continuing, the Liquidity Reserve will be terminated and all funds will be returned to the borrower. |
The Westgate MHC mortgage loan is evidenced by a single promissory note that is secured by a first mortgage encumbering a 263-pad manufactured housing community located in Largo, Florida (the “Westgate MHC Property”), approximately 23 miles west of the Tampa central business district. The Westgate MHC Property is situated on a 30.2-acre site located within Pinellas County in the Tampa Bay metro area. Pinellas County is the most densely developed county in the Tampa Bay metro area. Within a three-mile radius of the Westgate MHC Property, the estimated 2015 population was 102,106 with an estimated average household income of $53,408. Amenities at the Westgate MHC Property include a playground area. The Westgate MHC Property has maintained average occupancy of 82.0% since 2010. As of May 1, 2015, the Westgate MHC Property was 83.3% occupied. As of June 2015, there are 32 homes on site available for purchase and 62 homes on site that are on a lease-to-own program. See “Cash Flow Analysis” section.
THE INFORMATION IN THIS STRUCTURAL AND COLLATERAL TERM SHEET IS NOT COMPLETE AND MAY BE AMENDED PRIOR TO THE TIME OF SALE. THIS TERM SHEET IS NOT AN OFFER TO SELL THESE SECURITIES AND IT IS NOT A SOLICITATION OF AN OFFER TO BUY THESE SECURITIES IN ANY JURISDICTION WHERE THE OFFER OR SALE IS NOT PERMITTED.
| 110 |
| WESTGATE MHC |
Sources and Uses
| Sources | Uses | |||||||
| Original loan amount | $11,450,000 | 100.0% | Loan payoff | $10,560,353 | 92.2% | |||
| Reserves | 299,371 | 2.6 | ||||||
| Closing costs | 90,862 | 0.8 | ||||||
| Return of equity | 499,414 | 4.4 | ||||||
| Total Sources | $11,450,000 | 100.0% | Total Uses | $11,450,000 | 100.0% |
The following table presents historical occupancy percentages at the Westgate MHC Property:
Historical Occupancy
12/31/2012(1) | 12/31/2013(1) | 12/31/2014(1) | 5/1/2015(1) | |||
| 81.0% | 82.0% | 82.0% | 83.3% |
| (1) | Information obtained from the borrower. |
Operating History and Underwritten Net Cash Flow. The following table presents certain information relating to the historical operating performance and the underwritten net cash flow at the Westgate MHC Property:
Cash Flow Analysis
2013 | 2014 | TTM 5/31/2015 | U/W(1) | % of U/W Effective Gross Income | U/W $ per Pad | |||||||
| Base Rent | $1,280,670 | $1,314,761 | $1,295,927 | $1,666,368 | 114.5% | $6,336 | ||||||
| Other Income | 157,761 | 160,109 | 160,051 | 160,051 | 11.0 | 609 | ||||||
| Less Vacancy & Credit Loss | 0 | 0 | 0 | (370,441)(2) | (25.4) | (1,409) | ||||||
| Effective Gross Income | $1,438,431 | $1,474,870 | $1,455,978 | $1,455,978 | 100.0% | $5,536 | ||||||
| Total Operating Expenses | $498,748 | $531,989 | $529,440 | $546,015 | 37.5% | $2,076 | ||||||
| Net Operating Income | $939,683 | $942,881 | $926,538 | $909,963 | 62.5% | $3,460 | ||||||
| Replacement Reserves | 0 | 0 | 0 | 13,150 | 0.9 | 50 | ||||||
| Net Cash Flow | $939,683 | $942,881 | $926,538 | $896,813 | 61.6% | $3,410 | ||||||
| NOI DSCR | 1.31x | 1.31x | 1.29x | 1.27x | ||||||||
| NCF DSCR | 1.31x | 1.31x | 1.29x | 1.25x | ||||||||
| NOI DY | 8.2% | 8.2% | 8.1% | 7.9% | ||||||||
| NCF DY | 8.2% | 8.2% | 8.1% | 7.8% |
| (1) | Underwriting was based on pad rental income only. |
| (2) | The underwritten economic vacancy is 22.2%. The Westgate MHC Property was 83.3% physically occupied as of May 1, 2015. |
THE INFORMATION IN THIS STRUCTURAL AND COLLATERAL TERM SHEET IS NOT COMPLETE AND MAY BE AMENDED PRIOR TO THE TIME OF SALE. THIS TERM SHEET IS NOT AN OFFER TO SELL THESE SECURITIES AND IT IS NOT A SOLICITATION OF AN OFFER TO BUY THESE SECURITIES IN ANY JURISDICTION WHERE THE OFFER OR SALE IS NOT PERMITTED.
| 111 |
| No. 13 - Plaza Diamond Bar | |||||||
| Loan Information | Property Information | ||||||
| Mortgage Loan Seller: | Rialto Mortgage Finance, LLC | Single Asset/Portfolio: | Single Asset | ||||
| Credit Assessment (Fitch/Moody’s/Morningstar): | NR/NR/NR | Property Type: | Mixed Use | ||||
| Original Principal Balance: | $11,000,000 | Specific Property Type: | Office/Retail | ||||
| Cut-off Date Principal Balance: | $11,000,000 | Location: | Diamond Bar, CA | ||||
| % of Initial Pool Balance: | 1.5% | Size: | 61,857 SF | ||||
| Loan Purpose: | Refinance | Cut-off Date Principal Balance Per SF: | $177.83 | ||||
| Borrower Name: | Plaza Diamond Bar Partners Holdings, LLC | Year Built/Renovated: | 1980/2007 | ||||
| Sponsors: | Nathaniel Williams; Rodney Freeman | Title Vesting: | Fee | ||||
| Mortgage Rate: | 4.750% | Property Manager: | Self-managed | ||||
| Note Date: | July 8, 2015 | 3rd Most Recent Occupancy (As of): | 98.4% (12/31/2012) | ||||
| Anticipated Repayment Date: | NAP | 2nd Most Recent Occupancy (As of): | 93.2% (12/31/2013) | ||||
| Maturity Date: | July 6, 2025 | Most Recent Occupancy (As of)(2): | 81.8% (12/31/2014) | ||||
| IO Period: | 60 months | Current Occupancy (As of): | 93.7% (6/26/2015) | ||||
| Loan Term (Original): | 120 months | ||||||
| Seasoning: | 1 month | Underwriting and Financial Information: | |||||
| Amortization Term (Original): | 360 months | ||||||
| Loan Amortization Type: | Interest-only, Amortizing Balloon | 3rd Most Recent NOI (As of): | $1,133,065 (12/31/2013) | ||||
| Interest Accrual Method: | Actual/360 | 2nd Most Recent NOI (As of): | $947,933 (12/31/2014) | ||||
| Call Protection: | L(25),D(91),O(4) | Most Recent NOI (As of): | $1,016,924 (TTM 4/30/2015) | ||||
| Lockbox Type: | Hard/Springing Cash Management | ||||||
| Additional Debt: | None | ||||||
| Additional Debt Type: | NAP | U/W Revenues: | $1,658,081 | ||||
| U/W Expenses: | $542,519 | ||||||
| U/W NOI: | $1,115,562 | ||||||
| Escrows and Reserves: | U/W NCF: | $1,034,528 | |||||
| U/W NOI DSCR: | 1.62x | ||||||
| Type: | Initial | Monthly | Cap (If Any) | U/W NCF DSCR: | 1.50x | ||
| Taxes: | $40,554 | $9,656 | NAP | U/W NOI Debt Yield: | 10.1% | ||
| Insurance: | $21,855 | $4,163 | NAP | U/W NCF Debt Yield: | 9.4% | ||
| Replacement Reserves: | $0 | $1,289 | NAP | As-Is Appraised Value: | $15,300,000 | ||
| Deferred Maintenance: | $13,688 | $0 | NAP | As-Is Appraisal Valuation Date: | May 1, 2015 | ||
| TI/LC Reserve: | $0 | $5,464 | NAP | Cut-off Date LTV Ratio: | 71.9% | ||
| Other(1): | $1,053,400 | $0 | NAP | LTV Ratio at Maturity or ARD: | 66.1% | ||
| (1) | Other initial reserves include a $1,000,000 reserve for the Nobel University tenant which executed a lease on May 28, 2015. The Nobel University reserve will be released once (i) the borrower delivers a rent roll certified by the borrower to the lender for the then-current month reflecting that the Plaza Diamond Bar Property has achieved aggregate annual base rents of at least $1,400,000, and (ii) either (a) the borrower delivers an estoppel certificate from Nobel University in form and content reasonably satisfactory and certifying that (1) Nobel University is in full occupancy of its premises with no further termination right, (2) a sum equal to the amount of free rent under the Nobel University lease has been deposited, (3) all tenant improvement allowances have been paid for in accordance with the terms of the Nobel University lease, or (b) the borrower has delivered an estoppel certificate to the lender certified by the borrower in form and content reasonably acceptable to the lender certifying that (1) all tenants on such rent roll are in full occupancy of the premises with no termination rights, (2) a sum equal to the aggregate amount of free rent under the Leases reflected on the rent roll has been deposited with the lender, and (3) all tenant improvements and leasing commissions for which the borrower is obligated have been completed and paid for in accordance with the terms of the leases reflected on such rent roll. Other initial reserves also include $53,400 reserve in the event that the borrower either elects or is required by applicable law to install a sub-slab depressurization system at the property related to a former dry cleaner at the Plaza Diamond Bar Property. |
| (2) | The 2014 occupancy decreased to 81.8% after a tenant occupying 6,354 square feet (10.3% of net rentable area) vacated in March 2014. The space was re-leased to Nobel University in May 2015. |
The Plaza Diamond Bar mortgage loan is evidenced by a single promissory note that is secured by a first mortgage encumbering a mixed-use office/retail property (the “Plaza Diamond Bar Property”) located in Diamond Bar, California, which is approximately 18 miles north of the Santa Ana central business district. The Plaza Diamond Bar Property is situated on 3.8 acres and was constructed from 1980-1981. The Plaza Diamond Bar Property is comprised of four, one- and two-story buildings, which include 47,270 square feet (76.4% of net rentable area) of office space and 14,587 square feet (23.6% of net rentable area) retail space. As of the June 26, 2015 rent roll the Plaza Diamond Bar Property was 83.4% occupied and 93.7% leased to 33 tenants including the lease of Nobel University. The neighborhood surrounding the Plaza Diamond Bar Property consists of a mixture of commercial, retail, and residential development. The Plaza Diamond Bar Property includes 274 surface parking spaces resulting in a parking ratio of 4.4 parking spaces per 1,000 square feet of net rentable area. The 2015 population within a one-, three-, and five-mile radius of the Plaza Diamond Bar Property is 11,972, 81,083, and 223,992, respectively, while the average household income within the same radii is $104,991, $95,730, and $97,461, respectively.
THE INFORMATION IN THIS STRUCTURAL AND COLLATERAL TERM SHEET IS NOT COMPLETE AND MAY BE AMENDED PRIOR TO THE TIME OF SALE. THIS TERM SHEET IS NOT AN OFFER TO SELL THESE SECURITIES AND IT IS NOT A SOLICITATION OF AN OFFER TO BUY THESE SECURITIES IN ANY JURISDICTION WHERE THE OFFER OR SALE IS NOT PERMITTED.
| 112 |
| PLAZA DIAMOND BAR |
Sources and Uses
| Sources | Uses | |||||||
| Original loan amount | $11,000,000 | 98.6% | Loan payoff(1) | $9,695,552 | 86.9% | |||
| Sponsor’s new cash contribution | 156,824 | 1.4 | Closing costs | 331,776 | 3.0 | |||
| Reserves | 1,129,496 | 10.1 | ||||||
| Total Sources | $11,156,824 | 100.0% | Total Uses | $11,156,824 | 100.0% |
| (1) | The Plaza Diamond Bar Property was previously securitized in the MLMT 2005-CIP1 transaction. |
Major Tenants
| Tenant Name | Credit Rating (Fitch/Moody’s/ S&P) | Tenant NRSF | % of NRSF | Annual U/W Base Rent PSF(1) | Annual U/W Base Rent(1) | % of Total Annual U/W Base Rent | Lease Expiration Date |
| Major Tenants | |||||||
| James Real (S&S Realtors, TLC Financial) | NR/NR/NR | 7,557 | 12.2% | $27.00 | $204,039 | 14.1% | 7/31/2020 |
| Dr. Robin Abari | NR/NR/NR | 3,174 | 5.1% | $42.70 | $135,528 | 9.4% | 5/31/2017 |
| Nobel University(2) | NR/NR/NR | 6,354 | 10.3% | $18.60 | $118,184 | 8.2% | 3/31/2021 |
| All Day, Inc. | NR/NR/NR | 3,379 | 5.5% | $20.39 | $68,911 | 4.8% | 2/28/2020 |
| Total Major Tenants | 20,464 | 33.1% | $25.74 | $526,662 | 36.4% | ||
| Non-Major Tenants | 37,485 | 60.6% | $24.50 | $918,552 | 63.6% | ||
| Occupied Collateral Total | 57,949 | 93.7% | $24.94 | $1,445,215 | 100.0% | ||
| Vacant Space | 3,908 | 6.3% | |||||
| Collateral Total | 61,857 | 100.0% | |||||
| (1) | Annual U/W Base Rent PSF and Annual U/W Base Rent include contractual rent steps through May 2016, totaling $27,976. |
| (2) | Nobel University executed the lease on May 28, 2015 and is not yet in occupancy or paying rent. The lease term will commence the earlier of 90 days from the issuance of a conditional use permit from the City of Diamond Bar or January 1, 2016. If the tenant is unable to obtain a conditional use permit or all required approvals, the tenant or the borrower may terminate the lease. |
The following table presents certain information relating to the lease rollover schedule at the Plaza Diamond Bar Property:
Lease Expiration Schedule(1)(2)
| Year Ending December 31, | No. of Leases Expiring | Expiring NRSF | % of Total NRSF | Cumulative Expiring NRSF | Cumulative % of Total NRSF | Annual U/W Base Rent | Annual U/W Base Rent PSF(3) |
| MTM | 3 | 3,560 | 5.8% | 3,560 | 5.8% | $82,528 | $23.18 |
| 2015 | 5 | 6,270 | 10.1% | 9,830 | 15.9% | $156,180 | $24.91 |
| 2016 | 10 | 13,587 | 22.0% | 23,417 | 37.9% | $320,916 | $23.62 |
| 2017 | 7 | 10,428 | 16.9% | 33,845 | 54.7% | $299,698 | $28.74 |
| 2018 | 0 | 0 | 0.0% | 33,845 | 54.7% | $0 | $0.00 |
| 2019 | 2 | 2,054 | 3.3% | 35,899 | 58.0% | $39,993 | $19.47 |
| 2020 | 3 | 11,636 | 18.8% | 47,535 | 76.8% | $288,238 | $24.77 |
| 2021 | 1 | 6,354 | 10.3% | 53,889 | 87.1% | $118,184 | $18.60 |
| 2022 | 1 | 1,200 | 1.9% | 55,089 | 89.1% | $34,131 | $28.44 |
| 2023 | 0 | 0 | 0.0% | 55,089 | 89.1% | $0 | $0.00 |
| 2024 | 0 | 0 | 0.0% | 55,089 | 89.1% | $0 | $0.00 |
| 2025 | 0 | 0 | 0.0% | 55,089 | 89.1% | $0 | $0.00 |
| Thereafter | 1 | 2,860 | 4.6% | 57,949 | 93.7% | $105,347 | $36.83 |
| Vacant | 0 | 3,908 | 6.3% | 61,857 | 100.0% | $0 | $0.00 |
| Total/Weighted Average | 33 | 61,857 | 100.0% | $1,445,215 | $24.94 |
| (1) | Information obtained from the underwritten rent roll. |
| (2) | Certain tenants may have lease termination options that are exercisable prior to the stated expiration date of the subject lease and that are not considered in the Lease Expiration Schedule. |
| (3) | Weighted Average Annual U/W Base Rent PSF excludes vacant space. |
THE INFORMATION IN THIS STRUCTURAL AND COLLATERAL TERM SHEET IS NOT COMPLETE AND MAY BE AMENDED PRIOR TO THE TIME OF SALE. THIS TERM SHEET IS NOT AN OFFER TO SELL THESE SECURITIES AND IT IS NOT A SOLICITATION OF AN OFFER TO BUY THESE SECURITIES IN ANY JURISDICTION WHERE THE OFFER OR SALE IS NOT PERMITTED.
| 113 |
| PLAZA DIAMOND BAR |
The following table presents historical occupancy percentages at the Plaza Diamond Bar Property:
Historical Occupancy
2012(1) | 2013(1) | 2014(1)(2) | 6/26/2015(3) | |||
| 98.4% | 93.2% | 81.8% | 93.7% |
| (1) | Information obtained from the borrower. |
| (2) | The 2014 occupancy decreased to 81.8% after a tenant occupying 6,354 square feet (10.3% of net rentable area) vacated in March 2014. The space was re-leased to Nobel University in May 2015. |
| (3) | Information obtained from the underwritten rent roll. |
Operating History and Underwritten Net Cash Flow.The following table presents certain information relating to the historical operating performance and underwritten net cash flow at the Plaza Diamond Bar Property:
Cash Flow Analysis
| 2012 | 2013 | 2014(1) | TTM 4/30/2015 | U/W | % of U/W Effective Gross Income | U/W $ per SF | ||||||||
| Base Rent | $1,345,458 | $1,380,408 | $1,224,924 | $1,254,310 | $1,417,238 | 85.5% | $22.91 | |||||||
| Rent Steps | 0 | 0 | 0 | 0 | 27,976 | 1.7 | 0.45 | |||||||
| Grossed Up Vacant Space | 0 | 0 | 0 | 0 | 92,296 | 5.6 | 1.49 | |||||||
| Total Reimbursables | 192,011 | 251,507 | 212,011 | 222,981 | 223,007 | 13.4 | 3.61 | |||||||
| Other Income | 20,826 | 28,528 | 13,045 | 25,145 | 20,800 | 1.3 | 0.34 | |||||||
| Less Vacancy & Credit Loss | 0 | (13,917) | 0 | 0 | (123,236)(1) | (7.4) | (1.99) | |||||||
| Effective Gross Income | $1,558,295 | $1,646,526 | $1,449,980 | $1,502,437 | $1,658,081 | 100.0% | $26.81 | |||||||
| Total Operating Expenses | $487,392 | $513,461 | $502,047 | $486,142 | $542,519 | 32.7% | $8.77 | |||||||
| Net Operating Income | $1,070,904 | $1,133,065 | $947,933 | $1,016,294 | $1,115,562 | 67.3% | $18.03 | |||||||
| TI/LC | 0 | 0 | 0 | 0 | 65,570 | 4.0 | 1.06 | |||||||
| Capital Expenditures | 0 | 0 | 0 | 0 | 15,464 | 0.9 | 0.25 | |||||||
| Net Cash Flow | $1,070,904 | $1,133,065 | $947,933 | $1,016,294 | $1,034,528 | 62.4% | $16.72 | |||||||
| NOI DSCR | 1.56x | 1.65x | 1.38x | 1.48x | 1.62x | |||||||||
| NCF DSCR | 1.56x | 1.65x | 1.38x | 1.48x | 1.50x | |||||||||
| NOI DY | 9.7% | 10.3% | 8.6% | 9.2% | 10.1% | |||||||||
| NCF DY | 9.7% | 10.3% | 8.6% | 9.2% | 9.4% |
| (1) | The 2014 occupancy decreased to 81.8% after a tenant occupying 6,354 square feet (10.3% of net rentable area) vacated in March 2014. The space was re-leased to Nobel University in May 2015. |
| (2) | The underwritten economic vacancy is 7.0%. The Plaza Diamond Bar Property was 93.7% leased and 83.4% physically occupied as of June 26, 2015. |
THE INFORMATION IN THIS STRUCTURAL AND COLLATERAL TERM SHEET IS NOT COMPLETE AND MAY BE AMENDED PRIOR TO THE TIME OF SALE. THIS TERM SHEET IS NOT AN OFFER TO SELL THESE SECURITIES AND IT IS NOT A SOLICITATION OF AN OFFER TO BUY THESE SECURITIES IN ANY JURISDICTION WHERE THE OFFER OR SALE IS NOT PERMITTED.
| 114 |
(THIS PAGE INTENTIONALLY LEFT BLANK)
THE INFORMATION IN THIS STRUCTURAL AND COLLATERAL TERM SHEET IS NOT COMPLETE AND MAY BE AMENDED PRIOR TO THE TIME OF SALE. THIS TERM SHEET IS NOT AN OFFER TO SELL THESE SECURITIES AND IT IS NOT A SOLICITATION OF AN OFFER TO BUY THESE SECURITIES IN ANY JURISDICTION WHERE THE OFFER OR SALE IS NOT PERMITTED.
| 115 |
| No. 14 – Sunrise Industrial Park | ||||||
| Loan Information | Property Information | |||||
| Mortgage Loan Seller: | Wells Fargo Bank, National Association | Single Asset/Portfolio: | Single Asset | |||
| Credit Assessment (Fitch/Moody’s/Morningstar): | NR/NR/NR | Property Type: | Industrial | |||
| Original Principal Balance: | $10,850,000 | Specific Property Type: | Flex | |||
| Cut-off Date Principal Balance: | $10,850,000 | Location: | Rancho Cordova, CA | |||
| % of Initial Pool Balance: | 1.5% | Size: | 304,433 SF | |||
| Loan Purpose: | Refinance | Cut-off Date Principal Balance Per SF: | $35.64 | |||
| Borrower Name: | FJM Sunrise Associates SPE, LLC | Year Built/Renovated: | 1982/NAP | |||
| Sponsors: | Mark Pirie; Robert M. Moran, Jr.; The Moran Family Trust | Title Vesting: | Fee | |||
| Mortgage Rate: | 4.410% | Property Manager: | Self-managed | |||
| Note Date: | July 10, 2015 | 3rdMost Recent Occupancy (As of): | 83.0% (12/31/2012) | |||
| Anticipated Repayment Date: | NAP | 2ndMost Recent Occupancy (As of): | 83.3% (12/31/2013) | |||
| Maturity Date: | July 11, 2025 | Most Recent Occupancy (As of): | 81.4% (12/31/2014) | |||
| IO Period: | 60 months | Current Occupancy (As of): | 82.0% (7/8/2015) | |||
| Loan Term (Original): | 120 months | |||||
| Seasoning: | 1 month | Underwriting and Financial Information: | ||||
| Amortization Term (Original): | 360 months | |||||
| Loan Amortization Type: | Interest-only, Amortizing Balloon | 3rdMost Recent NOI (As of): | $1,104,310 (12/31/2013) | |||
| Interest Accrual Method: | Actual/360 | 2ndMost Recent NOI (As of): | $1,130,824 (12/31/2014) | |||
| Call Protection: | L(25),D(91),O(4) | Most Recent NOI (As of): | $1,154,387 (3/31/2015) | |||
| Lockbox Type: | Springing (Without Established Account) | |||||
| Additional Debt: | None | U/W Revenues: | $1,460,086 | |||
| Additional Debt Type: | NAP | U/W Expenses: | $375,694 | |||
| U/W NOI: | $1,084,392 | |||||
| U/W NCF: | $1,009,676 | |||||
| U/W NOI DSCR: | 1.66x | |||||
| Escrows and Reserves: | U/W NCF DSCR: | 1.55x | ||||
| U/W NOI Debt Yield: | 10.0% | |||||
| Type: | Initial | Monthly | Cap (If Any) | U/W NCF Debt Yield: | 9.3% | |
| Taxes | $50,528 | $12,632 | NAP | As-Is Appraised Value: | $15,800,000 | |
| Insurance(1) | $0 | Springing | NAP | As-Is Appraisal Valuation Date: | May 21, 2015 | |
| Replacement Reserves | $0 | $2,537 | $60,887 | Cut-off Date LTV Ratio: | 68.7% | |
| TI/LC Reserve(2) | $0 | $3,689 | $132,819 | LTV Ratio at Maturity or ARD: | 62.7% | |
| (1) | Ongoing monthly reserves for insurance are not required so long as (i) no event of default has occurred and is continuing; (ii) the Sunrise Industrial Park Property is insured by an acceptable blanket insurance policy; and (iii) the borrower provides the lender with evidence of renewal of the insurance policies and timely proof of payment of insurance premiums. |
| (2) | Monthly TI/LC reserves of $3,689 are required until the reserve has reached a cap $132,819. If funds are drawn from the TI/LC reserve, the borrower is required to replenish the reserve with monthly deposits until the reserve has reached the cap of $132,819. In the event the tenant We’re Organized has not renewed its lease agreement three months prior to its lease expiration date of 12/31/2015, the TI/LC monthly reserve requirement will increase to $20,356, or the borrower may deposit $50,000 with the lender in the form of cash or a letter of credit in lieu of the increased monthly reserve requirement. |
The Sunrise Industrial Park mortgage loan is evidenced by a single promissory note that is secured by a first mortgage encumbering the borrower’s fee interest in four industrial flex buildings totaling 304,433 square feet located in Rancho Cordova, California (the “Sunrise Industrial Park Property”), approximately 15.7 miles east of Sacramento, California. The Sunrise Industrial Park Property was constructed between 1982 and 1991, and the buildings contain between 12,800 square feet and 135,456 square feet comprised of approximately 13% office space and 87% warehouse space. Tenancy includes national, regional and local tenants from a wide variety of industries including manufacturing, healthcare and construction. The tenants’ facilities are predominantly used for distribution and warehouse space. The Sunrise Industrial Park Property contains 11 loading docks in total, with clear heights ranging from 18 feet to 24 feet, and is conveniently located 0.9 miles south of U.S. Highway 50, providing east-west access to and from Sacramento. The Sunrise Industrial Park Property features 240 parking spaces resulting in a parking ratio of 0.8 spaces per 1,000 square feet of rentable area. As of July 8, 2015, the Sunrise Industrial Park Property was 82.0% occupied by 16 tenants.
THE INFORMATION IN THIS STRUCTURAL AND COLLATERAL TERM SHEET IS NOT COMPLETE AND MAY BE AMENDED PRIOR TO THE TIME OF SALE. THIS TERM SHEET IS NOT AN OFFER TO SELL THESE SECURITIES AND IT IS NOT A SOLICITATION OF AN OFFER TO BUY THESE SECURITIES IN ANY JURISDICTION WHERE THE OFFER OR SALE IS NOT PERMITTED.
| 116 |
| SUNRISE INDUSTRIAL PARK |
Sources and Uses
| Sources | Uses | |||||||
| Original loan amount | $10,850,000 | 100.0% | Loan payoff | $8,960,684 | 82.6% | |||
| Reserves | 50,528 | 0.5 | ||||||
| Closing costs | 9,001 | 0.1 | ||||||
| Return of equity | 1,829,787 | 16.9% | ||||||
| Total Sources | $10,850,000 | 100.0% | Total Uses | $10,850,000 | 100.0% |
The following table presents certain information relating to the tenants at the Sunrise Industrial Park Property:
Major Tenants
| Tenant Name | Credit Rating (Fitch/Moody’s/ S&P) | Tenant NRSF | % of NRSF | Annual U/W Base Rent PSF(1) | Annual U/W Base Rent(1) | % of Total Annual U/W Base Rent | Lease Expiration Date | ||
| Major Tenants | |||||||||
| We’re Organized | NR/NR/NR | 30,000 | 9.9% | $6.00 | $180,000 | 14.7% | 12/31/2015 | ||
| Healthnet, Inc. | BB+/Ba2/BB | 29,400 | 9.7% | $5.04 | $148,176 | 12.1% | 4/30/2016 | ||
| Mailing Systems Inc. | NR/NR/NR | 24,500 | 8.0% | $4.80 | $117,600 | 9.6% | 6/30/2016 | ||
| Sacramento Bee | NR/NR/NR | 18,000 | 5.9% | $4.79 | $86,304 | 7.0% | 12/31/2015 | ||
| Tony’s Sons Moving & Storage | NR/NR/NR | 17,500 | 5.7% | $4.49 | $78,600 | 6.4% | 8/31/2020 | ||
| Total Major Tenants | 119,400 | 39.2% | $5.11 | $610,680 | 49.8% | ||||
| Non-Major Tenant | 130,296 | 42.8% | $4.73 | $616,367 | 50.2% | ||||
| �� | |||||||||
| Occupied Collateral Total | 249,696 | 82.0% | $4.91 | $1,227,047 | 100.0% | ||||
| Vacant Space | 54,737 | 18.0% | |||||||
| Collateral Total | 304,433 | 100.0% | |||||||
| (1) | Annual U/W Base Rent PSF and Annual U/W Base Rent include contractual rent steps through January 2016 totaling $8,257. |
The following table presents certain information relating to the lease rollover schedule at the Sunrise Industrial Park Property:
Lease Expiration Schedule(1)(2)
| Year Ending December 31, | No. of Leases Expiring | Expiring NRSF | % of Total NRSF | Cumulative Expiring NRSF | Cumulative % of Total NRSF | Annual U/W Base Rent | Annual U/W Base Rent PSF(3) |
| MTM | 1 | 12,611 | 4.1% | 12,611 | 4.1% | $63,559 | $5.04 |
| 2015 | 2 | 48,000 | 15.8% | 60,611 | 19.9% | $266,304 | $5.55 |
| 2016 | 5 | 96,600 | 31.7% | 157,211 | 51.6% | $477,642 | $4.94 |
| 2017 | 3 | 36,263 | 11.9% | 193,474 | 63.6% | $165,433 | $4.56 |
| 2018 | 1 | 10,500 | 3.4% | 203,974 | 67.0% | $46,620 | $4.44 |
| 2019 | 2 | 16,500 | 5.4% | 220,474 | 72.4% | $78,180 | $4.74 |
| 2020 | 2 | 29,222 | 9.6% | 249,696 | 82.0% | $129,309 | $4.43 |
| 2021 | 0 | 0 | 0.0% | 249,696 | 82.0% | $0 | $0.00 |
| 2022 | 0 | 0 | 0.0% | 249,696 | 82.0% | $0 | $0.00 |
| 2023 | 0 | 0 | 0.0% | 249,696 | 82.0% | $0 | $0.00 |
| 2024 | 0 | 0 | 0.0% | 249,696 | 82.0% | $0 | $0.00 |
| 2025 | 0 | 0 | 0.0% | 249,696 | 82.0% | $0 | $0.00 |
| Thereafter | 0 | 0 | 0.0% | 249,696 | 82.0% | $0 | $0.00 |
| Vacant | 0 | 54,737 | 18.0% | 304,433 | 100.0% | $0 | $0.00 |
| Total/Weighted Average | 16 | 304,433 | 100.0% | $1,227,047 | $4.91 |
| (1) | Information obtained from the underwritten rent roll. |
| (2) | Certain tenants may have lease termination options that are exercisable prior to the originally stated expiration date of the subject lease and that are not considered in the Lease Expiration Table. |
| (3) | Weighted Average Annual U/W Base Rent PSF excludes vacant space. |
THE INFORMATION IN THIS STRUCTURAL AND COLLATERAL TERM SHEET IS NOT COMPLETE AND MAY BE AMENDED PRIOR TO THE TIME OF SALE. THIS TERM SHEET IS NOT AN OFFER TO SELL THESE SECURITIES AND IT IS NOT A SOLICITATION OF AN OFFER TO BUY THESE SECURITIES IN ANY JURISDICTION WHERE THE OFFER OR SALE IS NOT PERMITTED.
| 117 |
| SUNRISE INDUSTRIAL PARK |
The following table presents historical occupancy percentages at the Sunrise Industrial Park Property:
Historical Occupancy
| 12/31/2012(1) | 12/31/2013(1) | 12/31/2014(1) | 7/8/2015(2) | |||
| 83.0% | 83.3% | 81.4% | 82.0% |
| (1) | Information obtained from the borrower. |
| (2) | Information obtained from the underwritten rent roll. |
Operating History and Underwritten Net Cash Flow. The following table presents certain information relating to the historical operating performance and the underwritten net cash flow at the Sunrise Industrial Park Property:
Cash Flow Analysis
| 2012 | 2013 | 2014 | TTM 3/31/2015 | U/W | % of U/W Effective Gross Income | U/W $ per SF | |||||||||
| Base Rent | $1,199,625 | $1,242,196 | $1,265,597 | $1,284,592 | $1,480,535(1) | 101.4% | $4.86 | ||||||||
| Total Reimbursables | 221,289 | 215,897 | 238,310 | 239,503 | 233,039 | 16.0 | 0.77 | ||||||||
| Other Income | 6,251 | 16,129 | 24,000 | 21,181 | 0 | 0.0 | 0.00 | ||||||||
| Less Vacancy & Free Rent | 0 | 0 | 0 | 0 | (253,488)(2) | (17.4) | (0.83) | ||||||||
| Effective Gross Income | $1,427,164 | $1,474,222 | $1,527,907 | $1,545,276 | $1,460,086 | 100.0% | $4.80 | ||||||||
| Total Operating Expenses | $401,915 | $369,912 | $397,083 | $390,889 | $375,694 | 25.7% | $1.23 | ||||||||
| Net Operating Income | $1,025,249 | $1,104,310 | $1,130,824 | $1,154,387 | $1,084,392 | 74.3% | $3.56 | ||||||||
| TI/LC | 0 | 0 | 0 | 0 | 44,273 | 3.0 | 0.15 | ||||||||
| Capital Expenditures | 0 | 0 | 0 | 0 | 30,443 | 2.1 | 0.10 | ||||||||
| Net Cash Flow | $1,025,249 | $1,104,310 | $1,130,824 | $1,154,387 | $1,009,676 | 69.2% | $3.32 | ||||||||
| NOI DSCR | 1.57x | 1.69x | 1.73x | 1.77x | 1.66x | ||||||||||
| NCF DSCR | 1.57x | 1.69x | 1.73x | 1.77x | 1.55x | ||||||||||
| NOI DY | 9.4% | 10.2% | 10.4% | 10.6% | 10.0% | ||||||||||
| NCF DY | 9.4% | 10.2% | 10.4% | 10.6% | 9.3% |
| (1) | U/W Base Rent includes contractual rent steps through January 2016 totaling $8,257. |
| (2) | The underwritten economic vacancy is 17.1%. The Sunrise Industrial Park Property was 82.0% physically occupied as of July 8, 2015. |
THE INFORMATION IN THIS STRUCTURAL AND COLLATERAL TERM SHEET IS NOT COMPLETE AND MAY BE AMENDED PRIOR TO THE TIME OF SALE. THIS TERM SHEET IS NOT AN OFFER TO SELL THESE SECURITIES AND IT IS NOT A SOLICITATION OF AN OFFER TO BUY THESE SECURITIES IN ANY JURISDICTION WHERE THE OFFER OR SALE IS NOT PERMITTED.
| 118 |
(THIS PAGE INTENTIONALLY LEFT BLANK)
THE INFORMATION IN THIS STRUCTURAL AND COLLATERAL TERM SHEET IS NOT COMPLETE AND MAY BE AMENDED PRIOR TO THE TIME OF SALE. THIS TERM SHEET IS NOT AN OFFER TO SELL THESE SECURITIES AND IT IS NOT A SOLICITATION OF AN OFFER TO BUY THESE SECURITIES IN ANY JURISDICTION WHERE THE OFFER OR SALE IS NOT PERMITTED.
| 119 |
| No. 15 - Sheridan Professional Centre | |||||||
| Loan Information | Property Information | ||||||
| Mortgage Loan Seller: | Rialto Mortgage Finance, LLC | Single Asset/Portfolio: | Single Asset | ||||
| Credit Assessment (Fitch/Moody’s/Morningstar): | NR/NR/NR | Property Type: | Office | ||||
| Original Principal Balance: | $10,350,000 | Specific Property Type: | Medical | ||||
| Cut-off Date Principal Balance: | $10,325,370 | Location: | Cooper City, FL | ||||
| % of Initial Pool Balance: | 1.4% | Size: | 57,717 SF | ||||
| Loan Purpose: | Refinance | Cut-off Date Principal Balance Per SF: | $178.90 | ||||
| Borrower Name: | Sheridan Professional Centre, Ltd., LLLP | Year Built/Renovated: | 2004/NAP | ||||
| Sponsors: | John C. Halliday III; Gerald T. Herrod | Title Vesting: | Fee | ||||
| Mortgage Rate: | 4.770% | Property Manager: | Self-managed | ||||
| Note Date: | June, 8, 2015 | 3rdMost Recent Occupancy (As of)(2): | 71.6% (12/31/2012) | ||||
| Anticipated Repayment Date: | NAP | 2ndMost Recent Occupancy (As of): | 84.5% (12/31/2013) | ||||
| Maturity Date: | June, 06, 2025 | Most Recent Occupancy (As of): | 90.0% (12/31/2014) | ||||
| IO Period: | NAP | Current Occupancy (As of): | 95.6% (6/1/2015) | ||||
| Loan Term (Original): | 120 months | ||||||
| Seasoning: | 2 months | Underwriting and Financial Information: | |||||
| Amortization Term (Original): | 360 months | ||||||
| Loan Amortization Type: | Amortizing Balloon | 3rdMost Recent NOI (As of): | $962,891 (12/31/2013) | ||||
| Interest Accrual Method: | Actual/360 | 2ndMost Recent NOI (As of): | $1,041,514 (12/31/2014) | ||||
| Call Protection: | L(26),D(90),O(4) | Most Recent NOI (As of): | $1,047,638 (TTM 4/30/2015) | ||||
| Lockbox Type: | Springing (Without Established Account) | ||||||
| Additional Debt: | None | U/W Revenues: | $1,484,664 | ||||
| Additional Debt Type: | NAP | U/W Expenses: | $449,995 | ||||
| U/W NOI: | $1,034,670 | ||||||
| U/W NCF: | $953,637 | ||||||
| Escrows and Reserves: | U/W NOI DSCR: | 1.59x | |||||
| U/W NCF DSCR: | 1.47x | ||||||
| Type: | Initial | Monthly | Cap (If Any) | U/W NOI Debt Yield: | 10.0% | ||
| Taxes: | $143,920 | $17,133 | NAP | U/W NCF Debt Yield: | 9.2% | ||
| Insurance | $9,601 | $4,572 | NAP | As-Is Appraised Value: | $14,000,000 | ||
| Replacement Reserves: | $0 | $962 | NAP | As-Is Appraisal Valuation Date: | February 10, 2015 | ||
| TI/LC Reserve: | $100,000 | $4,167 | $200,000 | Cut-off Date LTV Ratio: | 73.8% | ||
| Other(1): | $200,625 | $0 | NAP | LTV Ratio at Maturity or ARD: | 60.3% | ||
| (1) | Other reserves includes a $200,000 TI/LC reserves, allocated as follows: $100,000 for the Hicks, Porter, Ebenfeld and Stein, P.A.; and $100,000 for Gregory A. Ebenfeld, P.A. Additionally, the Other reserve includes $625 for deferred maintenance. |
| (2) | Five suites (301, 302, 304, 309 and 310) totalling 5,675 square feet (9.8% net rentable area) were offline through most of 2012 due to major renovation of the respective spaces. |
The Sheridan Professional Centre Mortgage Loan is evidenced by a single promissory note that is secured by a first mortgage encumbering an office property (the “Sheridan Professional Centre Property”) located in Cooper City, Florida, approximately 15 miles southwest of the Fort Lauderdale central business district. The Sheridan Professional Centre Property consists of three interconnected buildings, situated on 5.0 acres. As of the June 1, 2015 rent roll, the Sheridan Professional Centre Property was 95.6% occupied. The largest tenant, GC West Properties, LLP (“GC West”), has been in occupancy since April 2005 and currently occupies 12,429 square feet (21.5% of net rentable area) of the Sheridan Professional Centre Property. GC West is fully owned by Physicians Endoscopy, a private ambulatory surgery center development and management company. GC West has sublease agreements with South Broward Endoscopy (7,223 square feet, 12.5% net rentable area) and Gastroenterology Consultants (5,206 square feet, 9.0% net rentable area). South Broward Endoscopy and Gastroenterology Consultants have been in occupancy since April 2005. The subtenants’ leases are coterminous with the GC West lease. The Sheridan Professional Centre is located approximately 4.7 miles from Memorial Regional Hospital. The Sheridan Professional Centre Property includes 262 parking spaces resulting in a parking ratio of 4.5 parking spaces per 1,000 square feet of net rentable area. In 2015, the population within a one-, three-, and five-mile radius of the Sheridan Professional Centre Property is 16,772, 126,094, and 328,944, respectively, while the average household income within the same radii is $98,701, $77,723, and $76,696, respectively.
THE INFORMATION IN THIS STRUCTURAL AND COLLATERAL TERM SHEET IS NOT COMPLETE AND MAY BE AMENDED PRIOR TO THE TIME OF SALE. THIS TERM SHEET IS NOT AN OFFER TO SELL THESE SECURITIES AND IT IS NOT A SOLICITATION OF AN OFFER TO BUY THESE SECURITIES IN ANY JURISDICTION WHERE THE OFFER OR SALE IS NOT PERMITTED.
| 120 |
| SHERIDAN PROFESSIONAL CENTRE |
Sources and Uses
| Sources | Uses | |||||||||
| Original loan amount | $10,350,000 | 100.0% | Loan payoff(1) | $7,887,481 | 76.2 | % | ||||
| Reserves | 454,146 | 4.4 | ||||||||
| Closing costs | 270,410 | 2.6 | ||||||||
| Return of equity | 1,737,963 | 16.8 | ||||||||
| Total Sources | $10,350,000 | 100.0% | Total Uses | $10,350,000 | 100.0 | % |
| (1) | The Sheridan Professional Centre Property was previously securitized in the GCCFC 2005-GG5 transaction. |
Major Tenants
| Tenant Name | Credit Rating (Fitch/Moody’s/ S&P)(1) | Tenant NRSF | % of NRSF | Annual U/W Base Rent PSF(2) | Annual U/W | % of Total Annual U/W Base Rent | Lease Expiration Date | |||||||
| Major Tenants | ||||||||||||||
| GC West Properties, LLP(3) | NR/NR/NR | 12,429 | 21.5% | $21.00 | $261,009 | 24.5% | 4/30/2025 | |||||||
| Renal Life Link | NR/Ba3/BB | 5,675 | 9.8% | $21.00 | $119,175 | 11.2% | 1/31/2020 | |||||||
| Plantation Oper MRI, LLC | NR/NR/NR | 5,524 | 9.6% | $21.00 | $116,004 | 10.9% | 12/31/2019 | |||||||
| Total Major Tenants | 23,628 | 40.9% | $21.00 | $496,188 | 46.7% | |||||||||
| Non-Major Tenants | 31,573 | 54.7% | $17.96 | $567,002 | 53.3% | |||||||||
| Occupied Collateral Total | 55,201 | 95.6% | $19.26 | $1,063,190 | 100.0% | |||||||||
| Vacant Space | 2,516 | 4.4% | ||||||||||||
| Collateral Total | 57,717 | 100.0% | ||||||||||||
| (1) | Certain ratings are those of the parent company whether or not the parent guarantees the lease. |
| (2) | Annual U/W Base Rent PSF and Annual U/W Base Rent include contractual rent steps through June 2016, totaling $20,063. |
| (3) | GC West subleases 7,223 square feet (12.5% of net rentable area) to South Broward Endoscopy and 5,206 square feet (9.0% of net rentable area) to Gastroenterology Consultants. The subtenants’ leases are coterminous with GC West lease. Square footage shown is inclusive of the subleased space. |
The following table presents certain information relating to the lease rollover schedule at the Sheridan Professional Centre Property:
Lease Expiration Schedule(1)(2)
| Year Ending December 31, | No. of Leases Expiring | Expiring NRSF | % of Total NRSF | Cumulative Expiring NRSF | Cumulative % of Total NRSF | Annual U/W Base Rent | Annual U/W Base Rent PSF(3) | |||||||||
| MTM | 2 | 2,762 | 4.8% | 2,762 | 4.8% | $48,349 | $17.50 | |||||||||
| 2015 | 1 | 1,135 | 2.0% | 3,897 | 6.8% | $18,728 | $16.50 | |||||||||
| 2016 | 5 | 7,295 | 12.6% | 11,192 | 19.4% | $120,368 | $16.50 | |||||||||
| 2017 | 3 | 4,150 | 7.2% | 15,342 | 26.6% | $68,475 | $16.50 | |||||||||
| 2018 | 5 | 6,666 | 11.5% | 22,008 | 38.1% | $126,419 | $18.96 | |||||||||
| 2019 | 2 | 7,534 | 13.1% | 29,542 | 51.2% | $158,214 | $21.00 | |||||||||
| 2020 | 1 | 5,675 | 9.8% | 35,217 | 61.0% | $119,175 | $21.00 | |||||||||
| 2021 | 1 | 3,015 | 5.2% | 38,232 | 66.2% | $49,748 | $16.50 | |||||||||
| 2022 | 0 | 0 | 0.0% | 38,232 | 66.2% | $0 | $0.00 | �� | ||||||||
| 2023 | 1 | 4,540 | 7.9% | 42,772 | 74.1% | $92,707 | $20.42 | |||||||||
| 2024 | 0 | 0 | 0.0% | 42,772 | 74.1% | $0 | $0.00 | |||||||||
| 2025 | 1 | 12,429 | 21.5% | 55,201 | 95.6% | $261,009 | $21.00 | |||||||||
| Thereafter | 0 | 0 | 0.0% | 55,201 | 95.6% | $0 | $0.00 | |||||||||
| Vacant | 0 | 2,516 | 4.4% | 57,717 | 100.0% | $0 | $0.00 | |||||||||
| Total/Weighted Average | 22 | 57,717 | 100.0% | $1,063,190 | $19.26 |
| (1) | Information obtained from the underwritten rent roll. |
| (2) | Certain tenants may have lease termination options that are exercisable prior to the stated expiration date of the subject lease and that are not considered in the Lease Expiration Schedule. |
| (3) | Weighted Average Annual U/W Base Rent PSF excludes vacant space. |
THE INFORMATION IN THIS STRUCTURAL AND COLLATERAL TERM SHEET IS NOT COMPLETE AND MAY BE AMENDED PRIOR TO THE TIME OF SALE. THIS TERM SHEET IS NOT AN OFFER TO SELL THESE SECURITIES AND IT IS NOT A SOLICITATION OF AN OFFER TO BUY THESE SECURITIES IN ANY JURISDICTION WHERE THE OFFER OR SALE IS NOT PERMITTED.
| 121 |
| SHERIDAN PROFESSIONAL CENTRE |
The following table presents historical occupancy percentages at the Sheridan Professional Centre Property:
Historical Occupancy
12/31/2012(1)(2) | 12/31/2013(2) | 12/31/2014(2) | 6/1/2015(3) | |||
| 71.6% | 84.5% | 90.0% | 95.6% |
| (1) | Five suites (301, 302, 304, 309 and 310) totaling 5,675 square feet (9.8% net rentable area) were offline through most of 2012 due to major renovation of the respective spaces. |
| (2) | Information obtained from the borrower. |
| (3) | Information obtained from the underwritten rent roll. |
Operating History and Underwritten Net Cash Flow.The following table presents certain information relating to the historical operating performance and Underwritten Net Cash Flow at the Sheridan Professional Centre Property:
Cash Flow Analysis
| 2012(1) | 2013 | 2014 | T12 4/30/2015 | U/W | % of U/W Effective Gross Income | U/W $ per SF | |||||||||||
| Base Rent | $888,736 | $1,023,164 | $1,081,106 | $1,085,593 | $1,105,989 | 74.5 | % | $19.16 | |||||||||
| Rent Steps | 0 | 0 | 0 | 0 | 20,063 | 3.2 | $0.35 | ||||||||||
| Grossed Up Vacant Space | 0 | 0 | 0 | 0 | 47,729 | 1.4 | $0.83 | ||||||||||
| Mark to Market Adjustments(2) | 0 | 0 | 0 | 0 | (30,513) | (2.1 | ) | ($0.53) | |||||||||
| Total Reimbursables | 278,788 | 325,890 | 347,031 | 344,932 | 425,015 | 28.6 | $7.36 | ||||||||||
| Other Income | 6,828 | 1,645 | 3,046 | 2,197 | 3,429 | 0.2 | $0.06 | ||||||||||
| Less Vacancy & Credit Loss | 0 | 0 | 0 | 0 | (87,048)(3) | (5.9 | ) | ($1.51) | |||||||||
| Effective Gross Income | $1,174,352 | $1,350,700 | $1,431,183 | $1,432,722 | $1,484,664 | 100.0 | % | $25.72 | |||||||||
| Total Operating Expenses | $350,738 | $387,809 | $389,669 | $385,084 | $449,995 | 30.3 | % | $7.80 | |||||||||
|
|
|
|
|
|
| |||||||||||
| Net Operating Income | $823,614 | $962,891 | $1,041,514 | $1,047,638 | $1,034,670 | 69.7 | % | $17.93 | |||||||||
| TI/LC | 0 | 0 | 0 | 0 | 69,489 | 4.7 | $1.20 | ||||||||||
| Capital Expenditures | 0 | 0 | 0 | 0 | 11,543 | 0.8 | $0.20 | ||||||||||
| Net Cash Flow | $823,614 | $962,891 | $1,041,514 | $1,047,638 | $953,637 | 64.2 | % | $16.52 | |||||||||
| NOI DSCR | 1.27x | 1.48x | 1.60x | 1.61x | 1.59x | ||||||||||||
| NCF DSCR | 1.27x | 1.48x | 1.60x | 1.61x | 1.47x | ||||||||||||
| NOI DY | 8.0% | 9.3% | 10.1% | 10.1% | 10.0% | ||||||||||||
| NCF DY | 8.0% | 9.3% | 10.1% | 10.1% | 9.2% | ||||||||||||
| (1) | Five suites (301, 302, 304, 309 and 310) totaling 5,675 square feet (9.8% net rentable area) were offline through most of 2012 due to a major renovation of the respective spaces. |
| (2) | Mark to market adjustments were taken for the difference between in-place rent and the appraiser’s concluded rent for the tenant spaces. |
| (3) | The underwritten economic vacancy is 5.6%. The Sheridan Professional Centre Property was 95.6% physically occupied as of June 1, 2015. |
THE INFORMATION IN THIS STRUCTURAL AND COLLATERAL TERM SHEET IS NOT COMPLETE AND MAY BE AMENDED PRIOR TO THE TIME OF SALE. THIS TERM SHEET IS NOT AN OFFER TO SELL THESE SECURITIES AND IT IS NOT A SOLICITATION OF AN OFFER TO BUY THESE SECURITIES IN ANY JURISDICTION WHERE THE OFFER OR SALE IS NOT PERMITTED.
| 122 |
| Wells Fargo Commercial Mortgage Trust 2015-C30 | Transaction Contact Information |
| VI. | Transaction Contact Information |
Questions regarding this Structural and Collateral Term Sheet may be directed to any of the following individuals:
Wells Fargo Securities, LLC
| Brigid Mattingly | Tel. (312) 269-3062 |
| Fax (312) 658-0140 | |
| A.J. Sfarra | Tel. (212) 214-5613 |
| Fax (212) 214-8970 | |
| Alex Wong | Tel. (212) 214-5615 |
| Fax (212) 214-8970 |
THE INFORMATION IN THIS STRUCTURAL AND COLLATERAL TERM SHEET IS NOT COMPLETE AND MAY BE AMENDED PRIOR TO THE TIME OF SALE. THIS TERM SHEET IS NOT AN OFFER TO SELL THESE SECURITIES AND IT IS NOT A SOLICITATION OF AN OFFER TO BUY THESE SECURITIES IN ANY JURISDICTION WHERE THE OFFER OR SALE IS NOT PERMITTED.
| 123 |