Table of Contents
UNITED STATES
SECURITIES AND EXCHANGE COMMISSION
Washington, D.C. 20549
FORMN-CSR
CERTIFIED SHAREHOLDER REPORT OF REGISTERED
MANAGEMENT INVESTMENT COMPANIES
Investment Company Act file number811-23155
Ivy NextShares
(Exact name of registrant as specified in charter)
6300 Lamar Avenue, Overland Park, Kansas 66202
(Address of principal executive offices) (Zip code)
Jennifer K. Dulski
6300 Lamar Avenue
Overland Park, Kansas 66202
(Name and address of agent for service)
Registrant’s telephone number, including area code: (913)236-2000
Date of fiscal year end: June 30
Date of reporting period: June 30, 2019
Table of Contents
| ITEM 1. | REPORTS TO STOCKHOLDERS. |
Table of Contents
 |
Annual Report
JUNE 30, 2019 |
| Ticker | ||||
IVY NEXTSHARES | ||||
| Ivy Focused Energy NextShares | IVENC | |||
| Ivy Focused Growth NextShares | IVFGC | |||
| Ivy Focused Value NextShares | IVFVC | |||
| Listing Exchange: The NASDAQ Stock Market LLC |
| |||
Beginning on January 1, 2021, as permitted by regulations adopted by the U.S. Securities and Exchange Commission (SEC), paper copies of the Funds’ Annual and Semiannual Shareholder Reports no longer will be sent by mail, unless you specifically request paper copies of the reports. Instead, the reports will be made available on the Ivy Investments website (www.ivyinvestments.com), and you will be notified by mail each time a report is posted, and provided with a website link to access the report.
If you have already elected to receive shareholder reports electronically, you will not be affected by this change and you need not take any action. You may elect to receive shareholder reports and other communications from the Funds electronically anytime by contacting your financial intermediary (e.g., a broker-dealer or bank) or, if you are a direct investor, by calling1-888-923-3355 or by enrolling at www.ivyinvestments.com.
You may elect to receive all future reports in paper format free of charge. If you invest through a financial intermediary, you can contact your financial intermediary to request that you continue to receive paper copies of your shareholder reports. If you invest directly with the Funds, you may call1-888-923-3355 to let the Funds know you wish to continue receiving paper copies of your shareholder reports. Your election to receive reports in paper format will apply to all funds held in your account if you invest through your financial intermediary or all funds held with the Fund Complex if you invest directly with the Funds.
IVY INVESTMENTS®refers to the financial services offered by Ivy Distributors, Inc., a FINRA member broker dealer and the distributor of IVY FUNDS® mutual funds, and those financial services offered by its affiliates.
Table of Contents
| CONTENTS | IVY NEXTSHARES |
| 3 | ||||
| 4 | ||||
Management Discussion, Portfolio Highlights and Schedule of Investments: | ||||
| 5 | ||||
| 10 | ||||
| 16 | ||||
| 21 | ||||
| 22 | ||||
| 23 | ||||
| 24 | ||||
| 26 | ||||
| 33 | ||||
| 34 | ||||
| 35 | ||||
| 41 | ||||
| 42 | ||||
| 42 | ||||
| 42 | ||||
| 42 |
This report is submitted for the general information of the shareholders of Ivy NextShares. It is not authorized for distribution to prospective investors in the Funds unless preceded or accompanied by a current Ivy NextShares prospectus, or summary prospectus, and current performance information.
2
Table of Contents
| PRESIDENT’S LETTER | IVY NEXTSHARES |
| JUNE 30, 2019 (UNAUDITED) | |
| Philip J. Sanders, CFA |

Dear Shareholder,
We saw a little bit of everything during the fiscal period. The first quarter of the fiscal year was relatively calm, while we witnessed dramatic market volatility and the worst quarter for U.S. equities since 2011 to end 2018. Equity markets roared back following the sharp correction, with the S&P 500 Index advancing 17% so far in 2019, as of June 30, and every sector posting gains. The rally had apro-cyclical component as information technology, consumer discretionary and industrials delivered the strongest sector returns while energy and health care were the laggards.
The U.S. economy remains relatively healthy and is now in the longest economic expansion in U.S. history despite uncertainty about trade and signs of global weakening. We believe the underlying fundamentals — a robust job market, rising wages and low inflation — support continued growth during the rest of 2019. However, U.S. trade policy remains a wildcard and poses a major threat to the current expansion.
The U.S. Federal Reserve (Fed) has held steady on interest rates thus far in 2019. However, increasing pressures from trade turmoil and uncertainty around the strength of global growth is likely to lead the Fed to become more accommodative, leading to interest rate cuts in the second half of the calendar year.
Emerging markets faced multiple headwinds over the fiscal year, namely a strong dollar, China’s focus on deleveraging and regulation, trade wars, volatile energy prices and increased geopolitical risks. Despite near-term concerns and likely volatility across the global equity market, we believe the long-term fundamentals in emerging markets will continue to offer opportunities. By comparison, U.S. equities broadly have benefitted from a more attractive growth rate, which was the result of tax reform, lower regulatory pressures and repatriation of overseas earnings.
Looking ahead, we believe equities face intensifying headwinds as the pace of global growth slows and trade turmoil lingers. As we examine the investment landscape, we continue to put greater emphasis on the fundamentals and quality of asset classes and sectors. We believe it is important to stay focused on the merits of individual market sectors, industries and companies when making investment decisions. Those fundamentals historically have tended to outweigh external factors such as government policies and regulations. While those can affect
every business and every investor, we think the innovation and management skill within individual companies are the ultimate drivers of long-term stock prices.
Economic Snapshot
| 6/30/2019 | 6/30/2018 | |||||||
S&P 500 Index | 2,941.76 | 2,718.37 | ||||||
MSCI EAFE Index | 1,922.30 | 1,958.64 | ||||||
10-Year Treasury Yield | 2.00% | 2.85% | ||||||
U.S. unemployment rate | 3.7% | 4.0% | ||||||
30-year fixed mortgage rate | 3.73% | 4.55% | ||||||
Oil price per barrel | $ | 58.47 | $ | 74.15 | ||||
Sources: Bloomberg, U.S. Department of Labor, MBA, CME
All government statistics shown are subject to periodic revision. The S&P 500 Index is an unmanaged index that tracks the stocks of 500 primarilylarge-cap U.S. companies. MSCI EAFE Index is an unmanaged index comprised of securities that represent the securities markets in Europe, Australasia and the Far East. It is not possible to invest directly in any of these indexes. Mortgage rates are from BankRate and reflect the overnight national average rate on a conventional30-year fixed loan. Oil prices reflect the market price of West Texas intermediate crude grade.
Respectfully,

Philip J. Sanders, CFA
President
The opinions expressed in this letter are those of the President of the Ivy NextShares Funds and are current only through the end of the period of the report, as stated on the cover. The President’s views are subject to change at any time, based on market and other conditions, and no forecasts can be guaranteed.
| 2019 | ANNUAL REPORT | 3 |
Table of Contents
| ILLUSTRATION OF FUND EXPENSES | IVY NEXTSHARES |
(UNAUDITED)
Expense Example
As a shareholder of a Fund, you incur two types of costs: (1) transaction costs, including brokerage commissions on purchases and sales of fund shares and (2) ongoing costs, including management fees and other Fund expenses. The following table is intended to help you understand your ongoing costs (in dollars) of investing in a Fund and to compare these costs with the ongoing costs of investing in other funds. The example is based on an investment of $1,000 invested at the beginning of the period and held for thesix-month period ended June 30, 2019.
Actual Expenses
The first section in the following table provides information about actual account values and actual expenses for each Fund. You may use the information in this section, together with the amount you invested, to estimate the expenses that you paid over the period. Simply divide your account value by $1,000 (for example, a $7,500 account value divided by $1,000 = 7.5), then multiply the result by the number in the first section under the heading entitled “Expenses Paid During Period” to estimate the expenses you paid on your account during this period.
Hypothetical Example for Comparison Purposes
The second section in the following table provides information about hypothetical account values and hypothetical expenses based on the Fund’s actual expense ratio and an assumed rate of return of five percent per year before expenses, which is not the Fund’s actual return. The hypothetical account values and expenses may not be used to estimate the actual ending account balance or expenses you paid for the period. You may use this information to compare the ongoing costs of investing in the Fund and other funds. To do so, compare this five percent hypothetical example with the five percent hypothetical examples that appear in the shareholder reports of the other funds.
Please note that the expenses shown in the table are meant to highlight your ongoing costs only and do not reflect any transactional costs, such as brokerage commissions paid on purchases and sales of fund shares. Therefore, the second section in the table is useful in comparing ongoing costs only, and will not help you determine the relative total costs of owning different funds. In addition, if these transactional costs were included, your costs would have been higher.
Expenses paid may be impacted by expense reduction arrangements. If those arrangements had not been in place, expenses paid would have been higher. See Note 4 in Notes to Financial Statements for further information.
| Actual(1) | Hypothetical(2) | Annualized Expense Ratio Based on the Six-Month Period | ||||||||||||||||||||||||||
| Fund | Beginning Account Value 12-31-18 | Ending Account Value 6-30-19 | Expenses Paid During Period* | Beginning Account Value 12-31-18 | Ending Account Value 6-30-19 | Expenses Paid During Period* | ||||||||||||||||||||||
Ivy Focused Energy NextShares | $ | 1,000 | $ | 1,092.50 | $ | 4.92 | $ | 1,000 | $ | 1,020.09 | $ | 4.75 | 0.95% | |||||||||||||||
Ivy Focused Growth NextShares | $ | 1,000 | $ | 1,249.60 | $ | 4.39 | $ | 1,000 | $ | 1,020.94 | $ | 3.94 | 0.78% | |||||||||||||||
Ivy Focused Value NextShares | $ | 1,000 | $ | 1,088.10 | $ | 4.07 | $ | 1,000 | $ | 1,020.93 | $ | 3.94 | 0.78% | |||||||||||||||
| * | Fund expenses are equal to the Fund’s annualized expense ratio (provided in the table), multiplied by the average account value over the period, multiplied by 181 days in thesix-month period ended June 30, 2019, and divided by 365. |
| (1) | This section uses the Fund’s actual total return and actual Fund expenses. It is a guide to the actual expenses paid by the Fund in the period. The “Ending Account Value” shown is computed using the Fund’s actual return and the “Expenses Paid During Period” column shows the dollar amount that would have been paid by an investor who started with $1,000 in the Fund. A shareholder may use the information here, together with the dollar amount invested, to estimate the expenses that were paid over the period. For every thousand dollars a shareholder has invested, the expenses are listed in the last column of this section. |
| (2) | This section uses a hypothetical five percent annual return and actual Fund expenses. It helps to compare the Fund’s ongoing costs with other mutual funds. A shareholder can compare the Fund’s ongoing costs by comparing this hypothetical example with the hypothetical examples that appear in shareholder reports of other Funds. |
The above illustrations are based on ongoing costs only and do not include any transactional costs, such as brokerage commissions on purchases and sales of fund shares.
| 4 | ANNUAL REPORT | 2019 |
Table of Contents
| MANAGEMENT DISCUSSION | IVY FOCUSED ENERGY NEXTSHARES |
(UNAUDITED)

David P. Ginther

Michael T. Wolverton
Below, David P. Ginther, CPA, and Michael Wolverton, CFA, portfolio managers, discuss positioning, performance and results of Ivy Focused Energy NextShares for the fiscal year ended June 30, 2019. Mr. Ginther and Mr. Wolverton have managed the Fund since its inception in October 2016. Mr. Ginther has 24 years of industry experience and Mr. Wolverton has 15 years of industry experience.
Fiscal Year Performance
For the 12 Months Ended June 30, 2019 | ||||
Ivy Focused Energy NextShares (at net asset value) | -30.59% | |||
Ivy Focused Energy NextShares (at share price) | -30.57% | |||
Benchmark and Morningstar/Lipper Averages | ||||
S&P 1500 Energy Sector Index | -15.66% | |||
(generally reflects the performance of stocks that represent the energy market) | ||||
Morningstar Equity Energy Category Average | -23.59% | |||
(generally reflects the performance of the universe of funds with similar investment objectives) | ||||
Lipper Natural Resources Funds Universe Average | -19.92% | |||
(generally reflects the performance of the universe of funds with similar investment objectives) | ||||
Please note that Fund returns include applicable fees and expenses while index returns do not include any such fees. The performance discussion below is at net asset value.
Global risks mean volatile year
There were dramatic swings in oil prices during the fiscal year, culminating in a decline in the final quarter because of concerns about rising shale oil production, a slowing global economy and escalation of the U.S.-China trade tension.
Because of strong underlying supply/demand fundamentals, the Organization of Petroleum Exporting Countries (OPEC) early in the fiscal year decided to change its production quotas to begin bringing more supply to the market. Another factor in this decision was the resumption by the U.S. of economic sanctions against Iran that were scheduled to take effect in November 2018. Members of OPEC anticipated a significant reduction of supply when oil exports from Iran were phased out. However, OPEC and the rest of the market were surprised when the U.S. granted waivers for recipients of Iranian oil to continue doing so for another six months through the first quarter of 2019. The Trump Administration then did not further extend waivers during the second quarter of 2019, which would have allowed selected countries to continue buying Iranian crude oil. The administration also threatened penalties for any country trading with Iran.
The combination of acceleration in the U.S. oil supply, increased OPEC supply, waivers for Iranian exports and decelerating global demand led to a steep drop in oil prices in the third quarter of the year. Because of the dramatic negative swing in fundamentals, OPEC reversed course in November 2018 and announced a reduction in supply once again. The production cut was a positive stimulus for the oil market as crude oil prices rebounded significantly higher in the first quarter of 2019. West Texas Intermediate — the U.S. benchmark — was up about 30% and Brent crude oil was up slightly more. In addition, global oil inventories declined in the quarter as demand exceeded supply.
Strong economic growth, rationed supply from OPEC and falling global inventories created a positive backdrop for oil prices to move higher. But late in the fiscal year, Brent crude oil — the international benchmark — was in “backwardation,” meaning the current (spot) price was higher than the futures market price. That condition typically suggests a tight physical oil market. Concerns about deteriorating global macroeconomic sentiment versus a tight physical oil market led to a wide price spread between the Brent crude oil futures and spot oil, and crude oil steadily declined.
Geopolitical risks around the world increased in the final quarter of the fiscal year. Tensions between the U.S. and Iran continued to rise after Iran shot down a U.S. military drone and was accused of being behind attacks on oil tankers in the Straits of Hormuz. Roughly 20% of the world oil supply travels through the Straits every day, raising fears of additional disruptions. Geopolitical risks continued to affect production in Iran, Libya and Venezuela. The OPEC member countries plus Russia agreed during the quarter to extend production cuts through the first quarter of 2020. OPEC indicated it will review the cuts and could extend them again through the end of 2020, depending on global economic growth.
Oil prices pressure energy equities
The Fund had a negative return for the fiscal year and underperformed the returns of its benchmark index and category averages.
| 2019 | ANNUAL REPORT | 5 |
Table of Contents
The Fund’s overweight allocations at the end of the fiscal year of more than 38% of its equity assets in Exploration & Production (E&P) companies and 26% in Oil and Gas Equipment and Services companies were factors in the underperformance. The Fund remained underweight to the integrated oil companies compared to the benchmark. The Fund has maintained a high allocation to what we believe to be quality upstream companies in the E&P and Oil Services industry segments. Such companies generally have outperformed energy sector peers when oil prices have risen — which the portfolio managers still expect in the coming year — but that was a factor in underperformance because of the sharp fall in prices late in the fiscal year.
Key detractors from the Fund’s performance relative to its benchmark during the fiscal year included holdings in Enscoplc-Class A, Chevron Corp., Oasis Petroleum, Inc., Transocean Ltd., Superior Energy Services and Halliburton Co. Enscoplc-Class A, Oasis Petroleum, Inc. and Superior Energy Services no longer were holdings in the Fund as of June 30, 2019.
Holdings in Enterprise Products Partners, Anadarko Petroleum Corp. and Propetro Holding Corp. contributed to the Fund’s relative performance. Anadarko Petroleum Corp. no longer was a holding in the Fund as of June 30, 2019. The Fund also benefitted by not holding several underperforming equities that are benchmark components, including ExxonMobil Corp., Occidental Petroleum Corp. and Conocophillips.
The Fund made no use of derivatives during the reporting period.
The focus of the energy strategy remains on investing in companies that we believe can create value over the full course of the energy cycle. We define those as companies that arelow-cost operators, have strong balance sheets, have the ability to grow profitably and have strong return on capital.
Continue tight oil markets
We expect the oil markets to continue to be tight through 2019 because of draws on inventories and the extension of OPEC’s production cuts into 2020. We think growth in U.S. shale oil production is likely to exceed worldwide oil demand growth for 2019.
The worldwide oil demand growth rate continues to be the greatest risk to oil prices. We believe the rate of growth will slow in the second half of 2019. Demand growth still has been better than the market expected despite the increased tension between U.S. and China over trade issues.
We believe price volatility in the oil markets will continue in 2019. We expect geopolitical tensions in the Middle East to remain high and continue to be a factor in the oil market, with no sign of talks in the future. We nevertheless believe oil demand will continue to grow despite slower global economic growth and the production cuts by OPEC and partner states. We also think the reversal of some of the Iran sanction waivers will help rebalance the world oil market and support oil prices in 2019. We believe OPEC took a positive and necessary step toward rebalancing the world oil market with its production cut decision and think the move will help support prices in 2019.
We think that the U.S. oil rig count is likely to remain flat, as producers show spending discipline even with higher oil prices. Exploration and production companies are seeing more pressure from investors to be more prudent in allocating capital in order to generate better investor returns. This discipline could be tested in the second half of 2019 if oil prices remain in the current range or higher.
Past performance is not a guarantee of future results. The value of the Fund’s shares will change and you could lose money on your investment.
Investing in companies involved in one specified sector may be more risky and volatile than an investment with greater sector diversification. Investing in the energy sector can be riskier than other types of investment activities because of a range of factors, including price fluctuation caused by real and perceived inflationary trends and political developments, and the cost assumed by energy companies in complying with environmental safety regulations. These and other risks are more fully described in the Fund’s prospectus.
The opinions expressed in this report are those of the Fund’s portfolio managers and are current only through the end of the period of the report as stated on the cover. The managers’ views are subject to change at any time based on market and other conditions, and no forecasts can be guaranteed.
The index noted is unmanaged, includes reinvested dividends and does not include fees. One cannot invest directly in an index, nor is an index representative of Ivy Focused Energy NextShares.
| 6 | ANNUAL REPORT | 2019 |
Table of Contents
| PORTFOLIO HIGHLIGHTS | IVY FOCUSED ENERGY NEXTSHARES |
ALL DATA IS AS OF JUNE 30, 2019 (UNAUDITED)
Asset Allocation
Stocks | 97.0% | |||
Energy | 93.9% | |||
Industrials | 3.1% | |||
Liabilities (Net of Cash and Other Assets), and Cash Equivalents+ | 3.0% |
Country Weightings
North America | 88.6% | |||
United States | 84.6% | |||
Canada | 4.0% | |||
Europe | 8.4% | |||
Liabilities (Net of Cash and Other Assets), and Cash Equivalents+ | 3.0% |
Top 10 Equity Holdings
| Company | Country | Sector | Industry | |||
Pioneer Natural Resources Co. | United States | Energy | Oil & Gas Exploration & Production | |||
Continental Resources, Inc. | United States | Energy | Oil & Gas Exploration & Production | |||
Concho Resources, Inc. | United States | Energy | Oil & Gas Exploration & Production | |||
Chevron Corp. | United States | Energy | Integrated Oil & Gas | |||
Enterprise Products Partners L.P. | United States | Energy | Oil & Gas Storage & Transportation | |||
Marathon Petroleum Corp. | United States | Energy | Oil & Gas Refining & Marketing | |||
Parsley Energy, Inc., Class A | United States | Energy | Oil & Gas Exploration & Production | |||
Schlumberger Ltd. | United States | Energy | Oil & Gas Equipment & Services | |||
ProPetro Holding Corp. | United States | Energy | Oil & Gas Equipment & Services | |||
Valero Energy Corp. | United States | Energy | Oil & Gas Refining & Marketing |
See your advisor or www.ivyinvestments.com for more information on the Fund’s most recently published Top 10 Equity Holdings.
| + | Cash equivalents are defined as highly liquid securities with maturities of less than three months. Cash equivalents may include U.S. Government Treasury bills, bank certificates of deposit, bankers’ acceptances, corporate commercial paper, short term investment funds and other money market instruments. |
| 2019 | ANNUAL REPORT | 7 |
Table of Contents
| COMPARISON OF CHANGE IN VALUE OF $10,000 INVESTMENT | IVY FOCUSED ENERGY NEXTSHARES |
(UNAUDITED)
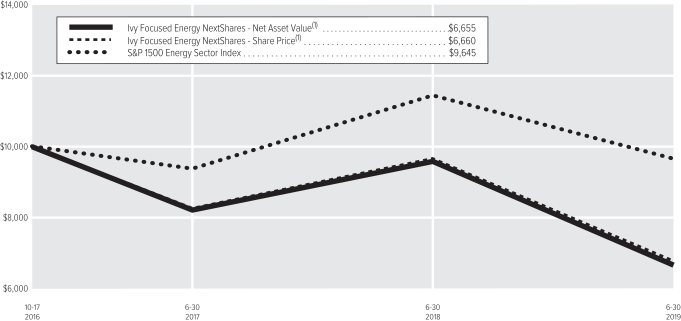
| (1) | The value of the investment in the Fund is impacted by the ongoing expenses of the Fund and assumes reinvestment of dividends and distributions. |
| Average Annual Total Return | ||||||||
| | Net Asset Value | | | Share Price | ||||
1-year period ended6-30-19 | -30.59% | -30.57% | ||||||
5-year period ended6-30-19 | — | — | ||||||
10-year period ended6-30-19 | — | — | ||||||
Since inception of Fund(2) through6-30-19 | -14.00% | -13.97% | ||||||
| (2) | 10-17-16 (the date on which shares were first acquired by shareholders). |
Past performance is not necessarily indicative of future performance. Indexes are unmanaged. The performance graph and table do not reflect the deduction of taxes that a shareholder would pay on Fund distributions or on the redemption of Fund shares. Performance results may include the effect of expense reduction arrangements for some or all of the periods shown. If those arrangements had not been in place, the performance results for those periods would have been lower. The Fund’s performance at share price will differ from its results at net asset value (“NAV”). Share price returns are based on the Fund’s price at the close of market trading. If you trade your shares at another time during the day, your return may differ. For performance as of the most recent month end, including historical trading premiums/discounts relative to NAV, please refer to www.ivyinvestments.com.
| 8 | ANNUAL REPORT | 2019 |
Table of Contents
| SCHEDULE OF INVESTMENTS | IVY FOCUSED ENERGY NEXTSHARES (in thousands) |
JUNE 30, 2019
| COMMON STOCKS | Shares | Value | ||||||
Energy |
| |||||||
Integrated Oil & Gas – 9.3% |
| |||||||
Chevron Corp. | 3 | $ | 311 | |||||
Suncor Energy, Inc. | 8 | 238 | ||||||
|
| |||||||
| 549 | ||||||||
|
| |||||||
Oil & Gas Drilling – 5.6% |
| |||||||
Patterson-UTI Energy, Inc. | 13 | 149 | ||||||
Transocean, Inc. (A) | 28 | 182 | ||||||
|
| |||||||
| 331 | ||||||||
|
| |||||||
Oil & Gas Equipment & Services – 25.2% |
| |||||||
Baker Hughes, Inc. | 10 | 235 | ||||||
Cactus, Inc., Class A (A) | 6 | 184 | ||||||
Core Laboratories N.V. | 3 | 136 | ||||||
FMC Technologies, Inc. | 7 | 176 | ||||||
Halliburton Co. | 10 | 228 | ||||||
ProPetro Holding Corp. (A) | 13 | 265 | ||||||
Schlumberger Ltd. | 7 | 266 | ||||||
|
| |||||||
| 1,490 | ||||||||
|
| |||||||
Oil & Gas Exploration & Production – 36.4% |
| |||||||
Concho Resources, Inc. | 3 | 329 | ||||||
Continental Resources, Inc. (A) | 8 | 338 | ||||||
Diamondback Energy, Inc. | 2 | 246 | ||||||
EOG Resources, Inc. | 3 | 252 | ||||||
Parsley Energy, Inc., Class A (A) | 14 | 267 | ||||||
| COMMON STOCKS (Continued) | Shares | Value | ||||||
Oil & Gas Exploration & Production(Continued) |
| |||||||
Pioneer Natural Resources Co. | 2 | $ | 376 | |||||
Whiting Petroleum Corp. (A) | 7 | 122 | ||||||
WPX Energy, Inc. (A) | 20 | 225 | ||||||
|
| |||||||
| 2,155 | ||||||||
|
| |||||||
Oil & Gas Refining & Marketing – 12.6% |
| |||||||
Marathon Petroleum Corp. | 5 | 271 | ||||||
Phillips 66 | 2 | 214 | ||||||
Valero Energy Corp. | 3 | 263 | ||||||
|
| |||||||
| 748 | ||||||||
|
| |||||||
Oil & Gas Storage & Transportation – 4.8% |
| |||||||
Enterprise Products Partners L.P. | 10 | 286 | ||||||
|
| |||||||
Total Energy – 93.9% |
| 5,559 | ||||||
Industrials |
| |||||||
Industrial Machinery – 3.1% |
| |||||||
Apergy Corp. (A) | 5 | 184 | ||||||
|
| |||||||
Total Industrials – 3.1% |
| 184 | ||||||
TOTAL COMMON STOCKS – 97.0% |
| $ | 5,743 | |||||
(Cost: $7,253) |
| |||||||
| SHORT-TERM SECURITIES | Shares | Value | ||||||
Money Market Funds – 3.5% |
| |||||||
State Street Institutional U.S. Government Money Market Fund 2.310% (B) | 209 | $ | 209 | |||||
|
| |||||||
TOTAL SHORT-TERM SECURITIES – 3.5% |
| $ | 209 | |||||
(Cost: $209) |
| |||||||
TOTAL INVESTMENT SECURITIES – 100.5% |
| $ | 5,952 | |||||
(Cost: $7,462) |
| |||||||
LIABILITIES, NET OF CASH AND OTHER ASSETS – (0.5)% |
| (32 | ) | |||||
NET ASSETS – 100.0% |
| $ | 5,920 | |||||
Notes to Schedule of Investments
| (A) | No dividends were paid during the preceding 12 months. |
| (B) | Rate shown is the annualized7-day yield at June 30, 2019. |
The following table is a summary of the valuation of the Fund’s investments by the fair value hierarchy levels as of June 30, 2019. See Note 3 to the Financial Statements for further information regarding fair value measurement.
| Level 1 | Level 2 | Level 3 | ||||||||||
Assets | ||||||||||||
Investments in Securities | ||||||||||||
Common Stocks | $ | 5,743 | $ | — | $ | — | ||||||
Short-Term Securities | 209 | — | — | |||||||||
Total | $ | 5,952 | $ | — | $ | — | ||||||
| Country Diversification | ||||
(as a % of net assets) |
| |||
United States | 84.6% | |||
Canada | 4.0% | |||
Switzerland | 3.1% | |||
United Kingdom | 3.0% | |||
Netherlands | 2.3% | |||
Other+ | 3.0% | |||
| + | Includes liabilities (net of cash and other assets), and cash equivalents |
See Accompanying Notes to Financial Statements.
| 2019 | ANNUAL REPORT | 9 |
Table of Contents
| MANAGEMENT DISCUSSION | IVY FOCUSED GROWTH NEXTSHARES |
(UNAUDITED)

Bradley M. Klapmeyer
Below, Bradley M. Klapmeyer, CFA, portfolio manager of Ivy Focused Growth NextShares, discusses positioning, performance and results for the fiscal year ended June 30, 2019. Mr. Klapmeyer has managed the Fund since inception in October 2016 and has 19 years of industry experience.
Fiscal Year Performance
For the 12 Months Ended June 30, 2019 | ||||
Ivy Focused Growth NextShares (at net asset value) | 16.54% | |||
Ivy Focused Growth NextShares (at share price) | 16.54% | |||
Benchmark and Morningstar/Lipper Averages | ||||
Russell 1000 Growth Index | 11.56% | |||
(generally reflects the performance of securities that represent thelarge-cap growth market) | ||||
Morningstar Large Growth Category Average | 10.02% | |||
(generally reflects the performance of the universe of funds with similar investment objectives) | ||||
LipperLarge-Cap Growth Funds Universe Average | 10.79% | |||
(generally reflects the performance of the universe of funds with similar investment objectives) | ||||
Please note that Fund returns include applicable fees and expenses while index returns do not include any such fees. The performance discussion below is at net asset value.
The Russell 1000 Growth Index, the Fund’s benchmark, gained a solid 11.56% during the measurement period, which would have indicated the possibility of a solid, uneventful prior 12 months. Unfortunately, that assessment was far from correct as the market went through a series of significant reversals during the measurement period. As a timeline, the benchmark posted strong gains from June 30, 2018 through September 30, 2018, up 9.2%. Those gains were reversed in a significantsell-off of nearly 16% in the following three months, only to reverse again with a 21.5% gain during the next six months.
Sentiment evolved notably from the beginning until the end of the measurement period. During the early months of the fiscal year, economic growth remained strong, fueled from the benefits of personal and corporate tax reform in calendar year 2018. Economic growth likely also experienced an uplift. Global businesses began to pull forward export demand from the U.S. to front run tariffs as trade war rhetoric continued to intensify but remained a peripheral threat to overall economic stability. The Federal Reserve (Fed) comfortably moved interest rates higher in June and September 2018, marking the seventh and eighth increases of the cycle. Importantly, inflation remained within reasonable bounds, giving investors comfort that the Fed had plenty of room for patience on interest rates before the economy overheated. Volatility cooled off and market returns were strong.
The positive sentiment changed significantly during the October to December 2018 timeframe and there was carnage in the markets as proof. The list of concerns during this period began to build into a market panic and were plentiful: Weakening growth in the U.S., eurozone and China — likely stemming from the uncertainty created by the trade war; Brexit risk back to a boil; U.S. government shutdown over a border wall funding impasse; presidential attacks on Fed Chairman Jerome Powell, and the realization that the temporary trade truce was anything but clear. The panic attack was further exacerbated by the Fed moving forward with the ninth interest rate hike of the cycle in December 2018, marking the fourth within that past 12 months. As such, the equity market screamed “policy error” and the markets turned to a dark place … the end of an already too long economic cycle.
In the last reversal, the market came roaring back during the second half of the measurement period. It isn’t difficult to find the factors that generated the optimism, which drove the markets higher. Post what was perceived to be a policy error during the prior period, the Fed moved quickly to ease tightening financial conditions. Actions taken included stepping back from material quantitative tightening (balance sheet reduction) and communicating that interest rates will be on hold for the foreseeable future. Interest rates responded as the yield curve moved lower. Investors perceived the reduction in rates as helpful for solving the problem of tightening financial conditions and by the end of the measurement period were pricing in the likelihood of multiple rates cuts during the coming quarters.
Another reversal was the market stress related to escalating trade war rhetoric. There was building consensus during the final quarter of the fiscal year that China and the U.S. were on a path to a real trade agreement. Companies with foreign exposure, which had a difficult year in calendar year 2018, benefited from this more optimistic sentiment. Ultimately at the end of period the U.S. and China agreed to a “trade truce” that paused further tariff action by either country. Investors welcomed this pause in escalation, but it was largely anticipated by the markets and left the existing tariffs in place.
Overall, the fiscal year closed out with an optimistic tone that corrective action being taken in part by U.S. participants, such as the Fed moving more dovish, but also supportive actions from other central banks and governments around the globe, would ultimately lead to improved global growth over the coming12-month measurement period.
| 10 | ANNUAL REPORT | 2019 |
Table of Contents
Looking at the return by the index, factor performance showed that momentum (price returns, relative strength) and quality (Return on Capital and Return on Equity) factors were key variables in driving performance during the fiscal year. Value, risk and cash deployment were the keyout-of-favor factors, with low valuation stocks and high-dividend yielding stocks generally underperforming the benchmark.
Strategies employed, contributors and detractors
In the12-month period ended June 30, 2019, the Fund outperformed relative to its benchmark. Fund performance was mainly driven by information technology, with additional strong positive contributions from industrials and health care. Despite the strong absolute and relative performance, the communications services sector was a notable detractor of performance during the measurement period.
Information technology stocks, especiallymega-cap technology stocks, once again proved to be fuel for the markets for most of the measurement period. The Fund was overweight the sector but the majority of outperformance was driven by stock selection. Individual security overweight positions in PayPal, Inc., MasterCard, Inc., VeriSign, Inc. and Visa, Inc., contributed meaningfully to performance. An overweight position to software stocks, such as Microsoft Corp., Adobe, Inc. and salesforce.com, Inc., also contributed to relative performance. We think investors were attracted to the strongend-markets in technology, such as digital marketing initiatives, cloud computing andsoftware-as-a-service approaches. The payment stocks continued to post solid transaction volume gains and likely benefited from movement during the second half of the measurement period toward higher quality names.
Another notable contributor to the Fund’s strong relative performance was stock selection in the industrials sector. An overweight position in CoStar Group, Inc. contributed to performance as the company continued to post solid growth in both its core commercial real estate analytics business but also in its strong multi-family/commercial real estate listings offering. Defense contractor, Lockheed Martin, Corp., also contributed to relative performance.
Health care contribution was driven by Zoetis, Inc., which continues to benefit from its slow, steady and stable growth in the animal health sector. The Fund also benefited from underweight exposure to thelarge-cap biotechnology and pharmaceutical sectors, both of which performed poorly during the measurement period.
Despite good overall strong absolute and relative performance, the communications services sector was acall-out detractor from Fund performance. The Fund was overweight Alphabet, Inc., which underperformed, and was underweight Facebook, Inc., which outperformed. The Fund also was negatively impacted by lack of exposure to Disney, which was strong in the last quarter of the measurement period due to investor excitement regarding Disney’s new video streaming service.
Outlook and positioning
Exiting the second quarter of 2019, one could easily be drawn back into a narrative that has worked for most of this decade’s long bull market. The narrative takes a very optimist skew on shaky economic data and is something akin to the beliefs, “Don’t sweat these pullbacks, they are typically good buying opportunities, slow growth is good enough, and although global growth has weakened, China is adding economic support and global central bankers will respond.” This narrative may sound familiar and is in fact the narrative we have leaned into over the past decade as well. We took advantage of multiple buying opportunities during many of the “mini-shocks” through the years. And yes, many ultimately proved to be good buying opportunities.
This time around we take issue with returning to this same narrative so quickly. Yes, there are actions in place to address the slowing global growth and address tightening financial conditions in the U.S. However, we believe it is important to take a step back and observe that the slowdowns and subsequent recoveries that occurred during 2013 and 2016 were painted within a backdrop of easy monetary policy conditions and easy global policy. Since then the Fed has instituted nine rate hikes and has stopped the expansion of its balance sheet. These changes are all mechanisms that could lead to tightening conditions, which we believe have yet to be fully digested and should result in continued slowing in the back half of 2019.
We foresee earnings risk and negative revisions ahead. There are some who believe bad economic news is good for the market because it will bring with it central bank intervention. We believe this thinking is a bit premature, so we are positioned more for the slowing than any rebound that might follow. One must stop to consider, “are global rates moving to ‘dovish’ territory to increase the odds of accelerating growth, or have global rates moved ‘dovish’ because the downside risk to growth was materially increasing? Are things likely to accelerate, or just not get as nasty?”
In our view, investors seem comfortable with current trade tensions, believing the disputes will amicably resolve themselves (with time). They seem to have gotten used to the trade war rhetoric and the “on again, off again” threats. And while two large economies threatening each other with growth-halting tariffs is now the new normal, it still worries us. Others believe the Trump administration will seek a resolution to the trade disputes only when the equity market retreats. Whatever the rationale, it seems investors have generally priced in a positive outcome for the trade dispute.
| 2019 | ANNUAL REPORT | 11 |
Table of Contents
Investor complacency is surprising given the economic headwinds. Global manufacturing data, for example, has moved into contraction territory. Companies are reassessing how and when to reposition their assets, leading to slowdown in business investment spending. As we have noted before, companies will likely struggle to build long-range investment plans if the rules of engagement for global trade are in flux and are changed by social posts. We believe this situation will continue to impair corporate investment and challenge the long-term margins of manufacturing companies.
We are eyeing risky assets, as we believe the next round of negative revisions may present opportunities in more risky assets. However, we have a very high hurdle for taking on additional risk, either cyclical or economic. We require companies with higher cyclical risk to have a strong margin profile and outstanding through-cycle cash flow generation. We also require these companies to have strong economic models, as revealed by our proprietary fundamental research, a unique aspect to the businesses that protects their through-cycle competitive position and asset returns. With these riskier assets we also require valuations that offer downside protection.
For the time being, we believe investors will remain favorable to the high-quality growth names and the overall growth category as they find fewer and fewer attractive holdings due to slowing economic growth. Valuation is always a consideration and a risk control mechanism, but during these periods, valuations can take a backseat to demand for the shrinking list of stable, visible growers. Should economic growth reaccelerate, we could see a sharp rotation back to cyclical growth, but for now we believe the growth scarcity narrative has a little more runway.
As of June 30, 2019, the Fund’s largest positions are Microsoft Corp., Alphabet, Inc., MasterCard, Inc., PayPal, Inc., Amazon.com, Inc., Zoetis, Inc., Adobe, Inc., Visa, Inc., Apple, Inc., and CoStar Group, Inc.
Past performance is not a guarantee of future results. As with any mutual fund, the value of the Fund’s shares will change, and you could lose money on your investment.
Prices of growth stocks may be more sensitive to changes in current or expected earnings than the prices of other stocks. Growth stocks may not perform as well as value stocks or the stock market in general. These and other risks are more fully described in the Fund’s prospectus.
The opinions expressed in this report are those of the Fund’s portfolio manager and are current only through the end of the period of the report as stated on the cover. The portfolio manager’s views are subject to change at any time based on market and other conditions, and no forecasts can be guaranteed.
The index noted is unmanaged, includes reinvested dividends and does not include fees. One cannot invest directly in an index, nor is an index representative of Ivy Focused Growth NextShares.
| 12 | ANNUAL REPORT | 2019 |
Table of Contents
| PORTFOLIO HIGHLIGHTS | IVY FOCUSED GROWTH NEXTSHARES |
ALL DATA IS AS OF JUNE 30, 2019 (UNAUDITED)
Asset Allocation
Stocks | 98.6% | |||
Information Technology | 43.5% | |||
Consumer Discretionary | 14.5% | |||
Communication Services | 11.9% | |||
Industrials | 11.6% | |||
Health Care | 10.6% | |||
Financials | 4.1% | |||
Real Estate | 2.4% | |||
Liabilities (Net of Cash and Other Assets), and Cash Equivalents+ | 1.4% |
Top 10 Equity Holdings
| Company | Sector | Industry | ||
Microsoft Corp. | Information Technology | Systems Software | ||
Alphabet, Inc., Class C | Communication Services | Interactive Media & Services | ||
MasterCard, Inc., Class A | Information Technology | Data Processing & Outsourced Services | ||
PayPal, Inc. | Information Technology | Data Processing & Outsourced Services | ||
Amazon.com, Inc. | Consumer Discretionary | Internet & Direct Marketing Retail | ||
Zoetis, Inc. | Health Care | Pharmaceuticals | ||
Adobe, Inc. | Information Technology | Application Software | ||
Visa, Inc., Class A | Information Technology | Data Processing & Outsourced Services | ||
Apple, Inc. | Information Technology | Technology Hardware, Storage & Peripherals | ||
CoStar Group, Inc. | Industrials | Research & Consulting Services |
See your advisor or www.ivyinvestments.com for more information on the Fund’s most recently published Top 10 Equity Holdings.
| + | Cash equivalents are defined as highly liquid securities with maturities of less than three months. Cash equivalents may include U.S. Government Treasury bills, bank certificates of deposit, bankers’ acceptances, corporate commercial paper, short term investment funds and other money market instruments. |
| 2019 | ANNUAL REPORT | 13 |
Table of Contents
| COMPARISON OF CHANGE IN VALUE OF $10,000 INVESTMENT | IVY FOCUSED GROWTH NEXTSHARES |
(UNAUDITED)
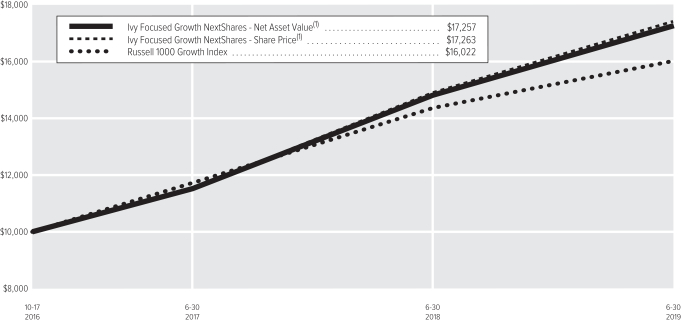
| (1) | The value of the investment in the Fund is impacted by the ongoing expenses of the Fund and assumes reinvestment of dividends and distributions. |
| Average Annual Total Return | ||||||||
| | Net Asset Value | | | Share Price | | |||
1-year period ended6-30-19 | 16.54% | 16.54% | ||||||
5-year period ended6-30-19 | — | — | ||||||
10-year period ended6-30-19 | — | — | ||||||
Since inception of Fund(2) through6-30-19 | 22.38% | 22.40% | ||||||
| (2) | 10-17-16 (the date on which shares were first acquired by shareholders). |
Past performance is not necessarily indicative of future performance. Indexes are unmanaged. The performance graph and table do not reflect the deduction of taxes that a shareholder would pay on Fund distributions or on the redemption of Fund shares. Performance results may include the effect of expense reduction arrangements for some or all of the periods shown. If those arrangements had not been in place, the performance results for those periods would have been lower. The Fund’s performance at share price will differ from its results at net asset value (“NAV”). Share price returns are based on the Fund’s price at the close of market trading. If you trade your shares at another time during the day, your return may differ. For performance as of the most recent month end, including historical trading premiums/discounts relative to NAV, please refer to www.ivyinvestments.com.
| 14 | ANNUAL REPORT | 2019 |
Table of Contents
| SCHEDULE OF INVESTMENTS | IVY FOCUSED GROWTH NEXTSHARES (in thousands) |
JUNE 30, 2019
| COMMON STOCKS | Shares | Value | ||||||
Communication Services |
| |||||||
Interactive Home Entertainment – 2.9% |
| |||||||
Electronic Arts, Inc. (A) | 4 | $ | 401 | |||||
|
| |||||||
Interactive Media & Services – 9.0% |
| |||||||
Alphabet, Inc., Class C (A) | 1 | 882 | ||||||
Facebook, Inc., Class A (A) | 2 | 385 | ||||||
|
| |||||||
| 1,267 | ||||||||
|
| |||||||
Total Communication Services – 11.9% |
| 1,668 | ||||||
Consumer Discretionary |
| |||||||
Apparel, Accessories & Luxury Goods – 2.7% |
| |||||||
V.F. Corp. | 4 | 380 | ||||||
|
| |||||||
Automobile Manufacturers – 3.8% |
| |||||||
Ferrari N.V. | 3 | 535 | ||||||
|
| |||||||
Home Improvement Retail – 2.7% |
| |||||||
Home Depot, Inc. (The) | 2 | 373 | ||||||
|
| |||||||
Internet & Direct Marketing Retail – 5.3% |
| |||||||
Amazon.com, Inc. (A) | — | * | 748 | |||||
|
| |||||||
Total Consumer Discretionary – 14.5% |
| 2,036 | ||||||
Financials |
| |||||||
Financial Exchanges & Data – 4.1% |
| |||||||
CME Group, Inc. | 3 | 579 | ||||||
|
| |||||||
Total Financials – 4.1% |
| 579 | ||||||
Health Care |
| |||||||
Managed Health Care – 2.8% |
| |||||||
UnitedHealth Group, Inc. | 2 | 394 | ||||||
|
| |||||||
| COMMON STOCKS (Continued) | Shares | Value | ||||||
Pharmaceuticals – 7.8% |
| |||||||
Pfizer, Inc. | 8 | $ | 361 | |||||
Zoetis, Inc. | 6 | 728 | ||||||
|
| |||||||
| 1,089 | ||||||||
|
| |||||||
Total Health Care – 10.6% |
| 1,483 | ||||||
Industrials |
| |||||||
Aerospace & Defense – 3.5% |
| |||||||
Lockheed Martin Corp. | 1 | 486 | ||||||
|
| |||||||
Construction Machinery & Heavy Trucks – 1.8% |
| |||||||
Caterpillar, Inc. | 2 | 246 | ||||||
|
| |||||||
Railroads – 2.0% |
| |||||||
Union Pacific Corp. | 2 | 288 | ||||||
|
| |||||||
Research & Consulting Services – 4.3% |
| |||||||
CoStar Group, Inc. (A) | 1 | 605 | ||||||
|
| |||||||
Total Industrials – 11.6% |
| 1,625 | ||||||
Information Technology |
| |||||||
Application Software – 11.2% |
| |||||||
Adobe, Inc. (A) | 2 | 708 | ||||||
Intuit, Inc. | 2 | 585 | ||||||
salesforce.com, Inc. (A) | 2 | 276 | ||||||
|
| |||||||
| 1,569 | ||||||||
|
| |||||||
Data Processing & Outsourced Services – 16.3% |
| |||||||
MasterCard, Inc., Class A | 3 | 829 | ||||||
PayPal, Inc. (A) | 7 | 788 | ||||||
Visa, Inc., Class A | 4 | 671 | ||||||
|
| |||||||
| 2,288 | ||||||||
|
| |||||||
| COMMON STOCKS (Continued) | Shares | Value | ||||||
Internet Services & Infrastructure – 2.5% |
| |||||||
VeriSign, Inc. (A) | 2 | $ | 348 | |||||
|
| |||||||
Systems Software – 8.9% |
| |||||||
Microsoft Corp. | 9 | 1,242 | ||||||
|
| |||||||
Technology Hardware, Storage & Peripherals – 4.6% |
| |||||||
Apple, Inc. | 3 | 653 | ||||||
|
| |||||||
Total Information Technology – 43.5% |
| 6,100 | ||||||
Real Estate |
| |||||||
Specialized REITs – 2.4% |
| |||||||
Equinix, Inc. | 1 | 344 | ||||||
|
| |||||||
Total Real Estate – 2.4% |
| 344 | ||||||
TOTAL COMMON STOCKS – 98.6% |
| $ | 13,835 | |||||
(Cost: $9,218) |
| |||||||
| SHORT-TERM SECURITIES | ||||||||
Money Market Funds – 1.6% |
| |||||||
State Street Institutional U.S. Government Money Market Fund 2.310% (B) | 218 | 218 | ||||||
|
| |||||||
TOTAL SHORT-TERM SECURITIES – 1.6% |
| $ | 218 | |||||
(Cost: $218) |
| |||||||
TOTAL INVESTMENT SECURITIES – 100.2% |
| $ | 14,053 | |||||
(Cost: $9,436) |
| |||||||
LIABILITIES, NET OF CASH AND OTHER ASSETS – (0.2)% |
| (33 | ) | |||||
NET ASSETS – 100.0% |
| $ | 14,020 | |||||
Notes to Schedule of Investments
| * | Not shown due to rounding. |
| (A) | No dividends were paid during the preceding 12 months. |
| (B) | Rate shown is the annualized7-day yield at June 30, 2019. |
The following table is a summary of the valuation of the Fund’s investments by the fair value hierarchy levels as of June 30, 2019. See Note 3 to the Financial Statements for further information regarding fair value measurement.
| Level 1 | Level 2 | Level 3 | ||||||||||
Assets | ||||||||||||
Investments in Securities | ||||||||||||
Common Stocks | $ | 13,835 | $ | — | $ | — | ||||||
Short-Term Securities | 218 | — | — | |||||||||
Total | $ | 14,053 | $ | — | $ | — | ||||||
The following acronym is used throughout this schedule:
REIT = Real Estate Investment Trust
See Accompanying Notes to Financial Statements.
| 2019 | ANNUAL REPORT | 15 |
Table of Contents
| MANAGEMENT DISCUSSION | IVY FOCUSED VALUE NEXTSHARES |
(UNAUDITED)

Matthew T. Norris
Below, Matthew T. Norris, CFA, portfolio manager of Ivy Focused Value NextShares, discusses positioning, performance and results for the fiscal year ended June 30, 2019. He has managed the Fund since its inception in October 2016, and has 27 years of industry experience.
Fiscal Year Performance
For the 12 Months Ended June 30, 2019 | ||||
Ivy Focused Value NextShares (at net asset value) | 1.62% | |||
Ivy Focused Value NextShares (at share price) | 1.63% | |||
Benchmark and Morningstar/Lipper Averages | ||||
Russell 1000 Value Index | 8.46% | |||
(generally reflects the performance of large-company value style stocks) | ||||
Morningstar Large Value Category Average | 5.79% | |||
(generally reflects the performance of the universe of funds with similar investment objectives) | ||||
LipperMulti-Cap Value Funds Universe Average | 3.20% | |||
(generally reflects the performance of the universe of funds with similar investment objectives) | ||||
Please note that Fund returns include applicable fees and expenses while index returns do not include any such fees. The performance discussion below is at net asset value.
Key drivers
Overall, equity markets were up for the measurement period, but experienced considerable volatility along the way. The broader market fell around 15% in the fourth calendar quarter of 2018, before recovering all of the loss in the first calendar quarter of 2019. There are a number of macro issues contributing to recent increased market volatility. About a year ago, the Federal Reserve (Fed) was on a path of gradually increasing interest rates, while in the past three months this has changed to an expectation of interest rate cuts. The economy, while still growing, has slowed; job growth, while still positive, is more tenuous; and inflation isnon-existent. There is also a feeling that this may be as good as it gets, as many of the tailwinds propelling the market over the past few years will have a difficult time continuing. This has led the Fed to the conclusion that an interest rate cut may improve the economic outlook, with many referring to it as an “insurance” cut against a possible recession.
The trade conflict with China has also contributed to market swings. The news flow during the measurement period swung from good to bad and then back to neutral. Trade wars are not good for either country, and while we have not seen many signs of harm to the U.S. economy so far, we feel they are inevitable if the tariffs continue for a long period.
The12-month measurement period was solid if not spectacular for value stocks as the Russell 1000 Value Index (the Fund’s benchmark) was up 8.46% for the timeframe. The Fund had positive returns for the period, but lagged its benchmark on a number of poor stock selections. Style investing continues to favor growth over value. These trends have been in place for some time and will likely only change with two possible factors: an economic recession, or the return of higher inflation/interest rates. Roughly 10 years post the 2008 recession, it seems possible that we are likely due for another; however, that will be very hard to recognize until it begins.
Contributors and detractors
Large impacts to the Fund’s performance came from several individual stocks. On the negative side, Gap, Inc. (no longer a holding) stock fell 43%, as the strength in its Old Navy division could not offset weakness in the company’s branded retail stores. Although the energy sector was an overall contributor to Fund performance, it did hold one of our negative picks, which was refinery PBF Energy, Inc., which fell 14%. This sector was by far the worst performer in the market, with the sector within the benchmark declining more than 14% — only one other sector, materials, was negative. The Fund still holds PBF Energy.
On the more positive side, our financials and information technology investments added notable performance. Broadcom, Ltd. and KLA Corp., both involved in the semiconductor industry, rose 38% and 31%, respectively. In financials, Synchrony Financial, a provider of store brand and private label credit cards, rose 27%. KLA and Synchrony have both been sold as the stocks appreciated to our estimate of full valuation. The Fund is still invested in Broadcom.
| 16 | ANNUAL REPORT | 2019 |
Table of Contents
Outlook
The rest of 2019 could be interesting for investors. We believe the U.S. economy should continue to plug along, but there are worrisome signs of slowing ahead. We feel corporate earnings estimates are likely too high for the second half of 2019. The outcome of the trade tariffs is difficult to predict, with resolution or escalation having major positive/negative effects on the economy and markets. The tightened job market appears to be stable, but consumers have yet to see significant wage growth. Finally, will the Fed pursue interest rate cuts in an attempt to spur faster gross domestic product growth is the big question. We would expect small positive returns from the overall stock market. However, the risk of a downturn suddenly seems greater than at any time in the past few years.
The aforementioned trends of growth versus value and small cap versus large cap will not alter our investment approach. We seek to find quality, growing companies whose stocks are trading below what we consider their intrinsic values. We seek companies that pay a dividend in the upper deciles of yield, have high returns on capital and strong balance sheets.
The Fund continues to emphasize high current income as an investment goal. During the measurement period, the Fund paid 73.89 cents of income to investors. Based on the measurement period ending net asset value (NAV) of 20.27, this equates to a 3.65% yield. We continue to target a high current yield, with expectations of 3.5% to 4%. We feel the approach of combining dividend, valuation and quality factors gives us a short list of possible investment candidates. This short list enables us to focus on these names in detail. We believe keeping the Fund concentrated will allow our stock picking to show through into the final results.
Past performance is not a guarantee of future results. The value of the Fund’s shares will change, and you could lose money on your investment.
Value stocks are stocks of companies that may have experienced adverse business or industry developments, or may be subject to special risks that have caused the stocks to be out of favor and, in the opinion of the Fund’s manager, undervalued. The value of a security believed by the Fund’s manager to be undervalued may never reach what the manager believes to be its full value, or such security’s value may decrease. These and other risks are more fully described in the Fund’s prospectus.
The opinions expressed in this report are those of the Fund’s portfolio manager and are current only through the end of the period of the report as stated on the cover. The manager’s views are subject to change at any time based on market and other conditions, and no forecasts can be guaranteed.
The index noted is unmanaged, includes reinvested dividends and does not include fees. One cannot invest directly in an index, nor is an index representative of the Ivy Focused Value NextShares.
| 2019 | ANNUAL REPORT | 17 |
Table of Contents
| PORTFOLIO HIGHLIGHTS | IVY FOCUSED VALUE NEXTSHARES |
ALL DATA IS AS OF JUNE 30, 2019 (UNAUDITED)
Asset Allocation
Stocks | 99.5% | |||
Financials | 18.5% | |||
Information Technology | 17.3% | |||
Health Care | 17.0% | |||
Energy | 11.0% | |||
Communication Services | 7.8% | |||
Materials | 7.4% | |||
Industrials | 5.1% | |||
Consumer Discretionary | 4.2% | |||
Utilities | 4.1% | |||
Consumer Staples | 4.1% | |||
Real Estate | 3.0% | |||
Liabilities (Net of Cash and Other Assets), and Cash Equivalents+ | 0.5% |
Top 10 Equity Holdings
| Company | Sector | Industry | ||
PBF Energy, Inc., Class A | Energy | Oil & Gas Refining & Marketing | ||
AGNC Investment Corp. | Financials | Mortgage REITs | ||
Broadcom Corp., Class A | Information Technology | Semiconductors | ||
MetLife, Inc. | Financials | Life & Health Insurance | ||
Cummins, Inc. | Industrials | Construction Machinery & Heavy Trucks | ||
Phillips 66 | Energy | Oil & Gas Refining & Marketing | ||
Gilead Sciences, Inc. | Health Care | Biotechnology | ||
General Motors Co. | Consumer Discretionary | Automobile Manufacturers | ||
Walgreen Co. | Consumer Staples | Drug Retail | ||
Cardinal Health, Inc. | Health Care | Health Care Services |
See your advisor or www.ivyinvestments.com for more information on the Fund’s most recently published Top 10 Equity Holdings.
| + | Cash equivalents are defined as highly liquid securities with maturities of less than three months. Cash equivalents may include U.S. Government Treasury bills, bank certificates of deposit, bankers’ acceptances, corporate commercial paper, short term investment funds and other money market instruments. |
| 18 | ANNUAL REPORT | 2019 |
Table of Contents
| COMPARISON OF CHANGE IN VALUE OF $10,000 INVESTMENT | IVY FOCUSED VALUE NEXTSHARES |
(UNAUDITED)
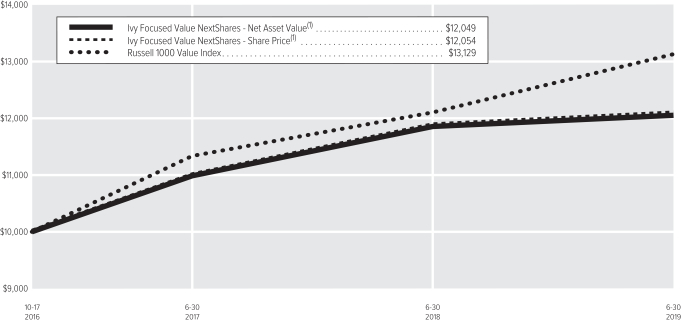
| (1) | The value of the investment in the Fund is impacted by the ongoing expenses of the Fund and assumes reinvestment of dividends and distributions. |
| Average Annual Total Return | ||||||||
| | Net Asset Value | | | Share Price | ||||
1-year period ended6-30-19 | 1.62% | 1.63% | ||||||
5-year period ended6-30-19 | — | — | ||||||
10-year period ended6-30-19 | — | — | ||||||
Since inception of Fund(2) through6-30-19 | 7.14% | 7.16% | ||||||
| (2) | 10-17-16 (the date on which shares were first acquired by shareholders). |
Past performance is not necessarily indicative of future performance. Indexes are unmanaged. The performance graph and table do not reflect the deduction of taxes that a shareholder would pay on Fund distributions or on the redemption of Fund shares. Performance results may include the effect of expense reduction arrangements for some or all of the periods shown. If those arrangements had not been in place, the performance results for those periods would have been lower. The Fund’s performance at share price will differ from its results at net asset value (“NAV”). Share price returns are based on the Fund’s price at the close of market trading. If you trade your shares at another time during the day, your return may differ. For performance as of the most recent month end, including historical trading premiums/discounts relative to NAV, please refer to www.ivyinvestments.com.
| 2019 | ANNUAL REPORT | 19 |
Table of Contents
| SCHEDULE OF INVESTMENTS | IVY FOCUSED VALUE NEXTSHARES (in thousands) |
JUNE 30, 2019
| COMMON STOCKS | Shares | Value | ||||||
Communication Services |
| |||||||
Advertising – 4.0% |
| |||||||
Omnicom Group, Inc. | 4 | $ | 367 | |||||
|
| |||||||
Integrated Telecommunication Services – 3.8% |
| |||||||
Verizon Communications, Inc. | 6 | 348 | ||||||
|
| |||||||
Total Communication Services – 7.8% |
| 715 | ||||||
Consumer Discretionary |
| |||||||
Automobile Manufacturers – 4.2% |
| |||||||
General Motors Co. | 10 | 385 | ||||||
|
| |||||||
Total Consumer Discretionary – 4.2% |
| 385 | ||||||
Consumer Staples |
| |||||||
Drug Retail – 4.1% |
| |||||||
Walgreen Co. | 7 | 378 | ||||||
|
| |||||||
Total Consumer Staples – 4.1% |
| 378 | ||||||
Energy |
| |||||||
Oil & Gas Refining & Marketing – 11.0% |
| |||||||
PBF Energy, Inc., Class A | 18 | 548 | ||||||
Phillips 66 | 5 | 460 | ||||||
|
| |||||||
| 1,008 | ||||||||
|
| |||||||
Total Energy – 11.0% |
| 1,008 | ||||||
Financials |
| |||||||
Life & Health Insurance – 9.1% |
| |||||||
MetLife, Inc. | 9 | 465 | ||||||
Prudential Financial, Inc. | 4 | 364 | ||||||
|
| |||||||
| 829 | ||||||||
|
| |||||||
Mortgage REITs – 5.4% |
| |||||||
AGNC Investment Corp. | 29 | 495 | ||||||
|
| |||||||
| COMMON STOCKS(Continued) | Shares | Value | ||||||
Regional Banks – 4.0% |
| |||||||
Citizens Financial Group, Inc. | 10 | $ | 363 | |||||
|
| |||||||
Total Financials – 18.5% |
| 1,687 | ||||||
Health Care |
| |||||||
Biotechnology – 9.0% |
| |||||||
Amgen, Inc. | 2 | 361 | ||||||
Gilead Sciences, Inc. | 7 | 454 | ||||||
|
| |||||||
| 815 | ||||||||
|
| |||||||
Health Care Services – 4.1% |
| |||||||
Cardinal Health, Inc. | 8 | 374 | ||||||
|
| |||||||
Pharmaceuticals – 3.9% |
| |||||||
Bristol-Myers Squibb Co. | 8 | 359 | ||||||
|
| |||||||
Total Health Care – 17.0% |
| 1,548 | ||||||
Industrials |
| |||||||
Construction Machinery & Heavy Trucks – 5.1% |
| |||||||
Cummins, Inc. | 3 | 463 | ||||||
|
| |||||||
Total Industrials – 5.1% |
| 463 | ||||||
Information Technology |
| |||||||
IT Consulting & Other Services – 4.1% |
| |||||||
International Business Machines Corp. | 3 | 369 | ||||||
|
| |||||||
Semiconductors – 5.3% |
| |||||||
Broadcom Corp., Class A | 2 | 482 | ||||||
|
| |||||||
Technology Hardware, Storage & Peripherals – 7.9% |
| |||||||
Hewlett-Packard Co. | 17 | 360 | ||||||
NetApp, Inc. | 6 | 364 | ||||||
|
| |||||||
| 724 | ||||||||
|
| |||||||
Total Information Technology – 17.3% |
| 1,575 | ||||||
| COMMON STOCKS(Continued) | Shares | Value | ||||||
Materials |
| |||||||
Paper Packaging – 3.8% |
| |||||||
International Paper Co. | 8 | $ | 347 | |||||
|
| |||||||
Specialty Chemicals – 3.6% |
| |||||||
Chemours Co. (The) | 14 | 329 | ||||||
|
| |||||||
Total Materials – 7.4% |
| 676 | ||||||
Real Estate |
| |||||||
Health Care REITs – 3.0% |
| |||||||
Welltower, Inc. | 3 | 271 | ||||||
|
| |||||||
Total Real Estate – 3.0% |
| 271 | ||||||
Utilities |
| |||||||
Independent Power Producers & Energy Traders – 4.1% |
| |||||||
AES Corp. (The) | 22 | 371 | ||||||
|
| |||||||
Total Utilities – 4.1% |
| 371 | ||||||
TOTAL COMMON STOCKS – 99.5% |
| $ | 9,077 | |||||
(Cost: $9,209) | ||||||||
| SHORT-TERM SECURITIES | ||||||||
Money Market Funds – 0.7% |
| |||||||
State Street Institutional U.S. Government Money Market Fund 2.310% (A) | 63 | 63 | ||||||
|
| |||||||
TOTAL SHORT-TERM SECURITIES – 0.7% |
| $ | 63 | |||||
(Cost: $63) | ||||||||
TOTAL INVESTMENT SECURITIES – 100.2% |
| $ | 9,140 | |||||
(Cost: $9,272) | ||||||||
LIABILITIES, NET OF CASH AND OTHER ASSETS – (0.2)% |
| (21 | ) | |||||
NET ASSETS – 100.0% |
| $ | 9,119 | |||||
Notes to Schedule of Investments
| (A) | Rate shown is the annualized7-day yield at June 30, 2019. |
The following table is a summary of the valuation of the Fund’s investments by the fair value hierarchy levels as of June 30, 2019. See Note 3 to the Financial Statements for further information regarding fair value measurement.
| Level 1 | Level 2 | Level 3 | ||||||||||
Assets | ||||||||||||
Investments in Securities | ||||||||||||
Common Stocks | $ | 9,077 | $ | — | $ | — | ||||||
Short-Term Securities | 63 | — | — | |||||||||
Total | $ | 9,140 | $ | — | $ | — | ||||||
The following acronym is used throughout this schedule:
REIT = Real Estate Investment Trust
See Accompanying Notes to Financial Statements.
| 20 | ANNUAL REPORT | 2019 |
Table of Contents
| STATEMENTS OF ASSETS AND LIABILITIES | IVY NEXTSHARES |
AS OF JUNE 30, 2019
| (In thousands, except per share amounts) | Ivy Focused Energy NextShares | Ivy Focused Growth NextShares | Ivy Focused Value NextShares | |||||||||
ASSETS |
| |||||||||||
Investments in unaffiliated securities at value+ | $ | 5,952 | $ | 14,053 | $ | 9,140 | ||||||
Investments at Market Value | 5,952 | 14,053 | 9,140 | |||||||||
Investment securities sold receivable | — | — | 329 | |||||||||
Dividends and interest receivable | 5 | — | * | 22 | ||||||||
Receivable from affiliates | 21 | 27 | 27 | |||||||||
Total Assets | 5,978 | 14,080 | 9,518 | |||||||||
LIABILITIES | ||||||||||||
Investment securities purchased payable | — | — | 340 | |||||||||
Shareholder servicing payable | 2 | 2 | 2 | |||||||||
Accounting services fee payable | 10 | 9 | 10 | |||||||||
Other liabilities | 46 | 49 | 47 | |||||||||
Total Liabilities | 58 | 60 | 399 | |||||||||
Total Net Assets | $ | 5,920 | $ | 14,020 | $ | 9,119 | ||||||
NET ASSETS | ||||||||||||
Capital paid in (shares authorized – unlimited) | $ | 9,333 | $ | 8,854 | $ | 9,513 | ||||||
Accumulated earnings gain (loss) | (3,413 | ) | 5,166 | (394 | ) | |||||||
Total Net Assets | $ | 5,920 | $ | 14,020 | $ | 9,119 | ||||||
CAPITAL SHARES OUTSTANDING | 450 | 430 | 450 | |||||||||
NET ASSET VALUE PER SHARE | $ | 13.16 | $ | 32.60 | $ | 20.27 | ||||||
+COST | ||||||||||||
Investments in unaffiliated securities at cost | $ | 7,462 | $ | 9,436 | $ | 9,272 | ||||||
*Not shown due to rounding.
See Accompanying Notes to Financial Statements.
| 2019 | ANNUAL REPORT | 21 |
Table of Contents
| STATEMENTS OF OPERATIONS | IVY NEXTSHARES |
FOR THE YEAR ENDED JUNE 30, 2019
| (In thousands) | Ivy Focused Energy NextShares | Ivy Focused Growth NextShares | Ivy Focused Value NextShares | |||||||||
INVESTMENT INCOME |
| |||||||||||
Dividends from unaffiliated securities | $ | 92 | $ | 127 | $ | 376 | ||||||
Foreign dividend withholding tax | (2 | ) | — | * | — | |||||||
Interest and amortization from unaffiliated securities | 3 | 6 | 1 | |||||||||
Total Investment Income | 93 | 133 | 377 | |||||||||
EXPENSES | ||||||||||||
Investment management fee | 58 | 96 | 72 | |||||||||
Service fee | 25 | 25 | 25 | |||||||||
Custodian fees | 1 | 2 | 2 | |||||||||
Independent Trustees and Chief Compliance Officer fees | 1 | 1 | 1 | |||||||||
Accounting services fee | 115 | 115 | 115 | |||||||||
Professional fees | 45 | 53 | 49 | |||||||||
Intraday pricing fees | 6 | 6 | 6 | |||||||||
Listing fees | 11 | 11 | 11 | |||||||||
Printing fees | 10 | 11 | 10 | |||||||||
Transfer and dividend disbursing agent fees | 14 | 13 | 14 | |||||||||
Other | 4 | 4 | 4 | |||||||||
Total Expenses | 290 | 337 | 309 | |||||||||
Less: | ||||||||||||
Expenses in excess of limit | (224 | ) | (237 | ) | (233 | ) | ||||||
Total Net Expenses | 66 | 100 | 76 | |||||||||
Net Investment Income | 27 | 33 | 301 | |||||||||
REALIZED AND UNREALIZED GAIN (LOSS) | ||||||||||||
Net realized gain (loss) on: | ||||||||||||
Investments in unaffiliated securities | (1,034 | ) | 865 | (251 | ) | |||||||
Foreign currency exchange transactions | — | * | — | — | ||||||||
Net change in unrealized appreciation (depreciation) on: | ||||||||||||
Investments in unaffiliated securities | (1,603 | ) | 1,082 | 60 | ||||||||
Net Realized and Unrealized Gain (Loss) | (2,637 | ) | 1,947 | (191 | ) | |||||||
Net Increase (Decrease) in Net Assets Resulting from Operations | $ | (2,610 | ) | $ | 1,980 | $ | 110 | |||||
*Not shown due to rounding.
See Accompanying Notes to Financial Statements.
| 22 | ANNUAL REPORT | 2019 |
Table of Contents
| STATEMENTS OF CHANGES IN NET ASSETS | IVY NEXTSHARES |
| Ivy Focused Energy NextShares | Ivy Focused Growth NextShares | Ivy Focused Value NextShares | ||||||||||||||||||||||
| (In thousands) | Year ended 6-30-19 | Year ended 6-30-18 | Year ended 6-30-19 | Year ended 6-30-18 | Year ended 6-30-19 | Year ended 6-30-18 | ||||||||||||||||||
INCREASE (DECREASE) IN NET ASSETS | ||||||||||||||||||||||||
Operations: | ||||||||||||||||||||||||
Net investment income | $ | 27 | $ | 81 | $ | 33 | $ | 26 | $ | 301 | $ | 209 | ||||||||||||
Net realized gain (loss) on investments | (1,034 | ) | (831 | ) | 865 | 397 | (251 | ) | 815 | |||||||||||||||
Net change in unrealized appreciation (depreciation) | (1,603 | ) | 1,973 | 1,082 | 2,391 | 60 | (318 | ) | ||||||||||||||||
Net Increase (Decrease) in Net Assets Resulting from Operations | (2,610 | ) | 1,223 | 1,980 | 2,814 | 110 | 706 | |||||||||||||||||
Distributions to Shareholders From: | ||||||||||||||||||||||||
Net investment income | (82 | ) | (30 | ) | (183 | ) | ||||||||||||||||||
Net realized gains | — | (19 | ) | (114 | ) | |||||||||||||||||||
Accumulated earnings | (3 | ) | (614 | ) | (1,177 | ) | ||||||||||||||||||
(combined net investment income and net realized gains) | ||||||||||||||||||||||||
Total Distributions to Shareholders | (3 | ) | (82 | ) | (614 | ) | (49 | ) | (1,177 | ) | (297 | ) | ||||||||||||
Capital Share Transactions | — | 413 | — | — | — | 582 | ||||||||||||||||||
Net Increase (Decrease) in Net Assets | (2,613 | ) | 1,554 | 1,366 | 2,765 | (1,067 | ) | 991 | ||||||||||||||||
Net Assets, Beginning of Period | 8,533 | 6,979 | 12,654 | 9,889 | 10,186 | 9,195 | ||||||||||||||||||
Net Assets, End of Period | $ | 5,920 | $ | 8,533 | $ | 14,020 | $ | 12,654 | $ | 9,119 | $ | 10,186 | ||||||||||||
Undistributed net investment income | $ | 1 | $ | 13 | $ | 44 | ||||||||||||||||||
See Accompanying Notes to Financial Statements.
| 2019 | ANNUAL REPORT | 23 |
Table of Contents
| FINANCIAL HIGHLIGHTS | IVY NEXTSHARES |
FOR A SHARE OF CAPITAL STOCK OUTSTANDING THROUGHOUT EACH PERIOD
| Net Asset Value, Beginning of Period | Net Investment Income (Loss)(1) | Net Realized and Unrealized Gain (Loss) on Investments | Total from Investment Operations | Distributions From Net Investment Income | Distributions From Net Realized Gains | Total Distributions | ||||||||||||||||||||||
Ivy Focused Energy NextShares |
| |||||||||||||||||||||||||||
Year ended6-30-2019 | $ | 18.96 | $ | 0.07 | $ | (5.86 | ) | $ | (5.79 | ) | $ | (0.01 | ) | $ | — | $ | (0.01 | ) | ||||||||||
Year ended6-30-2018 | 16.42 | 0.19 | 2.54 | 2.73 | (0.19 | ) | — | (0.19 | ) | |||||||||||||||||||
Year ended6-30-2017(4) | 20.00 | (0.01 | ) | (3.57 | ) | (3.58 | ) | — | — | — | ||||||||||||||||||
Ivy Focused Growth NextShares |
| |||||||||||||||||||||||||||
Year ended6-30-2019 | 29.43 | 0.08 | 4.52 | 4.60 | (0.06 | ) | (1.37 | ) | (1.43 | ) | ||||||||||||||||||
Year ended6-30-2018 | 23.00 | 0.07 | 6.48 | 6.55 | (0.07 | ) | (0.05 | ) | (0.12 | ) | ||||||||||||||||||
Year ended6-30-2017(4) | 20.00 | 0.07 | 2.97 | 3.04 | (0.04 | ) | — | (0.04 | ) | |||||||||||||||||||
Ivy Focused Value NextShares |
| |||||||||||||||||||||||||||
Year ended6-30-2019 | 22.64 | 0.67 | (0.42 | ) | 0.25 | (0.74 | ) | (1.88 | ) | (2.62 | ) | |||||||||||||||||
Year ended6-30-2018 | 21.64 | 0.48 | 1.21 | 1.69 | (0.42 | ) | (0.27 | ) | (0.69 | ) | ||||||||||||||||||
Year ended6-30-2017(4) | 20.00 | 0.44 | 1.53 | 1.97 | (0.33 | ) | — | (0.33 | ) | |||||||||||||||||||
| (1) | Based on average weekly shares outstanding. |
| (2) | Based on net asset value. Total returns for periods less than one year are not annualized. |
| (3) | Ratios excluding expense waivers are included only for periods in which the Fund had waived or reimbursed expenses. |
| (4) | For the period from October 17, 2016 (commencement of operations of the Fund) through June 30, 2017. |
| (5) | Annualized. |
| 24 | ANNUAL REPORT | 2019 |
Table of Contents
| Net Asset Value, End of Period | Total Return(2) | Net Assets, End of Period (in millions) | Ratio of Expenses to Average Net Assets Including Expense Waiver | Ratio of Net Investment Income (Loss) to Average Net Assets Including Expense Waiver | Ratio of Expenses to Average Net Assets Excluding Expense Waiver(3) | Ratio of Net Investment Income (Loss) to Average Net Assets Excluding Expense Waiver(3) | Portfolio Turnover Rate | |||||||||||||||||||||||||
Ivy Focused Energy NextShares |
| |||||||||||||||||||||||||||||||
Year ended6-30-2019 | $ | 13.16 | -30.59 | % | $ | 6 | 0.95 | % | 0.41 | % | 4.21 | % | -2.85 | % | 29 | % | ||||||||||||||||
Year ended6-30-2018 | 18.96 | 16.76 | 9 | 0.95 | 1.06 | 3.62 | -1.61 | 44 | ||||||||||||||||||||||||
Year ended6-30-2017(4) | 16.42 | -17.89 | 7 | 0.95 | (5) | -0.09 | (5) | 4.16 | (5) | -3.30 | (5) | 18 | ||||||||||||||||||||
Ivy Focused Growth NextShares |
| |||||||||||||||||||||||||||||||
Year ended6-30-2019 | 32.60 | 16.54 | 14 | 0.78 | 0.25 | 2.62 | -1.59 | 29 | ||||||||||||||||||||||||
Year ended6-30-2018 | 29.43 | 28.52 | 13 | 0.78 | 0.22 | 2.58 | -1.58 | 35 | ||||||||||||||||||||||||
Year ended6-30-2017(4) | 23.00 | 15.21 | 10 | 0.78 | (5) | 0.48 | (5) | 3.61 | (5) | -2.35 | (5) | 25 | ||||||||||||||||||||
Ivy Focused Value NextShares |
| |||||||||||||||||||||||||||||||
Year ended6-30-2019 | 20.27 | 1.62 | 9 | 0.78 | 3.12 | 3.19 | 0.71 | 186 | ||||||||||||||||||||||||
Year ended6-30-2018 | 22.64 | 7.91 | 10 | 0.78 | 2.17 | 2.92 | 0.03 | 189 | ||||||||||||||||||||||||
Year ended6-30-2017(4) | 21.64 | 9.87 | 9 | 0.78 | (5) | 2.95 | (5) | 3.69 | (5) | 0.04 | (5) | 66 | ||||||||||||||||||||
See Accompanying Notes to Financial Statements.
| 2019 | ANNUAL REPORT | 25 |
Table of Contents
| NOTES TO FINANCIAL STATEMENTS | IVY NEXTSHARES |
JUNE 30, 2019
| 1. | ORGANIZATION |
Ivy NextShares, a Delaware statutory trust (the “Trust”), is registered under the Investment Company Act of 1940, as amended (the “1940 Act”). Ivy Focused Energy NextShares, Ivy Focused Growth NextShares and Ivy Focused Value NextShares are classified asnon-diversified under the 1940 Act. Ivy Focused Energy NextShares, Ivy Focused Growth NextShares and Ivy Focused Value NextShares (each, a “Fund”) are the only three series of the Trust. The investment objective(s), policies and risk factors of each Fund are described more fully in the Prospectus and Statement of Additional Information (“SAI”). Each Fund’s investment manager is Ivy Investment Management Company (“IICO” or the “Manager”).
Each Fund is an actively managed exchange-traded product operating pursuant to an order issued by the Securities and Exchange Commission (“SEC”) granting an exemption from certain provisions of the 1940 Act. Individual shares of a NextShares Fund may be purchased and sold only on a national securities exchange or alternative trading system through a broker-dealer that offers NextShares, and may not be directly purchased or redeemed from a NextShares Fund. Trading prices of NextShares are directly linked to the Fund’s next-computed net asset value per share (“NAV”) and will vary from NAV by a market-determined trading cost (a premium or discount to NAV), which may be zero. Buyers and sellers of NextShares will not know the value of their purchases and sales until NAV is determined at the end of the trading day.
| 2. | SIGNIFICANT ACCOUNTING POLICIES |
The following is a summary of significant accounting policies consistently followed by each Fund.
Security Transactions and Related Investment Income.Security transactions are accounted for on the trade date (date the order to buy or sell is executed). Realized gains and losses are calculated on the identified cost basis. Interest income is recorded on the accrual basis and includes paydown gain (loss) and accretion of discounts and amortization of premiums. Dividend income is recorded on theex-dividend date, except certain dividends from foreign securities where theex-dividend date may have passed, which are recorded as soon as the Fund is informed of theex-dividend date. All or a portion of the distributions received from a real estate investment trust or publicly traded partnership may be designated as a reduction of cost of the related investment or realized gain.
Foreign Currency Translation.Each Fund’s accounting records are maintained in U.S. dollars. All assets and liabilities denominated in foreign currencies are translated into U.S. dollars daily, using foreign exchange rates obtained from an independent pricing service approved by the Board of Trustees of the Trust (the “Board”). Purchases and sales of investment securities and accruals of income and expenses are translated at the rate of exchange prevailing on the date of the transaction. For assets and liabilities other than investments in securities, net realized and unrealized gains and losses from foreign currency translation arise from changes in currency exchange rates. Each Fund combines fluctuations from currency exchange rates and fluctuations in value when computing net realized gain (loss) and net change in unrealized appreciation (depreciation) on investments. Foreign exchange rates are typically valued as of the close of the New York Stock Exchange (“NYSE”), normally 4:00 P.M. Eastern time, on each day the NYSE is open for trading.
Income Taxes. It is the policy of each Fund to distribute all of its taxable income and capital gains to its shareholders and to otherwise qualify as a regulated investment company under Subchapter M of the Internal Revenue Code. In addition, each Fund intends to pay distributions as required to avoid imposition of excise tax. Accordingly, no provision has been made for Federal income taxes. The Funds file income tax returns in U.S. federal and applicable state jurisdictions. The Funds’ tax returns are subject to examination by the relevant taxing authority until expiration of the applicable statute of limitations, which is generally three years after the filing of the tax returns. Management of the Trust periodically reviews all tax positions to assess whether it is more likely than not that the position would be sustained upon examination by the relevant tax authority based on the technical merits of each position. As of the date of these financial statements, management believes that no liability for unrecognized tax positions is required.
Dividends and Distributions to Shareholders.Dividends and distributions to shareholders are recorded by each Fund on the business day following record date. Net investment income dividends and capital gains distributions are determined in accordance with income tax regulations, which may differ from accounting principles generally accepted in the United States of America (“U.S. GAAP”). If the total dividends and distributions made in any tax year exceed net investment income and accumulated realized capital gains, a portion of the total distribution may be treated as a return of capital for tax purposes.
Concentration of Market and Credit Risk. In the normal course of business, the Funds invest in securities and enter into transactions where risks exist due to fluctuations in the market (market risk) or failure of the issuer of a security to meet all its obligations (issuer credit risk). The value of securities held by the Funds may decline in response to certain events, including those directly involving the issuers whose securities are owned by the Funds; conditions affecting the general economy; overall market changes; local, regional or global political, social or economic instability; and currency and interest rate and price fluctuations. Similar to issuer credit risk, the Funds may be exposed to counterparty credit risk, or the
| 26 | ANNUAL REPORT | 2019 |
Table of Contents
risk that an entity with which the Funds have unsettled or open transactions may fail to or be unable to perform on its commitments. The Funds manage counterparty credit risk by entering into transactions only with counterparties that they believe have the financial resources to honor their obligations and by monitoring the financial stability of those counterparties. Financial assets, which potentially expose the Funds to market, issuer and counterparty credit risks, consist principally of financial instruments and receivables due from counterparties. The extent of the Funds’ exposure to market, issuer and counterparty credit risks with respect to these financial assets is generally approximated by their value recorded on the Funds’ Statement of Assets and Liabilities, less any collateral held by the Funds.
If a Fund invests directly in foreign currencies or in securities that trade in, and receive revenues in, foreign currencies, or in financial derivatives that provide exposure to foreign currencies, it will be subject to the risk that those currencies will decline in value relative to the base currency of the Fund, or, in the case of hedging positions, that the Fund’s base currency will decline in value relative to the currency being hedged. Currency rates in foreign countries may fluctuate significantly over short periods of time for a number of reasons, including changes in interest rates, intervention (or the failure to intervene) by U.S. or foreign governments, central banks or supranational entities such as the International Monetary Fund, or by the imposition of currency controls or other political developments in the United States or abroad.
Custodian Fees.“Custodian fees” on the Statement of Operations may include interest expense incurred by a Fund on any cash overdrafts of its custodian account during the period. Such cash overdrafts may result from the effects of failed trades in portfolio securities and from cash outflows resulting from unanticipated shareholder redemption activity. A Fund pays interest to its custodian on such cash overdrafts, to the extent they are not offset by positive cash balances maintained by that Fund. The “Earnings credit” line item, if shown, represents earnings on cash balances maintained by that Fund during the period. Such interest expense and other custodian fees may be paid with these earnings.
Indemnification.The Trust’s organizational documents provide current and former Trustees and Officers with a limited indemnification against liabilities arising in connection with the performance of their duties to the Trust. In the normal course of business, the Trust may also enter into contracts that provide general indemnification. The Trust’s maximum exposure under these arrangements is unknown and is dependent on future claims that may be made against the Trust. The risk of material loss from such claims is considered remote.
Basis of Preparation.Each Fund is an investment company and follows accounting and reporting guidance in the Financial Accounting Standards Board (“FASB”) Accounting Standards Codification Topic 946 (“ASC 946”). The accompanying financial statements were prepared in accordance with U.S. GAAP, including but not limited to ASC 946. U.S. GAAP requires the use of estimates made by management. Management believes that estimates and valuations are appropriate; however, actual results may differ from those estimates, and the valuations reflected in the accompanying financial statements may differ from the value ultimately realized upon sale or maturity.
New Rule Issuance. In August 2018, the FASB issued ASU2018-13, Fair Value Measurement (Topic 820). The amendments in the ASU impact disclosure requirements for fair value measurement. It is anticipated that this change will enhance the effectiveness of disclosures in the notes to the financial statements. This ASU is effective for fiscal years beginning after December 15, 2019. Early adoption is permitted and can include the entire standard or certain provisions that exclude or amend disclosures. For the year ended June 30, 2019, the Funds have chosen to adopt the standard. The adoption of this ASU is reflected in the disclosures of the financial statements.
In August 2018, U.S. Securities and Exchange Commission (“SEC”) adopted amendments to certain financial statement disclosure requirements to conform them to U.S. GAAP for investment companies. These amendments made certain removals from, changes to and additions to existing disclosure requirements under RegulationS-X. These amendments became effective for filings made with the SEC after November 5, 2018. The Funds’ adoption of these amendments, effective with the financial statements prepared as of June 30, 2019, required modified disclosures reflected herein, but had no effect on the Funds’ net assets or results of operations.
Subsequent Events. At a meeting held on August13-14, 2019, the Board of Trustees (the “Board”) of Ivy NextShares (the “Trust”) approved the termination and winding down of each of Ivy Focused Growth NextShares, Ivy Focused Value NextShares and Ivy Focused Energy NextShares (each, a “Fund,” and collectively, the “Funds”), each a series of the Trust, with the liquidation payment to shareholders of each Fund expected to take place on or about September 20, 2019.
After the close of business on September 3, 2019, each Fund no longer will accept orders for creation units. The last day of trading in each Fund on The Nasdaq Stock Market LLC (the “Exchange”) will be September 9, 2019. Shareholders should be aware that while a Fund is preparing to liquidate, it will not pursue its stated investment objective or engage in any business activities except for the purposes of winding up its business and affairs, preserving the value of its assets, paying its liabilities, and distributing its remaining assets to shareholders.
Shareholders may sell their holdings of a Fund on the Exchange until market close on September 9, 2019, and may incur typical transaction fees from their broker-dealer. Each Fund’s shares will no longer trade on the Exchange after market close on September 9, 2019, and the shares will be subsequently delisted. Shareholders who do not sell their shares of a Fund before
| 2019 | ANNUAL REPORT | 27 |
Table of Contents
market close on September 9, 2019 will receive cash equal to the amount of the net asset value of their shares, which will include any capital gains and dividends, in the cash portion of their brokerage accounts, on or about September 20, 2019.
Shareholders generally will recognize a capital gain or loss equal to the amount received for their shares to the extent it is greater than or less than their adjusted basis in such shares.
| 3. | INVESTMENT VALUATION AND FAIR VALUE MEASUREMENTS |
Each Fund’s investments are reported at fair value. Fair value is defined as the price that each Fund would receive upon selling an asset or would pay upon satisfying a liability in an orderly transaction between market participants at the measurement date. Each Fund calculates the NAV of its shares as of the close of the NYSE, normally 4:00 P.M. Eastern time, on each day the NYSE is open for trading.
For purposes of calculating the NAV, the portfolio securities and financial instruments are valued on each business day using pricing and valuation methods as adopted by the Board. Where market quotes are readily available, fair value is generally determined on the basis of the last reported sales price, or if no sales are reported, based on quotes obtained from a quotation reporting system, established market makers, or pricing services.
Prices for fixed-income securities are typically based on quotes that are obtained from an independent pricing service approved by the Board. To determine values of fixed-income securities, the independent pricing service utilizes such factors as current quotations by broker/dealers, coupon, maturity, quality, type of issue, trading characteristics, and other yield and risk factors it deems relevant in determining valuations. Securities that cannot be valued by the independent pricing service may be valued using quotes obtained from dealers that make markets in the securities.
Short-term securities with maturities of 60 days or less are valued based on quotes that are obtained from an independent pricing service approved by the Board as described in the preceding paragraph above.
Because many foreign markets close before the NYSE, events may occur between the close of the foreign market and the close of the NYSE that could have a material impact on the valuation of foreign securities. Waddell & Reed Services Company (“WRSCO”), pursuant to procedures adopted by the Board, evaluates the impact of these events and may adjust the valuation of foreign securities to reflect the fair value as of the close of the NYSE. In addition, all securities for which values are not readily available or are deemed unreliable are appraised at fair value as determined in good faith under the supervision of the Board.
Where market quotes are not readily available, portfolio securities or financial instruments are valued at fair value, as determined in good faith by the Board or Valuation Committee pursuant to procedures approved by the Board.
Market quotes are considered not readily available in circumstances where there is an absence of current or reliable market-based data (e.g., trade information or broker quotes), including where events occur after the close of the relevant market, but prior to the NYSE close, that materially affect the values of a Fund’s securities or financial instruments. In addition, market quotes are considered not readily available when, due to extraordinary circumstances, the exchanges or markets on which the securities trade do not open for trading for the entire day and no other market prices are available.
The Board has delegated to WRSCO the responsibility for monitoring significant events that may materially affect the values of a Fund’s securities or financial instruments and for determining whether the value of the applicable securities or financial instruments should bere-evaluated in light of such significant events. The Board has established a Valuation Committee to administer and oversee the valuation process, including the use of third party pricing vendors.
The Board has adopted methods for valuing securities and financial instruments in circumstances where market quotes are not readily available. For instances in which daily market quotes are not readily available, investments may be valued, pursuant to procedures established by the Board, with reference to other securities or indices. In the event that the security or financial instrument cannot be valued pursuant to one of the valuation methods established by the Board, the value of the security or financial instrument will be determined in good faith by the Valuation Committee in accordance with the procedures adopted by the Board.
When a Fund uses these fair valuation methods applied by WRSCO that use significant unobservable inputs to determine its NAV, securities will be priced by a method that the Board or persons acting at its direction believe accurately reflects fair value and are categorized as Level 3 of the fair value hierarchy. These methods may require subjective determinations about the value of a security. The prices used by a Fund may differ from the value that will ultimately be realized at the time the securities are sold.
WRSCO is responsible for monitoring the implementation of the pricing and valuation policies through a series of activities to provide reasonable comfort of the accuracy of prices including: 1) periodic vendor due diligence meetings to review methodologies, new developments, and process at vendors, 2) daily and monthly multi-source pricing comparisons reviewed and submitted to the Valuation Committee, and 3) daily review of unpriced, stale, and variance reports with exceptions reviewed by management and the Valuation Committee.
| 28 | ANNUAL REPORT | 2019 |
Table of Contents
Accounting standards establish a framework for measuring fair value and a three-level hierarchy for fair value measurements based upon the transparency of inputs to the valuation of an asset or liability. Inputs may be observable or unobservable and refer broadly to the assumptions that market participants would use in pricing the asset or liability. Observable inputs reflect the assumptions market participants would use in pricing the asset or liability based on market data obtained from sources independent of the reporting entity. Unobservable inputs reflect the reporting entity’s own assumptions about the factors that market participants would use in pricing the asset or liability developed based on the best information available in the circumstances.
An individual investment’s fair value measurement is assigned a level based upon the observability of the inputs which are significant to the overall valuation.
The three-tier hierarchy of inputs is summarized as follows:
| • | Level 1 – Observable input such as quoted prices, available in active markets, for identical assets or liabilities. |
| • | Level 2 – Significant other observable inputs, which may include, but are not limited to, quoted prices for similar assets or liabilities in markets that are active, quoted prices for identical or similar assets or liabilities in markets that are not active, inputs other than quoted prices that are observable for the assets or liabilities (such as interest rates, yield curves, volatilities, prepayment speeds, loss severities, credit risks and default rates) or other market corroborated inputs. |
| • | Level 3 – Significant unobservable inputs based on the best information available in the circumstances, to the extent observable inputs are not available, which may include assumptions made by the Board or persons acting at its direction that are used in determining the fair value of investments. |
A description of the valuation techniques applied to the Funds’ major classes of assets and liabilities measured at fair value on a recurring basis follows:
Equity Securities. Equity securities traded on U.S. or foreign securities exchanges or included in a national market system are valued at the official closing price at the close of each business day unless otherwise stated below. OTC equity securities and listed securities for which no price is readily available are valued at the average of the last bid and ask prices.
Mutual funds, including investment funds, typically are valued at the NAV reported as of the valuation date.
Securities that are stated at the last reported sales price or closing price on the day of valuation taken from the primary exchange where the security is principally traded and to the extent these securities are actively traded and valuation adjustments are not applied, they are categorized in Level 1 of the fair value hierarchy.
Foreign securities, for which the primary trading market closes at the same time or after the NYSE, are valued based on quotations from the primary market in which they are traded and categorized in Level 1. Because many foreign securities markets and exchanges close prior to the close of the NYSE, closing prices for foreign securities in those markets or on those exchanges do not reflect the events that occur after that close. Certain foreign securities may be fair valued using a pricing service that considers the correlation of the trading patterns of the foreign security to theintra-day trading in the U.S. markets for investments such as American Depositary Receipts, financial futures, exchange-traded funds, and the movement of certain indices of securities based on a statistical analysis of their historical relationship; such valuations generally are categorized in Level 2.
Preferred stock, repurchase agreements, and other equities traded on inactive markets or valued by reference to similar instruments are also generally categorized in Level 2.
| 4. | INVESTMENT MANAGEMENT AND PAYMENTS TO AFFILIATED PERSONS |
| ($ amounts in thousands unless indicated otherwise) |
Management Fees. IICO, a wholly owned subsidiary of Waddell & Reed Financial, Inc. (“WDR”), serves as each Fund’s investment manager. The management fee is accrued daily by each Fund at the annual rates of 0.85%, 0.75% and 0.75% in Ivy Focused Energy NextShares, Ivy Focused Growth NextShares and Ivy Focused Value NextShares, respectively, as a percentage of average daily net assets.
Independent Trustees and Chief Compliance Officer Fees. Fees paid to the Independent Trustees can be paid in cash or deferred to a later date, at the election of the Trustees according to the Deferred Fee Agreement entered into between the Trust and the Trustee(s). Each Fund records its portion of the deferred fees as a liability on the Statement of Assets and Liabilities. All fees paid in cash plus any appreciation (depreciation) in the underlying deferred plan are shown on the Statement of Operations. Additionally, fees paid to the Chief Compliance Officer of the Funds are shown on the Statement of Operations.
Accounting Services Fees. The Trust has an Accounting and Administrative Services Agreement with WRSCO, doing business as WI Services Company (“WISC”), an indirect subsidiary of WDR. Under the agreement, WISC acts as the agent in
| 2019 | ANNUAL REPORT | 29 |
Table of Contents
providing bookkeeping and accounting services and assistance and other administrative services, including maintenance of Fund records, preparation of prospectuses for existing shareholders, preparation of proxy statements and certain shareholder reports. For these services, each Fund pays WISC a monthly fee, equal to the greater ofone-twelfth of the asset-based fee or the aggregate annual minimum fee as shown in the following table, based on the average daily net asset levels shown in the following table:
Annual Minimum Fee (Per Fund) $115,000
| Asset-Based Fee (all Funds) | Annual Basis Point Rate | |||
First $1 Billion Next $5 Billion Thereafter | | 0.03 0.0225 0.015 | % % % | |
Other Fees. Each Fund pays all of its other expenses. These include, for each Fund, the costs of printing and mailing materials sent to shareholders, audit and outside legal fees, taxes, brokerage commissions, interest, insurance premiums, custodian fees, fees payable by the Funds under Federal or other securities laws and to the Investment Company Institute, cost of processing and maintaining shareholder records, costs of systems or services used to price Fund securities and nonrecurring and extraordinary expenses, including litigation and indemnification relating to litigation.
Expense Reimbursements and/or Waivers.IICO, the Funds’ investment manager, and/or WISC, has contractually agreed to reimburse sufficient management fees and/or accounting and administrative services fees to cap the total annual ordinary fund operating expenses (which would exclude interest, taxes, brokerage commissions, acquired fund fees and expenses, and extraordinary expenses, if any). Fund expense limitations and related waivers/reimbursements for the year ended June 30, 2019 were as follows:
| Fund Name | Type of Expense Limit | Commencement Date | End Date | Expense Limit | Amount of Expense Waiver/ Reimbursement | Expense Reduced | |||||||||
Ivy Focused Energy NextShares | Contractual | 10-17-2016 | 10-31-2019 | 0.95% | $58 | Investment management fees | |||||||||
| 166 | Accounting and administrative services fees | ||||||||||||||
Ivy Focused Growth NextShares | Contractual | 10-17-2016 | 10-31-2019 | 0.78% | $96 | Investment management fees | |||||||||
| 141 | Accounting and administrative services fees | ||||||||||||||
Ivy Focused Value NextShares | Contractual | 10-17-2016 | 10-31-2019 | 0.78% | $72 | Investment management fees | |||||||||
| 161 | Accounting and administrative services fees | ||||||||||||||
Any amounts due to the Funds as a reimbursement but not paid as of June 30, 2019 are shown as a receivable from affiliates on the Statement of Assets and Liabilities.
| 5. | INVESTMENT SECURITIES TRANSACTIONS ($ amounts in thousands) |
The cost of purchases and the proceeds from maturities and sales of investment securities (excludingin-kind transactions and short-term securities) for the year ended June 30, 2019, were as follows:
| Purchases | Sales | |||||||||||||||
| U.S. Government | Other Issuers | U.S. Government | Other Issuers | |||||||||||||
Ivy Focused Energy NextShares | $ | — | $ | 1,968 | $ | — | $ | 2,026 | ||||||||
Ivy Focused Growth NextShares | — | 3,629 | — | 4,103 | ||||||||||||
Ivy Focused Value NextShares | — | 17,824 | — | 18,637 | ||||||||||||
For the year ended June 30, 2019, the Funds did not have anyin-kind contributions or redemptions.
| 30 | ANNUAL REPORT | 2019 |
Table of Contents
| 6. | CAPITAL SHARE TRANSACTIONS (All amounts in thousands) |
The Funds issue and redeem shares only in specified large aggregations (“Creation Units”) of 25,000 shares or multiples thereof. Creation Units may be purchased or redeemed only by or through “Authorized Participants,” which are broker-dealers or institutional investors that have entered into agreements with ALPS Distributors, Inc., the Funds’ distributor for this purpose. The Funds issue and redeem Creation Units in return for the securities, other instruments and/or cash (“Basket”) that the Funds specify each business day. The Funds impose transaction fees on Creation Units issued and redeemed to offset the estimated cost to the Fund of processing the transaction and converting the Basket to or from the desired portfolio composition. Such transaction fees are reflected in capital share transactions on the Statement of Changes in Net Assets. Transactions in capital shares for each Fund were as follows:
| Ivy Focused Energy NextShares | Ivy Focused Growth NextShares | |||||||||||||||||||||||||||||||
| Year ended 6-30-19 | Year ended 6-30-18 | Year ended 6-30-19 | Year ended 6-30-18 | |||||||||||||||||||||||||||||
| Shares | Value | Shares | Value | Shares | Value | Shares | Value | |||||||||||||||||||||||||
Shares issued from sale of shares | — | $ | — | 25 | $ | 413 | — | $ | — | — | $ | — | ||||||||||||||||||||
Shares issued in reinvestment of distributions to shareholders | — | — | — | — | — | — | — | — | ||||||||||||||||||||||||
Shares redeemed | — | — | — | — | — | — | — | — | ||||||||||||||||||||||||
Net increase | — | $ | — | 25 | $ | 413 | — | $ | — | — | $ | — | ||||||||||||||||||||
| Ivy Focused Value NextShares | ||||||||||||||||
| Year ended 6-30-19 | Year ended 6-30-18 | |||||||||||||||
| Shares | Value | Shares | Value | |||||||||||||
Shares issued from sale of shares | — | $ | — | 25 | $ | 582 | ||||||||||
Shares issued in reinvestment of distributions to shareholders | — | — | — | — | ||||||||||||
Shares redeemed | — | — | — | — | ||||||||||||
Net increase | — | $ | — | 25 | $ | 582 | ||||||||||
| 7. | FEDERAL INCOME TAX MATTERS ($ amounts in thousands) |
For Federal income tax purposes, cost of investments owned at June 30, 2019 and the related unrealized appreciation (depreciation) were as follows:
Fund | Cost of | Gross | Gross | Net | ||||||||||||
Ivy Focused Energy NextShares | $ | 7,468 | $ | 145 | $ | 1,661 | $ | (1,516 | ) | |||||||
Ivy Focused Growth NextShares | 9,447 | 4,648 | 42 | 4,606 | ||||||||||||
Ivy Focused Value NextShares | 9,318 | 196 | 374 | (178 | ) | |||||||||||
For Federal income tax purposes, the Funds’ undistributed earnings and profit for the year ended June 30, 2019 and the post-October and late-year ordinary activity were as follows:
Fund | Undistributed | Undistributed | Tax Return | Post- | Late-Year | |||||||||||||||
Ivy Focused Energy NextShares | $ | 24 | $ | — | $ | — | $ | — | $ | — | ||||||||||
Ivy Focused Growth NextShares | 20 | 574 | — | 35 | — | |||||||||||||||
Ivy Focused Value NextShares | 40 | — | — | — | — | |||||||||||||||
Internal Revenue Code regulations permit each Fund to elect to defer into its next fiscal year capital losses and certain specified ordinary items incurred between each November 1 and the end of its fiscal year. Each Fund is also permitted to defer into its next fiscal certain ordinary losses that generated between each January 1 and the end of its fiscal year.
| 2019 | ANNUAL REPORT | 31 |
Table of Contents
The tax character of dividends and distributions paid during the two fiscal years ended June 30, 2019 and 2018 were as follows:
| June 30, 2019 | June 30, 2018 | |||||||||||||||
Fund | Distributed | Distributed | Distributed | Distributed | ||||||||||||
Ivy Focused Energy NextShares | $ | 3 | $ | — | $ | 82 | $ | — | ||||||||
Ivy Focused Growth NextShares | 96 | 518 | 49 | — | ||||||||||||
Ivy Focused Value NextShares | 937 | 240 | 297 | — | ||||||||||||
| (1) | Includes short-term capital gains distributed, if any. |
Dividends from net investment income and short-term capital gains are treated as ordinary income dividends for federal income tax purposes.
Accumulated capital losses represent net capital loss carryovers as of June 30, 2019 that may be available to offset future realized capital gains and thereby reduce future capital gains distributions. As of June 30, 2019, the capital loss carryovers were as follows:
| Post-Enactment | ||||||||
Fund | Short-Term | Long-Term | ||||||
Ivy Focused Energy NextShares | $ | 1,049 | $ | 873 | ||||
Ivy Focused Growth NextShares | — | — | ||||||
Ivy Focused Value NextShares | 140 | 116 | ||||||
Net investment income dividends and capital gains distributions are determined in accordance with income tax regulations which may differ from U.S. GAAP. These differences are due to differing treatments for items such as deferral of wash sales, post-October losses, late-year ordinary losses, foreign currency transactions, net operating losses, partnership transactions,non-deductible taxes andin-kind redemptions. At June 30, 2019, the following reclassifications were made:
Fund | Accumulated | Paid-In Capital | ||||||
Ivy Focused Energy NextShares | $ | — | * | $ | — | * | ||
Ivy Focused Growth NextShares | — | — | ||||||
Ivy Focused Value NextShares | — | * | — | * | ||||
*Not shown due to rounding.
| 32 | ANNUAL REPORT | 2019 |
Table of Contents
| REPORT OF INDEPENDENT REGISTERED PUBLIC ACCOUNTING FIRM | IVY NEXTSHARES |
To the Shareholders and Board of Trustees of Ivy NextSharesTM:
| Opinion | on the Financial Statements and Financial Highlights |
We have audited the accompanying statements of assets and liabilities of Ivy NextSharesTM (the “Funds”), comprising the Ivy Focused Energy NextSharesTM, Ivy Focused Growth NextSharesTM, and Ivy Focused Value NextSharesTM, including the schedules of investments, as of June 30, 2019, the related statements of operations for the year then ended, the statements of changes in net assets for each of the two years in the period then ended, the financial highlights for the years ended June 30, 2019 and 2018 and the period from October 17, 2016 (commencement of operations) through June 30, 2017, and the related notes. In our opinion, the financial statements and financial highlights present fairly, in all material respects, the financial position of each of the Funds as of June 30, 2019, and the results of their operations for the year then ended, the changes in their net assets for each of the two years in the period then ended, and the financial highlights for the years ended June 30, 2019 and 2018 and the period from October 17, 2016 (commencement of operations) through June 30, 2017 in conformity with accounting principles generally accepted in the United States of America.
| Basis | for Opinion |
These financial statements and financial highlights are the responsibility of the Funds’ management. Our responsibility is to express an opinion on the Funds’ financial statements and financial highlights based on our audits. We are a public accounting firm registered with the Public Company Accounting Oversight Board (United States) (PCAOB) and are required to be independent with respect to the Funds in accordance with the U.S. federal securities laws and the applicable rules and regulations of the Securities and Exchange Commission and the PCAOB.
We conducted our audits in accordance with the standards of the PCAOB. Those standards require that we plan and perform the audit to obtain reasonable assurance about whether the financial statements and financial highlights are free of material misstatement, whether due to error or fraud. The Funds are not required to have, nor were we engaged to perform, an audit of their internal control over financial reporting. As part of our audits we are required to obtain an understanding of internal control over financial reporting but not for the purpose of expressing an opinion on the effectiveness of the Funds’ internal control over financial reporting. Accordingly, we express no such opinion.
Our audits included performing procedures to assess the risks of material misstatement of the financial statements and financial highlights, whether due to error or fraud, and performing procedures that respond to those risks. Such procedures included examining, on a test basis, evidence regarding the amounts and disclosures in the financial statements and financial highlights. Our audits also included evaluating the accounting principles used and significant estimates made by management, as well as evaluating the overall presentation of the financial statements and financial highlights. Our procedures included confirmation of securities owned as of June 30, 2019, by correspondence with the custodian and brokers; when replies were not received from brokers, we performed other auditing procedures. We believe that our audits provide a reasonable basis for our opinion.

Kansas City, Missouri
August 16, 2019
We have served as the auditor of one or more Waddell & Reed investment companies since 1997.
| 2019 | ANNUAL REPORT | 33 |
Table of Contents
| INCOME TAX INFORMATION | IVY NEXTSHARES |
AMOUNTS NOT ROUNDED (UNAUDITED)
The Funds hereby designate the following amounts of dividends paid from net ordinary income as dividends qualifying for the 70% dividends received deduction for corporations or as qualified dividend income for individuals for the tax period ended June 30, 2019:
Dividends | Qualified Dividend Income for Individuals | |||||||
Ivy Focused Energy NextShares | $ | 3,510 | $ | 3,510 | ||||
Ivy Focused Growth NextShares | 95,976 | 95,976 | ||||||
Ivy Focused Value NextShares | 505,212 | 523,149 | ||||||
The Funds hereby designate the following amounts as distributions of long-term capital gains:
Ivy Focused Energy NextShares | $ | — | ||
Ivy Focused Growth NextShares | 517,763 | |||
Ivy Focused Value NextShares | 239,562 |
Shareholders are advised to consult with their tax advisors concerning the tax treatment of dividends and distributions from all the Funds.
The tax status of dividends paid will be reported to you on Form1099-DIV after the close of the applicable calendar year.
| 34 | ANNUAL REPORT | 2019 |
Table of Contents
| BOARD OF TRUSTEES AND OFFICERS | IVY NEXTSHARES |
(UNAUDITED)
Each of the individuals listed below serves as a trustee for the Trust (3 portfolios), and (except as noted in the table below) for the rest of the funds within the Fund Complex, which also includes, in addition to the Trust, InvestEd Portfolios (“InvestEd”) (6 portfolios), the Ivy High Income Opportunities Fund (aclosed-end fund) (“IVH”), Ivy Funds (45 portfolios) and Ivy Variable Insurance Portfolios (“Ivy VIP”) (28 Portfolios).
Board members who are not “interested persons” of the Funds as defined in Section 2(a)(19) of the 1940 Act (“Independent Trustees”) constitute at least 75% of the Board.
Joseph Harroz, Jr. serves as Independent Chairman of the Trust’s Board and of the Board of Trustees of the other funds in the Fund Complex. Subject to the Trustee Emeritus and Retirement Policy, a Trustee serves until his or her successor is elected and qualified or until his or her earlier death, resignation or removal.
The Statement of Additional Information (“SAI”) for the Trust includes additional information about the Trust’s Trustees. The SAI is available without charge, upon request by calling 1.800.777.6472. It is also available on the Ivy Investments website, www.ivyinvestments.com.
Independent Trustees
The following table provides information regarding each Independent Trustee.
| Name, Address and Year of Birth | Position Held with the Trust | Trustee Since | Principal Occupation(s) During Past 5 Years | Number of Funds in Fund Complex Overseen | Other Directorships Held During Past 5 Years | |||||
James M. Concannon 6300 Lamar Avenue Overland Park, KS 66202 1947 | Trustee | 2017 | Professor of Law, Washburn University School of Law (1973 to present). | 83 | Director, Kansas Legal Services for Prisoners, Inc.(non-profit community service); Director, U.S. Alliance Corp. (Insurance) and wholly-owned subsidiaries: U.S. Alliance Life and Security Company and Dakota Capital Life Insurance Company (Insurance) (2009 to present); Director, Kansas Appleseed, Inc.(non-profit community service) (2007 to present); Trustee, Waddell & Reed Advisors Funds (1997- 2018); Trustee, IVH (2017 to present); Trustee, Ivy Funds (2017 to present); Trustee, InvestEd (2001 to present); Trustee, Ivy VIP (1997 to present). |
| 2019 | ANNUAL REPORT | 35 |
Table of Contents
| Name, Address and Year of Birth | Position Held with the Trust | Trustee Since | Principal Occupation(s) During Past 5 Years | Number of Funds in Fund Complex Overseen | Other Directorships Held During Past 5 Years | |||||
H. Jeffrey Dobbs 6300 Lamar Avenue Overland Park, KS 66202 1955 | Trustee | 2019 | Global Sector Chairman, Industrial Manufacturing, KPMG LLP (2010-2015). | 82 | Director, Valparaiso University (2012 to present) Director, TechAccel LLC (2015 to present) (Tech R&D); Board Member, Kansas City Repertory Theatre (2015 to present); Board Member, Patients Voices, Inc. (technology) (2018 to present); Director, National Association of Manufacturers (2010-2015); Director, The Children’s Center (2003-2015); Director, Metropolitan Affairs Coalition (2003-2015); Director, Michigan Roundtable for Diversity and Inclusion (2003-2015); Trustee, Ivy Funds (2019 to present); Trustee, InvestEd (2019 to present); Trustee, Ivy VIP (2019 to present). | |||||
James D. Gressett 6300 Lamar Avenue Overland Park, KS 66202 1950 | Trustee | 2016 | Chief Executive Officer (CEO) of CalPac Pizza LLC (2011 to present); CEO of CalPac Pizza II LLC (2012 to present); CEO of PacPizza LLC (Pizza Hut franchise) (2000 to present); Member/CEO, Southern Pac Pizza LLC (2013 to present); Partner, Century Bridge Partners (real estate investments) (2007 to present); Manager, Hartley Ranch Angus Beef, LLC (2013 to present); President, Penn Capital Corp. (1995 to present); Partner, Penn Capital Partners (1999 to present); Partner, 1788 Chicken, LLC (Food Franchise) (2016 to present). | 83 | Member/Secretary, The Metochoi Group LLC (1999 to present); Member/Chairman, Idea Homes LLC (Homebuilding and Development) (2013 to present); Trustee, Waddell & Reed Advisors Funds (2017-2018); Trustee, IVH (2013 to present); Trustee, Ivy Funds (2002 to present); Trustee, InvestEd (2017 to present); Trustee, Ivy VIP (2017 to present). |
| 36 | ANNUAL REPORT | 2019 |
Table of Contents
| Name, Address and Year of Birth | Position Held with the Trust | Trustee Since | Principal Occupation(s) During Past 5 Years | Number of Funds in Fund Complex Overseen | Other Directorships Held During Past 5 Years | |||||
Joseph Harroz, Jr. 6300 Lamar Avenue Overland Park, KS 66202 1967 | Trustee and Independent Chairman | 2016 | Interim President, (2019 to present), Vice President (2010-2019) and Dean (2010 to present), College of Law, University of Oklahoma; Managing Member, Harroz Investments, LLC, (commercial enterprises) (1998 to present). | 83 | Director and Shareholder, Valliance Bank (2007 to present); Director, Foundation Healthcare, (formerly Graymark HealthCare) (2008-2017); Trustee, The Mewbourne Family Support Organization (2006 to present)(non-profit); Independent Director, LSQ Manager, Inc. (real estate) (2007 to 2016); Director, Oklahoma Foundation for Excellence(non-profit) (2008 to present); Independent Chairman and Trustee, Waddell & Reed Advisors Funds (Independent Chairman: 2015-2018; Trustee: 1998-2018); Independent Chairman and Trustee, IVH (2013 to present); Independent Chairman and Trustee, Ivy Funds (Independent Chairman: 2006 to present; Trustee: 1998 to present); Independent Chairman and Trustee, InvestEd (Independent Chairman: 2015 to present; Trustee: 2001 to present); Independent Chairman and Trustee, Ivy VIP (Independent Chairman: 2015 to present; Trustee: 1998 to present). | |||||
Glendon E. Johnson, Jr. 6300 Lamar Avenue Overland Park, KS 66202 1951 | Trustee | 2016 | Of Counsel, Lee & Smith, PC (law firm, emphasis on finance, securities, mergers and acquisitions law) (1996 to present); Owner and Manager, Castle Valley Ranches, LLC (ranching) and Castle Valley Outdoors, LLC (outdoor recreation) (1995 to present); Formerly, Partner, Kelly, Drye & Warren LLP (law firm) (1989-1996); Partner, Lane & Edson PC (law firm) (1987-1989). | 83 | Director, Thomas Foundation for Cancer Research (Medical Research) (2005 to present); Director, Warriors Afield Legacy Foundation(non-profit) (2014 to present); Trustee, Waddell & Reed Advisors Funds (2017-2018); Trustee, IVH (2013 to present); Trustee, Ivy Funds (2002 to present); Trustee, InvestEd (2017 to present); Trustee, Ivy VIP (2017 to present). |
| 2019 | ANNUAL REPORT | 37 |
Table of Contents
| Name, Address and Year of Birth | Position Held with the Trust | Trustee Since | Principal Occupation(s) During Past 5 Years | Number of Funds in Fund Complex Overseen | Other Directorships Held During Past 5 Years | |||||
Sandra A.J. Lawrence 6300 Lamar Avenue Overland Park, KS 66202 1957 | Trustee | 2019 | Retired, formerly Chief Administrative Officer, Children’s Mercy Hospitals and Clinics (2016-2019); CFO, Children’s Mercy Hospitals and Clinics (2005-2016). | 82 | Director, Hall Family Foundation (1993 to present); Director, Westar Energy (2004 to present); Trustee, Nelson-Atkins Museum of Art(non-profit) (2007 to present); Director, Kansas Metropolitan Business and Healthcare Coalition(non-profit) (2017 to present); Director, National Association of Corporate Directors(non-profit) (2017 to present); Director, American Shared Hospital Services (2017 to present); Director, Evergy, Inc., Kansas City Power & Light Company, KCP&L Greater Missouri Operations Company, Westar Energy, Inc. and Kansas Gas and Electric Company (related utility companies) (2018 to present); Director, Stowers (research) (2018); Director, Turn the Page KC(non-profit) (2012-2016); Trustee, Ivy Funds (2019 to present); Trustee, InvestEd (2019 to present); Trustee, Ivy VIP (2019 to present). | |||||
Frank J. Ross, Jr. Polsinelli PC 900 West 48th Place Suite 900 Kansas City, MO 64112 1953 | Trustee | 2017 | Shareholder/Director, Polsinelli PC, (law firm) (1980 to present). | 83 | Trustee, Waddell & Reed Advisors Funds (1996-2018); Trustee, IVH (2017 to present); Trustee, Ivy Funds (2017 to present); Trustee, InvestEd (2001 to present); Trustee, Ivy VIP (1996 to present). | |||||
Michael G. Smith 6300 Lamar Avenue Overland Park, KS 66202 1944 | Trustee | 2016 | Retired; formerly, with Merrill Lynch as Managing Director of Global Investor Client Strategy (1996-1998), Head of Regional Institutional Sales (1995-1996) and of U.S. Central Region (1986-1995, 1999). | 83 | Director, Executive Board, Cox Business School, Southern Methodist University (1998-2019); Lead Director, Northwestern Mutual Funds (2003 to 2017); Director, CTMG, Inc. (clinical testing) (2008-2015); Trustee, Waddell & Reed Advisors Funds (2017-2018); Trustee, IVH (2013 to present); Trustee, Ivy Funds (2002 to present); Trustee, InvestEd (2017 to present); Trustee, Ivy VIP (2017 to present). |
| 38 | ANNUAL REPORT | 2019 |
Table of Contents
| Name, Address and Year of Birth | Position Held with the Trust | Trustee Since | Principal Occupation(s) During Past 5 Years | Number of Funds in Fund Complex Overseen | Other Directorships Held During Past 5 Years | |||||
Edward M. Tighe 6300 Lamar Avenue Overland Park, KS 66202 1942 | Trustee | 2016 | Retired; formerly, CEO and Director of Asgard Holdings LLC (computer network and security services) (2002 to 2004); President, Citco Technology Management (1995-2000); CEO, Global Mutual Fund Services (1993-2000); Sr. Vice President, Templeton Global Investors (1988-1992). | 83 | Trustee, Hansberger Institutional Funds (2000-2007); Director, The Research Coast Principium Foundation, Inc.(non-profit) (2012-2015); Trustee, Waddell & Reed Advisors Funds (2017-2018); Trustee, IVH (2013 to present); Trustee, Ivy Funds (1999 to present); Trustee, InvestEd (2017 to present); Trustee, Ivy VIP (2017 to present). |
Interested Trustees
Messrs. Herrmann and Sanders are “interested” by virtue of their current or former engagement as an officer of Waddell & Reed Financial, Inc. (“WDR”) or its wholly owned subsidiaries, including each Fund’s investment manager, Ivy Investment Management Company (IICO), each Fund’s principal underwriter, Ivy Distributors, Inc. (IDI), and each Fund’s shareholder servicing and accounting services agent, Waddell & Reed Services Company, doing business as WI Services Company (“WISC”), as well as by virtue of their personal ownership in shares of WDR.
| Name, Address and Year of Birth | Position(s) Held with the Trust | Trustee/Officer Since | Principal Occupation(s) During Past 5 Years | Number of Funds in Fund Complex Overseen | Other Directorships Held | |||||
Henry J. Herrmann 6300 Lamar Avenue Overland Park, KS 66202 1942 | Trustee | 2016 | Retired,Non-Executive Chairman of the Board, WDR (2016-2018); Formerly Chairman, WDR (2010-2018); CEO, WDR (2005-2016); President, CEO and Chairman, IICO (2002-2016); President, CEO and Chairman, Waddell & Reed Investment Management Company (WRIMCO) (1993-2016); President of each of the funds in the Fund Complex (2001-2016). | 83 | Director, WDR, (1998 to present), Director, IICO (2002-2016), Director, WRIMCO (1991-2016), Director WISC (2001-2016), Director, W&R Capital Management Group, Inc. (2008-2016), Director, Waddell & Reed (1993-2016); Director, Blue Cross Blue Shield of Kansas City (2007-2017); Trustee, Waddell & Reed Advisors Funds (1998-2018); Trustee, IVH (2013 to present); Trustee, Ivy Funds (1998 to present); Trustee, InvestEd (2001 to present); Trustee, Ivy VIP (1998 to present). | |||||
Philip J. Sanders 6300 Lamar Avenue Overland Park, KS 66202 1959 | Trustee | 2019 | CEO, WDR (2016 to present); President, CEO and Chairman, IICO (2016 to present) and WRIMCO (2016-2018); CIO, WDR (2011-2019); CIO, IICO (2010-2019) and WRIMCO (2010-2018); President of each of the funds in the Fund Complex (2016 to present). | 82 | Trustee, Ivy Funds (2019 to present); Trustee, InvestEd (2019 to present); Trustee, Ivy VIP (2019 to present). |
| 2019 | ANNUAL REPORT | 39 |
Table of Contents
Officers
The Board has appointed officers who are responsible for theday-to-day business decisions based on policies it has established. The officers serve at the pleasure of the Board. The Trust’s principal officers are:
| Name, Address and Year of Birth | Position(s) Held With the Trust and Fund Complex | Officer of Trust Since | Officer of Fund Complex Since* | Principal Occupation(s) During Past 5 Years | ||||
Jennifer K. Dulski 6300 Lamar Avenue Overland Park, KS 66202 1980 | Secretary | 2017 | 2017 | Secretary of each of the funds in the Fund Complex (2017 to present); Senior Vice President and Associate General Counsel of Waddell & Reed and IDI (2018 to present). | ||||
Joseph W. Kauten 6300 Lamar Avenue Overland Park, KS 66202 1969 | Vice President
Treasurer
Principal Financial Officer | 2016
2016
2016 | 2006
2006
2007 | Principal Financial Officer of each of the funds in the Fund Complex (2007 to present); Vice President and Treasurer of each of the funds in the Fund Complex (2006 to present); Principal Accounting Officer of each of the funds in the Funds Complex (2006-2017); Assistant Treasurer of each of the funds in the Fund Complex (2003-2006) Vice President of Waddell & Reed Services Company (“WRSCO”) (2007 to present). | ||||
Philip J. Sanders** 6300 Lamar Avenue Overland Park, KS 66202 1959 | President | 2016 | 2016 | CEO of WDR (2016 to present); President, CEO and Chairman of IICO (2016 to present) and WRIMCO (2016-2018); President of each of the funds in the Fund Complex (2016 to present); CIO of WDR (2011 to present); CIO of IICO (2010-2019) and WRIMCO (2010-2018). | ||||
Scott J. Schneider 6300 Lamar Avenue Overland Park, KS 66202 1968 | Vice President
Chief Compliance Officer | 2016
2016 | 2006
2004 | Chief Compliance Officer (2004 to present); Vice President of WRIMCO (2006-2018) and IICO (2006 to present); Vice President of each of the funds in the Fund Complex (2006 to present). | ||||
Philip A. Shipp 6300 Lamar Avenue Overland Park, KS 66202 1969 | Assistant Secretary | 2016 | 2012 | Assistant Secretary of each of the funds in the Fund Complex (2012 to present); Vice President, Waddell & Reed and IDI (2010 to present). | ||||
John E. Sundeen, Jr. 6300 Lamar Avenue Overland Park, KS 66202 1960 | Vice President | 2016 | 2006 | Senior Vice President (1999 to present) and Chief Administrative Officer (2006 to present) of WDR; Executive Vice President and Chief Administrative Officer of IICO (2004 to present) and WRIMCO (2004-2018); Executive Vice President of WRSCO (2016 to present). |
* This is the date when the officer first became an officer of one or more of the funds that are the predecessors to current funds within Ivy Funds (each, a predecessor fund) (if applicable).
** Mr. Sanders was Vice President of the Fund Complex since 1998, until his appointment as President in August 2016.
| 40 | ANNUAL REPORT | 2019 |
Table of Contents
| ANNUAL PRIVACY NOTICE | IVY NEXTSHARES |
(UNAUDITED)
The following privacy notice is issued by Ivy NextShares (the “Funds”), Ivy Investment Management Company (“IICO”) and Ivy Distributors, Inc. (“IDI”).
Information Collected
We collect nonpublic personal information about you from your account application and other forms that you may deliver to us, and from your transactions with us and our affiliates. This is information that regulators consider necessary for the proper servicing of your account. In order to affect your transactions and service your account properly, we may disclose all of the information that we collect, as described above, to firms that assist us in servicing your account, such as our transfer agent.
Confidentiality of Information Collected
All records containing your nonpublic personal information are kept at our various service providers. These entities include IICO, IDI and our transfer agent and administrative services provider. We require these affiliates, and anynon-affiliated service providers, to protect the confidentiality of your information and to use the information only for the purposes for which disclosure to them is made. The Funds, IICO, IDI and other service providers restrict access to nonpublic personal information about you to those employees who need to know that information to provide products and services to you and maintain physical, electronic, and procedural safeguards that comply with federal standards to maintain the security of your nonpublic personal information.
Disclosure of Information in Limited Circumstances
We do not disclose nonpublic personal information about present or former customers to nonaffiliated third parties, except as permitted or required by law. In connection with servicing your account, your nonpublic personal information may be shared among the entities named in this notice, their affiliates, andnon-affiliates, including a transfer agent or other service companies. We will adhere to the policies and practices above for both current and former customers.
| 2019 | ANNUAL REPORT | 41 |
Table of Contents
| PROXY VOTING INFORMATION | IVY NEXTSHARES |
(UNAUDITED)
Proxy Voting Guidelines
A description of the policies and procedures Ivy NextShares uses to determine how to vote proxies relating to portfolio securities is available (i) without charge, upon request, by calling 1.888.923.3355 and (ii) on the Securities and Exchange Commission’s (“SEC”) website at www.sec.gov.
Proxy Voting Records
Information regarding how the Trust voted proxies relating to portfolio securities during the most recent12-month period ended June 30 is available on FormN-PX through the Ivy Investments’ website at www.ivyinvestments.com and on the SEC’s website at www.sec.gov.
| QUARTERLY PORTFOLIO SCHEDULE INFORMATION | IVY NEXTSHARES |
Portfolio holdings can be found on the Trust’s website at www.ivyinvestments.com. Alternatively, a complete schedule of portfolio holdings of each Fund for the first and third quarters of each fiscal year is filed with the SEC and can be found on the Trust’s FormN-Q. These holdings may be viewed in the following ways:
| • | On the SEC’s website at www.sec.gov. |
| • | For review and copy at the SEC’s Public Reference Room in Washington, DC. Information on the operations of the Public Reference Room may be obtained by calling 1.800.SEC.0330. |
| TO ALL TRADITIONAL IRA PLANHOLDERS: | IVY NEXTSHARES |
As required by law, we are hereby providing notice to you that income tax may be withheld automatically from any distribution or withdrawal from a traditional IRA. A Fund is generally required to withhold taxes unless you make a written election not to have taxes withheld. The election may be made on the distribution/withdrawal form provided by Waddell & Reed, Inc. which can be obtained from your Waddell & Reed representative or by submitting Internal Revenue Service Form W–4P. Once made, an election can be revoked by providing written notice to Waddell & Reed, Inc. If you elect not to have tax withheld you may be required to make payments of estimated tax. Penalties may be imposed by the IRS if withholding and estimated tax payments are not adequate.
| HOUSEHOLDING NOTICE | IVY NEXTSHARES |
If you currently receive one copy of the shareholder reports and prospectus for your household (even if more than one person in your household owns shares of the Trust) and you would prefer to receive separate shareholder reports and prospectuses for each account holder living at your address, you can do either of the following:
Fax your request to 800.532.2749.
Write to us at the address listed on the back cover.
Please list each account for which you would like to receive separate shareholder reports and prospectus mailings. We will resume sending separate documents within 30 days of receiving your request.
| 42 | ANNUAL REPORT | 2019 |
Table of Contents
| THE IVY NEXTSHARES FAMILY |
Domestic Equity Funds
Ivy Focused Growth NextShares
Ivy Focused Value NextShares
Specialty Funds
Ivy Focused Energy NextShares
About NextShares: Shares of NextShares funds are normally bought and sold in the secondary market through a broker, and may not be individually purchased or redeemed from the fund. In the secondary market, buyers and sellers transact with each other, rather than with the fund. NextShares funds issue and redeem shares only in specified creation unit quantities in transactions by or through Authorized Participants. In such transactions, a fund issues and redeems shares in exchange for the basket of securities, other instruments and/or cash that the fund specifies each business day. By transacting in kind, a NextShares fund can lower its trading costs and enhance fund tax efficiency by avoiding forced sales of securities to meet redemptions. Redemptions may be effected partially or entirely in cash whenin-kind delivery is not practicable or deemed not in the best interests of shareholders. A fund’s basket is not intended to be representative of the fund’s current portfolio positions and may vary significantly from current positions. As exchange-traded securities, NextShares can operate with low transfer agency expenses by utilizing the same highly efficient share processing system as used for exchange-listed stocks and ETFs. Trading prices are linked to the NextShares next-computed NAV and will vary by a market-determined premium or discount, which may be zero; may be above, at or below NAV; and may vary significantly from anticipated levels. Purchase and sale prices will not be known until the NextShares NAV is determined at the end of the trading day. NextShares do not offer the opportunity to transact intraday based on current (versusend-of-day) determinations of a fund’s value. Limit orders can be used to control differences in trade prices versus NAV (cost of trade execution), but cannot be used to control or limit execution price. Buying and selling NextShares may require payment of brokerage commissions and expose transacting shareholders to other trading costs. Frequent trading may detract from realized investment returns. The return on a shareholder’s NextShares investment will be reduced if the shareholder sells shares at a greater discount or narrower premium to NAV than he or she acquired the shares.
Ivy NextShares are a new type of actively managed exchange-traded product. Ivy NextShares have a limited operating history and may not be available at all broker/dealers. There is no guarantee that an active trading market for Ivy NextShares will develop or be maintained, or that their listings will continue or remain unchanged.
1.888.923.3355
Visit us online at www.ivyinvestments.com
Ivy NextShares funds are managed by Ivy Investment Management Company and are distributed by ALPS Distributors, Inc. ALPS Distributors, Inc., NextShares Solutions LLC, and Ivy Investment Management Company or Ivy Distributors, Inc. (or their affiliates), are all unaffiliated companies.
Before investing, investors should consider carefully the investment objectives, risks, charges and expenses of an Ivy NextShares exchange-traded managed fund. This and other important information is contained in the prospectus and summary prospectus, which may be obtained at ivyinvestments.com or from a financial advisor. Read it carefully before investing.
| 2019 | ANNUAL REPORT | 43 |
Table of Contents
ANN-NXS (6-19)
Table of Contents
| ITEM 2. | CODE OF ETHICS |
| (a) | As of June 30, 2019, the Registrant has adopted a code of ethics (the “Code”), as defined in Item 2 of FormN-CSR, that applies to the Principal Executive Officer and Principal Financial Officer or persons performing similar functions, regardless of whether these individuals are employed by the registrant or a third party. A copy of this code of ethics is filed as an exhibit to thisForm N-CSR. |
| (b) | There have been no amendments, during the period covered by this report, to a provision of the Code that applies to the registrant’s Principal Executive Officer, Principal Financial Officer, Principal Accounting Officer or Controller, or persons performing similar functions, regardless of whether these individuals are employed by the registrant or a third party, and that relates to any element of the Code. |
| (c) | During the period covered by this report, the registrant did not grant any waivers, including an implicit waiver, from a provision of the Code that applies to the registrant’s Principal Executive Officer, Principal Financial Officer, Principal Accounting Officer or Controller, or persons performing similar functions, regardless of whether those individuals were employed by the registrant or a third party, that related to one or more of the items set forth in paragraph (b) of this item’s instructions. |
| ITEM 3. | AUDIT COMMITTEE FINANCIAL EXPERT |
The Board of Trustees of the Registrant has determined that each of H. Jeffrey Dobbs, James D. Gressett and Edward M. Tighe is an audit committee financial expert, as defined in Item 3 of FormN-CSR, serving on its audit committee. Each of Mr. Dobbs, Mr. Gressett and Mr. Tighe is independent for purposes of Item 3 of FormN-CSR. Under applicable securities laws, a person who is determined to be an audit committee financial expert will not be deemed an “expert” for any purpose, including without limitation for the purposes of Section 11 of the Securities Act of 1933, as a result of being designated or identified as an audit committee financial expert. The designation or identification of a person as an audit committee financial expert does not impose on such person any duties, obligations, or liability that are greater than the duties, obligations, and liability imposed on such person as a member of the audit committee and board of trustees in the absence of such designation or identification. The designation or identification of a person as an audit committee financial expert does not affect the duties, obligations, or liability of any other member of the audit committee or board of trustees.
Table of Contents
| ITEM 4. | PRINCIPAL ACCOUNTANT FEES AND SERVICES. |
| (a) | Audit Fees |
The aggregate fees billed for professional services rendered by the principal accountant for the audit of the registrant’s annual financial statements or services that are normally provided by the accountant in connection with statutory and regulatory filings or engagements for each of the last two fiscal years are as follows:
2018 | $ | 61,800 | ||
2019 | 63,600 |
| (b) | Audit-Related Fees |
The aggregate fees billed for assurance and related services by the principal accountant that are reasonably related to the performance of the audit of the registrant’s annual financial statements and are not reported under paragraph (a) of this Item are as follows:
2018 | $ | 0 | ||
2019 | 0 |
These fees are related to the review of FormN-1A.
| (c) | Tax Fees |
The aggregate fees billed for professional services rendered by the principal accountant for tax compliance, tax advice and tax planning are as follows:
2018 | $ | 13,365 | ||
2019 | 13,770 |
These fees are related to the review of the registrant’s tax returns.
| (d) | All Other Fees |
The aggregate fees billed for products and services provided by the principal accountant, other than the services reported in paragraphs (a) through (c) of this item are as follows:
2018 | $ | 0 | ||
2019 | 1,130 |
These fees are related to the review of internal control.
| (e) | (1) | Registrant’s audit committee considers with the principal accountants all audit services to be provided by the principal accountants andpre-approves all such audit services. |
The audit committee shallpre-approve allnon-audit services to be provided by the principal accountants to the registrant;
Table of Contents
provided that thepre-approval requirement does not apply tonon-audit services that (i) were not identified as such at the time of thepre-approval and (ii) do not aggregate more than 5% of total fees paid to the principal accountants by the registrant during the fiscal year in which the services are provided, if the audit committee approves the provision of suchnon-audit services prior to the completion of the audit.
The audit committee shallpre-approve allnon-audit services to be provided by the principal accountants to the investment adviser (not including any subadvisor whose role is primarily portfolio management and is subcontracted and overseen by the investment advisor) or any entity controlling, controlled by, or under common control with the investment adviser that provides ongoing services to the registrant if the engagement relates directly to the operations or financial reporting of the registrant; provided that thepre-approval requirement does not apply tonon-audit services that (i) were not identified as such at the time of thepre-approval and (ii) do not aggregate more than 5% of total fees paid to the principal accountants by the registrant for all services and by the registrant’s investment adviser fornon-audit services if the engagement relates directly to the operations or financial reporting of the registrant during the fiscal year in which those services are provided, if the audit committee approves the provision of suchnon-audit services prior to the completion of the audit.
| (e) | (2) | None of the services described in each of paragraphs (b) through (d) of this Item were approved by the audit committee pursuant to the waiver provisions of paragraph (c)(7)(i)(C) of Rule2-01 of RegulationS-X. |
| (f) | Not applicable |
| (g) | $13,365 and $14,900 are the aggregatenon-audit fees billed in each of the last two fiscal years for services rendered by the principal accountant to the registrant. $97,700 and $41,300 are the aggregatenon-audit fees billed in each of the last two fiscal years for services rendered by the principal accountant to the investment adviser (not including anysub-adviser whose role is primarily portfolio management and is subcontracted with or overseen by another investment adviser) and any entity controlling, controlled by, or under common control with the adviser that provides ongoing services to the registrant. |
| (h) | Not Applicable. |
| ITEM 5. | AUDIT COMMITTEE OF LISTED REGISTRANTS |
Not applicable.
Table of Contents
| ITEM 6. | SCHEDULE OF INVESTMENTS. |
| (a) | See Item 1 Shareholder Report. |
| (b) | Not Applicable. |
| ITEM 7. | DISCLOSURE OF PROXY VOTING POLICIES AND PROCEDURES FORCLOSED-END MANAGEMENT INVESTMENT COMPANIES |
Not applicable.
| ITEM 8. | PORTFOLIO MANAGERS OFCLOSED-END MANAGEMENT INVESTMENT COMPANIES. |
Not applicable.
| ITEM 9. | PURCHASES OF EQUITY SECURITIES BYCLOSED-END MANAGEMENT INVESTMENT COMPANIES AND AFFILIATED PURCHASERS |
Not applicable.
| ITEM 10. | SUBMISSION OF MATTERS TO A VOTE OF SECURITY HOLDERS |
There have been no material changes to the procedures by which shareholders may recommend nominees to the Registrant’s board of trustees.
| ITEM 11. | CONTROLS AND PROCEDURES. |
| (a) | The Registrant’s Principal Executive Officer and Principal Financial Officer, or persons performing similar functions, based on their evaluation of the Registrant’s disclosure controls and procedures as of a date within 90 days of the filing date of this report, have concluded that such controls and procedures (as defined in Rule30a-3(c) under the Investment Company Act of 1940, as amended) are effective and adequately designed to ensure that information required to be disclosed by the Registrant in its reports that it files or submits is accumulated and communicated to the Registrant’s management, including the Principal Executive Officer and Principal Financial Officer, or persons performing similar functions, as appropriate, to allow timely decisions regarding required disclosure. |
| (b) | There were no significant changes in the registrant’s internal controls over financial reporting (as defined in Rule30a-3(d) under the Investment Company Act of 1940, as amended) that occurred during the registrant’s second fiscal quarter of the period covered by this report that has materially affected, or is reasonably likely to materially affect, the registrant’s internal control over financial reporting. |
| ITEM 12. | EXHIBITS. |
(a)(1) The Code described in Item 2 of this FormN-CSR.
Attached hereto as Exhibit 99.CODE.
Table of Contents
(a)(2) A separate certification for each principal executive officer and principal financial officer of the registrant as required byRule 30a-2(a) under the Investment Company Act of 1940 (17 CFR270.30a-2(a)).
Attached hereto as Exhibit 99.CERT.
(b) A separate certification for each principal executive officer and principal financial officer of the registrant as required byRule 30a-2(b) under the Investment Company Act of 1940 (17 CFR270.30a-2(b)).
Attached hereto as Exhibit 99.906CERT.
Table of Contents
SIGNATURES
Pursuant to the requirements of the Securities Exchange Act of 1934 and the Investment Company Act of 1940, the registrant has duly caused this report to be signed on its behalf by the undersigned, thereunto duly authorized.
IVY NEXTSHARES
(Registrant)
| By | /s/ Jennifer K. Dulski | |
| Jennifer K. Dulski, Secretary | ||
| Date: | September 6, 2019 | |
Pursuant to the requirements of the Securities Exchange Act of 1934 and the Investment Company Act of 1940, this report has been signed below by the following persons on behalf of the registrant and in the capacities and on the dates indicated.
| By | /s/ Philip J. Sanders | |
| Philip J. Sanders, Principal Executive Officer | ||
| Date: | September 6, 2019 | |
| By | /s/ Joseph W. Kauten | |
| Joseph W. Kauten, Principal Financial Officer | ||
| Date: | September 6, 2019 | |