| Earnings Presentation Q2 2024 22 August 2024 ● BW LPG Earnings Presentation |
| Disclaimer and Forward-Looking Statements NOT FOR RELEASE, PUBLICATION, DISTRIBUTION OR FORWARDING, IN WHOLE OR IN PART, DIRECTLY OR INDIRECTLY, IN OR IN TO ANY JURISDICTION IN WHICH THE SAME WOULD BE UNLAWFUL. BY ATTENDING THE MEETING WHERE THIS PRESENTATION IS MADE, OR BY READING THE PRESENTATION SLIDES, YOU ACKNOWLEDGE AND AGREE TO COMPLY WITH THE FOLLOWING RESTRICTIONS. This presentation has been produced by BW LPG Limited (“BW LPG”) exclusively for information purposes. This presentation may not be reproduced or redistributed, in whole or in part, to any other person. Matters discussed in this presentation and any materials distributed in connection with this presentation may constitute or include forward–looking statements. Forward–looking statements are statements that are not historical facts and may be identified by words such as “anticipates”, “believes”, “continues”, “estimates”, “expects”, “intends”, “may”, “should”, “will” and similar expressions, such as “going forward”. These forward–looking statements reflect BW LPG’s reasonable beliefs, intentions and current expectations concerning, among other things, BW LPG’s results of operations, financial condition, liquidity, prospects, growth and strategies. Forward–looking statements include statements regarding: objectives, goals, strategies, outlook and growth prospects; future plans, events or performance and potential for future growth; liquidity, capital resources and capital expenditures; economic outlook and industry trends; developments of BW LPG’s markets; the impact of regulatory initiatives; and the strength of BW LPG’s competitors. Forward–looking statements involve risks and uncertainties because they relate to events and depend on circumstances that may or may not occur in the future. The forward–looking statements in this presentation are based upon various assumptions, many of which are based, in turn, upon further assumptions, including without limitation, management’s examination of historical operating trends, data contained in BW LPG’s records and other data available from Fourth parties. Although BW LPG believes that these assumptions were reasonable when made, these assumptions are inherently subject to significant known and unknown risks, uncertainties, contingencies and other important factors which are difficult or impossible to predict and are beyond its control. Forward–looking statements are not guarantees of future performance and such risks, uncertainties, contingencies and other important factors could cause the actual results of operations, financial condition and liquidity of BW LPG or the industry to differ materially from those results expressed or implied in this presentation by such forward–looking statements. No representation is made that any of these forward–looking statements or forecasts will come to pass or that any forecast result will be achieved and you are cautioned not to place any undue influence on any forward–looking statement. 2 No representation, warranty or undertaking, express or implied, is made by BW LPG, its affiliates or representatives as to, and no reliance should be placed on, the fairness, accuracy, completeness or correctness of the information or the opinions contained herein, for any purpose whatsoever. Neither BW LPG nor any of its affiliates or representatives shall have any responsibility or liability whatsoever (for negligence or otherwise) for any loss whatsoever and howsoever arising from any use of this presentation or its contents or otherwise arising in connection with this presentation. All information in this presentation is subject to updating, revision, verification, correction, completion, amendment and may change materially and without notice. In giving this presentation, none of BW LPG, its affiliates or representatives undertakes any obligation to provide the recipient with access to any additional information or to update this presentation or any information or to correct any inaccuracies in any such information. The information contained in this presentation should be considered in the context of the circumstances prevailing at the time and has not been, and will not be, updated to reflect material developments which may occur after the date of the presentation. The contents of this presentation are not to be construed as legal, business, investment or tax advice. Each recipient should consult its own legal, business, investment or tax adviser as to legal, business, investment or tax advice. By attending this presentation you acknowledge that you will be solely responsible for your own assessment of the market and the market position of BW LPG and that you will conduct your own analysis and be solely responsible for forming your own view on the potential future performance of the business of BW LPG. This presentation must be read in conjunction with the recent financial information and the disclosures therein. Neither this presentation nor anything contained herein shall form the basis of, or be relied upon in connection with, any offer or purchase whatsoever in any jurisdiction and shall not constitute or form part of an offer to sell or the solicitation of an offer to buy any securities in the United States or in any other jurisdiction. The securities referred to herein may not be offered or sold in the United States absent registration with the United States Securities and Exchange Commission or an exemption from registration under the U.S. Securities Act of 1933, as amended (the “Securities Act”). BW LPG does not intend to register any part of any offering in the United States or to conduct a public offering in the United States of the shares to which this presentation relates. In the EEA Member States, with the exception of Norway (each such EEA Member State, a “Relevant State“), this presentation and the information contained herein are intended only for and directed to qualified investors as defined in Article 2(e) of Regulation (EU) 2017/1129 of the European Parliament and of the Council of 14 June 2017 (the “Prospectus Regulation”). The securities mentioned in this presentation are not intended to be offered to the public in any Relevant State and are only available to qualified investors except in accordance with exceptions in the Prospectus Regulation. Persons in any Relevant State who are not qualified investors should not take any actions based on this presentation, nor rely on it. In the United Kingdom, this presentation is directed only at, and communicated only to, persons who are qualified investors within the meaning of Article 2(e) of the Prospectus Regulation as it forms part of domestic law in the United Kingdom by virtue of the European Union (Withdrawal) Act 2018 who are (i) persons who fall within the definition of "investment professional" in Article 19(5) of the Financial Services and Markets Act 2000 (Financial Promotion) Order 2005, as amended (the “Order”), or (ii) persons who fall within Article 49(2)(a) to (d) of the Order, or (iii) persons to whom it may otherwise be lawfully communicated (all such persons referred to in (i), (ii) and (iii) above together being referred to as “Relevant Persons”). This presentation must not be acted on or relied on by persons in the United Kingdom who are not Relevant Persons. |
| Agenda 01 Highlights 02 Market 03 Performance 04 Q&A |
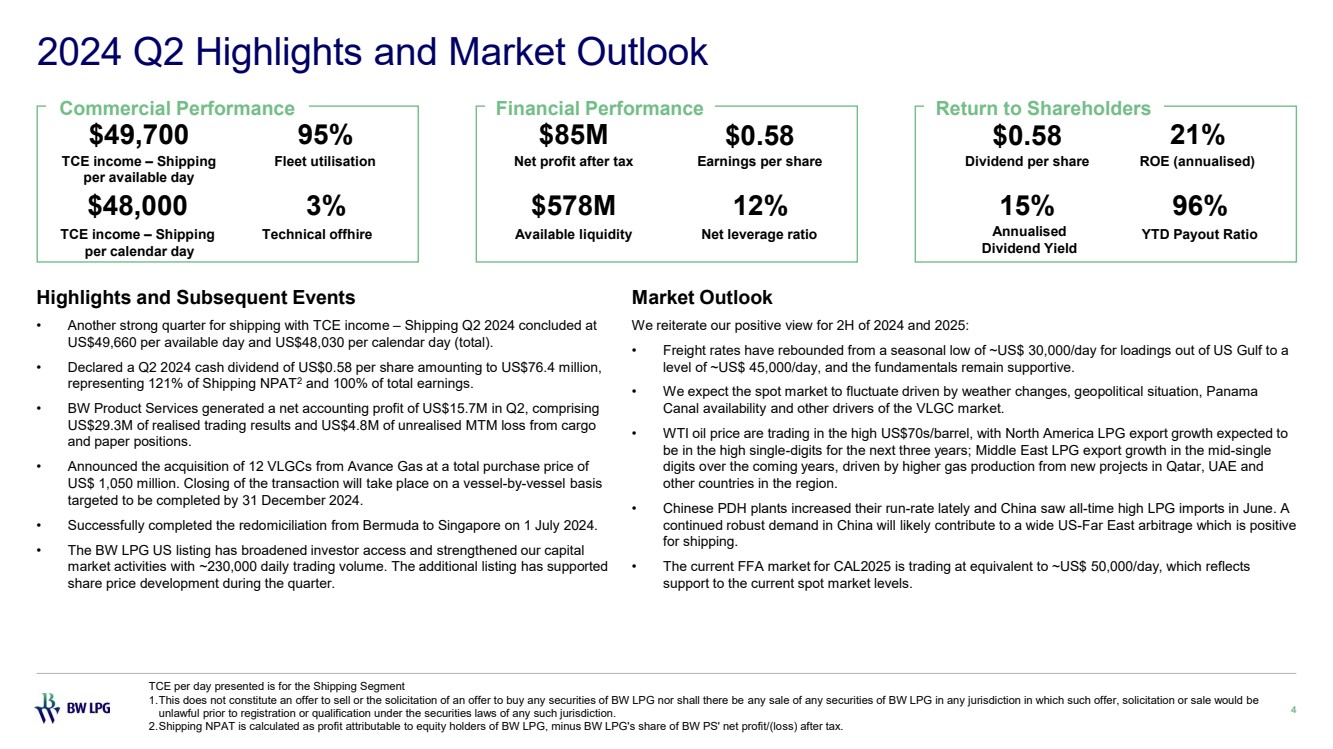
| 2024 Q2 Highlights and Market Outlook Highlights and Subsequent Events • Another strong quarter for shipping with TCE income – Shipping Q2 2024 concluded at US$49,660 per available day and US$48,030 per calendar day (total). • Declared a Q2 2024 cash dividend of US$0.58 per share amounting to US$76.4 million, representing 121% of Shipping NPAT2 and 100% of total earnings. • BW Product Services generated a net accounting profit of US$15.7M in Q2, comprising US$29.3M of realised trading results and US$4.8M of unrealised MTM loss from cargo and paper positions. • Announced the acquisition of 12 VLGCs from Avance Gas at a total purchase price of US$ 1,050 million. Closing of the transaction will take place on a vessel-by-vessel basis targeted to be completed by 31 December 2024. • Successfully completed the redomiciliation from Bermuda to Singapore on 1 July 2024. • The BW LPG US listing has broadened investor access and strengthened our capital market activities with ~230,000 daily trading volume. The additional listing has supported share price development during the quarter. 4 Market Outlook We reiterate our positive view for 2H of 2024 and 2025: • Freight rates have rebounded from a seasonal low of ~US$ 30,000/day for loadings out of US Gulf to a level of ~US$ 45,000/day, and the fundamentals remain supportive. • We expect the spot market to fluctuate driven by weather changes, geopolitical situation, Panama Canal availability and other drivers of the VLGC market. • WTI oil price are trading in the high US$70s/barrel, with North America LPG export growth expected to be in the high single-digits for the next three years; Middle East LPG export growth in the mid-single digits over the coming years, driven by higher gas production from new projects in Qatar, UAE and other countries in the region. • Chinese PDH plants increased their run-rate lately and China saw all-time high LPG imports in June. A continued robust demand in China will likely contribute to a wide US-Far East arbitrage which is positive for shipping. • The current FFA market for CAL2025 is trading at equivalent to ~US$ 50,000/day, which reflects support to the current spot market levels. TCE per day presented is for the Shipping Segment 1.This does not constitute an offer to sell or the solicitation of an offer to buy any securities of BW LPG nor shall there be any sale of any securities of BW LPG in any jurisdiction in which such offer, solicitation or sale would be unlawful prior to registration or qualification under the securities laws of any such jurisdiction. 2.Shipping NPAT is calculated as profit attributable to equity holders of BW LPG, minus BW LPG's share of BW PS' net profit/(loss) after tax. $49,700 TCE income – Shipping per available day 95% Fleet utilisation $48,000 TCE income – Shipping per calendar day 3% Technical offhire Commercial Performance Financial Performance Return to Shareholders $85M Net profit after tax $578M Available liquidity $0.58 Earnings per share 12% Net leverage ratio $0.58 Dividend per share 21% ROE (annualised) YTD Payout Ratio 15% 96% Annualised Dividend Yield |
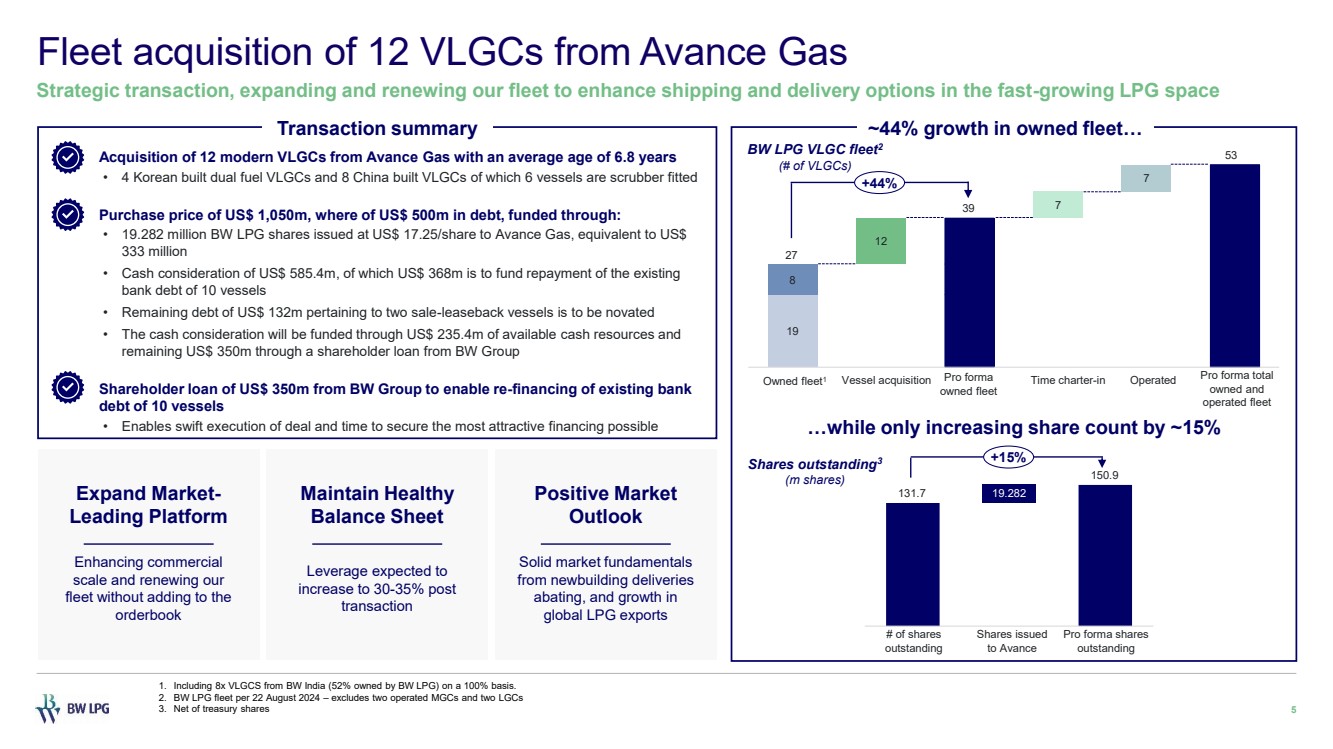
| Fleet acquisition of 12 VLGCs from Avance Gas 5 Strategic transaction, expanding and renewing our fleet to enhance shipping and delivery options in the fast-growing LPG space 1. Including 8x VLGCS from BW India (52% owned by BW LPG) on a 100% basis. 2. BW LPG fleet per 22 August 2024 – excludes two operated MGCs and two LGCs 3. Net of treasury shares 19 8 12 7 7 Owned fleet1 Vessel acquisition Pro forma owned fleet Time charter-in Operated Pro forma total owned and operated fleet 27 39 53 +44% ~44% growth in owned fleet… …while only increasing share count by ~15% # of shares outstanding Shares issued to Avance Pro forma shares outstanding 131.7 150.9 19.282 Shares outstanding3 (m shares) +15% BW LPG VLGC fleet2 (# of VLGCs) Transaction summary ✓ Acquisition of 12 modern VLGCs from Avance Gas with an average age of 6.8 years • 4 Korean built dual fuel VLGCs and 8 China built VLGCs of which 6 vessels are scrubber fitted ✓ Purchase price of US$ 1,050m, where of US$ 500m in debt, funded through: • 19.282 million BW LPG shares issued at US$ 17.25/share to Avance Gas, equivalent to US$ 333 million • Cash consideration of US$ 585.4m, of which US$ 368m is to fund repayment of the existing bank debt of 10 vessels • Remaining debt of US$ 132m pertaining to two sale-leaseback vessels is to be novated • The cash consideration will be funded through US$ 235.4m of available cash resources and remaining US$ 350m through a shareholder loan from BW Group ✓ Shareholder loan of US$ 350m from BW Group to enable re-financing of existing bank debt of 10 vessels • Enables swift execution of deal and time to secure the most attractive financing possible Positive Market Outlook Solid market fundamentals from newbuilding deliveries abating, and growth in global LPG exports Expand Market-Leading Platform Enhancing commercial scale and renewing our fleet without adding to the orderbook Maintain Healthy Balance Sheet Leverage expected to increase to 30-35% post transaction |
| Market 6 02 |
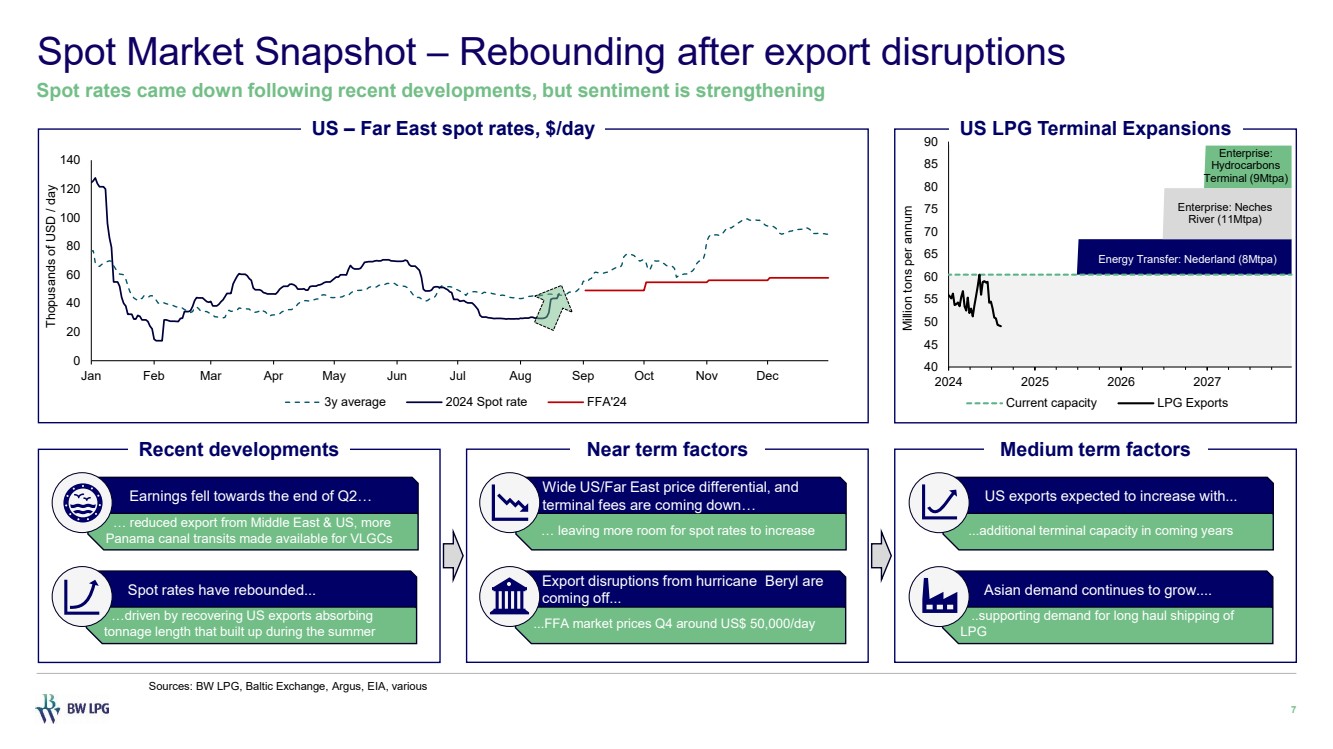
| Energy Transfer: Nederland (8Mtpa) Enterprise: Neches River (11Mtpa) Enterprise: Hydrocarbons Terminal (9Mtpa) 40 45 50 55 60 65 70 75 80 85 90 2024 2025 2026 2027 Million tons per annum Current capacity LPG Exports Spot Market Snapshot – Rebounding after export disruptions 7 Spot rates came down following recent developments, but sentiment is strengthening US – Far East spot rates, $/day Recent developments Near term factors Medium term factors US LPG Terminal Expansions Sources: BW LPG, Baltic Exchange, Argus, EIA, various 0 20 40 60 80 100 120 140 Jan Feb Mar Apr May Jun Jul Aug Sep Oct Nov Dec Thopusands of USD / day 3y average 2024 Spot rate FFA'24 …driven by recovering US exports absorbing tonnage length that built up during the summer … leaving more room for spot rates to increase Wide US/Far East price differential, and terminal fees are coming down… ...additional terminal capacity in coming years US exports expected to increase with... Spot rates have rebounded... … reduced export from Middle East & US, more Panama canal transits made available for VLGCs Earnings fell towards the end of Q2… ....FFA market prices Q4 around US$ 50,000/day Export disruptions from hurricane Beryl are coming off... ..supporting demand for long haul shipping of LPG Asian demand continues to grow.... |
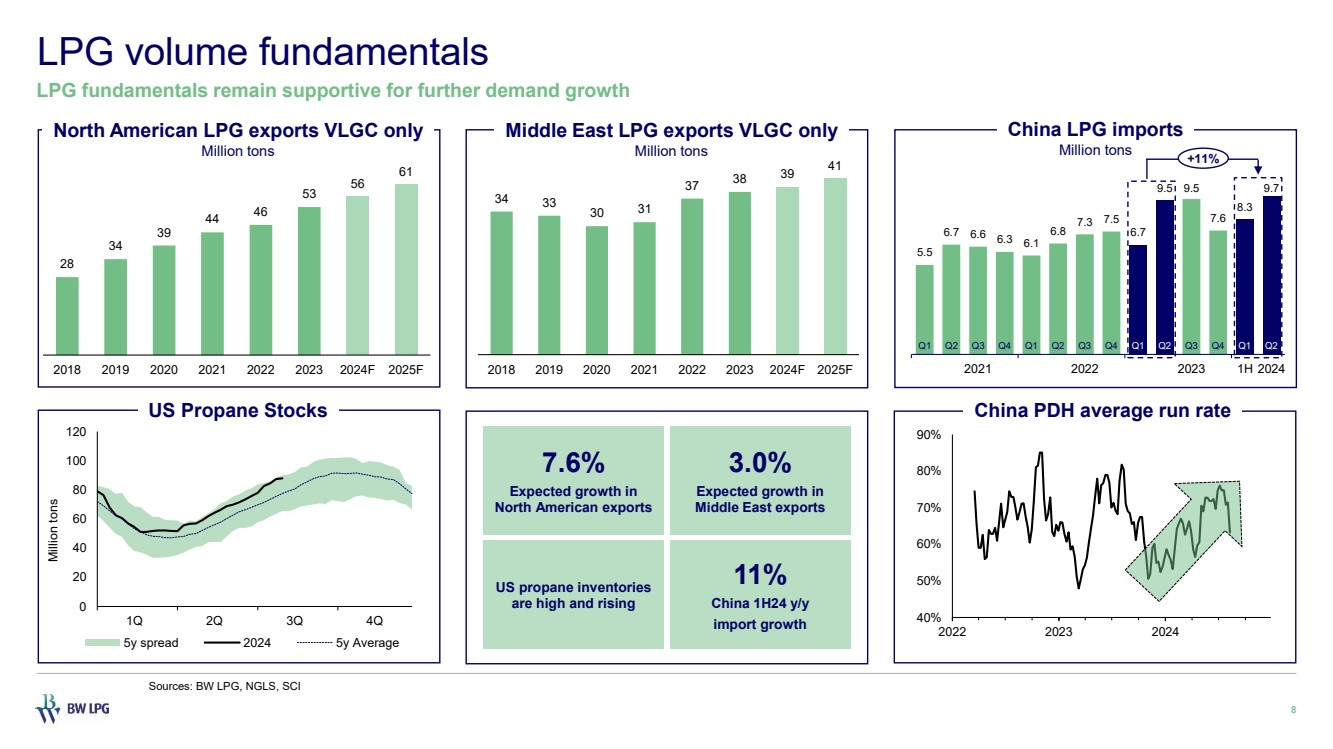
| 40% 50% 60% 70% 80% 90% 2022 2023 2024 LPG volume fundamentals 8 LPG fundamentals remain supportive for further demand growth 28 34 39 44 46 53 56 61 2018 2019 2020 2021 2022 2023 2024F 2025F North American LPG exports VLGC only Million tons 34 33 30 31 37 38 39 41 2018 2019 2020 2021 2022 2023 2024F 2025F Middle East LPG exports VLGC only Million tons 5.5 6.7 6.6 6.3 6.1 6.8 7.3 7.5 6.7 9.5 9.5 7.6 8.3 9.7 2021 2022 2023 1H 2024 China LPG imports Million tons China PDH average run rate Sources: BW LPG, NGLS, SCI 0 20 40 60 80 100 120 1Q 2Q 3Q 4Q Million tons 5y spread 2024 5y Average US Propane Stocks 7.6% Expected growth in North American exports 3.0% Expected growth in Middle East exports 11% China 1H24 y/y import growth US propane inventories are high and rising +11% Q1 Q2 Q3 Q4 Q1 Q2 Q3 Q4 Q1 Q2 Q3 Q4 Q1 Q2 |
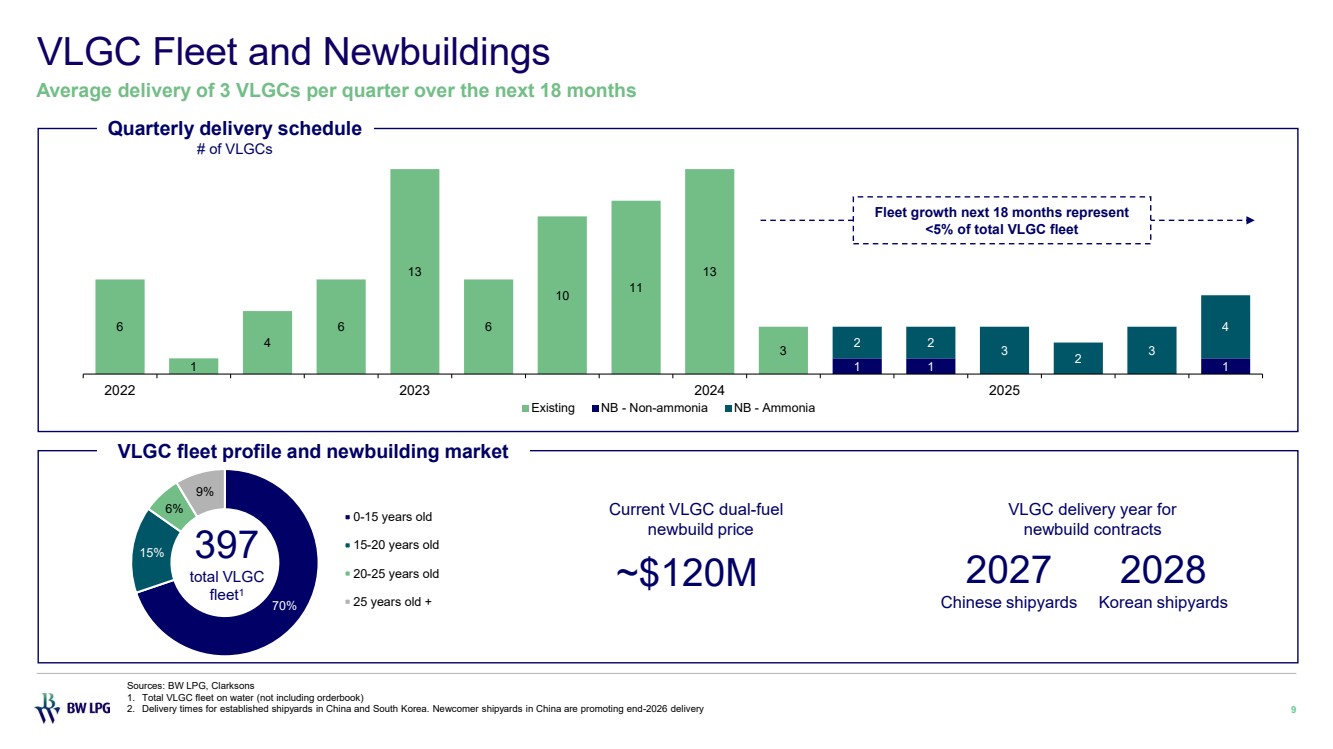
| VLGC Fleet and Newbuildings 9 Average delivery of 3 VLGCs per quarter over the next 18 months Sources: BW LPG, Clarksons 1. Total VLGC fleet on water (not including orderbook) 2. Delivery times for established shipyards in China and South Korea. Newcomer shipyards in China are promoting end-2026 delivery Quarterly delivery schedule # of VLGCs 6 1 4 6 13 6 10 11 13 3 1 1 1 2 2 3 2 3 4 2022 2023 2024 2025 Existing NB - Non-ammonia NB - Ammonia Fleet growth next 18 months represent <5% of total VLGC fleet VLGC fleet profile and newbuilding market 70% 15% 6% 9% 0-15 years old 15-20 years old 20-25 years old 25 years old + 397 total VLGC fleet1 ~$120M VLGC delivery year for newbuild contracts 2028 Korean shipyards 2027 Chinese shipyards Current VLGC dual-fuel newbuild price |
| Performance 10 03 |
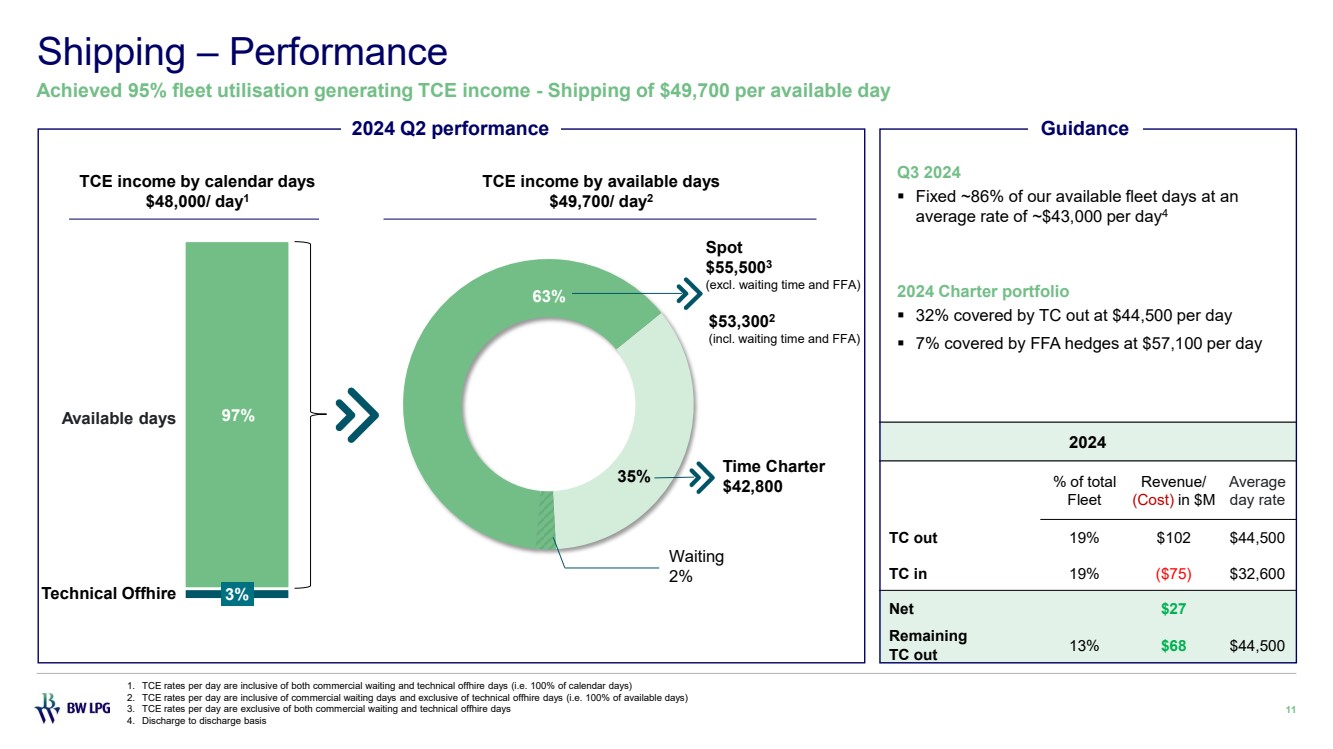
| 2024 % of total Fleet Revenue/ (Cost) in $M Average day rate TC out 19% $102 $44,500 TC in 19% ($75) $32,600 Net $27 Remaining TC out 13% $68 $44,500 Shipping – Performance 11 Achieved 95% fleet utilisation generating TCE income - Shipping of $49,700 per available day 2024 Q2 performance Q3 2024 ▪ Fixed ~86% of our available fleet days at an average rate of ~$43,000 per day4 Guidance 2024 Charter portfolio ▪ 32% covered by TC out at $44,500 per day ▪ 7% covered by FFA hedges at $57,100 per day 3% 97% TCE income by calendar days $48,000/ day1 Technical Offhire Available days 35% 63% TCE income by available days $49,700/ day2 $53,3002 (incl. waiting time and FFA) Spot $55,5003 (excl. waiting time and FFA) Time Charter $42,800 Waiting 2% 1. TCE rates per day are inclusive of both commercial waiting and technical offhire days (i.e. 100% of calendar days) 2. TCE rates per day are inclusive of commercial waiting days and exclusive of technical offhire days (i.e. 100% of available days) 3. TCE rates per day are exclusive of both commercial waiting and technical offhire days 4. Discharge to discharge basis |
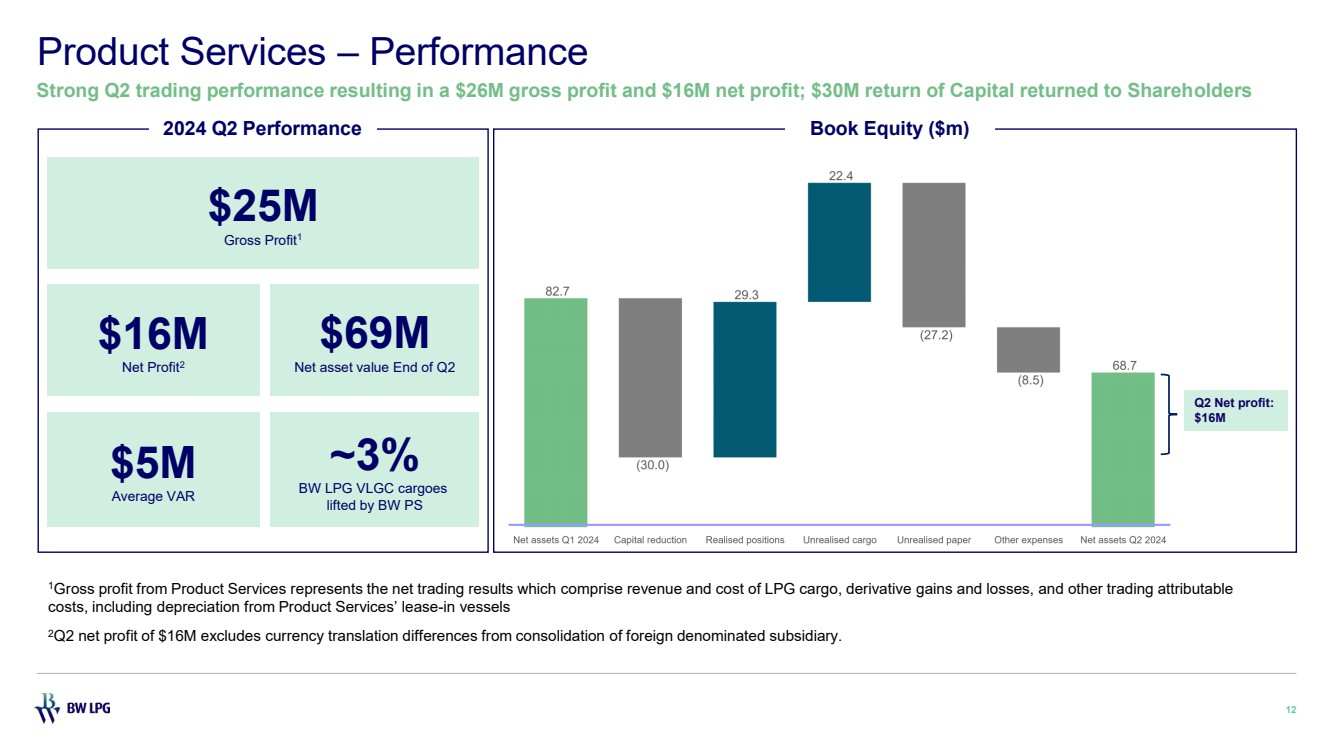
| Q2 Net profit: $16M 1Gross profit from Product Services represents the net trading results which comprise revenue and cost of LPG cargo, derivative gains and losses, and other trading attributable costs, including depreciation from Product Services’ lease-in vessels 2Q2 net profit of $16M excludes currency translation differences from consolidation of foreign denominated subsidiary. 12 Product Services – Performance 2024 Q2 Performance Book Equity ($m) Strong Q2 trading performance resulting in a $26M gross profit and $16M net profit; $30M return of Capital returned to Shareholders $25M Gross Profit1 $16M Net Profit2 $69M Net asset value End of Q2 $5M Average VAR ~3% BW LPG VLGC cargoes lifted by BW PS |
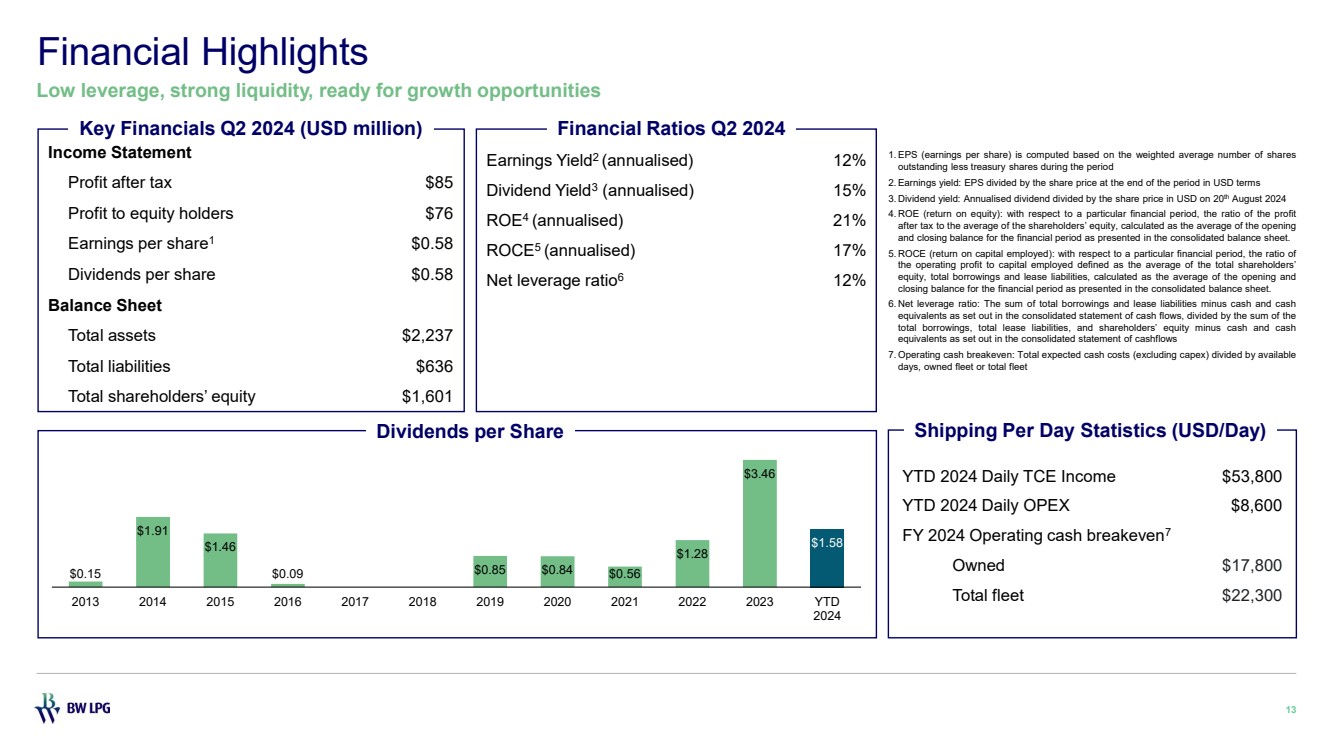
| $0.15 $1.91 $1.46 $0.09 $0.85 $0.84 $0.56 $1.28 $3.46 $1.58 2013 2014 2015 2016 2017 2018 2019 2020 2021 2022 2023 YTD 2024 Financial Highlights 13 Low leverage, strong liquidity, ready for growth opportunities Earnings Yield2 (annualised) 12% Dividend Yield3 (annualised) 15% ROE4 (annualised) 21% ROCE5 (annualised) 17% Net leverage ratio6 12% 1. EPS (earnings per share) is computed based on the weighted average number of shares outstanding less treasury shares during the period 2. Earnings yield: EPS divided by the share price at the end of the period in USD terms 3. Dividend yield: Annualised dividend divided by the share price in USD on 20th August 2024 4. ROE (return on equity): with respect to a particular financial period, the ratio of the profit after tax to the average of the shareholders’ equity, calculated as the average of the opening and closing balance for the financial period as presented in the consolidated balance sheet. 5. ROCE (return on capital employed): with respect to a particular financial period, the ratio of the operating profit to capital employed defined as the average of the total shareholders’ equity, total borrowings and lease liabilities, calculated as the average of the opening and closing balance for the financial period as presented in the consolidated balance sheet. 6. Net leverage ratio: The sum of total borrowings and lease liabilities minus cash and cash equivalents as set out in the consolidated statement of cash flows, divided by the sum of the total borrowings, total lease liabilities, and shareholders’ equity minus cash and cash equivalents as set out in the consolidated statement of cashflows 7. Operating cash breakeven: Total expected cash costs (excluding capex) divided by available days, owned fleet or total fleet Financial Ratios Q2 2024 Income Statement Profit after tax $85 Profit to equity holders $76 Earnings per share1 $0.58 Dividends per share $0.58 Balance Sheet Total assets $2,237 Total liabilities $636 Total shareholders’ equity $1,601 Dividends per Share YTD 2024 Daily TCE Income $53,800 YTD 2024 Daily OPEX $8,600 FY 2024 Operating cash breakeven7 Owned $17,800 Total fleet $22,300 Shipping Per Day Statistics (USD/Day) Key Financials Q2 2024 (USD million) |
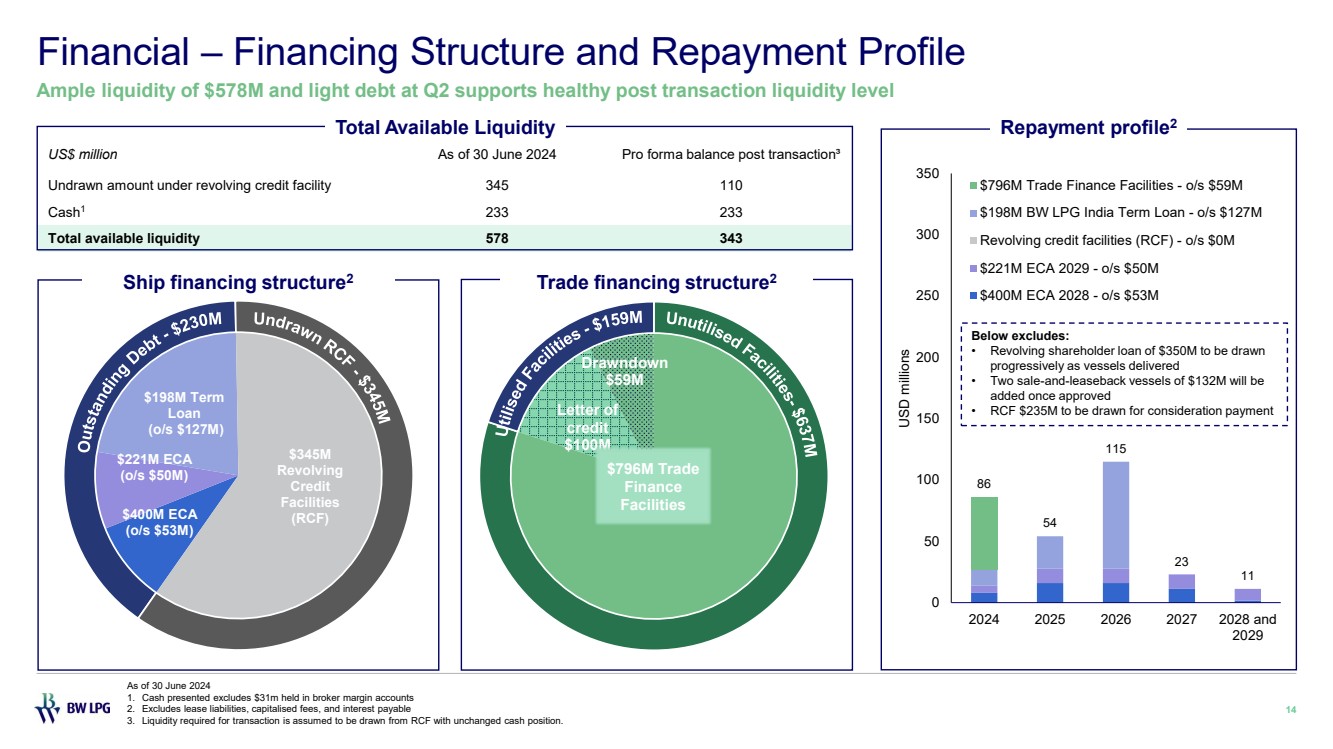
| $400M ECA (o/s $53M) $221M ECA (o/s $50M) $198M Term Loan (o/s $127M) $345M Revolving Credit Facilities (RCF) Undrawn RCF - $345M O utstanding Debt - $230M US$ million As of 30 June 2024 Pro forma balance post transaction³ Undrawn amount under revolving credit facility 345 110 Cash1 233 233 Total available liquidity 578 343 Financial – Financing Structure and Repayment Profile 14 Ample liquidity of $578M and light debt at Q2 supports healthy post transaction liquidity level Trade financing structure2 Total Available Liquidity As of 30 June 2024 1. Cash presented excludes $31m held in broker margin accounts 2. Excludes lease liabilities, capitalised fees, and interest payable 3. Liquidity required for transaction is assumed to be drawn from RCF with unchanged cash position. Ship financing structure2 86 54 115 23 11 0 50 100 150 200 250 300 350 2024 2025 2026 2027 2028 and 2029 USD millions $796M Trade Finance Facilities - o/s $59M $198M BW LPG India Term Loan - o/s $127M Revolving credit facilities (RCF) - o/s $0M $221M ECA 2029 - o/s $50M $400M ECA 2028 - o/s $53M Repayment profile2 Letter of credit $100M Drawndown $59M $796M Trade Finance Facilities Unutilised Facilities- $637 U M tilised Facilities - $159M Below excludes: • Revolving shareholder loan of $350M to be drawn progressively as vessels delivered • Two sale-and-leaseback vessels of $132M will be added once approved • RCF $235M to be drawn for consideration payment |
| Q&A 15 04 |
| Q&A CEO Kristian Sørensen CFO Samantha Xu |
| Contact Us Investor Relations investor.relations@bwlpg.com Ticker (OSE) / Ticker (NYSE) BWLPG / BWLP LinkedIn linkedin.com/company/bwlpg Telephone +65 6705 5588 Website https://investor.bwlpg.com Address 10 Pasir Panjang Road Mapletree Business City #17 -02 Singapore 117438 17 |
| Appendices 18 05 |
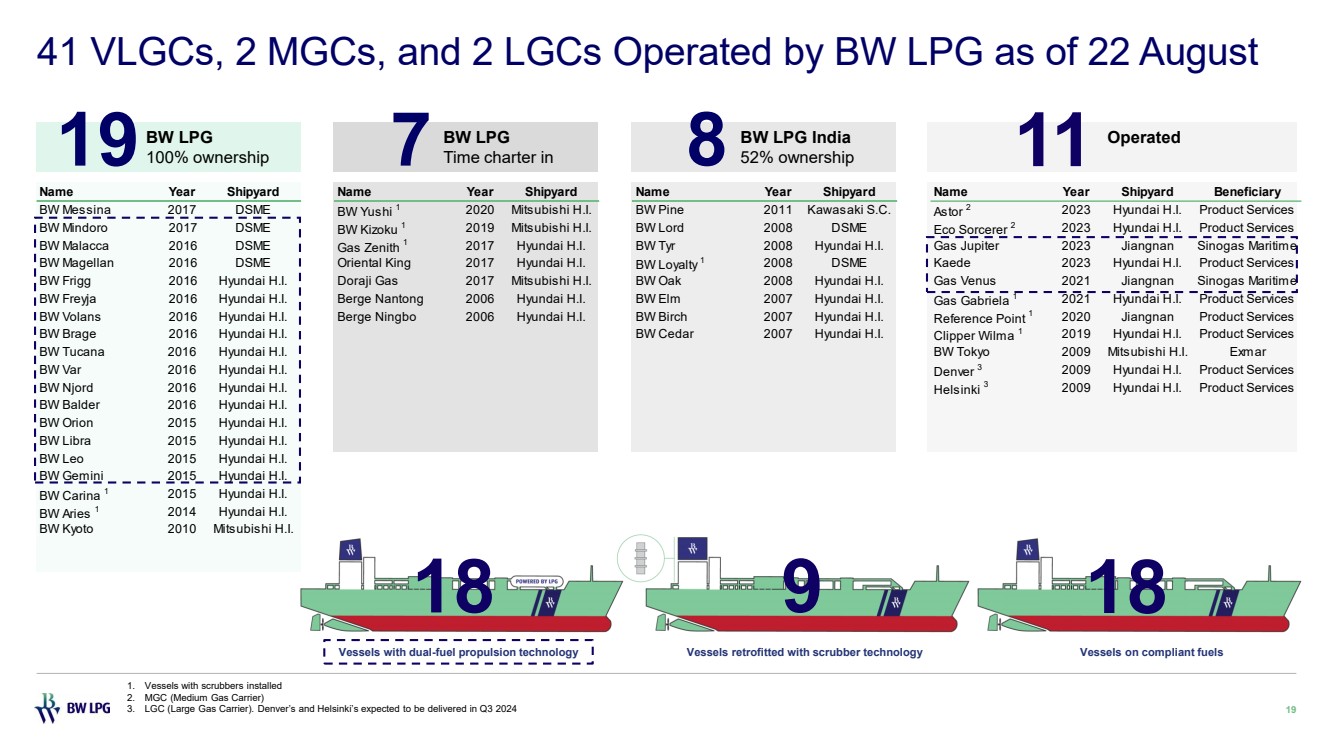
| 1. Vessels with scrubbers installed 2. MGC (Medium Gas Carrier) 3. LGC (Large Gas Carrier). Denver’s and Helsinki’s expected to be delivered in Q3 2024 41 VLGCs, 2 MGCs, and 2 LGCs Operated by BW LPG as of 22 August 19 BW LPG 19100% ownership BW LPG 7 Time charter in BW LPG India 52% ownership Operated 8 11 18 Vessels with dual-fuel propulsion technology Vessels retrofitted with scrubber technology Vessels on compliant fuels 9 18 Name Year Shipyard Name Year Shipyard Name Year Shipyard Name Year Shipyard Beneficiary BW Messina 2017 DSME BW Yushi 1 2020 Mitsubishi H.I. BW Pine 2011 Kawasaki S.C. Astor 2 2023 Hyundai H.I. Product Services BW Mindoro 2017 DSME BW Kizoku 1 2019 Mitsubishi H.I. BW Lord 2008 DSME Eco Sorcerer 2 2023 Hyundai H.I. Product Services BW Malacca 2016 DSME Gas Zenith 1 2017 Hyundai H.I. BW Tyr 2008 Hyundai H.I. Gas Jupiter 2023 Jiangnan Sinogas Maritime BW Magellan 2016 DSME Oriental King 2017 Hyundai H.I. BW Loyalty 1 2008 DSME Kaede 2023 Hyundai H.I. Product Services BW Frigg 2016 Hyundai H.I. Doraji Gas 2017 Mitsubishi H.I. BW Oak 2008 Hyundai H.I. Gas Venus 2021 Jiangnan Sinogas Maritime BW Freyja 2016 Hyundai H.I. Berge Nantong 2006 Hyundai H.I. BW Elm 2007 Hyundai H.I. Gas Gabriela 1 2021 Hyundai H.I. Product Services BW Volans 2016 Hyundai H.I. Berge Ningbo 2006 Hyundai H.I. BW Birch 2007 Hyundai H.I. Reference Point 1 2020 Jiangnan Product Services BW Brage 2016 Hyundai H.I. BW Cedar 2007 Hyundai H.I. Clipper Wilma 1 2019 Hyundai H.I. Product Services BW Tucana 2016 Hyundai H.I. BW Tokyo 2009 Mitsubishi H.I. Exmar BW Var 2016 Hyundai H.I. Denver 3 2009 Hyundai H.I. Product Services BW Njord 2016 Hyundai H.I. Helsinki 3 2009 Hyundai H.I. Product Services BW Balder 2016 Hyundai H.I. BW Orion 2015 Hyundai H.I. BW Libra 2015 Hyundai H.I. BW Leo 2015 Hyundai H.I. BW Gemini 2015 Hyundai H.I. BW Carina 1 2015 Hyundai H.I. BW Aries 1 2014 Hyundai H.I. BW Kyoto 2010 Mitsubishi H.I. |
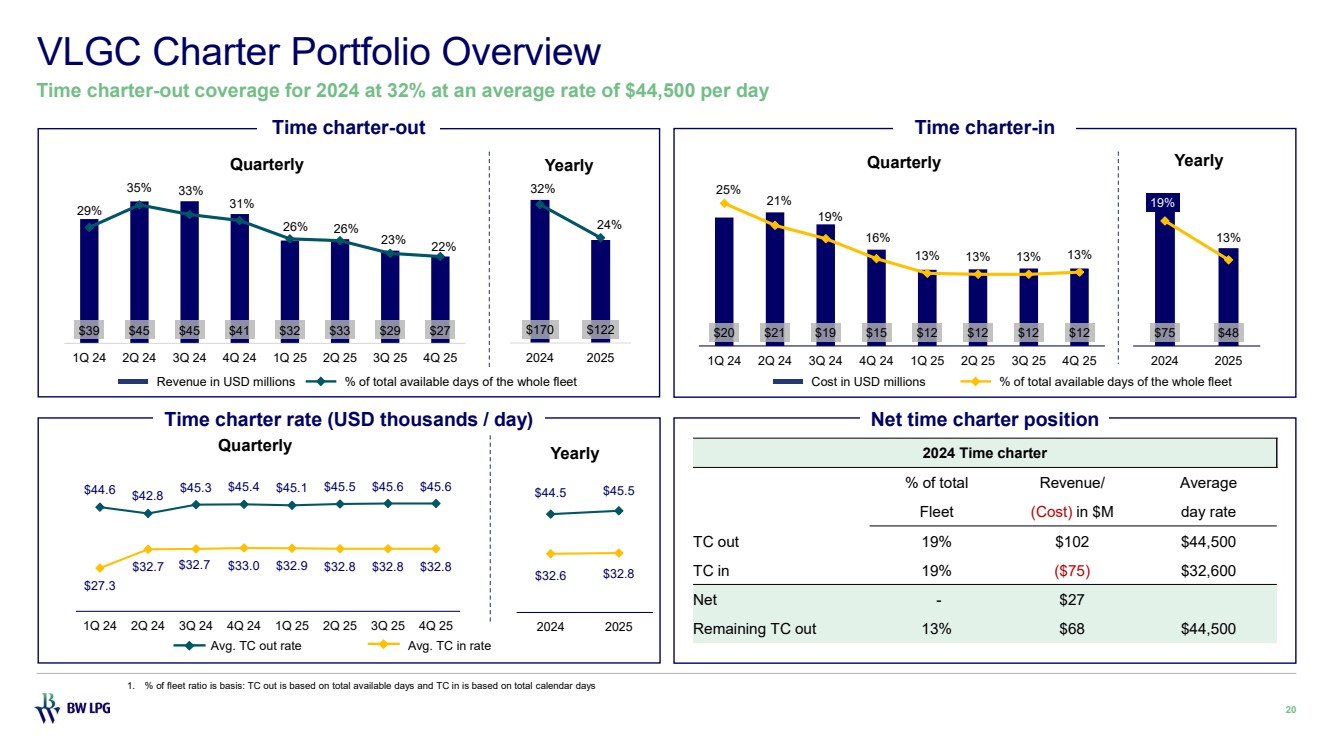
| 1. % of fleet ratio is basis: TC out is based on total available days and TC in is based on total calendar days VLGC Charter Portfolio Overview 20 Time charter-out coverage for 2024 at 32% at an average rate of $44,500 per day Revenue in USD millions % of total available days of the whole fleet Cost in USD millions % of total available days of the whole fleet Avg. TC out rate Avg. TC in rate Time charter-out Time charter rate (USD thousands / day) Time charter-in Net time charter position 2024 Time charter % of total Revenue/ Average Fleet (Cost) in $M day rate TC out 19% $102 $44,500 TC in 19% ($75) $32,600 Net - $27 Remaining TC out 13% $68 $44,500 $20 $21 $19 $15 $12 $12 $12 $12 25% 21% 19% 16% 13% 13% 13% 13% 1Q 24 2Q 24 3Q 24 4Q 24 1Q 25 2Q 25 3Q 25 4Q 25 Quarterly $75 $48 19% 13% 2024 2025 Yearly $44.6 $42.8 $45.3 $45.4 $45.1 $45.5 $45.6 $45.6 $27.3 $32.7 $32.7 $33.0 $32.9 $32.8 $32.8 $32.8 1Q 24 2Q 24 3Q 24 4Q 24 1Q 25 2Q 25 3Q 25 4Q 25 Quarterly $44.5 $45.5 $32.6 $32.8 2024 2025 Yearly $39 $45 $45 $41 $32 $33 $29 $27 29% 35% 33% 31% 26% 26% 23% 22% 1Q 24 2Q 24 3Q 24 4Q 24 1Q 25 2Q 25 3Q 25 4Q 25 Quarterly $170 $122 32% 24% 2024 2025 Yearly |
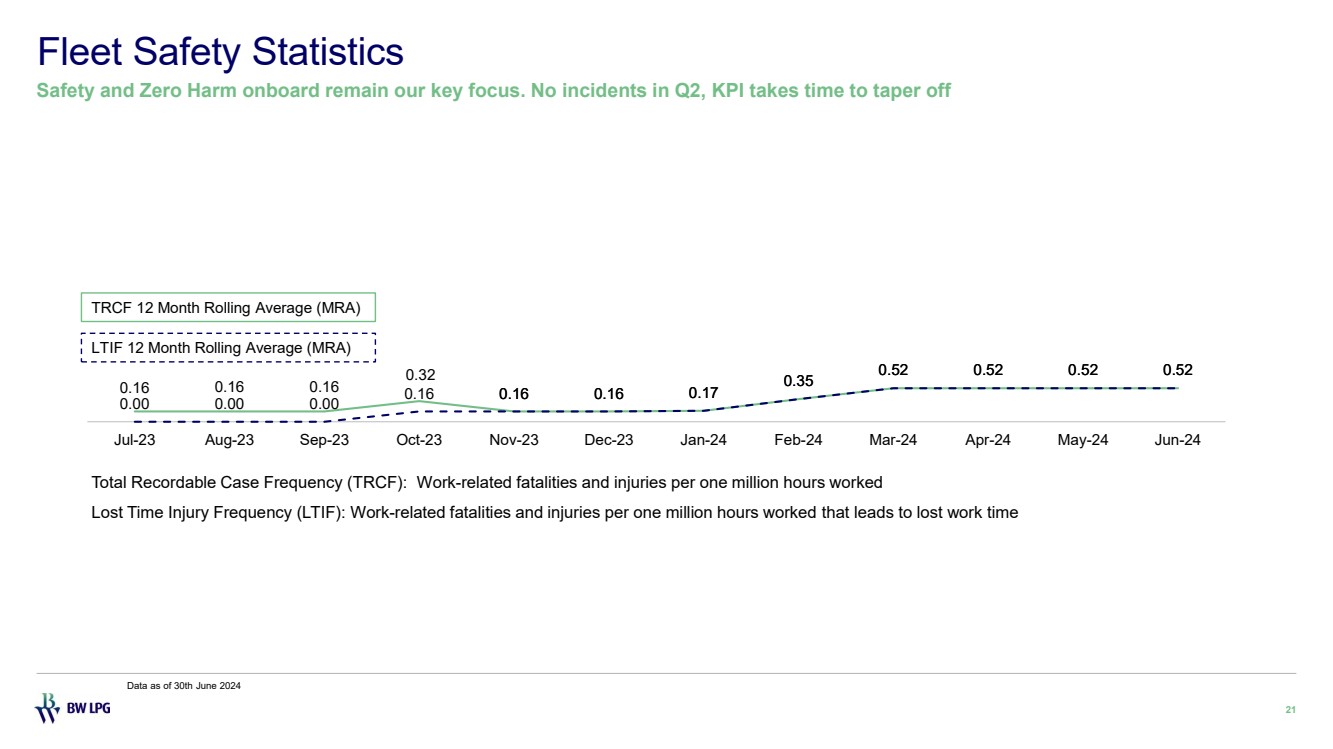
| 0.16 0.16 0.16 0.32 0.16 0.16 0.17 0.35 0.52 0.52 0.52 0.52 0.00 0.00 0.00 0.16 0.16 0.16 0.17 0.35 0.52 0.52 0.52 0.52 Jul-23 Aug-23 Sep-23 Oct-23 Nov-23 Dec-23 Jan-24 Feb-24 Mar-24 Apr-24 May-24 Jun-24 Fleet Safety Statistics 21 Safety and Zero Harm onboard remain our key focus. No incidents in Q2, KPI takes time to taper off Total Recordable Case Frequency (TRCF): Work-related fatalities and injuries per one million hours worked Lost Time Injury Frequency (LTIF): Work-related fatalities and injuries per one million hours worked that leads to lost work time TRCF 12 Month Rolling Average (MRA) LTIF 12 Month Rolling Average (MRA) Data as of 30th June 2024 |
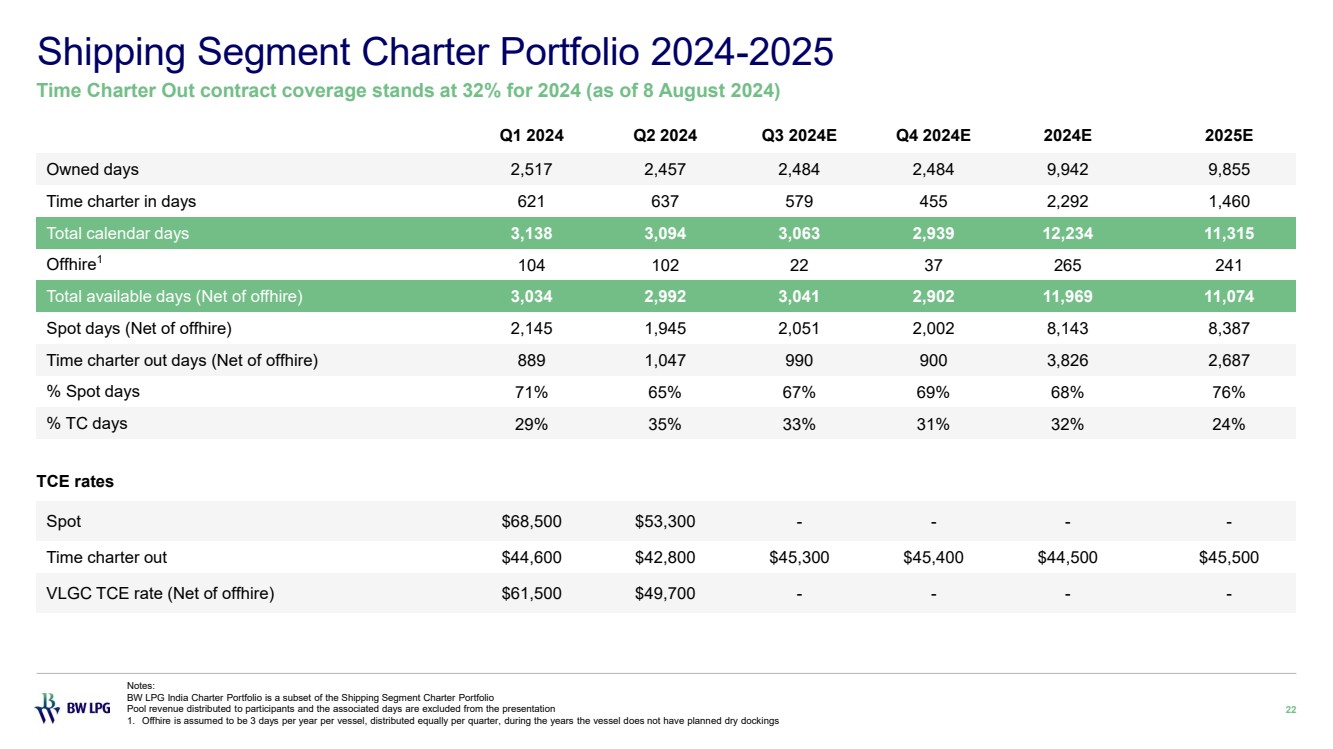
| Q1 2024 Q2 2024 Q3 2024E Q4 2024E 2024E 2025E Owned days 2,517 2,457 2,484 2,484 9,942 9,855 Time charter in days 621 637 579 455 2,292 1,460 Total calendar days 3,138 3,094 3,063 2,939 12,234 11,315 Offhire1 104 102 22 37 265 241 Total available days (Net of offhire) 3,034 2,992 3,041 2,902 11,969 11,074 Spot days (Net of offhire) 2,145 1,945 2,051 2,002 8,143 8,387 Time charter out days (Net of offhire) 889 1,047 990 900 3,826 2,687 % Spot days 71% 65% 67% 69% 68% 76% % TC days 29% 35% 33% 31% 32% 24% TCE rates Spot $68,500 $53,300 - - - - Time charter out $44,600 $42,800 $45,300 $45,400 $44,500 $45,500 VLGC TCE rate (Net of offhire) $61,500 $49,700 - - - - Shipping Segment Charter Portfolio 2024-2025 22 Time Charter Out contract coverage stands at 32% for 2024 (as of 8 August 2024) Notes: BW LPG India Charter Portfolio is a subset of the Shipping Segment Charter Portfolio Pool revenue distributed to participants and the associated days are excluded from the presentation 1. Offhire is assumed to be 3 days per year per vessel, distributed equally per quarter, during the years the vessel does not have planned dry dockings |
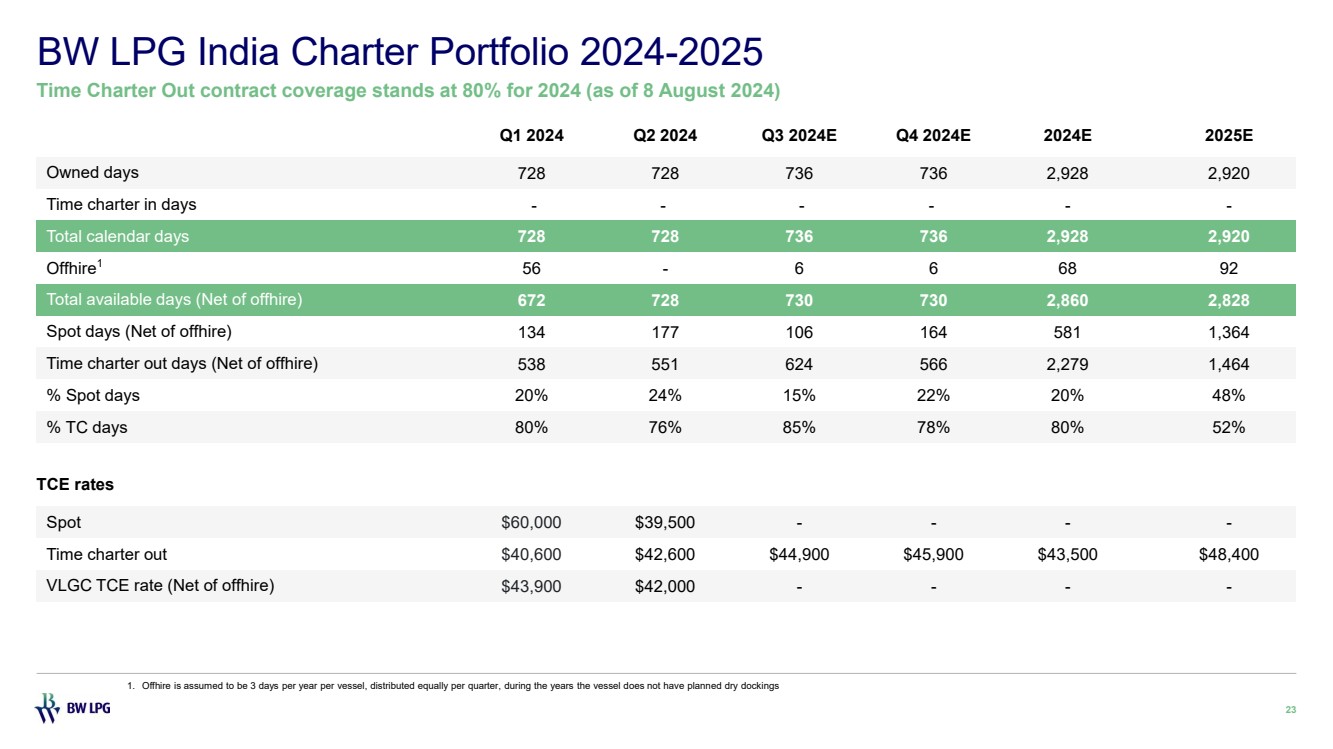
| BW LPG India Charter Portfolio 2024-2025 23 Time Charter Out contract coverage stands at 80% for 2024 (as of 8 August 2024) 1. Offhire is assumed to be 3 days per year per vessel, distributed equally per quarter, during the years the vessel does not have planned dry dockings Q1 2024 Q2 2024 Q3 2024E Q4 2024E 2024E 2025E Owned days 728 728 736 736 2,928 2,920 Time charter in days - - - - - - Total calendar days 728 728 736 736 2,928 2,920 Offhire1 56 - 6 6 68 92 Total available days (Net of offhire) 672 728 730 730 2,860 2,828 Spot days (Net of offhire) 134 177 106 164 581 1,364 Time charter out days (Net of offhire) 538 551 624 566 2,279 1,464 % Spot days 20% 24% 15% 22% 20% 48% % TC days 80% 76% 85% 78% 80% 52% TCE rates Spot $60,000 $39,500 - - - - Time charter out $40,600 $42,600 $44,900 $45,900 $43,500 $48,400 VLGC TCE rate (Net of offhire) $43,900 $42,000 - - - - |
