Exhibit 99.1
Broadcom Overview
Susquehanna Group’s
Semi, Storage & Technology Conference
March 10, 2016
© 2016 Broadcom. All rights reserved.
Safe Harbor Statement
This presentation contains forward-looking statements (including within the meaning of Section 21E of the United States Securities ExchangeAct of 1934, as amended, and Section 27A of the United States Securities Act of 1933, as amended) concerning Broadcom Limited (“Broadcom” or the “Company”). These statements include, but are not limited to, statements about (i) the expected benefits of the acquisition of Broadcom Corporation (“BRCM”), (ii) the combined organization’s plans, objectives and intentions with respect to future operations and products, (iii) the combined organization’s competitive position and opportunities, (iv) the impact of the transaction on the market for the combined organization’s products, (v) other statements identified by words such as “will”, “expect”, “intends”, “believe”, “anticipate”, “estimate”, “should”, “intend”, “plan”, “potential”, “predict” “project”, “aim”, and similar words, phrases or expressions. These forward-looking statements are based on current expectations and beliefs of the management of Broadcom, as well as assumptions made by, and information currently available to, such management, current market trends and market conditions and involve risks and uncertainties, many of which are outside the Company’s and management’s control, and which may cause actual results to differ materially from those contained in forward-looking statements. Accordingly, you should not place undue reliance on such statements.
Particular uncertainties that could materially affect future results include risks associated with our recent acquisition of BRCM, and other acquisitions we may make, including delays, challenges and expenses associated with integrating BRCM and other acquired companies with our existing businesses and our ability to achieve the benefits, growth prospects and synergies expected from BRCM and other acquisitions we may make; any loss of our significant customers and fluctuations in the timing and volume of significant customer demand; our ability to accurately estimate customers’ demand and adjust supply chain and third party manufacturing capacity accordingly; our ability to timely increase our internal manufacturing capacity to meet customer demand; the significant indebtedness incurred by us in February 2016 in connection with the BRCM acquisition, including the need to generate sufficient cashflows to service and repay such debt; our ability to timely increase our internal manufacturing capacity to meet customer demand; our ability to improve our manufacturing efficiency and quality; increased dependence on a small number of markets; quarterly and annual fluctuations in operating results; cyclicality in the semiconductor industry or in our target markets; global economic conditions and concerns; our competitive performance and ability to continue achieving design wins with our customers, as well as the timing of those design wins; rates of growth in our target markets; our dependence on contract manufacturing and outsourced supply chain and our ability to improve our cost structure through our manufacturing outsourcing program; prolonged disruptions of our or our contract manufacturers’ manufacturing facilities or other significant operations; our dependence on outsourced service providers for certain key business services and their ability to execute to our requirements; our ability to maintain or improve gross margin; our ability to maintain tax concessions in certain jurisdictions; our ability to protect our intellectual property and the unpredictability of any associated litigation expenses; any expenses or reputational damage associated with resolving customer product and warranty and indemnification claims; dependence on and risks associated with distributors of our products; our ability to sell to new types of customers and to keep pace with technological advances; market acceptance of the end products into which our products are designed; and other events and trends on a national, regional and global scale, including those of a political, economic, business, competitive and regulatory nature.
Avago Technologies Limited’s, Broadcom Corporation’s and our filings with the Securities and Exchange Commission (“SEC”), which you may obtain for free at the SEC’s website at http://www.sec.gov, discuss some of the important risk factors that may affect our business, results of operations and financial condition. We undertake no intent or obligation to publicly update or revise any of these forward looking statements, whether as a result of new information, future events or otherwise, except as required by law.
This presentation includes certain financial measures on a non-GAAP basis. These historical and forward-looking non-GAAP measures are in addition to, not a substitute for or superior to, measures of financial performance prepared in accordance with GAAP. You can find comparable GAAP information and reconciliation between the non-GAAP and GAAP information in the “Investor” section of our website at www.broadcom.com. Non-GAAP financial information includes the effect of purchase accounting on revenues, and excludes amortization of intangible assets, share-based compensation expense, restructuring and asset impairment charges, acquisition-related costs, including integration costs, purchase accounting effect on inventory, write-off of debt issuance costs, gain on extinguishment of debt, income (loss) from and gain (loss) on discontinued operations and income tax effects of non-GAAP reconciling adjustments.
Avago, Broadcom and the pulse logo are among the trademarks of Broadcom Limited. Any other trademarks or trade names mentioned are the property of their respective owners.
2 | © 2016 Broadcom. All rights reserved.
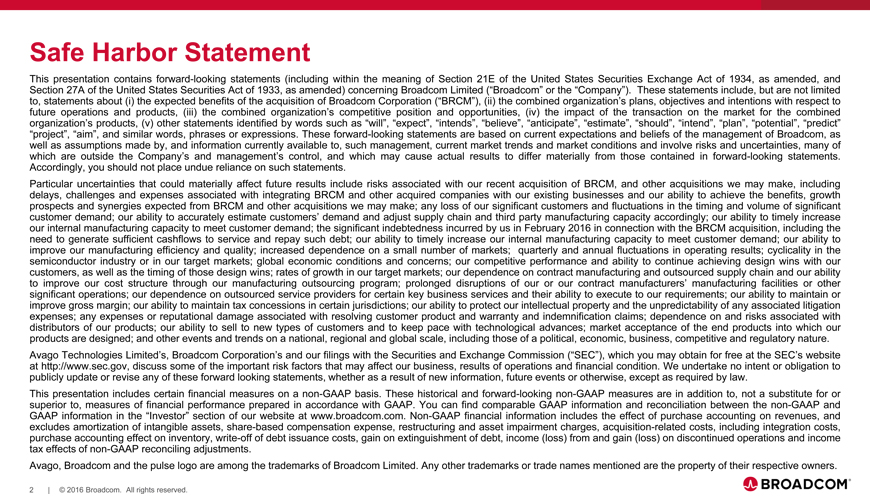
Heritage of Technology
IPO
1961 1981 1991 1996 1999 2002 2005 2007 2009 2014 2016
3 | © 2016 Broadcom. All rights reserved.
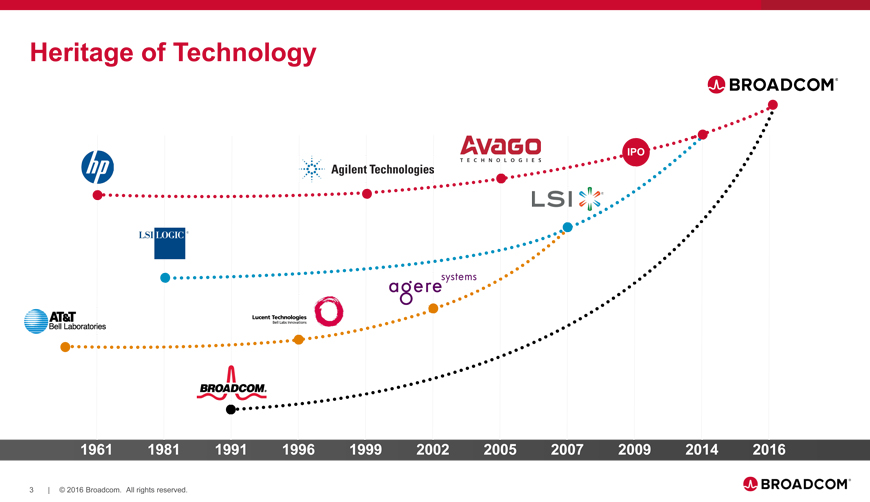
Delivering IP Through Differentiated Products
Core Technologies Franchise Products
FBAR and RF Filters and Amplifiers
SerDes ASIC
Optics VCSEL/DFB Fiber Optic Products
Optical Sensing Optical Isolation/Motion Encoders/LED
SAS/SATA/FC/PCIe Enterprise SAS, SATA, Fibre Channel
Read Channel HDD/SSD Controllers
Set-Top Box/Cable Modem
Broadband/QAM PON/DSL
ADC/DAC Ethernet NIC/Controller
DSP/ARM Wireless Connectivity
• Wi-Fi/Bluetooth/FM • Embedded Processors
Data Center Switch/Router
4 | © 2016 Broadcom. All rights reserved.
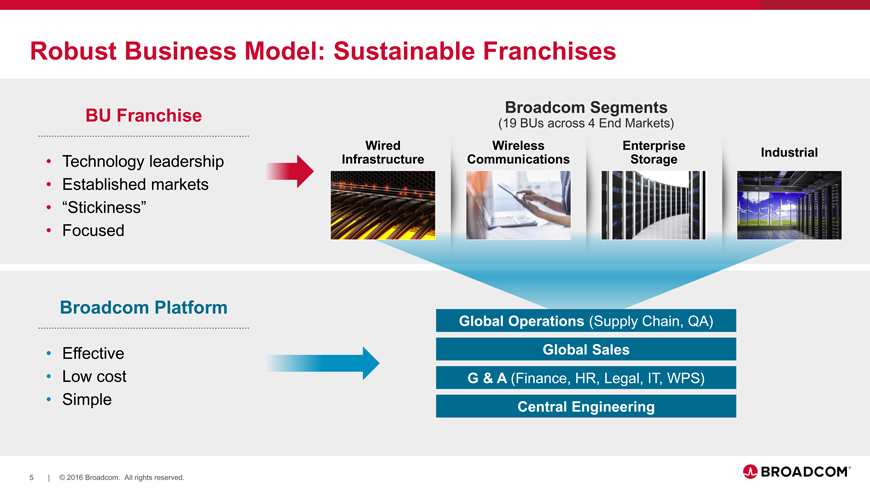
Robust Business Model: Sustainable Franchises
BU Franchise Broadcom Segments
(19 BUs across 4 End Markets)
Wired Wireless Enterprise
Industrial
• Technology leadership Infrastructure Communications Storage
Established markets
“Stickiness”
Focused
Broadcom Platform
Global Operations (Supply Chain, QA)
• Effective Global Sales
Low cost G & A (Finance, HR, Legal, IT, WPS)
Simple
Central Engineering
5 | © 2016 Broadcom. All rights reserved.
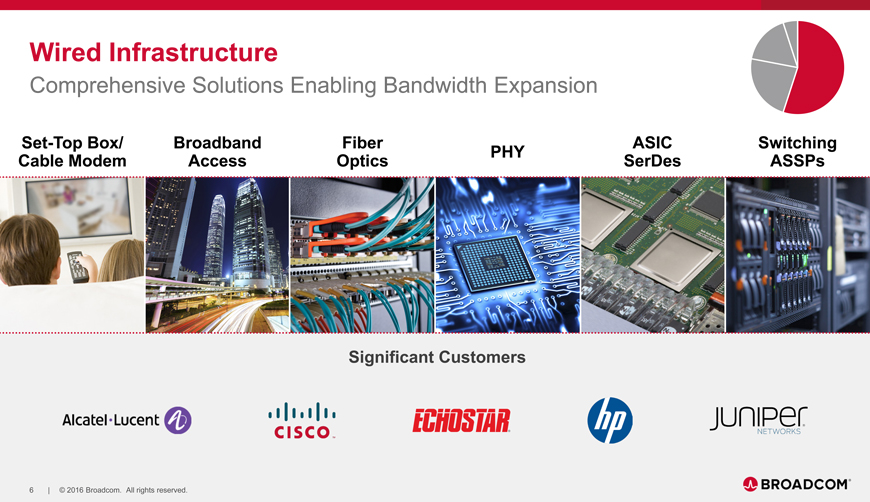
Wired Infrastructure
Comprehensive Solutions Enabling Bandwidth Expansion
Set-Top Box/ Broadband Fiber ASIC Switching PHY
Cable Modem Access Optics SerDes ASSPs
Significant Customers
6 | © 2016 Broadcom. All rights reserved.
Wireless Communications
Winning Solutions Combining High-Performance Differentiated Technologies
Handsets and Tablets – RF Wireless Connectivity Custom Solutions
Significant Customers
7 | © 2016 Broadcom. All rights reserved.
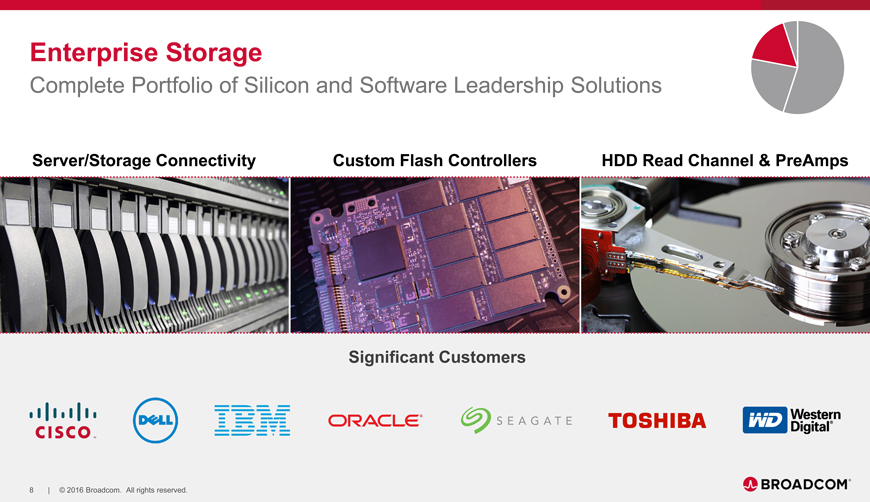
Enterprise Storage
Complete Portfolio of Silicon and Software Leadership Solutions
Server/Storage Connectivity Custom Flash Controllers HDD Read Channel & PreAmps
Significant Customers
8 | © 2016 Broadcom. All rights reserved.
Industrial
Superior Solutions Offering Efficiency, Reliability, Accuracy and Protection
Power Generation
Factory Automation Servo Drives and Conversion Solid State Displays
Significant Customers
9 | © 2016 Broadcom. All rights reserved.
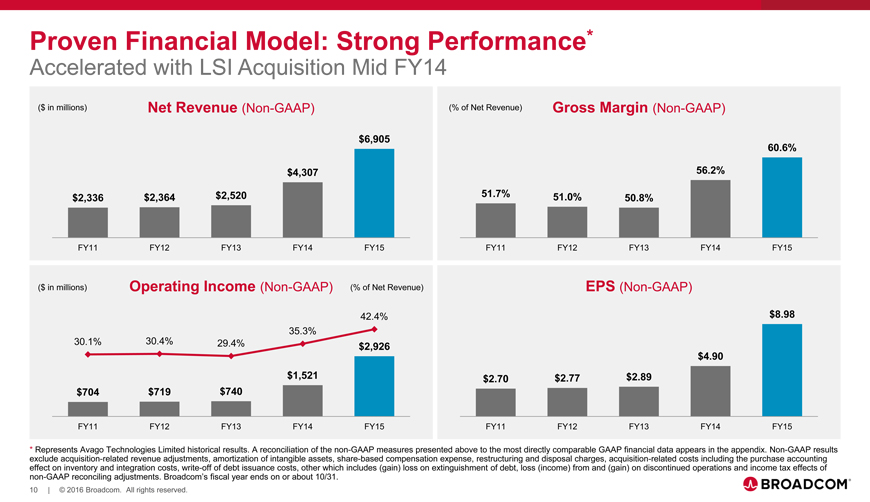
Proven Financial Model: Strong Performance*
Accelerated with LSI Acquisition Mid FY14
($ in millions) Net Revenue (Non-GAAP) (% of Net Revenue) Gross Margin (Non-GAAP)
$6,905
60.6%
$4,307 56.2% $2,336 $2,364 $2,520 51.7% 51.0% 50.8%
FY11 FY12 FY13 FY14 FY15 FY11 FY12 FY13 FY14 FY15
($ in millions) Operating Income (Non-GAAP) (% of Net Revenue) EPS (Non-GAAP)
42.4% $8.98
35.3% 30.1% 30.4% 29.4% $2,926 $4.90 $1,521 $2.70 $2.77 $2.89 $704 $719 $740
FY11 FY12 FY13 FY14 FY15 FY11 FY12 FY13 FY14 FY15
* Represents Avago Technologies Limited historical results. A reconciliation of the non-GAAP measures presented above to the most directly comparable GAAP financial data appears in the appendix. Non-GAAP results exclude acquisition-related revenue adjustments, amortization of intangible assets, share-based compensation expense, restructuring and disposal charges, acquisition-related costs including the purchase accounting effect on inventory and integration costs, write-off of debt issuance costs, other which includes (gain) loss on extinguishment of debt, loss (income) from and (gain) on discontinued operations and income tax effects of non-GAAP reconciling adjustments. Broadcom’s fiscal year ends on or about 10/31.
10 | © 2016 Broadcom. All rights reserved.
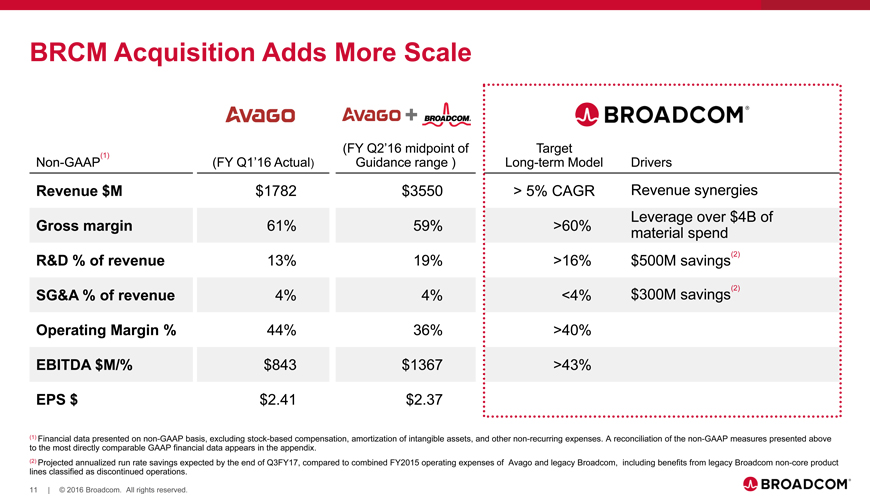
BRCM Acquisition Adds More Scale
(FY Q2’16 midpoint of Target
(1)
Non-GAAP (FY Q1’16 Actual) Guidance range ) Long-term Model Drivers
Revenue $M $1782 $3550 > 5% CAGR Revenue synergies Leverage over $4B of
Gross margin 61% 59% >60% material spend R&D % of revenue 13% 19% >16% $500M savings(2) SG&A % of revenue 4% 4% <4% $300M savings(2)
Operating Margin % 44% 36% >40%
EBITDA $M/% $843 $1367 >43%
EPS $ $2.41 $2.37
(1) Financial data presented on non-GAAP basis, excluding stock-based compensation, amortization of intangible assets, and other non-recurring expenses. A reconciliation of the non-GAAP measures presented above to the most directly comparable GAAP financial data appears in the appendix.
(2) Projected annualized run rate savings expected by the end of Q3FY17, compared to combined FY2015 operating expenses of Avago and legacy Broadcom, including benefits from legacy Broadcom non-core product lines classified as discontinued operations.
11 | © 2016 Broadcom. All rights reserved.
Questions & Answers
© 2016 Broadcom. All rights reserved.
Appendix
© 2016 Broadcom. All rights reserved.
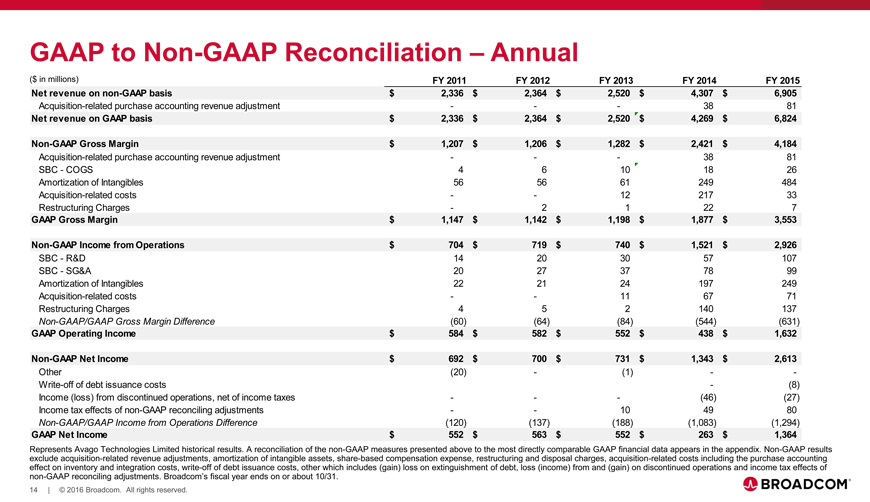
GAAP to Non-GAAP Reconciliation – Annual
($ in millions) FY 2011 FY 2012 FY 2013 FY 2014 FY 2015 Net revenue on non-GAAP basis $ 2,336 $ 2,364 $ 2,520 $ 4,307 $ 6,905
Acquisition-related purchase accounting revenue adjustment — — —38 81
Net revenue on GAAP basis $ 2,336 $ 2,364 $ 2,520 $ 4,269 $ 6,824
Non-GAAP Gross Margin $ 1,207 $ 1,206 $ 1,282 $ 2,421 $ 4,184
Acquisition-related purchase accounting revenue adjustment — — —38 81 SBC—COGS 4 6 10 18 26 Amortization of Intangibles 56 56 61 249 484 Acquisition-related costs — — 12 217 33 Restructuring Charges — 2 1 22 7
GAAP Gross Margin $ 1,147 $ 1,142 $ 1,198 $ 1,877 $ 3,553
Non-GAAP Income from Operations $ 704 $ 719 $ 740 $ 1,521 $ 2,926
SBC—R&D 14 20 30 57 107 SBC—SG&A 20 27 37 78 99 Amortization of Intangibles 22 21 24 197 249 Acquisition-related costs — — 11 67 71 Restructuring Charges 4 5 2 140 137 Non-GAAP/GAAP Gross Margin Difference (60) (64) (84) (544) (631)
GAAP Operating Income $ 584 $ 582 $ 552 $ 438 $ 1,632
Non-GAAP Net Income $ 692 $ 700 $ 731 $ 1,343 $ 2,613
Other (20) — (1) — -Write-off of debt issuance costs — (8) Income (loss) from discontinued operations, net of income taxes — — — (46) (27) Income tax effects of non-GAAP reconciling adjustments — — 10 49 80 Non-GAAP/GAAP Income from Operations Difference (120) (137) (188) (1,083) (1,294)
GAAP Net Income $ 552 $ 563 $ 552 $ 263 $ 1,364
Represents Avago Technologies Limited historical results. A reconciliation of the non-GAAP measures presented above to the most directly comparable GAAP financial data appears in the appendix. Non-GAAP results exclude acquisition-related revenue adjustments, amortization of intangible assets, share-based compensation expense, restructuring and disposal charges, acquisition-related costs including the purchase accounting effect on inventory and integration costs, write-off of debt issuance costs, other which includes (gain) loss on extinguishment of debt, loss (income) from and (gain) on discontinued operations and income tax effects of non-GAAP reconciling adjustments. Broadcom’s fiscal year ends on or about 10/31.
14 | © 2016 Broadcom. All rights reserved.
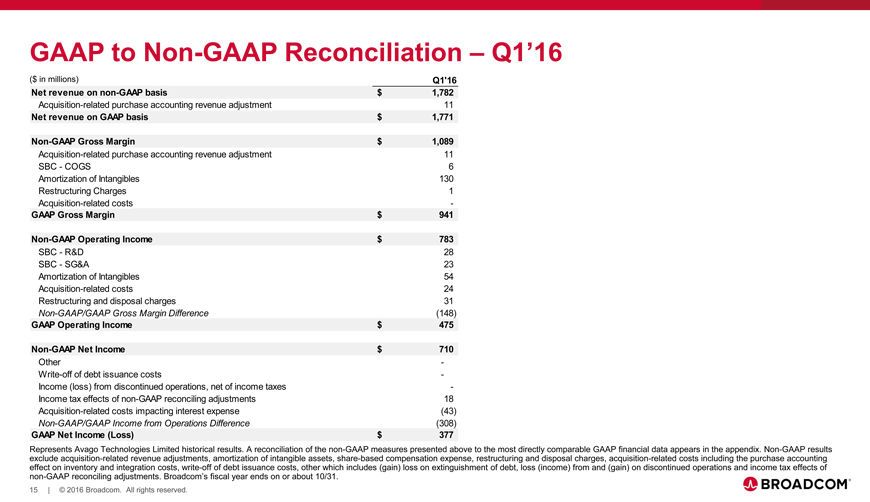
GAAP to Non-GAAP Reconciliation – Q1’16
($ in millions) Q1’16 Net revenue on non-GAAP basis $ 1,782
Acquisition-related purchase accounting revenue adjustment 11
Net revenue on GAAP basis $ 1,771
Non-GAAP Gross Margin $ 1,089
Acquisition-related purchase accounting revenue adjustment 11 SBC—COGS 6 Amortization of Intangibles 130 Restructuring Charges 1 Acquisition-related costs -
GAAP Gross Margin $ 941
Non-GAAP Operating Income $ 783
SBC—R&D 28 SBC—SG&A 23 Amortization of Intangibles 54 Acquisition-related costs 24 Restructuring and disposal charges 31
Non-GAAP/GAAP Gross Margin Difference (148)
GAAP Operating Income $ 475
Non-GAAP Net Income $ 710
Other -Write-off of debt issuance costs -Income (loss) from discontinued operations, net of income taxes -Income tax effects of non-GAAP reconciling adjustments 18 Acquisition-related costs impacting interest expense (43)
Non-GAAP/GAAP Income from Operations Difference (308)
GAAP Net Income (Loss) $ 377
Represents Avago Technologies Limited historical results. A reconciliation of the non-GAAP measures presented above to the most directly comparable GAAP financial data appears in the appendix. Non-GAAP results exclude acquisition-related revenue adjustments, amortization of intangible assets, share-based compensation expense, restructuring and disposal charges, acquisition-related costs including the purchase accounting effect on inventory and integration costs, write-off of debt issuance costs, other which includes (gain) loss on extinguishment of debt, loss (income) from and (gain) on discontinued operations and income tax effects of non-GAAP reconciling adjustments. Broadcom’s fiscal year ends on or about 10/31.
15 | © 2016 Broadcom. All rights reserved.
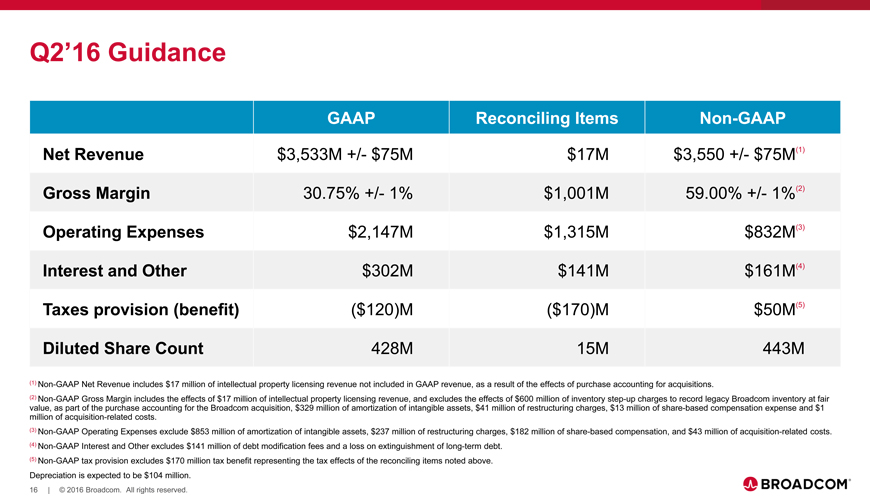
Q2’16 Guidance
GAAP Reconciling Items Non-GAAP Net Revenue $3,533M +/- $75M $17M $3,550 +/- $75M(1) Gross Margin 30.75% +/- 1% $1,001M 59.00% +/- 1%(2) Operating Expenses $2,147M $1,315M $832M(3)
Interest and Other $302M $141M $161M(4) Taxes provision (benefit) ($120)M ($170)M $50M(5) Diluted Share Count 428M 15M 443M
(1) Non-GAAP Net Revenue includes $17 million of intellectual property licensing revenue not included in GAAP revenue, as a result of the effects of purchase accounting for acquisitions.
(2) Non-GAAP Gross Margin includes the effects of $17 million of intellectual property licensing revenue, and excludes the effects of $600 million of inventory step-up charges to record legacy Broadcom inventory at fair value, as part of the purchase accounting for the Broadcom acquisition, $329 million of amortization of intangible assets, $41 million of restructuring charges, $13 million of share-based compensation expense and $1 million of acquisition-related costs.
(3) Non-GAAP Operating Expenses exclude $853 million of amortization of intangible assets, $237 million of restructuring charges, $182 million of share-based compensation, and $43 million of acquisition-related costs. (4) Non-GAAP Interest and Other excludes $141 million of debt modification fees and a loss on extinguishment of long-term debt.
(5) Non-GAAP tax provision excludes $170 million tax benefit representing the tax effects of the reconciling items noted above. Depreciation is expected to be $104 million.
16 | © 2016 Broadcom. All rights reserved.
BROADCOM®
Connecting everything®