0001649373san:InternalGradeThreeToOneMemberifrs-full:CreditRiskMembersan:LoansAndAdvancesToCustomersMembersan:BalanceSheetExposuresMembersan:StageTwoMembersan:TotalExposureMemberifrs-full:FinancialAssetsAtAmortisedCostMember2022-12-310001649373san:InternalGradeSixMemberifrs-full:CreditRiskMembersan:LoansAndAdvancesToBanksCategoryMembersan:BalanceSheetExposuresMembersan:StageOneMembersan:TotalExposureMemberifrs-full:FinancialAssetsAtAmortisedCostMember2021-12-310001649373san:BalanceSheetExposuresMembersan:ConsumerFinanceMembersan:StageTwoMember2021-12-310001649373ifrs-full:FinancialInstrumentsCreditimpairedMemberifrs-full:LifetimeExpectedCreditLossesMembersan:ConsumerFinanceMembersan:StageThreeExpectedCreditLossMember2022-12-310001649373ifrs-full:TopOfRangeMembersan:OfficeFixturesAndEquipmentMember2022-01-012022-12-310001649373ifrs-full:OtherEquityInterestMember2021-12-31
UNITED STATES
SECURITIES AND EXCHANGE COMMISSION
WASHINGTON, D.C. 20549
FORM 20-F
(Mark One)
| | | | | |
| ☐ | REGISTRATION STATEMENT PURSUANT TO SECTION 12(b) OR (g) OF THE SECURITIES EXCHANGE ACT OF 1934 |
OR
| | | | | |
| ☒ | ANNUAL REPORT PURSUANT TO SECTION 13 OR 15(d) OF THE SECURITIES EXCHANGE ACT OF 1934 |
For the fiscal year ended December 31, 2022
OR
| | | | | |
| ☐ | TRANSITION REPORT PURSUANT TO SECTION 13 OR 15(d) OF THE SECURITIES EXCHANGE ACT OF 1934 |
OR
| | | | | |
| ☐ | SHELL COMPANY REPORT PURSUANT TO SECTION 13 OR 15(d) OF THE SECURITIES EXCHANGE ACT OF 1934 |
Date of event requiring this shell company report
For the transition period from to
Commission file number 001-37595
Santander UK Group Holdings plc
(Exact name of Registrant as specified in its charter)
England
(Jurisdiction of incorporation or organization)
2 Triton Square, Regent’s Place, London NW1 3AN, England
(Address of principal executive offices)
Julian Curtis
2 Triton Square, Regent’s Place, London NW1 3AN, England
Tel: +44 (0) 800 085 1491
E-mail: julian.curtis@santander.co.uk
(Name, Telephone, E-mail and/or Facsimile number and Address of Company Contact Person)
Securities registered or to be registered pursuant to Section 12(b) of the Act.
| | | | | | | | | | | | | | |
| Title of each class | | Trading
Symbol(s) | | Name of each exchange
on which registered |
| 3.373% Fixed Rate/Floating Rate Notes due 2024 | | SAN/24A | | New York Stock Exchange |
| 4.796% Fixed Rate/Floating Rate Notes due 2024 | | SAN/24B | | New York Stock Exchange |
1.089% Fixed Rate/Floating Rate Notes due 2025 | | SAN/25C | | New York Stock Exchange |
| 1.532% Fixed Rate Resetting Notes due 2026 | | SAN/26 | | New York Stock Exchange |
1.673% Fixed Rate/Floating Rate Notes due 2027 | | SAN/27A | | New York Stock Exchange |
| 3.823% Fixed Rate/Floating Rate Notes due 2028 | | SAN/28 | | New York Stock Exchange |
2.896% Fixed Rate/Floating Rate Notes due 2032 | | SAN/32 | | New York Stock Exchange |
| 2.469% Fixed Rate/Floating Rate Notes due 2028 | | SAN/28A | | New York Stock Exchange |
| 6.833% Fixed Rate/Floating Rate Notes due 2026 | | SAN/28B | | New York Stock Exchange |
Securities registered or to be registered pursuant to Section 12(g) of the Act.
None
Securities for which there is a reporting obligation pursuant to Section 15(d) of the Act.
None
Indicate the number of outstanding shares of each of the issuer’s classes of capital or common stock as of the close of the period covered by the annual report
| | | | | |
| Ordinary shares of nominal value of £1 each | 7,060,000,000 | |
Indicate by check mark if the registrant is a well-known seasoned issuer, as defined in Rule 405 of the Securities Act. Yes ☒ No ☐
If this report is an annual or transition report, indicate by check mark if the registrant is not required to file reports pursuant to Section 13 or 15(d) of the Securities Exchange Act of 1934. Yes ☐ No ☒
Indicate by check mark whether the registrant: (1) has filed all reports required to be filed by Section 13 or 15(d) of the Securities Exchange Act of 1934 during the preceding 12 months (or for such shorter period that the registrant was required to file such reports), and (2) has been subject to such filing requirements for the past 90 days. Yes ☒ No ☐
Indicate by check mark whether the registrant has submitted electronically every Interactive Data File required to be submitted pursuant to Rule 405 of Regulation S-T (§232.405 of this chapter) during the preceding 12 months (or for such shorter period that the registrant was required to submit such files). Yes ☒ No ☐
Indicate by check mark whether the registrant is a large accelerated filer, an accelerated filer, a non-accelerated filer or an emerging growth company. See definition of “large accelerated filer,” “accelerated filer,” and “emerging growth company” in Rule 12b-2 of the Exchange Act.
| | | | | | | | | | | | | | | | | | | | | | | |
| Large accelerated filer | ☐ | Accelerated filer | ☐ | Non-accelerated filer | ☒ | Emerging growth company | ☐ |
If an emerging growth company that prepares its financial statements in accordance with U.S. GAAP, indicate by check mark if the registrant has elected not to use the extended transition period for complying with any new or revised financial accounting standards† provided pursuant to Section 13(a) of the Exchange Act. ☐
| | | | | |
| † | The term “new or revised financial accounting standard” refers to any update issued by the Financial Accounting Standards Board to its Accounting Standards Codification after April 5, 2012. |
Indicate by check mark whether the registrant has filed a report on and attestation to its management’s assessment of the effectiveness of its internal control over financial reporting under Section 404(b) of the Sarbanes-Oxley Act (15 U.S.C. 7262(b)) by the registered public accounting firm that prepared or issued its audit report. ☐
If securities are registered pursuant to Section 12(b) of the Act, indicate by check mark whether the financial statements of the registrant included in the filing reflect the correction of an error to previously issued financial statements. ☐
Indicate by check mark whether any of those error corrections are restatements that required a recovery analysis of incentive based compensation received by any of the registrant’s executive officers during the relevant recovery period pursuant to §240.10D-1(b). ☐
Indicate by check mark which basis of accounting the registrant has used to prepare the financial statements included in this filing:
| | | | | | | | | | | | | | | | | |
| U.S. GAAP | ☐ | International Financial Reporting Standards as issued by the International Accounting Standards Board | ☒ | Other | ☐ |
If “Other” has been checked in response to the previous question, indicate by check mark which financial statement item the registrant has elected to follow. Item 17 ☐ Item 18 ☐
If this is an annual report, indicate by check mark whether the registrant is a shell company (as defined in Rule 12b-2 of the Exchange Act). Yes ☐ No ☒
| | | | | |
Helping our customers
when it matters most |
| |
| Santander UK Group Holdings plc – Annual Report 2022 |

| | | | | | | | | | | | | | | | | | | | | | | | | | | | | | | | | | | | | | | | | |
| Strategic Report | Sustainability and Responsible Banking | Governance | Risk review | Financial review | Financial
statements | Shareholder
information |
| | | | | | | | | | | | | |
| | | | | | | | | | | | | |
| | |
The Strategic Report outlines the key elements of the Annual Report and provides context for the related financial statements. The report highlights key financial and non-financial metrics which help to explain our performance over the past year. It also highlights the external environmental factors affecting the business along with Santander UK’s position in the UK banking market. At all times, we aim to treat our stakeholders fairly and meet our environmental responsibilities. Sustainability and our strategic direction are inseparable, and we continue to embed sustainability across our business. We have included information to demonstrate this within our Strategic Report and more information is also available in our ESG Supplement. By Order of the Board. William Vereker Chair 1 March 2023 |
|
Important information for readers None of the websites referred to in this Annual Report on Form 20-F for the year ended 31 December 2022 (the Form 20-F), including where a link is provided, nor any of the information contained on such websites, is incorporated by reference in the Form 20-F. Santander UK Group Holdings plc (the Company) and its subsidiaries (collectively Santander UK or the Santander UK group) operate primarily in the UK, and are part of Banco Santander (comprising Banco Santander SA and its subsidiaries). Santander UK plc and Santander Financial Services plc are regulated by the UK Prudential Regulation Authority (PRA) and the Financial Conduct Authority (FCA). Certain other companies within the Santander UK group are regulated by the FCA and the PRA. This Annual Report contains forward-looking statements that involve inherent risks and uncertainties. Actual results may differ materially from those contained in such forward-looking statements. See Forward-looking statements on page 271. The Company is the immediate parent company of Santander UK plc. The two companies operate on the basis of a unified business strategy, albeit the principal business activities of the Santander UK group are carried on by Santander UK plc and its subsidiaries (the Santander UK plc group). The Board and Committees of the two companies run substantially simultaneously to ensure efficiency and effectiveness, whilst ensuring the independence and autonomy of Santander UK plc, our ring-fenced bank, are appropriately protected. The Company’s Corporate Governance and Risk Frameworks have been adopted by its subsidiaries to ensure consistency of application. As a result, the review of the business and principal risks and uncertainties facing the Company, and the description of the Company’s Corporate Governance, including the activities of the Board and risk management arrangements, are integrated with those of Santander UK plc and are reported in this document as operating within the Company for all periods presented. |
| | | | | |
| Our reporting suite |
| |
| Financial reports and presentations TO READ MORE, VISIT SANTANDER.CO.UK/ABOUT-SANTANDER/ INVESTOR-RELATIONS g |
| |
| ESG Supplement TO READ MORE VISIT SANTANDERSUSTAINABILITY.CO.UK g |
| |
| Sustainability microsite TO READ MORE VISIT SANTANDERSUSTAINABILITY.CO.UK g |
| |
| Gender Pay Gap Report TO READ MORE, VISIT SANTANDERJOBS.CO.UK g |
| |
| Sustainability and Responsible banking TO READ MORE VISIT SANTANDERSUSTAINABILITY.CO.UK g |
| |
| ACCESS THE FULL REPORTING SUITE AT SANTANDER.CO.UK g |
| | | | | | | | | | | | | | |
| Annual Report 2022 | | | Santander UK Group Holdings plc |
| | | | | | | | | | | | | | | | | | | | | | | | | | | | | | | | | | | | | | | | | |
| Strategic Report | Sustainability and Responsible Banking | Governance | Risk review | Financial review | Financial
statements | Shareholder
information |
| | | | | | | | | | | | | |
| | | | | | | | | | | | | |
| | | | | |
| Together we’re working for a better tomorrow, today |
| |
| | | | | | | | | | | | | | |
| | Contents | |
| | | |
| Santander UK at a glance | | |
| Who we are | 3 | |
| | | |
| | 6 | |
| Market overview | 10 | |
| | | |
| Our strategic priorities | 14 | |
| Our performance and KPIs | 15 | |
| | | |
| | | |
| | 23 | |
| | | |
| Sustainability & Responsible Banking | | |
| | | |
| | | |
| | | |
| | | |
| | | |
| | | |
| | | |
| | | |
| | | |
| | | |
| |
| | | | | | | | | | | | | | | | | | | | | | | |
| Creating value for our stakeholders | | | | |
| Customers | | | Shareholders | | | People |
| We want to be Simple, Personal and Fair in how we deal with our customers | | We aim to improve efficiency and returns through simplification and digitalisation | | We provide a thriving workplace for engaged, motivated and diverse individuals and teams |
| | | | |
| TO READ MORE, SEE PAGE 25 g | | | TO READ MORE, SEE PAGE 26 g | | | TO READ MORE, SEE PAGE 27 g |
| | | | | | | |
| Communities | | | Climate & ethics | | | |
| We help to support and build better communities where people can prosper | | We apply high environmental and ethical standards to our business and operations | | |
| | | | |
| TO READ MORE, SEE PAGE 28 g | | | TO READ MORE, SEE PAGE 29 g | | | |
| | | | | | | |
| | | | | | | | | | | | | | |
| Annual Report 2022 | | | Santander UK Group Holdings plc 1 |
| | | | | | | | | | | | | | | | | | | | | | | | | | | | | | | | | | | | | | | | | |
| Strategic Report | Sustainability and Responsible Banking | Governance | Risk review | Financial review | Financial
statements | Shareholder
information |
| | | | | | | | | | | | | |
| | | | | | | | | | | | | |
Our business model is focused on building customer loyalty
| | | | | | | | | | | | | | | | | | | | | | | | | | | | | | | | | | | | | | | | | |
| | | | | | | | | | | | | |
| Our Purpose is to help people and businesses prosper We help our customers at moments that matter most We champion British businesses and help them to grow sustainably Our customer focus helps us to develop more loyal and lasting relationships | | | | We live our values of Simple, Personal and Fair through great behaviours and our people leaders:
| |
| | | | | | | | | | | | |
| | | | | | | | | | | | |
| OUR COMPETITIVE ADVANTAGES: | | | | |
| Leading scale challenger bank | | Strong balance
sheet | | International
expertise
for UK companies | | | | |
| | | | | | | | | | | | |
| | | | | | | | | | | | |
| | | | | | | | | | | | |
| We provide high quality, seamless service across our branch, digital and telephony channels. | | | | OUR PEOPLE LEADERS: | |
| | | | | |
| | | | | | | | | | | | |
| 14 million active UK customers | 449 branches | | | | |
| | | | |
| | | | |
| | | | |
|
| | | | | | | | | | | |
| £187.1bn prime retail mortgages | 5th largest commercial lender1 | | | | |
| | | | |
| | | | |
| | | | |
| | | | |
| | | | | | | | | | | | |
| c19,000 Full time equivalent employees | | | | | | | | |
| | | | | | | | |
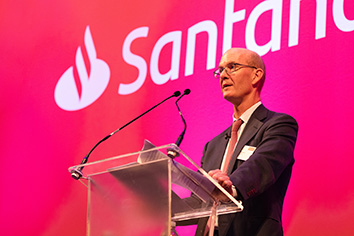
| | | | | | | | Mike Regnier at a management event for top 250 leaders in February 2023 | |
| | | | | | | | 1.Santander UK industry analysis of latest available bank and building society reports as at Q3 22. UK commercial lending stock, Corporate and/or Commercial Banking divisions (excludes investment banking). | |
| | | | | | | | |
| | | | | | | | | | | | | |
| | | | | | | | | | | | | | |
| Annual Report 2022 | Santander UK Group Holdings plc 2 |
| | | | | | | | | | | | | | | | | | | | | | | | | | | | | | | | | | | | | | | | | |
| Strategic Report | Sustainability and Responsible Banking | Governance | Risk review | Financial review | Financial
statements | Shareholder
information |
| | | | | | | | | | | | | |
| | | | | | | | | | | | | |
| | | | | | | | | | | | | | | | | |
| | | | | |
| Sustainability & Responsible Banking Strategy | |
| | Thriving Workplace | | Our Foundation | |
| Creating a culture of inclusivity and belonging | | Being responsible in everything we do | |
| | | | |
| | Better Communities | | |
| Helping customers and communities prosper | | | |
| | | | |
| | Healthy Environment | | |
| Fighting climate change and supporting
the green economy | | |
| | | | | |
| | | | | | | | | | | | | | | | | | | | |
| | | | | | |
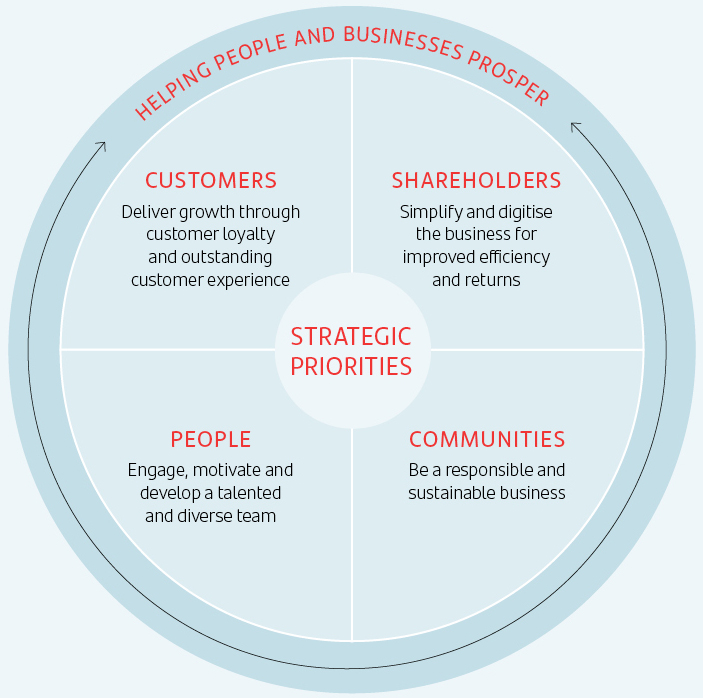
| Our strategic priorities | |
| 1 | Deliver growth through customer loyalty and outstanding customer experience | | 3 | Engage, motivate and develop a talented and diverse team | |
| | | | | | |
| 2 | Simplify and digitise the business for improved efficiency and returns | | 4 | Be a responsible and sustainable business | |
| | | | | | |
| | | | | | | | | | | | | | | | | | | | | | | | | | | | | | | | | | | |
| | | | | | | | | | | |
| We offer innovative products and services to help people and businesses prosper | | | | Our corporate structure | |
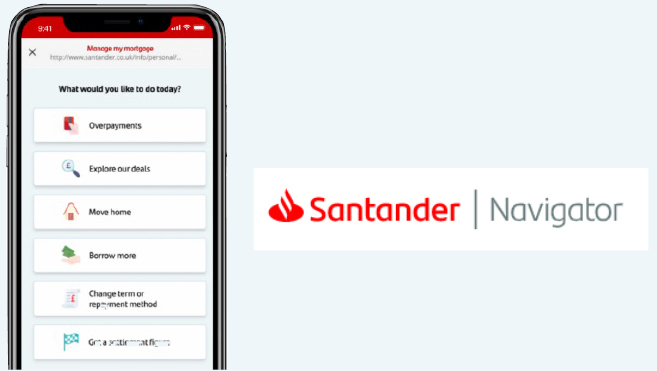
| In 2022 we launched My Home Manager bringing services together to help customers get more from their home. Customers can see their estimated home value and equity, view their Energy Performance Certificates, access cost estimates and quotes from local tradespeople for maintenance and repair. We also launched Santander Navigator to support businesses by providing expertise and practical support from our global network. | | | | Banco Santander SA | |
| | | | | | | | | | |
| | | | Santander UK Group Holdings plc | |
| | | | | | | | | | |
| | | | | | | | | | |
| | | | | Santander UK plc | | | Santander Financial Services plc | |
| | | | Ring-fenced bank | | | Non ring-fenced bank | |
| | | | | | | | | | |
| | | | OUR BUSINESS SEGMENTS: | |
| | | | | | | | | | |
| | | | Retail Banking | | | Corporate & Commercial
Banking (CCB) | |
| | | | | | | | | | |
| | | | Consumer Finance | | | Corporate Centre | |
| | | | | | | | | | |
| | | | | | | | | | | | | | |
| Annual Report 2022 | Santander UK Group Holdings plc 3 |
| | | | | | | | | | | | | | | | | | | | | | | | | | | | | | | | | | | | | | | | | |
| Strategic Report | Sustainability and Responsible Banking | Governance | Risk review | Financial review | Financial
statements | Shareholder
information |
| | | | | | | | | | | | | |
| | | | | | | | | | | | | |
| | | | | | | | | | | |
| | Financial services have a critical role to play in the UK’s economic recovery by attracting investment, encouraging innovation and supporting tomorrow’s entrepreneurs.
William Vereker |
| | |
| | |
Strong performance in challenging times
2022 was once again a challenging year as our customers faced into significant cost of living challenges against the backdrop of the conflict in Ukraine and macroeconomic uncertainty. I am very proud of the way that our people have responded to those challenges, especially coming so soon after the Covid-19 pandemic, helping the business to deliver a strong set of results. We have been especially focused on supporting our customers and delivering our mission to help businesses and people prosper.
Our profit from continuing operations before tax was up 2% from £1,858m to £1,894m driven by increased income, including significantly improved mortgage lending on the previous year and an increase in customer deposits thanks to the savings rates we were able to offer our customers, reflecting the increase to the Bank of England base rate.
Our CET1 capital ratio was again well above regulatory requirements at 15.2%. £1bn interim and special dividends were paid. The difficult economic headwinds experienced throughout the year underlined the prudence of our approach to risk and a resilient balance sheet.
Our strong mortgage performance of £9.8bn net lending and the success of our transformation programme in delivering efficiency improvements through simplification and further digitisation of our key processes ensured we were significant contributors to the success of Banco Santander throughout the year.
As part of Banco Santander's One Europe, we have utilised the expertise and insight across the business to ensure we have provided our customers with the best support possible in these difficult times, of which our new current account, Edge, is an example. We were also able to move our Commercial and Corporate Banking mainframe to the cloud ensuring we have the best infrastructure in place to support our customers.
This year, amongst the projects we are working on, I look forward to the launch of our OneApp, our pan-European customer interface. This exemplifies the power of being able to work across markets and benefit from the broader expertise of the Banco Santander group. Leveraging the strengths of the Banco Santander group will be even more important as we face into the challenges of the coming months.
Quick and proactive engagement
We cannot underestimate how challenging the last twelve months have been for our customers, just at the point where they were beginning to look ahead to a year free from Covid-19 related restrictions. The conflation of the conflict in Ukraine, cost of living and unprecedented political upheaval brought real pressure to bear on the households and businesses across the country.
The increase in inflation, exacerbated by the conflict in Ukraine, had a clear impact on household budgets with almost a quarter of our customers now spending over 10% more of their income on energy payments compared to the start of 2022. Our business customers found themselves in a position of having to raise prices or reconsider their hiring and investment strategies for the year ahead. The environment throughout 2022 for our SMEs was demanding with strong demand often undermined by issues with supply chains and recruitment.
By engaging with those customers proactively and quickly, we were able to provide support and assistance on key financial challenges from managing mortgage payments to advising businesses on how to handle changes in customer demand, thereby helping to put in place strategies now that could avoid financial distress later in
the year.
The political turmoil experienced in the UK
during the second half of 2022 was a reminder, should it be needed, that the decisions taken in Westminster have a very real impact upon the lives of people across the country.
Following the fiscal event in September, many of our mortgage customers coming off a fixed rate deal at the end 2022 or in 2023 will now be facing significantly increased payments. Whilst the steps taken subsequently reassured the markets and restored much needed calm, the ripple effect will continue to be felt in the months ahead, most obviously in the housing market as confidence takes time to recover.
The UK’s financial sector must help drive recovery
What has been evident throughout the year
has been the UK government’s welcome desire
to support the country’s financial sector and maintain the City of London’s position as one of
the two pre-eminent locations for financial services globally.
Financial services has a critical role to play in the UK’s economic recovery by attracting investment, encouraging innovation and supporting tomorrow’s entrepreneurs.
The government’s Edinburgh Reforms are a welcome step to improving the competitiveness of the sector and along with the Financial Services and Markets (FSM) Bill, will, I believe, help foster an environment focused on supporting investment and economic growth.
| | | | | | | | | | | | | | |
| Annual Report 2022 | Santander UK Group Holdings plc 4 |
| | | | | | | | | | | | | | | | | | | | | | | | | | | | | | | | | | | | | | | | | |
| Strategic Report | Sustainability and Responsible Banking | Governance | Risk review | Financial review | Financial
statements | Shareholder
information |
| | | | | | | | | | | | | |
| | | | | | | | | | | | | |
| | | | | | | | |
| Chair’s statement continued |
| | |
It will be important that our regulators play their part in this as they adapt to the environment outside the European Union and have regard for their secondary competitiveness objective.
Industry and politicians from all sides must maintain this constructive dialogue on how we can retain confidence in the UK and allow our financial sector to flourish for the benefit of the communities we serve up and down the country.
To this end, we look forward to working with the government in the months ahead to help them as they develop their plans for reform and implement the FSM Bill once it has royal assent.
Developing the skills our workforce and businesses need
In order that the UK economy is able to continue competing in the global market place, it is vital that we give its workforce the skills that our businesses need. We have a key role to play in delivering this.
Banco Santander is the largest global corporate supporter of higher education, and I am immensely proud of the fact that since 2007 Santander UK has donated over £100m to our university partners across the country, supporting 125,000 students into and through higher education. We offered a range of scholarships across a variety of areas including languages, leadership, sustainability and technology to give people the chance to learn the skills businesses want and need in their future employees.
In November 2022, I launched Santander UK’s ambitious new education and skills programme
at London’s Science Museum. Our aim is clear:
To help people across all age ranges fulfil their potential, whether they’re a budding entrepreneur with a great business idea, someone in mid-career who is looking to reskill or a young person from an under-represented community who dreams of going to university.
At the heart of the initiative is a £1m scholarship scheme that will help 100 students from under-represented groups with annual grants of £10,000 over three years across our 75 university partners.
I am particularly excited by our unique partnership with MK:U - Britain’s new model, digital and technical university, who will work with us in our new headquarters in Milton Keynes to develop the skills of the future for our staff and the local community.
Board changes and focus for 2023
Mike Regnier, our new Chief Executive Officer, has provided superb leadership across the business in his first year and been an excellent addition to the Boards of the Company and our Ring-Fenced Bank.
In the face of significant economic challenges, he has ensured that Santander UK has retained, at all times, a clear focus on serving our customers and meeting their needs.
The year ahead promises to be an exciting one as we prepare to move our corporate headquarters to our new, purpose built, campus in Milton Keynes, Unity Place. I look forward to welcoming our people to a building that has been designed to meet the needs of today’s workforce.
I welcome the gradual return to the workplace we have seen over the last twelve months, and expect that to continue in the coming months, so teams can come together to exchange ideas on how we best deliver on our purpose and strategy.
It is with that sense of collaboration I know we will come together, to provide our customers and businesses with the support, expertise and guidance that will help them to navigate whatever challenges and opportunities 2023 presents.
William Vereker
Chair, 1 March 2023
| | | | | | | | | | | | | | | | | | | | |
| Education and skills program | |
| | | |
|
| Over £100m Donated since 2007 through our Universities Programme in the UK as we supported 125,000 students into and through higher education
| |
| | | |
| £1m education and skills programme launched 100 students from under-represented groups helped with annual grants of £10,000 over three years and 1,000 students a year supported through paid internships with small and medium-sized businesses | |
| | | | William Vereker at the launch of our new education and skills programme |
| | | | | | |
| | | | | | | | | | | | | | |
| Annual Report 2022 | Santander UK Group Holdings plc 5 |
| | | | | | | | | | | | | | | | | | | | | | | | | | | | | | | | | | | | | | | | | |
| Strategic Report | Sustainability and Responsible Banking | Governance | Risk review | Financial review | Financial
statements | Shareholder
information |
| | | | | | | | | | | | | |
| | | | | | | | | | | | | |
| | | | | | | | | | | |
| | The global environment and rising cost of living have presented challenges for many of our customers and clients. Our focus has been to provide targeted and practical support, including advice on household budgeting and a toolkit for SMEs to help with ongoing inflationary pressures. Mike Regnier |
| | |
| | |
Commitment to help our customers
My first twelve months as Chief Executive Officer have underlined the vital role we play in the lives of our customers when they are facing into the difficult conditions the UK economy is currently experiencing.
When I took over from my predecessor Nathan Bostock in March 2022, it was clear that our business and retail customers would require support to navigate their way through the increase in the cost of living, exacerbated by the effect the conflict in Ukraine had on energy and commodity prices.
Just talking about support, no matter how well intentioned, means nothing if it is not matched by the commitment and actions of our people. Since I joined Santander UK, that desire to help and do the right thing has shone through in every conversation I have had in our branches and contact centres across the UK. They understand instinctively that, when times are difficult, people want practical help that will enable them to budget, to save or take that step onto the housing ladder.
Ensuring that we can enable our people to serve our customers and deliver on our purpose to help people and businesses prosper is especially important in the current climate. Throughout 2022, we implemented a series of changes and improvements to simplify our processes, modernise our IT platforms and tackle financial crime that I believe gives our people the best chance to provide the help that is needed.
Launching Edge
That same spirit of transformation and innovation was behind the launch of our new current account, Edge. It has been designed specifically with the expectations and behaviours of our customers in mind, helping them to make the most of their money today and reward them for essential spending, which is especially important in the current environment.
Alongside an improved focus on cashback, we have introduced an exclusive preferential savings rate, because saving remains important even when household budgets are under pressure.
Edge will continue to evolve as customers feedback to us what they want from the account alongside new in-app benefits throughout 2023.
It is an exciting statement about what the future offers for Santander UK.
Our NPS ranking was 7th for our retail business but I am optimistic that with our new current account product and improved customer service, we will be able to improve on that in the coming year.
Delivering strong results
Against challenging headwinds, it is to the enormous credit of our people that we delivered a strong set of results in 2022, building on the success of 2021. Profit from continuing operations before tax was up 2% to £1,894m, driven by £9.8bn net mortgage lending, an increase of £2.3bn. The increase in interest rates at the end of the third quarter of 2022 did result in a slowdown at the end of the year and we expect house prices will return to early 2021 levels in the coming months.
Mortgage customers across the country will be facing higher prices than they have been used to, particularly those whose fixed rate mortgage term ends during 2023. But this is exactly where our proactive support has been essential, giving customers the opportunity to fix a new rate or extend their term, for example, so they can budget with certainty.
Our customer deposits grew by £4.3bn to £196.5bn thanks to the fact we offered some of the most competitive savings rates in the market and customer loans to £219.7bn from £210.6bn. Our Corporate and Commercial Banking division lent over £8bn to clients. The increase in the Bank of England base rate contributed to Banking NIM rising by 14bps on the year to 2.06% and our CET1 capital ratio stood at 15.2%.
We served 14 million customers throughout the year and for the first time, the number of digital customers accounted for half our customer base, increasing to 7 million. The number of digital transactions went up by 12%.
Following the Bank of England's assessment of UK banks' preparation for resolution under the Resolvability Assessment Framework, they concluded that we had no material issues in our approach.
| | |
| 2022 highlights |
£1,894m Profit from continuing operations before tax (2021: £1,858m) |
£655m Savings realised to date, with £936m of investment. |
£9.8bn Net mortgage lending (2021: £7.5bn) |
£4.3bn Customer deposits increase (2021: £0.5bn) |
£1.0bn Interim and special dividends paid (2021: £1.3bn) |
| | | | | | | | | | | | | | |
| Annual Report 2022 | Santander UK Group Holdings plc 6 |
| | | | | | | | | | | | | | | | | | | | | | | | | | | | | | | | | | | | | | | | | |
| Strategic Report | Sustainability and Responsible Banking | Governance | Risk review | Financial review | Financial
statements | Shareholder
information |
| | | | | | | | | | | | | |
| | | | | | | | | | | | | |
Supporting our customers with the cost of living
Our customers, rightly, expect us to provide them with the support and help that is essential to allow them to navigate a way through the impact of higher inflation and a slowing economy.
For many, including relatively new homeowners, this has been the first significant economic downturn they will have experienced. But in this digital age of banking, how we engage with them had to be different and it was important that our customers were able to contact us or take decisions in a way that was consistent with how they would normally bank.
Those experiencing financial difficulties were more likely to want to connect with us digitally and be confident they could take those important first decisions, big or small on spending, saving and housing costs, in the way they wanted to do so.
We contacted four million personal customers as part of our outreach programme, and over two million customers as part of our proactive strategy. We used our customer insight, looking at spending patterns and trigger points to identify and speak to customers who we believed may require additional support.
We grew our Financial Support team to around 600 colleagues who were trained to help our customers on the phone.
In addition to to this programme, we have run free online events to suggest how budgets could be managed, and signposted, where appropriate, customers to the debt advice agency PayPlan where we believe this may be of real benefit. The work of agencies like PayPlan and Stepchange is invaluable for many people around the country and that was why we provided £1m to them in funding to support their vital work.
I strongly believe that enabling customers to take that first step is crucial in enabling them to address any bigger financial concerns they may have. Giving them the opportunity to do so by whatever channel works for them is the least they should expect from us. I am proud, but not surprised, that our people have stepped up to provide that support at the time it is needed the most.
Supporting our people with the cost of living
In the same way, it was important that as an employer we were able to provide our people with additional support with the rising cost of living. We took a holistic approach by implementing a range of measures, both financial and non-financial, including awarding an additional, exceptional 4% pay increase in the autumn to more than 11,000 of our people earning less than £35,000 per annum and the introduction of a financial support helpline open to all. This pay award was in addition to the 2021 annual pay review.
Helping our business customers to grow
Life has not been any easier for our business customers, so soon after the challenges of the pandemic. As with our retail customers, it was crucial they could access support whether it be online or through our local relationship teams as and when they needed it.
Our clients were clear that it was not about surviving; they still want to take advantage of the opportunities to grow and expand their markets. To do this, we have to provide them with innovative solutions.
We launched our SME Toolkit in October 2022 to support businesses to adapt and manage growing costs, staffing issues, energy cost pressures and uncertainty. We partnered with our Breakthrough Team to select trusted partners to provide the content, as well as signposting other financial support content we have on our retail pages.
In June 2022, we launched Santander Navigator, our subscription-based platform to help UK businesses realise their international growth plans via our extensive global network as they explore new markets and grow internationally. 350 businesses have been supported into a new international market as a result, a 40% increase on 2021. Growing this number further will be vital for those businesses that will drive the UK’s economic recovery.
We complemented this with meet the buyer events, trade missions and webinars focused on helping businesses grow their international trade.
This contributed to retaining our 1st place NPS ranking for Business & Corporate banking.
| | | | | |
| Providing support and helping customers make the most of their money |
| Over 2 million customers |
We identified those customers who were most at risk of financial stress and reached out to them to offer our support –Website pages dedicated to where customers can find support –Launched an online SME support toolkit to provide guidance for businesses under pressure –Issued bespoke ‘cost of living’ communications to c200k students and around 220,000 business banking customers. –Sent communications to four million of our customers signposting advice available. |
| c600 colleagues |
In our Financial Support team to help our customers on the phone
|
Stopping fraud at source
Tackling fraud remains an absolute priority for us. The numbers are stark, with over £609m stolen by criminals through authorised and unauthorised fraud and scams across the UK.
The numbers involved are so large they can almost appear meaningless, but behind them are thousands of individual tragedies. A lifetime of savings; a pension for retirement; the deposit for that first house; or an inheritance to pass on to the family has gone. And in some cases, cannot be replaced.
Along with our peers in the banking sector, we have been working incredibly hard to put in place the checks that can help our customers take the necessary steps to protect themselves.
We have also focused our efforts on giving customers the right information about what they should look out for so they can spot scams at source. As fraudsters become more sophisticated in their methods, so the groups of customers who become victims grow.
The idea that this is a problem for older customers is patently untrue, with 19-34 year olds as likely to be a victim of authorised push payment (APP) scams due to our increasingly diverse online shopping habits.
We published a discussion paper, ‘Tackling authorised push payment fraud’, in October 2022 that looked at what we can do as an industry to address these problems.
We believe there is a need to create a 'Chip and Pin moment', as we did in the early 2000s which made it harder for criminals to defraud customers’ bank cards. By shifting the focus to how we can remove fraud risk in the first place, we can tip the balance back in favour of the customer against the criminal.
| | | | | | | | | | | | | | |
| Annual Report 2022 | Santander UK Group Holdings plc 7 |
| | | | | | | | | | | | | | | | | | | | | | | | | | | | | | | | | | | | | | | | | |
| Strategic Report | Sustainability and Responsible Banking | Governance | Risk review | Financial review | Financial
statements | Shareholder
information |
| | | | | | | | | | | | | |
| | | | | | | | | | | | | |
Enabling customers to transition to a low
carbon economy
Being a responsible business is a key part of our strategy for the long-term and our day-to-day decisions. Central to that is how we help our customers make the transition to a low carbon economy. As with the our approach to the cost of living, we must enable our customers to take practical decisions. We launched our Greener Homes Hub that provides help on how to make the home more eco-friendly and we continued to offer the free EnergyFact Report that gives guidance on how home owners can improve the energy efficiency of their homes.
Corporate and Commercial Banking expanded our sustainability lending proposition to make it easier for businesses across all sectors to access sustainable finance so customers can start their transition towards a net-zero economy.
We have also used our position in the market to foster debate on the retrofitting landscape in the UK and what policy developments are needed to facilitate change.
Our report, 'Buying into the Green Homes Revolution' examined the changing attitudes towards net zero among homeowners and buyers and revealed that we still have some serious barriers regarding cost and lack of understanding and guidance on retrofitting options to overcome to make it a natural step for homeowners to take.
To address these challenges, we made a series of recommendations that must focus on the right financial incentives, better information to offer guidance on upgrading properties and, establishing the skills, infrastructure and capacity to carry out retrofitting at scale to meet future needs. If we are to make progress, the financial sector and government must be willing to be bold in thinking and in action.
Responding to the conflict in Ukraine
I have been incredibly proud of how our people and customers have responded to the conflict in Ukraine and their desire to support the humanitarian relief effort that is taking place. Customers, our people and the Santander Foundation contributed over £455,000 to the Banco Santander initiative to support the Red Cross and United Nations High Commissioner for Refugees (UNHCR).
We made it easier for Ukrainian refugees arriving in the UK to open a bank account with us, with over 2,000 new accounts opened. We also provided customers with the ability to make international payments to Ukraine.
Macmillan Partnership
There are currently three million people living with cancer in the UK and one in two of us will receive a cancer diagnosis in our lifetimes. In June 2022, we launched a new strategic charitable partnership with Macmillan Cancer Support.
The partnership aims to improve financial inclusion and support to help people to cope with financial challenges they face after receiving a cancer diagnosis.
Since the launch, we have been working with Macmillan to review our processes, services and customer feedback to identify areas for improvement.
We are also developing a referral programme to connect our customers with Macmillan’s support services. In addition to these strategic workstreams, we have raised over £455,000 including the matched donations from the Santander Foundation.
Creating a diverse and inclusive workplace
Given the challenges we are facing, we must have a diverse and inclusive workplace that understands what our customers and communities are experiencing and need so they can prosper.
A critical part of that is the culture that we create across the business. The Santander Way is our cultural framework and we refreshed our behaviours to help us keep with the pace of change we have seen in the wider sector in recent years and ensure the customer is at the heart of what we do and why we do it.
But it is clear that we still have work to do. The recruitment, retention and advancement of women is still an area of focus for us, particularly if we are to meet our ambition of having 50% (+/- 10%) senior female employees by 2025. The percentage of women in senior roles stands at 33.2%, but we must strive to do more, such as through our Women in STEM campaign, which aims to increase representation of women in these roles at all levels.
| | | | | | | | |
| Unity Place |
| Unity Place, our new hub, will enable us to access the talent and skills that are being developed in Milton Keynes and across the Oxford-Cambridge arc. This fits perfectly with our ongoing partnership with MK:U, the new university of Milton Keynes, which will focus on the needs of business in the digital economy, addressing the technological skills gap. MK:U will occupy part of the office space, highlighting the close relationship Santander Universities maintains with academia. |
We have made further progress towards our ambition to increase Asian, Black and other minority ethnic representation in senior roles to 14% (+/- 2%) by 2025. This is now at 11.1% increasing by 1% from 2021, which means we are on track to meet our target, but I want us to look at how we can exceed that number.
I was delighted that our first Black Talent Programme cohort graduated earlier this year, and over 60% of the participants have now been promoted or moved roles since joining the programme and we will host a further Black Talent Programme this year.
Our Gender Pay Gap shows a mixed picture. The mean pay gap reduced over the last 12 months to 29.2% primarily through success in hiring and promoting women into senior roles. However, the median pay gap has grown by 1.3% to 31.3% driven by structural changes to meet changing customer demand.
We have also seen increases to our Ethnicity Pay Gap with the mean average increasing by 1.5% to 9.1% due to a greater increase in representation in our most junior roles. I firmly believe that as we work on creating the career pathways, that will support more of our minority ethnic colleagues moving into senior roles.
I was pleased that we were recognised as a Top Employer by the Top Employers Institute and are accredited by Great Place to Work as a Best Super Large Organisation, Best Workplace for Women and Best Workplace for Wellbeing. Once again we featured in The Times Top 50 Employers for Women and have done so in each of the 11 years since its inception.
| | | | | | | | | | | | | | |
| Annual Report 2022 | Santander UK Group Holdings plc 8 |
| | | | | | | | | | | | | | | | | | | | | | | | | | | | | | | | | | | | | | | | | |
| Strategic Report | Sustainability and Responsible Banking | Governance | Risk review | Financial review | Financial
statements | Shareholder
information |
| | | | | | | | | | | | | |
| | | | | | | | | | | | | |
Looking ahead
2023 promises to be an exciting year for Santander UK. We will be moving our corporate headquarters to our new state-of-the-art campus in Milton Keynes and I am looking forward immensely to the opportunity of bringing our people together in a space that is focused on collaboration.
In 2022, we saw changes in our Executive Committee as John Collins OBE, Louise Shield and Iain Plunkett left the business for new challenges. I was extremely grateful to all three who provided me with invaluable advice and counsel in my first year at Santander UK as well as making significant contributions to our successes over a number of years. We wish them well for the future.
As we prepare to embrace this exciting new future, we welcomed several new faces to our Executive Committee, with Juan Ignacio Echeverria, Elisabet Pinilla, Charlie Shepherd and Stephen White joining in 2022.
Throughout the year, we instinctively put the customer first in our thinking and our actions. We must continue to do that as we know that the year ahead will continue to present challenges, but it will also offer opportunities.
I look forward to being able to support our customers and continuing to be a voice on the issues that are important to us as a bank and our customers as we live up to our purpose in helping people and businesses prosper.
Mike Regnier
Chief Executive Officer
1 March 2023
| | | | | | | | | | | |
| FCA settlement on historical Business Banking AML controls |
In December 2022, the FCA concluded an investigation in relation to anti-money laundering controls in our Business Banking division in the period 31 December 2012 to 18 October 2017 following the payment of a £108m financial penalty. The FCA’s investigation focused on the identification, assessment and management of higher risk customers in the Business Banking division, including Money Services Businesses. It has now concluded, and no further action is anticipated by the FCA or any other authority in respect of this matter. “Santander UK takes its responsibilities regarding financial crime extremely seriously. We are very sorry for the historical Anti-Money Laundering (AML) related controls issues in our Business Banking division between 2012-17 highlighted in the FCA’s findings. “While we took action to address our AML issues once they were identified, we accept that our AML framework at the time should have been stronger. We have since made significant changes to address this by overhauling our financial crime technology, systems and processes.” |
| | |
| | | | | | | | | | | | | | |
| Annual Report 2022 | Santander UK Group Holdings plc 9 |
| | | | | | | | | | | | | | | | | | | | | | | | | | | | | | | | | | | | | | | | | |
| Strategic Report | Sustainability and Responsible Banking | Governance | Risk review | Financial review | Financial
statements | Shareholder
information |
| | | | | | | | | | | | | |
| | | | | | | | | | | | | |
Five major forces continue to shape the UK banking market
| | | | | | | | | | | |
| | | |
| What we have seen The market in which we operate is highly competitive. We expect such competition to intensify in response to increasing entry of FinTech and BigTech firms in the banking sector as well as the growth of digital currencies and cryptocurrencies. Traditional UK banks have largely refocused on core business areas and improving their digital offerings. Our response and looking ahead We remain cognisant of the evolving competitive environment and continue to develop offerings to rival competitors and seek partnerships to develop new propositions. Banco Santander's PagoNxt offering incorporates simple and accessible digital payment solutions. This is a key area for growth alongside OpenBank, their 100% digital bank. We expect these to be rolled out in the UK in the future. | Neo-banks continue to gain market share, competing with traditional UK banks. Nevertheless, financial sustainability remains unproven for most. Those that have started to highlight emerging signs of profitability have tended to mirror more traditional banking models. Nevertheless, digital-only providers continue to disaggregate the traditional vertically integrated banking business model by targeting the most profitable elements with innovative new propositions and attracting significant valuations (for example buy-now-pay-later). Large international peers have also entered the UK market through new digital-only brands with limited product offerings; however may provide a competitive offering over the longer term.
|
| Increased market disruption and strong competition | |
| |
| | | | | | | | | | | |
| | | |
| What we have seen Climate change is one of the biggest challenges facing society and our industry has a critical role to help tackle this. Clear disclosure is essential to help markets and other stakeholders assess our climate performance. Our response and looking ahead Climate change is one of three pillars of our Sustainability and Responsible Banking Strategy; with the goal of supporting the transition to a low carbon economy as both a lender and an employer.
In 2022, we expanded our Task Force on Climate-Related Financial Disclosures (TCFD) as well as reporting on how we are financing the green transition and our collaboration with stakeholders. We are implementing TCFD recommendations and working to meet the expectations set by the Bank of England, PRA and FCA. We also completed regulatory stress test exercises1 and the internal climate stress | test exercise (CISA) and started further development of the process to assess potential capital requirements for climate risk. Since 2020, we have provided over £10bn of green finance, helping our customers reduce their carbon footprint with a £20bn target by 2025. We launched a home energy report, EnergyFact, in partnership with Countrywide, with a goal to start meaningful engagement with mortgage customers and to begin to raise awareness on home improvements targeting energy efficiency and reduced carbon emissions. Looking ahead, we aim to develop more targets that reflect our strategic priority to be a responsible and sustainable business. TO READ MORE ABOUT OUR CLIMATE AGENDA, SEE OUR SUSTAINABILITY REVIEW g |
| Climate change | |
| |
1.BoE CBES and ECB's climate stress tests.
| | | | | | | | | | | | | | |
| Annual Report 2022 | Santander UK Group Holdings plc 10 |
| | | | | | | | | | | | | | | | | | | | | | | | | | | | | | | | | | | | | | | | | |
| Strategic Report | Sustainability and Responsible Banking | Governance | Risk review | Financial review | Financial
statements | Shareholder
information |
| | | | | | | | | | | | | |
| | | | | | | | | | | | | |
| | | | | |
| Market overview continued |
| |
| | | | | | | | | | | |
| | | |
| What we have seen Customer interactions continued to shift to digital and remote services. Our enhanced digital capability attracted a further 370,000 digital customers in 2022, with 92% of current account and 99% of credit card openings made through digital channels. In mortgages, intermediary share of distribution continues to increase, whilst other products are now distributed largely through digital channels. 76% of our refinanced mortgages were retained online in 2022. Our response and looking ahead We invest in ensuring access to financial services for our customers, including those less confident in using technology for managing their finances.
| While customer footfall has fallen in recent years, we continue to appreciate the value of the human touch delivered through our branch network. We are mindful of the needs of our most vulnerable customers, responding with 'access to cash' solutions and providing mechanisms for help from a trusted third party. We continue to develop offerings to deliver growth through customer loyalty and customer experience. We are committed to creating products and services catered to our customers needs. In October 2022 we launched my Home Manager, designed to assist mortgage customers aspects of managing their home. |
Changing customer
behaviour and distribution | |
| |
| | | | | | | | | | | |
| | | |
| What we have seen In 2022 the regulatory policy and change agenda remained intense. The UK Government announced the outcome of the Future Regulatory Framework review and has introduced legislation to Parliament to implement this, combined with a number of regulatory consultations aligned with the proposals. Our response and looking ahead This year we implemented the PRA’s operational resilience and outsourcing expectations, and this remains a key focus area for the bank moving forward, up to the 2025 deadline. The PRA has also published its consultation on the implementation of Basel 3.1 which will impact capital requirements. | The FCA announced the introduction of the Consumer Duty with tight implementation timelines, requiring significant focus across business units to ensure that we are compliant with the Duty, which has a first implementation date of 31 July 2023.
We continue to engage with regulators on other key issues, such as APP fraud and the challenges around the rising cost of living and impact of interest rates rises.
We await the Government’s forthcoming consultation on ring fencing. We anticipate further intensive regulatory activity in 2023 and will continue to work with industry, trade bodies, regulators, and Government to support the appropriate regulation of the UK’s financial services industry. |
Demanding
regulatory agenda | |
| |
| | | | | | | | | | | |
| | | |
| What we have seen In 2022, inflationary conditions moved from a perceived transitory condition to a likely more longer-term and persistent high inflation environment, following the conflict in Ukraine. This has caused further increases in the cost of living for our retail customers, particularly those on lower incomes. Market expectations for Bank Rate also changed significantly with the Monetary Policy Committee (MPC) raising the rate from 25bps at the end of 2021 to 350bps by the end of 2022. The volatility in Q3 2022 caused mortgage rates to rise sharply. Our response and looking ahead Our business is correlated to the performance of the economy. Our purpose is to help people and businesses prosper, so we are committed to support our customers with the rising cost of living. | Our focus has been to provide targeted and practical support, including advice on household budgeting and a toolkit for SMEs to help them through the ongoing inflationary pressures. The outlook remains uncertain as inflation has eroded real disposable income with the prospects of a recession ahead. We expect Bank Rate to continue to rise, peaking in H1 2023. Higher interest rates are likely to dampen demand for housing, causing a fall in house prices back to 2021 levels. We reached out to over 2 million customers most likely to be impacted by the cost of living crisis and remain committed to helping our customers at moments that matter most.
|
Uncertain economic
environment | |
| |
| | | | | | | | | | | | | | |
| Annual Report 2022 | Santander UK Group Holdings plc 11 |
| | | | | | | | | | | | | | | | | | | | | | | | | | | | | | | | | | | | | | | | | |
| Strategic Report | Sustainability and Responsible Banking | Governance | Risk review | Financial review | Financial
statements | Shareholder
information |
| | | | | | | | | | | | | |
| | | | | | | | | | | | | |
| | | | | | | | | | | | | | |
Our aim is to be the best open financial services platform by acting responsibly and earning
the lasting loyalty of our people, customers, shareholders and communities |
| | | | |
Our
resources | | | | |
People Bringing the skills, expertise and drive
to deliver enhanced customer loyalty
and experience | Infrastructure Branch and online presence, operating centres and innovative technology | Banco Santander family Technology, shared management experience and brand benefits as
part of well-diversified global bank | Financial Strong capital,
liquidity and a prudent approach to risk |
|
| | | | | | | | | | | |
| | | |
Our
competitive advantage | Leading scale challenger bank in the UK Scale in our core banking
businesses combined with
an innovative mindset | Strong balance sheet Focused on prime secured lending with consistent strength under stress | International expertise
for UK companies 20 trade corridors to help
UK companies expand into
overseas markets |
| | | |
| | | |
| What we do | We provide financial products and services Mortgages, consumer finance, unsecured loans, credit cards, banking and savings accounts, investment and insurance products for individuals and services for companies |
| | | |
| | | | | | | | | | | | | | |
| | | | |
| How we do it | Build strong customer relationships | Offer a differentiated proposition | Take a prudent
approach to risk | Do things
The Santander Way |
|
| | | | | | | | | | | |
| | | |
| Our culture is built on doing things The Santander Way | | | |
Simple Our products are easy to
understand and we offer a
service which is convenient,
no matter when or how our customers want to
engage with us | Personal We treat our customers as
valued individuals, with a professional service they can trust. We support our colleagues to achieve their ambitions | Fair We are open, honest and treat others as we would like to be treated. We earn our investors a sustainable return and do our part to support our communities |
| | | |
| Our purpose is to help people and businesses prosper |
| | | | | | | | | | | | | | |
| Annual Report 2022 | Santander UK Group Holdings plc 12 |
| | | | | | | | | | | | | | | | | | | | | | | | | | | | | | | | | | | | | | | | | |
| Strategic Report | Sustainability and Responsible Banking | Governance | Risk review | Financial review | Financial
statements | Shareholder
information |
| | | | | | | | | | | | | |
| | | | | | | | | | | | | |
Our strategic priorities focus on customer loyalty and experience, simplification, improved efficiency and sustainable growth, while aiming to be the best bank for all our stakeholders.
| | | | | | | | | | | | | | | | | | | | |
|
| | | | | | |
| Customers | | Shareholders | | People | | Communities |
| | | | | | |
–Deliver outstanding propositions to meet more of our customers' needs –Connect physical and digital channels for seamless customer experience –Profitable growth in retail banking and sustainable returns in corporate banking –New and evolving revenue sources including global Banco Santander group projects | | –Simplify, digitise and automate our processes –Improve our technology and operations through innovation and optimisation –Remove complexity and siloes to increase productivity –Capital discipline and RWA management –Maintain a prudent approach to risk | | –Enable our people to meet their full potential –Implement new and flexible ways of working –Provide training and development to deliver a workforce for the future –Ensure all aspects of diversity remain front of mind | | –Creating a thriving workplace –Driving sustainable economic growth and financial inclusion –Driving inclusive digitalisation –Upholding the highest ethical standards and fighting financial crime –Helping fight climate change and supporting the low carbon economy |
| | | | | | | | | | | | | | |
| Annual Report 2022 | Santander UK Group Holdings plc 13 |
| | | | | | | | | | | | | | | | | | | | | | | | | | | | | | | | | | | | | | | | | |
| Strategic Report | Sustainability and Responsible Banking | Governance | Risk review | Financial review | Financial
statements | Shareholder
information |
| | | | | | | | | | | | | |
| | | | | | | | | | | | | |
| | | | | |
Our performance and KPIs1 |
| |
We are confident in our ability to transform the business through our customer focus, business efficiency and proven resilience.
| | |
4.6 million Loyal customers We grew loyalty by deepening existing relationships and acquiring valuable new customers. This was enabled by strong propositions which included leading Savings offers and the launch of our new Edge current account. Delivering growth though customer loyalty remains at the heart of our strategy. |
| | |
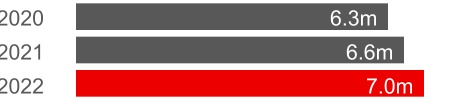
7.0 million Digital customers Customers in the UK are increasingly moving towards digital banking. Our enhanced digital capability attracted a further 370,000 digital customers in 2022, with 92% of current account and 99% of credit card openings made through digital channels. Half of our 14 million total active customers are now digital. |
| | |
Ranked 7th in Retail Net Promoter Score At the start of 2022 we changed survey methodology for Retail (2021: NPS ranked 4th). Customer service is integral to our strategy and remains a key area of focus. |
| 7th out of 9 competitors |
| | |
Ranked 1st in Business and Corporate Net Promoter We maintained our first place ranking, a testament to the comprehensive proposition and our strong support for our small and medium-sized business customers. |
| 1st out of 6 competitors |
| | |
Return on Equity 10.6% (2021: 9.9%) and Adjusted RoTE2 14.1% (2021: 13.2%)
Improvement reflected increased income and lower costs, partly offset by higher credit charges. |
| | |
Cost-to-income ratio improved to 47% (2021: 56%) and Adjusted cost-to-income ratio2 43% (2021: 50%)
Improved as a result of higher adjusted net interest income largely due to the impact of Bank Rate increases and lower adjusted operating expense. |
| | |
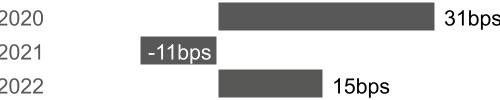
15bps Cost of risk Increased with the deterioration in the economic environment and followed write-backs in 2021 related to ECL Covid releases. |
| | |
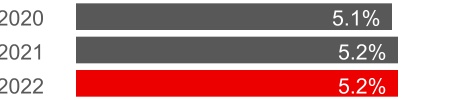
5.2% UK Leverage ratio Remained stable as retained profit was partially offset by the change in treatment of software assets on 1 January 2022. UK leverage exposure remained broadly stable at £248.6bn (2021: £246.3bn) |
1.See Glossary on page 305 for KPI definitions. Our shareholders primarily monitor the APMs shown here. Equal prominence between IFRS measures and APMs are included within the CEO and CFO reviews. 2.Non-IFRS measure. See ‘Alternative Performance Measures’ on page 181 for details and reconciliation to the nearest IFRS measure for return on ordinary shareholders’ equity (RoE) and cost-to-income ratio. | | | | | | | | | | | | | | |
| Annual Report 2022 | Santander UK Group Holdings plc 14 |
| | | | | | | | | | | | | | | | | | | | | | | | | | | | | | | | | | | | | | | | | |
| Strategic Report | Sustainability and Responsible Banking | Governance | Risk review | Financial review | Financial
statements | Shareholder
information |
| | | | | | | | | | | | | |
| | | | | | | | | | | | | |
| | | | | |
| Our performance and KPIs continued |
| |
| | |
Medium term aim to be a Top 10 company to work for We aspire to be a Top 10 company to work for as this is an important measure of employee satisfaction and our participation forms part of a wider Banco Santander goal. (2021: 16th) |
Current position: 30th |
|
| We are also accredited as a Top Employer (unranked) by the Top Employers Institute |
| | |
>2.1m financially empowered people cumulative since 2019 We have given further support to those unbanked, underbanked or vulnerable people by promoting access to finance, tailored products and financial education initiatives. This has been even more important during the Covid-19 crisis. |
| | | | | | | | | | | | | | | | | | | | | | | |
| Organisation of our segments |
| | | | | | | |
| We manage our business through three operating segments plus the corporate centre as outlined here. Our segmental structure is consistent with how Banco Santander organises its operations across its Europe division. To ensure consistency and to leverage shared investment, best practice and expertise, we work closely with our colleagues across Europe. A number of our senior business leaders also head up business units across Europe. This includes our Head of Homes and Head of Everyday Banking who hold these roles for Europe as well as Santander UK.
| | | Retail Banking Retail Banking consists of two business units, Homes and Everyday Banking. Homes provides prime UK mortgage lending to owner occupiers and buy-to-let landlords with small portfolios. Everyday Banking provides banking services and unsecured lending to individuals and small businesses. | | | Corporate & Commercial Banking (CCB) CCB provides banking products and services to SMEs, mid-sized and larger corporates, typically with annual turnovers of between £2m and £500m, as well as to Local Authorities and Housing Associations. |
| | | |
| | |
| | |
| | | | |
| | | | | |
|
| | | Consumer Finance Consumer Finance provides prime auto consumer financing for individuals, businesses, and automotive distribution networks. | | | Corporate Centre Corporate Centre provides treasury services for asset and liability management of our balance sheet. |
| | | | | | | |
| | | | | | | | | | | | | | |
| Annual Report 2022 | Santander UK Group Holdings plc 15 |
| | | | | | | | | | | | | | | | | | | | | | | | | | | | | | | | | | | | | | | | | |
| Strategic Report | Sustainability and Responsible Banking | Governance | Risk review | Financial review | Financial
statements | Shareholder
information |
| | | | | | | | | | | | | |
| | | | | | | | | | | | | |
The pressures from rising interest rates alongside increased costs of living and doing business in 2022, meant it was increasingly important for us to focus on the impacts for our customers, as well as the bank. These challenges are ongoing and we remain committed to supporting our customers in the current environment, whilst prudently managing risk
Christine Palmer
Chief Risk Officer
Sustained support for the business
We continued to support the business throughout 2022 via both remote access and increasingly office-based working, as the government removed all Covid restrictions by early Q2 2022. Our Risk teams have been active across a range of business and support functions including:
–Bringing Risk, Compliance and Economic Crime Risk functions together, into an aligned Risk & Compliance function under the Chief Risk Officer.
–Compliance support for initiation of a Consumer Duty organisation-wide programme; and effective Financial Crime oversight, including the enablement of an effective and timely response to Russia sanctions.
–Supporting new model developments and a continued focus on regulatory capital approaches.
–Continued support for asset growth through credit decisioning, risk oversight and challenge.
–Support for delivery of Santander UK-wide stress testing including the Bank of England's Annual Cyclical Scenario and sensitivity analysis of our future business plans.
–Working with the business to ensure that risk is fully considered and effectively managed through the change lifecycle, from inception and prioritisation through to delivery.
–Impactful oversight and engagement across key Bank initiatives including IT transformation programmes, payments, material outsourcing, and organizational change.
Capital and Liquidity risks
We remain in a strong position with respect to our Capital, Liquidity and Pension fund metrics.
Our customer funding gap increased in 2022, with strong mortgage demand and competition for the UK retail deposits market.
We are pro-actively addressing this through mitigating actions across the business. Financial market volatility in September 2022 increased gilt yields materially, increasing pressure on pension funds' collateral requirements across the industry. Our pension fund had sufficient collateral to support hedging, but we have since taken further actions to increase resiliency.
Operational risks
We closely monitor operational risks, providing input and oversight to ensure operational resilience. Key areas of focus include Financial crime, Fraud, IT infrastructure, People, Data, Third Party Risk Management, and Cyber-attacks, where external risks to the industry remain elevated.
The net value of our operational risk losses (events over £10k) increased by 160%, largely relating to the £108m penalty arising from the FCA enforcement investigation into our Financial Crime systems and controls, together with new transformation programmes and continued External Fraud related losses which increased by 138% in value and are in line with industry trends.
Looking forward
With the Covid-19 pandemic now behind us, we aim to maintain our forward transition by focusing on:
–Managing a return to the office, and preparing for our move to a new headquarters due to open in 2023, while pro-actively engaging with our colleagues throughout the process.
–Continuing to attract and retain Risk management and Compliance talent, in a competitive recruitment market and transforming it to a fit-for-the future Risk & Compliance function.
–Supporting our customers, in an inflationary environment and tighter monetary conditions.
–Regular risk assessments of our business plans, to inform financial forecasts and risk appetite.
–Delivering impactful oversight, challenge, guidance and support to the business.
| | | | | | | | | | | | | | | | | | | | |
| Cost of living pressures, higher mortgage rates | | |
| | | | | | | | |
| In 2022, inflationary conditions moved from a perceived transitory condition to a likely more longer-term and persistent high inflation environment, following the outbreak of conflict in Ukraine. This caused further increases in the cost of living for our retail customers, particularly those on lower incomes. Market expectations for the BoE Bank Rate also changed significantly with the MPC raising the rate from 10bps at the end of 2021 to 400bps by February 2023. Current market consensus is | | that the BoE Bank Rate will rise a little further and peak in H1 2023, as inflation subsides in response to tighter financial conditions. We have recognised Inflationary and supply chain pressures as a Top risk, to ensure we remain focused on the potential impacts on our customers, and across our retail and corporate credit portfolios. Overall credit quality remains good across our portfolios, however cost of living pressures are starting to impact the book performance, with an increase in early warning | | indicators, albeit from a low base position. We continue to monitor the situation closely. Political turmoil within the UK Government, and a lack of clarity over public finances caused longer term rates to surge in September 2022. This placed further upwards pressure on mortgage rates, and since then affordability policy updates have been made to protect against the potential of unaffordable loans. We also reviewed and enhanced customer support capacity and solutions for customers in financial difficulty. | | |
| | | | | | | | |
| | | | | | | | | | | | | | |
| Annual Report 2022 | Santander UK Group Holdings plc 16 |
| | | | | | | | | | | | | | | | | | | | | | | | | | | | | | | | | | | | | | | | | |
| Strategic Report | Sustainability and Responsible Banking | Governance | Risk review | Financial review | Financial
statements | Shareholder
information |
| | | | | | | | | | | | | |
| | | | | | | | | | | | | |
We monitor our Top risks monthly at the Executive Risk Control Committee and Board Risk Committee.
Highlighted below are our Top risks in 2022 and associated management actions. Many of these risks are likely to remain in focus in 2023.
Inflationary & supply chain pressures - New
We introduced this as a Top risk following the onset of the conflict in Ukraine, which exacerbated already elevated inflation levels. This covers potential impacts on our customers from cost of living increases and rising interest rates; on our corporate customers from business cost increases and supply chain pressures. It also covers remaining Covid-19 and Brexit related risk issues, post pandemic and formal exit from the EU, which are now no longer separate Top risks. We have taken actions to adjust affordability criteria in our retail lending decisions, increase customer support capacity, and ensure close and continuous monitoring of our credit portfolios for any indications of stress in our customer base.
Climate change
We continue to enhance our data strategy and reporting reflecting the strategic importance of climate change risk. We continue to progress our climate change implementation plan, including integrating associated risks into our Risk Framework, formulating a risk appetite, and progressing associated initiatives.
Financial Crime
In December 2022, we accepted an FCA penalty of £108m relating to historical AML control shortcomings as described under Conduct & Regulatory below. Developments related to the implementation of Russian sanctions have added further complexity to mitigating compliance risks and maintaining operational resilience in our Financial Crime Centre of Excellence. We continue to enhance our financial crime risk management capabilities, through implementation of our Financial Crime Transformation and Remediation programme, enhancing controls, and providing additional analytics capacity and subject matter expertise.
Fraud - New
We recognised this as a Top risk, reflecting significant industry wide increases in Fraud levels and losses, which are impacting our customers. Fraud losses now consistently form a significant proportion of our operational losses. We have designed new fraud prevention tools to complement our existing prevention and detection systems and controls. We continue to deploy dynamic 'scam warning' in our online banking payment process, to enhance fraud prevention controls for high-risk digital payments.
IT
The importance of IT risk management and control continued to be re-iterated by some outages to customer services during the year, although there has been a continued trend downwards in such incidents from H2 2021. To address these issues, we have finalised a multi-year IT Transformation plan, with Board approval, with the aim of securing risk reduction benefits which will accrue during the plan period. We consider that our IT associated risks are decreasing as a result of the ongoing implementation of our transformation plan.
Cyber risk management
In 2022, we experienced no notable data or cyber security incidents, although we responded to a number of third-party incidents, mainly ransomware attacks. Externally, the cyber risk landscape stabilised, however the threat remains at unprecedented levels due to the ongoing conflict in Ukraine. We continue to review and enhance our controls based on the latest intelligence, and invest in the right skills and resources. We also actively work with our peers in the Cyber Defence Alliance to share threat intelligence expertise, and experiences, to help identify common cyber-attack features and effective mitigation strategies.
People
In 2022, we continued to focus our overall wellbeing and inclusion strategy on supporting colleagues through transformation and change. In line with our peers, we are experiencing a competitive recruitment market and responding with enabler plans to reduce time-to-hire and open vacancies, as well as maintaining capacity and capability to deliver our business plans. Cost of living is also a key focus area where we have intervened with pay rises to support our colleagues across the business. We have managed a gradual return of colleagues to office environments, along with hybrid working as well as the people risks associated with a phased relocation of our Head Office to Unity Place in Milton Keynes.
Conduct & Regulatory
We continue to face a challenging regulatory agenda with significant ongoing FCA and PRA interaction on a range of industry issues, as well as the ECB and Payments Services regulators. These issues include the FCA's Consumer Duty, which requires considerable management and focus of resources. Final rules were published in July 2022, with the first implementation date set at 31 July 2023 and the final date of July 2024. In December 2022 the FCA announced that Santander UK accepted a penalty of £108m for historical AML control shortcomings between December 2012 and October 2017.
Managing Complex Change
We have a challenging change agenda including continued aspirations for transformation and growth. We have well-established change control processes, as well as a strong oversight framework and related risk-based prioritisation. This enables us to address operational and capacity challenges and facilitate timely delivery. In 2022, change included a reduction of our property footprint, and a specific focus on migration to cloud, further digitalisation, and management of obsolescence. Ensuring change does not result in adverse impacts on our risk profile underpins our strategic decisions and is robustly managed.
Data management
Data management, including data privacy, is a Top risk reflecting its role in supporting our business plans and strategy, as well as the rising cyber threat landscape and the importance of controls over personal data. In 2022, we continued to monitor data management risk through the enhanced governance structures and processes put in place by our Chief Data Officer. We are implementing a central data programme, with clear deliverables that will improve our data management capabilities in line with our approved data strategy.
Third Party Risk Management (TPRM)
We are progressing with a programme of work to enhance controls and governance arrangements. During 2022, we continued to evolve our processes, including implementation of a new TPRM process and amending contracts with suppliers. Our Procurement transformation also continues to operationalise our updated TPRM policies and processes.
Ring-Fencing
We have retained Ring-fencing as a Top risk to maintain our focus on ongoing governance and compliance, as we continue to assess and refine the quality and maturity of controls. Further review may be needed, depending on the outcomes of HM Treasury's proposed consultations on the ring-fencing regime, due to take place in 2023.
Building and maintaining capital strength and Pension risk
We saw sustained resilience and improvement in our Regulatory capital and Pension fund metrics throughout 2022 with detailed analysis set out in the Risk review. Pension risk has now been removed as a Top risk as a result of those improvements in metrics and actions taken to reduce residual risk and enhance resiliency, given increased market volatility in 2022.
| | | | | | | | | | | | | | |
| Annual Report 2022 | Santander UK Group Holdings plc 17 |
| | | | | | | | | | | | | | | | | | | | | | | | | | | | | | | | | | | | | | | | | |
| Strategic Report | Sustainability and Responsible Banking | Governance | Risk review | Financial review | Financial
statements | Shareholder
information |
| | | | | | | | | | | | | |
| | | | | | | | | | | | | |
We monitor these risks using our Emerging risks radar and regularly provide updates to the ERCC and BRC.
Highlighted below are our emerging risks in 2022 and our associated management actions. All of these risks will likely be in focus in 2023, given that they continue to evolve and intersect with our Top risks.
Uncertain macroeconomic and geopolitical environment
In the past few years, a number of broader, more complex and uncertain risks have evolved which may present future headwinds. These include geopolitical tensions between regions across the world, in particular the current conflict in the Ukraine. This has impacted global energy prices and supply chains which added to inflationary pressures, as well as stretching household finances. These risks accelerate trends towards deglobalisation, and a reduction of variety of goods and services, causing prices to increase over the medium to long-term.
These factors are also playing into increased localised political risk across the globe, including in the UK with a second new Prime Minister in 2022. In February 2023, the First Minister of Scotland resigned, with future implications for the Union with the UK remaining uncertain. We are closely following these political developments and the potential for any material impacts which we may need to reflect in our business plans.
Rapid technological change and customer behaviour
Our multi-year transformation programme with a focus on investment in digitalisation and automation, is aimed at designing compelling propositions for targeted customer segments, reshaping customer interactions and simplifying and digitising the business at scale for improved efficiency and returns.
Our overall approach reflects the continued acceleration of strong trends towards customer digital adoption via mobile and online banking, whilst also ensuring that we remain competitive in a market which is experiencing an increase in digital-led market entrants. We are cognisant of cyber, cloud technology and operational resilience issues which we take into account in our development strategy.
Intense market competition
Enhancing our digital proposition remains key in supporting our customers' needs, retaining and growing our customer loyalty base, and addressing the commercial challenges of a highly competitive mortgage market, where surplus deposits in ring-fenced banks remain a key driver of market pricing. As well as the elevated competition between incumbent banks, new entrants backed by other large multi-national banks are also launching in the UK offering competitive incentives to compete in the growing digital market, as well as savings, lending and investment markets.
Demanding regulatory agenda
We remain vigilant in taking a customer-focused approach in developing strategy, products, services and policies that support fair customer outcomes and market integrity. Like all UK banks, we will continue to face a demanding and complex regulatory agenda in 2023 and beyond focused on consumer outcomes, customer vulnerability, competition, climate change and Consumer Duty.
The PRA's operational resilience and outsourcing expectations remains a key focus for the bank moving forward, as well as implementation of Basel 3.1 which will impact capital requirements. We also continue with regulatory engagement on other key issues such as APP fraud and the impacts of the rising cost of living and interest rate rises.
Looking ahead we await the government's forthcoming consultation on ring-fencing, as well as working with industry, trade bodies, regulators and the government to support the appropriate regulation of UK financial services.
Extended Government involvement in banking & markets
Following Government policy interventions during the Covid-19 pandemic, including UK Government guaranteed loans and dividend restrictions, there are some indications that this trend will continue moving forwards. The increase in environmental, social and governance factors is likely to direct banks’ lending decisions further, with the risks of higher capital requirements as an incentive to channel lending to certain sectors, and potentially restrict or avoid others. Banks may also be called upon to contribute more to the exchequer, due to stretched public finances, via increased taxation rates, or windfall taxes, as evidenced by recent actions in Spain. Product pricing and actions will also remain under intense scrutiny by regulators and the Government, during the current period of higher inflation and mortgage rates. These issues have the potential to significantly impact our business plans, costs and revenues.
Central Bank Digital Currencies & Crypto assets
Depending upon how these are implemented, there is a risk of a significant transfer of commercial bank deposits into these Central Bank Digital Currencies over time, increasing wholesale funding requirements and costs, and reducing the 'stickiness' of deposits in a stress. There are also broader potential impacts on regulatory frameworks, and monetary and fiscal policy. We continue to monitor these developments as they evolve. We are also addressing the risk of crypto asset exposure through our client onboarding policies and procedures, which are part of our Financial Crime framework.
Disruption of UK macroeconomic factors
In the last quarter of 2022 and early 2023, UK house price growth slowed, following shocks to the macroeconomic environment arising from the conflict in Ukraine, which exacerbated inflationary pressures, and triggered significant rises in the cost of living and interest rates globally. After a steady increase of financial pressures on customers, the financial markets and economic environment saw substantial dislocation in H2 2022, which fundamentally changed macro-economic expectations for 2023 and beyond. We have been actively monitoring customer behaviour and to date our customers are showing resilience in adapting to the changing environment.
In 2022, we significantly developed our regulatory models, focusing on capital adequacy, to comply with new regulatory technical standards for banks. We expect this trend to continue over the next two years in line with supervisory expectations.
We recognise that Model risks have increased in the current environment of both higher inflation and interest rates, which is inconsistent with the period upon which the models were developed. We have fed back our response to the PRA on how we meet policy and procedure requirements under the Model Risk consultation paper (CP6/22), including the independent review of judgemental adjustments.
There are also significant macroeconomic risks attached to the transition process of decarbonising industrial sectors, although we have very limited direct exposure to those in our Corporate and Commercial Banking clients' businesses. There are also costs and risks associated with reducing UK housing emissions and 'greening' commercial property which could impact our retail customers and corporate clients.
Eurozone/Sovereign Bank Contagion
We previously considered this risk as part of the uncertain macroeconomic and geopolitical environment, but have now identified it separately, given developments in 2022. Energy and commodity price shocks have increased risks to post-pandemic growth and financial conditions in the Euro area and globally. Euro area sovereigns, corporates and households face higher interest rates and cost pressures that could test debt sustainability for more highly indebted entities. The most relevant risks for Santander UK could be reflected in wider credit spreads which could increase wholesale funding costs. Credible funding plans and liability strategies to support our aspired business growth will be key, which are the subject of regular review, challenge and discussion at our ALCO.
| | | | | | | | | | | | | | |
| Annual Report 2022 | Santander UK Group Holdings plc 18 |
| | | | | | | | | | | | | | | | | | | | | | | | | | | | | | | | | | | | | | | | | |
| Strategic Report | Sustainability and Responsible Banking | Governance | Risk review | Financial review | Financial
statements | Shareholder
information |
| | | | | | | | | | | | | |
| | | | | | | | | | | | | |
Key risk types map to, and are significant drivers of, our Top and Emerging risks. See the Risk review for more information.
Introduction
Key risk types are components of our overarching Risk Framework and are set out in detail in the Risk review. Each has its own defined framework, and we report on and review its risk profile formally at the ERCC, BRC and Board. However, the risk profile level is agreed at the underlying specialist risk control forums.
Top and emerging risk issues, which have been described in the commentary above, are contained within our Key risk types, and are mapped in the table below.
We have also commented below on a selection of these Key risk types, which were in focus in 2022 and remain so in 2023:
Credit risk – our credit portfolios have remained resilient, with unemployment tracking at historically low levels (one of the most important factors in defaults on mortgages). The UK housing market has also continued to show resilience, although house price growth slowed in Q4 2022 ; however we have a cautious outlook for 2023, with an increased cost of living impacting
households and increased mortgage rates likely to be a further factor going forwards. Our corporate credit customer portfolios have also remained resilient, but we also have a similar cautious outlook for 2023, with increased business costs and supply chain pressures, and potentially reduced consumer spending, likely to impact our customers further.
Strategic and Business risks – are challenging to manage in the current volatile and uncertain macro-environment, following the Covid-19 pandemic and the ongoing conflict in Ukraine. This risk type has strong links with a number of our Top and Emerging risks including people risks and management of change and transformation, which are critical to achieving our medium and longer-term business plans.
Operational risks – were prominent in 2022 where we were focused on managing risks arising from a heightened external cyber risk environment, exacerbated by the conflict in Ukraine; enhancing our fraud detection and prevention controls to mitigate increasing fraud
attacks and fraud losses, which are impacting across the banking industry; oversight of IT risk management where a multi-year transformation programme is being implemented; managing our people risk in a hybrid-working environment and tight recruitment market; managing complex change risk delivery with capacity and capability challenges intersecting with people risks; and enhancing our operational resilience along with associated regulatory requirements.
Model risks – in 2022 we devoted significant development and implementation time to regulatory models focused on capital adequacy. We expect this trend to continue over the next two years in line with supervisory expectations. We also developed new models for ECL reporting, with a focus on residential mortgages and commercial lending. The new models are designed to improve the overall control environment and enable us to eliminate some long-standing Judgemental Adjustments required due to limitations in prior models.
| | | | | | | | |
| Key risk type | Top risks | Emerging risks |
| Credit & Capital | Inflationary & supply chain pressures
Climate change
Building & maintaining capital strength | Uncertain macroeconomic and geopolitical environment
Extended Government involvement in banking & markets
Disruption of UK macroeconomic factors |
| Pension | Building & maintaining capital strength | Uncertain macroeconomic & geopolitical environment |
| Operational | Third party risk management Managing complex change
Data management IT Risk
People risk IT Fraud Risk
Cyber Risk Management | Central Bank Digital Currencies & Crypto Assets
Rapid technological change & customer behaviour
|
| Conduct & Regulatory | Conduct & Regulatory Ring-Fencing
Climate change Data management
Inflationary & supply chain pressures Fraud Risk | Extended Government involvement in banking & markets
Demanding regulatory agenda |
| Financial crime | Financial crime Fraud Risk | Central Bank Digital Currencies & Crypto Assets |
| Legal | Climate change Ring-fencing | Central Bank Digital Currencies & Crypto Assets |
| Strategic & Business | Inflationary & supply chain pressures Managing complex change
People Risk IT Risk
Data management Financial Crime | Intense market competition
Rapid Technological Change & Customer Behaviour
Central Bank Digital Currencies & Crypto Assets |
| Reputational | Climate change Conduct & Regulatory | Demanding regulatory agenda |
| Model | Inflationary & supply chain pressures Climate change | Uncertain macroeconomic & geopolitical environment |
| Market, Structural & Liquidity | Inflationary & supply chain pressures Building & maintaining capital strength | Uncertain macroeconomic & geopolitical environment
Eurozone/Sovereign Bank Contagion |
| | | | | | | | | | | | | | |
| Annual Report 2022 | Santander UK Group Holdings plc 19 |
| | | | | | | | | | | | | | | | | | | | | | | | | | | | | | | | | | | | | | | | | |
| Strategic Report | Sustainability and Responsible Banking | Governance | Risk review | Financial review | Financial
statements | Shareholder
information |
| | | | | | | | | | | | | |
| | | | | | | | | | | | | |
| | | | | | | | | | | |
| | Our strong set of results reflect the hard work of our people while demonstrating the continued importance of taking a prudent approach to risk and maintaining a resilient balance sheet.
Duke Dayal |
| | |
| | |
A strong set of results in a challenging environment
The UK economy has faced a range of challenges over recent years, and it now faces a cost of living crisis with higher inflation and increased Bank Rate, together with the impacts from the conflict in Ukraine.
Against a challenging macroeconomic backdrop, we are extremely proud to have delivered a strong set of results across our segments underpinned by our prudent approach to risk and maintaining a resilient balance sheet.
Our financial results
Profit from continuing operations before tax of £1,894m was 2% higher than 2021.
Net interest income increased 12% and Banking NIM was up 14bps largely due to the impact of Bank Rate increases and higher mortgage lending.
| | | | | | | | |
| Summarised consolidated income statement |
| | |
| For the years ended 31 December | 2022
£m | 2021
£m |
| Net interest income | 4,472 | 3,997 |
Non-interest income(1) | 534 | 547 |
| Total operating income | 5,006 | 4,544 |
| Operating expenses before credit impairment (charges)/write-backs, provisions and charges | (2,370) | (2,540) |
| Credit impairment (charges)/write-backs | (321) | 233 |
| Provisions for other liabilities and charges | (421) | (379) |
| Profit from continuing operations before tax | 1,894 | 1,858 |
Adjusted profit from continuing operations before tax(2) | 2,202 | 2,193 |
|
1.Comprises ‘Net fee and commission income’ and ‘Other operating income’. 2.The financial results were affected by several items which are excluded from the ‘Adjusted profit from continuing operations before tax' above. These items had an aggregate impact of £308m on 2022 profit from continuing operations before tax (2021: £335m). Non-IFRS measure. See ‘Alternative Performance Measures’ on page 181 for details and reconciliation to the nearest IFRS measure.
|
Operating expenses before credit impairment charges/write-backs and provisions decreased 7% due to lower transformation spend following significant restructuring in 2021.
This programme has embedded lower operational costs and improved our efficiency which should help to mitigate the impact of inflation.
Credit impairment charges of £321m, were driven by the deterioration in the economic outlook in 2022. Mortgage interest rates have risen with the expectation of further increases to Bank Rate and are likely to remain substantially higher than a year ago. These challenges for households and businesses are expected to continue well into 2023 and could impact credit quality. New to arrears flows and Stage 3 defaults remain low.
| | | | | | | | |
| Financial highlights |
| £1,894m Profit before tax (2021: £1,858m) |
| 2.06% Banking NIM (2021: 1.92%) |
| 47% Cost-to-income ratio (2021: 56%) |
| 1.24% Stage 3 ratio (2021: 1.43%) |
| 15.2% CET1 Capital ratio (2021: 15.9%) |
| 5.2% UK leverage ratio (2021: 5.2%) |
.
| | | | | | | | | | | | | | |
| Annual Report 2022 | Santander UK Group Holdings plc 20 |
| | | | | | | | | | | | | | | | | | | | | | | | | | | | | | | | | | | | | | | | | |
| Strategic Report | Sustainability and Responsible Banking | Governance | Risk review | Financial review | Financial
statements | Shareholder
information |
| | | | | | | | | | | | | |
| | | | | | | | | | | | | |
| | | | | |
| Financial overview continued |
| |
Provisions for other liabilities and charges increased 11%, largely related to the £108m penalty for historical shortcomings in our AML controls between 31 December 2012 and 18 October 2017. We also continued to see a rise in scams with increased fraud charges of £153m in 2022 (2021: £74m). These were partially offset by lower transformation programme charges following significant restructuring in 2021.
Tax on profit from continuing operations decreased to £471m (2021: £485m), largely due to the impact of the revaluation of the deferred tax liability position following the 2022 decrease in the rate of Bank Surcharge. The effective tax rate decreased to 24.9% (2021: 26.1.%) in the period.
Our transformation programme has embedded lower operational costs and improved efficiency of the business. Despite a high inflationary environment we delivered £655m of transformation programme savings from investment of £936m, since 2019.
| | | | | | | | |
Summarised segmental balance sheet(3) |
| | |
| 31 December | 2022
£bn | 2021
£bn |
| Customer loans by segment | | |
| | |
| Retail Banking | 194.6 | 185.6 |
| Consumer Finance | 5.4 | 5.0 |
CCB 1 | 18.5 | 19.3 |
| Corporate Centre | 1.2 | 0.7 |
| Total | 219.7 | 210.6 |
Other assets2 | 72.5 | 83.1 |
| Total assets | 292.2 | 293.7 |
| Customer deposits by segment | | |
| Retail Banking | 161.8 | 157.0 |
CCB | 24.8 | 26.5 |
Corporate Centre | 9.9 | 8.7 |
| Total | 196.5 | 192.2 |
| Total wholesale funding | 63.0 | 65.4 |
| Other liabilities | 18.0 | 19.8 |
| Total liabilities | 277.5 | 277.4 |
| Shareholders' equity | 14.7 | 16.1 |
| Non-controlling interest | 0.0 | 0.2 |
| Total liabilities and equity | 292.2 | 293.7 |
|
1. CCB customer loans includes £4.5bn of CRE loans (2021: £4.4bn). 2.31 December 2022, includes £49m of property assets classified as held for sale. 3.The segmental basis of presentation in this Annual Report has been changed. See Note 2 to the Consolidated Financial Statements for more information. |
Our loan book is well collateralised and primarily focused on prime UK mortgage lending which accounts for 85% of the customer loans with an average stock loan-to-value of 50%. Consumer Finance makes up 2% of the loan book and is largely secured on the vehicle. Unsecured retail lending which includes credit cards, overdrafts and UPLs also makes up 2% of the book.
Our corporate loan book is focused on SMEs and mid-sized and larger corporates and accounts for 8% of customer loans. We have a prudent approach to CRE with less than 1% of new business written above 60% LTV and no new loans for development purposes.
| | | | | | | | |
| Mortgage activity | |
|
|
During the early part of 2022, the mortgage market was very active with high mortgage volumes and rising house prices. Liquidity among lenders led to high competition for mortgage lending. Despite this strong start to the year, the mortgage market began to slow as cost of living worries among consumers started to take effect. In the third quarter of 2022, borrowing costs rose sharply following Bank Rate increases after the fiscal event in September 2022. Despite these challenges, in 2022 we wrote £35.5bn of gross lending. Given 85% of our customer loans are retail mortgages, with an average loan-to-value of 50%, we are confident in the resilience of our balance sheet and believe our mortgage book is well protected from a downturn in the market. We introduced new Judgemental Adjustments (JAs) in June 2022 to account for the potential repayment affordability risk among those customers with low disposable income. After stressing for inflation, £5bn of mortgages moved from Stage 1 to Stage 2. Looking ahead, we expect a softer mortgage market in 2023 as the increased cost of living and higher borrowing costs dampen demand. |
| | | | | | | | | | | | | | |
| Annual Report 2022 | Santander UK Group Holdings plc 21 |
| | | | | | | | | | | | | | | | | | | | | | | | | | | | | | | | | | | | | | | | | |
| Strategic Report | Sustainability and Responsible Banking | Governance | Risk review | Financial review | Financial
statements | Shareholder
information |
| | | | | | | | | | | | | |
| | | | | | | | | | | | | |
| | | | | |
| Financial overview continued |
| |
Segmental performance
Retail Banking achieved strong customer growth throughout 2022 attributed to various switcher campaigns and new products.
We launched our new Santander Edge current account, which builds on the success of our 1I2I3 current account, offering cashback on essential spend, preferential savings rates as well as other benefits aimed to help our customers, particularly given current economic conditions.
We have also been focused on furthering customers financial education and ability to recognise scams, empowering over 2.1 million customers in 2022.
Consumer Finance has a prime portfolio with 84% of lending secured on the vehicle and low levels of default. In 2022, our Original Equipment Manufacturer (OEM) partners were responsible for 19% of all new car registrations and 14% of new business was for green assets (i.e. electric vehicles and hybrids).
Corporate & Commercial Banking (CCB) delivered strong financial performance in 2022 with good growth in clients, activity and income, almost £9bn in new facilities extended and a marked increase in segment profitability and returns.
The Santander Navigator platform, launched in June 2022, designed to help our clients diversify and expand overseas, has further enhanced our international proposition.
Our SME Support toolkit providing practical support and advice to businesses facing challenges has also been well received.
Our Growth Capital fund celebrated its 10th anniversary having supported over 200 businesses with £1.5bn in facilities.
| | | | | | | | | | | | | | | | | |
| Successful return to wholesale funding market | |
| | | | | |
| £3.9bn Senior issuance by Santander UK Group Holdings plc (2021: £2.8bn) | | | £25.0bn TFSME (2021: £31.9bn)
–£6.9bn TFSME repaid in 2022 and similar annual repayments expected over the next 3 years –£21.1bn TFSME repayment due by 2025
–£3.9bn remaining TFSME repayment due between 2027 and 2031 as schedule is aligned to BBLS lending term |
| | | |
| £4.7bn Issuance by Santander UK plc (2021: £0.1bn) | | |
| | | |
Balance sheet resilience from strong capital
and liquidity
The CET1 capital ratio decreased 70bps to 15.2%. This was largely due to regulatory changes that took effect on 1 January 2022, including the reintroduction of the full CET1 software asset deduction, and implementation of a new definition of default. RWAs increased to £71.2bn with growth in lending.
The UK leverage ratio remained stable at 5.2%, as retained profit was partially offset by the change in treatment of software assets on 1 January 2022.
We paid interim dividends of £1.0bn, £300m of which was a special dividend. These were paid after review and approval by the Board in line with our dividend policy.
Our liquidity coverage ratio was strong at 163%, significantly above regulatory requirements.
Looking ahead
As we look ahead to 2023, while the macro environment will remain uncertain, tail winds from higher Bank Rates should help improve Banking NIM. The outlook remains uncertain, as inflation has eroded real disposable income with prospects of a recession ahead. After strong house price growth in recent years, we expect house prices to fall back to 2021 levels as higher Bank Rates dampen demand.
We are preparing for the FCA's Consumer Duty which requires considerable management and focus of resources. The first implementation date for Consumer Duty is set at 31 July 2023, with a final date of July 2024.
Despite the challenging environment, we continue to remain focused on supporting our customers, people and communities.
Duke Dayal
Chief Financial Officer
| | | | | | | | | | | | | | |
| Annual Report 2022 | Santander UK Group Holdings plc 22 |
| | | | | | | | | | | | | | | | | | | | | | | | | | | | | | | | | | | | | | | | | |
| Strategic Report | Sustainability and Responsible Banking | Governance | Risk review | Financial review | Financial
statements | Shareholder
information |
| | | | | | | | | | | | | |
| | | | | | | | | | | | | |
We recognise that financial institutions have an important role to play in addressing sector-specific challenges such as financial inclusion and financial crime, as well as broader systemic issues such as climate change.
Our Sustainability and Responsible Banking (SRB) strategy sets our ambition to become a sustainable and responsible bank; one which addresses these challenges and supports our purpose of helping people and businesses prosper. It responds to our most important sustainability issues and consists of three pillars and a solid foundation.
| | | | | | | | | | | | | | | | | | | | |
| Our strategic ambition: to become a sustainable and responsible bank | |
| | | | | | |
| Pillar 1: Creating a thriving workplace | | | Pillar 2: Better communities | |
| Our aim is to be a place where all of our people feel they belong and are supported to succeed. We want to provide a workplace with a responsible culture where anyone and everyone can grow while being themselves. This commitment is backed up by our Everyday Inclusion strategy which prioritises the themes of intersectionality, respect, balanced representation, leadership, advocacy, allyship, transparency and accountability. The strategy focuses on attracting, recruiting, developing and retaining the most talented and diverse people. | | | Financial Inclusion is an increasingly important topic. It is therefore a key part of our approach to building better communities. Our Financial Inclusion strategy is designed to help people improve their financial skills, gain access to financial services and develop financial resilience. We also focus on generating positive impact in our communities, for example, working with our charity partner Macmillan Cancer Support, supporting vulnerable customers and empowering students with our Santander Universities programme, whilst focussing on providing good outcomes for our customers. |
| | | |
|
| Pillar 3: Healthy environment | |
| Climate change is one of the major challenges facing society today. At Santander UK we recognise this. Our goal is to support the UK in tackling climate change by supporting our customers, colleagues and communities transition to a low-carbon, climate-resilient economy. We are fully committed to the Banco Santander’s ambition to achieve net zero carbon emissions by 2050, in line with the Paris Climate Agreement. | |
| |
| |
| | | |
| | | |
| Foundation: Being responsible in everything we do | |
| We must get the basics right before we can excel in the first three pillars. High standards of ethics and integrity are the foundation to prosperous businesses and society. They are also a clear priority in how customers choose their bank. We are committed to being a fair, transparent and responsible bank. At the heart of this is fair treatment of our customers. We deal with any form of fraud against our customers or other economic crime as a priority. | |
|
|
| For more information see the following sections in this report: –Sustainability review –Sustainability & Responsible Banking section, including TCFD
More information on performance data is also available in our separate Environmental, Social and Governance (ESG) Supplement, which does not form part of this Annual Report. | |
| | | | | | | | | | | | | | |
| Annual Report 2022 | Santander UK Group Holdings plc 23 |
| | | | | | | | | | | | | | | | | | | | | | | | | | | | | | | | | | | | | | | | | |
| Strategic Report | Sustainability and Responsible Banking | Governance | Risk review | Financial review | Financial
statements | Shareholder
information |
| | | | | | | | | | | | | |
| | | | | | | | | | | | | |
We strive to create value for all our stakeholders, by delivering on our commitment to be a more responsible bank.
This section is designed to be read together with the Sustainability and Responsible Banking section later in this report and our separate ESG Supplement.
Customers
We aim to be Simple, Personal and Fair in all our dealings with customers.
Cost of living
2022 saw a sharp increase in the cost of living. We recognise that our customers may be feeling financial pressure brought on by these rising costs and higher mortgage interest rates.
In response, we updated the financial support pages on our website to offer financial health checks, budget planning tools and tips on cutting spending and navigating rising energy costs. We also communicated with more than two million customers most likely to be impacted to highlight the support available. Where appropriate, we give links to PayPlan, a free and independent debt advice provider.
Financial inclusion
Financial inclusion is an important issue; starkly illustrated by the 1.5 million people in the UK without a bank account and 13.1 million people with low financial capability. Our Financial Inclusion strategy is designed to help people improve their financial skills, gain access to financial services and develop financial resilience. The strategy has three pillars: financial education and knowledge; an inclusive portfolio of products; and, services and customer care.
Meeting our customers' changing needs
Responding to trends in customer behaviour, we changed our branch opening hours in 2022 and increased telephone support available.
Alongside serving customers face-to-face, the new opening hours give our branch colleagues extra capacity to help customers with telephone banking. In 2022, branch colleagues helped more customers than ever over the phone, taking more than 4.9 million calls during the year.
More of our customers are also benefiting from our Voice ID service, which allows them to use their voice as their security password when they call us. Over three million customers are now set up to use Voice ID.
Meanwhile digital transactions continue to grow, increasing by 12% in 2022. More than seven million customers now use our digital platforms every month, representing more than half of our customer base. Peak daily log-ons to our mobile app exceed six million. The increased digitisation trends that started with Covid-19 have persisted.
With the growth in online and mobile banking we continue to enhance our digital offering. 2.4 million customers are registered for My Money Manager, a feature in our mobile app that provides personalised insights and helps customers make better financial decisions. To date there have been over 125 million sessions in My Money Manager and we have shared over 60 million personalised insights with our customers since its launch.
We also use digital channels to help raise customer awareness on the latest fraud and scam threats. This year we shared tips and advice
9.9 million times through the mobile app and in total, 46.3 million fraud and scam messages were shared through the mobile app, online and by email.
Digital customer service is also growing. Online chats through Sandi, our virtual assistant, reached 5.7 million in 2022, a 24% increase over 2021.
We also enhanced our online tool for customers experiencing financial difficulty, which includes financial education, budget planning and managing debt. For more on this, see the financial inclusion section in our ESG supplement (which does not form part of this Annual Report).
| | | | | | | | | | | | | | | | | |
| Customer sustainability highlights | |
| 7+ million customers now use our digital platforms monthly | | | Additional information on how we support our customers can be found in our ESG supplement, including: –Cost of living –Supporting our customers through financial difficulty –Financial inclusion and our strategy
|
| | | |
| 5.7 million online chats through Sandi, our virtual assistant, a 24% increase from 2021 | | |
| | | | |
| 10 years Since 2012, the Growth Capital team has helped over 200 businesses with more than £1.5bn of lending. In 2022, over £240m of new lending was deployed | | | 2.4 million customers are registered for our financial decision-making tool, My Money Manager. The service has provided more than 60 million personalised insights since 2020 |
| TO READ MORE, SEE OUR ESG SUPPLEMENT g |
Ongoing non-financial support for SMEs
Santander Breakthrough continues to develop new tools, resources and programmes to help small and medium-sized enterprises (SMEs) with non-financial support that meets their needs when they need it most. The economic environment was challenging for SMEs and throughout 2022 we increased on-demand resources and skills development programmes available via santanderbreakthrough.co.uk. We ensure there is a balance of information for every business, whether they are looking to expand domestically or internationally, develop new ways of working or manage the rising costs of doing business.
In 2022, Corporate and Commercial Banking celebrated 10 years since the creation of the Growth Capital team. The team was created to offer debt funding to high growth UK SMEs that would not dilute business founders’ equity or control. Since 2012, the Growth Capital team has helped over 200 businesses with more than £1.5bn of lending. In 2022, £240m of new lending was deployed.
In June 2022, we launched Santander Navigator, an end-to-end digital platform designed to help simplify international growth for SMEs. The platform brings together Santander’s global ecosystem of solution providers who can help businesses explore, prepare for, and connect to global opportunities. It also provides events and market insights. Through Santander Navigator, SMEs can draw on the knowledge and global reach of our provider network, gaining the information they need to overcome obstacles to international expansion. They can also access opportunities to expand into new markets and achieve their international ambitions while saving time and money as they grow.
| | | | | | | | | | | | | | |
| Annual Report 2022 | Santander UK Group Holdings plc 24 |
| | | | | | | | | | | | | | | | | | | | | | | | | | | | | | | | | | | | | | | | | |
| Strategic Report | Sustainability and Responsible Banking | Governance | Risk review | Financial review | Financial
statements | Shareholder
information |
| | | | | | | | | | | | | |
| | | | | | | | | | | | | |
| | | | | |
| Sustainability review continued |
| |
Shareholders
We aim to deliver a long-term, sustainable return for our shareholders while helping people and businesses prosper.
Part of a global bank
We are a subsidiary of Banco Santander SA and our ordinary shares are all held by Banco Santander group companies and are not listed. Santander UK plc's preference shares are listed on the London Stock Exchange and we also have other equity instruments in the form of AT1 securities.
Under the Banco Santander subsidiary model, Santander UK and other subsidiaries are responsible for their own capital, liquidity and funding. This not only mitigates the risk of difficulties in one subsidiary affecting another, it allows local market knowledge and expertise to be used and provides considerable operational flexibility.
We benefit from the strong Santander brand along with the experience and expertise of a global banking group. Sharing resources and capacity for systems development and using common, Banco Santander-wide technology platforms and innovations create a significant competitive advantage.
We are an important part of Banco Santander’s European division, and share a common ambition to grow our business through collaboration and by working more closely together. We aim to do this by better serving our customers, redefining how we interact with them and creating a simpler, more efficient operating model.
We began our multi-year transformation programme in 2019 to reshape the bank to better support our customers by focusing on simplification, digitalisation and customer experience. This has also helped reduce our cost base and we expect to see further improved returns in the medium term.
Consistent shareholder returns
Our operations are consistently profitable and we have paid a dividend every year since 2008. Dividends are paid in line with our dividend policy following review and approval by the Board. This ensures that our capital strength and resilience is maintained.
In 2022, we paid interim dividends of £1.0bn, £300m of which was a special dividend.
Investor engagement
Our Investor Relations team actively engages with institutional investors globally, working alongside our funding and capital teams for new issuances and building and maintaining relationships with fixed income investors and analysts.
We engaged with investors through in-person and virtual meetings, roadshows conferences, events and via regulatory announcements.
| | | | | | | | | | | | | | | | | |
| Shareholders sustainability highlights | |
| | | | | |
| | 100% owned Our ordinary shares are owned by our parent group, Banco Santander. Santander UK plc's preference shares are listed on the London Stock Exchange |
| £1bn Interim ordinary share dividends related to 2022 profit and special dividend |
| TO READ MORE, SEE THE FINANCIAL OVERVIEW g |
During 2022, our discussions with investors included these key topics:
–Impact of the changing macroeconomic environment, notably higher inflation and rising interest rates, the mortgage market
–Competition for deposits
–Asset quality
–Strength of our regulatory capital and liquidity
–Funding plans
–Net Interest Margin outlook
Sustainability is also an increasing area of focus for investors. In response, we have significantly increased our focus and disclosure in recent years.
Our Investor Relations team provides a link between investors and senior management, focusing on external messaging and communication. The Board receives updates from the Investor Relations team on the continuing engagement with investors.
| | | | | | | | | | | | | | |
| Annual Report 2022 | Santander UK Group Holdings plc 25 |
| | | | | | | | | | | | | | | | | | | | | | | | | | | | | | | | | | | | | | | | | |
| Strategic Report | Sustainability and Responsible Banking | Governance | Risk review | Financial review | Financial
statements | Shareholder
information |
| | | | | | | | | | | | | |
| | | | | | | | | | | | | |
| | | | | |
| Sustainability review continued |
| |
People
Our motivated workforce is committed to our purpose.
Culture
We are part of a global company, united by a common culture, The Santander Way. This encompasses our purpose to help people and businesses prosper, our aim, to be the best open financial services platform, acting responsibly and earning the trust of our people, customers, shareholders and communities, our Simple, Personal and Fair values, our risk culture, which stresses that risk management is everyone’s job, and our behaviours.
In 2022, we refreshed the behaviours which were first launched in 2015. Our new TEAMS framework – Think Customer, Embrace Change, Act Now, Move Together and Speak Up will help us speed up our transformation towards becoming a more Simple, Personal and Fair bank.
We use our monthly pulse survey, Your Say, to listen to our employees. Launched in December 2021, Your Say provides real-time insight into our employees' engagement and experience; highlighting areas of success and opportunities for improvement. At the end of 2022 our overall employee engagement score was 7.8, which is above external benchmarks1.
Inclusion and belonging
We aim to be a place where all of our people feel they belong and are supported to succeed. We’re committed to being a truly inclusive organisation, one that reflects the customers and communities we serve. This commitment is backed up by our Everyday Inclusion strategy which prioritises the themes of intersectionality, respect, balanced representation, leadership, advocacy, allyship, transparency and accountability.
Our eight People Networks play an important role in bringing lived experiences into our decision making and promoting allyship. The networks (which all have a Board and ExCo sponsor) cover gender, ethnicity, LGBTQ+, disability, families and carers, social mobility, mental wellbeing, and veterans and reservists. Our Embrace LGBTQ+ Network was awarded the Outstanding Network of the Year at the European Diversity Awards.
In 2022 we continued focusing on building diversity and inclusion in Santander UK through programmes which include reverse mentoring for our Executive Committee and our Women in Science, Technology, Engineering and Mathematics (STEM) programme. More details are available in our ESG supplement. We continued to work towards our Black Inclusion Plan commitment to tackle under-representation of Black talent in our senior roles.
Our first 40 participants graduated from our Black Talent Programme and the next cohort of 60 employees will join in early 2023. We voluntarily disclose our ethnicity pay gap, and a breakdown by identity, as we believe in the positive benefits of transparency. We are actively lobbying for mandatory ethnicity pay gap reporting.
We are a signatory to the Menopause Workplace Pledge. Our team of passionate Menopause Advocates, trained by experts, Henpicked, run awareness sessions and point our people and managers to support resources. We are proud to be the first major employer in the UK to partner with digital health app, Peppy, which has provided access to expert menopause support to over 700 of our people to date. This includes one-to-one text chats with a team of nurse practitioners, a webinar series, group chats and a suite of additional resources.
We led the way across financial and professional services companies to raise awareness of the importance of socio-economic diversity through our work with the Government's Socio-Economic Diversity Taskforce. This led to us becoming a founding partner of Progress Together in 2022, a financial services membership body aimed at levelling the playing field for social mobility. We also received the Lord Mayor’s Award for Advancing Socio-Economic Diversity in Business and a silver award for Progression Programme of the Year at the Social Mobility Awards.
Wellbeing
Wellbeing is essential to helping our employees thrive. Our comprehensive approach involves supporting mental, physical, social and financial wellbeing. Our internal Wellbeing Hub provides information on wellbeing topics and brings together all the support options we offer. The Hub has been accessed 160,000 times in two years.
| | | | | | | | | | | | | | | | | |
| People sustainability highlights | |
| | | | | |
| Inclusive environment within the top 10% benchmark(1) for our score to the question ‘A diverse workforce is a clear priority for Santander’ | | | More information on how we support our people can be found in our ESG supplement, including:
–Inclusion, belonging and wellbeing –Skills development –Women in STEM –Reverse mentoring circles –Working with our two recognised trade unions –Recognition and reward –Post-pandemic ways of working –Our priorities going forward |
| Engaged people Engagement score of 7.8 is above external benchmarks(1) | | |
| | |
| | |
| |
| | | | | |
| 10% of Santander UK Variable Pay is based on Sustainability and Responsible Banking metrics. In 2022, these metrics covered colleague engagement (5%) and people financially empowered (5%) | | Award recognition We’re proud of the recognition we receive for our work to create a sense of belonging for our people. This includes being a Times Top 50 Employer for Women, a top 75 Social Mobility Index employer, voted best for Mental Health and Wellbeing by Working Families |
| |
| |
|
| | | | | |
| TO READ MORE, SEE OUR ESG SUPPLEMENT g | |
| (1) Your Say's benchmark is the average score of all organisations using Your Say pulse surveys |
This year we relaunched our Positive About Mental Wellbeing training. The training will equip all of our 3,800 people managers with the tools to prioritise positive mental wellbeing every day, recognise when more support may be needed and help colleagues access support.
We also have a specific focus on financial wellbeing in response to the cost of living crisis. We have improved our financial support options and are raising colleague awareness on the support available including a dedicated helpline for all our people.
Fair pay and transparency
In 2022, we took action to relieve cost of living pressures on our people. This included an exceptional salary increase of 4% for 60% of our workforce. This covered 11,000 colleagues in lower pay bands and was in addition to our usual annual pay review. This was part of the annual review of our reward framework, which checks that all salary reviews and changes to reward policies do not have an adverse impact on particular employee groups.
We are transparent about pay and benefits and are proud to have been an accredited Real Living Wage employer since 2015. All salary ranges and pay progression arrangements are visible to all colleagues. We voluntarily publish our Ethnicity Pay Gap within our annual Everyday Inclusion and Pay Gap Report. We also voluntarily disclose our CEO pay ratio in the Remuneration Implementation Report within this Annual Report.
| | | | | | | | | | | | | | |
| Annual Report 2022 | Santander UK Group Holdings plc 26 |
| | | | | | | | | | | | | | | | | | | | | | | | | | | | | | | | | | | | | | | | | |
| Strategic Report | Sustainability and Responsible Banking | Governance | Risk review | Financial review | Financial
statements | Shareholder
information |
| | | | | | | | | | | | | |
| | | | | | | | | | | | | |
| | | | | |
| Sustainability review continued |
| |
Communities
We provide support to build better communities where customers and people can prosper.
Financial education
Financial education is one of the pillars of our Financial Inclusion strategy. We believe it is crucial to provide a solid financial education to all children and young people, ultimately ensuring financial education for all. This is why we have a goal to become a leader in financial education by 2025. More information on our approach to financial inclusion is provided in the better communities section of our ESG Supplement.
The importance of financial education in the UK has been highlighted by the 2021 Strategy for Financial Wellbeing developed by the Money and Pensions Service, an arms-length Government body. The strategy’s goal is to ensure an additional 2 million children and young people get a meaningful financial education by 2030, growing from 4.8 million to 6.8 million.
We have worked with experts who told us the best way to deliver financial education is to teach financial concepts to people when they are young. This helps them to make better decisions about their money and protect their finances later in life. As a result, we support financial education being compulsory in UK primary schools and for resources to be easily accessible for all teachers, parents and students across the UK. In 2022, we provided financial education to 1,292,724 young people.
Santander Foundation
In 2022 the Santander Foundation awarded £1.85m to 13 charities as part of its Financial and Digital Empowerment Fund. These new partners will receive grants ranging from £125,000 to £150,000 over the next three years to deliver services that will empower people with skills, support and confidence needed to improve digital and financial capabilities.
The Santander Foundation is currently providing funding and support to 34 charitable organisations across the UK. In 2022, the Financial and Digital Empowerment funded partners have supported 2,109 people to develop their digital and financial capabilities.
In partnership with Santander UK, the Foundation continues to support a range of charities through the matched donations programme. In 2022, 1,105 employees were able to increase their fundraising contributions by a further £625,579.
Santander Universities
In 2022 we launched a new scholarship, skills and entrepreneurship programme designed to fuel the success of new generations of university students from underrepresented groups. Through the programme we aim to remove barriers to entry into higher education for these groups, level the currently uneven playing field and build essential skills for the future to ensure employment outcomes match peers from outside these groups. To achieve these aims, we will continue working with our established university partners to increase opportunities for underrepresented students, whether through our scholarships, living wage internships that help students focus on their future, or specialist entrepreneur centres to help turn students’ passion projects into businesses. In 2022 we provided more than 8,000 scholarships and awards. At the heart of the initiative is a £1m scholarship scheme that will help 100 students from under-represented groups with annual grants of £10,000 over three years at our 75 university partners.
We also know that higher education isn’t for everyone. So we are investing in ideas that provide a pathway for all, no matter where they are in the UK. One example is our global entrepreneurship platform, which brings together people with ideas, skilled individuals and eager interns alike. We are also working on opportunities to share more free and accessible learning programmes with people from all backgrounds, giving everyone the opportunity to learn and thrive.
When our new headquarters, Unity Place in Milton Keynes, opens its doors in 2023, we will welcome MK:U, a new-model, digital and technical higher education provider, to partner with us. We look forward to working together to create courses and qualifications that will help develop the skills of the future.
| | | | | | | | | | | | | | | | | |
| Communities sustainability highlights | |
| | | | | |
| 2,141,163 people have been financially empowered since 2019. We have been able to reach this many people by working with partners such as Twinkl and Young Enterprise | | More information on our approach to building better communities can be found in our ESG supplement, including: –Financial inclusion and our strategy –Santander Foundation: Case study |
| | | | | |
| | | | | |
| £1.85m Santander Foundation's Financial and Digital Empowerment Fund awarded £1.85m to 13 charities supporting digital and financial inclusion to disadvantaged communities | | | 20,000+ people reached through our people helped initiatives. This includes a variety of activities, from colleague community volunteering initiatives to supporting charities through matched donations |
| | | | | |
| | | | | |
| £455,000+ has been raised for Macmillan Cancer Support, from colleagues and matched donations from the Santander Foundation | | | £8m In 2022, we worked with 75 university partners making donations of £8m and benefiting 8,130 students and graduates |
| | | | | |
| TO READ MORE, SEE OUR ESG SUPPLEMENT g |
Macmillan Cancer Support 2022-2024
There are currently three million people living with cancer in the UK and one in two of us will receive a cancer diagnosis in our lifetimes. In June 2022, we launched a new strategic charitable partnership with Macmillan Cancer Support. The partnership aims to improve financial inclusion and support to help people to cope with financial challenges they face after receiving a cancer diagnosis. Since the launch, we have been working with Macmillan to review our processes, services and customer feedback to identify areas for improvement. We are developing a referral programme to connect our customers with Macmillan’s support services. In addition to these strategic workstreams, we have raised over £455,000 including matched donations from the Santander Foundation.
Ukraine support
Since the conflict in Ukraine in February 2022, we have been working to support the humanitarian relief effort. Santander UK (including customers, colleagues and the Santander UK Foundation) supported a Banco Santander initiative to aid Ukraine with Santander UK contributing over £455,000 to the Red Cross and UNHCR. In addition, our colleagues can still benefit from 70 hours of matched volunteering time, which was originally doubled from 35 hours during Covid-19, but has been kept open due to the new crisis.
Ukrainian refugees arriving in the UK can open a bank account with us so they can access the banking services they need. So far over 2,000 new accounts from Ukrainian refugees have been opened. We also provide customers with the ability to make international payments to Ukraine.
| | | | | | | | | | | | | | |
| Annual Report 2022 | Santander UK Group Holdings plc 27 |
| | | | | | | | | | | | | | | | | | | | | | | | | | | | | | | | | | | | | | | | | |
| Strategic Report | Sustainability and Responsible Banking | Governance | Risk review | Financial review | Financial
statements | Shareholder
information |
| | | | | | | | | | | | | |
| | | | | | | | | | | | | |
| | | | | |
| Sustainability review continued |
| |
Climate and ethics
We apply high environmental and ethical standards to our investments and operations.
Responsible lending
As part of the Banco Santander group, we comply with the Equator Principles to factor social, ethical, and environmental impacts into our risk analysis and decision making for qualifying financial transactions.
Our Reputational Risk policy and Environmental, Social and Climate Change (ESCC) policy covers oil and gas, power generation and transmission, mining and metals, and soft commodities. It also covers projects or activities within certain sectors located in areas classified as Ramsar Sites, World Heritage Sites or Category I, II, III or IV sites defined by the International Union for Conservation of Nature.
Our ESCC policy also prohibits project-related financing for new coal-fired power plant (CFPP) worldwide and we will only work with new clients with CFPPs to provide specific financing for renewable energy projects. In these exceptions, we expect the client to have a credible plan with verifiable targets that show the client will reduce its revenues from coal-powered generation to 10% or below by 2030. Currently, we have no exposure to CFPPs.
At 31 December 2022, Santander UK's exposure to fossil fuel sectors was only 0.4% of our total non-financial corporate lending. In line with Banco Santander's 2050 net zero commitment, by 2030 we will eliminate all exposure to thermal coal mining and not provide financial services to power generation clients with more than 10% of revenue from thermal coal. For more on Banco Santander's commitment and approach to carbon-intensive sectors, please see Banco Santander's Climate Finance Report 2021-2022.
We review all relationships and transactions with identified ESCC or reputational risks, including human rights, to ensure they are within our risk appetite. Key decisions can be escalated to the Reputational Risk Forum and, if needed, the Board.
Green finance
Banco Santander's Sustainable Finance Classification System (SFCS) defines what investments can be considered green or social financing. We have applied the SFCS to our lending and identified the following as green financing: renewable energy and other green energy financing; mortgages on properties with A- or B-rated energy performance certificates (EPC); and, financing for electric vehicles, hybrid and PHEV with emissions below 50g CO2/km.
The SFCS uses harmonised definitions that provide consistency in tracking, reporting and managing sustainable finance across Banco Santander group. For more on our green finance ambition and performance, see TCFD in the Sustainability and Responsible Banking section.
Economic crime
Our Anti-Financial Crime strategy seeks to deter, detect and disrupt financial crime. All colleagues receive mandatory economic crime training that highlights issues and risks across all types of financial crime. We continue to enhance our award-winning Anti-Financial Crime Academy (AFCA) to deliver targeted, role-specific training. This includes specialist Academies for operational capabilities and business lines performing key anti-financial crime controls, as well as formal training and competence measurement to ensure employees show the required anti-financial crime skills. We have completed our annual Learning Needs Analysis which provides a key input for determining our 2023 anti-financial crime training plan and strategy. By the end of 2022, 60,474
AFCA modules covering all AFC disciplines have been completed by 16,078 individuals across Santander UK.
To enhance recognition for those taking AFCA training, we are working with a leading industry body, the International Compliance Association (ICA), to obtain accreditation for AFCA curriculum modules. This will provide an AFCA-ICA certification to employees passing AFCA modules.
We maintain strong processes for anti-bribery and corruption and facilitation of tax evasion, in particular risk management measures for relationships with third parties. In 2022, we reaffirmed our senior executive commitment against facilitation of tax evasion by issuing our pledge to all colleagues. We continue to work with external partners to understand and develop best practice integrity standards and we remain a Transparency International UK Business Integrity Forum Gold Member.
Economic crime also includes protecting our customers from fraud. Further information can be found in our ESG Supplement.
| | | | | | | | | | | | | | | | | |
| Climate and ethics sustainability highlights | |
| | | | | |
| More information on our approach to the environment and upholding high ethical standards can be found in our ESG supplement, including: –Tackling climate change –Climate Change strategy and governance –Financing the green transition –Investment in ESG assets –Sustainable Procurement –Enhancing climate change awareness –External collaborations and engagement –Focus on financial crime –Response to Anti-Money Laundering FCA finding –Protecting our customers from fraud –Ethical supply chain –Humanitarian focus –Cyber risk management –Data privacy and cyber security
| | | 5,761 tCO2e in 2022, we emitted 5,761 tCO2e of greenhouse gas emissions, a 9% decrease on 2021. This equates to 0.31 tCO2e per employee |
| | |
| | | £6.5bn In 2022, we raised and facilitated £6.5bn of green finance of projects and activities classified as green according to SFCS. In 2021, we provided £3.9bn of green finance. |
| | |
| | | TO READ MORE, SEE OUR TCFD SECTION AND ESG SUPPLEMENTg |
Streamlined Energy and Carbon Reporting In 2022, we used 103,156,234 kWh of energy, a 14% reduction against 2021 (119,562,413 kWh). Greenhouse gas emissions (market-based) were 5,761 tCO2e, 9% down from 2021 (6,321 tCO2e). Emissions per employee equate to 0.31 tCO2e, a decrease from 0.35 tCO2e in 2022. A rise in Scope 2 market-based emissions is mostly attributed to Santander Financial Services plc (SFS), which we included for this year's reporting. The basis of reporting of SECR information can be found in the TCFD section under Environmental Performance.
| | | | | | | | | | | |
| 2022 | 2021 | 2020 |
Scope 1 tCO2e | 4,512 | | 6,074 | | 5,937 | |
Scope 2 tCO2e - Location-based | 15,624 | | 18,860 | | 22,014 | |
Scope 2 tCO2e - Market-based | 53 | | | — | |
Scope 3 tCO2e - business travel only | 1,196 | | 247 | | 515 | |
tCO2e/FTE | 0.31 | | 0.35 | | 0.31 | |
Note: 2021 and 2020 exclude Santander Financial Services (SFS). For 2022, SFS accounts to less than 2% of total emissions.
With the easing of Covid-19 travel restrictions, business travel increased in 2022. This resulted in higher Scope 3 emissions compared to 2021. The total distance travelled and related emissions remain significantly below pre-pandemic levels. Our total emissions fell in 2022 due to significant reductions in our gas and electricity consumption. This was largely due to the rationalisation of our office network.
We continue to actively manage energy performance across all sites, identifying opportunities to enhance efficiency and optimise energy use. Ongoing energy saving refurbishments include new LED lighting, HVAC upgrades and replacement of fan coil units. Go Green, our environmental engagement initiative for employees gives them practical energy saving tips which help to reduce our energy consumption.
| | | | | | | | | | | | | | |
| Annual Report 2022 | Santander UK Group Holdings plc 28 |
| | | | | | | | | | | | | | | | | | | | | | | | | | | | | | | | | | | | | | | | | |
| Strategic Report | Sustainability and Responsible Banking | Governance | Risk review | Financial review | Financial
statements | Shareholder
information |
| | | | | | | | | | | | | |
| | | | | | | | | | | | | |
The Boards of the Company and Santander UK plc (the RFB and the Boards) have identified the below as our key stakeholder groups on the basis of their importance in ensuring the continuing success of Santander UK.
Balancing the interests of these five stakeholder groups alongside the interests of the Santander UK group is key to ensuring that we operate as a sustainable and responsible business, in line with our strategy. This will help to ensure the long-term success of both companies.
To ensure that the interests of our stakeholders can be fully assessed and considered in our decision making, the Board and the RFB Board delegate a number of matters to their Committees.
The main governance flows for these stakeholders’ interests are set out below, together with details of the key issues relating to each stakeholder that we took into consideration in 2022.
To support the Boards and their Committees in their considerations, in 2022 the Corporate Governance team provided training on how to write good board papers to circa 300 senior members of management. This training included a specific focus on the directors' duties and how management's preparation of their papers plays a key role in ensuring that the Directors can discharge their responsibilities in a fully informed manner.
In addition, the proforma paper, which management is required to use for their Board papers, now includes a section on stakeholder considerations.
For more on how the Directors discharged their responsibilities in 2022, including specific examples of stakeholder considerations and engagement, see the Governance section, including the Board Committee Chair reports, particularly the Board Responsible Banking Committee (RBC) Chair's Report.
| | | | | | | | | | | | | | | | | | | | | | | | | | | | | | | | | | | | | | |
| | | | | | | | | | | | |
| Stakeholders | |
| | | | | | | | | |
| | | | | | |
| Customers | Shareholders | People | Communities | Regulators | |
| –Customer outcomes –Fraud protection –Vulnerable customers –Cost of living crisis support –Supporting customers’ sustainability ambitions –New Consumer Duty | –Financial performance –Return on equity –Alignment of strategy with our parent company –Meeting sustainability expectations | –Culture, conduct and behaviours –Cost of living crisis –Return to the office –Remuneration –Employee value proposition –Move to Milton Keynes | –Financial inclusion and empowerment –Community engagement and support –Universities programme | –Meeting regulatory rules and expectations –Proactively and constructively engaging with the regulators –Responding to regulatory requests | |
| | | | | | | | | |
| | | | | | | | | | | | |
| | Board Responsible Banking Committee | | | | | |
| | | | | | | | | |
| – | The RBC's purpose is to assist the Board achieving its aspiration to be a responsible bank, with particular reference to its key stakeholders.
During 2022, RBC spent the majority of its time considering the needs of its stakeholders, how they are being met and how to mitigate risks to their interests. Examples of these considerations can be found in the RBC Chairs’ report in the Governance section of this Annual Report. | | | | – | |
| | | | | | | | | | | | |
| | The Boards | | | | | |
| | | | | | | | | |
| | Promote the success of the Companies in the long term for the benefit of their shareholders, taking into account the likely impact of their decisions in the long-term, as well as the interests of our stakeholders. | | | | | |
| | | | | |
| | | | | | | | | | | | |
| | | | | | | | | | | | | | |
| Annual Report 2022 | Santander UK Group Holdings plc 29 |
| | | | | | | | | | | | | | | | | | | | | | | | | | | | | | | | | | | | | | | | | |
| Strategic Report | Sustainability and Responsible Banking | Governance | Risk review | Financial review | Financial
statements | Shareholder
information |
| | | | | | | | | | | | | |
| | | | | | | | | | | | | |
Page intentionally blank
| | | | | | | | | | | | | | |
| Annual Report 2022 | Santander UK Group Holdings plc 30 |
| | | | | | | | | | | | | | | | | | | | | | | | | | | | | | | | | | | | | | | | | |
| Strategic Report | Sustainability and Responsible Banking | Governance | Risk review | Financial review | Financial
statements | Shareholder
information |
| | | | | | | | | | | | | |
| | | | | | | | | | | | | |
| | | | | |
| Sustainability and Responsible Banking |
| |
| |
| | | | | | | | | | | |
| | | |
| | Contents | |
| | Introduction | 32 |
| | Sustainability and Responsible Banking strategy | 33 |
| | Materiality | 34 |
| | Governance | 35 |
| | Medium-term scorecard and performance highlights | 36 |
| | Taskforce on Climate-related Financial Disclosures (TCFD) | 38 |
| | | |
| | | |
| | | |
| | | |
| | | |
| | | |
| | | |
| | | |
| | | |
| | | |
| | | |
| | | |
| | | |
| | | |
| | | |
| | | |
| | | |
| | | |
| | | |
| | | |
| | | |
| | | |
| | | |
| | | |
| | | | | | | | | | | | | | |
| Annual Report 2022 | Santander UK Group Holdings plc 31 |
| | | | | | | | | | | | | | | | | | | | | | | | | | | | | | | | | | | | | | | | | |
| Strategic Report | Sustainability and Responsible Banking | Governance | Risk review | Financial review | Financial
statements | Shareholder
information |
| | | | | | | | | | | | | |
| | | | | | | | | | | | | |
| | | | | |
| Sustainability and Responsible Banking continued |
| |
| |
Introduction
Sustainability and Responsible Banking (SRB)
SRB is a strategic priority for Santander UK and our parent company, Banco Santander. Our goal is to be responsible and ethical across all our activities. By delivering on our purpose to help people and businesses prosper, we will grow as a business while helping to address society's key challenges. Our Simple, Personal and Fair values need to be reflected in everything we do. From the everyday decisions we take to our long-term plans and goals.
In recent years, the attention on Environmental Social and Governance (ESG) matters has increased. In the finance sector, this focus is reflected in the growth of signatories to the UN Principles for Responsible Banking (UNPRB). Banco Santander is a founding signatory to the UNPRB which are designed to integrate ESG considerations into banking. The UNPRB now has more than 300 signatories with US$ 89.5 trillion of assets under management, a growth of 127% since 2019.
This trend is also reflected in the growing number of existing and proposed regulatory requirements on ESG topics. These include the Taskforce on Climate-related Financial Disclosures (TCFD); International Sustainability Standards Board (ISSB); EU Corporate Sustainability Reporting Directive (CSRD); and, US SEC Climate Rules. We are also seeing growing engagement with stakeholders on ESG and sustainability. Throughout 2022, we engaged with debt investors and rating agencies solely on ESG topics.
About our SRB Reporting
This year we have created a new SRB section in our Annual Report. This responds to increasing demands by stakeholders for more information on our ESG strategy and performance alongside. In this section, we give an overview of our approach to SRB. This includes our strategy, material issues, sustainability governance, progress against our medium-term targets and a selection of highlights.
This new section also includes mandatory disclosures such as TCFD. We will continue to update our ESG disclosures in line with future regulatory guidance and market practice. There is information in our 2022 ESG Supplement available on our website (which does not form part of this Annual Report). Our ESG Supplement also includes limited assurance on a sample of our ESG metrics.
Our Sustainability Microsite also gives more information on all our ESG-related reports and disclosures. Banco Santander lists all its ESG reports and disclosures on its website.

| | | | | | | | | | | | | | |
| Annual Report 2022 | Santander UK Group Holdings plc 32 |
| | | | | | | | | | | | | | | | | | | | | | | | | | | | | | | | | | | | | | | | | |
| Strategic Report | Sustainability and Responsible Banking | Governance | Risk review | Financial review | Financial
statements | Shareholder
information |
| | | | | | | | | | | | | |
| | | | | | | | | | | | | |
| | | | | |
| Sustainability and Responsible Banking continued |
| |
| |
Sustainability and Responsible Banking Strategy
Our approach
With a growing focus on sustainability over recent years, the need for businesses to be part of the solution to pressing social and environmental issues has become increasingly clear. We recognise that financial institutions have an important role to play. This includes addressing sector-specific challenges such as financial inclusion and financial crime. It also includes broader systemic issues such as climate change.
Our SRB strategy sets our ambition to become a sustainable and responsible bank. One which addresses these challenges and supports our vision of helping people and businesses prosper. It responds to our most important, or material, sustainability issues. Our SRB strategy consists of three pillars and a solid foundation.
Pillar 1: Thriving workplace
Our aim is to be a place where all of our people feel they belong and are supported to succeed. We want to provide a workplace with a responsible culture where anyone and everyone can grow while being themselves. Employee wellbeing is central to our approach.
This commitment is backed up by our Everyday Inclusion strategy which prioritises the themes of intersectionality, respect, balanced representation, leadership, advocacy, allyship, transparency and accountability.
Pillar 2: Better communities
Financial Inclusion is an increasingly important topic. It is therefore a key part of our approach to building better communities. Our Financial Inclusion strategy is designed to help people improve their financial skills, gain access to financial services and develop financial resilience. Our financial inclusion working group coordinates our approach and enhances business-wide collaboration.
We also focus on generating positive impact in our communities. For example, working with our charity partner Macmillan Cancer Support; supporting vulnerable customers; empowering students with our Santander education programme; and working with the Santander Foundation, whilst focusing on providing good outcomes for our customers.
Pillar 3: Healthy environment
Climate change is one of the major challenges facing society today. At Santander UK we recognise this. Our goal is to support the UK in tackling climate change by supporting our customers, colleagues and communities transition to a low-carbon, climate-resilient economy. We are fully committed to the Banco Santander’s ambition to achieve net zero carbon emissions by 2050, in line with the Paris Climate Agreement.
Foundation: Being responsible in everything we do
We must get the basics right before we can excel in the first three pillars. High standards of ethics and integrity are the foundation to prosperous businesses and society. They are also a clear priority in how customers choose their bank.
We are committed to being a fair, transparent and responsible bank. At the heart of this is fair treatment of our customers. We deal with any form of fraud against our customers or other economic crime as a priority.
A key focus is raising customer awareness on financial crime as a priority. We are committed to upholding the highest ethical standards, ensuring a responsible corporate culture and promoting human rights.
For more information on our SRB strategy see the Strategic Report and our ESG Supplement.
| | | | | | | | | | | | | | | | | | | | | | | | | | | | | | | | | | | | | | | | | | | | | | | | | | | | | | | | | | | | | | | | | |
| Our strategic ambition: to become a sustainable and responsible bank |
| | | | | | | | | | | | | | | |
| | Thriving workplace Creating a culture of inclusivity and belonging | | | Better communities Helping customers and communities prosper | | | Healthy environment Fighting climate change and supporting the green economy | |
| Key issues |
| –Diversity, inclusion and belonging –Employee wellbeing and talent –Organisational culture and governance
Additional priorities: –Social mobility |
| –Financial inclusion and empowerment –Community engagement and support –Sustainable finance –Inclusive innovation and digitalisation –Privacy, data protection and cyber security
Additional priorities: –Santander education –Santander Foundation |
| –Climate risk management –Portfolio alignment to net zero –Own operational footprint
Additional priorities: –Ensuring a just transition |
| Our solid foundation |
| | | | | | | | | | | | | | | | | | | | | |
| | Being responsible, in everything we do We will aim to be responsible in everything we do with ethics and integrity being a solid foundation of our strategy, enabling businesses and society to prosper. | |
| Key issues | Additional priorities | |
| | | | | | | | | | | | | | | | | | | | | |
| –Ethics and compliance –Human and labour rights | –Responsible supply chain and procurement | –Responsible banking practices | –Financial crime | | |
| Delivering on our strategic priorities and creating value for all of our stakeholders |
| | | | | | | | | | | | | | |
| Annual Report 2022 | Santander UK Group Holdings plc 33 |
| | | | | | | | | | | | | | | | | | | | | | | | | | | | | | | | | | | | | | | | | |
| Strategic Report | Sustainability and Responsible Banking | Governance | Risk review | Financial review | Financial
statements | Shareholder
information |
| | | | | | | | | | | | | |
| | | | | | | | | | | | | |
| | | | | |
| Sustainability and Responsible Banking continued |
| |
| |
Materiality
Identifying our most material issues
Our SRB strategy focuses on our material issues. These are the most relevant ESG issues for Santander UK. We conducted a detailed materiality assessment in 2020. It identified the sustainability topics, or material issues, that are most important to our business and our stakeholders. In 2022 we refreshed our materiality matrix in line with technical guidance issued by Banco Santander. This defines a coordinated global approach, methodology and timelines for future materiality assessments and updates. Our next full materiality assessment is planned for 2024 and we will complete another refresh in 2023. Our material topics remain broadly the same this year. They continue to form the basis of our SRB strategy and our reporting.
Process
Our materiality process uses an evidence-based analysis. In our last full assessment we used a big data approach, powered by Datamaran. This analysed millions of data points covering regulatory frameworks, social media, news, and financial and sustainability reports of industry peers. The findings were overlaid with consumer insights and inputs from colleague surveys including our Executive Committee.
Our assessment also included a review of sustainability megatrends to identify emerging issues. We considered the principle of double materiality by analysing both sustainability and financial reports of peers. In total 100 peers were benchmarked, including non-traditional financial services companies and financial sector disruptors. Specialist consultancy Environmental Resources Management Ltd conducted the assessment in line with best practice.
For the 2022 refresh, we considered many different inputs including:
–Banco Santander material issues
–Our business strategy and SRB strategy documentation
–Key external documents including ratings, standards, regulations and mega trends relevant to our business and financial services
–reviewing key competitors' material issues.
We used the results of the materiality assessment to help develop our strategy. The materiality assessment and resulting matrix of material topics have been approved by the Board Responsible Banking Committee (RBC).
Evolving our strategy further
In a fast changing world, we review our SRB strategy regularly to make sure it is fit for purpose. We reviewed our strategic priorities in 2022 to ensure they remain relevant to the changing context we face. Our analysis confirmed that our SRB strategy is still relevant.
Maximising our positive impact
We strive for excellence in all areas of our SRB strategy. In particular, we want to amplify our impact in areas where we can make the biggest difference. In late 2021, we identified how we can maximise our positive impact as a business. After engagement with our Executive Committee and RBC, we identified three focus areas where we have concentrated our efforts in 2022 to build positive impact and differentiate our business. These are:
–Education, including financial education and knowledge
–Helping to green UK homes and businesses, and
–Social mobility.
We have also developed medium-term targets which are set out in the medium-term scorecard and performance highlights section below.

 Changes since 2021
  Environmental material topics
  Social material topics
  Governance material topics
 | | | | | | | | | | | | | | |
| Annual Report 2022 | Santander UK Group Holdings plc 34 |
| | | | | | | | | | | | | | | | | | | | | | | | | | | | | | | | | | | | | | | | | |
| Strategic Report | Sustainability and Responsible Banking | Governance | Risk review | Financial review | Financial
statements | Shareholder
information |
| | | | | | | | | | | | | |
| | | | | | | | | | | | | |
| | | | | |
| Sustainability and Responsible Banking continued |
| |
| |
Governance
Improving our ESG governance
We continue to improve how we govern sustainability. In 2022, we enhanced how our Executive team maintains oversight of our SRB objectives. Our Senior Management Committee now reviews ESG monthly. There is also more focus on sustainability updates at Board Responsible Banking Committee meetings.
SRB is owned and executed by each business division with the support of the SRB team. The SRB team acts as a centre of expertise providing strategic direction and guidance for Sustainability Business Partners (SBPs). The SBPs help deliver our sustainability agenda across different business divisions, as shown below.
We also integrate sustainability into our day-to-day business. It is included as an assessment element in our product and initiatives approval processes for both retail and corporate businesses. This ensures we consider how new products or processes might have an impact on the environment, our customers or our communities.
To enhance sustainability knowledge and skills, we provide specialist training for our SBPs and colleagues in key functions. This includes courses from the Chartered Banker Institute, and the Cambridge Institute for Sustainability Leadership.
In 2022, we gave over 2,000 colleagues access to Sustainability Unlocked. This enabled them to deep dive into different subjects within the Sustainability agenda.
| | | | | | | | | | | | | | | | | | | | | | | | | | | | | | | | | | | |
| Our Governance for Sustainability and Responsible Banking |
| | | | | | | | | | | |
| | | | Board Responsible Banking Committee | | | | |
| | | | Assists the Board in setting vision, level of ambition, priorities and pace | | | | |
| | | | | | | | | | | |
| | | | Senior Management Committee | | | | |
| | | | Provides management level oversight, steer and approval on performance | | | | |
| | | | | | | | | | | |
| | | | | | | | | | | |
| Partners | | Sustainability and
Responsibility Banking Team | | Third parties | |
| –Share subject matter expertise –Support on execution and operations –Provide platforms for external communications and brand positioning | | –Overall responsibility for the strategy, defining activities and programmes, and delivering on centrally driven activities –Advises the business as subject-matter experts | | –Provide specialist expertise and resource | |
| | | | | | | | | | | |
| | | | Sustainability Business Partners | | | | |
| | | | Act as centre of expertise and contact for individual business areas and deliver the sustainability agenda across the business | | | | |
| | | | | | | | | | | |
| | | | Business Units | | | | |
| | | | –Execute programmes –Provide input to strategy | | | | |
| | | | | | | | | | | |
| | | | | | | | | | | | | | |
| Annual Report 2022 | Santander UK Group Holdings plc 35 |
| | | | | | | | | | | | | | | | | | | | | | | | | | | | | | | | | | | | | | | | | |
| Strategic Report | Sustainability and Responsible Banking | Governance | Risk review | Financial review | Financial
statements | Shareholder
information |
| | | | | | | | | | | | | |
| | | | | | | | | | | | | |
| | | | | |
| Sustainability and Responsible Banking continued |
| |
| |
Medium-term scorecard and performance highlights
In late 2021, we established a medium-term scorecard. This consists of targets for 2022-2025, and in some cases 2030. These will measure our performance and progress in key areas of our SRB strategy. We set the targets with two main considerations in mind: targets that will strengthen our contribution to existing Banco Santander group public commitments, and targets that will help us to meet our sustainability priorities. We will conduct a review of metrics and targets in 2023 to ensure they continue to be fit for purpose in meeting our sustainability priorities.
| | |
Diversity, inclusion and belonging
50% (+/-10%) senior female employees by 2025 We maintained an upward trajectory in our senior female population in 2022. This is a long-term strategic commitment for us. We will continue to work hard to increase diversity and representation at senior employee levels over the medium term. |
33.2% (2021: 31.9%) |
| | |
Diversity, inclusion and belonging
14% (+/-2%) senior Asian, Black, and other Minority Ethnic employees by 2025 Senior Asian, Black and other Minority Ethnic employee representation increased in 2022. We continue to work with our culture team to improve diversity and inclusion. This includes encouraging further employee disclosure across our diversity metrics to ensure that our data is accurate and up to date. |
11.1% (2021: 9.8%) |
| | |
Diversity, inclusion and belonging
40-60% of women on the Board by 2030 Our female representation on the Board did not change in 2022. We are not anticipating any large changes in representation on our Board in the near future. |
33% (2021: 33%) |
| | |
Organisational culture and governance
Top 10 company to work for by 2025 We continue to participate in the Great Place to Work rankings. We aim to achieve a top ten ranking over the medium term. Although our 2022 placing dropped from 2021, our continuous listening tool Your Say has improved visibility of our key focus areas, which we continue to work on to meet our target.1 |
30th (2021: 16th) |
| | |
Social mobility
35% of senior employees from a lower socio-economic background by 2030 We continue to encourage our senior leaders to disclose their socio-economic background. We continue to integrate social mobility into our SRB agenda and have assigned a new senior sponsor to help drive our agenda forward.2 |
29% (2021: 29%) |
| | |
|
ESG Supplement TO READ MORE VISIT SANTANDERSUSTAINABILITY.CO.UK g |
1 We are also recognised as a Top Employer by the Top Employers Institute. We are accredited by Great Place to Work as a Best Super Large Organisation (Rank 30), Best Workplace for Women and Best Workplace for Wellbeing
2 We are also developing new ways to create momentum within our internal Social Mobility network, a network of motivated colleagues who are working to deliver change for young adults within the community and our own workforce The 2022 result is the same as 2021 as the survey is due to be completed again 2023.
| | | | | | | | | | | | | | |
| Annual Report 2022 | Santander UK Group Holdings plc 36 |
| | | | | | | | | | | | | | | | | | | | | | | | | | | | | | | | | | | | | | | | | |
| Strategic Report | Sustainability and Responsible Banking | Governance | Risk review | Financial review | Financial
statements | Shareholder
information |
| | | | | | | | | | | | | |
| | | | | | | | | | | | | |
| | | | | |
| Sustainability and Responsible Banking continued |
| |
| |
| | |
Financial inclusion
3 million people financially empowered by 2025 (cumulative since 2019) We have outperformed our expectations this year in our work to improve financial education and financial resilience. We have empowered 2,141,163 people since 2019. We continue to support and build financial resilience across the UK with our partners and our internal financial support centre of excellence. |
2.1 million1 (2021: 750,0001) |
| | |
Financial inclusion
2.2 million children and young people given a meaningful financial education by 2025 Our work with our partner Twinkl was a huge success in 2022. Together we reached more than one million young people with financial education resources. These are distributed virtually and can be accessed by parents and school teachers. Our work with Young Enterprise was also successful reaching over 105,000 school children. |
1.7 million1 (2021: 500,0001) |
For more on:
–Diversity, inclusion and belonging, organisational culture and governance & social mobility, see the People section of the Strategic Report.
–Financial inclusion, see the Customers section of the Strategic Report.
–Supporting customers' transition to a low carbon economy, see the TCFD Metrics and Targets section.
1 Cumulative since 2019
2 Banco Santander's Sustainable Finance Classification System (SFCS) defines what investments can be considered green or social financing. We have applied the SFCS to our lending and identified the following as green financing: renewable energy and other green energy financing; mortgages on properties with A- or B rated EPC; and financing for electric vehicles, hybrid and PHEV with emissions below 50g CO2/km.
3 To measure communication, we measure unique visits to the Greener Homes Hub and emails that have been opened by customers with EPC ratings of D or below that includes advice on making energy efficiency improvements.
| | |
Supporting customers to transition to a low carbon economy
£20bn of green finance raised and facilitated by 2025 In 2022, we performed strongly in our distribution of green finance. We adopted Banco Santander's Sustainable Finance Classification System2. This provides a uniform and robust way to identify green investments and loans in our business. Our mortgage lending performed strongly in 2022. 2023 may be a more challenging economic environment for mortgages. |
£6.5bn (2021: £3.9bn) |
| | |
Supporting customers to transition to a low carbon economy
1.3 million customers with properties with an EPC rating of D or below communicated with to improve their homes' efficiency by 2025 In 2022, we launched our Green Homes Hub. It helps consumers learn more on their homes' EPC ratings and ways to improve their energy efficiency. We also continue to offer customers a free EnergyFact Report, provided by our partner Countrywide. This gives an outlook on potential energy efficiency retrofitting improvements.3 |
0.8 million (2021: 4,000) |
| | |
Supporting customers to transition to a low carbon economy
180,000 customers supported to become greener with products and services by 2025 We performed strongly in offering mortgages for energy efficient properties, as well as lending for businesses. We continue to provide consumer finance funding with loans for electric and hybrid vehicles and will look to support more customers as they navigate the challenging economic climate. |
32,000 (2021: N/A - Data collection began in 2022) |
| | | | | | | | | | | | | | |
| Annual Report 2022 | Santander UK Group Holdings plc 37 |
| | | | | | | | | | | | | | | | | | | | | | | | | | | | | | | | | | | | | | | | | |
| Strategic Report | Sustainability and Responsible Banking | Governance | Risk review | Financial review | Financial
statements | Shareholder
information |
| | | | | | | | | | | | | |
| | | | | | | | | | | | | |
| | | | | |
| Taskforce on climate-related financial disclosures (TCFD) |
| |
| |
Introduction
Climate change and the banking sector’s response is a constantly evolving topic. This influences how we respond to climate-related risk in our business and we continually seek to improve the way we manage and report on climate change.
This is the third year we have published our response to the TCFD recommendations. We have expanded our disclosure to match growing expectations from our stakeholders for transparent reporting on climate-related risks and opportunities.
We recognise that climate change is one of the biggest challenges facing society. We are committed to the objectives of the Paris Agreement on climate change. This includes the transition to a climate-resilient, net-zero economy.
In 2021, Banco Santander committed to achieve net zero carbon emissions by 2050. This target includes emissions from its own operations and all client emissions that result from our lending, advisory or investment services. In the UK, we have adopted this ambition as part of our SRB strategy.
This report shows how we manage climate risks, opportunities and considerations within our processes and policies.
We follow the four pillars of the TCFD recommendations:
–Governance
–Strategy
–Risk Management, and
–Metrics and Targets.
To demonstrate how we are achieving this, we also report on how we are financing the green transition and our collaboration with stakeholders.
More information can be found in our ESG Supplement, which does not form part of this Annual Report.
Summary of our response to the TCFD recommendations
| | | | | | | | |
| TCFD pillar and disclosure requirements | Examples of our approach | page |
| Governance | | |
| a) Describe the Board’s oversight of climate-related risks and opportunities | Santander UK climate change governance framework
Board Responsible Banking Committee (RBC) and other Board-level committees (Board Audit Committee, Board Risk Committee)
2022 Board-level climate-related activities | 40-41 |
| b) Describe management’s role in assessing and managing climate-related risks and opportunities | Santander UK climate change governance framework
Senior Management Committee (SMC) and Executive Risk Control Committee (ERCC)
2022 senior management climate-related activities |
| Strategy | | |
| a) Describe the climate-related risks and opportunities the organisation has identified over the short, medium, and long term | Three pillar approach of Santander UK’s Climate Change strategy
Evolving risk appetite and business strategy informed by scenario analysis and stress tests
Santander UK medium-term scorecard commitments | 42-46, 47-48, 53 |
|
| b) Describe the impact of climate-related risks and opportunities on the organisation’s businesses, strategy, and financial planning | Net Zero Banking Alliance (NZBA) commitment to decarbonise the UK’s material sectors
Climate Internal Scenario Analysis informing strategy and planning | 44-46, 52 |
|
|
| c) Describe the resilience of the organisation’s strategy, taking into consideration different climate-relate scenarios, including a 2°C or lower scenario | NZBA commitments to decarbonise the UK’s material sectors
Climate Internal Scenario Analysis (CISA) | 52, 54 |
| Risk Management | | |
| a) Describe the organisation’s processes for identifying and assessing climate-related risks | UK Climate Change Risk taxonomy
Climate risk operating model | 49 |
| b) Describe the organisation’s processes for managing climate-related risks | UK Climate Change Risk taxonomy
Climate risk operating model
Climate-related risk appetite
Roles and responsibilities for climate change | 49, 50 |
| c) Describe how processes for identifying, assessing, and managing climate-related risks are integrated into the organisation’s overall risk management | Climate risk integration in key risks
Climate Internal Scenario Analysis | 50, 52 |
| Metrics and Targets | | |
| a) Disclose the metrics used by the organisation to assess climate-related risks and opportunities in line with its strategy and risk management process | Santander UK medium-term scorecard climate change targets
Exposure to climate-related risk across sectors | 53-55 |
| b) Disclose Scope 1, Scope 2 and, if appropriate, Scope 3 greenhouse gas (GHG) emissions and related risks | Scope 1-3 GHG emission disclosures | 56 |
| c) Describe the targets used by the organisation to manage climate-related risks and opportunities and performance against targets | Santander UK medium-term scorecard climate change targets | 39, 47, 53 |
| | | | | | | | | | | | | | |
| Annual Report 2022 | Santander UK Group Holdings plc 38 |
| | | | | | | | | | | | | | | | | | | | | | | | | | | | | | | | | | | | | | | | | |
| Strategic Report | Sustainability and Responsible Banking | Governance | Risk review | Financial review | Financial
statements | Shareholder
information |
| | | | | | | | | | | | | |
| | | | | | | | | | | | | |
Our overarching climate ambition is to achieve net zero by 2050
| | | | | | | | | | | |
| Our climate change targets for 2025 | Our progress to date
(2021-2022) |
| | | |
| Green finance raised and facilitated | £20bn | £10.5bn
|
| Customers with properties that have an EPC rating of D or below communicated with to improve their homes' efficiency | 1.3 million | 0.8 million |
| Customers supported to become greener
with products and services | 180,000 | >32,000 |
Status of our response to the TCFD recommendations
The FCA's Listing Rules require UK equity-listed companies to provide a statement of consistency with the TCFD framework. This requirement does not apply to Santander UK. However, we are voluntarily providing a statement to enhance transparency in our progress against the TCFD recommendations.
From 1 January 2023 the requirements of the new Companies Act (s414CA and CB) will require us to make similar disclosures.
We do not believe we are fully compliant with the TCFD framework yet. We have identified areas where we still need to make progress with respect to each of the four TCFD pillars, as follows:
Governance
We continue to develop our governance approach as our response to climate change evolves and matures. This includes new processes to support growing reporting requirements and commercial opportunities. The fast-changing regulatory environment requires us to continuously review our governance framework to ensure it is fit for purpose. We are streamlining our processes to create an agile approach to climate change supported by robust governance.
Strategy
For Strategy recommendations b) and c) we will continue to embed the results of our Climate Internal Scenario Analysis (CISA) to demonstrate our resilience to climate-related risks. We look to integrate this forward-looking analysis into our financial planning and business strategy. We are also developing commercial strategies to capture opportunities linked to the climate agenda.
Risk Management
Progress has been made relating to recommendations a) and b). We continue to enhance our capabilities for recommendation c). We have performed CISA and started to enhance our scenario analysis capability.
Metrics and Targets
Work is underway to gather credit exposure data by geography and average tenure. We have developed a client outreach programme to assess areas of vulnerability in our balance sheet to risks related to the transition to net zero and to identify ways to support customers on their transitions.
To develop interim Scope 1 and 2 reduction targets, we are assessing the impact of staff returning to offices and the move to our new headquarters in Milton Keynes in 2023.
Our disclosure for Scope 3 covers business travel only. We have made significant progress in measuring our main lending activities. As part the Banco Santander commitment1 to the Net Zero Banking Alliance (NZBA) we are working on setting decarbonisation plans for both short and long term timeframes and disclosure will be made in accordance with the NZBA requirements. We will also continue to work on disclosing more Scope 3 emissions in the future.
| | | | | | | | | | | | | | |
| Climate change workshop with COP26 President |
| | | | |
| The Board Responsible Banking Committee (RBC) hosted a climate change workshop in May 2022 with the Rt Hon Alok Sharma MP, President of the 26th United Nations Climate Change Conference (COP26). During the workshop we exchanged thoughts on our climate change strategy and ambitions, and the challenges we face as an industry. | | The dialogue concluded positively and we shared a summary of policy positions that would support the finance industry to decarbonise and help customers transition to a net zero economy. |
1 more information can be found in Banco Santander Climate Finance Report 2021-2022 : https://www.santander.com/content/dam/santander-com/en/documentos/informe-anual-de-sostenibilidad/2021/ias-2021-climate-finance-2021-en.pdf
| | | | | | | | | | | | | | |
| Annual Report 2022 | Santander UK Group Holdings plc 39 |
| | | | | | | | | | | | | | | | | | | | | | | | | | | | | | | | | | | | | | | | | |
| Strategic Report | Sustainability and Responsible Banking | Governance | Risk review | Financial review | Financial
statements | Shareholder
information |
| | | | | | | | | | | | | |
| | | | | | | | | | | | | |
Governance
Our climate change governance provides Board and senior management oversight of climate-related risks and opportunities. This supports our Climate Change strategy and the Board's ambition to support the UK transition to a low-carbon economy.
Governance of climate change is in place across all levels of our business. From Board and Executive level, through our Risk and SRB functions, to our business divisions, including Retail Banking, Consumer Finance and Corporate & Commercial Banking (CCB).
Climate change governance activities in 2022
We made significant progress in developing our approach to climate-related risk in 2022.
Board Committees
Key Board Committee activities undertaken relating to climate change in 2022 included a review of the response to BoE’s CBES 2 and the PRA feedback on CBES. In addition, the Board Responsible Banking Committee (RBC) reviewed progress against our SRB performance metrics and the portfolio alignment exercise.
Executive Level Committees
At Executive management level, the Executive Risk Control Committee reviewed the planning and outputs of CISA. The Senior Management Committee (SMC) received updates on our climate change progress, including the portfolio alignment. The SMC made further recommendations to the Board-level committees.
Climate Leadership Group (CLG)
To reflect the rapid evolution of the climate change agenda in the banking sector we updated the Terms of Reference for our CLG. It is now chaired by the Head of SRB and meets monthly. It also reports more frequently to the Board and senior management committees on current and emerging climate risks and opportunities.
Throughout 2022, the CLG delivered regular updates to the SMC and Board RBC with a focus on our progress of the portfolio alignment exercise.
Climate Finance Working Groups
Our divisional Climate Finance Working Groups oversee the climate change and sustainability topics that are relevant to that division. In 2022, the working groups explored new products and services that will help our customers’ transition to a greener and more inclusive net zero economy. Initiatives included strengthening our process and practices on green finance and enhancing customer awareness on property energy efficiency and financing for retrofitting activities.
Our climate change governance framework
Our Climate Leadership Group (CLG) is responsible for recommending the overall Climate Change strategy and reports to the Board and senior management. Beneath the CLG, various working groups are responsible for the three pillars of our Climate Change strategy.
| | | | | | | | | | | | | | | | | | | | | | | | | | | | | | | | | | | | | | | | | | | | | | | | | | | | | | | | | | | | | | | | | | | | | | | | | | | | | |
| | | | | | | | | | | | | | | | | | | | | | | | | |
| Board Risk Committee | | | Board Responsible Banking Committee | |
| | | | | | | | | | | | | | | | | | | | | | | | | |
| Executive Risk Control Committee | | | Senior Management Committee | |
| Responsible for: climate change financial risks and
regulatory requirements (BoE, PRA, FCA) | | | Responsible for: assisting the Board in its aspiration to be a responsible bank, including its approach to ESG matters | |
| | | | | |
| | | | | | | | | | | | | | | | | | | | | | | | | |
| | | | | | | | | | | | | | | | | | | | | | | | | |
| | | | | | Climate Leadership Group | | | | | |
| | | | | | Responsible for: overseeing the development and implementation of the UK Climate Change strategy, encompassing the three strategic focus areas and eight enablers, including regulations and public policy | | | | | |
| | | | | | | | | | | |
| | | | | | | | | | | | | | | | | | | | | | | | | |
| | | | | | | | | | | | | | | | | | | | | | | | | |
| Climate Change Risk
Working Group | | Climate Finance
Working Groups | | Forum for
Environmental Change | |
| | | | | | |
| Responsible for: overseeing the management of climate risk in credit, market, liquidity and operations | | Responsible for: supporting
customers' transition to a low-carbon economy with products and services | | Responsible for: reducing emissions
in our operations in branches,
offices and data centres | |
| Subgroups (x2): Scenario
Analysis Working Group
and Steering Committee | | Working Groups (x3): Homes, Consumer Finance, and Corporate and Commercial Banking | | Representation: Governance,
procurement, data, Go Green,
wellbeing and workplace, Sustainability and Responsible Banking | |
| | | | | | |
| | | | | | | | | | | | | | |
| Annual Report 2022 | Santander UK Group Holdings plc 40 |
| | | | | | | | | | | | | | | | | | | | | | | | | | | | | | | | | | | | | | | | | |
| Strategic Report | Sustainability and Responsible Banking | Governance | Risk review | Financial review | Financial
statements | Shareholder
information |
| | | | | | | | | | | | | |
| | | | | | | | | | | | | |
Our climate change governance structure
Our climate change governance structure strengthens our ability to identify, assess, manage and report climate risks, as follows:
– Committees: A number of Board and Executive committees, as well as dedicated working groups are responsible for climate-related risk
– Key senior management roles: A number of senior roles have specific responsibilities for climate risk management
– Risk organisational structure: We have the ‘three lines of defence’ model built into the way we run our business, including how we manage climate risk.
Our Climate change governance framework supports Santander UK's wider Governance structure. For more on the Board Risk Committee, Board Responsible Banking Committee and other relevant Board-level and senior executive committees, see the Governance section of this Annual Report.
Committees
The Board and Board Level Committee responsibilities for climate risk are
| | | | | |
| Board-level Committee | Main climate-related responsibilities |
| Board Risk Committee (BRC) | –Approves risk appetite and maintains oversight of climate-related financial risks and regulatory requirements, including the BoE’s Climate Biennial Exploratory Scenario (CBES). |
| Board Responsible Banking Committee (RBC) | –Recommends the SRB strategy (including climate change ambition level, policies, targets) to the Board and maintains oversight of execution. –Reviews climate disclosures, business performance against climate agenda priorities. |
The Executive Level Committee responsibilities for climate risk are: | | | | | | |
| Executive level Committee | Main climate-related responsibilities | |
| Executive Risk Control Committee (ERCC) | –Recommends risk appetite to BRC and reviews climate-related financial risks and compliance with regulatory requirements –Reviews planning and outputs of CISA. | |
| Senior Management Committee (SMC) | –Sets the SRB strategy including climate change ambition level, policies, targets, and reviews progress –Reviews progress against climate agenda. Makes recommendations to Board committees. | |
The dedicated working group responsibilities for climate risk are: | | | | | | |
| Working Group | | Main climate-related responsibilities |
| Climate Leadership Group (CLG) | | –Oversees development and implementation of our Climate Change strategy –Coordinates and discusses strategic priorities and receives status updates from working groups. |
| Climate Change Risk Working Group (CCRWG) | | –Coordinates and monitors delivery of climate change plan to manage climate change financial risks aligned with PRA expectations and TCFD –Reports progress to the CRO, the CLG and directly to the BRC and ERCC. |
Climate Finance Working Groups For Homes, Consumer Finance and CCB | | –Harness business opportunities from the transition to net zero, develop green products and services for customers and provide updates to the CLG |
| Forum For Environmental Change (FFEC) | | –Oversees environmental matters on Santander UK Plc property, covering ISO14001 environmental management system, performance and communication to staff. |
Key senior management roles
Senior roles with specific responsibilities for managing climate risk are:
| | | | | |
| Role | Main climate-related responsibilities |
| Chief Risk Officer | The appointed Senior Management Function (SMF) with responsibility for climate-related financial risks. |
| Head of Sustainability and Responsible Banking | Oversees our SRB strategy, including implementing our climate change strategy. Supports the business to manage climate risk, align our portfolios to net zero, and develop products and services that support customers and reduce our emissions. |
| Head of Climate Change Risk | Coordinates and monitors delivery of our climate change implementation plan, managing the financial risks from climate change in line with PRA expectations and TCFD. Reports climate risks and progress to the CRO, the CLG and directly to the BRC and ERCC. |
| Head of ESG and Climate Change in CCB | Acts as a central point of contact for ESG and climate-related matters in CCB. Responsible for raising awareness and training for CCB colleagues to enable them to support clients on climate change and sustainability. Reviews and responds to regulations that relate to our Sustainable Finance Classification System (SFCS) and including the UK Green Taxonomy. Supports all CCB regulatory climate stress testing. Develops new products and co-ordinates all ESG and climate matters that impact CCB. |
Risk organisational structure
As described in the Risk review section of this Annual Report, we use the 'three lines of defence' model to manage risk, including climate risk. Our Business Units, Business Support Units and Risk Control Units consider the impact of environmental and climate-related risks on our existing business risks in the medium and long term. Business Units are responsible for any climate-related risk identified in their business area. Business Support Units give Business Units specialist support on risk management. For climate-related risks, the Business Support Units include SRB, Technology & Operations, and Finance. The Risk Control Units report to the CRO and are responsible for the control and oversight of their respective risk type. For climate-related risks, the relevant Risk Control Units are credit, liquidity, pension, capital, operational, reputational, conduct & regulatory and legal risks. Internal Audit plays a key role in the governance of our ESG and climate change journey by providing assurance across a wide range of related topics. Internal Audit is developing an ESG audit strategy to provide line three assurance.
| | | | | | | | | | | | | | |
| Annual Report 2022 | Santander UK Group Holdings plc 41 |
| | | | | | | | | | | | | | | | | | | | | | | | | | | | | | | | | | | | | | | | | |
| Strategic Report | Sustainability and Responsible Banking | Governance | Risk review | Financial review | Financial
statements | Shareholder
information |
| | | | | | | | | | | | | |
| | | | | | | | | | | | | |
Strategy
Our ambition: Net Zero by 2050
Banco Santander has set an ambition to achieve net zero carbon emissions by 2050. In the UK we are aligned to this commitment and aim to reduce our emissions from our operations, and from our lending, advisory and investment services to meet this ambition.
Climate change is part of the Healthy Environment pillar of our SRB strategy. Our Climate Change strategy is made up of three pillars that cover the material climate-related risks and opportunities we face. Since 2020 we have achieved milestones within our Climate Change strategy and have also set internal targets for climate change. These include a target of £20bn of green finance by 2025.
As the climate change agenda grows, we aim to develop more targets to reflect our ambitions and track our progress.
This section consists of the following sub-sections:
–Our UK Climate Change strategy
–Progress within our Climate Change strategy
–Climate-related risks over short-, medium- and long-term
–Climate-related commercial and operational opportunities
–Financing the green transition.
UK Climate Change strategy framework
Climate change is one of Santander UK's most material sustainability and ESG issues. Our Climate Change strategy responds to this and focuses on three main areas that will deliver our net zero ambition:
| | | | | | | | | | | | | | | | | | | | | | | | | | | | | |
| Our Climate Change strategy |
| Ambition |
| | | | | | | | | |
| Achieve net zero carbon emissions by 2050 |
| Three strategic focus areas |
| | | | | | | | | |
| 1.Managing climate risks | | | 2.Supporting customers | | | 3.Reducing emissions in our operations |
| –Integrate climate considerations into risk management frameworks –Screen and stress test our portfolio to identify sector-specific transition and physical climate-related financial risks –Measure portfolio alignment and set risk appetites to help steer our portfolios in line with the Paris Agreement. | | | –Support customers to grow and succeed –Develop customer/client, sector and segment strategies to support and accelerate the transition to a zero-carbon economy –Create green products and services –Develop customer engagement plans –Ensure strategies are inclusive and avoid unintended social consequences. | | | –Review internal policies to consider climate –Continuous improvement of ISO certified environmental and energy management systems –Offset residual CO2 emissions –Create an internal green culture through employee engagement –Procure 100% green energy. |
| | | | | | | | | |
| | | | | | | | | | | | | | | | | |
| Eight enablers |
| Governance and policies | Targets and KPIs | | Stakeholder management | Competencies and skills |
|
Public policy, communication
and brand | External partnerships | Reporting and disclosures | Pricing and/or rewards |
| | | | | | | | | | | | | | |
| Annual Report 2022 | Santander UK Group Holdings plc 42 |
| | | | | | | | | | | | | | | | | | | | | | | | | | | | | | | | | | | | | | | | | |
| Strategic Report | Sustainability and Responsible Banking | Governance | Risk review | Financial review | Financial
statements | Shareholder
information |
| | | | | | | | | | | | | |
| | | | | | | | | | | | | |
Progress within our Climate Change strategy in 2022
We recognise that meeting our net zero target needs ongoing and ambitious action. We have hit some positive milestones in the last few years and are working to set additional milestones that support our ambition.
| | | | | | | | | | | | | | | | | |
| First steps on our journey to net zero by 2050 |
| | | | | |
2020 Achieved carbon neutrality in our operations | 2021 Removed unnecessary single-use plastics | 2022 Sourced 100% of electricity from renewable sources1 1.2 million customers moved to paper-free | 2025 Raise or facilitate £20bn of green finance | 2030 Reduce Scope 3 GHG emissions towards the 2050 group commitment | 2050 Net Zero |
1 100% renewable electricity sourced for Santander UK plc. Santander Financial Services plc, which is included in this report, is sourcing non-renewable electricity and represents 0.03% of Santander UK's total electricity consumption in 2022.
In 2022, we made significant progress across each of our UK Climate Change strategy pillars:
Managing climate risks
–Completed regulatory stress test exercises (BoE CBES and ECB’s climate stress tests) and the internal climate stress testing exercise (CISA). Started further development of the process to assess potential capital requirements for climate risk
–Implemented a climate change risk screening tool for suppliers
–Continued to measure financed emissions for Santander UK's two main lending activities (residential mortgages and auto finance)
–Launched an ESG data project to improve ESG data governance and strategy
–Implemented Climate Risk Assessment Model (CRAM), an assessment tool to monitor customers transition to net zero and show how we can help.
Supporting customers
–Launched the New Greener Homes Hub and home improvement loan for mortgage customers to support retrofitting properties
–Expanded free EnergyFact Reports offer to all Santander UK customers to inform and raise awareness of home energy efficiency.
Reducing emissions in our own operations
–Started a new Green Renewables contract
–Continued to work towards a BREEAM certification for our new head office, Unity Place, in Milton Keynes (due 2023)
–Contracted an independent sustainability ratings provider to assess sustainability ratings of our suppliers.
Enablers
–Updated the Climate change governance to strengthen the framework
–Ran a climate change Board level workshop with Rt Hon Alok Sharma MP
–Participated Bankers for Net Zero (B4NZ) roundtables, the Country chapter of Net Zero Banking Alliance (NZBA)
–Launched the sustainability and climate change training platform, Sustainability Unlocked, for CCB and Risk colleagues
–Entered a new collaboration with a pioneering climate tech business to market and expand the reach of their decarbonisation technology.
| | | | | | | | |
| Developing a Just Transition | |
| | |
| It is essential to recognise the needs of workers, communities and suppliers as the economy shifts towards low carbon. Ensuring that our activities continue to serve our stakeholders and communities is important to us. A fair transition ensures that vulnerable groups are not excluded. Everyone needs to have the chance to transition and prosper in a low-carbon economy. We joined the Financing Just Transition Alliance (FJTA) in 2022 to consider a just transition as part of our wider Climate Change strategy. The FJTA is coordinated by the Grantham Research Institute and the London School of Economics. It brings together finance industry peers to make sure their transition plans consider social implications alongside environmental. Our Homes division participated in FJTA workshops on identifying the social dimensions of decarbonising the UK Housing market. With the cost-of-living crisis and fuel poverty, the work with the Alliance and its members to build a whole-system approach is critical to meeting one of the greatest decarbonisation challenges. |
| | | | | | | | | | | | | | |
| Annual Report 2022 | Santander UK Group Holdings plc 43 |
| | | | | | | | | | | | | | | | | | | | | | | | | | | | | | | | | | | | | | | | | |
| Strategic Report | Sustainability and Responsible Banking | Governance | Risk review | Financial review | Financial
statements | Shareholder
information |
| | | | | | | | | | | | | |
| | | | | | | | | | | | | |
Climate-related risks and opportunities
The impacts of climate change present a range of risks to our business. The response to climate change, however, also offers real opportunities for us, our clients and how we operate.
Climate-related risks
Identifying, assessing and managing our climate risks is a key part of our Climate Change strategy. The complexity of climate change translates into a diverse range of risks. The first pillar of our Climate Change strategy addresses these risks. We assess our exposure to climate-related risk and establish processes to manage and respond to them. Our systems provide data inputs to our strategic and financial decision making. We also build our capabilities to test the resilience of our strategy and business against climate risks and their impacts.
Physical risks
These result from the direct impacts of climate change such as increasing severity and frequency of extreme weather events. They can be acute (event-driven) or chronic. Chronic risks tend to materialise in the medium-to-longer term due to progressive climate shifts:
–Acute physical risks include more severe natural disasters. These include coastal floods, droughts, heatwaves, heavy precipitation, floods, landslides, hurricanes/cyclones, storm surges, water scarcity and stress, and wildfires
–Chronic physical risks include weather pattern shifts, extreme precipitation, higher average temperatures, chronic heatwaves and higher sea levels.
Physical risks can have economic impacts:
–Lower revenues owing to transport problems, supply chain disruption and other impacts that strain production
–Lower revenues and higher costs linked to workers’ health, safety, absenteeism and other workforce-related problems
–Write-offs and early retirement of assets due to property damage and high-risk locations
–Higher operating costs for example, from inadequate water supply for hydroelectric plants or to cool nuclear and fossil fuel plants
–Wind pattern shifts that reduce energy production from wind farms
–Higher capital costs, for example from damage to facilities
–Lower revenues from declining sales.
Transition risks
These relate to the process of adjustment towards a low-carbon economy. They arise from policymaking, technology, market sentiment and reputation changes in response to climate change:
–Government policymaking and action can give rise to higher operating costs for carbon intensive customers. Policies can introduce enhanced reporting obligations, especially on emissions and green taxonomy disclosures
–Potential prudential treatment for high carbon-related exposures, which could also raise financing costs for customers. These impacts appear in the short-to-medium term
–Technological advances, such as in renewable energy, energy storage and energy efficiency could render companies’ systems obsolete. This could make them less competitive in the medium-to-long term
–Market sentiment can have an impact on supply and demand in the medium-to-long term. This could come from changes in customer preferences, companies’ sales mix, energy pricing and asset revaluation
–Reputation impacts can lead to a sudden drop in demand for goods and services from discredited sectors or companies.
Climate change impact on financial planning and financial performance
It is important to understand the risks and opportunities to our balance sheet from climate change. A current example is how the energy crisis and war in Ukraine could affect the energy transition. We undertake climate scenario modelling to better understand these potential impacts on our business portfolios. This helps with devising actions that can mitigate these risks. Examples of potential climate-related impacts include:
–Impact of changing economics on house prices and mortgage repayments
–Possible consequences of policies that promote rapid transition and will require retrofits and upgrades to improve energy efficiency. We also consider if grants may be available to support our customers with upgrade costs
–The impact on affordability and associated household costs from increasing energy costs. We consider customers whose properties and have potentially lower EPC scores and associated energy costs
–Sectoral analysis of the impact of transition for our CCB customers. This includes EPC improvements of commercial properties, moving to renewable energy sources, reducing Scope 1-3 emissions or progressing sustainability plans.
The resilience of our Climate Change strategy
Our strategic approach not only reviews climate-related risks and opportunities. It also assesses our resilience to climate-related risk.
We took part in the BoE's CBES in 2021 and the ECB climate stress test in 2022. We are developing our regular in-house scenario analysis process – CISA. This will help us to enhance our processes and explore opportunities and impacts on the business. Our approach and full details are available in the Risk Management section below.
| | | | | | | | | | | |
| Climate risk factors |
| | |
Physical risks Leading to more severe natural disasters such as higher sea levels, higher temperatures and extreme flooding storms or heatwaves | | | Transition risks Shifts in consumer behaviours and preferences, policy changes affecting EPC ratings and technological advances |
| | | | | | | | | | | | | | | | | |
| Potential economic impacts |
| | | | |
| Falling house prices | Falling Equity and Bond prices | | | Market and credit losses | Supply chain disruption |
| | | | | | | | | | | | | | | | | |
| Financial implications |
| | | | |
| Credit losses and capital requirements | Write-downs of carbon-intensive assets | | | Falling Equity and Bond prices | Market and liquidity risk |
| | | | | | | | | | | | | | |
| Annual Report 2022 | Santander UK Group Holdings plc 44 |
| | | | | | | | | | | | | | | | | | | | | | | | | | | | | | | | | | | | | | | | | |
| Strategic Report | Sustainability and Responsible Banking | Governance | Risk review | Financial review | Financial
statements | Shareholder
information |
| | | | | | | | | | | | | |
| | | | | | | | | | | | | |
Climate-related risks over the short, medium and long term
The below table outlines the potential physical risk and transitional risk impacts arising from climate change. It includes an initial assessment of how these risks affect our key business segments over time.
| | | | | | | | | | | |
| Climate risk type and drivers | Impact | Business Impact
(low, medium, high) | Time horizon |
| Physical risk |
| Acute | –More frequent and severe climate events such as flooding, and drought that could affect our business and customers –Extreme events that could cause damage to our sites. | –Damage may occur to properties in our retail and commercial mortgage books, reducing collateral values (low) –Santander UK-owned property, or third-party supplier impacts could impact customer servicing (low). | ST, MT, LT |
| Chronic | –Changes in weather patterns and stability of local ecosystems affecting food production and living environments impacting customers whose operations are exposed to vulnerable ecosystems –Rising temperatures affecting working conditions, living conditions and local infrastructure. –Rising sea levels affecting local ecosystems, increasing subsidence and food risks in our financial assets. | LT |
| Transition risk |
| Market and customers | –Change in consumer behaviours including deliberate move to more sustainable products –Potential loss of competitive advantage with our green product proposition or pricing risks. | –Strategic risk of not keeping pace if consumer preferences rapidly move towards more sustainable products (low). | ST, MT |
| Policy making | –More demanding policy environment and standards affecting our customers' business operations and customer behaviour –Increased greenhouse gas emissions pricing to foster movement to renewable energy. | –Strategic risk of a rapid disorderly transition (low) –Potential risk of stranded customer assets if minimum EPC standards are enforced without government transition assistance (medium) –Dependency on policy making to achieve decarbonisation of material lending portfolios. Risk of falling behind if appropriate policies are not implemented or in a timely manner (medium). | ST, MT, LT |
| Technology and data | –The need to invest in technology to reduce emissions or improve energy efficiency ratings –Lack of procedures and systems to obtain and store reliable data for risk assessments, classification and disclosure. | –For Consumer Finance, there is a risk that rapid technological obsolescence could result in lower vehicle residual values (low) –All business areas are subject to the risk of investments being made in green technologies that are rapidly superseded (low) –There are operational costs and greenwashing risks associated with misclassification of green assets and transition reporting (low). | MT |
| Regulatory pressure | –Increasingly demanding banking regulation (for example, disclosure, stress testing, taxonomies) and increasing complexity and/or inconsistency with a scope required where data is not available or reliable –Inefficiencies as consequence of different climate regulations from various jurisdictions. | –Santander UK, as a subsidiary of Banco Santander, is exposed to a risk of arbitrage given differences in climate- related definitions (low) –Higher operating costs may be incurred as a result of multiple and conflicting regulatory reporting requirements (low). | ST, MT |
| Reputational | –Risk of slow or lack of sufficient reaction impacting reputation –Increased scrutiny from different stakeholders (for example, supervisors, regulators, media, NGOs, investors) –Perceived not to be meeting, sufficiently progressing, or providing transparency on climate-related commitments –Liability implications as an intermediary in several value chains (for example, data, products, financial services) –Reputational impact from potential misalignment of emissions reduction commitments with performance in specific portfolios. | –Increased customer and regulatory scrutiny due to changing public opinion and increased regulation, which we are perceived as not to be meeting, sufficiently progressing, or providing transparency on climate-related commitments (low). | ST, MT, LT |
ST - short term: 0-3 years, MT - medium term: 3-5 years, LT - long term: 5-30 years
Business impact (low, medium, high): the scale of potential loss in terms of profitability/revenues, diminishing value of collateral/assets or occurrence of increased potential costs that Santander UK could face for climate- related events.
| | | | | | | | | | | | | | |
| Annual Report 2022 | Santander UK Group Holdings plc 45 |
| | | | | | | | | | | | | | | | | | | | | | | | | | | | | | | | | | | | | | | | | |
| Strategic Report | Sustainability and Responsible Banking | Governance | Risk review | Financial review | Financial
statements | Shareholder
information |
| | | | | | | | | | | | | |
| | | | | | | | | | | | | |
Climate-related opportunities
Climate change also presents commercial and operational opportunities for Santander UK.
To ensure we capitalise on these it is crucial we track the development of emerging and transition technology. We also need to understand the challenges customers face in adapting to the low-carbon transition. We aim to identify and develop innovative ideas, collaborations and products that are commercial opportunities.
The opportunities presented by climate change and the transition to a low-carbon economy are reflected in the second and third pillars of our Climate Change strategy. These are: 'Supporting customers' transition' and 'Reducing emissions in our own operations'.
In 2022, we reviewed the climate-related opportunities in areas where climate change has a material impact on our mortgage, consumer and corporate businesses.
It validated our strategic goal to support the transition by providing green and sustainable finance. We have set our target of £20bn of green financing by 2025. We also identified key enablers that will help to not only achieve but exceed our ambition.
The opportunities from climate change we have identified are outlined in the table below.We will also conduct a review of metrics and targets associated with these opportunities in 2023 to ensure they continue to be fit for purpose in meeting our sustainability priorities.
Climate-related opportunities over the short, medium and long term
| | | | | | | | | | | |
| Commercial opportunities | Potential Impact on Santander UK | Market enablers | Time horizon |
| Retail Banking - Homes | |
| Green mortgages | –Increase balance sheet and funding requirement –Reduce relative exposure to energy inefficient properties.
| –Growth of energy efficient properties (EPC rating A and B) by maintaining levels of lending on new build properties, subject to new build supply and development, and encouraging the retrofitting of existing property stock –Public policy and regulations that can encourage homeowners and property sector to retrofit. | MT, LT |
| Financing of retrofitting activities | –Grow the number of properties rated as energy efficient. | –Skills infrastructure growth to deliver retrofitting solutions in the market at scale –Increased awareness and knowledge of property owners on retrofitting –Clear and consistent Government policy on retrofitting. | MT, LT |
| Consumer Finance | |
| Financing to enable shift to EVs | –Reduce financed emission intensity –Establish new partnerships, such as with charging providers. | –Car manufacturers corporate strategy to transition to electric or hybrid vehicles –Consumer uptake and acceptance of electric or hybrid vehicles. | ST, MT |
| Financing of additional technologies that enable low-carbon mobility solutions | –Establish new partnerships, e.g., with solar panel providers –Collaboration between Consumer Finance and Homes to offer complimentary products. | | MT, LT |
| Corporate & Commercial Banking | |
Financing of –wind, solar and renewable energy –EV charging infrastructure –battery storage systems | –Increase in volume of green lending and sustainable-linked financing. | –Supportive public policy for renewables energy and balanced cost-benefit for energy providers and consumers –Consumer uptake of electric and hybrid vehicles –Growth of battery demand and supply. | ST, MT |
| Continuing to eliminate carbon-intensive lending activities to support the green transition | | |
| Supporting clients in the just transition | | |
| Operational Opportunities | Potential Impact on Santander UK | Approach | Time horizon |
| Reduce emissions in our properties, operations and company cars | –Potential cost savings from sourcing renewable energy and independence from gas/ electricity supply.
| –Work further to reduce our carbon emissions in our properties –Transfer a majority of our activities to our new headquarters Milton Keynes which will be completed and BREEAM certified in 2023 –Aim to retain ISO14001 and ISO50001 Management Systems. | ST, MT |
| Supply chain management | –Increased transparency on suppliers' sustainability performance –Enhanced reporting on Scope 3 upstream emissions. | –Assess our suppliers using an independent sustainability rating provider and work with our suppliers to promote progress through specific KPIs and metrics. | ST, MT, LT |
ST - short term: 0-3 years, MT - medium term: 3-5 years, LT - long term: 5-30 years
| | | | | | | | | | | | | | |
| Annual Report 2022 | Santander UK Group Holdings plc 46 |
| | | | | | | | | | | | | | | | | | | | | | | | | | | | | | | | | | | | | | | | | |
| Strategic Report | Sustainability and Responsible Banking | Governance | Risk review | Financial review | Financial
statements | Shareholder
information |
| | | | | | | | | | | | | |
| | | | | | | | | | | | | |
Financing the Green Transition
Supporting our retail banking and corporate clients in the climate change transition is important to us and is reflected in our second pillar of our Climate Change strategy.
How we are supporting the climate change transition
We are engaging with our retail, business and corporate customers to identify the challenges and opportunities they face from the low-carbon transitioning and adapting to climate change.
In our Retail Banking and Consumer Finance divisions, there is a need for financial products and services that help improve energy inefficient properties and accelerate the uptake of electric vehicles.
These include:
–The purchase construction and refurbishment of energy-efficient buildings
–Installation and refurbishment of renewable power systems that use less energy
–Retrofitting activities, including insulation, double glazing of windows, installation of heat pumps are required
–Leasing of electric and hybrid vehicles
–Installation of EV charging points
We support our CCB clients with dedicated financing for renewable energy products and storage, such as solar panels, wind farms and battery production.
Our green finance performance
12%
Green Asset Ratio 2022
The EU's Non-Financial Reporting Directive (NFRD) sets out a framework for banks on how to report on sustainable finance activities. In response to Banco Santander's reporting requirement, in 2022 we started to assess our volume of green assets according to the EU Green Taxonomy.
The Green Asset Ratio (GAR) measures the share of taxonomy-eligible and taxonomy-aligned assets over the Bank's total assets. As of 2022, our GAR was 12%. Although it is not mandatory for us to report on GAR, we use this metric to enhance transparency of our own sustainable performance. We aim to use GAR to inform internal decision-making processes related to our green finance strategy. This is the first year of measuring this metric. We are looking to improve our GAR in the next coming years by increasing our green proposition to customers and providing more green finance.
We adopted Banco Santander’s SFCS, which outlines criteria to consider if an asset is green, social or sustainable across the Banco Santander group. By applying the SFCS we have identified multiple assets as green financing. The following can be considered most representative: renewable energy and other green energy financing, mortgages on properties with A- or B- rated EPCs and financing for vehicles with emissions of 50g CO2/ km or less.
In 2022 alone, we raised and facilitated £6.5bn of green finance according to the SFCS guidance. Since 2021, we have supported our customers with more than £10bn of green finance.
Consumer Finance provided £714m of financing to low-emission vehicles in 2022, representing a year-on-year growth of 64%. Similarly, CCB accelerated their green finance activities, growing their green financing from £199m in 2021 to £557m in 2022.
| | | | | | | | |
| Reducing our exposure to carbon intensive sectors | |
| | |
| Our ESCC Risk Management policy reflects our fundamental values and guides how we operate as a responsible lender. We assess any lending as a fossil fuel exposure if the counterparty is engaged in any of the activities laid out in the policy. This includes for example, the production and treatment, including refining, transportation, storage and wholesale distribution, of oil and gas; any coal mining or extraction activities; power plants; and the construction and maintenance of electricity transmission lines. The policy draws upon international standards and sector-specific regulations and guidelines to ensure we incorporate best practices. At 31 December 2022, Santander UK's exposure to fossil fuel sectors was only 0.4% of our total non-financial corporate lending. In line with Banco Santander's 2050 net zero commitment, by 2030 we will eliminate all exposure to thermal coal mining and not provide financial services to power generation clients with more than 10% of revenue from thermal coal. For more on Banco Santander's commitment and approach to carbon-intensive sectors, please see Banco Santander's Climate Finance Report 2021-2022. Our Risk Review section in the Annual Report contains further information on how we identify, assess, manage and report risks within our lending exposures. |
| | | | | | | | | | | | | | |
| Annual Report 2022 | Santander UK Group Holdings plc 47 |
| | | | | | | | | | | | | | | | | | | | | | | | | | | | | | | | | | | | | | | | | |
| Strategic Report | Sustainability and Responsible Banking | Governance | Risk review | Financial review | Financial
statements | Shareholder
information |
| | | | | | | | | | | | | |
| | | | | | | | | | | | | |
Retail Banking
Homes
Nineteen million homes in the UK have an EPC rating of D or below. This is both a challenge and an opportunity for the UK to improve the energy efficiency of these properties. In 2022, Homes launched a new home improvement loan to support customers planning green retrofits. We also launched the Greener Homes Hub, giving customers online information on energy efficiency. We continue to provide access to a free, digital EnergyFact Report tailored to each customer’s home. These tools will help raise customer awareness on energy efficiency. We have provided 11,500 EnergyFact Reports since 2021 including 6,000 in the second half of 2022 alone.
Everyday Banking
Everyday Banking supports customers and colleagues in the transition to a low carbon economy with the following products and services:
–We are working closely with Santander Asset Management1 to better understand customers’ needs on Sustainable Investment products. We are conducting customer research and designing offerings that will allow customers to invest their money in products that support people and planet.
–Through Santander UK’s National Parks Partnership we are exploring innovative investment solutions to deliver much-needed private capital to fund nature-based solutions.
We conducted research to discover how we can improve our customers’ awareness and understanding of how to reduce their contribution to climate change to help them transition to a low-carbon economy. The research shows that customers want help in this area. To provide support, we will be launching a carbon footprint tool in 2023 through My Money Manager, our personal finance management tool on the Santander mobile app. The tool will provide customers with their estimated carbon footprint and ideas on how to reduce their impact.
Consumer Finance
We have implemented a number of initiatives to help finance the green transition. In 2021, we set up the green finance dashboard and we track performance every month at the Climate Action and Sustainability Forum (CASF), the divisional working group for sustainability and climate change. CASF follows key trends and influences on green finance and identifies commercial opportunities to finance hybrid and electric vehicles. CASF’s scope included a review of Consumer Finance's risk appetite in 2022 which allowed increased financing on used EVs. Key updates CASF and the green finance dashboard are reported quarterly to the Consumer Finance Board. Non-auto financing increased in 2022 through an expanded cycle dealer network. We are also exploring other opportunities to offer finance to customers to support the shift to more sustainable lifestyles.
For 2023, we will review the trends and motivations for customers to shift to green vehicles. This will include reviewing opportunities to support them with financing. Aligned to this, we have engaged with the Green Finance Institute to look at ways to overcome barriers to EV uptake and financing.
Corporate & Commercial Banking
In 2022, we expanded our sustainability lending proposition in CCB. We are providing more opportunities for customers to start or accelerate their transition towards a net zero economy. Our Sustainability-linked lending has enabled corporate clients to strengthen their sustainability ambitions by aligning their commitments and targets to their finances. In 2022, we participated in £590m of sustainability-linked financing in a variety of sectors in the UK. We also delivered £557m of green financing to CCB customers. Examples of corporate clients’ targets that have been linked to our financing include, reducing Scope 1, 2 and 3 carbon emissions, enhancing diversity and inclusion, and improving community impact or improving operational waste and efficiency. This is a small sample of sustainability-aligned performance indicators that have helped CCB clients to accelerate their sustainability journey. We are one of the market-leading lenders in battery storage project financing providing more than £360m in funding since 2019. In 2022, we also provided £1.9bn of Social Housing loans.
| | | | | | | | | | | | | | | | | | | | | | | | | | | | | | | | |
| Buying into the Green Homes Revolution | | | Supporting the switch to electric vehicles | | | | Financing battery
storage | |
| | | | | | | | | | |
| In October 2022, we launched the ‘Buying into the Green Homes Revolution’ report. The report highlights the main challenges to accelerating energy efficiency retrofitting in UK homes. These include a lack of skills infrastructure and the knowledge gap of consumers on how to make their property more energy efficient.
The report’s findings are based on interviews with over 2,300 UK homebuyers and owners, estate agents and mortgage brokers.
This research will help us develop suitable products and services and raise customer awareness. It will also support our public policy engagement in the best way to accelerate retrofitting in the UK. | | | 2022 saw CCB develop its first financing facility to support the switch to electric vehicles. With financing totalling £25.5m, CCB strengthened its relationship with Zenobē, the UK’s market leader in providing end-to-end solutions for fleet operators moving to zero-carbon fleets.
The new financing marks CCB's entry into a high-growth sector that actively supports the UK Government’s ambition to decarbonise the transport sector. CCB has previously provided finance to Zenobē’s Battery Energy Storage Systems division which provides grid scale battery storage solutions.
Consumer Finance provided financing for 16,400 electric and hybrid vehicles in 2021. In 2022, the portfolio grew to more than 24,000 green vehicles, supporting more customers to switch to electric transport. | | | | High-quality battery storage is recognised as a key enabler of the UK’s transition to net zero. CCB continues to build its strong position in this sector and has provided over £360m of financing since 2019 to support the sector. Our success comes from the strong relationships we have established with market-leading project developers, including TagEnergy. We have delivered financing to support the build and operation of four TagEnergy battery projects in the last 18 months. One is operational, a 20MW/40MWh standalone storage system, with the other three due to come online later in 2023 and 2024. | |
1 Santander Asset Management sits outside of Santander UK Group Holdings plc and is also a subsidiary of the wider Banco Santander group
| | | | | | | | | | | | | | |
| Annual Report 2022 | Santander UK Group Holdings plc 48 |
| | | | | | | | | | | | | | | | | | | | | | | | | | | | | | | | | | | | | | | | | |
| Strategic Report | Sustainability and Responsible Banking | Governance | Risk review | Financial review | Financial
statements | Shareholder
information |
| | | | | | | | | | | | | |
| | | | | | | | | | | | | |
Risk Management
The risks associated with climate and environmental change are key issues for us and our stakeholders. We focused on managing them effectively.
We regularly review the Top risks that could affect our business, customers and shareholders. They are monitored at meetings of the Board Risk Committee and Executive Risk Control Committee.
Climate risk is considered as one of the principal risks to our business. Our Top risks in 2022 are summarised in the Risk management overview section of this report and covered in detail in the Risk review.
Impact of climate risk on our key risk types
Although climate risk can impact all risk types, the main risk types impacted by climate risk are:
Operational risk and resilience
Climate change has a clear impact on operational risk. Extreme weather may force closures or damage to our offices, data centres and branches. It could damage services provided by our suppliers which may affect our ability to operate.
Credit risk
Certain sectors will be affected more than others by climate risk. Some sectors may be affected by transition risks such as transport, whilst others will be more impacted from physical risk.
Physical climate risks may give rise to credit losses if weather-related events affect customers' ability to repay their debts. Collateral values could also be impacted as a result of damage to physical assets.
Transition risks include changes in Government policy related to residential homes and property value. For example, closing the Flood Re Scheme impacts homeowners, who have been flooded or are in high flood risk areas, and their ability to get flood insurance.
Reputational risk
Climate risks may arise from our own business activities and also from failing to meet sustainability targets. We are also mindful of the counterparties that we lend to and ensure that green lending does not undermine the positive efforts of the climate change agenda. Reputational risk may arise from classifying and reporting assets incorrectly as green or sustainable.
Pension risk
Climate change may present long-term risks to the value and security of pension scheme investments. There is a risk that investment of funds could be made without considering climate-related risks as our schemes are managed by trustees.
Liquidity risk
Climate risk may result in increased withdrawals of deposits. This could be acute physical hazard or changing customer sentiment due to a reputational event.
Our UK Climate Change Risk taxonomy
This is a qualitative classification of our portfolios’ potential exposure to climate risks. It gives us a common language and method for portfolio holders and decision makers to support their climate-related decisions. The taxonomy assigns corporate sectors a risk rating on a five-point scale for physical and transition climate change risks. Using guidance from Banco Santander, in 2022 we held workshops with our credit experts to validate these sector risk ratings.
Our climate risk operating model
Our SRB and Enterprise risk teams act as centres of excellence. They are responsible for integrating climate change considerations into teams across the first and second lines of defence.
The SRB team leads the Climate Leadership Group, which is responsible for implementing our Climate Change strategy. The SRB team works with our businesses on calculating financed emissions, setting decarbonisation targets and developing a transition plan.
The Climate Risk team reviews the impact of our net-zero-aligned commercial strategies and transition plans on our overall risk position and credit risk. The SRB team works with the business to develop products and services to achieve this. For more, see 'Financing the green transition'.
Our Enterprise Risk team leads the Climate Change Risk Working Group which manages climate risk across risk types. Enterprise Risk has also developed our Climate Change Risk Policy and coordinated our response to the PRA Supervisory Statement 3/19.
Managing climate-related risks
To manage the risks associated with climate change, we have a range of policies such as the ESCC Risk Management policy. In addition, the Climate Change Risk Policy outlines the steps that our risk teams will take to identify, assess, manage and report on climate-related risks in our business and our primary supply chain.
The policy represents the minimum requirements for how we will manage and control climate-related financial risk. It covers the material physical and transition risks that exist in all risk types .
We remain committed to following best practices, international standards, treaties and references including:
–The Equator Principles
–The standards for social and environmental performance and the explanatory notes of the International Finance Corporation (IFC)
–The United Nations Global Compact
–The Universal Declaration of Human Rights
–The International Labour Organisation Declaration
–The Convention on the Rights of the Child
–The Rio Declaration on Environment
–The United Nations Convention against corruption.
We also follow standards specific to the activities in the oil and gas, power generation and mining and metals sectors, and those associated with businesses engaged in soft commodities.
Our UK risk management framework
| | | | | | | | | | | | | | |
| Annual Report 2022 | Santander UK Group Holdings plc 49 |
| | | | | | | | | | | | | | | | | | | | | | | | | | | | | | | | | | | | | | | | | |
| Strategic Report | Sustainability and Responsible Banking | Governance | Risk review | Financial review | Financial
statements | Shareholder
information |
| | | | | | | | | | | | | |
| | | | | | | | | | | | | |
Climate-related risk appetite
The Santander UK plc Board develops our qualitative climate risk appetite statement. We used data from internal and external analyses in 2022 to develop further and approve the climate risk appetite statements. Our climate change risk management follows six pillars which are aligned to the four PRA Pillars
| | | | | | | | |
| PRA Pillar | Santander Pillar | Description |
| Governance | Internal stakeholder engagement and capacity building | Understanding the climate issues that we face, up to Board-level. Ensuring we have adequate resources to implement the actions defined in the other pillars of our implementation plan |
| Governance | Defining how we ensure there is Board and senior management oversight and management of financial climate risks and climate change issues |
| Scenario analysis | Strategy and scenario analysis | Understanding the financial and strategic implications of climate risks, including via scenario analysis |
| Risk management | Risk management | Embedding climate change into business-as-usual risk management across all portfolios |
| Disclosure | Metrics and targets | Defining metrics and targets to assess and manage climate-related risks and opportunities |
| Disclosure | Ensuring we make required disclosures of financial climate risks and monitor how they are managed |
Roles and responsibilities
We have allocated roles and responsibilities across risk types. | | | | | |
| Team | Sample of Accountabilities |
| Sustainability and Responsible Banking | –Design and development of Climate Change strategy, including alignment with SRB strategy –TCFD reporting and target-setting including performing analysis in line with Paris pathway. |
| First Line of Defence teams | –The identification, assessment, management and monitoring climate change risks –Enhance decision-making to include climate change –Understand the impact of scenario analysis outputs, leading client engagement on climate change risk. |
| Second Line of Defence teams |
| Enterprise Risk | –Runs climate change implementation plan and ensuring compliance to SMF accountabilities –Develop centralised climate change risk report and associated Management information –Develop business-configurable climate scenarios which will feed into stress testing and other processes. |
| Risk owners | –Update relevant policies and procedures in response to climate risk and maintain accountability for risk control –Monitor key indicators for climate-related risk and opportunities. |
| Credit Stress Testing | –Execution of climate stress tests for Retail and Corporate portfolios, and reporting of scenario outputs –Supporting Enterprise Risk to shape the climate stress testing scenarios supported by economics. |
| Third Line of Defence Teams | –Assess the efficiency and effectiveness of processes and systems; compliance with regulation and supervisory requirements; and the reliability and integrity of financial and operational ESG reporting |
Developments in 2022
Credit risk
In 2022, we embedded a green dashboard in Consumer Finance to monitor the mix of vehicles we finance based on engine type. We also launched our Climate Risk Assessment Model (CRAM) to assess climate-related risk across corporate and commercial portfolios.
Climate risk considerations are now part of the product approval processes. We also established CISA and development programmes that will enhance the inputs into our credit decision processes.
Within the Home division, we have created a dashboard of key metrics to monitor potential climate change impacts and climate transitional risks across the mortgage book.
Operational risk & resilience
We included climate change scenarios within the Operational Risk Scenario Programme. We implemented the Environmental Operations Policy Statement, which outlines how we will manage the environmental impacts of our business. We also introduced a climate screening process when we use third parties.
Liquidity risk
A liquidity impacted scenario was tested based on the Disorderly Accelerated Transition scenario in the CISA. We also participated in the 2022 European Banking Authority (EBA) Climate Stress Exercise for Liquidity where an energy transition and nuclear disaster scenarios were tested.
Reputational risk
We reviewed sustainable finance products and green finance initiatives to ensure any green labelling is fit for purpose.
In addition, we explored the impact on liquidity and reputational risk was explored from potential negative media attention resulting from both Santander UK and Banco Santander group activities.
Pension risk
The Pension Scheme established a Sustainability Committee and published their TCFD. Specific responsibilities for climate-related risks and opportunities were agreed to ensure adequate management and oversight.
The Scheme explored and agreed a range of climate-specific investment objectives and policies to inform its ongoing investment approach.
Third-party risk
Climate considerations have been incorporated into our onboarding process for third parties. We have partnered with a sustainability ratings provider to measure the quality of a potential supplier's sustainability management system through its policies, actions and results.
| | | | | | | | |
| Climate risks in our pension scheme | |
| The Santander (UK) Group Pension scheme Trustees are responsible for managing climate risk. A dedicated sustainability committee supports them. It oversees the Scheme’s sustainability strategy, climate policies and regulatory obligations. It has the responsibility for ensuring that the Scheme meets its net zero by 2050 carbon target. In 2022, the Scheme’s Responsible Investment Policy was updated to provide an additional focus on climate risks. Scenario analysis was completed to identify how these risks might affect the Scheme’s funding and investment strategies. For more on the Scheme’s approach relating to climate risk, see its TCFD report. | |
| | | | | | | | | | | | | | |
| Annual Report 2022 | Santander UK Group Holdings plc 50 |
| | | | | | | | | | | | | | | | | | | | | | | | | | | | | | | | | | | | | | | | | |
| Strategic Report | Sustainability and Responsible Banking | Governance | Risk review | Financial review | Financial
statements | Shareholder
information |
| | | | | | | | | | | | | |
| | | | | | | | | | | | | |
Climate stress testing and scenario analysis
Bank of England’s Climate Biennial Exploratory Scenario
We participated in the BoE's Biennial Exploratory Scenario for Climate Change (CBES). The CBES is an exploratory exercise to help the BoE size the finance sector’s exposure to climate risks. It reviews risks across three climate scenarios over a 30-year horizon. The exercise helps companies understand challenges to their business models and likely responses to climate-related risk. The CBES does not test capital adequacy or establish capital requirements.
Partnering with third-party climate modelling experts, we used internal and market datasets to feed into the CBES models used to complete this exercise. We also reached out to around 230 of our largest corporate clients. The responses we received helped us model the impact of climate risks across each of the three scenarios.
This analysis covered most of our balance sheet assets across Retail Banking and CCB.
After analysing the outputs, we defined more than 60 strategic management actions that we could take in relation to each scenario to mitigate the impact of climate change on our portfolios.
In January 2022, the BoE requested participants to perform a qualitative follow-up exercise.
The questions requested a qualitative, high-level sizing of potential loan book changes that might arise by 2050 from management actions and opportunities.
| | | | | |
| CBES scenario | Scenario characteristics |
| Early Action (Orderly) | – Assumes early and decisive action immediately in 2021 and is sufficient to limit global average temperature increases to below 2°C, in line with Paris Agreement – Carbon prices increase steadily from 2021 to 2050 and global CO2 emissions reach net zero around 2050 – This scenario has the least transition and physical risk. |
| Late Action (Disorderly) | –Like the early action, this scenario assumes policy action will suffice to successfully limit warming to under 2°C by 2100 – Action to address climate change is delayed by ten years to 2030. Carbon prices undergo a steeper increase – Physical risks rise quicker than in the early action scenario and transition risks are also higher. |
| No Additional Action | –This scenario explores what may happen if there are no further climate policies introduced beyond those already in place in 2021 – This results in limited technological transition and the climate target is not met – Global average temperature increases substantially by 2080 – This scenario tests resilience to both chronic changes in weather and more frequent and extreme weather events – There are limited transition risks, but more severe physical risks. |
European Central Bank stress testing
This was a constrained bottom-up stress test. It required participants to provide data and projections for different climate risk scenarios following a common methodology. The five climate risk scenarios tested were largely based on the outputs of the Phase II Network for Greening the Financial System (NGFS) models (released in June 2021). The exercise did not test capital adequacy similar to traditional stress tests.
There were a number of differences between the ECB stress test and the conventional UK PRA regulatory stress test and the CBES. The ECB test provided an additional scenario to help our analysis and magnify portfolio vulnerabilities, which can then be assessed.
Under the ECB stress test, we only needed to consider the transition risks of climate change on our mortgage and corporate books. Climate-related physical risks were out of scope.
| | | | | |
| ECB scenario | Scenario characteristics |
| Short term disorderly | –Three-year disorderly transition triggered by a sharp increase in the price of carbon emissions –Identifying potential vulnerabilities connected to a severe but plausible disorderly transition due to unexpected measures taken to reduce carbon emissions in the short term –Inspired by the increase in carbon price needed in the NGFS disorderly transition scenario to achieve the Paris Agreement targets to limits global temperature rise to 2°C. |
| Long term orderly | –30-year scenario which explored early and decisive action to reduce global emissions in a gradual way –Clearly signposted government policies implemented relatively smoothly –Actions are sufficient to limit global average temperature increases to below 2°C by 2050. |
| Long term disorderly | –30-year scenario where action to address climate change is delayed to 2030 –Due to the rapid transition needed, a deeper adjustment is required –Steeper increase in global carbon prices in a late attempt to meet the climate target of net zero by 2050. |
| Long term hot house | –Governments fail to introduce policies to address climate change other than those already announced –Companies and consumers do not change their behaviour to reduce emissions. The transition to a low-carbon economy does not take place, so transition risks are very low or not existent –Emissions gradually decline in this scenario, although they continue to grow until 2080, leading to around 3°C of warming. |
| | | | | | | | | | | | | | |
| Annual Report 2022 | Santander UK Group Holdings plc 51 |
| | | | | | | | | | | | | | | | | | | | | | | | | | | | | | | | | | | | | | | | | |
| Strategic Report | Sustainability and Responsible Banking | Governance | Risk review | Financial review | Financial
statements | Shareholder
information |
| | | | | | | | | | | | | |
| | | | | | | | | | | | | |
Climate Internal Scenario Analysis (CISA)
In 2022 we developed a CISA to help understand better the potential impact of climate change on our business portfolios and balance sheet.
We generated three qualitative scenarios for climate-related risks. We also quantified potential losses from an early disorderly transition, for example linked to the current energy crisis and conflict in Ukraine.
The CISA outputs will form the basis of our 2022 ICAAP for climate risk. This will help to show if we need to hold more capital for climate-related risk and help us prioritise our actions for the next five years.
We developed the CISA in three phases:
–Phase 1 defined climate change scenarios and explored their potential impact. At the end of Phase 1, we selected the scenario to quantify in Phase 2
–Phase 2 assessed the chosen scenario for its economic impact on the balance sheet and modelled potential losses
–Phase 3 reviewed and finalised the results, including applying expert judgement. It added a sensitivity analysis and extended the time frame from 5 to 30 years.
The impacts assessed through the CISA include:
–Impact on house prices from climate change and interest rates on mortgages
–Possible consequences of policies that promote rapid transition and require retrofits and upgrades to improve energy efficiency. This takes into account any grants towards upgrade grants
–Impact on household finances from higher energy costs and taking account of customers whose homes have lower EPC scores
–Sectoral analysis of the financial impact of transition risks. This includes EPC improvements, moving to renewable energy sources, reducing Scope 1 to 3 emissions, and progressing sustainability plans.
| | | | | |
| CISA scenario | Scenario characteristics |
| Accelerated transition | –Immediate and disorderly transition where geopolitical tension creates uncertainty over global energy market supply chains –This creates an emphasis on domestic energy security where the government funds an accelerated transition to renewable energy supplies. For example, grants to assist with a mass rollout of electric heat pumps, electric vehicles and renewable energy sources, such as offshore wind, which reduces the reliance on Russian energy. |
| Cost-sensitive transition | –A steady state scenario where real income growth continues its weak trend and energy transition continues in a cost sensitive way –Stable energy markets, and cheaper wholesale prices, keep gas in the energy mix –Private investment is expected to provide the bulk of the funding, with the government reluctant to directly pass-on infrastructure investment costs to the public. |
| De-prioritised transition | –Energy transition becomes more expensive due to geopolitical fragmentation and superpower competition –Climate action is de-prioritised until 2030, permanently slowing transition in Europe. |
Outcomes of Scenario analysis
The CBES assessment was performed against long-term scenarios and a static balance sheet. This provided valuable understanding of modelling capabilities and development. However, it provided only limited insight into potential credit risk exposures that could be reflected in our provisioning assessments or credit decisions.
Through CBES and CBES 2, a set of management actions were defined to further explore portfolio risks and opportunities. This included identifying the need to perform a shorter-term scenario analysis on our balance sheet (CISA) and set out modelling capability enhancements (CISA Development Programme). These stress tests help us to understand our exposure and sensitivity to climate-related transition and physical risks in our loan book.
We used our CISA 2022 results to inform provisioning assessments against the modelled accelerated disorderly transition scenario. The range of losses over the 5-year horizon peaks at c.£1.2bn driven mainly by the economic scenario rather than climate factors. This loss estimate falls in the range of our IFRS 9 Expected Credit Loss scenarios, as described in the Risk Review, so no further provision is deemed necessary.
Evolving our approach to climate risk assessment
We have reflected on the learnings from our scenario analysis exercises. We are working on an end-to-end assessment of the capabilities we need for our climate scenario analysis, such as:
–Scenario generation – making sure we look at plausible, coherent and timely scenarios
–Establishing economic parameters – considering how economics may evolve due to policy changes or physical risk impacts
–Credit decisioning results – ensuring that decisions we make are simple, personal and fair
–Disclosures – the different regulatory data we need to report for transparency
–Governance – how we ensure decisions are taken at the correct management levels.
We are also upgrading our systems to capture more data that will improve our climate scenario modelling capabilities.
Client engagement
The CBES gave us an opportunity to reach out to customers to discover their adaptation plans for climate-related risk. This helped us identify how we can support them to accelerate their transition to net zero.
Data strategy
Both regulatory exercises required us to gather data from external sources for our models. This learning allowed us to plan how to collate data for future exercises by engaging with clients, using proxy methodologies and external sources.
Modelling development
We expect scenario analysis to increase and the models needed to identify climate risk will need to evolve. This allowed us to explore developments to our scenario analysis operating model and to reflect longer-term horizons.
Business strategy
The stress tests allowed us to consider and prioritise the actions we would take and build this into our strategy planning processes.
Increasing understanding on climate risk
We are assessing our capacity to comply with new and evolving regulations that can affect credit risk policies and procedures. This led to initiatives to increase our awareness of regulatory risks and horizon planning. We plan to focus on the physical risks that can affect our balance sheet, especially our large mortgage portfolio.
| | | | | | | | | | | | | | |
| Annual Report 2022 | Santander UK Group Holdings plc 52 |
| | | | | | | | | | | | | | | | | | | | | | | | | | | | | | | | | | | | | | | | | |
| Strategic Report | Sustainability and Responsible Banking | Governance | Risk review | Financial review | Financial
statements | Shareholder
information |
| | | | | | | | | | | | | |
| | | | | | | | | | | | | |
Metrics and targets
Our Climate Change strategy sets out medium-term metrics and targets across the business. These measure our performance and underpin our progress against the climate change agenda. They form part of our SRB medium-term scorecard.
Our targets are ambitious and the initiatives we put in place are in their early stages. We expect them to accelerate in the next few years. We are working on additional targets in the other pillars of our Climate Change strategy that will help us achieve our overall climate change goal of net zero by 2050.
We will conduct a review of metrics and targets in 2023 to ensure they continue to be fit for purpose in meeting our sustainability priorities. We also set out details of our operational GHG emissions (Scope 1, 2 and 3) in this section.
Santander UK medium-term climate change targets and 2022 performance | | | | | | | | | | | | | | | | | | | | |
| Metric | Performance | 2025 Target | Climate-related risk or opportunity | Looking ahead |
| in 2022 | to date |
| Climate Change strategy pillar: Managing climate risk |
| 1 | Decarbonisation targets (sector-specific emission intensity) | In 2022, we continued to measure and assess our financed emissions for our material sectors | | | Addressing transition risks (for example, government policies such as phasing out sales of new internal combustion engine vehicles from 2030) | Status: ☐ We continue to work on assessing financed emissions. We will take into consideration our own initiatives and what Government policies can enable decarbonisation when setting our targets. We aim to meet Banco Santander's disclosure commitment made under the NZBA for 2024. |
| Climate Change strategy pillar: Supporting our customers |
| 1 | Volume of green finance raised and facilitated1 | £6.5bn
Commentary:
This target includes our commitment to support the renewable energy sector and we are on track on meeting the target set | £10.5bn | £20bn | Opportunity to provide sector leading sustainable and green finance products to support customers develop climate-resilient business models | Status: ☐ In Homes, we are looking to develop our green finance proposition to support existing and new customers in making their homes more energy efficient. We are exploring partnerships with firms involved in either the supply or installation of energy efficiency retrofitting. |
| 2 | Number of mortgage customers with properties that have an EPC rating of D or below communicated with to improve the efficiency of their homes2 | 807,383 customers
Commentary:
Our Greener Homes Hub has recorded more than 40,000 unique visits since launch, and we reached out to 2 million customers via e-mail | 811,034 | 1.3m | Addressing transition risks for homeowners in properties with low energy efficiency ratings | Status: ☐ Our Greener Homes Hub helped customers access our free EnergyFact Report, which provides insight on home energy efficiency. We are working on the customer journey for energy efficiency retrofitting over the next 12 months. Our focus is on supporting customers and aiming to de-risk retrofitting to enable more customers to reduce carbon emissions from their homes. |
| 3 | Number of customers supported with products and services in their transition to net zero3 | 32,968 customers
Commentary: Our auto loans have provided over 25,000 customers with access to electric and hybrid vehicles. Over 11,000 mortgage customers have benefited from our free EnergyFact Report since its launch in 2021. The report has since been made available to all customers to provide the benefit of free insights on their home energy efficiency. | 32,968 | 180,000 | Supporting customers in building resilience to manage transition and physical risks through dedicated financing | Status: ☐ In Homes, we will continue to focus on our retrofitting strategy and developing our product offerings tailored to customer needs. EnergyFact reports have proved to be a continued success and we will continue to offer these to existing customers. During Q4 2022, CCB set out to upskill its colleagues by launching the educational platform Sustainability Unlocked. This will help enhance the quality of conversations with clients to support their transition to net zero. We continue to improve our services and products to enable clients to meet the climate change challenges. |
| Climate Change strategy pillar: reducing emissions in our own operations |
| 1 | Reduction of waste (e.g., single-use plastics) | Introduced a new sustainable cleaning system to a number of our properties | | | Implementing the latest operational sustainability standards to reduce costs | Status: ☐ In 2023, we will continue to rollout the new cleaning systems to the whole of the Santander UK estate and monitor its impact on waste generation.
|
☐ Initiative is on track ☐ Initiative is to be accelerated
1 using Banco Santander’s SFCS, green finance includes lending to renewable energy and other green energy financing, mortgages on properties with A- or B- rated EPCs and financing for vehicles with emissions of 50g CO2/ km or less
2 We measure the number of emails received and opened by customers and customer journeys made on the Greener Homes Hub
3 Some customers who received the EnergyFact report may be subset of the customers reported under metric 2
| | | | | | | | | | | | | | |
| Annual Report 2022 | Santander UK Group Holdings plc 53 |
| | | | | | | | | | | | | | | | | | | | | | | | | | | | | | | | | | | | | | | | | |
| Strategic Report | Sustainability and Responsible Banking | Governance | Risk review | Financial review | Financial
statements | Shareholder
information |
| | | | | | | | | | | | | |
| | | | | | | | | | | | | |
Aligning our lending portfolios to net zero
We are committed to aligning our operational emissions and financed emissions caused through our lending activities to net zero by 2050. We recognise the importance of setting interim targets that measure and track our performance against this ambition.
The Partnership for Carbon Accounting Financials (PCAF) is a global partnership of financial institutions that develops and implements a harmonized approach to assessing and disclosing GHG emissions associated with loan and investment portfolios. In November 2020, PCAF released a Global GHG Standard for the financial industry. We joined PCAF in 2021 to contribute to the ongoing development and application of its standards.
The PCAF GHG Standard covers seven asset classes, including our three most significant sector exposures – mortgages, consumer finance and commercial real estate. We use the Standard to calculate our baseline financed emissions for these three material sectors. Emissions are attributed based on our exposure, such as the outstanding loan amount divided by the value of the property or vehicle.
In 2021, our Climate Leadership Group approved the approach to calculating attributed baseline financed emissions (on an absolute and intensity basis). In 2022, we continued to follow the roadmaps we developed in 2021 for establishing the baseline of financed emissions for residential mortgages and auto lending. Together these represent around 88% of our lending activities.
The quality of data available for these calculations is reflected in PCAF data quality scores, with the aim to improve data quality and collection process over time. Using the baseline, we will work to determine suitable 2030 targets and plans by assessing suitable transition pathways. Part of target setting involves assessing the likelihood of market levers to decarbonise the sector. This includes public policies, and internal levers such as our own commercial opportunities.
In 2023, we will continue to work on assessing our financed emissions and establishing interim targets. We will consider key enablers, including Government Policy as well as our own actions to accelerate the decarbonisation. We will integrate the results of this process into our overall commercial strategies and climate change risk management process. We aim to publish results of our portfolio alignment exercise and decarbonisation plans in line with Banco Santander's commitment to NZBA in 2024. We also recognise the challenges in obtaining accurate and qualitative data for our lending books in this process.
Exposure to climate-related risk across sectors
Retail Banking - Homes
We are rapidly expanding our understanding of climate-related risks to our balance sheet, of which residential mortgages lending is our most significant portfolio. We have completed a review of both the physical and transition risks of climate change to our residential mortgage portfolio.
Energy efficiency profile of our residential mortgage book (transition climate risk)
As part of the 'Supporting our customers' pillar of our Climate Change strategy, we have set targets for providing green finance to support residential mortgage customers to make their homes more energy efficient.
The UK Government is currently consulting on proposals to require mortgage lenders to disclose the energy performance of their property portfolio. This includes an introduction of voluntary targets to improve portfolio energy performance to an average of EPC band C by 2035. To improve this we have been developing initiatives to help our customers understand their homes' energy efficiency and offer finance to make improvements.
In 2022 the percentage of A-C rated energy efficient properties on our mortgage book increased to 40%. This was due to strong new lending to A-C rated homes in the year as well as an improvement in the availability of EPC data.
EPC ratings (A-G) for residential mortgages as a percentage of the total number of mortgages where an EPC is recorded for 2022 and 20211: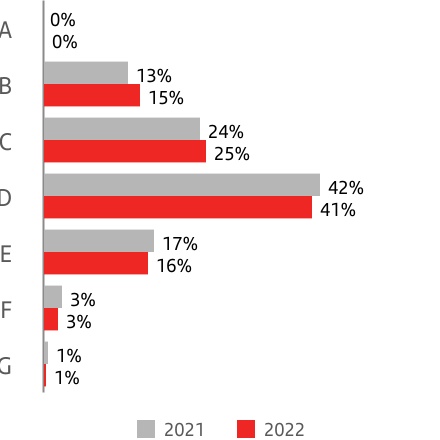 Note: Sourced from Landmark. Distribution of registered EPCs.
 2022 distribution including modelled EPCs: A:<1%,B:11%, C:22%, D: 50%, E: 15%, F: 2% and G:<1%
1 For EPC data, we are using data provided by the UK Government and other third parties. Reasonable efforts have been made to ensure such data is complete and accurate. There are some known data quality issues across the process and reasonable efforts have been made to ensure disclosures are materially correct.
Regional distribution of EPC ratings (A - B) 2022: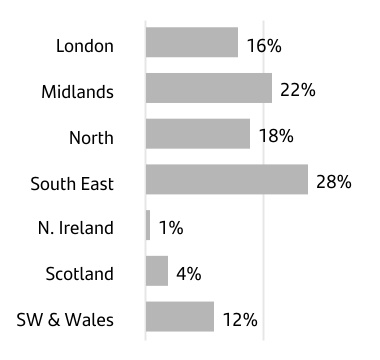
Note: Sourced from Landmark. Distribution of registered EPCs.
2022 distribution including modelled EPCs: LDN: 16%, ML :21%, NO:18%, SE:29%, NIRE:2%, SCOT:4%, SW&W:11%
Notes on EPC and flood risk data and assumptions
EPC data for our residential mortgage portfolio is provided by Landmark who source the data from the central EPC registers for the three UK jurisdictions, England and Wales, Scotland and Northern Ireland. Where a property does not have an actual EPC rating Landmark infers energy efficiency using its own proprietary model or by reference to EPC ratings in the same postcode area.
EPC data for England and Wales is currently the highest quality in terms of its recency and availability. In 2022, English and Welsh properties represented 91% of our mortgage portfolio. Around 71% of the portfolio across all jurisdictions currently has a registered EPC. Landmark provides an estimate of current flood risk and 50-year forecasts using four climate change scenarios. The presented figures show the current annual flood risk for all mortgage accounts open at 31 December 2022. Flood risk estimates are based on the likelihood of winter precipitation exceeding 6mm per day and consider coastal, river and pluvial flooding.
| | | | | | | | | | | | | | |
| Annual Report 2022 | Santander UK Group Holdings plc 54 |
| | | | | | | | | | | | | | | | | | | | | | | | | | | | | | | | | | | | | | | | | |
| Strategic Report | Sustainability and Responsible Banking | Governance | Risk review | Financial review | Financial
statements | Shareholder
information |
| | | | | | | | | | | | | |
| | | | | | | | | | | | | |
Flood risk (physical climate risk)
Flooding is the most visible physical risk to our mortgage portfolio. Working with postcode-level data we have assessed the flood risk for every Santander UK mortgage. Almost 95% of our mortgage lending is on properties with negligible or very low risk of flooding (see table).
Flood risk probability is expressed as a ratio, where a 1 in 30-year flood event (1:30) refers to the likelihood of flooding occurring in a given year. The table shows the current annual flood risk for all mortgage accounts open at 31 December 2022.
As part of our risk management process, we regularly review the value of our portfolio against the physical impacts of climate change. We provide more details on this in our Credit Risk section in the Risk Review of this Annual Report. There was no material change in flood risk across the portfolio in 2022 compared to 2021.
Consumer Finance
In Consumer Finance, the main transitional risk is the phase-out of internal combustion engine vehicles. The transition to electric vehicles may impact the demand for auto loans and the residual value of automotive vehicles. The division continues to monitor these risks.
Corporate & Commercial Banking
Carbon-intensive sectors
We are committed to providing financial products and/or services to business activities that are environmentally and socially responsible. Our strategy to grow our green finance activities supports this ambition.
The ESCC Risk Management policy sets out Santander’s criteria for the identification, assessment, monitoring and management of environmental and social risks and other climate change related activities. The policy is fully integrated within our risk management and lending decision-making processes. It prohibits direct new investment in, and/or providing financial services to specific projects or activities across key sectors that are considered harmful for the environment. It is aligned to and must be applied in conjunction with Banco Santander’s Sustainability and Human Rights policies. This policy covers activities within the oil and gas, power generation and mining and metals sectors and those arising from businesses engaged in soft commodities. We define fossil fuel exposure as counterparty activities that are engaged in those sectors.
In 2022, our corporate lending exposure to sectors1 that are considered to contribute most to climate change remained relatively low. Lending to mining represented 0.4% of our total non-financial corporate exposure.
| | | | | | | | | | | | | | |
| Flood risk for residential mortgages | 2022 | 2021 |
| Annual Probability Band | Number of properties | % of properties | Number of properties | % of properties |
| High: >1:30 | 2,975 | | 0.2 | % | 2,963 | | 0.2 | % |
| Medium: between 1:30 and 1:100 | 9,814 | | 1 | % | 10,039 | | 1 | % |
| Low: between 1:100 and 1:1,000 | 51,778 | | 4 | % | 50,009 | | 4 | % |
| Very Low: between 1:1,000 and 1:10,000 | 69,234 | | 6 | % | 73,893 | | 6 | % |
| Negligible: <1:10,000 | 1,084,755 | | 89 | % | 1,077,821 | | 89 | % |
| Total | 1,218,556 | | 100 | % | 1,214,725 | | 100 | % |
| | | | |
| Regional risk exposure in % of total number of properties (high and med flood risk, properties with EPCs E-F) |
| | | | | | | | |
| Overview of exposures to carbon-intensive sectors |
| Credit exposure |
| 2022 balance (£m) | %(*) |
| Real estate activities | 8,469 | 47.4 | % |
| Accommodation and food service activities | 1,345 | 7.5 | % |
Wholesale and retail trade(1) | 1,341 | 7.5 | % |
Construction(2) | 1,073 | 6.0 | % |
Manufacturing(3) | 752 | 4.2 | % |
| Information and communication | 379 | 2.1 | % |
| Electricity, gas and steam supply | 268 | 1.5 | % |
Transport and storage(4) | 241 | 1.3 | % |
| Agriculture | 125 | 0.7 | % |
| Water supply | 95 | 0.5 | % |
Mining and quarrying(5) | 64 | 0.4 | % |
1 We set our classification of carbon-intensive or climate-relevant sectors in line with EBA's technical standards on prudential disclosures on ESG risks in accordance to Article 449a CRR (Pillar 3), which follows the Statistical Classification of Economic Activities in the European Community (commonly referred to "NACE" for "Nomenclature statistique des activités économiques dans la Communauté européenne").
(*) Percentage of Santander UK's total credit exposure to non-financial corporates of £17.9bn in 2022
(1) includes wholesale and trade of motor vehicles and motorcycles, parts and accessories. (2) includes construction of buildings and civil engineering activities. (3) includes manufacturing and processing of food products. (4) includes transport by road, rail and air and passenger transport. (5) includes mining and extraction activities of crude petroleum, coal, natural gas, metals.
| | | | | | | | | | | | | | |
| Annual Report 2022 | Santander UK Group Holdings plc 55 |
| | | | | | | | | | | | | | | | | | | | | | | | | | | | | | | | | | | | | | | | | |
| Strategic Report | Sustainability and Responsible Banking | Governance | Risk review | Financial review | Financial
statements | Shareholder
information |
| | | | | | | | | | | | | |
| | | | | | | | | | | | | |
Environmental performance
| | | | | | | | | | | |
| 2022 performance |
| | | |
| (19)% | (13)% | (18)% |
| Water consumed | Energy consumed | Waste collected |
| 2022: 107,719m3 (2021: 133,663 m3 ) | 2022: 103 million kWh (2021: 119 million kWh) | 2022: 1,910 tonnes (2021: 2,315 tonnes) |
| | | |
| (62)% | 99.7% | 99.8% |
| Paper consumed | Renewable electricity | Waste diverted from landfill |
| 2022: 331 tonnes (2021: 879 tonnes) | | 2021: 99.8% |
| | | |
Consumption of water and paper, waste collected and diverted not including Santander Financial Services plc
The figures above are in addition to our reporting of GHG emissions, paper, electricity consumption and waste in our ESG supplement. More details on our methodology for measuring performance data can be found in the same report.
As per our Streamlined Energy and Carbon Reporting (SECR) in 2022 (see the Ethics and Climate section in this report), we used 103,156,234 kWh of energy, compared to the 119,562,413 kWh used in 2021, and emitted 5,761 tCO2e market-based greenhouse gas emissions, compared to 6,321 tCO2e in 2021. The market-based approach reflects the emissions from the electricity purchased and this electricity is generated via green energy sources. A rise of 53 tCO2e of Scope 2 market-based emissions mainly reflects the inclusion of Santander Financial Services plc (SFS) for 2022. Santander UK plc reported less than 0.5 tCO2e of market-based emissions caused by EV charging performed by colleagues. Emissions per employee fell in 2022 to 0.31 tCO2e/FTE compared to 0.35 tCO2e/FTE in 2021.
Our total Scope 1, 2 and 3 emissions for 2022 were as follows:
| | | | | | | | | | | |
| 2022 | 2021 | 2020 |
Scope 1 tCO2e | 4,512 | | 6,074 | | 5,937 | |
Scope 2 tCO2e (Location-based) | 15,624 | | 18,860 | | 22,014 | |
Scope 2 tCO2e (Market-based) | 53 | | — | | — | |
Scope 3 tCO2e (Business travel) | 1,196 | | 247 | | 515 | |
| Total | 5,761 | | 6,321 | | 6,452 | |
| YoY % | (9) | % | (2) | % | |
Note: 2021 and 2020 figures exclude Santander Financial Services plc emissions, which for 2022 were less than 2% of total emissions and considered not material to be included in 2021 and 2020.
Additional notes on Scope 1 -3 GHG emissions
Boundary
The Scope 1-3 GHG emissions include the activities and facilities owned and/or under operational control of Santander UK Group Holdings plc.
Calculation
Scope 1: GHG emissions from oil, gas, direct transport and fugitive gas emissions. They exclude emissions related to colleagues working from home. Energy consumption and transport data is extracted from relevant internal systems and records, including bill validation systems, meter readings and internal travel systems.
Emissions for gas, oil, direct travel and fugitive gases are calculated using the GHG Protocol Corporate Standard using the relevant UK BEIS conversion factors. There were no Scope 1 emissions reported for SFS.
Scope 2: GHG emissions from purchased electricity (and electric fleet/company cars). We used for Santander UK plc the ‘market-based’ approach to quantify our emissions, meaning we use emissions factors provided by our electricity suppliers. 100% of Santander UK plc’s electricity is purchased from renewable sources (including solar and wind) via green tariffs and results in zero carbon emissions when using the market-based approach. The data for electricity consumption and electric fleet/cars are extracted from relevant source systems, such as billing invoices, mileage claims and maintenance records. Indirect emissions are calculated using the relevant UK BEIS conversion factors and guidance. We use conversion factors to convert distance travelled to CO2e emissions. Electricity purchased by SFS was from conventional energy sources.
We record Scope 2 emissions from SFS both as location-based and market-based emissions. We sourced data for SFS electricity usage from billing invoices. Where data was delayed for the year- end reporting, the average monthly electricity consumption was used to project the consumption for the remainder of the year.
Scope 3: GHG emissions are indirect emissions created through our value chain that are not included in Scope 1 and 2. For Santander UK plc 2022 data reporting includes emissions from Scope 3 category six: business travel, which includes travel by air, road and train and is not included elsewhere. Business travel records are extracted from relevant internal systems or provided by our third-party travel administrator. The distance travelled (kilometres) is converted into carbon emissions using relevant factors from the UK BEIS. For Santander UK plc business travel, conversion factors for cars are based on engine size. For flights they are based on average cabin seat class. For rail they are based on average cabin seat class and rail figures are based on national rail conversion factor from UK BEIS. We source data from mileage claims and third-party travel reports. For SFS, assumptions were made for the average distance travelled by air and rail. Further assumptions were made for the share of business and economy flights and average number of flights made per flight route. Respective UK BEIS conversion factors for short-haul flights and national rail were used to convert the total distance travelled into carbon emissions, and different factors were used for economy and business classes. Business travel data for SFS were sourced from financial records and based on expensed travel in the reporting period. Business travel for Santander UK plc and SFS excludes taxi journeys.
| | | | | | | | | | | | | | |
| Annual Report 2022 | Santander UK Group Holdings plc 56 |
| | | | | | | | | | | | | | | | | | | | | | | | | | | | | | | | | | | | | | | | | |
| Strategic Report | Sustainability and Responsible Banking | Governance | Risk review | Financial review | Financial
statements | Shareholder
information |
| | | | | | | | | | | | | |
| | | | | | | | | | | | | |
| | | | | | | | | | | |
| Governance | | | |
| | | |
| | | |
| | | |
| | | |
| Our governance | | Contents | |
The UK Corporate Governance Code 2018 (the Code) sets out the framework for premium listed companies in the UK. Although the Company does not have premium listed shares on the London Stock Exchange, compliance with the Code is appropriate for a Company of our size and systemic importance to the UK economy. This Governance section details how the Company has applied and complied with the principles and provisions of the Code. Any principles and provisions of the Code that are not complied with are detailed in the Directors' Report. | | | |
| Governance | |
| Corporate Governance report | |
| Chair's report on corporate governance | |
| Board Nomination Committee Chair's report | |
| Board Risk Committee Chair's report | |
| Board Audit Committee Chair's report | |
| Board Responsible Banking Committee Chair's report | |
| | Directors' Remuneration report | |
| | Board Remuneration Committee Chair's report | |
| Remuneration policy report | |
| Remuneration implementation report | |
| Directors' report | |
| | |
| | |
| | |
| | | |
| | | |
| | | |
| | | |
| | | |
| | | |
| | | | | | | | | | | | | | |
| Annual Report 2022 | Santander UK Group Holdings plc 57 |
| | | | | | | | | | | | | | | | | | | | | | | | | | | | | | | | | | | | | | | | | |
| Strategic Report | Sustainability and Responsible Banking | Governance | Risk review | Financial review | Financial
statements | Shareholder
information |
| | | | | | | | | | | | | |
| | | | | | | | | | | | | |
| | | | | |
| Chair’s report on corporate governance |
| |
| |
Our Board and governance structure
Maintaining high standards of corporate governance is an essential element to ensure the long-term sustainable success of the Company. In addition to the UK Corporate Governance Code 2018 (the Code) (the standard against which we measure ourselves), we also have internal governance practices and rules, principally:
–The UK Group Framework, which defines clearly our responsibilities and relationship with Banco Santander SA, our shareholder, taking account of our fiduciary and regulatory responsibilities. This gives us the autonomy to discharge our responsibilities in the UK in line with best practice as an independent board while giving Banco Santander SA the oversight it needs. Clarity of roles and responsibilities is key to ensuring proper accountability for decisions and outcomes.
–The Corporate Governance Framework, which is designed to assist the Board of Directors in discharging their responsibilities and ensuring an appropriate scheme of delegation throughout the Santander UK group.
The Corporate Governance Framework is reviewed regularly by the Board to confirm that governance arrangements remain effective. The corporate governance structure is supported by the internal control and risk management systems. An important principle, applied throughout the Corporate Governance Framework, is that delegation of executive authority is to individual office holders, who may delegate aspects of their authority to others, as appropriate. Executive Committees have been established to support individuals in discharging their responsibilities.
The role and responsibilities of the Board
The Board is collectively responsible for promoting the success of Santander UK for the benefit of its stakeholders, taking into account the likely impact of their decisions in the long-term, as well as the interests of our other stakeholders and to its contribution to the wider society.
The Board’s schedule and activities are planned to make sure that Directors have regard to the matters necessary to promote the success of the Company, including the broader implications of their decisions for the Company’s stakeholders including its shareholder.
The key decisions and matters reserved for the Board's approval, such as the long-term strategy and priorities, are set out in the Corporate Governance Framework. The Board is supported by its Committees which make decisions and recommendations on matters delegated to them under the Corporate Governance Framework. This enables the Board to spend a greater proportion of its time on strategic, forward-looking matters.
Board Committees
The Committees play an essential role in supporting the Board, giving focused oversight of key areas and aspects of the business and their roles and responsibilities are set out in their Terms of Reference which are available at aboutsantander.co.uk and which do not form part of this Annual Report. The Terms of Reference are
regularly reviewed by each Committee to make sure they remain appropriate.
Each Committee comprises Non-Executive Directors (NEDs) and a Chair. Except for the Board Nomination and Board Risk Committees which have one Banco Santander Group appointed Non-Executive Director (GNED), all Board Committees are composed of Independent Non-Executive Directors (INEDs) only. The Board Remuneration Committee comprised two INEDs only in 2022. Having assessed this in light of the Code recommendations and as the substantive business of the Santander UK group is conducted by Santander UK plc, we are satisfied that the Committees will continue to be able to discharge their duties professionally, effectively and efficiently. As the Santander UK Group Holdings plc and Santander UK plc Committees meet substantively simultaneously, they also continue to have the opportunity to benefit from the broader INED group's skills and experience.
The Board Committees have each prepared a report which includes a description of their role and composition. These are presented in the sections that follow.
Board meetings in 2022
There were 11 Board meetings in 2022. Meetings of the Company were held concurrently with Santander UK plc. This model is supported by a number of ring-fencing safeguards to enable the Santander UK plc Board to operate in this way including the appointment of three ring-fenced bank Double Independent NEDs (DINEDs) (one of whom is the senior ring-fencing Director) and a Ring-Fenced Bank Risk Officer.
Regular updates are provided to the Board by the Committee Chairs, CEO, CFO, CRO and myself as Chair. I, as Chair, also held a number of meetings with the NEDs without the Executive Directors (EDs) present. There is a comprehensive and continuous agenda setting and escalation process in place to ensure that the Board has the right information at the right time and in the right format to enable the Directors to make the right decisions. As Chair, I lead the process, assisted by the CEO and Company Secretary, and this ensures that sufficient time is set aside for strategic discussions and business critical items. Together with the Committee Chairs, we ensure Board and Committee meetings are structured to facilitate open discussion, debate and challenge.
The NEDs also receive regular updates from management to give context to current issues.
How governance contributes to the delivery of our strategy
Our governance arrangements contribute to the development and delivery of our strategy in various ways, including by taking accountability and responsibility, and ensuring information flows and independent insight from the NEDs.
All Directors are collectively responsible for the success of the Company. The NEDs exercise objective judgement in respect of Board decisions, and scrutinise and challenge management constructively. They also have responsibilities concerning the integrity of financial information, internal controls and risk management.
The Board is responsible for overseeing and developing our strategy and policies, overseeing risk and corporate governance and monitoring progress towards meeting our objectives and annual plans and monitoring its implementation by the CEO, supported by his wider executive management team. In 2022, the Board regularly reviewed progress against its delivery of the three year business plan. The Board is accountable to our shareholder for the proper conduct of the business and seeks to represent the interests of all stakeholders.
The Board has identified the following key stakeholders: Customers, Employees, Regulators, Communities and Investors. More information on how the Board balance the interests of these stakeholders can be found in the Board Responsible Banking Committee Chair's report.
Views of the workforce at the Board
Our colleagues are a key stakeholder, central to the delivery of our strategy, and the Board is committed to ensuring continuous engagement with them.
As the overwhelming majority of colleagues in the Santander UK group are employed by Santander UK plc, the Board receives regular updates on the culture of the business and views of employees of Santander UK plc from engagement surveys feedback. These give the Board an understanding of the overall Santander UK group workforce and provide meaningful dialogue at Board meetings on workforce matters.
With effect from 1 March 2023, Lisa Fretwell replaced Annemarie Durbin as the designated NED representing the views of the workforce on the Company and Santander UK plc.
Board activities
I, together with the CEO and Company Secretary, and supported by the Directors and senior management, make sure that the Board has an appropriate schedule for the year. This is focused on the opportunities to drive growth and profitability of the business, transformation to support the future success of the business, business performance and risk management and customer experience and outcomes. It includes the Company's digital strategy, ensuring the Company is run in a responsible and sustainable way in the interests of its stakeholders, and ensuring that the Company’s culture is aligned with its purpose, values and strategy.
| | | | | | | | | | | | | | |
| Annual Report 2022 | Santander UK Group Holdings plc 58 |
| | | | | | | | | | | | | | | | | | | | | | | | | | | | | | | | | | | | | | | | | |
| Strategic Report | Sustainability and Responsible Banking | Governance | Risk review | Financial review | Financial
statements | Shareholder
information |
| | | | | | | | | | | | | |
| | | | | | | | | | | | | |
| | | | | |
| Chair’s report on corporate governance continued |
| |
| |
The Board ensures regular contact with management and colleagues through a number of means. These include inviting relevant business and function heads to present to the Board or its Committees on latest developments; permitting observers as part of individual senior managers’ development plans; scheduling regular meetings for Committee Chairs to meet with relevant senior managers; site visits by one or more NEDs; and topical or technical workshops. Senior leaders are also available to the NEDs for advice and support.
The Board regularly monitors progress against the strategic priorities and performance targets of the business, and in 2022, once again held a separate Board Strategy Day. In advance of the Board Strategy Day, a workshop was held focused on disruption by Fintechs and Neobanks, which was designed to set the scene for the discussions on how and where we want to grow and invest, in the context of an evolving competitive landscape. Presentations at the Board Strategy Day considered the current macro environment, discussing potential changes to the Employee Value Proposition (including the future 'Ways of Working'), before the Board considered and explored opportunities to further grow the business. The day concluded with a presentation by the CEO on potential investments and the financial impact, recognising the trade off between returns and market share/revenue growth.
In 2022, the Board and its Committees received deep dives on a number of areas (e.g. Consumer Duty, Climate Change and ILAAP) and externally facilitated workshops to consider important topics in depth and to engage with key stakeholders. To ensure the most effective use of the time at Board meetings, in addition to the delegation of certain responsibilities to the Board Committees, held informal discussions with Board members. The INEDs also met on several occasions without management and once without me present to assess my performance.
More details of the Board activities in 2022 are set out at the end of this report.
Culture
The Board recognises the importance of culture, as a mechanism to support the long-term sustainable success of the Company. The Board are responsible for setting and overseeing our culture and values as well as monitoring progress on its development. The Board are committed to creating a culture of inclusivity and belonging, as well as creating a healthy culture environment. Throughout the year the Board has received feedback on our culture via a number of mechanisms including engagement with the workforce directly and through the NED chosen to represent the views of the workforce, as well as receiving reports from colleague surveys considering matters including future ways of working and wellbeing. The Board also seeks to ensure that workforce policies and practices are consistent with the Company's values and supports its long-term sustainable success.
Board responsibilities
As Chair, I have overall responsibility for the leadership of the Board and for ensuring its effectiveness in all aspects of its operation. These responsibilities are formalised in the Corporate Governance Framework.
The composition of the Board helps to ensure that no one individual or small group of individuals dominates the Board's decision-making. The diversity of skills, experience and background on the Board enables the Board to provide constructive challenge and strategic guidance and to offer specialist advice. There is a clear division of responsibilities between the leadership of the Board and the executive leadership of the business. The responsibilities of the Chair, CEO, SID and NEDs and all Board Committees are agreed by the Board and set out in writing (as part of the Corporate Governance Framework) and are publicly available on our website at www.aboutsantander.co.uk, which does not form part of this Annual Report.
Board membership
At 31 December 2022, the Board of Santander UK Group Holdings plc consisted of the Chair (independent on appointment), three INEDs, two EDs and two GNEDs. The Santander UK plc Board, at 31 December 2022, consisted of the Chair (independent on appointment), six INEDs, two EDs and three GNEDs.
The Board's composition does not comply with the Code because our shareholder requires at least half the Board, including the Chair, to be independent unlike the Code which requires at least half the Board, excluding the Chair, to be independent.
Biographies of the Directors are set out in the Shareholders information section of this Annual Report. A record of Directors who served in the year is shown in the Directors' Report. The letters of appointment for INEDs and GNEDs are available at the Company’s registered office and at the Annual General Meeting.
Through the Board Nomination Committee, we make sure there is the right mix of individuals on the Board, giving an appropriate balance of knowledge, skills, experience and perspectives. Our aim of ensuring orderly succession for Board positions is supported by continuous and proactive processes. We take into account our strategic priorities and the main trends and factors affecting the sustainability and success of the business. We oversee and regularly review the development of a diverse pipeline for succession.
Changes to Board membership are set out in the Directors' report. In 2022, we appointed Mike Regnier as CEO (following Nathan Bostock's departure on 1 April 2022) and Lisa Fretwell as an INED, effective from 1 January 2022. These appointees have valuable skills and experience of financial services, digital, strategy and transformation.
All aspects of diversity form part of our Board succession planning process. For more, see the Board Nomination Committee Chair's report.
Board attendance
The Directors’ attendance at the Board meetings held in the year is set out below. Meetings of the Board are generally held concurrently with the Santander UK plc Board, with business specific to each company identified and recorded as appropriate, reflecting the decisions taken by the Board of the relevant entity.
| | | | | | | | | | | |
| | Scheduled meetings attended | Ad hoc meetings attended |
| Chair | William Vereker | 8/8 | 3/3 |
| | | |
| Independent Non-Executive Directors | Lisa Fretwell 1 | 8/8 | 3/3 |
| Ed Giera | 8/8 | 3/3 |
| Chris Jones | 8/8 | 3/3 |
| Banco Santander Group nominated Non-Executive Directors | Antonio Simoes | 8/8 | 2/3 |
Pamela Walkden | 8/8 | 3/3 |
| Executive Directors | Nathan Bostock 2 | 2/2 | 2/2 |
| Duke Dayal | 8/8 | 3/3 |
Mike Regnier 3 | 6/6 | 1/1 |
| | | | | |
| 1 | Lisa Fretwell was appointed on 1 January 2022 |
| 2 | Nathan Bostock resigned on 1 April 2022 |
| 3 | Mike Regnier was appointed on 1 April 2022 |
| | | | | | | | | | | | | | |
| Annual Report 2022 | Santander UK Group Holdings plc 59 |
| | | | | | | | | | | | | | | | | | | | | | | | | | | | | | | | | | | | | | | | | |
| Strategic Report | Sustainability and Responsible Banking | Governance | Risk review | Financial review | Financial
statements | Shareholder
information |
| | | | | | | | | | | | | |
| | | | | | | | | | | | | |
| | | | | |
| Chair’s report on corporate governance continued |
| |
| |
Monitoring independence
The Board Nomination Committee monitors whether there are relationships or circumstances which may affect a Director's independence, and have concluded that all NEDs are independent in character and judgement. I, as Chair, was independent on appointment when assessed against the circumstances set out in Provision 10 of the Code. No INEDs have a material relationship with the Company nor receive additional remuneration to Directors' fees. In addition, no INEDs serve as Directors of any external companies or affiliates in which any other Director is also a Director.
Monitoring Director time commitment, interests and fees
The Board Nomination Committee is responsible for oversight of Conflicts of Interest.
Each Director has a duty under the Companies Act 2006 to avoid a situation in which they have or may have, a direct or indirect interest that conflicts, or may conflict, with the interests of the Company. This duty is in addition to the existing duty Directors owe to the Company to disclose to the Board any interest in a transaction or arrangement under consideration by the Company.
In 2022, the Board Nomination Committee continued to review the time commitment and Directors' potential conflicts of interest to ensure that any such conflicts are managed appropriately and in compliance with CRD IV and ring-fencing requirements. In accordance with Provision 15 of the Code, Directors are required to seek prior approval from the Board before taking up external appointments.
External appointments are disclosed to the Board, before appointment, with an indication of time involved. All directors continue to devote sufficient time to their roles at the Company. No significant external appointments were undertaken by any Directors. The Articles of Association contain provisions that allow the Board to consider and, if it sees fit, authorise situational conflicts.
These powers have operated effectively and the formal system for Directors to declare their interests and for the non-conflicted Directors to authorise situational conflicts continues to be in place. Any authorisations given are recorded by the Company Secretary and Directors are asked to certify, on an annual basis, that the information in the register is correct.
The level of fees paid to INEDs for Board and Board Committee chair and membership were unchanged in 2022, although, following a review, it was decided to pay fees for some of the director responsibilities which had previously not been remunerated. For more, see the Remuneration Implementation Report.
The right information and support
The Chair, supported by the Company Secretary, ensures that all Board members receive appropriate and timely information. All Directors have access to the advice of the Company Secretary and the Company provides access, at its expense, to the services of independent professional advisers in order to help the Directors discharge their role. This also applies to Board Committees.
Board composition
Ensuring the right balance of skills, experience, independence and knowledge on the Board is the responsibility of the Board Nomination Committee. For more, see the Board Nomination Committee Chair's report.
Succession Planning
The Board Nomination Committee is responsible for ensuring plans are in place for orderly succession to both Board and senior management positions, and oversees the development of a diverse pipeline for succession. For more, see the Board Nomination Committee Chair's report.
Board and Committees' evaluation
The annual evaluation, which is typically facilitated externally at least once every three years, highlights areas of further development to enable the Board to continuously improve its performance.
I, as Chair of the Board, with the support of the Board Nomination Committee, lead the Board in considering and responding to the annual review of the Board and Committees' effectiveness, including the performance of individual Directors. In 2022, I asked the Company Secretary to undertake an internally facilitated review of the effectiveness of the Board and Board Committees.
In addition, in 2022, the Board continued to monitor progress against actions for the 2021 externally facilitated review of Board effectiveness.
For more, see the Board Nomination Committee Chair's report.
Director induction and training
The Company Secretary supports the Chair in designing individual inductions for NEDs, which include site visits and cover topics like strategy, balance sheet and capital, key risks and current issues including the legal and regulatory landscape.
Directors who take on new roles or change roles in the year (such as becoming a member of a new Board Committee) attend induction or handover meetings as appropriate. Committee Chairs, with the Committee secretaries, agree Committee specific training, as appropriate. Directors are also given the opportunity to undertake further training so that they are fully comfortable with their role on the Board and to enable them to contribute to the long-term success of the Company. For more, see the Board Nomination Committee Chair's report.
Group structure and ring-fencing governance arrangements
The substantive business of the Santander UK group continues to be conducted by Santander UK plc, our principal ring-fenced bank (RFB). Ring-fenced banks operate within governance rules defined and overseen by the PRA who have granted Santander UK plc certain ring-fencing governance rule modifications, subject to various safeguards. This allows for certain overlaps of the Board and senior management of Santander UK Group Holdings plc and Santander UK plc, recognising our ownership structure and chosen ring-fencing business model.
At 31 December 2022, the three DINEDs of Santander UK plc were Annemarie Durbin, Mark Lewis and Nicky Morgan. In addition, Annemarie Durbin acts as the SRD of Santander UK plc.
Appointment and retirement of Directors
The Company's Articles of Association require each Director to retire every year at the Annual General Meeting and any Director may offer themselves for re-election by members. For more, see the Directors’ report.
| | | | | | | | | | | | | | |
| Annual Report 2022 | Santander UK Group Holdings plc 60 |
| | | | | | | | | | | | | | | | | | | | | | | | | | | | | | | | | | | | | | | | | |
| Strategic Report | Sustainability and Responsible Banking | Governance | Risk review | Financial review | Financial
statements | Shareholder
information |
| | | | | | | | | | | | | |
| | | | | | | | | | | | | |
| | | | | |
| Chair’s report on corporate governance continued |
| |
| |
| | | | | | | | |
Summary of Board activities in 2022 The Board aims to consider the views of all impacted stakeholders, whilst acting in the best interests of the Company and its members as a whole. Activities in 2022 included: |
| Theme | Action taken by the Board and outcomes | |
| Strategy including One Europe and Banco Santander | –Following on from the Board Strategy Day, considered and challenged management’s proposals to enhance our proposition across the Everyday Banking and Homes businesses. –Reviewed our customer proposition and experience, including a deep dive on our Net Promoter Score (NPS) and initiatives to improve the NPS trend, and customer interactions strategy, including changes to the branch operating model. –Reviewed and challenged our marketing and brand strategy and positioning, with a view to developing a coherent brand narrative aligned with our ambition to be a ‘digital bank with a human touch’. –Considered specific M&A market opportunities to accelerate growth. –Reviewed initiatives and opportunities to collaborate and leverage resources and capability across the Europe region and the Banco Santander group, including a common payments platform and, banking application (OneApp). –Considered disruption in the financial services market including the impact of neobanks and fintechs and digital currency and blockchain technology.
|
Business,
Customer and Transformation | –Reviewed, challenged, and approved the 3-year business plan (2023-2025) and the annual budget, including assumptions underpinning the plan given the rapidly evolving macroeconomic environment and investment to support a resilient and sustainable operating environment and associated risk assessments. –Reviewed, challenged and remained apprised of the performance of the business divisions and functions, strategic business opportunities, developments with customer experience and the Company's transformation programme. –Considered financial crime, including approval of risk appetite and oversight of programmes to accelerate controls enhancement and regulatory engagement, as well as back book remediation. –Considered and endorsed the IT transformation programme including clear milestones and investment to align IT infrastructure and systems with business requirements and bring IT risk within Board Risk Appetite.
|
Regulation,
Balance Sheet
and Capital | –Reviewed, challenged and approved the ICAAP, ILAAP, adequacy and effectiveness of stress-testing and capital management, AT1 payments and ordinary and preference share dividend payments in line with PRA guidance. –Submitted to the Bank of England results of the annual cyclical and solvency stress test submissions. –Submitted a self-assessment of resolvability to the PRA in line with the Bank of England Resolvability Assessment Framework. –Considered the future regulatory landscape and implications, including approval of the Consumer Duty implementation plan. – A number of Board members also participated in workshops delivered to the Board Audit Committee on the evolution of the IFRS 9 approach and supporting models.
|
Risk and
control | –Received regular enterprise-wide risk updates from the CRO, together with updates on specific risks, such as third-party outsourcing, IT, data management, financial crime, fraud, climate change and inflation. The Board closely monitored overall operational risk given the ongoing execution of the extensive transformation agenda. –Approved/adopted changes to the Risk Framework as part of the annual review, including the introduction of a new minimum standard to ensure each business area and risk type considers risks posed by climate change. –Received annual reports on whistleblowing and cyber security, considering the effectiveness of such arrangements. –Reviewed and approved relevant submissions related to the Operational Resilience Programme. –Approved the submission to the BoE of results from the Climate Biennial Exploratory Scenario Stress tests for climate risks. |
People and
Culture | –Received updates on issues including talent management & succession planning, gender pay gap and diversity & inclusion. – Utilised regular reports on culture, including employee feedback to identify cultural priorities and alignment with the Company's long term strategic direction. – Considered colleagues' ways of working and opportunities to optimise the real estate portfolio. – Considered succession planning across all key control, support functions and business functions. |
| Governance and Responsible Banking | – Reviewed, challenged and approved the Annual Report. – Received regular verbal updates of Board Committee activity from their respective Committee Chairs. – Approved a revised Banco Santander Subsidiary Governance Model for subsidiaries, and certain Corporate Frameworks. – Approved the education and social mobility strategies. – Approved the recommendations and resulting action plan for the 2021 externally facilitated Board evaluation, and the incremental recommendations arising from the internally facilitated Board evaluation in late 2022. – Approved policies including a new Board level Conflicts of Interest Policy, Board Diversity & Inclusion Policy, Policy for the Suitability, Selection and Succession of Board members and Policy on Regulatory Documents on the recommendation of the Board Nomination Committee. – A number of Board members also participated in workshops delivered to the Board Responsible Banking Committee to discuss the Company's climate strategy and supporting business initiatives; and consider the impact of initiatives implemented so far and next steps in fraud prevention. |
William Vereker
| | | | | | | | | | | | | | |
| Annual Report 2022 | Santander UK Group Holdings plc 61 |
| | | | | | | | | | | | | | | | | | | | | | | | | | | | | | | | | | | | | | | | | |
| Strategic Report | Sustainability and Responsible Banking | Governance | Risk review | Financial review | Financial
statements | Shareholder
information |
| | | | | | | | | | | | | |
| | | | | | | | | | | | | |
| | | | | |
| Board Nomination Committee Chair’s report |
| |
| |
Introduction
On behalf of the Committee, I am pleased to present the Board Nomination Committee report, providing details of the key topics we considered in the year. I would like to thank the Committee members and management for their continued support.
The Committee conducts its business concurrently with the RFB Board Nomination Committee (the RFB Committee) to ensure alignment of practices, policies and procedures.
I am also the Chair of the RFB Committee and, given that the RFB has within its perimeter the vast majority of Santander UK's business, this report details the governance arrangements, practices and activities of both the Committee and the RFB Committee.
The Committees are responsible for, amongst other things:
–Identifying, nominating and recommending candidates for appointment to the Board.
–Regularly reviewing the structure, size and composition of the Board and its Committees.
–Overseeing the evaluation of Board and Board Committee performance.
–Reviewing corporate and internal governance matters.
Committee composition
| | | | | | | | |
| Scheduled meetings | Ad hoc meetings |
| William Vereker (Chair) | 7/7 | 2/2 |
| Ed Giera | 7/7 | 2/2 |
| Pamela Walkden | 7/7 | 1/2 |
RFB Committee composition
| | | | | | | | |
| Scheduled meetings | Ad hoc meetings |
| William Vereker (Chair) | 7/7 | 2/2 |
| Annemarie Durbin | 7/7 | 2/2 |
| Ed Giera | 7/7 | 2/2 |
| Pamela Walkden | 7/7 | 1/2 |
Other attendees at Committee meetings in 2022 included the CEO, Chief People Officer, Director, Performance & Reward, and Director, Culture & Capability.
Key activities in the year
During 2022, the focus of the Committees' work was in the following areas:
Succession planning
The Committees lead a formal, rigorous and transparent process for the identification, nomination and recommendation of candidates for appointment to the Board and senior management positions.
Part of this process is ensuring that there are succession plans in place for both Board and key management positions encompassing internal and external candidates, and that there is a skills, experiences and diversity matrix which maps each Director's attributes against those which are most relevant for the Board, taking into account the future strategic direction of the Company and its needs. As well as tracking the Board's strengths, this matrix is used to identify gaps in its desired collective skills profile.
While appointments are based on the merit of the individual candidates and objective criteria, we also aim to promote diversity, in its broadest sense, to complement and strengthen the overall Board and its Committees' skills, knowledge and experience. Any appointment also takes account of all legal and regulatory requirements.
In 2022, a significant proportion of the Committees' time was devoted to succession planning, and in particular identifying successors for Chris Jones, Chair of both the Board Audit and Remuneration Committees and Chair of the RFB Audit Committee, and Ed Giera, Senior Independent Director, Chair of both the Board Risk and Responsible Banking Committees and Chair of the RFB Risk Committee. Both will step down by 2024 after serving as Directors for nine years. To ensure a thorough handover, the Committees were keen to start the selection process early.
Hedley May, an external search consultant with whom the Company and individual Directors have no other relationship, were engaged to assist with the search and selection process. A preferred candidate to succeed Chris Jones as the Board Audit Committees Chair has been identified (subject to regulatory approval) but as the appointment process remains ongoing we will report on it more fully in next year’s Annual report, together with details of the induction programme arranged for the new director.
The Committees also reviewed the additional roles that the NEDs take on, such as the Whistleblowers’ Champion and Workforce Engagement representative to reallocate some of these when the current incumbents retire. Nicky Morgan was appointed to the new role of Consumer Duty Champion for Santander UK plc.
In addition to Board level appointments, the Committees oversaw and approved several changes to the Executive Committee membership and other management key position holders in 2022. On the Executive Committee, John Collins, Chief Legal and Regulatory Officer and Iain Plunkett, Chief Operating Officer both left, with Charles Shepherd, General Counsel and Stephen White,
Chief Operating Officer appointed. Louise Shield, Director of Corporate Communications and Responsible Banking left at the end of the year, with Andrew Wilson appointed to this position from 1 March 2023. In addition, the internal appointments of Elisabet Pinilla as Head of Technology & Operations from Banco Santander SA and Juan Ignacio Echeverria as Chief People Officer from Banco Santander Mexico showcase the strength of the Banco Santander group talent pool. On behalf of the Board, I would like to welcome all those who joined us in the year and thank those who left us for their contributions.
Board effectiveness
The Committees reviewed the progress made and further actions needed on the areas of improvement identified in the 2021 external evaluation of the Board, facilitated by Boardroom Review Limited (BRL) who have no other connection to Santander UK or any individual Directors.
Progress against these actions is set out below:
–Ensuring a successful induction for Mike Regnier, as incoming CEO, was critical. The Committees also considered upcoming Board retirements and the future composition in line with the Company's long-term strategy.
–The Board Strategy Day this year allowed the Board to spend time further developing a long-term vision for growth and risk.
–To ensure that the Board receive the right information, presented in a helpful way to support effective decision making, a new paper template was implemented and training on writing papers and presenting at meetings given to regular contributors.
Following the detailed and comprehensive external evaluation by BRL, in 2022 an internal review of the Board and its Committees was conducted by the Company Secretary, assisted by the Head of Internal Governance. Interviews were held with Board members and the Executive Committee members were asked to complete a survey on the Board’s performance.
The review concluded that the Board and its Committees continue to operate effectively, with notable improvements now that recently appointed Directors, including the CEO and I, have settled into our roles and established strong relationships with the Banco Santander group. Additional strengths identified were the fostering of an open and transparent atmosphere and the blend of skills and experience on the Board. The review also identified some opportunities for improvement including:
–Oversight of ESG and Responsible Banking - given the increasing importance of these matters, the Board should ensure enough time is allocated to discuss them across the year.
–Agenda planning, Board time and Board materials - there is still room for improvement in these areas and the Chair and Company Secretary will work to enhance the scheduling and operation of Board vs Board Committee meetings.
| | | | | | | | | | | | | | |
| Annual Report 2022 | Santander UK Group Holdings plc 62 |
| | | | | | | | | | | | | | | | | | | | | | | | | | | | | | | | | | | | | | | | | |
| Strategic Report | Sustainability and Responsible Banking | Governance | Risk review | Financial review | Financial
statements | Shareholder
information |
| | | | | | | | | | | | | |
| | | | | | | | | | | | | |
| | | | | |
| Board Nomination Committee Chair’s report continued |
| |
| |
–Board Committee composition – undertake a review of the Board Committee composition to ensure knowledge is spread among Directors while meeting regulatory requirements.
–Emerging market themes and competitor benchmarking – ensuring the Board remain appraised of market activity.
–Strengthening our alignment with the Banco Santander group – fostered through the attendance of Banco Santander group directors and executives at UK meetings as appropriate, including the Board Strategy Day, and regular Board visits to Madrid.
The Board fully considered the recommendations from the internal evaluation and agreed an action plan which will be regularly reviewed by the Committees in 2023.
In 2022, I also conducted individual Directors’ assessments and the SID undertook an assessment of my performance.
Governance
Review of the Corporate Governance Framework and Banco Santander group Frameworks
A key element of our internal governance system is the adoption of corporate frameworks, which are designed to establish common principles across key subsidiaries on matters considered relevant due to their impact on the Banco Santander group’s risk profile. When the frameworks are periodically reviewed, the Committees oversee whether the Company remains in compliance with the key principles in each, and determines whether any UK specific amendments are required. In 2022, the Committees reviewed six of these frameworks.
We also reviewed a proposal to amend the Santander UK Corporate Governance Framework (CGF). The proposed changes simplified the CGF structure and updated components to ensure they are fit for purpose and reflect Santander UK’s business and operating framework. The changes to the CGF were approved by the Board following recommendation from the Committee.
The Committees also approved the implementation of a Santander UK Subsidiary Governance Framework, which formalises the minimum standards for subsidiaries across the Santander UK group to support good governance.
Diversity, inclusion and engagement with stakeholders
We believe that our success is integrally linked to the diverse composition of our people and the promotion of an inclusive culture. The basis of this premise applies to our Boards as much as it does to any other area of our business. We recognise that a diverse and inclusive Board should result in a broad strategic perspective and we strive to maintain a Board in which a diverse range of skills, knowledge and experience are combined in an environment which values the input of every Director. Due regard is given to this when identifying and selecting candidates for Board appointments. We want a Board that reflects diversity in its broadest sense, embracing different perspectives and dynamics such as gender, race, age, disability, sexual orientation and socio-economic background.
During the year, the Committees considered updates to our Board Diversity and Inclusion Policy. The Board aims to maintain at least two female members and aims to have 40% female representation by 2025, previously having a minimum of 33%, and overall aim of 50% female representation on the Board by 2030. We are also committed to maintaining at least one member from an ethnic minority background. Currently, one of our Directors is from an ethnic minority, and 33% of the Board of Santander UK plc are female.
The Board of Santander UK Group Holdings plc is significantly smaller than the Board of Santander UK plc, reflecting its role as a holding company and that Board has only eight Directors, two of whom are female. We continue to make sure gender and all aspects of diversity remain front of mind in our succession plans for both Boards.
Our commitment to the HM Treasury Women in Finance Charter continues, with the aim to create gender balance by setting a target of 50% (+/-10%) women in senior roles (excluding Board members) by the end of 2025. At 31 December 2022, 28% of Executive Committee members were female, 34% of Executive Committee members' direct reports were female and our senior manager female population (mid to senior manager roles) was 33%.
Our representation of Asian, Black and other Minority Ethnic colleagues in senior roles (excluding Board members) increased in 2022, broadly in line with our internal growth target to achieve our ambition of 14% (+/-2%) by 2025.
We voluntarily published our ethnicity pay gap for the second year and continue to publish separate pay gaps for Asian, Black and other Minority Ethnic identities as part of our commitment to equality, transparency and accountability.
We continue to work towards race equality at work through our action plans in place and commitments including being a signatory to the Race at Work Charter and the 'If Not Now, When' campaign where we commit to taking key long term, sustainable actions on Black inclusion.
We also pledged to report on the progress of our Black Inclusion Plan within an annual report which can be found in our 2022 Diversity Pay Gap Report, now known as the 'Everyday Inclusion and Pay Gap Report'. This does not form part of this report. The Responsible Banking Committees will be reviewing an updated Santander UK Diversity and Inclusion strategy, with planned supporting actions aimed at closing the gender and ethnicity pay gaps, in 2023.
Director induction and training
Lisa Fretwell joined us as an INED on 1 January 2022, and Mike Regnier was appointed as CEO on 1 April 2022.
As the induction of the new CEO and other recent NED appointments was one of the priorities identified in the 2021 external evaluation, the oversight of their induction plans has been a key area of focus for the Committees. Each new Director received a comprehensive, tailored induction to ensure that they were fully informed about strategic and commercial issues affecting Santander UK and the markets in which they operate, as well as their duties and responsibilities as a Director. In addition, meetings were arranged with key stakeholders in the UK and across the Banco Santander group, and visits to different sites around the business were undertaken by each of them in line with their roles and needs.
Annual review of Director interests, fees and conflicts of interest
As set out in the Chair's report on corporate governance, the Committees' have responsibility for the oversight of conflicts of interest, reviewing Directors' proposed external appointments and their time commitment.
The level of fees paid to INEDs for Board and Board Committee chair and membership are set out in the Remuneration Implementation Report.
Effectiveness of the Committee
As noted above, as part of the internally facilitated Board evaluation carried out during the year, the Committees' performance was assessed and it was concluded that the Committees continue to perform effectively. The results of the evaluation and the subsequent action plan were considered and agreed by the Board as a whole. Information on the progress against actions from last year's review, this year’s evaluation process and areas for improvement identified is set out above.
William Vereker
Chair
1 March 2023
| | | | | | | | | | | | | | |
| Annual Report 2022 | Santander UK Group Holdings plc 63 |
| | | | | | | | | | | | | | | | | | | | | | | | | | | | | | | | | | | | | | | | | |
| Strategic Report | Sustainability and Responsible Banking | Governance | Risk review | Financial review | Financial
statements | Shareholder
information |
| | | | | | | | | | | | | |
| | | | | | | | | | | | | |
| | | | | |
| Board Risk Committee Chair’s report |
| |
| |
Introduction
On behalf of the Committee, I am pleased to present the Board Risk Committee report, providing details of the key topics we considered in the year. I would like to thank the Committee members and management for their continued support.
The Committee conducts its business concurrently with the RFB Board Risk Committee (the RFB Committee) to ensure alignment of practices, policies and procedures. I am also the Chair of the RFB Committee and, given that the RFB has within its perimeter the vast majority of Santander UK's business, this report details the governance arrangements, practices and activities of both the Committee and the RFB Committee.
The Committee is authorised by the Board to:
–Advise the Board on the enterprise wide risk profile, Risk Appetite and strategy.
–Review the enterprise wide risk profile through business updates from the First Line of Defence and regular reports on each key risk type from the Second Line of Defence.
–Provide advice, oversight and challenge to embed and maintain a supportive risk culture.
–Review the Risk Framework and recommend it to the Board for approval.
–Review and approve the key risk type and risk activity frameworks identified in the Risk Framework.
–Review the capability to identify and manage new risks and risk types.
–Consider and review all risks and issues escalated by the Chief Risk Officer, and their associated action plans.
–Oversee and challenge the day-to-day risk management actions and oversight arrangements and adherence to risk frameworks and policies.
–Oversee the adequacy of the governance arrangements we have in place.
Committee composition
| | | | | | | | |
| Scheduled meetings | Ad hoc meetings |
| Ed Giera (Chair) | 10/10 | 1/1* |
| Chris Jones | 10/10 | 1/1* |
| Pamela Walkden | 10/10 | 0/0 |
| Lisa Fretwell | 10/10 | 0/0 |
RFB Committee composition
| | | | | | | | |
| Scheduled meetings | Ad hoc meetings |
| Ed Giera (Chair) | 10/10 | 1/1* |
| Chris Jones | 10/10 | 1/1* |
| Annemarie Durbin | 10/10 | 0/0 |
| Mark Lewis | 10/10 | 0/0 |
| Nicky Morgan | 10/10 | 1/1* |
| Lisa Fretwell | 10/10 | 0/0 |
| Pamela Walkden | 10/10 | 0/0 |
*BRC subcommittee to consider a specific topic on behalf of the Board.
Other attendees at Committee meetings in 2022 included the Board Chair, CEO, CFO, Chief Internal Auditor, CRO and External Auditors.
Key activities in the year
During 2022, the focus of the Committees' work was in the following areas:
Financial Crime risk
Financial crime risk remained a Top risk for Santander UK, with the Committee focusing on it at each meeting. The Committee continues to monitor progress and challenge management on evidencing a return to Board risk appetite.
Fraud risk
Fraud risk was identified as a Top risk for Santander UK and was discussed regularly by the Committee, with fraud risk losses accounting for a significant portion of our overall operational risk losses. The Committee is monitoring the progress of management's tactical and strategic actions to return this risk to the Board's risk appetite.
Credit risk
The risks associated with our credit portfolios, including corporate customer portfolios, were considered by the Committee, particularly in light of macroeconomic factors such as the risks associated with unemployment, the UK housing market, rising cost of living pressures on households, and rising mortgage rates, as well as increased business costs and supply chain pressures.
Strategic and Business risk
We evaluated Santander UK's competitive position, long-term viability, and potential future threats, including its operations in the current volatile and uncertain macro-environment.
Operational risk & resilience
Managing resilience risk has remained a top priority, along with demonstrating to our regulators that Santander UK is resilient to any disruptions in its operations. The Committee assessed the operational risks associated with a heightened external Cyber risk environment, IT risks, third-party risk management, People risk in a hybrid-working environment and a difficult recruitment market, and managing complex change risk with capacity and capability challenges.
Model risk
We reviewed and discussed regular Model risk updates, including progress on the heightened regulatory model transformation and new model developments, as well as the refresh of the model risk target operating model.
We maintain an holistic view of enterprise wide risks and, to help achieve this, there is appropriate cross-membership between this Committee, the Board Responsible Banking Committee and the Board Audit Committee.
Effectiveness of risk management system and internal controls
We considered, as part of the Operational Risk Profile & Analysis update, the results of the 2021 year end Risk and Control Self Assessment (RCSA). This highlighted the risk and exposure issues reported through the RCSA processes.
Through mitigating actions completed in 2021, several critical risks were reduced to high or lower risks. The critical risks remaining at 31 December 2021, were all being addressed, with no risk acceptance requested. An additional level of control assurance was introduced through the Operational Risk & Resilience Control’s (ORRC) review of Special Monitoring Controls as part of the annual Control Certification Campaign (those controls identified as most important in the mitigation of their critical inherent risks) by the respective risk owners.
Overall, we were satisfied that critical and high risks were well managed via risk mitigation and reassessment processes. The remaining high risk work streams, mainly relating to Financial Crime, IT and Third-Party exposures, were being addressed through the Financial Crime Transformation Programme, IT transformation programme and Procurement Transformation, respectively.
In 2022, the RCSA process continued to be enhanced, to ensure all material risks are considered and reported consistently across Santander UK.
The Committee received reports on management’s strategic plan for investment prioritisation. The Committee continues to review management’s reports on the execution of the overall bank-wide Risk Infrastructure Management Programme which, due to the progress made over the last few years to improve the bank’s infrastructure, has now transitioned into the business.
Effectiveness of the Committee
As part of the internally facilitated Board evaluation carried out during the year, the Committee's performance was assessed and it was concluded that the Committee continues to perform effectively. The results of the evaluation and the subsequent action plan were considered and agreed by the Board as a whole. More information on the progress against actions from last year's review, this year’s evaluation process and areas for improvement identified can be found in the Board Nomination Committee Chair's report.
| | | | | | | | | | | | | | |
| Annual Report 2022 | Santander UK Group Holdings plc 64 |
| | | | | | | | | | | | | | | | | | | | | | | | | | | | | | | | | | | | | | | | | |
| Strategic Report | Sustainability and Responsible Banking | Governance | Risk review | Financial review | Financial
statements | Shareholder
information |
| | | | | | | | | | | | | |
| | | | | | | | | | | | | |
| | | | | |
| Board Risk Committee Chair’s report continued |
| |
| |
Significant areas of focus
In 2022, we discharged our responsibilities and continued to raise challenges relating to our areas of focus, identifying, and managing new risks and risk types.
| | | | | | | | |
| Area of focus | Action taken by the Board Risk Committee | Outcome |
| Risk Appetite | –Considered changes proposed to the Board’s Risk Appetite Statement (RAS) as part of the Annual Risk Appetite Review. The RAS approach, methodology and structure were thoroughly reviewed as part of the annual analysis to determine whether they remained in line with peers and also fit for purpose for our business. –Oversaw the implementation of a quantitative expression for Climate Change Risk Appetite and the simplification of the Board's Financial Crime Risk Appetite measures, as well as incremental changes to several existing metrics to provide a more meaningful measurement against the RAS. –Challenged management on the Climate Change Risk Appetite, noting that the focus had shifted from qualitative to a quantitative expression of appetite, with targets established and expected to continue to evolve. Climate Change risk will be monitored and assessed relative to the Responsible Banking Committee targets. –Examined the proposed changes to the Cost of Credit limit to better measure deviations from the budget, and updated to the Operational Risk qualitative statements and supporting metrics to ensure alignment to the current risk exposures, the statements and supporting metrics.
| –Agreed with the results of the RAS analysis which confirmed that the business has the right approach and structure, as well as a market-appropriate appetite. –Recommended the proposed Risk Appetite to the Board for approval. For more, see ‘Risk Appetite’ in the ‘Risk governance’ section of the Risk review. |
| Risk Framework | –Reviewed proposed changes to the Risk Framework. Management highlighted the reduction in the number of the Risk Types and frameworks due to the transfer of assets from Santander UK plc to Banco Santander London Branch in 2021, which resulted in a simpler and more streamlined business model. –Considered management's descriptors of Risk Profile and Board Risk Appetite (BRA) to promote clearer demarcation of the two measures in reporting. –Discussed the annual certification process and assessed the extent to which the Risk Framework had been effectively implemented and embedded across the business. –Noted that the Risk certification results indicated that the majority of Santander UK remained compliant with the Risk Framework. Noted that full compliance increased to 92%, with improvements against most sections of the Risk Framework.
| –Following the completion of the bank-wide Risk Infrastructure Management Programme, agreed with management on the implementation of a risk infrastructure framework in H1 2022 to aid in the transition of risk infrastructure assessment into the business. –Agreed that the Risk Framework continues to meet Industry and regulatory standards and that it has been effectively implemented. –Recommended the proposed changes to the Board for approval.
For more, see ‘Risk Framework’ in the ‘Risk governance’ section of the Risk review. |
| Stress testing | –Stress testing remains a key tool to highlight and manage the impact on capital and profit and loss in stress scenarios. The Committee continues to closely monitor methodology, governance arrangements, and outputs. –Reviewed and challenged the proposed scenarios and approach for completing the Bank of England Annual Cyclical Scenario (ACS) stress testing exercise in 2022. The Committee was involved throughout the process, reviewing key drivers and challenging assumptions and outputs, particularly in light of the economic climate. –Examined the impact of the second round of the Bank of England’s Climate Biennial Exploratory Scenario stress test scenarios on Santander UK. A third-party peer review was also commissioned to compare our climate-related risk management to that of peer banks and to provide guidance on our overall ESG Risk operating model. –Reviewed management responses to address the regulator's feedback on the 2022 Bank of England Climate Biennial Exploratory Scenario stress tests.
| –Approved Santander UK’s response to the CBES 2 and the results and assumptions from the ACS stress testing exercise.
For more, see ‘Stress testing’ in the ‘Risk governance’ section of the Risk review. |
| | | | | | | | | | | | | | |
| Annual Report 2022 | Santander UK Group Holdings plc 65 |
| | | | | | | | | | | | | | | | | | | | | | | | | | | | | | | | | | | | | | | | | |
| Strategic Report | Sustainability and Responsible Banking | Governance | Risk review | Financial review | Financial
statements | Shareholder
information |
| | | | | | | | | | | | | |
| | | | | | | | | | | | | |
| | | | | |
| Board Risk Committee Chair’s report continued |
| |
| |
| | | | | | | | |
| Area of focus | Action taken by the Board Risk Committee | Outcome |
| Technology & Operations | –Some IT incidents experienced by our customers in 2022 demonstrated the importance of robust IT risk management, controls, and third-party oversight and accountability. –Considered progress that had been made in IT transformation to reduce IT risk. The stabilisation of the production environment had reduced incidents, and the safe execution of change requests had increased. –Reviewed management progress in removing blockers to IT transformation had been resolved through the establishment of technical solutions to move applications to new infrastructures, an IT risk dashboard to measure progress against Risk Appetite and accountability and within the Chief Resilience and Control Office for the mapping and prioritisation of Important Business Services. –Discussed the challenges around recruitment, particularly for certain IT roles, and queried management on the actions being taken. –Received multiple updates on cyber security risk, the external threat landscape and the actions being taken by management in response to further strengthen our control measures. Although Santander UK had not experienced any critical cyber security incidents, we continue to respond to third-party ransomware attacks.
| –Agreed that the governance and control framework for the cloud infrastructure needed to be improved, highlighting the impact of any delay in cloud capability. –Endorsed the high-level plan to meet the BRA for IT, supported by underlying work streams with accountable owners. The Committee noted that the plan would be adjusted during 2023 to account for potential unknowns and management was encouraged to promptly escalate budgetary requirements to ensure alignment with available funding. –Management assured the Committee that there was sufficient investment for cyber security and patching, and addressing any system obsolescence continued to be a priority within the IT transformation programme.
For more, see the ‘Operational risk’ section of the Risk review. |
| Financial Crime | –Given the critical importance of financial crime management, the Committee meets on a regular basis to discuss and challenge management on the path back to Risk Appetite. –Reviewed the findings of the Skilled Person’s (SP’s) report and management’s consideration in re-planning the Financial Crime Transformation Plan for a return to Risk Appetite. –Considered management's approaches to responding to the SP's recommendation and findings from the independent review of the Financial Crime Transformation Plan implementation. –Critically examined and challenged management throughout the year on the progress made on the Financial Crime Remediation Plan to return to Risk Appetite. As part of this review, we considered the Money Laundering Reporting Officer’s report, and the Second Line of Defence view as part of the enterprise-wide risk management reports to the Committee. –Challenged management on the return to Risk Appetite delay, resource adequacy, third-party reliance, potential convergence with the One Europe Financial Crime Programme, and the pace of Financial Crime Transformation implementation and remediation to drive financial crime improvements.
| –Recommended that management should ensure appropriate capacity for teams to manage work streams and encouraged management to also demonstrate a sustainable cadence in bringing down remediation volumes. –Noted management's assurance that financial crime would return within Risk Appetite by the deadline, as the risk profile continued to reduce across the business. To support this, the Committee requested regular updates on the current position, the associated risks to achieving BRA, plans for mitigation, and the measures to assure the Committee that the programme could be delivered in accordance with the remediation lifecycle timelines. For more, see the ‘Financial crime risk’ section of the Risk review.
|
| Fraud | –Reviewed, discussed, and challenged management's actions to implement fraud prevention tools, systems, and controls to mitigate a variety of fraud risk types that are prevalent both within Santander UK and across the UK banking industry, particularly Authorised Payment Push (APP) fraud, which is our most prevalent fraud type. –Challenged management on the importance of continuing to educate and raise awareness among our customers and people about the growing risk of fraud and scams through media campaigns and digital channels. –Monitored and challenged management on progress with returning Fraud risk to Risk Appetite. | –Noted updates from management on progress with the range of actions being taken to prevent and mitigate fraud risk types, particularly under the Fraud Transformation Programme, which includes several projects designed to reduce the risk to our customers and the bank. |
| | | | | | | | | | | | | | |
| Annual Report 2022 | Santander UK Group Holdings plc 66 |
| | | | | | | | | | | | | | | | | | | | | | | | | | | | | | | | | | | | | | | | | |
| Strategic Report | Sustainability and Responsible Banking | Governance | Risk review | Financial review | Financial
statements | Shareholder
information |
| | | | | | | | | | | | | |
| | | | | | | | | | | | | |
| | | | | |
| Board Risk Committee Chair’s report continued |
| |
| |
| | | | | | | | |
Oversight and advice to the Board on Santander UK’s current risk exposure and future risk strategy In 2022, we reviewed our exposure to the risks outlined below and analysed emerging themes, including regulatory, macroeconomic and global risks, which could affect Santander UK’s ability to achieve its strategic goals. |
| Risk | Action taken by the Board Risk Committee | Outcome |
| Credit risk | –Reviewed the credit risk profile of the Retail Banking (Homes and Everyday Banking), Corporate & Commercial Banking and Cater Allen businesses. –Discussed the current macroeconomic environment which continues to be challenging, with increased inflation, cost of living pressures, supply chain pressures, increased business costs, having the potential to put greater strain on our ability to serve our customers, as well as the risk of increased impairments and considered the impacts on our credit portfolios. –Challenged management on operational readiness/capacity to support customers, particularly those who would be due for mortgage maturity in 2023, and we were assured by the actions being taken by management to be operationally ready. –Reviewed the Consumer Finance business and the impacts of the rising inflation and associated cost of living increase which could result in an income shock for our customers and their ability to repay their loans. | –Concluded that credit portfolios remained resilient but have a cautious outlook for 2023. For more, see the ‘Credit risk’ section of the Risk review. |
| Strategic & Business risk | –Considered the strategic & business risk, particularly in relation to the delivery of critical programmes such as the IT transformation and Financial Crime Transformation Plan, and the potential impact this could have on the delivery of our strategic priorities. –Discussed the complex regulatory agenda and considered management's plans for addressing the key regulatory priorities for the year. –Discussed actions management had taken to mitigate strategic & business risk, including strengthening our business continuity and resilience plans, improving our business model, delivering cost efficiencies, building on our transformation programme and evolving our way of working to enhance flexibility, agility, and access to talent while ensuring our people’s well-being.
| –Recommended that management should consider as part of the strategic & business risk review, including perspectives on culture, people risk (capacity and future ways of working), and related strategic and business risk vulnerabilities. –Recommended that management should consider the requirement for forward-looking modelling analysis to aid in decision-making about profit sustainability, changing customer mix, evolving macroeconomic environment, and competitive landscape.
For more, see the ‘Strategic risk’ section of the Risk review. |
| Pension risk | –Discussed the key pension risk factors, such as interest rate risk, inflation risk, investment risk and longevity risk, that the Santander UK Group Pension Scheme (the Scheme) is exposed to. –Monitored the interest rate, inflation rate and longevity hedging levels, and the significant progress made in de-risking the Scheme's asset portfolio. –Considered the actions taken by management to manage risk in relation to the conflict in Ukraine, and the related shocks to global markets. –Discussed the Pension Schemes Act 2021 amendments and the changes implemented to ensure any impact on the Scheme is properly considered in decision-making. –Reviewed the relevant metrics and management actions recommended and agreed with the trustees in connection with notional leverage, liquidity, and collateral management associated with the Scheme's derivative hedging portfolios. | –Agreed with management's proposal to remove pension risk as a Top risk, noting the significant improvements in the overall risk profile and risk metrics. –Agreed with management that the Scheme had sufficient collateral to support hedging, but recognised management actions to increase resiliency as a result of increased gilt yields. For more, see the ‘Pension risk’ section of the Risk review. |
| Liquidity risk | –Reviewed the ILAAP and noted that management have addressed all feedback from the regulator on the previous Liquidity Supervisory Review and Evaluation Process and subsequent ILAAP reviews. –Questioned management about challenges faced during the ILAAP process, material liquidity stress test assumptions, and the flexibility and timeliness of our liquidity reporting. –Attended a workshop in October 2022 with members of the Board on ILAAP to consider key assumptions in the ILAAP. –Considered the half yearly updates on asset and liability management activities. We discussed the current macroeconomic environment and the Bank of England base rate increases impacts on products, particularly, mortgages and pricing. We discussed the effective actions management had taken to address our customer funding gap and the possible impacts on our assets and liabilities. –Noted that the analysis in support of the ACS submission to the regulator confirmed that Santander UK remains in a robust capital and liquidity ratio position.
| –Acknowledged that the Company holds sufficient liquid resources and has adequate governance and controls in place to manage the liquidity risks arising from its business and strategy. –Agreed to recommend the 2022 ILAAP to the Board for approval, following review and challenge. For more, see the ‘Liquidity risk’ section of the Risk review. |
| | | | | | | | | | | | | | |
| Annual Report 2022 | Santander UK Group Holdings plc 67 |
| | | | | | | | | | | | | | | | | | | | | | | | | | | | | | | | | | | | | | | | | |
| Strategic Report | Sustainability and Responsible Banking | Governance | Risk review | Financial review | Financial
statements | Shareholder
information |
| | | | | | | | | | | | | |
| | | | | | | | | | | | | |
| | | | | |
| Board Risk Committee Chair’s report continued |
| |
| |
| | | | | | | | |
| Risk | Action taken by the Board Risk Committee | Outcome |
| Capital risk | –Considered, from a capital risk perspective, the ordinary and preference share dividends proposed to be paid for the year. –Questioned management about continuous engagement with Banco Santander regarding possible dividend scenarios. –Discussed the capital risk position and the status of initiatives to deliver on Banco Santander’s capital contribution target for 2022. –Reviewed and approved the changes proposed to the Surplus Capital Allocation Framework which allowed for the identification of surplus capital. –Reviewed the ICAAP and challenged management to examine whether the scenario weights were still appropriate in light of the UK’s economic and political changes. –Discussed the performance of the internal ratings based (IRB) regulatory capital models for the mortgage book. Despite the inherent uncertainty caused by Covid-19, we noted that performance across the IRB model rating systems remained robust. | –Recommended the payment of dividends to the Board for approval, subject to final determinations on capital distributions by the regulator. –Comments and challenges received from Committee members were considered by management and incorporated into the final ICAAP. –Agreed to recommend the ICAAP to the Board for approval following review and challenge. For more, see the ‘Capital risk’ section of the Risk review. |
| Operational risk & resilience | –Received regular updates on the operational risk profile and risk appetite, with a particular focus on operational resilience, data management, outsourcing and third-party risk management, people risk and change and transformation risk. –Considered progress to meet compliance with the Operational Resilience parts of the PRA Rulebook and the FCA Handbook. –Reviewed management progress in identifying the important business services, setting impact tolerances, asset mapping and scenario testing completed to a level required to identify vulnerabilities and risks. –Examined the independent review of our approach to operational resilience including the design, methodology and outcomes. We were assured that our Operational Resilience Programme’s design and execution had no significant flaws, and recommendations from the independent reviewer were incorporated into our self-assessment programme. –Received regular updates on data management & privacy risk. We challenged management on the data programme prioritisation, RAS and metrics, capacity, system plans, funding and on residual data privacy risk. –Attended a workshop in July 2022 with members of the Board on our Data Strategy with a particular focus on the risk implications of our data & analytics capabilities. –With more outsourcing underway or planned as part of our transformation agenda, challenged management to continue to make positive progress in improving the application of the Third-Party Risk Management Framework. –Questioned the root cause and remedial actions relating to the incidents in the year, partly due to third parties, most of which are related to IT vendors. –Remained focused on people risk and received updates on the people risk profile, the risk associated with Santander UK's relocation to Milton Keynes, the risk affecting key subject matter experts, and the ongoing effects of the pandemic. –Questioned management about their steps to address capacity challenges in key areas, and to improve colleague wellbeing, the recruitment process, and attrition and absence rates. –Considered the overall change portfolio risk position and its implications for our transformation plan. We reviewed the root cause analysis into under-performance in change and the resulting action plan to address the under-performance. –Discussed management’s capacity and capabilities in completing the projects in the necessary timeframes and encouraged management to carry out a portfolio review focused on rationalising the change agenda to enable delivery within capacity.
| –Recommended to the Board the approval of the Operational Resilience Self-assessment. –Acknowledged the progress made to improve the risk profile of our data strategy and encouraged management to consider the risk implications of our current data challenges. –Recommended that management take remedial action to re-assess the control protocols relating to the specific incident, as well as the overall mainframe of a service outsourcing arrangement. –Continued to support management on their strategic plan for future ways of working and returning to the office, colleagues' well-being, and support provided to colleagues during the cost of living crisis. –Advised management to prioritise, plan and budget holistically to support the execution of the Data strategy, IT transformation programme, and Financial Crime Transformation Programme. Given the Data Strategy's critical dependence on key programmes and business initiatives.
For more, see the ‘Operational risk’ section of the Risk review. |
| Model risk | –Considered an update on the regular monitoring of capital adequacy models. –Received an update on the regulatory review of key mortgage and corporate IRB models. –Considered the implications of differing regulatory perspectives on through-the-cycle capital requirements of the Bank of England and the ECB, respectively, including the potential implications for capital planning, product pricing, and business strategy. | –Continued to monitor progress in respect of regulatory initiatives for IRB models, and request evidence of appropriate model types, assumptions, data integrity, and calibration. For more, see the ‘Model risk’ section of the Risk review. |
Ed Giera
| | | | | | | | | | | | | | |
| Annual Report 2022 | Santander UK Group Holdings plc 68 |
| | | | | | | | | | | | | | | | | | | | | | | | | | | | | | | | | | | | | | | | | |
| Strategic Report | Sustainability and Responsible Banking | Governance | Risk review | Financial review | Financial
statements | Shareholder
information |
| | | | | | | | | | | | | |
| | | | | | | | | | | | | |
| | | | | |
| Board Audit Committee Chair’s report |
| |
| |
Introduction
On behalf of the Committee, I am pleased to present the Board Audit Committee report, providing details of the key topics we considered in the year. I would like to thank the Committee members and management for their continued support.
The Committee conducts its business concurrently with the RFB Board Audit Committee (the RFB Committee) to ensure alignment of practices, policies and procedures. I am also the Chair of the RFB Committee and, given that the RFB has within its perimeter the vast majority of Santander UK's business, this report details the governance arrangements, practices and activities of both the Committee and the RFB Committee.
The Committee is authorised by the Board to provide oversight of:
–Integrity of the financial statements of the Company and any formal announcements relating to its financial performance, including underlying significant financial reporting judgements and estimates.
–Internal financial control effectiveness.
–The relationship with our external auditors including their independence and objectivity, audit scope and effectiveness of the audit process in respect of their statutory audit of the annual financial statements.
–Internal Audit function effectiveness.
–Recovery and Resolution planning.
–Whistleblowing arrangements.
Committee composition
| | | | | | | | |
| Scheduled meetings | Ad hoc meetings |
| Chris Jones (Chair) | 10/10 | 0/0 |
| Ed Giera | 10/10 | 0/0 |
| Lisa Fretwell | 10/10 | 0/0 |
RFB Committee composition
| | | | | | | | |
| Scheduled meetings | Ad hoc meetings |
| Chris Jones (Chair) | 10/10 | 0/0 |
| Ed Giera | 10/10 | 0/0 |
| Lisa Fretwell | 10/10 | 0/0 |
| Annemarie Durbin | 10/10 | 0/0 |
| Nicky Morgan | 10/10 | 0/0 |
| Mark Lewis | 04/04 | 0/0 |
Other attendees at Committee meetings in 2022 included the Board Chair, CEO, CFO, Chief Internal Auditor, CRO, Financial Controller, Director of Financial Reporting and the external auditor.
Key activities in the year
During 2022, the focus of the Committees' work was in the following areas:
Financial reporting
–Considering the disclosures of and provision for a financial penalty as a result of a civil regulatory investigation into Santander UK's historical Anti Money Laundering control framework by the FCA and subsequent settlement of £108m.
–Challenging the macroeconomic scenarios weightings and other inputs to our credit risk models for purposes of estimating expected credit loss (ECL) provisions, to ensure appropriateness.
–Considering management's proposals on Judgemental Adjustments (JAs, formerly known as Post Model Adjustments), including new JAs to reflect potential repayment affordability risk among retail and corporate customers, and the release of Covid-19 related JAs previously applied to our credit risk model outputs for purposes of estimating ECL provisions.
–Reviewing management’s approach and key methodology changes for new mortgage and corporate ECL models, and supporting simplifications to reduce run time and allow for increased macroeconomic sensitivity analysis. We will continue to monitor the implementation of the new ECL models, which is expected to be completed in H1 2023.
–Reviewing management's approach to the defined benefit pension schemes assumptions and agreeing new models for estimating discount and inflation rates.
–Considering management's efforts to further streamline external financial reporting to ensure it remains relevant to investors, regulators and other stakeholders.
Oversight of external auditors
–Approving the external auditor's proposed audit scope and related fee proposal.
–Considering the FRC's Audit Quality Inspection Report published in July 2022 and other audit quality indicators including PwC Transparency Report as part of our annual assessment of PwC's performance.
–Monitoring the transition of the outgoing, and approved the selection of the incoming, lead external audit partner.
–Reviewing PwC's reports on findings and recommendations on internal control and financial reporting matters identified during their audit and their view of management's progress in resolving them.
–Discussing developments in financial reporting including changes to statute, accounting standards and best practice.
–Monitoring the ongoing independence of PwC.
Internal controls and regulatory reporting
–Overseeing the introduction of 100% independent testing of SOx controls, identified control deficiencies and related remediation plans.
–Continuing focus on oversight of the procurement process including consultant spend.
Internal Audit
–Monitoring progress against the 2022 Audit Plan.
–Monitoring past due Internal Audit recommendations and management's remediation plan to close them.
–Receiving regular updates on the operational effectiveness of Internal Audit to ensure the quality and experience is appropriate for the business and that it is appropriately resourced.
–Considering the results of Internal Audit reviews in conjunction with relevant Line 1 management as appropriate.
–Considering the 2023 Audit Plan and annual report for recommendation to the Board.
Recovery and Resolution planning
–The Committee oversaw management's progress on resolvability, including reviewing the preparations for and submission of the first resolvability public disclosure and arrangements supporting the ongoing maintenance and, where possible, enhancement of the Company's resolution capabilities.
–Overseeing the updating of the recovery plan.
Whistleblowing
–Monitoring management's continued embedding of its whistleblowing framework and arrangements. We continued to refine our policies and operating procedures to stay abreast of best practice.
–Considering key themes and whistleblows.
–Considering the whistleblowing annual report to the Board.
| | | | | | | | | | | | | | |
| Annual Report 2022 | Santander UK Group Holdings plc 69 |
| | | | | | | | | | | | | | | | | | | | | | | | | | | | | | | | | | | | | | | | | |
| Strategic Report | Sustainability and Responsible Banking | Governance | Risk review | Financial review | Financial
statements | Shareholder
information |
| | | | | | | | | | | | | |
| | | | | | | | | | | | | |
| | | | | |
| Board Audit Committee Chair’s report continued |
| |
| |
| | | | | | | | |
Financial reporting Significant financial reporting issues including judgements and estimates The use of assumptions or estimates and the application of management judgement is an essential part of financial reporting. This is considered by the Committee on at least a quarterly basis. In 2022, we focused on the following significant reporting matters in relation to financial accounting and disclosures: |
| Financial reporting issue | Action taken by the Board Audit Committee | Outcome |
Credit impairment charges Determining the appropriateness of credit impairment charges is highly judgemental requiring management to make a number of assumptions. | Overall approach –Noted that applying management judgements on IFRS 9 ECL provisioning was difficult given the circumstances due to the cost of living crisis, and the reduction of Covid-related risks. –Reviewed the fully updated macroeconomic scenarios and weights on a quarterly basis, which captured a wide range of potential outcomes for the UK economy, particularly in light of the current high inflation environment. –Oversaw improvements in the framework to identify when a new JA is needed or an existing JA is no longer needed. –Reviewed management’s approach and key methodology changes for new mortgage and corporate ECL models. We supported simplifications to reduce run time and allow for increased macroeconomic sensitivity analysis, and noted an improved corporate LGD methodology. We welcomed embedding of some long standing JAs into core models, and supported the proposed upgrade to a bespoke tool to calculate ECL which strengthens the control environment. –Challenged management to ensure time is given to complete model governance to allow a high quality, well controlled implementation. We also discussed the use of Covid-19 loss experience in model development given the significant customer support which suppressed arrears emergence. The models are due to go live in H1 2023 after an independent model validation review, and are not expected to result in a material change in ECL. | –Agreed additional disclosures to provide clarity on management judgements and estimates. –Satisfied ourselves with the robustness of the process used to arrive at the management judgements and estimates as well as with the management judgements and estimates themselves. –Endorsed the quarterly updates to the macroeconomic scenarios and weights. –Endorsed the improvements in the JA framework. –Endorsed management’s approach and key methodology changes for new mortgage and corporate ECL models. –We will continue to monitor the implementation of the new ECL models. See the 'Credit risk' section in the Risk review. See 'Critical judgements and accounting estimates' in Note 1 to the Consolidated Financial Statements. |
| Retail and corporate credit impairment charges –Reviewed detailed reports from management throughout the year to satisfy ourselves that Significant Increase in Credit Risk (SICR) triggers had been correctly identified. –Considered management's proposal to apply new JAs to reflect repayment affordability risk for mortgage and unsecured lending customers with low disposable income. –Considered management's proposal to uplift the modelled mortgage probability of default as back testing and monitoring showed a risk of model underestimation. –Considered management's proposal to apply new JAs to reflect the corporate lending risks to those sectors susceptible to high inflation and energy prices, higher input costs, potential for lower consumer and business demand, as well as exposure to supply chain challenges. –Considered management's proposal to release all Covid-19 corporate sector staging JAs as lockdown risk has reduced. |
–Concurred with management's judgement on the level of retail and corporate credit impairment charges, concluding that provisions remain robust and assumptions were appropriate. –Agreed with management's updates on and proposals for JAs. –Agreed with management's proposals to apply new JAs and to reduce or eliminate those which were no longer required. –We will continue to monitor retail and corporate credit provisions. See 'Critical judgements and accounting estimates' in Note 1 to the Consolidated Financial Statements. See Note 13 to the Consolidated Financial Statements. See ‘Credit risk’ in the Risk Review. |
Provisions and Contingent liabilities The provisions for customer remediation, litigation and other regulatory activities continued to be highly judgemental and have required significant assumptions. | –Considered the disclosures of and provision for a financial penalty as a result of a civil regulatory investigation into Santander UK's historical Anti Money Laundering control framework by the FCA and subsequent settlement. –Continued to scrutinise the level and adequacy of customer remediation, litigation and other regulatory provisions and challenged management’s assumptions. –Monitored progress on litigation with a third party over an alleged PPI liability and reviewed judgements and estimates on the level of provision for potential future legal claims. –Reviewed management’s judgements and estimates in respect of the level of provision in relation to on-going regulatory and law enforcement investigations. | –Agreed with management's proposed disclosures and provision for the financial penalty following the FCA's civil regulatory investigation. –Agreed with management’s judgement on the level of customer remediation, litigation and other regulatory provisions and disclosures. –Endorsed the proposed year-end disclosures. See ‘Critical judgements and accounting estimates’ in Note 1 to the Consolidated Financial Statements. See Note 29 and 31 to the Consolidated Financial Statements. |
| | | | | | | | | | | | | | |
| Annual Report 2022 | Santander UK Group Holdings plc 70 |
| | | | | | | | | | | | | | | | | | | | | | | | | | | | | | | | | | | | | | | | | |
| Strategic Report | Sustainability and Responsible Banking | Governance | Risk review | Financial review | Financial
statements | Shareholder
information |
| | | | | | | | | | | | | |
| | | | | | | | | | | | | |
| | | | | |
| Board Audit Committee Chair’s report continued |
| |
| |
| | | | | | | | |
| Financial reporting issue | Action taken by the Board Audit Committee | Outcome |
Defined benefit pension schemes Significant judgement is required on the key assumptions underlying defined benefit pension asset and liability calculations. Outcomes remain inherently uncertain. | –Reviewed management’s approach regarding the principal assumptions underlying the defined benefit pension asset and liability calculations. –Reviewed management's approach to illiquid assets valuation where there is inherent uncertainty as their values are based on unobservable market inputs. Reviewed the proposal to continue to use the unaudited flash valuations provided by our private equity advisors, following review of the testing carried out against final audited valuations, and the conclusion that this is management’s best estimate of the value. –Reviewed management's proposals to adopt new models for estimating the discount and inflation rates. –Assessed management's proposal to apply a 10 basis point overlay to the discount rate at 31 December 2022 as the difference between it and the average of modelled discount rates exceeded management's policy threshold to make an adjustment. –Monitored the continued appropriateness of the methodology for defined benefit pension calculations and reviewed the inflation, discount and mortality rates applied at the year-end.
| –Agreed with management’s approach regarding the principal assumptions. –Agreed with management's approach to illiquid assets valuation, including the proposal to continue to use the unaudited flash valuations provided by our private equity advisors. –Agreed with management's proposals to adopt new models for estimating the discount and inflation rates. –Supported management's proposal to apply an overlay to the discount rate at 31 December 2022. –Endorsed the proposed quantitative and qualitative year-end disclosures in respect of pension obligations. See ‘Critical judgements and accounting estimates’ in Note 1 to the Consolidated Financial Statements. See Note 30 to the Consolidated Financial Statements. See ‘Pension risk’ in the Risk Review. |
| Other areas | –Reviewed the outcome of management’s going concern and viability assessments. –Reviewed the outcome of management’s annual impairment assessments for goodwill and the cost of the Company's investment in Santander UK plc and and noted the increase in headroom in the year.
| –Agreed with management that the going concern basis of accounting remained appropriate at 31 December 2022. –Agreed with management that no impairments to goodwill or the cost of the Company's investment in Santander UK plc should be recognised in 2022. See 'Going concern' in this report and in the Directors' report. See Note 20 to the Consolidated Financial Statements. |
The Committee’s focus continues to be on areas of significant judgement and estimate which pose the greatest risk of a material financial statement misstatement. In doing so we consider carefully the reports of PwC, our external auditors, who constructively challenge the Company's financial reporting.
In addition to the areas set out in the preceding table, the Committee also considers other higher risk items. For 2022, these continued to include the identification and assessment of risks of material misstatement due to management fraud or error. We also considered management's assessment of the effectiveness of model risk management for financial reporting related models.
Disclosure in the Annual Report
We received verbal updates, in respect of each quarterly financial report, from the Disclosure Committee, a senior executive committee chaired by the CFO. Its remit is to advise the Committee on the completeness and accuracy of disclosures in the Company’s external reporting. Some of the Committee's disclosure considerations included:
–Provision for a financial penalty as a result of a civil regulatory investigation into Santander UK's historical Anti Money Laundering control framework by the FCA, and its settlement.
–Climate change and the transition to a low carbon economy, and its potential impact on the financial statements.
This, together with other reports received in the year, and a review of best practice and peer approaches, enabled us to conclude that we were satisfied with the disclosures in this Annual Report.
Management also engaged with the Board and the Committee early on in 2022 in respect of the approach to the Annual Report which enabled us to input into the overall tone and messaging in a timely manner.
Fair, balanced and understandable
The Disclosure Committee also reports on whether the Annual Report is fair, balanced, and understandable and whether it provides the information necessary for readers to assess Santander UK's position and performance, business model and strategy.
In this context, the Disclosure Committee considered whether:
–Key messages are consistent throughout the document, relating to financial performance and progress against strategic priorities.
–Key judgements and estimates, significant risks and issues are reported clearly and adequately.
–The Annual Report has a clear framework with good signposting and a complete picture of performance and events.
The Committee's assessment of fair, balanced and understandable is also underpinned by the understanding it gains through the reporting made to it throughout the year relating to management judgements and estimates, internal control matters, Internal Audit activities and the reports of the external auditors. Our assessment also considers the robustness and outcomes of the assurance, review and verification processes conducted by management and whether the key risks reflected the Committee's concerns and were consistent with those reported by management.
Following our assessment, we concluded that the 2022 Annual Report was fair, balanced and understandable.
Financial Reporting Council (FRC) Annual Review of Corporate Reporting 2021/22
In October 2022, the FRC issued a report which sets out its views on key developments for annual reports, codifying its Thematic Reviews. The report highlighted areas of high-quality reporting, but also drew attention to improvements that would be needed in areas such as disclosures on workforce and wider stakeholder engagement, diversity and oversight of the effectiveness of the risk management and internal control systems. As part of our oversight of this area, management reported to us on its work in the areas of interest to the FRC. We are satisfied that management appropriately addressed the areas identified by the FRC in the preparation of this Annual Report.
| | | | | | | | | | | | | | |
| Annual Report 2022 | Santander UK Group Holdings plc 71 |
| | | | | | | | | | | | | | | | | | | | | | | | | | | | | | | | | | | | | | | | | |
| Strategic Report | Sustainability and Responsible Banking | Governance | Risk review | Financial review | Financial
statements | Shareholder
information |
| | | | | | | | | | | | | |
| | | | | | | | | | | | | |
| | | | | |
| Board Audit Committee Chair’s report continued |
| |
| |
We also reviewed management’s response to a PRA thematic ‘Dear CFO’ letter which focused on high quality ECL implementation practices, progress and areas of development for climate-related risks, including disclosures, and IBOR reform, and we are comfortable with progress made in these areas.
Alternative Performance Measures (APMs)
This Annual Report includes a number of financial measures which are not accounting measures within the scope of IFRS. Such non-IFRS measures are APMs and include financial measures of historical or future performance or financial position that exclude or include amounts that would not be adjusted in the most comparable IFRS measures.
Management reviews these APMs to measure Santander UK's overall performance, position and profitability, and believes that their presentation provides useful information to investors. For definitions of these APMs and, where they are adjusted, reconciliations to the most comparable IFRS measures, see the 'Financial review' section.
We reviewed the APMs and are satisfied that they provide useful information to investors, and that management has clearly identified the APMs in this Annual Report and, where such APMs are adjusted, reconciled them to the most comparable IFRS measures.
Going concern
We satisfied ourselves that it is appropriate to use the going concern basis of accounting in preparing the financial statements, supported by a detailed analysis provided by senior Finance management.
As part of the assessment, we considered whether there are sufficient financial resources, including liquidity and capital, available to continue the operations of Santander UK. We considered Santander UK's resilience in the face of potential stress and prominent events. In making our assessment, we considered all information of which we were aware about the future, which was at least, but not limited to, 12 months from the date that the balance sheet was signed.
Oversight of external auditors
External Auditors
PwC were appointed in 2016 and their independence was considered and monitored throughout the year. We were satisfied that PwC continued to meet the independence requirements. Ian Godsmark became lead audit engagement artner from June 2022 following the resignation of Laura Needham from PwC.
Oversight of the relationship
Our review of the relationship with PwC included the following activities:
–Consideration of their audit plan and updates.
–Consideration of their work relating to management judgements and estimates.
–Consideration of the summary of misstatements not corrected by management. The Committee was satisfied that they were not quantitatively or qualitatively material, either individually or in the aggregate at each quarter.
–Discussion on the level of disclosure in the Annual Report and Half Yearly Financial Report to satisfy ourselves that it is appropriate.
–Discussion of developments in financial reporting including changes to statute, accounting standards and best practice.
–Review of PwC's reports on findings and recommendations on internal control and financial reporting matters identified during their audit and their view of management's progress in resolving them.
–Interactions, including meetings in private session during Committee meetings, and at other times throughout the year.
–Consideration of Santander UK specific independence issues, as well as those of PwC.
–Consideration of the FRC's Audit Quality Inspection Report published in July 2022 and other audit quality indicators including the PwC Transparency Report as part of our annual assessment of PwC's performance.
Based on the above inputs, captured in a formalised assessment, the Committee satisfied itself as to the rigour and quality of PwC’s audit process.
Non-audit fees
We have a robust policy on non-audit services provided by our external auditors. Non-audit services were under continuous review throughout 2022 to determine that they were permitted by reference to their nature, assessing potential threats and safeguards to auditor independence as well as the overall ratio of audit to non-audit fees.
All assignments require advance approval, either by the Chair (or in his absence his alternate), under delegated authority for amounts under £250,000 plus VAT or, if larger, by the Committee. This process is in addition to the requirement for all non-audit fees to be approved by the Banco Santander Audit Committee.
The fees for non-audit work performed by PwC in the year, are disclosed in Note 7 to the Consolidated Financial Statements. We ensured that these met the external and internal tests for maintaining their independence, including evidence of their professional scepticism. During 2022, the Company paid a fee of £1.4m to PwC in relation to incremental work undertaken in support of their audit of Banco Santander SA.
In 2022, PwC's non-audit related fees were 34% for the Company and 35% for the RFB of their total audit fees, well within the external cap of 70%.
Fees for non-audit work performed by PwC in the year, other than those in relation to audit-related assurance services, were 6% of the average of the fees approved for Deloitte, EY and KPMG.
Internal Controls and regulatory reporting
The Board Risk Committee has overall responsibility for the effectiveness of the internal control systems. However, due to the nature of internal control matters, there is a degree of overlap in responsibilities with those of this Committee, particularly regarding financial reporting controls.
Section 404 of the Sarbanes-Oxley Act requires management to report on the design and effectiveness of its internal controls over financial reporting (ICFR) framework. The Committee considered Management's enhancement of the SOx testing framework; 100% independent testing of controls; reviewing the adequacy of data lineage; and assessing potential risks from operating in a hybrid working environment.
Recognising the importance within statutory and regulatory reporting of capital and risk weighted asset metrics, many of which are not subject to external audit, the Committee retained its focus on the level of comfort we obtain. The PRA also emphasised the importance of the reliability of regulatory reporting in its thematic review published in September 2022. This area has always been covered by Internal Audit. We also reviewed the processes and governance in respect of preparing additional capital and risk management disclosures. We had a specific focus on liquidity risk reporting which is subject to a control enhancement programme.
The Committee monitored the control framework in place in respect of consultancy engagement as well as associated spend and performance of consultants. The appointment of a new Director of Procurement, with a focus on embedding the new procurement operation model, was welcomed by the Committee.
| | | | | | | | | | | | | | |
| Annual Report 2022 | Santander UK Group Holdings plc 72 |
| | | | | | | | | | | | | | | | | | | | | | | | | | | | | | | | | | | | | | | | | |
| Strategic Report | Sustainability and Responsible Banking | Governance | Risk review | Financial review | Financial
statements | Shareholder
information |
| | | | | | | | | | | | | |
| | | | | | | | | | | | | |
| | | | | |
| Board Audit Committee Chair’s report continued |
| |
| |
Internal Audit
The Internal Audit plan, based on a comprehensive risk assessment, including budget and resources, was presented in draft and then final form for challenge and recommendation by the Committee to the Board for its approval. The plan was updated at regular intervals in 2022 in response to changes in the business and the regulatory environment and at the request of the Committee.
All unsatisfactory and inadequate rated audit reports issued were subject to additional scrutiny by the Committee with the relevant business areas being required to present their action plans to the Committee. We also reviewed a sample of audit reports rated 'needs improvement' and requested management to present on progress with addressing Internal Audit's recommendations, issues encountered, milestones and dependencies.
We received regular reports on audit recommendations from our Chief Internal Auditor, quarterly and annual Internal Audit reports and monitored findings as part of our oversight. We considered the total number of recommendations, the rationale for any becoming overdue, and broader root cause analyses. We also requested that the Chief Internal Auditor highlight recommendations becoming due and any that were past due, as a result of past due recommendations increasing beyond reasonable expectation; this was remediated by the year-end. The strong engagement between Internal Audit and the business continued in 2022.
We also oversaw the objective setting, performance evaluation and remuneration of the Chief Internal Auditor, ensuring objectives were aligned to key priorities for the Company.
The Committee has approved the Internal Audit Charter and receives regular updates on the operational effectiveness of the Internal Audit function to confirm that it maintains its independence and to ensure its quality, experience and resourcing is appropriate. This is supplemented by regular interactions between the Chief Internal Auditor and the Committee Chair. We also receive feedback on interactions between Internal Audit, management and our external auditors.
A review is conducted every five years to evaluate the Internal Audit function in respect of its conformance with the standards of the Chartered Institute of Internal Auditors (CIIA), as well as its performance and effectiveness compared to industry peers and good practice. The next review is due in 2023 and a thorough process to select an external provider to carry out the review has been undertaken.
Recovery and Resolution Planning
The Committee oversaw management's progress on resolvability, including reviewing the preparations for the first resolvability public disclosure and arrangements supporting the ongoing maintenance and, where possible, enhancement of the Company's resolution capabilities. The Bank of England's (BoE) Resolvability Assessment Framework (RAF) sets out how it assesses UK financial firms' resolvability and introduces a public disclosure regime.
On 10 June 2022, the BoE published its first assessment of resolvability preparations of the eight major UK banks following its review of firms' self-assessment reports submitted to the PRA in October 2021 (as updated in February 2022). Santander UK was the only large systemic bank for which the BoE did not identify any 'material issues' across three resolution outcomes.
The Committee also oversaw the updating of the recovery plan which was submitted to the PRA in June 2022.
Whistleblowing
The Committee oversees Santander UK's whistleblowing arrangements including continuous refinement of our processes to align with evolving best practice. Santander UK recognises the importance of creating an environment where colleagues feel safe and able to Speak Up. Speaking Up is a core behaviour at Santander UK and there are a number of ways colleagues can do this, including raising a concern via Santander UK's Whistleblowing Team.
In 2022, management continued to manage the whistleblowing framework and arrangements under our oversight. We continued to refine our policies and operating procedures to stay abreast of best practice.
In November 2021, Santander UK delivered Ethics Training with a focus on the Company’s Ethical Code of Conduct, to our top 120 leaders and middle management. Our communications strategy has ensured the visibility and awareness of whistleblowing has remained high and dedicated and bespoke training to specific teams has been delivered. The Board received Whistleblowing training as part of its annual training programme.
The Committee considered bi-annual reports on Santander UK's whistleblowing arrangements. This included oversight and progress of concerns, outcomes, identifiable trends, observable risks, the regulatory environment, proposed changes to legislation and activities to promote and enhance the arrangements to support the culture of speaking up. The Committee also reviewed the annual Whistleblowing Report ahead of its submission to the Board.
The Committee is satisfied that Santander UK complied with the FCA and PRA regulations on whistleblowing in the year. I continued to act as the Whistleblowers' Champion to oversee the integrity, independence, and effectiveness of the whistleblowing arrangements and I remain focused on procedures and governance to prevent victimisation of employees who raise a whistleblowing concern. I meet regularly with management and I have been involved in overseeing the implementation of continuous improvements to the arrangements.
Other areas of 2022 focus
The Committee also reviewed management's response to the Department for Business, Energy and Industrial Strategy (BEIS) consultations.
The Committee also considered the Chief Financial Officer's objectives and annual performance evaluation.
Effectiveness of the Committee
As noted in the Board Nomination Committee Chair's Report above, as part of the internally facilitated Board evaluation carried out during the year, the Committees' performance was assessed and it was concluded that the Committees continue to perform effectively. The results of the evaluation and the subsequent action plan were considered and agreed by the Board as a whole. Information on the progress against actions from last year's review, this year’s evaluation process and areas for improvement identified is set out above.
In my capacity as Committee Chair, I meet with key members of the management team and the external auditors in advance of each Committee meeting. I ensure that the Committee meets with management and the external auditors in private sessions. I also attend meetings with the PRA and the FRC.
With regards to my operation as Committee Chair, the Board has determined that I have the necessary qualifications and skills to qualify as the Board Audit Committee financial expert as defined in item 16F of Form 20-F and by reference to the NYSE listing standards.
As I approach the end of my third term of appointment, it is my intention to resign during the second half of 2023 as a Director of both the Company and Santander UK plc, and therefore as Committee Chair. The Board Nomination Committee will propose a replacement in due course ensuring that the nominee has the necessary qualifications and skills.
Chris Jones
1 March 2023
| | | | | | | | | | | | | | |
| Annual Report 2022 | Santander UK Group Holdings plc 73 |
| | | | | | | | | | | | | | | | | | | | | | | | | | | | | | | | | | | | | | | | | |
| Strategic Report | Sustainability and Responsible Banking | Governance | Risk review | Financial review | Financial
statements | Shareholder information |
| | | | | | | | | | | | | |
| | | | | | | | | | | | | |
| | | | | |
| Board Responsible Banking Committee Chair’s report |
| |
| |
Introduction
On behalf of the Committee, I am pleased to present the Board Responsible Banking Committee report, providing details of the key topics we considered in the year. I would like to thank the Committee members and management for their continued support.
The Committee conducts its business concurrently with the RFB Board Responsible Banking Committee (the RFB Committee) to ensure alignment of practices, policies and procedures. Nicky Morgan, the RFB Committee Chair, and I have written this report jointly and, given that the RFB has within its perimeter the vast majority of Santander UK's business, this report details the governance arrangements, practices and activities of both the Committee and the RFB Committee.
Nicky and I collaborate to ensure that matters within the Committees' remit are considered by the appropriate forum, and to prevent any gaps in coverage. This is facilitated through a degree of common membership between the Committee and the RFB Committee which enhances visibility of matters that extend across Committees and fosters open channels of communication.
In summary, the Committee is authorised by the Board to:
–Oversee the operation of the business and subsidiaries to ensure they act in a responsible way, promoting their long-term success having due regard to the interests of the Company's stakeholders.
–Support management in shaping and driving the responsible banking agenda of the business across a broad spectrum of areas including customers, culture, diversity and inclusion, conduct, communities and climate change and the environment (the Board Risk Committee is responsible for overseeing the risks associated with climate change).
Committee composition
| | | | | | | | |
| Scheduled meetings | Ad hoc meetings |
| Ed Giera (Chair) | 4/4 | 0/0 |
| Lisa Fretwell | 4/4 | 0/0 |
| Chris Jones | 4/4 | 0/0 |
RFB Committee composition
| | | | | | | | |
| Scheduled meetings | Ad hoc meetings |
| Nicky Morgan (Chair) | 4/4 | 0/0 |
| Annemarie Durbin | 4/4 | 0/0 |
| Lisa Fretwell | 4/4 | 0/0 |
| Ed Giera | 4/4 | 0/0 |
| Chris Jones | 4/4 | 0/0 |
| Mark Lewis | 4/4 | 0/0 |
Other attendees at Committee meetings in 2022 included the CEO, Director of Corporate Communications and Responsible Banking, Chief People Officer, CRO, Director of Compliance, Chief Customer Officer, Everyday Banking, and Chief Customer Officer, Homes.
Key activities in the year
During 2022, the focus of the Committees' work was in the following areas:
Responsible Banking at Santander
Responsible banking is a broad term covering an extensive array of environmental, social and governance-related (ESG) matters that are key to delivering Santander UK's strategy.
Following our decision in 2021 to focus our energies on three strategically-aligned pillars in relation to which we believe we can promote the success of the Company and the RFB, in the long term, while also having a real impact for the companies' stakeholders, in February 2022 we considered and approved the key metrics and targets that would allow us to track progress against these pillars relative to our ambitions.
The three pillars, which you can read more about in the Responsible Banking and Sustainability section of this Annual Report, are:
–A Thriving Workplace: Creating a culture of inclusivity and belonging.
–Better Communities: Helping customers and communities prosper.
–A Healthy Environment: Responding to climate change and supporting the green economy.
The foundation underlying these pillars is to be responsible in everything we do. You can read more about this in the Strategic Report.
Our customers
The Committees' focus on supporting our customers continued to increase in 2022 given challenges posed by the cost of living crisis and ever more sophisticated fraudsters. To support us in providing holistic oversight of how we are performing in respect of our customers, we tasked management with designing a new report and dashboard which now allows us to track progress and focus our discussions on areas that require further attention.
For each of our scheduled meetings in 2022, we received reports on our support for vulnerable customers and how we are ensuring that we are ready to help customers who find themselves in financial hardship as a result of the cost of living crisis. We have been pleased to learn that management has been dedicated to putting robust measures in place to:
–Understand the financial health of our customers.
–Contact customers proactively with support and advice if we think they might find themselves in financial distress.
–Provide additional channels through which customers can request help from us.
–Give extra training to our financial support specialists.
–Increase the capacity in our contact centres.
We believe management has taken the right steps to help our customers during this difficult time and encourage them to continue to identify more ways to provide support.
In February 2022, the Committee held a fraud workshop in order to better understand the significant challenges that Santander UK, its customers and the industry as a whole face in this area. The outcome of the workshop was a series of practical recommendations aimed at increasing the protection for our customers. We were pleased to hear at our December 2022 meeting that good progress has been made and that there are further initiatives in the pipeline which will be launched in early 2023. A number of members of the Committees also visited the Fraud and Economic crime teams on-site to understand the challenges in more depth. We expect that fraud prevention and detection will continue to be a priority in 2023.
While we spend much of our time considering how we can address specific issues facing our customers, such as fraud and inflation, we also need to understand how our customers feel about Santander UK more generally in order to ensure that we continue to provide good service and good outcomes to customers. One way we do this is by scrutinising our Net Promoter Scores and encouraging management to resolve the underlying factors that negatively affect them. This ensures that management is continuously working to improve our service and support.
In order to get a more personalised view of customers' experiences, Directors also visited contact centres and branches during the course of 2022 where they observed customers' calls and interactions. This has allowed the Board to understand more about how we interact with our customers and the issues that are raised. Visits during 2022 included those to our Mays Meadow contact centre in Belfast and Liverpool Lord Street branch.
In addition to our traditional banking services, a key priority for Santander UK is helping our customers meet their 'green' ambitions. We provide more information on this below.
| | | | | | | | | | | | | | |
| Annual Report 2022 | Santander UK Group Holdings plc 74 |
| | | | | | | | | | | | | | | | | | | | | | | | | | | | | | | | | | | | | | | | | |
| Strategic Report | Sustainability and Responsible Banking | Governance | Risk review | Financial review | Financial
statements | Shareholder information |
| | | | | | | | | | | | | |
| | | | | | | | | | | | | |
| | | | | |
| Board Responsible Banking Committee Chair’s report continued |
| |
| |
Our people and culture
A Thriving Workplace is the first pillar of our Responsible Banking strategy and we spend a significant proportion of our meeting time assessing culture and colleagues' views of the organisation. We recognise that all teams differ, so we introduced a standing section to our quarterly meeting agendas called 'Employee Voice', where we hear directly from colleagues in specific teams. In 2022, we hosted colleagues from the Financial Support Centre of Excellence, the Customer Interactions team, the Technology and Operations team and the CFO division. We find it hugely valuable to deep dive into the experiences of each team. We encourage colleagues to be as open about the challenges they face as they are about their successes. This allows us to provide management with advice and support to resolve these challenges, and to identify any thematic issues that may need a more structured or strategic approach.
Annemarie Durbin, the Santander UK plc Employee Designated Director reports on her interactions with colleagues at each quarterly meeting. In addition, each NED has completed an employee engagement plan arranged for them by the Corporate Governance Office. In 2022, these included visits to contact centres, offices and branches. A number of us also attended events and meetings with Santander UK colleague networks including the Embrace network, an inclusive community for LGBTQ+ colleagues and allies to share information, personal experiences and hold discussions, and the Ethnicity@Work network which celebrates and embraces cultural differences from race, belief, traditions, heritage and customs. We look forward to more interactions in 2023.
We recognise that many of our colleagues will be as affected by the cost of living crisis as our customers, and the Board focused on ensuring we provide a range of support to help. You can read more about this in the Board Remuneration Committee Chair's report.
Diversity and inclusion
The Committees considered Santander UK's approach to increasing diversity and inclusion at the majority of its scheduled meetings in 2022. We were pleased to note that we have been successful in improving the gender and ethnicity representation at senior levels. However, we acknowledge that there is still much to do and we were disappointed that with the results of our pay gap reporting, details of which you can find in the Board Remuneration Committee Chair's Report and Sustainability and Responsible Banking section. One way to enable us to be more proactive in improving diversity and inclusion is to enhance the data we have about it. In 2022 we welcomed an exercise conducted by management to improve our data disclosure options to ensure all our people feel they can select options that best reflect their individual identity. This has seen us improve our data disclosure rates for ethnicity and sexual orientation by 4% to 77% and 59%,
respectively. Management has undertaken to continue to help key decision makers across the business to use this data to take more targeted actions to improve representation and experience across Santander UK.
An updated Diversity and Inclusion strategy, with planned supporting actions aimed at closing the gender and ethnicity pay gaps, will be considered by the Committees in H1 2023.
Social mobility
In September 2022, management presented the first draft of an exciting new strategy aimed at facilitating greater social mobility for the benefit of our people, customers and communities. We welcomed the initiative and collaborated with management to give them the benefit of our experience and knowledge to refine the strategy to make it as impactful as possible, encouraging them to focus on a limited number of initiatives that could make the most difference. We were pleased to consider the final draft strategy at our December 2022 meeting where we recommended it to the Board for approval. You can find more information on Santander UK's social mobility strategy and activities in our Everyday Inclusion and Pay Gap Report 2022.
Our communities
Better Communities is the second pillar of our Responsible Banking strategy. Our communities are the foundations of our society and we believe that acting responsibly in relation to them, and providing investment in them, will make a great difference. The Committees also agreed that it is important that Santander UK focuses our efforts on activities through which we can make the biggest impact, and these tend to be linked to our business model and strategy. We have therefore encouraged management to continue our financial education and inclusion initiatives and agreed the priorities and structure of our Universities Programme and particularly our strategic partnership with Milton Keynes University (MK:U). For more on this, see the Sustainability review.
Regulators and compliance
Our regulators are a key stakeholder as they authorise Santander UK to provide our services to our customers. Complying with regulatory requirements and best practice is a priority, so we proactively engage with our regulators. While management undertakes the majority of engagement, Directors with specific SMF responsibilities meet regularly with the PRA and FCA.
At each quarterly meeting, the RFB Committee receives comprehensive updates on the Ring-Fenced sub-group's conduct and compliance risk status, as well as actions to resolve any issues. The report also includes 'horizon scanning' to show the Committee what regulatory or compliance matters are expected in the future and how management plans to address them.
A key part of our regulatory agenda in 2022 was preparing, planning for, and implementing the new Consumer Duty. The Committee held a Consumer Duty workshop in Q2 2022 to get early sight of what was expected of the final rules and understand how management was preparing. Once the rules were published at the end of July 2022, the Board and the Committee held a series of meetings to ensure that a sound and robust implementation plan was available for approval by the October 2022 deadline. The RFB Committee Chair, Nicky Morgan, has been appointed as Consumer Duty Champion and the RFB Committee will oversee implementation in the RFB sub-group leading up to the deadline of 31 July 2023.
Responding to climate change
A Healthy Environment is the third pillar of our Responsible Banking strategy. Santander UK is committed to reducing both its financed carbon emissions and its own emissions to support the ambition to limit climate change to 1.5 degrees. In April 2022, the Committee met the then COP President, Alok Sharma, to discuss the climate change opportunities and challenges in the banking sector, and the key issues that could be influenced by Government. For more on this workshop, see the Sustainability review.
Santander UK is also aware and supportive of the fact that many of our customers want to reduce their impact on the environment. The Committee encouraged management to support customers in meeting their ambitions and we were pleased to see decisive action taken by management, including the launch of the 'My Homes Manager' app for mortgage customers. Using the app, customers can view the Energy Performance Certificate of their home and find tips for saving energy and reducing their bills.
The Committee also considered Santander UK's financed emissions reduction trajectory taking into account other key considerations such as customer and social impacts and Board Risk Appetite. This will continue to be a key focus in 2023.
Effectiveness of the Committee
As noted in the Board Nomination Committee Chair's Report, as part of the internally facilitated Board evaluation carried out during the year, the Committees' performance was assessed and it was concluded that the Committees continue to perform effectively. The results of the evaluation and the subsequent action plan were considered and agreed by the Board as a whole. Information on the progress against actions from last year's review, this year’s evaluation process and areas for improvement identified is set out above. An action plan for the Committees will be agreed at a forthcoming meeting. We will report on the actions identified and progress against them in next year's Annual Report.
Ed Giera
1 March 2023
| | | | | | | | | | | | | | |
| Annual Report 2022 | Santander UK Group Holdings plc 75 |
| | | | | | | | | | | | | | | | | | | | | | | | | | | | | | | | | | | | | | | | | |
| Strategic Report | Sustainability and Responsible Banking | Governance | Risk review | Financial review | Financial
statements | Shareholder
information |
| | | | | | | | | | | | | |
| | | | | | | | | | | | | |
| | | | | |
| Board Remuneration Committee Chair’s report |
| |
| |
Introduction
On behalf of the Committee, I am pleased to present the Board Remuneration Committee report, providing details of the key topics we considered in the year. I would like to thank the Committee members and management for their continued support.
The Committee conducts its business concurrently with the RFB Board Remuneration Committee (the RFB Committee) (together the "Committees") to ensure alignment of practices, policies and procedures. Annemarie Durbin, the RFB Committee Chair, and I have written this report jointly and, given that the RFB has within its perimeter the vast majority of Santander UK's business, this report details the governance arrangements, practices and activities of both the Committee and the RFB Committee.
Annemarie and I collaborate to ensure that matters within the Committees' remit are considered by the appropriate forum, and to prevent any gaps in coverage. This is facilitated through a degree of common membership between the Committee and the RFB Committee which enhances visibility of matters that extend across Committees and fosters open channels of communication.
The Committee is authorised by the Board to:
–Set the overarching principles and parameters of remuneration policy across Santander UK. We do so in consultation with the RFB Committee to ensure that the RFB is able to comply with its legal and regulatory obligations, including its ring-fencing obligations.
–Oversee implementation of remuneration policies, including considering and approving the remuneration arrangements (including bonuses) for EDs and senior executives. We approve individual remuneration awards and also changes to senior executive incentive plans.
–Approve the framework by which colleagues are designated as Material Risk Takers (MRT) and oversee MRT remuneration arrangements, including bonuses.
Committee composition
| | | | | | | | |
| Scheduled meetings | Ad hoc meetings |
| Chris Jones (Chair) | 6/6 | 0/0 |
| Ed Giera | 6/6 | 0/0 |
RFB Committee composition
| | | | | | | | |
| Scheduled meetings | Ad hoc meetings |
| Annemarie Durbin (Chair) | 6/6 | 2/2 |
| Ed Giera | 6/6 | 2/2 |
| Chris Jones | 6/6 | 1/2 |
| Mark Lewis | 6/6 | 2/2 |
Other attendees at the Committee meetings in 2022 included the CEO, Chief People Officer, Performance and Reward Director, Head of Performance and Reward and the Committees' Independent Adviser. The CRO and Director of Compliance (DoC) join the meetings regularly to give updates and recommendations on risk performance and potential remuneration risk adjustments.
No individual participates in discussions regarding their own remuneration.
Key activities in the year
During 2022, the focus of the Committees' work was in the following areas:
Aligning remuneration with strategy
As always, a key consideration when agreeing our variable pay framework for the year is ensuring it incentivises our people to deliver Santander UK's strategy and business model for the long-term benefit of the Company and its stakeholders. It must also be designed to incentivise our people to exhibit the right behaviours.
For 2022, we ensured that our bonus scorecard continued to be aligned with our strategy, including our strategic commitments to our shareholder, our people, our customers and our wider communities. We approved a balanced scorecard of financial and non-financial metrics and targets, including metrics related to customer satisfaction and loyalty, and employee engagement scores. In order to support our Responsible Banking ambitions, which you can read more about in the Board Responsible Banking Chair's Report and Strategic Report, we included targets relating to financial empowerment and we also included a mechanism by which the bonus pool would be increased if management delivered targeted increases in diversity representation. We also tracked a sustainability metric aimed at supporting our customers to reduce their carbon emissions, in anticipation of being able to include it in a future bonus scorecard, should it be considered appropriately robust and strategically aligned. We will update you on that in our 2023 Report.
For more on the 2022 variable pay framework, including the metrics used in the scorecard for Santander UK plc, see the Remuneration Implementation Report.
Business performance in 2022 and impact on remuneration
The Committees made the year-end variable pay decisions in the context of the strong performance of the business, the wider economic environment and the fact that our customers and communities are facing significant inflationary pressures. In addition, while seeking to fairly reward hard work and strong financial and non-financial performance against our business strategy, we were mindful of the potential for improved business results that could be considered as a windfall resulting from the macroeconomic conditions in the year.
As usual, we also took into account an assessment of current and future risks when approving the overall bonus pools for Santander UK, Santander Consumer UK and Santander Financial Services, as well as bonus awards for Executive Directors.
The Committees are satisfied that 2022 variable pay outcomes for all colleagues appropriately reflect Santander UK’s business performance and are fair, consistent, and aligned to our stakeholders’ interests. For more on these outcomes, see the Remuneration Implementation Report.
All employee matters - cost of living
The Committee's roles and remit extend beyond the Executive Directors to include other senior roles (including MRTs) and, importantly, to the oversight of the implementation of remuneration policies for all colleagues across Santander UK.
We continued to ensure that executive remuneration decisions are informed by, and consistent with, the approach taken for employees more broadly. Ensuring our colleagues across the businesses are fairly remunerated is also a key focus for the Committees. As such, the Committees undertake an annual review of the remuneration policies and practices for the wider workforce and receive updates throughout the year on other key matters. Given the impact of the cost of living crisis on our colleagues, we considered these matters at the majority of our scheduled meetings during 2022.
During the year, the Committees endorsed and championed management's drive to support our people in managing the challenges arising from the cost of living crisis, particularly the lowest paid. We received regular updates on the assistance that Santander UK was putting in place to support colleagues. In December 2022, we conducted a review of all initiatives that had been delivered to satisfy ourselves that our approach had been fair, reasonable, targeted and, most of all, impactful. These initiatives included:
–An exceptional 4% salary increase awarded to all employees earning less than £35,000 per annum (full time equivalent) from 1 August 2022.
–An increase in entry level salaries from 1 August.
–A new financial support helpline, run by a dedicated team of Financial Care Specialists in the Financial Support Team, launched in October 2022. The helpline gives guidance on account options, repayment plans and budgeting tips for all employees.
Santander UK is an accredited Real Living Wage employer, a status over which the Committees maintain oversight.
We have once again voluntarily disclosed our CEO pay ratio. For more, see the Remuneration Implementation Report.
| | | | | | | | | | | | | | |
| Annual Report 2022 | Santander UK Group Holdings plc 76 |
| | | | | | | | | | | | | | | | | | | | | | | | | | | | | | | | | | | | | | | | | |
| Strategic Report | Sustainability and Responsible Banking | Governance | Risk review | Financial review | Financial
statements | Shareholder
information |
| | | | | | | | | | | | | |
| | | | | | | | | | | | | |
| | | | | |
| Board Remuneration Committee Chair’s report continued |
| |
| |
All employee matters - benefits
In 2022, we continued our oversight of all employee benefits, supporting management's efforts to ensure that our benefits proposition is competitive and meaningful to our colleagues. Providing a breadth of benefits choices across financial, lifestyle, health and protection satisfies our colleagues' core benefits expectations as well as providing a good range of additional benefits choices that are highly valued. The Committees' view this as particularly important in light of the cost of living crisis.
We continued our oversight of the work management was undertaking with regards to our defined contribution pensions offering, and were pleased to support the introduction of a minimum employer contribution of 8% with no colleague contribution necessary. Other enhancements that will significantly strengthen our offering include the removal of service-related increments, which increases fairness. The changes, which will positively impact thousands of our people, and which will be particularly meaningful for our most junior colleagues, come into effect in April 2023. This has been well-received by colleagues.
Employee wellbeing is a key guiding principle for our benefits strategy and we were pleased that one of the improvements made to our offering in 2022 was to make available to all colleagues a free app-based service offering sessions with a private GP, physiotherapist, mental health professional, and a medical second opinion service.
Executive Director reward
In Q1 2022 we welcomed Mike Regnier as our new CEO, whose remuneration arrangements we reported on in last year's Annual Report. As a result of Nathan Bostock, our former CEO, transferring to a role at Banco Santander SA, he has retained his right to his deferred reward and is eligible for a pro-rated 2022 bonus. More information on this is available in the Remuneration Implementation Report.
Reward for senior colleagues
The talent market in the UK continued to be very competitive in 2022, particularly in key operational roles such as IT and cyber-security. Given the need to continue to attract and retain top talent with the relevant skills and experience to drive our strategic agenda forward, we had to carefully consider the remuneration for a number of key roles. To support us in doing so, the Committees continued to monitor our remuneration framework and approach to external market benchmarking, with the support of our external adviser, Deloitte LLP.
Where the business recruited or promoted senior members of management, we scrutinised the proposed remuneration and challenged where appropriate.
We also agreed the removal of long-term Banco Santander SA performance metrics to more closely align Executive Committee members' incentives with Santander UK's strategic priorities. These metrics only apply to the CEO from 2022 onwards.
Risk Adjustments
Our risk adjustment procedures, which are applicable to all colleagues, are robust and well embedded within our remuneration policy framework. We continue to use a range of risk adjustment mechanisms, including reducing the bonus pool and / or individual bonus awards in the current and previous years, and / or reducing the amount of any unvested deferred variable remuneration. Our approach to risk adjustment is under continuous review to adapt to the changes in Santander UK’s operating environment, ensuring that they remain comprehensive, relevant and compliant with regulatory requirements.
The CRO and DoC report to us regularly, providing commentary on the risk profile and performance of the business in the year, and recommending any collective or individual adjustments that we may wish to implement as a result.
Ahead of the 2022 variable remuneration pay review, we spent time considering the fairest and most proportionate way of taking current risk issues into account. In particular, we spent significant time considering the most fair and proportionate way to deal with the FCA's penalty relating to historical anti-money laundering controls between 2012 and 2017. The failings and penalty were taken into account as part of the 2022 bonus pool determination calculation.
Diversity Pay Reporting
We remain committed to increasing diversity and inclusion at Santander UK, recognising its benefits to our business, colleagues and our wider communities.
While the Committees are responsible for overseeing Santander UK's approach to pay gap reporting, the Board Responsible Banking Committee (RBC) is responsible for overseeing management’s approach to, and progress in, improving diversity and inclusion across Santander UK. For more on this, see the RBC Chair's report.
Our 2022 Pay Gap Report, now known as the Everyday Inclusion and Pay Gap report, which was analysed and approved by the RFB Committee, was published in December 2022. Given our commitment to inclusion more broadly, this year we have provided a more holistic overview of our actions and progress towards achieving everyday inclusion, including additional metrics on diversity representation and employee experience. For more information on our approach to everyday inclusion, see the RBC Chair's report and the Sustainability and Responsible Banking section of the Strategic Report.
In terms of the results, the mean gender pay and bonus gaps reduced in 2022, while the median gender pay and bonus gaps increased. Mean and median binary ethnicity pay and bonus gaps also increased. Clearly these results are disappointing and management has worked hard to identify the reasons behind the increases and create an action plan to address the factors within Santander UK's control. More details can be found in Everyday Inclusion and Pay Gap Report on our website, which does not form part of this Annual Report.
The Committee and the RBC will continue to provide oversight and encouragement to management to improve our diversity, inclusion and fair pay in 2023.
Committee adviser tender
In November 2021, the Committee reviewed the independence and effectiveness of the current Remuneration Committee Advisor, Deloitte LLP. While the review confirmed that Deloitte remained independent and effective, it was agreed that a formal tender would be conducted in 2022 as a matter of best practice.
Four independent firms participated in the tender, each of whom provided a written submission and met with management. They were assessed on an objective basis on factors including proven experience and credentials, understanding of Level One banking remuneration regulations and cultural fit with Santander UK. Two firms were shortlisted and were interviewed by the Chair of the RFB Committee and one of its members.
Based on the above criteria, the re-appointment of the current Independent Adviser, Deloitte, was approved at the September 2022 meeting. We look forward to continuing to work closely with them.
Regulatory changes and engagement
Regulatory requirements and expectations are at the forefront of the Committees' considerations when making decisions and we are kept abreast of changes in regulatory requirements via a variety of means, including by management and our Independent Adviser. The Chairs of the Committees meet with our regulators on a periodic basis to update them on recent developments and upcoming matters. We also encourage management to engage proactively and regularly with our regulators on matters of interest to them. Ensuring that the new Consumer Duty is appropriately reflected in our variable pay framework going forward will be a key focus for the Committee in 2023.
Effectiveness of the Committee
As noted in the Board Nomination Committee Chair's Report, as part of the internally facilitated Board evaluation carried out during the year, the Committees' performance was assessed and it was concluded that the Committees continue to perform effectively. The results of the evaluation and the subsequent action plan were considered and agreed by the Boards. Information on the progress against actions from last year's review, this year’s evaluation process and areas for improvement identified, is set out in the Board Nomination Committee Chair's Report.
Chris Jones
1 March 2023
| | | | | | | | | | | | | | |
| Annual Report 2022 | Santander UK Group Holdings plc 77 |
| | | | | | | | | | | | | | | | | | | | | | | | | | | | | | | | | | | | | | | | | |
| Strategic Report | Sustainability and Responsible Banking | Governance | Risk review | Financial review | Financial
statements | Shareholder
information |
| | | | | | | | | | | | | |
| | | | | | | | | | | | | |
| | | | | |
| Remuneration policy report |
| |
| |
Basis of preparation
This report has been prepared on behalf of the Board by the Board Remuneration Committee. We comply with the statutory reporting obligations for large private companies. Furthermore, we applied the UK Corporate Governance Code 2018 (the Code) and complied with the Provisions other than where stated in the Directors' Report. In addition, we comply with other listed disclosure requirements to the extent considered appropriate taking into account our ownership structure.
Accordingly, several voluntary disclosures relating to remuneration are presented in this report.
Remuneration policy for Executive Directors (EDs)
Our remuneration policy, which applies to EDs, is outlined below. Remuneration is structured in two elements: fixed and variable pay. Fixed pay is set at market competitive levels appropriate for the role. Variable pay rewards the delivery of internal financial targets, key strategic priorities and individual performance, subject to risk adjustment.
Remuneration policy applicable to Executive Directors in the year
| | | | | | | | |
| | |
| Fixed pay | Principle and description | Policy |
| Base salary | –To attract and retain EDs of sufficient calibre and with the skills to deliver our strategy, taking into account the demands and complexity of the role. | –Base salaries are normally reviewed annually. In reviewing base salaries the Committee considers a number of factors, including: –the skills required and responsibilities of the role alongside the market value of those attributes; –the requirement for base salaries to be set at a level to avoid inappropriate risk taking; –base salary increases across the colleague population; and –prevailing market and economic conditions. |
| Pension arrangements | –To provide a discrete element of the package to contribute towards retirement. | –All EDs receive a cash allowance in lieu of pension in line with the wider workforce average, currently 9% of salary.
|
| Other benefits | –To offer a competitive package and to support employee wellbeing. | –Including but not limited to: private medical insurance for EDs and their dependants, life assurance, health screening, and relocation allowances where relevant. –Access to Santander UK’s all-employee share schemes on the same terms as all UK employees. |
| | | | | | | | |
| Variable pay | Principle and description | Policy |
| Variable pay plans | –The Variable Pay Plan aims to motivate EDs to achieve and exceed annual internal targets within Santander UK’s Risk Appetite and aligned with our business strategy and values. –Multi-year deferral and delivery in Banco Santander SA shares aligns EDs’ interests to the long-term interests of Santander UK. Further performance testing also applies for the CEO. –Part of the award is deferred according to the requirements of the PRA Rulebook (Remuneration Part). –The long-term Transformation Incentive Plan recognises the collective achievement of key financial and non-financial targets associated with the bank's ongoing transformation. | –Bonus awards under the Variable Pay Plan are discretionary and determined by reference to performance against a scorecard of financial and non-financial goals, as well as individual performance. –40% of any bonus awarded is paid upfront after the performance year ends, and delivered at least half in shares. –60% of the bonus awarded is deferred and delivered in equal tranches over years three to seven, with each tranche delivered at least half in shares. –For the CEO, the first three of five deferred award tranches are subject to further performance testing, which may reduce or increase the payout. –The Transformation Incentive is based on performance assessed over a three year period with further deferral into cash and share based awards in line with regulatory requirements. –Share based awards are subject to a minimum twelve-month retention period following vesting. –Malus and clawback provisions apply to variable pay for up to ten years following the grant of an award. –The structure of variable pay awards means EDs acquire a meaningful shareholding in Banco Santander SA which may extend for a significant period post-employment. In addition, the CEO is subject to a Shareholding Policy, which ensures alignment with the long-term interests of Banco Santander shareholders. The requirement under the policy is set at two times the incumbent’s net salary upon appointment. A formal post-employment shareholding requirement is therefore not in place. |
| | | | | | | | | | | | | | |
| Annual Report 2022 | Santander UK Group Holdings plc 78 |
| | | | | | | | | | | | | | | | | | | | | | | | | | | | | | | | | | | | | | | | | |
| Strategic Report | Sustainability and Responsible Banking | Governance | Risk review | Financial review | Financial
statements | Shareholder
information |
| | | | | | | | | | | | | |
| | | | | | | | | | | | | |
| | | | | |
| Remuneration policy report continued |
| |
| |
Our remuneration policy continues to meet regulatory requirements. Santander UK applies a 2:1 variable to fixed pay cap in line with approvals granted to Banco Santander SA by its shareholders. For control function roles, a lower ratio of 1:1 is normally applied.
Executive remuneration policies
and principles
Our core values of Simple, Personal and Fair drive our remuneration policy. We focus on delivering a reward framework that is easily understood, tailored to individual roles, competitive and fair.
The key drivers of our Remuneration Policy
Alignment to culture
–To design policies aligned to the long-term success of the business, which support the delivery of our strategy and reinforce our values.
–To base variable pay on a balanced scorecard of quantitative and qualitative metrics which reflect our strategic priorities across Customers, Shareholders, People and Communities. This ensures that our day-to-day activities align with Santander UK’s strategic priorities which focus on customer loyalty and experience, simplification, improved efficiency and sustainable growth while aiming to be the best bank for all our stakeholders.
Simplicity
–To ensure our approach to remuneration is transparent and easily understood.
–To operate clear structures to support each colleague to link their contribution to the success of the organisation.
Risk
–To apply a consistent approach to reward for all our employees which upholds our prudent approach to Risk Appetite set as part of a Santander UK-wide framework. Risk adjustment occurs at an individual and bonus pool level.
–To provide a package that is balanced between fixed and variable pay, and short-term and long-term horizons, which aligns to our strategy whilst promoting prudent risk management.
–To ensure remuneration is compliant with applicable regulations and legislation.
Fairness
–To take into account an assessment of the EDs' performance against objectives set at the start of the year covering a range of financial, non-financial, quantitative and qualitative criteria.
–To set robust and stretching internal targets and reward exceptional performance.
–To attract, retain and motivate employees of the highest calibre by providing total remuneration which reflects individual and Company performance, is competitive, reflects the responsibilities of the role and drives the organisation’s growth and transformation.
–To consider wider employee pay and conditions when determining pay of our Executives.
Clarity
–The Committee reviews remuneration reporting on an annual basis against principles of best practice and developments in corporate governance, including the Code. Our reporting is designed to be transparent to promote effective stakeholder engagement, whilst reflective of our structure.
Predictability
–The Committee annually reviews the variable pay opportunity for individuals and the basis of the bonus pool calculation. Due to commercial sensitivity, these are not disclosed as per the provisions of the Code. Directors’ remuneration is within the variable pay cap as approved by Banco Santander SA shareholders and set out above.
On recruitment
When appointing a new ED, base salary is set at a market competitive level appropriate for the role, taking into consideration a range of factors including role scope and responsibilities, internal and external peer groups, relevant experience, and affordability.
Unless determined otherwise, any new ED will receive a pension allowance in line with the wider workforce average, currently 9% of salary. Benefits available will typically be aligned to the wider employee population.
Remuneration will be established in line with the Remuneration Policy, as set out in the EDs’ remuneration structure table in this report.
Relocation support and international mobility benefits may also be given. Where provided, relocation assistance will normally be a capped amount for a limited time. In cases of international mobility, the Committee will have discretion to offer benefits and pension provisions which reflect home country market practice and align to relevant legislation.
Buy-out awards
Compensation may be provided to EDs recruited externally for the forfeiture of any awards on leaving their previous employer. The Committee retains discretion to make such compensation as deemed appropriate to secure the relevant individual’s employment and will ensure any such payments align with both the long-term interests of Santander UK and the prevailing regulatory framework.
Such payments will be in line with the awards foregone as a result of leaving the previous employer taking into account value, form of awards, vesting dates and the extent to which performance conditions applied to the original awards.
Service agreements
The key terms and conditions of employment are set out in individual service agreements. These agreements include a notice period of six months from both the ED and the Company.
The agreement reserves a right for the Company to terminate employment immediately with a payment in lieu equal to the ED's fixed pay for the notice period. In the event of termination for gross misconduct, neither notice nor payment in lieu of notice is required.
Termination payments
The remuneration impact of an ED leaving the Company, including treatment of variable pay and/or any termination payment will reflect the terms of the service agreements, relevant scheme rules, regulatory requirements and the Committee’s policy relevant to the reason for leaving.
Outstanding variable pay awards will generally lapse on termination, other than where an individual is considered a ‘good leaver’. Where an ED is a good leaver, eligibility to variable pay awards will normally subsist until the relevant scheduled payment dates and will remain subject to performance where relevant.
The Committee determines whether an ED is a good leaver. Usual good leaver circumstances include but are not limited to: injury, ill-health, disability, redundancy, retirement and death. The Committee may, at its discretion, determine an ED a good leaver in any other circumstances.
A framework is in place to guide the Committee to determine the discretionary circumstances when good leaver status is appropriate. Other than a payment in the event of redundancy, there are generally no other payments upon termination of employment for EDs.
In the event of a change in control, any outstanding variable pay awards will be treated in line with the relevant scheme rules, taking into account applicable regulatory requirements.
| | | | | | | | | | | | | | |
| Annual Report 2022 | Santander UK Group Holdings plc 79 |
| | | | | | | | | | | | | | | | | | | | | | | | | | | | | | | | | | | | | | | | | |
| Strategic Report | Sustainability and Responsible Banking | Governance | Risk review | Financial review | Financial
statements | Shareholder
information |
| | | | | | | | | | | | | |
| | | | | | | | | | | | | |
| | | | | |
| Remuneration policy report continued |
| |
| |
Risk and Performance adjustment
We continue to meet the regulatory requirements in respect of risk and performance adjustment. All variable remuneration is subject to adjustment for current and future risks through our Additional Risk Adjustment Standard which is linked to our Board approved Risk Appetite.
The Standard provides both a formula-based assessment against Santander UK’s Risk Appetite and an additional qualitative risk event assessment that can reduce the bonus pool or individual awards to nil at the Committee’s discretion.
Our Individual Remuneration Adjustment Standard provides a framework for the process, governance and standards relevant for decisions in relation to individual performance adjustments following an incident, including the application of malus and clawback.
Performance adjustments may include, but are not limited to:
–reducing an award for the current year;
–reducing the amount of any unvested deferred variable remuneration;
–requiring an award which has not yet been paid to be forfeited; and
–requiring repayment on demand (on a net basis) of any cash and share awards received at any time for a period of up to ten years following the date of award.
The Committee has full discretion to prevent vesting of all or part of an amount of deferred remuneration and/or to freeze an award during an ongoing investigation in a number of circumstances, including:
–colleague misbehaviour, misconduct or material error;
–material downturn in the performance of Santander UK or a relevant business unit; and
–Santander UK or a relevant business unit suffering a material failure of risk management.
When determining variable pay awards for individuals performing roles across Santander UK plc and Santander UK Group Holdings plc, the Santander UK Group Holdings plc Board Remuneration Committee will apply any necessary discretion based on factors related to UK group entities outside of Santander UK plc. This discretion is subject to validation by the Santander UK plc Board Remuneration Committee.
The Committee seeks input from the Chair of the Board, Chair of the Board Risk Committee, Chair of the Board Audit Committee, Chief Risk Officer, Director of Compliance, Chief People Officer and Chief Internal Auditor when determining whether any performance or risk adjustments are required.
Policy for all employees
Our performance and reward approach across the Company supports our business strategy, rewards strong performance and reinforces our values within the approved risk management framework. The general principles of the Remuneration Policy broadly apply across all colleagues where appropriate, and are designed to facilitate recruitment, motivation and retention whilst driving performance.
The composition of remuneration packages for EDs is aligned with the broader colleague population, comprising salary, benefits, workforce aligned pension provisions and eligibility for discretionary variable pay dependent on role and responsibility.
The Committee annually approves the operation of variable reward schemes for all our colleagues to ensure they reward appropriate behaviour and do not incentivise activities which are outside risk appetite.
| | | | | | | | | | | | | | |
| Annual Report 2022 | Santander UK Group Holdings plc 80 |
| | | | | | | | | | | | | | | | | | | | | | | | | | | | | | | | | | | | | | | | | |
| Strategic Report | Sustainability and Responsible Banking | Governance | Risk review | Financial review | Financial
statements | Shareholder
information |
| | | | | | | | | | | | | |
| | | | | | | | | | | | | |
| | | | | |
| Remuneration implementation report |
| |
| |
Introduction
This section of the report outlines how our Remuneration Policy was implemented for 2022.
Variable Pay Plan
To incentivise and reward EDs for achieving superior and sustained performance, our Directors participate in an annual variable incentive plan. A balance of financial and non-financial performance metrics are selected annually by the Committee and are aligned with our strategy as measured over the financial year. Multi-year deferral and delivery in Banco Santander SA shares ensure that EDs’ interests are aligned to the long-term interests of the business. Further long-term performance testing also applies for the CEO.
Both upfront and deferred awards are made at least half in shares or share-linked instruments. The deferred element is delivered over seven years. Effective 2022 and for the CEO only, the first three deferred tranches of awards are subject to further performance testing against long-term metrics. Awards delivered in shares or share-linked instruments are subject to an additional one-year retention period from the point of delivery.
The 2022 Variable Pay Plan pool was determined based on a range of metrics using a balanced scorecard approach as follows:
Quantitative assessment
A quantitative assessment is undertaken against a balanced scorecard of financial and non-financial metrics that are key to Santander UK’s 2022 strategy. Performance metrics are reviewed annually to ensure continued alignment with strategy and, for 2022 a simplified scorecard comprised:
–Customers (Net Promoter Score, Loyal Customers and Total Customers)
–Shareholders
–ROTE
–RORWA (where an accelerator could apply subject to ROTE and Capital generation)
–Sustainability (Financial Empowerment)
–People (Employee Engagement and a Diversity and Inclusion multiplier).
A profit underpin applies which requires Profit after Tax to remain positive in order to pay any award, with a reduced pool should profit reduce substantially from the prior year.
Qualitative assessment
A qualitative assessment adds context to the quantitative assessment and ensures a balanced view of performance is taken. Performance is assessed across metrics including but not limited to: customers (conduct risk), profitability (results and costs) and responsible banking.
Banco Santander Group Multiplier
The Committee has the discretion to adjust the pool upwards or downwards to reflect overall Banco Santander performance if appropriate.
Regional Adjustment
A Regional Adjustment was introduced in 2021, to reflect the UK's contribution to performance of the Banco Santander group's European Region (comprising Spain, Portugal, Poland and the UK).
Exceptional Adjustment
Exceptional adjustments allow for unexpected factors or additional internal targets not covered by the quantitative or qualitative assessments to be reflected in variable pay outcomes.
UK-focused risk adjustment
The UK-focused risk adjustment is linked to Santander UK’s Risk Appetite and provides both a formula-based assessment against Risk Appetite and an additional qualitative risk event assessment overlay. Consideration is given to risk appetite limit breaches including but not limited to: customers, conduct, operational, reputational and financial crime risk. This can result in a downward risk adjustment of up to 100% of the bonus pool or individual awards at the discretion of the Committee.
The Committee reviews and approves remuneration governance and frameworks on an annual basis to ensure continued compliance with the relevant regulatory rules, including for ring-fencing.
Individual assessment
The allocation of the pool is based on an individual's performance, taking into account a range of factors. Specifically an individual's performance is assessed 50% against the delivery of priorities (the 'What'), 40% against the behaviours exhibited to deliver these priorities (the 'How') and 10% on Risk.
Deferred long-term awards
Effective 2022, performance testing applies to a portion of the deferred awards for the CEO. Prior to 2022, this applied to all EDs. Any outstanding deferred awards granted to EDs prior to 2022 will remain subject to performance testing.
Performance testing applies to the first three deferred tranches of the 2022 awards (36% of the total award) which are payable in 2026, 2027 and 2028. Performance is measured over a three-year period 2023 to 2025.
The performance measures for 2022 awards are relative TSR, ROTE and ESG metrics. Following the performance assessment, the level of awards will be adjusted accordingly.
To drive performance, these measures can now both reduce and increase the overall value of the deferred awards.
Transformation Incentive Plan
This is a one-off long-term incentive plan which is designed to recognise the achievement of financial targets and an enhanced customer experience, whilst maintaining appropriate conduct controls and risk management, over the course of our transformation period.
Awards under the plan will be assessed over the period 1 January 2021 to 31 December 2023. Awards are granted half in cash and half in share-based units (linked to the Banco Santander SA share price), and will vest in accordance with regulatory requirements.
| | | | | | | | | | | | | | |
| Annual Report 2022 | Santander UK Group Holdings plc 81 |
| | | | | | | | | | | | | | | | | | | | | | | | | | | | | | | | | | | | | | | | | |
| Strategic Report | Sustainability and Responsible Banking | Governance | Risk review | Financial review | Financial
statements | Shareholder
information |
| | | | | | | | | | | | | |
| | | | | | | | | | | | | |
| | | | | |
| Remuneration implementation report continued |
| |
| |
2022 Business Performance and Impact
on Remuneration
In the context of continued economic uncertainty and high inflation, our priority remains supporting our customers and people. Despite this challenging operating environment, the hard work of our colleagues has helped us to deliver a strong set of results. Strong profit performance was driven by net mortgage lending. Both our customer deposits and customer loans grew as part of our prudent balance sheet management. We retained our 14 million customers throughout the year and for the first time the number of digital customers accounts for half our customer base.
Our ongoing transformation programme has realised considerable savings which has helped mitigate the impact of rising inflation whilst allowing us to continue to improve our customer experience and deliver against our strategic priorities of being a responsible and sustainable business.
Whilst the Committee acknowledged this strong performance, it also recognised the seriousness of the penalty imposed by the FCA in December 2022 relating to historical anti-money laundering controls between 2012 and 2017 and the importance of reflecting this, alongside other factors, in determining variable pay awards. The failings and penalty were therefore taken into account as part of the quantitative and qualitative steps in the 2022 bonus pool determination, with a further discretionary adjustment applied.
Context for decision making
The Committee ensures that broader remuneration policies and practices for employees across the Santander UK group are taken into account when setting policy for executive remuneration. The Committee reviews remuneration trends across the Santander UK group including the outcome of any pay negotiations with our recognised trade unions and considers the relationship between executive remuneration and that of other Santander UK group employees, as well as remuneration in the wider UK market when making decisions on executive pay.
A particular focus of the Committee during the year has been the impact of the cost of living crisis on our colleagues. Several management initiatives designed to support our people, particularly the lowest paid, were endorsed by the Committee during the year. In addition, a review of all cost of living initiatives was undertaken at year end to ensure that the approach taken was both fair and effective. The cost of living crisis was considered carefully by the Committee when determining EDs' 2022 variable pay awards and remuneration for 2023.
The Committee oversees broader workforce remuneration policies and practices, the implementation of remuneration and related employment policies across Santander UK and the salary and variable pay awards for all Material Risk Takers. It also approves the design of any material performance-related pay plans.
As part of the monitoring of pay, the following is considered:
–Santander UK’s engagement with its recognised trade unions on pay and benefits matters for all colleagues;
–Annual pay reviews for the general employee population;
–Santander UK group-wide pension and other benefit provisions;
–The design of and overall spend on variable incentive arrangements; and
–An assessment of conduct across the business.
The Committee is focused on ensuring that colleagues are not subject to undue pressures or inappropriately incentivised. This is monitored using existing employee engagement indicators including engagement surveys.
The Committee always considers the broader stakeholder environment when setting policy or reaching decisions on executive pay.
Summary of remuneration arrangements for the Chief Executive Officers
Nathan Bostock stepped down as CEO effective 1 April 2022 to take up a position within Banco Santander. As such, he retains the right to deferred variable pay awards and was eligible for a pro-rated bonus to reflect time served in 2022. During the year, Santander UK welcomed Mike Regnier who was appointed CEO on 1 April 2022. Details of Mike’s remuneration are disclosed in the Executive Directors’ remuneration table below.
| | | | | | | | | | | | | | | | | | | | | | | | | | |
Executive Directors’ remuneration Total remuneration of each ED for the years ended 31 December 2022 and 2021. |
|
| Mike Regnier (3) | | Nathan Bostock (4) | | Duke Dayal (5) |
| 2022 | 2021 | | 2022 | 2021 | | 2022 | 2021 |
| £000 | £000 | | £000 | £000 | | £000 | £000 |
| Salary and fees | 1,123 | - | | 420 | 1,680 | | 1,000 | 958 |
Taxable benefits (1) | 2 | - | | 154 | 45 | | 522 | 523 |
| Pension | 101 | - | | 38 | 151 | | 88 | 86 |
| Total fixed pay | 1,226 | - | | 612 | 1,876 | | 1,610 | 1,567 |
Bonus (paid and deferred) (2) | 1,139 | - | | 398 | 1,864 | | 1,901 | 1,567 |
| Total variable pay | 1,139 | - | | 398 | 1,864 | | 1,901 | 1,567 |
| Total remuneration (6) | 2,365 | - | | 1,010 | 3,740 | | 3,511 | 3,134 |
| | | | | |
| (1) | Taxable benefits for the Executive Directors comprise a range of benefits including, but not limited to, private health care, life cover and car benefit. Included in the 2021 and 2022 figures for Duke Dayal is a relocation allowance of £500,000 p.a.. |
| (2) | The 2021 Variable Pay Plan awards made to Nathan Bostock and Duke Dayal have been restated to account for 36% of the awards being subject to long-term metrics. Performance against these metrics can decrease the award to 0% and may not increase the award value. Previously the value of the Variable Pay Plan awards have been disclosed in full which has resulted in an overstatement post the application of performance conditions. The value of the 2021 Variable Pay Plan subject to long-term performance conditions (currently Nathan Bostock: £1,048,680 and Duke Dayal: £715,748) will be disclosed at the close of the performance period.
Effective 2022, 36% of the CEO's 2022 Variable Pay Plan award will be subject to long-term performance metrics assessed over three years. No other executive, aside from the CEO, will be subject to long-term performance metrics. Performance against these metrics can increase the value of this element by up to 25% of original value, or decrease the award to 0%. The value of both the current and former CEOs' 2022 Variable Pay Plan awards not subject to performance conditions, i.e. 64%, are disclosed above. The value subject to further performance conditions (currently Mike Regnier: £640,588 and Nathan Bostock: £223,864) will be disclosed at the close of the performance period upon vesting. |
| (3) | Mike Regnier was appointed as CEO on 1 April 2022. Upon appointment, Mike Regnier was awarded guaranteed variable remuneration of £660,648 to compensate for remuneration forgone from his previous employer. This has not been included in the Total Remuneration value above. |
| (4) | Nathan Bostock stepped down as CEO on 1 April 2022. The figures above reflect remuneration received whilst serving as a Board Director. No further payments are due. |
| (5) | An additional one-off award was delivered to Duke Dayal in recognition of his contribution to regulatory projects during his service with Santander Holdings USA prior to joining the Company, and subject to Santander UK plc corporate and individual performance conditions during 2021. The value of the award is £294,532, and is included in the bonus value for 2021. |
| |
| |
| |
| | | | | | | | | | | | | | |
| Annual Report 2022 | Santander UK Group Holdings plc 82 |
| | | | | | | | | | | | | | | | | | | | | | | | | | | | | | | | | | | | | | | | | |
| Strategic Report | Sustainability and Responsible Banking | Governance | Risk review | Financial review | Financial
statements | Shareholder
information |
| | | | | | | | | | | | | |
| | | | | | | | | | | | | |
| | | | | |
| Remuneration implementation report continued |
| |
| |
Stakeholder views
During 2022, Santander UK continued to engage with key stakeholders on remuneration related matters including its main regulators, the PRA and FCA.
Regular engagement takes place with our shareholder to ensure there is alignment with remuneration constructs across the wider Banco Santander group while meeting all regulatory requirements and expectations. The outcome of these discussions drives our bonus pool construct.
Frequent colleague pulse surveys were conducted throughout 2022. This 'Your Say' function has enabled colleagues to share thoughts and ideas more frequently and anonymously all year round. Alongside other virtual listening forums, this gives a more frequent gauge of employee sentiment.
Additionally, discussions are conducted with union representatives during the annual pay review cycle and on relevant employee reward matters on a more frequent basis.
CEO pay ratio
Santander UK is committed to delivering fair pay which attracts, retains and motivates colleagues of the highest calibre across all grades. In line with this commitment, the Committee has oversight of compensation across the organisation, including pay ratios, and considers this when determining reward outcomes. We continue to voluntarily disclose the ratio of the CEO’s total remuneration to that of colleagues.
The CEO's pay mix is weighted more heavily towards variable pay to incentivise the achievement of stretching internal targets and long-term value creation. This can lead to greater variability in total remuneration. In contrast, the typical pay mix of our less senior colleagues places more emphasis on fixed pay, to ensure earnings offer security and certainty, and to meet our commitment to colleague financial wellbeing.
Changes in the ratio are therefore influenced by the differences in remuneration structure, rather than an increase in pay disparity. The ratio has decreased from 96:1 (re-stated and explained in footnote 4 below) in 2021 to 84:1 in 2022. The reduction in pay ratio is attributable to a number of different factors. These include an increase in average total remuneration amongst the employee population, and a reduction in the CEO remuneration package year-to-year. In assessing the pay ratio, the Committee is confident that the Company's policy on remuneration is fair and consistent with our all-employee pay policies.
Advice and support provided to the
Committee
As permitted by its Terms of Reference, the Committee has engaged the advice and support of Deloitte LLP (Deloitte) as independent remuneration consultants at the expense of the Company. Total fees (excluding VAT) for advice and support provided to the Committee in 2022 were £176,600 (2021: £199,050). Deloitte was first appointed as Adviser to the Committee following a formal tender process conducted in 2015. Following a further tender process in 2022, Deloitte was reappointed as the Committees' advisor. Deloitte's independence and effectiveness will continue to be reviewed annually. Deloitte is a founding member of the Remuneration Consultants Group and voluntarily operates under the Code of Conduct in relation to executive remuneration consulting in the UK.
The Committee is satisfied that the Deloitte engagement partner and team that provides remuneration advice to the Committee do not have connections with Santander UK that may impair their independence, following review in 2022.
In 2022, Deloitte also provided unrelated tax, advisory, risk, assurance and consulting services to Santander UK.
By Committee invitation, the Chair, CEO and designated representatives from business functions attend meetings as appropriate to advise on HR, Risk, Legal and Regulatory matters in support of the Committee's work. Attendees included the Chief People Officer, Performance & Reward Director, CRO and Company Secretary.
| | | | | | | | | | | | | | |
| CEO pay ratio |
|
| Methodology (1) | 25th percentile | Median | 75th percentile |
| 2022 CEO pay ratio (5) | Option A | 119:1 | 84:1 | 49:1 |
2021 CEO pay ratio (4) | Option A | 140:1 | 96:1 | 54:1 |
| 2020 CEO pay ratio | Option A | 88:1 | 64:1 | 37:1 |
| CEO remuneration (3) | 25th percentile (2) | Median (2) | 75th percentile (2) |
| 2022 CEO pay ratio | £ | £ | £ | £ |
| Total salary | £1,543,366 | £23,644 | £32,833 | £51,199 |
| Total remuneration | £3,374,795 | £28,361 | £40,294 | £69,416 |
| | | | | |
| (1) | Employee pay is calculated based on the 'Option A' methodology. We have chosen Option A as it gives the most reliable and accurate result by calculating a comparable single figure for each employee. |
| (2) | Employee pay data is based on full time equivalent pay for Santander UK plc employees. This excludes a small number of employees in the rest of the Santander UK group. Including those employees results in a ratio consistent with the above. For each employee, total remuneration is calculated based on fixed pay accrued in the 2022 financial year, and variable pay is either based on actual bonuses in respect of the 2022 year (where these are available) or modelled target bonuses where actuals are not yet available. |
| (3) | The CEO's total remuneration is aligned to that disclosed in the Executive Directors' remuneration table on the previous page. |
| (4) | The 2021 ratios are re-stated above. These were originally calculated based on fixed pay accrued within the 2021 year, in addition to target bonuses for eligible colleagues. The 2021 ratios have now been recalculated using 2021 fixed pay and bonuses paid in 2022 in respect of 2021 for all employees. The CEO's 2021 total remuneration has been restated to account for a component of that award being subject to long-term metrics, in line with the approach to the Executive Directors’ remuneration table. |
| (5) | The values used for the current and former CEOs' 2022 Variable Pay Plan awards are the same as those stated in the Executive Directors’ remuneration table i.e. the component which is not subject to performance conditions is used for the CEO pay ratio calculation above. The calculation also excludes the award of guaranteed variable remuneration of £660,648 made to Mike Regnier upon joining, to compensate for remuneration foregone from his previous employer. |
| |
| | | | | | | | | | | | | | |
| Relative importance of spend on pay |
|
| 2022 | 2021 | Change |
| £m | £m | % |
| Profit from continuing operations before tax | 1,894 | | 1,858 | | 2 | | |
| Total employee costs | 1,179 | | 1,202 | | (2) | | |
| | | | | | | | | | | | | | |
| Annual Report 2022 | Santander UK Group Holdings plc 83 |
| | | | | | | | | | | | | | | | | | | | | | | | | | | | | | | | | | | | | | | | | |
| Strategic Report | Sustainability and Responsible Banking | Governance | Risk review | Financial review | Financial
statements | Shareholder
information |
| | | | | | | | | | | | | |
| | | | | | | | | | | | | |
| | | | | |
| Remuneration implementation report continued |
| |
| |
Chair and Non-Executive Director remuneration
The Chair’s fee is reviewed and approved by the Committee. The fees paid to NEDs are reviewed and approved by the CEO and the Chair. Fees are reviewed annually taking into account the market rate and time commitment for the role. The Chair is paid an all-inclusive base fee. NEDs are paid a base fee, with a supplement for serving on or chairing a Board Committee.
All NEDs and the Chair serve under letters of appointment and either party can terminate on three months’ written notice, except in the case of the Chair where 12 months’ written notice is required.
Neither the Chair nor the NEDs have the right to compensation on the early termination of their appointment beyond payments in lieu of notice at the option of Santander UK. In addition, neither the Chair nor the NEDs are eligible for pension scheme membership or incentive arrangements.
| | | | | | | | |
| Chair and Board Committee member fees |
| | |
| 1 January 2022 | 1 January 2021 |
| £000 | £000 |
| Chair (inclusive of membership fee) | 675 | 675 |
| Board member | 95 | 95 |
| Additional responsibilities | | |
| Senior Independent Director | 45 | 45 |
| Chair of Board Risk Committee | 65 | 65 |
| Chair of Board Audit Committee | 60 | 60 |
| Chair of Board Responsible Banking Committee | 60 | 60 |
| Chair of Board Remuneration Committee | 60 | 60 |
| Membership of Board Risk Committee | 30 | 30 |
| Membership of Board Audit Committee | 25 | 25 |
| Membership of Board Responsible Banking Committee | 25 | 25 |
| Membership of Board Remuneration Committee | 25 | 25 |
| Chair of Litigation and Contentious Regulatory Board Sub-Committee | 8 | — |
| | | | | | | | | | | | | | | | | | | | | | | | | | |
| 2022 Fees | 2021 Fees | 2022 Expenses | 2021 Expenses | 2022 Benefits | 2021 Benefits | 2022 Total | 2021 Total |
| Non-Executive Directors | £000 | £000 | £000 | £000 | £000 | £000 | £000 | £000 |
| Chair | | | | | | | | |
William Vereker (1) | 675 | 675 | — | — | 2 | 2 | 677 | 677 |
| | | | | | | | |
| Independent Non-Executive Directors | | | | | | | | |
Lisa Fretwell (2) | 175 | — | 10 | — | — | — | 185 | — |
| Ed Giera (3) | 280 | 280 | — | — | — | — | 280 | 280 |
| Chris Jones | 239 | 235 | 2 | 4 | — | — | 241 | 239 |
| | | | | | | | |
Banco Santander Group nominated Non-Executive Directors (6) | | | | | | | | |
| | | | | | | | |
| | | | | | | | |
Antonio Simoes (4) | — | — | — | — | — | — | — | — |
Pamela Walkden (5) | 125 | 31 | 2 | — | — | — | 127 | 31 |
(1)William Vereker's taxable benefit relates to private health care.
(2)Lisa Fretwell was appointed on 1 January 2022. Fees received are in respect of services from that date.
(3)Ed Giera’s 2021 fee has been restated to reflect fees earned in respect of 2021 (reduced by £7,000 to remove payments made in 2021 for services rendered as Senior Independent Director in 2020).
(4)Antonio Simoes was appointed on 30 April 2021.
(5)Pamela Walkden was appointed on 1 October 2021. Fees received are in respect of services from that date.
(6)With the exception of Pamela Walkden, none of the Banco Santander Group nominated Non-Executive Directors received any fees or expenses.
| | | | | | | | | | | | | | |
| Annual Report 2022 | Santander UK Group Holdings plc 84 |
| | | | | | | | | | | | | | | | | | | | | | | | | | | | | | | | | | | | | | | | | |
| Strategic Report | Sustainability and Responsible Banking | Governance | Risk review | Financial review | Financial
statements | Shareholder
information |
| | | | | | | | | | | | | |
| | | | | | | | | | | | | |
Introduction
The Directors submit their report together with the financial statements for the year ended 31 December 2022. The information in the Directors’ Report is unaudited, except where indicated.
Corporate structure, Subsidiaries and Branches
Santander UK Group Holdings plc is a subsidiary of Banco Santander SA, a Spanish retail and commercial bank with a market share in ten core countries in Europe and the Americas.
Santander UK was formed from two former building societies, Abbey National and Alliance & Leicester, together with the branch network and savings business of Bradford & Bingley, and has operated under a single brand since 2010.
Santander UK Group Holdings plc is a wholly-owned subsidiary of Banco Santander SA and all of its ordinary shares are unlisted and held directly and indirectly by Banco Santander SA.
Santander UK plc's preference shares are listed on the London Stock Exchange and both the Company and Santander UK plc have other equity instruments in the form of AT1 securities listed on various securities exchange markets, including the London Stock Exchange and Euronext Dublin.
In addition, the Company and Santander UK plc are subject to US Securities Exchange Act reporting requirements as they have debt securities registered in the United States.
The Santander UK group consists of a parent company, Santander UK Group Holdings plc, incorporated in England and Wales, and a number of directly and indirectly held subsidiaries and associates. The Company directly or indirectly holds 100% of the issued ordinary share capital of its principal subsidiaries. All companies operate principally in their country of incorporation or registration.
As a result of ring-fencing implementation in 2018, and requirements set out in the Financial Services (Banking Reform) Act 2013, Santander UK plc and its subsidiaries comprise of only entities whose business is permitted under the Act as a ring-fenced bank. Other entities including Santander Financial Services (SFS) plc, which is incorporated in England and Wales, are directly or indirectly owned by the Company and SFS has branch offices in the Isle of Man and in Jersey. For more information, see Note 19.
Results and dividends
For details of the results for the year, see the Income Statement in the Consolidated Financial Statements. For more on dividends, see Note 10.
Details of Santander UK’s activities and business performance in 2022, together with an indication of the outlook, are set out in the Strategic report and the Financial review.
Events after the balance sheet date
There have been no material post balance sheet events, except as set out in Note 43.
Directors
Biographies of the Directors are included in the Shareholder information section. Details of their emoluments and interests in shares are outlined in the Directors’ Remuneration Implementation report. For more on changes to the composition of the Board, see the Chair’s report on Corporate Governance and the Board Nomination Committee Chair's report.
Appointment and retirement of Directors
All Directors are appointed and retire in accordance with the Company’s Articles of Association, the UK Companies Act 2006 and the UK Group Framework. The Directors are required to retire every year at the Annual General meeting and may offer themselves for re-election.
Lisa Fretwell was appointed to the Board on 1 January 2022 as an INED and Mike Regnier joined the Board on 1 April 2022, as an Executive Director and CEO. Nathan Bostock resigned as an Executive Director and CEO on 1 April 2022.
Directors’ indemnities
Directors’ and Officers’ liability insurance cover was in place throughout the year, in addition to a deed of indemnity to provide cover to the Directors for liabilities to the maximum extent permitted by law. These remain in force for the duration of the Directors’ period of office from the date of appointment until such time as any limitation periods for bringing claims against the Directors have expired. The Directors, including former Directors who resigned in the year, benefit from these deeds of indemnity which constitute qualifying third party indemnity provisions for the purposes of the Companies Act 2006. Deeds for existing Directors are available for inspection at the Company’s registered office.
The Company has also granted an indemnity which constitutes ‘qualifying third party indemnity provisions’ to the Directors of its subsidiary and affiliated companies, including former Directors who resigned in the year and since the year-end. Qualifying pension scheme indemnities were also granted to the Trustees of the Santander UK group’s pension schemes.
Employees
We continue to ensure that Santander UK’s remuneration policies are consistent with its strategic objectives and are designed with its long-term success in mind.
Communication
Santander UK aims to involve and inform employees on matters that affect them. The intranet is a focal point for communications and the ‘AskHR’ website connects employees to all the information they need about working for Santander UK. We also use face-to-face communication, such as team meetings and roadshows for updates.
Santander UK regularly considers employees’ opinions and asks for their views on a range of issues through regular engagement and surveys. For more information, on colleague engagement and initiatives, see the Strategic Report and Board Responsible Banking Committee Chair's Report.
Consultation with Employees
Santander UK has a successful history of working in partnership with its recognised trade unions, Advance and the Communication Workers Union (CWU), who collectively negotiate on behalf of approximately 99.5% of our UK workforce. Both trade unions are affiliated to the Trades Union Congress. We consult Advance and the CWU on significant proposals including those relating to change across the business at both national and local levels.
Employee share ownership
Santander UK continues to operate two all-employee, HMRC approved share schemes: a Save-As-You-Earn (Sharesave) Scheme and a Share Incentive Plan (SIP). Those employees who are designated as Material Risk Takers receive part of their annual bonus awards in Banco Santander SA shares/share linked instruments. Details of the plans and the related costs and obligations can be found in the Share-based payments and compensation sections in Notes 1 and 36.
Disability
Santander UK is committed to equality of employment, access and quality of service for disabled people and complies with the UK Equality Act 2010 throughout its business operations. Santander UK has processes in place to help train, develop, retain and promote employees with disabilities. We are a Disability Confident Employer achieving the 'Leader' level. We are committed to giving full and fair consideration to employment applications by disabled people, having regard to their particular aptitudes and abilities, and for continuing the employment of employees who have become disabled by arranging appropriate training and making reasonable adjustment in the workplace.
Engagement with stakeholders and employees
Santander UK recognises the importance of fostering relationships with its principal stakeholders and that this is key to the long-term success of our business. We understand the importance of acting fairly and responsibly between members of the Company.
| | | | | | | | | | | | | | |
| Annual Report 2022 | Santander UK Group Holdings plc 85 |
| | | | | | | | | | | | | | | | | | | | | | | | | | | | | | | | | | | | | | | | | |
| Strategic Report | Sustainability and Responsible Banking | Governance | Risk review | Financial review | Financial
statements | Shareholder
information |
| | | | | | | | | | | | | |
| | | | | | | | | | | | | |
| | | | | |
| Directors’ report continued |
| |
| |
Streamlined Energy & Carbon Reporting (SECR)
For details on our energy use, carbon emissions and efficiency measures implemented in 2022 including Scope 1, 2 and 3 data, see the SECR section in the Sustainability Review.
Political contributions
In 2022 and 2021, no contributions were made for political purposes and no political expenditure was incurred by the Company.
Share capital
Details about the structure of the Company’s capital can be found in Note 32.
For details of employee share schemes and how rights are exercisable, see Note 36.
The powers of the Directors in relation to share capital are set out in the Company’s Articles of Association. These are available for inspection on request.
Financial instruments
The financial risk management objectives and policies of Santander UK and the policy for hedging, along with details of Santander UK's exposure to credit risk, market risk and liquidity risk are set out in the Risk review.
Research and development
Santander UK has a comprehensive product approval process and policy. New products, campaigns and business initiatives are reviewed by Santander UK’s Proposition Approval Forum.
Supervision and regulation
Some of Santander UK’s subsidiaries and joint venture companies are authorised by the FCA and the PRA (dual regulated) or the PRA or the FCA (solo regulated).
While Santander UK operates primarily in the UK, it is also subject to the laws and regulations of other jurisdictions in which it operates or has listed debt securities such as the US.
Internal controls
Risk management and internal controls
The Board and its Committees are responsible for reviewing and ensuring the effectiveness of management’s system of risk management and internal controls.
We have carried out a robust assessment of the principal and emerging risks facing Santander UK including those that would threaten its business model, future performance, solvency or liquidity. Details of our principal risks, our procedures to identify emerging risks, and how these are being managed or mitigated are set out in the Risk review. A summary of our Top and Emerging Risks is also set out in the Strategic report.
Management’s report on internal control over financial reporting
Internal control over financial reporting is a component of an overall system of internal control. Santander UK’s internal control over financial reporting is designed to provide reasonable assurance regarding the reliability of financial reporting and the preparation of financial statements for external purposes in accordance with UK-adopted international accounting standards (IAS) and International Financial Reporting Standards (IFRS) as issued by the International Accounting Standards Board (IASB). Santander UK’s internal control over financial reporting includes:
–Policies and procedures that pertain to the maintenance of records that in reasonable detail accurately and fairly reflect the transactions and dispositions of assets.
–Controls providing reasonable assurance that transactions are recorded as necessary to permit the preparation of financial statements in accordance with UK-adopted IAS and IFRS, and that receipts and expenditures are being made only in accordance with authorisations of management.
–Controls providing reasonable assurance regarding prevention or timely detection of unauthorised acquisition, use or disposition of assets that could have a material effect on the financial statements.
Because of its inherent limitations, internal control over financial reporting may not prevent or detect misstatements. In addition, projections of any evaluation of effectiveness to future periods are subject to the risk that controls may become inadequate because of changes in conditions, or because the degree of compliance with policies or procedures may deteriorate.
Management is responsible for establishing and maintaining adequate internal control over the financial reporting of Santander UK. Management assessed the effectiveness of Santander UK’s internal control over financial reporting at 31 December 2022 based on the criteria established in the Internal Control – Integrated Framework issued by the Committee of Sponsoring Organisations of the Treadway Commission (COSO) in May 2013.
As a registrant under the US Securities Exchange Act of 1934, Santander UK's management is responsible for establishing and maintaining an adequate system of internal control over financial reporting in order to ensure the accuracy and reliability of Santander UK's Financial Statements and the Form 20-F submitted to the SEC.
In line with COSO and SEC requirements, controls recognised as Sarbanes-Oxley applicable are subject to annual testing and certification by management including an attestation by the CEO and the CFO that they are operating effectively and that the internal control over financial reporting can be relied on.
All Sarbanes-Oxley control weaknesses identified are captured, assessed and included in the year-end assessment of the reliability of the Internal Control environment. They are reported on an ongoing basis to the Board Audit Committee to ensure the control environment is continuously improved.
Based on this assessment, management concluded, at 31 December 2022, that Santander UK’s internal control over financial reporting was effective.
Disclosure controls and procedures over financial reporting
Santander UK’s management has evaluated, with the participation of its CEO and CFO, the effectiveness of its disclosure controls at 31 December 2022. There are inherent limitations to the effectiveness of any system of disclosure controls and procedures, including the possibility of human error, and the circumvention or overriding of the controls and procedures. Accordingly, even effective disclosure controls and procedures can only provide reasonable assurance of achieving their control objectives.
Based upon this evaluation, the CEO and the CFO have concluded that, at 31 December 2022 , Santander UK’s disclosure controls and procedures were effective to provide reasonable assurance that information required to be disclosed by Santander UK in the reports that it files and submits under the US Securities Exchange Act of 1934 is recorded, processed, summarised and reported within the time periods specified in the applicable rules and forms, and that it is accumulated and communicated to Santander UK’s management, including the CEO and CFO, as appropriate, to allow timely decisions regarding disclosure.
| | | | | | | | | | | | | | |
| Annual Report 2022 | Santander UK Group Holdings plc 86 |
| | | | | | | | | | | | | | | | | | | | | | | | | | | | | | | | | | | | | | | | | |
| Strategic Report | Sustainability and Responsible Banking | Governance | Risk review | Financial review | Financial
statements | Shareholder
information |
| | | | | | | | | | | | | |
| | | | | | | | | | | | | |
| | | | | |
| Directors’ report continued |
| |
| |
Statements of Compliance
The UK Corporate Governance Code 2018 (the Code)
Santander UK complies with the Code wherever applicable in order to achieve the best standards of corporate governance.The Code applied to the financial year ended 31 December 2022 and the Board confirms that it applied the principles and complied with those provisions of the Code throughout the year, except as follows:
–Provision 5: The Company has not appointed a NED to represent the views of the workforce, as this entity does not have a workforce. For further details, see 'Views of the workforce at the Board' in the Chair's Report in the Corporate Governance Section. The Board does however, receive regular updates on the culture of the business and the views of employees from engagement surveys feedback. These provide the Board with an understanding of the wider workforce and provide meaningful dialogue at Board meetings on workforce matters.
–Provision 11: The Company does not comply with the requirement for at least half the Board, excluding the Chair, to be NEDs whom the Board considers to be independent. We have assessed the implications and believe that the approach we follow is appropriate for our size and ownership structure. Furthermore, no one person or group of individuals dominates the Board’s decision-making. For details, see the Chair’s report on Corporate Governance.
–Provision 17: The Company does not comply with the requirement for the Board Nomination Committee (BNC) membership to comprise a majority of INEDs, following the appointment of Pamela Walkden, as a GNED in October 2021. Whilst Pamela Walkden is not an INED, her credentials and experience were felt to be invaluable to the BNC. We have assessed the implications and believe that the approach we follow is appropriate for our size and ownership structure.
–Provision 25: The Board Risk Committee (BRC), since the appointment of Pamela Walkden as a GNED in October 2021, has not been composed of only INEDs. We have assessed the implications and believe that the approach we follow is appropriate for our size and ownership structure, recognising the experience and expertise that the GNED brings to BRC.
–Provision 36: The Board Remuneration Committee has not developed a policy for post-employment shareholding requirements. However, the structure of variable pay for EDs and other senior executives ensures that they acquire a meaningful shareholding in Banco Santander SA which is held over a period of up to eight years and which extends for a significant period post employment. For details, see the Remuneration Policy Report.
–Provisions 40 and 41: Due to commercial sensitivity, we have opted not to provide all of the disclosures required by Provision 41. The details not provided relate to (1) the extent to which discretion has been applied to remuneration outcomes and the reasons why and (2) a description, with examples, of how the Board Remuneration Committee has addressed the factors in Provision 40 (specifically predictability as we do not provide the range of possible values of rewards to individual directors). Specific engagement does not take place with the workforce to explain how executive remuneration aligns with wider company pay policy. However, an explanation is available for employees in the Directors’ Remuneration Report. Details of the structure of our remuneration arrangements and key considerations of the Committee in the year are included in the Board Remuneration Chair's Report, Remuneration Policy and Implementation Reports.
UK Finance Disclosure Code for Financial Reporting
Santander UK’s financial statements for the year ended 31 December 2022 have been prepared in compliance with the principles of the UK Finance Disclosure Code for Financial Reporting.
Going concern
The going concern of Santander UK is reliant on preserving a sufficient level of capital and adequately funding the balance sheet. In making their going concern assessment in connection with preparing the financial statements, the Directors considered a wide range of information including those associated with climate change, capital position and liquidity and funding profile, stress scenarios, and contingent liabilities, and the reasonably possible changes in trading performance arising from potential economic, market and product developments. The Directors' assessment included consideration of the potential impacts arising from higher living costs.
Having assessed this information and the principal risks and uncertainties, the Directors are satisfied that the Santander UK group has adequate resources to continue operations for a period of at least 12 months from the date of this report and therefore consider it appropriate to adopt the going concern basis of accounting in preparing the financial statements.
Ethical Code of Conduct
Santander UK is committed to ensuring we hold ourselves to high ethical standards. This means adhering to laws, regulations, policies including our Ethical Code of Conduct and also carrying out business in a responsible way. High standards of professional and personal conduct helps Santander identify, manage and respond to risks, creates a positive, collaborative working environment and it ensures positive customer interactions and outcomes.
The Santander Way determines how we deliver on our purpose, to help people and businesses prosper. How we deliver that purpose is as important as the end result. Our conduct and our culture matters. Our aim is to be the best open financial services platform by acting responsibly and earning the lasting loyalty of our colleagues, customers and communities.
How we do business is intrinsically linked to our behaviours and values and supports our aim. Santander UK’s Ethical Code of Conduct sets the standards expected of all colleagues and forms part of the terms and conditions of employment.
It makes clear our corporate values, our expectations regarding corporate behaviours and general principles and standards we expect with regard to customers, colleagues, conflicts of interest, data, media and our approach to sustainability.
There are numerous policies, processes, support and guidance that help colleagues meet these expectations and do the right thing to ensure Santander UK remains a Simple, Personal and Fair bank for its colleagues, customers, shareholders and the communities it serves.
The Ethical Code of Conduct applies to all colleagues including permanent and temporary colleagues as well as EDs and NEDs. The SEC requires companies to disclose whether they have a code of ethics that applies to the CEO and senior financial officers which promotes honest and ethical conduct, full, fair, accurate, timely and understandable disclosures, compliance with applicable governmental laws, rules and regulations, prompt internal reporting of violations, and accountability for adherence to a code of ethics.
Santander UK meets these requirements through its Ethical Code of Conduct and supporting policies, including but not limited to the Anti-Bribery and Corruption Policy, the Whistleblowing Policy, the FCA’s Principles for Businesses, and the FCA’s Statements of Principle and Code of Practice for Approved Persons, with which the CEO and senior financial officers comply.
Copies of these documents are available on application to Santander UK Group Holdings plc, 2 Triton Square, Regent’s Place, London NW1 3AN.
| | | | | | | | | | | | | | |
| Annual Report 2022 | Santander UK Group Holdings plc 87 |
| | | | | | | | | | | | | | | | | | | | | | | | | | | | | | | | | | | | | | | | | |
| Strategic Report | Sustainability and Responsible Banking | Governance | Risk review | Financial review | Financial
statements | Shareholder
information |
| | | | | | | | | | | | | |
| | | | | | | | | | | | | |
| | | | | |
| Directors’ report continued |
| |
| |
Disclosure of information to Auditors
Each of the Directors at the date of approval of this report confirms that:
–So far as the Director is aware, there is no relevant audit information of which Santander UK’s auditor is unaware
–The Director has taken all steps that they ought to have taken as a Director to make himself or herself aware of any relevant audit information and to establish that Santander UK’s auditor is aware of that information.
This confirmation is given and should be interpreted in accordance with the provisions of Section 418 of the UK Companies Act 2006.
Auditor
PricewaterhouseCoopers LLP will continue in the office of auditor. A resolution to reappoint them will be proposed at the Company’s forthcoming Annual General Meeting.
By Order of the Board
John Mills
Company Secretary
1 March 2023
2 Triton Square, Regent’s Place,
London NW1 3AN
| | | | | | | | | | | | | | |
| Annual Report 2022 | Santander UK Group Holdings plc 88 |
Page left intentionally blank
| | | | | | | | | | | | | | |
| Annual Report 2022 | Santander UK Group Holdings plc 89 |
| | | | | | | | | | | | | | | | | | | | | | | | | | | | | | | | | | | | | | | | | |
| Strategic Report | Sustainability and Responsible Banking | Governance | Risk review | Financial review | Financial
statements | Shareholder
information |
| | | | | | | | | | | | | |
| | | | | | | | | | | | | |
| | | | | | | | | | | |
| Risk review | | | |
The Risk review consists of unaudited financial information unless otherwise stated. The audited financial information is an integral part of our Consolidated Financial Statements.
We aim to continually enhance our disclosures and their usefulness to readers in the light of developing market practice and areas of focus. As a result, our disclosures go beyond the minimum required by accounting standards and other regulatory requirements. | | Contents | |
| | |
| | |
| | |
| | |
We support the recommendations and guidance made by the Taskforce on Disclosures about ECL (DECL Taskforce) and have adopted its recommendations where it is practical to do so. The DECL Taskforce was formed in 2017 by the FCA, FRC and PRA with a remit to help encourage high-quality ECL-related disclosures following adoption of IFRS 9.
| | | |
| | |
| | |
| | | |
| | | |
| | | |
| | | |
| | | |
| | | |
| | | |
| | | |
| | | |
| | | |
| | | |
| | | |
| | | |
| | | |
| | | |
| | | |
| | | |
| | | |
| | | |
| | | |
| | | |
| | | | | | | | | | | | | | |
| Annual Report 2022 | Santander UK Group Holdings plc 90 |
| | | | | | | | | | | | | | | | | | | | | | | | | | | | | | | | | | | | | | | | | |
| Strategic Report | Sustainability and Responsible Banking | Governance | Risk review | Financial review | Financial
statements | Shareholder
information |
| | | | | | | | | | | | | |
| | | | | | | | | | | | | |
Risk governance
INTRODUCTION
Santander UK Group Holdings plc is the immediate parent company of Santander UK plc. The two companies operate on the basis of a unified business strategy with some overlap in membership, albeit the principal business activities of the Santander UK group are carried out by Santander UK plc and its subsidiaries (the Santander UK plc group). The Company’s Risk Frameworks have been adopted by its subsidiaries to ensure consistent application.
As a financial services provider, managing risk is a core part of our day-to-day activities. To be able to manage our business effectively, it is critical that we understand and control risk in everything we do. We aim to use a prudent approach and advanced risk management techniques to help us deliver robust financial performance, withstand stresses, and build sustainable value for our stakeholders. We aim to keep a predictable medium-low risk profile, consistent with our business model. This is key to achieving our strategic objectives.
RISK FRAMEWORK
How we define risk
Risk is any uncertainty about us being able to achieve our business objectives. It covers both financial and non-financial risks (NFRs). NFR is a broad term usually defined by exclusion, i.e. any risks other than the traditional financial risks of Credit, Market, Liquidity, Capital and Pension, and Strategic and business risk. Risk can be split into a set of risk types, each of which could affect our results and our financial resources. Enterprise risk is the aggregate view of all the risk types described below:
Key risk types
| | | | | |
| Risk types | Description |
| Credit | The risk of financial loss due to the default or credit quality deterioration of a customer or counterparty to which we have provided credit, or for whom we have assumed a financial obligation. |
| Market | Non-traded market risk – the risk of loss of income, economic or market value due to changes to interest rates in the non-trading book or to changes in other market risk factors (e.g. credit spread and inflation risk), where such changes would affect our net worth through a change to revenues, assets, liabilities and off-balance sheet exposures in the non-trading book. Traded market risk – the risk of changes in market factors that affect the value of positions in the trading book. |
| Liquidity | The risk that we do not have sufficient liquid financial resources available to meet our obligations as they fall due, or we can only secure such resources at excessive cost. |
| Capital | The risk that we do not have an adequate amount or quality of capital to meet our internal business objectives, regulatory requirements and market expectations. |
| Pension | The risk caused by our statutory, contractual or other liabilities with respect to a pension scheme (whether set up for our employees or those of a related company or otherwise). It also refers to the risk that we will need to make payments or other contributions with respect to a pension scheme due to an agreed Recovery Plan or for some other reason. |
| Operational risk & resilience | The risk of loss or adverse impact due to inadequate or failed internal processes, people and systems, or external events. We give a particular focus to Cyber, Fraud, IT, People and Third Party risks, which we mitigate through our management of operational risk. |
| Conduct and regulatory | Conduct risk – the risk that our decisions and behaviours lead to detriment or poor outcomes for our customers. It also refers to the risk that we fail to maintain high standards of market behaviour and integrity. Regulatory risk – the risk of financial or reputational loss, or imposition or conditions on regulatory permission, as a result of failing to comply with applicable codes, regulator’s rules, guidance and regulatory expectations. |
| Financial crime | The risk that we are used to further financial crime, including money laundering, sanctions evasion, terrorist financing, facilitation of tax evasion, bribery and corruption. Failure to meet our legal and regulatory obligations could result in criminal or civil penalties against Santander UK or individuals, as well as affecting our customers and the communities we serve. |
| Other risk types | Model risk – the risk that the predictions of our models may be inaccurate, causing us to make sub-optimal decisions, or that a model may be used inappropriately. Legal risk – the risk of an impact arising from legal deficiencies in contracts; failure to protect assets; failure to manage legal disputes appropriately; failure to assess or implement the requirements of a change of law; or failure to comply with law or regulation or to discharge duties or responsibilities created by law or regulation. Strategic and business risk – the risk of loss or underperformance against planned objectives; damage from strategic decisions or their poor implementation that impact the long-term interests of our key stakeholders or from an inability to adapt to external developments. Reputational risk – the risk of damage to the way our reputation and brand are perceived by the public, clients, government, colleagues, investors or any other interested party. |
In January 2023, the Legal risk framework, in agreement with the General Counsel, was retired following a structural change when the Chief Legal and Regulatory Officer (CLRO) left the organisation and the Legal function moved to the CFO Division (Line 1). As the Risk Types are owned by Risk control units (Line 2 in our three lines of defence model, as set out in 'Risk organisational structure' section that follows), and the CFO Division is a Risk management unit (Line 1), it was decided to retire the Legal risk type and framework. Where appropriate, elements of the existing Legal risk framework will be subsumed into the other relevant risk frameworks. Within the Risk Framework, the roles and responsibilities of CFO have been expanded to include the oversight of the General Counsel and Legal function, overseeing the provision of legal support to Santander UK, and management of relationships with third party law firms.
| | | | | | | | | | | | | | |
| Annual Report 2022 | Santander UK Group Holdings plc 91 |
| | | | | | | | | | | | | | | | | | | | | | | | | | | | | | | | | | | | | | | | | |
| Strategic Report | Sustainability and Responsible Banking | Governance | Risk review | Financial review | Financial
statements | Shareholder
information |
| | | | | | | | | | | | | |
| | | | | | | | | | | | | |
Top and emerging risks
Several of our risk types also have Top risks associated with them. We regularly review the Top risks that could impact our business, customers and shareholders, and they are monitored at each meeting of the ERCC and BRC. The Top risks we actively monitored in 2022 are set out in the relevant section of this Risk review and summarised in the Top risks section of the Risk management overview in the Strategic report. Our Top risks included risks arising from Inflationary and supply chain pressures, Climate change, Financial crime, Fraud, IT, Cyber, People and Conduct and regulatory.
We also regularly review emerging risks that could impact our business, customers and shareholders, including regular review and discussion at the ERCC and BRC. The identification of emerging risks is co-ordinated by the Risk Division. A key part of the process is continual scanning of the external environment, focusing on emerging risk drivers such as broader geo-political, environmental and social risks, technology change, customer behaviour, market competition, regulation, government, digital assets and disruption of UK macroeconomic factors. Emerging risks actively monitored in 2022 are set out in the relevant section of this Risk review and summarised in the ‘Emerging risks’ section of the 'Risk management overview in the Strategic report.
In 2022, we added Eurozone/Sovereign Bank Contagion to the emerging risks we monitor and transitioned Inflationary and supply chain pressures to Top risks. For more, see the Risk management overview in the Strategic report.
Key elements
Our Risk Framework sets out how we manage and control risk. In 2021, we enhanced some of the standards to provide more details and clarity on the relationship between, and roles of, Banco Santander SA and Santander UK, climate related risk drivers whether physical or transition-led, and the development of risk methodologies and quantitative models.
How we approach risk – our culture and principles
The complexity and importance of the financial services industry demands a strong risk culture. We have systems, controls and safeguards in place to manage and control the risks we face, but it is also crucial that everyone takes personal responsibility for managing risk. Our risk culture plays a key role in our aim to be the best bank for our customers, shareholders, people and communities by acting responsibly. It is vital that all our people understand this. To achieve this, our people have a strong, shared understanding of what risk is, and what their role is in helping to control it. We express this in our Risk Culture Statement:
| | |
| Risk Culture Statement |
| Santander UK will only take risks that it understands and will always remain prudent in identifying, assessing, managing and reporting all risks. We proactively encourage our people to take personal responsibility for doing the right thing and to challenge without fear. We ensure decisions and actions take account of the best interests of all our stakeholders and are in line with The Santander Way. |
The Board reviews and approves our Risk Culture Statement every year. Senior executives are responsible for promoting our risk culture from the top. They drive cultural change and increased accountability across the business. We reinforce our Risk Culture Statement and embed our risk culture in all our business units through our Risk Framework, Risk Certifications and other initiatives. This includes highlighting that:
–It is everyone’s personal responsibility to play their part in managing risk
–We must Identify, Assess, Manage and Report risk quickly and accurately
–We make risk part of how we assess our people’s performance and how we recruit, develop and reward them
–Our internal control system is essential to ensure we manage and control risk in line with our principles, standards, Risk Appetite and policies.
We use Risk Certifications to confirm how we manage and control risks in line with our Risk Framework and within our Risk Appetite. As an example, every year, each member of our Executive Committee confirms that they have managed risk effectively in line with the Risk Framework in the part of the business for which they are responsible. Their certification lists any exceptions and the agreed actions to be taken to correct them. This is a tangible sign of the personal responsibility that is such a key part of our risk culture.
Our risk culture programme – I AM Risk
Our I AM Risk approach aims to make sure our people:
| | | | | |
–Identify risks and opportunities –Assess their probability and impact –Manage the risks and suggest alternatives –Report, challenge, review, learn and ‘speak up’. | |
I AM Risk is how we make risk management part of everyone’s life as a Santander UK employee from how we recruit them and manage their performance to how we develop and reward them. It is also how we encourage people to take personal responsibility for risk to speak up and to come up with ideas. We use I AM Risk in our risk certifications, policies, frameworks and governance, and risk-related communications. We also include it in reward arrangements and in mandatory training. To support general awareness, our learning websites include videos and factsheets.
As part of I AM Risk, we include mandatory risk objectives for all our people in our performance management processes. The Executive Committee leads our culture initiatives under the CEO’s sponsorship and we use monthly staff surveys to give insight into our culture.
| | | | | | | | | | | | | | |
| Annual Report 2022 | Santander UK Group Holdings plc 92 |
| | | | | | | | | | | | | | | | | | | | | | | | | | | | | | | | | | | | | | | | | |
| Strategic Report | Sustainability and Responsible Banking | Governance | Risk review | Financial review | Financial
statements | Shareholder
information |
| | | | | | | | | | | | | |
| | | | | | | | | | | | | |
Our risk governance structure
We are committed to the highest standards of corporate governance in every part of our business, including risk management. For details of our governance, including the Board and its Committees, see the ‘Governance’ section of this Annual Report. The Board delegates certain responsibilities to Board Level Committees as needed and where appropriate. Our risk governance structure strengthens our ability to identify, assess, manage and report risks, as follows:
–Committees: A number of Board and Executive committees are responsible for specific parts of our Risk Framework
–Key senior management roles: A number of senior roles have specific responsibilities for risk management
–Risk organisational structure: We have the ‘three lines of defence’ model built into the way we run our business.
Committees
The Board and Board Level Committee responsibilities for risk are:
| | | | | |
| Board Level Committee | Main risk responsibilities |
| The Board (including the Santander UK plc Board) | –Has overall responsibility for business execution and for managing risk |
–Reviews and approves the Risk Framework and Risk Appetite |
| Board Risk Committee (BRC) | –Assesses the Risk Framework and recommends it to the Board for approval |
–Advises the Board on our overall Risk Appetite, tolerance and strategy |
–Oversees our exposure to risk and our strategy and advises the Board on both |
–Reviews the effectiveness of our risk management systems and internal controls |
–Receives regular updates on financial crime compliance and risks including money laundering, bribery and corruption and sanctions compliance and monitors KPIs in line with approved Board risk appetite |
| Board Responsible Banking Committee | –Responsible for culture and operational risk from conduct, compliance, competition & legal matters |
–Reviews reports from the Director of Compliance (DoC) on the adequacy and effectiveness of the compliance function |
–Ensures that adequate and effective control processes are in place to identify and manage reputational risks |
–Oversees our Sustainability and Responsible Banking programme and how it impacts on employees, communities, the environment including sustainability and climate change, reputation, brand and market positioning |
| Board Audit Committee | –Monitors and reviews the financial statements integrity, and any formal announcements on financial performance |
–Reviews the adequacy and effectiveness of the internal financial controls and whistleblowing arrangements |
–Monitors and reviews the effectiveness of the internal audit function |
–Oversees the independence and performance of the external auditors |
| Board Remuneration Committee | –Oversees implementation of remuneration policies, ensuring they promote sound and effective risk management |
The Executive Level Committee responsibilities for risk are:
| | | | | |
| Executive Level Committee | Main risk responsibilities |
| Executive Committee (ExCo) | –Reviews business plans in line with our Risk Framework and Risk Appetite before they are sent to the Board to approve |
–Receives updates on key risk issues managed by CEO-level committees and monitors the actions taken |
| Senior Management Committee | –Focuses on the responsibilities of the Executive Committee Senior Management Function holders and how they are discharged |
–Reviews updates on key risk issues, customer, reputational and conduct matters |
| Executive Risk Control Committee (ERCC) | –Reviews Risk Appetite proposals before they are sent to the BRC and the Board to approve |
–Ensures that we comply with our Risk Framework, Risk Appetite and risk policies |
–Reviews and monitors our risk exposures and approves any corrective steps we need to take |
| Asset and Liability Committee (ALCO) | –Reviews liquidity risk appetite (LRA) proposals |
–Ensures we measure and control structural balance sheet risks, including capital, funding and liquidity, in line with the policies, strategies and plans set by the Board |
–Reviews and monitors key asset and liability management activities to ensure we keep our exposures within our Risk Appetite |
| Pensions Committee | –Reviews pension risk appetite proposals |
–Approves actuarial valuations and reviews the impact they may have on our contributions, capital and funding |
–Consults with the pension scheme trustees on the scheme’s investment strategy |
| Capital Committee | –Puts in place reporting systems and risk control processes to make sure capital risks are managed within our Risk Framework |
–Reviews capital adequacy and capital plans, including the ICAAP, before they are sent to the Board to approve |
| Incident Accountability Committee | –Considers, calibrates, challenges and agrees any appropriate individual remuneration adjustments |
–Presents recommendations to the Board Remuneration Committee |
| Credit Approval Committee | –Approves corporate and wholesale credit transactions which exceed levels delegated to lower level forums or individuals |
| Investment Approval Committee | –Approves equity type investment transactions which exceed levels delegated to lower level approval forums or individuals |
| Economic Crime Committee | –Ensures due reporting, consideration, oversight and informed decision making regarding compliance with financial crime laws and regulations, fraud, and best industry practice aligned to our Risk Appetite |
| | | | | | | | | | | | | | |
| Annual Report 2022 | Santander UK Group Holdings plc 93 |
| | | | | | | | | | | | | | | | | | | | | | | | | | | | | | | | | | | | | | | | | |
| Strategic Report | Sustainability and Responsible Banking | Governance | Risk review | Financial review | Financial
statements | Shareholder
information |
| | | | | | | | | | | | | |
| | | | | | | | | | | | | |
Key senior management roles
Senior roles with specific responsibilities for risk management are:
| | | | | |
| Role | Main risk responsibilities |
| Chief Executive Officer | The Board delegates responsibility for our business activities and managing risk on a day-to-day basis to the CEO. The CEO proposes our strategy and business plan, puts them into practice and manages the risks involved. The CEO must also ensure we have a suitable system of controls to manage risks and report to the Board on it. |
| Chief Risk Officer (CRO) | Oversees and challenges risk activities, and ensures lending is made within our Risk Appetite. Accountable for control and oversight of credit, market, liquidity, capital, pension, strategic & business, operational, model, climate and enterprise risks. |
| |
| Chief Financial Officer | Responsible for developing strategy, leadership and management of the CFO Division. The CFO is responsible for managing interest rate, liquidity, pension and capital risks. The CFO also aims to maximise the return on Regulatory and Economic Capital. |
| Chief Internal Auditor (CIA) | Designs and uses an audit system that identifies key risks and evaluates controls. The CIA also develops an audit plan to assess existing risks that involve producing audit, assurance and monitoring reports. |
| Money Laundering Reporting Officer (MLRO) | Responsible to the CRO for control and oversight of financial crime risk but has regulatory responsibility to report on this risk type to Executive and Board Committees and the FCA. |
| Director of Compliance (DoC) | Responsible to the CRO for control and oversight of conduct and regulatory risk and Compliance but has regulatory responsibility to report on this risk type to Executive and Board Committees and the FCA. |
Risk organisational structure
We use the ‘three lines of defence’ model to manage risk. This model is widely used in the banking industry and has a clear set of principles to put in place a cohesive operating model across an organisation. It does this by separating risk management, risk control and risk assurance. The reporting lines to the Board (including the Santander UK plc Board) with respect to risk are as follows:
| | | | | | | | | | | | | | | | | | | | | | | | | | | | | | | | | | | | | | | | | | | | | | | | | | | | | | | | | | | | | | | | | | | | | | | |
| | | | | | | | | | | | | | | | | | | | | | | |
| Line 1: Risk management | | | | | | | | | | | | | | | | | | | | | | |
| Business Units and Business Support Units identify, assess and manage the risks which originate and exist in their area, within our Risk Appetite. It is under the executive responsibility of the CEO. | | Business & Business Support Units | | | | | | | | | | | | | | | | | | | | |
| | | | | | | | | | | | | | | | | | | | | |
| | | | | | | | | | | | | | | | | | | | | |
| | | | | | | | | | | | | | | | | | | | | |
| | | | | | | | | | | | | | | | | | | | | | |
| | | | | | | | | | | | | | | | | | | | | | | |
| | | | | | | | | | | | | | | | | | | | | | | |
| Line 2: Risk control | | Financial Crime Unit | | | | | | | | | | | | | Board
Responsible
Banking
Committee | | | | |
| Risk Control Units are independent monitoring and control functions. They make sure Business Units and Business Support Units manage risks effectively and within our Risk Appetite. The Risk Control units are: Financial Crime, Risk - responsible for controlling credit, liquidity, capital, market, pension, strategic and business, operational, model and enterprise risks; and Compliance, responsible for controlling reputational and conduct and regulatory risks. It is under the executive responsibility of the CEO, but responsible to the CRO for overseeing the first line of defence. | | | | | MLRO | | | | | | | | | | | | |
| | | | | | | | | | | | | | | |
| | | | | | | | | | | | | | | | |
| | | | | | | | | | | | | | | | | | |
| | | | | | | | | | | | | | | | | | |
| | | | | | | | | | | | | | | | | | | | | | Board |
| | Risk Unit | | | | | | | | | | | | | | | | | | | |
| | | | | | | | | CRO | | | | | | | CEO | | | | |
| | | | | | | | | | | | | | | |
| | | | | | | | | | | | | | | | | | | | |
| | | | | | | | | | | | | | | | | | | | | |
| | | | | | | | | | | | | | | | | | | | | | |
| | | | | | | | | | | | | | | Board
Risk
Committee | | | | |
| | | | | | | | | | | | | | | | | | |
| |
Compliance Unit
| | | | | | | | | | | | | | | | |
| | | | | | | | | | | | | | | | |
| | | | | DoC | | | | | | | | | | | | |
| | | | | | | | | | | | | | | |
| | | | | | | | | | | | | | | | | | | | | | | |
| | | | | | | | | | | | | | | | | | | | | | | |
| | | | | | | | | | | | | | | | | | | | | | | |
| Line 3: Risk assurance | | | | | | | | | | | | | | | Board
Audit
Committee | | | | |
| Internal Audit is an independent corporate function. It gives assurance on the design and effectiveness of our risk management and control processes. It is responsible to the CIA. | | Internal Audit | | | | | | | | | | | | | | | |
| | | | | | | | | CIA | | | | | | | | |
| | | | | | | | | | | | | | |
| | | | | | | | | | | | | | | | | |
| | | | | | | | | | | | | | | | | |
| | | | | | | | | | | | | | | | | | | | | | | |
Internal control system
Our Risk Framework is an overarching view of our internal control system that helps us manage risk across the business. It sets out at a high level the principles, standards, roles and responsibilities, and governance for internal control. Our Risk Framework covers the categories below:
| | | | | |
| Category | Description |
| Risk Frameworks | Set out how we should manage and control risk across the business, our risk types and our risk activities. |
| Risk Management Responsibilities | Set out the Line 1 risk management responsibilities for Business Units and Business Support Units. |
| Strategic Commercial Plans | Plans produced by business areas, at least annually, which describe the forecasted objectives, volumes and risk profile of new and existing business, within the limits defined in our Risk Appetite. |
| Risk Appetite | See our Risk Appetite section that follows. |
| Delegated Authorities/Mandates | Define who can do what under the authority delegated to the CEO by the Board. |
| Risk Certifications | Business Units, Business Support Units or Risk Control Units set out each year how they managed/controlled risks in line with our risk frameworks and Risk Appetite, and explain any action to be taken. This helps drive personal accountability. |
| | | | | | | | | | | | | | |
| Annual Report 2022 | Santander UK Group Holdings plc 94 |
| | | | | | | | | | | | | | | | | | | | | | | | | | | | | | | | | | | | | | | | | |
| Strategic Report | Sustainability and Responsible Banking | Governance | Risk review | Financial review | Financial
statements | Shareholder
information |
| | | | | | | | | | | | | |
| | | | | | | | | | | | | |
RISK APPETITE
How we control the risks we are prepared to take
When our Board sets our strategic objectives, it is important that we are clear about the risks we are prepared to take to achieve them. We express this through our Risk Appetite Statement, which defines the amount and kind of risk we are willing to take. Our Risk Appetite and strategy are closely linked, and our strategy must be achievable within the limits set out in our Risk Appetite.
The principles of our Risk Appetite
Our Risk Appetite Statement lists ten principles that we use to set our Risk Appetite.
–We always aim to have enough financial resources to continue to do business in adverse but plausible stressed economic and business conditions, as well as to survive a very severe stress that would deplete our capital reserves
–We should be able to predict how our income and losses might vary – that is, how volatile they are. That applies to all our risks and lines of business
–Our earnings and dividend payments should be stable, and in line with the return we aim to achieve
–We are an autonomous business, so we always aim to have strong capital and liquidity resources
–The way we fund our business should be based on diverse funding sources and duration. This helps us avoid relying too much on wholesale markets
–We set controls on large concentrations of risk, like single customers or specific industries
–There are some key risks we take, but for which we do not actively seek any reward, like operational, conduct and regulatory, financial crime, legal and reputational risk. We take a risk-averse approach to these risks
–We comply with all regulations – and aim to exceed the standards they set
–Our pay and bonus schemes should support these principles and our risk culture
–We always aim to earn the trust of our people, customers, shareholders and communities.
How we describe the limits in our Risk Appetite
Our Risk Appetite sets out detailed limits across all types of risk, using metrics and qualitative statements.
Metrics
We use metrics to set limits across most risk types including a set of metrics focused on losses, capital, liquidity and concentration. We set:
–Limits for losses for our most important risks, including credit, market, operational and conduct risk
–Capital limits, reflecting both the capital that regulators expect us to hold (regulatory capital) and our own internal measure economic capital (EC)
–Liquidity limits according to a range of plausible stress scenarios for our business
–Concentration limits, to determine the maximum concentration level that we are willing to accept.
These limits apply in normal business conditions, but also when we might be experiencing a far more difficult economic environment. We refer to conditions like this as being under stress. For more on EC and stress scenarios, see the next page.
Qualitative statements
For some types of risk we also use qualitative statements that describe in words the appetite we want to set. For example, in operational risk, we use them to describe our risk-averse appetite for cyber risk. We also use them to prohibit or restrict exposure to certain sectors, types of customer and activities.
How we set our Risk Appetite, and stay within it
We control our Risk Appetite through our Risk Appetite Framework. Our Board approves and oversees our Risk Appetite Statement every year. This ensures it is consistent with our strategy and reflects changes in the markets and economic environment in which we operate. Our ERCC is responsible for ensuring that our risk profile (the level of risk we are prepared to accept) is consistent with our Risk Appetite Statement. To do this they monitor our performance against our Risk Appetite, business plans and budgets each month.
We also use stress testing to review how our business plan performs against our Risk Appetite Statement. This shows us if we would stay within our Risk Appetite under stress conditions. It also helps us to identify any adverse trends or inconsistencies.
We embed our Risk Appetite by setting more detailed risk limits for each business unit and key portfolios. These are set in a way so that if we stay within each detailed limit, we will stay within our overall Risk Appetite. When we use qualitative statements to describe our appetite for a risk, we link them to lower-level key risk indicators, so that we can monitor and report our performance against them.
| | | | | | | | | | | | | | |
| Annual Report 2022 | Santander UK Group Holdings plc 95 |
| | | | | | | | | | | | | | | | | | | | | | | | | | | | | | | | | | | | | | | | | |
| Strategic Report | Sustainability and Responsible Banking | Governance | Risk review | Financial review | Financial
statements | Shareholder
information |
| | | | | | | | | | | | | |
| | | | | | | | | | | | | |
STRESS TESTING
Stress testing helps us understand how different events and economic conditions could affect our business plan, earnings and risk profile. This helps us plan and manage our business.
Scenarios for stress testing
To see how we might cope with difficult conditions, we regularly develop challenging scenarios that we might face. We consult a broad range of internal stakeholders, including Board members, when we design and choose our most important scenarios. The scenarios cover a wide range of outcomes, risk factors, time horizons and market conditions. They are designed to test:
–The impact of shocks affecting the economy as a whole or the markets we operate in
–Key potential vulnerabilities of our business model, and the processes and systems which support it
–Potential impacts on specific risk types.
We describe each scenario using a narrative setting out how events might unfold, as well as a market and/or economic context. For example, the key economic factors we reflect in our ICAAP scenarios include house prices, interest rates, unemployment levels, inflation, and the size of the UK economy. We also explore sensitivities around several macro variables where there may be concerns or levels of uncertainty.
In 2021 and 2022, we completed the Bank of England’s (BoE) Climate Biennial Exploratory Scenario (CBES). The purpose of this exercise was to investigate a range of risks that may not be directly linked to prevailing economic and financial conditions and helps us to prepare for possible future shocks. The CBES tested the resilience of the UK financial system to the physical and transition risks associated with three different climate pathways. The key climate factors included physical risks due to higher global temperatures, and transition risks due to the structural changes needed to transition to a low-carbon economy.
In 2022, we also developed a Climate Internal Scenario Analysis (CISA) to help understand better the potential impact of climate change on our business portfolios and balance sheet. We generated three qualitative scenarios for climate-related risks and we also quantified potential losses from an early disorderly transition, for example linked to the current energy crisis and conflict in Ukraine. The CISA outputs will form the basis of our 2022 ICAAP for climate risk by helping show if we need to hold more capital for climate-related risk and help us prioritise our actions for the next five years.
How we use stress testing
We use stress testing to estimate the effect of these scenarios on our business and financial performance, including:
–Our business plan, and its assessment against our Risk Appetite
–Our capital strength, through our ICAAP
–Our liquidity position, through our ILAAP
–Our long term impacts of climate change, through the CBES and our CISA
–Impacts on other risk types.
We use a wide range of models, approaches and assumptions. These help us interpret the links between factors in markets and the economy, and our financial performance. For example, one model looks at how changes to key macroeconomic variables like unemployment rates might affect the number of customers who might fall into arrears on their mortgage or other loans.
Our stress testing models are subject to a formal review, independent validation and approval process. We highlight the key weaknesses and related model assumptions in the approval process for each stress test. In some cases, we overlay expert judgement onto the results of our models. Where this is material to the outcome of the stress test, the approving governance committee reviews it. We take a multi-layered approach to stress testing to capture risks at various levels. This ranges from sensitivity analysis of a single factor to a portfolio, to wider exercises that cover all risks across our entire business. We use stress test outputs to design business plans that aim to mitigate potential impacts of possible stress scenarios.
We also conduct reverse stress tests. These are tests in which we identify and assess scenarios that are most likely to cause our business model to fail.
Board oversight of stress testing
The ERCC approves the design of the scenarios in our ICAAP, ILAAP and CISA. The BRC approves the stress testing framework. The Board reviews stress test outputs as part of the approval processes for the ICAAP, ILAAP, Bank Recovery and Resolution Directive (BRRD), our Risk Appetite and regulatory stress tests, including CBES.
Regulatory stress tests
We take part in a number of external stress testing exercises. These can include stress tests of the UK banking system conducted by the PRA and the BoE. We also contribute to stress tests of Banco Santander conducted by the European Banking Authority (EBA).
For more on capital and liquidity stress testing, see the ‘Capital risk’ and ‘Liquidity risk’ sections.
HOW RISK IS DISTRIBUTED ACROSS OUR BUSINESS
Economic capital
As well as assessing how much regulatory capital we need to hold, we use an internal EC model to measure our risk. We use EC to get a consistent measure across different risk types. EC also takes account of how concentrated our portfolios are, and how much diversification there is between our various businesses and risk types. As a consequence, we can use EC for a range of risk management activities. For example, we can use it to help us compare requirements in our ICAAP or to get a risk-adjusted comparison of income from different activities.
Regulatory capital – risk-weighted assets
We hold regulatory capital against our credit, market and operational risks. In 2022, over half of our total risk-weighted assets accounted for credit risk in Retail Banking. This reflects our business strategy and balance sheet.
For more on this, see ‘Risk-weighted assets’ in the ‘Capital risk’ section.
| | | | | | | | | | | | | | |
| Annual Report 2022 | Santander UK Group Holdings plc 96 |
| | | | | | | | | | | | | | | | | | | | | | | | | | | | | | | | | | | | | | | | | |
| Strategic Report | Sustainability and Responsible Banking | Governance | Risk review | Financial review | Financial
statements | Shareholder
information |
| | | | | | | | | | | | | |
| | | | | | | | | | | | | |
Credit risk
| | | | | | | | | | | | | | | | | |
| | | | | |
| Overview Credit risk is the risk of financial loss due to the default or credit quality deterioration of a customer or counterparty to which we provided credit, or for whom we have assumed a financial obligation. We set out how our exposures arise and our approach to credit risk across the credit risk lifecycle. We discuss our ECL approach and the key inputs to our ECL model. We then analyse our key metrics, credit performance and forbearance. | | | Key metrics Stage 3 ratio improved to 1.24% (2021: 1.43%). Loss allowances increased to £1,007m (2021: £866m). Balance weighted average LTV of 69% (2021: 66%) on new mortgage lending. | |
CREDIT RISK MANAGEMENT
Exposures (audited)
Exposures to credit risk arise in our business segments from:
| | | | | | | | | | | | |
| Retail Banking | | Consumer Finance | Corporate & Commercial Banking | Corporate Centre |
In Homes: –Residential mortgages for customers with good credit quality (prime lending). –We provide these mostly for owner-occupiers, with buy-to-let mortgages for non-professional landlords. In Everyday Banking: –Unsecured lending to individuals, such as loans, credit cards and overdrafts. –Banking services to businesses with turnover up to £6.5m per annum and simpler borrowing needs. We offer loans, credit cards and overdrafts. | | –Financing for cars, vans, motorbikes and leisure vehicles through Santander Consumer (UK) plc (SCUK). –Through our joint ventures, Hyundai Capital UK Ltd and Volvo Car Financial Services UK Limited, we provide retail point of sale customer finance and wholesale finance facilities (stock finance). | –Loans, bank accounts, treasury services, invoice discounting, cash transmission, trade finance and asset finance. –We provide these to SMEs and mid-sized corporates with turnover up to £500m per annum, Commercial Real Estate and Social Housing associations. | –Asset and liability management of our balance sheet, as well as non-core and legacy portfolios in run-off. –Exposures include financial institutions (derivatives and other treasury products), structured products, and sovereign and supranational assets chosen for diversification and liquidity. –Crown Dependencies - mainly residential mortgages to individuals in Jersey and the Isle of Man. |
The segmental basis of presentation in this Annual Report has changed following the transfer of Social Housing loans and non-core liabilities to our CCB segment from Corporate Centre. Comparatives have been restated accordingly. See Note 2 for more information.
Our approach to credit risk
We manage our portfolios across the credit risk lifecycle, from drawing up our risk strategy and planning, through assessment and origination, monitoring, arrears management and debt recovery. We make sure the actual risk profile of our exposures stays in line with our business plans and within our Risk Appetite. We tailor the way we manage risk to the type of product and regularly review our approach and refine it when we need to.
1. Risk strategy and planning (audited)
All relevant areas of the business work together to create our business plans. We aim to balance our strategy, goals, and financial and technical resources with our Risk Appetite. To do this, we focus on economic and market conditions and forecasts, regulations, conduct matters, profitability, returns and market share.
2. Assessment and origination (audited)
Managing credit risk begins with lending responsibly. That means only lending to customers who are committed to paying us back and can afford to, even if their circumstances change. We undertake a thorough risk assessment to make sure a customer can meet their obligations before we approve a loan. We take proportionate steps to assess whether a customer will be able to repay the money borrowed. We do this by a series of initial affordability and credit risk assessments. We access each customer’s credit profile and signs of how reliable they are at repaying credit. When a customer applies, we assess the data they provide, plus data from credit reference agencies (for Retail Banking and Consumer Finance) and performance on their other Santander accounts (if they have any) against our Credit Policy.
Retail Banking
In Homes, for secured loans, we assess affordability by reviewing the customer’s income and spending, their other credit commitments, and what would happen if interest rates went up. Many of our decisions are automated as we use data available to us. We tailor our process and application assessment based on the product. More complex transactions often need greater manual assessment using our credit underwriters’ skill and experience.
In Everyday Banking, similar to Homes, many of our decisions are automated and we tailor the process based on the product. We assess affordability on a proportionate basis by reviewing the customer’s income, spending stressed for future inflation, their total credit commitments and accommodation stressed for expected interest rates.
| | | | | | | | | | | | | | |
| Annual Report 2022 | Santander UK Group Holdings plc 97 |
| | | | | | | | | | | | | | | | | | | | | | | | | | | | | | | | | | | | | | | | | |
| Strategic Report | Sustainability and Responsible Banking | Governance | Risk review | Financial review | Financial
statements | Shareholder
information |
| | | | | | | | | | | | | |
| | | | | | | | | | | | | |
Credit risk mitigation
The types of credit risk mitigation, including collateral, across each of our portfolios are:
| | | | | |
| Portfolio | Description |
| Residential mortgages | Collateral is in the form of a first legal charge over the property. Before we grant a mortgage, the property is valued either by a surveyor or using automated valuation methodologies where our confidence in the accuracy of this method is high. |
| Unsecured lending | There is no collateral or security tied to the loan that can be used to mitigate any potential loss if the customer does not pay us back. |
| Business banking services | Business banking lending is unsecured. When lending to incorporated businesses, we typically obtain personal guarantees from each director but we do not treat these as collateral. We consider the UK Government guarantee supporting losses on amounts lent under its Coronavirus Loan Schemes as collateral with 100% for Bounce Back Loan Scheme (BBLS) and 80% for Coronavirus Business Interruption Loan Scheme (CBILS). |
Consumer Finance
In Consumer Finance, similar to Retail Banking, many decisions are automated and we tailor the process to the product. Residual value risk is one of our top risks.
Credit risk mitigation
The type of credit risk mitigation, including collateral, is:
| | | | | |
| Portfolio | Description |
| Consumer (auto) finance | Collateral is in the form of legal ownership of the vehicle for most loans, with the customer being the registered keeper. Only a very small proportion of business is underwritten as a personal loan. In these cases, there is no collateral or security tied to the loan. We use a leading vehicle valuation company to assess the LTV at the proposal stage to ensure the value of the vehicle is appropriate. |
Corporate & Commercial Banking
We assign each customer a credit rating according to the internal rating threshold, using our internal rating scale (see ‘Credit quality’ in ‘Santander UK group level – credit risk review’ section). To do this, we look at the customer’s financial history and trends in the economy, backed up by the expert judgement of a risk analyst. We review our internal ratings on a dynamic basis and at least once a year for those clients that are rated. We also assess the underlying risk of the transaction, taking account of any mitigating factors (see the tables below) and how it fits with our risk policies, limits and Risk Appetite.
Responsible lending, including climate change and the transition to a low carbon economy
As part of the Banco Santander group, we comply with the Equator Principles to factor social, ethical and environmental impacts into our risk analysis and decision making for qualifying financial transactions. We are committed to supporting clients and economies in their transition to a low carbon economy, providing financial products and/or services to business activities that are environmentally and socially responsible. Our ESCC policy sets out how we identify, assess, monitor and manage environmental and social risks and other climate change related activities in the Oil and Gas, Power Generation and Mining and Metals sectors and those arising from businesses engaged in soft commodities. Our ESCC policy prohibits project-related financing for new coal-fired power plants (CFPP) worldwide and we will only work with new clients with CFPPs to provide specific financing for renewable energy projects. In line with Banco Santander's commitment, by 2030 we will eliminate all exposure to thermal coal mining and stop providing financial services to power generation clients with more than 10% of revenue from thermal coal. More information on our approach to Responsible Lending can be found in the Sustainability and Responsible Banking section.
Credit risk mitigation
The types of credit risk mitigation, including collateral, across each of our portfolios are as follows. In addition, from time to time at a portfolio level we execute significant risk transfer transactions, which typically reduce RWAs.
| | | | | |
| Portfolio | Description |
| SME and mid corporate | Includes secured and unsecured lending. We can take mortgage debentures or a first charge on commercial property as collateral. Before agreeing the loan, we get an independent professional valuation of the property. Loan agreements typically allow us to obtain revaluations during the term of the loan. We can also take guarantees, but we do not treat them as collateral unless they are supported by a tangible asset charged to us. We also lend against assets (like vehicles and equipment) and invoices for some customers. We value assets before we lend. For invoices, we review the customers' ledgers regularly and lend against debtors who meet agreed criteria. |
| Commercial Real Estate | We take a first charge on commercial property as collateral. The loan is subject to criteria such as the property condition, age and location, tenant quality, lease terms and length, and the sponsor’s experience and creditworthiness. Before advancing the loan and where appropriate, a bank representative visits the property, additionally we get an independent professional valuation which typically includes a site visit. Loan agreements typically allow us to obtain revaluations during the term of the loan. |
| Social Housing | We take a first charge on portfolios of residential real estate owned and let by UK Housing Associations as collateral, in most cases. We revalue this every three to five years (in line with industry practice), using the standard methods for property used for Social Housing. |
Corporate Centre
Credit risk mitigation
The types of credit risk mitigation, including collateral, across each of our portfolios are as follows. In addition, from time to time at a portfolio level we execute significant risk transfer transactions, which typically reduce RWAs.
| | | | | |
| Portfolio | Description |
| Sovereign and Supranational | In line with market practice, there is no collateral against these assets. |
| Structured Products | These are our High Quality Liquid Assets (HQLA) in our Eligible Liquidity Pool. They are mainly ABS and covered bonds, which hold senior positions in the creditor hierarchy. Their credit rating reflects over-collateralisation in the structure and the assets that underpin their cash flows. |
| |
| Financial Institutions | We use standard legal agreements to reduce credit risk via netting and collateralisation on derivatives, repos and reverse repos, and stock borrowing/lending. We also reduce risk by clearing trades through central counterparties (CCPs) where possible.
|
| |
| Crown Dependencies | We manage the risk on this portfolio in the same way as for mortgages in Retail Banking. |
| | | | | | | | | | | | | | |
| Annual Report 2022 | Santander UK Group Holdings plc 98 |
| | | | | | | | | | | | | | | | | | | | | | | | | | | | | | | | | | | | | | | | | |
| Strategic Report | Sustainability and Responsible Banking | Governance | Risk review | Financial review | Financial
statements | Shareholder
information |
| | | | | | | | | | | | | |
| | | | | | | | | | | | | |
3. Monitoring (audited)
We measure and monitor changes in our credit risk profile on a regular and systematic basis against our budgets, limits and benchmarks.
Credit concentrations
A core part of our monitoring and management is a focus on credit concentrations, such as the proportion of our lending that goes to specific borrowers, groups or industries. We set and monitor concentration limits in line with our Risk Appetite and review them on a regular basis.
–Geographical concentrations: We set exposure limits to countries and geographies, with reference to the country limits set by Banco Santander and our own Risk Appetite. For more geographical information, see ‘Country risk exposures’.
–Industry concentrations: We also set exposure limits by industry sector. We set these limits based on the industry outlook, our strategic aims and desired level of concentration, and relevant limits set by Banco Santander. We analyse committed exposures in the ‘Credit risk review’ section that follows.
Retail Banking
In Homes, we use IT systems and data available to us to monitor accounts. The main parts are:
–Behavioural scoring: we use statistical models that help predict whether a customer will have problems repaying, based on how they use their accounts
–Credit reference agencies: we often use data from agencies on how the borrower is handling credit from other lenders in our behaviour scoring models
–Other Santander accounts: each month, we also look at how the customer uses their other accounts with us, so we can identify problems early.
Our day-to-day retail credit risk monitoring relies on a mix of product, customer and portfolio performance measures as described above. However, changes in the wider UK economy also impact our Homes portfolio. As part of our day-to-day risk monitoring, we use a Retail Risk Playbook tolerance framework that sets out the most relevant macroeconomic variables to retail portfolio performance. We monitor these variables against our forecasts. If the economy deviates materially from our forecasts, such as due to the effects of the cost of living crisis, high inflation, we formally review our retail risk management policy and strategy. Our monitoring can also mean we change our minds about whether a product is still right for a customer. If we find evidence that a customer is in financial difficulties, we contact them about arrears management including forbearance, which we explain in more detail below.
For secured lending, our monitoring also takes account of changes in property prices. We estimate the property’s value every three months. In most cases, we use statistical models based on recent sales prices and valuations in that local area. Use of this model is subject to Model Risk Governance. Where a lack of data means the model’s valuation is not available, we use the original surveyor valuation with a House Price Index (HPI) adjustment as needed.
In Everyday Banking, similar to Homes, we use IT systems and data available to us to monitor accounts, and we use the Retail Risk Playbook tolerance framework (except for business banking services) and management judgements to ensure that portfolio quality remains within Risk Appetite. For unsecured personal lending like credit cards and overdrafts, monitoring might lead us to raise or lower credit limits. For business banking services, we review revolving credit facilities each year to ensure the facilities remain appropriate for the customer's financial circumstances.
Consumer Finance
In Consumer Finance, similar to Retail Banking, we use IT systems and data available to us to monitor accounts, and we use the Retail Risk Playbook tolerance framework and management judgements to ensure that portfolio quality remains within Risk Appetite. We also check the Residual Value of our portfolio each month, using triggers set to identify any material change in trends.
Corporate & Commercial Banking and Corporate Centre
We regularly monitor and report our credit risk by portfolio, segment, industry, location and customer. We monitor detailed analyses of our credit exposures and risk trends each month. We also report our larger exposures and risks to the Board Risk Committee each month.
Our Watchlist
We also use a Watchlist for exposures subject to annual reviews to help identify potential problem debt early. Just because a customer is on our Watchlist does not mean they have defaulted. It just means that their probability of default has increased, such as they have breached a covenant or lost a major contract.
We classify Watchlist cases as:
–Enhanced monitoring: for less urgent cases. We monitor these cases more often and where appropriate may consider more collateral.
–Proactive management: for more urgent or serious cases. We may take steps to restructure debt including extending the term, taking more collateral, agreeing a lower credit limit, or seeking repayment of the loan through refinancing or other means.
We assess Watchlist cases for impairment as set out in the ‘Significant Increase in Credit Risk (SICR)’ section. When a customer is in enhanced monitoring, we do not consider it has suffered a SICR for ECL purposes, so it remains in Stage 1 for our loss allowance calculations. When a customer is in proactive management, we consider it has suffered a SICR, so we transfer it to Stage 2 and apply a lifetime ECL for our loss allowance calculations. We take into account any forbearance we offer. This includes any extra security, guarantees or equity available and the potential to enhance value by asset management.
In Corporate & Commercial Banking, as part of our annual reviews, for loans nearing maturity, we look at the prospect of refinancing the loan on current market terms and applicable credit policy. If this is unlikely, we put the case on our Watchlist. We manage exposures not subject to annual reviews, mainly high volume and low value cases, using early warning indicators including credit reference agency data, supported by teams of expert analysts.
In Corporate Centre, we typically monitor the credit quality of our exposures daily. We use internal and third-party data to detect any potential credit deterioration. In addition, we manage the credit quality of our Crown Dependencies mortgages in the same way as for mortgages in Retail Banking.
4. Arrears management (audited)
Retail Banking and Consumer Finance
We have several strategies to manage arrears that we can use as early as the day after a missed payment. We assess the problems a customer is having, so we can offer them the right help to bring their account up to date as soon as possible. The strategy we use depends on the risk and the customer’s circumstances.
Corporate & Commercial Banking and Corporate Centre
We identify problem debt by close monitoring, supported by our Watchlist process for exposures subject to annual review. We aim to identify warning signs early by monitoring customers’ financial and trading data, checking to see they do not breach covenants, and having regular dialogue with them. We tailor our strategy to the type of customer, their circumstances and the level of risk. We try to help our customers find their own way out of financial difficulty and agree on a plan that works for both of us. We engage our Restructuring & Recoveries team as needed on Watchlist cases and we may hand over more serious cases to them. For exposures not subject to annual review, we have strategies to manage arrears that can be used as early as the day of the missed payment. If a case becomes more urgent or needs specialist attention, and if it transfers to Stage 3, we transfer it to our Restructuring & Recoveries team.
For more, see the Forbearance section.
| | | | | | | | | | | | | | |
| Annual Report 2022 | Santander UK Group Holdings plc 99 |
| | | | | | | | | | | | | | | | | | | | | | | | | | | | | | | | | | | | | | | | | |
| Strategic Report | Sustainability and Responsible Banking | Governance | Risk review | Financial review | Financial
statements | Shareholder
information |
| | | | | | | | | | | | | |
| | | | | | | | | | | | | |
5. Debt recovery (audited)
Sometimes, even when we have taken all reasonable and responsible steps to manage arrears, they are not effective. If this happens, we have to end our agreement with the customer and try to recover the whole debt, or as much of it as we can.
Retail Banking
In Homes, we may use a debt collection agency, sell the debt, or take the customer to court. For retail mortgages, we may repossess the property as a last resort or to protect it from damage or third-party claims. We make sure our estimated losses from repossessed properties are realistic by getting two independent valuations and the estimated selling costs, and using them in our loss allowances calculations. Where we repossess a property, we do not take ownership. We use agents to realise the value and settle the debt. Any surplus funds are returned to the borrower or dealt with in line with insolvency rules.
In Everyday Banking, we may use a debt collection agency, sell the debt, or take the customer to court, similar to our approach in Homes.
Consumer Finance
In Consumer Finance, similar to Retail Banking, we may use a debt collection agency, sell the debt, or take the customer to court. We may consider taking steps to re-possess the vehicles we have financed.
Corporate & Commercial Banking and Corporate Centre
Where we look for an exit, we aim to do this, if we can, by agreeing with the borrower that they will sell some or all their assets on a voluntary basis or agreeing to give them time to refinance their debt with another lender. Where we cannot reach an agreement, we consider recovery options. This can be through an insolvency proceeding, enforcing over any collateral or selling debt on the secondary market. We may also consider other legal action to recover what we are owed. If there is a shortfall, we write it off against our loss allowances. In very rare cases, we may act as mortgagee in possession of assets held as collateral against non-performing commercial lending. In such cases, we carry the assets on our balance sheet and classify them in line with our accounting policies.
Loan modifications (audited)
We sometimes change the terms of a loan when a customer gets into financial difficulty (this is known as forbearance), or for other commercial reasons.
Forbearance (audited)
We can change the terms of a customer's loan, temporarily or permanently, to help them through temporary periods of difficulty so they can get back on to sustainable terms. We assess what we offer to make sure the customer can afford it. Forbearance improves our customer relationships and we review our approach regularly to make sure it is still effective. We try to offer forbearance before a customer defaults and we only foreclose or repossess as a last resort.
The main types of forbearance we offer are:
| | | | | |
| Action | Description |
| Term extension | We can extend the loan term, making each monthly payment smaller. We may offer this if the customer is up to date with payments but shows signs of financial difficulties. We may also offer this if the loan is about to mature and refinancing is not possible on market terms. |
| Interest-only | Prior to 2016, we offered retail customers temporary concessions to interest-only repayments due to financial difficulty. This concession is no longer available but any such loans that remain on interest-only repayment concession are classed as forborne. For corporate customers, we still consider interest-only concessions on a case by case basis. We only agree to this if we believe their financial problems are temporary and they are going to recover. After the interest-only period, we expect the customer to go back to making full payments of interest and capital once they are in a stronger financial position. |
Other payment rescheduling, including capitalisation
| For retail customers, we may add the arrears to the mortgage balance (this is known as capitalisation) if they cannot afford to increase their monthly payment to pay off their arrears in a reasonable time but have been making their monthly payments, usually for at least six months. We can also capitalise property charges due to a landlord. We pay them for the customer to avoid the lease being forfeited. We may combine this help with term extensions and, in the past, interest-only concessions. In certain cases we may also offer interest rate concessions. For corporate customers, we may lower or stop their payments until they have time to recover. We may reschedule payments to better match the customer’s cash flow – for example if the business is seasonal - or provide a temporary increase in facilities to cover peak demand ahead of their trading improving. We might do this by arrears capitalisation or drawing from an overdraft. We may also offer to provide new facilities, interest rate concessions and interest roll-up. In rare cases, we agree to forgive or reduce part of the debt. |
When we agree forbearance, we consider the account has suffered a SICR, as we explain later on, and we classify it as Stage 2 or 3. If an account is already in Stage 2, we keep it in Stage 2 unless the account is deemed unlikely to pay, involves forgiving fees and interest or debt, or is being granted multiple forbearances. In these cases, we move it into Stage 3. If an account is already in Stage 3, we keep it in Stage 3. A loan moves out of forbearance once the exit criteria below are met. We monitor the performance of all forborne loans.
Exit from forbearance or cure
For an account in Stage 3 to exit forbearance, all the following conditions must be met:
–The account has been classed as Stage 3 for at least one year since the end of the latest forbearance strategy
–The account is not deemed unlikely to pay
–The account is no longer in arrears, and the customer has no other material debts with us which are more than 90 days in arrears.
If all the conditions are met, the account is re-classed as Stage 2 forbearance until the Stage 2 forbearance exit conditions set out below are also met.
For an account in Stage 2 to exit forbearance, all the following conditions must be met:
–The account has been classed as Stage 2 for at least two years since the end of the latest forbearance strategy
–The account has been performing, i.e. the customer is no longer in financial difficulty
–Meaningful capital and interest repayments have been made for at least 50% of the two year period
–The account is no longer in arrears, and the customer has no other material debts with us which are more than 30 days in arrears.
| | | | | | | | | | | | | | |
| Annual Report 2022 | Santander UK Group Holdings plc 100 |
| | | | | | | | | | | | | | | | | | | | | | | | | | | | | | | | | | | | | | | | | |
| Strategic Report | Sustainability and Responsible Banking | Governance | Risk review | Financial review | Financial
statements | Shareholder
information |
| | | | | | | | | | | | | |
| | | | | | | | | | | | | |
Other forms of debt management and modifications
When a customer is not showing signs of financial difficulties, we can also change their loan terms. We do this to help them manage their financial liabilities.
Retail Banking
In Homes, apart from forbearance, we have sometimes changed the contract terms to keep a good relationship with a customer. In Homes and Everyday Banking, we do not classify insolvency solutions for any unsecured retail customers as forbearance. This is in line with industry guidelines.
Consumer Finance
We do not classify insolvency solutions for any unsecured retail customers as forbearance. This is in line with industry guidelines.
Corporate & Commercial Banking and Corporate Centre
When customers are in financial difficulty, we can also manage debt in other ways, depending on the facts of the specific case:
| | | | | |
| Action | Description |
| Waiving or changing covenants | If a borrower breaks a covenant, we can either waive it or change it, taking their latest and future financial position into account. We may also add a condition on the use of any surplus cash (after operating costs) to pay down their debt to us. |
| Asking for more collateral or guarantees | If a borrower has unencumbered assets, we may accept more collateral in return for revised financing terms. We may also take a guarantee from companies in the same group and/or major shareholders. We only do this where we believe the guarantor can meet their commitment. |
| Asking for more equity | Where a borrower can no longer pay the interest on their debt, we may accept fresh equity capital from new or existing investors to change the capital structure in return for better terms on the existing debt. |
Risk measurement and control
We measure and control credit risk at all stages across the credit risk lifecycle. We have a range of tools, processes and approaches.
Retail Banking and Consumer Finance
These businesses involve managing large numbers of accounts, so they produce a huge amount of data. This allows us to take a more analytical and data intense approach to measuring risk. This is reflected in the wide range of statistical models we use across the credit risk lifecycle. We use:
–Risk strategy and planning: econometric models
–Assessment and origination: application scorecards, and attrition, pricing, loss allowance and capital models
–Monitoring: behavioural scorecards and profitability models
–Arrears management: models to estimate the proportion of cases that will result in possession (known as roll rates)
–Debt recovery: recovery models.
We assess and review our loss allowances regularly and have them independently reviewed. We look at factors such as the cash flow available to service debt. We also use an agency to value any collateral – mainly mortgages.
Corporate & Commercial Banking and Corporate Centre
We measure the credit risk on treasury products by adding their potential future exposure to market movements over their lives to their fair value. Then we add it to any other exposure and measure the total against our credit limits for each client. In Corporate Centre, we manage the credit quality of our Crown Dependencies mortgages in the same way as for mortgages in Retail Banking. We assess our loss allowances regularly by looking at factors such as the cash flow available to service debt and the value of collateral based on third-party professional valuations.
Key metrics (audited)
We use a number of key metrics to measure and control credit risk, as follows:
| | | | | |
| Metric | Description |
| Expected Credit Loss (ECL) | ECL tells us what credit risk is likely to cost us either over the next 12 months or over the lifetime of the exposure where there is evidence of a SICR since origination. We explain how we calculate ECL below. |
| Stages 1, 2 and 3 | We assess each facility’s credit risk profile to determine which stage to allocate them to, and we monitor where there is a SICR and transfers between the Stages including monitoring of coverage ratios for each stage. We explain how we allocate a facility to Stage 1, 2 or 3 below. |
| Stage 3 ratio | The Stage 3 ratio is the sum of Stage 3 drawn and Stage 3 undrawn assets divided by the sum of total drawn assets and Stage 3 undrawn assets. The Stage 3 ratio is the main indicator of credit quality performance. |
| Expected Loss (EL) | EL is based on the CRD IV regulatory capital rules and gives us another view of credit risk. It is the product of the probability of default, exposure at default and loss given default, and we include direct and indirect costs. We base it on our risk models and our assessment of each customer’s credit quality. The rest of our Risk review, impairments, losses and loss allowances refer to calculations in accordance with IFRS, unless we specifically say they relate to CRD IV. For our IFRS impairment accounting policy, see Note 1 to the Consolidated Financial Statements. |
We also assess risks from other perspectives, such as geography, business area, product and process to identify areas to focus on. We also use stress testing to establish vulnerabilities to economic deterioration. Our business segments tailor their approach to credit risk to their customers, as we explain later on.
| | | | | | | | | | | | | | |
| Annual Report 2022 | Santander UK Group Holdings plc 101 |
| | | | | | | | | | | | | | | | | | | | | | | | | | | | | | | | | | | | | | | | | |
| Strategic Report | Sustainability and Responsible Banking | Governance | Risk review | Financial review | Financial
statements | Shareholder
information |
| | | | | | | | | | | | | |
| | | | | | | | | | | | | |
Key differences between regulatory EL and IFRS 9 ECL models
There are differences between the regulatory EL and IFRS 9 ECL approaches. Although our IFRS 9 models use the existing Basel advanced IRB risk components, we need to make adjustments to ensure the outcome is in line with IFRS 9, i.e. the financial reporting standard we use, as follows.
| | | | | | | | |
| Basel advanced IRB EL | IFRS 9 ECL |
| Rating philosophy | Mix of point-in-time, through-the-cycle or hybrid | Point-in-time, forward-looking. Considers a range of economic scenarios |
| Parameters calibration | Contains regulatory floors and downturn calibration | Unbiased estimate, based on conditions known at the balance sheet date |
| Calculation timing | Considers aggregation of possible default events in the next 12 months | Considers monthly calculation of parameters, for all possible future default dates. First 12 months are used for Stage 1, full lifetime for Stages 2 and 3 |
| Probability of Default (PD) | PD in the next 12 months | Includes forward-looking economic data and removes conservatism. PD in next 12 months for Stage 1, lifetime for Stages 2 and 3 |
| Loss Given Default (LGD) | Lifetime LGD for defaults in the next 12 months | Modelled without regulatory floors and exclusion of indirect costs |
| Exposure at Default (EAD) | Exposure at the point of default if the customer defaults in the next 12 months | Recognises ability for exposure to reduce from balance sheet date to default date |
| SICR | Does not include SICR concept | Includes SICR concept |
| Discounting applied | At weighted average cost of capital to the default date | At the effective interest rate (EIR) to the balance sheet date |
Recognising ECL (audited)
The ECL approach estimates the credit losses arising from defaults in the next 12 months on qualifying exposures, or defaults over the lifetime of the exposure where there is evidence of a Significant Increase in Credit Risk (SICR) since the origination date. The ECL approach takes into account forward-looking data, including a range of possible outcomes, which should be unbiased and probability-weighted to reflect the risk of a loss being incurred even when it is unlikely.
Critical judgements and accounting estimates applied in calculating ECL (audited)
The preparation of Santander UK's consolidated financial statements in accordance with IFRS requires management to make judgements, estimates and assumptions in applying the accounting policies that affect the reported amounts of assets, liabilities, income and expenses. Due to the inherent uncertainty in making estimates, actual results reported in future periods may be based on amounts which differ from those estimates. Estimates, judgements and assumptions are continually evaluated and are based on historical experience and other factors, including expectations of future events that are believed to be reasonable under the circumstances. There has been no change in the inherent sensitivity of the areas of judgement in the period. Management have considered the impact of developments in principal risks and uncertainties, as set out in the Risk review, on critical judgements and accounting estimates.
The significant judgements, apart from those involving estimation, made by management in applying Santander UK's accounting policies in these financial statements (key judgements) and the key sources of estimation uncertainty that may have a significant risk of causing a material adjustment to the carrying amount of assets and liabilities within the next financial year (key estimates), which together are considered critical to Santander UK's results and financial position, are as follows:
The application of the ECL impairment methodology for calculating credit impairment allowances is highly susceptible to change from period to period. The methodology requires management to make judgmental assumptions in determining the estimates. Any significant difference between the estimated amounts and actual amounts could have a material impact on the future financial results and financial condition. The impact of the cost of living crisis has increased the uncertainty around ECL impairment calculations and has required management to make additional judgements and accounting estimates that affect the amount of assets and liabilities at the reporting date and the amount of income and expenses in the reporting period. The key additional judgements due to the impact of the cost of living crisis mainly reflect the increased uncertainty around forward-looking economic data and the need for additional Judgemental Adjustments. We consider the critical accounting estimates in calculating ECL to be:
–Forward-looking multiple economic scenario assumptions; and
–Probability weights assigned to multiple economic scenarios.
We consider the critical management judgements in calculating ECL to be:
–Determining an appropriate definition of default;
–Establishing the criteria for a significant increase in credit risk (SICR) and for corporate borrowers internal credit risk rating;
–Determining the need for any Judgemental Adjustments (JAs);
–Determining the need to assess corporate Stage 3 exposures individually.
See the sections below for more on each of these key judgements and estimates.
Multiple economic scenarios and probability weights (audited)
For all our portfolios we use five forward-looking economic scenarios. For 2022 , they consist of a central base case, one upside scenario and three downside scenarios. We use five scenarios to reflect a wide range of possible outcomes for the UK economy.
Our forecasting approach
We derive our scenarios in part by using a set of parameters in GDP fan charts published by the Office for Budget Responsibility (OBR). These fan charts reflect the probability distribution of a deviation from the OBR’s central forecast to illustrate the uncertainty regarding the outcome of a variable, in this case GDP.
We use the 0.6 fan chart path for our Upside 1 scenario and the 0.3 path for Downside 1. For Downside 2 we impose a recession via an adjustment factor that converges to Downside 1 in the long-run, rather than imposing a floor on the peak to trough fall which had occurred prior to the pandemic. To ensure that Downside 2 is kept consistent with any changes to the OBR fan charts, we calculate the Downside 2 GDP by taking the percentage difference between Downside 2 and Downside 1 GDP in the original forecast and applying this difference to the new Downside 1.
Once we have established the GDP paths for each scenario, we run them through the Oxford Global Economic Model (OGEM) to derive the other macroeconomic variables, such as unemployment and house prices. These variables are the product of the GDP growth paths we have forecast and the output of the OGEM for these growth paths. These are then reviewed to ensure consistency with the narrative of each scenario and therefore changes to these variables may be required in some cases. We then impose a Bank Rate profile for each scenario using expert judgement. We determine the Bank of England Bank Rate by using the base case Bank Rate profile and adjusting this for each of the four other scenarios. To do this, we firstly consider what each of the scenarios is trying to achieve.
| | | | | | | | | | | | | | |
| Annual Report 2022 | Santander UK Group Holdings plc 102 |
| | | | | | | | | | | | | | | | | | | | | | | | | | | | | | | | | | | | | | | | | |
| Strategic Report | Sustainability and Responsible Banking | Governance | Risk review | Financial review | Financial
statements | Shareholder
information |
| | | | | | | | | | | | | |
| | | | | | | | | | | | | |
For the upside scenario, which has a slightly higher growth path, we assume a smaller increase in Bank Rate in 2023 with cuts beginning in 2024 in similar increments as the base case. For Downside 2 the scenario shows monetary policy being tightened to contain inflation at a time of weakening output growth, so here we assume the Bank of England raises rates to the same peak as in the base case to bring inflation back to its target rate, but that cuts start earlier as economic growth falls much more markedly and the Bank of England look to aid the economy. The rising Bank Rate profiles are based on forward guidance from the Bank of England, where increases are assumed to be gradual and incremental. For the Downside 1 scenario, this has a lower Bank Rate profile than in the base as the Bank of England look to bolster the economy earlier despite above target inflation rates, and for Stubborn Inflation, this reflects a larger increase in Bank Rate as inflation remains persistently above target. In this way, our scenarios reflect a range of possible outcomes that the Bank of England may follow for different growth paths, but also assumes that the Bank of England does not slash rates due to recessionary concerns.
Our use of five scenarios is designed to reflect different possible outcomes to the base case forecast highlighting the upside and downside risks associated with the central scenario. The downside risks for the UK economy include a further and sharper downturn in global growth, a substantial increase in inflation which raises the cost of living, a continuation of the very low productivity growth seen in the UK, and a move to a more protectionist agenda for trade. The upside risks were more muted at the end of 2022 and include a stronger recovery in global growth, a faster fall in inflation, coupled with a move to more open trade and further trade agreements with other countries.
We update the baseline in our economic scenarios at least twice a year in line with our annual budgeting and three-year planning processes, or sooner if there is a material change in current or expected economic conditions. For instance, in 2022 the base case has been updated every quarter. We refresh all our economic scenarios each quarter to reflect the latest data and OBR fan charts if these have changed, which are then reviewed and approved by the Credit Risk Provisions Forum (CRPF). The CRPF also assesses the probability weights at least once a quarter.
We do not use consensus forecasts as inputs to our models, but we do compare the outputs of our models against consensus views for the base case, to make sure that we understand any significant differences and address them where needed. At the end of 2022, there were no significant differences between our base case forecasts and the consensus views.
In 2022, we were also able to do further peer benchmarking analysis of the economic scenarios using the data the PRA provided, which for Q4 2022 included the mean weighted analysis for a selection of economic variables, including GDP, unemployment rate and HPI. This meant that we could compare our weighted scenarios against the average of our peers to understand what differences there may be. The conclusion of this analysis demonstrated that our economic scenarios were in line with our peers although, on a weighted basis, our house price inflation assumption reflected a more conservative view.
In 2022, we also considered any likely impact from climate change risk on our forecasting approach and concluded that no adjustment to the multiple economic scenarios for climate change risk was required. This is because climate change effects are generally regarded to be relevant over a longer timeframe than our forecast period of five years.
Our forecasting period for GDP is five years and then we revert to the average trend growth over three years based on the OBR’s long-run GDP forecast assumption. The reversion to mean for all macroeconomic variables is expected to take three years after the initial five-year forecast period.
Key changes to our forecasting approach in 2022
In 2022, there were no specific changes to our forecasting approach. The OBR returned to publishing its fan charts and the latest version, published in March 2022, have been incorporated.
Base case
For our base case, the forecasts include a 6 quarter recession with a peak to trough fall in GDP of c.2%, caused by falling real disposable incomes due to the cost of living crisis and higher interest rates which push up housing costs. The forecasts also incorporate the policies set out in the Autumn Statement, including the changes to the Energy Price Guarantee scheme. It is normal practice to review the scenarios and associated weights every quarter to ensure they appropriately reflect the current economic circumstances, and we will continue to follow that approach particularly as the advice the UK Government issues is subject to change in this fluid environment.
| | |
| Base case key macroeconomic assumptions |
–House price growth: The housing market was surprisingly resilient in the first half of 2022. However, the sharp rise in mortgage rates has triggered a slowdown in house price growth in recent months. With survey indicators pointing to a sharp reduction in demand as buyer confidence is hit by a squeeze on affordability from higher inflation, taxes and mortgage rates, house prices are expected to continue declining in the near-term. We are forecasting a 10% year-on-year decline in house prices by the end of 2023, with zero growth anticipated by the end of 2024. Once the Bank Rate moves towards its neutral level, house price growth starts to pick up and by the end of the forecast period is in line with long term average earnings growth. |
–GDP: The GDP forecasts for Q3 showed negative growth of -0.3% q/q and there is a high likelihood of a further contraction in Q4 which would push the UK economy into recession. The Q3 data showed that households and businesses are reducing spending to deal with rising costs, particularly of essential goods such as food and energy. All of this is likely, along with additional costs, to weigh on businesses with some firms falling into insolvency and there are examples of this being reported in Q4. The economy is expected to officially be in recession by the end of 2022 and for all of 2023, with growth remaining weak in 2024. While support from the Autumn Statement was reduced in some areas, for example with energy costs, there was some positive news for those on benefits and receiving the state pension, with both increasing in line with September’s inflation rate of 11.1% and with the minimum wage also set to increase in April 2023. This should help support household spending and prevent a deeper economic downturn than the c.2% decline we expect. |
–Unemployment rate: Unemployment rose to 3.7% in the 3 months to October as labour demand started to soften and inactivity among early retirees fell. However, the large increase in inactivity due to ill health or workers opting for early retirement is keeping unemployment rates low. Vacancies remain at high levels although they are continuing to fall back as demand of goods and services declines. With the effect of rising energy costs and interest rates, it is likely that labour demand will fall back further as some firms become insolvent and others find that demand for goods and services reduce as households restrict spending as real earnings fall. Whilst the forecast does not assume a large rise in unemployment, the rate peaks at 5.1% by end of 2024 as labour demand and supply conditions change, including previously inactive workers returning to the labour force. |
–Bank Rate: For the Bank Rate forecast, the last actual data point for 2022 was December when the MPC increased rates by 50bps to 3.50% in line with expectations. This was followed by another 50bps rise to 4.00% in February, with two members voting in favour of no change. Our base case assumes that in Q1 2023 there will be no additional rises. Rate cuts start in Q2 2024 as inflation starts to fall back and the MPC looks to boost flagging growth. Bank Rate ends 2024 at 3.25%, with further cuts in 2025 leaving the terminal rate at 2.50% over the medium-term. |
In the medium-term, the projections assume that current demographic and productivity trends will continue, causing a reduction in the UK’s growth potential. For instance, it is likely that the reduction in the UK workforce continues and that this will have a knock-on impact for the economy, particularly if there are shortages of skilled workers in particular sectors. This is reflected in an average annual growth expectation of 1.6%, the OBR’s latest estimate of the UK’s long run average growth rate. CPI inflation is forecast to be significantly above the 2% target rate in the initial forecast period but then falls to target by the end.
| | | | | | | | | | | | | | |
| Annual Report 2022 | Santander UK Group Holdings plc 103 |
| | | | | | | | | | | | | | | | | | | | | | | | | | | | | | | | | | | | | | | | | |
| Strategic Report | Sustainability and Responsible Banking | Governance | Risk review | Financial review | Financial
statements | Shareholder
information |
| | | | | | | | | | | | | |
| | | | | | | | | | | | | |
Key changes to our base case in 2022
The key changes to our base case assumptions in 2022 were: (i) weaker GDP growth in 2023 and 2024 which largely reflects the bigger hit to consumer spending from the squeeze on real incomes; (ii) higher and longer above target inflation in response to rising food, fuel and utility bills; (iii) a steeper Bank Rate profile with rates now reaching 4% in 2023, with cuts starting in 2024. This had the effect of increasing the weighted average Bank Rate profile across the five scenarios to 4.29%; and (iv) house prices are 10% lower by the end of 2023.
Other scenarios
Based on this revised base case, we have reviewed our suite of scenarios to ensure that they capture the wide range of potential outcomes for the UK economy. These include (i) reflecting persistent above target inflation over the forecast period; (ii) a slower recovery that is more akin to the ‘U’ shape of past recessions; (iii) labour market frictions due to skills mismatches and a shrinking workforce as some discouraged workers leave altogether (for example EU workers returning to their native countries and older UK-born workers retiring early); and (iv) the global economy recovering more swiftly from higher inflation.
To reflect these potential outcomes, we decided to continue to use the base case and four additional scenarios, which management considers provides a range wide enough to reflect all the above potential outcomes. However, as the risks remain skewed to the downside, to reflect these outcomes sufficiently, we concluded that only one upside scenario would be needed to reflect the upside risks to the base case. As with the base case, the scenarios are forecast over a five-year period and then mean revert over the next three years to the OBR's latest estimate of the UK's long run average growth rate.
The four other scenarios are:
One upside scenario
This scenario has a quicker recovery than the Baseline although remains benign. It assumes that inflation falls back more swiftly than in the base case, with a quicker end to the Ukraine conflict which helps to reduce gas and food prices. This allows the Bank of England to cut rates bringing them back to what is more likely to be the neutral rate, with households using some of the additional levels of saving accrued over the pandemic. This results in higher consumer and business confidence enabling higher levels of spending with savings rates falling back as real earnings growth returns. House prices fall marginally more than the base case, mainly due to the implied relationship between GDP and HPI used by the Oxford Economics model compared to that used by Management to construct the base case.
Three downside scenarios
Downside 1 - This scenario is a bear case to the baseline. It assumes that peak to trough economic growth is lower and that the path out of recession is weaker. In this scenario excess savings are not used to support growth as consumer confidence remains extremely low, with households worried over the prospect of losing their job. House prices fall further than in the base case as more households look to downsize to lower mortgage repayments. Although inflation remains significantly above target, due to the very poor economic conditions, the Bank of England decides to cut Bank Rate earlier than in the base case to try and bolster growth.
Downside 2 - This scenario is similar in severity to a typical stress test scenario. It shows a marked fall in GDP, with unemployment rising to levels consistent with the Global Financial Crisis (GFC) and house prices falling by almost a third as real incomes are squeezed by higher mortgage rates, inflation and taxes, which in turn hits buyer affordability. The scenario also reflects ongoing strike action by various unions pushing for larger pay growth, along with dealing with potential blackouts and the possibility of curtailed working weeks to deal with the energy supply shortage over the winter months. It further assumes that the incidence of major risk events, for example those caused by climate change, continue to occur exposing risks to countries’ fiscal position and the means to respond to such events. For this scenario an overlay to the unemployment rate was also made to the model output from the OGEM. This was to account for the possibility of a recession of similar magnitude to that of 2008/09 where the unemployment rate peaked at 8.5%.
Stubborn inflation - which has replaced the Downside 3 scenario that was related to Covid-19. The scenario considers the effect on the UK economy of a persistent inflationary environment, where inflation remains above target for much of the forecast period. This persistent inflation is created by a combination of factors, including higher energy costs exacerbated by the conflict in Ukraine; continuous wage rises resulting in a spiral effect pushed by increasing numbers of strikes; falling productivity; and continuing supply constraints pushing up input prices. This causes a peak to trough fall in GDP of -4% and a much higher Bank Rate profile with a peak of 6% to combat persistently higher inflation. House prices fall c.20% which is similar to the GFC.
Key changes to our alternative scenarios in 2022
The key changes in 2022 were to Stubborn Inflation, which was changed from a pandemic scenario to one considering the effects of persistently above target inflation; to the Bank Rate profile of the scenarios to reflect current levels; and changes to the base case, historical data for each variable, and the OGEM. We did not make any other methodological changes to the scenarios. The combination of these different inputs will mean differences across the variables for each of the alternative scenarios when we update them each quarter. We continue to compare the variables between each quarter and review any large changes to ensure they are not erroneous.
| | | | | | | | | | | | | | |
| Annual Report 2022 | Santander UK Group Holdings plc 104 |
| | | | | | | | | | | | | | | | | | | | | | | | | | | | | | | | | | | | | | | | | |
| Strategic Report | Sustainability and Responsible Banking | Governance | Risk review | Financial review | Financial
statements | Shareholder
information |
| | | | | | | | | | | | | |
| | | | | | | | | | | | | |
The table below sets out our macroeconomic assumptions for each of the five scenarios at 31 December 2022:
| | | | | | | | | | | | | | | | | | | | | | | |
| | Upside 1 | Base case | Downside 1 | Downside 2 | Stubborn Inflation | Weighted |
| | % | % | % | % | % | % |
GDP(1) | 2021 (actual) | 7.5 | | 7.5 | | 7.5 | | 7.5 | | 7.5 | | 7.5 | |
| 2022 | 4.4 | | 4.4 | | 4.3 | | 3.7 | | 4.2 | | 4.3 | |
| 2023 | (1.0) | | (1.3) | | (1.9) | | (6.4) | | (2.7) | | (2.2) | |
| 2024 | 0.8 | | 0.5 | | (0.3) | | (0.7) | | (0.9) | | 0.0 | |
| 2025 | 2.0 | | 1.6 | | 0.5 | | 1.7 | | 0.2 | | 1.2 | |
| 2026 | 2.0 | | 1.5 | | 0.4 | | 1.5 | | 0.6 | | 1.2 | |
Bank Rate(1) | 2021 (actual) | 0.25 | | 0.25 | | 0.25 | | 0.25 | | 0.25 | | 0.25 | |
| 2022 | 3.50 | | 3.50 | | 3.50 | | 3.50 | | 3.50 | | 3.50 | |
| 2023 | 3.75 | | 4.00 | | 3.50 | | 3.75 | | 6.00 | | 4.29 | |
| 2024 | 3.00 | | 3.25 | | 2.75 | | 3.00 | | 5.50 | | 3.59 | |
| 2025 | 2.50 | | 2.75 | | 2.50 | | 2.75 | | 3.50 | | 2.85 | |
| 2026 | 2.25 | | 2.50 | | 2.25 | | 2.50 | | 3.00 | | 2.55 | |
HPI(1) | 2021 (actual) | 8.7 | | 8.7 | | 8.7 | | 8.7 | | 8.7 | | 8.7 | |
| 2022 | 7.6 | | 7.0 | | 7.6 | | 7.6 | | 7.6 | | 7.3 | |
| 2023 | (8.8) | | (10.0) | | (10.0) | | (15.8) | | (10.9) | | (10.7) | |
| 2024 | (4.3) | | 0.0 | | (6.7) | | (14.3) | | (8.8) | | (4.4) | |
| 2025 | 0.6 | | 2.0 | | (3.1) | | (4.1) | | (4.9) | | (0.8) | |
| 2026 | 4.1 | | 3.0 | | (0.2) | | 4.7 | | (0.6) | | 2.0 | |
Unemployment(1) | 2021 (actual) | 4.0 | | 4.0 | | 4.0 | | 4.0 | | 4.0 | | 4.0 | |
| 2022 | 3.7 | | 3.8 | | 3.7 | | 4.4 | | 3.7 | | 3.8 | |
| 2023 | 4.7 | | 4.7 | | 5.1 | | 8.5 | | 5.5 | | 5.3 | |
| 2024 | 4.5 | | 5.1 | | 5.4 | | 8.0 | | 5.9 | | 5.6 | |
| 2025 | 4.5 | | 4.5 | | 5.8 | | 7.4 | | 6.4 | | 5.4 | |
| 2026 | 4.4 | | 4.3 | | 6.1 | | 6.8 | | 6.6 | | 5.3 | |
The table below sets out our macroeconomic assumptions for each of the five scenarios at 31 December 2021:
| | | | | | | | | | | | | | | | | | | | | | | |
| | Upside 1 | Base case | Downside 1 | Downside 2 | Downside 3 | Weighted |
| | % | % | % | % | % | % |
GDP(1) | 2020 | (9.7) | | (9.7) | | (9.7) | | (9.7) | | (9.7) | | (9.7) | |
| 2021 | 7.0 | | 6.9 | | 6.8 | | 6.2 | | 5.6 | | 6.7 | |
| 2022 | 4.8 | | 4.6 | | 4.1 | | (0.7) | | (7.5) | | 2.8 | |
| 2023 | 2.2 | | 1.7 | | 0.9 | | 0.5 | | 3.1 | | 1.4 | |
| 2024 | 1.9 | | 1.5 | | 0.5 | | 1.6 | | 1.5 | | 1.3 | |
| 2025 | 2.1 | | 1.6 | | 0.5 | | 1.7 | | 1.5 | | 1.4 | |
Bank Rate(1) | 2020 | 0.10 | | 0.10 | | 0.10 | | 0.10 | | 0.10 | | 0.10 | |
| 2021 | 0.25 | | 0.25 | | 0.25 | | 0.25 | | 0.25 | | 0.10 | |
| 2022 | 0.75 | | 0.75 | | 0.75 | | 1.00 | | (0.50) | | 0.55 | |
| 2023 | 0.75 | | 0.75 | | 0.75 | | 2.00 | | 0.00 | | 0.96 | |
| 2024 | 1.25 | | 0.75 | | 1.00 | | 3.00 | | 0.00 | | 1.24 | |
| 2025 | 1.75 | | 0.75 | | 1.00 | | 2.75 | | 0.00 | | 1.21 | |
HPI(1) | 2020 | 6.9 | | 6.9 | | 6.9 | | 6.9 | | 6.9 | | 6.9 | |
| 2021 | 5.4 | | 5.0 | | 5.4 | | 5.4 | | (2.5) | | 4.8 | |
| 2022 | (0.8) | | 2.0 | | (1.8) | | (8.3) | | (19.6) | | (2.0) | |
| 2023 | (2.0) | | 2.0 | | (4.6) | | (13.1) | | (9.3) | | (3.1) | |
| 2024 | 1.0 | | 2.0 | | (3.1) | | (4.8) | | 2.4 | | (0.4) | |
| 2025 | 3.8 | | 2.0 | | (0.7) | | 4.3 | | 3.3 | | 2.1 | |
Unemployment(1) | 2020 | 5.2 | | 5.2 | | 5.2 | | 5.2 | | 5.2 | | 5.2 | |
| 2021 | 4.4 | | 4.7 | | 4.4 | | 4.4 | | 6.8 | | 4.7 | |
| 2022 | 4.4 | | 4.5 | | 4.8 | | 6.9 | | 11.4 | | 5.4 | |
| 2023 | 4.2 | | 4.4 | | 5.0 | | 6.9 | | 8.7 | | 5.2 | |
| 2024 | 3.9 | | 4.3 | | 5.1 | | 6.4 | | 8.0 | | 5.0 | |
| 2025 | 3.7 | | 4.3 | | 5.4 | | 6.1 | | 7.4 | | 5.0 | |
(1)GDP is the calendar year annual growth rate, HPI is Q4 annual growth rate and all other data points are at 31 December in the year indicated.
| | | | | | | | | | | | | | |
| Annual Report 2022 | Santander UK Group Holdings plc 105 |
| | | | | | | | | | | | | | | | | | | | | | | | | | | | | | | | | | | | | | | | | |
| Strategic Report | Sustainability and Responsible Banking | Governance | Risk review | Financial review | Financial
statements | Shareholder
information |
| | | | | | | | | | | | | |
| | | | | | | | | | | | | |
Our macroeconomic assumptions and their evolution throughout the forecast period
Our macroeconomic assumptions and their evolution throughout the forecast period for 31 December 2022 and 31 December 2021 were:
| | | | | | | | | | | | | | | | | | | | |
| | Upside 1 | Base case | Downside 1 | Downside 2 | Stubborn Inflation |
| 2022 | | % | % | % | % | % |
| House price growth | 5-year average increase/decrease | (0.73) | | (0.62) | | (3.79) | | (4.82) | | (4.69) | |
Peak/(trough) at (1) | (12.79) | | (11.19) | | (19.00) | | (30.69) | | (23.12) | |
| GDP | 5-year average increase/decrease | 1.17 | | 0.75 | | (0.17) | | (0.63) | | (0.45) | |
Cumulative growth/(fall) to peak/(trough) (2) | 5.98 | | 3.80 | | (0.84) | | (3.12) | | (2.23) | |
| Unemployment rate | 5-year end period | 4.17 | | 4.28 | | 6.09 | | 6.23 | | 6.40 | |
Peak/(trough) at (1) | 4.72 | | 5.10 | | 6.12 | | 8.50 | | 6.64 | |
| Bank of England bank rate | 5-year end period | 2.25 | | 2.50 | | 2.25 | | 2.50 | | 3.00 | |
Peak/(trough) at (1) | 3.75 | | 4.00 | | 3.50 | | 4.00 | | 6.00 | |
| | | | | | | | | | | | | | | | | | | | |
| | Upside 1 | Base case | Downside 1 | Downside 2 | Downside 3 |
| 2021 | | % | % | % | % | % |
| House price growth | 5-year average increase/decrease | 1.30 | | 2.00 | | (1.78) | | (3.27) | | (6.00) | |
Peak/(trough) at (1) | (3.07) | | 0.00 | | (9.87) | | (24.03) | | (32.12) | |
| GDP | 5-year average increase/decrease | 2.33 | | 1.89 | | 0.93 | | 0.49 | | (0.58) | |
Cumulative growth/(fall) to peak/(trough) (2) | 12.19 | | 9.83 | | 4.75 | | 2.48 | | (2.85) | |
| Unemployment rate | 5-year end period | 3.60 | | 4.30 | | 5.65 | | 5.95 | | 6.80 | |
Peak/(trough) at (1) | 4.45 | | 4.70 | | 5.65 | | 7.27 | | 11.90 | |
| Bank of England bank rate | 5-year end period | 2.00 | | 0.75 | | 1.00 | | 2.25 | | 0.25 | |
Peak/(trough) at (1) | 2.00 | | 0.75 | | 1.00 | | 3.00 | | (0.50) | |
(1)For GDP and house price growth it is the peak to trough change within the 5-year period; for the unemployment rate it is the peak; and for Bank Rate it is the peak or trough.
(2)This is the cumulative growth for the 5-year period.
The historical and forecast growth rates for the GDP assumptions we use for scenario modelling
The historical and forecast growth rates for the GDP assumptions we used for scenario modelling at 31 December 2022 and 31 December 2021 were:
31 December 2022
31 December 2021
| | | | | | | | | | | | | | |
| Annual Report 2022 | Santander UK Group Holdings plc 106 |
| | | | | | | | | | | | | | | | | | | | | | | | | | | | | | | | | | | | | | | | | |
| Strategic Report | Sustainability and Responsible Banking | Governance | Risk review | Financial review | Financial
statements | Shareholder
information |
| | | | | | | | | | | | | |
| | | | | | | | | | | | | |
Scenario weights
Each quarter, we undertake a full review of the probability weights we apply to the scenarios. We consider the probability of the economic scenarios occurring, while ensuring that the scenarios capture the non-linear distribution of losses across a reasonable range. To support our initial assessment of how likely a scenario is to occur, we typically undertake a Monte Carlo analysis which would ascertain the likelihood of a five-year average GDP forecast growth rate occurring based on the long run historically observed average. Creating a standard distribution bell curve around this long run average allows us to estimate the probability of a given GDP scenario occurring and therefore assign a probability weight to that scenario. However, a key challenge with this approach in a stressed environment like the one seen in 2020 is that extreme GDP forecasts can occur.
We continue to use the entire historical GDP data set available for the Monte Carlo analysis to smooth out the large GDP data swings that the pandemic gave. For 2022, the base case sits around the 20th percentile as growth is lower now that a further recession is predicted. Under the longer period, the Downside 2 scenario, which has the lowest CAGR, now sits below the 10th percentile suggesting that a lower weight than the base case remains appropriate.
We also need to consider the UK economic and political environment when applying weights. Given the current cost of living crisis, we remain of the view that the risks to UK growth are still biased to the downside and include: a substantial increase in inflation staying above target for longer, which raises the cost of living reducing consumer demand; continuing weak investment reflecting the turbulent political global environment; further development of Covid strains that are immune to vaccines leading to further restrictions; a larger negative impact from the EU trade deal given ongoing issues such as in NI; a continuing and significant mismatch between vacancies and skills along with a smaller labour force; and the increasing possibility of a second Scottish referendum which may bring disruption to any recovery in the latter years of the forecast. As such, it remains appropriate to reflect this with a 45% cumulative weighting for the downside scenarios. In contrast to last year, Downside 3 (i.e. the stubborn inflation scenario) has a heavier weight compared to downside 1 and 2 as this scenario is more representative of the current climate of potential stagflation.
The scenario weights we applied for 2022 and 2021 were:
| | | | | | | | | | | | | | | | | | | | |
| Upside 1 | Base case | Downside 1 | Downside 2 | Stubborn Inflation | Weighted |
| Scenario weights | % | % | % | % | % | % |
| 2022 | 5 | | 50 | | 15 | | 10 | | 20 | | 100 | |
| | | | | | |
| Upside 1 | Base case | Downside 1 | Downside 2 | Downside 3 | Weighted |
| Scenario weights | % | % | % | % | % | % |
| 2021 | 5 | | 45 | | 25 | | 20 | | 5 | | 100 | |
Definition of default (Credit impaired) (audited)
We define a financial instrument as in default (i.e. credit impaired) for purposes of calculating ECL if it is more than three months past due, or if we have data that suggests the customer is unlikely to pay. The data we have on customers varies across our business segments. It typically includes where:
| | |
| Retail Banking and Consumer Finance |
–They have been reported bankrupt or insolvent and are in arrears |
–Their loan term has ended, but they still owe us money more than three months later |
–They have had forbearance while in default and have failed to perform under the new arrangement terms, or have had multiple forbearance. Performing forborne accounts while not in default are reported in Stage 2 |
–We have suspended their fees and interest because they are in financial difficulties |
–We have repossessed the property. |
| Corporate & Commercial Banking and Corporate Centre |
–They have had a winding up notice issued, or something happens that is likely to trigger insolvency – such as another lender calls in a loan |
–Something happens that makes them less likely to be able to pay us – such as they lose an important client or contract |
–They have regularly missed or delayed payments, even though they have not gone over the three-month limit for default |
–Their loan is unlikely to be refinanced or repaid in full on maturity |
–Their loan has an excessive LTV that is unlikely to be resolved, such as by a change in planning policy, pay-downs, or increase in market value |
–Loans restructured under financial difficulties, classified as forborne transactions, in last 12 months. |
Where we use the advanced internal ratings-based basis for a portfolio in our capital calculations, there are differences with the default definitions for ECL purposes. The main differences are as follows:
–Performing forborne accounts while not in default are in Stage 2 until they cure their forbearance status (measured as 12 consecutive months of successful payments).
–Performing non-forborne accounts, which under our internal rating-based basis are subject to a 3-month cure period, for accounting purposes we classify them in Stage 2 until they cure all SICR triggers.
The CRPF reviews and approves the definition of default each year, or more often if we change it.
Following the implementation of a new regulatory definition of default in early 2022, we updated and aligned our definitions. This increased the Stage 3 ratio by 7bps (£0.2bn). This was due to including non-performing forbearance accounts which were previously reported in Stage 2 and are now reported in Stage 3 in line with unlikeliness to pay definitions, subject to a 12-month probation period in line with our regulatory default definition. The change in definition was a change in estimate and therefore prior periods have not been amended.
| | | | | | | | | | | | | | |
| Annual Report 2022 | Santander UK Group Holdings plc 107 |
| | | | | | | | | | | | | | | | | | | | | | | | | | | | | | | | | | | | | | | | | |
| Strategic Report | Sustainability and Responsible Banking | Governance | Risk review | Financial review | Financial
statements | Shareholder
information |
| | | | | | | | | | | | | |
| | | | | | | | | | | | | |
Significant Increase in Credit risk (SICR) (audited)
Loans which have suffered a SICR since origination are subject to a lifetime ECL assessment which extends to a maximum of the contractual term of the loan, or the behavioural term for a revolving facility. Loans which have not experienced a SICR are subject to 12-month ECL. We assess the credit risk profile of each facility to determine which of three stages to allocate them to:
–Stage 1: when there has been no SICR since initial recognition. We apply a loss allowance equal to a 12-month ECL i.e. the proportion of lifetime expected losses that relate to that default event expected in the next 12 months
–Stage 2: when there has been a SICR since initial recognition, but the exposure is not considered credit impaired. We apply a loss allowance equal to the lifetime ECL i.e. the expected loss resulting from all possible defaults throughout the residual life of a facility
–Stage 3: when the exposure is considered credit impaired. We apply a loss allowance equal to the lifetime ECL. Objective evidence of credit impairment is required. For more, see the section ‘Definition of default (Credit impaired)’ above.
We use quantitative, qualitative and backstop criteria to identify exposures that suffer a SICR. The Credit Risk Provisions Forum (CRPF) reviews and approves our SICR thresholds periodically. The Board Audit Committee reviews and challenges their appropriateness each year, or more often if we change them.
Quantitative criteria
We use quantitative criteria to identify where an exposure has increased in credit risk. We base our criteria on whether any increase in the lifetime PD since origination exceeds a threshold in relative and absolute terms. We base the value anticipated at origination on similar assumptions and data to the ones we use at the reporting date, adjusted to reflect the account surviving to that date. The comparison uses either an annualised lifetime PD, where the lifetime PD is divided by the forecast period, or the absolute change in lifetime PD since origination. Our criteria are absolute (rather than relative) increases in lifetime PD since origination. We also apply a relative threshold of 100% (doubling the PD) across all portfolios. The criteria for 2022 were:
| | | | | | | | | | | | | | | | | | | | |
| For 2022 and 2021 |
| Retail Banking | Consumer Finance(2) | Corporate & Commercial Banking | Corporate Centre |
| Homes | Everyday Banking (1) |
| Personal loans | Credit cards | Overdrafts |
| 30bps | 30bps | 340bps | 260bps | 300bps | 30bps | Internal rating method |
(1)For larger business banking customers we apply the same criteria that we use for Corporate & Commercial Banking.
(2)Consumer Finance use the comparison of lifetime PDs to determine Stage allocation, unlike other products which first turn the lifetime PD into an average yearly PD (annualised) and then do the comparison.
Qualitative criteria
We also use qualitative criteria to identify where an exposure has increased in credit risk, independent of changes in PD. The criteria for 2022 and 2021 were:
| | | | | | | | | | | | | | | | | | | | |
| Retail Banking | Consumer Finance | Corporate & Commercial Banking | Corporate Centre |
| Homes | Everyday Banking(1) |
| Personal loans | Credit cards | Overdrafts |
– In forbearance
– Default in last 24m
– 30 Days past due (DPD) in last 12m
– Bankrupt
– £100+ arrears | – In Collections
– Default in last 12m
– £50+ arrears | – In forbearance
– Default in last 12m
– In Collections
– £100+ arrears
– Behaviour score indicators | – Fees suspended
– Default in last 12m
– Debit dormant >35 days
– Any excess in month | – In forbearance – Deceased or Insolvent – Court ‘Return of goods’ order or Police watchlist – Agreement terminated – Payment holiday – Cash Collection | – In forbearance
– Default in last 12m
– Watchlist: proactive management
– Default at proxy origination |
– Watchlist: proactive management |
|
|
|
|
(1)For larger business banking customers we apply the same criteria that we use for Corporate & Commercial Banking.
An additional qualitative assessment was introduced as part of new Judgemental Adjustment introduced during 2022 in response to the cost of living crisis. Exposures that were deemed more significantly impacted by cost-of-living pressures based on indebtedness and disposable income thresholds were migrated to Stage 2. See 'Judgemental Adjustments (JAs) below for more on this.
Backstop criteria
As a backstop, we classify all exposures more than 30 or 90 DPD in at least Stage 2 or in Stage 3, respectively. This means that we do not rebut the backstop presumptions in IFRS 9 (i.e. credit risk has significantly increased if contractual payments are more than 30 DPD) relating to either a SICR or default.
Improvement in credit risk or cure
We transfer Stage 3 exposures to Stage 2 or Stage 1 when we no longer consider them to be credit impaired. We transfer Stage 2 exposures to Stage 1 when we no longer consider them to have suffered a SICR. Where we identified a SICR using quantitative criteria, we transfer the exposures to Stage 1 when they no longer meet the original PD-based transfer criteria. Where we identified a SICR using qualitative criteria, the issues that led to the transfer must be cured before we transfer the exposure to Stage 1. For a loan to exit forbearance, it must meet the conditions set out in the section ‘Forbearance’.
| | | | | | | | | | | | | | |
| Annual Report 2022 | Santander UK Group Holdings plc 108 |
| | | | | | | | | | | | | | | | | | | | | | | | | | | | | | | | | | | | | | | | | |
| Strategic Report | Sustainability and Responsible Banking | Governance | Risk review | Financial review | Financial
statements | Shareholder
information |
| | | | | | | | | | | | | |
| | | | | | | | | | | | | |
Judgemental Adjustments (JAs) formerly known as Post Model Adjustments (PMAs) (audited)
We use a range of methods to identify whether we need a JA. These include regular review of model monitoring tools, changes in the period, trend analysis, comparison against forecasts, and input from expert teams who manage key portfolio risks. We only recognise a JA if its expected impact is over £1m and keep it in place until we no longer need it. This is usually when we build it into our core credit model or the conditions that impacted the historical data no longer exist.
Our Risk Provisions & Forecasting team calculates JAs to ensure they are incremental to the core credit model and to ensure the calculation is performed in a consistent and controlled manner. We apply standard end-user computing controls to JAs expected to be in place for more than six months. Our Independent Validations Team may also review significant JAs. The CRPF approves all new JAs and, each quarter, reviews and approves existing JAs.
–Long-term indeterminate arrears: To mitigate the risk of model underestimation, we fully provide for accounts in arrears which have neither repaid (cured) or been written-off after a period of 2 years for unsecured portfolios or 5 years for secured portfolios. For our secured portfolios, we use expected security valuations at the point of repossession to estimate the adjustment. At 31 December 2022 and 31 December 2021, we only needed to make an adjustment for mortgages. When calculating the ECL uplift for this JA, management assumes a 2 year delay in the time to repossessions which reflects experience and ensure the LTVs are impacted by our Multiple scenario forecasts for HPI. Over the medium term, as we continue to address long term arrears in the portfolio, we expect the need for this JA will diminish. This JA increased our ECL by £13m. Had management assumed no delay in repossessions or a 3 year delay, the JA could have been within a range of £12m to £14m.
–12+ months in arrears: To mitigate the risk of underestimating ECL, mortgage accounts which are more than 12 months past due are fully provided for after deducting a historically observed self-cure rate. When calculating the ECL uplift for this JA, management assumes a 2 year delay in the time to repossessions which reflects experience and ensure the LTVs are impacted by our Multiple scenario forecasts for HPI. Over the medium term, as we continue to address long term arrears in the portfolio, we expect the need for this JA will diminish. This JA increased our ECL by £22m. Had management assumed no delay in repossessions or a 3 year delay, the JA could have been within a range of £7m to £28m.
–Cladding risk: Following the Government's intervention to support the owners of flats where cladding rectification may be required, we released this JA.
–Mortgages affordability: This JA addresses the risk that the current PD model for mortgages is likely to underestimate a 'cost of living crisis' whereby real disposable income is stretched with increasing living costs and debt burden as interest rates begin to rise. The JA identifies a population of customers most likely to be under inflationary pressures, increases their PDs and moves them to Stage 2. At 31 December 2022, these accounts made up a significant amount of the total mortgage Stage 2 population as £5.0bn mortgages were moved from Stage 1 into Stage 2 as a result. The JA increased our ECL by £9m in 2022 with a closing ECL of £27m .
–Affordability of unsecured lending repayments: We introduced new JAs to account for the potential repayment affordability risk among those customers with low disposable income. These JAs increased our ECL by £35m. Had management applied different sensitivities to the PD uplifts across Mortgages and Retail unsecured affordability, the ECL impact could have been between £49m and £82m.
–UPL loss floor: This JA addresses the perceived macroeconomic insensitivity within the UPL IFRS 9 models, where historical analysis of losses shows a much larger correlation to the International Labour Organisation (ILO) unemployment forecast than the model gives. The JA then uplifts the lifetime losses expected in each of the five macroeconomic scenarios within the IFRS 9 model to meet the expected losses the historical analysis predicts. The JA increased our ECL by £15m . If management had only increased PDs, the JA could have been £12m.
–Model underestimation: This JA addresses potential underestimation risk of projected modelled ECL identified by our model monitoring and back-testing from lower PDs given the low level of macroeconomic stress and timing effects of government support schemes on emergence of defaults. At 31 December 2022, this JA increased our ECL by £57m. Had management applied the same PD uplift on the upside 1 scenario the JA could have been £49m. Had management applied the same PD uplift on the Downside 3 scenario as the Base case, Upside 1 and Downside 1 scenarios, the JA could have been £60m.
–Corporate lending to segments affected by supply chain: We introduced new JAs to reflect the corporate lending risks to those sectors which are susceptible to high inflation and energy prices, higher input costs, potential for lower consumer and business demand, as well as exposure to supply chain challenges. This JA calculates ECL depending on the customer’s risk profile in stage 1 and moves risk between stage 1 and 2 (resulting in increase in lifetime vs 12m ECL). In case of those clients already in stage 2 the JA is calculated by stressing PD levels according to the risk profile of the customer. In total this JA increased our ECL by £61m. The range for this JA can be between £26m to £187m depending on PD assumptions of high and severe sectors.
–Corporate lending to segments affected by Covid-19: In 2022, following a successful 18 month probation period, with no material observed defaults, we released all corporate sector staging JAs related to Covid-19 as the risks from lockdowns have reduced.
–Corporate single large exposure: In 2020, to mitigate against the risk of a single large corporate exposure with an ECL requirement of greater than £10m defaulting, which has not been covered by the existing model estimate or the corporate and SME JA above, we applied a JA for the risk of a company which unexpectedly defaults. This JA has been calculated based on incurring two average historically observed single name large losses in our Corporate & Commercial business segment. We will continue to assess this risk over the medium term based on actual experience and we will refine the estimate based on changes in our portfolio credit quality and loan size mix. At 31 December 2021, this JA increased our ECL by £23m . Had management assumed only one average loss was incurred the JA would decrease to £12m. The JA would increase to £35m assuming three average losses were incurred. It has been assessed and decision made to keep this JA as it is felt there is still a need for this given we are the start of a conventional recessionary environment. It is believed that the unprecedented support provided by the government over the last 2 to 3 years have differed stresses and accounted for the lack of any actual examples where we would have looked to utilise this JA.
–SME debt burden: We introduced a SME debt burden JA in 2021 to take account of the potential debt burden risk of unsecured lending to our SME customers who also took a BBL. This does not incorporate the credit risk on BBLs, as these are government guaranteed but instead considers the possible impact on repayment of other lending with us. At 31 December 2022, this JA increased our ECL by £7m . Had management used the modelled lifetime losses for all dragged accounts, the JA could have been £3m. Had management used a 50% coverage on all accounts, the JA could have been £15m.
–Other: This includes adjustments for other exposures in smaller portfolios that are not within models such as Buy To Let Mortgages. The year on year movement is driven by the absence of a £32m underlay JA which corrected an overstatement of the core modelled ECL as a result of customers who took a payment holiday artificially inflating stage 2. This was released in 2022 as the data distortion no longer impacted the modelled ECL.
| | | | | | | | | | | | | | |
| Annual Report 2022 | Santander UK Group Holdings plc 109 |
| | | | | | | | | | | | | | | | | | | | | | | | | | | | | | | | | | | | | | | | | |
| Strategic Report | Sustainability and Responsible Banking | Governance | Risk review | Financial review | Financial
statements | Shareholder
information |
| | | | | | | | | | | | | |
| | | | | | | | | | | | | |
Climate change
In addition 2022 and 2021,we assessed the risks to asset valuations in the customer loan book from both transitional and physical risks associated with climate change. At 31 December 2022 and 2021, we did not consider it appropriate to recognise a climate change risk related JA for the following reasons:
–The behavioural life of the loan book is less than five years. Any material transitional risks are generally regarded to be relevant over a longer timeframe than five years and as such, the risk predominantly relates to assets yet to be written;
–There have been no observed default events or SICRs due to climate change for any part of the loan book;
–The absolute exposure to fossil fuel industries is not deemed to be material. On an individually assessed basis, clients in these industries are highly rated and their markets remain highly liquid;
–The residual value of automotive vehicles might be impacted by diesel obsolescence and the transition to electric vehicles.The residual value risk is already set at the more cautious end of the acceptable range to capture the inherent risk of diesel obsolescence and measurement uncertainty of electric vehicles;
–ECL calculations are based on multiple forward-looking economic scenarios developed by management covering a period of 5 years, during which timeframe climate change risks may crystallise;
–The proportion of mortgage loans subject to flood and subsidence risk is not deemed to be material. The terms of our mortgage lending also require homeowners to buy suitable insurance which transfers the majority of the risk to asset valuations to third party insurers.
| | | | | | | | | | | | | | | | | | | | | | | |
| Homes | Everyday Banking | Consumer Finance | CCB | Corporate Centre | Total |
| Mortgages | Credit Cards | Other |
| 2022 | £m | £m | £m | £m | £m | £m | £m |
| Modelled ECL | 134 | | 112 | | 93 | | 65 | | 194 | | — | | 598 | |
| Individually assessed | — | | — | | — | | — | | 112 | | — | | 112 | |
| ECL before JAs | 134 | | 112 | | 93 | | 65 | | 306 | | — | | 710 | |
| JAs | | | | | | | |
| Long-term indeterminate arrears | 13 | | — | | — | | — | | — | | — | | 13 | |
| 12+ months in arrears | 22 | | — | | — | | — | | — | | — | | 22 | |
| | | | | | | |
| UPL loss floor | — | | — | | 15 | | — | | — | | — | | 15 | |
| Model underestimation | 36 | | 2 | | 19 | | — | | — | | — | | 57 | |
| Corporate single large exposure | — | | — | | — | | — | | 23 | | — | | 23 | |
| Other | 21 | | 1 | | 10 | | 2 | | 3 | | — | | 37 | |
| Total JAs | 92 | | 3 | | 44 | | 2 | | 26 | | — | | 167 | |
| | | | | | | |
| | | | | | | |
| | | | | | | |
| | | | | | | |
| | | | | | | |
| Affordability and Cost of Living JAs | | | | | | | |
| Corporate lending to segments affected by supply chain | — | | — | | — | | — | | 61 | | — | | 61 | |
| Mortgages affordability | 27 | | — | | — | | — | | — | | — | | 27 | |
| Retail Unsecured Affordability | — | | 15 | | 20 | | — | | — | | — | | 35 | |
| SME debt burden | — | | — | | 7 | | — | | — | | — | | 7 | |
| Total Affordability and Cost of Living JAs | 27 | | 15 | | 27 | | — | | 61 | | — | | 130 | |
| | | | | | | |
| Total ECL | 253 | | 130 | | 164 | | 67 | | 393 | | — | | 1,007 | |
| | | | | | | | | | | | | | |
| Annual Report 2022 | Santander UK Group Holdings plc 110 |
| | | | | | | | | | | | | | | | | | | | | | | | | | | | | | | | | | | | | | | | | |
| Strategic Report | Sustainability and Responsible Banking | Governance | Risk review | Financial review | Financial
statements | Shareholder
information |
| | | | | | | | | | | | | |
| | | | | | | | | | | | | |
| | | | | | | | | | | | | | | | | | | | | | | |
| Homes | Everyday Banking | Consumer Finance | CCB | Corporate Centre | Total |
| Mortgages | Credit Cards | Other |
| 2021 | £m | £m | £m | £m | £m | £m | £m |
| Modelled ECL | 121 | | 88 | | 56 | | 52 | | 108 | | — | | 425 | |
| Individually assessed | — | | — | | — | | — | | 100 | | — | | 100 | |
| ECL before JAs | 121 | | 88 | | 56 | | 52 | | 208 | | — | | 525 | |
| JAs | | | | | | | |
| Long-term indeterminate arrears | 14 | | — | | — | | — | | — | | — | | 14 | |
| 12+ months in arrears | 29 | | — | | — | | — | | — | | — | | 29 | |
| Cladding risk | 15 | | — | | — | | — | | — | | — | | 15 | |
| UPL loss floor | — | | — | | 21 | | — | | — | | — | | 21 | |
| | | | | | | |
| | | | | | | |
| Other JA | (20) | | 1 | | 9 | | — | | 18 | | — | | 8 | |
| Total non Covid-19 JAs | 38 | | 1 | | 30 | | — | | 18 | | — | | 87 | |
| Covid-19 JAs | | | | | | | |
| Corporate lending to segments affected by Covid-19 | — | | — | | — | | — | | 176 | | — | | 176 | |
| Corporate single large exposure | — | | — | | — | | — | | 23 | | — | | 23 | |
| Model underestimation | 14 | | — | | 14 | | — | | — | | — | | 28 | |
| SME debt burden | — | | — | | 9 | | — | | — | | — | | 9 | |
| Total Covid-19 JAs | 14 | | — | | 23 | | — | | 199 | | — | | 236 | |
| Affordability and Cost of Living JAs | | | | | | | |
| | | | | | | |
| Mortgages affordability | 18 | | — | | — | | — | | — | | — | | 18 | |
| | | | | | | |
| | | | | | | |
| Total Affordability and Cost of Living JAs | 18 | | — | | — | | — | | — | | — | | 18 | |
| | | | | | | |
| Total ECL | 191 | | 89 | | 109 | | 52 | | 425 | | — | | 866 | |
2022 compared to 2021
JAs reduced from £341m to £297m and the proportion of JAs to total ECL decreased from 39% to 29%. The change in proportion was mainly due to an increase in total ECL driven by the deterioration in the economic environment compared to 2021.
Internal credit risk rating for corporate borrowers (audited)
We assign each corporate borrower an internal credit rating based on our internal rating scale. To do this, we look at the customer’s financial history and trends in the economy backed up by the expert judgement of a risk analyst. We review our internal ratings on a dynamic basis and at least once a year. The internal risk rating is used to determine the Probability of Default for a client.
Individually assessed corporate Stage 3 exposures (audited)
We assess the ECL requirement for large single name corporate exposures on an individual basis when they meet our definition of default and are transferred into Stage 3. This assessment takes into consideration the latest specific information about the counterparty to determine a probability weighted ECL based on a best, worst and mid case outcome. For those loans that were in default (i.e. Stage 3), the ECL was £129m at 31 December 2022 (2021: £100m). Had management assumed the best or worst outcome in terms of loss estimates, the ECL could have been within a range of £68m to £203m.
| | | | | | | | | | | | | | |
| Annual Report 2022 | Santander UK Group Holdings plc 111 |
| | | | | | | | | | | | | | | | | | | | | | | | | | | | | | | | | | | | | | | | | |
| Strategic Report | Sustainability and Responsible Banking | Governance | Risk review | Financial review | Financial
statements | Shareholder
information |
| | | | | | | | | | | | | |
| | | | | | | | | | | | | |
Sensitivity of ECL allowance(audited)
The ECL allowance is sensitive to the methods, assumptions and estimates underlying its calculation. For example, management could have applied different probability weights to the economic scenarios. In addition, the ECL for residential mortgages is significantly affected by the HPI assumptions which determine the valuation of collateral used in the calculations.
Had management used different assumptions on probability weights and HPI, a larger or smaller ECL charge would have resulted that could have had a material impact on the ECL allowance and profit before tax. We have incorporated judgemental adjustments (JA's) into the sensitivity analysis, and these assumptions are set out below.
Scenario sensitivity
The tables below show the ECL allowances that would have arisen had management applied a 100% weight to each economic scenario. The allowances were calculated using a stage allocation appropriate to each scenario and differs from the probability-weighted stage allocation used to determine the ECL allowance shown above. For exposures subject to individual assessment, the distribution of ECL which could reasonably be expected has also been considered, assuming no change in the number of cases subject to individual assessment, and within the context of a potential best to worst case outcome.
| | | | | | | | | | | | | | | | | | | | |
| Upside 1 | Base case | Downside 1 | Downside 2 | Stubborn Inflation | Weighted |
| 2022 | £m | £m | £m | £m | £m | £m |
| Exposure | 312,830 | | 312,830 | | 312,830 | | 312,830 | | 312,830 | | 312,830 | |
| Retail Banking | 216,383 | | 216,383 | | 216,383 | | 216,383 | | 216,383 | | 216,383 | |
– Homes - Mortgages | 195,170 | | 195,170 | | 195,170 | | 195,170 | | 195,170 | | 195,170 | |
– EDB - Credit Cards | 12,845 | | 12,845 | | 12,845 | | 12,845 | | 12,845 | | 12,845 | |
– EDB - Other | 8,368 | | 8,368 | | 8,368 | | 8,368 | | 8,368 | | 8,368 | |
| Consumer Finance | 5,739 | | 5,739 | | 5,739 | | 5,739 | | 5,739 | | 5,739 | |
| CCB | 28,299 | | 28,299 | | 28,299 | | 28,299 | | 28,299 | | 28,299 | |
| Corporate Centre | 62,409 | | 62,409 | | 62,409 | | 62,409 | | 62,409 | | 62,409 | |
| | | | | | |
| ECL | 931 | | 933 | | 994 | | 1,384 | | 1,150 | | 1,007 | |
| Retail Banking | 490 | | 498 | | 530 | | 831 | | 648 | | 546 | |
– Homes - Mortgages | 215 | | 219 | | 245 | | 502 | | 325 | | 253 | |
– EDB - Credit Cards | 122 | | 123 | | 127 | | 142 | | 140 | | 130 | |
– EDB - Other | 153 | | 156 | | 158 | | 187 | | 183 | | 163 | |
| Consumer Finance | 65 | | 66 | | 65 | | 69 | | 68 | | 67 | |
| CCB | 376 | | 369 | | 399 | | 484 | | 434 | | 394 | |
| Corporate Centre | — | | — | | — | | — | | — | | — | |
| % | % | % | % | % | % |
| Proportion of assets in Stage 2 | 4.0 | | 4.0 | | 5.0 | | 11.0 | | 7.0 | | 7.0 | |
| Retail Banking | 4.0 | | 4.0 | | 4.0 | | 10.0 | | 6.0 | | 7.0 | |
– Homes - Mortgages | 4.0 | | 4.0 | | 4.0 | | 11.0 | | 6.0 | | 7.0 | |
– EDB - Credit Cards | 2.0 | | 2.0 | | 2.0 | | 3.0 | | 3.0 | | 3.0 | |
– EDB - Other | 7.0 | | 7.0 | | 7.0 | | 9.0 | | 8.0 | | 8.0 | |
| Consumer Finance | 6.0 | | 6.0 | | 6.0 | | 6.0 | | 6.0 | | 6.0 | |
| CCB | 8.0 | | 9.0 | | 9.0 | | 18.0 | | 14.0 | | 12.0 | |
| Corporate Centre | — | | — | | — | | — | | — | | — | |
| % | % | % | % | % | % |
| Proportion of assets in Stage 3 | 1.0 | | 1.0 | | 1.0 | | 1.0 | | 1.0 | | 1.0 | |
| Retail Banking | 1.0 | | 1.0 | | 1.0 | | 1.0 | | 1.0 | | 1.0 | |
– Homes - Mortgages | 1.0 | | 1.0 | | 1.0 | | 1.0 | | 1.0 | | 1.0 | |
– EDB - Credit Cards | — | | — | | — | | — | | — | | — | |
– EDB - Other | 2.0 | | 2.0 | | 2.0 | | 2.0 | | 2.0 | | 2.0 | |
| Consumer Finance | 1.0 | | 1.0 | | 1.0 | | 1.0 | | 1.0 | | 1.0 | |
| CCB | 2.0 | | 2.0 | | 2.0 | | 2.0 | | 2.0 | | 2.0 | |
| Corporate Centre | — | | — | | — | | — | | — | | — | |
| | | | | | | | | | | | | | |
| Annual Report 2022 | Santander UK Group Holdings plc 112 |
| | | | | | | | | | | | | | | | | | | | | | | | | | | | | | | | | | | | | | | | | |
| Strategic Report | Sustainability and Responsible Banking | Governance | Risk review | Financial review | Financial
statements | Shareholder
information |
| | | | | | | | | | | | | |
| | | | | | | | | | | | | |
| | | | | | | | | | | | | | | | | | | | |
| Upside 1 | Base case | Downside 1 | Downside 2 | Downside 3 | Weighted |
| 2021 | £m | £m | £m | £m | £m | £m |
| Exposure | 319,319 | | 319,319 | | 319,319 | | 319,319 | | 319,319 | | 319,319 | |
| Retail Banking | 214,979 | | 214,979 | | 214,979 | | 214,979 | | 214,979 | | 214,979 | |
– Homes - Mortgages | 193,247 | | 193,247 | | 193,247 | | 193,247 | | 193,247 | | 193,247 | |
– EDB - Credit Cards | 12,301 | | 12,301 | | 12,301 | | 12,301 | | 12,301 | | 12,301 | |
– EDB - Other | 9,431 | | 9,431 | | 9,431 | | 9,431 | | 9,431 | | 9,431 | |
| Consumer Finance | 5,298 | | 5,298 | | 5,298 | | 5,298 | | 5,298 | | 5,298 | |
| CCB | 27,345 | | 27,345 | | 27,345 | | 27,345 | | 27,345 | | 27,345 | |
| Corporate Centre | 71,697 | | 71,697 | | 71,697 | | 71,697 | | 71,697 | | 71,697 | |
| | | | | | |
| ECL | 740 | | 738 | | 849 | | 1,123 | | 1,288 | | 866 | |
| Retail Banking | 307 | | 286 | | 375 | | 510 | | 662 | | 389 | |
– Homes - Mortgages | 134 | | 125 | | 177 | | 283 | | 437 | | 191 | |
– EDB - Credit Cards | 78 | | 72 | | 89 | | 102 | | 101 | | 89 | |
– EDB - Other | 95 | | 89 | | 109 | | 125 | | 124 | | 109 | |
| Consumer Finance | 50 | | 51 | | 51 | | 53 | | 54 | | 52 | |
| CCB | 383 | | 401 | | 423 | | 560 | | 572 | | 425 | |
| Corporate Centre | — | | — | | — | | — | | — | | — | |
| % | % | % | % | % | % |
| Proportion of assets in Stage 2 | 5.0 | | 5.0 | | 5.0 | | 6.0 | | 7.0 | | 5.0 | |
| Retail Banking | 5.0 | | 5.0 | | 5.0 | | 7.0 | | 8.0 | | 5.0 | |
– Homes - Mortgages | 6.0 | | 6.0 | | 6.0 | | 7.0 | | 8.0 | | 6.0 | |
– EDB - Credit Cards | 2.0 | | 1.0 | | 2.0 | | 2.0 | | 2.0 | | 2.0 | |
– EDB - Other | 3.0 | | 3.0 | | 4.0 | | 5.0 | | 4.0 | | 4.0 | |
| Consumer Finance | 4.0 | | 4.0 | | 4.0 | | 4.0 | | 4.0 | | 4.0 | |
| CCB | 17.0 | | 16.0 | | 17.0 | | 21.0 | | 21.0 | | 18.0 | |
| Corporate Centre | — | | — | | — | | — | | — | | — | |
| % | % | % | % | % | % |
| Proportion of assets in Stage 3 | 1.0 | | 1.0 | | 1.0 | | 1.0 | | 1.0 | | 1.0 | |
| Retail Banking | 1.0 | | 1.0 | | 1.0 | | 1.0 | | 1.0 | | 1.0 | |
– Homes - Mortgages | 1.0 | | 1.0 | | 1.0 | | 1.0 | | 1.0 | | 1.0 | |
– EDB - Credit Cards | — | | — | | — | | — | | — | | — | |
– EDB - Other | 3.0 | | 3.0 | | 3.0 | | 3.0 | | 3.0 | | 3.0 | |
| Consumer Finance | — | | — | | — | | — | | — | | — | |
| CCB | 4.0 | | 4.0 | | 4.0 | | 4.0 | | 4.0 | | 4.0 | |
| Corporate Centre | — | | — | | — | | — | | — | | — | |
2022 compared to 2021
In 2022 ECL increased as a result of PD deterioration and an introduction of affordability JAs mainly due to changes in the current economic environment. As a risk from further lockdowns relating to Covid19 reduced, we released all Corporate Covid19 related JAs. This release resulted in the movement of £0.4bn corporate Stage 3 loans to Stage 2 and £1.7bn of corporate loans transferred from Stage 2 to Stage 1. However, this was offset by an introduction of a new corporate lending JA relating to segments that are susceptible to high inflation and energy price, higher input costs, potential for lower consumer and business demand. This resulted in movement of £1.4bn from Stages 1 to 2. Mortgage affordability continued to be impacted by the increased base rate and inflationary pressures, resulting in an increase in Stage 2 mortgage asset by £0.8bn.
We have incorporated our JA's into the sensitivity analysis.
HPI sensitivity
Given the relative size of our residential mortgage portfolio, management considers that changes in HPI assumptions used to calculate the ECL allowance for residential mortgages would have the most significant impact on the ECL allowance. The table below shows the ECL impact on the profit before tax of applying an immediate and permanent hour price increase/decrease to our unweighted base case scenario, and assumes no changes to the stage allocation of exposures.
| | | | | | | | | | | | | | |
| Increase/decrease in house prices |
| +20% | +10% | -10% | -20% |
| Increase/(decrease) in profit before tax | £m | £m | £m | £m |
| 2022 | 48 | | 32 | | (61) | | (176) | |
| 2021 | 64 | | 40 | | (69) | | (197) | |
2022 compared to 2021
The HPI ECL sensitivity remains similar to 2021. The expected impact from a drop in the HPI index by 10% and 20% is £61m and £176m respectively. There has been moderate growth for 2022 coupled with a negative economic outlook that has resulted in potential losses increasing towards the end of the year.
Both the modelled ECL and the PMAs were stressed in the sensitivity analysis to assess the potential impact on ECL from housing market volatility. The impact is driven by marginal growth in the housing market with subdued demand for purchases driven by the increases interest rates.
| | | | | | | | | | | | | | |
| Annual Report 2022 | Santander UK Group Holdings plc 113 |
| | | | | | | | | | | | | | | | | | | | | | | | | | | | | | | | | | | | | | | | | |
| Strategic Report | Sustainability and Responsible Banking | Governance | Risk review | Financial review | Financial
statements | Shareholder
information |
| | | | | | | | | | | | | |
| | | | | | | | | | | | | |
Measuring ECL (audited)
For accounts not in default at the reporting date, we estimate a monthly ECL for each exposure and for each month over the forecast period. The lifetime ECL is the sum of the monthly ECLs over the forecast period, while the 12-month ECL is limited to the first 12 months. We calculate each monthly ECL as the discounted value for the relevant forecast month of the product of the following factors:
| | | | | |
| Factor | Description |
| Survival rate (SR) | The probability that the exposure has not closed or defaulted since the reporting date. |
| Probability of default (PD) | The likelihood of a borrower defaulting in the following month, assuming it has not closed or defaulted since the reporting date. For each month in the forecast period, we estimate the monthly PD from a range of factors. These include the current risk grade for the exposure, which becomes less relevant further into the forecast period, as well as the expected evolution of the account risk with maturity and factors for changing economics. We support this with historical data analysis. |
| Exposure at default (EAD) | The amount we expect to be owed if a default event occurs. We determine EAD for each month of the forecast period by the expected payment profile, which varies by product. For amortising products, we base it on the borrower’s contractual repayments over the forecast period. We adjust this for any expected overpayments on Stage 1 accounts that the borrower may make and for any arrears we expect if the account was to default. For revolving products, or amortising products with an off-balance sheet element, we determine EAD using the balance at default and the contractual exposure limit. We vary these assumptions by product and base them on analysis of recent default data. |
| Loss given default (LGD) | Our expected loss if a default event were to occur. We express it as a percentage and calculate it based on factors that we have observed to affect the likelihood and/or value of any subsequent write-offs, which vary according to whether the product is secured or unsecured. If the product is secured, we take into account collateral values as well as the historical discounts to market/book values due to forced sales type. |
We use the original effective interest rate as the discount rate. For accounts in default, we use the EAD as the reporting date balance. We also calculate an LGD to reflect the default status of the account, considering the current DPD and loan to value. PD and SR are not required for accounts in default.
Forecast period
We base the forecast period for amortising facilities on the remaining contract term. For revolving facilities, we base it on the behavioural, rather than contractual, characteristics of the facility type. In some cases, we shorten the period to simplify the calculation. If we do this, we apply a Judgemental Adjustment to reflect our view of the full lifetime ECL.
Forward-looking information
Our assessments of a SICR and the calculation of ECL incorporate forward-looking data. We perform historical analysis and identify the key economic variables that impact credit risk and ECL for each portfolio. These can include house price growth, GDP, unemployment rate and BoE Bank Rate. Where applicable, we incorporate these economic variables and their associated impacts into our models.
Economic forecasts have the most impact on ECL measurement for residential mortgages and, to a lesser extent, corporate loans. This is due to the long behavioural lives and large size of these portfolios. Economic forecasts have less impact on ECL for other portfolios due to their shorter lives and smaller size.
Grouping of instruments for losses measured on a collective basis
We measure ECL at the individual financial instrument level. However, where we have used internal capital or similar models as the basis for our ECL models, this typically results in a large number of relatively small homogenous groups. We typically group instruments where they share risk characteristics using statistical models and assess them for impairment collectively.
We use this approach for
–all our Retail Banking and Consumer Finance portfolios,
–SME customers in Corporate & Commercial Banking, and
–Legacy Portfolios in run-off and the Crown Dependencies mortgage portfolio in Corporate Centre.
We calculate separate collective provisions for instruments in Stages 1, 2 and 3 where the instrument is not individually assessed.
For all our portfolios (whether we assess them for impairment individually or collectively) we use five forward-looking economic scenarios.
Governance around ECL impairment allowances (audited)
Our Risk Methodology team developed our ECL models (except for the external models we use, such as OGEM which we described earlier in ‘Our forecasting approach’), and our Independent Validations team reviews all material models. As model owners, our Risk Provisioning & Forecasting team run the models to calculate our ECL each month. The models are sensitive to changes in credit conditions and reflect management judgements that give rise to measurement uncertainty in our ECL as set out above. The following committees and forums review the provision drivers and ensure that the ECL remains appropriate:
–Model Risk Control Forum (MRCF) reviews and approves new models and model changes. It also reviews the use of OGEM as a reliable model on which to base our other forecast macroeconomic variables. We use it across all stress testing and planning so it is subject to model risk criteria.
–ALCO reviews and approves the base case used in the economic scenarios we use to calculate forward-looking scenarios.
–CRPF reviews and approves the economic scenarios and probability weights we use to calculate forward-looking scenarios. It also reviews management judgements and approves ECL impairment allowances.
–Board Audit Committee reviews and challenges the appropriateness of the estimates and judgements made by management.
For more on the governance around specific elements of the ECL impairment allowances, including the frequency of, and thresholds for, reviews, including by these committees and forums, see the detailed sections above.
How we assess the performance of our ECL estimation process
We assess the reasonableness of our ECL provisions and the results of our Staging analysis using a range of methods. These include:
–Benchmarking: we compare our coverage levels with our peers.
–Stand-back testing: we monitor the level of our coverage against actual write-offs.
–Back-testing: we compare key drivers periodically as part of model monitoring practices.
–Monitoring trends: we track ECL and Staged assets over time and against our internal budgets and forecasts, with triggers set accordingly.
| | | | | | | | | | | | | | |
| Annual Report 2022 | Santander UK Group Holdings plc 114 |
| | | | | | | | | | | | | | | | | | | | | | | | | | | | | | | | | | | | | | | | | |
| Strategic Report | Sustainability and Responsible Banking | Governance | Risk review | Financial review | Financial
statements | Shareholder
information |
| | | | | | | | | | | | | |
| | | | | | | | | | | | | |
SANTANDER UK GROUP LEVEL – CREDIT RISK REVIEW
Our maximum and net exposure to credit risk (audited)
The tables below show the main differences between our maximum and net exposure to credit risk. They show the effects of collateral, netting, and risk transfer to mitigate our exposure. The tables only show the financial assets that credit risk affects and to which the impairment requirements in IFRS 9 are applied.
For balance sheet assets, the maximum exposure to credit risk is the carrying value after impairment loss allowances. Off-balance sheet exposures are mortgage offers, guarantees, formal standby facilities, credit lines and other commitments. For off-balance sheet guarantees, the maximum exposure is the maximum amount that we would have to pay if the guarantees were called on. For formal standby facilities, credit lines and other commitments that are irrevocable over the life of the facility, the maximum exposure is the total amount of the commitment.
| | | | | | | | | | | | | | | | | | | | | | | | | | | | | | | | | | | | | | | | | |
| Maximum exposure | | | | | |
| Balance sheet asset | | Off-balance sheet | | Collateral(1) | | |
| Gross
amounts | Loss allowance | Net
amounts | | Gross
amounts | Loss allowance | Net
amounts | | Cash | Non-cash | Netting(2) | Net
exposure |
| 2022 | £bn | £bn | £bn | | £bn | £bn | £bn | | £bn | £bn | £bn | £bn |
| Cash and balances at central banks | 46.6 | | — | | 46.6 | | | — | | — | | — | | | — | | — | | — | | 46.6 | |
| Financial assets at amortised cost: | | | | | | | | | | | | |
–Loans and advances to customers:(3) | | | | | | | | | | | | |
–Retail Mortgages(4) | 188.3 | | (0.3) | | 188.0 | | | 8.0 | | — | | 8.0 | | | — | | (191.4) | | — | | 4.6 | |
–Corporate loans | 19.1 | | (0.3) | | 18.8 | | | 9.3 | | — | | 9.3 | | | (0.1) | | (16.5) | | — | | 11.5 | |
–Finance leases | 4.6 | | (0.1) | | 4.5 | | | 0.4 | | — | | 0.4 | | | — | | (4.8) | | — | | 0.1 | |
–Accrued interest and other adjustments | 0.9 | | — | | 0.9 | | | — | | — | | — | | | — | | — | | — | | 0.9 | |
–Other unsecured loans | 7.7 | | (0.2) | | 7.5 | | | 13.7 | | (0.1) | | 13.6 | | | — | | — | | — | | 21.1 | |
–Amounts due from fellow Banco Santander group subsidiaries and joint ventures | 4.2 | | — | | 4.2 | | | — | | — | | — | | | — | | — | | — | | 4.2 | |
| Total loans and advances to customers | 224.8 | | (0.9) | | 223.9 | | | 31.4 | | (0.1) | | 31.3 | | | (0.1) | | (212.7) | | — | | 42.4 | |
–Loans and advances to banks | 1.1 | | — | | 1.1 | | | 0.4 | | — | | 0.4 | | | — | | — | | — | | 1.5 | |
–Reverse repurchase agreements – non trading | 7.3 | | — | | 7.3 | | | — | | — | | — | | | — | | (7.3) | | — | | — | |
–Other financial assets at amortised cost | 0.2 | | — | | 0.2 | | | — | | — | | — | | | — | | — | | — | | 0.2 | |
| Total financial assets at amortised cost | 233.4 | | (0.9) | | 232.5 | | | 31.8 | | (0.1) | | 31.7 | | | (0.1) | | (220.0) | | — | | 44.1 | |
| Financial assets at fair value at FVOCI: | | | | | | | | | | | | |
–Loans and advances to customers | — | | — | | — | | | — | | — | | — | | | — | | — | | — | | — | |
–Debt securities | 6.0 | | — | | 6.0 | | | — | | — | | — | | | — | | — | | — | | 6.0 | |
| Total financial assets at FVOCI | 6.0 | | — | | 6.0 | | | — | | — | | — | | | — | | — | | — | | 6.0 | |
| Total | 286.0 | | (0.9) | | 285.1 | | | 31.8 | | (0.1) | | 31.7 | | | (0.1) | | (220.0) | | — | | 96.7 | |
| | | | | | | | | | | | | | | | | | | | | | | | | | | | | | | | | | | | | | |
| 2021 | | | | | | | | | | | | |
| Cash and balances at central banks | 50.5 | | — | | 50.5 | | | — | | — | | — | | | — | | — | | — | | 50.5 | |
| Financial assets at amortised cost: | | | | | | | | | | | | |
–Loans and advances to customers:(3) | | | | | | | | | | | | |
–Retail Mortgages(4) | 178.0 | | (0.2) | | 177.8 | | | 16.0 | | — | | 16.0 | | | — | | (181.2) | | — | | 12.6 | |
–Corporate loans | 19.3 | | (0.4) | | 18.9 | | | 7.7 | | — | | 7.7 | | | (0.1) | | (16.8) | | — | | 9.7 | |
–Finance leases | 3.9 | | (0.1) | | 3.8 | | | 0.3 | | — | | 0.3 | | | — | | (4.7) | | — | | (0.6) | |
–Accrued interest and other adjustments | 0.7 | | — | | 0.7 | | | — | | — | | — | | | — | | — | | — | | 0.7 | |
–Other unsecured loans | 9.4 | | (0.2) | | 9.2 | | | 13.3 | | — | | 13.3 | | | — | | — | | — | | 22.5 | |
–Amounts due from fellow Banco Santander group subsidiaries and joint ventures | 3.1 | | — | | 3.1 | | | — | | — | | — | | | — | | — | | — | | 3.1 | |
| Total loans and advances to customers | 214.4 | | (0.9) | | 213.5 | | | 37.3 | | — | | 37.3 | | | (0.1) | | (202.7) | | — | | 48.0 | |
–Loans and advances to banks | 1.4 | | — | | 1.4 | | | 0.4 | | — | | 0.4 | | | — | | — | | — | | 1.8 | |
–Reverse repurchase agreements – non trading | 12.7 | | — | | 12.7 | | | — | | — | | — | | | — | | (12.2) | | (0.4) | | 0.1 | |
–Other financial assets at amortised cost | 0.5 | | — | | 0.5 | | | — | | — | | — | | | — | | — | | — | | 0.5 | |
| Total financial assets at amortised cost | 229.0 | | (0.9) | | 228.1 | | | 37.7 | | — | | 37.7 | | | (0.1) | | (214.9) | | (0.4) | | 50.4 | |
| Financial assets at FVOCI: | | | | | | | | | | | | |
–Loans and advances to customers | — | | — | | — | | | — | | — | | — | | | — | | — | | — | | — | |
–Debt securities | 5.9 | | — | | 5.9 | | | — | | — | | — | | | — | | — | | — | | 5.9 | |
| Total financial assets at FVOCI | 5.9 | | — | | 5.9 | | | — | | — | | — | | | — | | — | | — | | 5.9 | |
| Total | 285.4 | | (0.9) | | 284.5 | | | 37.7 | | — | | 37.7 | | | (0.1) | | (214.9) | | (0.4) | | 106.8 | |
(1)The forms of collateral we take to reduce credit risk include: residential and commercial property; other physical assets, including motor vehicles; liquid securities, including those transferred under reverse repurchase agreements; cash, including cash used as collateral for derivative transactions; and receivables. Charges on residential property are most of the collateral we take.
(2)We can reduce credit risk exposures by applying netting. We do this mainly for derivative and repurchase transactions with financial institutions. For derivatives and securities finance transactions, we use standard master netting agreements. For more on this, see ‘Credit risk mitigation’ in the ‘Credit risk - Credit risk management’ section.
(3)Balances include interest we have charged to the customer’s account and accrued interest that we have not charged to the account yet.
(4)The collateral value shown against advances secured on residential property is limited to the balance of each associated individual loan. It does not include the impact of over–collateralisation (where the collateral has a higher value than the loan balance) and includes collateral we would receive on draw down of certain off–balance sheet commitments.
| | | | | | | | | | | | | | |
| Annual Report 2022 | Santander UK Group Holdings plc 115 |
| | | | | | | | | | | | | | | | | | | | | | | | | | | | | | | | | | | | | | | | | |
| Strategic Report | Sustainability and Responsible Banking | Governance | Risk review | Financial review | Financial
statements | Shareholder
information |
| | | | | | | | | | | | | |
| | | | | | | | | | | | | |
The tables below show the main differences between our maximum and net exposure to credit risk on the financial assets that credit risk affects and to which the impairment requirements in IFRS 9 are not applied.
| | | | | | | | | | | | | | | | | | | | |
| Balance sheet asset gross
amount | | Collateral(1) | Netting(2) | Net
exposure |
| | Cash | Non-cash |
| 2022 | £bn | | £bn | £bn | £bn | £bn |
| Financial assets at FVTPL: | | | | | | |
–Derivative financial instruments | 2.4 | | | — | | (1.7) | | (0.5) | | 0.2 | |
–Other financial assets at FVTPL | 0.4 | | | — | | — | | — | | 0.4 | |
| Total | 2.8 | | | — | | (1.7) | | (0.5) | | 0.6 | |
| | | | | | |
| 2021 | | | | | | |
| Financial assets at FVTPL: | | | | | | |
–Derivative financial instruments | 1.7 | | | — | | (0.7) | | (0.6) | | 0.4 | |
–Other financial assets at FVTPL | 0.7 | | | — | | — | | — | | 0.7 | |
| Total | 2.4 | | | — | | (0.7) | | (0.6) | | 1.1 | |
(1)The forms of collateral we take to reduce credit risk include: liquid securities, including those transferred under reverse repurchase agreements; cash, including cash used as collateral for derivative transactions; and receivables.
(2)We can reduce credit risk exposures by applying netting. We do this mainly for derivative and repurchase transactions with financial institutions. For derivatives and securities finance transactions, we use standard master netting agreements. They allow us to set off our credit risk exposure to a counterparty against our obligations to the counterparty in relation to transactions under the master netting agreement in the event of default. This gives us a lower net credit exposure. They may also reduce settlement exposure. For more on this, see ‘Credit risk mitigation’ in the ‘Credit risk – Credit risk management’ section.
Single credit rating scale
In the table below, we have used a single rating scale to ensure we are consistent across all our credit risk portfolios in how we report the risk of default. It has eight grades for non–defaulted exposures, from 9 (lowest risk) to 2 (highest risk). We define each grade by an upper and lower PD value and we scale the grades so that the default risk increases by a factor of ten every time the grade number drops by two steps. For example, grade 9 has an average PD of 0.010%, and grade 7 has an average PD of 0.100%. We give defaulted exposures a grade 1 and a PD value of 100%. In the final column of the table we show the approximate equivalent credit rating grade used by Standard & Poor’s Ratings Services (S&P).
| | | | | | | | | | | | | | |
| PD range | |
| Mid | Lower | Upper | S&P equivalent |
| Santander UK risk grade | % | % | % |
| 9 | 0.010 | | 0.000 | | 0.021 | | AAA to AA+ |
| 8 | 0.032 | | 0.021 | | 0.066 | | AA to AA- |
| 7 | 0.100 | | 0.066 | | 0.208 | | A+ to BBB |
| 6 | 0.316 | | 0.208 | | 0.658 | | BBB- to BB |
| 5 | 1.000 | | 0.658 | | 2.081 | | BB- |
| 4 | 3.162 | | 2.081 | | 6.581 | | B+ to B |
| 3 | 10.000 | | 6.581 | | 20.811 | | B- |
| 2 | 31.623 | | 20.811 | | 99.999 | | CCC to C |
| 1 (Default) | 100.000 | | 100.000 | | 100.000 | | D |
The PDs in the table above are based on Economic Capital (EC) PD mappings, calculated based on the average PD over an economic cycle. This is different to the IFRS 9 PDs which are calculated at a point in time using forward looking economic scenarios. Where possible, the EC PD values are aligned to the regulatory capital models however any regulatory floors are removed and PDs are defined at every possible rating rather than grouped into rating buckets.
| | | | | | | | | | | | | | |
| Annual Report 2022 | Santander UK Group Holdings plc 116 |
| | | | | | | | | | | | | | | | | | | | | | | | | | | | | | | | | | | | | | | | | |
| Strategic Report | Sustainability and Responsible Banking | Governance | Risk review | Financial review | Financial
statements | Shareholder
information |
| | | | | | | | | | | | | |
| | | | | | | | | | | | | |
Rating distribution (audited)
The tables below show the credit rating of our financial assets to which the impairment requirements in IFRS 9 apply. JAs are incorporated in the balances. For more on the credit rating profiles of key portfolios, see the credit risk review section for each business segment. | | | | | | | | | | | | | | | | | | | | | | | | | | | | | | | | |
| Santander UK risk grade | | Loss allowance | Total |
| 9 | 8 | 7 | 6 | 5 | 4 | 3 to 1 | Other(1) |
| 2022 | £bn | £bn | £bn | £bn | £bn | £bn | £bn | £bn | £bn | £bn |
| Exposures | | | | | | | | | | |
| On balance sheet | | | | | | | | | | |
| Cash and balances at central banks | 46.6 | | — | | — | | — | | — | | — | | — | | — | | — | | 46.6 | |
–Stage 1 | 46.6 | | — | | — | | — | | — | | — | | — | | — | | — | | 46.6 | |
| Financial assets at amortised cost: | | | | | | | | | | |
–Loans and advances to customers(2) | 9.5 | | 36.5 | | 87.1 | | 52.7 | | 15.2 | | 9.3 | | 5.4 | | 9.0 | | (0.9) | | 223.8 | |
–Stage 1 | 9.5 | | 36.2 | | 85.4 | | 48.4 | | 11.1 | | 4.0 | | 0.5 | | 8.6 | | (0.1) | | 203.6 | |
–Stage 2 | — | | 0.3 | | 1.7 | | 4.3 | | 4.1 | | 5.2 | | 2.6 | | 0.2 | | (0.5) | | 17.9 | |
–Stage 3 | — | | — | | — | | — | | — | | 0.1 | | 2.3 | | 0.2 | | (0.3) | | 2.3 | |
| Of which mortgages: | 9.5 | | 34.1 | | 83.8 | | 45.6 | | 7.3 | | 3.8 | | 3.1 | | 1.1 | | (0.3) | | 188.0 | |
–Stage 1 | 9.5 | | 33.8 | | 82.1 | | 41.6 | | 4.2 | | 0.5 | | 0.1 | | 1.1 | | — | | 172.9 | |
–Stage 2 | — | | 0.3 | | 1.7 | | 4.0 | | 3.1 | | 3.2 | | 1.3 | | — | | (0.2) | | 13.4 | |
–Stage 3 | — | | — | | — | | — | | — | | 0.1 | | 1.7 | | — | | (0.1) | | 1.7 | |
| | | | | | | | | | |
| | | | | | | | | | |
| | | | | | | | | | |
| | | | | | | | | | |
| | | | | | | | | | |
| | | | | | | | | | |
| | | | | | | | | | |
| | | | | | | | | | |
–Loans and advances to banks | 0.1 | | (0.1) | | — | | — | | — | | — | | — | | 1.1 | | — | | 1.1 | |
–Stage 1 | 0.1 | | (0.1) | | — | | — | | — | | — | | — | | 1.1 | | — | | 1.1 | |
–Reverse repo agreements – non trading | 5.4 | | 0.6 | | 0.1 | | 1.1 | | — | | — | | — | | 0.1 | | — | | 7.3 | |
–Stage 1 | 5.4 | | 0.6 | | 0.1 | | 1.1 | | — | | — | | — | | 0.1 | | — | | 7.3 | |
–Other financial assets at amortised cost | 0.2 | | — | | — | | — | | — | | — | | — | | — | | — | | 0.2 | |
–Stage 1 | 0.2 | | — | | — | | — | | — | | — | | — | | — | | — | | 0.2 | |
| Total financial assets at amortised cost | 15.2 | | 37.0 | | 87.2 | | 53.8 | | 15.2 | | 9.3 | | 5.4 | | 10.2 | | (0.9) | | 232.4 | |
| Financial assets at FVOCI: | 3.5 | | 2.2 | | 0.3 | | — | | — | | — | | —�� | | — | | — | | 6.0 | |
–Stage 1 | 3.5 | | 2.2 | | 0.3 | | — | | — | | — | | — | | — | | — | | 6.0 | |
| Total on balance sheet | 65.3 | | 39.2 | | 87.5 | | 53.8 | | 15.2 | | 9.3 | | 5.4 | | 10.2 | | (0.9) | | 285.0 | |
| | | | | | | | | | |
| Total off–balance sheet | 0.1 | | 7.2 | | 6.9 | | 6.5 | | 4.9 | | 2.1 | | 0.4 | | 3.7 | | (0.1) | | 31.7 | |
–Stage 1 | 0.1 | | 7.2 | | 6.8 | | 6.4 | | 4.7 | | 1.7 | | 0.2 | | 3.7 | | — | | 30.8 | |
–Stage 2 | — | | — | | 0.1 | | 0.1 | | 0.2 | | 0.4 | | 0.1 | | — | | (0.1) | | 0.8 | |
–Stage 3 | — | | — | | — | | — | | — | | — | | 0.1 | | — | | — | | 0.1 | |
| Total exposures | 65.4 | | 46.4 | | 94.4 | | 60.3 | | 20.1 | | 11.4 | | 5.8 | | 13.9 | | (1.0) | | 316.7 | |
| | | | | | | | | | |
| ECL | | | | | | | | | | |
| On balance sheet | | | | | | | | | | |
| Cash and balances at central banks | — | | — | | — | | — | | — | | — | | — | | — | | | — | |
–Stage 1 | — | | — | | — | | — | | — | | — | | — | | — | | | — | |
| Financial assets at amortised cost: | | | | | | | | | | |
–Loans and advances to customers(2) | — | | — | | — | | — | | 0.2 | | 0.2 | | 0.5 | | 0.0 | | | 0.9 | |
–Stage 1 | — | | — | | — | | — | | 0.1 | | 0.0 | | 0.0 | | 0.0 | | | 0.1 | |
–Stage 2 | — | | — | | — | | — | | 0.1 | | 0.2 | | 0.2 | | 0.0 | | | 0.5 | |
–Stage 3 | — | | — | | — | | — | | 0.0 | | 0.0 | | 0.3 | | 0.0 | | | 0.3 | |
| Of which mortgages: | — | | — | | — | | — | | 0.1 | | 0.1 | | 0.1 | | 0.0 | | | 0.3 | |
–Stage 1 | — | | — | | — | | — | | | | | 0.0 | | | — | |
–Stage 2 | — | | — | | — | | — | | 0.1 | | 0.1 | | | 0.0 | | | 0.2 | |
–Stage 3 | — | | — | | — | | — | | | | 0.1 | | 0.0 | | | 0.1 | |
| | | | | | | | | | |
| | | | | | | | | | |
| | | | | | | | | | |
| | | | | | | | | | |
| | | | | | | | | | |
| | | | | | | | | | |
| | | | | | | | | | |
| | | | | | | | | | |
–Loans and advances to banks | — | | — | | — | | — | | — | | — | | — | | — | | | — | |
–Stage 1 | — | | — | | — | | — | | — | | — | | — | | — | | | — | |
–Reverse repo agreements – non trading | — | | — | | — | | — | | — | | — | | — | | — | | | — | |
–Stage 1 | — | | — | | — | | — | | — | | — | | — | | — | | | — | |
–Other financial assets at amortised cost | — | | — | | — | | — | | — | | — | | — | | — | | | — | |
–Stage 1 | — | | — | | — | | — | | — | | — | | — | | — | | | — | |
| Total financial assets at amortised cost | — | | — | | — | | — | | 0.2 | | 0.2 | | 0.5 | | — | | | 0.9 | |
| Financial assets at FVOCI: | — | | — | | — | | — | | — | | — | | — | | — | | | — | |
–Stage 1 | — | | — | | — | | — | | — | | — | | — | | — | | | — | |
| Total on balance sheet | — | | — | | — | | — | | 0.2 | | 0.2 | | 0.5 | | — | | | 0.9 | |
| | | | | | | | | | |
| Total off–balance sheet | — | | — | | — | | — | | — | | — | | 0.1 | | — | | | 0.1 | |
–Stage 1 | — | | — | | — | | — | | — | | — | | — | | — | | | — | |
–Stage 2 | — | | — | | — | | — | | — | | — | | 0.1 | | — | | | 0.1 | |
–Stage 3 | — | | — | | — | | — | | — | | — | | — | | — | | | — | |
| Total ECL | — | | — | | — | | — | | 0.2 | | 0.2 | | 0.6 | | — | | | 1.0 | |
| | | | | | | | | | | | | | |
| Annual Report 2022 | Santander UK Group Holdings plc 117 |
| | | | | | | | | | | | | | | | | | | | | | | | | | | | | | | | | | | | | | | | | |
| Strategic Report | Sustainability and Responsible Banking | Governance | Risk review | Financial review | Financial
statements | Shareholder
information |
| | | | | | | | | | | | | |
| | | | | | | | | | | | | |
| | | | | | | | | | | | | | | | | | | | | | | | | | | | | | |
| Santander UK risk grade | | | |
| 9 | 8 | 7 | 6 | 5 | 4 | 3 to 1 | Other(1) | Total |
| 2022 | % | % | % | % | % | % | % | % | | % |
| Coverage ratio | | | | | | | | | | |
| On balance sheet | | | | | | | | | | |
| Cash and balances at central banks | — | | — | | — | | — | | — | | — | | — | | — | | | — | |
–Stage 1 | — | | — | | — | | — | | — | | — | | — | | — | | | — | |
| Financial assets at amortised cost: | — | | — | | — | | — | | — | | — | | — | | — | | | — | |
–Loans and advances to customers(2) | — | | — | | — | | — | | 1.3 | | 2.2 | | 9.3 | | — | | | 0.4 | |
–Stage 1 | — | | — | | — | | — | | 0.9 | | — | | — | | — | | | — | |
–Stage 2 | — | | — | | — | | — | | 2.4 | | 3.8 | | 7.7 | | — | | | 2.8 | |
–Stage 3 | — | | — | | — | | — | | — | | — | | 13.0 | | — | | | 13.0 | |
| Of which mortgages: | — | | — | | — | | — | | 1.4 | | 2.6 | | 3.2 | | — | | | 0.2 | |
–Stage 1 | — | | — | | — | | — | | — | | — | | — | | — | | | — | |
–Stage 2 | — | | — | | — | | — | | 3.2 | | 3.1 | | — | | — | | | 1.5 | |
–Stage 3 | — | | — | | — | | — | | — | | — | | 5.9 | | — | | | 5.9 | |
–Loans and advances to banks | — | | — | | — | | — | | — | | — | | — | | — | | | — | |
–Stage 1 | — | | — | | — | | — | | — | | — | | — | | — | | | — | |
–Reverse repo agreements – non trading | — | | — | | — | | — | | — | | — | | — | | — | | | — | |
–Stage 1 | — | | — | | — | | — | | — | | — | | — | | — | | | — | |
–Other financial assets at amortised cost | — | | — | | — | | — | | — | | — | | — | | — | | | — | |
–Stage 1 | — | | — | | — | | — | | — | | — | | — | | — | | | — | |
| Total financial assets at amortised cost | — | | — | | — | | — | | 1.3 | | 2.2 | | 9.3 | | — | | | 0.4 | |
| Financial assets at FVOCI: | — | | — | | — | | — | | — | | — | | — | | — | | | — | |
–Stage 1 | — | | — | | — | | — | | — | | — | | — | | — | | | — | |
| Total on balance sheet | — | | — | | — | | — | | 1.3 | | 2.2 | | 9.3 | | — | | | 0.3 | |
| | | | | | | | | | |
| Total off–balance sheet | — | | — | | — | | — | | — | | — | | 25.0 | | — | | | 0.3 | |
–Stage 1 | — | | — | | — | | — | | — | | — | | — | | — | | | — | |
–Stage 2 | — | | — | | — | | — | | — | | — | | 100.0 | | — | | | 12.5 | |
–Stage 3 | — | | — | | — | | — | | — | | — | | — | | — | | | — | |
| Total coverage ratio | — | | — | | — | | — | | 1.0 | | 1.8 | | 10.3 | | — | | | 0.3 | |
| | | | | | | | | | | | | | |
| Annual Report 2022 | Santander UK Group Holdings plc 118 |
| | | | | | | | | | | | | | | | | | | | | | | | | | | | | | | | | | | | | | | | | |
| Strategic Report | Sustainability and Responsible Banking | Governance | Risk review | Financial review | Financial
statements | Shareholder
information |
| | | | | | | | | | | | | |
| | | | | | | | | | | | | |
| | | | | | | | | | | | | | | | | | | | | | | | | | | | | | | | |
| Santander UK risk grade | | Loss allowance | |
| 9 | 8 | 7 | 6 | 5 | 4 | 3 to 1 | Other(1) | Total |
| 2021 | £bn | £bn | £bn | £bn | £bn | £bn | £bn | £bn | £bn | £bn |
| Exposures | | | | | | | | | | |
| On balance sheet | | | | | | | | | | |
| Cash and balances at central banks | 50.5 | | — | | — | | — | | — | | — | | — | | — | | — | | 50.5 | |
–Stage 1 | 50.5 | | — | | — | | — | | — | | — | | — | | — | | — | | 50.5 | |
| Financial assets at amortised cost: | | | | | | | | | | |
–Loans and advances to customers⁽²⁾ | 9.0 | | 33.0 | | 85.8 | | 48.6 | | 12.9 | | 10.2 | | 6.0 | | 8.9 | | (0.9) | | 213.5 | |
–Stage 1 | 9.0 | | 32.2 | | 84.3 | | 45.5 | | 10.1 | | 5.0 | | 0.6 | | 8.3 | | (0.1) | | 194.9 | |
–Stage 2 | — | | 0.8 | | 1.5 | | 3.1 | | 2.8 | | 5.2 | | 2.8 | | 0.3 | | (0.4) | | 16.1 | |
–Stage 3 | — | | — | | — | | — | | — | | — | | 2.6 | | 0.3 | | (0.4) | | 2.5 | |
| Of which mortgages: | 9.0 | | 30.2 | | 80.5 | | 43.1 | | 6.5 | | 4.7 | | 3.2 | | 0.8 | | (0.2) | | 177.8 | |
–Stage 1 | 9.0 | | 30.0 | | 79.2 | | 40.2 | | 4.2 | | 1.6 | | 0.1 | | 0.8 | | — | | 165.1 | |
–Stage 2 | — | | 0.2 | | 1.3 | | 2.9 | | 2.3 | | 3.1 | | 1.3 | | — | | (0.1) | | 11.0 | |
–Stage 3 | — | | — | | — | | — | | — | | — | | 1.8 | | — | | (0.1) | | 1.7 | |
–Loans and advances to banks | 0.2 | | 0.2 | | 1.0 | | — | | — | | — | | — | | — | | — | | 1.4 | |
–Stage 1 | 0.2 | | 0.2 | | 1.0 | | — | | — | | — | | — | | — | | — | | 1.4 | |
–Reverse repo agreements – non trading | 9.7 | | 0.1 | | 1.1 | | 0.6 | | — | | — | | — | | 1.2 | | — | | 12.7 | |
–Stage 1 | 9.7 | | 0.1 | | 1.1 | | 0.6 | | — | | — | | — | | 1.2 | | — | | 12.7 | |
–Other financial assets at amortised cost | 0.5 | | — | | — | | — | | — | | — | | — | | — | | — | | 0.5 | |
–Stage 1 | 0.5 | | — | | — | | — | | — | | — | | — | | — | | — | | 0.5 | |
| Total financial assets at amortised cost | 19.4 | | 33.3 | | 87.9 | | 49.2 | | 12.9 | | 10.2 | | 6.0 | | 10.1 | | (0.9) | | 228.1 | |
| Financial assets at FVOCI: | 3.6 | | 2.1 | | 0.2 | | — | | — | | — | | — | | — | | — | | 5.9 | |
–Stage 1 | 3.6 | | 2.1 | | 0.2 | | — | | — | | — | | — | | — | | — | | 5.9 | |
| Total on balance sheet | 73.5 | | 35.4 | | 88.1 | | 49.2 | | 12.9 | | 10.2 | | 6.0 | | 10.1 | | (0.9) | | 284.5 | |
| | | | | | | | | | |
| Total off–balance sheet | 0.1 | | 7.3 | | 7.0 | | 6.8 | | 4.5 | | 1.3 | | 0.5 | | 10.2 | | — | | 37.7 | |
–Stage 1 | 0.1 | | 7.0 | | 6.7 | | 6.6 | | 4.3 | | 1.0 | | 0.2 | | 10.2 | | — | | 36.1 | |
–Stage 2 | — | | 0.3 | | 0.3 | | 0.2 | | 0.2 | | 0.3 | | 0.2 | | — | | — | | 1.5 | |
–Stage 3 | — | | — | | — | | — | | — | | — | | 0.1 | | — | | — | | 0.1 | |
| Total exposures | 73.6 | | 42.7 | | 95.1 | | 56.0 | | 17.4 | | 11.5 | | 6.5 | | 20.3 | | (0.9) | | 322.2 | |
| | | | | | | | | | | | | | | | | | | | | | | | | | | | | | |
| | | | |
| | | | | | | | | |
| | | | | | | | | | |
| ECL | | | | | | | | | | |
| On balance sheet | | | | | | | | | | |
| Cash and balances at central banks | — | | — | | — | | — | | — | | — | | — | | — | | | — | |
–Stage 1 | — | | — | | — | | — | | — | | — | | — | | — | | | — | |
| Financial assets at amortised cost: | | | | | | | | | | |
–Loans and advances to customers⁽²⁾ | — | | — | | — | | — | | 0.3 | | 0.1 | | 0.5 | | — | | | 0.9 | |
–Stage 1 | — | | — | | — | | — | | 0.1 | | — | | — | | — | | | 0.1 | |
–Stage 2 | — | | — | | — | | — | | 0.2 | | 0.1 | | 0.1 | | — | | | 0.4 | |
–Stage 3 | — | | — | | — | | — | | — | | — | | 0.4 | | — | | | 0.4 | |
| Of which mortgages: | — | | — | | — | | — | | — | | 0.1 | | 0.1 | | — | | | 0.2 | |
–Stage 1 | — | | — | | — | | — | | — | | — | | — | | — | | | — | |
–Stage 2 | — | | — | | — | | — | | — | | 0.1 | | — | | — | | | 0.1 | |
–Stage 3 | — | | — | | — | | — | | — | | — | | 0.1 | | — | | | 0.1 | |
–Loans and advances to banks | — | | — | | — | | — | | — | | — | | — | | — | | | — | |
–Stage 1 | — | | — | | — | | — | | — | | — | | — | | — | | | — | |
–Reverse repo agreements – non trading | — | | — | | — | | — | | — | | — | | — | | — | | | — | |
–Stage 1 | — | | — | | — | | — | | — | | — | | — | | — | | | — | |
–Other financial assets at amortised cost | — | | — | | — | | — | | — | | — | | — | | — | | | — | |
–Stage 1 | — | | — | | — | | — | | — | | — | | — | | — | | | — | |
| Total financial assets at amortised cost | — | | — | | — | | — | | 0.3 | | 0.1 | | 0.5 | | — | | | 0.9 | |
| Financial assets at FVOCI: | — | | — | | — | | — | | — | | — | | — | | — | | | — | |
–Stage 1 | — | | — | | — | | — | | — | | — | | — | | — | | | — | |
| Total on balance sheet | — | | — | | — | | — | | 0.3 | | 0.1 | | 0.5 | | — | | | 0.9 | |
| | | | | | | | | | |
| Total off–balance sheet | — | | — | | — | | — | | — | | — | | — | | — | | | — | |
–Stage 1 | — | | — | | — | | — | | — | | — | | — | | �� | | | — | |
–Stage 2 | — | | — | | — | | — | | — | | — | | — | — | | | — | |
–Stage 3 | — | | — | | — | | — | | — | | — | | — | | — | | | — | |
| Total ECL | — | | — | | — | | — | | 0.3 | | 0.1 | | 0.5 | | — | | | 0.9 | |
| | | | | | | | | | | | | | |
| Annual Report 2022 | Santander UK Group Holdings plc 119 |
| | | | | | | | | | | | | | | | | | | | | | | | | | | | | | | | | | | | | | | | | |
| Strategic Report | Sustainability and Responsible Banking | Governance | Risk review | Financial review | Financial
statements | Shareholder
information |
| | | | | | | | | | | | | |
| | | | | | | | | | | | | |
| | | | | | | | | | | | | | | | | | | | | | | | | | | | | | |
| Santander UK risk grade | | | |
| 9 | 8 | 7 | 6 | 5 | 4 | 3 to 1 | Other(1) | Total |
| 2021 | % | % | % | % | % | % | % | % | | % |
| Coverage ratio | | | | | | | | | | |
| On balance sheet | | | | | | | | | | |
| Cash and balances at central banks | — | | — | | — | | — | | — | | — | | — | | — | | | — | |
–Stage 1 | — | | — | | — | | — | | — | | — | | — | | — | | | — | |
| Financial assets at amortised cost: | | | | | | | | | | |
–Loans and advances to customers⁽²⁾ | — | | — | | — | | — | | 2.3 | | 1.0 | | 8.3 | | — | | | 0.4 | |
–Stage 1 | — | | — | | — | | — | | 1.0 | | — | | — | | — | | | 0.1 | |
–Stage 2 | — | | — | | — | | — | | 7.1 | | 1.9 | | 3.6 | | — | | | 2.5 | |
–Stage 3 | — | | — | | — | | — | | — | | — | | 15.4 | | — | | | 16.0 | |
| Of which mortgages: | — | | — | | — | | — | | — | | 2.1 | | 3.1 | | — | | | 0.1 | |
–Stage 1 | — | | — | | — | | — | | — | | — | | — | | — | | | — | |
–Stage 2 | — | | — | | — | | — | | — | | 3.2 | | — | | — | | | 0.9 | |
–Stage 3 | — | | — | | — | | — | | — | | — | | 5.6 | | — | | | 5.9 | |
–Loans and advances to banks | — | | — | | — | | — | | — | | — | | — | | — | | | — | |
–Stage 1 | — | | — | | — | | — | | — | | — | | — | | — | | | — | |
–Reverse repo agreements – non trading | — | | — | | — | | — | | — | | — | | — | | — | | | — | |
–Stage 1 | — | | — | | — | | — | | — | | — | | — | | — | | | — | |
–Other financial assets at amortised cost | — | | — | | — | | — | | — | | — | | — | | — | | | — | |
–Stage 1 | — | | — | | — | | — | | — | | — | | — | | — | | | — | |
| Total financial assets at amortised cost | — | | — | | — | | — | | 2.3 | | 1.0 | | 8.3 | | — | | | 0.4 | |
| Financial assets at FVOCI: | — | | — | | — | | — | | — | | — | | — | | — | | | — | |
–Stage 1 | — | | — | | — | | — | | — | | — | | — | | — | | | — | |
| Total on balance sheet | — | | — | | — | | — | | 2.3 | | 1.0 | | 8.3 | | — | | | 0.3 | |
| | | | | | | | | | |
| Total off–balance sheet | — | | — | | — | | — | | — | | — | | — | | — | | | — | |
–Stage 1 | — | | — | | — | | — | | — | | — | | — | | — | | | — | |
–Stage 2 | — | | — | | — | | — | | — | | — | | — | | — | | | — | |
–Stage 3 | — | | — | | — | | — | | — | | — | | — | | — | | | — | |
| Total coverage ratio | — | | — | | — | | — | | 1.7 | | 0.9 | | 7.7 | | — | | | 0.3 | |
(1)Includes cash at hand and smaller cases mainly in the Consumer (auto) finance and commercial mortgages portfolios, as well as loans written as part of the Covid-19 support schemes. We use scorecards for these items, rather than rating models.
(2)Includes interest we have charged to the customer’s account and accrued interest we have not charged to the account yet.
| | | | | | | | | | | | | | |
| Annual Report 2022 | Santander UK Group Holdings plc 120 |
| | | | | | | | | | | | | | | | | | | | | | | | | | | | | | | | | | | | | | | | | |
| Strategic Report | Sustainability and Responsible Banking | Governance | Risk review | Financial review | Financial
statements | Shareholder
information |
| | | | | | | | | | | | | |
| | | | | | | | | | | | | |
Credit performance (audited)
| | | | | | | | | | | | | | | | | | | | | | | | | | | | | |
| Customer Loans | Gross write-offs | Loan Loss Allowances |
| Total | Stage 1 | Stage 2 | Stage 3 |
| 2022 | £bn | £bn | % | £bn | % | £bn | % | £m | £m |
| | | | | | | | | |
| Retail Banking | 194.6 | | 178.0 | | 91.5 | | 14.6 | | 7.4 | | 2.0 | | 1.08 | | 113 | | 504 | |
– Homes - Mortgages | 187.1 | | 171.7 | | 91.8 | | 13.6 | | 7.3 | | 1.8 | | 0.99 | | 3 | | 250 | |
– EDB - Credit Cards | 2.5 | | 2.1 | | 85.7 | | 0.3 | | 12.9 | | 0.1 | | 2.53 | | 40 | | 120 | |
– EDB - Other(1) | 5.0 | | 4.2 | | 82.8 | | 0.7 | | 13.0 | | 0.1 | | 4.30 | | 70 | | 134 | |
Consumer Finance(2) | 5.4 | | 5.0 | | 93.0 | | 0.4 | | 6.5 | | — | | 0.54 | | 19 | | 67 | |
| | | | | | | | | |
| | | | | | | | | |
| | | | | | | | | |
| CCB | 18.5 | | 14.5 | | 78.3 | | 3.5 | | 18.8 | | 0.5 | | 3.08 | | 24 | | 362 | |
| Corporate Centre | 1.2 | | 1.2 | | 99.6 | | — | | 0.3 | | — | | 0.10 | | — | | — | |
| Total Drawn | 219.7 | | 198.7 | | 90.4 | | 18.5 | | 8.4 | | 2.5 | | 1.24 | | 156 | | 933 | |
| Retail Banking | 21.8 | | 21.2 | | — | | 0.5 | | — | | 0.1 | | — | | — | | 42 | |
– Homes - Mortgages | 8.0 | | 7.9 | | — | | 0.1 | | — | | — | | — | | — | | 3 | |
– EDB - Credit Cards | 10.3 | | 10.2 | | — | | 0.1 | | — | | — | | — | | — | | 10 | |
– EDB - Other(1) | 3.5 | | 3.1 | | — | | 0.3 | | — | | 0.1 | | — | | — | | 29 | |
Consumer Finance(2) | 0.4 | | 0.4 | | — | | — | | — | | — | | — | | — | | — | |
| CCB | 9.7 | | 9.3 | | — | | 0.4 | | — | | — | | — | | — | | 32 | |
| Corporate Centre | — | | — | | — | | — | | — | | — | | — | | — | | — | |
| Total Undrawn | 31.9 | | 30.9 | | — | | 0.9 | | — | | 0.1 | | — | | — | | 74 | |
| Total | 251.6 | | 229.6 | | — | | 19.4 | | — | | 2.6 | | — | | 156 | | 1,007 | |
| | | | | | | | | | | | | | | | | | | | | | | | | | | | | |
| 2021 | £bn | £bn | % | £bn | % | £bn | % | £m | £m |
| Retail Banking | 185.6 | | 171.8 | | 92.6 | | 11.7 | | 6.2 | | 2.1 | | 1.15 | | 107 | | 368 | |
– Homes - Mortgages | 177.3 | | 164.4 | | 92.7 | | 11.1 | | 6.3 | | 1.8 | | 1.02 | | 5 | | 186 | |
– EDB - Credit Cards | 2.4 | | 2.2 | | 90.8 | | 0.2 | | 7.7 | | — | | 2.54 | | 39 | | 82 | |
–EDB - Other | 5.9 | | 5.2 | | 88.5 | | 0.4 | | 6.6 | | 0.3 | | 4.90 | | 63 | | 100 | |
| Consumer Finance | 5.0 | | 4.8 | | 95.5 | | 0.2 | | 4.0 | | — | | 0.48 | | 25 | | 52 | |
| | | | | | | | | |
| | | | | | | | | |
| | | | | | | | | |
| CCB | 19.3 | | 13.9 | | 72.0 | | 4.6 | | 23.9 | | 0.8 | | 4.28 | | 58 | | 408 | |
| | | | | | | | | |
| Corporate Centre | 0.7 | | 0.7 | | 99.5 | | — | | 0.3 | | — | | 0.21 | | — | | — | |
| Total Drawn | 210.6 | | 191.2 | | 90.8 | | 16.5 | | 8 | | 2.9 | | 1.43 | | 190 | | 828 | |
| Retail Banking | 29.4 | | 29.2 | | — | | 0.2 | | — | | — | | — | | — | | 21 | |
– Homes - Mortgages | 16.0 | | 15.9 | | — | | 0.1 | | — | | — | | — | | — | | 5 | |
– EDB - Credit Cards | 9.9 | | 9.9 | | — | | — | | — | | — | | — | | — | | 7 | |
–EDB - Other | 3.5 | | 3.4 | | — | | 0.1 | | — | | — | | — | | — | | 9 | |
| Consumer Finance | 0.3 | | 0.3 | | — | | — | | — | | — | | — | | — | | — | |
| CCB | 8.1 | | 6.7 | | — | | 1.3 | | — | | 0.1 | | — | | — | | 17 | |
| Corporate Centre | — | | — | | — | | — | | — | | — | | — | | — | | — | |
| Total Undrawn | 37.8 | | 36.2 | | — | | 1.5 | | — | | 0.1 | | — | | — | | 38 | |
| Total | 248.4 | | 227.4 | | — | | 18.0 | | — | | 3.0 | | — | | 190 | | 866 | |
(1)EDB - Other includes £2.5bnof BBLS lending (£2.4bn is BBLS with 100% Government Guarantee), £2.0bn unsecured personal loans and£0.5bn overdrafts.
(2)Consumer Finance - 84% of lending is collateralised on the vehicle.
For more on the credit performance of our key portfolios by business segment, see the credit risk review section for each business segment.
| | | | | | | | | | | | | | |
| Annual Report 2022 | Santander UK Group Holdings plc 121 |
| | | | | | | | | | | | | | | | | | | | | | | | | | | | | | | | | | | | | | | | | |
| Strategic Report | Sustainability and Responsible Banking | Governance | Risk review | Financial review | Financial
statements | Shareholder
information |
| | | | | | | | | | | | | |
| | | | | | | | | | | | | |
Credit quality (audited)
Total on-balance sheet exposures at 31 December 2022 comprised £219.7bn of customer loans, loans and advances to banks of £1.1 bn, £7.5bn of sovereign assets measured at amortised cost £6.0bn of assets measured at FVOCI, and £46.6bn of cash and balances at central banks.
| | | | | | | | | | | | | | |
| Stage 1 | Stage 2 | Stage 3 | Total |
| 2022 | £m | £m | £m | £m |
| Exposures | | | | |
| On-balance sheet | | | | |
| Retail Banking | 178,033 | | 14,551 | | 2,077 | | 194,661 | |
– Homes - Mortgages | 171,733 | | 13,576 | | 1,832 | | 187,141 | |
– EDB - Credit Cards | 2,192 | | 329 | | 37 | | 2,558 | |
– EDB - Other | 4,108 | | 646 | | 208 | | 4,962 | |
| Consumer Finance | 5,005 | | 350 | | 29 | | 5,384 | |
| CCB | 14,507 | | 3,476 | | 535 | | 18,518 | |
| Corporate Centre | 62,405 | | 3 | | 1 | | 62,409 | |
| Total on-balance sheet | 259,950 | | 18,380 | | 2,642 | | 280,972 | |
| Off-balance sheet | | | | |
Retail Banking(1) | 21,176 | | 490 | | 56 | | 21,722 | |
– Homes - Mortgages(1) | 7,899 | | 109 | | 21 | | 8,029 | |
– EDB - Credit Cards | 10,137 | | 122 | | 29 | | 10,288 | |
– EDB - Other | 3,140 | | 259 | | 6 | | 3,405 | |
| Consumer Finance | 356 | | — | | — | | 356 | |
| CCB | 9,331 | | 412 | | 37 | | 9,780 | |
| Corporate Centre | — | | — | | — | | — | |
Total off-balance sheet(2) | 30,863 | | 902 | | 93 | | 31,858 | |
| Total exposures | 290,813 | | 19,282 | | 2,735 | | 312,830 | |
| | | | |
| ECL | | | | |
| On-balance sheet | | | | |
| Retail Banking | 57 | | 295 | | 152 | | 504 | |
– Homes - Mortgages | 24 | | 131 | | 95 | | 250 | |
– EDB - Credit Cards | 14 | | 85 | | 21 | | 120 | |
– EDB - Other | 19 | | 79 | | 36 | | 134 | |
| Consumer Finance | 19 | | 27 | | 21 | | 67 | |
| CCB | 69 | | 155 | | 138 | | 362 | |
| Corporate Centre | — | | — | | — | | — | |
| Total on-balance sheet | 145 | | 477 | | 311 | | 933 | |
| Off-balance sheet | | | | |
| Retail Banking | 12 | | 28 | | 2 | | 42 | |
– Homes - Mortgages | 2 | | 1 | | — | | 3 | |
– EDB - Credit Cards | 3 | | 6 | | 1 | | 10 | |
– EDB - Other | 7 | | 21 | | 1 | | 29 | |
| Consumer Finance | — | | — | | — | | — | |
| CCB | 14 | | 11 | | 7 | | 32 | |
| Corporate Centre | — | | — | | — | | — | |
| Total off-balance sheet | 26 | | 39 | | 9 | | 74 | |
| Total ECL | 171 | | 516 | | 320 | | 1,007 | |
| | | | |
Coverage ratio(3) | % | % | % | % |
| On-balance sheet | | | | |
| Retail Banking | — | | 2.0 | | 7.3 | | 0.3 | |
– Homes - Mortgages | — | | 1.0 | | 5.2 | | 0.1 | |
– EDB - Credit Cards | 0.6 | | 25.8 | | 56.8 | | 4.7 | |
– EDB - Other | 0.5 | | 12.2 | | 17.3 | | 2.7 | |
| Consumer Finance | 0.4 | | 7.7 | | 72.4 | | 1.2 | |
| CCB | 0.5 | | 4.5 | | 25.8 | | 2.0 | |
| Corporate Centre | — | | — | | — | | — | |
| Total on-balance sheet | 0.1 | | 2.6 | | 11.8 | | 0.3 | |
| Off-balance sheet | | | | |
| Retail Banking | 0.1 | | 5.7 | | 3.6 | | 0.2 | |
– Homes - Mortgages | — | | 0.9 | | — | | — | |
– EDB - Credit Cards | — | | 4.9 | | 3.4 | | 0.1 | |
– EDB - Other | 0.2 | | 8.1 | | 16.7 | | 0.9 | |
| Consumer Finance | — | | — | | — | | — | |
| CCB | 0.2 | | 2.7 | | 18.9 | | 0.3 | |
| Corporate Centre | — | | — | | — | | — | |
| Total off-balance sheet | 0.1 | | 4.3 | | 9.7 | | 0.2 | |
| Total coverage | 0.1 | | 2.7 | | 11.7 | | 0.3 | |
(1)Off-balance sheet exposures include £2.8bn of residential mortgage offers in the pipeline.
(2)Off-balance sheet amounts consist of contingent liabilities and commitments. For more, see Note 31.
(3)ECL as a percentage of the related exposure.
| | | | | | | | | | | | | | |
| Annual Report 2022 | Santander UK Group Holdings plc 122 |
| | | | | | | | | | | | | | | | | | | | | | | | | | | | | | | | | | | | | | | | | |
| Strategic Report | Sustainability and Responsible Banking | Governance | Risk review | Financial review | Financial
statements | Shareholder
information |
| | | | | | | | | | | | | |
| | | | | | | | | | | | | |
Total on-balance sheet exposures at 31 December 2021 comprised £210.6bn of customer loans, loans and advances to banks of £1.4bn, £13.2bn of sovereign assets measured at amortised cost, £5.9bn of assets measured at FVOCI, and £50.5bn of cash and balances at central banks.
| | | | | | | | | | | | | | |
| Stage 1 | Stage 2 | Stage 3 | Total |
| 2021 | £m | £m | £m | £m |
| Exposures | | | | |
| On-balance sheet | | | | |
| Retail Banking | 171,791 | | 11,693 | | 2,124 | | 185,608 | |
– Homes - Mortgages | 164,381 | | 11,118 | | 1,798 | | 177,297 | |
– EDB - Credit Cards | 2,125 | | 181 | | 35 | | 2,341 | |
– EDB - Other | 5,285 | | 394 | | 291 | | 5,970 | |
| Consumer Finance | 4,760 | | 200 | | 24 | | 4,984 | |
| CCB | 13,890 | | 4,602 | | 790 | | 19,282 | |
| Corporate Centre | 71,693 | | 2 | | 2 | | 71,697 | |
| Total on-balance sheet | 262,134 | | 16,497 | | 2,940 | | 281,571 | |
| Off-balance sheet | | | | |
Retail Banking(1) | 29,123 | | 204 | | 44 | | 29,371 | |
– Homes - Mortgages(1) | 15,851 | | 81 | | 18 | | 15,950 | |
– EDB - Credit Cards | 9,887 | | 49 | | 24 | | 9,960 | |
– EDB - Other | 3,385 | | 74 | | 2 | | 3,461 | |
| Consumer Finance | 314 | | — | | — | | 314 | |
| CCB | 6,714 | | 1,312 | | 37 | | 8,063 | |
| Corporate Centre | — | | — | | — | | — | |
Total off-balance sheet(2) | 36,151 | | 1,516 | | 81 | | 37,748 | |
| Total exposures | 298,285 | | 18,013 | | 3,021 | | 319,319 | |
| | | | |
| ECL | | | | |
| On-balance sheet | | | | |
| Retail Banking | 53 | | 178 | | 137 | | 368 | |
– Homes - Mortgages | 9 | | 88 | | 89 | | 186 | |
– EDB - Credit Cards | 15 | | 47 | | 20 | | 82 | |
– EDB - Other | 29 | | 43 | | 28 | | 100 | |
| Consumer Finance | 18 | | 17 | | 17 | | 52 | |
| CCB | 45 | | 119 | | 244 | | 408 | |
| Corporate Centre | — | | — | | — | | — | |
| Total on-balance sheet | 116 | | 314 | | 398 | | 828 | |
| Off-balance sheet | | | | |
| Retail Banking | 12 | | 8 | | 1 | | 21 | |
– Homes - Mortgages | 5 | | 0 | | — | | 5 | |
– EDB - Credit Cards | 3 | | 3 | | 1 | | 7 | |
– EDB - Other | 4 | | 5 | | — | | 9 | |
| Consumer Finance | — | | — | | — | | — | |
| CCB | 5 | | 8 | | 4 | | 17 | |
| Corporate Centre | — | | 0 | | 0 | | — | |
| Total off-balance sheet | 17 | | 16 | | 5 | | 38 | |
| Total ECL | 133 | | 330 | | 403 | | 866 | |
| | | | |
Coverage ratio(3) | % | % | % | % |
| On-balance sheet | | | | |
| Retail Banking | — | | 1.5 | | 6.5 | | 0.2 | |
– Homes - Mortgages | — | | 0.8 | | 4.9 | | 0.1 | |
– EDB - Credit Cards | 0.7 | | 26.0 | | 57.1 | | 3.5 | |
– EDB - Other | 0.5 | | 10.9 | | 9.6 | | 1.7 | |
| Consumer Finance | 0.4 | | 8.5 | | 70.8 | | 1.0 | |
| CCB | 0.3 | | 2.6 | | 30.9 | | 2.1 | |
| Corporate Centre | — | | — | | — | | — | |
| Total on-balance sheet | — | | 1.9 | | 13.5 | | 0.3 | |
| Off-balance sheet | | | | |
| Retail Banking | — | | 3.9 | | 2.3 | | 0.1 | |
– Homes - Mortgages | — | | — | | — | | — | |
– EDB - Credit Cards | — | | 6.1 | | 4.2 | | 0.1 | |
– EDB - Other | 0.1 | | 6.8 | | — | | 0.3 | |
| Consumer Finance | — | | — | | — | | — | |
| CCB | 0.1 | | 0.6 | | 10.8 | | 0.2 | |
| Corporate Centre | — | | — | | — | | — | |
| Total off-balance sheet | — | | 1.1 | | 6.2 | | 0.1 | |
| Total coverage | — | | 1.8 | | 13.3 | | 0.3 | |
(1)Off-balance sheet exposures include £10.6bn of residential mortgage offers in the pipeline.
(2)Off-balance sheet amounts consist of contingent liabilities and commitments. For more, see Note 31.
(3)ECL as a percentage of the related exposure
| | | | | | | | | | | | | | |
| Annual Report 2022 | Santander UK Group Holdings plc 123 |
| | | | | | | | | | | | | | | | | | | | | | | | | | | | | | | | | | | | | | | | | |
| Strategic Report | Sustainability and Responsible Banking | Governance | Risk review | Financial review | Financial
statements | Shareholder
information |
| | | | | | | | | | | | | |
| | | | | | | | | | | | | |
2022 compared to 2021
The ECL provision at 31 December 2022 increased by £141m to £1.0bn (2021: £0.9bn). Notable changes to ECL in 2022 which impacted credit impairment were:
–Corporate Covid-19 related JAs:: net release of £175m. All corporate sector staging JAs related to Covid-19 released, resulting in £0.4bn movement of corporate Stage 3 loans to Stage 2.
–Economic scenarios and weights: charge of £163m. Updated economic scenarios with expectations for higher base rate and lower house prices in 2023.
–Corporate sector staging risks: charge of £61m. JAs to reflect the corporate lending risks for sectors and counterparties which are most susceptible to increased inflation, energy prices and input costs alongside potentially lower demand. As a result, £1.4bn of higher risk Stage 1 loans were moved to Stage 2, and probability of defaults increased on some Stage 2 loans following an assessment of the client and sector risks.
–Affordability of retail lending repayments: charge of £44m. JAs to account for the potential repayment affordability risk among those customers with low disposable income. After stressing for inflation, £0.2bn of unsecured loans, overdrafts and credit cards moved from Stage 1 to Stage 2. In addition, £5.0bn of mortgages moved from Stage 1 to Stage 2 following an assessment of customer indebtedness.
–Write-offs against provision: Gross write-off utilisation of £157m (2021: £191m).
Key movements in exposures and ECL in the period by Stage were:
–The reduction in Stage 1 exposures arose mainly from changes in Corporate Centre. This reduction was partially offset by the growth in the mortgage portfolio and Corporate & Commercial Banking. The Stage 1 ECL increased mainly due to the increase in Corporate & Commercial Banking as a result of unwinding the Corporate lending to segments affected by Covid-19 JA that placed more vulnerable accounts into Stage 2.
–Total Stage 2 exposures increased due to the implementation of cost of living JAs to cover the affordability risk associated with the increase in interest rates and energy pries. This included a portion of the mortgage and unsecured lending portfolios from Stage 1 to Stage 2. This was partially offset by the unwinding of the Corporate lending to segments affected by Covid-19 JAs. In Retail Banking, Stage 2 exposures increased due to the implementation of cost of living JAs to cover the affordability risk associated with the increase in interest rates and energy prices. Stage 2 ECL increased due to a worsening in the economic outlook with the inclusion of an inflationary pressure scenario. Retail Banking Stage 2 ECL also increased due to affordability risk JAs.
–Stage 3 exposures and ECL reduced due to releasing the Stage 2-3 Corporate lending to segments affected by Covid-19 JAs. Stage 3 exposures and ECL remained fairly stable across the Retail Banking portfolio.
| | | | | | | | | | | | | | |
| Annual Report 2022 | Santander UK Group Holdings plc 124 |
| | | | | | | | | | | | | | | | | | | | | | | | | | | | | | | | | | | | | | | | | |
| Strategic Report | Sustainability and Responsible Banking | Governance | Risk review | Financial review | Financial
statements | Shareholder
information |
| | | | | | | | | | | | | |
| | | | | | | | | | | | | |
Stage 2 analysis (audited)
The following table analyses our Stage 2 exposures and ECL by the reason the exposure is classified as Stage 2.
| | | | | | | | | | | | | | | | | | | | | | | | | | | | | | | | | | | |
| | | | | | | PD deterioration | Forbearance | Other | 30 DPD | Mortgage affordability | Retail Unsecured affordability | High risk corporate | Total |
| Retail Banking Homes - Mortgages | Exposure £m | | | | | | | 7,310 | | 449 | | 393 | | 463 | | 4,961 | | — | | — | | 13,576 | |
| ECL £m | | | | | | | 85 | | 2 | | 7 | | 10 | | 27 | | — | | — | | 131 | |
| Coverage % | | | | | | | 1.2 | | 0.4 | | 1.8 | | 2.2 | | 0.5 | | — | | — | | 1.0 | |
| Retail Banking EDB - Credit Cards | Exposure £m | | | | | | | 240 | | — | | 22 | | 8 | | — | | 59 | | — | | 329 | |
| ECL £m | | | | | | | 63 | | — | | 4 | | 4 | | — | | 14 | | — | | 85 | |
| Coverage % | | | | | | | 26.3 | | — | | 18.2 | | 50.0 | | — | | 23.7 | | — | | 25.8 | |
| Retail Banking EDB - Other | Exposure £m | | | | | | | 303 | | — | | 26 | | 178 | | — | | 139 | | — | | 646 | |
| ECL £m | | | | | | | 42 | | — | | 6 | | 14 | | — | | 17 | | — | | 79 | |
| Coverage % | | | | | | | 13.9 | | — | | 23.1 | | 7.9 | | — | | 12.2 | | — | | 12.2 | |
| Consumer Finance | Exposure £m | | | | | | | 159 | | — | | 164 | | 27 | | — | | — | | — | | 350 | |
| ECL £m | | | | | | | 12 | | — | | 5 | | 10 | | — | | — | | — | | 27 | |
| Coverage % | | | | | | | 7.5 | | — | | 3.0 | | 37.0 | | — | | — | | — | | 7.7 | |
| CCB | Exposure £m | | | | | | | 1,548 | | 64 | | 684 | | 214 | | — | | — | | 966 | | 3,476 | |
| ECL £m | | | | | | | 81 | | 4 | | 1 | | 10 | | — | | — | | 59 | | 155 | |
| Coverage % | | | | | | | 5.2 | | 6.3 | | 0.1 | | 4.7 | | — | | — | | 6.1 | | 4.5 | |
| Corporate Centre | Exposure £m | | | | | | | — | | — | | — | | 3 | | — | | — | | — | | 3 | |
| ECL £m | | | | | | | — | | — | | — | | — | | — | | — | | — | | — | |
| Coverage % | | | | | | | — | | — | | — | | — | | — | | — | | — | | — | |
| Total Drawn | Exposure £m | | | | | | | 9,560 | | 513 | | 1,289 | | 893 | | 4,961 | | 198 | | 966 | | 18,380 | |
| ECL £m | | | | | | | 283 | | 6 | | 23 | | 48 | | 27 | | 31 | | 59 | | 477 | |
| Coverage % | | | | | | | 3.0 | | 1.2 | | 1.8 | | 5.4 | | 0.5 | | 15.7 | | 6.1 | | 2.6 | |
| Undrawn | ECL £m | | | | | | | 19 | | — | | 8 | | 6 | | — | | 4 | | 2 | | 39 | |
| Total Reported | Exposure £m | | | | | | | 10,323 | | 625 | | 1,271 | | 937 | | 4,961 | | 199 | | 966 | | 19,282 | |
| ECL £m | | | | | | | 302 | | 6 | | 31 | | 54 | | 27 | | 35 | | 61 | | 516 | |
| | | | | | | | | | | | | | | |
| 2021 | | | | | | | | | | | | | | |
| Retail Banking Homes - Mortgages | Exposure £m | | | | | | | 5,138 | | 650 | | 600 | | 489 | | 4,241 | | — | | — | | 11,118 | |
| ECL £m | | | | | | | 57 | | 4 | | 2 | | 7 | | 18 | | — | | — | | 88 | |
| Coverage % | | | | | | | 1.1 | | 0.6 | | 0.3 | | 1.4 | | 0.4 | | — | | — | | 0.8 | |
| Retail Banking EDB - Credit Cards | Exposure £m | | | | | | | 160 | | — | | 13 | | 7 | | — | | — | | — | | 180 | |
| ECL £m | | | | | | | 41 | | — | | 2 | | 4 | | — | | — | | — | | 47 | |
| Coverage % | | | | | | | 25.6 | | — | | 15.4 | | 57.1 | | — | | — | | — | | 26.1 | |
| Retail Banking EDB - Other | Exposure £m | | | | | | | 150 | | — | | 6 | | 239 | | — | | — | | — | | 395 | |
| ECL £m | | | | | | | 22 | | — | | 1 | | 20 | | — | | — | | — | | 43 | |
| Coverage % | | | | | | | 14.7 | | — | | 16.7 | | 8.4 | | — | | — | | — | | 10.9 | |
| Consumer Finance | Exposure £m | | | | | | | 42 | | 11 | | 130 | | 17 | | — | | — | | — | | 200 | |
| ECL £m | | | | | | | 6 | | 2 | | 4 | | 5 | | — | | — | | — | | 17 | |
| Coverage % | | | | | | | 14.3 | | 18.2 | | 3.1 | | 29.4 | | — | | — | | — | | 8.5 | |
| CCB | Exposure £m | | | | | | | 463 | | 272 | | 445 | | 313 | | — | | — | | 3,109 | | 4,602 | |
| ECL £m | | | | | | | 19 | | 8 | | 17 | | 1 | | — | | — | | 74 | | 119 | |
| Coverage % | | | | | | | 4.1 | | 2.9 | | 3.8 | | 0.3 | | — | | — | | 2.4 | | 2.6 | |
| Corporate Centre | Exposure £m | | | | | | | — | | — | | 2 | | — | | — | | — | | — | | 2 | |
| ECL £m | | | | | | | — | | — | | — | | — | | — | | — | | — | | — | |
| Coverage % | | | | | | | — | | — | | — | | — | | — | | — | | — | | — | |
| Total Drawn | Exposure £m | | | | | | | 5,953 | | 933 | | 1,196 | | 1,065 | | 4,241 | | — | | 3,109 | | 16,497 | |
| ECL £m | | | | | | | 145 | | 14 | | 26 | | 37 | | 18 | | — | | 74 | | 314 | |
| Coverage % | | | | | | | 2.4 | | 1.5 | | 2.2 | | 3.5 | | 0.4 | | — | | 2.4 | | 1.9 | |
| Undrawn | ECL £m | | | | | | | 8 | | 1 | | 1 | | 2 | | — | | — | | 4 | | 16 | |
| Total Reported | Exposure £m | | | | | | | 6,192 | | 1,016 | | 1,332 | | 1,205 | | 4,272 | | — | | 3,996 | | 18,013 | |
| ECL £m | | | | | | | 153 | | 15 | | 27 | | 39 | | 18 | | — | | 78 | | 330 | |
Where balances satisfy more than one of the criteria above for determining a SICR, we have assigned the corresponding gross carrying amount and ECL in order of the categories presented.
| | | | | | | | | | | | | | |
| Annual Report 2022 | Santander UK Group Holdings plc 125 |
| | | | | | | | | | | | | | | | | | | | | | | | | | | | | | | | | | | | | | | | | |
| Strategic Report | Sustainability and Responsible Banking | Governance | Risk review | Financial review | Financial
statements | Shareholder
information |
| | | | | | | | | | | | | |
| | | | | | | | | | | | | |
The following table analyses our Stage 2 exposures and the related ECL by whether or not they are in a cure period at the balance sheet date:
| | | | | | | | | | | | | | | | | | | | | | | |
| 2022 | | 2021 |
| Exposure | ECL | Coverage | | Exposure | ECL | Coverage |
| £m | £m | % | | £m | £m | % |
| Stage 2 not in cure period | 13,156 | | 439 | | 3.3 | | | 13,351 | | 286 | | 2.1 | |
| Stage 2 in cure period (for transfer to Stage 1) | 6,126 | | 77 | | 1.3 | | | 4,662 | | 44 | | 0.9 | |
| 19,282 | | 516 | | 2.7 | | | 18,013 | | 330 | | 1.8 | |
2022 compared to 2021
The accounts in a cure period increased in 2022 due to the introduction of the Unsecured Affordability JA and an increase in the number of accounts falling in scope for the Mortgage affordability JA. Accounts which have been moved into Stage 2 due to a JA are assumed to not be in a cure period.
Stage 3 analysis (audited)
The following table analyses our Stage 3 exposures and the related ECL by whether or not they are in a cure period at the balance sheet date.
| | | | | | | | | | | | | | | | | | | | | | | |
| 2022 | | 2021 |
| Exposure | ECL | Coverage | | Exposure | ECL | Coverage |
| £m | £m | % | | £m | £m | % |
| Stage 3 not in cure period | 2,421 | | 286 | | 11.8 | | | N/A | N/A | N/A |
| Stage 3 in cure period (for transfer to Stage 2) | 314 | | 34 | | 10.8 | | | N/A | N/A | N/A |
| 2,735 | | 320 | | 11.7 | | | 3,021 | | 403 | | 13.3 | |
2022 compared to 2021
Following the implementation of a new regulatory definition of default in early 2022, we introduced a cure period criteria for Stage 3 assets. We did not have any cure period criteria for Stage 3 at 31 December 2021 and as the change in definition was a change in estimate the prior periods were not amended.
| | | | | | | | | | | | | | |
| Annual Report 2022 | Santander UK Group Holdings plc 126 |
| | | | | | | | | | | | | | | | | | | | | | | | | | | | | | | | | | | | | | | | | |
| Strategic Report | Sustainability and Responsible Banking | Governance | Risk review | Financial review | Financial
statements | Shareholder
information |
| | | | | | | | | | | | | |
| | | | | | | | | | | | | |
Reconciliation of exposures, loss allowance and net carrying amounts (audited)
The table below shows the relationships between disclosures in this Credit risk review section which refer to drawn exposures and the associated ECL, and the total assets as presented in the Consolidated Balance Sheet. The Credit risk review disclosures exclude Joint ventures, as they carry low credit risk and therefore have an immaterial ECL, and Other items, mainly accrued interest that we have not yet charged to the customer's account, and cash collateral.
| | | | | | | | | | | | | | | | | | |
| On-balance sheet | | Off-balance sheet |
| Exposures | Loss
allowance | Net carrying
amount | | Exposures | Loss allowance |
| 2022 | £m | £m | £m | | £m | £m |
| Retail Banking | 194,661 | | 504 | | 194,157 | | | 21,722 | | 42 | |
–Homes - Mortgages(1) | 187,141 | | 250 | | 186,891 | | | 8,029 | | 3 | |
–EDB - Credit Cards(2) | 2,558 | | 120 | | 2,438 | | | 10,288 | | 10 | |
–EDB - Other (3) | 4,962 | | 134 | | 4,828 | | | 3,405 | | 29 | |
| Consumer Finance | 5,384 | | 67 | | 5,317 | | | 356 | | — | |
| Corporate & Commercial Banking | 18,518 | | 362 | | 18,156 | | | 9,780 | | 32 | |
| | | | | | |
| Corporate Centre | 62,409 | | — | | 62,409 | | | — | | — | |
| Total exposures presented in Credit Quality tables | 280,972 | | 933 | | 280,039 | | | 31,858 | | 74 | |
| Joint ventures | | | 4,165 | | | | |
| Other items | | | 904 | | | | |
| Adjusted net carrying amount | | | 285,108 | | | | |
| Assets classified at FVTPL | | | 2,873 | | | | |
Non-financial assets(3) | | | 4,262 | | | | |
| Total assets per the Consolidated Balance Sheet | | | 292,243 | | | | |
| | | | | | |
| 2021 | | | | | | |
| Retail Banking | 185,608 | | 368 | | 185,240 | | | 29,371 | | 21 | |
–Homes(1) | 177,297 | | 186 | | 177,111 | | | 15,950 | | 5 | |
–EDB - Credit Cards(2) | 2,341 | | 82 | | 2,259 | | | 9,960 | | 7 | |
–EDB - Other(3) | 5,970 | | 100 | | 5,870 | | | 3,461 | | 9 | |
| Consumer Finance | 4,984 | | 52 | | 4,932 | | | 314 | | — | |
| Corporate & Commercial Banking | 19,282 | | 408 | | 18,874 | | | 8,063 | | 17 | |
| | | | | | |
| Corporate Centre | 71,697 | | — | | 71,697 | | | — | | — | |
| Total exposures presented in Credit Quality tables | 281,571 | | 828 | | 280,743 | | | 37,748 | | 38 | |
| Joint ventures | | | 3,080 | | | | |
| Other items | | | 656 | | | | |
| Adjusted net carrying amount | | | 284,479 | | | | |
| Assets classified at FVTPL | | | 2,396 | | | | |
Non-financial assets(3) | | | 6,801 | | | | |
| Total assets per the Consolidated Balance Sheet | | | 293,676 | | | | |
(1)Off-balance sheet exposures include offers in the pipeline and undrawn flexible mortgages products.
(2)Off-balance sheet exposures include credit cards.
(3)Non-financial assets include £(2,654)m (2021: £85m) of Macro hedge of interest rate risk.
| | | | | | | | | | | | | | |
| Annual Report 2022 | Santander UK Group Holdings plc 127 |
| | | | | | | | | | | | | | | | | | | | | | | | | | | | | | | | | | | | | | | | | |
| Strategic Report | Sustainability and Responsible Banking | Governance | Risk review | Financial review | Financial
statements | Shareholder
information |
| | | | | | | | | | | | | |
| | | | | | | | | | | | | |
Movement in total exposures and the corresponding ECL (audited)
The following table shows changes in total on and off-balance sheet exposures, subject to ECL assessment, and the corresponding ECL, in the period. The table presents total gross carrying amounts and ECLs at a Santander UK group level. We present segmental views in the sections below.
| | | | | | | | | | | | | | | | | | | | | | | | | | |
| Stage 1 | Stage 2 | Stage 3 | Total |
| Exposures(1) | ECL | Exposures(1) | ECL | Exposures(1) | ECL | Exposures(1) | ECL |
| £m | £m | £m | £m | £m | £m | £m | £m |
| At 1 January 2022 | 298,285 | | 133 | | 18,013 | | 330 | | 3,021 | | 403 | | 319,319 | | 866 | |
Transfers from Stage 1 to Stage 2(3) | (9,100) | | (25) | | 9,100 | | 25 | | — | | — | | — | | — | |
Transfers from Stage 2 to Stage 1(3) | 7,207 | | 133 | | (7,207) | | (133) | | — | | — | | — | | — | |
Transfers to Stage 3(3) | (621) | | (4) | | (624) | | (32) | | 1,245 | | 36 | | — | | — | |
Transfers from Stage 3(3) | 10 | | 1 | | 758 | | 150 | | (768) | | (151) | | — | | — | |
| Transfers of financial instruments | (2,504) | | 105 | | 2,027 | | 10 | | 477 | | (115) | | — | | — | |
Net ECL remeasurement on stage transfer(4) | — | | (110) | | — | | 98 | | — | | 110 | | — | | 98 | |
Change in economic scenarios(2) | — | | 37 | | — | | 123 | | — | | 3 | | — | | 163 | |
| Changes to model | — | | — | | — | | — | | — | | — | | — | | — | |
New lending and assets purchased(5) | 48,194 | | 42 | | 1,119 | | 76 | | 64 | | 24 | | 49,377 | | 142 | |
Redemptions, repayments and assets sold(7) | (55,332) | | (35) | | (2,065) | | (60) | | (950) | | (35) | | (58,347) | | (130) | |
Changes in risk parameters and other movements(6) | 2,170 | | (1) | | 188 | | (61) | | 377 | | 87 | | 2,735 | | 25 | |
Assets written off(7) | — | | — | | — | | — | | (254) | | (157) | | (254) | | (157) | |
| At 31 December 2022 | 290,813 | | 171 | | 19,282 | | 516 | | 2,735 | | 320 | | 312,830 | | 1,007 | |
| Net movement in the period | (7,472) | | 38 | | 1,269 | | 186 | | (286) | | (83) | | (6,489) | | 141 | |
| | | | | | | | |
| ECL charge/(release) to the Income Statement | | 38 | | | 186 | | | 74 | | | 298 | |
| Less: Discount unwind | | — | | | — | | | (13) | | | (13) | |
| Less: Recoveries net of collection costs | | — | | | — | | | 36 | | | 36 | |
| Total ECL charge/(release) to the Income Statement | | 38 | | | 186 | | | 97 | | | 321 | |
| Discontinued operations ECL adjustment | | — | | | — | | | — | | | — | |
| ECL charge/(release) to the Income Statement from continued operations | | 38 | | | 186 | | | 97 | | | 321 | |
| | | | | | | | | | | | | | | | | | | | | | | | | | |
| | | | | | | | |
| At 1 January 2021 | 307,416 | | 216 | | 18,380 | | 592 | | 2,996 | | 569 | | 328,792 | | 1,377 | |
Transfers from Stage 1 to Stage 2(3) | (6,805) | | (9) | | 6,805 | | 9 | | — | | — | | — | | — | |
Transfers from Stage 2 to Stage 1(3) | 5,883 | | 167 | | (5,883) | | (167) | | — | | — | | — | | — | |
Transfers to Stage 3(3) | (572) | | (3) | | (532) | | (20) | | 1,104 | | 23 | | — | | — | |
Transfers from Stage 3(3) | 14 | | 2 | | 455 | | 62 | | (469) | | (64) | | — | | — | |
| Transfers of financial instruments | (1,480) | | 157 | | 845 | | (116) | | 635 | | (41) | | — | | — | |
Net remeasurement of ECL on stage transfer(4) | — | | (133) | | — | | 26 | | — | | 64 | | — | | (43) | |
Change in economic scenarios(2) | — | | (7) | | — | | (151) | | — | | (12) | | — | | (170) | |
| Changes to model | — | | — | | — | | — | | — | | — | | — | | — | |
New lending and assets purchased(5) | 50,863 | | 31 | | 936 | | 26 | | 24 | | 19 | | 51,823 | | 76 | |
Redemptions, repayments and assets sold(7) | (63,659) | | (70) | | (3,441) | | (67) | | (519) | | (68) | | (67,619) | | (205) | |
Changes in risk parameters and other movements(6) | 5,145 | | (61) | | 1,293 | | 20 | | 182 | | 63 | | 6,620 | | 22 | |
Assets written off (7) | — | | — | | — | | — | | (297) | | (191) | | (297) | | (191) | |
| At 31 December 2021 | 298,285 | | 133 | | 18,013 | | 330 | | 3,021 | | 403 | | 319,319 | | 866 | |
| Net movement in the period | (9,131) | | (83) | | (367) | | (262) | | 25 | | (166) | | (9,473) | | (511) | |
| | | | | | | | |
| ECL charge/(release) to the Income Statement | | (83) | | | (262) | | | 25 | | | (320) | |
| Less: Discount unwind | | — | | | — | | | (11) | | | (11) | |
| Less: Recoveries net of collection costs | | — | | | — | | | 87 | | | 87 | |
| Total ECL charge/(release) to the Income Statement | | (83) | | | (262) | | | 101 | | | (244) | |
| Discontinued operations ECL adjustment | | 11 | | | — | | | — | | | 11 | |
| ECL charge/(release) to the Income Statement from continued operations | | (72) | | | (262) | | | 101 | | | (233) | |
(1)Exposures that have attracted an ECL, and as reported in the Credit Quality table above.
(2)Changes to assumptions in the period. Isolates the impact on ECL from changes to the economic variables for each scenario, the scenarios themselves, and the probability weights from all other movements. Also includes the impact of quarterly revaluation of collateral. The impact of changes in economics on exposure Stage allocations are shown in Transfers of financial instruments.
(3)Total impact of facilities that moved Stage(s) in the period. This means, for example, that where risk parameter changes (model inputs) or model changes (methodology) result in a facility moving Stage, the full impact is reflected here (rather than in Other). Stage flow analysis only applies to facilities that existed at both the start and end of the period. Transfers between Stages are based on opening balances and ECL at the start of the period.
(4)Relates to the revaluation of ECL following the transfer of an exposure from one Stage to another.
(5)Exposures and ECL of facilities that did not exist at the start of the period but did at the end. Amounts in Stage 2 and 3 represent assets which deteriorated in the period after origination in Stage 1.
(6)Residual movements on existing facilities that did not change Stage in the period, and which were not acquired in the period. Includes the net increase or decrease in the period of cash at central banks, the impact of changes in risk parameters in the period, unwind of discount rates and increases in ECL requirements of accounts which ultimately were written off in the period.
(7)Exposures and ECL for facilities that existed at the start of the period but not at the end.
| | | | | | | | | | | | | | |
| Annual Report 2022 | Santander UK Group Holdings plc 128 |
| | | | | | | | | | | | | | | | | | | | | | | | | | | | | | | | | | | | | | | | | |
| Strategic Report | Sustainability and Responsible Banking | Governance | Risk review | Financial review | Financial
statements | Shareholder
information |
| | | | | | | | | | | | | |
| | | | | | | | | | | | | |
COUNTRY RISK EXPOSURES (AUDITED)
We manage our country risk exposure under our global limits framework. We set our Risk Appetite for each country, taking into account factors that may affect its risk profile. These can include political events, macroeconomics and the nature of the risk. We actively manage exposures if we need to.
The tables below show our total exposures, which are the total of balance sheet and off–balance sheet values. We calculate balance sheet values in line with IFRS (i.e. after netting allowed under IAS 32) except for credit provisions which we add back. Off–balance sheet values are undrawn facilities and letters of credit. We classify location by country of risk – the country where each client has its main business or assets. That is unless there is a full risk transfer guarantee in place. If so, we use the guarantor’s country of domicile. If a client has operations in many countries, we use their country of incorporation. The table below excludes balances with other Banco Santander group members. We show them separately in the section that immediately follows.
| | | | | | | | | | | | | | | | | | | | | | | | | | | | | | | | | | | | | | | | | | | |
| 2022 | | 2021 |
| | | Financial institutions | | | | | | | Financial institutions | | | |
| Governments | | Banks(1) | Other | Retail | Corporate | Total(2) | | Governments | | Banks(1) | Other | Retail | Corporate | Total(2) |
| £bn | | £bn | £bn | £bn | £bn | £bn | | £bn | | £bn | £bn | £bn | £bn | £bn |
| Eurozone | | | | | | | | | | | | | | | |
| Ireland | — | | | — | | 2.3 | | — | | 0.1 | | 2.4 | | | — | | | — | | 5.3 | | — | | — | | 5.3 | |
| | | | | | | | | | | | | | | |
| Spain | — | | | — | | — | | — | | — | | — | | | — | | | — | | — | | — | | 0.1 | | 0.1 | |
| France | 0.1 | | | 0.8 | | 0.5 | | — | | — | | 1.4 | | | 0.1 | | | 0.3 | | 0.2 | | — | | — | | 0.6 | |
| Germany | — | | | 0.3 | | — | | — | | 0.1 | | 0.4 | | | — | | | 0.5 | | — | | — | | — | | 0.5 | |
| Luxembourg | — | | | — | | — | | — | | — | | — | | | — | | | — | | 0.1 | | — | | — | | 0.1 | |
Other(3) | 0.3 | | | 0.5 | | — | | — | | — | | 0.8 | | | 0.3 | | | 0.8 | | — | | — | | — | | 1.1 | |
| 0.4 | | | 1.6 | | 2.8 | | — | | 0.2 | | 5.0 | | | 0.4 | | | 1.6 | | 5.6 | | — | | 0.1 | | 7.7 | |
| Other countries | | | | | | | | | | | | | | | |
| UK | 46.6 | | | 1.8 | | 6.2 | | 220.2 | | 26.8 | | 301.6 | | | 50.2 | | | 2.1 | | 9.9 | | 217.8 | | 28.7 | | 308.7 | |
| US | 0.1 | | | 1.0 | | — | | — | | | 1.1 | | | 0.5 | | | 0.8 | | — | | — | | — | | 1.3 | |
| Japan | 1.1 | | | 0.3 | | — | | — | | — | | 1.4 | | | 1.0 | | | 0.2 | | — | | — | | — | | 1.2 | |
| Switzerland | 1.2 | | | — | | — | | — | | — | | 1.2 | | | — | | | — | | — | | — | | — | | — | |
| Other | 0.1 | | | 0.8 | | 0.2 | | 1.3 | | 0.5 | | 2.9 | | | 0.3 | | | 0.2 | | 0.1 | | 0.7 | | 0.1 | | 1.4 | |
| 49.1 | | | 3.9 | | 6.4 | | 221.5 | | 27.3 | | 308.2 | | | 52.0 | | | 3.3 | | 10.0 | | 218.5 | | 28.8 | | 312.6 | |
| Total | 49.5 | | | 5.5 | | 9.2 | | 221.5 | | 27.5 | | 313.2 | | | 52.4 | | | 4.9 | | 15.6 | | 218.5 | | 28.9 | | 320.3 | |
(1)Excludes balances with central banks.
(2)Excludes cash at hand, interests in other entities, intangible assets, property, plant and equipment, tax assets, retirement benefit assets and other assets.
(3)Includes The Netherlands £0.1bn (2021: £0.2bn), Belgium £0.6bn (2021: £0.7bn), and Finland £0.1bn (2021: £nil).
Balances with other Banco Santander group members (audited)
We deal with other Banco Santander group members in the ordinary course of business. We do this where we have a particular business advantage or expertise and where they can offer us commercial opportunities. These transactions also arise where we support the activities of, or with, larger multinational corporate clients and financial institutions which may deal with other Banco Santander group members. We conduct these activities on the same terms as for similar transactions with third parties, and in a way that manages the credit risk within limits acceptable to the Board and the PRA.
At 31 December 2022 and 31 December 2021, we had gross balances with other Banco Santander group members as follows:
| | | | | | | | | | | | | | | | | | | | | | | | | | | | | |
| 2022 | | 2021 |
| Financial institutions | | | | Financial institutions | | |
| Banks | Other | Corporate | Total | | Banks | Other | Corporate | Total |
| £bn | £bn | £bn | £bn | | £bn | £bn | £bn | £bn |
| Assets | | | | | | | | | |
| Spain | 1.4 | | — | | — | | 1.4 | | | 1.0 | | — | | — | | 1.0 | |
| UK | — | | 4.2 | | — | | 4.2 | | | — | | 3.1 | | — | | 3.1 | |
| 1.4 | | 4.2 | | — | | 5.6 | | | 1.0 | | 3.1 | | — | | 4.1 | |
| Liabilities | | | | | | | | | |
| Spain | 1.7 | | 0.1 | | — | | 1.8 | | | 1.4 | | 0.1 | | — | | 1.5 | |
| UK | — | | 1.2 | | — | | 1.2 | | | — | | 1.2 | | — | | 1.2 | |
| Uruguay | — | | — | | — | | — | | | 0.1 | | — | | — | | 0.1 | |
| 1.7 | | 1.3 | | — | | 3.0 | | | 1.5 | | 1.3 | | — | | 2.8 | |
| | | | | | | | | | | | | | |
| Annual Report 2022 | Santander UK Group Holdings plc 129 |
| | | | | | | | | | | | | | | | | | | | | | | | | | | | | | | | | | | | | | | | | |
| Strategic Report | Sustainability and Responsible Banking | Governance | Risk review | Financial review | Financial
statements | Shareholder
information |
| | | | | | | | | | | | | |
| | | | | | | | | | | | | |
RETAIL BANKING – CREDIT RISK REVIEW
We provide detailed credit risk analysis for Retail Banking in separate sections below for Homes, our largest portfolio, and our Everyday Banking portfolio.
RETAIL BANKING: HOMES – CREDIT RISK REVIEW
We offer mortgages to people who want to buy a property and offer additional borrowing (known as further advances) to existing mortgage customers. The property must be in the UK, except for a small number of loans in the Isle of Man and Jersey.
Borrower profile (audited)
| | | | | | | | | | | | | | | | | | | | | | | | | | | | | | | | | | | |
| Stock | | New business |
| 2022 | | 2021 | | 2022 | | 2021 |
| £m | % | | £m | % | | £m | % | | £m | % |
Home movers(1) | 77,708 | | 41 | | | 75,879 | | 43 | | | 12,221 | | 36 | | | 13,537 | | 43 | |
Remortgagers(2) | 53,936 | | 29 | | | 51,336 | | 29 | | | 10,644 | | 31 | | | 8,031 | | 25 | |
| First-time buyers | 38,698 | | 21 | | | 35,189 | | 20 | | | 8,129 | | 24 | | | 6,206 | | 19 | |
| Buy-to-let | 16,799 | | 9 | | | 14,893 | | 8 | | | 3,133 | | 9 | | | 4,239 | | 13 | |
| 187,141 | | 100 | | | 177,297 | | 100 | | | 34,127 | | 100 | | | 32,013 | | 100 | |
(1)'Home movers’ include both existing customers moving house and taking out a new mortgage with us, and customers who switch their mortgage to us when they move house.
(2)'Remortgagers’ are new customers who are taking a new mortgage with us
As well as the new business above, there were £25.3bn (2021: £30.5bn) of remortgages where we moved customers with maturing products onto new mortgages. We also provided £1.2bn (2021: £1.4bn) of further advances and flexible mortgage drawdowns. 81% (2021: 83%) of customers with a maturing mortgage were retained, which applied to mortgages four months post maturity and calculated as a 12-month average of retention rates to September.
2022 compared to 2021
In 2022, mortgage asset stock increased across all sectors, with the stock borrower profile unchanged. Our new business increased, mainly in remortgages, reflecting market conditions and strong demand from first time buyers, driven by customers securing fixed rate products in a rising interest rate environment. In 2022, we helped first-time buyers buy their new home with £8.1bn of gross lending (2021: £6.2bn).
Interest rate profile (audited)
The interest rate profile of our maturing mortgage asset stock was:
| | | | | | | | | | | | | | | | | |
| 2022 | | 2021 |
| £m | % | | £m | % |
| Fixed rate | 166,281 | | 89 | | | 149,517 | | 84 | |
| Of which maturing: | | | | | |
–< 12 months | 39,123 | | 21 | | | 30,067 | | 17 | |
–Later than 1 year but no later than 3 years | 39,056 | | 21 | | | 41,753 | | 24 | |
–Later than 3 years but no later than 4 years | 24,584 | | 13 | | | 24,799 | | 14 | |
–Later than 4 years but no later than 5 years | 25,290 | | 14 | | | 21,276 | | 12 | |
–Later than 5 years | 38,228 | | 20 | | | 31,622 | | 18 | |
| Variable rate | 12,511 | | 7 | | | 17,124 | | 10 | |
| Standard Variable Rate (SVR) | 5,682 | | 3 | | | 7,876 | | 4 | |
| Follow on Rate (FoR) | 2,667 | | 1 | | | 2,780 | | 2 | |
| 187,141 | | 100 | | | 177,297 | | 100 | |
2022 compared to 2021
In 2022, we continued to see customers refinance from variable rate and SVR to fixed rate products influenced by the rapid increases in interest rates and the competitive mortgage market. Within fixed rate products, we continued to see an increase in the proportion of 5 year fixed rate mortgages in 2022.
Geographical distribution (audited)
The geographical distribution of our mortgage asset stock and new business was:
| | | | | | | | | | | | | | | | | |
| Stock | | New business |
| 2022 | 2021 | | 2022 | 2021 |
| Region | £bn | £bn | | £bn | £bn |
| London | 47.8 | | 45.3 | | | 8.3 | | 8.3 | |
| Midlands and East Anglia | 26.0 | | 24.1 | | | 5.3 | | 4.7 | |
| North | 24.8 | | 23.5 | | | 4.7 | | 3.8 | |
| Northern Ireland | 2.9 | | 3.0 | | | 0.3 | | 0.3 | |
| Scotland | 6.8 | | 6.6 | | | 1.2 | | 1.0 | |
| South East excluding London | 59.3 | | 56.4 | | | 10.6 | | 10.5 | |
| South West, Wales and other | 19.5 | | 18.4 | | | 3.7 | | 3.4 | |
| 187.1 | | 177.3 | | | 34.1 | | 32.0 | |
| | | | | |
| | |
| | |
| | |
| | |
2022 compared to 2021
The portfolio's geographical distribution continued to represent a broad footprint across the UK, with a concentration around London and the South East. The loan-to-income multiple of mortgage lending in the year, based on average earnings of new business at inception, was 3.35 (2021: 3.35).
| | | | | | | | | | | | | | |
| Annual Report 2022 | Santander UK Group Holdings plc 130 |
| | | | | | | | | | | | | | | | | | | | | | | | | | | | | | | | | | | | | | | | | |
| Strategic Report | Sustainability and Responsible Banking | Governance | Risk review | Financial review | Financial
statements | Shareholder
information |
| | | | | | | | | | | | | |
| | | | | | | | | | | | | |
Mortgage loan size (audited)
The split of our mortgage asset by size was:
| | | | | | | | |
| Mortgage loan size | 2022 | 2021 |
| >£1.0m | 2 | % | 2 | % |
| £0.5m to £1.0m | 10 | % | 9 | % |
| £0.25m to £0.5m | 31 | % | 30 | % |
| <£0.25m | 57 | % | 59 | % |
| Average loan size (stock) | £184k | £174k |
| Average loan size (new business) | £237k | £234k |
Loan-to-value analysis (audited)
This table shows the LTV distribution for the gross carrying amount and the related ECL of our total mortgage portfolio and Stage 3 mortgages, and new business. We also show the collateral value and average LTV. We use our estimate of the property value at the balance sheet date and include fees that have been added to the loan. For flexible products, we only include the drawn amount, not undrawn limits.
| | | | | | | | | | | | | | | | | | | | | | | | | | | | | | | | | | | |
| 2022 | | 2021 |
| Stock | Stage 3 | New | | Stock | Stage 3 | New |
| Total | ECL | Total | ECL | Business | | Total | ECL | Total | ECL | Business |
| LTV | £m | £m | £m | £m | £m | | £m | £m | £m | £m | £m |
| Up to 50% | 88,841 | | 37 | | 1,116 | | 14 | | 4,890 | | | 80,058 | | 25 | | 944 | | 9 | | 4,997 | |
| >50-60% | 36,356 | | 29 | | 284 | | 11 | | 4,014 | | | 30,854 | | 22 | | 301 | | 10 | | 4,379 | |
| >60-70% | 34,350 | | 50 | | 197 | | 16 | | 6,104 | | | 33,344 | | 25 | | 226 | | 11 | | 6,517 | |
| >70-80% | 17,977 | | 46 | | 110 | | 15 | | 10,094 | | | 24,511 | | 31 | | 155 | | 14 | | 10,242 | |
| >80-90% | 7,369 | | 29 | | 42 | | 9 | | 6,002 | | | 6,632 | | 21 | | 68 | | 10 | | 4,558 | |
| >90-100% | 1,876 | | 17 | | 32 | | 9 | | 2,999 | | | 1,367 | | 16 | | 39 | | 9 | | 1,270 | |
| >100% | 372 | | 45 | | 52 | | 21 | | 24 | | | 531 | | 51 | | 65 | | 26 | | 50 | |
| 187,141 | | 253 | | 1,833 | | 95 | | 34,127 | | | 177,297 | | 191 | | 1,798 | | 89 | | 32,013 | |
Collateral value (1) | 187,093 | | | 1,824 | | | 34,126 | | | 177,222 | | | 1,786 | | | 32,012 | |
| | | | | | | | | | | |
| % | | % | | % | | % | | % | | % |
| | | | | | | | | | | |
Average LTV - Balance weighted(2)(3) | 50 | | | 47 | | | 69 | | | 52 | | | 51 | | | 66 | |
(1)Collateral value is limited to the balance of each loan and excludes the impact of any over-collateralisation. Includes collateral against loans in negative equity of £323m (2021: £455m).
(2)Balance weighted LTV = (Loan 1 balance x (Loan 1 Balance/Loan 1 latest property valuation) + (Loan 2 balance x (loan 2 balance/Loan 2 latest property valuation)+ ...) /(Loan 1 balance + Loan 2 balance+...).
(3) Simple average stock LTV 39% (2021: 41%).
At 31 December 2022, the parts of loans in negative equity which were effectively uncollateralised before deducting loss allowances was £48m (2021: £75m). The balance weighted average LTV of new business in the period in London was 66% (2021: 64%).
2022 compared to 2021
There were no significant changes in collateral quality in 2022. Despite economic pressures, balance weighted average LTVs were broadly flat over the period. We monitor the LTV profile of new lending and take action as needed to ensure the LTV mix of completions is appropriate.
Credit performance (audited)
| | | | | | | | |
| 2022 | 2021 |
| £m | £m |
| Mortgage loans and advances to customers of which: | 187,141 | | 177,297 | |
–Stage 1 | 171,733 | | 164,381 | |
–Stage 2 | 13,576 | | 11,118 | |
–Stage 3 | 1,832 | | 1,798 | |
Loss allowances(1) | 253 | | 191 | |
| | | | | | | | |
| % | % |
Stage 1 ratio(2) | 91.76 | | 92.72 | |
Stage 2 ratio(2) | 7.25 | | 6.27 | |
| Stage 3 ratio | 0.99 | | 1.02 | |
(1)The ECL allowance is for both on and off–balance sheet exposures.
(2)Stage 1/Stage 2 exposures as a percentage of customer loans.
| | | | | | | | | | | | | | |
| Annual Report 2022 | Santander UK Group Holdings plc 131 |
| | | | | | | | | | | | | | | | | | | | | | | | | | | | | | | | | | | | | | | | | |
| Strategic Report | Sustainability and Responsible Banking | Governance | Risk review | Financial review | Financial
statements | Shareholder
information |
| | | | | | | | | | | | | |
| | | | | | | | | | | | | |
Movement in total exposures and the corresponding ECL (audited)
The following tables show changes in total on and off-balance sheet exposures and ECL in the period. The footnotes to the Santander UK group level table on page 128 also apply to these tables. | | | | | | | | | | | | | | | | | | | | | | | | | | |
| Stage 1 | Stage 2 | Stage 3 | Total |
| Exposures(1) | ECL | Exposures(1) | ECL | Exposures(1) | ECL | Exposures(1) | ECL |
| £m | £m | £m | £m | £m | £m | £m | £m |
| At 1 January 2022 | 180,232 | | 14 | | 11,199 | | 88 | | 1,816 | | 89 | | 193,247 | | 191 | |
Transfers from Stage 1 to Stage 2(3) | (5,833) | | (1) | | 5,833 | | 1 | | — | | — | | — | | — | |
Transfers from Stage 2 to Stage 1(3) | 2,961 | | 16 | | (2,961) | | (16) | | — | | — | | — | | — | |
Transfers to Stage 3(3) | (278) | | (2) | | (448) | | (11) | | 726 | | 13 | | — | | — | |
Transfers from Stage 3(3) | 3 | | — | | 280 | | 9 | | (283) | | (9) | | — | | — | |
| Transfers of financial instruments | (3,147) | | 13 | | 2,704 | | (17) | | 443 | | 4 | | — | | — | |
Net ECL remeasurement on stage transfer(4) | — | | (15) | | — | | 40 | | — | | 8 | | — | | 33 | |
Change in economic scenarios(2) | — | | 1 | | — | | 21 | | — | | 2 | | — | | 24 | |
| Changes to model | — | | — | | — | | — | | — | | — | | — | | — | |
New lending and assets purchased(5) | 35,028 | | 7 | | 529 | | 11 | | 1 | | — | | 35,558 | | 18 | |
Redemptions, repayments and assets sold(7) | (32,565) | | (3) | | (1,229) | | (11) | | (415) | | (12) | | (34,209) | | (26) | |
Changes in risk parameters and other movements(6) | 84 | | 9 | | 482 | | — | | 18 | | 7 | | 584 | | 16 | |
Assets written off (7) | — | | — | | — | | — | | (10) | | (3) | | (10) | | (3) | |
| At 31 December 2022 | 179,632 | | 26 | | 13,685 | | 132 | | 1,853 | | 95 | | 195,170 | | 253 | |
| Net movement in the period | (600) | | 12 | | 2,486 | | 44 | | 37 | | 6 | | 1,923 | | 62 | |
| | | | | | | | |
| ECL charge/(release) to the Income Statement | | 12 | | | 44 | | | 9 | | | 65 | |
| Less: Discount unwind | | — | | | — | | | (2) | | | (2) | |
| Less: Recoveries net of collection costs | | — | | | — | | | (1) | | | (1) | |
| Total ECL charge/(release) to the Income Statement | | 12 | | | 44 | | | 6 | | | 62 | |
| | | | | | | | |
| | | | | | | | |
| At 1 January 2021 | 170,794 | | 17 | | 10,470 | | 131 | | 1,813 | | 132 | | 183,077 | | 280 | |
Transfers from Stage 1 to Stage 2(3) | (5,439) | | (2) | | 5,439 | | 2 | | — | | — | | — | | — | |
Transfers from Stage 2 to Stage 1(3) | 3,782 | | 21 | | (3,782) | | (21) | | — | | — | | — | | — | |
Transfers to Stage 3(3) | (242) | | (2) | | (451) | | (4) | | 693 | | 6 | | — | | — | |
Transfers from Stage 3(3) | 3 | | — | | 353 | | 15 | | (356) | | (15) | | — | | — | |
| Transfers of financial instruments | (1,896) | | 17 | | 1,559 | | (8) | | 337 | | (9) | | — | | — | |
Net ECL remeasurement on stage transfer(4) | — | | (18) | | — | | 10 | | — | | 9 | | — | | 1 | |
Change in economic scenarios(2) | — | | (1) | | — | | (67) | | — | | (12) | | — | | (80) | |
| Changes to model | — | | — | | — | | — | | — | | — | | — | | — | |
New lending and assets purchased(5) | 33,292 | | 6 | | 332 | | 2 | | 1 | | — | | 33,625 | | 8 | |
Redemptions, repayments and assets sold(7) | (25,073) | | (3) | | (1,435) | | (6) | | (332) | | (16) | | (26,840) | | (25) | |
Changes in risk parameters and other movements(6) | 3,115 | | (4) | | 273 | | 26 | | 13 | | (10) | | 3,401 | | 12 | |
Assets written off (7) | — | | — | | — | | — | | (16) | | (5) | | (16) | | (5) | |
| At 31 December 2021 | 180,232 | | 14 | | 11,199 | | 88 | | 1,816 | | 89 | | 193,247 | | 191 | |
| Net movement in the period | 9,438 | | (3) | | 729 | | (43) | | 3 | | (43) | | 10,170 | | (89) | |
| | | | | | | | |
| ECL charge/(release) to the Income Statement | | (3) | | | (43) | | | (38) | | | (84) | |
| Less: Discount unwind | | — | | | — | | | (2) | | | (2) | |
| Less: Recoveries net of collection costs | | — | | | — | | | (1) | | | (1) | |
| Total ECL charge/(release) to the Income Statement | | (3) | | | (43) | | | (41) | | | (87) | |
| | | | | | | | | | | | | | |
| Annual Report 2022 | Santander UK Group Holdings plc 132 |
| | | | | | | | | | | | | | | | | | | | | | | | | | | | | | | | | | | | | | | | | |
| Strategic Report | Sustainability and Responsible Banking | Governance | Risk review | Financial review | Financial
statements | Shareholder
information |
| | | | | | | | | | | | | |
| | | | | | | | | | | | | |
Loan modifications
Forbearance(1)
The following table (audited) sets out the financial assets that were forborne while they had a loss allowance measured at lifetime ECL.
| | | | | | | | |
| 2022 | 2021 |
| £m | £m |
| Financial assets modified in the period: | | |
–Amortised cost before modification | 317 | | 424 | |
–Net modification loss | 7 | | 9 | |
| Financial assets modified since initial recognition: | | |
–Gross carrying amount of financial assets for which the loss allowance changed to 12 months ECL in the period | 91 | | 152 | |
The balances at 31 December 2022 and 31 December 2021, analysed by their staging at the period-end and the forbearance we applied, were:
| | | | | | | | | | | | | | | | | | | | |
| Capitalisation | Term extension | Interest-only | Concessionary interest rate | Total (audited) | Loss allowances |
| 2022 | £m | £m | £m | £m | £m | £m |
| Stage 2 | 311 | 320 | 240 | 6 | 877 | 11 |
| Stage 3 | 299 | 140 | 65 | 190 | 694 | 31 |
| 610 | 460 | 305 | 196 | 1,571 | 42 |
| Proportion of portfolio | 0.3 | % | 0.3 | % | 0.2 | % | 0.1 | % | 0.9 | % | |
| | | | | | |
| 2021 | | | | | | |
| Stage 2 | 388 | 444 | 273 | 4 | 1,109 | 12 |
| Stage 3 | 217 | 75 | 73 | 111 | 476 | 26 |
| 605 | 519 | 346 | 115 | 1,585 | 38 |
| Proportion of portfolio | 0.3 | % | 0.3 | % | 0.2 | % | 0.1 | % | 0.9 | % | |
(1)We base forbearance type on the first forbearance on the accounts.
2022 compared to 2021
In 2022, forbearance activity was stable. The proportion of the mortgage portfolio in forbearance remained flat at 0.9% (2021: 0.9%).
–At 31 December 2022, the proportion of accounts in forbearance for more than six months that had made their last six months’ contractual payments was 85% (2021: 85%).
–The weighted average LTV of all accounts in forbearance was 43% (2021: 32%) compared to the weighted average portfolio LTV of 50% (2021: 35%)
–At 31 December 2022, the carrying value of mortgages classified as multiple forbearance increased slightly to £152m (2021: £148m).
Other loan modifications
From March 2020 to March 2021, we provided mortgage customers with payment holiday terms in line with UK Government and FCA guidance. The scheme has now ceased. The following table provides information on such loan modifications.
| | | | | | | | |
| 2022 | 2021 |
| £m | £m |
| Financial assets modified in the period: | | |
–Amortised cost before modification | — | | 658 | |
| | |
| Financial assets modified since initial recognition: | | |
–Gross carrying amount of financial assets for which the loss allowance changed to 12 months ECL in the period | — | | 8 | |
At 31 December 2022, there were £1.9bn (2021: £2.3bn) of other mortgages on the balance sheet that we had modified since January 2008. At 31 December 2022:
The average LTV was 24% (2021: 27%), and 94% (2021: 95%) of accounts had made their last six months’ contractual payments.
The proportion of accounts that were 90 days or more in arrears was 1.53% (2021: 2.62%).
There were no other loan modifications made in the year.
| | | | | | | | | | | | | | |
| Annual Report 2022 | Santander UK Group Holdings plc 133 |
| | | | | | | | | | | | | | | | | | | | | | | | | | | | | | | | | | | | | | | | | |
| Strategic Report | Sustainability and Responsible Banking | Governance | Risk review | Financial review | Financial
statements | Shareholder
information |
| | | | | | | | | | | | | |
| | | | | | | | | | | | | |
RETAIL BANKING: HOMES – PORTFOLIOS OF PARTICULAR INTEREST
Introduction
We are mainly a residential prime lender and we do not originate sub-prime or second charge mortgages. Despite that, some types of mortgages have higher risks and others stand out for different reasons. These are:
| | | | | |
| Product | Description |
| Interest-only loans and part interest-only, part repayment loans | With an interest-only mortgage, the customer pays interest every month but the principal is only repaid at the end of the mortgage term. Some mortgages have a part that is interest-only, with the rest being a normal repayment mortgage. Customers with part interest-only, part repayment mortgages still have to pay back a lump sum at the end of their mortgage for the interest-only part. This means these loans have a higher credit risk as we depend on the customers to pay back a lump sum. We design new account LTV maximums to mitigate this risk. We also make sure the customer has a plausible repayment plan before we lend to them and stays on track for the loan term.
We mitigate the risk from new interest-only mortgages by having lower maximum LTVs. For most applicants, the maximum LTV is 50%. For high net worth customers, it can be up to 75%. When a customer plans to repay their mortgage by selling the property, we require a minimum equity buffer of £250k. We also remind customers that they have to arrange to repay the principal at the end of the mortgage. We send them messages with their annual mortgage statements, and we contact them throughout the mortgage term to encourage them to tell us how they plan to repay. We increase the frequency of contact as the loan approaches maturity. If customers know they will not be able to repay their mortgage when it ends, or if their mortgage has already passed the date when it should have ended, we talk to them. If we think it is in their interests and they can afford it, we look at other ways to manage it, such as turning the mortgage into a repayment one and extending it. If the customer is waiting for their way to repay it, such as an investment plan, to mature, we may permit an extension. |
| Flexible loans | Flexible mortgages allow customers to pay more or less than their usual amount each month, or even to take ‘payment holidays’ when they pay nothing at all. There are conditions on when and how much customers can draw down, and they do not have to take or draw down the whole loan all at once. A customer can ask us to raise their credit limit, but that means we will go through our full credit approval process. We can also lower a customer’s credit limit at any time, so it never goes above 90% of the property’s current market value. We no longer offer flexible loans for new mortgages. This is an area of interest if any customers might be using these facilities to self-forbear, such as regularly drawing down small amounts. We reflect signs that the credit risk has significantly increased in our ECL calculations. |
| Loans with an LTV >100% | In some cases, property prices have fallen, so mortgages we gave in the past with lower LTVs now have LTVs greater than 100%. Where the mortgage balance is more than the property is now worth, we cannot recover the full value of the loan by repossessing and selling the property. This means there is a higher credit risk on these loans so we monitor them as part of our assessment of ongoing portfolio performance. We design new account LTV maximums to mitigate an increase in accounts with an LTV >100%. |
| Buy-to-Let (BTL) loans | We have specific policies for BTL and focus on non-professional landlords. We have prudent lending criteria and the maximum LTV is 75%. The first applicant must earn a minimum of £25,000 per year, and we require proof of income in all cases. We also use a BTL affordability rate as part of our lending assessment. This means that the rental income must cover the monthly mortgage interest payments by a prescribed amount when calculated using a stressed interest rate. We regularly review the prescribed amount and adjust it as needed. |
Climate change
The value of property collateral for mortgages might be affected by physical impacts related to the frequency and scale of extreme weather events, such as flood and subsidence risk or changing environmental performance standards for property. In 2022 we reviewed the proportion of mortgage loans subject to flood and subsidence risk and concluded that the risk was not material. The terms of our mortgage lending require homeowners to buy suitable insurance which transfers the majority of the risk to asset valuations to third party insurers.
| | | | | | | | | | | | | | |
| Annual Report 2022 | Santander UK Group Holdings plc 134 |
| | | | | | | | | | | | | | | | | | | | | | | | | | | | | | | | | | | | | | | | | |
| Strategic Report | Sustainability and Responsible Banking | Governance | Risk review | Financial review | Financial
statements | Shareholder
information |
| | | | | | | | | | | | | |
| | | | | | | | | | | | | |
Credit performance (audited)
| | | | | | | | | | | | | | | | | | | | | | | |
| | Portfolio of particular interest(1) | |
| Total | Interest-only | Part interest-only, part repayment (2) | Flexible | LTV >100% | Buy-to-let | Other
portfolio |
| 2022 | £m | £m | £m | £m | £m | £m | £m |
| Mortgage portfolio | 187,141 | 41,098 | 13,759 | 6,765 | 372 | 16,799 | 129,299 |
–Stage 1 | 171,733 | 35,957 | 12,380 | 5,713 | 218 | 15,884 | 120,683 |
–Stage 2 | 13,576 | 4,265 | 1,161 | 839 | 102 | 876 | 7,916 |
–Stage 3 | 1,832 | 876 | 218 | 213 | 52 | 39 | 700 |
| Stage 3 ratio | 0.99 | % | 2.15 | % | 1.60 | % | 3.45 | % | 13.91 | % | 0.23 | % | 0.54 | % |
| Properties in possession | 47 | 18 | 8 | 3 | 7 | 1 | 16 |
| | | | | | | |
| Balance weighted LTV (indexed) | 50 | % | 47 | % | 49 | % | 36 | % | 117 | % | 58 | % | 52 | % |
| | | | | | | |
| 2021 | | | | | | | |
| Mortgage portfolio | 177,297 | 40,906 | 13,865 | 8,549 | 531 | 14,893 | 118,874 |
–Stage 1 | 164,381 | 36,459 | 12,614 | 7,509 | 357 | 14,363 | 111,947 |
–Stage 2 | 11,118 | 3,630 | 1,024 | 796 | 109 | 489 | 6,225 |
–Stage 3 | 1,798 | 817 | 227 | 244 | 65 | 41 | 702 |
| Stage 3 ratio | 1.02 | % | 2.02 | % | 1.64 | % | 3.06 | % | 12.29 | % | 0.27 | % | 0.59 | % |
| Properties in possession | 2 | 1 | 1 | 0 | 1 | — | 0 |
| Balance weighted LTV (indexed) | 52 | % | 48 | % | 52 | % | 39 | % | 118 | % | 61 | % | 53 | % |
(1)Where a loan falls into more than one category, we include it in all the categories that apply. As a result, the sum of the mortgages in the segments of particular interest and the other portfolio does not agree to the total mortgage portfolio.
(2)Mortgage balance includes both the interest-only part of £10,192m (2021: £10,270m) and the non-interest-only part of the loan.
2022 compared to 2021
–In 2022, the combined total proportion of interest-only loans, part interest-only, part repayment loans and flexible loans remained stable.
–BTL mortgage balances increased £1.9bn to £16.8bn (2021: £14.9bn) driven by continued focus in growing this portfolio. In 2022, the balance weighted average LTV of mortgage total new BTL lending was 67% (2021: 68%)
Forbearance(1) (audited)
The balances at 31 December 2022 and 31 December 2021 were:
| | | | | | | | | | | | | | |
| Interest-only(2) | Flexible | LTV >100% | Buy-to-Let |
| 2022 | £m | £m | £m | £m |
| Total | 292 | | 36 | | 10 | | 15 | |
–Stage 2 | 112 | | 19 | | 1 | | 11 | |
–Stage 3 | 180 | | 17 | | 9 | | 4 | |
| | | | |
| 2021 | | | | |
| Total | 419 | | 35 | | 13 | | 11 | |
–Stage 2 | 280 | | 24 | | 3 | | 8 | |
–Stage 3 | 139 | | 11 | | 10 | | 3 | |
(1)Where a loan falls into more than one category, we have included it in all the categories that apply.
(2)Comprises full interest-only loans and part interest-only, part repayment loans.
2022 compared to 2021
Levels of forbearance on interest-only accounts decreased in 2022. The higher levels of forbearance on interest-only accounts in 2021 were driven by the availability of a one year deferral of repaying capital for maturing or past maturity interest-only customers impacted or potentially impacted by Covid-19. This was offered in line with FCA guidance. The scheme closed in 2021.
| | | | | | | | | | | | | | |
| Annual Report 2022 | Santander UK Group Holdings plc 135 |
| | | | | | | | | | | | | | | | | | | | | | | | | | | | | | | | | | | | | | | | | |
| Strategic Report | Sustainability and Responsible Banking | Governance | Risk review | Financial review | Financial
statements | Shareholder
information |
| | | | | | | | | | | | | |
| | | | | | | | | | | | | |
RETAIL BANKING: EVERYDAY BANKING – CREDIT RISK REVIEW
Movement in total exposures and the corresponding ECL (audited)
The following tables show changes in total on and off-balance sheet exposures and ECL in the period. The footnotes to the Santander UK group level table on page 128 also apply to these tables. | | | | | | | | | | | | | | | | | | | | | | | | | | |
| Stage 1 | Stage 2 | Stage 3 | Total |
| Exposures ⁽¹⁾ | ECL | Exposures ⁽¹⁾ | ECL | Exposures ⁽¹⁾ | ECL | Exposures ⁽¹⁾ | ECL |
| £m | £m | £m | £m | £m | £m | £m | £m |
| At 1 January 2022 | 20,682 | | 51 | | 698 | | 98 | | 352 | | 49 | | 21,732 | | 198 | |
Transfers from Stage 1 to Stage 2(3) | (841) | | (7) | | 840 | | 8 | | — | | — | | (1) | | 1 | |
Transfers from Stage 2 to Stage 1(3) | 155 | | 22 | | (155) | | (22) | | — | | — | | — | | — | |
Transfers to Stage 3(3) | (158) | | (1) | | (56) | | (7) | | 214 | | 7 | | — | | (1) | |
Transfers from Stage 3(3) | 7 | | — | | 14 | | 4 | | (21) | | (5) | | — | | (1) | |
| Transfers of financial instruments | (837) | | 14 | | 643 | | (17) | | 193 | | 2 | | (1) | | (1) | |
Net ECL remeasurement on stage transfer(4) | — | | (22) | | — | | 91 | | — | | 30 | | — | | 99 | |
Change in economic scenarios(2) | — | | (2) | | — | | 26 | | — | | — | | — | | 24 | |
| Changes to model | — | | — | | — | | — | | — | | — | | — | | — | |
New lending and assets purchased(5) | 2,312 | | 12 | | 253 | | 38 | | 16 | | 10 | | 2,581 | | 60 | |
Redemptions, repayments and assets sold (7) | (2,829) | | (11) | | (176) | | (10) | | (483) | | (5) | | (3,488) | | (26) | |
Changes in risk parameters and other movements(6) | 249 | | 1 | | (62) | | (35) | | 324 | | 83 | | 511 | | 49 | |
Assets written off(7) | — | | — | | — | | — | | (122) | | (110) | | (122) | | (110) | |
| At 31 December 2022 | 19,577 | | 43 | | 1,356 | | 191 | | 280 | | 59 | | 21,213 | | 293 | |
| Net movement in the period | (1,105) | | (8) | | 658 | | 93 | | (72) | | 10 | | (519) | | 95 | |
| | | | | | | | |
| Charge/(release) to the Income Statement | | (8) | | | 93 | | | 120 | | | 205 | |
| Less: Discount unwind | | — | | | — | | | (4) | | | (4) | |
| Less: Recoveries net of collection costs | | — | | | — | | | 1 | | | 1 | |
| Total ECL charge/(release) to the Income Statement | | (8) | | | 93 | | | 117 | | | 202 | |
| | | | | | | | |
| | | | | | | | |
| At 1 January 2021 | 21,089 | | 57 | | 791 | | 201 | | 105 | | 50 | | 21,985 | | 308 | |
Transfers from Stage 1 to Stage 2(3) | (214) | | (2) | | 214 | | 2 | | — | | — | | — | | — | |
Transfers from Stage 2 to Stage 1(3) | 418 | | 81 | | (418) | | (81) | | — | | — | | — | | — | |
Transfers to Stage 3(3) | (284) | | (1) | | (36) | | (10) | | 320 | | 11 | | — | | — | |
Transfers from Stage 3(3) | 5 | | 1 | | 11 | | 5 | | (16) | | (6) | | — | | — | |
| Transfers of financial instruments: | (75) | | 79 | | (229) | | (84) | | 304 | | 5 | | — | | — | |
Net ECL remeasurement on stage transfer(4) | — | | (78) | | — | | 39 | | — | | 23 | | — | | (16) | |
Change in economic scenarios(2) | — | | (4) | | — | | (19) | | — | | — | | — | | (23) | |
| Changes to model | — | | — | | — | | — | | — | | — | | — | | — | |
New lending and assets purchased(5) | 2,150 | | 13 | | 84 | | 12 | | 9 | | 4 | | 2,243 | | 29 | |
Redemptions, repayments and assets sold(7) | (3,023) | | (11) | | (101) | | (16) | | (29) | | (5) | | (3,153) | | (32) | |
Changes in risk parameters and other movements(6) | 541 | | (6) | | 153 | | (34) | | 77 | | 74 | | 771 | | 34 | |
Assets written off(7) | — | | 1 | | — | | (1) | | (114) | | (102) | | (114) | | (102) | |
| At 31 December 2021 | 20,682 | | 51 | | 698 | | 98 | | 352 | | 49 | | 21,732 | | 198 | |
| Net movement in the period | (407) | | (6) | | (93) | | (103) | | 247 | | (1) | | (253) | | (110) | |
| | | | | | | | |
| Charge/(release) to the Income Statement | | (7) | | | (102) | | | 101 | | | (8) | |
| Less: Discount unwind | | — | | | — | | | (4) | | | (4) | |
| Less: Recoveries net of collection costs | | — | | | — | | | (51) | | | (51) | |
| Total ECL charge/(release) to the Income Statement | | (7) | | | (102) | | | 46 | | | (63) | |
| | | | | | | | | | | | | | |
| Annual Report 2022 | Santander UK Group Holdings plc 136 |
| | | | | | | | | | | | | | | | | | | | | | | | | | | | | | | | | | | | | | | | | |
| Strategic Report | Sustainability and Responsible Banking | Governance | Risk review | Financial review | Financial
statements | Shareholder
information |
| | | | | | | | | | | | | |
| | | | | | | | | | | | | |
Credit performance (audited)
| | | | | | | | | | | | | | | | | | | | |
| Business banking | Other unsecured | |
| Personal
loans | Credit
cards | Overdrafts | Total other unsecured | Total |
| 2022 | £m | £m | £m | £m | £m | £m |
| Loans and advances to customers of which: | 2,519 | 1,982 | 2,558 | 461 | 5,001 | 7,520 |
–Stage 1 | 2,223 | 1,730 | 2,192 | 155 | 4,077 | 6,300 |
–Stage 2 | 133 | 231 | 329 | 282 | 842 | 975 |
–Stage 3 | 163 | 21 | 37 | 24 | 82 | 245 |
Loss allowances(1) | 19 | 62 | 130 | 82 | 274 | 293 |
| Stage 3 undrawn exposures | 3 | | | | 32 | 35 |
| Stage 3 ratio | 6.58 | % | | | | 2.27 | % | 3.71 | % |
| Gross write-offs | 11 | | | | 99 | 110 |
| | | | | | |
| 2021 | | | |
| Loans and advances to customers of which: | 3,532 | 2,000 | 2,341 | 438 | 4,779 | 8,311 |
–Stage 1 | 3,076 | 1,910 | 2,125 | 299 | 4,334 | 7,410 |
–Stage 2 | 201 | 73 | 181 | 120 | 374 | 575 |
–Stage 3 | 255 | 17 | 35 | 19 | 71 | 326 |
Loss allowances(1) | 22 | 47 | 89 | 40 | 176 | 198 |
| Stage 3 undrawn exposures | — | | | | 26 | 26 |
| Stage 3 ratio | 7.20 | % | | | | 2.03 | % | 4.23 | % |
| Gross write-offs | 6 | | | | 97 | 103 |
(1)The ECL allowance is for both on and off–balance sheet exposures
2022 compared to 2021
Business Banking balances were lower, mainly due to reductions in the Bounce back loans (BBL) portfolio. Stage 3 assets reduced, although this had a minimal impact on write offs as the reduction in assets was mainly due to the BBLs, where the 100% government guarantee was claimed. Other unsecured balances increased slightly in 2022. However, Stage 2 unsecured assets increased by125%, reflecting the current economic environment. This is yet to impact Stage 3 or write offs, which did not increase.
| | | | | | | | | | | | | | |
| Annual Report 2022 | Santander UK Group Holdings plc 137 |
| | | | | | | | | | | | | | | | | | | | | | | | | | | | | | | | | | | | | | | | | |
| Strategic Report | Sustainability and Responsible Banking | Governance | Risk review | Financial review | Financial
statements | Shareholder
information |
| | | | | | | | | | | | | |
| | | | | | | | | | | | | |
Loan modifications
Forbearance
The following table (audited) sets out the financial assets that were forborne while they had a loss allowance measured at lifetime ECL.
| | | | | | | | | | | | | | |
| Business banking | Credit cards | Overdrafts | Total |
| 2022 | £m | £m | £m | £m |
| Financial assets modified in the period: | | | | |
–Amortised cost before modification | — | | 7 | | 7 | | 14 | |
–Net modification gain | — | | 7 | | 6 | | 13 | |
| Financial assets modified since initial recognition: | | | | |
–Gross carrying amount of financial assets for which the loss allowance changed to 12m ECL in the period | — | | 3 | | 1 | | 4 | |
| | | | |
| 2021 | | | | |
| Financial assets modified in the period: | | | | |
–Amortised cost before modification | — | | 13 | | 9 | | 22 | |
–Net modification gain | — | | 5 | | 4 | | 9 | |
| Financial assets modified since initial recognition: | | | | |
–Gross carrying amount of financial assets for which the loss allowance changed to 12m ECL in the period | — | | 4 | | 2 | | 6 | |
The balances (audited) at 31 December 2022 and 31 December 2021 were:
| | | | | | | | | | | | | | | | | | | | |
| | Other unsecured | |
| Business banking | Personal loans | Credit cards | Overdrafts | Total other
unsecured | Total |
| 2022 | £m | £m | £m | £m | £m | £m |
| Total | 3 | | 1 | | 34 | | 16 | | 51 | | 54 | |
–Stage 2 | — | | 1 | | 6 | | 2 | | 9 | | 9 | |
–Stage 3 | 3 | | — | | 28 | | 14 | | 42 | | 45 | |
| | | | | | |
| 2021 | | | | | | |
| Total | 2 | | 1 | | 38 | | 15 | | 54 | | 56 | |
–Stage 2 | — | | — | | 7 | | 3 | | 10 | | 10 | |
–Stage 3 | 2 | | 1 | | 31 | | 12 | | 44 | | 46 | |
Other loan modifications
From March 2020 to March 2021, we provided business banking and other unsecured lending customers with payment holiday terms. The following table provides information on such loan modifications.
| | | | | | | | | | | |
| Business banking | Other unsecured | Total |
| 2022 | £m | £m | £m |
| Financial assets modified in the period: | | | |
–Amortised cost before modification | — | | — | | — | |
–Net modification gain | — | | — | | — | |
| Financial assets modified since initial recognition: | | | |
–Gross carrying amount of financial assets for which the loss allowance changed to 12m ECL in the period | — | | — | | — | |
| | | |
| 2021 | | | |
| Financial assets modified in the period: | | | |
–Amortised cost before modification | — | | 9 | | 9 | |
–Net modification gain | — | | — | | — | |
| Financial assets modified since initial recognition: | | | |
–Gross carrying amount of financial assets for which the loss allowance changed to 12m ECL in the period | — | | 1 | | 1 | |
| | | | | | | | | | | | | | |
| Annual Report 2022 | Santander UK Group Holdings plc 138 |
| | | | | | | | | | | | | | | | | | | | | | | | | | | | | | | | | | | | | | | | | |
| Strategic Report | Sustainability and Responsible Banking | Governance | Risk review | Financial review | Financial
statements | Shareholder
information |
| | | | | | | | | | | | | |
| | | | | | | | | | | | | |
CONSUMER FINANCE – CREDIT RISK REVIEW
Movement in total exposures and the corresponding ECL (audited)
The following table shows changes in total on and off-balance sheet exposures and ECL in the period. The footnotes to the Santander UK group level analysis on page 128 also apply to this table. | | | | | | | | | | | | | | | | | | | | | | | | | | |
| Stage 1 | Stage 2 | Stage 3 | Total |
| Exposures ⁽¹⁾ | ECL | Exposures ⁽¹⁾ | ECL | Exposures ⁽¹⁾ | ECL | Exposures ⁽¹⁾ | ECL |
| £m | £m | £m | £m | £m | £m | £m | £m |
| At 1 January 2022 | 5,074 | | 18 | | 200 | | 17 | | 24 | | 17 | | 5,298 | | 52 | |
Transfers from Stage 1 to Stage 2(3) | (232) | | (2) | | 232 | | 2 | | — | | — | | — | | — | |
Transfers from Stage 2 to Stage 1(3) | 68 | | 2 | | (68) | | (2) | | — | | — | | — | | — | |
Transfers to Stage 3(3) | (13) | | — | | (10) | | (2) | | 22 | | 2 | | (1) | | — | |
Transfers from Stage 3(3) | — | | — | | 1 | | 1 | | (1) | | (1) | | — | | — | |
| Transfers of financial instruments | (177) | | — | | 155 | | (1) | | 21 | | 1 | | (1) | | — | |
Net ECL remeasurement on stage transfer(4) | — | | (2) | | — | | 9 | | — | | 10 | | — | | 17 | |
Change in economic scenarios(2) | — | | — | | — | | — | | — | | — | | — | | — | |
| Changes to model | — | | — | | — | | — | | — | | — | | — | | — | |
New lending and assets purchased(5) | 2,225 | | 7 | | 110 | | 8 | | 3 | | 2 | | 2,338 | | 17 | |
Redemptions, repayments and assets sold(7) | (1,232) | | (5) | | (77) | | (7) | | — | | — | | (1,309) | | (12) | |
Changes in risk parameters and other movements(6) | (529) | | 1 | | (38) | | 1 | | 18 | | 10 | | (549) | | 12 | |
Assets written off(7) | — | | — | | — | | — | | (37) | | (19) | | (37) | | (19) | |
| At 31 December 2022 | 5,361 | | 19 | | 350 | | 27 | | 29 | | 21 | | 5,740 | | 67 | |
| Net movement in the period | 287 | | 1 | | 150 | | 10 | | 5 | | 4 | | 442 | | 15 | |
| | | | | | | | |
| Charge/(release) to the Income Statement | | 1 | | | 10 | | | 23 | | | 34 | |
| Less: Discount unwind | | — | | | — | | | (2) | | | (2) | |
| Less: Recoveries net of collection costs | | — | | | — | | | (5) | | | (5) | |
| Total ECL charge/(release) to the Income Statement | | 1 | | | 10 | | | 16 | | | 27 | |
| | | | | | | | |
| | | | | | | | |
| At 1 January 2021 | 7,824 | | 44 | | 379 | | 37 | | 58 | | 37 | | 8,261 | | 118 | |
Transfers from Stage 1 to Stage 2(3) | (98) | | (1) | | 98 | | 1 | | — | | — | | — | | — | |
Transfers from Stage 2 to Stage 1(3) | 105 | | 6 | | (105) | | (6) | | — | | — | | — | | — | |
Transfers to Stage 3(3) | (8) | | — | | (8) | | (2) | | 16 | | 2 | | — | | — | |
Transfers from Stage 3(3) | 5 | | — | | 3 | | 2 | | (8) | | (2) | | — | | — | |
| Transfers of financial instruments: | 4 | | 5 | | (12) | | (5) | | 8 | | — | | — | | — | |
Net ECL remeasurement on stage transfer(4) | — | | — | | — | | — | | — | | — | | — | | — | |
Change in economic scenarios(2) | — | | — | | — | | (2) | | — | | — | | — | | (2) | |
| Changes to model | — | | — | | — | | — | | — | | — | | — | | — | |
New lending and assets purchased(5) | 2,212 | | 6 | | 70 | | 4 | | 3 | | 2 | | 2,285 | | 12 | |
Redemptions, repayments and assets sold(7) | (4,063) | | (19) | | (142) | | (6) | | (19) | | (3) | | (4,224) | | (28) | |
Changes in risk parameters and other movements(6) | (903) | | (18) | | (95) | | (12) | | 11 | | 6 | | (987) | | (24) | |
Assets written off(7) | — | | — | | — | | 1 | | (37) | | (25) | | (37) | | (24) | |
| At 31 December 2021 | 5,074 | | 18 | | 200 | | 17 | | 24 | | 17 | | 5,298 | | 52 | |
| Net movement in the period | (2,750) | | (26) | | (179) | | (20) | | (34) | | (20) | | (2,963) | | (66) | |
| | | | | | | | |
| Charge/(release) to the Income Statement | | (26) | | | (21) | | | 5 | | | (42) | |
| Less: Discount unwind | | — | | | — | | | — | | | — | |
| Less: Recoveries net of collection costs | | — | | | — | | | 9 | | | 9 | |
| Total ECL charge/(release) to the Income Statement | | (26) | | | (21) | | | 14 | | | (33) | |
| | | | | | | | | | | | | | |
| Annual Report 2022 | Santander UK Group Holdings plc 139 |
| | | | | | | | | | | | | | | | | | | | | | | | | | | | | | | | | | | | | | | | | |
| Strategic Report | Sustainability and Responsible Banking | Governance | Risk review | Financial review | Financial
statements | Shareholder
information |
| | | | | | | | | | | | | |
| | | | | | | | | | | | | |
Credit performance (audited)
| | | | | | | | |
| 2022 | 2021 |
| £m | £m |
| Loans and advances to customers of which: | 5,384 | 4,984 |
–Stage 1 | 5,005 | 4,760 |
–Stage 2 | 350 | 200 |
–Stage 3 | 29 | 24 |
Loss allowances(1) | 67 | 52 |
| Stage 3 undrawn exposures | — | — |
| Stage 3 ratio | 0.54 | % | 0.49 | % |
| Gross write offs | 19 | 25 |
(1)The ECL allowance is for both on and off–balance sheet exposures.
2022 compared to 2021
In 2022, we maintained our prudent Consumer (auto) finance underwriting criteria. The product mix was broadly unchanged, with wholesale balances increasing slightly.
At 31 December 2022, Consumer (auto) finance gross lending (new business) was £2,519m( 2021: £2,383m). Wholesale loans (Stock finance) to car dealerships at 31 December 2022 were approximately 10.1% (2021: 7.3%) of the Consumer loan book. At 31 December 2022, the average Consumer (auto) finance loan size was £17,256 (2021: £16,182).
The risk profile was stable in terms of our credit scoring acceptance policies. The overall risk performance was good with the vast majority of customers paying.
Loan modifications
Forbearance
There were no accounts in forbearance at 31 December 2022 and 31 December 2021.
Other loan modifications
From March 2020 to March 2021, we provided Consumer Finance customers with payment holiday terms. The following table provides information on such loan modifications.
| | | | | | | | |
| 2022 | 2021 |
| £m | £m |
| Financial assets modified in the period: | | |
–Amortised cost before modification | — | | 54 | |
–Net modification loss | — | | — | |
| Financial assets modified since initial recognition: | | |
–Gross carrying amount of financial assets for which the ECL allowance changed to 12-month measurement in the period | 95 | | 226 | |
| | | | | | | | | | | | | | |
| Annual Report 2022 | Santander UK Group Holdings plc 140 |
| | | | | | | | | | | | | | | | | | | | | | | | | | | | | | | | | | | | | | | | | |
| Strategic Report | Sustainability and Responsible Banking | Governance | Risk review | Financial review | Financial
statements | Shareholder
information |
| | | | | | | | | | | | | |
| | | | | | | | | | | | | |
CORPORATE & COMMERCIAL BANKING – CREDIT RISK REVIEW
Movement in total exposures and the corresponding ECL (audited)
The following tables show changes in total on and off-balance sheet exposures and ECL in the period. The footnotes to the Santander UK group level table on page 128 also apply to these tables. | | | | | | | | | | | | | | | | | | | | | | | | | | |
| Stage 1 | Stage 2 | Stage 3 | Total |
Exposures(1) | ECL | Exposures(1) | ECL | Exposures(1) | ECL | Exposures(1) | ECL |
| £m | £m | £m | £m | £m | £m | £m | £m |
| At 1 January 2022 | 20,604 | | 50 | | 5,914 | | 127 | | 827 | | 248 | | 27,345 | | 425 | |
Transfers from Stage 1 to Stage 2(3) | (2,195) | | (14) | | 2,195 | | 14 | | — | | — | | — | | — | |
Transfers from Stage 2 to Stage 1(3) | 4,023 | | 92 | | (4,023) | | (92) | | — | | — | | — | | — | |
Transfers to Stage 3(3) | (172) | | (1) | | (111) | | (13) | | 283 | | 14 | | — | | — | |
Transfers from Stage 3(3) | — | | — | | 463 | | 135 | | (463) | | (135) | | — | | — | |
| Transfers of financial instruments | 1,656 | | 77 | | (1,476) | | 44 | | (180) | | (121) | | — | | — | |
Net ECL remeasurement on stage transfer(4) | — | | (72) | | — | | (41) | | — | | 61 | | — | | (52) | |
Change in economic scenarios(2) | — | | 38 | | — | | 76 | | — | | — | | — | | 114 | |
| Changes to model | — | | — | | — | | — | | — | | — | | — | | — | |
New lending and assets purchased(5) | 8,629 | | 16 | | 228 | | 19 | | 43 | | 12 | | 8,900 | | 47 | |
Redemptions, repayments and assets sold(7) | (9,019) | | (15) | | (584) | | (32) | | (53) | | (17) | | (9,656) | | (64) | |
Changes in risk parameters and other movements(6) | 1,968 | | (11) | | (194) | | (27) | | 21 | | (14) | | 1,795 | | (52) | |
Assets written off (7) | — | | — | | — | | — | | (86) | | (24) | | (86) | | (24) | |
| At 31 December 2022 | 23,838 | | 83 | | 3,888 | | 166 | | 572 | | 145 | | 28,298 | | 394 | |
| Net movement in the period | 3,234 | | 33 | | (2,026) | | 39 | | (255) | | (103) | | 953 | | (31) | |
| | | | | | | | |
| ECL charge/(release) to the Income Statement | | 33 | | | 39 | | | (79) | | | (7) | |
| Less: Discount unwind | | — | | | — | | | (3) | | | (3) | |
| Less: Recoveries net of collection costs | | — | | | — | | | 42 | | | 42 | |
| Total ECL charge/(release) to the Income Statement | | 33 | | | 39 | | | (40) | | | 32 | |
| | | | | | | | | | | | | | | | | | | | | | | | | | |
| Stage 1 | Stage 2 | Stage 3 | Total |
| Exposures(1) | ECL | Exposures(1) | ECL | Exposures(1) | ECL | Exposures(1) | ECL |
| £m | £m | £m | £m | £m | £m | £m | £m |
| At 1 January 2021 | 20,952 | | 77 | | 6,311 | | 199 | | 1,020 | | 350 | | 28,283 | | 626 | |
Transfers from Stage 1 to Stage 2(3) | (1,055) | | (4) | | 1,055 | | 4 | | — | | — | | — | | — | |
Transfers from Stage 2 to Stage 1(3) | 1,579 | | 60 | | (1,579) | | (60) | | — | | — | | — | | — | |
Transfers to Stage 3(3) | (38) | | — | | (37) | | (3) | | 75 | | 3 | | — | | — | |
Transfers from Stage 3(3) | 1 | | — | | 88 | | 40 | | (89) | | (40) | | — | | — | |
| Transfers of financial instruments | 487 | | 56 | | (473) | | (19) | | (14) | | (37) | | — | | — | |
Net ECL remeasurement on stage transfer(4) | — | | (39) | | — | | (22) | | — | | 31 | | — | | (30) | |
Change in economic scenarios(2) | — | | (2) | | — | | (62) | | — | | (1) | | — | | (65) | |
| Changes to model | — | | — | | — | | — | | — | | — | | — | | — | |
New lending and assets purchased(5) | 13,208 | | 6 | | 450 | | 8 | | 12 | | 13 | | 13,670 | | 27 | |
Redemptions, repayments and assets sold(7) | (16,644) | | (15) | | (1,357) | | (17) | | (139) | | (42) | | (18,140) | | (74) | |
Changes in risk parameters and other movements(6) | 2,601 | | (33) | | 983 | | 40 | | 54 | | (7) | | 3,638 | | — | |
Assets written off (7) | — | | — | | — | | — | | (106) | | (59) | | (106) | | (59) | |
| At 31 December 2021 | 20,604 | | 50 | | 5,914 | | 127 | | 827 | | 248 | | 27,345 | | 425 | |
| Net movement in the period | (348) | | (27) | | (397) | | (72) | | (193) | | (102) | | (938) | | (201) | |
| | | | | | | | |
| ECL charge/(release) to the Income Statement | | (27) | | | (72) | | | (43) | | | (142) | |
| Less: Discount unwind | | — | | | — | | | (4) | | | (4) | |
| Less: Recoveries net of collection costs | | — | | | — | | | 56 | | | 56 | |
| Total ECL charge/(release) to the Income Statement | | (27) | | | (72) | | | 9 | | | (90) | |
| | | | | | | | | | | | | | |
| Annual Report 2022 | Santander UK Group Holdings plc 141 |
| | | | | | | | | | | | | | | | | | | | | | | | | | | | | | | | | | | | | | | | | |
| Strategic Report | Sustainability and Responsible Banking | Governance | Risk review | Financial review | Financial
statements | Shareholder
information |
| | | | | | | | | | | | | |
| | | | | | | | | | | | | |
Committed exposures
Credit risk arises on both on- and off–balance sheet transactions, e.g. guarantees. Therefore, committed exposures are typically higher than asset balances. However, committed exposures can be smaller than asset balances due to netting.
Rating distribution (audited)
These tables show our credit risk exposure according to our internal rating scale (see ‘Credit quality’ in the ‘Santander UK group level – credit risk review’ section) for each portfolio. On this scale, the higher the rating, the better the quality of the counterparty.
| | | | | | | | | | | | | | | | | | | | | | | | | | | | | |
| Santander UK risk grade | |
| 9 | 8 | 7 | 6 | 5 | 4 | 3 to 1 | Other(1) | Total |
| 2022 | £m | £m | £m | £m | £m | £m | £m | £m | £m |
| | | | | | | | | |
| SME and mid corporate | — | | 336 | | 923 | | 2,341 | | 3,299 | | 5,327 | | 1,791 | | 106 | | 14,123 | |
| Commercial Real Estate | — | | 2 | | 111 | | 2,044 | | 2,128 | | 936 | | 185 | | 1 | | 5,407 | |
| Social Housing | 44 | | 4,028 | | 3,956 | | 6 | | — | | — | | — | | 1 | | 8,035 | |
| 44 | | 4,366 | | 4,990 | | 4,391 | | 5,427 | | 6,263 | | 1,976 | | 108 | | 27,565 | |
| Of which: | | | | | | | | | |
| Stage 1 | 39 | | 4,364 | | 4,944 | | 4,202 | | 4,773 | | 4,289 | | 386 | | 108 | | 23,105 | |
| Stage 2 | 5 | | 2 | | 46 | | 189 | | 654 | | 1,974 | | 1,018 | | — | | 3,888 | |
| Stage 3 | — | | — | | — | | — | | — | | — | | 572 | | — | | 572 | |
| | | | | | | | | |
| 2021 | | | | | | | | | |
| | | | | | | | | |
| SME and mid corporate | — | | 659 | | 714 | | 2,397 | | 3,067 | | 5,545 | | 2,207 | | 66 | | 14,655 | |
| Commercial Real Estate | — | | 126 | | 137 | | 1,471 | | 2,228 | | 638 | | 249 | | — | | 4,849 | |
| Social Housing | 52 | | 3,961 | | 3,759 | | 9 | | — | | 53 | | — | | 106 | | 7,940 | |
| 52 | | 4,746 | | 4,610 | | 3,877 | | 5,295 | | 6,236 | | 2,456 | | 172 | | 27,444 | |
| Of which: | | | | | | | | | |
| Stage 1 | 52 | | 3,809 | | 4,359 | | 3,604 | | 4,192 | | 4,138 | | 380 | | 169 | | 20,703 | |
| Stage 2 | — | | 937 | | 251 | | 239 | | 1,086 | | 2,005 | | 1,509 | | (114) | | 5,913 | |
| Stage 3 | — | | — | | — | | 34 | | 17 | | 93 | | 567 | | 117 | | 828 | |
(1)Smaller exposures mainly in the commercial mortgage portfolio. We use scorecards for them, instead of a rating model.
2022 compared to 2021
In 2022, committed exposure was substantially unchanged, with an increase in the CRE portfolio of 12%., largely offset by reductions in SME and mid corporate. The rating distribution improved in the CRE portfolios following recovery in the credit quality of a number of customers initially downgraded as a result of Covid-19. It has remained broadly stable in SME and mid corporate.
Geographical distribution (audited)
We typically classify geographical location according to the counterparty’s country of domicile unless a full risk transfer guarantee is in place, in which case we use the guarantor’s country of domicile instead.
| | | | | | | | | | | | | | | | | | | | | | | | | | | | | | | | | | | |
| 2022 | | 2021 |
| UK | Europe | US | Rest of World | Total | | UK | Europe | US | Rest of World | Total |
| £m | £m | £m | £m | £m | | £m | £m | £m | £m | £m |
| | | | | | | | | | | |
| SME and mid corporate | 14,091 | | 32 | | — | | — | | 14,123 | | | 14,612 | | 43 | | — | | — | | 14,655 | |
| Commercial Real Estate | 5,407 | | — | | — | | — | | 5,407 | | | 4,849 | | — | | — | | — | | 4,849 | |
| Social Housing | 8,035 | | — | | — | | — | | 8,035 | | | 7,940 | | — | | — | | — | | 7,940 | |
| 27,533 | | 32 | | — | | — | | 27,565 | | | 27,401 | | 43 | | — | | 0 | | 27,444 | |
Credit risk mitigation (audited)
| | | | | | | | | | | |
| Gross exposure | Collateral | Net exposure |
| Stage 3 | Stage 3 | Stage 3 |
| 2022 | £m | £m | £m |
| | | |
| SME and mid corporate | 513 | | 169 | | 344 | |
| Commercial Real Estate | 59 | | 30 | | 29 | |
| 572 | | 199 | | 373 | |
| | | | | | | | | | | |
| 2021 | | | |
| | | |
| SME and mid corporate | 747 | | 307 | | 440 | |
| Commercial Real Estate | 81 | | 37 | | 44 | |
| 828 | | 344 | | 484 | |
| | | | | | | | | | | | | | |
| Annual Report 2022 | Santander UK Group Holdings plc 142 |
| | | | | | | | | | | | | | | | | | | | | | | | | | | | | | | | | | | | | | | | | |
| Strategic Report | Sustainability and Responsible Banking | Governance | Risk review | Financial review | Financial
statements | Shareholder
information |
| | | | | | | | | | | | | |
| | | | | | | | | | | | | |
Credit performance (audited)
We monitor exposures that show potentially higher risk characteristics using our Watchlist process. The table below shows the exposures we monitor, and those we classify as Stage 3 by portfolio at 31 December 2022 and 31 December 2021.
| | | | | | | | | | | | | | | | | | | | |
| 2022 | Committed exposure | |
| Watchlist | | | |
| Fully performing | Enhanced monitoring | Proactive management | Stage 3 | Total (1) | Loss allowances |
| £m | £m | £m | £m | £m | £m |
| | | | | | |
| SME and mid corporate | 11,796 | | 431 | | 1,383 | | 513 | | 14,123 | | 355 | |
| Commercial Real Estate | 4,765 | | 103 | | 480 | | 59 | | 5,407 | | 38 | |
| Social Housing | 7,979 | | 46 | | 10 | | — | | 8,035 | | 1 | |
| 24,540 | | 580 | | 1,873 | | 572 | | 27,565 | | 394 | |
| | | | | | | | | | | | | | | | | | | | |
2021(2) | | |
| | | | | | |
| SME and mid corporate | 11,227 | | 520 | | 2,161 | | 747 | | 14,655 | | 376 | |
| Commercial Real Estate | 4,344 | | 204 | | 220 | | 81 | | 4,849 | | 46 | |
| Social Housing | 7,800 | | — | | 140 | | — | | 7,940 | | 3 | |
| 23,371 | | 724 | | 2,521 | | 828 | | 27,444 | | 425 | |
(1)Includes committed facilities and derivatives.
(2)New customer management systems have introduced improved portfolio segmentation information. This has led to a realignment of portfolio segmentation and improved the identification of portfolios of particular interest. Due to this a restatement of the 2021 figures has taken place.
2022 compared to 2021
Across Corporate & Commercial Banking, watchlist exposure decreased, enhanced monitoring by 20% and proactive monitoring by 26% This followed the upgrading of cases as they stabilised after emerging from Covid-19 lockdowns especially in SME and Mid Corporates whilst CRE saw an increase in Proactive Management.
Stage 3 assets also decreased, down 31% with loss allowances decreasing by £31m (7%). The remaining Covid-19 related judgemental adjustments (JAs) were released. New JAs have been introduced to reflect the heightened risks of sectors and counterparties deemed most susceptible to current headwinds.
Loan modifications
Forbearance
The following table (audited) sets out the financial assets that were forborne while they had a loss allowance measured at lifetime ECL.
| | | | | | | | | | | |
| 2022 | | 2021 |
| | | |
| £m | | £m |
| Financial assets modified in the period: | | | |
–Amortised cost before modification | 240 | | | 243 | |
–Net modification gain/ (loss) | 8 | | | (5) | |
| Financial assets modified since initial recognition: | | | |
–Gross carrying amount of financial assets for which the loss allowance changed to 12-month ECL in the period | 15 | | | 29 | |
We only make forbearance arrangements for lending to customers. The balances (audited) at 31 December 2022 and 31 December 2021, analysed by their staging at the period–end and the forbearance we applied, were:
| | | | | | | | |
| 2022 | 2021 |
| | |
| £m | £m |
Stock(1) | | |
–Term extension | 98 | 150 |
–Interest-only | 238 | 239 |
–Other payment rescheduling | 219 | 204 |
| 555 | 593 |
| Of which: | | |
–Stage 1 | 17 | 20 |
–Stage 2 | 173 | 303 |
–Stage 3 | 365 | 270 |
| 555 | 593 |
| Proportion of portfolio | 2.0 | % | 2.4 | % |
(1)We base forbearance type on the first forbearance we applied. Tables only show accounts open at the period-end. Amounts are drawn balances and include off balance sheet balances.
2022 compared to 2021
In 2022, forbearance stock decreased overall due to a single case that was first reported as forbearance in 2021, and was repaid in 2022. This was partially offset by a small increase in other cases.
| | | | | | | | | | | | | | |
| Annual Report 2022 | Santander UK Group Holdings plc 143 |
| | | | | | | | | | | | | | | | | | | | | | | | | | | | | | | | | | | | | | | | | |
| Strategic Report | Sustainability and Responsible Banking | Governance | Risk review | Financial review | Financial
statements | Shareholder
information |
| | | | | | | | | | | | | |
| | | | | | | | | | | | | |
PORTFOLIOS OF PARTICULAR INTEREST
Introduction
Some types of lending have higher risk and others stand out for other reasons. We give more detail below on the following areas of particular interest.
| | | | | |
| Portfolio | Description |
| Commercial Real Estate (CRE) | Lending to experienced, professional landlords mainly secured by tenanted UK property. The CRE market has seen regular cyclical downturns, and so is a portfolio of particular interest. We manage and report our CRE portfolio in Corporate & Commercial Banking. |
In prior periods, we also gave a summary of our total Social Housing portfolio as we managed part of it in Corporate & Commercial Banking and part of it in Corporate Centre. With effect from 2022, we manage all our Social Housing portfolio in Corporate & Commercial Banking, as explained in Note 2 to the Consolidated Financial Statements. As a result, information on our total Social Housing portfolio is now presented in the main Corporate & Commercial Banking section.
Climate change
The global economy is still heavily dependent on fossil fuel energy sources such as coal, natural gas and oil, which significantly contribute to climate change. Energy transmission requires building and maintaining appropriate wholesale networks that can affect the natural environment. We remain committed to reallocating financial flows from fossil fuel consumption, including for electricity generation, to cleaner alternatives as set out in our Environmental, Social and Climate Change Policy.
In order to track and measure how our current lending activities contribute towards the reliance of fossil fuels, in 2022 we analysed our portfolio to identify fossil fuel exposures. We classified lending as a fossil fuel exposure if the counterparty engaged in any of the following activities:
–Oil & Gas: production and treatment including refining, transportation, storage and wholesale distribution
–Mining & Extraction: any coal mining or extraction activities
–Power Generation: clients for who coal-fired generation represents more than 10% of revenues on a consolidated basis.
At 31 December 2022, we had limited exposure to such counterparties, with these activities making up 0.4% of our Corporate and Commercial Banking lending to non-financial corporates. On an individually assessed basis, clients in these industries were highly rated and their markets remained highly liquid. We will continue to monitor, disclose and reduce lending which contributes to ongoing fossil fuel use.
Commercial Real Estate
Credit performance
The table below shows the main CRE credit performance metrics at 31 December 2022 and 31 December 2021.
| | | | | | | | | | | | | | | | | |
| Customer loans | Stage 3 | Stage 3
Ratio | Gross
write–offs | Total loss allowance |
| £m | £m | % | £m | £m |
| 2022 | 4,822 | | 58 | | 1.20 | | — | | 38 | |
| 2021 | 4,345 | | 79 | | 1.82 | | 25 | | 46 | |
LTV analysis
The table below shows the LTV distribution for our CRE total stock and Stage 3 stock (based on the drawn balance and our latest estimate of the property’s current value) of the portfolio at 31 December 2022 and 31 December 2021.
| | | | | | | | | | | | | | | | | | | | | | | | | | | | | | | | | | | |
| 2022 | | 2021 |
| Stock | | Stage 3 | | Stock | | Stage 3 |
| Total | ECL | | Total | ECL | | Total | ECL | | Total | ECL |
| LTV | £m | £m | | £m | £m | | £m | £m | | £m | £m |
| Up to 50% | 2,818 | | 15 | | | 14 | | 1 | | | 2,485 | | 15 | | | 21 | | 5 | |
| >50-70% | 1,416 | | 7 | | | 2 | | — | | | 1,194 | | 20 | | | 41 | | 14 | |
| >70-100% | 137 | | 4 | | | 15 | | 3 | | | 35 | | 2 | | | 3 | | — | |
| > 100% | 67 | | — | | | 1 | | — | | | 37 | | 1 | | | 5 | | 1 | |
Other portfolio (1) | 359 | | 12 | | | 26 | | 7 | | | 594 | | 8 | | | 9 | | 3 | |
| Total with collateral | 4,797 | | 38 | | | 58 | | 11 | | | 4,345 | | 46 | | | 79 | | 23 | |
| Development loans | 25 | | — | | | — | | — | | | — | | — | | | — | | — | |
| 4,822 | | 38 | | | 58 | | 11 | | | 4,345 | | 46 | | | 79 | | 23 | |
(1)Smaller value transactions, mainly commercial mortgages.
| | | | | | | | | | | | | | |
| Annual Report 2022 | Santander UK Group Holdings plc 144 |
| | | | | | | | | | | | | | | | | | | | | | | | | | | | | | | | | | | | | | | | | |
| Strategic Report | Sustainability and Responsible Banking | Governance | Risk review | Financial review | Financial
statements | Shareholder
information |
| | | | | | | | | | | | | |
| | | | | | | | | | | | | |
Refinancing risk
At 31 December 2022, CRE loans of £964m (2021: £1,084m) were due to mature within 12 months. Of these, £17m or 1.8% (2021: £7m or 0.7%) had an LTV ratio higher than is acceptable under our current credit policy, £7m of which were reported as Stage 3 (2021: £4m).
Sector analysis
| | | | | | | | | | | | | | | | | |
| Sector | 2022 | | 2021 |
| £m | % | | £m | % |
| Office | 1,267 | | 26 | | | 1,127 | | 26 | |
| Retail | 635 | | 13 | | | 653 | | 15 | |
| Industrial | 749 | | 16 | | | 457 | | 10 | |
| Residential | 853 | | 18 | | | 720 | | 17 | |
| Mixed use | 641 | | 13 | | | 526 | | 12 | |
| Student accommodation | 81 | | 2 | | | 58 | | 1 | |
| Hotels and leisure | 212 | | 4 | | | 210 | | 5 | |
| Other | 25 | | 1 | | | — | | — | |
Small value transactions portfolio(1) | 359 | | 7 | | | 594 | | 14 | |
| 4,822 | | 100 | | | 4,345 | | 100 | |
(1)Mainly commercial mortgages.
2022 compared to 2021
The CRE portfolio is well diversified across sectors with no significant regional or single name concentration. In 2022, the market faced falling capital and rental yields along with structural changes in certain sub-sectors such as Retail and Office. However at 31 December 2022, the LTV profile of the portfolio remained conservative with £4,234m and 95% (2021: £3,679m and 98%) at or below 70% LTV. Almost two thirds of the CRE portfolio has an LTV below 50%.
In our CRE portfolio, drawn customer loans increased by £477m. In 2022 , we maintained a prudent lending approach, with >99% of new business (2021: 100%) written at or below 60% LTV. The weighted average LTV on the CRE portfolio was 46%.
Drawn facilities subject to enhanced monitoring decreased by 48% to £102m (2021: £198m). Drawn facilities subject to proactive management increased by 115% to £473m (2021: £220m). Stage 3 exposures decreased to £58m (2021: £79m).
| | | | | | | | | | | | | | |
| Annual Report 2022 | Santander UK Group Holdings plc 145 |
| | | | | | | | | | | | | | | | | | | | | | | | | | | | | | | | | | | | | | | | | |
| Strategic Report | Sustainability and Responsible Banking | Governance | Risk review | Financial review | Financial
statements | Shareholder
information |
| | | | | | | | | | | | | |
| | | | | | | | | | | | | |
CORPORATE CENTRE – CREDIT RISK REVIEW
Movement in total exposures and the corresponding ECL (audited)
The following tables show changes in total on and off-balance sheet exposures and ECL in the period. The footnotes to the Santander UK group level table on page 128 also apply to these tables. | | | | | | | | | | | | | | | | | | | | | | | | | | |
| Stage 1 | Stage 2 | Stage 3 | Total |
| Exposures(1) | ECL | Exposures(1) | ECL | Exposures(1) | ECL | Exposures(1) | ECL |
| £m | £m | £m | £m | £m | £m | £m | £m |
| At 1 January 2022 | 71,693 | | — | | 2 | | — | | 2 | | — | | 71,697 | | — | |
Transfers from Stage 1 to Stage 2(3) | — | | — | | — | | — | | — | | — | | — | | — | |
Transfers from Stage 2 to Stage 1(3) | — | | — | | — | | — | | — | | — | | — | | — | |
Transfers to Stage 3(3) | — | | — | | — | | — | | — | | — | | — | | — | |
Transfers from Stage 3(3) | — | | — | | — | | — | | — | | — | | — | | — | |
| Transfers of financial instruments | — | | — | | — | | — | | — | | — | | — | | — | |
Net ECL remeasurement on stage transfer(4) | — | | — | | — | | — | | — | | — | | — | | — | |
Change in economic scenarios(2) | — | | — | | — | | — | | — | | — | | — | | — | |
| Changes to model | — | | — | | — | | — | | — | | — | | — | | — | |
New lending and assets purchased(5) | — | | — | | — | | — | | — | | — | | — | | — | |
Redemptions, repayments and assets sold (7) | (9,687) | | — | | — | | — | | — | | — | | (9,687) | | — | |
Changes in risk parameters and other movements(6) | 399 | | — | | 1 | | — | | (1) | | — | | 399 | | — | |
Assets written off (7) | — | | — | | — | | — | | — | | — | | — | | — | |
| At 31 December 2022 | 62,405 | | — | | 3 | | — | | 1 | | — | | 62,409 | | — | |
| Net movement in the period | (9,288) | | — | | 1 | | — | | (1) | | — | | (9,288) | | — | |
| | | | | | | | |
| ECL charge/(release) to the Income Statement | | — | | | — | | | — | | | — | |
| Less: Discount unwind | | — | | | — | | | — | | | — | |
| Less: Recoveries net of collection costs | | — | | | — | | | — | | | — | |
| Total ECL charge/(release) to the Income Statement | | — | | | — | | | — | | | — | |
| | | | | | | | | | | | | | | | | | | | | | | | | | |
| £m | £m | £m | £m | £m | £m | £m | £m |
| At 1 January 2021 | 75,540 | | 12 | | — | | — | | — | | — | | 75,540 | | 12 | |
Transfers from Stage 1 to Stage 2(3) | — | | — | | — | | — | | — | | — | | — | | — | |
Transfers from Stage 2 to Stage 1(3) | — | | — | | — | | — | | — | | — | | — | | — | |
Transfers to Stage 3(3) | — | | — | | — | | — | | — | | — | | — | | — | |
Transfers from Stage 3(3) | — | | — | | — | | — | | — | | — | | — | | — | |
| Transfers of financial instruments | — | | — | | — | | — | | — | | — | | — | | — | |
Net ECL remeasurement on stage transfer(4) | — | | — | | — | | — | | — | | — | | — | | — | |
Change in economic scenarios(2) | — | | — | | — | | — | | — | | — | | — | | — | |
| Changes to model | — | | — | | — | | — | | — | | — | | — | | — | |
New lending and assets purchased(5) | — | | — | | — | | — | | — | | — | | — | | — | |
Redemptions, repayments and assets sold(7) | (3,749) | | (12) | | — | | — | | — | | — | | (3,749) | | (12) | |
Changes in risk parameters and other movements(6) | (98) | | — | | 2 | | — | | 2 | | — | | (94) | | — | |
Assets written off (7) | — | | — | | — | | — | | — | | — | | — | | — | |
| At 31 December 2021 | 71,693 | | — | | 2 | | — | | 2 | | — | | 71,697 | | — | |
| Net movement in the period | (3,847) | | (12) | | 2 | | — | | 2 | | — | | (3,843) | | (12) | |
| | | | | | | | |
| ECL charge/(release) to the Income Statement | | (12) | | | — | | | — | | | (12) | |
| Less: Discount unwind | | — | | | — | | | — | | | — | |
| Less: Recoveries net of collection costs | | — | | | — | | | — | | | — | |
| Total ECL charge/(release) to the Income Statement | | (12) | | | — | | | — | | | (12) | |
| | | | | | | | | | | | | | |
| Annual Report 2022 | Santander UK Group Holdings plc 146 |
| | | | | | | | | | | | | | | | | | | | | | | | | | | | | | | | | | | | | | | | | |
| Strategic Report | Sustainability and Responsible Banking | Governance | Risk review | Financial review | Financial
statements | Shareholder
information |
| | | | | | | | | | | | | |
| | | | | | | | | | | | | |
Committed exposures
Credit risk arises on both on- and off–balance sheet transactions, e.g. derivatives.
Rating distribution (audited)
These tables show our credit risk exposure according to our internal rating scale (see ‘Credit quality’ in the ‘Santander UK group level – credit risk review’ section) for each portfolio. On this scale, the higher the rating, the better the quality of the counterparty.
| | | | | | | | | | | | | | | | | | | | | | | | | | | | | |
| Santander UK risk grade | |
| 9 | 8 | 7 | 6 | 5 | 4 | 3 to 1 | Other(1) | Total |
| 2022 | £m | £m | £m | £m | £m | £m | £m | £m | £m |
| Corporate Centre | | | | | | | | | |
| Sovereign and Supranational | 53,910 | | 1,077 | | — | | — | | — | | — | | — | | — | | 54,987 | |
| Structured Products | 136 | | 1,162 | | 875 | | — | | — | | — | | — | | — | | 2,173 | |
| | | | | | | | | |
| Financial Institutions | 1,191 | | 676 | | 635 | | 26 | | — | | — | | — | | — | | 2,528 | |
| | | | | | | | | |
| | | | | | | | | |
| Crown Dependencies | — | | — | | — | | — | | — | | — | | — | | 1,141 | | 1,141 | |
| 55,237 | | 2,915 | | 1,510 | | 26 | | — | | — | | — | | 1,141 | | 60,829 | |
| Of which: | | | | | | | | | |
| Stage 1 | 55,237 | | 2,915 | | 1,510 | | 26 | | — | | — | | — | | 1,137 | | 60,825 | |
| Stage 2 | — | | — | | — | | — | | — | | — | | — | | 3 | | 3 | |
| Stage 3 | — | | — | | — | | — | | — | | — | | — | | 1 | | 1 | |
| | | | | | | | | |
| 2021 | | | | | | | | | |
| Corporate Centre | | | | | | | | | |
| Sovereign and Supranational | 57,415 | | 1,051 | | — | | — | | — | | — | | — | | — | | 58,466 | |
| Structured Products | 573 | | 1,064 | | 197 | | 41 | | | | | — | | 1,875 | |
| | | | | | | | | |
| Financial Institutions | 501 | | 534 | | 361 | | 7 | | — | | — | | — | | — | | 1,403 | |
| | | | | | | | | |
| | | | | | | | | |
| Crown Dependencies | — | | — | | — | | — | | — | | — | | — | | 742 | | 742 | |
| 58,489 | | 2,649 | | 558 | | 48 | | — | | — | | — | | 742 | | 62,486 | |
| Of which: | | | | | | | | | |
| Stage 1 | 58,489 | | 2,649 | | 558 | | 48 | | — | | — | | — | | 740 | | 62,484 | |
| Stage 2 | — | | — | | — | | — | | — | | — | | — | | 2 | | 2 | |
| Stage 3 | — | | — | | — | | — | | — | | — | | — | | — | | — | |
(1)Smaller exposures mainly in the commercial mortgage portfolio, and Crown Dependencies residential mortgages portfolio. We use scorecards for them, instead of a rating model.
(2)Commercial mortgages and residual structured and asset finance loans (shipping, aviation and structured finance).
2022 compared to 2021
Committed exposures decreased by 2.7% mainly driven by UK Sovereign and Supranational exposures, as part of normal liquid asset portfolio management, which reduced by 6.0%. The portfolio profile remained short-term, reflecting the purpose of the holdings.
Geographical distribution (audited)
We typically classify geographical location according to the counterparty’s country of domicile unless a full risk transfer guarantee is in place, in which case we use the guarantor’s country of domicile instead.
| | | | | | | | | | | | | | | | | | | | | | | | | | | | | | | | | | | |
| 2022 | | 2021 |
| UK | Europe | US | Rest of World | Total | | UK | Europe | US | Rest of World | Total |
| £m | £m | £m | £m | £m | | £m | £m | £m | £m | £m |
| | | | | | | | | | | |
| Sovereign and Supranational | 50,806 | | 1,886 | | 83 | | 2,212 | | 54,987 | | | 54,651 | | 950 | | 469 | | 2,396 | | 58,466 | |
| Structured Products | 1,379 | | 422 | | 4 | | 368 | | 2,173 | | | 1,219 | | 656 | | — | | 0 | | 1,875 | |
| | | | | | | | | | | |
| Financial Institutions | 1,075 | | 1,036 | | 230 | | 187 | | 2,528 | | | 536 | | 572 | | 81 | | 214 | | 1,403 | |
| | | | | | | | | | | |
| | | | | | | | | | | |
| Crown Dependencies | — | | — | | — | | 1,141 | | 1,141 | | | — | | — | | — | | 742 | | 742 | |
| 53,260 | | 3,344 | | 317 | | 3,908 | | 60,829 | | | 56,406 | | 2,178 | | 550 | | 3,352 | | 62,486 | |
Credit performance (audited)
We monitor exposures that show potentially higher risk characteristics using our Watchlist process. In Corporate Centre committed exposures were all fully performing at 31 December 2022 and 31 December 2021.
Loan modifications (audited)
There were no loan modifications made in 2022 and 2021.
| | | | | | | | | | | | | | |
| Annual Report 2022 | Santander UK Group Holdings plc 147 |
| | | | | | | | | | | | | | | | | | | | | | | | | | | | | | | | | | | | | | | | | |
| Strategic Report | Sustainability and Responsible Banking | Governance | Risk review | Financial review | Financial
statements | Shareholder
information |
| | | | | | | | | | | | | |
| | | | | | | | | | | | | |
Market risk
| | | | | | | | | | | | | | | | | |
| | | | | |
| Overview Market risk comprises non-traded market risk and traded market risk. Non-traded market risk is the risk of loss of income, economic or market value due to changes to interest rates in the non-trading book or to changes in other market risk factors (e.g. credit spread and inflation risk), where such changes would affect our net worth through an adjustment to revenues, assets, liabilities and off-balance sheet exposures in the non-trading book. Traded market risk is the risk of changes in market factors that affect the value of the positions in the trading book. We have no significant traded market risk exposure. In this section, we set out which of our assets and liabilities are exposed to non-traded and traded market risk. Then we explain how we manage these risks and discuss our key market risk metrics. | | | Key metrics Net Interest Income (NII) sensitivity to +100bps was £238m and to ‑100bps was £(194)m (2021: £334m and £(459)m).
Economic Value of Equity (EVE) sensitivity to +100bps was £(501)m and to ‑100bps was £651m (2021: £(399)m and £147m). | |
BALANCE SHEET ALLOCATION BY MARKET RISK CLASSIFICATION (AUDITED)
We classify all our assets and liabilities exposed to market risk as non-traded market risk, except for certain portfolios that we must classify as trading books for regulatory purposes (such as selling derivatives or derivative-based products to clients), of which we must fair value for accounting reasons (such as assets in the eligible liquidity pool). For accounting purposes, we classify all derivatives as held for trading unless they are designated as being in a hedging relationship. For more, see Note 11 to the Consolidated Financial Statements.
NON-TRADED MARKET RISK
OUR KEY NON-TRADED MARKET RISKS (audited)
Non-traded market risk mainly comes from providing banking products and services to our customers, as well as our structural balance sheet exposures. It arises in all our business segments. In Retail Banking, Consumer Finance and Corporate & Commercial Banking, it is a by-product of us writing customer business and we transfer most of these risks to Corporate Centre to manage. The only types of non-traded market risk that we keep in Retail Banking, Consumer Finance and Corporate & Commercial Banking are short-term mismatches due to forecasting variances in prepayment and launch risk. This is where customers repay their loans earlier than their expected maturity date or do not take the expected volume of new products. Corporate Centre also manages our structural balance sheet exposures, such as foreign exchange and Income Statement volatility risk.
Our key non-traded market risks are:
| | | | | |
| Key risks | Description |
| Interest rate risk | Yield curve risk: comes from timing mismatches in repricing fixed and variable rate assets, liabilities and off-balance sheet instruments. It also comes from investing non-rate sensitive liabilities in interest-earning assets. Basis risk: comes from pricing assets using a different rate index to the liabilities that fund them. We are exposed to basis risks associated with Bank of England bank rate, reserve rate linked assets we deposit with central banks, and the Sterling Overnight Index Average (SONIA) rate. |
| Spread risk | Spread risk arises when the value of assets or liabilities which are accounted for at fair value (either through Other Comprehensive Income or through Profit and Loss) are affected by changes in the credit spread. We measure these spreads as the difference between the discount rate we use to value the asset or liability, and an underlying interest rate curve. |
| Foreign exchange risk | Our banking businesses operate mainly in sterling markets, so we do not create significant foreign exchange exposures. The only exception to this is money we raise in foreign currencies. For more on this, see ‘Wholesale funding’ in the ‘Liquidity risk’ section. |
Income statement
volatility risk | We measure most of the assets and liabilities in our banking book balance sheet at amortised cost. We sometimes manage their risk profile by using derivatives. As all derivatives are accounted for at fair value, the mismatch in their accounting treatment can lead to volatility in our Income Statement. This happens even if the derivative is an economic hedge of the asset or liability. |
NON-TRADED MARKET RISK MANAGEMENT
Risk appetite
Our Structural and Market Risk framework sets out our high-level arrangements and standards to manage, control and oversee non-traded market risk, and is part of our overall Risk Framework. Our Risk Appetite sets the controls, risk limits and key risk metrics for non-traded market risk. We show risk appetite by the income and value sensitivity limits we set in our Risk Appetite, at both Santander UK and Banco Santander group levels.
Risk measurement
We mainly measure our exposures with NII and EVE sensitivity analysis. We support this with VaR risk measures and stress testing. We also monitor our interest rate repricing gap. We regularly review our risk models and metrics including underlying model assumptions to ensure they continue to reflect the risks inherent in the current rate environment and regulatory expectations.
| | | | | | | | | | | | | | |
| Annual Report 2022 | Santander UK Group Holdings plc 148 |
| | | | | | | | | | | | | | | | | | | | | | | | | | | | | | | | | | | | | | | | | |
| Strategic Report | Sustainability and Responsible Banking | Governance | Risk review | Financial review | Financial
statements | Shareholder
information |
| | | | | | | | | | | | | |
| | | | | | | | | | | | | |
NII and EVE sensitivities (audited)
The calculations for NII and EVE sensitivities involve many assumptions, including expected customer behaviour (such as early repayment of loans) and how interest rates may move. These assumptions are a key part of our overall control framework, so we update and review them regularly. Our NII and EVE sensitivities include the interest rate risk from all our banking book positions. Our banking book positions generate almost all our reported net interest income.
| | | | |
| NII sensitivity | | |
| NII sensitivity is an income-based measure we use to forecast the changes to interest income and interest expense in different scenarios. It gives us a combined impact on net interest income over a given period – usually 12 or 36 months. | | |
| We calculate NII sensitivity by simulating the NII using 2 yield curves. The difference between the 2 NII totals is the NII sensitivity. | | |
| | |
| | |
| EVE sensitivity |
–We calculate EVE sensitivity as the change in the net present value of all the interest rate sensitive items in the banking book balance sheet for a defined set of instantaneous parallel and non-parallel shifts in the yield curve. |
|
The limitations of sensitivities
We use sensitivities to measure the impact of standard, instantaneous, parallel shifts in relevant yield curves. The advantage of using standard parallel shifts is they generally give us a constant measure of the size of our market risk exposure, with a simple and consistent stress. We also run non-parallel stress tests, to calculate the impact of some plausible non-parallel scenarios, and over various time periods for income stresses, usually one or three years.
Value at Risk (VaR) (audited)
| | |
| VaR |
–VaR indicates the losses that we might suffer because of unfavourable changes in the markets under normal (non-stressed) market conditions. |
| We run a historical simulation using historical daily price moves to find how much we might lose, normally at a 99% confidence level. |
|
|
The limitations of VaR
VaR is a useful and important market standard measure of risk, but it does have some limitations. These include:
–VaR assumes what happened in the past is a reliable way to predict what will happen in the future. This may not always be the case
–VaR is based on positions at the end of the business day so it doesn’t include intra-day positions
–VaR does not predict how big the loss could be on the 1% of trading days that it is greater than the VaR
–Using a time horizon of one day means VaR does not tell us everything about exposures that we cannot liquidate or hedge within a day, or products with infrequent pricing.
Back-testing – comparing VaR estimates with reality
To check that the way we estimate VaR is reasonable, we back-test our VaR by comparing it against both actual and hypothetical profits and losses, using a one-day time horizon. Back-testing allows us to identify exceptions – times when the predictions were out of line with what happened. We can then look for trends in these exceptions, which can help us decide whether we need to recalibrate our VaR model.
Stress testing
Stress testing is an essential part of our risk management. It helps us to measure and evaluate the potential impact on portfolio values of more extreme, although plausible, events or market moves. We express limits as on how much we could lose in a stress event, and this restricts how much risk we take.
Stress testing scenarios
Simple stress tests (like parallel shifts in relevant curves) give us clear measures of risk and a consistent starting point for setting limits. More complex, multi-factor and multi-time period stress tests give us information about specific potential events. They can also test outcomes that we might not capture through parallel stresses or VaR-type measures. We use stress tests to estimate losses in extreme market events beyond the confidence level used in VaR models.
We can adapt our stress tests to reflect current concerns such as climate change risk, the Covid-19 pandemic and other macroeconomic events or changing market conditions. We run individual business area stresses and Santander UK-wide scenarios.
Other ways of measuring risk
As well as using sensitivities and stress tests, we can measure non-traded market risk using net notional positions. This can give us a simple view of our exposure, although we generally need to combine it with other risk measures to cover all aspects of a risk profile, such as projected changes over time. Other metrics we can use include Earnings at Risk (EaR). EaR is like VaR but captures changes in income rather than value. We use this approach for example to generate a one-year EaR measure to assess Basis risk.
Risk mitigation (audited)
We typically hedge the interest rate risk of the securities we hold for liquidity and investment purposes with interest rate swaps. We retain spread exposures, and these are the key drivers of the VaR and stress tests we use to assess the risk of the portfolio. We mitigate Income Statement volatility mainly through hedge accounting. We monitor any hedge accounting ineffectiveness that might lead to Income Statement volatility with a VaR measure and trigger, reported monthly. For our accounting policies for derivatives and hedge accounting, see Note 1 to the Consolidated Financial Statements.
We hedge our foreign currency funding positions back to sterling, so our foreign exchange positions tend to be residual exposures that remain after hedging. These exposures could be, for example, to ‘spot’ foreign exchange rates or to cross currency basis. We monitor foreign exchange risk against absolute net exposures and VaR-based limits and triggers.
For more on this, see ‘Funding strategy‘ and ‘Term issuance’ in the ‘Liquidity risk’ section.
Risk monitoring and reporting (audited)
We monitor our non-traded market risks using sensitivities, VaR and stress tests. We report them against limits and triggers to senior management daily and to ALCO and ERCC each month. The VaR we report captures all key sources of volatility (including interest rate and spread risks) to fully reflect potential volatility.
| | | | | | | | | | | | | | |
| Annual Report 2022 | Santander UK Group Holdings plc 149 |
| | | | | | | | | | | | | | | | | | | | | | | | | | | | | | | | | | | | | | | | | |
| Strategic Report | Sustainability and Responsible Banking | Governance | Risk review | Financial review | Financial
statements | Shareholder
information |
| | | | | | | | | | | | | |
| | | | | | | | | | | | | |
NON-TRADED MARKET RISK REVIEW
Interest rate risk
Yield curve risk
The table below shows how our net interest income would be affected by a parallel shift (both up and down) applied instantaneously to the yield curve at 31 December 2022 and 31 December 2021. Sensitivity to parallel shifts represents the amount of risk in a way that we think is both simple and scalable. In 2022, we moved to focus on 100 basis points (bps) from previously disclosed sensitivities of 50bps and 25bps. The shift reflects a more realistic stress in the current rate environment. We have replaced the previously disclosed sensitivities of 50bps and 25bps for 2021 with 100 bps sensitivities for consistency with 2022.
| | | | | | | | | | | | | | | | | | |
| | | |
| | | 2022 | | | 2021 |
| | | +100bps | -100bps | | | +100bps | -100bps |
| | | £m | £m | | | £m | £m |
| NII sensitivity (audited)(1) | | | 238 | | (194) | | | | 334 | | (459) | |
| EVE sensitivity | | | (501) | | 651 | | | | (399) | | 147 | |
(1) Based on modelling assumptions of repricing behaviour.
.
Basis risk
We report basis risk using the EaR approach. | | | | | | | | |
| 2022 | 2021 |
| £m | £m |
| Basis risk EaR | 2 | | 2 | |
Interest rate repricing gap
The table below shows the interest rate repricing gap of our balance sheet by repricing buckets. | | | | | | | | | | | | | | | | | | | | | | | |
| 3 months | 1 year | 3 years | 5 years | >5years | Not sensitive | Total |
| 2022 | £m | £m | £m | £m | £m | £m | £m |
| Assets | 106,980 | | 44,748 | | 79,006 | | 52,489 | | 5,249 | | 14,123 | | 302,595 | |
| Liabilities | 135,801 | | 30,262 | | 58,526 | | 51,161 | | 3,833 | | 25,023 | | 304,606 | |
| Off-balance sheet | 31,378 | | (16,133) | | (16,972) | | 723 | | 3,015 | | — | | 2,011 | |
| Net gap | 2,557 | | (1,647) | | 3,508 | | 2,051 | | 4,431 | | (10,900) | | — | |
| | | | | | | | | | | | | | | | | | | | | | | |
| 2021 | | | | | | | |
| Assets | 111,211 | | 45,979 | | 77,726 | | 44,418 | | 7,191 | | 16,930 | | 303,455 | |
| Liabilities | 190,649 | | 17,328 | | 25,735 | | 16,108 | | 28,733 | | 25,551 | | 304,104 | |
| Off-balance sheet | 27,369 | | (18,508) | | (19,842) | | 3,447 | | 8,183 | | — | | 649 | |
| Net gap | (52,069) | | 10,143 | | 32,149 | | 31,757 | | (13,359) | | (8,621) | | — | |
Spread risk
The table below shows the risk metrics covering the portfolios of securities we hold for liquidity and investment purposes. | | | | | | | | |
| 2022 | 2021 |
| £m | £m |
| VaR | 3 | | 4 | |
| Worst three month stressed loss | 46 | | 56 | |
2022 compared to 2021
We regularly review our risk models and metrics including underlying modelling assumptions to ensure they continue to reflect the risks inherent in the current rate environment and incorporate regulatory expectations.
NII Sensitivity to a -100bps stress reduced to £(194)m 2021: £(459)m) as the risk of margin compression as a result of customer deposit rates becoming floored reduced in the higher rate environment. The NII sensitivity to a +100bps parallel stress reduced to £238m (2021: £334m), as the mix of customer liabilities changed in the higher rate environment.
EVE Sensitivity to a +100bps stress increased to £(501)m (2021: £(399)m) in the higher rate environment. This was driven by changes in the mix of customer liabilities, offset by a reduction in the profile of the structural position and customer behaviour in response to higher rates.
TRADED MARKET RISK
We have no significant traded market risk exposure. Our only exposure to traded market risk comes from providing permitted financial services to permitted customers, in our main Ring-Fenced Bank, Santander UK plc. Our exposures are affected by market movements in interest rates, credit spreads, and foreign exchange rates. Traded market risk can reduce our net income. We hedge risks from client trades, and our books are as close to back-to-back as possible, with market risk hedged with Banco Santander SA or CCPs. This is required by Banking Reform legislation. Santander UK plc has two trading desks. The Link Desk transacts derivatives with our corporate clients that are permitted under the ring-fencing regime. The Retail Structured Products desk (RSP) sells investments to retail investors, through our UK branches and other channels. We calculate market risk capital using standard rules.
The Internal VaR for exposure to traded market risk at 31 December 2022 was less than £1m (2021: less than £1m).
| | | | | | | | | | | | | | |
| Annual Report 2022 | Santander UK Group Holdings plc 150 |
| | | | | | | | | | | | | | | | | | | | | | | | | | | | | | | | | | | | | | | | | |
| Strategic Report | Sustainability and Responsible Banking | Governance | Risk review | Financial review | Financial
statements | Shareholder
information |
| | | | | | | | | | | | | |
| | | | | | | | | | | | | |
Liquidity risk
| | | | | | | | | | | | | | | | | |
| | | | | |
| Overview Liquidity risk is the risk that we do not have sufficient liquid financial resources available to meet our obligations when they fall due, or we can only secure such resources at excessive cost. In this section, we describe our sources and uses of liquidity and how we manage liquidity risk. We also analyse our key liquidity metrics, including our LCRs and our eligible liquidity pools. We then explain our funding strategy and structure and we analyse our wholesale funding. Finally, we analyse how we have encumbered some of our assets to support our funding activities.
| | | Key metrics LCR of 163% (2021: n/a) RFB LCR of 157% (2021: 168%) RFB DoLSub LCR of 152% (2021: 166%) SFS LCR of 218% (2021: 206%) Wholesale funding with maturity <1 year £11.0bn (2021: £10.2bn) LCR eligible liquidity pool of £49.0bn (2021: n/a) RFB DoLSub LCR eligible liquidity pool of £46.3bn (2021: £51.4bn) SFS LCR eligible liquidity pool of £2.7bn (2021: £2.8bn) | |
OUR KEY LIQUIDITY RISKS (audited)
Through our LRA framework, we manage our funding or structural contingent and market liquidity risks wherever they arise. This can be in retail and corporate deposit outflows, wholesale secured and unsecured liquidity outflows and off-balance sheet activities. Other risks our framework covers include funding concentrations, intra-day cash flows, intra-group commitments and support, franchise retention and cross currency risk.
Our main sources of liquidity
Customer deposits finance most of our customer lending. Although these funds are mostly callable, in practice they give us a stable and predictable core of funding. This is due to the nature of retail accounts and the breadth of our retail customer relationships.
We have a strong wholesale funding investor base, diversified across product types and geographies. Through the wholesale markets, we have active relationships in many sectors including banks, other financial institutions, corporates and investment funds. We access the wholesale funding markets through the issuance of capital, senior unsecured debt, covered bonds, structured notes and short-term funding. We also access these markets through securitisations of certain assets of Santander UK plc and our operating subsidiaries. For more on our programmes, see Notes 14, 26 and 27 in the Consolidated Financial Statements.
We generate funding on the strength of our own balance sheet, our own profitability and our own network of investors. In addition, we have access to UK Government funding schemes. We comply with rules set by the PRA, other regulators, and Banco Santander standards. While we manage, consolidate and monitor liquidity risk centrally, we also manage and monitor it in the business area it comes from.
Our main uses of liquidity
Our main uses of liquidity are to fund our lending in Retail Banking, Consumer Finance and Corporate & Commercial Banking, to pay interest and dividends, and to repay debt. Our ability to pay dividends depends on various factors. These include our regulatory capital needs, the level of our distributable reserves, and our financial performance. We also use liquidity to pay for business combinations.
LIQUIDITY RISK MANAGEMENT
Introduction
We manage liquidity risk on a consolidated basis in our CFO division, which is our centralised function for managing funding, liquidity and capital. We created our governance, oversight and control frameworks, and our LRA, on the same consolidated basis.
We monitor and manage liquidity risk for the Santander UK plc group and SFS separately. Under this model, and the PRA’s liquidity rules, Santander UK plc and its subsidiary Cater Allen Limited form the RFB Domestic Liquidity Sub-group (the RFB DoLSub), which allows them to collectively meet regulatory requirements to manage liquidity risk. Each member of the RFB DoLSub will support the other by transferring surplus liquidity in times of stress.
We continue to transfer liquidity risks from the securities Santander UK Group Holdings plc issues, or the contracts it executes, into our subsidiaries largely through back-to-back transactions. We fund any mismatches, if needed, by ordinary share dividends from subsidiaries.
Risk appetite
Separate LRAs are in place for Santander UK plc group and SFS. These are appropriate to their individual business models and consistent with the strategy of Santander UK Group Holdings plc.
Our LRA is based on the principles of liquidity management we use to manage our balance sheet. It also supports our need to meet or exceed regulatory rules. In line with our liquidity management principles, we avoid an over-reliance on funding from a single product, customer or counterparty. We also maintain enough unencumbered customer assets to support current and future funding and collateral requirements and maintain enough capacity to monetise liquid assets and other counterbalancing capacity on a timely basis.
Our LRA is proposed to the Risk division and the Board, which is then approved under advice from the Board Risk Committee. Our LRA, in the context of our overall Risk Appetite, is reviewed and approved by the Board each year, or more often if needed.
| | | | | | | | | | | | | | |
| Annual Report 2022 | Santander UK Group Holdings plc 151 |
| | | | | | | | | | | | | | | | | | | | | | | | | | | | | | | | | | | | | | | | | |
| Strategic Report | Sustainability and Responsible Banking | Governance | Risk review | Financial review | Financial
statements | Shareholder
information |
| | | | | | | | | | | | | |
| | | | | | | | | | | | | |
Risk measurement
We use a number of metrics to manage liquidity risk. These include metrics that show the difference between cash and collateral inflows and outflows in different periods. They also include structural metrics, such as our level of encumbered assets.
Ongoing business management
Within our framework of prudent funding and liquidity management, we manage our activities to our liquidity risk appetite. We have clear responsibilities for short-term funding, medium-term funding, encumbrance, collateral and liquid asset management. This ensures we manage liquidity risks as part of our daily operations, strategy and planning.
Our liquidity management framework is split between short-term and strategic activities. Our short-term activities focus on intra-day collateral; management and maintaining liquid assets to cover unexpected demands on cash in a stress, such as large and unexpected deposit withdrawals by customers and loss of wholesale funding. Our strategic activities focus on ensuring we are not over reliant on any one source for funding and that we avoid excessive concentrations in the maturity of our funding.
We regularly test the liquidity of our eligible liquidity pool, in line with PRA and Basel rules. We do this by realising some of the assets by repurchase or outright sale to the market. We make sure that over any 12-month period we realise a significant part of our eligible liquidity pool. As well as our eligible liquidity pool, we always hold a portfolio of unencumbered liquid assets. Our LRA and PRA requirements determine the size and composition of this portfolio. These assets give us a source of contingent liquidity, as we can realise some of them in a stress to create liquidity by repurchase or outright sale to the market.
Stress testing
Our liquidity stress testing framework is central to our LRA measurement and monitoring. To fit with our risk appetite, the liquidity outflows that come from these stress tests must be fully covered with high-quality liquid assets, other liquid assets and appropriate management actions.
Our Risk division runs a range of stress tests. Our LRA stress test is a combination of three tests that cover idiosyncratic, market-wide and combined scenarios.
Our other tests consider scenarios such as a global economic slowdown that results in reduced confidence in banks, a slowdown in a major economy or a decline in access to liquidity. These are considered on both an acute and protracted basis. We also run severe combined stress tests which look at both a deep and prolonged UK recession that results in a reduction in wholesale funding availability and an idiosyncratic shock that would lead to retail and commercial outflows. We run a climate change stress, that assumes severe physical risks results in a reduction in retail deposits, increased use of corporate lending facilities and an increase in mortgage defaults.
We also conduct sensitivity analysis and reverse stress testing for instant liquidity shocks by each key liquidity risk. We do this to understand the impacts they would have on our LRA and our regulatory liquidity metrics.
We monitor our LCR to ensure we continue to meet the requirements. We also monitor the Net Stable Funding Ratio (NSFR), which was implemented on 1 January 2022.
Risk mitigation (audited)
The Board aims to make our balance sheet resilient at all times and for it to be perceived as such by stakeholders. This preserves our short and long-term viability. The Board recognises that as we are involved in maturity transformation, we cannot hold enough liquidity to cover all possible stress scenarios. The Board requires us to hold enough liquidity to make sure we will survive three plausible but severe stress scenarios (our LRA stress test, described above). We do this by maintaining a prudent balance sheet structure and approved liquid resources.
Recovery and Resolution framework
The CFO is the accountable SMF for recovery and resolution and the related work is managed by the CFO division. They are overseen by the Board Audit Committee and the Board.
We review and refresh our recovery plan each year. It sets out the risks, the indicators we use to monitor these risks, and the actions we can take to mitigate a capital, liquidity or combined stress event. We are confident that we have sufficient credible and executable options to respond to a wide variety of stresses, be they market-wide or idiosyncratic, in a timely and effective manner. Recovery indicators are both qualitative and quantitative and are embedded into risk frameworks. We monitor recovery capacity, headroom to recovery triggers and recovery indicators regularly. If necessary, we would invoke recovery early to mitigate the effects of a stress and restore our financial position and balance sheet strength.
We submitted our first self-assessment of our resolvability to the PRA in October 2021 and made targeted updates to it in February 2022. On 10 June 2022 we published our first resolvability public disclosure. This concludes that we have put in place capabilities that enable us to meet the Bank of England’s resolution outcomes and that these are sufficiently flexible, so that they can be adapted to the specifics of failure as it unfolds, in order to credibly support the resolution in practice. Our capabilities are underpinned by comprehensive governance, testing and assurance arrangements, which seek to ensure that our resolution readiness is maintained and, where appropriate, enhanced on an ongoing basis. On the same day, the Bank of England published its own assessment of UK major banks’ resolvability arrangements. The Santander UK specific section of the Bank of England’s disclosure confirms that the Bank of England has not identified any material issues in relation to our approach to achieving the three resolution outcomes set out in the Resolvability Assessment Framework.
Risk monitoring and reporting (audited)
We monitor liquidity risk daily, weekly and monthly. We do this through different committees and levels of management, including ALCO and the BRC.
| | | | | | | | | | | | | | |
| Annual Report 2022 | Santander UK Group Holdings plc 152 |
| | | | | | | | | | | | | | | | | | | | | | | | | | | | | | | | | | | | | | | | | |
| Strategic Report | Sustainability and Responsible Banking | Governance | Risk review | Financial review | Financial
statements | Shareholder
information |
| | | | | | | | | | | | | |
| | | | | | | | | | | | | |
LIQUIDITY RISK REVIEW
Liquidity Coverage Ratio
Liquidity metrics are reported for Santander UK from 1 January 2022 following adoption of the CRR2 regulation. We have continued to present separate data for RFB and SFS for 2022 and 2021 as a transition.
| | | | | | | | | | | | | | | | | | | | |
| LCR | RFB DoLSub LCR(1) | SFS LCR |
| 2022 | 2021 | 2022 | 2021 | 2022 | 2021 |
| £bn | £bn | £bn | £bn | £bn | £bn |
Eligible liquidity pool (liquidity value)(2) | 48.9 | n/a | 46.2 | 51.3 | 2.7 | 2.8 |
| Net stress outflows | (30.0) | n/a | (30.4) | (30.9) | (1.3) | (1.4) |
| Surplus | 18.9 | n/a | 15.8 | 20.4 | 1.4 | 1.4 |
| Eligible liquidity pool as a percentage of anticipated net cash flows | 163 | % | n/a | 152 | % | 166 | % | 218 | % | 206 | % |
(1) The RFB LCR was 157%(2021:168%).
(2) The liquidity value is calculated as applying an applicable haircut to the carrying value.
LCR eligible liquidity pool
This table shows the carrying value of our eligible liquidity pool assets at 31 December 2022 and 31 December 2021. It also shows the weighted average carrying value in the year.
| | | | | | | | | | | | | | | | | | | | | | | | | | |
| Carrying value | Weighted average carrying
value in the year |
| 2022 | 2021 | 2022 | 2021 |
| Level 1 | Level 2 | Total | Level 1 | Level 2 | Total | Total | Total |
| £bn | £bn | £bn | £bn | £bn | £bn | £bn | £bn |
| Cash and balances at central banks | 44.5 | | — | | 44.5 | | n/a | n/a | n/a | 45.5 | | n/a |
| Government bonds | 3.2 | | — | | 3.2 | | n/a | n/a | n/a | 4.1 | | n/a |
| Supranational bonds and multilateral development banks | 0.3 | | — | | 0.3 | | n/a | n/a | n/a | 0.1 | | n/a |
| Covered bonds | 0.1 | | 0.9 | | 1.0 | | n/a | n/a | n/a | 0.9 | | n/a |
| Asset-backed securities | — | | — | | — | | n/a | n/a | n/a | 0.1 | | n/a |
| | | | | | | | |
| 48.1 | | 0.9 | | 49.0 | | n/a | n/a | n/a | 50.7 | | n/a |
| | | | | | | | | | | | | | | | | | | | | | | | | | |
| RFB DoLSub | | |
| | | | |
| | | | | | | | |
| | | | | | | | |
| Cash and balances at central banks | 42.1 | | — | | 42.1 | | 45.9 | | — | | 45.9 | | 43.5 | | 40.6 | |
| Government bonds | 2.9 | | — | | 2.9 | | 4.2 | | — | | 4.2 | | 3.8 | | 7.0 | |
| Supranational bonds and multilateral development banks | 0.3 | | — | | 0.3 | | 0.2 | | — | | 0.2 | | 0.1 | | 0.3 | |
| Covered bonds | 0.1 | | 0.9 | | 1.0 | | 0.8 | | — | | 0.8 | | 0.9 | | 1.1 | |
| Asset-backed securities | — | | — | | — | | — | | 0.3 | | 0.3 | | 0.1 | | 0.4 | |
| | | | | | | | |
| 45.4 | | 0.9 | | 46.3 | | 51.1 | | 0.3 | | 51.4 | | 48.4 | | 49.4 | |
| | | | | | | | | | | | | | | | | | | | | | | | | | |
| SFS | | | | | | | | |
| Cash and balances at central banks | 2.4 | | — | | 2.4 | | 2.3 | | — | | 2.3 | | 2.0 | | 2.0 | |
| Government bonds | 0.3 | | — | | 0.3 | | 0.5 | | — | | 0.5 | | 0.4 | | 0.5 | |
| 2.7 | | — | | 2.7 | | 2.8 | | — | | 2.8 | | 2.4 | | 2.5 | |
Currency analysis
This table shows the carrying value of our eligible liquidity pool by major currencies at 31 December 2022 and 31 December 2021. The composition of the pool is consistent with the currency profile of our net liquidity outflows. | | | | | | | | | | | | | | | | | |
| US Dollar | Euro | Sterling | Other | Total |
| £bn | £bn | £bn | £bn | £bn |
| 2022 | 0.8 | | 1.3 | | 46.9 | | — | | 49.0 | |
| | | | | |
| RFB DoLSub | | | | | |
| | | | | |
| 2022 | 0.8 | | 1.3 | | 44.2 | | — | | 46.3 | |
| 2021 | 0.8 | | 0.4 | | 50.2 | | — | | 51.4 | |
| | | | | |
| | | | | |
| | | | | |
| | | | | |
| | | | | |
All the assets in the SFS eligible liquidity pool of £2.7bn (2021: £2.8bn) are denominated in Sterling.
Net Stable Funding Ratio (NSFR)
The NSFR was implemented on 1 January 2022.
2022 compared to 2021
We remain in a strong liquidity position. We hold sufficient liquid resources and have adequate governance and controls in place to manage the liquidity risks arising from our business and strategy. At 31 December 2022, the LCR and NSFR significantly exceeded regulatory requirements.
| | | | | | | | | | | | | | |
| Annual Report 2022 | Santander UK Group Holdings plc 153 |
| | | | | | | | | | | | | | | | | | | | | | | | | | | | | | | | | | | | | | | | | |
| Strategic Report | Sustainability and Responsible Banking | Governance | Risk review | Financial review | Financial
statements | Shareholder
information |
| | | | | | | | | | | | | |
| | | | | | | | | | | | | |
FUNDING RISK MANAGEMENT
Funding strategy
Our funding strategy continues to be based on maintaining a conservatively structured balance sheet and diverse sources of funding to meet the needs of our business strategy and plans. The CFO Division maintains a funding plan that complies with the LRA and regulatory liquidity and capital requirements.
Most of our funding comes from customer deposits. We source the rest from a mix of secured and unsecured funding in the wholesale markets. Overall, this means that we do not rely too heavily on wholesale funds. We manage funding requirements by targeting a specific Liquidity Coverage Ratio, we ensure maturities are prefunded and capital/Minimum Requirements for Eligible Liabilities (MREl) requirements are prioritised. We also have checks and controls to limit our asset encumbrance from our secured funding operations.
As part of maintaining a diverse funding base, we raise funding in a number of currencies, including EUR and USD, and convert it into sterling through currency swaps to fund our commercial assets which are largely sterling denominated.
Our base of stable retail and corporate deposits is a key funding source for us. We leverage our large and diverse customer base to offer products that give us a long-term sustainable source of funding. We do this by focusing on building long-term relationships. Over 85% of our total core retail customer liabilities are covered by the Financial Services Compensation Scheme (the FSCS).
Behavioural maturities
The contractual maturity of our balance sheet assets and liabilities highlights the maturity transformation that underpins the role of banks to lend long term, but to fund themselves mainly with shorter-term liabilities, like customer deposits. We do this by diversifying our funding operations across a wide customer base, both in numbers and by type of depositor. In practice, the behavioural profiles of many liabilities show more stability and longer maturity than their contractual maturity. This is especially true of many retail and corporate deposits that, while they may be repayable on demand or at short notice, have shown good stability even in times of stress. We model behaviour profiles using our experience of customer behaviour. We use this data to determine the funds transfer pricing rates at which we reward and charge our business units for sources and uses of funds. We apply this rate until a customer changes to a different product or service offered by us or by one of our competitors.
We continue to maintain the quality of our retail, commercial and wholesale deposits. We aim to deepen our customer relationships across all customer segments. We do this to lengthen the contractual and behavioural profile of our liability base.
Deposit funding
We mainly fund our Retail Banking, Consumer Finance and Corporate & Commercial Banking activities by customer deposits. We fund the rest through wholesale markets.
Wholesale funding
Composition of wholesale funding
We are active in the wholesale markets and we have direct access to both money market and long-term investors through our funding programmes. This makes our wholesale funding well diversified by product, maturity, geography and currency. This includes currencies available across a range of channels from money markets, repo markets, senior unsecured, secured, medium-term and capital.
Santander UK plc is our main operating company issuer of senior unsecured debt, structured notes, short-term funding and covered bonds.
Santander UK Group Holdings plc is the issuer of capital and MREL/Total Loss Absorbing Capacity (TLAC) eligible senior unsecured debt. Under CRR II, G-SIBs have been subject to the MREL standard. As part of this, UK resolution entities that are G-SIBs or are part of a G-SIB, including Santander UK Group Holdings plc, are required to meet the MREL minimum requirements, implemented through the Bank of England Statement of Policy on MREL in the UK. From 1 January 2020, the MREL requirement is the higher of (i) two times the Pillar 1 capital requirements and one times their Pillar 2A add-ons; (ii) 6% of CRR leverage exposures or (iii) two times the minimum leverage ratio requirement. The MREL requirements have been fully implemented from 1 January 2022.
Our main operating company Santander UK plc is subject to internal MREL as it meets the requirements of a material subsidiary of our ultimate parent Banco Santander SA.
We also access the wholesale markets through securitisations of certain assets of our operating subsidiaries. We also have access to UK Government funding schemes. Eligible collateral for these schemes includes all collateral that is eligible in the Bank of England’s Discount Window Facility. We ensure that enough collateral is placed and available at the Discount Window.
Issuance model and resolution
Banco Santander is a multiple point of entry resolution group. This means that should it fail, it would be split up into parts. Healthy parts might be sold or be kept as a residual group without their distressed sister companies. The resolution or recapitalisation of the distressed parts might be effected via ‘bail in’ of bonds that had been issued to the market by a regional intermediate holding company.
Santander UK is a single point of entry resolution group. This means that resolution would work downwards from the group’s holding company i.e. Santander UK Group Holdings plc. Losses in subsidiaries would first be transferred up to Santander UK Group Holdings plc. If the holding company is bankrupt as a result, the group is deemed to be failing or likely to fail, it will be put into resolution. The ‘bail in’ tool is applied to the holding company, with the equity being written off and bonds written off or converted into equity as needed to recapitalise the group. Those bondholders would become the new owners, and the group would stay together.
Santander UK Group Holdings plc is the immediate holding company of Santander UK plc but does not guarantee its debts or other obligations. This structure is a Bank of England recommended configuration which aims to ensure the activities of the operating company are not disrupted as the Santander UK group goes through resolution, thereby maintaining continuity of services for customers.
| | | | | | | | | | | | | | |
| Annual Report 2022 | Santander UK Group Holdings plc 154 |
| | | | | | | | | | | | | | | | | | | | | | | | | | | | | | | | | | | | | | | | | |
| Strategic Report | Sustainability and Responsible Banking | Governance | Risk review | Financial review | Financial
statements | Shareholder
information |
| | | | | | | | | | | | | |
| | | | | | | | | | | | | |
FUNDING RISK REVIEW
Reconciliation of wholesale funding to the balance sheet (audited)
This table reconciles our wholesale funding to our balance sheet at 31 December 2022 and 31 December 2021.
| | | | | | | | | | | | | | | | | | | | | | | | | | |
| | Balance sheet line item |
| Funding
analysis | Deposits by banks(3) | Deposits by customers(1) | Repurchase agreements - non trading | Financial
liabilities
designated
at fair value | Debt
securities
in issue | Subordinated
liabilities | Other equity instruments and non- controlling interests(2) |
| 2022 | £bn | £bn | £bn | £bn | £bn | £bn | £bn | £bn |
| Deposits by banks | 0.5 | | 0.5 | | — | | — | | — | | — | | — | | — | |
| Certificates of deposit and commercial paper | 4.7 | | — | | — | | — | | — | | 4.7 | | — | | — | |
| Senior unsecured – public benchmark | 14.4 | | — | | — | | — | | — | | 14.4 | | — | | — | |
–privately placed | 0.6 | | — | | — | | — | | 0.4 | | 0.2 | | — | | — | |
| Covered bonds | 14.9 | | — | | — | | — | | — | | 14.9 | | — | | — | |
| Securitisation and structured issuance | 1.0 | | — | | — | | — | | — | | 1.0 | | — | | — | |
| | | | | | | | |
| TFSME | 25.0 | | 25.0 | | — | | — | | — | | — | | — | | — | |
| Subordinated liabilities and equity | 4.1 | | — | | — | | — | | — | | — | | 1.9 | | 2.2 | |
| Total wholesale funding | 65.2 | | 25.5 | | — | | — | | 0.4 | | 35.2 | | 1.9 | | 2.2 | |
| Repos | 8.0 | | — | | — | | 8.0 | | — | | — | | — | | — | |
| Foreign exchange and hedge accounting | 1.6 | | — | | — | | — | | — | | 1.2 | | 0.4 | | — | |
| Other | 3.4 | | 3.0 | | — | | — | | 0.4 | | — | | — | | — | |
| Balance sheet total | 78.2 | | 28.5 | | — | | 8.0 | | 0.8 | | 36.4 | | 2.3 | | 2.2 | |
| | | | | | | | | | | | | | | | | | | | | | | | | | |
| 2021 | | | | | | | | |
| Deposits by banks | 0.2 | | 0.2 | | — | | — | | — | | — | | — | | — | |
| Certificates of deposit and commercial paper | 5.1 | | — | | — | | — | | — | | 5.1 | | — | | — | |
| Senior unsecured – public benchmark | 12.4 | | — | | — | | — | | — | | 12.4 | | — | | — | |
–privately placed | 0.6 | | — | | — | | — | | 0.5 | | 0.1 | | — | | — | |
| Covered bonds | 12.5 | | — | | — | | — | | — | | 12.5 | | — | | — | |
| Securitisation and structured issuance | 0.7 | | — | | — | | — | | — | | 0.7 | | — | | — | |
| | | | | | | | |
| TFSME | 31.9 | | 31.9 | | — | | — | | — | | — | | — | | — | |
| Subordinated liabilities and equity | 4.4 | | — | | — | | — | | — | | — | | 2.0 | | 2.4 | |
| Total wholesale funding | 67.8 | | 32.1 | | — | | — | | 0.5 | | 30.8 | | 2.0 | | 2.4 | |
| Repos | 11.7 | | — | | — | | 11.7 | | — | | — | | — | | — | |
| Foreign exchange and hedge accounting | 1.0 | | — | | — | | — | | — | | 0.8 | | 0.2 | | — | |
| Other | 2.1 | | 1.8 | | — | | — | | 0.3 | | — | | — | | — | |
| Balance sheet total | 82.6 | | 33.9 | | — | | 11.7 | | 0.8 | | 31.6 | | 2.2 | | 2.4 | |
(1)This is included in our balance sheet total of £197,313m (2021: £192,914m).
(2)Consists of £nil (2021: £nil) fixed/floating rate non-cumulative callable preference shares, £0m (2021: £235m) Step-up Callable Perpetual Reserve Capital Instruments and £2,196m (2021: £2,191m) Perpetual Capital Securities (net of issuance costs). See Notes 45 and 33 to the Consolidated Financial Statements.
(3)Other consists of items in the course of transmission and other deposits. See Note 24 to the Consolidated Financial Statements.
| | | | | | | | | | | | | | |
| Annual Report 2022 | Santander UK Group Holdings plc 155 |
| | | | | | | | | | | | | | | | | | | | | | | | | | | | | | | | | | | | | | | | | |
| Strategic Report | Sustainability and Responsible Banking | Governance | Risk review | Financial review | Financial
statements | Shareholder
information |
| | | | | | | | | | | | | |
| | | | | | | | | | | | | |
Maturity profile of wholesale funding (audited)
This table shows our main sources of wholesale funding. It does not include securities finance agreements. The table is based on exchange rates at issue and scheduled repayments and call dates. It does not reflect the final contractual maturity of the funding.
For details of the maturities of financial liabilities and off-balance sheet commitments, see Note 39 to the Consolidated Financial Statements.
| | | | | | | | | | | | | | | | | | | | | | | | | | | | | | | | |
| ≤ 1
month | >1 and ≤ 3 months | >3 and ≤ 6 months | >6 and ≤ 9 months | >9 and ≤ 12 months | Sub-total
≤ 1 year | >1 and
≤ 2 years | >2 and
≤ 5 years | >5 years | Total |
| 2022 | £bn | £bn | £bn | £bn | £bn | £bn | £bn | £bn | £bn | £bn |
Santander UK Group Holdings plc(1) | | | | | | | | | | |
| Senior unsecured – public benchmark | 0.8 | | 0.7 | | — | | 0.6 | | 0.8 | | 2.9 | | 1.6 | | 6.5 | | 1.6 | | 12.6 | |
–privately placed | — | | — | | — | | — | | — | | — | | — | | 0.1 | | — | | 0.1 | |
| Subordinated liabilities and equity (incl. AT1) | — | | — | | — | | — | | — | | — | | 0.5 | | 1.4 | | 1.0 | | 2.9 | |
| 0.8 | | 0.7 | | — | | 0.6 | | 0.8 | | 2.9 | | 2.1 | | 8.0 | | 2.6 | | 15.6 | |
| Santander UK plc | | | | | | | | | | |
| Deposits by banks | 0.2 | | 0.3 | | — | | — | | — | | 0.5 | | — | | — | | — | | 0.5 | |
| Certificates of deposit and commercial paper | 1.2 | | 3.2 | | 0.3 | | — | | — | | 4.7 | | — | | — | | — | | 4.7 | |
| Senior unsecured – public benchmark | 0.3 | | — | | — | | — | | — | | 0.3 | | 0.9 | | 0.3 | | 0.3 | | 1.8�� | |
–privately placed | — | | — | | — | | — | | — | | — | | 0.1 | | 0.2 | | 0.2 | | 0.5 | |
| Covered bonds | — | | 1.0 | | 0.1 | | 0.9 | | — | | 2.0 | | 3.4 | | 8.4 | | 1.1 | | 14.9 | |
Securitisation & structured issuance(2) | 0.1 | | — | | 0.1 | | — | | — | | 0.2 | | 0.1 | | 0.6 | | 0.1 | | 1.0 | |
| | | | | | | | | | |
| TFSME | — | | — | | — | | — | | — | | — | | — | | 25.0 | | — | | 25.0 | |
| Subordinated liabilities | — | | — | | — | | — | | 0.4 | | 0.4 | | — | | — | | 0.8 | | 1.2 | |
| 1.8 | | 4.5 | | 0.5 | | 0.9 | | 0.4 | | 8.1 | | 4.5 | | 34.5 | | 2.5 | | 49.6 | |
| Other group entities | | | | | | | | | | |
Securitisation & structured issuance(3) | — | | — | | — | | — | | — | | — | | — | | — | | — | | — | |
| | | | | | | | | | |
| Total at 2022 | 2.6 | | 5.2 | | 0.5 | | 1.5 | | 1.2 | | 11.0 | | 6.6 | | 42.5 | | 5.1 | | 65.2 | |
| Of which: | | | | | | | | | | |
–Secured | 0.1 | | 1.0 | | 0.2 | | 0.9 | | — | | 2.2 | | 3.5 | | 34.0 | | 1.2 | | 40.9 | |
–Unsecured | 2.5 | | 4.2 | | 0.3 | | 0.6 | | 1.2 | | 8.8 | | 3.1 | | 8.5 | | 3.9 | | 24.3 | |
| | | | | | | | | | |
| | | | | | | | | | | | | | | | | | | | | | | | | | | | | | | | |
| 2021 | | | | | | | | | | |
| Total at 2021 | 3.1 | | 3.2 | | 2.8 | | 0.2 | | 0.9 | | 10.2 | | 5.9 | | 41.1 | | 10.6 | | 67.8 | |
| Of which: | | | | | | | | | | |
–Secured | 0.2 | | — | | 0.9 | | 0.1 | | 0.9 | | 2.1 | | 2.1 | | 33.7 | | 7.2 | | 45.1 | |
–Unsecured | 2.9 | | 3.2 | | 1.9 | | 0.1 | | — | | 8.1 | | 3.8 | | 7.4 | | 3.4 | | 22.7 | |
(1)95% of senior unsecured debt issued from Santander UK Group Holdings plc has been downstreamed to Santander UK plc as ‘secondary non-preferential debt’ in line with the guidelines from the Bank of England for Internal MREL.
(2)Includes funding from mortgage-backed securitisation vehicles where Santander UK plc is the asset originator.
(3)Includes funding from asset-backed securitisation vehicles where entities other than Santander UK plc are the asset originator.
2022 compared to 2021
–Our overall funding strategy remains to develop and sustain a diversified funding base. We also need to fulfil regulatory requirements as well as support our credit ratings.
–Our funding costs improved with maturities refinanced at lower cost. Total wholesale funding decreased in 2022.
–We repaid £6.9bn of TFSME, with £25.0bn outstanding at year-end. In 2022, we utilised TFSME drawings to support mortgage lending in H122, but a successful retail funding campaign towards the end of the year and above-planned secured funding meant we were able to repay drawings. We expect similar annual repayments over the next 3 years.
–We issued a total of £8.6bn, including MREL issuance of £3.9bn equivalent, and £4.7bn of non-MREL issuance from Santander UK plc. We expect to issue between £2bn and £3bn of MREL in 2023, of which we have already issued £1.0bn equivalent in January 2023. Maturities in 2022 were £5.3bn.
–At 31 December 2022, 83% (2021:85%) of wholesale funding had a maturity of greater than one year, with an overall residual duration of 37 months (2021: 47 months).
–Our structural hedge position increased, with an average of £110bn over the last 12 months, and an average duration of c2.5 years.
–Our level of encumbrance from external and internal issuance of securitisations and covered bonds decreased again in 2022.
| | | | | | | | | | | | | | |
| Annual Report 2022 | Santander UK Group Holdings plc 156 |
| | | | | | | | | | | | | | | | | | | | | | | | | | | | | | | | | | | | | | | | | |
| Strategic Report | Sustainability and Responsible Banking | Governance | Risk review | Financial review | Financial
statements | Shareholder
information |
| | | | | | | | | | | | | |
| | | | | | | | | | | | | |
Currency composition of wholesale funds (audited)
This table shows our wholesale funding by major currency at 31 December 2022 and 31 December 2021.
| | | | | | | | | | | | | | | | | | | | | | | | | | | | | |
| 2022 | | 2021 |
| Sterling | US Dollar | Euro | Other | | Sterling | US Dollar | Euro | Other |
| % | % | % | % | | % | % | % | % |
| Santander UK Group Holdings plc | | | | | | | | | |
| Senior unsecured – public benchmark | 18 | | 58 | | 24 | | — | | | 10 | | 59 | | 31 | | — | |
–privately placed | — | | — | | — | | 100 | | | — | | — | | — | | 100 | |
| Subordinated liabilities and equity (incl. AT1) | 75 | | 25 | | — | | — | | | 75 | | 25 | | — | | — | |
| 28 | | 51 | | 20 | | 1 | | | 24 | | 51 | | 24 | | 1 | |
| Santander UK plc | | | | | | | | | |
| Deposits by banks | 29 | | 71 | | — | | — | | | 32 | | 68 | | — | | — | |
| Certificates of deposit and commercial paper | 56 | | 42 | | 2 | | — | | | 45 | | 53 | | 2 | | — | |
| Senior unsecured – public benchmark | 18 | | 62 | | 20 | | — | | | 14 | | 46 | | 40 | | — | |
–privately placed | 95 | | — | | 5 | | — | | | 92 | | — | | 6 | | 2 | |
| Covered bonds | 43 | | 12 | | 45 | | — | | | 44 | | 8 | | 48 | | — | |
| Securitisation & structured issuance | 100 | | — | | — | | — | | | 74 | | 26 | | — | | — | |
| | | | | | | | | |
| TFSME | 100 | | — | | — | | — | | | 100 | | — | | — | | — | |
| Subordinated liabilities | 48 | | 52 | | — | | — | | | 57 | | 43 | | — | | — | |
| 74 | | 12 | | 14 | | — | | | 77 | | 10 | | 13 | | — | |
| | | | | | | | | |
| | | | | | | | | |
| | | | | | | | | |
| Total | 63 | | 21 | | 16 | | — | | | 67 | | 18 | | 15 | | — | |
Term issuance (audited)
In 2022, our external term issuance (sterling equivalent) was:
| | | | | | | | | | | | | | | | | | | | |
| Sterling | US Dollar | Euro | Other | 2022 | 2021 |
| £bn | £bn | £bn | £bn | £bn | £bn |
| Santander UK Group Holdings plc | | | | | | |
| Senior unsecured – public benchmark | 1.2 | | 2.1 | | 0.6 | | — | | 3.9 | | 2.8 | |
| Subordinated debt and equity (inc. AT1) | 0.8 | | — | | — | | — | | 0.8 | | 0.5 | |
| 2.0 | | 2.1 | | 0.6 | | — | | 4.7 | | 3.3 | |
| Santander UK plc | | | | | | |
| Securitisations and other secured funding | 0.6 | | — | | — | | — | | 0.6 | | — | |
| Covered bonds | 1.8 | | 0.8 | | 1.4 | | — | | 4.0 | | — | |
| Senior unsecured – public benchmark | — | | — | | — | | — | | — | | — | |
–privately placed | 0.1 | | — | | — | | — | | 0.1 | | 0.1 | |
| TFSME | — | | — | | — | | — | | — | | 20.2 | |
| 2.5 | | 0.8 | | 1.4 | | — | | 4.7 | | 20.3 | |
| | | | | | |
| | | | | | |
| Total gross issuances | 4.5 | | 2.9 | | 2.0 | | — | | 9.4 | | 23.6 | |
Loan to deposit ratio
This table shows our customer loans, customer deposits and loan to deposit ratio (LDR) at 31 December 2022 and 31 December 2021, and the adjustments to reconcile the data to the balance sheet.
| | | | | | | | | | | | | | | | | | | | |
| 2022 | 2021 |
| Customer loans | Customer deposits | LDR(2) | Customer loans | Customer deposits | LDR(2) |
| £bn | £bn | % | £bn | £bn | % |
| | | | | | |
| | | | | | |
| | | | | | |
| | | | | | |
Total customer loans and deposits(1) | 219.7 | | 196.5 | | 112 | % | 210.6 | | 192.2 | | 110 | % |
| Adjust for fair value loans, impairment loss allowances, accrued interest and other | 4.1 | | 0.8 | | | 2.9 | | 0.7 | | |
| Statutory loans and advances to customers and deposits by customers | 223.8 | | 197.3 | | 113 | % | 213.5 | | 192.9 | | 111 | % |
(1) The customer loans and customer deposits numbers agree to the customer balances in the Balance sheet review section of the Financial review.
(2) Customer loans (Loans and advances to customers) divided by Customer deposits (Deposits by customers).
| | | | | | | | | | | | | | |
| Annual Report 2022 | Santander UK Group Holdings plc 157 |
| | | | | | | | | | | | | | | | | | | | | | | | | | | | | | | | | | | | | | | | | |
| Strategic Report | Sustainability and Responsible Banking | Governance | Risk review | Financial review | Financial
statements | Shareholder
information |
| | | | | | | | | | | | | |
| | | | | | | | | | | | | |
Encumbrance
We encumber an asset if we pledge or transfer it as collateral against a liability. This means it is no longer available to secure funding, meet our collateral needs or be sold to reduce funding needs. Being able to pledge or transfer assets as collateral is a key part of a bank’s operations. The main ways we encumber assets are that we: enter into securitisation, covered bonds, and repurchase agreements to access medium and long-term funding; enter into short-term funding transactions (including repurchase agreements and stock borrowing) as part of our liquidity management; pledge collateral as part of participating in payment and settlement systems; and post collateral as part of derivatives activity. We control levels of encumbrance by setting a minimum level of unencumbered assets after we factor in our funding plans, whether we can use our assets for our future collateral needs, the impact of a stress and our current encumbrance level.
Assets classified as readily available for encumbrance include cash and securities in our eligible liquidity pool. They also include other unencumbered assets that give us a source of contingent liquidity. We do not rely on these extra unencumbered assets in our LRA, but we might use them in a stress. We can create liquidity by using them as collateral for secured funding or through outright sale. This includes excess collateral already in a secured funding structure and collateral pre-positioned at central banks that is available for use in secured funding. All other loans and advances are classified as not readily available for encumbrance, however, they may still be suitable for use in secured funding structures.
Encumbrance of customer loans and advances
We have issued securitised products to a diverse investor base through our prime mortgage-backed and other asset-backed funding programmes. We have raised funding with mortgage-backed notes, both issued to third parties and retained – the latter being central bank eligible collateral for funding purposes in other Bank of England facilities. We also have a covered bond programme, under which we issue securities to investors secured by a pool of residential mortgages. For more on these programmes, see Notes 14 and 26 to the Consolidated Financial Statements.
On-balance sheet encumbered and unencumbered assets (audited)
| | | | | | | | | | | | | | | | | | | | | | | | | | | | | | | | |
| Encumbered with counterparties other than central banks | Assets positioned at central banks(3) | | Unencumbered assets not pre-positioned with central banks | |
| Covered
bonds | Securitis-
ations | Other | Total | Readily
available | Other
available
assets | Cannot be
encumbered | Total | Total
assets |
| 2022 | £m | £m | £m | £m | £m | £m | £m | £m | £m | £m |
Cash and balances at central banks(1)(2) | — | | — | | 1,330 | | 1,330 | | 911 | | 44,394 | | — | | — | | 45,305 | | 46,635 | |
| Financial assets at FVTPL: | | | | | | | | | | |
–Derivative financial instruments | — | | — | | — | | — | | — | | — | | — | | 2,439 | | 2,439 | | 2,439 | |
–Other financial assets at FVTPL | — | | — | | — | | — | | — | | — | | — | | 434 | | 434 | | 434 | |
| Financial assets at amortised cost: | | | | | | | | | | |
–Loans and advances to customers | 21,304 | | 2,851 | | 46 | | 24,201 | | 68,535 | | 91,761 | | 18,284 | | 21,059 | | 199,639 | | 223,840 | |
–Loans and advances to banks | — | | — | | 163 | | 163 | | — | | — | | — | | 942 | | 942 | | 1,105 | |
–Repurchase agreements – non trading | — | | — | | — | | — | | — | | — | | — | | 7,348 | | 7,348 | | 7,348 | |
–Other financial assets at amortised cost | — | | — | | 35 | | 35 | | — | | 121 | | — | | — | | 121 | | 156 | |
| Financial assets at FVOCI | — | | — | | 4,441 | | 4,441 | | — | | 1,583 | | — | | — | | 1,583 | | 6,024 | |
| Interests in other entities | — | | — | | — | | — | | — | | — | | — | | 252 | | 252 | | 252 | |
| Intangible assets | — | | — | | — | | — | | — | | — | | — | | 1,550 | | 1,550 | | 1,550 | |
| Property, plant and equipment | — | | — | | — | | — | | — | | — | | 1,526 | | — | | 1,526 | | 1,526 | |
| Current tax assets | — | | — | | — | | — | | — | | — | | — | | 484 | | 484 | | 484 | |
| Retirement benefit assets | — | | — | | — | | — | | — | | — | | — | | 1,051 | | 1,051 | | 1,051 | |
| Other assets | — | | — | | — | | — | | — | | — | | — | | (601) | | (601) | | (601) | |
| Total assets | 21,304 | | 2,851 | | 6,015 | | 30,170 | | 69,446 | | 137,859 | | 19,810 | | 34,958 | | 262,073 | | 292,243 | |
| | | | | | | | | | | | | | | | | | | | | | | | | | | | | | | | |
| | | | | |
| | | | | | | | | | |
| 2021 | | | | | | | | | | |
Cash and balances at central banks(1)(2) | — | | — | | 1,580 | | 1,580 | | 935 | | 47,979 | | — | | — | | 48,914 | | 50,494 | |
| Financial assets at FVTPL: | | | | | | | | | | |
–Derivative financial instruments | — | | — | | — | | — | | — | | — | | — | | 1,720 | | 1,720 | | 1,720 | |
–Other financial assets at FVTPL | — | | — | | — | | — | | — | | — | | — | | 676 | | 676 | | 676 | |
| Financial assets at amortised cost: | | | | | | | | | | |
–Loans and advances to customers | 15,713 | | 3,720 | | 84 | | 19,517 | | 80,623 | | 74,890 | | 18,893 | | 19,602 | | 194,008 | | 213,525 | |
–Loans and advances to banks | — | | — | | 478 | | 478 | | — | | — | | — | | 942 | | 942 | | 1,420 | |
–Repurchase agreements – non trading | — | | — | | — | | — | | — | | — | | — | | 12,683 | | 12,683 | | 12,683 | |
–Other financial assets at amortised cost | — | | — | | 0 | | 0 | | — | | 506 | | — | | — | | 506 | | 506 | |
| Financial assets at FVOCI | — | | — | | 4,434 | | 4,434 | | — | | 1,417 | | — | | — | | 1,417 | | 5,851 | |
| Interests in other entities | — | | — | | — | | — | | — | | — | | — | | 201 | | 201 | | 201 | |
| Intangible assets | — | | — | | — | | — | | — | | — | | — | | 1,545 | | 1,545 | | 1,545 | |
| Property, plant and equipment | — | | — | | — | | — | | — | | — | | 1,555 | | — | | 1,555 | | 1,555 | |
| Current tax assets | — | | — | | — | | — | | — | | — | | — | | 351 | | 351 | | 351 | |
| Retirement benefit assets | — | | — | | — | | — | | — | | — | | — | | 1,573 | | 1,573 | | 1,573 | |
| Other assets | — | | — | | — | | — | | — | | — | | — | | 1,576 | | 1,576 | | 1,576 | |
| Total assets | 15,713 | | 3,720 | | 6,576 | | 26,009 | | 81,558 | | 124,792 | | 20,448 | | 40,869 | | 267,667 | | 293,676 | |
(1)Encumbered cash and balances at central banks include minimum cash balances we have to hold at central banks for regulatory purposes.
(2)Readily realisable cash and balances at central banks are amounts held at central banks as part of our liquidity management activities.
(3)Comprises pre-positioned assets and encumbered assets.
| | | | | | | | | | | | | | |
| Annual Report 2022 | Santander UK Group Holdings plc 158 |
| | | | | | | | | | | | | | | | | | | | | | | | | | | | | | | | | | | | | | | | | |
| Strategic Report | Sustainability and Responsible Banking | Governance | Risk review | Financial review | Financial
statements | Shareholder
information |
| | | | | | | | | | | | | |
| | | | | | | | | | | | | |
Capital risk
| | | | | | | | | | | | | | | | | |
| | | | | |
| Overview Capital risk is the risk that we do not have an adequate amount or quality of capital to meet our business objectives, regulatory requirements and market expectations. In this section, we set out how we are regulated. We explain how we manage capital on a standalone basis as a subsidiary in the Banco Santander group. We then analyse our capital resources and key capital ratios including our leverage and RWAs. | | | Key metrics CET1 capital ratio of 15.2% (2021: 15.9%) Total qualifying regulatory capital of £14.5bn (2021: £14.7bn)
UK leverage ratio of 5.2% (2021: 5.2%) | |
THE SCOPE OF OUR CAPITAL ADEQUACY
Regulatory supervision
For capital purposes, we are subject to prudential supervision by the PRA, as a UK banking group, and by the European Central Bank (ECB) as part of the Banco Santander group. The ECB supervises Banco Santander as part of the Single Supervisory Mechanism (SSM). Although we are part of the Banco Santander group, we do not have a guarantee from Banco Santander SA and we operate as a standalone subsidiary. As we are part of the UK sub-group regulated by the PRA, we have to meet the PRA capital requirements on a standalone basis. We also have to show the PRA that we can withstand capital stress tests without the support of our parent. Reinforcing our corporate governance framework, the PRA exercises oversight through its rules and regulations on the Board and senior management appointments.
Santander UK Group Holdings plc is the holding company of Santander UK plc and is the head of the Santander UK group for regulatory capital and leverage purposes. Santander UK plc is the head of the ring-fenced bank sub-group and is subject to regulatory capital and leverage rules in relation to that sub-group. Our basis of consolidation for our capital disclosures is substantially the same as for our Consolidated Financial Statements.
CAPITAL RISK MANAGEMENT
The Board is responsible for capital management strategy and policy and ensuring that we monitor and control our capital within regulatory and internal limits. We manage our funding and maintain capital adequacy on a standalone basis. We operate within the capital risk framework and appetite approved by our Board. This reflects the environment we operate in, our strategy for each material risk and the potential impact of adverse scenarios or stresses on our capital.
Management of capital requirements (audited)
Our capital risk appetite aims to maintain capital levels appropriate to the level of stress applied, and the expected regulatory response. In:
–An adverse economic stress, which we expect once in 20 years, the firm should remain profitable and exceed all regulatory capital minimums at all times.
–A very severe economic stress, which we expect once in 100 years, and which has been designed to test any specific weaknesses of a firm’s business model, the firm should meet all regulatory capital minimums at all times. This is subject to using regulatory buffers designed to absorb losses in such a stress.
Management of capital resources (audited)
We use a mix of regulatory and EC ratios and limits, internal buffers and restrictions to manage our capital resources. We also take account of the costs of differing capital instruments and capital management techniques. We also use these to shape the best structure for our capital needs. We decide how to allocate our capital resources as part of our strategic planning process. We base this in part on the relative returns on capital using both EC and regulatory capital measures. We plan for severe stresses and we set out what action we would take if an extremely severe stress threatened our viability and solvency. This could include not paying dividends, selling assets, reducing our business and issuing more capital.
Risk measurement
We apply Banco Santander’s approach to capital measurement and risk management for CRD IV. Santander UK Group Holdings plc is classified as a significant subsidiary of Banco Santander SA. For more on the CRD IV risk measurement of our exposures, see Banco Santander’s Pillar 3 report.
Key metrics
The main metrics we use to measure capital risk are CET1 capital ratio,and total capital ratio and UK leverage ratio.We continue to be in excess of overall capital requirements, minimum leverage requirements and minimum requirements for own funds and eligible liabilities (MREL).
Stress testing
Each year we create a capital plan, as part of our ICAAP. We share our ICAAP with the PRA. The PRA then tells us how much capital (Pillar 2A), and of what quality, it thinks we should hold on top of our Pillar 1 requirements and buffer levels. We also develop a series of economic scenarios to stress test our capital needs and confirm that we have enough regulatory capital to meet our projected and stressed capital needs and to meet our obligations as they fall due.
In 2022, we developed a Climate Internal Scenario Analysis (CISA) to help understand better the potential impact of climate change on our business portfolios and balance sheet. The CISA outputs will form the basis of our 2022 ICAAP for climate risk by helping show if we need to hold more capital for climate risks and help us prioritise our actions for the next five years.
We augment our regulatory minimum capital with internal buffers. We hold buffers to ensure we have enough time to take action against unexpected changes.
Risk mitigation
We designed our capital risk framework, policies and procedures to ensure that we operate within our Risk Appetite. We manage capital transferability between our subsidiaries in line with our business strategy, our risk and capital management policies, UK laws and regulations. There are no legal restrictions on us moving capital resources promptly, or repaying liabilities, between the Company and its subsidiaries except for distributions between Santander UK entities in the ring-fenced bank sub-group and Santander UK entities that are not members of the ring-fenced bank sub-group, where the PRA is required to assess the impact of proposed distribution prior to payment. For details on our Recovery framework in the event of a capital stress, see 'risk mitigation' in the ‘Liquidity risk’ section.
| | | | | | | | | | | | | | |
| Annual Report 2022 | Santander UK Group Holdings plc 159 |
| | | | | | | | | | | | | | | | | | | | | | | | | | | | | | | | | | | | | | | | | |
| Strategic Report | Sustainability and Responsible Banking | Governance | Risk review | Financial review | Financial
statements | Shareholder
information |
| | | | | | | | | | | | | |
| | | | | | | | | | | | | |
At 31 December 2022, Santander UK plc (RFB), Cater Allen Limited, Santander ISA Managers Limited and certain other non-regulated subsidiaries within the RFB were party to the RFB Sub-Group Capital Support Deed dated 17 December 2021. These parties were permitted by the PRA to form a core UK group, as defined in the PRA Rulebook, a permission which will expire on 31 December 2024. Exposures of each of the regulated entities to other members of the core UK group were exempt from large exposure limits that would otherwise apply. These intra-group exposures were risk-weighted at 0% and excluded from leverage exposure on a solo as well as consolidated basis. The purpose the Deed was to facilitate the prompt transfer of available capital resources from, or repayment of liabilities by, the non-regulated parties to any of the regulated parties in the RFB Sub-Group in the event that one of the regulated parties breached or was at risk of breaching its capital resources or risk concentrations requirements.
At 31 December 2022, Santander UK Group Holdings plc and Santander Financial Services plc, the regulated entities, and Santander Equity Investments Limited were party to the Non-RFB Sub-Group Capital Support Deed dated 17 December 2021. These parties were permitted by the PRA to form a core UK group, as defined in the PRA Rulebook, a permission which will expire on 31 December 2024. Exposures of each of the regulated entities to other members of the core UK group were exempt from large exposure limits that would otherwise apply. These intra-group exposures were risk-weighted at 0% and excluded from leverage exposure on a solo as well as consolidated basis. The purpose of the Deed was to facilitate the prompt transfer of available capital resources from, or repayment of liabilities by, the non-regulated parties to any of the regulated parties in the Non-RFB Sub-Group in the event that one of the regulated parties breached or was at risk of breaching its capital resources or risk concentrations requirements. For more details, see Note 31.
Risk monitoring and reporting
We monitor and report regularly against our capital plan. We do this to identify any change in our business performance that might affect our capital. Each month, we also review the economic assumptions we use to create and stress test our capital plan. We do this to identify any potential reduction in our capital.
CAPITAL RISK REVIEW
Meeting evolving capital requirements
We target a CET1 management buffer of sufficient size to absorb volatility in CET1 deductions, capital supply and capital demand whilst remaining above the current and expected future regulatory CET1 requirement. Distribution restrictions would be expected to be applied if we were unable to meet both our minimum requirement, which consists of the Pillar 1 minimum plus Pillar 2A, the CRD IV buffers consisting of the Capital Conservation Buffer (CCB), the Countercyclical Capital Buffer (CCyB), and the Other Systemically Important Institutions Buffer (O-SII) at the level of the RFB Group. Expected future regulatory CET1 requirements are impacted by the projected increase in the UK CCyB to 2% in July 2023.
Impact of IFRS 9 on regulatory capital
Our ECL methodology takes account of forward-looking data and covers a range of possible economic outcomes, and so provision movements may result in increased pro-cyclicality of risk-based capital and leverage ratios. However, the impact is currently mitigated by our surplus of IRB model regulatory expected losses over provisions for exposures using the IRB approach. For such exposures (which include residential mortgages) the adverse impact on CET1 capital of provision increases from reserve movements is offset by the related reduction of the negative CET1 capital adjustment for regulatory expected loss amounts. Furthermore, the UK CRR transitional rules for the capital impact of IFRS 9 mean that adverse CET1 effects from increases in ECL-based provisions from the level of such provisions at 1 January 2018 are partly reduced until the end of 2024.
We reflect projections of ECL provisions in our capital position forecasting under base case and stress scenarios for ICAAP and capital management purposes. We also consider the dynamics of ECL in how we assess and manage capital risk. A period of economic instability, such as that seen in early 2020 due to the impacts of the Covid-19 pandemic, could significantly impact our results and our financial assets. It could also impact the amount of capital we have to hold. We take into account the volatility of ECL in our capital planning strategy.
Bank of England stress testing
The results of the latest round of Bank of England stress tests were released in December 2021. As a result of the exercise, the Bank of England did not require Santander UK to undertake any actions. Before management actions and on a non-transitional IFRS 9 basis, with a low-point CET1 capital ratio of 11.2% we were well above the reference rate of 8.2%. Additionally, with a low-point UK leverage ratio of 4.1%, we were above the reference rate of 3.5%. The Bank of England’s reference rates comprise the sum of minimum capital requirements (4.5% of RWA plus Pillar 2A for the CET1 ratio, and 3.25% of Leverage Exposure for the UK Leverage Ratio), applicable systemic buffers, and an adjustment to offset the pro-cyclical impacts of IFRS 9.
Headroom of our CET1 capital ratio to our current MDA trigger level at 31 December 2022
At 31 December 2022, the headroom of our CET1 capital ratio of 15.2% to our 7% AT1 permanent write down (PWD) securities trigger was 8.2% of total RWAs or £5.8bn (2021: 8.9% of total RWAs or £6.1bn).
The headroom of our CET1 capital ratio to our current maximum distributable amount (MDA) trigger level at 31 December 2022 was:
| | | | | | | |
| | | Minimum |
| | | % |
| Pillar 1 | | | 4.5 | |
Pillar 2A(1) | | | 3.2 | |
| | | |
| Capital conservation buffer | | | 2.5 | |
| Countercyclical capital buffer | | | 1.0 | |
| Current MDA trigger | | | 11.2 | |
| Headroom | | | 4.0 | |
| CET1 capital ratio | | | 15.2 | |
(1) Santander UK's Pillar 2 requirement was 5.7% at 31 December 2022, Pillar 2A guidance is a point in time assessment.
Significant headroom to minimum capital requirements and MDA
Our current capital position provides significant headroom of 400bps above our MDA trigger. The UK leverage ratio of 5.2% is well above regulatory requirements.
| | | | | | | | | | | | | | |
| Annual Report 2022 | Santander UK Group Holdings plc 160 |
| | | | | | | | | | | | | | | | | | | | | | | | | | | | | | | | | | | | | | | | | |
| Strategic Report | Sustainability and Responsible Banking | Governance | Risk review | Financial review | Financial
statements | Shareholder
information |
| | | | | | | | | | | | | |
| | | | | | | | | | | | | |
Key capital ratios
| | | | | | | | | | | | | | | | | |
| Santander UK Group Holdings plc | | Santander UK plc |
| 2022 | 2021 | | 2022 | 2021 |
| % | % | | % | % |
| CET1 capital ratio | 15.2 | | 15.9 | | | 15.4 | | 16.1 | |
| AT1 | 3.1 | | 3.2 | | | 2.8 | | 2.9 | |
| Grandfathered Tier 1 | — | | 0.2 | | | — | | 0.2 | |
| Tier 2 | 2.1 | | 2.3 | | | 2.2 | | 2.7 | |
| Total capital ratio | 20.4 | | 21.6 | | | 20.4 | | 21.9 | |
The total subordination available to Santander UK plc senior unsecured bondholders was 20.4% (2021: 21.9%) of RWAs.
Return on assets - profit after tax divided by average total assets was 0.48% (2021: 0.48%).
Summarised change in CET1 capital ratio
| | | | | | | | |
| Change | CET1 Capital ratio |
| pp | % |
| 31 December 2021 | | 15.9 | |
| Regulatory changes on 1 January 2022 | -0.4 | |
| Pro forma at 1 January 2022 | | 15.5 | |
| Post dividend retained earnings | +0.8 | |
| Special dividend | -0.4 | |
| Fixed pension deficit contributions | -0.2 | |
| Expected loss less provisions | +0.2 | |
| RWA growth and other | -0.7 | |
| 31 December 2022 | | 15.2 | |
2022 compared to 2021
The CET1 capital ratio decreased 70 bps to 15.2%. This was largely due to regulatory changes that took effect on 1 January 2022, and a special dividend paid in December 2022. The regulatory changes included the reintroduction of the full CET1 software asset deduction, and implementation of new definition of default regulatory guidance. The impact of increased RWAs £71.2bn (£68.1bn) and the special dividend were partially offset by post dividend retained earnings. We remain strongly capitalised with significant headroom to minimum requirements and MDA.
Total capital ratio decreased by 120bps to 20.4%, due to the lower CET1 capital ratio as outlined above and the reduction in AT1 and Tier 2 capital securities recognised following the end of the CRR Grandfathering period on 1 January 2022.
| | | | | | | | | | | | | | |
| Annual Report 2022 | Santander UK Group Holdings plc 161 |
| | | | | | | | | | | | | | | | | | | | | | | | | | | | | | | | | | | | | | | | | |
| Strategic Report | Sustainability and Responsible Banking | Governance | Risk review | Financial review | Financial
statements | Shareholder
information |
| | | | | | | | | | | | | |
| | | | | | | | | | | | | |
Regulatory capital resources (audited)
This table shows our qualifying regulatory capital:
| | | | | | | | |
| 2022 | 2021 |
| £m | £m |
| CET1 capital instruments and reserves: | | |
| – Capital instruments | 7,060 | | 7,060 | |
| – Retained earnings | 6,563 | | 6,754 | |
| – Accumulated other reserves and non-controlling interests | (1,108) | | 138 | |
| CET1 capital before regulatory adjustments | 12,515 | | 13,952 | |
| CET1 regulatory adjustments: | | |
| – Additional value adjustments | (18) | | (25) | |
| – Goodwill (net of tax) | (1,133) | | (1,130) | |
| – Other intangibles | (351) | | (195) | |
| – Fair value reserves related to gains or losses on cash flow hedges | 1,116 | | (110) | |
| – Negative amounts resulting from the calculation of regulatory expected loss amounts | (517) | | (585) | |
| – Gains or losses on liabilities valued at fair value resulting from changes in own credit standing | (27) | | 0 | |
| – Deferred tax assets that rely on future profitability excluding timing differences | 0 | | (2) | |
| – Defined benefit pension fund assets | (755) | | (1,061) | |
| – NPE Backstop | (4) | | 0 | |
| – CET1 Capital Charge | 0 | | 0 | |
| – Dividend accrual | (3) | | (17) | |
| – IFRS 9 Transitional Adjustment | 20 | | 21 | |
| | |
| CET1 capital | 10,843 | | 10,848 | |
| AT1 capital instruments: | | |
| – Capital instruments | 2,196 | | 2,191 | |
| – Amount of qualifying items subject to phase out from AT1 | — | | 163 | |
| – Regulatory deductions for instruments issued by subsidiary undertakings | — | | (48) | |
| AT1 capital | 2,196 | | 2,306 | |
| Tier 1 capital | 13,039 | | 13,154 | |
| Tier 2 capital instruments: | | |
| – Capital instruments | 2,111 | | 2,263 | |
| – Amount of qualifying items subject to phase out from Tier 2 | 207 | | 35 | |
| – Regulatory deductions for instruments issued by subsidiary undertakings or subject to CRDIV amortisation and repurchases | (857) | | (725) | |
| Tier 2 capital | 1,461 | | 1,573 | |
| Total regulatory capital | 14,500 | | 14,727 | |
2022 compared to 2021
We paid £1.0bn interim dividends (2021: £1.3bn), £0.3bn of which was a special dividend. These were paid following review and approval by the Board in line with our dividend policy.
Movements in regulatory capital
| | | | | | | | | | | | | | |
| CET1 capital | AT1 capital | Tier 2 capital | Total |
| £m | £m | £m | £m |
| At 1 January 2022 | 10,848 | 2,306 | 1,573 | 14,727 |
–Retained earnings | (191) | | — | | — | | (191) | |
–Other reserves and non-controlling interests | (1,246) | | — | | — | | (1,246) | |
–Additional value adjustments | 7 | | — | | — | | 7 | |
–Goodwill (net of tax) | (3) | | — | | — | | (3) | |
–Other intangibles | (156) | | — | | — | | (156) | |
–Fair value reserves related to gains and losses on cash flow hedges | 1,226 | | — | | — | | 1,226 | |
–Negative amounts resulting from the calculation of regulatory expected loss amounts | 68 | | — | | — | | 68 | |
–Gains or losses on liabilities valued at fair value resulting from changes in own credit standing | (27) | | — | | — | | (27) | |
–Deferred tax assets that rely on future profitability excluding timing differences | 2 | | — | | — | | 2 | |
–Defined benefit pension fund assets | 306 | | — | | — | | 306 | |
–NPE Backstop | (4) | | — | | — | | (4) | |
–CET1 Capital Charge | — | | — | | — | | — | |
–Dividend accrual | 14 | | — | | — | | 14 | |
| | | | |
–Capital instruments | — | | 5 | | (152) | | (147) | |
–IFRS 9 Transitional Adjustment | (1) | | — | | — | | (1) | |
–Amount of qualifying items subject to phase out from AT1 | — | | (163) | | — | | (163) | |
–Amount of qualifying items subject to phase out from Tier 2 | — | | — | | 172 | | 172 | |
| - Deductions for instruments issued by subsidiary undertakings or subject to CRD IV amortisation | — | | 48 | | (132) | | (84) | |
| At 31 December 2022 | 10,843 | | 2,196 | | 1,461 | | 14,500 | |
| | | | | | | | | | | | | | |
| Annual Report 2022 | Santander UK Group Holdings plc 162 |
| | | | | | | | | | | | | | | | | | | | | | | | | | | | | | | | | | | | | | | | | |
| Strategic Report | Sustainability and Responsible Banking | Governance | Risk review | Financial review | Financial
statements | Shareholder
information |
| | | | | | | | | | | | | |
| | | | | | | | | | | | | |
In line with the position of the Basel Committee views following the outbreak of the Covid-19 pandemic, the UK has now adopted revised IFRS 9 transitional adjustment rules which apply a higher level of transitional relief to capital following rises in IFRS 9 provisions.
The original transitional adjustments consisted of a Static component, which was impacted on 1 January 2018 and a Dynamic component with changes in provisions for non-impaired assets made after 1 January 2018. A transitional factor was applied to the Dynamic component to determine the level of offset that was available over time (95% in 2018, 85% in 2019, 70% in 2020, 50% in 2021 and 25% in 2022).
The revisions to the transitional adjustment are part of the ‘Quick fix' CRR amendments which have been in force from 27 June 2020. They have involved dividing the original Dynamic component into two parts – creating an ‘old’ component for provision changes from 1 January 2018 to 1 January 2020, and then a new Dynamic component for provision changes from 1 January 2020 and applying a revised higher transitional factor to this latter component, with an extended transitional period.
CET1, AT1 and Tier 2 regulatory adjustments
These are adjustments required by CRD IV.
AT1 capital
These are preference shares and innovative/hybrid Tier 1 securities. None of the instruments we issued before 1 January 2014 fully meet the CRD IV AT1 capital rules, which apply from that date. The instruments contribution to Tier 1 capital was phased out by CRD IV rules in 2021. The £750m Fixed Rate Reset Perpetual AT1 Capital Securities (net of issuance costs), the £800m Perpetual Capital Securities and the £500m Perpetual Capital Securities we issued since then fully meet the CRD IV AT1 capital rules.
Tier 2 capital
These are fully CRD IV eligible Tier 2 instruments and grandfathered Tier 2 instruments whose recognition as capital was phased out under CRD IV in 2021.
MREL recapitalisation
As at the end of 2022, we have outstanding £12.2bn of MREL compliant senior unsecured bonds.
Our forward-looking MREL recapitalisation plan assumes the Pillar 2A requirement remains at 5.7% and is calculated using RWA, leverage exposures and exchange rates at 31 December 2022. Based on this set of assumptions, our MREL requirements are driven by our RWAs. Santander UK’s indicative MREL requirements including combined buffer requirements is currently circa £23bn from 31 December 2022.
In addition to meeting our minimum requirement, we intend to have an MREL recapitalisation management buffer in excess of the value of Santander UK Group Holdings plc senior unsecured securities that are due to become MREL ineligible over the following six months, plus a buffer for foreign exchange movements.
Risk-weighted assets
The tables below are consistent with our regulatory filings for 31 December 2022 and 31 December 2021.
| | | | | | | | |
| 2022 | 2021 |
| RWAs by risk | £bn | £bn |
| Credit risk | 63.0 | | 60.2 | |
| Counterparty risk | 0.7 | | 1.0 | |
| Market risk | 0.3 | | 0.2 | |
| Operational risk | 7.2 | | 6.7 | |
| 71.2 | | 68.1 | |
| | | | | | | | |
| 2022 | 2021 |
| RWAs by segment | £bn | £bn |
| Retail Banking | 44.6 | | 42.9 | |
– Homes | 35.0 | | 34.2 | |
– Everyday Banking | 9.6 | | 8.7 | |
| Consumer Finance | 7.3 | | 6.4 | |
| Corporate & Commercial Banking | 14.0 | | 13.6 | |
| | |
| Corporate Centre | 5.3 | | 5.2 | |
| 71.2 | | 68.1 | |
Movements in RWAs by risk:
| | | | | | | | | | | | | | |
| Credit/counterparty
risk | Market risk | Operational
risk | Total |
| £bn | £bn | £bn | £bn |
| At 1 January 2022 | 61.2 | | 0.2 | | 6.7 | | 68.1 | |
| Asset size | 0.9 | | 0.1 | | 0.5 | | 1.5 | |
| Asset quality | 0.4 | | — | | — | | 0.4 | |
| Model updates | 0.5 | | — | | — | | 0.5 | |
| Methodology and policy | 0.7 | | — | | — | | 0.7 | |
| | | | |
| | | | |
| | | | |
| At 31 December 2022 | 63.7 | | 0.3 | | 7.2 | | 71.2 | |
| | | | | | | | | | | | | | |
| Annual Report 2022 | Santander UK Group Holdings plc 163 |
| | | | | | | | | | | | | | | | | | | | | | | | | | | | | | | | | | | | | | | | | |
| Strategic Report | Sustainability and Responsible Banking | Governance | Risk review | Financial review | Financial
statements | Shareholder
information |
| | | | | | | | | | | | | |
| | | | | | | | | | | | | |
Regulatory leverage
| | | | | | | | |
| 2022 | 2021 |
| £m | £m |
| Regulatory exposure | 248,602 | 246,304 |
End-point Tier 1 capital(1) | 12,863 | 12,849 |
| UK leverage ratio | 5.2 | % | 5.2 | % |
| BBLS lending excluded from leverage exposure | (2,564) | (3,622) |
(1) Includes deductions and AT1 adjustment permitted under the recommendation from the Financial Policy Committee on 25 July 2016.
Under the PRA rules, we adjust our total assets per the Consolidated Balance Sheet to calculate our regulatory exposure for leverage purposes. We do this as follows:
| | | | | | | | |
| 2022 | 2021 |
| £m | £m |
| Total assets per the Consolidated Balance Sheet | 292,243 | | 293,676 | |
| Derivatives netting and potential future exposure | (1,305) | | (646) | |
| Securities financing current exposure add-on | 371 | | 518 | |
| Removal of IFRS netting | 923 | | 1,052 | |
| Removal of qualifying central bank claims | (49,199) | | (54,116) | |
| Commitments calculated in accordance with Basel Committee Leverage Framework | 6,971 | | 7,619 | |
| CET1 regulatory adjustments | (1,402) | | (1,799) | |
| 248,602 | | 246,304 | |
The adjustments are:
–Derivatives netting and potential future exposure: where a qualifying netting agreement is in place netting is allowed for leverage purposes. This is partially offset by including the Potential Future Exposure (PFE) we use to calculate EADs
–Securities financing current exposure add-on: we include an add-on for securities financing transactions to show current exposure for leverage purposes
–Removal of IFRS netting: where netting of assets and liabilities is allowed under IFRS, but not under the Basel rules, we remove it for leverage purposes
–Removal of qualifying central banks claims: permitted under the recommendation of the Financial Policy Committee (FPC) on 25 July 2016, but under CRD IV rules the exposure measure does not allow the removal of qualifying central bank deposits or claims
–Commitments calculated in accordance with Basel Committee Leverage Framework: we add the gross value of off-balance sheet commitments for leverage purposes after we apply regulatory credit conversion factors
–CET1 regulatory adjustments: where we have deducted assets from CET1, they can be deducted for leverage purposes.
2022 compared to 2021
The UK leverage ratio remained stable at 5.2%, as retained profit was partially offset by the change in treatment of software assets on 1 January 2022. UK leverage exposure remained broadly stable at £248.6bn (2021: £246.3bn).
Distributable items
Distributable items are equivalent to distributable profits under the UK Companies Act 2006. The distributable items of Santander UK Group Holdings plc under CRD IV at 31 December 2022 and 31 December 2021, and movements in the period, were as follows:
| | | | | | | | |
| 2022 | 2021 |
| £m | £m |
| At 1 January | 4,262 | | 4,252 | |
| Dividends approved: | | |
–AT1 Capital Securities | (143) | | (143) | |
–Tax on above item | 27 | | 27 | |
–Ordinary shares | (1,013) | | (1,346) | |
| Dividends receivable: | | |
–Investment in AT1 Capital Securities | 133 | | 131 | |
–Tax on above item | (25) | | (25) | |
–Investment in ordinary shares of subsidiary | 1,079 | | 1,366 | |
| Other income statement items (Company) | (13) | | — | |
| At period end | 4,307 | | 4,262 | |
| | | | | | | | | | | | | | |
| Annual Report 2022 | Santander UK Group Holdings plc 164 |
| | | | | | | | | | | | | | | | | | | | | | | | | | | | | | | | | | | | | | | | | |
| Strategic Report | Sustainability and Responsible Banking | Governance | Risk review | Financial review | Financial
statements | Shareholder
information |
| | | | | | | | | | | | | |
| | | | | | | | | | | | | |
Pension risk
| | | | | | | | | | | | | | | | | |
| | | | | |
| Overview Pension risk is the risk caused by our statutory contractual or other liabilities with respect to a pension scheme (whether set up for our employees or those of a related company or otherwise). It also refers to the risk that we will need to make payments or other contributions with respect to a pension scheme due to some other reason. In this section, we explain how we manage and mitigate pension risk, including our investment and hedging strategies. We also discuss our key metrics and developments in the year. | | | Key metrics Funding Deficit at Risk was £860m (2021: £1,190m)
Funded defined benefit pension scheme accounting surplus was £1,051m (2021: £1,573m) | |
OUR KEY PENSION RISKS
Sources of risk
Pension risk is one of our key financial risks. Santander UK plc is the sponsor of the Santander (UK) Group Pension Scheme (the Scheme), a defined benefit scheme. Our risk is that over the long-term the Scheme’s assets are not enough to meet its liabilities as they fall due. If this happens, we could have to (or choose to) make extra contributions. We might also need to hold more capital to reflect this risk.
The Scheme, risk metrics and regulatory capital can be sensitive to changes in the assumptions of the key risk factors shown below.
| | | | | |
| Key risks | Description |
| Interest rate risk | The risk that a decrease in (long-term) interest rates causes an increase in the value of the Scheme’s liabilities that are not matched by an increase in the value of its assets. |
| Inflation risk | Annual pension increases are directly linked to RPI or CPI. The risk is that an increase in inflation causes an increase in the value of the Scheme’s liabilities that are not matched by an increase in the value of its assets. |
| Longevity risk | The Scheme’s liabilities are in respect of current and past employees and are expected to stretch beyond 2080 due to the long-term nature of the obligation. Therefore, the Scheme’s liabilities are also impacted by changes to the life expectancy of Scheme members over time. |
| Investment risk | The risk that the return on the Scheme’s assets is insufficient to meet the liabilities. |
For more on our defined benefit schemes, including sensitivity analysis of our key actuarial assumptions, see Note 30 to the Consolidated Financial Statements.
Defined contribution schemes
We also have defined contribution schemes for some of our employees. These schemes carry far less market risk for us, although we are still exposed to operational and reputational risks. For more on our defined contribution schemes, see Note 30 to the Consolidated Financial Statements.
The impact of our defined benefit schemes on capital
We take account of the impact of pension risk on our capital as part of our planning and stress testing process, considering measures such as the impact on CET1 and Pillar 2A, and also where relevant the impact on the related measures such as the leverage ratio.
Our defined benefit pension schemes affect capital in two ways:
–We treat an IAS 19 deficit as a liability on our balance sheet. We recognise deficit movements in Other Comprehensive Income, so this reduces shareholders’ equity and CET1 capital. We treat an IAS 19 surplus as an asset. This increases shareholders’ equity, but it is deducted in determining CET1 capital. An IAS 19 surplus/deficit is partially offset by a deferred tax liability/asset. These may be recognised for calculating CET1 capital depending on our overall tax position.
–The PRA takes pension risk into account in the Pillar 2A capital assessment in the annual ICAAP exercise. Pillar 2A is part of our overall regulatory requirement for CET1 capital, Tier 1 capital and total capital. For more on our regulatory requirements, see the ‘Capital risk’ section.
PENSION RISK MANAGEMENT
Scheme governance
For details of how the Scheme is governed and operates, see Note 30 to the Consolidated Financial Statements.
Risk appetite
Our risk appetite is a key consideration in all decisions and risk management activities related to the Scheme. Our pension risk appetite is reviewed by our Pensions Committee at least once a year. It is then sent to the Board for approval. We measure pension risk on both a technical provisions (funding) basis and an accounting (IAS 19) basis. We manage pension risk on both the accounting and the funding basis. Both bases are inputs into our capital calculations.
Risk measurement
Our key risk metrics include:
| | | | | |
| Key risk metrics | Description |
| Funding Deficit at Risk | We use a VaR and a forward-looking stress testing framework to model the Scheme’s assets and liabilities to show the potential deterioration in the funding position. |
| Required Return | This estimates the return required from the Scheme’s assets each year to reach a pre-defined funding target by a fixed date in the future. |
| Pensions Volatility | We use a VaR and a forward-looking stress testing framework to model the volatility in the pension-related capital deduction. |
The Scheme invests in certain assets whose values are not based on market observable data, such as investments in private equity funds and property. See Note 30 to the Consolidated Financial Statements for more details. The risks of these assets are included in the metrics described above.
| | | | | | | | | | | | | | |
| Annual Report 2022 | Santander UK Group Holdings plc 165 |
| | | | | | | | | | | | | | | | | | | | | | | | | | | | | | | | | | | | | | | | | |
| Strategic Report | Sustainability and Responsible Banking | Governance | Risk review | Financial review | Financial
statements | Shareholder
information |
| | | | | | | | | | | | | |
| | | | | | | | | | | | | |
We perform stress tests for regulators, including for ICAAPs and PRA stress tests. For more on our stress testing, see the 'Risk governance' section.
Climate change scenario testing was developed in 2021 and refined in 2022 giving us the capacity to simulate risk exposures over an extended time horizon. The Trustee adopted a target of net zero by 2050. This target is now factored into Trustee decision making.
Risk mitigation
The key tools we use to maintain the above key risk metrics within appetite are:
| | | | | |
| Key tools | Description |
| Investment strategies | The Trustee developed the following investment objectives to reflect their main duty to act in the best interests of Scheme beneficiaries: –To maintain a diversified portfolio of assets of appropriate quality, security, liquidity and profitability to generate income and capital growth to meet, with new contributions from members and employers, the cost of current and future benefits that the Scheme provides –To limit the risk that the assets fail to meet the liabilities –To invest in a manner appropriate to the nature and duration of the expected future retirement benefit payments under the Scheme –To minimise the Scheme's long-term costs by maximising asset returns net of fees and expenses whilst reflecting the objectives above. The investment strategy is regularly reviewed, and its impact on Funding Deficit at Risk is considered. |
| Hedging strategies | The Trustee employs asset-liability matching arrangements including the use of liability driven investment strategies, and has a hedging strategy to reduce key market risks, mainly interest rate and inflation risk, but also currency risk. We monitor available collateral and liquidity with the objective of ensuring we have sufficient collateral and/or liquidity available to meet any margin calls. |
| Environmental, social and governance (ESG) | The Trustee has established a Sustainability Committee which is responsible for overseeing the Scheme’s policies, regulatory obligations and priorities in respect of climate change and wider ESG related matters. |
We look at the impact on our risk metrics when determining the appropriateness of the investment and hedging strategies.
Risk monitoring and reporting
We monitor pension risk each month and report on it at Pension Risk Forum, ERCC, Pensions Committee and, where thresholds are exceeded (or likely to be), to the Board Risk Committee and the Board in line with our pension risk appetite. We discuss any remedial action with the Trustee.
In addition, we monitor the performance of third parties who support the valuation of the Scheme’s assets and liabilities.
PENSION RISK REVIEW
2022 compared to 2021
Asset de-risking continued in 2022 as part of the long-term goal to reduce the risk of the Scheme, in particular with listed equities being sold and investment grade corporate bonds being purchased. In 2022, the Scheme purchased a second annuity policy and entered into a second longevity swap. These covered most pensioners in the Scheme who retired since the first annuity purchase and longevity swap. There was also a significant focus on ensuring sufficient liquidity and collateral levels in the Scheme and securing a positive outcome for the 2022 triennial actuarial valuation with the Trustee.
Risk monitoring and measurement
Our main focus is to ensure the Scheme achieves the right balance between risk and reward whilst minimising the impact on our capital and financial position. At 31 December 2022, the Funding Deficit at Risk decreased to £860m (2021: £1,190m), mainly due to actions such as interest rate and inflation hedging, and the sale of growth assets, including listed equities, hedge funds and commercial property.
The impact from variations in the IAS 19 position on CET1 capital was not significant in 2022. For more on the impact of our defined benefit schemes on capital, see the ‘Capital risk’ section.
Accounting position
The accounting position deteriorated over 2022. The Scheme sections in surplus had an aggregate surplus of £1,051m at 31 December 2022 (2021: £1,573m) while there were no sections in deficit (2021: none). The overall funded position was a £1,051m surplus (2021: £1,573m surplus). There were also unfunded liabilities of £25m at 31 December 2022 (2021: £37m). The overall deterioration was mainly driven by negative asset returns over the period, partially offset by an increase in the discount rate due to rising gilt yields, and deficit contributions paid into the Scheme.
There remains considerable market uncertainty and while the actions above mitigate some of the impact of market movements on yields, our position could change materially over a short period.
For more on our pension schemes, including the asset allocation and our accounting assumptions, see Note 30 to the Consolidated Financial Statements.
Maturity profile of undiscounted benefit payments
The Scheme’s obligation to make benefit payments extends over the long-term. This is expected to stretch beyond 2080. The graph below shows the maturity profile of the undiscounted benefit payments expected to be paid from the Scheme over its life at 31 December 2022:
| | | | | | | | | | | | | | |
| Annual Report 2022 | Santander UK Group Holdings plc 166 |
| | | | | | | | | | | | | | | | | | | | | | | | | | | | | | | | | | | | | | | | | |
| Strategic Report | Sustainability and Responsible Banking | Governance | Risk review | Financial review | Financial
statements | Shareholder
information |
| | | | | | | | | | | | | |
| | | | | | | | | | | | | |
Operational risk & resilience
| | | | | | | | | | | | | | | | | |
| | | | | |
| Overview Operational risk is the risk of loss or adverse impact due to inadequate or failed internal processes, people and systems, or external events. Operational resilience is the ability to prevent disruption occurring to the extent practicable; adapt systems and processes to continue to provide services and functions in the event of an incident; return to normal running promptly when a disruption is over; and learn and evolve from both incidents and near misses. The combined ‘Operational Risk & Resilience Framework’ reflects the importance of operational resilience and the intrinsically close links between the management of operational risk and the operational resilience of the organisation - Operational Resilience is the outcome of executing sound Operational Risk practices. In this section, we explain how we manage operational risk, with a focus on our top operational risks. These top operational risks may change each year depending on the relative movement in importance among all operational risks. We also describe our operational risk event losses and developments in the year. | | | Key metrics Operational risk losses (over £10,000, and excluding PPI) increased by 160% compared to 2021.
| |
OUR KEY OPERATIONAL RISKS
Operational risk is inherent in our business. As a result, we aim to manage it down to as low a level as possible, rather than eliminate it entirely. Operational risk events can have a financial impact and can also affect our business objectives, customer service and regulatory obligations. These events can include product mis-selling, fraud, process failures, system downtime and damage to assets or external events.
Our top operational risks are:
| | | | | |
| Key risks | Description |
| Cyber | We rely extensively on the use of technology to support our customers and to run our business. While technology allows us to develop and improve the way we serve our customers, it is critically important that we protect our customers’ data and provide them with a secure environment in which to deal with us. Failure to protect the data of Santander UK and its customers against theft, damage or destruction from cyber-attacks could cause operational disruption, unauthorised access, loss or misuse of data, breach of regulations, negative customer outcomes, financial loss or reputational damage. The value of the data itself, especially personal details of customers and employees is a focus of cyber criminals along with systems that enable cyber attacks to be monetised. It is therefore critical that we are resilient to cyber-attacks and can quickly recover from them. |
| Data Management | We use data in all of our services and products. Data Management risk is where this data does not support the business outcomes, either through incorrect decisions or offerings, due to issues with its data quality. Data quality issues may be caused by technology incidents or processing errors. |
| Fraud | Fraud can be committed by first parties (our customers), second parties (people known to our customers or us), third parties (people unknown to our customers or us), and internally by our staff. We are committed to protecting ourselves and our customers from fraud and to mitigating our fraud risk in an ever-evolving external fraud environment. |
| IT | As noted in Cyber, technology is vital to our processes and operations, and in providing service to our customers. IT risk arises from any event related to the use of technology supporting business processes, where the event may result in the unavailability or failure of systems or in processing errors that impact our customers or operations. This includes hardware or software failures, or issues caused by change. |
| People | People risks include all risks related to employees and third parties working for us, covering resource management, health, safety and wellbeing and employee relations. People risk is a transverse risk as resource capacity, capability, and engagement challenges impact all risk types. As we develop our working practices and adapt to changing circumstances, people impacts and risks continue to be key considerations. |
| Third party | We rely extensively on third parties, both within the Banco Santander group and outside of it, for a range of services and goods. These include outsourced services, such as IT infrastructure including increasing use of the Cloud, software development and banking operations. Regulations require us to classify other legal entities in the Banco Santander group as external suppliers, so we manage them as third parties. Many suppliers are also shared across the sector and this could increase risk due to complexity and capacity issues at the third parties. The failure of a supplier may cause operational disruption, breach of data security or regulations, negative customer impact, financial loss or reputational damage. |
| Transformation and Change | Change risk arises in any activity that transforms our business strategy, operating environment, or products and services we provide to our customers. Management of change risks is an integral part of our governance and our focus, given the potential for impacts across all areas of non-financial risk. Failure to ensure change is appropriately considered, funded, executed and managed could result in operational disruption, poor customer outcomes, financial loss, reputational damage and may impede our ability to meet regulatory requirements. |
We are also exposed to tax risk which, even though it is a lower risk for us, is still a high-profile risk and may include legacy items. We adopted the Code of Practice on Taxation for Banks in 2010.
OPERATIONAL RISK MANAGEMENT
Risk appetite
We set our operational risk appetite at a Santander UK group level and we express it through measures approved by the Board. These include risk statements and metrics set against our main non-financial risk event types. We also set lower level triggers, qualitative parameters and quantitative thresholds across our business. We monitor our risk profile and performance against the risk appetite under several key risk areas, and we have processes to identify, assess, manage and report risks and events. We incorporate Banco Santander group principles and standards, regulatory requirements and best practice, where applicable. Coverage across the seven CRD IV loss event types is comprehensive and aligns to the key risk areas approved by ERCC.
| | | | | | | | | | | | | | |
| Annual Report 2022 | Santander UK Group Holdings plc 167 |
| | | | | | | | | | | | | | | | | | | | | | | | | | | | | | | | | | | | | | | | | |
| Strategic Report | Sustainability and Responsible Banking | Governance | Risk review | Financial review | Financial
statements | Shareholder
information |
| | | | | | | | | | | | | |
| | | | | | | | | | | | | |
Risk measurement
The key components of the operational risk toolset we use to measure and mitigate risk are:
| | | | | |
| Operational risk toolset | Description |
| Operational risk and control assessments | Our business units identify and assess their operational risks to ensure they manage and control them within our operational risk appetite, and prioritise actions needed. Every area must identify and record their material risks, assess their controls for adequacy and then accept the risk or plan to address any deficiencies. We also use operational risk assessments and risk rating tools as key parts of change risk management. |
| Risk scenario analysis | We perform this across business units. It involves a top down assessment of our key operational risks. We update our scenarios each year. The analysis gives us insight into rare but high impact events and allows us to understand potential impacts and address issues. |
| Key indicators | Key indicators and their tolerance levels give us an objective view of risk exposure or the strength of a control at any point in time. They also show trends and give us early warning of potential increasing risk exposures. Of primary importance are our business-wide risk appetite indicators which show adherence to our risk appetite statements. |
| Operational risk event and loss management | Operational risk events occur when our controls do not operate as we planned and this leads to customer impact, financial loss, regulatory impacts and/or damage to our reputation. We use data from these processes to identify and correct any control weaknesses. We also use root cause analysis to identify emerging themes, to prevent or reduce the impacts of recurrence and to support risk and control assessments, scenario analysis and risk reporting. Our operational risk loss appetite sets the level of total operational risk loss (expected and unexpected) in any given year (on a 12-month rolling basis) that we consider to be acceptable. We track actual losses against our appetite, and we escalate as needed. |
| Risk based insurance | Where appropriate, we use insurance to complement other risk mitigation measures. |
Risk mitigation
We mitigate our key operational risks in the following ways:
| | | | | |
| Key risks | Risk mitigation |
| Cyber | Protecting our customers, systems and data remains a top priority for us. We operate a layered defence approach which we regularly assess to ensure that it addresses the prevailing threats. We validate our controls using tests designed to replicate real-world cyber-attacks. Our cyber security experts assess our overall cyber security posture and report to management each month, and to ExCo, ERCC, BRC and Board at least twice a year. We assess cyber controls and risks each quarter using Banco Santander's Holistic Cyber Risk Framework. Keeping our systems secure is a bank-wide responsibility and we continue to enhance our staff training to support this. We also have targeted training for Board members, senior management and other employees. We continue to work with other banks through the Cyber Defence Alliance, where we share intelligence on cyber threats and effective strategies to counter them. We campaign to raise awareness and give customers the knowledge they need to avoid becoming victims of cyber attacks. As part of this, we run customer education campaigns, and we offer advice through our online security centre. We also have a cyber insurance policy to give us comprehensive cover to respond and recover losses and damages from security or system failures and any impact of a data breach. |
| |
| Data | We continue to monitor and mitigate data risk through enhanced governance structures and processes supported by effective deployment of our risk and control library. We assess Data risk each year as part of the Risk and Control Self-Assessment (RCSA) process and update our risk profile as needed. Our data management programme is a key enabler to ensuring our data is fit for purpose and making improvements to our underlying processes and data governance. We are also embedding Data Marketplace as a holistic system for data management across the bank, ensuring a more robust and comprehensive approach for managing data. |
| Fraud | We operate layered security controls combining prevention and detection controls, to mitigate risks. The current fraud environment is incredibly challenging, and as such our current Fraud Transformation programme contains several projects that are designed to reduce the risks to us and our customers. We are committed to taking a more preventative approach to mitigate these risks. To help support customers, over the past five years we have created a series of fraud education and media campaigns, many of which focus on drawing public attention to common frauds, such as purchase scams, investment fraud, and money mules, and how to avoid them. |
| IT | We proactively monitor technology platforms and applications through automated alerts to detect events that may impact their performance or availability. We investigate material events to identify the root cause and remedial actions needed. We escalate these events as needed through the Santander Early Escalation Notification (SEEN) Process, and we review them each quarter to identify trends we need to remediate. We assess IT risk each year as part of the RCSA process and update our risk profile as needed. |
| People | We monitor people risks through the use of a broad range of operational risk indicators covering capacity, capability, engagement and diversity and inclusion. These are reviewed and refreshed annually to track and monitor all people related measures. We mitigate people risk through adopting various attraction and retention strategies throughout the employee lifecycle, and by delivering a competitive employee value proposition including hybrid working. All significant people-related change initiatives must have Operational Risk Assessments conducted. We also have processes to capture and assess people-related events. |
| Third party | We identify and assess the risk profile of each of our third party arrangements before onboarding and throughout the relationship. We also identify and measure key third party risks within our operational risk and control assessments. We capture and assess related events, and use operational risk indicators to measure the third party risk profile of the business. We aim to ensure that our suppliers meet our risk and control standards beginning with on-boarding, throughout our relationship with them, and during off-boarding. |
| Transformation and change | Risk management of Transformation and Change is integrated within our project governance framework, known as One Governance, which brings together project planning and prioritisation, cost discipline and risk management of all project portfolios under one unified system environment. Projects are initially subject to rigorous review to ensure that demand funded is prioritised based on what the bank should, needs and wants to do for the benefit of our customers clients, colleagues and franchise, a process which incorporates risk and regulatory considerations. At an individual initiative level, the key risk management requirements are supported by an initial Project Risk Rating (PRR) which considers the risk an initiative poses to us and allows application of risk-based governance. An Executive Risk Summary (ERS) and an Operational Risk Assessment (ORA) are completed for all but very low risk rated projects. Our Change Risk Oversight Group assesses and manages risks at portfolio level. We continue to take a measured approach to executing risk and delivering cost savings, with a focus on prioritisation and capacity management. |
Risk monitoring and reporting
Reporting is a key part of how we manage risk. We can identify exposures through our operational risk and control assessments, risk scenario analysis, key indicators, operational risk assessments and incidents and events. We report exposures for each business unit through regular risk and control forums. These include details of risk exposures and how we plan to mitigate them. We prioritise and highlight events that have a material impact on our customers, reputation or finance by reporting them to key executives and committees. We use The Standardised Approach (TSA) to calculate our Pillar 1 operational risk capital. We use an internal model aligned to the CRD IV advanced measurement approach to validate our Pillar 2 capital needs.
Our crisis management framework covers all levels of the business. It sets out possible triggers and how we will manage a crisis, and we test it at least annually. If an event occurs, our business continuity plans help us recover as quickly as possible and we undertake post incident reviews to identify learnings.
| | | | | | | | | | | | | | |
| Annual Report 2022 | Santander UK Group Holdings plc 168 |
| | | | | | | | | | | | | | | | | | | | | | | | | | | | | | | | | | | | | | | | | |
| Strategic Report | Sustainability and Responsible Banking | Governance | Risk review | Financial review | Financial
statements | Shareholder
information |
| | | | | | | | | | | | | |
| | | | | | | | | | | | | |
OPERATIONAL RISK REVIEW
2022 compared to 2021
Operational risk event losses
The table below shows our operational losses in 2022 and 2021 for reportable events with an impact over £10,000, excluding conduct risk events (which we discuss separately in the ‘Conduct and regulatory risk’ section), by CRD IV loss event types.
| | | | | | | | | | | | | | | | | |
| 2022 | | 2021 |
| Value
% | Volume
% | | Value
% | Volume
% |
| | | | | |
| External fraud | 27 | | 95 | | | 30 | | 89 | |
| | | | | |
Clients, products and business practices(1) | 77 | | 1 | | | 41 | | 2 | |
| | | | | |
| Business disruption and systems failures | (3) | | — | | | 14 | | 1 | |
| Execution, delivery, and process management | (1) | | 4 | | | 15 | | 8 | |
| 100 | | 100 | | | 100 | | 100 | |
(1) 2% volume in 2021 was previously categorised as Employment practices and workplace safety
The value of our operational risk losses (events over £10,000) increased by 160% in 2022 largely due to the AML penalty and the continued increase in Fraud losses. In line with general industry trends, the value and volumes of losses due to cases of External Fraud increased by 138% and 119% respectively. We continue to enhance our anti-fraud measures to help protect our customers. Additionally, we have observed a rise in the number of events and losses prompted by the increasing level of change, resulting from delivery of regulation, industry developments and the need to further digitalise the business.
Cyber risk
Information and cyber security remain a top risk and a priority. We experienced no notable data and cyber security incidents in 2022. We continue to see increasing ransomware attacks across all sectors driven by compromises in supply chain tools and we expect this trend to continue. We continue to invest in the right skills and resources to manage data and cyber risk. We also continue to monitor the cyber threat from the conflict in Ukraine.
Data risk
in 2022, we continued to monitor data management risk through the enhanced governance structures and processes put in place by our Chief Data Officer. Our Data Programme is progressing with clearly defined deliverables that will improve our ability to manage data and enhance our data management capabilities, in line with our approved Data Strategy.
Fraud risk
Fraud against our customers and the bank remains a top risk and a priority. Fraud levels across UK banks continued to rise in 2022. Social engineering techniques used by fraudsters are a significant threat to customers and outside of the bank’s controls. As such, in line with peers, Authorised Push Payment (APP) fraud is our largest fraud type. We are focused on preventative measures and in response to increasing fraud attacks, we designed new fraud prevention tools to complement our existing prevention and detection systems and controls. We continue to deploy dynamic ‘scam warnings’ in our online banking payment process, enhancing fraud prevention controls for high-risk digital payments, presenting customers with tailored questions and warnings specific to their payment journey. We play an actively collaborate on fraud management with industry partners, through UK Finance and Stop Scams UK. In 2022, we continued our customer awareness campaigns on the most common frauds and scams.
IT risk
The importance of IT continued to be reiterated by some outages to customer services in 2022 and we continue progressing a wide programme to address the root causes and further reduce key risks within our IT estate. The programme is expected to deliver risk reduction over a three year horizon and progress is closely monitored though our risk governance.
People risk
This risk continues to be compounded by changes in operating models and the execution of our strategies. We continue to adapt and respond to these risks; in particular, the people risks associated with the phased relocation of our Head Office to Unity Place in Milton Keynes, which are under close monitoring and management. 2022 saw lower wellbeing-related absence but, in line with our peers, we continue to see raised attrition levels reflecting a more buoyant job market. Potential impacts on productivity are supported with our wellbeing and inclusion strategy, centred on helping colleagues through change. As appropriate, we advocate hybrid working to encourage colleagues to return to offices, and are providing support as external economic factors impact some colleagues.
Third party risk
We continue to rely extensively on third parties, both within the Banco Santander group and outside of it, for a range of goods and services. In 2022, we continued to evolve our processes. This included implementing a new Third Party Risk Management process and amending contracts with suppliers.
Transformation and change
The way in which we operate, the technology we rely on, and how we interact with our customers and stakeholders is constantly evolving, and consequently, our ability as an organization to meet this change is a key priority. In 2022, we continued our transformation to simplify the bank, digitise processes and customer journeys, reduce cost, extend internal capabilities and ensure a resilient operating model. This included reducing our property footprint and significant delivery against a diverse transformation agenda with specific focus on a migration to the cloud, further digitalisation and managing obsolescence. Ensuring change does not result in unacceptable impacts on our risk profile underpins our strategic decisions and is robustly managed.
Operational Resilience
We have committed that, by 2025, we will address the vulnerabilities identified in the first operational resilience self-assessment approved by the Board and submitted to our regulators in March 2022. Achieving this will enhance our resilience, i.e. the ability of Santander UK to recover its Important Business Services (IBS) within Impact Tolerance levels to avoid intolerable harm to customers, the firm, or the market, with focus on vulnerable customers. In 2022, we focused on enhancing and testing our firm-wide recovery strategies and readiness to respond to a range of potential external events. Our operational resilience programme was subject to independent external review in January 2022 and received a satisfactory rating from Internal Audit in July 2022. A programme is in progress to remediate identified asset vulnerabilities which could directly affect our ability to recover our IBS within Impact Tolerances in the event of an outage. We have introduced resilience assessments across technology, data, people, third parties, and premises, which enhance our ability to monitor, oversee and action issues. Input to these assessments include scenario test outputs, post incident reviews, metrics, RCSAs, and event data. The Board continues to be actively engaged in the operational resilience journey and in March 2023 are to approve our annual operational resilience self-assessment.
| | | | | | | | | | | | | | |
| Annual Report 2022 | Santander UK Group Holdings plc 169 |
| | | | | | | | | | | | | | | | | | | | | | | | | | | | | | | | | | | | | | | | | |
| Strategic Report | Sustainability and Responsible Banking | Governance | Risk review | Financial review | Financial
statements | Shareholder
information |
| | | | | | | | | | | | | |
| | | | | | | | | | | | | |
Conduct and regulatory risk
| | | | | | | | | | | | | | | | | |
| | | | | |
| Overview We manage conduct and non-financial regulatory risk types in one framework to reflect their similarities. Conduct risk is the risk that our decisions and behaviours lead to detriment or poor outcomes for our customers. It also refers to the risk that we fail to maintain high standards of market behaviour and integrity. Regulatory risk is the risk of financial or reputational loss, or imposition of or conditions on regulatory permission, as a result of failing to comply with applicable codes, regulator’s rules, guidance and regulatory expectations. In this section, we explain how we manage conduct and regulatory risk. We also describe our main conduct and regulatory provisions.
| | | Key metrics Customer remediation provision was £90m (2021: £44m) Litigation and other regulatory provision was £136m (2021: £166m)
| |
OUR KEY CONDUCT AND REGULATORY RISKS
Our purpose is to help customers and businesses prosper. To achieve this, we are committed to ensuring conduct strategy is embedded in our business, good outcomes for our customers is at the heart of what we do and that our proposition and initiative approval process, and systems, operation and controls are well designed and operating effectively. We see our key exposure to conduct and regulatory risk through the risk of errors in our product design, sales practices, post-sale servicing, operational processes, complaint handling, and the failure to supervise, monitor or control the activities of our employees. All of these may result in the risk that we do not meet our customers’ needs, align to the expectations of our regulators, deliver the expected outcomes or observe required standards of market behaviour.
Our Conduct and Regulatory Framework is built on the following risks:
| | | | | |
| Key risks | Description |
| Regulatory | The risk that we fail to adhere to laws, regulations and codes which could have serious financial, reputational and customer impacts, including the risk that we may be adversely impacted by changes and uncertainty around UK and international regulations. We categorise regulatory risk into financial and non-financial risk aligned to our main regulators - the PRA and FCA - and other UK regulators and authorities. As part of the Banco Santander group, we are also impacted indirectly through regulation by the Banco de España (the Bank of Spain) and by the ECB through the SSM. We also fall within the scope of US regulation. |
| Product | The risk that we offer products and services that do not result in good outcomes for our customers. |
| Sales | The risk that we sell products and services without giving customers enough information to make an informed decision, that we do not provide appropriate advice, or that we fail to take account of customer vulnerability. |
| After-sale and servicing | The risk that failures of our operations, processes, IT or controls result in poor customer outcomes. This includes the risks that we do not give appropriate after-sale communications to customers, make it difficult for customers to contact us, or that we fail to take account of customer vulnerability. It also includes the risk that our systems and controls do not prevent or detect fraud. |
| Culture | The risk that we do not maintain a culture that encourages appropriate behaviours and puts the customer at the heart of what we do. |
| Competition | The risk of financial harm, criminal liability, customer harm or reputational damage that we may incur because we fail to comply with relevant competition law or being involved in any competition law investigation or proceedings. |
| Controls | The risk that we do not supervise our employees effectively or that our systems and controls do not prevent or detect misconduct. |
CONDUCT AND REGULATORY RISK MANAGEMENT
Risk appetite
We aim to comply with all regulatory requirements, and we have no appetite to make decisions or operate in a way that leads to poor customer outcomes or which negatively impacts the market. Our Board approves our risk appetite each year, or more often if needed, and we cascade it to our business units through our risk framework and policies. We also agree lower level risk tolerance thresholds at least annually.
Risk measurement
Due to the links between our conduct, regulatory and operational risk frameworks, our tools to identify, assess, manage and report operational risks also apply where exposures have a conduct or regulatory risk impact.
We support our conduct and regulatory risk framework and policies with tools that aim to identify and assess new and emerging conduct risks. These include:
| | | | | |
| Key tools | Description |
| Strategy and business planning | We align our overall corporate strategy, financial plans, risk appetite and operational capabilities through our annual process to set our strategy. We derive our business unit plans from our corporate strategy and they contain a view of conduct and regulatory risk. |
| Quality assurance | We subject sales and processes to internal quality assurance and, as needed, external monitoring. |
| Operational risk and control assessments | Our business and business support units assess our operational risks, systems and controls to give us a consolidated risk view across all our business areas. We complete the assessments through a central tool to evaluate and manage our residual risk exposures. |
| Scenario testing and horizon scanning | We consider conduct and regulatory risk in our scenario testing and review possible root causes and assumptions to determine the likelihood and impact, with actions to enhance our controls where required. |
| Conduct risk reporting | We use dashboards to give us a view of conduct risks across our business and manage conduct risk in line with our risk appetite. |
| Compliance monitoring | We carry out an annual conduct and regulatory risk assurance programme approved by the Board and tracked throughout the year. |
| | | | | | | | | | | | | | |
| Annual Report 2022 | Santander UK Group Holdings plc 170 |
| | | | | | | | | | | | | | | | | | | | | | | | | | | | | | | | | | | | | | | | | |
| Strategic Report | Sustainability and Responsible Banking | Governance | Risk review | Financial review | Financial
statements | Shareholder
information |
| | | | | | | | | | | | | |
| | | | | | | | | | | | | |
Risk mitigation
Our conduct and regulatory risk framework and policies set out the principles, standards, roles and responsibilities and governance for conduct and regulatory risk, such as:
| | | | | |
| Policies | Description |
| Product approval | Our product approval process aims to minimise our conduct, regulatory or reputational risks in the design, marketing, sales and servicing of products and services. We assess our products and services within a formal framework to ensure they meet the needs and expectations of our customers, are within our risk appetite and agreed metrics, and to ensure processes and controls are in place. |
| Suitable advice and information for customers | We give guidance to advisers and staff on the key principles, requirements and ethical behaviours they must follow. This ensures our customers are sufficiently informed when they consider or make a buying decision. |
| Training and competence | We train our staff and require them to maintain a suitable level of competence to ensure customers can achieve appropriate outcomes. We invest in all our people to ensure that we achieve our mandatory risk objectives and that everyone acknowledges their personal responsibility to manage risk. We place focus on ensuring our colleagues are trained to recognise and support customers who may be vulnerable, or who may be experiencing financial stress, financial difficulty or financial abuse. We also have a dedicated Specialist Support Team that offers guidance to colleagues helping customers who may need more tailored solutions. |
| Fair treatment of vulnerable customers | Some customers may be impacted financially or personally as a result of their circumstances. Our Vulnerable Customer Policy gives business units a clear and consistent view of what vulnerability can mean and situations when customers may need more support. Our guidelines focus on identifying characteristics of vulnerability, understanding customer needs and the support and flexibility we can give to help. In addition to mandatory training, we train our customer-facing staff using real customer scenarios to enable our colleagues to deal with a wide range of sensitive issues. Our online Vulnerable Customer Support Tool gives our people more guidance and support, and our Specialist Support Team provides guidance for the most complex situations. We also consider vulnerability in every initiative, and adapt our technology to the needs of customers with vulnerability characteristics in our design and testing stages. We work with charities, authorities, trade associations and other specialists to develop our understanding of vulnerability. |
Risk monitoring and reporting
We consider conduct and regulatory risk in all our business decisions. Our material conduct and regulatory risk exposures are subject to, and reported against, our conduct and regulatory risk appetite statement, as well as lower level triggers and thresholds for action. We monitor the position to ensure we provide appropriate outcomes and meet regulatory expectations. We have specific fora and committees such as our Conduct and Compliance Forum, and business specific risk management fora to make decisions on conduct and regulatory risks and we report to the ERCC and BRBC. Our risk and control fora support management to control risks in their business units. Reporting includes conduct risk dashboards, with metrics across common areas. These include policy breaches logged, quality assurance and complaints, and commentary on trends and root causes to enable us to take effective action.
CONDUCT AND REGULATORY RISK REVIEW
2022 compared to 2021
To fully consider customer and conduct impacts across our business, we maintain a strong focus on robust oversight and control of the customer journey across all our products and services. In 2022, we continued to build on our progress and remain vigilant in taking a customer-focused approach in developing strategy, products, services and policies that support fair customer outcomes and market integrity, in particular in the context of regulator and government driven initiatives. As part of this, we:
–Assessed the views and new policy areas in the FCA’s 2022/23 Business Plan. The key focus is on three main areas: reducing and preventing serious consumer harm; setting and testing higher standards; and promoting competition and positive change. We continue to consider and address these in our controls, product and service processes and frameworks, and we continue to adapt in line with the evolution of a digital economy.
–Delivered change to meet the evolving regulatory landscape, including changes brought about by the PSR: Confirmation of Payee Phase 2, Open Banking and PSD2, and the FCA consumer protection agenda.
–Following the implementation of the Contingent Reimbursement Model, a voluntary code to deal with authorised push payment (APP) fraud, we continue to engage with the industry and authorities, giving input and support to further develop the code's framework. We also considered the latest PSR proposals to give greater protection for consumers against APP scams.
–Further evolved our Financial Support team and SME support, with more investment in people and IT to ensure we continue to drive fair outcomes and can provide tailored support, whilst managing the anticipated increased inflow of customers affected by the rising cost of living. This included reviewing related FCA and LSB publications.
–Proactively contacted over 2 million customers who may be experiencing early signs of financial stress, to support them and try to help avoid longer term financial difficulty. We refer customers to internal and external sources of support and have ongoing customer engagement and support plans.
–Continued focus on financial support for our business customers as Pay As You Grow options have been exhausted for many BBLS customers and 3 year CBILS overdrafts are reaching maturity.
–Successfully transitioned to alternate reference rates for the vast majority of LIBOR agreements. Our focus remains on transitioning a small group of customers whose agreements still reference either synthetic Sterling LIBOR or USD LIBOR. We continue to contribute to FCA consultation papers on both.
–Continued to actively participate in schemes to ensure the long term future of access to cash, including supporting the set up of shared banking hubs and wider engagement with LINK and industry partners.
–Continued our Consumer Duty implementation programme remaining focused on ensuring that our product and services, communications, and control frameworks are enhanced to continue to support good customer outcomes.
Like all UK banks, we continue to see a demanding regulatory agenda focused on consumer outcomes and customer vulnerability, including Consumer Duty, and continue to evaluate the evolving regulatory environment, particularly in light of the FSM Bill, and the government's Edinburgh Reforms. Conduct risks will likely continue to rise in the near and medium-term, as banks deal with increasing numbers of personal and business borrowers who are impacted by the rising cost of living. When implementing change, we focus on ensuring that our strategy, leadership, governance arrangements, and approach to managing and rewarding staff does not lead to a detrimental impact on our customers, competition, or to market integrity. We also remain committed to protecting the personal data we collect and use, and respecting the data protection rights of our customers, our people and others associated with us.
For an update on key movements in our financial crime risk profile, see the 'Financial crime risk review' section.
Accounting position
For more on our provisions, see Note 29 to the Consolidated Financial Statements. For more on our contingent liabilities, see Note 31 to the Consolidated Financial Statements.
| | | | | | | | | | | | | | |
| Annual Report 2022 | Santander UK Group Holdings plc 171 |
| | | | | | | | | | | | | | | | | | | | | | | | | | | | | | | | | | | | | | | | | |
| Strategic Report | Sustainability and Responsible Banking | Governance | Risk review | Financial review | Financial
statements | Shareholder
information |
| | | | | | | | | | | | | |
| | | | | | | | | | | | | |
Financial crime risk
| | | | | | | | |
| | |
| Overview Financial crime risk is the risk that we are used to further financial crime, including money laundering, sanctions evasion, terrorist financing, facilitation of tax evasion, bribery and corruption. In this section, we describe our key financial crime risks and explain how we manage and mitigate financial crime risk. We also describe developments in the year. | |
FINANCIAL CRIME RISK
OUR KEY FINANCIAL CRIME RISKS
We recognise that financial crime and associated illegal activity damages the customers and communities we serve. Criminals use the financial system to launder the profits of illegal activity such as human trafficking and to fund terrorism. Financial crime is therefore a high priority risk for us and we remain committed in our efforts to counter it by maintaining the highest ethical standards and conducting business in accordance with regulatory and legal requirements. We have adopted a bank wide anti-financial crime strategy (AFC) that sets out the principles of ‘Deter, Detect and Disrupt’ and invested in training our colleagues in how to identify and prevent financial crime.
We believe that having a comprehensive and effective financial crime risk management framework is a business imperative and a positive investment that protects us from legal, regulatory and reputational risks. This includes implementing policies, procedures, and maintaining effective systems and controls to prevent and detect financial crime. We may be adversely affected if we fail to effectively mitigate the risk that third parties or our employees facilitate, or that our products and services are used to facilitate financial crime. We adopt a risk-based approach in line with UK and international laws and standards, and we work with government, law enforcement and the private sector to help meet our commitments and to inform our AFC strategy.
Our key financial crime risks are: :
| | | | | |
| Key risks | Description |
| Money laundering | We are used by criminals to transform the proceeds of crime into seemingly legitimate money or other assets. |
| Terrorist financing | We are used by terrorists to deposit, distribute or collect funds that are used to fund their activity. |
| Sanctions | We do not identify payments, customers or entities that are subject to economic or financial sanctions. |
| Bribery and corruption | We fail to put in place effective controls to prevent or detect bribery and corruption. |
| Facilitation of tax evasion | We fail to put in place effective systems and controls to prevent the facilitation of tax evasion. |
FINANCIAL CRIME RISK MANAGEMENT
Risk appetite
Financial crime risk appetite is the level of financial crime risk we are prepared to accept in carrying out our activities. This is approved at Board level and shared across the business, with limits specified to control exposures and activities that have material risk implications for us and the communities we are part of. Our customers and shareholders will be impacted if we do not mitigate the risk that we are being used to facilitate financial crime. We seek to comply with applicable UK and international sanctions laws and other regulations and make sure our risk appetite adapts to external events. We have minimal tolerance for residual financial crime risk, bribery and corruption risk, facilitation of tax evasion risk and zero tolerance for non-compliance with sanctions laws and regulations. We require employees and third parties acting on our behalf to act with integrity, due diligence and care. We have no appetite for non-compliance with financial crime laws or regulations by employees or persons acting for or on our behalf.
Risk measurement
We measure our exposure to financial crime risk regularly. Our AFC strategy and frameworks set the strategic direction for risk management by defining standards, objectives and responsibilities for all areas of the business. It supports senior management in effective risk management and developing a strong risk culture. We screen and risk rate all our customers and monitor activity to identify potential suspicious behaviour. We complete ad-hoc reviews based on key trigger events. Our Financial Intelligence Unit assesses specific types of threat, drawing on data from law enforcement and public authorities.
Risk mitigation
We take a proactive approach to mitigating financial crime risk. Our financial crime risk frameworks are supported by policies and standards which explain the requirements for mitigating money laundering, terrorist financing, sanctions compliance risks, bribery and corruption, and facilitation of tax evasion risks. We update these regularly to ensure they reflect new requirements and industry best practice. We support our colleagues to make sure they can make the right decisions at the right time. We raise awareness and provide role-specific training to build knowledge of emerging risks.
Key elements of our financial crime risk mitigation approach are that we:
–Undertake customer due diligence measures for new and existing customers, which include understanding their activities and banking needs
–Conduct risk assessments of customers, products, businesses, sectors and geographic risks to tailor our mitigation efforts
–Ensure all our staff complete mandatory financial crime training and, where required, role-based specialist training
–Deploy new systems to better capture, analyse and act on data to mitigate financial crime risks
–Partner with public authorities, the Home Office and the wider financial services industry to pool expertise and data. We are also involved in partnerships such as the Joint Money Laundering Intelligence Taskforce (JMLIT) which supports public-private collaboration to tackle financial crime.
| | | | | | | | | | | | | | |
| Annual Report 2022 | Santander UK Group Holdings plc 172 |
| | | | | | | | | | | | | | | | | | | | | | | | | | | | | | | | | | | | | | | | | |
| Strategic Report | Sustainability and Responsible Banking | Governance | Risk review | Financial review | Financial
statements | Shareholder
information |
| | | | | | | | | | | | | |
| | | | | | | | | | | | | |
Risk monitoring and reporting
We use key risk indicators to monitor our exposure to financial crime risks, and we report all issues in a timely manner. We work closely with subject matter experts across the business on all risk management and monitoring activities alongside more effective communication of policy changes. Regulators around the world continue to emphasise the importance of effective risk culture, personal accountability and the adoption and enforcement of risk-based requirements and adequate internal reporting processes and procedures. We continue to develop and enhance our financial crime operating and governance model to ensure that our control environment evolves at pace, keeping up with new or amended laws, regulations or industry guidance.
We adhere to a strong governance and reporting schedule to our ERCC and Financial Crime Committee, including analysis of the risks on the horizon, key risk indicators and a directional indication of the risk profile. Throughout 2022, management continued to update the risk committees on management and mitigation of financial crime risks including our activities to understand and address emerging challenges. We enhanced our financial crime risk indicators for effective risk reporting to senior management. We also regularly report to the Board Risk Committee on financial crime risk, the impact on the business and the actions we are taking to mitigate the risk.
FINANCIAL CRIME RISK REVIEW
2022 compared to 2021
Protecting the communities we serve from the social and economic impacts of financial crime remains a top priority for Santander. The financial crime landscape continues to be complex, with evolving regulatory and legal requirements, geo-political factors and changing criminal methods influencing the risks we face.
Changes to UK and global sanctions regimes in 2022, most notably those arising from the global response to the conflict in Ukraine, added significant complexity and operational demand upon our financial crime controls in a compressed period. This complexity is anticipated to continue in 2023 and we continue to monitor external developments and respond to their impacts on our financial crime controls, and have increased our resources to do so.
FCA settlement on historical Business Banking AML controls
In December 2022, the FCA concluded an investigation in relation to anti-money laundering controls in our Business Banking division in the period 31 December 2012 to 18 October 2017 following the payment of a £108m financial penalty.
The FCA’s investigation focused on the identification, assessment and management of higher risk customers in our Business Banking division, including Money Services Businesses. It has now concluded, and no further action is anticipated by the FCA or any other authority in respect of this matter.
Santander UK takes its responsibilities regarding financial crime extremely seriously. For more, see Note 31. The Banco Santander group, including Santander UK, is fully committed to the fight against financial crime and will continue to meet all applicable financial crime regulations and legislation internationally and ensure effectiveness in our control environment.
Financial Crime Transformation Programme
Senior management and the Board engagement in the management of financial crime risk remains high, proportionate with one of our top risks. We continue to enhance our financial crime risk management capabilities across data, systems and subject matter expertise through our multiyear financial crime transformation and remediation programme. Continued areas of focus during 2022 includes;
–Ongoing training of colleagues in identifying, assessing, managing and reporting financial crime. Uplifting specialist role competencies through our Economic Crime Academy (ECA), enhancing the skill sets, knowledge and qualifications of key staff.
–Remediated data gaps in our customer records through back door remediation o help us manage financial crime risks.
–Maturing our Financial Crime Centre of Excellence to increase integration of financial crime risk management operations across our organisation.
| | | | | | | | | | | | | | |
| Annual Report 2022 | Santander UK Group Holdings plc 173 |
| | | | | | | | | | | | | | | | | | | | | | | | | | | | | | | | | | | | | | | | | |
| Strategic Report | Sustainability and Responsible Banking | Governance | Risk review | Financial review | Financial
statements | Shareholder
information |
| | | | | | | | | | | | | |
| | | | | | | | | | | | | |
Other key risks
| | | | | | | | | | | | | | |
| | | | |
| Overview | | | |
| In this section, we describe how we manage our other key risks and discuss developments in the year. Our other key risks are: –Model risk: the risk that the prediction of our models may be inaccurate, causing us to make sub-optimal decisions, or that a model may be used inappropriately. –Legal risk: the risk of loss arising from legal deficiencies in contracts; failure to protect assets; failure to manage legal disputes appropriately; failure to assess or implement the requirements of a change of law; or failure to comply with law or regulation or to | | discharge duties or responsibilities created by law or regulation. –Strategic and business risk: the risk of significant loss or underperformance against planned objectives; damage arising from strategic decisions or their poor implementation that impact the long-term interests of our key stakeholders, or from an inability to adapt to external developments. –Reputational risk: the risk of damage to the way our reputation and brand are perceived by the public, clients, government, colleagues, investors, or any other interested party.
| |
MODEL RISK
Generally, we consider a model to be a repeatable method that relies on assumptions to produce estimates of uncertain outcomes. Our key model risks arise from weaknesses and limitations in our models, or the incorrect use of a model. They include risks stemming from model data, systems, development, performance and governance. The most material models we use help us calculate our regulatory capital and credit losses, and perform stress tests.
| | | | | |
| Model risk management | Description |
| Risk appetite | We express our model risk appetite through risk assessments of our material models. The Board is asked to agree this at least annually. |
| Risk measurement | We consider the percentage of models that have been independently assessed and the outcome of those reviews in measuring model risk. All models have assumptions and in general the more limitations those assumptions have, the higher the uncertainty and model risk. |
| Risk mitigation | We mitigate model risk through controls over how we use models throughout their life. We maintain a central model inventory that includes data on owners, uses and model limitations. We assess how important each model is to our business, and we track and resolve actions from independent reviews. We also maintain a clear approval path for new models and changes to existing models. |
| Risk monitoring and reporting | We report model risks and issues using management and control forums. We escalate issues when needed, or if our risk appetite is breached or showing adverse trends that could lead to future issues. |
2022 compared to 2021
We maintain a risk-based approach to management and control, focusing on model monitoring and independent model reviews on our more material models, such as those for credit losses or those with specifically defined regulatory standards.We remain focused on all our models given the recent changes in economic factors, with a particular focus on inflation and Bank Rate.
In 2022, we significantly developed our regulatory models, focusing on capital adequacy, to comply with new regulatory technical standards for banks. We expect this trend to continue over the next two years in line with supervisory expectations. We also developed new models for ECL reporting, with a focus on residential mortgages and commercial lending. The new models are designed to improve the overall control environment and accuracy of our risk measurement. They will also enable us to eliminate some long-standing Judgemental Adjustments required due to limitations in prior models.
Changes to models due to the cessation of LIBOR were completed. All model updates were governed in line with the complexity of change and the materiality of underlying models.We also focused on the models we used to support the BoE climate change stress test. These were new types of models with much longer forecast horizons. We expect work to continue in this area in the coming years.We updated our toolsets to help manage and control model risk, implementing a tool that supports the end-to-end model risk lifecycle. The tool provides a register for all models and their uses, automated reporting and governance workflow. The tool also has full traceability.
LEGAL RISK
Legal risk includes the legal consequences of operational risk, such as breach of contract, and operational risk with legal origins, such as a legally defective contract. We manage legal risk as a standalone risk type to reflect the continued pace and breadth of regulatory change across financial services.
| | | | | |
| Risk management | Description |
| Risk appetite | We aim to make decisions and operate in a way that does not lead to legal risk. We have a low tolerance for residual legal risk. |
| Risk measurement | Due to the close links between our legal and operational risk frameworks, our tools to identify, assess, manage and report operational risks also apply where such exposures have a legal risk impact. |
| Risk mitigation | The Legal teams provide specialist advice and support to all business units to ensure we effectively manage legal risk. They help to implement a strong legal risk culture and decide whether legal advice should be sourced internally or externally. |
| Risk monitoring and reporting | Our internal legal risk reporting framework gives visibility of the Santander UK-wide legal risk profile. We provide regular updates of our key legal risks, issues or breaches, to senior management and the Board through our Legal & Corporate Governance Division. |
2022 compared to 2021
Our legal risk profile remained heightened but broadly stable in 2022, reflecting the high number and value of legal risks that we continue to manage. We continued to evaluate the evolving legal and regulatory environment, particularly in light of the Financial Services and Markets Bill and other changes set out in the Government’s Edinburgh Reforms and the implications of the FCA’s new Consumer Duty. We continued to align our outsourcing and material contracts to ensure EBA Outsourcing compliance, PRA/FCA requirements on operational resiliency and continuity, and Schrems II. We focused on the mitigation of legal and reputational risk relating to the FCA enforcement investigation into historical anti-money laundering systems and controls in our Business Banking division which concluded in December 2022. While litigated PPI claim volumes stabilised, there remains on-going large scale complex PPI related litigation brought by AXA, and a German criminal and tax investigation relating to historical dividend tax arbitrage transactions. We continue to manage our legal risk in relation to thematic Court actions and FOS complaints related to fraud, mortgages and commissions. In January 2023, the Legal risk framework was retired following a structural change when the Legal function moved to the CFO Division, as described in 'How we define risk' in 'Risk Framework' in the 'Risk governance' section.
| | | | | | | | | | | | | | |
| Annual Report 2022 | Santander UK Group Holdings plc 174 |
| | | | | | | | | | | | | | | | | | | | | | | | | | | | | | | | | | | | | | | | | |
| Strategic Report | Sustainability and Responsible Banking | Governance | Risk review | Financial review | Financial
statements | Shareholder
information |
| | | | | | | | | | | | | |
| | | | | | | | | | | | | |
STRATEGIC AND BUSINESS RISK
Strategic and business risk could impact our long-term success if it caused our business model to become out of date, ineffective, or inconsistent with our goals. This could arise if we fail to identify threats arising from the economy, regulation, competitors and/or changes in technology and customer expectations. It could also arise if we misjudge our capabilities, or ability to implement our strategy, or pursue initiatives that do not fit with our business model or miss opportunities we could benefit from.
| | | | | |
| Risk management | Description |
| Risk appetite | We have a low to moderate appetite for strategic and business risk. This limits the risks we are prepared to take to achieve our strategic objectives and is aligned to our balanced, customer-centric business model. |
| Risk measurement | Our Board and senior management regularly review potential risks in our operations and plans to ensure we stay within risk appetite. |
| Risk mitigation | We manage strategic and business risk by having a clear and consistent strategy that takes account of external factors and our own capabilities. We have an effective planning process which ensures we adapt our strategy to reflect changes in key risks and opportunities. |
| Risk monitoring and reporting | We closely track our business environment, including long-term trends that might affect us in the future. As part of this, we report a range of indicators. These include our KPIs as set out in the ‘Strategic report’. |
2022 compared to 2021
Our business environment is always changing, and this affects how we do business. The post Covid-19 economic recovery was unexpectedly halted by the conflict in Ukraine bringing in geo-political uncertainties and exacerbating the cost of living crisis. We prudently managed our balance sheet in an increasing interest rate environment and are simplifying our operating model to offset pressures of the deteriorating macro environment. Mortgage volumes dropped post mini-budget and mortgage prices increased given increasing interest rates. We proactively reached out to our mortgage customers and gave them financial support where needed. We helped our customers manage their finances in a rising inflation environment by providing them with budget planning and management tools, as well as tips to cut spending. We will continue to work with all our customers through these difficult times and provide them targeted and practical support that they need.
We continue to face a demanding regulatory agenda and in July 2022, the FCA published the new Consumer Duty rules, which we are on track to deliver.
Climate change is a key part of our business decisions. In 2022, we complied with all climate change related regulation including engaging in the BoE's CBES. As part of the Banco Santander group, we have also set ourselves Green Finance targets until 2025.
Competitive pressures continued in 2022, mainly from established players. We remained competitive by launching new products such as a market leading e-Saver account, fixed rate ISA products and the Edge current account for our retail customers, and helping our business customers grow through the Santander Navigator and SME Toolkit. We also improved our digital capabilities through enhanced mobile app features like My Money Manager and Santander Boosts. We will continue to invest in our technology to provide a high-quality customer experience.
Overall, we remain focused on supporting customer needs, improving efficiency, and building a responsible and sustainable business, while continuing to progress with our agenda to tackle climate change. This will enable us to meet the changing needs of our customers and deliver improved returns over the long-term.
REPUTATIONAL RISK
Reputational risks can arise from internal and external factors. We seek to manage our reputation proactively, underpinned by our aim to be a responsible bank, and through our reputational risk framework.Reputational risk is not static; today’s decisions may be judged by different standards tomorrow. We build this into our risk culture, evaluation and sanction procedures.
| | | | | |
| Risk management | Description |
| Risk appetite | We have a low appetite for reputational risk, which is agreed by the Board at least each year. |
| Risk measurement | We assess our exposure to reputational risk daily. We base this on expert judgement and analysis of social, print, and broadcast media, and the views of political and market commentators. We also commission independent third parties to analyse our activities and those of our UK peers to identify reputational events, a decline in our reputation, and sector or thematic issues that impact our business. We also measure the perception of Santander UK by key stakeholders through regular interactions and review staff sentiment each year. |
| Risk mitigation | Our business units consider reputational risk as part of their operational risk and control assessments. We also consider it as part of our new product reviews. Our Corporate Communications and Responsible Banking, Legal and Regulatory Affairs and Marketing team helps business units to mitigate the risk and agree action plans as needed, as part of their role to protect our brand and reputation. |
| Risk monitoring and reporting | We monitor and report reputational risks and issues on a timely basis. Our Reputational Risk Forum reviews and escalates key issues to ERCC, RBC and the Board. We also report regularly to ExCo on Sustainability and Responsible Banking, and Public Affairs policies. |
Our Reputational and ESCC risk policies define how we create long-term value while managing those risks. Our ESCC policy covers Oil & Gas, Power Generation & Transmission, Mining & Metals and Soft Commodities. For example, financing is prohibited for project-related financing for new CFPP projects worldwide and we will only work with new clients with CFPPs to provide specific financing for renewable energy projects.
2022 compared to 2021
In 2022, our key reputational risks arose from the economic slowdown and the cost of living crisis. To manage this, we regularly and proactively shared information with key external stakeholders on the actions we took to support customers, colleagues and communities. Particular areas of external focus included our support for customers facing financial difficulties and increasing mortgage payments.
We also worked to explain how our processes and controls have changed and improved since the period related to the FCA penalty for historical shortcomings in our AML controls, settled in December 2022.
| | | | | | | | | | | | | | |
| Annual Report 2022 | Santander UK Group Holdings plc 175 |
| | | | | | | | | | | | | | | | | | | | | | | | | | | | | | | | | | | | | | | | | |
| Strategic Report | Sustainability and Responsible Banking | Governance | Risk review | Financial review | Financial
statements | Shareholder
information |
| | | | | | | | | | | | | |
| | | | | | | | | | | | | |
| | | | | | | | | | | |
| Financial review | | | |
| | Contents | |
| | | |
| | | |
| | |
| | |
| | |
| Treasury | |
| Key capital metrics | |
| Key funding and liquidity metrics | |
| Alternative Performance Measures (APMs) | |
| | |
| | |
| | | | | | | | | | | | | | |
| Annual Report 2022 | Santander UK Group Holdings plc 176 |
| | | | | | | | | | | | | | | | | | | | | | | | | | | | | | | | | | | | | | | | | |
| Strategic Report | Sustainability and Responsible Banking | Governance | Risk review | Financial review | Financial
statements | Shareholder
information |
| | | | | | | | | | | | | |
| | | | | | | | | | | | | |
Income statement review
SUMMARISED CONSOLIDATED INCOME STATEMENT
| | | | | | | | |
| 2022 | 2021 |
| £m | £m |
| Net interest income | 4,472 | | 3,997 | |
Non-interest income(1) | 534 | | 547 | |
| Total operating income | 5,006 | | 4,544 | |
| Operating expenses before credit impairment (charges)/write-backs, provisions and charges | (2,370) | | (2,540) | |
| Credit impairment (charges)/write-backs | (321) | | 233 | |
| Provisions for other liabilities and charges | (421) | | (379) | |
| Total operating credit impairment (charges)/write-backs, provisions and charges | (742) | | (146) | |
| Profit from continuing operations before tax | 1,894 | | 1,858 | |
| Tax on profit from continuing operations | (471) | | (485) | |
| Profit from continuing operations after tax | 1,423 | | 1,373 | |
| Profit/(loss) from discontinued operations after tax | — | | 32 | |
| Profit after tax | 1,423 | | 1,405 | |
| | |
| Attributable to: | | |
| Equity holders of the parent | 1,406 | | 1,369 | |
| Non-controlling interests | 17 | | 36 | |
| Profit after tax | 1,423 | | 1,405 | |
(1)Comprises 'Net fee and commission income' and 'Other operating income'.
A more detailed Consolidated Income Statement is contained in the Consolidated Financial Statements.
2022 compared to 2021
Profit from continuing operations after tax up 4%. Adjusted profit from continuing operations before tax flat: adjustments for transformation, operating lease depreciation, property and penalty for historical shortcomings in our AML controls(1)
–Net interest income up 12% and Banking NIM up 14bps largely due to the impact of base rate increases.
–Non-interest income down 2%, due to the £71m gain on sale of our UK head office in 2021. Adjusted non-interest income(1) up 19%, largely due to the continued strength of the second-hand car market which drove higher Consumer Finance income.
–Operating expenses before credit impairment (charges) / write-backs, provisions and charges down 7% largely due to lower transformation programme spend following significant restructuring in 2021. This programme has embedded lower operational costs and improved the efficiency of the business which should help to mitigate the impact of inflation. Adjusted operating expenses before credit impairment (charges) / write-backs, provisions and charges(1) down 3% as efficiency savings from our transformation programme were partially offset by increased financial crime spend and inflationary pressures.
–Credit impairment charges of £321m driven by the deterioration in the economic environment, including higher interest rates, lower GDP, and lower house prices, as well as the risk that higher inflation could impact lending repayments. These charges followed write-backs of £233m in 2021 and increased the cost of risk to 15bps, as we increased the ECL build in retail portfolios (2021: (11)bps). Loans entering arrears remained low. Arrears stock on mortgages remains low with 0.62% greater than 90 days past due (2021: 0.79%)(2). In Corporate and Commercial Banking, we have seen a small number of single name defaults emerge in Q4-22.
–Provisions for other liabilities and charges up 11%, largely related to the £108m penalty for shortcomings in our AML controls between 31 December 2012 and 18 October 2017. We also continued to see a rise in scams with increased fraud charges of £153m in 2022 (2021: £74m). These were partially offset by lower transformation programme charges following significant restructuring in 2021. Adjusted provisions for other liabilities and charges(1) up 17%, an increase of £42m. This was primarily due to the higher fraud charges noted above.
Discontinued operations relate to the CIB segment which was moved to SLB under a Part VII banking business transfer scheme, completed on 11 October 2021.
Please refer to the Financial review section of our Annual Report on Form 20-F for the year ended 31 December 2021 for a comparative discussion of 2021 financial results compared to 2020.
(1) Non-IFRS measure. See 'Alternative Performance Measures' in the Financial Review for details and a reconciliation of adjusted metrics to the nearest IFRS measure.
(2) Arrears over 90 days past due: credit cards 0.49% (2021: 0.45%), UPLs 0.61% (2021: 0.51%), overdrafts 2.24% (2021: 2.10%), Consumer Finance 0.44% (2021: 0.36%).
| | | | | | | | | | | | | | |
| Annual Report 2022 | Santander UK Group Holdings plc 177 |
| | | | | | | | | | | | | | | | | | | | | | | | | | | | | | | | | | | | | | | | | |
| Strategic Report | Sustainability and Responsible Banking | Governance | Risk review | Financial review | Financial
statements | Shareholder
information |
| | | | | | | | | | | | | |
| | | | | | | | | | | | | |
PROFIT BEFORE TAX BY SEGMENT
Continuing operations
The segmental information in this Annual Report reflects the reporting structure in place at the reporting date in accordance with the segmental information in Note 2 to the Consolidated Financial Statements.
| | | | | | | | | | | | | | | | | |
| Retail Banking | Consumer Finance | Corporate & Commercial
Banking | Corporate
Centre | Total |
| 2022 | £m | £m | £m | £m | £m |
| Net interest income | 3,689 | | 180 | | 580 | | 23 | | 4,472 | |
Non-interest income/(expense)(1) | 197 | | 195 | | 146 | | (4) | | 534 | |
| Total operating income | 3,886 | | 375 | | 726 | | 19 | | 5,006 | |
| Operating expenses before credit impairment (charges)/write-backs, provisions and charges | (1,683) | | (144) | | (342) | | (201) | | (2,370) | |
| Credit impairment (charges)/write-backs | (263) | | (27) | | (31) | | — | | (321) | |
| Provisions for other liabilities and charges | (395) | | (6) | | (8) | | (12) | | (421) | |
| Total operating credit impairment (charges)/write-backs, provisions and charges | (658) | | (33) | | (39) | | (12) | | (742) | |
| Profit from continuing operations before tax | 1,545 | | 198 | | 345 | | (194) | | 1,894 | |
| | | | | |
| 2021 | | | | | |
| Net interest income/(expense) | 3,374 | | 233 | | 397 | | (7) | | 3,997 | |
Non-interest income(1) | 201 | | 178 | | 112 | | 56 | | 547 | |
| Total operating income/(expense) | 3,575 | | 411 | | 509 | | 49 | | 4,544 | |
| Operating expenses before credit impairment (charges)/write-backs, provisions and charges | (1,703) | | (163) | | (365) | | (309) | | (2,540) | |
| Credit impairment (charges)/write-backs | 98 | | 33 | | 90 | | 12 | | 233 | |
| Provisions for other liabilities and charges | (187) | | 4 | | (34) | | (162) | | (379) | |
| Total operating credit impairment (charges)/write-backs, provisions and charges | (89) | | 37 | | 56 | | (150) | | (146) | |
| Profit from continuing operations before tax | 1,783 | | 285 | | 200 | | (410) | | 1,858 | |
(1)Comprises 'Net fee and commission income' and 'Other operating income'.
| | | | | | | | | | | | | | |
| Annual Report 2022 | Santander UK Group Holdings plc 178 |
| | | | | | | | | | | | | | | | | | | | | | | | | | | | | | | | | | | | | | | | | |
| Strategic Report | Sustainability and Responsible Banking | Governance | Risk review | Financial review | Financial
statements | Shareholder
information |
| | | | | | | | | | | | | |
| | | | | | | | | | | | | |
Balance sheet review
CUSTOMER BALANCES
This section analyses customer loans and customer deposits at a consolidated level and by business segment. The customer balances below exclude Joint ventures, as they carry low credit risk and therefore have an immaterial ECL, and Other items, mainly accrued interest that we have not yet charged to the customer's account, and cash collateral. A reconciliation between the customer balances below and the total assets as presented in the Consolidated Balance Sheet is set out in the Risk review.
Consolidated | | | | | | | | |
| 2022 | 2021 |
| £bn | £bn |
| Customer loans | 219.7 | | 210.6 | |
Other assets(1) | 72.5 | | 83.1 | |
| Total assets | 292.2 | | 293.7 | |
| Customer deposits | 196.5 | | 192.2 | |
| Total wholesale funding | 63.0 | | 65.4 | |
| Other liabilities | 18.0 | | 19.8 | |
| Total liabilities | 277.5 | | 277.4 | |
| Shareholders' equity | 14.7 | | 16.1 | |
| Non-controlling interest | — | | 0.2 | |
| Total liabilities and equity | 292.2 | | 293.7 | |
(1) At 31 December 2022, includes £49m of property assets classified as held for sale.
Further analysis of credit risk on customer loans is set out in the Credit risk section of the Risk review.
2022 compared to 2021
–Customer loans increased £9.1bn, with £9.8bn of net mortgage lending.
–Customer deposits increased £4.3bn, following successful eSaver and ISA campaigns in H2-22.
–Other assets and other liabilities decreased, primarily reflecting our approach to liquidity management in 2022.
–Total wholesale funding decreased, with total term funding of £57.8bn (2021: £60.1bn).
–Shareholders' equity decreased, largely due to cash flow hedging of our debt issuance and pension remeasurement.
Customer loans by segment
| | | | | | | | |
| 2022 | 2021 |
| £bn | £bn |
| Retail Banking | 194.6 | | 185.6 | |
| Consumer Finance | 5.4 | | 5.0 | |
CCB 1 | 18.5 | | 19.3 | |
Corporate Centre 2 | 1.2 | | 0.7 | |
| Total | 219.7 | | 210.6 | |
(1) CCB customer loans includes £4.5bn of CRE loans (2021: £4.4bn). In Q4-22 we transferred £1.5bn (2021: £2.3bn) of Social Housing loans to our CCB segment from Corporate Centre to reflect the way these are managed, and restated comparatives accordingly.
Customer deposits by segment
| | | | | | | | |
| 2022 | 2021 |
| £bn | £bn |
| Retail Banking | 161.8 | | 157.0 | |
CCB 1 | 24.8 | | 26.5 | |
Corporate Centre 1 | 9.9 | | 8.7 | |
| Total | 196.5 | | 192.2 | |
(1) In Q4-22 we transferred £0.4bn of non-core liabilities (2021: £0.9bn) to our CCB segment from Corporate Centre to reflect the way these are managed, and restated comparatives accordingly.
Retail Banking customer deposits by portfolio
| | | | | | | | |
| 2022 | 2021 |
| £bn | £bn |
| Current accounts | 76.6 | | 80.7 | |
| Savings accounts | 67.0 | | 57.8 | |
| Business banking accounts | 12.2 | | 13.1 | |
| Other retail products | 6.0 | | 5.4 | |
| Retail Banking customer deposits | 161.8 | | 157.0 | |
| | | | | | | | | | | | | | |
| Annual Report 2022 | Santander UK Group Holdings plc 179 |
| | | | | | | | | | | | | | | | | | | | | | | | | | | | | | | | | | | | | | | | | |
| Strategic Report | Sustainability and Responsible Banking | Governance | Risk review | Financial review | Financial
statements | Shareholder
information |
| | | | | | | | | | | | | |
| | | | | | | | | | | | | |
Treasury
KEY CAPITAL METRICS
| | | | | | | | | | | | | | |
| 2022 | 2021 |
| £bn | % | £bn | % |
| Capital | | | | |
| CET1 capital | 10.8 | | 15.2 | | 10.8 | | 15.9 | |
| Total qualifying regulatory capital | 14.5 | | 20.4 | | 14.7 | | 21.6 | |
| UK leverage | 13.0 | | 5.2 | | 12.8 | | 5.2 | |
Summarised change in CET1 capital ratio
| | | | | |
| CET1 capital ratio |
| % |
| 31 December 2021 | 15.9 | |
| Regulatory changes on 1 January 2022 | (0.4) | |
| Pro forma at 1 January 2022 | 15.5 | |
| Post dividend retained earnings | 0.8 | |
| Special dividend | (0.4) | |
| Fixed pension deficit contributions | (0.2) | |
| Expected loss less provisions | 0.2 | |
| RWA growth and other | (0.7) | |
| 31 December 2022 | 15.2 | |
2022 compared to 2021
Capital ratios well above regulatory requirements
–The CET1 capital ratio decreased 70bps to 15.2%. This was largely due to regulatory changes that took effect on 1 January 2022 and a special dividend paid in December 2022. The regulatory changes included the reintroduction of the full CET1 software asset deduction, and implementation of new definition of default regulatory guidance. The impact of increased RWAs and the special dividend were partially offset by post dividend retained earnings. We remain strongly capitalised with significant headroom to minimum requirements and MDA.
–The UK leverage ratio remained stable at 5.2% as retained profit was partially offset by the change in treatment of software assets on 1 January 2022. UK leverage exposure remained broadly stable at £248.6bn (2021: £246.3bn).
–Total capital ratio decreased by 120bps to 20.4%, due to lower CET1 capital ratio as outlined above as well as the reduction in Additional Tier 1 and Tier 2 capital securities recognised following the end of the CRR Grandfathering period on 1 January 2022.
–We paid £1.0bn interim dividends, £300m of which was a special dividend (2021: £1.3bn). These were paid following review and approval by the Board in line with our dividend policy.
CET1 capital ratio at 31 December 2022
| | | | | |
| Minimum |
| % |
| Pillar 1 | 4.5 | |
| Pillar 2A | 3.2 | |
| Capital conservation buffer | 2.5 | |
| Countercyclical capital buffer | 1.0 | |
| Current MDA trigger | 11.2 | |
| Headroom | 4.0 | |
| CET1 capital ratio | 15.2 | |
KEY FUNDING AND LIQUIDITY METRICS
| | | | | | | | |
| 2022 | 2021 |
| £bn | £bn |
| Loan to deposit ratio | 113 | % | 111 | % |
| Total wholesale funding and AT1 | 65.2 | 67.8 |
| of which TFSME | 25.0 | 31.9 |
| of which with a residual maturity of less than one year | 11.0 | 10.2 |
| LCR | 163 | % | n.a. |
| LCR eligible liquidity pool | 49.0 | n.a. |
Liquidity metrics reported for Santander UK from 1 January 2022 following the adoption of the CRR2 regulation.
2022 compared to 2021
Strong funding across a range of diverse products
–Total wholesale funding decreased, with £6.9bn TFSME repayment. Funding costs improved with maturities refinanced at lower cost.
–Issuances of £8.6bn, including MREL issuance of £3.9bn equivalent and £4.7bn of non-MREL issuance from Santander UK plc, our RFB.
–We expect to issue between £2.0bn and £3.0bn of MREL in 2023 , of which we have already issued £1.0bn equivalent in January 2023.
| | | | | | | | | | | | | | |
| Annual Report 2022 | Santander UK Group Holdings plc 180 |
| | | | | | | | | | | | | | | | | | | | | | | | | | | | | | | | | | | | | | | | | |
| Strategic Report | Sustainability and Responsible Banking | Governance | Risk review | Financial review | Financial
statements | Shareholder
information |
| | | | | | | | | | | | | |
| | | | | | | | | | | | | |
Alternative Performance Measures (APMs)
In addition to the financial information prepared under IFRS, this Annual Report contains non-IFRS financial measures that constitute APMs, as defined in European Securities and Markets Authority (ESMA) guidelines and non-GAAP financial measures, as defined in (and presented in accordance with) U.S. Securities and Exchange Commission (SEC) rules and guidance. The financial measures contained in this Annual Report that qualify as APMs have been calculated using the financial information of the Santander UK group but are not defined or detailed in the applicable financial information framework or under IFRS.
We use these APMs when planning, monitoring and evaluating our performance. We consider these APMs to be useful metrics for management and investors to facilitate operating performance comparisons from period to period. Whilst we believe that these APMs are useful in evaluating our business, this information should be considered as supplemental in nature and is not meant as a substitute for IFRS measures.
Adjusted APMs
A description of the Santander UK group’s adjusted APMs, the reasons why management feel they provide useful information, and their calculation are set out below.
| | | | | |
| Adjusted APM | Description and calculation |
| Adjusted net interest income | Net interest income adjusted for items management believe to be significant, to facilitate operating performance comparisons from period to period. |
| Adjusted non-interest income | Non-interest income adjusted for items management believe to be significant, to facilitate operating performance and cost-to-income comparisons from period to period. |
| Adjusted operating expenses before credit impairment charges, provisions and charges | Operating expenses before credit impairment charges, provisions and charges adjusted for items management believe to be significant, to facilitate operating performance and cost-to-income comparisons from period to period. |
| Adjusted provisions for other liabilities and charges | Provisions for other liabilities and charges adjusted for items management believe to be significant, to facilitate operating performance comparisons from period to period. |
| Adjusted profit before tax | Profit before tax adjusted for items management believe to be significant, to facilitate operating performance comparisons from period to period. |
| Adjusted cost-to-income ratio | Adjusted total operating expenses before credit impairment (charges)/ write-backs and provisions for other liabilities and charges as a percentage of the total of adjusted net interest income and adjusted non-interest income. We consider this metric useful for management and investors as an efficiency measure to capture the amount spent to generate income, as we invest in our multi-year transformation programme. |
| Adjusted Return on Tangible Equity (RoTE) | Adjusted profit before tax, less tax on profit, attributable to equity holders of the parent, divided by average shareholders’ equity less non-controlling interests, other equity instruments and average goodwill and other intangible assets. We consider this adjusted measure useful for management and investors as a measure of income generation on shareholder investment, as we focus on improving returns through our multi-year transformation programme. |
Reconciliation of adjusted APMs to nearest IFRS measure
a) Adjusted profit metrics
As shown in the table below, profit from continuing operations before tax is adjusted for items management believe to be significant. We adjust for these to facilitate operating performance comparisons from period to period. The financial results reflect continuing operations and therefore do not include discontinued operations.
| | | | | | | | | | | |
| Ref. | 2022 | 2021 |
| | £m | £m |
| Non-interest income | | | |
| Reported | (i) | 534 | | 547 | |
| Adjust for operating lease depreciation | | (74) | | (81) | |
| Adjust for net loss / (gain) on sale of property | | 7 | | (73) | |
| Adjusted | (ii) | 467 | | 393 | |
| | | |
| Operating expenses before credit impairment (charges)/write-backs, provisions and charges | | | |
| Reported | (iii) | (2,370) | | (2,540) | |
| Adjust for transformation | | 171 | | 278 | |
| Adjust for operating lease depreciation | | 74 | | 81 | |
| Adjusted | (iv) | (2,125) | | (2,181) | |
| | | |
| Provisions for other liabilities and charges | | | |
| Reported | | (421) | | (379) | |
| Adjust for transformation | | 22 | | 130 | |
| Adjust for penalty related to historical shortcomings in AML controls | | 108 | | — | |
| Adjusted | | (291) | | (249) | |
| | | |
| Profit from continuing operations before tax | | | |
| Reported | | 1,894 | | 1,858 | |
| Specific income, expenses and charges | | 308 | | 335 | |
| Adjusted profit from continuing operations before tax | | 2,202 | | 2,193 | |
| | | | | | | | | | | | | | |
| Annual Report 2022 | Santander UK Group Holdings plc 181 |
| | | | | | | | | | | | | | | | | | | | | | | | | | | | | | | | | | | | | | | | | |
| Strategic Report | Sustainability and Responsible Banking | Governance | Risk review | Financial review | Financial
statements | Shareholder
information |
| | | | | | | | | | | | | |
| | | | | | | | | | | | | |
The financial results for 2022 and 2021 were impacted by a number of specific income, expenses and charges with an aggregate impact on profit from continuing operations before tax of £308m in 2022 and £335m in 2021. The specific income, expenses and charges are outlined below:
–Operating lease depreciation
We adjust operating expenses and non-interest income for operating lease depreciation. We believe this provides a clearer explanation of expenses and income as operating lease depreciation is a direct cost associated with business volumes.
–Net loss / (gain) on sale of property
Previously named ‘net gain on sale of London head office and branch properties’, now also includes subsequent sale of property under our transformation programme.
–Transformation costs and charges
Transformation costs and charges relate to a multi-year project to deliver on our strategic priorities and enhance efficiency in order for us to better serve our customers and meet our medium-term targets.
–Penalty related to historical shortcomings in AML controls
In December 2022, we paid a financial penalty to settle the FCA’s enforcement investigation into the AML systems and controls in our Business Banking division in the period between 31 December 2012 and 18 October 2017. The settlement concluded the FCA’s investigation and we are adjusting for this because it relates to a historical incident which impacts comparison of the underlying trend. Details of Santander UK’s response to the settlement can be viewed at www.santander.co.uk/about-santander/media-centre/press-releases/santander-uk-reaches-fca-settlement-on-historical.
b) Adjusted cost-to-income ratio
Calculated as adjusted total operating expenses before credit impairment (charges) / write-backs, provisions and charges as a percentage of the total of net interest income and adjusted non-interest income. We consider this metric useful for management and investors as an efficiency measure to capture the amount spent to generate income, as we invest in our multi-year transformation programme.
| | | | | | | | | | | |
| Ref. | 2022 | 2021 |
| | % | % |
| | | |
| | | |
| | | |
| | | |
| | | |
| Cost-to-income ratio | (iii) divided by the sum of (i) and net interest income | 47 | % | 56 | % |
| Adjusted cost-to-income ratio | (iv) divided by the sum of (ii) and net interest income | 43 | % | 50 | % |
c) Adjusted RoTE
Calculated as adjusted profit after tax attributable to equity holders of the parent, divided by average shareholders’ equity less non-controlling interests, other equity instruments, and average goodwill and other intangible assets. We consider this adjusted measure useful for management and investors as a measure of income generation on shareholder investment, as we focus on improving returns through our multi-year transformation programme.
| | | | | | | | | | | |
| | Specific income, expenses and charges | As adjusted |
| |
| 2022 | £m | £m | £m |
| Profit after tax | 1,423 | | 254 | | 1,677 | |
| Less non-controlling interests of annual profit | (17) | | | (17) | |
| Profit due to equity holders of the parent (A) | 1,406 | | | 1,660 | |
| | | | | | | | | | | |
| | Equity adjustments | As adjusted |
| |
| 2022 | £m | £m | £m |
| Average shareholders' equity | 15,545 | | | |
| Less average AT1 securities | (2,194) | | | |
| Less average non-controlling interests | (118) | | | |
| Average ordinary shareholders' equity (B) | 13,233 | | | |
| Average goodwill and intangible assets | (1,548) | | | |
| Average tangible equity (C) | 11,685 | | 63 | | 11,748 | |
| | | |
| Return on ordinary shareholders’ equity (A/B) | 10.6 | % | | — | |
| Adjusted RoTE (A/C) | — | | | 14.1 | % |
| | | | | | | | | | | | | | |
| Annual Report 2022 | Santander UK Group Holdings plc 182 |
| | | | | | | | | | | | | | | | | | | | | | | | | | | | | | | | | | | | | | | | | |
| Strategic Report | Sustainability and Responsible Banking | Governance | Risk review | Financial review | Financial
statements | Shareholder
information |
| | | | | | | | | | | | | |
| | | | | | | | | | | | | |
| | | | | | | | | | | |
| | Specific income, expenses and charges | As adjusted |
| |
| 2021 | £m | £m | £m |
| Profit after tax | 1,405 | | 244 | | 1,649 | |
| Less non-controlling interests of annual profit | (36) | | | (36) | |
| Profit due to equity holders of the parent (A) | 1,369 | | | 1,613 | |
| | | | | | | | | | | |
| | Equity adjustments | As adjusted |
| |
| 2021 | £m | £m | £m |
| Average shareholders' equity | 16,312 | | | |
| Less average AT1 securities | (2,216) | | | |
| Less average non-controlling interests | (316) | | | |
| Average ordinary shareholders' equity (B) | 13,780 | | | |
| Average goodwill and intangible assets | (1,597) | | | |
| Average tangible equity (C) | 12,183 | | 61 | | 12,244 | |
| | | |
| Return on ordinary shareholders’ equity (A/B) | 9.9 | % | | — | |
| RoTE (A/C) | — | | | 13.2 | % |
–Specific income, expenses, charges
Details of these items are outlined in 'a) Adjusted profit metrics and average customer assets' above, with a total impact on profit from continuing operations before tax of £308m. The impact of these items on the taxation charge was £54m and on profit after tax was £254m. Tax is calculated at the standard rate of corporation tax including the bank surcharge, except for items such as conduct provisions which are not tax deductible.
–Equity adjustments
These adjustments are made to reflect the impact of adjustments to profit on average tangible equity.
Management does not assess forward-looking ‘Return on ordinary shareholders’ equity' (ROE) as a performance indicator of the business, and therefore a reconciliation of the forward-looking non-IFRS Adjusted RoTE targets for the medium term to an equivalent IFRS measure for ROE is not available without unreasonable efforts.
| | | | | | | | | | | | | | |
| Annual Report 2022 | Santander UK Group Holdings plc 183 |
| | | | | | | | | | | | | | | | | | | | | | | | | | | | | | | | | | | | | | | | | |
| Strategic Report | Sustainability and Responsible Banking | Governance | Risk review | Financial review | Financial
statements | Shareholder
information |
| | | | | | | | | | | | | |
| | | | | | | | | | | | | |
| | | | | | | | | | | |
| Financial statements | | | |
| | Contents | |
| | | |
| | Report of Independent Registered Public Accounting Firm (PCAOB ID 876) | |
| | Primary financial statements | |
| | Consolidated Income Statement | |
| | Consolidated Statement of Comprehensive Income | |
| | Consolidated Balance Sheet | |
| | Consolidated Cash Flow Statement | |
| | Consolidated Statement of Changes in Equity | |
| | Notes to the financial statements | |
| | | |
| | | |
| | | |
| | | |
| | | |
| | | |
| | | | | | | | | | | | | | |
| Annual Report 2022 | Santander UK Group Holdings plc 184 |
| | | | | | | | | | | | | | | | | | | | | | | | | | | | | | | | | | | | | | | | | |
| Strategic Report | Sustainability and Responsible Banking | Governance | Risk review | Financial review | Financial
statements | Shareholder
information |
| | | | | | | | | | | | | |
| | | | | | | | | | | | | |
Report of Independent Registered Public Accounting Firm
To the Board of Directors and Shareholders of Santander UK Group Holdings plc
Opinion on the Financial Statements
We have audited the accompanying consolidated balance sheets of Santander UK Group Holdings plc and its subsidiaries (the “Company”) as of December 31, 2022 and 2021, and the related consolidated income statement, consolidated statement of comprehensive income, consolidated cash flow statement and consolidated statement of changes in equity for each of the three years in the period ended December 31, 2022, including the related notes (collectively referred to as the “consolidated financial statements”). In our opinion, the consolidated financial statements present fairly, in all material respects, the financial position of the Company as of December 31, 2022 and 2021, and the results of its operations and its cash flows for each of the three years in the period ended December 31, 2022 in accordance with i) International Financial Reporting Standards as issued by the International Accounting Standards Board, and ii) UK-adopted International Accounting Standards.
Basis for Opinion
These consolidated financial statements are the responsibility of the Company’s management. Our responsibility is to express an opinion on the Company’s consolidated financial statements based on our audits. We are a public accounting firm registered with the Public Company Accounting Oversight Board (United States) (PCAOB) and are required to be independent with respect to the Company in accordance with the U.S. federal securities laws and the applicable rules and regulations of the Securities and Exchange Commission and the PCAOB.
We conducted our audits of these consolidated financial statements in accordance with the standards of the PCAOB. Those standards require that we plan and perform the audit to obtain reasonable assurance about whether the consolidated financial statements are free of material misstatement, whether due to error or fraud. The Company is not required to have, nor were we engaged to perform, an audit of its internal control over financial reporting. As part of our audits we are required to obtain an understanding of internal control over financial reporting but not for the purpose of expressing an opinion on the effectiveness of the Company's internal control over financial reporting. Accordingly, we express no such opinion.
Our audits included performing procedures to assess the risks of material misstatement of the consolidated financial statements, whether due to error or fraud, and performing procedures that respond to those risks. Such procedures included examining, on a test basis, evidence regarding the amounts and disclosures in the consolidated financial statements. Our audits also included evaluating the accounting principles used and significant estimates made by management, as well as evaluating the overall presentation of the consolidated financial statements. We believe that our audits provide a reasonable basis for our opinion.
Critical Audit Matters
The critical audit matters communicated below are matters arising from the current period audit of the consolidated financial statements that were communicated or required to be communicated to the Board Audit Committee and that (i) relate to accounts or disclosures that are material to the consolidated financial statements and (ii) involved our especially challenging, subjective, or complex judgements. The communication of critical audit matters does not alter in any way our opinion on the consolidated financial statements, taken as a whole, and we are not, by communicating the critical audit matters below, providing separate opinions on the critical audit matters or on the accounts or disclosures to which they relate.
Credit Impairment Loss Allowance on loans and advances to customers
As described in Notes 1 and 13 to the consolidated financial statements, expected credit losses (“ECL”) are recognised for financial assets measured at amortised cost. The measurement of ECL reflects: a probability weighted amount that is determined by evaluating a range of possible outcomes; the time value of money; and information about past events, current conditions and forecasts of future economic conditions. The application of the ECL impairment methodology for calculating credit impairment loss allowances is highly susceptible to change from period to period and requires management to make assumptions in determining the estimate. The key judgements made by management in applying the ECL impairment methodology are: (i) the forward looking multiple economic scenarios; (ii) the probability weights assigned to multiple economic scenarios; (iii) assessing individual corporate stage 3 exposures; and (iv) determining judgemental adjustments. The Company’s ECL was £933 million as of December 31, 2022.
The principal considerations for our determination that performing procedures relating to the credit impairment loss allowance on loans and advances to customers is a critical audit matter are due to the significant judgements being applied by management in determining (i) the forward looking economic scenarios, (ii) the probability weights applied to those scenarios, (iii) individual corporate stage 3 provisions and (iv) judgemental adjustments. This in turn led to a high degree of auditor judgement, subjectivity and effort in performing procedures and evaluating audit evidence related to the methodology and judgement in assumptions used to determine the allowance; and the audit effort involved the use of professionals with specialised skill and knowledge.
Addressing the matter involved performing procedures and evaluating audit evidence in connection with forming our overall opinion on the consolidated financial statements. These procedures included testing the effectiveness of controls relating to the credit impairment loss allowance. These procedures also included, among others, testing management’s process for estimating expected credit losses; evaluating the appropriateness of model methodologies; testing the underlying data used in the model and evaluating the reasonableness of management’s assumptions related to (i) multiple forward looking economic scenarios and their relative probability weights; (ii) judgemental adjustments; and (iii) expected future cash flows and collateral valuations of individually assessed corporate stage 3 exposures. Professionals with specialised skill and knowledge were used to assist in evaluating the reasonableness of the forward looking economic scenarios, probability weight assumptions, the sufficiency and appropriateness of the judgemental adjustments, and corporate real estate collateral valuations.
| | | | | | | | | | | | | | |
| Annual Report 2022 | Santander UK Group Holdings plc 185 |
| | | | | | | | | | | | | | | | | | | | | | | | | | | | | | | | | | | | | | | | | |
| Strategic Report | Sustainability and Responsible Banking | Governance | Risk review | Financial review | Financial
statements | Shareholder
information |
| | | | | | | | | | | | | |
| | | | | | | | | | | | | |
Valuation of defined benefit pension surplus
As described in Notes 1 and 30 to the consolidated financial statements, the Company operates a number of defined benefit pension schemes. The main scheme is the Santander (UK) Group Pension Scheme (the scheme). The scheme is in a net surplus of £1,051 million as of December 31, 2022. Any surplus or deficit of scheme assets over liabilities is recognised in the balance sheet as an asset (surplus) or liability (deficit). Management estimates the present value of the defined benefit obligation by projecting forward the growth in current accrued pension benefits to reflect inflation and salary growth to the date of pension payment, then discounted to present value. In determining the value of scheme liabilities, demographic and financial assumptions are made by management about life expectancy, inflation and discount rates. The scheme invests in certain assets whose values are not based on market observable data which totalled £3,100 million as of December 31, 2022. These illiquid assets included investments in unquoted equities and unquoted corporate bonds, as well as investments in property, infrastructure and hedge funds. These illiquid assets are valued by reference to the latest manager statements provided by the managers, adjusted for any cash movements since the latest valuation, with the exception of directly held property where the underlying asset valuations are prepared by an independent expert, adjusted for any cash movements where necessary since the latest valuation.
The principal considerations for our determination that performing procedures relating to the valuation of the defined benefit pension surplus is a critical audit matter are due to the significant judgements made by management in determining: (i) the life expectancy, inflation and discount rate assumptions; and (ii) the fair value of the scheme’s illiquid assets, including adjustments for any capital changes and potential fair value movements since the last valuation date. This, in turn, led to significant auditor judgement, subjectivity and effort in performing procedures and evaluating audit evidence. The audit effort involved the use of professionals with specialised skill or knowledge.
Addressing the matter involved performing procedures and evaluating audit evidence in connection with forming our overall opinion on the consolidated financial statements. These procedures included testing the effectiveness of controls relating to the valuation of the defined benefit pension obligation and the valuation of illiquid assets. These procedures also included, among others, evaluating the defined benefit pension obligation by 1) testing the completeness and accuracy of the underlying data, and 2) the involvement of professionals with specialised skill and knowledge to assist in a) developing an independent range of the inflation rate, the discount rate and life expectancy assumptions, b) comparing the independent range of assumptions to management's assumptions to evaluate the reasonableness of management’s assumptions and c) assessing the appropriateness of the methodologies used by management to determine these assumptions. Procedures over directly held property included, among others: (i) the involvement of professionals with specialised skill and knowledge to assist in assessing the appropriateness of the methodology and reasonableness of the key assumptions used by management’s third party valuer for property and reviewing the reasonableness of the valuation for a sample of properties, (ii) for the other illiquid assets, obtaining third-party confirmations of the valuation directly from investment managers and comparing these against management’s reported value, recalculating management’s valuations and comparing them to the third-party confirmations and, if applicable, testing material capital changes in the period between the valuation and the entity’s balance sheet date where there was a time lag, (iii) assessing evidence regarding the valuations, such as agreeing NAV statements from investment managers to audited fund financial statements where they were available, performing back testing of fair values to any recent transactions and reviewing controls reports for the investment managers where available.
Goodwill impairment assessment - personal financial services cash generating unit
As described in Notes 1 and 20 to the consolidated financial statements, the carrying amount of goodwill relating to the personal financial services (‘PFS’) cash generating unit (“CGU”) was £1.17 billion as of December 31, 2022. Management undertakes an annual assessment to evaluate whether the carrying value of goodwill is impaired, carrying out this assessment more frequently if reviews identify indicators of impairment or when events or changes in circumstances dictate. Impairment is required where the carrying value of goodwill exceeds its recoverable amount. The recoverable amount of the CGU was determined based on the value in use (“VIU”) methodology at each testing date. The VIU is calculated by discounting the cash flow projections for the CGU. The carrying value of the goodwill is based on the application of judgement in determining the basis of goodwill impairment testing methodology, including the need for planning assumptions and internal capital allocations. Estimates include forecast cash flows for CGUs, including estimated allocations of regulatory capital, the growth rate for the period beyond the initial cash flow projections and discount rates which factor in risk-free rates and applicable risk premiums.
The principal considerations for our determination that performing procedures relating to the goodwill impairment assessment - personal financial services cash generating unit is a critical audit matter are due to the significant judgements by management in determining (i) the amount of regulatory capital and carrying value of the PFS CGU, (ii) the forecast cash flows, (iii) the discount rate and (iv) the growth rate for the period beyond the initial cash flow projections assumptions. This, in turn, led to significant auditor judgement, subjectivity and effort in performing procedures and evaluating audit evidence related to management’s judgements and assumptions. In addition, the audit effort involved the use of professionals with specialised skill or knowledge.
Addressing the matter involved performing procedures and evaluating audit evidence in connection with forming our overall opinion on the consolidated financial statements. These procedures also included, among others, (i) testing management’s process for determining the carrying value of individual CGU including internal capital allocations, (ii) evaluating the appropriateness of the methodology used to estimate the VIU, (iii) testing the completeness and accuracy of underlying data used in the model (iv) comparing an independent range of assumptions for the discount rate and the growth rate beyond the initial cash flow projections to management's assumptions to evaluate the reasonableness of management’s assumptions, and (v) evaluating the reasonableness of the forecasted cash flows including comparing performance in recent years to the budgets and 3 year plans for the equivalent periods to assess the accuracy of the budgeting and forecasting process and (vi) assessing the appropriateness of the related disclosures. Professionals with specialised skill and knowledge assisted in the evaluation of the reasonableness of the discount rate, the growth beyond the initial cash flow projections and assessing the determination of the carrying value of the PFS CGU.
Litigation and other regulatory matters
As described in Notes 1, 29 and 31 to the consolidated financial statements, as of December 31, 2022, the provision for litigation and other regulatory matters of £136 million includes, among other items, a provision relating to a legal dispute regarding allocation of responsibility for a specific Payment Protection Insurance (“PPI”) portfolio of complaints. There is also an ongoing investigation in relation to the historical involvement of Santander UK plc, Santander Financial Services plc and Cater Allen International Limited (all subsidiaries of Santander UK Group Holdings plc) in German dividend tax arbitrage transactions for which management has determined that there are uncertainties that mean it is not currently possible to make a reliable assessment of the size of any potential liability. Significant judgement may be required when accounting for provisions, including in determining whether a present obligation exists, in assessing the likely outcome of future legal decisions and in estimating the probability, timing, nature and amount of any outflows that may arise from past events. These judgements are based on the specific facts available and often require specialist professional advice. There can be a wide range of possible outcomes and uncertainties, particularly in relation to legal actions, and regulatory and consumer credit matters.
The principal considerations for our determination that performing procedures relating to litigation and other regulatory matters is a critical audit matter are due to the significant judgements made by management when estimating the probability, timing, nature and amount of any outflows for the legal dispute for a specific PPI portfolio of complaints, and the German dividend tax arbitrage investigation. This in turn led to a high degree of auditor judgement, subjectivity and effort in performing procedures and evaluating audit evidence obtained.
Addressing the matter involved performing procedures and evaluating audit evidence in connection with forming our overall opinion on the consolidated financial statements. These procedures included testing the effectiveness of controls relating to management’s assessment of the cases against the requirements of IAS
| | | | | | | | | | | | | | |
| Annual Report 2022 | Santander UK Group Holdings plc 186 |
| | | | | | | | | | | | | | | | | | | | | | | | | | | | | | | | | | | | | | | | | |
| Strategic Report | Sustainability and Responsible Banking | Governance | Risk review | Financial review | Financial
statements | Shareholder
information |
| | | | | | | | | | | | | |
| | | | | | | | | | | | | |
37, Provisions, Contingent Liabilities and Contingent Assets. These procedures also included, among others, (i) inquiries of internal legal counsel on the developments in respect to the significant cases (ii) obtaining and evaluating letters of audit inquiry from external legal counsel, (iii) evaluating the reasonableness of management’s assessment regarding the probability of an outflow and the estimated amount of the obligation, where a reliable estimate can be formed and (iv) evaluating the sufficiency of the group’s disclosures made in relation to each of the matters.
/s/ PricewaterhouseCoopers LLP
London, UK
7 March 2023
We have served as the Company's auditor since 2016.
| | | | | | | | | | | | | | |
| Annual Report 2022 | Santander UK Group Holdings plc 187 |
| | | | | | | | | | | | | | | | | | | | | | | | | | | | | | | | | | | | | | | | | |
| Strategic Report | Sustainability and Responsible Banking | Governance | Risk review | Financial review | Financial
statements | Shareholder
information |
| | | | | | | | | | | | | |
| | | | | | | | | | | | | |
This page left intentionally blank
| | | | | | | | | | | | | | |
| Annual Report 2022 | Santander UK Group Holdings plc 188 |
| | | | | | | | | | | | | | | | | | | | | | | | | | | | | | | | | | | | | | | | | |
| Strategic Report | Sustainability and Responsible Banking | Governance | Risk review | Financial review | Financial
statements | Shareholder
information |
| | | | | | | | | | | | | |
| | | | | | | | | | | | | |
This page left intentionally blank
| | | | | | | | | | | | | | |
| Annual Report 2022 | Santander UK Group Holdings plc 189 |
| | | | | | | | | | | | | | | | | | | | | | | | | | | | | | | | | | | | | | | | | |
| Strategic Report | Sustainability and Responsible Banking | Governance | Risk review | Financial review | Financial
statements | Shareholder
information |
| | | | | | | | | | | | | |
| | | | | | | | | | | | | |
This page left intentionally blank
| | | | | | | | | | | | | | |
| Annual Report 2022 | Santander UK Group Holdings plc 190 |
| | | | | | | | | | | | | | | | | | | | | | | | | | | | | | | | | | | | | | | | | |
| Strategic Report | Sustainability and Responsible Banking | Governance | Risk review | Financial review | Financial
statements | Shareholder
information |
| | | | | | | | | | | | | |
| | | | | | | | | | | | | |
This page left intentionally blank
| | | | | | | | | | | | | | |
| Annual Report 2022 | Santander UK Group Holdings plc 191 |
| | | | | | | | | | | | | | | | | | | | | | | | | | | | | | | | | | | | | | | | | |
| Strategic Report | Sustainability and Responsible Banking | Governance | Risk review | Financial review | Financial
statements | Shareholder
information |
| | | | | | | | | | | | | |
| | | | | | | | | | | | | |
This page left intentionally blank
| | | | | | | | | | | | | | |
| Annual Report 2022 | Santander UK Group Holdings plc 192 |
| | | | | | | | | | | | | | | | | | | | | | | | | | | | | | | | | | | | | | | | | |
| Strategic Report | Sustainability and Responsible Banking | Governance | Risk review | Financial review | Financial
statements | Shareholder
information |
| | | | | | | | | | | | | |
| | | | | | | | | | | | | |
This page left intentionally blank
| | | | | | | | | | | | | | |
| Annual Report 2022 | Santander UK Group Holdings plc 193 |
| | | | | | | | | | | | | | | | | | | | | | | | | | | | | | | | | | | | | | | | | |
| Strategic Report | Sustainability and Responsible Banking | Governance | Risk review | Financial review | Financial
statements | Shareholder
information |
| | | | | | | | | | | | | |
| | | | | | | | | | | | | |
Consolidated Income Statement
For the years ended 31 December
| | | | | | | | | | | | | | |
| | 2022 | 2021 | 2020 |
| Notes | £m | £m | £m |
| Interest and similar income | 3 | 6,822 | | 4,830 | | 5,071 | |
| Interest expense and similar charges | 3 | (2,350) | | (833) | | (1,690) | |
| Net interest income | | 4,472 | | 3,997 | | 3,381 | |
| Fee and commission income | 4 | 836 | | 694 | | 681 | |
| Fee and commission expense | 4 | (512) | | (414) | | (363) | |
| Net fee and commission income | | 324 | | 280 | | 318 | |
| Other operating income | 5 | 210 | | 267 | | 136 | |
| Total operating income | | 5,006 | | 4,544 | | 3,835 | |
| Operating expenses before credit impairment (charges)/write-backs, provisions and charges | 6 | (2,370) | | (2,540) | | (2,425) | |
| Credit impairment (charges)/write-backs | 8 | (321) | | 233 | | (639) | |
| Provisions for other liabilities and charges | 8 | (421) | | (379) | | (263) | |
| Total operating credit impairment (charges)/write-backs, provisions and charges | | (742) | | (146) | | (902) | |
| Profit from continuing operations before tax | | 1,894 | | 1,858 | | 508 | |
| Tax on profit from continuing operations | 9 | (471) | | (485) | | (101) | |
| Profit from continuing operations after tax | | 1,423 | | 1,373 | | 407 | |
| Profit from discontinued operations after tax | 42 | — | | 32 | | 31 | |
| Profit after tax | | 1,423 | | 1,405 | | 438 | |
| | | | |
| Attributable to: | | | | |
| Equity holders of the parent | | 1,406 | | 1,369 | | 402 | |
| Non-controlling interests | | 17 | | 36 | | 36 | |
| Profit after tax | | 1,423 | | 1,405 | | 438 | |
The accompanying Notes to the Financial Statements form an integral part of these Consolidated Financial Statements.
| | | | | | | | | | | | | | |
| Annual Report 2022 | Santander UK Group Holdings plc 194 |
| | | | | | | | | | | | | | | | | | | | | | | | | | | | | | | | | | | | | | | | | |
| Strategic Report | Sustainability and Responsible Banking | Governance | Risk review | Financial review | Financial
statements | Shareholder
information |
| | | | | | | | | | | | | |
| | | | | | | | | | | | | |
Consolidated Statement of Comprehensive Income
For the years ended 31 December
| | | | | | | | | | | |
| 2022 | 2021 | 2020 |
| £m | £m | £m |
| Profit after tax | 1,423 | | 1,405 | | 438 | |
| Other comprehensive (expense)/income that may be reclassified to profit or loss subsequently: | | | |
| Movement in fair value reserve (debt instruments): | | | |
| - Change in fair value | (278) | | (111) | | 114 | |
| - Income statement transfers | 247 | | 110 | | (107) | |
| - Taxation | 11 | | (2) | | (2) | |
| (20) | | (3) | | 5 | |
| Cash flow hedges: | | | |
| - Effective portion of changes in fair value | 436 | | (875) | | 974 | |
| - Income statement transfers | (2,130) | | 357 | | (803) | |
| - Taxation | 468 | | 142 | | (53) | |
| (1,226) | | (376) | | 118 | |
| Currency translation on foreign operations | — | | — | | — | |
| Net other comprehensive (expense)/income that may be reclassified to profit or loss subsequently | (1,246) | | (379) | | 123 | |
| Other comprehensive (expense)/income that will not be reclassified to profit or loss subsequently: | | | |
| Pension remeasurement: | | | |
| - Change in fair value | (723) | | 1,263 | | (505) | |
| - Taxation | 267 | | (419) | | 133 | |
| (456) | | 844 | | (372) | |
| Own credit adjustment: | | | |
| - Change in fair value | 29 | | — | | (3) | |
| - Taxation | (9) | | — | | 0 | |
| 20 | | — | | (3) | |
| Net other comprehensive (expense)/income that will not be reclassified to profit or loss subsequently | (436) | | 844 | | (375) | |
| Total other comprehensive (expense)/income net of tax | (1,682) | | 465 | | (252) | |
| Total comprehensive (expense)/income | (259) | | 1,870 | | 186 | |
| | | |
| Attributable to: | | | |
| Equity holders of the parent | (276) | | 1,834 | | 152 | |
| Non-controlling interests | 17 | | 36 | | 34 | |
| Total comprehensive (expense)/income | (259) | | 1,870 | | 186 | |
The accompanying Notes to the Financial Statements form an integral part of these Consolidated Financial Statements.
| | | | | | | | | | | | | | |
| Annual Report 2022 | Santander UK Group Holdings plc 195 |
| | | | | | | | | | | | | | | | | | | | | | | | | | | | | | | | | | | | | | | | | |
| Strategic Report | Sustainability and Responsible Banking | Governance | Risk review | Financial review | Financial
statements | Shareholder
information |
| | | | | | | | | | | | | |
| | | | | | | | | | | | | |
Consolidated Balance Sheet(1)
At 31 December
| | | | | | | | | | | |
| | 2022 | 2021 |
| Notes | £m | £m |
| Assets | | | |
| Cash and balances at central banks | | 46,635 | | 50,494 | |
| Derivative financial instruments | 11 | 2,439 | | 1,720 | |
| Other financial assets at fair value through profit or loss | 12 | 434 | | 676 | |
| Loans and advances to customers | 13 | 223,840 | | 213,525 | |
| Loans and advances to banks | | 1,105 | | 1,420 | |
| Reverse repurchase agreements - non trading | 16 | 7,348 | | 12,683 | |
| Other financial assets at amortised cost | 17 | 156 | | 506 | |
| Macro hedge of interest rate risk | | (2,654) | | 85 | |
| Financial assets at fair value through other comprehensive income | 18 | 6,024 | | 5,851 | |
| Interests in other entities | 19 | 252 | | 201 | |
| Intangible assets | 20 | 1,550 | | 1,545 | |
| Property, plant and equipment | 21 | 1,526 | | 1,555 | |
| Current tax assets | | 484 | | 351 | |
| Retirement benefit assets | 30 | 1,051 | | 1,573 | |
| Other assets | | 2,004 | | 1,491 | |
| Assets held for sale | 42 | 49 | | — | |
| Total assets | | 292,243 | | 293,676 | |
| Liabilities | | | |
| Derivative financial instruments | 11 | 1,008 | | 1,019 | |
| Other financial liabilities at fair value through profit or loss | 22 | 803 | | 803 | |
| Deposits by customers | 23 | 197,313 | | 192,914 | |
| Deposits by banks | 24 | 28,543 | | 33,862 | |
| Repurchase agreements - non trading | 25 | 7,982 | | 11,718 | |
| Debt securities in issue | 26 | 36,420 | | 31,580 | |
| Subordinated liabilities | 27 | 2,332 | | 2,228 | |
| Macro hedge of interest rate risk | | 95 | | 122 | |
| Other liabilities | 28 | 2,601 | | 2,076 | |
| Provisions | 29 | 380 | | 366 | |
| Deferred tax liabilities | | 30 | | 573 | |
| Retirement benefit obligations | 30 | 25 | | 37 | |
| | | |
| Total liabilities | | 277,532 | | 277,298 | |
| Equity | | | |
| Share capital | 32 | 7,060 | | 7,060 | |
| Other equity instruments | 33 | 2,196 | | 2,191 | |
| Retained earnings | | 6,563 | | 6,754 | |
| Other reserves | | (1,108) | | 138 | |
| Total shareholders’ equity | | 14,711 | | 16,143 | |
| Non-controlling interests | 45 | — | | 235 | |
| Total equity | | 14,711 | | 16,378 | |
| Total liabilities and equity | | 292,243 | | 293,676 | |
(1) For more information on balance sheet amounts restated see Note 44.
The accompanying Notes to the Financial Statements form an integral part of these Consolidated Financial Statements.
The Financial Statements were approved and authorised for issue by the Board on 1 March 2023 and signed on its behalf by:
| | | | | |
| Mike Regnier | Madhukar Dayal |
| Chief Executive Officer | Chief Financial Officer |
| Company Registered Number: 08700698 | |
| | | | | | | | | | | | | | |
| Annual Report 2022 | Santander UK Group Holdings plc 196 |
| | | | | | | | | | | | | | | | | | | | | | | | | | | | | | | | | | | | | | | | | |
| Strategic Report | Sustainability and Responsible Banking | Governance | Risk review | Financial review | Financial
statements | Shareholder
information |
| | | | | | | | | | | | | |
| | | | | | | | | | | | | |
Consolidated Cash Flow Statement(1)
For the years ended 31 December
| | | | | | | | | | | |
| 2022 | 2021 | 2020 |
| £m | £m | £m |
| Cash flows from operating activities | | | |
| Profit before tax | 1,894 | | 1,902 | | 552 | |
| | | |
| Adjustments for: | | | |
| Non-cash items included in profit: | | | |
| – Depreciation and amortisation | 297 | | 506 | | 570 | |
| – Provisions for other liabilities and charges | 421 | | 383 | | 274 | |
| – Impairment losses | 285 | | (228) | | 672 | |
| | | |
| – Other non-cash items | 1,363 | | (244) | | 93 | |
| – Pension charge/(credit) for defined benefit pension schemes | 28 | | 38 | | 38 | |
| 2,394 | | 455 | | 1,647 | |
| Net change in operating assets and liabilities: | | | |
| – Cash and balances at central banks | 274 | | (659) | | (57) | |
| – Derivative assets | (719) | | 1,731 | | (88) | |
| – Other financial assets at fair value through profit or loss | 1,064 | | 1,143 | | 1,561 | |
| – Loans and advances to banks and customers | (10,683) | | (960) | | (5,421) | |
| – Reverse repurchase agreements - non trading | 6,818 | | 7,024 | | 3,924 | |
| – Other assets | (571) | | 327 | | (343) | |
| – Deposits by banks and customers | (1,373) | | 12,747 | | 20,812 | |
| – Repurchase agreements - non trading | (4,145) | | (7,550) | | (2,959) | |
| – Derivative liabilities | (11) | | (902) | | 211 | |
| – Other financial liabilities at fair value through profit or loss | (973) | | (1,109) | | (1,618) | |
| – Debt securities in issue | (1,352) | | (330) | | (202) | |
| – Other liabilities | (41) | | (608) | | (937) | |
| (11,712) | | 10,854 | | 14,883 | |
| Corporation taxes paid | (397) | | (418) | | (161) | |
| Effects of exchange rate differences | 2,354 | | (640) | | 366 | |
| Net cash flows from operating activities | (5,467) | | 12,153 | | 17,287 | |
| Cash flows from investing activities | | | |
| | | |
| | | |
| Purchase of property, plant and equipment and intangible assets | (504) | | (615) | | (378) | |
| Proceeds from sale of property, plant and equipment and intangible assets | 159 | | 437 | | 166 | |
| Purchase of financial assets at amortised cost and financial assets at FVOCI | (2,884) | | (1,256) | | (3,015) | |
| Proceeds from sale and redemption of financial assets at amortised cost and financial assets at FVOCI | 3,023 | | 4,509 | | 9,858 | |
| Net cash flows from investing activities | (206) | | 3,075 | | 6,631 | |
| Cash flows from financing activities | | | |
| Issue of other equity instruments | 750 | | 450 | | — | |
| | | |
| Issue of debt securities and subordinated notes | 8,683 | | 2,853 | | 5,599 | |
| Issuance costs of debt securities and subordinated notes | (16) | | (6) | | (13) | |
| Repayment of debt securities and subordinated notes | (4,522) | | (13,728) | | (13,287) | |
| Disposal of non-controlling interests | (235) | | (181) | | — | |
| Repurchase of other equity instruments | (750) | | (500) | | — | |
| Dividends paid on ordinary shares | (1,013) | | (1,346) | | (103) | |
| Dividends paid on other equity instruments | (143) | | (143) | | (147) | |
| Dividends paid on non-controlling interests | (17) | | (17) | | (32) | |
| Principal elements of lease payments | (26) | | (25) | | (46) | |
| Net cash flows from financing activities | 2,711 | | (12,643) | | (8,029) | |
| Change in cash and cash equivalents | (2,962) | | 2,585 | | 15,889 | |
| Cash and cash equivalents at beginning of the year | 51,787 | | 49,221 | | 33,287 | |
| Effects of exchange rate changes on cash and cash equivalents | 120 | | (19) | | 45 | |
| Cash and cash equivalents at the end of the year | 48,945 | | 51,787 | | 49,221 | |
| | | |
| Cash and cash equivalents consist of: | | | |
| Cash and balances at central banks | 46,635 | | 50,494 | | 43,537 | |
| Less: restricted balances | (2,241) | | (2,515) | | (1,856) | |
| 44,394 | | 47,979 | | 41,681 | |
| | | |
| Other cash equivalents: Loans and advances to banks - Non trading | 938 | 1,270 | 1,690 |
| Other cash equivalents: Reverse repurchase agreements | 3,613 | 2,538 | 5,850 |
| Cash and cash equivalents at the end of the year | 48,945 | 51,787 | 49,221 |
(1) For more information on cash flows and amounts restated see Note 34.
The accompanying Notes to the Financial Statements form an integral part of these Consolidated Financial Statements.
| | | | | | | | | | | | | | |
| Annual Report 2022 | Santander UK Group Holdings plc 197 |
| | | | | | | | | | | | | | | | | | | | | | | | | | | | | | | | | | | | | | | | | |
| Strategic Report | Sustainability and Responsible Banking | Governance | Risk review | Financial review | Financial
statements | Shareholder
information |
| | | | | | | | | | | | | |
| | | | | | | | | | | | | |
Consolidated Statement of Changes in Equity
| | | | | | | | | | | | | | | | | | | | | | | | | | | | | |
| | | Other reserves | | | Non-controlling interests | |
| Share capital | Other equity instruments | Fair value | Cash flow hedging | Currency translation | Retained earnings | | |
| Total | Total |
| £m | £m | £m | £m | £m | £m | £m | £m | £m |
| At 1 January 2022 | 7,060 | | 2,191 | | 26 | | 110 | | 2 | | 6,754 | | 16,143 | | 235 | | 16,378 | |
| Profit after tax | — | | — | | — | | — | | — | | 1,406 | | 1,406 | | 17 | | 1,423 | |
| Other comprehensive (expense)/income, net of tax: | | | | | | | | | |
| - Fair value reserve (debt instruments) | — | | — | | (20) | | — | | — | | — | | (20) | | — | | (20) | |
| - Cash flow hedges | — | | — | | — | | (1,226) | | — | | — | | (1,226) | | — | | (1,226) | |
| - Pension remeasurement | — | | — | | — | | — | | — | | (456) | | (456) | | — | | (456) | |
| - Own credit adjustment | — | | — | | — | | — | | — | | 20 | | 20 | | — | | 20 | |
| | | | | | | | | |
| Total comprehensive income | — | | — | | (20) | | (1,226) | | — | | 970 | | (276) | | 17 | | (259) | |
| Issue of other equity instruments | — | | 750 | | — | | — | | — | | — | | 750 | | — | | 750 | |
| Disposal of non-controlling interests | — | | — | | — | | — | | — | | — | | — | | (235) | | (235) | |
| Repurchase of other equity instruments | — | | (745) | | — | | — | | — | | (5) | | (750) | | — | | (750) | |
| | | | | | | | | |
| Dividends on ordinary shares | — | | — | | — | | — | | — | | (1,013) | | (1,013) | | — | | (1,013) | |
| Dividends on other equity instruments | — | | — | | — | | — | | — | | (143) | | (143) | | — | | (143) | |
| Dividends on non-controlling interests | — | | — | | — | | — | | — | | — | | — | | (17) | | (17) | |
| | | | | | | | | |
| At 31 December 2022 | 7,060 | | 2,196 | | 6 | | (1,116) | | 2 | | 6,563 | | 14,711 | | — | | 14,711 | |
| | | | | | | | | |
| At 1 January 2021 | 7,060 | | 2,241 | | 29 | | 486 | | 2 | | 6,030 | | 15,848 | | 397 | | 16,245 | |
| Profit after tax | — | | — | | — | | — | | — | | 1,369 | | 1,369 | | 36 | | 1,405 | |
| Other comprehensive (expense)/income, net of tax: | | | | | | | | | |
| - Fair value reserve (debt instruments) | — | | — | | (3) | | — | | — | | — | | (3) | | — | | (3) | |
| - Cash flow hedges | — | | — | | — | | (376) | | — | | — | | (376) | | — | | (376) | |
| - Pension remeasurement | — | | — | | — | | — | | — | | 844 | | 844 | | — | | 844 | |
| Total comprehensive income | — | | — | | (3) | | (376) | | — | | 2,213 | | 1,834 | | 36 | | 1,870 | |
| Issue of other equity instruments | — | | 450 | | — | | — | | — | | — | | 450 | | — | | 450 | |
| Disposal of non-controlling interests | — | | — | | — | | — | | — | | — | | — | | (181) | | (181) | |
| Repurchase of other equity instruments | — | | (500) | | — | | — | | — | | — | | (500) | | — | | (500) | |
| Dividends on ordinary shares | — | | — | | — | | — | | — | | (1,346) | | (1,346) | | — | | (1,346) | |
| Dividends on other equity instruments | — | | — | | — | | — | | — | | (143) | | (143) | | — | | (143) | |
| Dividends on non-controlling interests | — | | — | | — | | — | | — | | — | | — | | (17) | | (17) | |
| At 31 December 2021 | 7,060 | | 2,191 | | 26 | | 110 | | 2 | | 6,754 | | 16,143 | | 235 | | 16,378 | |
| | | | | | | | | |
| At 1 January 2020 | 7,060 | | 2,241 | | 24 | | 368 | | 2 | | 6,251 | | 15,946 | | 395 | | 16,341 | |
| Profit after tax | — | | — | | — | | — | | — | | 402 | | 402 | | 36 | | 438 | |
| Other comprehensive (expense). income, net of tax: | | | | | | | | | |
| - Fair value reserve (debt instruments) | — | | — | | 5 | | — | | — | | — | | 5 | | — | | 5 | |
| - Cash flow hedges | — | | — | | — | | 118 | | — | | — | | 118 | | — | | 118 | |
| - Pension remeasurement | — | | — | | — | | — | | — | | (370) | | (370) | | (2) | | (372) | |
| - Own credit adjustment | — | | — | | — | | — | | — | | (3) | | (3) | | — | | (3) | |
| Total comprehensive income | — | | — | | 5 | | 118 | | — | | 29 | | 152 | | 34 | | 186 | |
| Dividends on ordinary shares | — | | — | | — | | — | | — | | (103) | | (103) | | — | | (103) | |
| Dividends on other equity instruments | — | | — | | — | | — | | — | | (147) | | (147) | | — | | (147) | |
| Dividends on non-controlling interests | — | | — | | — | | — | | — | | — | | — | | (32) | | (32) | |
| At 31 December 2020 | 7,060 | | 2,241 | | 29 | | 486 | | 2 | | 6,030 | | 15,848 | | 397 | | 16,245 | |
The accompanying Notes to the Financial Statements form an integral part of these Consolidated Financial Statements.
| | | | | | | | | | | | | | |
| Annual Report 2022 | Santander UK Group Holdings plc 198 |
| | | | | | | | | | | | | | | | | | | | | | | | | | | | | | | | | | | | | | | | | |
| Strategic Report | Sustainability and Responsible Banking | Governance | Risk review | Financial review | Financial
statements | Shareholder
information |
| | | | | | | | | | | | | |
| | | | | | | | | | | | | |
1. ACCOUNTING POLICIES
These financial statements are prepared for Santander UK Group Holdings plc (the Company) and the Santander UK Group Holdings plc group (the Santander UK group) under the UK Companies Act 2006. The principal activity of the Santander UK group is the provision of a wide range of banking and financial services to personal, business and corporate customers. Santander UK Group Holdings plc is a public company, limited by shares and incorporated in England and Wales having a registered office at 2 Triton Square, Regent’s Place, London, NW1 3AN. It is a financial services holding company.
Basis of preparation
These financial statements incorporate the financial statements of the Company and entities it controls (its subsidiaries) made up to 31 December each year. The consolidated financial statements have been prepared on the going concern basis using the historical cost convention, except for financial assets and liabilities that have been measured at fair value. An assessment of the appropriateness of the adoption of the going concern basis of accounting is disclosed in the statement of going concern in the Directors’ report.
Compliance with International Financial Reporting Standards (IFRS)
The consolidated financial statements of the Santander UK group and the separate financial statements of the Company comply with UK-adopted International Accounting Standards (IAS). The financial statements are also prepared in accordance with IFRS as issued by the International Accounting Standards Board (IASB), including interpretations issued by the IFRS Interpretations Committee, as there are no applicable differences from IFRS as issued by the IASB for the periods presented.
Disclosures required by IFRS 7 ‘Financial Instruments: Disclosure’ relating to the nature and extent of risks arising from financial instruments, and IAS 1 ‘Presentation of Financial Statements’ relating to objectives, policies and processes for managing capital, have been included in the Risk review section of this Annual Report. This information forms an integral part of these financial statements by this cross reference, is marked as audited, and is covered by the Independent auditor's report.
Climate change
Santander UK continues to develop its assessment of the potential impacts that climate change and the transition to a low carbon economy may have on the assets and liabilities recognised and presented in its financial statements.
Santander UK is mindful of its responsibilities as a responsible lender and is focused on ways to meet the objectives of the Paris Agreement on climate change and to support the UK’s transition to a climate-resilient, net zero economy.
Santander UK's current climate change strategy focuses on three main areas to achieve Banco Santander's ambition to reach net zero emissions by 2050:
1. Managing climate risks by integrating climate considerations into risk management frameworks, screening and stress testing our portfolio for climate related financial risks, and setting risk appetites to help steer our portfolio in line with the Paris Agreement,
2. Supporting our customers’ transition by developing products and services that promote a reduction in CO2 emissions, and
3. Reducing emissions in our operations and supply chain by focusing on continuous improvement in our operations, and environmental and energy management systems in accordance with ISO14001 and 15001, promoting responsible procurement practices and employee engagement.
Santander UK's current climate change strategy and its view of the risks associated with climate change and the transition to a low carbon economy are reflected in its critical judgements and accounting estimates, although climate change risk did not have a significant impact at 31 December 2022 and 2021, consistent with management's assessment that climate change and the transition to a low carbon economy are not currently expected to have a meaningful impact on the viability of the Santander UK group in the medium term.
At 31 December 2022 and 2021, management specifically considered the potential impact of climate change and the transition to a low carbon economy on:
–Loans and advances to customers (see Note 13 and the credit risk section of the Risk review). Some climate change risks arise due to the requirements of IFRS 9 and others relate to specific portfolios and sectors: 5 years,For Mortgages in Retail Banking and Commercial Real Estate lending in Corporate & Commercial Banking, the value of property collateral might be affected by physical impacts related to the frequency and scale of extreme weather events, such as flood and subsidence risk, or changing environmental performance standards for property.
–For automotive loans in Consumer Finance, the residual value of automotive vehicles might be impacted by diesel obsolescence and the transition to electric vehicles.
–For corporate lending in Corporate & Commercial Banking, certain sectors give rise to fossil fuel exposures, such as Oil & Gas, Mining & Extraction and Power Generation.
–Goodwill impairment assessment (see Note 20). Estimates underpinning the determination of whether or not goodwill balances are impaired are partly based on forecast business performance beyond the time horizon for management's detailed plans.
Future changes to Santander UK's climate change strategy may impact Santander UK's critical judgements and accounting estimates and result in material changes to financial results and the carrying values of certain assets and liabilities in future reporting periods.
Recent accounting developments
Disclosure of Accounting Policies – Amendments to IAS 1 and IFRS Practice Statement 2
In February 2021, the IASB amended IAS 1 Presentation of Financial Statements to require entities to disclose their material rather than their significant accounting policies. To support this amendment, the IASB also amended IFRS Practice Statement 2 Making Materiality Judgements to provide guidance on how to apply the concept of materiality. The amendments are effective for annual periods beginning on or after 1 January 2023 with earlier application permitted. The amendments have been applied in preparing these financial statements and, consequently, only material accounting policy information is disclosed.
Future accounting developments
At 31 December 2022, for the Santander UK group, there were no other significant new or revised standards and interpretations, and amendments thereto, which have been issued but which are not yet effective, or which have otherwise not been early adopted where permitted.
Comparative information
As required by US public company reporting requirements, these financial statements include two years of comparative information for the consolidated income statement, consolidated statement of comprehensive income, consolidated statement of changes in equity, consolidated statement of cash flows and related notes.
| | | | | | | | | | | | | | |
| Annual Report 2022 | Santander UK Group Holdings plc 199 |
| | | | | | | | | | | | | | | | | | | | | | | | | | | | | | | | | | | | | | | | | |
| Strategic Report | Sustainability and Responsible Banking | Governance | Risk review | Financial review | Financial
statements | Shareholder
information |
| | | | | | | | | | | | | |
| | | | | | | | | | | | | |
Material accounting policy information
The following material accounting policies have been applied in preparing these financial statements. For material accounting policies which involve the application of judgements or accounting estimates that are determined to be critical to the preparation of these financial statements see 'Critical judgements and accounting estimates'.
Consolidation
The consolidated financial statements incorporate the financial statements of the Company and entities (including structured entities) controlled by it and its subsidiaries.
The acquisition method of accounting is used to account for the acquisition of subsidiaries which meet the definition of a business.
Business combinations between entities under common control (i.e. fellow subsidiaries of Banco Santander SA, the ultimate parent) are outside the scope of IFRS 3 – ‘Business Combinations’, and there is no other guidance for such transactions under IFRS. The Santander UK group elects to account for business combinations between entities under common control at their book values in the acquired entity by including the acquired entity’s results from the date of the business combination and not restating comparatives. Reorganisations of entities within the Santander UK group are also accounted for at their book values.
Credit protection entities established as part of significant risk transfer (SRT) transactions are not consolidated by the Santander UK group in cases where third party investors have the exposure, or rights, to all of the variability of returns from the performance of the entities.
Revenue recognition
a) Interest income and expense
Interest and similar income comprise interest income on financial assets measured at amortised cost, investments in debt instruments measured at FVOCI and interest income on hedging derivatives. Interest expense and similar charges comprises interest expense on financial liabilities measured at amortised cost, and interest expense on hedging derivatives. Interest income on financial assets measured at amortised cost, investments in debt instruments measured at FVOCI and interest expense on financial liabilities other than those at fair value through profit or loss (FVTPL) is determined using the effective interest rate method.
Interest income is calculated by applying the effective interest rate to the gross carrying amount of financial assets, except for financial assets that have subsequently become credit-impaired (i.e. Stage 3), for which interest revenue is calculated by applying the effective interest rate to their amortised cost (i.e. net of the ECL provision). For more information on stage allocations of credit risk exposures, see ‘Significant increase in credit risk’ in the ‘Santander UK group level – credit risk management’ section of the Risk review.
b) Fee and commission income and expense
Fees and commissions that are not an integral part of the effective interest rate are recognised when the service is performed. Most fee and commission income is recognised at a point in time. Certain commitment, upfront and management fees are recognised over time but are not material. For retail and corporate products, fee and commission income consists principally of collection services fees, commission on foreign currencies, commission and other fees received from retailers for processing credit card transactions, fees received from other credit card issuers for providing cash advances for their customers through the Santander UK group’s branch and ATM networks, annual fees payable by credit card holders and fees for non-banking financial products.
For insurance products, fee and commission income consists principally of commissions and profit share arising from the sale of building and contents insurance and life protection insurance. Commissions arising from the sale of buildings and contents insurance are recognised over the period of insurance cover, adjusted to take account of cancelled policies. Profit share income from the sale of buildings and contents insurance which is not subject to any adjustment is recognised when the profit share income is earned. Commissions and profit share arising from the sale of life protection insurance is subject to adjustment for cancellations of policies within 3 years from inception.
Fee and commission income which forms an integral part of the effective interest rate of a financial instrument (for example certain loan commitment fees) is recognised as an adjustment to the effective interest rate and recorded in ‘Interest income’.
c) Other operating income
Other operating income includes all gains and losses from changes in the fair value of financial assets and liabilities held at fair value through profit or loss (comprising financial assets and liabilities held for trading, trading derivatives and other financial assets and liabilities at fair value through profit or loss), together with related interest income, expense, dividends, and changes in fair value of any derivatives managed in conjunction with these assets and liabilities. Changes in fair value of derivatives in a fair value hedging relationship are also recognised in other operating income. Other operating income also includes income from operating lease assets, and profits and losses arising on the sales of property, plant and equipment and subsidiary undertakings.
Defined benefit pension schemes (see 'Critical judgements and accounting estimates')
A defined benefit scheme is a pension scheme that guarantees an amount of pension benefit to be provided, usually as a function of one or more factors such as age, years of service or compensation. Pension costs are charged to ‘Administration expenses’, within the line item ‘Operating expenses before impairment losses, provisions and charges’ with the net interest on the defined benefit asset or liability included within ‘Net interest income’ in the income statement. The asset or liability recognised in respect of defined benefit pension schemes is the present value of the defined benefit obligation at the balance sheet date, less the fair value of scheme assets. The defined benefit obligation is calculated annually by independent actuaries using the projected unit credit method. The assets of the schemes are measured at their fair values at the balance sheet date.
The present value of the defined benefit obligation is estimated by projecting forward the growth in current accrued pension benefits to reflect inflation and salary growth to the date of pension payment, then discounted to present value using the yield applicable to high-quality AA rated corporate bonds of the same currency and which have terms to maturity closest to the terms of the scheme liabilities, adjusted where necessary to match those terms. In determining the value of scheme liabilities, demographic and financial assumptions are made by management about life expectancy, inflation, discount rates, pension increases and earnings growth, based on past experience and future expectations. Financial assumptions are based on market conditions at the balance sheet date and can generally be derived objectively.
Demographic assumptions require a greater degree of estimation and judgement to be applied to externally derived data. Any surplus or deficit of scheme assets over liabilities is recognised in the balance sheet as an asset (surplus) or liability (deficit). An asset is only recognised to the extent that the surplus can be recovered through reduced contributions in the future or through refunds from the scheme.
Share-based payments
The Santander UK group engages in cash-settled and equity-settled share-based payment transactions in respect of services received from certain of its employees. Shares of the Santander UK group’s parent, Banco Santander SA are purchased in the open market by the Santander UK group (for the Employee Sharesave scheme) or are purchased by Banco Santander SA or another Banco Santander subsidiary (including awards granted under the Long-Term Incentive Plan and the Deferred Shares Bonus Plan) to satisfy share options or awards as they vest.
| | | | | | | | | | | | | | |
| Annual Report 2022 | Santander UK Group Holdings plc 200 |
| | | | | | | | | | | | | | | | | | | | | | | | | | | | | | | | | | | | | | | | | |
| Strategic Report | Sustainability and Responsible Banking | Governance | Risk review | Financial review | Financial
statements | Shareholder
information |
| | | | | | | | | | | | | |
| | | | | | | | | | | | | |
Options granted under the Employee Sharesave scheme and awards granted under the Transformation Incentive Plan are accounted for as cash-settled share-based payment transactions. Awards granted under the Long-Term Incentive Plan and Deferred Shares Bonus Plan are accounted for as equity-settled share-based payment transactions.
The fair value of the options granted under the Employee Sharesave scheme is determined using an option pricing model, which takes into account the exercise price of the option, the current share price, the risk-free interest rate, the expected volatility of the Banco Santander SA share price over the life of the option and the dividend growth rate. The fair value of the awards granted for the Long-Term Incentive Plan was determined at the grant date using an option pricing model, which takes into account the share price at grant date, the risk-free interest rate, the expected volatility of the Banco Santander SA share price over the life of the award and the dividend growth rate.
Goodwill and other intangible assets (for goodwill see 'Critical judgements and accounting estimates')
Goodwill represents the excess of the cost of an acquisition, as well as the fair value of any interest previously held, over the fair value of the share of the identifiable net assets of the acquired subsidiary, or business at the date of acquisition. Goodwill on the acquisition of subsidiaries and businesses is included in intangible assets. Goodwill is tested for impairment annually, or more frequently when events or changes in circumstances dictate and carried at cost less accumulated impairment losses. Gains and losses on the disposal of an entity or business include the carrying amount of goodwill relating to the entity or business sold.
Other intangible assets are recognised if they arise from contractual or other legal rights or if they are capable of being separated or divided from Santander UK and sold, transferred, licensed, rented or exchanged. The value of such intangible assets, where they are available for use, is amortised on a straight-line basis over their useful economic life of three to seven years and the assets are reviewed annually for impairment indicators and tested for impairment where indicators are present. Other intangible assets that are not yet available for use are tested for impairment annually or more frequently when events or changes in circumstances dictate.
Software development costs are capitalised when they are direct costs associated with identifiable and unique software products that are expected to provide future economic benefits and the cost of those products can be measured reliably. These costs include payroll, materials, services and directly attributable overheads. Internally developed software meeting these criteria and externally purchased software are classified in intangible assets on the balance sheet and amortised on a straight-line basis over their useful life of three to seven years, unless the software is an integral part of the related computer hardware, in which case it is treated as property, plant and equipment as described below. Capitalisation of costs ceases when the software is capable of operating as intended. Costs of maintaining software are expensed as incurred.
Property, plant and equipment
Property, plant and equipment include owner-occupied properties (including leasehold properties), office fixtures and equipment and computer software. Property, plant and equipment also includes operating leases where the Santander UK group is the lessor and right-of-use assets where the Santander UK group is the lessee. Internally developed software meeting the criteria set out in ‘Goodwill and other intangible assets’ above and externally purchased software are classified in property, plant and equipment where the software is an integral part of the related computer hardware (for example operating system of a computer). Classes of property, plant and equipment are depreciated on a straight-line basis over their useful life, as follows:
| | | | | |
| Owner-occupied properties | Not exceeding 50 years |
| Office fixtures and equipment | 3 to 15 years |
| Computer software | 3 to 7 years |
| Right-of-use assets | Shorter of the lease term or the useful life of the underlying asset |
| Operating lease assets - vehicles | 2 to 4 years |
Depreciation is not charged on freehold land and assets under construction. Depreciation of operating lease assets where the Santander UK group is the lessor is described in 'Leases' below.
Financial instruments (for impairment of debt instrument financial assets see' Critical judgements and accounting estimates: Credit impairment losses')
a) Initial recognition and measurement
Financial assets and liabilities are initially recognised when the Santander UK group becomes a party to the contractual terms of the instrument. The Santander UK group determines the classification of its financial assets and liabilities at initial recognition and measures a financial asset or financial liability at its fair value plus or minus, in the case of a financial asset or financial liability not at FVTPL, transaction costs that are incremental and directly attributable to the acquisition or issue of the financial asset or financial liability. Transaction costs of financial assets and financial liabilities carried at FVTPL are expensed in profit or loss. Immediately after initial recognition, an expected credit loss (ECL) allowance is recognised for financial assets measured at amortised cost and investments in debt instruments measured at FVOCI.
A regular way purchase is a purchase of a financial asset under a contract whose terms require delivery of the asset within the timeframe established generally by regulation or convention in the marketplace concerned. Regular way purchases of financial assets classified as loans and advances, and issues of equity or financial liabilities measured at amortised cost are recognised on settlement date, being the date when the Santander UK group becomes a party to the contractual terms of the instrument; all other regular way purchases and issues are recognised on trade date.
b) Financial assets and liabilities
i) Classification and subsequent measurement
The Santander UK group classifies its financial assets in the measurement categories of amortised cost, FVOCI and FVTPL.
Financial assets and financial liabilities are classified as FVTPL where there is a requirement to do so or where they are otherwise designated at FVTPL on initial recognition. Financial assets and financial liabilities which are required to be held at FVTPL include:
–Financial assets and financial liabilities held for trading.
–Debt instruments that do not have solely payments of principal and interest (SPPI) characteristics. Otherwise, such instruments are measured at amortised cost or FVOCI, and
–Equity instruments that have not been designated as held at FVOCI.
Financial assets and financial liabilities are classified as held for trading if they are derivatives or if they are acquired or incurred principally for the purpose of selling or repurchasing in the near-term, or form part of a portfolio of financial instruments that are managed together and for which there is evidence of short-term profit taking.
| | | | | | | | | | | | | | |
| Annual Report 2022 | Santander UK Group Holdings plc 201 |
| | | | | | | | | | | | | | | | | | | | | | | | | | | | | | | | | | | | | | | | | |
| Strategic Report | Sustainability and Responsible Banking | Governance | Risk review | Financial review | Financial
statements | Shareholder
information |
| | | | | | | | | | | | | |
| | | | | | | | | | | | | |
In certain circumstances, other financial assets and financial liabilities are designated at FVTPL where this results in more relevant information. This may arise because it significantly reduces a measurement inconsistency that would otherwise arise from measuring assets or liabilities or recognising the gains or losses on them on a different basis, where the assets and liabilities are managed and their performance evaluated on a fair value basis or, in the case of financial liabilities, where it contains one or more embedded derivatives which are not closely related to the host contract.
The classification and measurement requirements for financial asset debt and equity instruments and financial liabilities are set out below.
Financial assets: debt instruments
Debt instruments are those instruments that meet the definition of a financial liability from the issuer’s perspective, such as loans and government and corporate bonds. Classification and subsequent measurement of debt instruments depend on the Santander UK group’s business model for managing the asset, and the cash flow characteristics of the asset.
Business model
The business model reflects how the Santander UK group manages the assets in order to generate cash flows and, specifically, whether the Santander UK group’s objective is solely to collect the contractual cash flows from the assets or is to collect both the contractual cash flows and cash flows arising from the sale of the assets. If neither of these is applicable, such as where the financial assets are held for trading purposes, then the financial assets are classified as part of an ‘other’ business model and measured at FVTPL. Factors considered in determining the business model for a group of assets include past experience on how the cash flows for these assets were collected, how the assets’ performance is evaluated and reported to key management personnel, and how risks are assessed and managed.
SPPI
Where the business model is to hold assets to collect contractual cash flows or to collect contractual cash flows and sell, the Santander UK group assesses whether the assets’ cash flows represent SPPI. In making this assessment, the Santander UK group considers whether the contractual cash flows are consistent with a basic lending arrangement (i.e. interest includes only consideration for the time value of money, credit risk, other basic lending risks and a profit margin that is consistent with a basic lending arrangement). Where the contractual terms introduce exposure to risk or volatility that is inconsistent with a basic lending arrangement, the related asset is classified and measured at FVTPL.
Financial assets with embedded derivatives are considered in their entirety when determining whether their cash flows are SPPI.
Based on these factors, the Santander UK group classifies its debt instruments into one of the following measurement categories:
–Amortised cost – Financial assets that are held for collection of contractual cash flows where those cash flows represent SPPI, and that are not designated at FVTPL, are measured at amortised cost. The carrying amount of these assets is adjusted by any ECL recognised and measured as presented in Note 12. Interest income from these financial assets is included in ‘Interest and similar income’ using the effective interest rate method. When estimates of future cash flows are revised, the carrying amount of the respective financial assets or financial liabilities is adjusted to reflect the new estimate discounted using the original effective interest rate. Any changes are recognised in the income statement.
–FVOCI – Financial assets that are held for collection of contractual cash flows and for selling the assets, where the assets’ cash flows represent SPPI, and that are not designated at FVTPL, are measured at FVOCI. Movements in the carrying amount are recognised in OCI, except for the recognition of impairment gains or losses, interest revenue and foreign exchange gains and losses on the instrument’s amortised cost which are recognised in profit or loss. When the financial asset is derecognised, the cumulative gain or loss previously recognised in OCI is reclassified from equity to profit or loss and recognised in ‘Other operating income’. Interest income from these financial assets is included in ‘Interest and similar income’ using the effective interest rate method.
–FVTPL – Financial assets that do not meet the criteria for amortised cost or FVOCI are measured at FVTPL. A gain or loss on a debt instrument that is subsequently measured at FVTPL, including any debt instruments designated at fair value, is recognised in profit or loss and presented in the income statement in ‘Other operating income’ in the period in which it arises.
The Santander UK group reclassifies financial assets when and only when its business model for managing those assets changes. The reclassification takes place from the start of the first reporting period following the change. Such changes are expected to be very infrequent.
Financial assets: equity instruments
Equity instruments are instruments that meet the definition of equity from the issuer’s perspective, being instruments that do not contain a contractual obligation to pay cash and that evidence a residual interest in the issuer’s net assets. All equity investments are subsequently measured at FVTPL, except where management has elected, at initial recognition, to irrevocably designate an equity investment at FVOCI. When this election is used, fair value gains and losses are recognised in OCI and are not subsequently reclassified to profit or loss, including on disposal. ECLs (and reversal of ECLs) are not reported separately from other changes in fair value. Dividends, when representing a return on such investments, continue to be recognised in profit or loss as other income when the right to receive payments is established. Gains and losses on equity investments at FVTPL are included in ‘Other operating income’ in the income statement.
Financial liabilities
Financial liabilities are classified as subsequently measured at amortised cost, except for:
–Financial liabilities at FVTPL: this classification is applied to derivatives and other financial liabilities designated as such at initial recognition. Gains or losses on financial liabilities designated at FVTPL are presented partially in other comprehensive income (the amount of change in the fair value of the financial liability that is attributable to changes in the credit risk of that liability) and partially in profit or loss (the remaining amount of change in the fair value of the liability)
–Financial liabilities arising from the transfer of financial assets which did not qualify for derecognition, whereby a financial liability is recognised for the consideration received for the transfer. In subsequent periods, the Santander UK group recognises any expense incurred on the financial liability, and
–Financial guarantee contracts and loan commitments.
Contracts involving the receipt of cash on which customers receive an index-linked return are accounted for as equity index-linked deposits. The principal products are Capital Guaranteed/Protected Products which give the customers a limited participation in the upside growth of an equity index. In the event the index falls in price, a cash principal element is guaranteed/protected. The equity index-linked deposits contain embedded derivatives. These embedded derivatives, in combination with the principal cash deposit element, are designed to replicate the investment performance profile tailored to the return agreed in the contracts with customers. The cash principal element is accounted for as deposits by customers at amortised cost. The embedded derivatives are separated from the host instrument and are separately accounted for as derivatives.
Sale and repurchase agreements (including stock borrowing and lending)
Securities sold subject to a commitment to repurchase them at a predetermined price (repos) under which substantially all the risks and rewards of ownership are retained by the Santander UK group remain on the balance sheet and a liability is recorded in respect of the consideration received. Securities purchased under commitments to resell (reverse repos) are not recognised on the balance sheet and the consideration paid is recorded as an asset. The difference between the sale and repurchase price is treated as trading income in the income statement, except where the repo is not treated as part of the trading book, in which case the difference is recorded in interest income or expense.
| | | | | | | | | | | | | | |
| Annual Report 2022 | Santander UK Group Holdings plc 202 |
| | | | | | | | | | | | | | | | | | | | | | | | | | | | | | | | | | | | | | | | | |
| Strategic Report | Sustainability and Responsible Banking | Governance | Risk review | Financial review | Financial
statements | Shareholder
information |
| | | | | | | | | | | | | |
| | | | | | | | | | | | | |
Securities lending and borrowing transactions are generally secured, with collateral in the form of securities or cash advanced or received. Securities lent or borrowed are not reflected on the balance sheet. Collateral in the form of cash received or advanced is recorded as a deposit or a loan. Collateral in the form of securities is not recognised.
Day One profit adjustments
The fair value of a financial instrument on initial recognition is generally its transaction price (that is, the fair value of the consideration given or received). However, sometimes the fair value will be based on other observable current market transactions in the same instrument, without modification or repackaging, or on a valuation technique whose variables include only data from observable markets, such as interest rate yield curves, option volatilities and currency rates. When such evidence exists, the Santander UK group recognises a trading gain or loss at inception (Day One gain or loss), being the difference between the transaction price and the fair value. When significant unobservable parameters are used, the entire Day One gain or loss is deferred and is recognised in the income statement over the life of the transaction until the transaction matures, is closed out, the valuation inputs become observable, or an offsetting transaction is entered into.
ii) Impairment of debt instrument financial assets
The Santander UK group assesses on a forward-looking basis the ECL associated with its debt instrument assets carried at amortised cost and FVOCI and with the exposure arising from financial guarantee contracts and loan commitments. The Santander UK group recognises a loss allowance for such losses at each reporting date. The measurement of ECL reflects:
–An unbiased and probability-weighted amount that is determined by evaluating a range of possible outcomes.
–The time value of money, and
–Reasonable and supportable information that is available without undue cost or effort at the reporting date about past events, current conditions and forecasts of future economic conditions.
Grouping of instruments for losses measured on a collective basis
We typically group instruments and assess them for impairment collectively where they share risk characteristics (as described in the Credit risk section of the Risk review) using one or more statistical models. Where we have used internal capital or similar models as the basis for our ECL models, this typically results in a large number of relatively small homogenous groups which are determined by the permutations of the underlying characteristics in the statistical models. We calculate separate collective provisions for instruments in Stages 1, 2 and 3 where the instrument is not individually assessed, as described below.
Individually assessed impairments (IAIs)
We assess significant Stage 3 cases individually. We do this for Corporate & Commercial Banking cases, but not for Business Banking cases in Retail Banking which we assess collectively. To calculate the estimated loss, we estimate the future cash flows under several scenarios each of which uses case-specific factors and circumstances. We then probability-weight the net present value of the cash flows under each scenario to arrive at a weighted average provision requirement. We update our assessment process every quarter and more frequently if there are changes in circumstances that might affect the scenarios, cash flows or probabilities we apply.
For more on how ECL is calculated, see the Credit risk section of the Risk review.
–Write-off
For secured loans, a write-off is only made when all collection procedures have been exhausted and the security has been sold and/or a claim made on any mortgage indemnity guarantee or other insurance. In the corporate loan portfolio, there may be occasions where a write-off occurs for other reasons, such as following a consensual restructure or refinancing of the debt or where the debt is sold for strategic reasons into the secondary market at a value lower than its face value.
There is no threshold based on past due status beyond which all secured loans are written off as there can be significant variations in the time needed to enforce possession and sale of the security, especially due to the different legal frameworks that apply in different regions of the UK. For unsecured loans, a write-off is only made when all internal avenues of collecting the debt have been exhausted. Where appropriate the debt is passed over to external collection agencies. A past due threshold is applied to unsecured debt where accounts that are 180 days past due are written off unless there is a dispute awaiting resolution. Contact is made with customers with the aim to achieve a realistic and sustainable repayment arrangement. Litigation and/or enforcement of security is usually carried out only when the steps described above have been undertaken without success.
All write-offs are assessed / made on a case-by-case basis, taking account of the exposure at the date of write-off, after accounting for the value from any collateral or insurance held against the loan. The exception to this is in cases where fraud has occurred, where the exposure is written off once investigations have been completed and the probability of recovery is minimal. The time span between discovery and write-off will be short and may not result in an impairment loss allowance being raised. The write-off policy is regularly reviewed. Write-offs are charged against previously established loss allowances.
–Recoveries
Recoveries of credit impairment charges are not included in the impairment loss allowance but are taken to income and offset against credit impairment charges. Recoveries of credit impairment charges are classified in the income statement as ‘Credit impairment charges’.
iii) Modifications of financial assets
The treatment of a renegotiation or modification of the contractual cash flows of a financial asset normally depends upon whether the renegotiation or modification is due to financial difficulties of the borrower or for other commercial reasons.
–Contractual modifications due to financial difficulties of the borrower: where the Santander UK group modifies the contractual conditions to enable the borrower to fulfil their payment obligations, the asset is not derecognised. The gross carrying amount of the financial asset is recalculated as the present value of the renegotiated/modified contractual cash flows that are discounted at the financial asset’s original EIR and any gain or loss arising from the modification is recognised in the income statement.
–Contractual modifications for other commercial reasons: an assessment is performed to determine whether the terms of the new agreement are substantially different from the terms of the existing agreement, after considering changes in the cash flows arising from the modified terms and the overall instrument risk profile. Where terms are substantially different, such modifications are treated as a new transaction resulting in derecognition of the original financial asset, and the recognition of a ‘new’ financial asset with any difference between the carrying amount of the derecognised asset and the fair value of the new asset is recognised in the income statement as a gain or loss on derecognition. Where terms are not substantially different, the carrying value of the financial asset is adjusted to reflect the present value of modified cash flows discounted at the original EIR with any gain or loss arising from modification recognised immediately in the income statement.
Any other contractual modifications, such as where a regulatory authority imposes a change in certain contractual terms or due to legal reasons, are assessed on a case-by-case basis to establish whether or not the financial asset should be derecognised. For IBOR reform see Note 41.
| | | | | | | | | | | | | | |
| Annual Report 2022 | Santander UK Group Holdings plc 203 |
| | | | | | | | | | | | | | | | | | | | | | | | | | | | | | | | | | | | | | | | | |
| Strategic Report | Sustainability and Responsible Banking | Governance | Risk review | Financial review | Financial
statements | Shareholder
information |
| | | | | | | | | | | | | |
| | | | | | | | | | | | | |
iv) Derecognition other than on a modification
Financial assets are derecognised when the rights to receive cash flows have expired or the Santander UK group has transferred its contractual right to receive the cash flows from the assets and either: (1) substantially all the risks and rewards of ownership have been transferred; or (2) the Santander UK group has neither retained nor transferred substantially all of the risks and rewards but has transferred control.
Financial liabilities are derecognised when extinguished, cancelled or expired.
c) Financial guarantee contracts and loan commitments
Financial guarantee contracts are contracts that require the issuer to make specified payments to reimburse the holder for a loss it incurs because a specified debtor fails to make payments when due, in accordance with the terms of a debt instrument. Such financial guarantees are given to banks, financial institutions and others on behalf of customers to secure loans, overdrafts and other banking facilities.
Financial guarantee contracts are initially measured at fair value and subsequently measured at the higher of the amount of the loss allowance, and the premium received on initial recognition less income recognised in accordance with the principles of IFRS 15. Loan commitments are measured as the amount of the loss allowance (determined in accordance with IFRS 9 as described in Credit risk section of the Risk review). The Santander UK group has not provided any commitment to provide loans at a below-market interest rate, or that can be settled net in cash or by delivering or issuing another financial instrument.
For financial guarantee contracts and loan commitments, the loss allowance is recognised as a provision and charged to credit impairment charges in the income statement. The loss allowance in respect of revolving facilities is classified in loans and advances to customers to the extent of any drawn balances. The loss allowance in respect of undrawn amounts is classified in provisions. When amounts are drawn, any related loss allowance is transferred from provisions to loans and advances to customers.
Derivative financial instruments (derivatives)
Derivatives are contracts or agreements whose value is derived from one or more underlying indices or asset values inherent in the contract or agreement, which require no or little initial net investment and are settled at a future date. Transactions are undertaken in interest rate, cross currency, equity, residential property and other index-related swaps, forwards, caps, floors, swaptions, as well as credit default and total return swaps, equity index contracts and exchange traded interest rate futures, and equity index options.
Derivatives are held for risk management purposes. Derivatives are classified as held for trading unless they are designated as being in a hedge accounting relationship. The Santander UK group chooses to designate certain derivatives as in a hedging relationship if they meet specific criteria, as further described in ‘Hedge accounting’ below.
Derivatives are recognised initially (on the date on which a derivative contract is entered into), and are subsequently remeasured, at their fair value. Fair values of exchange-traded derivatives are obtained from quoted market prices. Fair values of over-the-counter derivatives are estimated using valuation techniques, including discounted cash flow and option pricing models.
Certain derivatives may be embedded in hybrid contracts. If the hybrid contract contains a host that is a financial asset, then the Santander UK group assesses the entire contract as described in the financial asset section above for classification and measurement purposes. Otherwise, embedded derivatives are treated as separate derivatives when their economic characteristics and risks are not closely related to those of the host contract; the terms of the embedded derivative would meet the definition of a stand-alone derivative if they were contained in a separate contract; and the combined contract is not held for trading or designated at fair value. These embedded derivatives are measured at fair value with changes in fair value recognised in the income statement. Contracts containing embedded derivatives are not subsequently reassessed for separation unless either there has been a change in the terms of the contract which significantly modifies the cash flows (in which case the contract is reassessed at the time of modification) or the contract has been reclassified (in which case the contract is reassessed at the time of reclassification).
All derivatives are carried as assets when their fair value is positive and as liabilities when their fair value is negative, except where netting is permitted. The method of recognising fair value gains and losses depends on whether derivatives are held for trading or are designated as hedging instruments and, if the latter, the nature of the risks being hedged. Gains and losses from changes in the fair value of derivatives held for trading are recognised in the income statement and included in Other operating income.
Offsetting financial assets and liabilities
Financial assets and liabilities including derivatives are offset and the net amount reported in the balance sheet when there is a legally enforceable right to set off the recognised amounts and there is an intention to settle on a net basis or realise the asset and settle the liability simultaneously. The Santander UK group is party to a number of arrangements, including master netting arrangements under industry standard agreements which facilitate netting of transactions in jurisdictions where netting agreements are recognised and have legal force. The netting arrangements do not generally result in an offset of balance sheet assets and liabilities for accounting purposes, as transactions are usually settled on a gross basis.
Hedge accounting
The Santander UK group applies hedge accounting to represent, to the maximum possible extent permitted under accounting standards, the economic effects of its risk management strategies. Derivatives are used to hedge exposures to interest rates, exchange rates and equity price.
At the time a financial instrument is designated as a hedge (i.e. at the inception of the hedge), the Santander UK group formally documents the relationship between the hedging instrument(s) and hedged item(s), its risk management objective and strategy for undertaking the hedge. The documentation includes the identification of each hedging instrument and respective hedged item, the nature of the risk being hedged (including the benchmark interest rate being hedged in a hedge of interest rate risk) and how the hedging instrument’s effectiveness in offsetting the exposure to changes in the hedged item’s fair value attributable to the hedged risk is to be assessed. Accordingly, the Santander UK group formally assesses, both at the inception of the hedge and on an ongoing basis, whether the hedging derivatives have been and will be highly effective in offsetting changes in the fair value attributable to the hedged risk during the period that the hedge is designated. A hedge is normally regarded as highly effective if, at inception and throughout its life, the Santander UK group can expect, and actual results indicate, that changes in the fair value or cash flow of the hedged items are effectively offset by changes in the fair value or cash flow of the hedging instrument. If at any point it is concluded that it is no longer highly effective in achieving its documented objective, hedge accounting is discontinued.
Where derivatives are held for risk management purposes, and when transactions meet the required criteria for documentation and hedge effectiveness, the derivatives may be designated as either: (i) hedges of the change in fair value of recognised assets or liabilities or firm commitments (fair value hedges); (ii) hedges of the variability in highly probable future cash flows attributable to a recognised asset or liability, or a forecast transaction (cash flow hedges); or (iii) a hedge of a net investment in a foreign operation (net investment hedges). The Santander UK group applies fair value and cash flow hedge accounting, but not hedging of a net investment in a foreign operation.
| | | | | | | | | | | | | | |
| Annual Report 2022 | Santander UK Group Holdings plc 204 |
| | | | | | | | | | | | | | | | | | | | | | | | | | | | | | | | | | | | | | | | | |
| Strategic Report | Sustainability and Responsible Banking | Governance | Risk review | Financial review | Financial
statements | Shareholder
information |
| | | | | | | | | | | | | |
| | | | | | | | | | | | | |
a) Fair value hedge accounting
Changes in the fair value of derivatives that are designated and qualify as fair value hedges are recorded in the income statement, together with the changes in the fair value of the hedged asset or liability that are attributable to the hedged risk. Where the hedged item is measured at amortised cost, the fair value changes due to the hedged risk adjust the carrying amount of the hedged asset or liability. Changes in the fair value of portfolio hedged items are presented separately in the consolidated balance sheet in macro hedge of interest rate risk and recognised in the income statement within other operating income. If the hedge no longer meets the criteria for hedge accounting, changes in the fair value of the hedged item attributable to the hedged risk are no longer recognised in the income statement. For fair value hedges of interest rate risk, the cumulative adjustment that has been made to the carrying amount of the hedged item is amortised to the income statement using the effective interest method over the period to maturity. For portfolio hedged items, the cumulative adjustment is amortised to the income statement using the straight-line method over the period to maturity.
b) Cash flow hedge accounting
The effective portion of changes in the fair value of qualifying cash flow hedges is recognised in other comprehensive income in the cash flow hedging reserve. The gain or loss relating to the ineffective portion is recognised immediately in the income statement. Amounts accumulated in equity are reclassified to the income statement in the periods in which the hedged item affects profit or loss. When a hedging instrument expires or is sold, or when a hedge no longer meets the criteria for hedge accounting, any cumulative gain or loss existing in equity at that time remains in equity and is recognised in the income statement when the forecast transaction is ultimately recognised in the income statement. When a forecast transaction is no longer expected to occur, the cumulative gain or loss that was reported in equity is immediately transferred to the income statement. The Santander UK group is exposed to cash flow interest rate risk on its floating rate assets, foreign currency risk on its fixed rate debt issuances denominated in foreign currency and equity price risk arises from the Santander UK group operating the Employee Sharesave scheme. Cash flow hedging is used to hedge the variability in cash flows arising from these risks.
Securitisation transactions
The Santander UK group has entered into arrangements where undertakings have issued mortgage-backed and other asset-backed securities or have entered into funding arrangements with lenders in order to finance specific loans and advances to customers. The Santander UK group has also entered into synthetic securitisation arrangements, as part of significant risk transfer (SRT) transactions to reduce its risk-weighted assets, where undertakings have issued credit-linked notes and deposited the funds raised as collateral for credit protection in respect of specific loans and advances to customers. As the Santander UK group has retained substantially all the risks and rewards of the underlying assets, such financial instruments continue to be recognised on the balance sheet, and a liability recognised for the proceeds of the funding transaction, or in the case of SRT transactions, collateral deposited.
Impairment of non-financial assets (for goodwill see 'Critical judgements and accounting estimates')
At each balance sheet date, or more frequently when events or changes in circumstances dictate, property plant and equipment (including operating lease assets) and intangible assets (including goodwill) are assessed for indicators of impairment. If indications are present, these assets are subject to an impairment review. The impairment review comprises a comparison of the carrying value of the asset or cash generating unit with its recoverable amount: the higher of the asset’s or cash-generating unit’s fair value less costs to sell and its value in use. The cash-generating unit represents the lowest level at which non-financial assets, including goodwill, are monitored for internal management purposes and is not larger than an operating segment.
The fair value is the price that would be received to sell an asset or paid to transfer a liability in an orderly transaction between market participants at the measurement date. Value in use is calculated by discounting management’s expected future cash flows obtainable as a result of the asset’s continued use (after making allowance for increases in regulatory capital requirements), including those resulting from its ultimate disposal, at a market-based discount rate on a pre-tax basis. The recoverable amounts of goodwill have been based on value in use calculations.
For conducting goodwill impairment reviews, cash generating units are the lowest level at which management monitors the return on investment on assets.
Leases (as lessor)
Operating lease assets are recorded at cost and the difference between cost and residual value (RV) is depreciated over the life of the asset. Operating lease rental income and depreciation is recognised on a straight-line basis over the life of the asset. After initial recognition, residual values are reviewed regularly, and any changes are recognised prospectively through remaining depreciation charges.
Amounts due from lessees under finance leases and hire purchase contracts are recorded as receivables at the amount of the Santander UK group’s net investment in the leases. Finance lease income is allocated to accounting periods to reflect a constant periodic rate of return on the Santander UK group’s net investment outstanding in respect of the leases and hire purchase contracts. A provision is recognised to reflect a reduction in any anticipated unguaranteed RV. A provision is also recognised for voluntary termination of the contract by the customer, where appropriate.
Income taxes, including deferred taxes
The tax expense represents the sum of the income tax currently payable and deferred income tax.
A current tax liability for the current or prior period is measured at the amount expected to be paid to the tax authorities. Where the amount of the final tax liability is uncertain or where a position is challenged by a taxation authority, the liability recognised is the most likely outcome. Where a most likely outcome cannot be determined, a weighted average basis is applied.
Deferred tax is calculated at the tax rates that are expected to apply in the period when the liability is settled, or the asset is realised based on rates enacted or substantively enacted at the balance sheet date. Deferred tax is charged or credited in the income statement, except when it relates to items recognised in other comprehensive income or directly in equity, in which case the deferred tax is also recognised in other comprehensive income or directly in equity.
Deferred and current tax assets and liabilities are only offset when they arise in the same tax reporting group and where there is both the legal right and the intention to settle on a net basis or to realise the asset and settle the liability simultaneously.
Cash and cash equivalents
Following a decision by the IFRS Interpretations Committee in April 2022, Santander UK updated its accounting policy to exclude from cash and cash equivalents Reserves Collateralisation Accounts (RCAs) balances held at the Bank of England relating to Santander UK’s participation in certain payments schemes. Instead, RCAs balances are classified as restricted balances and included within 'change in operating assets' in the cash flow statement. Prior periods have been restated see Note 34.
For the purposes of the cash flow statement, cash and cash equivalents comprise balances with less than three months maturity from the date of acquisition, including cash and non-restricted balances with central banks, treasury bills and other eligible bills, loans and advances to banks, reverse repurchase agreements and short-term investments in securities. Balances with central banks represent amounts held at the Bank of England as part of the Santander UK group’s liquidity management activities. It includes certain minimum cash ratio deposits held for regulatory purposes and reserves collateralised accounts in respect of Santander UK’s participation in certain payments schemes which are required to be maintained with the Bank of England and are restricted balances.
| | | | | | | | | | | | | | |
| Annual Report 2022 | Santander UK Group Holdings plc 205 |
| | | | | | | | | | | | | | | | | | | | | | | | | | | | | | | | | | | | | | | | | |
| Strategic Report | Sustainability and Responsible Banking | Governance | Risk review | Financial review | Financial
statements | Shareholder
information |
| | | | | | | | | | | | | |
| | | | | | | | | | | | | |
Provisions and contingent liabilities (see 'Critical judgements and accounting estimates')
Provisions are recognised for present obligations arising as consequences of past events where it is more likely than not that a transfer of economic benefits will be necessary to settle the obligation, and it can be reliably estimated.
Customer remediation provisions are made for the estimated cost of making redress payments with respect to the past sales of products, using conclusions such as the number of claims the number of those that will be upheld, the estimated average settlement per case and other related costs. Provision is made for the anticipated cost of restructuring, including redundancy costs, when an obligation exists. An obligation exists when the Santander UK group has a detailed formal plan for restructuring a business, has raised valid expectations in those affected by the restructuring, and has started to implement the plan or announce its main features.
When a leasehold property ceases to be used in the business, provision is made where the unavoidable costs of the future obligations relating to the lease are expected to exceed anticipated rental income. The net costs are discounted using market rates of interest to reflect the long-term nature of the cash flows.
Loan commitments are measured as the amount of the loss allowance, determined in line with IFRS 9 as set out in the Credit risk section of the Risk review.
Contingent liabilities are possible obligations whose existence will be confirmed only by certain future events or present obligations where the transfer of economic benefit is uncertain or cannot be reliably measured. Contingent liabilities are not recognised but are disclosed unless they are remote.
Critical judgements and accounting estimates
The preparation of Santander UK's consolidated financial statements in accordance with IFRS requires management to make judgements, estimates and assumptions in applying the accounting policies that affect the reported amounts of assets, liabilities, income and expenses. Due to the inherent uncertainty in making estimates, actual results reported in future periods may be based on amounts which differ from those estimates. Estimates, judgements and assumptions are continually evaluated and are based on historical experience and other factors, including expectations of future events that are believed to be reasonable under the circumstances. There has been no change in the inherent sensitivity of the areas of judgement in the period. Management have considered the impact of developments in principal risks and uncertainties, as set out in the Risk review, on critical judgements and accounting estimates.
The significant judgements, apart from those involving estimation, made by management in applying Santander UK's accounting policies in these financial statements (key judgements) and the key sources of estimation uncertainty that may have a significant risk of causing a material adjustment to the carrying amount of assets and liabilities within the next financial year (key estimates), which together are considered critical to Santander UK's results and financial position, are as follows:
a) Credit impairment charges
The application of the ECL impairment methodology for calculating credit impairment allowances is highly susceptible to change from period to period. The methodology requires management to make judgmental assumptions in determining the estimates. Any significant difference between the estimated amounts and actual amounts could have a material impact on the future financial results and financial condition. The impact of the cost of living crisis has increased the uncertainty around ECL impairment calculations and has required management to make additional judgements and accounting estimates that affect the amount of assets and liabilities at the reporting date and the amount of income and expenses in the reporting period. The key additional judgements due to the impact of the cost of living crisis mainly reflect the increased uncertainty around forward-looking economic data and the need for additional judgemental adjustments.
| | | | | |
| Key judgements | –Determining an appropriate definition of default |
| –Establishing the criteria for a significant increase in credit risk (SICR) and, for corporate borrowers, internal credit risk rating |
| –Determining the need for any judgemental adjustments |
| –Determining the need to assess corporate Stage 3 exposures individually |
| Key estimates | –Forward-looking multiple economic scenario assumptions |
| –Probability weights assigned to multiple economic scenarios |
For more on each of these key judgements and estimates, see 'Critical judgements and accounting estimates applied in calculating ECL' in the ‘Credit risk – credit risk management’ section of the Risk review.
Sensitivity of ECL allowance
For detailed disclosures, see 'Sensitivity of ECL allowance' in the ‘Credit risk – credit risk management’ section of the Risk review.
b) Provisions and contingent liabilities
| | | | | |
| Key judgements | –Determining whether a present obligation exists |
| –Determining the likely outcome of future legal decisions |
| Key estimates | –Probability, timing, nature and amount of any outflows that may arise from past events |
Included in Litigation and other regulatory provisions in Note 29 are amounts in respect of management’s best estimates of liability relating to a legal dispute regarding allocation of responsibility for a specific PPI portfolio of complaints, and Plevin related litigation. Note 31 provides disclosure relating to ongoing factual issues and reviews that could impact the timing and amount of any outflows.
Note 31 includes disclosure relating to an investigation in relation to the historical involvement of Santander UK plc, Santander Financial Services plc and Cater Allen International Limited (all subsidiaries of Santander UK Group Holdings plc) in German dividend tax arbitrage transactions.
These judgements are based on the specific facts available and often require specialist professional advice. There can be a wide range of possible outcomes and uncertainties, particularly in relation to legal actions, and regulatory and consumer credit matters. As a result, it is often not possible to make reliable estimates of the likelihood and amount of any potential outflows, or to calculate any resulting sensitivities. For more on these key judgements and estimates, see Notes 29 and 31.
| | | | | | | | | | | | | | |
| Annual Report 2022 | Santander UK Group Holdings plc 206 |
| | | | | | | | | | | | | | | | | | | | | | | | | | | | | | | | | | | | | | | | | |
| Strategic Report | Sustainability and Responsible Banking | Governance | Risk review | Financial review | Financial
statements | Shareholder
information |
| | | | | | | | | | | | | |
| | | | | | | | | | | | | |
c) Defined benefit pension schemes
The Santander UK group operates a number of defined benefit pension schemes as described in Note 30 and estimates their position as described in the accounting policy ‘Pensions and other post retirement benefits’.
| | | | | |
| Key judgements | –Setting the criteria for constructing the corporate bond yield curve used to determine the discount rate |
| –Determining the methodology for setting the inflation assumption |
| Key estimates | –Discount rate applied to future cash flows |
| –Rate of price inflation |
| –Expected lifetime of the schemes' members |
| –Valuation of pension fund assets whose values are not based on market observable data |
For more on each of these key judgements and estimates, see Note 30.
Sensitivity of defined benefit pension scheme estimates
For detailed disclosures, see ‘Actuarial assumption sensitivities’ in Note 30. The Scheme is invested in certain assets whose values are not based on market observable data, such as investments in private equity funds and property. Due diligence has been conducted to ensure the values obtained in respect of these assets are appropriate and represent fair value. Given the nature of these investments, we are unable to prepare sensitivities on how their values could vary as market conditions or other variables change.
d) Goodwill
The carrying amount of goodwill is based on the application of judgements including the basis of goodwill impairment calculation assumptions. Santander UK undertakes an annual assessment to evaluate whether the carrying amount of goodwill is impaired, carrying out this assessment more frequently if reviews identify indicators of impairment or when events or changes in circumstances dictate.
| | | | | |
| Key judgements: | –Determining the basis of goodwill impairment testing methodology, including the need for planning assumptions and internal capital allocations |
| Key estimates: | –Forecast cash flows for cash generating units, including estimated allocations of regulatory capital |
| –Growth rate beyond initial cash flow projections |
| –Discount rates which factor in risk-free rates and applicable risk premiums |
| All of these variables are subject to fluctuations in external market rates and economic conditions beyond management’s control |
For more on each of these key judgements and estimates, see Note 20.
Sensitivity of goodwill
For detailed disclosures, see ‘Sensitivities of key assumptions in calculating VIU’ in Note 20.
| | | | | | | | | | | | | | |
| Annual Report 2022 | Santander UK Group Holdings plc 207 |
| | | | | | | | | | | | | | | | | | | | | | | | | | | | | | | | | | | | | | | | | |
| Strategic Report | Sustainability and Responsible Banking | Governance | Risk review | Financial review | Financial
statements | Shareholder
information |
| | | | | | | | | | | | | |
| | | | | | | | | | | | | |
2. SEGMENTS
Santander UK’s principal activity is financial services, mainly in the UK. The business is managed and reported on the basis of four segments, which are strategic business units that offer different products and services, have different customers and require different technology and marketing strategies.
–Retail Banking consists of two business units, Homes and Everyday Banking. Homes provides prime UK mortgage lending to owner occupiers and buy-to-let landlords with small portfolios. Everyday Banking provides banking services and unsecured lending to individuals and small businesses as well alongside wealth management for high-net-worth clients.
–Consumer Finance provides prime auto consumer financing for individuals, businesses, and automotive distribution networks.
–Corporate & Commercial Banking provides banking products and services to SMEs, mid-sized and larger corporates, typically with annual turnovers of between £2m and £500m as well as to Local Authorities and Housing Associations.
–Corporate Centre provides treasury services for asset and liability management of our balance sheet, as well as management of non-core and legacy portfolios.
Retail Banking delivers products through our omni-channel presence comprising branches, ATMs, telephony, digital and intermediary channels. Consumer Finance business is primarily introduced by car dealerships acting as our intermediary along with a small amount of new business introduced via digital channels. Corporate and Commercial Banking expertise is provided by relationship managers, product specialists and through digital and telephony channels, and cover clients' needs both in the UK and overseas. In addition, Corporate and Investment Banking (CIB) provided services to corporate clients with an annual turnover of £500m and above. Santander UK transferred a significant part of the CIB business to the London branch of Banco Santander SA under a part VII banking business transfer scheme which completed on 11 October 2021. The residual parts of the business were wound down or transferred to other segments.
In December 2022, we transferred £1.5bn (2021: £2.3bn; 2020: £3.2bn) of social housing loans, and £0.4bn of non-core Liabilities (2021: £0.9bn; 2020: £nil) to our CCB segment from Corporate Centre to reflect the way these assets are managed, and restated comparatives accordingly. This resulted in an increase in profit before tax in CCB of £2.9m (2021: decrease of £2.7m; 2020: decrease of £6.3m) and an equal but opposite impact in Corporate Centre.
The segmental data is prepared on a statutory basis of accounting, in line with the accounting policies set out in Note 1. Transactions between segments are on normal commercial terms and conditions. Internal charges and internal UK transfer pricing adjustments are reflected in the results of each segment. Revenue sharing agreements are used to allocate external customer revenues to a segment on a reasonable basis. Funds are ordinarily reallocated between segments, resulting in funding cost transfers disclosed in operating income. Interest charged for these funds is based on Santander UK’s cost of wholesale funding. Interest income and interest expense have not been reported separately. The majority of segment revenues are interest income in nature and net interest income is relied on primarily to assess segment performance and to make decisions on the allocation of segment resources.
Results by segment
For the years ended 31 December
| | | | | | | | | | | | | | | | | | |
| Retail Banking | Consumer Finance | Corporate & Commercial Banking | | Corporate Centre | Total |
| 2022 | £m | £m | £m | | £m | £m |
| Net interest income | 3,689 | | 180 | | 580 | | | 23 | | 4,472 | |
| Non-interest income / (expense) | 197 | | 195 | | 146 | | | (4) | | 534 | |
| Total operating income | 3,886 | | 375 | | 726 | | | 19 | | 5,006 | |
| Operating expenses before credit impairment (charges)/write-backs, provisions and charges | (1,683) | | (144) | | (342) | | | (201) | | (2,370) | |
| Credit impairment (charges)/write-backs | (263) | | (27) | | (31) | | | — | | (321) | |
| Provisions for other liabilities and charges | (395) | | (6) | | (8) | | | (12) | | (421) | |
| Total operating credit impairment (charges)/write-backs, provisions and charges | (658) | | (33) | | (39) | | | (12) | | (742) | |
| Profit/(loss) from continuing operations before tax | 1,545 | | 198 | | 345 | | | (194) | | 1,894 | |
| | | | | | |
| Revenue from external customers | 4,153 | | 513 | | 732 | | | (392) | | 5,006 | |
| Inter-segment revenue | (267) | | (138) | | (6) | | | 411 | | — | |
| Total operating income | 3,886 | | 375 | | 726 | | | 19 | | 5,006 | |
| | | | | | |
Revenue from external customers includes the following fee and commission income:(1) | | | | | | |
–Current account and debit card fees | 502 | | — | | 60 | | | — | | 562 | |
–Insurance, protection and investments | 78 | | — | | — | | | — | | 78 | |
–Credit cards | 95 | | — | | — | | | — | | 95 | |
–Non-banking and other fees(2) | 2 | | 20 | | 77 | | | 2 | | 101 | |
| Total fee and commission income | 677 | | 20 | | 137 | | | 2 | | 836 | |
| Fee and commission expense | (483) | | (5) | | (18) | | | (6) | | (512) | |
| Net fee and commission income/(expense) | 194 | | 15 | | 119 | | | (4) | | 324 | |
| | | | | | |
| Customer loans | 194,661 | | 5,384 | | 18,518 | | | 1,141 | | 219,704 | |
Total assets(3) | 203,697 | | 10,371 | | 18,518 | | | 59,657 | | 292,243 | |
| Of which assets held for sale | — | | — | | — | | | 49 | | 49 | |
| Customer deposits | 161,748 | | — | | 24,798 | | | 9,930 | | 196,476 | |
| Total liabilities | 161,821 | | 1,223 | | 24,473 | | | 90,015 | | 277,532 | |
| | | | | | |
| Average number of full-time equivalent staff | 15,212 | 531 | 2,336 | | 194 | 18,273 |
(1)The disaggregation of fees and commission income as shown above is not included in reports provided to the chief operating decision maker but is provided to show the split by reportable segments.
(2)Non-banking and other fees include mortgages (except mortgage account fees), consumer finance, commitment commission, asset finance, invoice finance and trade finance.
(3)Includes customer loans, net of credit impairment charge allowances.
| | | | | | | | | | | | | | |
| Annual Report 2022 | Santander UK Group Holdings plc 208 |
| | | | | | | | | | | | | | | | | | | | | | | | | | | | | | | | | | | | | | | | | |
| Strategic Report | Sustainability and Responsible Banking | Governance | Risk review | Financial review | Financial
statements | Shareholder
information |
| | | | | | | | | | | | | |
| | | | | | | | | | | | | |
| | | | | | | | | | | | | | | | | | | | |
| Retail Banking | Consumer Finance | Corporate & Commercial Banking | Corporate & Investment Banking | Corporate Centre | Total |
| 2021 | £m | £m | £m | £m | £m | £m |
| Net interest income/(expense) | 3,374 | | 233 | | 397 | | — | | (7) | | 3,997 | |
| Non-interest income | 201 | | 178 | | 112 | | — | | 56 | | 547 | |
| Total operating income | 3,575 | | 411 | | 509 | | — | | 49 | | 4,544 | |
| Operating expenses before credit impairment (charges)/write-backs, provisions and charges | (1,703) | | (163) | | (365) | | — | | (309) | | (2,540) | |
| Credit impairment (charges)/write-backs | 98 | | 33 | | 90 | | — | | 12 | | 233 | |
| Provisions for other liabilities and charges | (187) | | 4 | | (34) | | — | | (162) | | (379) | |
| Total operating credit impairment (charges)/write-backs, provisions and charges | (89) | | 37 | | 56 | | — | | (150) | | (146) | |
| Profit/(loss) from continuing operations before tax | 1,783 | | 285 | | 200 | | — | | (410) | | 1,858 | |
| | | | | | |
| Revenue from external customers | 4,061 | | 489 | | 619 | | — | | (625) | | 4,544 | |
| Inter-segment revenue | (486) | | (78) | | (110) | | — | | 674 | | — | |
| Total operating income/(expense) | 3,575 | | 411 | | 509 | | — | | 49 | | 4,544 | |
| | | | | | |
Revenue from external customers includes the following fee and commission income:(1) | | | | | | |
–Current account and debit card fees | 428 | | — | | 50 | | — | | — | | 478 | |
–Insurance, protection and investments | 67 | | — | | — | | — | | — | | 67 | |
–Credit cards | 73 | | — | | — | | — | | — | | 73 | |
–Non-banking and other fees(2) | 2 | | 10 | | 62 | | — | | 2 | | 76 | |
| Total fee and commission income | 570 | | 10 | | 112 | | — | | 2 | | 694 | |
| Fee and commission expense | (384) | | — | | (22) | | — | | (8) | | (414) | |
| Net fee and commission income | 186 | | 10 | | 90 | | — | | (6) | | 280 | |
| | | | | | |
| Customer loans | 185,608 | | 4,984 | | 19,282 | | — | | 742 | | 210,616 | |
Total assets(3) | 193,214 | | 8,873 | | 19,281 | | — | | 72,308 | | 293,676 | |
| Customer deposits | 156,991 | | — | | 26,466 | | — | | 8,719 | | 192,176 | |
| Total liabilities | 157,622 | | 1,173 | | 26,513 | | — | | 91,990 | | 277,298 | |
| | | | | | |
| Average number of full-time equivalent staff | 16,149 | | 670 | | 2,281 | | 528 | | 216 | | 19,844 | |
| | | | | | |
| 2020 | | | | | | |
| Net interest income | 2,758 | | 264 | | 355 | | — | | 4 | | 3,381 | |
| Non-interest income | 245 | | 127 | | 96 | | — | | (14) | | 454 | |
| Total operating income | 3,003 | | 391 | | 451 | | — | | (10) | | 3,835 | |
| Operating expenses before credit impairment (charges)/write-backs, provisions and charges | (1,792) | | (166) | | (324) | | — | | (143) | | (2,425) | |
| Credit impairment (charges)/write-backs | (264) | | (44) | | (294) | | — | | (37) | | (639) | |
| Provisions for other liabilities and charges | (160) | | (8) | | (6) | | — | | (89) | | (263) | |
| Total operating credit impairment (charges)/write-backs, provisions and charges | (424) | | (52) | | (300) | | — | | (126) | | (902) | |
| Profit/(loss) from continuing operations before tax | 787 | | 173 | | (173) | | — | | (279) | | 508 | |
| | | | | | |
| Revenue from external customers | 3,685 | | 501 | | 608 | | — | | (959) | | 3,835 | |
| Inter-segment revenue | (682) | | (110) | | (157) | | — | | 949 | | — | |
| Total operating income | 3,003 | | 391 | | 451 | | — | | (10) | | 3,835 | |
| | | | | | |
Revenue from external customers includes the following fee and commission income:(1) | | | | | | |
–Current account and debit card fees | 442 | | — | | 42 | | — | | — | | 484 | |
–Insurance, protection and investments | 65 | | — | | — | | — | | — | | 65 | |
–Credit card fees | 66 | | — | | — | | — | | — | | 66 | |
–Non-banking and other fees(2) | 3 | | 10 | | 50 | | — | | 3 | | 66 | |
| Total fee and commission income | 576 | | 10 | | 92 | | — | | 3 | | 681 | |
| Fee and commission expense | (337) | | — | | (22) | | — | | (4) | | (363) | |
| Net fee and commission income | 239 | | 10 | | 70 | | — | | (1) | | 318 | |
| | | | | | |
| Customer loans | 178,451 | | 8,025 | | 20,821 | | 2,784 | | 288 | | 210,369 | |
Total assets(3) | 186,226 | | 11,143 | | 20,820 | | 2,784 | | 78,091 | | 299,064 | |
| Customer deposits | 152,167 | | — | | 24,985 | | 6,506 | | 8,074 | | 191,732 | |
| Total liabilities | 152,687 | | 2,397 | | 25,011 | | 6,517 | | 96,207 | | 282,819 | |
| | | | | | |
| Average number of full-time equivalent staff | 18,198 | | 640 | | 2,405 | | 716 | | 180 | | 22,139 | |
(1)The disaggregation of fees and commission income as shown above is not included in reports provided to the chief operating decision maker but is provided to show the split by reportable segments.
(2)Non-banking and other fees include mortgages (except mortgage account fees), consumer finance, commitment commission, asset finance, invoice finance and trade finance.
(3)Includes customer loans, net of credit impairment charge allowances.
(4)CIB results presented as discontinued operations. See Note42.
The main differences between Customer loans and Loans and advances to customers (Note 13) are balances in Corporate Centre held for liquidity purposes. The main differences between Customer deposits and Deposits by customers (Note 23) are equity-linked deposits and intercompany deposits.
Geographical information is not provided, as substantially all of Santander UK’s activities are in the UK.
| | | | | | | | | | | | | | |
| Annual Report 2022 | Santander UK Group Holdings plc 209 |
| | | | | | | | | | | | | | | | | | | | | | | | | | | | | | | | | | | | | | | | | |
| Strategic Report | Sustainability and Responsible Banking | Governance | Risk review | Financial review | Financial
statements | Shareholder
information |
| | | | | | | | | | | | | |
| | | | | | | | | | | | | |
3. NET INTEREST INCOME
| | | | | | | | | | | |
| | | Group |
| 2022 | 2021 | 2020 |
| £m | £m | £m |
| Interest and similar income: | | | |
| Loans and advances to customers | 5,854 | | 4,685 | | 4,772 | |
| Loans and advances to banks | 651 | | 54 | | 62 | |
| Reverse repurchase agreements – non trading | 149 | | 35 | | 118 | |
| Other | 168 | | 56 | | 119 | |
Total interest and similar income(1) | 6,822 | | 4,830 | | 5,071 | |
| Interest expense and similar charges: | | | |
| Deposits by customers | (827) | | (331) | | (884) | |
| Deposits by banks | (496) | | (23) | | (28) | |
| Repurchase agreements – non trading | (120) | | (3) | | (43) | |
| Debt securities in issue | (795) | | (372) | | (614) | |
| Subordinated liabilities | (108) | | (92) | | (111) | |
| Other | (4) | | (12) | | (10) | |
Total interest expense and similar charges(2) | (2,350) | | (833) | | (1,690) | |
| Net interest income | 4,472 | | 3,997 | | 3,381 | |
(1)Includes £87m (2021: £22m, 2020: £38m) of interest income on financial assets at FVOCI.
(2)Includes £6m (2021: £317m, 2020: £451m) of interest expense on derivatives hedging debt issuances and £3m (2021: £3m, 2020, £3m) of interest expense on lease liabilities.
4. NET FEE AND COMMISSION INCOME
| | | | | | | | | | | |
| | | Group |
| 2022 | 2021 | 2020 |
| £m | £m | £m |
| Fee and commission income: | | | |
| Current account and debit card fees | 562 | | 478 | | 484 | |
| Insurance, protection and investments | 78 | | 67 | | 65 | |
| Credit cards | 95 | | 73 | | 66 | |
Non-banking and other fees(1) | 101 | | 76 | | 66 | |
| Total fee and commission income | 836 | | 694 | | 681 | |
| Total fee and commission expense | (512) | | (414) | | (363) | |
| Net fee and commission income | 324 | | 280 | | 318 | |
(1) Non-banking and other fees include mortgages (except mortgage account fees), consumer finance, commitment commission, asset finance, invoice finance and trade finance.
5. OTHER OPERATING INCOME
| | | | | | | | | | | |
| | | Group |
| 2022 | 2021 | 2020 |
| £m | £m | £m |
| Net gains/(losses) on financial instruments designated at fair value through profit or loss | (74) | | (68) | | (26) | |
| Net (losses)/gains on financial instruments mandatorily at fair value through profit or loss | 84 | | 50 | | 64 | |
| Hedge ineffectiveness | 28 | | 8 | | 19 | |
| Net profit on sale of financial assets at fair value through other comprehensive income | — | | 6 | | 17 | |
| Income from operating lease assets | 129 | | 136 | | 126 | |
| Other | 43 | | 135 | | (64) | |
| 210 | | 267 | | 136 | |
Assets and liabilities held at FVTPL, including derivatives, are mainly used to provide customers with risk management solutions, and to manage and hedge the Santander UK group’s own risks, and do not give rise to significant overall net gains/(losses) in the income statement.
'Net gains on financial instruments mandatorily at FVTPL' includes fair value gains of £14m (2021: losses of £15m, 2020: gains of £89m) on embedded derivatives bifurcated from certain equity index-linked deposits, as described in the derivatives accounting policy in Note 1. The embedded derivatives are economically hedged, the results of which are also included in this line item and amounted to losses of £14m (2021: gains of £15m, 2020: losses of £88m). As a result, the net fair value movements recognised on the equity index-linked deposits and the related economic hedges were net gains of £nil (2021: £nil , 2020: £1m).
Exchange rate differences recognised in the Consolidated Income Statement on items not at FVTPL were £2,147m expense (2021: £215m income, 2020: £719m expense) and are presented in the line ‘Other'. These are principally offset by related releases from the cash flow hedge reserve of £2,130m income (2021: £357m expense, 2020: £803m income) as set out in the Consolidated Statement of Comprehensive Income, which are also presented in 'Other’. Exchange rate differences on items measured at FVTPL are included in the line items relating to changes in fair value.
In 2022, the Santander UK group repurchased certain debt securities and subordinated liabilities as part of ongoing liability management exercises, resulting in a loss of £5m (2021 loss of £1m, 2020: loss of £24m).
| | | | | | | | | | | | | | |
| Annual Report 2022 | Santander UK Group Holdings plc 210 |
| | | | | | | | | | | | | | | | | | | | | | | | | | | | | | | | | | | | | | | | | |
| Strategic Report | Sustainability and Responsible Banking | Governance | Risk review | Financial review | Financial
statements | Shareholder
information |
| | | | | | | | | | | | | |
| | | | | | | | | | | | | |
In 2022, other includes £7m of losses on the sale of property under our transformation programme. In 2021, other includes £73m of property gains from the sale of our London head office and branch properties.
6. OPERATING EXPENSES BEFORE CREDIT IMPAIRMENT CHARGES, PROVISIONS AND CHARGES
For the years ended 31 December
| | | | | | | | | | | |
| | | Group |
| 2022 | 2021 | 2020 |
| £m | £m | £m |
| Staff costs: | | | |
| Wages and salaries | 761 | | 759 | | 802 | |
| Performance-related payments | 173 | | 184 | | 99 | |
| Social security costs | 112 | | 113 | | 102 | |
| Pensions costs: – defined contribution plans | 60 | | 65 | | 67 | |
–defined benefit plans | 28 | | 38 | | 38 | |
| Other share-based payments | 1 | | 1 | | 4 | |
| Other personnel costs | 44 | | 42 | | 34 | |
| 1,179 | | 1,202 | | 1,146 | |
| Other administration expenses | 894 | | 831 | | 710 | |
| Depreciation, amortisation and impairment | 297 | | 507 | | 569 | |
| 2,370 | | 2,540 | | 2,425 | |
| | | |
Staff costs
’Performance-related payments’ include bonuses paid in cash and share awards granted under the arrangements described in Note 36. Included in this are equity-settled share-based payments, none of which related to option-based schemes. These are disclosed in the table below as ‘Shares awards’. Performance-related payments above include amounts related to deferred performance awards as follows:
| | | | | | | | | | | | | | | | | | | | | | | |
| Costs recognised in 2022 | | Costs expected to be recognised in 2023 or later |
| Arising from awards in current year | Arising from awards in prior year | Total | | Arising from awards in current year | Arising from awards in prior year | Total |
| £m | £m | £m | | £m | £m | £m |
| Cash | 3 | | 5 | | 8 | | | 6 | | 8 | | 14 | |
| Shares | 3 | | 5 | | 8 | | | 6 | | 8 | | 14 | |
| 6 | | 10 | | 16 | | | 12 | | 16 | | 28 | |
The following table shows the amount of bonus awarded to employees for the performance year 2022. In the case of deferred cash and shares awards, the final amount paid to an employee is influenced by forfeiture provisions and any performance conditions to which the awards are subject. The deferred shares award amount is based on the fair value of the awards at the date of grant.
| | | | | | | | | | | | | | | | | | | | | | | | | | |
| Expenses charged in the year | | Expenses deferred to future periods | | Total |
| 2022 | 2021 | | 2022 | 2021 | | 2022 | 2021 |
| £m | £m | | £m | £m | | £m | £m |
| Cash award – not deferred | 148 | | 156 | | | — | | — | | | 148 | | 156 | |
–deferred | 8 | | 8 | | | 14 | | 15 | | | 22 | | 23 | |
| Shares award – not deferred | 9 | | 12 | | | — | | — | | | 9 | | 12 | |
–deferred | 8 | | 8 | | | 14 | | 14 | | | 22 | | 22 | |
| Total discretionary bonus | 173 | | 184 | | | 28 | | 29 | | | 201 | | 213 | |
'Other share-based payments’ consist of options granted under the Employee Sharesave scheme which comprise the Santander UK group’s cash-settled share-based payments. For more, see Note 36.
The average number of full-time equivalent staff was 18,273 (2021: 19,844, 2020: 22,139).
Depreciation, amortisation and impairment
In 2022, depreciation, amortisation and impairment included depreciation of £73m (2021: £81m, 2020: £92m) on operating lease assets (where the Santander UK group is the lessor) with a carrying amount of £577m at 31 December 2022 (2021: £595m, 2020: £542m). It also included depreciation of £19m (2021: £20m, 2020: £59m) on right-of-use assets with a carrying amount of £115m at 31 December 2022 (2021: £119m, 2020: £103m).
'Other administration expenses' includes £21m (2021: £23m, 2020: £10m) related to short-term leases.
In 2022, 'Depreciation, amortisation and impairment' included an impairment charge of £10m (2021: £88m, 2020: £nil) associated with branch and head office site closures as part of the transformation programme. For more, see Note 21.
| | | | | | | | | | | | | | |
| Annual Report 2022 | Santander UK Group Holdings plc 211 |
| | | | | | | | | | | | | | | | | | | | | | | | | | | | | | | | | | | | | | | | | |
| Strategic Report | Sustainability and Responsible Banking | Governance | Risk review | Financial review | Financial
statements | Shareholder
information |
| | | | | | | | | | | | | |
| | | | | | | | | | | | | |
7. AUDIT AND OTHER SERVICES
| | | | | | | | | | | |
| | | Group |
| 2022 | 2021 | 2020 |
| £m | £m | £m |
| Audit fees: | | | |
| Fees payable to the Company’s auditor and its associates for the audit of the Santander UK group’s annual accounts | 12.8 | | 12.1 | | 10.5 | |
| Fees payable to the Company’s auditor and its associates for other services to the Santander UK group: | | | |
–Audit of the Santander UK group’s subsidiaries | 0.8 | | 1.2 | | 1.8 | |
Total audit fees(1) | 13.6 | | 13.3 | | 12.3 | |
| Non-audit fees: | | | |
| Audit-related assurance services | 1.9 | | 1.7 | | 1.7 | |
| Other assurance services | 0.8 | | 0.5 | | 0.5 | |
| Other non-audit services | 0.2 | | 0.2 | | — | |
| Total non-audit fees | 2.9 | | 2.4 | | 2.2 | |
(1) 2022 audit fees included £0.6m (2021: £1.2m, 2020: £0.8m) which related to the prior year.
Audit fees payable for the statutory audit of Santander UK Group Holdings plc were £0.6m (2021: £0.5m, 2020: £0.5m).
Audit-related assurance services mainly comprised services performed in connection with review of the financial information of the Company and reporting to the Company's UK regulators.
Other assurance services mainly comprised services performed in support of various debt issuance programmes.
Of the total non-audit fees, £1.5m (2021: £1.2m, 2020: £1.2m) accords with the definition of 'Audit Fees' per US Securities and Exchange Commission (SEC) guidance, £1.4m (2021: £1.2m, 2020: £1.0m) accords with the definition of 'Audit related fees' per that guidance and £0.0m (2021: £0.0m, 2020: £0.0m) accords with the definition of 'All other fees' per that guidance.
In 2022, the Company’s auditors earned no fees (2021: £27,000, 2020: £24,000 fees) payable by entities outside the Santander UK group for the review of the financial position of corporate and other borrowers.
In 2022, the Company's auditors earned £1.6m (2021: £1.4m, 2020: £1.5m), in relation to incremental work undertaken in support of the audit of Banco Santander SA.
8. CREDIT IMPAIRMENT CHARGES AND PROVISIONS
For the years ended 31 December
| | | | | | | | | | | |
| | | Group |
| 2022 | 2021 | 2020 |
| £m | £m | £m |
| Credit impairment charges/(write-backs): | | | |
| Loans and advances to customers | 249 | | (186) | | 666 | |
| Recoveries of loans and advances, net of collection costs | 36 | | (17) | | (24) | |
| Off-balance sheet credit exposures (See Note 29) | 36 | | (30) | | (3) | |
| 321 | | (233) | | 639 | |
| Provisions for other liabilities and charges (excluding off-balance sheet credit exposures) (See Note 29) | 424 | | 388 | | 257 | |
| (Releases)/Provisions for residual value and voluntary termination | (3) | | (9) | | 6 | |
| 421 | | 379 | | 263 | |
| 742 | | 146 | | 902 | |
In 2022, 2021 and 2020 there were no material credit impairment charges on loans and advances to banks, non-trading reverse repurchase agreements, other financial assets at amortised cost and financial assets at FVOCI.
| | | | | | | | | | | | | | |
| Annual Report 2022 | Santander UK Group Holdings plc 212 |
| | | | | | | | | | | | | | | | | | | | | | | | | | | | | | | | | | | | | | | | | |
| Strategic Report | Sustainability and Responsible Banking | Governance | Risk review | Financial review | Financial
statements | Shareholder
information |
| | | | | | | | | | | | | |
| | | | | | | | | | | | | |
9. TAXATION
| | | | | | | | | | | |
| | | Group |
| 2022 | 2021 | 2020 |
| £m | £m | £m |
| Current tax: | | | |
| UK corporation tax on profit for the year | 524 | | 400 | | 92 | |
| Adjustments in respect of prior years | (88) | | (30) | | (27) | |
| Total current tax | 436 | | 370 | | 65 | |
| Deferred tax: | | | |
| (Credit)/Charge for the year | (30) | | 101 | | 35 | |
| Adjustments in respect of prior years | 65 | | 14 | | 1 | |
| Total deferred tax | 35 | | 115 | | 36 | |
| Tax on profit from continuing operations | 471 | | 485 | | 101 | |
The standard rate of UK corporation tax was 27% for banking entities and 19% for non-banking entities (2021: 27% for banking entities and 19% for non-banking entities; 2020: 27% for banking entities and 19% for non-banking entities). Tax for other jurisdictions is calculated at the rates prevailing in those jurisdictions.
The Santander UK group’s effective tax rate for 2022 was 24.9% (2021: 26.1%, 2020: 19.9%). The tax on profit from continuing operations before tax differs from the theoretical amount that would arise using the basic corporation tax rate as follows:
For the years ended 31 December
| | | | | | | | | | | |
| | | Group |
| 2022 | 2021 | 2020 |
| £m | £m | £m |
| Profit from continuing operations before tax | 1,894 | | 1,858 | | 508 | |
| Tax calculated at a tax rate of 19% (2021: 19%, 2020: 19%) | 360 | | 353 | | 97 | |
| Bank surcharge on profits | 123 | | 106 | | 23 | |
| Non-deductible preference dividends paid | 9 | | 9 | | 8 | |
| Non-deductible UK Bank Levy | 13 | | 14 | | 20 | |
| Non-deductible conduct remediation, fines and penalties | 48 | | 6 | | (4) | |
| Other non-deductible costs and non-taxable income | 20 | | 33 | | 23 | |
| Effect of change in tax rate on deferred tax provision | (28) | | 8 | | 6 | |
| Tax relief on dividends in respect of other equity instruments | (40) | | (40) | | (40) | |
| Adjustment to prior year provisions | (34) | | (4) | | (32) | |
| Tax on profit from continuing operations | 471 | | 485 | | 101 | |
The UK government announced in its budget on 3 March 2021 that it would increase the main rate of corporation tax by 6% to 25% with effect from 1 April 2023. This change was substantively enacted on 24 May 2021 and, as a result, the effect has been reflected in the closing deferred tax position included in these financial statements. The comparative 2020 results reflected an increase in tax rates by 2% following an announcement in the 2020 budget to reverse a previously planned rate reduction from April 2020.
A reduction in the Bank Surcharge rate from 8% to 3% was announced in October 2021 to be effective from 1 April 2023. This change in rate was substantively enacted on 2 February 2022 and as a result, the effects of this change have been reflected in the closing balance sheet position for deferred tax.
Current tax assets and liabilities
Movements in current tax assets and liabilities during the year were as follows:
| | | | | | | | |
| | Group |
| 2022 | 2021 |
| £m | £m |
| Assets | 351 | | 271 | |
| Liabilities | — | | — | |
| At 1 January | 351 | | 271 | |
| Income statement charge (including discontinued operations) | (436) | | (382) | |
| Other comprehensive income credit | 159 | | 33 | |
| Corporate income tax paid | 397 | | 418 | |
| Other movements | 13 | | 11 | |
| 484 | | 351 | |
| Assets | 484 | | 351 | |
| Liabilities | — | | — | |
| At 31 December | 484 | | 351 | |
The amount of corporation income tax paid differs from the tax charge for the period as a result of the timing of payments due to the tax authorities, the effects of movements in deferred tax, adjustments to prior period current tax provisions and current tax recognised directly in other comprehensive income.
Santander UK proactively engages with HM Revenue & Customs to resolve tax matters relating to prior years. The accounting policy for recognising provisions for such matters are described in Note 1. It is not expected that there will be any material movement in such provisions within the next 12 months.
| | | | | | | | | | | | | | |
| Annual Report 2022 | Santander UK Group Holdings plc 213 |
| | | | | | | | | | | | | | | | | | | | | | | | | | | | | | | | | | | | | | | | | |
| Strategic Report | Sustainability and Responsible Banking | Governance | Risk review | Financial review | Financial
statements | Shareholder
information |
| | | | | | | | | | | | | |
| | | | | | | | | | | | | |
Deferred tax
The table below shows the deferred tax assets and liabilities including the movement in the deferred tax account during the year. Deferred tax balances are presented in the balance sheet after offsetting assets and liabilities where the Santander UK group has the legal right to offset and intends to settle on a net basis.
| | | | | | | | | | | | | | | | | | | | | | | | | | |
| | | | | | | Group |
| Fair value of financial instruments | Pension remeasurement | Cash flow hedges | Fair value reserve | Tax losses carried forward | Accelerated tax depreciation | Other temporary differences | Total |
| £m | £m | £m | £m | £m | £m | £m | £m |
| At 1 January 2022 | (123) | | (508) | | (7) | | (12) | | 8 | | 68 | | 1 | | (573) | |
| Income statement (charge)/credit | 150 | | (49) | | — | | — | | (7) | | (33) | | (96) | | (35) | |
| Transfers/reclassifications | — | | — | | 3 | | (1) | | (1) | | — | | (1) | | — | |
| Credited/(charged) to other comprehensive income | — | | 267 | | 309 | | 11 | | — | | — | | (9) | | 578 | |
| At 31 December 2022 | 27 | | (290) | | 305 | | (2) | | — | | 35 | | (105) | | (30) | |
| | | | | | | | |
| At 1 January 2021 | (65) | | (27) | | (100) | | (10) | | 15 | | 39 | | 41 | | (107) | |
| Income statement (charge)/credit | (58) | | (67) | | — | | (1) | | (7) | | 39 | | (21) | | (115) | |
| Transfers/reclassifications | — | | 5 | | (16) | | 1 | | — | | (10) | | (19) | | (39) | |
| Credited/(charged) to other comprehensive income | — | | (419) | | 109 | | (2) | | — | | — | | — | | (312) | |
| At 31 December 2021 | (123) | | (508) | | (7) | | (12) | | 8 | | 68 | | 1 | | (573) | |
The deferred tax assets and liabilities above have been recognised in the Santander UK group on the basis that sufficient future taxable profits are forecast within the foreseeable future, in excess of the profits arising from the reversal of existing taxable temporary differences, to allow for the utilisation of the assets as they reverse. Based on the conditions at the balance sheet date, management determined that a reasonably possible change in any of the key assumptions underlying the estimated future taxable profits in the Santander UK group’s three-year plan (described in Note 20) would not cause a reduction in the deferred tax assets recognised. At 31 December 2022, the Santander UK group had a recognised deferred tax asset in respect of UK capital losses carried forward of £nil (2021:£5m ) included within tax losses carried forward. There are £nil unrecognised deferred tax assets on capital losses carried forward (2021: £nil).
10. DIVIDENDS ON ORDINARY SHARES
Dividends on ordinary shares declared and paid in the year were as follows:
| | | | | | | | | | | | | | | | | | | | | | | |
| | | Group | | | | Group |
| 2022 | 2021 | 2020 | | 2022 | 2021 | 2020 |
| Pence per share | Pence per share | Pence per share | | £m | £m | £m |
| In respect of current year – first interim | 5.62 | 4.05 | | 1.46 | | | 397 | | 286 | | 103 | |
| – second interim | 8.73 | 15.01 | | — | | | 616 | | 1,060 | | — | |
| | | | | | | |
| 14.35 | 19.06 | | 1.46 | | | 1,013 | | 1,346 | | 103 | |
In 2022 an interim dividend of £1,013m (2021: £1,346m, 2020: £103m) was paid on the Company's ordinary shares in issue, £300m of which was a special dividend. These were paid following review and approval by the Board in line with our dividend policy.
| | | | | | | | | | | | | | |
| Annual Report 2022 | Santander UK Group Holdings plc 214 |
| | | | | | | | | | | | | | | | | | | | | | | | | | | | | | | | | | | | | | | | | |
| Strategic Report | Sustainability and Responsible Banking | Governance | Risk review | Financial review | Financial
statements | Shareholder
information |
| | | | | | | | | | | | | |
| | | | | | | | | | | | | |
11. DERIVATIVE FINANCIAL INSTRUMENTS
a) Use of derivatives
Santander UK undertakes derivative activities primarily to provide customers with risk management solutions and to manage and hedge its own risks. These derivative activities do not give rise to significant open positions in portfolios of derivatives. Any residual position is managed to ensure that it remains within acceptable risk levels, with matching transactions used to achieve this where necessary. When entering into derivatives, Santander UK employs the same credit risk management procedures to assess and approve potential credit exposures that are used for traditional lending.
For information on how Santander UK is managing the transition to alternative benchmark interest rates, see Note 41.
b) Analysis of derivatives
The table below includes the notional amounts of transactions outstanding at the balance sheet date; they do not represent actual exposures.
| | | | | | | | | | | | | | | | | | | | | | | |
| | | | | | | Group |
| 2022 | | 2021 |
| | Fair value | | | Fair value |
| Notional amount | Assets | Liabilities | | Notional amount | Assets | Liabilities |
| £m | £m | £m | | £m | £m | £m |
| Derivatives held for trading: | | | | | | | |
| Exchange rate contracts | 14,769 | | 320 | | 299 | | | 11,750 | | 159 | | 183 | |
| Interest rate contracts | 31,599 | | 473 | | 792 | | | 25,617 | | 489 | | 708 | |
| Equity and credit contracts | 954 | | 142 | | 25 | | | 1,138 | | 166 | | 57 | |
| Total derivatives held for trading | 47,322 | | 935 | | 1,116 | | | 38,505 | | 814 | | 948 | |
| Derivatives held for hedging | | | | | | | |
| Designated as fair value hedges: | | | | | | | |
| Exchange rate contracts | 538 | | 12 | | 4 | | | 590 | | 39 | | — | |
| Interest rate contracts | 77,885 | | 1,776 | | 411 | | | 80,651 | | 908 | | 737 | |
| | | | | | | |
| 78,423 | | 1,788 | | 415 | | | 81,241 | | 947 | | 737 | |
| Designated as cash flow hedges: | | | | | | | |
| Exchange rate contracts | 26,035 | | 1,717 | | 186 | | | 22,239 | | 996 | | 338 | |
| Interest rate contracts | 25,971 | | 164 | | 1,463 | | | 21,329 | | 177 | | 216 | |
| Equity derivative contracts | 51 | | 8 | | 1 | | | 47 | | 7 | | 1 | |
| 52,057 | | 1,889 | | 1,650 | | | 43,615 | | 1,180 | | 555 | |
| Total derivatives held for hedging | 130,480 | | 3,677 | | 2,065 | | | 124,856 | | 2,127 | | 1,292 | |
Derivative netting(1) | — | | (2,173) | | (2,173) | | | — | | (1,221) | | (1,221) | |
| Total derivatives | 177,802 | | 2,439 | | 1,008 | | | 163,361 | | 1,720 | | 1,019 | |
(1)Derivative netting excludes the effect of cash collateral, which is offset against the gross derivative position. The amount of cash collateral received that had been offset against the gross derivative assets was £1,368m (2021: £189m) and the amount of cash collateral paid that had been offset against the gross derivative liabilities was £70m (2021: £202m).
For information about the impact of netting arrangements on derivative assets and liabilities in the table above, see Note 40.
The table below analyses the notional and fair values of derivatives by trading and settlement method.
| | | | | | | | | | | | | | | | | | | | | | | | | | |
| | Notional | | | | | | |
| | Traded over the counter | | | | Asset | | | Liability |
| | Settled by central counterparties | Not settled by central counterparties | Total | | | Traded over the counter | | | Traded over the counter |
| 2022 | | £m | £m | £m | | | £m | | | £m |
| Exchange rate contracts | | — | | 41,342 | | 41,342 | | | | 2,049 | | | | 489 | |
| Interest rate contracts | | 124,638 | | 10,817 | | 135,455 | | | | 240 | | | | 493 | |
| Equity and credit contracts | | — | | 1,005 | | 1,005 | | | | 150 | | | | 26 | |
| | 124,638 | | 53,164 | | 177,802 | | | | 2,439 | | | | 1,008 | |
| | | | | | | | | | |
| 2021 | | | | | | | | | | |
| Exchange rate contracts | | — | | 34,579 | | 34,579 | | | | 1,193 | | | | 522 | |
| Interest rate contracts | | 117,560 | | 10,037 | | 127,597 | | | | 353 | | | | 441 | |
| Equity and credit contracts | | — | | 1,185 | | 1,185 | | | | 174 | | | | 56 | |
| | 117,560 | | 45,801 | | 163,361 | | | | 1,720 | | | | 1,019 | |
| | | | | | | | | | | | | | |
| Annual Report 2022 | Santander UK Group Holdings plc 215 |
| | | | | | | | | | | | | | | | | | | | | | | | | | | | | | | | | | | | | | | | | |
| Strategic Report | Sustainability and Responsible Banking | Governance | Risk review | Financial review | Financial
statements | Shareholder
information |
| | | | | | | | | | | | | |
| | | | | | | | | | | | | |
c) Analysis of derivatives designated as hedges
Santander UK applies hedge accounting on both a fair value and cash flow basis depending on the nature of the underlying exposure. We establish the hedge ratio by matching the notional of the derivative with the underlying position being hedged. Only the designated risk is hedged and therefore other risks, such as credit risk are managed but not hedged. For interest rate hedges, the designated hedged risk is determined with reference to the underlying benchmark rate.
Fair value hedges
Portfolio hedges of interest rate risk
Santander UK holds portfolios of fixed rate assets and liabilities which expose it to changes in fair value due to movements in market interest rates. We manage these exposures by entering into interest rate swaps. Each portfolio contains assets or liabilities that are similar in nature and share the risk exposure that is designated as being hedged.
The interest rate risk component is the change in fair value of fixed rate instruments for changes in the designated benchmark rate. Such changes are usually the largest component of the overall change in fair value. Separate hedges are maintained for each underlying currency. Effectiveness is assessed by comparing changes in fair value of the hedged item attributable to changes in the designated benchmark interest rate, with changes in the fair value of the interest rate swaps.
Micro hedges of interest rate risk and foreign currency risk
Santander UK accesses international markets to obtain funding, issuing fixed rate debt in its functional currency and other currencies. We are therefore exposed to changes in fair value due to changes in market interest rates and/or foreign exchange rates, principally in USD and EUR, which we mitigate through the use of receive fixed/pay floating rate interest rate swaps and/or receive fixed/pay floating rate cross currency swaps.
The interest rate risk component is the change in fair value of the fixed rate debt due to changes in the benchmark rate. The foreign exchange component is the change in the fair value of the fixed rate debt issuance due to changes in foreign exchange rates prevailing from the time of execution. Effectiveness is assessed by using linear regression techniques to compare changes in the fair value of the debt caused by changes in the benchmark interest rate and foreign exchange rates, with changes in the fair value of the interest rate swaps and/or cross currency swaps.
Cash flow hedges
Hedges of interest rate risk
Santander UK manages its exposure to the variability in cash flows of floating rate assets and liabilities attributable to movements in market interest rates by entering into interest rate swaps. The interest rate risk component is determined with reference to the underlying benchmark rate attributable to the floating rates asset or liability. Designated benchmark rates referenced are currently SONIA or BoE base rate. Effectiveness is assessed by comparing changes in the fair value of the interest rate swap with changes in the fair value of the hedged item attributable to the hedged risk, applying a hypothetical derivative method using linear regression techniques.
Hedges of foreign currency risk
As Santander UK obtains funding in international markets, we assume significant foreign currency risk exposure, mainly in USD and EUR. In addition, Santander UK also holds debt securities for liquidity purposes which assumes foreign currency exposure, principally in JPY.
Santander UK manages the exposures to the variability in cash flows of foreign currency denominated assets and liabilities to movements in foreign exchange rates by entering into either foreign exchange contracts (spot, forward and swaps) or cross currency swaps. These instruments are entered into to match the cash flow profile and maturity of the estimated interest and principal repayments of the hedged item.
The foreign currency risk component is the change in cash flows of the foreign currency debt arising from changes in the relevant foreign currency forward exchange rate. Such changes constitute a significant component of the overall changes in cash flows of the instrument. Effectiveness is assessed by comparing changes in the fair value of the foreign exchange contracts (spot, forward and swaps) or cross currency swaps with changes in the fair value of the hedged debt attributable to the hedged risk applying a hypothetical derivative method using linear regression techniques.
Equity risk on cash settled share-based transactions
Santander Equity Investments Limited (SEIL) offers employees the chance to buy shares in Banco Santander SA at a discount under Sharesave, or other incentive schemes. This exposes Santander UK to equity price risk. The equity risk is managed by purchasing share options which allow Santander UK to buy shares at a fixed price. These instruments are entered into to match the amount of employee share options expected to be exercised.
The equity price risk is the change in cash flows arising from the change in share price over time. Santander UK established the hedge ratio by matching the notional of the derivative with the notional of the employee share options being hedged. Effectiveness is assessed by comparing the changes in fair value of the share options with changes in the fair value of the employee share options by using a hypothetical derivative method.
IBOR Reform
Note 41 includes details of the notional value of hedging instruments by benchmark interest rate impacted by IBOR reform and the notional amounts of assets, liabilities and off-balance sheet commitments affected by IBOR reform that have yet to transition to an alternative benchmark interest rate.
Possible sources of hedge ineffectiveness
For both fair value and cash flow hedges, hedge ineffectiveness can arise from hedging derivatives with a non-zero fair value at the date of initial designation. In addition, for:
Fair value hedges
Hedge ineffectiveness can also arise due to differences in discounting between the hedged item and the hedging instrument as cash collateralised swaps discount using Overnight Indexed Swaps discount curves not applied to the hedged item; and where counterparty credit risk impacts the fair value of the derivative but not the hedged item. For portfolio hedges of interest rate risk, it can also arise due to differences in the expected and actual volume of prepayments.
Cash flow hedges
Hedge ineffectiveness can also arise due to differences in the timing of cash flows between the hedged item and the hedging instrument. For micro hedges of interest rate risk, it can also arise due to differences in the basis of cash flows between the hedged item and the hedging instrument. For hedges of equity risk on cash settled share-based transactions, it can also arise due to changes in the expected number of Sharesave options to be exercised.
| | | | | | | | | | | | | | |
| Annual Report 2022 | Santander UK Group Holdings plc 216 |
| | | | | | | | | | | | | | | | | | | | | | | | | | | | | | | | | | | | | | | | | |
| Strategic Report | Sustainability and Responsible Banking | Governance | Risk review | Financial review | Financial
statements | Shareholder
information |
| | | | | | | | | | | | | |
| | | | | | | | | | | | | |
Maturity profile and average price/rate of hedging instruments
The following table sets out the maturity profile and average price/rate of the hedging instruments used in the Santander UK group’s hedging strategies:
| | | | | | | | | | | | | | | | | | | | | | | |
| | | | | | | Group |
| 2022 | Hedging Instruments | ≤1 month | >1 and ≤3 months | >3 and ≤12 months | >1 and ≤5 years | >5 years | Total |
| Fair value hedges: | | | | | | | |
| Interest rate risk | Interest rate contracts - Nominal amount (£m) | 2,210 | | 4,468 | | 21,678 | | 45,451 | | 3,808 | | 77,615 | |
| Average fixed interest rate - GBP | 2.58 | % | 0.88 | % | 0.56 | % | 2.07 | % | 3.78 | % | |
| Average fixed interest rate - EUR | 1.77 | % | 1.60 | % | 0.77 | % | 0.28 | % | 3.09 | % | |
| Average fixed interest rate - USD | 1.35 | % | 3.47 | % | 3.51 | % | 2.00 | % | 4.92 | % | |
| Interest rate/FX risk | Exchange rate contracts - Nominal amount (£m) | — | | — | | 66 | | 465 | | 7 | | 538 | |
| Interest rate contracts - Nominal amount (£m) | — | | — | | — | | 263 | | 7 | | 270 | |
| Average GBP - EUR exchange rate | — | | — | | 1.20 | | 1.16 | | 1.10 | | |
| Average GBP - USD exchange rate | — | | — | | — | | 1.19 | | — | | |
| Average fixed interest rate - EUR | — | % | — | % | 3.42 | % | 2.06 | % | — | % | |
| Average fixed interest rate - USD | — | % | — | % | — | % | 4.63 | % | — | % | |
| Cash flow hedges: | | | | | | | |
| Interest rate risk | Interest rate contracts - Nominal amount (£m) | 1,042 | | 2,191 | | 1,940 | | 13,060 | | 1,076 | | 19,309 | |
| Average fixed interest rate - GBP | 1.77 | % | 2.29 | % | 1.98 | % | 2.35 | % | 1.84 | % | |
| FX risk | Exchange rate contracts - Nominal amount (£m) | 2,301 | | 3,135 | | 2,381 | | 10,606 | | 1,163 | | 19,586 | |
| Interest rate contracts - Nominal amount (£m) | 415 | | — | | — | | 2,325 | | 997 | | 3,737 | |
| Average GBP - JPY exchange rate | — | 157.45 | 160.04 | — | — | |
| Average GBP - CHF exchange rate | — | 1.13 | — | — | — | |
| Average GBP - EUR exchange rate | — | — | 1.12 | 1.18 | 1.17 | |
| Average GBP - USD exchange rate | 1.22 | 1.25 | 1.17 | 1.31 | 1.39 | |
| Equity risk | Equity derivative contracts - Nominal amount (£m) | — | | — | | 6 | | 43 | | 2 | | 51 | |
| Interest rate/FX risk | Exchange rate contracts - Nominal amount (£m) | — | | — | | 1,173 | | 4,626 | | 650 | | 6,449 | |
| Interest rate contracts - Nominal amount (£m) | — | | — | | 585 | | 2,132 | | 208 | | 2,925 | |
| Average GBP - EUR exchange rate | — | — | 1.19 | 1.21 | 1.20 | |
| Average GBP - USD exchange rate | — | — | 1.60 | 1.50 | 1.54 | |
| Average fixed interest rate - GBP | — | | — | | 3.27 | % | 2.58 | % | 4.59 | % | |
| | | | | | | |
| 2021 | | | | | | | |
| Fair value hedges: | | | | | | | |
| Interest rate risk | Interest rate contracts - Nominal amount (£m) | 3,121 | | 6,223 | | 21,442 | | 44,644 | | 4,991 | | 80,421 | |
| Average fixed interest rate - GBP | 0.59 | % | 0.42 | % | 0.09 | % | 0.88 | % | 3.13 | % | |
| Average fixed interest rate - EUR | 0.51 | % | 1.74 | % | 1.08 | % | 0.81 | % | 2.61 | % | |
| Average fixed interest rate - USD | 1.91 | % | 0.96 | % | 1.44 | % | 2.76 | % | 4.05 | % | |
| Interest rate/FX risk | Exchange rate contracts - Nominal amount (£m) | — | | — | | 107 | | 381 | | 102 | | 590 | |
| Interest rate contracts - Nominal amount (£m) | — | | — | | — | | 193 | | 37 | | 230 | |
| Average GBP - EUR exchange rate | — | — | 1.21 | 1.16 | 1.17 | |
| Average fixed interest rate - EUR | — | | — | | 3.29 | % | 2.03 | % | 2.62 | % | |
| Cash flow hedges: | | | | | | | |
| Interest rate risk | Interest rate contracts - Nominal amount (£m) | 1,010 | | 481 | | 871 | | 7,532 | | 5,137 | | 15,031 | |
| Average fixed interest rate - GBP | 1.97 | % | 0.44 | % | 0.08 | % | 1.39 | % | 0.97 | % | |
| FX risk | Exchange rate contracts - Nominal amount (£m) | 2,703 | | 936 | | 2,057 | | 6,715 | | 2,124 | | 14,535 | |
| Interest rate contracts - Nominal amount (£m) | — | | — | | — | | 2,438 | | 887 | | 3,325 | |
| Average GBP - JPY exchange rate | — | 142.91 | 148.86 | — | — | |
| Average GBP - EUR exchange rate | 1.17 | — | 1.18 | 1.16 | 1.17 | |
| Average GBP - USD exchange rate | 1.34 | 1.34 | 1.33 | 1.34 | 1.39 | |
| Equity risk | Equity derivative contracts - Nominal amount (£m) | — | | — | | 2 | | 41 | | 4 | | 47 | |
| Interest rate/FX risk | Exchange rate contracts - Nominal amount (£m) | 620 | | — | | 840 | | 4,765 | | 1,479 | | 7,704 | |
| Interest rate contracts - Nominal amount (£m) | — | | — | | — | | 2,049 | | 924 | | 2,973 | |
| Average GBP - EUR exchange rate | 1.28 | — | 1.39 | 1.20 | 1.20 | |
| Average GBP - USD exchange rate | — | — | — | 1.61 | 1.38 | |
| Average fixed interest rate - GBP | 2.26 | % | — | | 1.17 | % | 2.72 | % | 3.41 | % | |
| | | | | | | | | | | | | | |
| Annual Report 2022 | Santander UK Group Holdings plc 217 |
| | | | | | | | | | | | | | | | | | | | | | | | | | | | | | | | | | | | | | | | | |
| Strategic Report | Sustainability and Responsible Banking | Governance | Risk review | Financial review | Financial
statements | Shareholder
information |
| | | | | | | | | | | | | |
| | | | | | | | | | | | | |
Net gains or losses arising from fair value and cash flow hedges included in other operating income
| | | | | | | | | | | |
| | | Group |
| 2022 | 2021 | 2020 |
| £m | £m | £m |
| Fair value hedging: | | | |
| Gains/(losses) on hedging instruments | 2,371 | | 846 | | (299) | |
| (Losses)/gains on hedged items attributable to hedged risks | (2,307) | | (804) | | 364 | |
| Fair value hedging ineffectiveness | 64 | | 42 | | 65 | |
| Cash flow hedging ineffectiveness | (36) | | (34) | | (46) | |
| 28 | | 8 | | 19 | |
Hedge ineffectiveness can be analysed by risk category as follows:
| | | | | | | | | | | | | | | | | | | | | | | | | | | | | | | | | | | |
| | | | | | | | | | | Group |
| | | 2022 | | | | 2021 | | | | 2020 |
| Change in FV of hedging instruments | Change in FV of hedged items | Recognised in income statement | | Change in FV of hedging instruments | Change in FV of hedged items | Recognised in income statement | | Change in FV of hedging instruments | Change in FV of hedged items | Recognised in income statement |
| Fair value hedges: | £m | £m | £m | | £m | £m | £m | | £m | £m | £m |
| | | | | | | | | | | |
| Interest rate risk | 2,382 | | (2,324) | | 58 | | | 868 | | (838) | | 30 | | | (358) | | 384 | | 26 | |
| Interest rate/FX risk | (11) | | 17 | | 6 | | | (22) | | 34 | | 12 | | | 59 | | (20) | | 39 | |
| 2,371 | | (2,307) | | 64 | | | 846 | | (804) | | 42 | | | (299) | | 364 | | 65 | |
| | | | | | | | | | | | | | | | | |
| | | | | Group |
| | Hedging Instruments | Recognised in income statement | Reclassified from reserves to income |
| Income statement line item affected by reclassification | Change in FV | Recognised in OCI |
| Cash flow hedges: | £m | £m | £m | £m |
| | | | | |
| 2022 | | | | | |
| Interest rate risk | Net interest income | (1,150) | | 1,150 | | — | | (96) | |
| FX risk | Net interest income/other operating income | 1,602 | | (1,602) | | — | | 1,691 | |
| Equity risk | Operating expenses | 2 | | (2) | | — | | 2 | |
| Interest rate/FX risk | Net interest income/other operating income | (54) | | 18 | | (36) | | 533 | |
| | 400 | | (436) | | (36) | | 2,130 | |
| 2021 | | | | | |
| Interest rate risk | Net interest income | (312) | | 306 | | (6) | | 70 | |
| FX risk | Net interest income/other operating income | (54) | | 54 | | — | | (158) | |
| Equity risk | Operating expenses | (1) | | 1 | | — | | 2 | |
| Interest rate/FX risk | Net interest income/other operating income | (542) | | 514 | | (28) | | (273) | |
| | (909) | | 875 | | (34) | | (359) | |
| 2020 | | | | | |
| Interest rate risk | Net interest income | 185 | | (179) | | 6 | | 33 | |
| FX risk | Net interest income/other operating income | (42) | | 38 | | (4) | | 2 | |
| Equity risk | Operating expenses | 2 | | (2) | | — | | (5) | |
| Interest rate/FX risk | Net interest income/other operating income | 782 | | (830) | | (48) | | 773 | |
| | 927 | | (973) | | (46) | | 803 | |
In 2022, cash flow hedge accounting of £10m (2021: £14m) had to cease due to the hedged cash flows no longer being expected to occur.
The following table provides a reconciliation by risk category of components of equity and analysis of OCI items (before tax) resulting from hedge accounting.
| | | | | | | | |
| | Group |
| 2022 | 2021 |
| £m | £m |
| Balance at 1 January | 133 | | 649 | |
| Effective portion of changes in fair value: | | |
| – Interest rate risk | (1,150) | | (306) | |
| – Foreign currency risk | 1,602 | | (54) | |
| – Equity risk | 2 | | (1) | |
| – Interest rate/foreign currency risk | (18) | | (514) | |
| 436 | | (875) | |
| Income statement transfers: | | |
| – Interest rate risk | 96 | | (70) | |
| – Foreign currency risk | (1,691) | | 158 | |
| – Equity risk | (2) | | (2) | |
| – Interest rate/foreign currency risk | (533) | | 273 | |
| (2,130) | | 359 | |
| Balance at 31 December | (1,561) | | 133 | |
| | | | | | | | | | | | | | |
| Annual Report 2022 | Santander UK Group Holdings plc 218 |
| | | | | | | | | | | | | | | | | | | | | | | | | | | | | | | | | | | | | | | | | |
| Strategic Report | Sustainability and Responsible Banking | Governance | Risk review | Financial review | Financial
statements | Shareholder
information |
| | | | | | | | | | | | | |
| | | | | | | | | | | | | |
Hedged exposures
Santander UK hedges its exposures to various risks, including interest rate risk and foreign currency risk, as set out in the following table.
| | | | | | | | | | | | | | | | | | | | | | | | | | | | | | | | | | | |
| | | | | | | | | | | Group |
| | | | | 2022 | | | | | | 2021 |
| | Accumulated amount of FV hedge adjustments | Change in value to calculate hedge ineffectiveness | | | Accumulated amount of FV hedge adjustments | Change in value to calculate hedge ineffectiveness |
| Carrying value | Hedged item | Portfolio hedge of interest rate risks | Of which Discontinued hedges | | Carrying value | Hedged item | Portfolio hedge of interest rate risks | Of which Discontinued hedges |
| £m | £m | £m | £m | £m | | £m | £m | £m | £m | £m |
| Fair value hedges | | | | | | | | | | | |
| Interest rate risk: | | | | | | | | | | | |
| Loans and advances to customers | 60,783 | | — | | (2,637) | | (651) | | (2,708) | | | 58,455 | | — | | 88 | | 500 | | (1,096) | |
| Other financial assets at amortised cost | 156 | | — | | (12) | | 2 | | (14) | | | 160 | | — | | 2 | | 3 | | (12) | |
| Reverse repurchase agreements – non trading | 4,045 | | — | | (5) | | (1) | | — | | | 9,570 | | — | | (5) | | — | | (6) | |
| Other financial assets at FVOCI | 2,325 | | (200) | | — | | 35 | | (227) | | | 3,728 | | 23 | | — | | 47 | | (112) | |
| Deposits by customers | (1,394) | | — | | 5 | | — | | 5 | | | — | | — | | — | | — | | 14 | |
| | | | | | | | | | | |
| Debt securities in issue | (5,210) | | 355 | | (95) | | (172) | | 566 | | | (4,373) | | (188) | | (115) | | (230) | | 325 | |
| Subordinated liabilities | (250) | | (27) | | (6) | | (62) | | 54 | | | (293) | | (75) | | (8) | | (70) | | 49 | |
| Interest rate/FX risk: | | | | | | | | | | | |
| Other financial assets at FVOCI | 237 | | (21) | | — | | 1 | | (9) | | | 227 | | — | | — | | 1 | | (20) | |
| Debt securities in issue | (290) | | (18) | | — | | (37) | | 27 | | | (423) | | (55) | | — | | (47) | | 55 | |
| Subordinated liabilities | 1 | | 1 | | — | | 1 | | (1) | | | 2 | | 2 | | — | | 2 | | (1) | |
| 60,403 | | 90 | | (2,750) | | (884) | | (2,307) | | | 67,053 | | (293) | | (38) | | 206 | | (804) | |
| | | | | | | | | | | | | | | | | | | | | | | | | | |
| | | | | | | | Group |
| | | | 2022 | | | | 2021 |
| | Change in value to calculate hedge ineffectiveness | Cash flow
hedge reserve | Balances on cash flow hedge reserve for discontinued hedges | | Change in value to calculate hedge ineffectiveness | Cash flow
hedge reserve | Balances on cash flow hedge reserve for discontinued hedges |
| Hedged item balance sheet line item | £m | £m | £m | | £m | £m | £m |
| Cash flow hedges: | | | | | | | | |
| Interest rate risk: | Loans and advances to customers | 925 | | (999) | | (1) | | | 236 | | (135) | | (2) | |
| Cash and balances at central banks | 233 | | (274) | | (106) | | | 71 | | (80) | | — | |
| | | | | | | | |
| Deposits by banks | (8) | | 7 | | — | | | (1) | | 1 | | — | |
| | | | | | | | |
| | | | | | | | |
| FX risk: | Other financial assets at FVOCI | — | | (6) | | — | | | (194) | | (1) | | — | |
| Not applicable – highly probable forecast transactions | (349) | | 2 | | — | | | 148 | | 1 | | — | |
| Deposits by customers | (74) | | — | | — | | | 4 | | — | | — | |
| | | | | | | | |
| Debt securities in issue | (1,142) | | (19) | | (2) | | | 90 | | 67 | | 6 | |
| Repurchase agreements - non trading | (37) | | — | | — | | | 6 | | — | | — | |
| Equity risk: | Other liabilities | (2) | | 3 | | — | | | 1 | | 3 | | — | |
| Interest rate/FX risk: | Debt securities in issue/loans and advances to customers | 55 | | (244) | | (3) | | | 503 | | 144 | | (4) | |
| Subordinated liabilities/loans and advances to customers | (37) | | (31) | | 77 | | | 11 | | 133 | | 80 | |
| | (436) | | (1,561) | | (35) | | | 875 | | 133 | | 80 | |
| | | | | | | | | | | | | | |
| Annual Report 2022 | Santander UK Group Holdings plc 219 |
| | | | | | | | | | | | | | | | | | | | | | | | | | | | | | | | | | | | | | | | | |
| Strategic Report | Sustainability and Responsible Banking | Governance | Risk review | Financial review | Financial
statements | Shareholder
information |
| | | | | | | | | | | | | |
| | | | | | | | | | | | | |
12. OTHER FINANCIAL ASSETS AT FAIR VALUE THROUGH PROFIT OR LOSS
| | | | | | | | |
| | Group |
| 2022 | 2021 |
| £m | £m |
| Loans and advances to customers: | | |
| Loans to housing associations | 4 | | 12 | |
| Other loans | 335 | | 502 | |
| 339 | | 514 | |
| Debt securities | 85 | | 112 | |
| Equity securities | 10 | | 50 | |
| 434 | | 676 | |
For the Santander UK group, other financial assets at FVTPL comprised £312m (2021: £454m) of financial assets designated at FVTPL and £122m (2021:£222m) of financial assets mandatorily held at FVTPL.
Loans and advances to customers principally represented other loans, being a portfolio of roll-up mortgages and deferred consideration following the partial sale of the portfolio. These are managed, and have their performance evaluated, on a fair value basis in accordance with a documented investment strategy, and information about them is provided on that basis to management. Since 2009, the Santander UK group’s policy has been not to designate similar new loans at FVTPL.
The net loss in the year attributable to changes in credit risk for loans and advances at FVTPL was £1m (2021: £nil, 2020: £nil). The cumulative net loss attributable to changes in credit risk for loans and advances at FVTPL at 31 December 2022 was £3m (2021: £2m).
13. LOANS AND ADVANCES TO CUSTOMERS
| | | | | | | | |
| | Group |
| 2022 | 2021 |
| £m | £m |
| Loans secured on residential properties | 188,282 | | 178,039 | |
| Corporate loans | 19,057 | | 19,282 | |
| Finance leases | 4,645 | | 3,916 | |
| | |
| Other unsecured loans | 7,742 | | 9,405 | |
| Accrued interest and other adjustments | 904 | | 656 | |
| Amounts due from fellow Banco Santander subsidiaries and joint ventures | 4,165 | | 3,080 | |
| Loans and advances to customers | 224,795 | | 214,378 | |
| Credit impairment loss allowances on loans and advances to customers | (933) | | (828) | |
| Residual value and voluntary termination provisions on finance leases | (22) | | (25) | |
| Net loans and advances to customers | 223,840 | | 213,525 | |
For movements in expected credit losses, see the 'Movement in total exposures and the corresponding ECL' table in the Santander UK group level - Credit risk review section of the Risk review.
Finance lease and hire purchase contract receivables may be analysed as follows:
| | | | | | | | | | | | | | | | | | | | | | | |
| Group |
| 2022 | | 2021 |
| Gross investment | Unearned finance income | Net investment | | Gross investment | Unearned finance income | Net investment |
| £m | £m | £m | | £m | £m | £m |
| No later than one year | 1,493 | | (182) | | 1,311 | | | 1,906 | | (5) | | 1,901 | |
| Later than one year and not later than two years | 1,367 | | (168) | | 1,199 | | | 1,324 | | (201) | | 1,123 | |
| Later than two years and not later than three years | 1,190 | | (147) | | 1,043 | | | 772 | | (141) | | 631 | |
| Later than three years and not later than four years | 1,044 | | (129) | | 915 | | | 343 | | (82) | | 261 | |
| Later than four years and not later than five years | 143 | | (18) | | 125 | | | 38 | | (38) | | — | |
| Later than five years | 59 | | (7) | | 52 | | | — | | — | | — | |
| 5,296 | | (651) | | 4,645 | | | 4,383 | | (467) | | 3,916 | |
| | | | | | | | | | | | | | |
| Annual Report 2022 | Santander UK Group Holdings plc 220 |
| | | | | | | | | | | | | | | | | | | | | | | | | | | | | | | | | | | | | | | | | |
| Strategic Report | Sustainability and Responsible Banking | Governance | Risk review | Financial review | Financial
statements | Shareholder
information |
| | | | | | | | | | | | | |
| | | | | | | | | | | | | |
The Santander UK group enters into finance leasing arrangements primarily for the financing of motor vehicles and a range of assets for its corporate customers. Included in the carrying value of net investment in finance leases and hire purchase contracts is £1,761m (2021: £1,510m) of unguaranteed RV at the end of the current lease terms, which is expected to be recovered through re-payment, re-financing or sale. Contingent rent income of £nil (2021: £nil, 2020: £nil) was earned in the year, which was classified in ‘Interest and similar income’. Finance income on the net investment in finance leases was £230m (2021: £243m, 2020: £308m).
Finance lease receivable balances are secured over the asset leased. The Santander UK group is not permitted to sell or repledge the asset in the absence of default by the lessee. The Directors consider that the carrying amount of the finance lease receivables approximates to their fair value.
Included within loans and advances to customers are advances assigned to bankruptcy remote structured entities and Abbey Covered Bonds LLP. These loans provide security to issues of covered bonds and mortgage-backed or other asset-backed securities issued by the Santander UK group. For more, see Note 14.
At 31 December 2022 and 2021, the Santander UK group had contracted with lessees for the following future undiscounted minimum lease payments receivable under operating leases.
| | | | | | | | |
| Group |
| 2022 | 2021 |
| | £m |
| No later than one year | 31 | | 31 | |
| Later than one year and not later than two years | 28 | | 27 | |
| Later than two years and not later than three years | 23 | | 22 | |
| Later than three years and not later than four years | 13 | | 15 | |
| Later than four years and not later than five years | 11 | | 11 | |
| Later than five years | 22 | | 28 | |
| 128 | | 134 | |
14. SECURITISATIONS AND COVERED BONDS
The information in this Note relates to securitisations and covered bonds for consolidated structured entities, used to obtain funding or collateral. It excludes structured entities relating to credit protection transactions.
The Santander UK group uses structured entities to securitise some of the mortgage and other loans to customers that it originates. The Santander UK group also issues covered bonds, which are guaranteed by, and secured against, a pool of the Santander UK group’s mortgage loans transferred to Abbey Covered Bonds LLP. The Santander UK group issues mortgage-backed securities, other asset-backed securities and covered bonds mainly in order to obtain diverse, low-cost funding, but also to use as collateral for raising funds via third party bilateral secured funding transactions or for liquidity purposes in the future. The Santander UK group has successfully used bilateral secured transactions as an additional form of medium-term funding; this has allowed the Santander UK group to further diversify its medium-term funding investor base.
Loans and advances to customers include portfolios of residential mortgage loans, and receivables derived from credit agreements with retail customers for the purchases of financed vehicles, which are subject to non-recourse finance arrangements. These loans and receivables have been purchased by, or assigned to, structured entities or Abbey Covered Bonds LLP, and have been funded primarily through the issue of mortgage-backed securities, other asset-backed securities or covered bonds. No gain or loss has been recognised as a result of these sales. The structured entities and Abbey Covered Bonds LLP are consolidated as subsidiary undertakings. The Company and its subsidiaries do not own directly, or indirectly, any of the share capital of any of the structured entities.
a) Securitisations
i) Master trust structures
The Santander UK group makes use of master trust structures, whereby a pool of residential mortgage loans is assigned to a trust company by the asset originator. A funding entity acquires a beneficial interest in the pool of assets held by the trust company with funds borrowed from qualifying structured entities, which at the same time issue asset-backed securities to third-party investors or the Santander UK group.
Santander UK plc and its subsidiaries receive payments from the securitisation companies in respect of fees for administering the loans, and payment of deferred consideration for the sale of the loans. Santander UK plc and its subsidiaries have no right or obligation to repurchase any securitised loan, except if certain representations and warranties given by Santander UK plc or its subsidiaries at the time of transfer are breached and, in certain cases, if there is a product switch or further advance, if a securitised loan is in arrears for over two months or if a securitised loan does not comply with regulatory requirements.
ii) Other securitisation structures
The Santander UK group also makes use of auto loan securitisations, whereby a pool of auto loans originated by a member of the Santander UK group is sold to a special purpose vehicle by the asset originator. The special purpose vehicle funds the purchase of the auto loans by issuing asset-backed securities to third-party investors. A proportion of the securities are also retained by members of the Santander UK group. Members of the Santander UK group also receive payments from the special purpose vehicle in respect of fees for administering the auto loans, and payment of deferred consideration for the sale of the auto loans. The seller has no right or obligation to repurchase any securitised loan, except if certain representations and warranties given by the seller at the time of transfer are breached and, in certain cases, if there has been a subsequent variation in the terms of the underlying auto loan not permitted under the sale agreement.
| | | | | | | | | | | | | | |
| Annual Report 2022 | Santander UK Group Holdings plc 221 |
| | | | | | | | | | | | | | | | | | | | | | | | | | | | | | | | | | | | | | | | | |
| Strategic Report | Sustainability and Responsible Banking | Governance | Risk review | Financial review | Financial
statements | Shareholder
information |
| | | | | | | | | | | | | |
| | | | | | | | | | | | | |
b) Covered bonds
Santander UK plc also issues covered bonds, which are its direct, unsecured and unconditional obligation. The covered bonds benefit from a guarantee from Abbey Covered Bonds LLP. Santander UK plc makes a term advance to Abbey Covered Bonds LLP equal to the sterling proceeds of each issue of covered bonds. Abbey Covered Bonds LLP uses the proceeds of the term advance to purchase portfolios of residential mortgage loans and their security from Santander UK plc. Under the terms of the guarantee, Abbey Covered Bonds LLP has agreed to pay an amount equal to the guaranteed amounts when the same shall become due for payment, but which would otherwise be unpaid by Santander UK plc.
c) Analysis of securitisations and covered bonds
The Santander UK group’s principal securitisation programmes and covered bond programme, together with the balances of the advances subject to securitisation (or for the covered bond programme assigned) and the carrying value of the notes in issue at 31 December 2022 and 2021 are listed below.
| | | | | | | | | | | | | | | | | | | | | | | | | | |
| Gross assets | | External notes in issue | | Notes issued to Santander UK plc/subsidiaries as collateral |
| 2022 | 2021 | | 2022 | 2021 | | 2022 | 2021 |
| £m | £m | | £m | £m | | £m | £m |
| Mortgage-backed master trust structures: | | | | | | | | |
| - Holmes | 1,646 | | 2,294 | | | 790 | | 430 | | | 176 | | 183 | |
| - Fosse | 2,028 | | 2,154 | | | 100 | | 288 | | | 1,365 | | 1,402 | |
| 3,674 | | 4,448 | | | 890 | | 718 | | | 1,541 | | 1,585 | |
| Other asset-backed securitisation structures: | | | | | | | | |
| - Motor | 6 | | 38 | | | 7 | | 41 | | | — | | — | |
| Total securitisation programmes | 3,680 | | 4,486 | | | 897 | | 759 | | | 1,541 | | 1,585 | |
| Covered bond programmes | | | | | | | | |
–Euro 35bn Global Covered Bond Programme | 21,304 | | 15,713 | | | 15,205 | | 12,760 | | | — | | — | |
| Total securitisation and covered bond programmes | 24,984 | | 20,199 | | | 16,102 | | 13,519 | | | 1,541 | | 1,585 | |
The following table sets out the internal and external issuances and redemptions in 2022 and 2021 for each securitisation and covered bond programme.
| | | | | | | | | | | | | | | | | | | | | | | | | | | | | | | | | | | |
| Internal issuances | | External issuances | | Internal redemptions | | External redemptions |
| 2022 | 2021 | | 2022 | 2021 | | 2022 | 2021 | | 2022 | 2021 |
| £bn | £bn | | £bn | £bn | | £bn | £bn | | £bn | £bn |
| Mortgage-backed master trust structures: | | | | | | | | | | | |
–Holmes | — | | — | | | 0.6 | | — | | | 0.1 | | 0.2 | | | 0.2 | | 0.4 | |
–Fosse | — | | — | | | — | | — | | | — | | — | | | 0.2 | | — | |
–Langton | — | | — | | | — | | — | | | — | | 2.4 | | | — | | — | |
| Other asset-backed securitisation structures: | | | | | | | | | | | |
–Motor | — | | — | | | — | | — | | | — | | 0.1 | | | — | | 0.1 | |
–Auto ABS UK Loans | — | | — | | | — | | — | | | — | | 0.1 | | | — | | 0.1 | |
| Covered bond programme | — | | — | | | 4.2 | | — | | | 0.1 | | — | | | 1.7 | | 6.5 | |
| — | | — | | | 4.8 | | — | | | 0.2 | | 2.8 | | | 2.1 | | 7.1 | |
In 2021 all the remaining Langton bonds were redeemed and all the remaining associated mortgages were repurchased by Santander UK plc. There was no gain or loss on redemption.
Redemptions for Auto ABS UK Loans, which were held in PSA Finance UK Limited (PSA), are included up to 30 July 2021, the date on which the Santander UK group sold its entire shareholding in PSA.
Holmes Funding Ltd has a beneficial interest of £0.8bn (2021: £0.5bn) in the residential mortgage loans held by Holmes Trustees Ltd. The remaining share of the beneficial interest in residential mortgage loans held by Holmes Trustees Ltd belongs to Santander UK plc.
Fosse Funding (No.1) Ltd has a beneficial interest of £1.5bn (2021: £1.6bn) in the residential mortgage loans held by Fosse Trustee (UK) Ltd. The remaining share of the beneficial interest in residential mortgage loans held by Fosse Trustee (UK) Ltd belongs to Santander UK plc.
The Holmes securitisation companies have cash deposits of £112m (2021: £60m), which have been accumulated to finance the redemption of a number of securities issued by the Holmes securitisation companies. The share of Holmes Funding Ltd in the trust assets is therefore reduced by this amount.
The Fosse securitisation companies have cash deposits of £108m (2021: £185m), which have been accumulated to finance the redemption of a number of securities issued by Fosse securitisation companies. The share of Fosse Funding (No.1) Ltd’s beneficial interest in the assets held by Fosse Trustee (UK) Ltd is therefore reduced by this amount.
| | | | | | | | | | | | | | |
| Annual Report 2022 | Santander UK Group Holdings plc 222 |
| | | | | | | | | | | | | | | | | | | | | | | | | | | | | | | | | | | | | | | | | |
| Strategic Report | Sustainability and Responsible Banking | Governance | Risk review | Financial review | Financial
statements | Shareholder
information |
| | | | | | | | | | | | | |
| | | | | | | | | | | | | |
15. TRANSFERS OF FINANCIAL ASSETS NOT QUALIFYING FOR DERECOGNITION
The Santander UK group enters into transactions in the normal course of business by which it transfers recognised financial assets directly to third parties or to structured entities. These transfers may give rise to the full or partial derecognition of those financial assets. Transferred financial assets that do not qualify for derecognition consist of (i) securities held by counterparties as collateral under repurchase agreements, (ii) securities lent under securities lending agreements, and (iii) loans that have been securitised under arrangements by which the Santander UK group retains a continuing involvement in such transferred assets.
As a result of these sale and repurchase and securities lending transactions, the Santander UK group is unable to use, sell or pledge the transferred assets for the duration of the transaction. The Santander UK group remains exposed to interest rate risk and credit risk on these pledged instruments. The counterparty’s recourse is not limited to the transferred assets.
The Santander UK group securitisation transfers do not qualify for derecognition. The Santander UK group remains exposed to credit risks arising from the mortgage loans or credit agreements and has retained control of the transferred assets. Circumstances in which the Santander UK group has continuing involvement in the transferred assets may include retention of servicing rights over the transferred assets (the servicing fee in respect of which is dependent on the amount or timing of the cash flows collected from, or the non-performance of, the transferred assets), entering into a derivative transaction with the securitisation vehicle, retaining an interest in the securitisation vehicle or providing a cash reserve fund. Where the Santander UK group has continuing involvement, it continues to recognise the transferred assets to the extent of its continuing involvement and recognises an associated liability. The net carrying amount of the transferred assets and associated liabilities reflects the rights and obligations that the Santander UK group has retained.
The following table analyses the carrying amount of financial assets that did not qualify for derecognition and their associated financial liabilities:
| | | | | | | | | | | | | | | | | |
| | | | | Group |
| 2022 | | 2021 |
| Assets | Liabilities | | Assets | Liabilities |
| Nature of transaction | £m | £m | £m | £m |
| Sale and repurchase agreements | 120 | | (128) | | | 171 | | (172) | |
| Securities lending agreements | 2,871 | | (2,509) | | | 1,892 | | (1,742) | |
| Securitisations (See Notes 14 and 26) | 3,680 | | (897) | | | 4,486 | | (759) | |
| 6,671 | | (3,534) | | | 6,549 | | (2,673) | |
16. REVERSE REPURCHASE AGREEMENTS – NON TRADING
| | | | | | | | |
| | Group |
| 2022 | 2021 |
| £m | £m |
| Agreements with banks | 885 | | 447 | |
| Agreements with customers | 6,463 | | 12,236 | |
| 7,348 | | 12,683 | |
17. OTHER FINANCIAL ASSETS AT AMORTISED COST
| | | | | | | | |
| | Group |
| 2022 | 2021 |
| £m | £m |
| Asset backed securities | 94 | | 443 | |
| Debt securities | 62 | | 63 | |
| 156 | | 506 | |
A significant portion of the debt securities are held in our eligible liquidity pool and consist mainly of government bonds and covered bonds. Detailed disclosures can be found in the 'Liquidity risk' section of the Risk review.
18. FINANCIAL ASSETS AT FAIR VALUE THROUGH OTHER COMPREHENSIVE INCOME
| | | | | | | | |
| | Group |
| 2022 | 2021 |
| £m | £m |
| Debt securities | 6,024 | | 5,833 | |
| Loans and advances to customers | — | | 18 | |
| 6,024 | | 5,851 | |
A significant portion of the debt securities are held in our eligible liquidity pool and consist mainly of government bonds and covered bonds. Detailed disclosures can be found in the 'Liquidity risk' section of the Risk review.
| | | | | | | | | | | | | | |
| Annual Report 2022 | Santander UK Group Holdings plc 223 |
| | | | | | | | | | | | | | | | | | | | | | | | | | | | | | | | | | | | | | | | | |
| Strategic Report | Sustainability and Responsible Banking | Governance | Risk review | Financial review | Financial
statements | Shareholder
information |
| | | | | | | | | | | | | |
| | | | | | | | | | | | | |
19. INTERESTS IN OTHER ENTITIES
| | | | | | | | |
| | Group |
| 2022 | 2021 |
| £m | £m |
| Joint Ventures | 252 | | 201 | |
| 252 | | 201 | |
The Santander UK group consists of a parent company, Santander UK Group Holdings plc, incorporated and domiciled in the UK and a number of subsidiaries and joint ventures held directly and indirectly by it.
a) Interests in subsidiaries
The Company holds directly or indirectly 100% of the issued ordinary share capital of its principal subsidiaries. All companies operate principally in their country of incorporation or registration. SFS has branch offices in Jersey and the Isle of Man.
Interests in consolidated structured entities
Structured entities are formed by Santander UK to accomplish specific and well-defined objectives. Santander UK consolidated these structured entities when the substance of the relationship indicates control, as described in Note 1. In addition to the structured entities disclosed in Note 14 which are used for securitisation and covered bond programmes, the only other structured entities consolidated by Santander UK are described below. All the external assets and liabilities in these entities are included in the financial statements and ion relevant notes. Other than as set out below, no significant judgements were required with respect to control or significant influence.
Motor Securities 2018-1 Designated Activity Company (Motor 2018)
Motor 2018 is a credit protection entity, and a Designated Activity Company limited by shares, incorporated in Ireland. It has issued a series of credit linked notes varying in seniority which reference portfolios of Santander UK group loans. Concurrently, these entity sells credit protection to Santander UK in respect of the referenced loans and, in return for a fee, is liable to make protection payments to Santander UK upon the occurrence of a credit event in relation to any of the referenced loans. Motor 2018 is consolidated as Santander UK holds a variable interest by retaining the junior tranche of notes issued by the entity.
b) Interests in joint ventures
Santander UK does not have any individually material interests in joint ventures. In 2022, Santander UK’s share in the profit after tax of its joint ventures was £36m (2021: £22m) before elimination of transactions between Santander UK and the joint ventures. At 31 December 2022, the carrying amount of Santander UK’s interest was £252m (2021: £201m). At 31 December 2022 and 2021, the joint ventures had no commitments and contingent liabilities.
c) Interests in unconsolidated structured entities
Structured entities sponsored by the Santander UK group
Santander UK has interests in structured entities which it sponsors but does not control. Santander UK considers itself a sponsor of structured entity when it facilitates the establishment of the structured entity. Other than as set out below, no significant judgements were required with respect to control or significant influence.The structured entities sponsored but not consolidated by Santander UK are as follows:
i) Santander (UK) Common Investment Fund (the Fund)
The Fund is a common investment fund that was established to hold the assets of the Santander (UK) Group Pension Scheme. The Fund is not consolidated by Santander UK, but its assets of £8,646m (2021: £14,100m) are accounted for as part of the defined benefit assets and obligations recognised on Santander UK’s balance sheet. For more on the Fund, see Note 30. As the Fund holds the assets of the pension scheme, it is outside the scope of IFRS 10. Santander UK’s maximum exposure to loss is the carrying amount of the assets held.
ii) Credit protection entities
Santander UK has established four (2021: three) unconsolidated credit protection entities, which are Designated Activity Companies limited by shares, incorporated in Ireland. Each entity has issued a series of credit linked notes varying in seniority which reference portfolios of Santander UK group loans. Concurrently, these entities sell credit protection to Santander UK in respect of the referenced loans and, in return for a fee, are liable to make protection payments to Santander UK upon the occurrence of a credit event in relation to any of the referenced loans. Senior credit linked notes, which amounted to £180m (2021: £1,184m), are issued to, and held by, Santander UK. Junior credit linked notes, which amounted to £465m (2021: £619m), are all held by third party investors and suffer losses incurred in the referenced portfolios after any tranche of risk that has been assumed by Santander UK. Funds raised by the sale of the credit linked notes are deposited with Santander UK as collateral for the credit protection.
The senior credit linked notes, along with the deposits and associated guarantees, are presented on a net basis, to reflect a legal right of set-off between the principal amounts of senior notes and the cash deposits. Deposits and associated guarantees in respect of the junior credit linked notes are included in ‘Deposits by customers’ (see Note 23). The entities are not consolidated by Santander UK because the third-party investors have the exposure, or rights, to all of the variability of returns from the performance of the entities. No assets are transferred to, or income received from, these entities. Since the credit linked notes (including those held by Santander UK) are fully cash collateralised, Santander UK’s maximum exposure to loss is equal to any unamortised fees paid to the entities in connection with the credit protection outlined above.
Structured entities not sponsored by the Santander UK group
Santander UK also has interests in structured entities which it does not sponsor or control. These consist of holdings of mortgage and other asset backed securities issued by entities that were established and/or sponsored by other unrelated financial institutions. These securities comprise the asset backed securities included in Note 17. Management has concluded that the Santander UK group has no control or significant influence over these entities and that the carrying value of the interests held in these entities represents the maximum exposure to loss.
| | | | | | | | | | | | | | |
| Annual Report 2022 | Santander UK Group Holdings plc 224 |
| | | | | | | | | | | | | | | | | | | | | | | | | | | | | | | | | | | | | | | | | |
| Strategic Report | Sustainability and Responsible Banking | Governance | Risk review | Financial review | Financial
statements | Shareholder
information |
| | | | | | | | | | | | | |
| | | | | | | | | | | | | |
20. INTANGIBLE ASSETS
a) Goodwill
| | | | | | | | | | | |
| | | Group |
| Cost | Accumulated impairment | Carrying amount |
| £m | £m | £m |
| At 31 December 2021 and 1 January 2022 | 1,285 | | (82) | | 1,203 | |
| Movement in the period | — | | (4) | | (4) | |
| At 31 December 2022 | 1,285 | | (86) | | 1,199 | |
Impairment of goodwill
In 2022 and 2021, no significant impairment of goodwill was recognised. Goodwill is tested for impairment annually at 31 December, with a review for impairment indicators at 30 June. Goodwill is tested for impairment if reviews identify an impairment indicator or when events or changes in circumstances dictate.
The annual review identified that the risks of Covid-19 have reduced significantly; however rising inflation, exacerbated by the conflict in Ukraine, places increasing uncertainty on the UK economic trajectory, and its potential impact on the carrying value of goodwill as impairment indicators for all cash-generating units (CGUs). As a result, management updated the impairment test at 31 December 2022 for all CGUs.
Basis of the recoverable amount
The recoverable amount of all CGUs was determined based on its value in use (VIU) methodology at each testing date. For each CGU, the VIU is calculated by discounting management’s cash flow projections for the CGU. The cash flow projections also take account of increased internal capital allocations needed to achieve internal and regulatory capital targets including the leverage ratio. The key assumptions used in the VIU calculation for each CGU are set out below. The Retail Banking segment consists of the Private Banking CGU and the rest of Retail Banking, known as the Personal Financial Services CGU.
Carrying amount of Goodwill by CGU and key assumptions in the VIU calculation
| | | | | | | | | | | | | | | | | | | | | | | | | | |
| Goodwill | | Discount rate | | Growth rate beyond initial cash flow projections |
| 2022 | 2021 | | 2022 | 2021 | | 2022 | 2021 |
| CGU | £m | £m | | % | % | | % | % |
| Personal Financial Services | 1,169 | | 1,169 | | | 16.6 | | 13.6 | | | 1.6 | | 1.6 | |
| Private Banking | 30 | | 30 | | | 15.3 | | 16.3 | | | 1.6 | | 1.6 | |
| Other | — | | 4 | | | | 13.6 | | | | 1.6 | |
| 1,199 | | 1,203 | | | | | | | |
The CGUs do not carry on their balance sheets any other intangible assets with indefinite useful lives.
Management’s judgement in estimating the cash flows of a CGU
The cash flow projections for the purpose of impairment testing for each CGU are derived from the latest 3-year plan presented to the Board. The Board challenges and endorses management’s planning assumptions in light of internal capital allocations needed to support Santander UK’s strategy, current market conditions and the macroeconomic outlook. For the goodwill impairment tests conducted at 31 December 2022, the determination of the carrying amount of the Personal Financial Services CGU was based on an allocation of regulatory capital and management’s cash flow projections until the end of 2025. The assumptions included in the cash flow projections reflect an allocation to the cost of capital to support future growth, as well as the expected impact of recent events in the UK economic environment on the financial outlook within which the CGUs operate. The cash flow projections are supported by Santander UK’s base case economic scenario. For more on the base case economic scenario, including our forecasting approach and the assumptions in place at 31 December 2022, see the Credit risk – Santander UK group level section of the Risk review. The cash flow projections take into account the likely impact of recent changes to the BoE Bank Rate, inflation and also consider the impact of future climate change.
Cash flow projections for the purpose of impairment testing do not take account of any adverse outcomes arising from contingent liabilities (see Note 31), whose existence will be confirmed by uncertain future events or where any obligation is not probable or otherwise cannot be measured reliably, nor do they take account of the benefits arising from Santander UK’s transformation plans that had not yet been implemented or committed at 31 December 2022.
Discount rate
The rate used to discount the cash flows is based on the cost of equity assigned to each CGU, which is derived using a capital asset pricing model (CAPM) and calculated on a post-tax basis. The CAPM depends on a number of inputs reflecting financial and economic variables, including the risk-free rate and a premium to reflect the inherent risk of the business being evaluated. These variables are based on the market’s assessment of the economic variables and management’s judgement. The inputs to the CAPM are observable on a post-tax basis. In determining the discount rate, management have identified the cost of equity associated with market participants that closely resemble our CGUs and adjusted them for tax to arrive at the pre-tax equivalent rate. The Private Banking CGU has a different discount rate compared to the Personal Financial Services CGU because different market participants closely resemble each CGU.
Growth rate beyond initial cash flow projections
The growth rate for periods beyond the initial cash flow projections is used to extrapolate the cash flows in perpetuity because of the long-term perspective of CGUs. In line with the accounting requirements, management uses the UK Government’s official estimate of UK long-term average GDP growth rate, as this is lower than management's estimate of the long-term average growth rate of the business. The estimated UK long-term average GDP growth rate has regard to the long-term impact of inherent uncertainties, such as Brexit, climate change and higher living costs, driven by high inflation and rising interest rates.
| | | | | | | | | | | | | | |
| Annual Report 2022 | Santander UK Group Holdings plc 225 |
| | | | | | | | | | | | | | | | | | | | | | | | | | | | | | | | | | | | | | | | | |
| Strategic Report | Sustainability and Responsible Banking | Governance | Risk review | Financial review | Financial
statements | Shareholder
information |
| | | | | | | | | | | | | |
| | | | | | | | | | | | | |
Goodwill arising on the acquisition of Personal Financial Services and Private Banking
The VIU of each CGU remains higher than the carrying value of the related goodwill. The VIU review at 31 December 2022 did not indicate the need for an impairment in the Company’s goodwill balances. Management considered the level of headroom and the uncertainty relating to the respective estimates of the VIU for those CGUs but determined that there was a sufficient basis to conclude that no impairment was required.
Sensitivities of key assumptions in calculating the value in use
At 31 December 2022 and 31 December 2021, the VIU of the Personal Financial Services CGU was sensitive to reasonably possible changes in the key assumptions supporting the recoverable amount.
The table below presents a summary of the key assumptions underlying the most sensitive inputs to the model for the Personal Financial Services CGU, the key risks associated with each and details of a reasonably possible change in assumptions, such as a decrease in mortgage new business. The sensitivity analysis presented below has been prepared on the basis that a change in each key assumption would not have a consequential impact on other assumptions used in the impairment review. However, due to the interrelationships between some of the assumptions, a change in one of the assumptions might impact one or more of the other assumptions and could result in a larger or smaller overall impact.
The VIU calculation is not sensitive overall to the UK long-term average GDP growth rate assumption given the amount of headroom as the increased profit after tax generated by growth of the business is mostly offset by the need to retain more profit to meet increased regulatory capital requirements driven by the growth in assets. No reasonably possible change in the growth rate assumption would have resulted in an impairment.
Reasonably possible changes in key assumptions
| | | | | | | | | | | | | | | |
| CGU | Input | Key assumptions | Associated risks | Reasonably possible change | |
| Personal Financial Services | Cash flow projections | –BoE Bank Rate –UK house price growth –UK mortgage loan market growth –UK unemployment rate –Position in the market –Regulatory capital levels. | –Uncertain market outlook –Higher interest rate environment impact on customer affordability –Customer remediation and regulatory action outcomes –Uncertain regulatory capital requirements. | –Cash flow projections decrease by 5% (2021: 5%). | |
| Discount rate | –Discount rate used is a reasonable estimate of a suitable market rate for the profile of the business. | –Market rates of interest rise. | –Discount rate increases by 100 basis points (2021: 100 basis points). | |
| | | | |
At 31 December 2022 and 31 December 2021, a reasonably possible change in the key assumptions in relation to the VIU calculation for the goodwill balance in the Personal Financial Services CGU would have resulted in a reduction in headroom as follows.
| | | | | | | | | | | |
| | Reduction in headroom |
| | 2022 | 2021 |
| CGU | Reasonably possible change | £m | £m |
| Personal Financial Services | Cash flow projections decrease by 5% (2021: 5%) | (538) | | (455) | |
| Discount rate increases by 100 basis points (2021: 100 basis points) | (887) | | (943) | |
Sensitivity of Value in use changes to current assumptions to achieve nil headroom
Although there was no impairment of goodwill relating to the Personal Financial Services CGU or the Private Banking CGU at 31 December 2022, the test for the Personal Financial Services CGU remains sensitive to some of the assumptions used, as described above. In addition, the changes in assumptions detailed below for the discount rate and cash flow projections would eliminate the current headroom. As a result, there is a risk of impairment in the future should business performance or economic factors diverge from forecasts.
In 2022, there was an increase in headroom arising from an increase in profitability and cash flows forecast as interest rates have risen, alongside a reduction in the required leverage capital requirement, which was partially offset by an increase in the discount rate.
The sensitivity analysis presented below has been prepared on the basis that a change in each key assumption would not have a consequential impact on other assumptions used in the impairment review. However, due to the interrelationships between some of the assumptions, a change in one of the assumptions might impact one or more of the other assumptions and could result in a larger or smaller overall impact.
| | | | | | | | | | | | | | | | | |
| 2022 | Carrying value | Value in use | Headroom | Increase in discount rate | Decrease in cash flows |
| CGU | £m | £m | £m | bps | % |
| Personal Financial Services | 8,860 | | 10,752 | | 1,892 | | 239 | 18 | |
| | | | | | | | | | | | | | | | | | |
| 2021 | | | | | | |
| Personal Financial Services | 8,433 | | 9,100 | | 667 | | 68 | | 7 | |
| | | | | | | | | | | | | | |
| Annual Report 2022 | Santander UK Group Holdings plc 226 |
| | | | | | | | | | | | | | | | | | | | | | | | | | | | | | | | | | | | | | | | | |
| Strategic Report | Sustainability and Responsible Banking | Governance | Risk review | Financial review | Financial
statements | Shareholder
information |
| | | | | | | | | | | | | |
| | | | | | | | | | | | | |
b) Other intangibles
| | | | | | | | | | | |
| | | Group |
| Cost | Accumulated amortisation / impairment | Carrying amount |
| £m | £m | £m |
| At 1 January 2022 | 1,346 | | (1,004) | | 342 | |
| Additions | 112 | | — | | 112 | |
| Disposals | (186) | | 186 | | — | |
| Charge | — | | (100) | | (100) | |
| Impairment | — | | (3) | | (3) | |
| At 31 December 2022 | 1,272 | | (921) | | 351 | |
| | | |
| At 1 January 2021 | 1,317 | | (871) | | 446 | |
| Additions | 83 | | — | | 83 | |
| Disposals | (54) | | 53 | | (1) | |
| Charge | — | | (159) | | (159) | |
| Impairment | — | | (27) | | (27) | |
| At 31 December 2021 | 1,346 | | (1,004) | | 342 | |
Other intangibles which consist of computer software, include computer software under development of £149m (2021: £83m), of which £33m is internally generated (2021: £31m).
The impairment charge of £3m (2021: £27m) relates to computer software no longer expected to yield future economic benefits as it has become obsolete.
21. PROPERTY, PLANT AND EQUIPMENT | | | | | | | | | | | | | | | | | | | | |
| | | | | | Group |
| Property | Office fixtures and equipment | Computer software | Operating lease assets | Right-of-use assets | Total(1) |
| £m | £m | £m | £m | £m | £m |
| Cost: | | | | | | |
| At 1 January 2022 | 981 | 1,056 | 437 | 755 | 258 | 3,487 |
| Additions | 62 | 87 | 4 | 185 | 39 | 377 |
| Reclassification to assets held for sale | (98) | (13) | — | — | — | (111) |
| Disposals | (52) | (299) | (362) | (218) | (25) | (956) |
| At 31 December 2022 | 893 | 831 | 79 | 722 | 272 | 2,797 |
| Accumulated depreciation: | | | | | | |
| At 1 January 2022 | 335 | 863 | 435 | 160 | 139 | 1,932 |
| Charge for the year | 18 | 69 | 1 | 73 | 19 | 180 |
| Impairment during the year | 8 | 2 | — | — | — | 10 |
| Reclassification to assets held for sale | (49) | (13) | — | — | — | (62) |
| Disposals | (41) | (296) | (363) | (88) | (1) | (789) |
| At 31 December 2022 | 271 | 625 | 73 | 145 | 157 | 1,271 |
| Carrying amount | 622 | 206 | 6 | 577 | 115 | 1,526 |
| | | | | | |
| Cost: | | | | | | |
| At 1 January 2021 | 1,275 | 1,362 | 436 | 720 | 222 | 4,015 |
| Additions | 126 | 28 | 1 | 284 | 65 | 504 |
| Disposals | (420) | (334) | — | (249) | (29) | (1,032) |
| At 31 December 2021 | 981 | 1,056 | 437 | 755 | 258 | 3,487 |
| Accumulated depreciation: | | | | | | |
| At 1 January 2021 | 491 | 1,053 | 434 | 178 | 119 | 2,275 |
Charge for the year(2) | 32 | 87 | 1 | 81 | 20 | 221 |
| Impairment during the year | 46 | 28 | — | — | 23 | 97 |
| Disposals | (234) | (305) | — | (99) | (23) | (661) |
| At 31 December 2021 | 335 | 863 | 435 | 160 | 139 | 1,932 |
| Carrying amount | 646 | 193 | 2 | 595 | 119 | 1,555 |
(1) Includes assets under construction of £204m (2021: £106m) and investment properties of £17m (2021: £17m). (2) Following a review of the estimated useful lives of property the charge for the year includes accelerated property depreciation of £nil (2021: £9m).
| | | | | | | | | | | | | | |
| Annual Report 2022 | Santander UK Group Holdings plc 227 |
| | | | | | | | | | | | | | | | | | | | | | | | | | | | | | | | | | | | | | | | | |
| Strategic Report | Sustainability and Responsible Banking | Governance | Risk review | Financial review | Financial
statements | Shareholder
information |
| | | | | | | | | | | | | |
| | | | | | | | | | | | | |
In 2021, we sold our current head office site in Triton Square, London to a wholly-owned subsidiary of Banco Santander SA. Property, office fixtures and equipment and right-of-use assets were impaired in the period as a result of our multi-year transformation project. The impairment relates to leasehold properties within the scope of our branch network restructuring programme and head office sites which are either closing or consolidating.
As part of our plan to be the best bank to work for in the UK, we are building a new head office in Milton Keynes to meet the flexible needs of a modern workforce. It represents a planned investment of more than £200m, funded from existing resources. Site works began in Q1 2020 with practical completion expected in April 2023. Expenditure at 31 December 2022 was approximately £204m.
22. OTHER FINANCIAL LIABILITIES AT FAIR VALUE THROUGH PROFIT OR LOSS
| | | | | | | | |
| | Group |
| 2022 | 2021 |
| £m | £m |
| US$30bn Euro Medium Term Note Programme | 3 | | 5 | |
| Structured Notes Programmes | 375 | | 413 | |
| Eurobonds | 102 | | 142 | |
| Structured deposits | 321 | | 223 | |
| Collateral and associated financial guarantees | 2 | | 20 | |
| 803 | | 803 | |
For the Santander UK group all (2021: all) of the other financial liabilities at FVTPL were designated as such.
Collateral and associated financial guarantees in the table above represent collateral received, together with associated credit protection guarantees, in respect of the proceeds of the retained senior tranches of credit linked notes described in Note 39.
Gains and losses arising from changes in the credit spread of securities issued by the Santander UK group reverse over the contractual life of the debt, provided that the debt is not repaid at a premium or a discount. The net gain during the year attributable to changes in the Santander UK group’s own credit risk on the above securities was £25m (2021: £12m loss, 2020: £3m loss). The cumulative net gain attributable to changes in the Santander UK group’s own credit risk on the above securities at 31 December 2022 was £15m (2021: £10m loss, 2020: £3m loss).
At 31 December 2022, the amount that would be required to be contractually paid at maturity of the securities above was £138m higher (2021: £nil) higher than the carrying value.
23. DEPOSITS BY CUSTOMERS
| | | | | | | | |
| | Group |
| 2022 | 2021 |
| £m | £m |
Demand and time deposits(1) | 196,160 | | 191,764 | |
| Amounts due to fellow Banco Santander subsidiaries and joint ventures | 1,153 | | 1,150 | |
| 197,313 | | 192,914 | |
(1)Includes equity index-linked deposits of £408m (2021: £549m). The capital amount guaranteed/protected and the amount of return guaranteed in respect of the equity index-linked deposits were £408m and £2m (2021: £549m and £2m) respectively.
24. DEPOSITS BY BANKS
| | | | | | | | |
| | Group |
| 2022 | 2021 |
| £m | £m |
| Items in the course of transmission | 701 | | 414 | |
| Deposits held as collateral | 1,758 | | 941 | |
Other deposits(1) | 26,084 | | 32,507 | |
| 28,543 | | 33,862 | |
(1)Includes drawdown from the TFSME of £25.0bn (2021: £31.9bn).
| | | | | | | | | | | | | | |
| Annual Report 2022 | Santander UK Group Holdings plc 228 |
| | | | | | | | | | | | | | | | | | | | | | | | | | | | | | | | | | | | | | | | | |
| Strategic Report | Sustainability and Responsible Banking | Governance | Risk review | Financial review | Financial
statements | Shareholder
information |
| | | | | | | | | | | | | |
| | | | | | | | | | | | | |
25. REPURCHASE AGREEMENTS – NON TRADING
| | | | | | | | |
| | Group |
| 2022 | 2021 |
| £m | £m |
Agreements with banks(1) | 50 | | 43 | |
Agreements with customers(1) | 7,932 | | 11,675 | |
| 7,982 | | 11,718 | |
(1) In 2022, an administrative error was identified where some repurchase agreements had been incorrectly classified as 'agreements with banks, rather than 'agreements with customers'. As a result, the balance for
2021 has been restated to reclassify £4,102m from 'agreements with banks' to 'agreements with customers'.
26. DEBT SECURITIES IN ISSUE
| | | | | | | | |
| | Group |
| 2022 | 2021 |
| £m | £m |
| Medium-term notes: | | |
| – US$30bn Euro Medium Term Note Programme | 739 | | 1,405 | |
| – Euro 30bn Euro Medium Term Note Programme | 6,435 | | 4,304 | |
| – US SEC-registered Debt Programme - Santander UK Group Holdings plc | 7,083 | | 5,978 | |
| - US SEC-registered Debt Programme - Santander UK plc | 1,276 | | 1,224 | |
| 15,533 | | 12,911 | |
| Euro 35bn Global Covered Bond Programme | 15,205 | | 12,760 | |
| US$20bn Commercial Paper Programmes | 1,851 | | 2,704 | |
| Certificates of deposit | 2,874 | | 2,387 | |
| Credit linked notes | 60 | | 59 | |
| Securitisation programmes | 897 | | 759 | |
| 36,420 | | 31,580 | |
The funding from the Euro 30bn Euro Medium Term Note Programme and the US SEC-registered Debt Programme in the name of Santander UK Group Holdings plc has mainly been downstreamed to our operating company Santander UK plc.
27. SUBORDINATED LIABILITIES
| | | | | | | | |
| Group |
| 2022 | 2021 |
| £m | £m |
| £325m Sterling preference shares | 344 | | 344 | |
| Undated subordinated liabilities | 219 | | 240 | |
| Dated subordinated liabilities | 1,769 | | 1,644 | |
| 2,332 | | 2,228 | |
In 2022, the Santander UK group repurchased certain debt securities and subordinated liabilities as part of ongoing liability management exercises, resulting in a loss of £5m (2021: a loss of £1m).
The above securities will, in the event of the winding up of the issuer, be subordinated to the claims of depositors and all other creditors of the issuer, other than creditors whose claims rank equally with, or are junior to, the claims of the holders of the subordinated liabilities. The subordination amongst each of the subordinated liabilities upon a winding up of the issuer is specified in their respective terms and conditions.
In 2022 and 2021, the Santander UK group had no defaults of principal, interest or other breaches with respect to its subordinated liabilities. No repayment or purchase by the issuer of the subordinated liabilities may be made prior to their stated maturity without the consent of the PRA.
Undated subordinated liabilities
| | | | | | | | | | | |
| Group |
| | 2022 | 2021 |
| First call date | £m | £m |
| 10.0625% Exchangeable capital securities | n/a | 205 | | 205 | |
| 7.125% 30 Year Step-up perpetual callable subordinated notes | 2030 | 14 | | 35 | |
| | 219 | | 240 | |
In common with other debt securities issued by Santander UK group companies and notwithstanding the issuer’s first call dates in the table above, in the event of certain tax changes affecting the treatment of payments of interest on subordinated liabilities in the UK, the 7.125% 30 Year Step-up perpetual callable subordinated notes are redeemable at any time, and the 10.0625% Exchangeable capital securities are redeemable on any interest payment date – each in whole at the option of Santander UK plc, at their principal amount together with any accrued interest.
| | | | | | | | | | | | | | |
| Annual Report 2022 | Santander UK Group Holdings plc 229 |
| | | | | | | | | | | | | | | | | | | | | | | | | | | | | | | | | | | | | | | | | |
| Strategic Report | Sustainability and Responsible Banking | Governance | Risk review | Financial review | Financial
statements | Shareholder
information |
| | | | | | | | | | | | | |
| | | | | | | | | | | | | |
The 10.0625% Exchangeable capital securities are exchangeable into fully paid 10.375% non-cumulative non-redeemable sterling preference shares of £1 each, at the option of Santander UK plc, on the business day immediately following any interest payment date.
Dated subordinated liabilities
| | | | | | | | | | | |
| Group |
| | 2022 | 2021 |
| Maturity | £m | £m |
| 5% Subordinated notes (US$1,500m) | 2023 | 591 | | 548 | |
| 4.75% Subordinated notes (US$1,000m) | 2025 | 608 | | 541 | |
| 7.95% Subordinated notes (US$1,000m) | 2029 | 207 | | 221 | |
| 6.50% Subordinated notes | 2030 | 22 | | 28 | |
| 5.875% Subordinated notes | 2031 | 7 | | 9 | |
| 5.625% Subordinated notes (US$500m) | 2045 | 334 | | 297 | |
| | 1,769 | | 1,644 | |
The dated subordinated liabilities are redeemable in whole at the option of Santander UK plc in the event of certain tax changes affecting the treatment of payments of interest on the subordinated liabilities in the UK, at their principal amount together with any accrued interest.
Each of the subordinated liabilities issued by Santander UK Group Holdings plc has been downstreamed to Santander UK plc by means of Santander UK plc issuing equivalent subordinated liabilities to Santander UK Group Holdings plc.
28. OTHER LIABILITIES
| | | | | | | | |
| | Group |
| 2022 | 2021 |
| £m | £m |
| Lease liabilities | 129 | 134 |
Other(1) | 2,472 | 1,942 |
| 2,601 | 2,076 |
(1) For more information on amounts restated see Note 44.
29. PROVISIONS
| | | | | | | | | | | | | | | | | | | | | | | | | | |
| | | | | | | | Group |
| Customer remediation | Litigation and other regulatory | Bank Levy | Property | ECL on undrawn facilities and guarantees | Restructuring | Other | Total |
|
| £m | £m | £m | £m | £m | £m | £m | £m |
| At 1 January 2022 | 44 | | 166 | | 1 | | 74 | | 38 | | 29 | | 14 | | 366 | |
| Additional provisions (See Note 8) | 77 | | 137 | | 49 | | — | | 36 | | 23 | | 196 | | 518 | |
| Provisions released (See Note 8) | (18) | | (18) | | (4) | | (7) | | — | | — | | (11) | | (58) | |
| Utilisation and other | (13) | | (149) | | (60) | | (20) | | — | | (30) | | (192) | | (464) | |
Recharge(1) | — | | — | | 18 | | — | | — | | — | | — | | 18 | |
| At 31 December 2022 | 90 | | 136 | | 4 | | 47 | | 74 | | 22 | | 7 | | 380 | |
(1) Recharge in respect of the UK Bank Levy paid on behalf of other UK entities in the Banco Santander group
Provisions expected to be settled within no more than 12 months after 31 December 2022 were £130m (2021: £182m).
a) Customer remediation
Provisions of £77m were recognised in 2022 for two customer remediation exercises relating to our historical mortgage book. Most of the provision relates to the proposed refund of early repayment charges paid by a specific group of customers who historically switched mortgage products The provision remains subject to change as additional data becomes available and remediation boundaries are finalised.
At 31 December 2022 there was no customer remediation provision (2021: £6m) for a systems-related historical issue identified by Santander UK, relating to compliance with certain requirements of the Consumer Credit Act (CCA). The remediation is now complete with all customers having been contacted.
| | | | | | | | | | | | | | |
| Annual Report 2022 | Santander UK Group Holdings plc 230 |
| | | | | | | | | | | | | | | | | | | | | | | | | | | | | | | | | | | | | | | | | |
| Strategic Report | Sustainability and Responsible Banking | Governance | Risk review | Financial review | Financial
statements | Shareholder
information |
| | | | | | | | | | | | | |
| | | | | | | | | | | | | |
b) Litigation and other regulatory
Litigation and other regulatory provisions principally comprised amounts in respect of litigation and other regulatory charges, operational loss and operational risk provisions, and related expenses. A number of uncertainties exist with respect to these provisions given the uncertainties inherent in litigation and other regulatory matters, that affect the amount and timing of any potential outflows with respect to which provisions have been established. These provisions are reviewed at least quarterly. The majority of the 2022 charge is the settlement of a financial penalty of £108m with the FCA for shortcomings in our anti-money laundering controls.
Although the deadline for bringing PPI complaints has passed, customers can still commence Plevin related litigation. Amounts include a provision of £24m for the best estimate of any obligation to pay compensation in respect of current stock and estimated future claims. There are ongoing factual issues to be resolved regarding such litigation which may have legal consequences including the volume and quality of future litigation claims. As a result, the extent of the potential liability and amount of any compensation to be paid remains uncertain.
The balance also included an amount in respect of our best estimate of the liability relating to a legal dispute regarding allocation of responsibility for a specific PPI portfolio of complaints, further described in Note 31. No further information on the best estimate is provided on the basis that it would be seriously prejudicial.
c) Bank Levy
A rate of 0.10% applied for 2022 (2021: 0.10%).
d) Property
Property provisions include leasehold vacant property provisions, dilapidation provisions for leased properties within the scope of IFRS 16 and decommissioning and disposal costs relating to vacant freehold properties. Leasehold vacant property provisions are made by reference to an estimate of any expected sub-let income, compared to the head rent, and the possibility of disposing of Santander UK’s interest in the lease, taking into account conditions in the property market.
e) ECL on undrawn facilities and guarantees
Provisions include expected credit losses relating to guarantees given to third parties and undrawn loan commitments.
f) Restructuring
Restructuring provisions relate to severance costs associated with transformation and organisational changes. The provision includes a charge of £19m as part of our multi-year transformation programme to improve future returns, focused on simplifying, digitising and automating the bank.
g) Other
Other provisions do not fit into any of the other categories, such as some categories of operational losses, including fraud losses. In 2022, Other provisions included charges for operational risk provisions of £186m, including fraud losses of £153m.
30. RETIREMENT BENEFIT PLANS
The amounts recognised in the balance sheet were as follows:
| | | | | | | | |
| Group |
| 2022 | 2021 |
| £m | £m |
| Assets/(liabilities) | | |
| Funded defined benefit pension scheme - surplus | 1,051 | | 1,573 | |
| | |
| Unfunded pension and post-retirement medical benefits | (25) | | (37) | |
| Total net assets | 1,026 | | 1,536 | |
Remeasurement losses/(gains) recognised in other comprehensive income in the year were as follows:
| | | | | | | | | | | |
| | | Group |
| 2022 | 2021 | 2020 |
| £m | £m | £m |
| Pension remeasurement | 723 | | (1,263) | | 505 | |
a) Defined contribution pension plans
The majority of employees are members of a defined contribution Master Trust, LifeSight. This is the plan into which eligible employees are enrolled automatically. The assets of LifeSight are held in separate trustee-administered funds. Funds arising from Additional Voluntary Contributions (AVCs) are largely held within the main defined benefit scheme operated by the Santander UK group.
An expense of £60m (2021: £65m) was recognised for defined contribution plans in the period and is included in staff costs within operating expenses (see Note 6).
b) Defined benefit pension schemes
The Santander UK group operates a number of defined benefit pension schemes. The main scheme is the Santander (UK) Group Pension Scheme (the Scheme). It comprises seven legally segregated sections. The Scheme covers 10% (2021: 11%) of the Santander UK group’s current employees and is a funded defined benefit scheme which is closed to new members.
The corporate trustee of the Scheme is Santander (UK) Group Pension Scheme Trustees Limited (the Trustee), a private limited company incorporated in 1996 and a wholly owned subsidiary of Santander UK Group Holdings plc. The principal duty of the Trustee is to act in the best interests of the members of the Scheme. The Trustee board comprises six (2021: five) Directors selected by Santander UK Group Holdings plc, plus four (2021: five) member-nominated Directors selected from eligible members who apply for the role.
The assets of the funded schemes including the Scheme are held independently of the Santander UK group’s assets in separate trustee administered funds. Investment strategy across the sections of the Scheme remains under regular review. Investment decisions are delegated by the Trustee to a common investment
| | | | | | | | | | | | | | |
| Annual Report 2022 | Santander UK Group Holdings plc 231 |
| | | | | | | | | | | | | | | | | | | | | | | | | | | | | | | | | | | | | | | | | |
| Strategic Report | Sustainability and Responsible Banking | Governance | Risk review | Financial review | Financial
statements | Shareholder
information |
| | | | | | | | | | | | | |
| | | | | | | | | | | | | |
fund, managed by Santander (CF Trustee) Limited, a private limited company owned by ten Trustee directors, who are the same as the directors of the Trustee. The Santander (CF Trustee) Limited directors’ principal duty, within the investment powers delegated to them, is to act in the best interest of the members of the Scheme. Ultimate responsibility for investment policy and strategy rests with the Trustee of the Scheme who is required under the Pensions Act 2004 to prepare a statement of investment principles. The defined benefit pension schemes expose the Santander UK group to risks such as investment risk, interest rate risk, longevity risk and inflation risk. The Santander UK group does not hold any insurance policies over the defined benefit pension schemes and has not entered into any significant transactions with them.
Formal actuarial valuations of the assets and liabilities of the defined benefit schemes are carried out on at least a triennial basis by independent professionally qualified actuaries and valued for accounting purposes at each balance sheet date. The Scheme Trustee is responsible for the actuarial valuations and in doing so considers, or relies in part on, a report of a third-party expert. The latest formal actuarial valuation for the Scheme at 31 March 2022 was finalised in November 2022, with an overall scheme deficit of £183m. The next scheduled triennial funding valuation will be at 31 March 2025. Any funding surpluses can be recovered by Santander UK plc from the Scheme through refunds as the Scheme is run off over time or could be used to pay for the cost of benefits which are accruing.
The main differences between the assumptions used for assessing the defined benefit liabilities for the funding valuation and those used for IAS 19 are that the financial and demographic assumptions used for the funding valuation are generally more prudent than those used for the IAS 19 valuation.
The total amount charged to the income statement was as follows:
| | | | | | | | | | | |
| | | Group |
| 2022 | 2021 | 2020 |
| £m | £m | £m |
| Net interest income | (31) | | (5) | | (10) | |
| Current service cost | 30 | | 38 | | 36 | |
| Past service and GMP costs | — | | — | | 1 | |
| Past service curtailment costs | 0 | | 5 | | — | |
| Administration costs | 9 | | 8 | | 8 | |
| 8 | | 46 | | 35 | |
The amounts recognised in other comprehensive income were as follows:
| | | | | | | | | | | |
| | | Group |
| 2022 | 2021 | 2020 |
| £m | £m | £m |
| Return on plan assets (excluding amounts included in net interest expense) | 5,531 | | (452) | | (1,328) | |
| Actuarial (gains)/losses arising from changes in demographic assumptions | (122) | | (17) | | 34 | |
| Actuarial (gains)/losses arising from experience adjustments | 481 | | (19) | | (141) | |
| Actuarial (gains)/losses arising from changes in financial assumptions | (5,167) | | (775) | | 1,940 | |
| Pension remeasurement | 723 | | (1,263) | | 505 | |
Movements in the present value of defined benefit scheme obligations were as follows:
| | | | | | | | |
| Group |
| 2022 | 2021 |
| £m | £m |
| At 1 January | (12,884) | | (13,894) | |
| Current service cost paid by Santander UK plc | (29) | | (29) | |
| Current service cost paid by other subsidiaries | (1) | | (9) | |
| Current service cost paid by fellow Banco Santander subsidiaries | — | | — | |
| Interest cost | (241) | | (188) | |
| Employer salary sacrifice contributions | (3) | | (9) | |
| Past service cost | — | | — | |
| Past service curtailment costs | — | | (5) | |
| GMP equalisation cost | — | | — | |
| Remeasurement due to actuarial movements arising from: | | |
| – Changes in demographic assumptions | 122 | | 17�� | |
| – Experience adjustments | (481) | | 19 | |
| – Changes in financial assumptions | 5,167 | | 775 | |
| Benefits paid | 413 | | 398 | |
| Derecognition of pension scheme liabilities arising from the sale of PSA | — | | 41 | |
| At 31 December | (7,937) | | (12,884) | |
| | | | | | | | | | | | | | |
| Annual Report 2022 | Santander UK Group Holdings plc 232 |
| | | | | | | | | | | | | | | | | | | | | | | | | | | | | | | | | | | | | | | | | |
| Strategic Report | Sustainability and Responsible Banking | Governance | Risk review | Financial review | Financial
statements | Shareholder
information |
| | | | | | | | | | | | | |
| | | | | | | | | | | | | |
Movements in the fair value of the schemes’ assets were as follows:
| | | | | | | | |
| Group |
| 2022 | 2021 |
| £m | £m |
| At 1 January | 14,420 | | 13,987 | |
| Interest income | 272 | | 193 | |
| Contributions paid by employer and scheme members | 224 | | 247 | |
| Contributions paid by fellow Banco Santander subsidiaries | — | | — | |
| Administration costs paid | (9) | | (8) | |
| Return on plan assets (excluding amounts included in net interest expense) | (5,531) | | 452 | |
| Benefits paid | (413) | | (398) | |
| Derecognition of pension scheme assets arising from the sale of PSA | — | | (53) | |
| At 31 December | 8,963 | | 14,420 | |
The composition and fair value of the schemes’ assets by category was:
| | | | | | | | | | | | | | | | | | | | | | | | | | | | | | | | |
| | | | | | | | | | Group |
| Quoted prices in active markets | | Prices not quoted in active markets | | Total | | Valuation |
| 2022 | £m | % | | £m | % | | £m | % | | technique |
| | | | | | | | | | |
| Overseas equities | — | — | | | 1,172 | 13 | | | 1,172 | 13 | | | A,C |
| Corporate bonds | 1,991 | 22 | | | 244 | 3 | | | 2,235 | 25 | | | A,C |
| Government fixed interest bonds | 1,138 | 13 | | | — | — | | | 1,138 | 13 | | | A |
| Government index-linked bonds | 5,525 | 62 | | | — | — | | | 5,525 | 62 | | | A |
| Property | — | — | | | 1,202 | 13 | | | 1,202 | 13 | | | B |
| Derivatives | — | — | | | (78) | (1) | | | (78) | (1) | | | A |
| Cash | — | — | | | 1,340 | 15 | | | 1,340 | 15 | | | A |
Repurchase agreements(1) | — | — | | | (4,312) | (48) | | | (4,312) | (48) | | | A |
| Infrastructure | — | — | | | 426 | 5 | | | 426 | 5 | | | B,C |
| Annuities | — | — | | | 298 | 3 | | | 298 | 3 | | | D |
| Longevity swap | — | — | | | (12) | — | | | (12) | — | | | D |
| Other | — | — | | | 29 | — | | | 29 | — | | | C |
| 8,654 | 97 | | | 309 | 3 | | | 8,963 | 100 | | | |
| 2021 | | | | | | | | | | |
| UK equities | 38 | — | | | — | — | | | 38 | — | | | A |
| Overseas equities | 1,401 | 10 | | | 1,065 | 7 | | | 2,466 | 17 | | | A,C |
| Corporate bonds | 1,607 | 11 | | | 312 | 2 | | | 1,919 | 13 | | | A,C |
| Government fixed interest bonds | 2,788 | 19 | | | — | — | | | 2,788 | 19 | | | A |
| Government index-linked bonds | 9,159 | 64 | | | — | — | | | 9,159 | 64 | | | A |
| Property | — | — | | | 1,409 | 10 | | | 1,409 | 10 | | | B |
| Derivatives | — | — | | | (83) | (1) | | | (83) | (1) | | | A |
| Cash | — | — | | | 2,290 | 16 | | | 2,290 | 16 | | | A |
Repurchase agreements(1) | — | — | | | (6,582) | (45) | | | (6,582) | (45) | | | A |
| Infrastructure | — | — | | | 390 | 3 | | | 390 | 3 | | | B,C |
| Annuities | — | — | | | 298 | 2 | | | 298 | 2 | | | D |
| Longevity swap | — | — | | | (8) | — | | | (8) | — | | | D |
| Other | — | — | | | 336 | 2 | | | 336 | 2 | | | C |
| 14,993 | 104 | | | (573) | (4) | | | 14,420 | 100 | | | |
(1) Sale and repurchase agreements net of purchase and resale agreements.
| | | | | | | | | | | | | | |
| Annual Report 2022 | Santander UK Group Holdings plc 233 |
| | | | | | | | | | | | | | | | | | | | | | | | | | | | | | | | | | | | | | | | | |
| Strategic Report | Sustainability and Responsible Banking | Governance | Risk review | Financial review | Financial
statements | Shareholder
information |
| | | | | | | | | | | | | |
| | | | | | | | | | | | | |
Valuation techniques
The main methods for measuring the fair value of the Scheme’s assets at 31 December 2022 and 2021 are set out below.
A.The asset valuation is provided by the asset manager. The valuation is based on observable market data, and where relevant is typically based on bid price values, or the single price if only one price is available.
B.The underlying asset valuations are prepared by an independent expert, adjusted for any cash movements where necessary since the latest valuation.
C.Assets are valued by reference to the latest manager statements provided by the managers, adjusted for any cash movements since the latest valuation.
D.Assets relating to insured liabilities are valued by the actuaries based on our year-end accounting assumptions.
The ‘Other’ category includes hedge fund investments.
A number of insurance transactions have been entered into that have been included in the asset valuation under annuities and Longevity swap. The transactions were as follows:.
–In May 2020 a pensioner buy-in was entered into by the Trustee. This transaction insured 100% of the SMA section pensioner liabilities and 50% of the SPI section pensioner liabilities based on membership in the Scheme at 31 December 2018.
–In March 2021, the Trustee entered into a longevity swap. Approximately 85% of pensioner liabilities were covered by the longevity swap at inception, excluding pensioners in the SMA and SPI sections.
–In 2022, a pensioner buy-in was entered into by the Trustee covering pensioners in the SMA and SPI sections who were uninsured at 30 June 2021.
–In July 2022, the Trustee entered into a second longevity swap, extending the insurance over uninsured pensioners in the same membership groups covered by the first swap transacted in March 2021, based on membership in the Scheme at 31 December 2021.
At 31 December 2022, as highlighted above, the Scheme was invested in certain assets whose values are not based on market observable data, such as the investments in unquoted equities and bonds, as well as property, infrastructure and hedge funds. The valuation of these assets relies on unobservable data as these assets do not have a readily available quoted price in an active market. A large proportion of the property is directly held and valued using a bespoke valuation method taking both the nature of the properties and the tenancy schedules as inputs to derive the fair value. Where there is a time lag between the net asset value and the balance sheet date, management adjusts the value of the assets for any cash movements. Due diligence has been conducted to ensure the values obtained in respect of these assets are appropriate and represent fair value. Given the nature of these investments, we are unable to prepare sensitivities on how their values could vary as market conditions or other variables change.
A strategy is in place to manage interest rate and inflation risk relating to the liabilities. The Scheme prior to 31 December 2022 invested in equities and had an equity collar in place to manage equity risk. The Scheme also hedges a proportion of its foreign exchange exposure to manage currency risk. At 31 December 2022 the equity collar had a notional value of £3m (2021: £1,259m) and the currency forwards had a notional value of £985m (2021: £2,296m). Significant asset de-risking took place in 2022, with the Scheme divesting entirely from listed equities, as well as its multi-asset funds. Significant investments were made in quoted corporate bonds over the year, largely funded from these sales. The sale proceeds also went to de-leveraging the asset portfolio. The Trustee has established the Sustainability Committee which is responsible for overseeing the Scheme’s policies, regulatory obligations and priorities in respect of climate change and wider Environmental, Social and Governance (ESG) related matters. This includes the monitoring of climate change related risks and opportunities, scenario analysis and monitoring of investments from an ESG perspective.
The Santander UK group’s pension schemes did not directly hold any equity securities of the Company or any of its related parties at 31 December 2022 and 2021. The Santander UK group’s pension scheme assets do not include any property or other assets that are occupied or used by the Santander UK group.
The Santander UK group's employee pension funds recognise the magnitude of the challenges that climate and energy transition pose to governments, companies and civil society. They are also aware of their impact on the ability to comply with their fiduciary duty providing long-term risk-adjusted returns to their members. They have committed to a target of net zero by 2050, showing their full support for the Santander UK group's vision, commitment to sustainability and climate change.
Funding
In November 2022, in compliance with the Pensions Act 2004, the Trustee and the Santander UK group agreed to a new recovery plan in respect of the Scheme and a schedule of contributions following the finalisation of the 31 March 2022 actuarial valuation. The funding target for this actuarial valuation is for the Scheme to have sufficient assets to make payments to members in respect of the accrued benefits as and when they fall due. In accordance with the terms of the Trustee agreement in place at the time, the Santander UK group contributed £218m in 2022 (2021: £241m) to the Scheme, of which £178m (2021: £194m) was in respect of agreed deficit repair contributions. The agreed schedule of the Santander UK group’s contributions to the Scheme covers the period up to 31 March 2026 and comprises of contingent contributions which become due if the funding position of any section falls behind the agreed plan. The Santander UK group also meets Scheme administration expenses. The funding valuation is used to judge the amount of cash contributions the Santander UK group needs to put into the pension scheme. It will always be different to the IAS 19 accounting deficit, which is an accounting rule concerning employee benefits and shown on the balance sheet of our financial statements.
Actuarial assumptions
The principal actuarial assumptions used for the Scheme were:
| | | | | | | | | | | |
| Group |
| 2022 | 2021 | 2020 |
| % | % | % |
To determine benefit obligations(1): | | | |
| – Discount rate for scheme liabilities | 4.9 | | 1.9 | | 1.3 | |
| – General price inflation | 3.1 | | 3.4 | | 3.0 | |
| – General salary increase | 1.0 | | 1.0 | | 1.0 | |
| – Expected rate of pension increase | 3.0 | | 3.2 | | 2.9 | |
| | | | | | | | | | | | | | |
| Annual Report 2022 | Santander UK Group Holdings plc 234 |
| | | | | | | | | | | | | | | | | | | | | | | | | | | | | | | | | | | | | | | | | |
| Strategic Report | Sustainability and Responsible Banking | Governance | Risk review | Financial review | Financial
statements | Shareholder
information |
| | | | | | | | | | | | | |
| | | | | | | | | | | | | |
| | | | | | | | | | | |
| Years | Years | Years |
| Longevity at 60 for current pensioners, on the valuation date: | | | |
| – Males | 27.4 | 27.5 | 27.5 |
| – Females | 30.1 | 30.1 | 30.0 |
| Longevity at 60 for future pensioners currently aged 40, on the valuation date: | | | |
| – Males | 28.9 | 29.0 | 29.0 |
| – Females | 31.6 | 31.6 | 31.5 |
(1) The discount rate and inflation related assumptions set out in the table above reflect the assumptions calculated based on the Scheme’s duration and cash flow profile as a whole. The actual
assumptions used were determined for each section independently based on each section’s duration and cash flow profile.
Discount rate for scheme liabilities
The rate used to discount the retirement benefit obligation for accounting purposes is based on the annual yield at the balance sheet date of high-quality corporate bonds on that date. There are only a limited number of higher quality Sterling-denominated corporate bonds, particularly those that are longer-dated. Therefore, in order to set a suitable discount rate, we need to construct a corporate bond yield curve. In 2022, management updated the model used to construct the curve following a review of the Scheme's IAS 19 assumptions. The model which we use to construct the curve uses corporate bond data but excludes convertible bonds, asset-backed bonds and government related bonds. The curve is then constructed from this data by extrapolating the spot rates from 30 years to 50 years by holding the spread above nominal gilt spot rates constant. From 50 years onwards, it is assumed that spot rates remain constant. When considering an appropriate assumption, we project forward the expected cash flows of each section of the Scheme and adopt a single equivalent cash flow weighted discount rate for each section, subject to management judgement.
General price inflation
Consistent with our discount rate methodology, we set the inflation assumption using the expected cash flows for each section of the Scheme, fitting them to an inflation curve to give a weighted average inflation assumption. We then deduct an inflation risk premium to reflect the compensation holders of fixed rate instruments expect to receive for taking on the inflation risk. This premium is subject to a cap, to better reflect management’s view of inflation expectations. In 2022, management refined the general price inflation assumption following a review of the Scheme’s IAS 19 assumptions, to reflect a different data set and different methodology used to construct the curve.
General salary increase
From 1 March 2015, a cap on pensionable pay increases of 1% each year was applied to staff in the Scheme.
Expected rate of pension increase
The pension increase assumption methodology uses a stochastic model, which is calibrated to consider both the observed historical volatility term structure and derivative pricing. The model allows for the likelihood that high or low inflation in one-year feeds into inflation remaining high or low in the next year.
Mortality assumptions
The mortality assumptions are based on an independent analysis of the Scheme’s actual mortality experience, carried out as part of the triennial actuarial valuation, together with recent evidence from the Continuous Mortality Investigation. An allowance is then made for expected future improvements to life expectancy based on the Continuous Mortality Investigation Tables. Following this review the S3 Medium all pensioner mortality table was adopted with appropriate adjustments to reflect the actual mortality experience. For future improvements, at 31 December 2022 the CMI 2021 projection model was adopted, with model parameters selected having had regard to the Scheme’s membership profile with an initial addition to improvements of 0.25%per annum, together with a long-term rate of future improvements to life expectancy of 1.25% for male and female members. No weight was placed on the 2020 data in the model, reflecting the uncertainty regarding whether, and how much, 2020 mortality data reflects likely future experience. A modest weight of 10% was placed on the 2021 data in the model, reflecting the likelihood of sustained indirect impacts of the pandemic. Both the mortality table and the projection model are published by the Continuous Mortality Investigation.
In 2022, the methodology for setting the demographic assumptions was changed to better represent current expectations, following a review carried out by the Trustee as part of the 2022 triennial valuation. These reviews resulted in changes in the assumptions for family statistics, early retirement and the withdrawal assumption.
Actuarial assumption sensitivities
The sensitivity analyses below have been determined based on reasonably possible changes of the respective assumptions occurring at the end of the reporting period, while holding all other assumptions constant.
| | | | | | | | | | | | | | |
| Change in pension obligation at year end from | (Decrease)/increase |
| 2022 | 2021 | 2022 | 2021 |
| Assumption | | | £m | £m |
| Discount rate | 50 bps increase | 25 bps increase | (501) | (571) |
| General price inflation | 50 bps increase | 25 bps increase | 374 | 392 |
| Mortality | Each additional year of longevity assumed | Each additional year of longevity assumed | 203 | 478 |
The 50bps sensitivity to the inflation assumption includes the corresponding impact of changes in future pension increase assumptions before and after retirement. The sensitivity analysis presented above may not be representative of the actual change in the defined benefit obligation as it is unlikely that the changes in assumptions would occur in isolation of one another as some of the assumptions may be correlated. Furthermore, in presenting the sensitivity analysis, the present value of the defined benefit obligation has been calculated using the projected unit credit method at the end of the reporting period, which is the same method used to calculate the defined benefit obligation recognised in the balance sheet. There were no changes in the methods and assumptions used in preparing the sensitivity analyses from prior years.
| | | | | | | | | | | | | | |
| Annual Report 2022 | Santander UK Group Holdings plc 235 |
| | | | | | | | | | | | | | | | | | | | | | | | | | | | | | | | | | | | | | | | | |
| Strategic Report | Sustainability and Responsible Banking | Governance | Risk review | Financial review | Financial
statements | Shareholder
information |
| | | | | | | | | | | | | |
| | | | | | | | | | | | | |
The benefits expected to be paid in each of the next five years, and in the aggregate for the five years thereafter are:
| | | | | |
| Year ending 31 December | £m |
| 2023 | 416 | |
| 2024 | 360 | |
| 2025 | 382 | |
| 2026 | 404 | |
| 2027 | 425 | |
| Five years ending 2032 | 2,325 | |
The average duration of the defined benefit obligation at 31 December 2022 was 14.2 years (2021: 18.3 years).
Emerging risks
Actions taken in 2022 to reduce asset risk, in line with the agreements already in place with the Trustee, served to improve the Scheme’s resilience to market volatility. In 2022, the risks considered in relation to Covid-19 related mainly to the suitability of our long-term mortality assumption for our IAS 19 and funding valuations.
The focus in 2022 shifted to the risks arising from the conflict in Ukraine, rising interest rates, the 2022 actuarial valuation, together with market volatility driven by the UK political landscape. The Santander UK group has collaborated with the Trustee to identify and monitor such risks and ensure they were adequately managed.
31. CONTINGENT LIABILITIES AND COMMITMENTS
| | | | | | | | |
| | Group |
| | 2022 | 2021 |
| | £m | £m |
| Guarantees given to third parties | 448 | | 363 | |
| Formal standby facilities, credit lines and other commitments | 31,410 | | 37,385 | |
| | | 31,858 | | 37,748 | |
At 31 December 2022, the Santander UK group had credit impairment loss provisions relating to guarantees given to third parties and undrawn loan commitments. See Note 29 for more details.
Where the items set out below can be reliably estimated, they are disclosed in the table above.
Capital support arrangements
At 31 December 2022 , Santander UK plc, Cater Allen Limited, Santander ISA Managers Limited and certain other non-regulated subsidiaries of Santander UK plc were party to a capital support deed entered into on 17 December 2021 and effective from 1 January 2022 (the RFB Sub-Group Capital Support Deed). These parties were permitted by the PRA to form a core UK group as defined in the PRA Rulebook, a permission which expires on 31 December 2024. Exposures of each of the regulated entities to other members of the core UK group are exempt from large exposure limits that would otherwise apply and these exposures are risk-weighted at 0%. Where applicable this permission also provides for intra-group exposures to be excluded from the leverage exposure measure. The purpose of the RFB Sub-Group Capital Support Deed is to facilitate the prompt transfer of available capital resources from, or repayment of liabilities by, the non-regulated parties to any of the regulated parties in the event that one of the regulated parties breached or was at risk of breaching its capital resources or risk concentrations requirements.
At 31 December 2022, Santander UK Group Holdings plc and Santander Financial Services plc, the regulated entities, and Santander Equity Investments Limited were party to a capital support deed entered into on 17 December 2021 and effective from 1 January 2022 (the Non-RFB Sub-Group Capital Support Deed). These parties were permitted by the PRA to form a core UK group as defined in the PRA Rulebook, a permission which expires on 31 December 2024. Exposures of each of the regulated entities to other members of the core UK group are exempt from large exposure limits that would otherwise apply and these exposures are risk-weighted at 0%. Where applicable this permission also provides for intra-group exposures to be excluded from the leverage exposure measure. The purpose of the Non-RFB Sub-Group Capital Support Deed is to facilitate the prompt transfer of available capital resources from, or repayment of liabilities by, the non-regulated parties to any of the regulated parties in the event that one of the regulated parties breached or was at risk of breaching its capital resources or risk concentrations requirements.
Liquidity support arrangements
We monitor and manage liquidity risk for the Santander UK plc group and Santander Financial Services plc separately. Under this model, and the PRA’s liquidity rules, Santander UK plc and its subsidiary Cater Allen Limited form the RFB Domestic Liquidity Sub-group (the RFB DoLSub), which allows the entities to collectively meet regulatory requirements for the purpose of managing liquidity risk. Each member of the RFB DoLSub will support the other by transferring surplus liquidity in times of stress.
| | | | | | | | | | | | | | |
| Annual Report 2022 | Santander UK Group Holdings plc 236 |
| | | | | | | | | | | | | | | | | | | | | | | | | | | | | | | | | | | | | | | | | |
| Strategic Report | Sustainability and Responsible Banking | Governance | Risk review | Financial review | Financial
statements | Shareholder
information |
| | | | | | | | | | | | | |
| | | | | | | | | | | | | |
Guarantees given to third parties
Guarantees given to third parties consist primarily of letters of credit, bonds and guarantees granted as part of normal product facilities which are offered to customers.
Formal standby facilities, credit lines and other commitments
Ongoing assessments are made to ensure that credit limits remain appropriate considering any change in the security value or the customer’s financial circumstances. For unsecured overdraft facilities and credit cards, the facilities are granted based on new business risk assessment and are reviewed more frequently based on internal, as well as external data. Corporate facilities can comprise standby and revolving facilities which are subject to ongoing compliance with covenants and may require the provision of agreed security.
FSCS
The FSCS is the UK’s independent statutory compensation fund for customers of authorised financial services firms and pays compensation if a firm is unable to pay certain claims against it. The FSCS is funded by levies on the industry and recoveries and borrowings where appropriate.
Loan representations and warranties
In connection with the securitisations and covered bond transactions described in Note 14, the Santander UK group entities selling the relevant loans into the applicable securitisation or covered bond portfolios make representations and warranties with respect to such loans, in each case as of the date of the sale of the loans into the applicable portfolio. These representations and warranties cover, among other things, the ownership of the loan by the relevant Santander UK group entity, absence of a material breach or default by the relevant borrower under the loan, the loan’s compliance with applicable laws and absence of material disputes with respect to the relevant borrower, asset and loan. The specific representations and warranties made by Santander UK group companies which act as sellers of loans in these securitisations and covered bond transactions depend in each case on the nature of the transaction and the requirements of the transaction structure. In addition, market conditions and credit rating agency requirements may affect the representations and warranties required of the relevant Santander UK group companies in these transactions.
In the event that there is a material breach of the representations and warranties given by Santander UK plc as seller of loans under the residential mortgage-backed securitisations or the covered bond programmes included in Note 14, or if such representations and warranties prove to be materially untrue at the date when they were given (being the sale date of the relevant mortgage loans), Santander UK plc may be required to repurchase the affected mortgage loans (generally at their outstanding principal balance plus accrued interest). These securitisations and covered bond programmes are collateralised by prime residential mortgage loans. Santander UK plc is principally a retail prime lender and has no appetite or product offering for any type of sub-prime business. In addition, Santander UK plc’s credit policy explicitly prohibits such lending.
Similarly, under the auto loan securitisations in Note 14, in the event that there is a breach or inaccuracy in respect of a representation or warranty relating to the loans, the relevant Santander UK group entity who sold the auto loans into the securitisation portfolio will be required to repurchase such loans from the structure (also at their outstanding principal balance plus accrued interest). In addition to breaches of representation and warranties, under the auto loan securitisations, the seller may also have a repurchase obligation if certain portfolio limits are breached (which include, amongst other things, limits as to the size of a loan given to an individual customer, LTV ratio, average term to maturity and average seasoning).
In the case of a repurchase of a loan from the relevant securitisation or covered bond programmes, the Santander UK group may bear any subsequent credit loss on such loan. The Santander UK group manages and monitors its securitisation and covered bond activities closely to minimise potential claims.
Other legal actions and regulatory matters
Santander UK engages in discussion, and co-operates, with the FCA, PRA, CMA and other regulators and government agencies in various jurisdictions in their supervision and review of Santander UK including reviews exercised under statutory powers, regarding its interaction with past and present customers, both as part of general thematic work and in relation to specific products, services and activities. During the ordinary course of business, Santander UK is also subject to complaints and threatened legal proceedings brought by or on behalf of current or former employees, customers, investors or other third parties, in addition to legal and regulatory reviews, challenges and tax or enforcement investigations or proceedings in various jurisdictions. All such matters are assessed periodically to determine the likelihood of Santander UK incurring a liability.
In those instances where it is concluded that it is not yet probable that a quantifiable payment will be made, for example because the facts are unclear or further time is required to fully assess the merits of the case or to reasonably quantify the expected payment, no provision is made. In addition, where it is not currently practicable to estimate the possible financial effect of these matters, no provision is made.
FCA civil regulatory investigation into Santander UK plc financial crime systems, processes and controls, and compliance with the Money Laundering Regulations 2007
In December 2022, we paid a £108m financial penalty to settle the FCA's enforcement investigation into the anti-money laundering systems and controls in our Business Banking division in the period between 31 December 2012 and 18 October 2017. The settlement concluded the FCA's investigation.
| | | | | | | | | | | | | | |
| Annual Report 2022 | Santander UK Group Holdings plc 237 |
| | | | | | | | | | | | | | | | | | | | | | | | | | | | | | | | | | | | | | | | | |
| Strategic Report | Sustainability and Responsible Banking | Governance | Risk review | Financial review | Financial
statements | Shareholder
information |
| | | | | | | | | | | | | |
| | | | | | | | | | | | | |
Payment Protection Insurance
In relation to a specific PPI portfolio of complaints, a legal dispute regarding allocation of liability is in its early stages. The dispute relates to the liability for PPI mis-selling complaints relating to pre-2005 PPI policies underwritten by AXA France IARD and AXA France Vie (together, AXA France - previously Financial Insurance Company Ltd and Financial Assurance Company Ltd respectively) and involves Santander Cards UK Limited (a former GE Capital Corporation entity and distributor of pre-2005 PPI known as GE Capital Bank Limited which was acquired by Banco Santander SA in 2008 and subsequently transferred to Santander UK plc) and a Banco Santander SA subsidiary Santander Insurance Services UK Limited (together the Santander Entities). During the relevant period, AXA France were owned by Genworth Financial International Holdings, Inc (Genworth).
In September 2015, AXA SA acquired AXA France from Genworth. In July 2017, the Santander Entities notified AXA France that they did not accept liability for losses on PPI policies relating to the relevant period. Santander UK plc entered into a Complaints Handling Agreement (CHA) with AXA France pursuant to which it agreed to handle complaints on their behalf, and AXA France agreed to pay redress assessed to be due to relevant policyholders on a without prejudice basis. A standstill agreement was entered into between the Santander Entities and AXA France as a condition of the CHA.
In July 2020, Genworth announced that it had agreed to pay AXA SA circa £624m in respect of PPI mis-selling losses in settlement of the related dispute concerning obligations under the sale and purchase agreement pursuant to which Genworth sold AXA France to AXA SA. The CHA between Santander UK plc and AXA France terminated on 26 December 2020. On 30 December 2020, AXA France provided written notice to the Santander Entities to terminate the standstill agreement. During 2021, AXA France commenced litigation against the Santander Entities seeking recovery of £636m and any further losses relating to pre-2005 PPI. Judgment in respect of the Santander Entities application for AXA France’s claim to be struck out/summarily dismissed, was handed down by the Commercial Court on 12 July 2022. In summary, the Commercial Court upheld a significant part of the Santander Entities’ strike-out application, striking out AXA France’s claim for contribution against Santander for alleged losses and requiring AXA France to re-plead a significant portion of its other pleadings. AXA France updated the amount of losses claimed from £636m to £670m in their Amended Particulars of Claim dated 21 October 2022. Overall, the dispute remains at an early stage and there are ongoing factual issues to be resolved which may have legal consequences including in relation to liability. These issues create uncertainties which mean that it is difficult to reliably predict the outcome or the timing of the resolution of the matter. The litigation and other regulatory provision in Note 29 includes our best estimate of the Santander Entities’ liability to the specific portfolio. Further information has not been provided on the basis that it would be seriously prejudicial to the Santander Entities’ interests in connection with the dispute.
In addition, and in relation to PPI more generally the PPI provision includes an amount relating to legal claims challenging the FCA’s industry guidance on the treatment of Plevin / recurring non-disclosure assessments. This provision is based on current stock levels, future projected claims, and average redress. There remains a risk that volumes received in future may be higher than forecast. The provision in Note 29 includes our best estimate of Santander UK’s liability for the specific issue. The actual cost of customer compensation could differ from the amount provided. It is not currently practicable to provide an estimate of the risk and amount of any further financial impact.
German dividend tax arbitrage transactions
In June 2018 the Cologne Criminal Prosecution Office and the German Federal Tax Office commenced an investigation in relation to the historical involvement of Santander UK plc, Santander Financial Services plc and Cater Allen International Limited (all subsidiaries of Santander UK Group Holdings plc) in German dividend tax arbitrage transactions (known as cum/ex transactions). These transactions allegedly exploited a loophole of a specific German settlement mechanism through short-selling and complex derivative structuring which resulted in the German government either refunding withholding tax where such tax had not been paid or refunding it more than once. The German authorities are investigating numerous institutions and individuals in connection with alleged transactions and practices which may be found to be illegal under German law.
During 2022 we continued to cooperate with the German authorities and, with the assistance of external experts, to progress an internal investigation into the matters in question. From Santander UK plc’s perspective, the investigation is focused principally on the period 2009-2011 and remains on-going. There remain factual issues to be resolved which may have legal consequences including potentially material financial penalties. These issues create uncertainties which mean that it is difficult to predict the resolution of the matter including timing or the significance of the possible impact. These uncertainties mean it is not currently possible to make a reliable assessment of the size of any related potential liability.
Taxation
The Santander UK group engages in discussion, and co-operates, with HM Revenue & Customs (HMRC) in their oversight of the Santander UK group’s tax matters. The Santander UK group adopted the UK’s Code of Practice on Taxation for Banks in 2010.
Certain leases in which the Santander UK group is or was the lessor have been under review by HMRC in connection with claims for tax allowances. Under the terms of the lease agreements, the Santander UK group is fully indemnified in all material respects by the respective lessees for any liability arising from the disallowance of tax allowances plus accrued interest. During 2021, an outline agreement in principle in respect of a number of these lease arrangements was reached directly between the lessee and HMRC. This agreement was executed in April 2022, resulting in a final payment by the lessee to HMRC and the conclusion of HMRC’s review. There is no financial impact for the Santander UK group.
| | | | | | | | | | | | | | |
| Annual Report 2022 | Santander UK Group Holdings plc 238 |
| | | | | | | | | | | | | | | | | | | | | | | | | | | | | | | | | | | | | | | | | |
| Strategic Report | Sustainability and Responsible Banking | Governance | Risk review | Financial review | Financial
statements | Shareholder
information |
| | | | | | | | | | | | | |
| | | | | | | | | | | | | |
Other
On 2 November 2015, Visa Europe Ltd agreed to sell 100% of its share capital to Visa Inc. The deal closed on 21 June 2016. As a member and shareholder of Visa Europe Ltd, Santander UK received upfront consideration made up of cash and convertible preferred stock. Conversion of the preferred stock into Class A Common Stock of Visa Inc. depends on the outcome of litigation against Visa involving UK & Ireland (UK&I) multilateral interchange fees (MIFs). Following ring-fencing, all Visa stock is now held by Santander Equity Investments Limited (SEIL), outside the ring-fenced bank. In valuing the preferred stock, SEIL makes adjustments for illiquidity and the potential for changes in the conversion rate due to litigation costs. In June 2020, the Supreme Court issued a judgement finding that MIFs restricted competition, and this resulted in a change to the calculation of the fair value adjustments. There has been no change to the fair value adjustment in 2022.
In September 2020, pursuant to the scheduled release assessment, Visa released half of the value of the convertible preferred stock. As a result of this release, SEIL was issued with 5,211 units of Series A Convertible Participating Preferred Stock (Series A Preferred Stock). This Series A Preferred Stock was subsequently sold for £82m.
In July 2022, pursuant to the scheduled release assessment, Visa released just over half of the value of the remaining convertible preferred stock. As a result of this release, SEIL was issued with 2,516 units of Series A Preferred Stock. In 2022, SEIL sold all 2,516 units of Series A Preferred Stock for £41.6m. SEIL therefore had no units of Series A Preferred Stock remaining at 31 December 2022. Following the scheduled release assessment, SEIL re-estimated the changes to the conversion rate of the remaining convertible preferred stock in the scenario that losses relating to UK&I MIFs exceed €1bn.
In addition, Santander UK and certain other UK&I banks have agreed to indemnify Visa Inc. in the event that the preferred stock is insufficient to meet the costs of this litigation. Visa Inc. has recourse to this indemnity once more than €1bn of losses relating to UK&I MIFs have arisen or once the total value of the preferred stock issued to UK&I banks on closing has been reduced to nil. Whilst Santander UK's liability under this indemnity is capped at €39.85m, Visa Inc. may have recourse to a general indemnity in place under Visa Europe Operating Regulations for damages not satisfied through the above mechanism. At this stage, it is unclear whether the litigation will give rise to more than €1bn of losses relating to UK&I MIFs which means it is difficult to predict the resolution of the matter including the timing or the significance of the possible impact.
As part of the sale of subsidiaries, businesses and other entities, and as is normal in such circumstances, entities within the Santander UK group have given warranties and indemnities to the purchasers.
Obligations under stock borrowing and lending agreements
Obligations under stock borrowing and lending agreements represent contractual commitments to return stock borrowed. These obligations are offset by a contractual right to receive stock under other contractual agreements. See Note 35.
Other off-balance sheet commitments
The Santander UK group has commitments to lend at fixed interest rates which expose us to interest rate risk. For more, see the Risk review.
32. SHARE CAPITAL
| | | | | | | | |
| | Group |
| Ordinary shares
of £1 each |
| Issued and fully paid share capital | No. | £m |
| At 31 December 2021, 1 January 2022 and 31 December 2022 | 7,060,000,000 | 7,060 | |
33. OTHER EQUITY INSTRUMENTS
| | | | | | | | | | | | | | |
| | | | Group |
| Interest rate
| | 2022 | 2021 |
| % | Next call date | £m | £m |
| AT1 securities: | | | | |
| - £500m Fixed Rate Reset Perpetual AT1 Capital Securities | 6.75 | | June 2024 | 496 | | 496 | |
| - £750m Fixed Rate Reset Perpetual AT1 Capital Securities | 7.375 | | June 2022 | — | | 745 | |
| - £500m Fixed Rate Reset Perpetual AT1 Capital Securities | 6.30 | | March 2025 | 500 | | 500 | |
| - £450m Fixed Rate Reset Perpetual AT1 Capital Securities | 4.25 | | March 2026 | 450 | | 450 | |
| - £750m Fixed Rate Reset Perpetual AT1 Capital Securities | 6.50 | | June 2027 | 750 | | — | |
| | | 2,196 | | 2,191 | |
AT1 securities
The AT1 securities are perpetual and pay a quarterly distribution. At each distribution payment date, the Company can decide whether to pay the distribution, which is non-cumulative, in whole or in part. The distribution rate resets every five years. The securities will be automatically written down and the investors will lose their entire investment in the securities should the CET1 capital ratio of the Santander UK prudential consolidation group fall below 7%.
All AT1 securities are redeemable at the option of the Company, and only with the consent of the PRA.
The £450m 4.25% Fixed Rate Reset Perpetual AT1 Capital Securities and the £500m 6.30% Fixed Rate Reset Perpetual AT1 Capital Securities were fully subscribed by the Company’s immediate parent company, Banco Santander SA. £100m of the £750m 7.375% Fixed Rate Reset Perpetual AT1 Capital Securities were subscribed by Banco Santander SA.
In June 2022, Santander UK Group Holdings plc purchased and redeemed the £750m 7.375% Fixed Rate Reset Perpetual AT1 Capital Securities and issued £750m 6.50% Fixed Rate Reset Perpetual AT1 Capital Securities, which were fully subscribed by the Company’s immediate parent company, Banco Santander SA. The original securities were redeemed at par and £5m of transaction costs that were recognised against the proceeds from the original securities were transferred to retained earnings.
| | | | | | | | | | | | | | |
| Annual Report 2022 | Santander UK Group Holdings plc 239 |
| | | | | | | | | | | | | | | | | | | | | | | | | | | | | | | | | | | | | | | | | |
| Strategic Report | Sustainability and Responsible Banking | Governance | Risk review | Financial review | Financial
statements | Shareholder
information |
| | | | | | | | | | | | | |
| | | | | | | | | | | | | |
34. NOTES TO CASH FLOWS
Changes in liabilities arising from financing activities
The table below shows the changes in liabilities arising from financing activities. The changes in equity arising from financing activities are set out in the Consolidated Statement of Changes in Equity.
| | | | | | | | | | | | | | | | | | | | |
| | | | | | Group |
| Balance sheet line item | | | |
| | Debt securities in issue | Subordinated liabilities | Other equity instruments | Lease liabilities | Dividends paid | Total |
| 2022 | £m | £m | £m | £m | £m | £m |
| At 1 January | 31,580 | 2,228 | 2,191 | 134 | — | 36,133 |
| Proceeds from issue of debt securities | 8,667 | — | — | — | — | 8,667 |
| Repayment of debt securities | (4,482) | — | — | — | — | (4,482) |
| | | | | | |
| Repayment of subordinated liabilities | — | (40) | — | — | — | (40) |
| Issue of other equity instruments | — | — | 750 | — | — | 750 |
| Repurchase of other equity instruments | — | — | (750) | — | — | (750) |
| Principal elements of lease payments | — | — | — | (26) | — | (26) |
| Dividends paid | — | — | — | — | (1,173) | (1,173) |
| Liability-related other changes | (1,282) | 2 | 5 | 21 | — | (1,254) |
| Non-cash changes: | | | | | | |
| – Unrealised foreign exchange | 1,893 | 190 | — | — | — | 2,083 |
| – Other changes | 44 | (47) | — | — | 1,173 | 1,169 |
| At 31 December | 36,420 | 2,332 | 2,196 | 129 | — | 41,077 |
| | | | | | | | | | | | | | | | | | | | |
| | | | |
| | | | | | |
| 2021 | | | | | | |
| At 1 January | 43,679 | 2,556 | 2,241 | 100 | — | 48,576 |
| Proceeds from issue of debt securities | 2,847 | — | — | — | — | 2,847 |
| Repayment of debt securities | (13,724) | — | — | — | — | (13,724) |
| Repayment of subordinated liabilities | — | (4) | — | — | — | (4) |
| Issue of other equity instruments | — | — | 450 | — | — | 450 |
| Repurchase of other equity instruments | — | — | (500) | — | — | (500) |
| Principal elements of lease payments | — | — | — | (25) | — | (25) |
| Dividends paid | — | — | — | — | (1,506) | (1,506) |
| Liability-related other changes | (473) | (4) | — | 59 | — | (418) |
| Non-cash changes: | | | | | | |
| – Unrealised foreign exchange | (930) | 14 | — | — | — | (916) |
| – Other changes | 181 | (334) | — | — | 1,506 | 1,353 |
| At 31 December | 31,580 | 2,228 | 2,191 | 134 | — | 36,133 |
| | | | | | | | | | | | | | | | | | | | |
| | | | |
| | | | | | |
| 2020 | | | | | | |
| At 1 January | 50,171 | 3,528 | 2,241 | 138 | — | 56,078 |
| Proceeds from issue of debt securities | 5,586 | — | — | — | — | 5,586 |
| Repayment of debt securities | (12,348) | — | — | — | — | (12,348) |
| Repayment of subordinated liabilities | — | (939) | — | — | — | (939) |
| Principal elements of lease payments | — | — | — | (46) | — | (46) |
| Dividends paid | — | — | — | — | (282) | (282) |
| Liability-related other changes | (243) | (10) | — | 8 | — | (245) |
| Non-cash changes: | | | | | | |
| – Unrealised foreign exchange | 359 | (6) | — | — | — | 353 |
| – Other changes | 154 | (17) | — | — | 282 | 419 |
| At 31 December | 43,679 | 2,556 | 2,241 | 100 | — | 48,576 |
Footnotes to the cash flow statement
Net cash flows from operating activities includes interest received of £6,618m (2021: £4,873m, 2020: £5,176m), interest paid of £2,107m (2021: £1,085m, 2020: £1,900m) and dividends received of £nil (2021: £nil, 2020: £nil).
Total cash outflow for leases was £28m (2021: £28m, 2020: £49m).
| | | | | | | | | | | | | | |
| Annual Report 2022 | Santander UK Group Holdings plc 240 |
| | | | | | | | | | | | | | | | | | | | | | | | | | | | | | | | | | | | | | | | | |
| Strategic Report | Sustainability and Responsible Banking | Governance | Risk review | Financial review | Financial
statements | Shareholder
information |
| | | | | | | | | | | | | |
| | | | | | | | | | | | | |
Restatements in the consolidated cash flow statement
The presentation of the consolidated cash flow statement has changed to present 'profit before tax' within cash flows from operating activities instead of 'profit after tax'. Prior periods have been restated. As a result, for the year ended 31 December 2021 and 31 December 2020, the adjustment for 'corporation tax charge' in 'non-cash items included in profit' within cash flows from operating activities has been decreased by £497m and £114m respectively.
Following a decision by the IFRS Interpretations Committee in April 2022, Santander UK updated its accounting policy to exclude from cash and cash equivalents Reserves Collateralisation Accounts (RCAs) balances held at the BoE relating to Santander UK’s participation in certain payments schemes. Instead, RCAs balances are classified as restricted balances and included within 'change in operating assets' in the cash flow statement. Prior periods have been restated. As a result, opening cash and cash equivalents at 1 January 2022 and 1 January 2021 have been restated by £1,580m and £985m respectively. At 31 December 2021, cash and cash equivalents were reduced by £1,580m and restricted balances were increased by £1,580m. At 31 December 2020, cash and cash equivalents were reduced by £985m and restricted balances were increased by £985m. The net change in cash and balances at central banks was restated as a result of a decrease in cash inflows from operating activities of £595m in 2021(2020: increase of £95m).
Other matters
As set out in Note 45, during 2022, the non-controlling interests were redeemed. In addition, in 2021, there was a disposal of non-controlling interests of £181m.
35. ASSETS CHARGED AS SECURITY FOR LIABILITIES AND COLLATERAL ACCEPTED AS SECURITY FOR ASSETS
The following transactions are conducted under terms that are usual and customary to collateralised transactions including, where relevant, standard securities lending and repurchase agreements.
a) Assets charged as security for liabilities
The financial assets below are analysed between those assets accounted for on-balance sheet and off-balance sheet.
| | | | | | | | |
| Group |
| 2022 | 2021 |
| £m | £m |
| On-balance sheet: | | |
| Cash and balances at central banks | 1,330 | | 1,580 | |
| Loans and advances to banks | 163 | | 478 | |
| Loans and advances to customers - securitisations and covered bonds (See Note 14) | 24,155 | | 19,432 | |
| Loans and advances to customers - other | 32,011 | | 41,953 | |
| Other financial assets at amortised cost | 35 | | — | |
| Financial assets at fair value through other comprehensive income | 4,441 | | 4,435 | |
| Total on-balance sheet | 62,135 | | 67,878 | |
| Total off-balance sheet | 9,184 | | 14,449 | |
The Santander UK group provides assets as collateral in the following areas of the business.
Sale and repurchase agreements
The Santander UK group also enters into sale and repurchase agreements and similar transactions of debt securities. Upon entering into such transactions, the Santander UK group provides collateral in excess of the borrowed amount. The carrying amount of assets that were so provided at 31 December 2022 was £11,553m (2021: £15,368m), of which £900m (2021: £639m) was classified within ‘Loans and advances to customers – securitisations and covered bonds’ in the table above.
Securitisations and covered bonds
As described in Note 14, Santander UK plc and certain of its subsidiaries issue securitisations and covered bonds. At 31 December 2022, there were £24,984m (2021: £20,199m) of gross assets in these secured programmes and £829m (2021: £767m) of these related to internally retained issuances that were available for use as collateral for liquidity purposes in the future.
At 31 December 2022, a total of £1,725m (2021: £1,855m) of notes issued under securitisation and covered bond programmes had been retained internally, a proportion of which had been used as collateral via third party bilateral secured funding transactions, which totalled £500m at 31 December 2022 (2021: £500m), or for use as collateral for liquidity purposes in the future.
Stock borrowing and lending agreements
Asset balances under stock borrowing and lending agreements represent stock lent by the Santander UK group. These balances amounted to £34,963m at 31 December 2022 (2021: £46,007m) and are offset by contractual commitments to return stock borrowed or cash received.
Derivatives business
In addition to the arrangements described above, collateral is also provided in the normal course of derivative business to counterparties. At 31 December 2022 £1,548m (2021: £2,159m) of such collateral in the form of cash had been provided by the Santander UK group and is included in the table.
| | | | | | | | | | | | | | |
| Annual Report 2022 | Santander UK Group Holdings plc 241 |
| | | | | | | | | | | | | | | | | | | | | | | | | | | | | | | | | | | | | | | | | |
| Strategic Report | Sustainability and Responsible Banking | Governance | Risk review | Financial review | Financial
statements | Shareholder
information |
| | | | | | | | | | | | | |
| | | | | | | | | | | | | |
b) Collateral accepted as security for assets
The collateral held as security for assets, analysed between those liabilities accounted for on balance sheet and off-balance sheet, was:
| | | | | | | | |
| Group |
| 2022 | 2021 |
| £m | £m |
| On-balance sheet: | | |
| Deposits by banks | 1,758 | | 941 | |
| Total on-balance sheet | 1,758 | | 941 | |
| Total off-balance sheet | 10,395 | | 18,240 | |
Purchase and resale agreements
The Santander UK group also enters into purchase and resale agreements and similar transactions of debt securities. Upon entering into such transactions, the Santander UK group receives collateral in excess of the loan amount. The level of collateral held is monitored daily and if required, further calls are made to ensure the market values of collateral remains at least equal to the loan balance. The subsidiaries are permitted to sell or repledge the collateral held in the absence of default. At 31 December 2022, the fair value of such collateral received was £8,628m (2021: £14,562m). Of the collateral received, almost all was sold or repledged. The subsidiaries have an obligation to return collateral that they have sold or pledged.
Stock borrowing and lending agreements
Obligations representing contractual commitments to return stock borrowed by the Santander UK group amounted to £1,767m at 31 December 2022 (2021: £3,678m) and are offset by a contractual right to receive stock lent.
Derivatives business
In addition to the arrangements described, collateral is also received from counterparties in the normal course of derivative business. At 31 December 2022, £1,758m (2021: £941m) of such collateral in the form of cash had been received by the Santander UK group and is included in the table.
Lending activities
In addition to the collateral held as security for assets, the Santander UK group may obtain a charge over a customer’s property in connection with its lending activities. Details of these arrangements are set out in the ‘Credit risk’ section of the Risk review.
36. SHARE-BASED COMPENSATION
The Santander UK group operates share schemes and arrangements for eligible employees. The main current schemes are the Sharesave Schemes, the Deferred Shares Bonus Plan, the Partnership Shares scheme and the Transformation Incentive Plan. All share options and awards relate to shares in Banco Santander SA.
The amount charged to the income statement in respect of share-based payment transactions is set out in Note 6.
At 31 December 2022, the carrying amount of liabilities arising from share-based payment transactions, excluding any cash element was £6.6m (2021: £3.7m), of which £0.1m had vested at 31 December 2022 (2021: £0.4m).
a) Sharesave Schemes
The Santander UK group launched its fifteenth HM Revenue & Customs approved Sharesave invitation under Banco Santander SA sponsorship in September 2022. Sharesave invitations have been offered since 2008 under broadly similar terms. Under the Sharesave Scheme’s HMRC-approved savings limits, eligible employees may enter into contracts to save between £5 and £500 per month. For all schemes, at the end of a fixed term of three or five years after the grant date, the employees can use these savings to buy shares in Banco Santander SA at a discount, calculated in accordance with the rules of the scheme. The option price is calculated as the average middle market quoted price of Banco Santander SA shares over the first three dealing days prior to invitation and discounted by up to 20%. This year a 10% discount was applied. The vesting of awards under the scheme depends on continued employment with the Banco Santander group. Participants in the scheme have six months from the date of vesting to exercise the option.
The table below summarises movements in the number of options, and changes in weighted average exercise price over the same period.
| | | | | | | | | | | | | | | | | |
| | 2022 | | | 2021 |
| Number of options | Weighted average exercise price | | Number of options | Weighted average exercise price |
| ‘000 | £ | | ‘000 | £ |
| Outstanding at 1 January | 25,993 | | 2.25 | | | 21,162 | | 2.32 | |
| Granted | 13,068 | | 1.89 | | | 9,414 | | 2.43 | |
| Exercised | (242) | | 1.69 | | | (48) | | 1.86 | |
| Forfeited/expired | (8,831) | | 2.59 | | | (4,535) | | 2.95 | |
| Outstanding at 31 December | 29,988 | | 2.00 | | | 25,993 | | 2.25 | |
| Exercisable at 31 December | 3,439 | | 3.22 | | | 1,321 | | 2.75 | |
The weighted average share price at the date the options were exercised was £2.34 (2021: £2.65).
| | | | | | | | | | | | | | |
| Annual Report 2022 | Santander UK Group Holdings plc 242 |
| | | | | | | | | | | | | | | | | | | | | | | | | | | | | | | | | | | | | | | | | |
| Strategic Report | Sustainability and Responsible Banking | Governance | Risk review | Financial review | Financial
statements | Shareholder
information |
| | | | | | | | | | | | | |
| | | | | | | | | | | | | |
The following table summarises the range of exercise prices and weighted average remaining contractual life of the options at 31 December 2022 and 2021.
| | | | | | | | | | | | | | | | | |
| | 2022 | | | 2021 |
| Weighted average remaining contractual life | Weighted average exercise price | | Weighted average remaining contractual life | Weighted average exercise price |
| Range of exercise prices | Years | £ | | Years | £ |
| £1 to £2 | 3 | 1.79 | | | 3 | 1.65 | |
| £2 to £3 | 2 | 2.56 | | | 3 | 2.81 | |
| £3 to £4 | 1 | 3.46 | | | 1 | 3.38 | |
| £4 to £5 | 0 | 4.02 | | | 1 | 4.02 | |
The fair value of each option at the date of grant is estimated using an analytical model that also reflects the correlation between EUR and GBP. This model uses assumptions on the share price, the EUR/GBP FX rate, the EUR/GBP risk-free interest rate, dividend yields, the expected volatilities of both the underlying shares and EUR/GBP for the expected lives of options granted. The weighted average grant-date fair value of options granted during the year was £0.23 (2021: £0.20).
b) Deferred shares bonus plan
Deferred bonus awards are designed to align employee performance with shareholder value and encourage increased retention of senior employees. Those employees who are designated as Material Risk Takers receive part of their annual bonus as a deferred award comprising 50% in shares, and 50% in cash. Either 40% (for any variable pay award of less than £500,000) or 60% (for any variable pay award greater than £500,000) is deferred over a four, five or seven year period from the anniversary of the initial award. Deferred bonus awards in shares are subject to an additional one-year retention period from the point of delivery. Any deferred awards are dependent on continued employment and subject to Santander UK's discretion, and the vesting of deferred bonus awards are subject to risk and performance adjustment.
c) Partnership Shares scheme
A Partnership Shares scheme is operated for eligible employees under the Share Incentive Plan (SIP) umbrella. Participants can choose to invest up to £1,800 per tax year (or no more than 10% of an employee’s salary for the tax year) from pre-tax salary to buy Banco Santander SA shares. Shares are held in trust for the participants. There are no vesting conditions attached to these shares, and no restrictions as to when the shares can be removed from the trust. However, if a participant chooses to sell the shares before the end of five years, they will be liable for the taxable benefit received when the shares are taken out of the trust. The shares can be released from trust after five years free of income tax and national insurance contributions. 3,974,698 shares were outstanding at 31 December 2022 (2021: 3,618,796 shares).
d) Transformation Incentive Plan
This is a one-off long-term incentive plan which is designed to recognise the achievement of financial targets and an enhanced customer experience, whilst maintaining appropriate conduct controls and risk management, over the course of our transformation period.
Awards under the plan will be assessed over the period 1 January 2021 to 31 December 2023. Awards are granted half in cash and half in share-based units (linked to the Banco Santander SA share price), and will vest in accordance with regulatory requirements. The total value of share-based awards granted in 2022 was £1m and the liability arising from share-based payment transactions, excluding any cash element was £1.8m.
37. TRANSACTIONS WITH DIRECTORS AND OTHER KEY MANAGEMENT PERSONNEL
The Directors of Santander UK Group Holdings plc did not receive any remuneration in respect of their services to the Company. The remuneration disclosures in these financial statements reflect their remuneration in respect of the Santander UK plc group.
a) Remuneration of Directors and Other Key Management Personnel
The remuneration of the Directors and Other Key Management Personnel (KMP) of the Santander UK group is set out in aggregate below.
| | | | | | | | | | | |
| 2022 | 2021 | 2020 |
| Directors’ remuneration | £ | £ | £ |
Salaries and fees(1) | 4,037,116 | | 3,828,333 | | 3,913,865 | |
Performance-related payments(2) | 3,701,569 | | 3,431,294 | | 479,037 | |
| Other fixed remuneration (allowances and non-cash benefits) | 906,201 | | 806,103 | | 1,047,986 | |
| Expenses | 13,004 | | 3,705 | | 2,579 | |
| Total remuneration | 8,657,890 | | 8,069,435 | | 5,443,467 | |
| | | | | | | | | | | |
| 2022 | 2021 | 2020 |
| Directors' and Other Key Management Personnel compensation | £ | £ | £ |
Short-term employee benefits(2) | 15,641,669 | | 18,831,380 | | 16,106,627 | |
| Post-employment benefits | 740,333 | | 913,842 | | 1,832,544 | |
Compensation for loss of office(3) | 1,540,400 | | — | | 275,000 | |
| Total compensation | 17,922,402 | | 19,745,222 | | 18,214,171 | |
(1)2021 and 2020 salaries and fees have been restated to reflect fees earned in respect of services rendered during the year. Fees of £7,463 have been reallocated from 2021 to 2020.
(2)2021 and 2020 Performance related payments have been restated to account for 36% of Directors and selected KMP awards being subject to long-term metrics. Performance against these metrics can decrease the award to 0% and may not increase the award value. Previously, the value of the Variable Pay Plan awards have been disclosed in full which has resulted in an overstatement post the application of performance conditions. The value of the 2021 and 2020 Variable Pay Plan awards subject to long-term performance conditions will be disclosed after the close of the performance period upon vesting. In addition to the remuneration in the table above, no grants of shares in Banco Santander SA were made to Directors and KMPs as part of buy-outs of deferred performance-related payments in connection with previous employment in 2022 (2021: one to a KMP with a value of £107,225, of which £25,413 vested in the year, 2020: one to a Director of £1,293,678 of which £242,605 vested in the year and one to a KMP of £924,133 of which £60,500 vested in the year). A payment of guaranteed variable remuneration of £660,648 was made to a Director in 2022 (2021: £nil, 2020: £nil) part of which was awarded in Banco Santander SA shares. The element of the guaranteed remuneration which vested in respect of 2022 has been disclosed above, 40%, and the remaining 60% will be disclosed upon vesting.
(3) Compensation for loss of office was paid to three KMPs in 2022 totalling £1,540,400 (2021: £nil, 2020: one KMP: £275,000).
In 2022, the remuneration, excluding pension contributions, of the highest paid Director, was £3,510,441 (2021: £3,740,810, 2020: £2,093,149) of which £1,900,506 (2021: £1,864,320, 2020: £nil) was performance related. In 2022, the accrued defined benefit pension relating to the highest paid director was £nil (2021: £22,119, 2020: £21,309 per annum for a different individual).
| | | | | | | | | | | | | | |
| Annual Report 2022 | Santander UK Group Holdings plc 243 |
| | | | | | | | | | | | | | | | | | | | | | | | | | | | | | | | | | | | | | | | | |
| Strategic Report | Sustainability and Responsible Banking | Governance | Risk review | Financial review | Financial
statements | Shareholder
information |
| | | | | | | | | | | | | |
| | | | | | | | | | | | | |
b) Retirement benefits
Defined benefit pension schemes are provided to certain employees. See Note 30 for details of the schemes and the related costs and obligations. One director has a deferred pension benefit accruing under a defined benefit scheme. Ex gratia pensions paid to former Directors of Santander UK plc in 2022, which have been provided for previously, amounted to £379,945 (2021: £370,668; 2020: £366,248). Since the Company became part of the Banco Santander group, the Board has not awarded any new ex-gratia pensions.
c) Transactions with Directors, Other Key Management Personnel and each of their connected persons
Directors, Other Key Management Personnel (defined as the Executive Committee of Santander UK plc who served during the year) and their connected persons have undertaken the following transactions with the Santander UK group in the ordinary course of business.
| | | | | | | | | | | | | | | | | |
| | 2022 | | | 2021 |
| No. | £000 | | No. | £000 |
| Secured loans, unsecured loans and overdrafts | | | | | |
| At 1 January | 4 | 27 | | | 9 | 1,825 | |
| Net movements | 2 | 620 | | | (5) | (1,798) | |
| At 31 December | 6 | 647 | | | 4 | 27 | |
| | | | | |
| Deposit, bank and instant access accounts and investments | | | | | |
| At 1 January | 16 | 6,427 | | | 16 | 8,063 | |
| Net movements | — | (3,432) | | | — | (1,636) | |
| At 31 December | 16 | 2,995 | | | 16 | 6,427 | |
In 2022 and 2021, no Director held any interest in the shares of any company in the Santander UK group and no Director exercised or was granted any rights to subscribe for shares in any company in the Santander UK group. In addition, in 2022 and 2021, no Directors exercised share options over shares in Banco Santander SA, the ultimate parent company of the Company.
Secured loans, unsecured loans and overdrafts are made to Directors, Other Key Management Personnel and their connected persons, in the ordinary course of business, with terms prevailing for comparable transactions and on the same terms and conditions as applicable to other employees in the Santander UK group. Such loans do not involve more than the normal risk of collectability or present any unfavourable features. Amounts deposited by Directors, Other Key Management Personnel and their connected persons earn interest at the same rates as those offered to the market or on the same terms and conditions applicable to other employees in the Santander UK group. Deposits, bank and instant access accounts and investments are entered into by Directors, Other Key Management Personnel and their connected persons on normal market terms and conditions, or on the same terms and conditions as applicable to other employees in Santander UK group.
In 2022, loans were made to four Directors (2021: two Directors), with a principal amount of £332,426 outstanding at 31 December 2022 (2021: £15,430). In 2022, loans were made to two Other Key Management Personnel (2021: two), with a principal amount of £314,667 outstanding at 31 December 2022 (2021: £11,678).
In 2022 and 2021, there were no other transactions, arrangements or agreements with Santander UK in which Directors, Other Key Management Personnel or their connected persons had a material interest. In addition, in 2022 and 2021, no Director had a material interest in any contract of significance with Santander UK other than a service contract or appointment letter, as appropriate.
38. RELATED PARTY DISCLOSURES
a) Parent undertaking and controlling party
The Company’s immediate and ultimate parent and controlling party is Banco Santander SA, a company incorporated in Spain. The smallest and largest groups into which the Santander UK group’s results are included are the group accounts of Banco Santander SA , copies of which may be obtained from Shareholder Relations, 2 Triton Square, Regent’s Place, London NW1 3AN.
b) Transactions with related parties
Transactions with related parties during the year and balances outstanding at the year-end:
| | | | | | | | | | | | | | | | | | | | | | | | | | | | | | | | | | | | | | | | | |
| | | | | | | | | | | | | Group |
| Interest, fees and
other income received | | Interest, fees and
other expenses paid | | Amounts owed by
related parties | | Amounts owed to
related parties |
| | |
| 2022 | 2021 | 2020 | | 2022 | 2021 | 2020 | | 2022 | 2021 | | 2022 | 2021 |
| £m | £m | £m | | £m | £m | £m | | £m | £m | | £m | £m |
| Ultimate parent | (863) | | (210) | | (120) | | | 47 | | 34 | | 158 | | | 1,423 | | 1,049 | | | (1,732) | | (1,392) | |
| Fellow subsidiaries | (60) | | (47) | | (54) | | | 171 | | 151 | | 148 | | | 31 | | 20 | | | (278) | | (467) | |
| Associates & joint ventures | (77) | | (34) | | (29) | | | 17 | | 4 | | — | | | 4,151 | | 3,075 | | | (973) | | (918) | |
| (1,000) | | (291) | | (203) | | | 235 | | 189 | | 306 | | | 5,605 | | 4,144 | | | (2,983) | | (2,777) | |
For more on this, see ‘Balances with other Banco Santander group members’ in the Risk review, Note 13. Loans and advances to customers, Note 23. Deposits by customers and Note 33. Other Equity Instruments. In addition, transactions with pension schemes operated by the Santander UK group are described in Note 30. In November 2022, Santander (UK) Group Pension Scheme Trustees Limited entered into an unsecured committed liquidity facility with Santander UK plc for £600m with a maturity date of 31 December 2024. This facility provides an alternate source of short-term liquidity for day-to-day operational needs. At the balance sheet date, no drawings had been made from this facility and the entire facility remained undrawn.
The above transactions were made in the ordinary course of business, on substantially the same terms as for comparable transactions with third party counterparties, and within limits acceptable to the PRA. Such transactions do not involve more than the normal risk of collectability or present any unfavourable features.
| | | | | | | | | | | | | | |
| Annual Report 2022 | Santander UK Group Holdings plc 244 |
| | | | | | | | | | | | | | | | | | | | | | | | | | | | | | | | | | | | | | | | | |
| Strategic Report | Sustainability and Responsible Banking | Governance | Risk review | Financial review | Financial
statements | Shareholder
information |
| | | | | | | | | | | | | |
| | | | | | | | | | | | | |
In 2020, Santander Consumer (UK) plc (SCUK) purchased a 50% share in a new joint venture, Volvo Car Financial Services UK Limited. In 2021, £390m of dealer lending was transferred from SCUK to the new entity.
In 2021, SCUK sold its entire 50% shareholding in PSA Finance UK Limited to PSA Financial Services Spain EFC SA, a joint venture between Santander Consumer Finance SA, a fellow subsidiary of Banco Santander SA, and Banque PSA Finance SA.
In 2021, a significant part of the CIB business of Santander UK was transferred to the London branch of Banco Santander SA by way of a Part VII banking business transfer scheme. For more details, see Note 42.
In 2021, we sold our current head office site in Triton Square, London to Santander UK Investments, a wholly owned subsidiary of our ultimate parent. Santander UK occupies space within the building and paid fees of £6m (2021: £4m) under an occupational licence arrangement.
39. FINANCIAL INSTRUMENTS
a) Fair value measurement and hierarchy
(i) Fair value measurement
The fair value of financial instruments is the price that would be received to sell an asset or paid to transfer a liability in an orderly transaction between market participants at the measurement date in the principal, or in its absence, the most advantageous market to which Santander UK has access at that date. The fair value of a liability reflects its non-performance risk.
Financial instruments valued using observable market prices
If a quoted market price in an active market is available for an instrument, the fair value is calculated as the current bid price multiplied by the number of units of the instrument held.
Financial instruments valued using a valuation technique
In the absence of a quoted market price in an active market, management uses internal models to make its best estimate of the price that the market would set for that financial instrument. In order to make these estimations, various techniques are employed, including extrapolation from observable market data and observation of similar financial instruments with similar characteristics. Wherever possible, valuation parameters for each product are based on prices directly observable in active markets or that can be derived from directly observable market prices. Chosen valuation techniques incorporate all the factors that market participants would take into account in pricing transactions.
Santander UK manages certain groups of financial assets and liabilities on the basis of its net exposure to either market risks or credit risk. As a result, it has elected to use the exception under IFRS 13 which permits the fair value measurement of a group of financial assets and financial liabilities on the basis of the price that would be received to sell a net long position for a particular risk exposure or paid to transfer a net short position for a particular risk exposure in an orderly transaction between market participants at the measurement date under current market conditions.
(ii) Fair value hierarchy
Santander UK applies the following fair value hierarchy that prioritises the inputs to valuation techniques used in measuring fair value. The hierarchy establishes three categories for valuing financial instruments, giving the highest priority to unadjusted quoted prices in active markets for identical assets or liabilities and the lowest priority to unobservable inputs. The three categories are: quoted prices in active markets (Level 1), internal models based on observable market data (Level 2) and internal models based on other than observable market data (Level 3). If the inputs used to measure an asset or a liability fall to different levels within the hierarchy, the classification of the entire asset or liability will be based on the lowest level input that is significant to the overall fair value measurement of the asset or liability.
Santander UK categorises assets and liabilities measured at fair value within the fair value hierarchy based on the inputs to the valuation techniques as follows:
Level 1 Unadjusted quoted prices for identical assets or liabilities in an active market that Santander UK can access at the measurement date. Active markets are assessed by reference to average daily trading volumes in absolute terms and, where applicable, by reference to market capitalisation for the instrument.
Level 2 Quoted prices in inactive markets, quoted prices for similar assets or liabilities, recent market transactions, inputs other than quoted market prices for the asset or liability that are observable either directly or indirectly for substantially the full term, and inputs to valuation techniques that are derived principally from or corroborated by observable market data through correlation or other statistical means for substantially the full term of the asset or liability.
Level 3 Significant inputs to the pricing or valuation techniques are unobservable. These unobservable inputs reflect the assumptions that market participants would use when pricing assets or liabilities and are considered significant to the overall valuation.
Changes in the observability of significant valuation inputs during the reporting period may result in a transfer of assets and liabilities within the fair value hierarchy. The Santander UK group recognises transfers between levels of the fair value hierarchy when there is a significant change in either its principal market or the level of observability of the inputs to the valuation techniques at the end of the reporting period.
| | | | | | | | | | | | | | |
| Annual Report 2022 | Santander UK Group Holdings plc 245 |
| | | | | | | | | | | | | | | | | | | | | | | | | | | | | | | | | | | | | | | | | |
| Strategic Report | Sustainability and Responsible Banking | Governance | Risk review | Financial review | Financial
statements | Shareholder
information |
| | | | | | | | | | | | | |
| | | | | | | | | | | | | |
b) Valuation techniques
The main valuation techniques employed in internal models to measure the fair value of the financial instruments at 31 December 2022 and 2021 are set out below. In substantially all cases, the principal inputs into these models are derived from observable market data. Santander UK did not make any material changes to the valuation techniques and internal models it used in 2022, 2021 and 2020.
AIn the valuation of financial instruments requiring static hedging (for example interest rate, currency derivatives and property derivatives) and in the valuation of loans and advances and deposits, the ‘present value’ method is used. Expected future cash flows are discounted using the interest rate curves of the applicable currencies or forward house price index levels, as well as credit spreads. The interest rate curves are generally observable market data and reference yield curves derived from quoted interest rates in appropriate time bandings, which match the timings of the cash flows and maturities of the instruments.
BIn the valuation of equity financial instruments requiring dynamic hedging (principally equity securities, options and other structured instruments), proprietary local volatility and stochastic volatility models are used. These types of models are widely accepted in the financial services industry. Observable market inputs used in these models include the bid-offer spread, foreign currency exchange rates, volatility and correlation between indices. In limited circumstances, other inputs may be used in these models that are based on unobservable market data, such as the Halifax’s UK HPI volatility, HPI forward growth, HPI spot rate, mortality, mean reversion and contingent litigation risk.
CIn the valuation of financial instruments exposed to interest rate risk that require either static or dynamic hedging (such as interest rate futures, caps and floors, and options), the present value method (futures), Black’s model (caps/floors) and the Hull/White and Markov functional models (Bermudan options) are used. These types of models are widely accepted in the financial services industry. The significant inputs used in these models are observable market data, including appropriate interest rate curves, volatilities, correlations and exchange rates. In limited circumstances, other inputs may be used in these models that are based on unobservable market data, such as HPI volatility, HPI forward growth, HPI spot rate and mortality.
DIn the valuation of linear instruments such as credit risk and fixed-income derivatives, credit risk is measured using dynamic models similar to those used in the measurement of interest rate risk. In the case of non-linear instruments, if the portfolio is exposed to credit risk such as credit derivatives, the probability of default is determined using the credit default spread market. The main inputs used to determine the underlying cost of credit of credit derivatives are quoted credit risk premiums and the correlation between the quoted credit derivatives of various issuers.
The fair values of the financial instruments arising from Santander UK’s internal models take into account, among other things, contract terms and observable market data, which include such factors as bid-offer spread, interest rates, credit risk, exchange rates, the quoted market price of equity securities, volatility and prepayments. In all cases, when it is not possible to derive a valuation for a particular feature of an instrument, management uses judgement to determine the fair value of the particular feature. In exercising this judgement, a variety of tools are used including proxy observable data, historical data and extrapolation techniques. Extrapolation techniques take into account behavioural characteristics of equity markets that have been observed over time, and for which there is a strong case to support an expectation of a continuing trend in the future. Estimates are calibrated to observable market prices when they become available.
Santander UK believes its valuation methods are appropriate and consistent with other market participants. Nevertheless, the use of different valuation methods or assumptions, including imprecision in estimating unobservable market inputs, to determine the fair value of certain financial instruments could result in different estimates of fair value at the reporting date and the amount of gain or loss recorded for a particular instrument. Most of the valuation models are not significantly subjective, because they can be tested and, if necessary, recalibrated by the internal calculation of and subsequent comparison to market prices of actively traded securities, where available.
c) Control framework
Fair values are subject to a control framework designed to ensure that they are either determined or validated by a function independent of the risk-taker. To this end, ultimate responsibility for the determination of fair values lies with the Risk Department. For all financial instruments where fair values are determined by reference to externally quoted prices or observable pricing inputs to models, independent price determination or verification is utilised. In inactive markets, direct observation of a traded price may not be possible. In these circumstances, Santander UK will source alternative market information to validate the financial instrument’s fair value, with greater weight given to information that is considered to be more relevant and reliable.
The factors that are considered in this regard include:
–The extent to which prices may be expected to represent genuine traded or tradeable prices
–The degree of similarity between financial instruments
–The degree of consistency between different sources
–The process followed by the pricing provider to derive the data
–The elapsed time between the date to which the market data relates and the balance sheet date
–The manner in which the data was sourced.
The source of pricing data is considered as part of the process that determines the classification of the level of a financial instrument. Consideration is given to the quality of the information available that provides the current mark-to-model valuation and estimates of how different these valuations could be on an actual trade, taking into consideration how active the market is. For spot assets that cannot be sold due to illiquidity, forward estimates are discounted to estimate a realisable value over time. Adjustments for illiquid positions are regularly reviewed to reflect changing market conditions.
For fair values determined using a valuation model, the control framework may include as applicable, independent development and / or validation of: (i) the logic within the models; (ii) the inputs to those models; and (iii) any adjustments required outside the models. Internal valuation models are validated independently within the Risk Department. A validation report is produced for each model-derived valuation that assesses the mathematical assumptions behind the model, the implementation of the model and its integration within the trading system.
| | | | | | | | | | | | | | |
| Annual Report 2022 | Santander UK Group Holdings plc 246 |
| | | | | | | | | | | | | | | | | | | | | | | | | | | | | | | | | | | | | | | | | |
| Strategic Report | Sustainability and Responsible Banking | Governance | Risk review | Financial review | Financial
statements | Shareholder
information |
| | | | | | | | | | | | | |
| | | | | | | | | | | | | |
d) Fair values of financial instruments carried at amortised cost
The following tables analyse the fair value of the financial instruments carried at amortised cost at 31 December 2022 and 2021, including their levels in the fair value hierarchy - Level 1, Level 2 and Level 3. It does not include fair value information for financial assets and financial liabilities carried at amortised cost if the carrying amount is a reasonable approximation of fair value. Cash and balances at central banks, which consist of demand deposits with the Bank of England, together with cash in tills and ATMs, have been excluded from the table as the carrying amount is deemed an appropriate approximation of fair value.
| | | | | | | | | | | | | | | | | | | | | | | | | | | | | | | | | | | |
| | | | | | | | | | | Group |
| 2022 | | 2021 |
| | | Fair value | | Carrying | | | | Fair value | | Carrying |
| Level 1 | Level 2 | Level 3 | Total | value | | Level 1 | Level 2 | Level 3 | Total | value |
| £m | £m | £m | £m | £m | | £m | £m | £m | £m | £m |
| Assets | | | | | | | | | | | |
| Loans and advances to customers | — | | — | | 216,451 | | 216,451 | | 223,840 | | | — | | — | | 216,279 | | 216,279 | | 213,525 | |
| Loans and advances to banks | — | | 1,105 | | — | | 1,105 | | 1,105 | | | — | | 1,420 | | — | | 1,420 | | 1,420 | |
| Reverse repurchase agreements - non trading | — | | 7,341 | | — | | 7,341 | | 7,348 | | | — | | 12,453 | | 226 | | 12,679 | | 12,683 | |
| Other financial assets at amortised cost | 144 | | — | | — | | 144 | | 156 | | | 164 | | 348 | | — | | 512 | | 506 | |
| 144 | | 8,446 | | 216,451 | | 225,041 | | 232,449 | | | 164 | | 14,221 | | 216,505 | | 230,890 | | 228,134 | |
| Liabilities | | | | | | | | | | | |
| Deposits by customers | — | | 52 | | 197,228 | | 197,280 | | 197,313 | | | — | | 52 | | 192,887 | | 192,939 | | 192,914 | |
| Deposits by banks | — | | 27,997 | | 54 | | 28,051 | | 28,543 | | | — | | 33,780 | | 82 | | 33,862 | | 33,862 | |
| Repurchase agreements - non trading | — | | 7,982 | | — | | 7,982 | | 7,982 | | | — | | 11,718 | | — | | 11,718 | | 11,718 | |
| Debt securities in issue | 4,988 | | 28,685 | | 1,582 | | 35,255 | | 36,420 | | | 4,070 | | 27,084 | | 1,218 | | 32,372 | | 31,580 | |
| Subordinated liabilities | 19 | | 2,268 | | 224 | | 2,511 | | 2,332 | | | 1,019 | | 1,512 | | 238 | | 2,769 | | 2,228 | |
| | 5,007 | | 66,984 | | 199,088 | | 271,079 | | 272,590 | | | 5,089 | | 74,146 | | 194,425 | | 273,660 | | 272,302 | |
The carrying value above of any financial assets and liabilities that are designated as hedged items in a portfolio (or macro) fair value hedge relationship excludes gains and losses attributable to the hedged risk, as this is included as a separate line item on the balance sheet.
Valuation methodology for financial instruments carried at amortised cost
The valuation approach to specific categories of financial instruments is described below.
Assets:
Loans and advances to customers
The approach to estimating the fair value of loans and advances to customers has been determined by discounting expected cash flows to reflect either current market rates or credit spreads relevant to the specific industry of the borrower. The determination of their fair values is an area of considerable estimation and uncertainty as there is no observable market and values are significantly affected by customer behaviour.
i) Advances secured on residential property
The fair value of the mortgage portfolio is calculated by discounting contractual cash flows by different spreads for each LTV Band, after taking account of expected customer prepayment rates. The spread is based on new business interest rates derived from publicly available competitor market information.
ii) Corporate loans
The determination of the fair values of performing loans is calculated by discounting the contractual cash flows and also deducting other costs relating to expected credit losses, cost of capital, credit risk capital, operational risk capital, cost of funding and operating costs.
iii) Other loans
These consist of unsecured personal loans, credit cards, overdrafts and consumer (auto) finance. The weighted average lives of these portfolios are typically short and relate to relatively new business. For unsecured personal loans and consumer (auto) finance loans, a small surplus or deficit has been recognised based on the differential between existing portfolio margins and the current contractual interest rates.
Loans and advances to banks
These comprise secured loans, short-term placements with banks including collateral and unsettled financial transactions. The secured loans have been valued based on a discounted spread for the term of the loans using valuation technique A as described above. The carrying amount of the other items is deemed a reasonable approximation of their fair value, as the transactions are very short-term in duration.
Reverse repurchase agreements - non-trading
The fair value of the reverse repurchase agreements - non trading has been estimated using valuation technique A as described above, using a spread appropriate to the underlying collateral.
Other financial assets at amortised cost
These consist of asset backed securities and debt securities. The asset backed securities can be complex products and in some instances are valued with the assistance of an independent, specialist valuation firm. These fair values are determined using industry-standard valuation techniques, including discounted cash flow models. The inputs to these models used in these valuation techniques include quotes from market makers, prices of similar assets, adjustments for differences in credit spreads, and additional quantitative and qualitative research. The debt security investments consist of a portfolio of government debt securities. The fair value of this portfolio has been determined using quoted market prices.
| | | | | | | | | | | | | | |
| Annual Report 2022 | Santander UK Group Holdings plc 247 |
| | | | | | | | | | | | | | | | | | | | | | | | | | | | | | | | | | | | | | | | | |
| Strategic Report | Sustainability and Responsible Banking | Governance | Risk review | Financial review | Financial
statements | Shareholder
information |
| | | | | | | | | | | | | |
| | | | | | | | | | | | | |
Liabilities:
Deposits by customers
The majority of deposit liabilities are payable on demand and therefore can be deemed short-term in nature with the fair value equal to the carrying value. Certain of the deposit liabilities are at a fixed rate until maturity. The deficit/surplus of fair value over carrying value of these liabilities has been estimated by reference to the market rates available at the balance sheet date for similar deposit liabilities of similar maturities. The fair value of such deposit liabilities has been estimated using valuation technique A as described above.
Deposits by banks
The fair value of deposits by banks, including repos, has been estimated using valuation technique A as described above, discounted at the appropriate credit spread.
Repurchase agreements - non trading
The fair value of the repurchase agreements - non trading has been estimated using valuation technique A as described above, discounted at a spread appropriate to the underlying collateral.
Debt securities in issue and subordinated liabilities
Where reliable prices are available, the fair value of debt securities in issue and subordinated liabilities has been calculated using quoted market prices. Where reliable prices are not available, internal models have been used to determine fair values, which take into account, among other things, contract terms and observable market data, which include such factors as interest rates, credit risk and exchange rates. In all cases, when it is not possible to derive a valuation for a particular feature of an instrument, management uses judgement to determine the fair value of the particular feature. In exercising this judgement, a variety of tools are used including proxy observable data.
e) Fair values of financial instruments measured at fair value
The following tables summarise the fair values of the financial assets and liabilities accounted for at fair value at 31 December 2022 and 31 December 2021, analysed by their levels in the fair value hierarchy - Level 1, Level 2 and Level 3.
| | | | | | | | | | | | | | | | | | | | | | | | | | | | | | | | | | | |
| | | | | | | | | | | Group |
| | 2022 | | 2021 | |
| | Level 1 | Level 2 | Level 3 | Total | | Level 1 | Level 2 | Level 3 | Total | Valuation |
| | £m | £m | £m | £m | | £m | £m | £m | £m | technique |
| Assets | | | | | | | | | | | |
| Derivative financial instruments | Exchange rate contracts | — | | 2,049 | | — | | 2,049 | | | — | | 1,193 | | 1 | | 1,194 | | A |
| Interest rate contracts | — | | 2,406 | | 7 | | 2,413 | | | — | | 1,574 | | — | | 1,574 | | A & C |
| Equity and credit contracts | — | | 103 | | 47 | | 150 | | | — | | 118 | | 55 | | 173 | | B & D |
| Netting | — | | (2,173) | | — | | (2,173) | | | — | | (1,221) | | — | | (1,221) | | |
| | | — | | 2,385 | | 54 | | 2,439 | | | — | | 1,664 | | 56 | | 1,720 | | |
| Other financial assets at FVTPL | Loans and advances to customers | — | | 294 | | 45 | | 339 | | | — | | 440 | | 74 | | 514 | | A |
| Debt securities | — | | 13 | | 72 | | 85 | | | — | | 1 | | 111 | | 112 | | A, B & D |
| Equity securities | — | | — | | 10 | | 10 | | | — | | — | | 50 | | 50 | | B |
| | — | | 307 | | 127 | | 434 | | | — | | 441 | | 235 | | 676 | | |
| Financial assets at FVOCI | Debt securities | 5,996 | | 28 | | — | | 6,024 | | | 5,833 | | — | | — | | 5,833 | | D |
| Loans and advances to customers | — | | — | | — | | — | | | — | | — | | 18 | | 18 | | D |
| | 5,996 | | 28 | | — | | 6,024 | | | 5,833 | | — | | 18 | | 5,851 | | |
| Total assets at fair value | | 5,996 | | 2,720 | | 181 | | 8,897 | | | 5,833 | | 2,105 | | 309 | | 8,247 | | |
| | | | | | | | | | | |
| Liabilities | | | | | | | | | | | |
| Derivative financial instruments | Exchange rate contracts | — | | 489 | | — | | 489 | | | — | | 521 | | — | | 521 | | A |
| Interest rate contracts | — | | 2,662 | | 4 | | 2,666 | | | — | | 1,659 | | 2 | | 1,661 | | A & C |
| Equity and credit contracts | — | | 18 | | 8 | | 26 | | | — | | 28 | | 30 | | 58 | | B & D |
| Netting | — | | (2,173) | | — | | (2,173) | | | — | | (1,221) | | — | | (1,221) | | |
| | — | | 996 | | 12 | | 1,008 | | | — | | 987 | | 32 | | 1,019 | | |
| Other financial liabilities at FVTPL | Debt securities in issue | — | | 477 | | 3 | | 480 | | | — | | 555 | | 5 | | 560 | | A |
| Structured deposits | — | | 321 | | — | | 321 | | | — | | 223 | | — | | 223 | | A |
| Collateral and associated financial guarantees | — | | 2 | | — | | 2 | | | — | | 19 | | 1 | | 20 | | D |
| | — | | 800 | | 3 | | 803 | | | — | | 797 | | 6 | | 803 | | |
| Total liabilities at fair value | | — | | 1,796 | | 15 | | 1,811 | | | — | | 1,784 | | 38 | | 1,822 | | |
Transfers between levels of the fair value hierarchy
In 2022 there were no significant (2021: no significant) transfers of financial instruments between levels of the fair value hierarchy.
| | | | | | | | | | | | | | |
| Annual Report 2022 | Santander UK Group Holdings plc 248 |
| | | | | | | | | | | | | | | | | | | | | | | | | | | | | | | | | | | | | | | | | |
| Strategic Report | Sustainability and Responsible Banking | Governance | Risk review | Financial review | Financial
statements | Shareholder
information |
| | | | | | | | | | | | | |
| | | | | | | | | | | | | |
f) Fair value adjustments
The internal models incorporate assumptions that Santander UK believes would be made by a market participant to establish fair value. Fair value adjustments are adopted when Santander UK considers that there are additional factors that would be considered by a market participant that are not incorporated in the valuation model.
Santander UK classifies fair value adjustments as either ‘risk-related’ or ‘model-related’. The fair value adjustments form part of the portfolio fair value and are included in the balance sheet values of the product types to which they have been applied. The fair value adjustments are set out in the following table:
| | | | | | | | |
| 2022 | 2021 |
| £m | £m |
| Risk-related: | | |
| - Bid-offer and trade specific adjustments | (12) | | (9) | |
| - Uncertainty | 27 | | 40 | |
| - Credit risk adjustment | (1) | | 6 | |
| - Funding fair value adjustment | 1 | | 3 | |
| 15 | | 40 | |
| | |
| Day One profit | (1) | — |
| 14 | | 40 | |
Risk-related adjustments
Risk-related adjustments are driven, in part, by the magnitude of Santander UK’s market or credit risk exposure, and by external market factors, such as the size of market spreads.
(i) Bid-offer and trade specific adjustments
Portfolios are marked at bid or offer, as appropriate. Valuation models will typically generate mid-market values. The bid-offer adjustment reflects the cost that would be incurred if substantially all residual net portfolio market risks were closed using available hedging instruments or by disposing of or unwinding the position. For debt securities, the bid-offer spread is based on a market price at an individual security level. For other products, the major risk types are identified. For each risk type, the net portfolio risks are first classified into buckets, and then a bid-offer spread is applied to each risk bucket based upon the market bid-offer spread for the relevant hedging instrument.
(ii) Uncertainty
Certain model inputs may be less readily determinable from market data, and/or the choice of model itself may be more subjective. In these circumstances, a range of possible values exists that the financial instrument or market parameter may assume, and an adjustment may be needed to reflect the likelihood that in estimating the fair value of the financial instrument, market participants would adopt more conservative values for uncertain parameters and/or model assumptions than those used in the valuation model.
(iii) Credit risk adjustment
Credit risk adjustments comprise credit and debit valuation adjustments. The credit valuation adjustment (CVA) is an adjustment to the valuation of OTC derivative contracts to reflect within fair value the possibility that the counterparty may default, and Santander UK may not receive the full market value of the transactions. The debit valuation adjustment (DVA) is an adjustment to the valuation of the OTC derivative contracts to reflect within the fair value the possibility that Santander UK may default, and that Santander UK may not pay full market value of the transactions.
Santander UK calculates a separate CVA and DVA for each Santander UK legal entity, and within each entity for each counterparty to which the entity has exposure. Santander UK calculates the CVA by applying the probability of default of the counterparty to the expected positive exposure to the counterparty, and multiplying the result by the loss expected in the event of default i.e. LGD. Conversely, Santander UK calculates the DVA by applying the PD of the Santander UK group, to the expected positive exposure of the counterparty to Santander UK and multiplying the result by the LGD. Both calculations are performed over the life of the potential exposure.
For most products Santander UK uses a simulation methodology to calculate the expected positive exposure to a counterparty. This incorporates a range of potential exposures across the portfolio of transactions with the counterparty over the life of the portfolio. The simulation methodology includes credit mitigants such as counterparty netting agreements and collateral agreements with the counterparty.
The methodologies do not, in general, account for wrong-way risk. Wrong-way risk arises where the underlying value of the derivative prior to any credit risk adjustment is positively correlated to the probability of default of the counterparty. When there is significant wrong-way risk, a trade-specific approach is applied to reflect the wrong-way risk within the valuation. Exposure to wrong-way risk is limited via internal governance processes and deal pricing. Santander UK considers that an appropriate adjustment to reflect wrong-way risk is £nil (2021: £nil).
(iv) Funding fair value adjustment (FFVA)
The FFVA is an adjustment to the valuation of OTC derivative positions to include the net cost of funding uncollateralised derivative positions. This is calculated by applying a suitable funding cost to the expected future funding exposure of any uncollateralised component of the OTC derivative portfolio.
Model-related adjustments
Models used for portfolio valuation purposes may be based upon a simplifying set of assumptions that do not capture all material market characteristics. Additionally, markets evolve, and models that were adequate in the past may require development to capture all material market characteristics in current market conditions. In these circumstances, model limitation adjustments are adopted. As model development progresses, model limitations are addressed within the core revaluation models and a model limitation adjustment is no longer needed.
Day One profit adjustments
Day One profit adjustments are adopted where the fair value estimated by a valuation model is based on one or more significant unobservable inputs. Day One profit adjustments are calculated and reported on a portfolio basis.
The timing of recognition of deferred Day One profit and loss is determined individually. It is deferred until either the instrument’s fair value can be determined using market observable inputs or is realised through settlement. The financial instrument is subsequently measured at fair value, adjusted for the deferred Day One profit and loss. Subsequent changes in fair value are recognised immediately in the Income Statement without immediate reversal of deferred Day One profits and losses.
| | | | | | | | | | | | | | |
| Annual Report 2022 | Santander UK Group Holdings plc 249 |
| | | | | | | | | | | | | | | | | | | | | | | | | | | | | | | | | | | | | | | | | |
| Strategic Report | Sustainability and Responsible Banking | Governance | Risk review | Financial review | Financial
statements | Shareholder
information |
| | | | | | | | | | | | | |
| | | | | | | | | | | | | |
g) Internal models based on information other than market data (Level 3)
The table below provides an analysis of financial instruments valued using internal models based on information other than market data together with further details on the valuation techniques used for each type of instrument. Each instrument is initially valued at transaction price:
| | | | | | | | | | | | | | | | | | | | | | | | | | |
| | | Balance sheet value | | Fair value movements recognised in profit/(loss) |
| | | |
| | | 2022 | 2021 | | 2022 | 2021 | 2020 |
| Balance sheet line item | Category | Financial instrument product type | £m | £m | | £m | £m | £m |
| 1. Derivative assets | Equity and credit contracts | Reversionary property interests | 30 | | 45 | | | (8) | | — | | 3 | |
| 2. FVTPL assets | Loans and advances to customers | Roll-up mortgage portfolio | 28 | | 48 | | | (18) | | (5) | | 6 | |
| 3. FVTPL assets | Loans and advances to customers | Other loans | 17 | | 26 | | | (4) | | (2) | | 3 | |
| 4. FVTPL assets | Debt securities | Reversionary property securities | 70 | | 91 | | | — | | 5 | | 6 | |
| 5. FVTPL assets | Equity securities | Unlisted equity shares | 10 | | 50 | | | (10) | | 1 | | 12 | |
| 6. FVTPL assets | Debt securities | Credit linked notes | 2 | | 20 | | | 4 | | (5) | | (16) | |
| 7. FVOCI assets | Loans and advances to customers | Other loans | — | | 18 | | | — | | (3) | | (4) | |
| 8. Derivative liabilities | Equity contracts | Property options and forwards | (8) | | (30) | | | 4 | | (1) | | (3) | |
| 9. FVTPL liabilities | Financial guarantees | Credit protection guarantee | — | | (1) | | | — | | 5 | | 16 | |
| | | 149 | | 267 | | | (32) | | (5) | | 23 | |
| Other Level 3 assets | | 24 | | 11 | | | 13 | | 2 | | 7 | |
| Other Level 3 liabilities | | (7) | | (7) | | | (2) | | 2 | | (3) | |
| Total net assets | | 166 | | 271 | | | | | | | | |
| Total income/(expense) | | | | | (21) | | (1) | | 27 | |
Valuation techniques
1. Derivative assets – Equity and credit contracts
These are valued using a probability weighted set of HPI forward prices, which are assumed to be a reasonable representation of the increase in value of the Santander UK group’s reversionary interest portfolio underlying the derivatives. The probability used reflects the likelihood of the homeowner vacating the property and is calculated from mortality rates and acceleration rates which are a function of age and gender, obtained from the relevant mortality tables. Indexing is felt to be appropriate due to the size and geographical dispersion of the reversionary interest portfolio. These are determined using HPI Spot Rates adjusted to reflect estimated forward growth. Non-seasonally adjusted (NSA) national and regional HPI are used in the valuation model to avoid any subjective judgement in the adjustment process, which is made by Markit, which publishes the Halifax House Price Index.
The inputs used to determine the value of the reversionary property derivatives are HPI spot, HPI forward growth and mortality rates. The principal pricing parameter is HPI forward growth.
2. FVTPL assets – Loans and advances to customers – roll-up mortgage portfolio
These represent roll-up mortgages (sometimes referred to as lifetime mortgages), which are an equity release scheme under which a property owner takes out a loan secured against their home. The owner does not have to make any interest payments during their lifetime in which case the fixed interest payments are rolled up into the mortgage. The loan or mortgage (capital and rolled-up interest) is repaid upon the owner’s vacation of the property and the value of the loan is only repaid from the value of the property. This is known as a ‘no negative equity guarantee’. Santander UK suffers a loss if the sale proceeds from the property are insufficient to repay the loan, as it is unable to pursue the homeowner’s estate or beneficiaries for the shortfall.
The value of the mortgage ‘rolls up’ or accretes until the owner vacates the property. In order to value the roll-up mortgages, Santander UK uses a probability-weighted set of European option prices (puts) determined using the Black-Scholes model, in which the ‘no negative equity guarantee’ are valued as short put options. The probability weighting applied is calculated from mortality rates and acceleration rates as a function of age and gender, taken from mortality tables.
The inputs used to determine the value of these instruments are HPI spot, HPI forward growth, HPI volatility, mortality rates and repayment rates. The principal pricing parameter is HPI forward growth. The HPI forward growth rate used is unobservable and is the same as used in the valuation of Instrument 1 above. The other parameters do not have a significant effect on the value of the instruments.
3. FVTPL assets – Loans and advances to customers – other loans
These relate to loans to transport and education companies. The fair value of these loans is estimated using the ‘present value’ model based on a credit curve derived from current market spreads. Loan specific credit data is unobservable, so a proxy population is applied based on industry sector and credit rating.
4. FVTPL assets – Debt securities
These consist of reversionary property securities and are an equity release scheme, where the property owner receives an upfront lump sum in return for paying a fixed percentage of the sales proceeds of the property when the owner vacates the property. These reversionary property securities are valued using a probability-weighted set of HPI forward prices which are assumed to be a reasonable representation of the increase in value of Santander UK’s reversionary interest portfolio underlying the derivatives. The probability weighting used reflects the probability of the homeowner vacating the property through death or moving into care and is calculated from mortality rates and acceleration factors which are a function of age and gender, obtained from the relevant mortality table.
The inputs used to determine the value of these instruments are HPI spot, HPI forward growth and mortality rates. The principal pricing parameter is HPI forward growth. Discussion of the HPI spot rate, HPI forward growth rate and mortality rates for this financial instrument is the same as Instrument 1 above. An adjustment is also made to reflect the specific property risk. Specific property risk is from the difference between the specific properties in the portfolio, and the average price as expressed in the regionally weighted house price index.
5. FVTPL assets – Equity securities
These consist of unquoted equity investments in companies providing infrastructure services to the financial services industry. Observable market inputs to valuation models used include equity prices and foreign currency exchange rates. The significant unobservable input is contingent litigation costs and related expenses in respect of convertible preferred stock in Visa Inc, as described in Note 31. This is estimated by reference to best estimates received from third party legal counsel.
| | | | | | | | | | | | | | |
| Annual Report 2022 | Santander UK Group Holdings plc 250 |
| | | | | | | | | | | | | | | | | | | | | | | | | | | | | | | | | | | | | | | | | |
| Strategic Report | Sustainability and Responsible Banking | Governance | Risk review | Financial review | Financial
statements | Shareholder
information |
| | | | | | | | | | | | | |
| | | | | | | | | | | | | |
6 . FVTPL assets – Debt securities (Credit linked notes)
These consist of the retained senior tranches of credit linked notes in respect of credit protection vehicles sponsored by Santander UK and are mandatorily held at fair value through profit or loss. These vehicles provide credit protection on reference portfolios of Santander UK group loans with junior notes sold to external investors. The notes retained by Santander UK are classified as level 3 financial instruments as their valuation depends upon unobservable parameters relating to the underlying reference portfolios of loans, including credit spreads, correlations and prepayment speed, which have a significant effect on the overall valuation. For more information, see ‘Credit protection entities’ in Note 19.
7. FVOCI assets – Loans and advances to customers – other loans
These relate to shipping loans. The fair value of these loans is estimated using the ‘present value’ model based on a credit curve derived from current market spreads. Loan specific credit data is unobservable, so a proxy population is applied based on industry sector and credit rating.
8. Derivative liabilities – Equity contracts
There are three types of derivatives in this category:
European options – These are valued using a modified Black-Scholes model where the HPI is log-normally distributed with the forward rates determined from the HPI forward growth.
Asian options – Asian (or average value) options are valued using a modified Black-Scholes model, with an amended strike price and volatility assumption to account for the average exercise period, through a closed form adjustment that reflects the strike price relative to the distribution of stock prices at each relevant date. This is also known as the Curran model.
Forward contracts – Forward contracts are valued using a standard forward pricing model.
The inputs used to determine the value of the above instruments are HPI spot rate, HPI forward growth rate and HPI volatility. The principal pricing parameter is HPI forward growth rate, which is unobservable.
9. FVTPL liabilities – Financial guarantees
These relate to credit protection guarantees in respect of the proceeds of the retained senior tranches of credit linked notes described in Instrument 6 above and have been designated at fair value through profit or loss. These instruments are valued using the same unobservable parameters described in Instrument 6 above, such that changes in the valuation of the senior tranches of the credit linked notes are offset by changes in the value of these credit protection guarantees. For more information, see ‘Credit protection entities’ in Note 19.
Reconciliation of fair value measurement in Level 3 of the fair value hierarchy
The following table sets out the movements in Level 3 financial instruments in 2022 and 2021:
| | | | | | | | | | | | | | | | | | | | | | | | | | |
| Assets | | Liabilities |
| Derivatives | Other financial assets at FVTPL | Financial assets at FVOCI | Total | | Derivatives | Other financial liabilities at FVTPL | Total |
| £m | £m | £m | £m | | £m | £m | £m |
| At 1 January 2022 | 56 | | 235 | | 18 | | 309 | | | (32) | | (6) | | (38) | |
| Total (losses)/gains recognised: | | | | | | | | |
Fair value movements(2) | 5 | | (28) | | — | | (23) | | | 2 | | — | | 2 | |
| Foreign exchange and other movements | — | | (2) | | — | | (2) | | | — | | 1 | | 1 | |
| Transfers in | — | | — | | — | | — | | | (2) | | — | | (2) | |
| Transfers out | — | (28) | — | (28) | | — | | — | | — | |
Netting(1) | — | | (8) | | — | | (8) | | | — | | — | | — | |
| | | | | | | | |
| Sales | — | | (5) | | — | | (5) | | | — | | — | | — | |
| Settlements | (7) | | (37) | | (18) | | (62) | | | 20 | | 2 | | 22 | |
| At 31 December 2022 | 54 | | 127 | | — | | 181 | | | (12) | | (3) | | (15) | |
| | | | | | | | |
| Gains/(losses) recognised in profit or loss/other comprehensive income relating to assets and liabilities held at the end of the year(2) | 5 | | (30) | | — | | (25) | | | 2 | | 1 | | 3 | |
| | | | | | | | |
| At 1 January 2021 | 75 | | 255 | | 21 | | 351 | | | (32) | | (8) | | (40) | |
| Total gains/(losses) recognised: | | | | | | | | |
| - Fair value movements | 2 | | (6) | | (3) | | (7) | | | — | | 6 | | 6 | |
| - Foreign exchange and other movements | — | | 2 | | — | | 2 | | | — | | 1 | | 1 | |
Netting(1) | — | | 23 | | — | | 23 | | | — | | (5) | | (5) | |
| Sales | — | | (16) | | — | | (16) | | | — | | — | | — | |
| Settlements | (21) | | (23) | | — | | (44) | | | — | | — | | — | |
| At 31 December 2021 | 56 | | 235 | | 18 | | 309 | | | (32) | | (6) | | (38) | |
| | | | | | | | |
| Gains/(losses) recognised in profit or loss/other comprehensive income relating to assets and liabilities held at the end of the year | 2 | | (4) | | (3) | | (5) | | | — | | 7 | | 7 | |
(1)This relates to the effect of netting on the fair value of the credit linked notes due to a legal right of set-off between the principal amounts of the senior notes and the associated cash deposits. For more, see ‘ii) Credit protection entities’ in Note 19.
(2)Fair value movements relating to derivatives and other financial assets at FVTPL are recognised in other operating income in the income statement. Fair value movements relating to financial assets at FVOCI are recognised in the movement in fair value reserve (debt instruments).
Effect of changes in significant unobservable assumptions to reasonably possible alternatives (Level 3)
As discussed above, the fair value of financial instruments are, in certain circumstances, measured using valuation techniques that incorporate assumptions that are not evidenced by prices from observable current market transactions in the same instrument and are not based on observable market data and, as such
| | | | | | | | | | | | | | |
| Annual Report 2022 | Santander UK Group Holdings plc 251 |
| | | | | | | | | | | | | | | | | | | | | | | | | | | | | | | | | | | | | | | | | |
| Strategic Report | Sustainability and Responsible Banking | Governance | Risk review | Financial review | Financial
statements | Shareholder
information |
| | | | | | | | | | | | | |
| | | | | | | | | | | | | |
require the application of a degree of judgement. Changing one or more of the inputs to the valuation models to reasonably possible alternative assumptions would change the fair values significantly. The following table shows the sensitivity of these fair values to reasonably possible alternative assumptions.
Favourable and unfavourable changes are determined on the basis of changes in the value of the instrument as a result of varying the levels of the unobservable input as described in the table below. The potential effects do not take into effect any hedged positions.
| | | | | | | | | | | | | | | | | | | | | | | |
| | Significant unobservable input | | Sensitivity |
| | | Assumption value | | Favourable changes | Unfavourable changes |
| Fair value | | Range | Weighted average | Shift |
| 2022 | £m | Assumption description | £m | £m |
| 1. Derivative assets – Equity and credit contracts: | 30 | | HPI Forward growth rate | -5% to 5% | 0.53 | % | 1 | % | 4 | | (4) | |
| – Reversionary property derivatives | | HPI Spot rate(2) | n/a | 513 | | 10 | % | 4 | | (4) | |
| 2. FVTPL – Loans and advances to customers: | 28 | | HPI Forward growth rate | -5% to 5% | 1.39 | % | 1 | % | 1 | | (1) | |
| – Roll-up mortgage portfolio | | | | | | | |
| 3. FVTPL – Loans and advances to customers: | 17 | | Credit spreads | 0.19% - 2.04% | 0.98 | % | 20 | % | — | | — | |
| – Other loans | | | | | | | |
| 4. FVTPL – Debt securities: | 70 | | HPI Forward growth rate | -5% to 5% | 0.53 | % | 1 | % | 1 | | (1) | |
| – Reversionary property securities | | HPI Spot rate(2) | n/a | 513 | | 10 | % | 3 | | (3) | |
| 5. FVTPL – equity securities: | 10 | | Contingent litigation risk | 0% - 100% | 0.95 | % | 20 | % | 7 | | (7) | |
| – Unlisted equity shares | | | | | | | |
| 6. FVOCI - Loans and advances to customers: | — | | Credit spreads | 0.40% - 0.48% | 0.48 | % | 20 | % | — | | — | |
| – Other loans | | | | | | | |
| 7. Derivative liabilities – Equity contracts: | (8) | | HPI Forward growth rate | -5% to 5% | -0.92 | % | 1 | % | 1 | | (1) | |
| – Property options and forwards | | HPI Spot rate(2) | n/a | 491 | | 10 | % | 2 | | (3) | |
| | | | | | | |
| 2021 | | | | | | | |
| 1. Derivative assets – Equity and credit contracts: | 45 | HPI Forward growth rate | 0% - 5% | 2.56 | % | 1 | % | 6 | | (6) | |
| – Reversionary property derivatives | | HPI Spot rate(2) | n/a | 483 | | 10 | % | 6 | | (6) | |
| 2. FVTPL – Loans and advances to customers: | 48 | HPI Forward growth rate | 0% - 5% | 2.68 | % | 1 | % | 2 | | (2) | |
| – Roll-up mortgage portfolio | | | | | | | |
| 3. FVTPL – Loans and advances to customers: | 26 | Credit spreads | 0.07% - 1.44% | 0.50 | % | 20 | % | — | | — | |
| – Other loans | | | | | | | |
| 4. FVTPL – Debt securities: | 91 | HPI Forward growth rate | 0% - 5% | 2.56 | % | 1 | % | 1 | | (1) | |
| – Reversionary property securities | | HPI Spot rate(2) | n/a | 483 | | 10 | % | 4 | | (4) | |
| 5. FVTPL – equity securities: | 50 | Contingent litigation risk | 0% - 100% | 45 | % | 20 | % | 7 | | (7) | |
| – Unlisted equity shares | | | | | | | |
| 7. FVOCI - Loans and advances to customers: | 18 | Credit spreads | 0.15% - 0.19% | 0.04 | % | 20 | % | — | | — | |
| – Other loans | | | | | | | |
| 8. Derivative liabilities – Equity contracts: | (30) | HPI Forward growth rate | 0% - 5% | 2.39 | % | 1 | % | 2 | | (2) | |
| – Property options and forwards | | HPI Spot rate(2) | n/a | 469 | | 10 | % | 3 | | (3) | |
(1)The range of actual assumption values used to calculate the weighted average disclosure.
(2)The HPI spot rate in the weighted average column represents the HPI spot rate index level at 31 December 2022 and 2021.
No sensitivities are presented for FVTPL assets – Debt securities, Credit Linked Notes (instrument 6) and FVTPL liabilities – financial guarantees (instrument 9), as the terms of these instruments are fully matched. As a result, any changes in the valuation of the credit linked notes would be offset by an equal and opposite change in the valuation of the financial guarantees.
| | | | | | | | | | | | | | |
| Annual Report 2022 | Santander UK Group Holdings plc 252 |
| | | | | | | | | | | | | | | | | | | | | | | | | | | | | | | | | | | | | | | | | |
| Strategic Report | Sustainability and Responsible Banking | Governance | Risk review | Financial review | Financial
statements | Shareholder
information |
| | | | | | | | | | | | | |
| | | | | | | | | | | | | |
h) Maturities of financial liabilities and off-balance sheet commitments
The table below analyses the maturities of the undiscounted cash flows relating to financial liabilities and off-balance sheet commitments of Santander UK based on the remaining period to the contractual maturity date at the balance sheet date. Deposits by customers largely consist of retail deposits. This table is not intended to show the liquidity of Santander UK.
| | | | | | | | | | | | | | | | | | | | |
| Group |
| On demand | Not later than 3 months | Later than 3 months and not later than 1 year | Later than 1 year and not later than 5 years | Later than 5 years | Total |
|
|
| 2022 | £m | £m | £m | £m | £m | £m |
| Financial liabilities | | | | | | |
| Derivative financial instruments | — | | 224 | | 120 | | 501 | | 302 | | 1,147 | |
| Other financial liabilities at fair value through profit or loss | — | | — | | 98 | | 443 | | 437 | | 978 | |
| Deposits by customers | 181,744 | | 4,969 | | 7,927 | | 2,471 | | 332 | | 197,443 | |
| Deposits by banks | 2,067 | | 948 | | 659 | | 26,140 | | — | | 29,814 | |
| Repurchase agreements – non trading | — | | 7,984 | | 3 | | — | | — | | 7,987 | |
| Debt securities in issue | — | | 6,678 | | 2,101 | | 23,076 | | 6,830 | | 38,685 | |
| Subordinated liabilities | — | | 35 | | 691 | | 1,149 | | 1,400 | | 3,275 | |
| Lease liabilities | — | | — | | 32 | | 82 | | 28 | | 142 | |
| Total financial liabilities | 183,811 | | 20,838 | | 11,631 | | 53,862 | | 9,329 | | 279,471 | |
| Off-balance sheet commitments given | 19,111 | | 787 | | 898 | | 7,508 | | 3,554 | | 31,858 | |
| | | | | | |
| 2021 | | | | | | |
| Financial liabilities | | | | | | |
| Derivative financial instruments | — | | 96 | | 61 | | 392 | | 517 | | 1,066 | |
| Other financial liabilities at fair value through profit or loss | — | | 6 | | 8 | | 553 | | 236 | | 803 | |
| Deposits by customers | 180,907 | | 3,706 | | 5,690 | | 1,920 | | 741 | | 192,964 | |
| Deposits by banks | 1,386 | | 536 | | 57 | | 31,984 | | — | | 33,963 | |
| Repurchase agreements – non trading | — | | 11,419 | | 299 | | — | | — | | 11,718 | |
| Debt securities in issue | — | | 5,011 | | 2,752 | | 16,754 | | 8,057 | | 32,574 | |
| Subordinated liabilities | — | | 32 | | 98 | | 1,547 | | 2,020 | | 3,697 | |
| Lease liabilities | — | | — | | 32 | | 79 | | 32 | | 143 | |
| Total financial liabilities | 182,293 | | 20,806 | | 8,997 | | 53,229 | | 11,603 | | 276,928 | |
| Off-balance sheet commitments given | 20,545 | | 5,359 | | 5,747 | | 5,523 | | 574 | | 37,748 | |
As the above table is based on contractual maturities, no account is taken of call features related to subordinated liabilities. In addition, the repayment terms of debt securities may be accelerated in line with relevant covenants. Further, no account is taken of the possible early repayment of Santander UK’s mortgage-backed non-recourse finance which is redeemed by Santander UK as funds become available from redemptions of the residential mortgages. Santander UK has no control over the timing and amount of redemptions of residential mortgages.
| | | | | | | | | | | | | | |
| Annual Report 2022 | Santander UK Group Holdings plc 253 |
| | | | | | | | | | | | | | | | | | | | | | | | | | | | | | | | | | | | | | | | | |
| Strategic Report | Sustainability and Responsible Banking | Governance | Risk review | Financial review | Financial
statements | Shareholder
information |
| | | | | | | | | | | | | |
| | | | | | | | | | | | | |
40. OFFSETTING FINANCIAL ASSETS AND LIABILITIES
The following table shows the impact of netting arrangements on:
–All financial assets and liabilities that are reported net on the balance sheet
–All derivative financial instruments and repurchase agreements and other similar secured lending and borrowing agreements that are subject to enforceable master netting arrangements or similar agreements, but do not qualify for balance sheet netting.
The table identifies the amounts that have been offset in the balance sheet and also those amounts that are covered by enforceable netting arrangements (offsetting arrangements and financial collateral) but do not qualify for netting under the requirements described above.
For derivative contracts, the ‘Financial instruments’ column identifies financial assets and liabilities that are subject to set off under netting agreements, such as the ISDA Master Agreement or derivative exchange or clearing counterparty agreements, whereby all outstanding transactions with the same counterparty can be offset and close-out netting applied across all outstanding transactions covered by the agreements if an event of default or other predetermined events occur. Financial collateral refers to cash and non-cash collateral obtained, typically daily or weekly, to cover the net exposure between counterparties by enabling the collateral to be realised in an event of default or if other predetermined events occur. For repurchase and reverse repurchase agreements and other similar secured lending and borrowing, the ‘Financial instruments’ column identifies financial assets and liabilities that are subject to set off under netting agreements, such as global master repurchase agreements and global master securities lending agreements, whereby all outstanding transactions with the same counterparty can be offset and close-out netting applied across all outstanding transactions covered by the agreements if an event of default or other predetermined events occur. Financial collateral typically comprises highly liquid securities which are legally transferred and can be liquidated if a counterparty defaults.
Santander UK engages in a variety of counterparty credit mitigation strategies in addition to netting and collateral arrangements. Therefore, the net amounts presented in the tables below do not purport to represent Santander UK’s actual credit exposure.
| | | | | | | | | | | | | | | | | | | | | | | | | | | | | |
| | | | | | | | | Group |
| Amounts subject to enforceable netting arrangements | | |
| Effects of offsetting on balance sheet | | Related amounts not offset | Assets not subject to enforceable netting arrangements(2) | |
| Gross
amounts | Amounts
offset | Net amounts
on balance sheet | | Financial
instruments | Financial collateral(1) | Net
amount | Balance sheet total(3) |
| 2022 | £m | £m | £m | | £m | £m | £m | £m | £m |
| Assets | | | | | | | | | |
| Derivative financial assets | 4,557 | | (2,173) | | 2,384 | | | (526) | | (1,720) | | 138 | | 55 | | 2,439 | |
| Reverse repurchase, securities borrowing & similar agreements: | | | | | | | | | |
| - Amortised cost | 8,826 | | (1,478) | | 7,348 | | | (9) | | (7,339) | | — | | — | | 7,348 | |
| | | | | | | | | |
Loans and advances to customers and banks(4) | 5,144 | | (908) | | 4,236 | | | — | | — | | 4,236 | | 220,709 | | 224,945 | |
| 18,527 | | (4,559) | | 13,968 | | | (535) | | (9,059) | | 4,374 | | 220,764 | | 234,732 | |
| Liabilities | | | | | | | | | |
| Derivative financial liabilities | 3,142 | | (2,173) | | 969 | | | (526) | | (158) | | 285 | | 39 | | 1,008 | |
| Repurchase, securities lending & similar agreements: | | | | | | | | | |
| - Amortised cost | 9,460 | | (1,478) | | 7,982 | | | (9) | | (7,973) | | — | | — | | 7,982 | |
| | | | | | | | | |
Deposits by customers and banks(4) | 3,265 | | (908) | | 2,357 | | | — | | — | | 2,357 | | 223,499 | | 225,856 | |
| 15,867 | | (4,559) | | 11,308 | | | (535) | | (8,131) | | 2,642 | | 223,538 | | 234,846 | |
| | | | | | | | | |
| 2021 | | | | | | | | | |
| Assets | | | | | | | | | |
| Derivative financial assets | 2,870 | | (1,221) | | 1,649 | | | (582) | | (693) | | 374 | | 72 | | 1,721 | |
| Reverse repurchase, securities borrowing & similar agreements: | | | | | | | | | |
| - Amortised cost | 14,882 | | (2,199) | | 12,683 | | | (435) | | (12,248) | | — | | — | | 12,683 | |
Loans and advances to customers and banks(4) | 4,316 | | (923) | | 3,393 | | | — | | — | | 3,393 | | 211,552 | | 214,945 | |
| 22,068 | | (4,343) | | 17,725 | | | (1,017) | | (12,941) | | 3,767 | | 211,624 | | 229,349 | |
| Liabilities | | | | | | | | | |
| Derivative financial liabilities | 2,197 | | (1,221) | | 976 | | | (582) | | (351) | | 43 | | 43 | | 1,019 | |
| Repurchase, securities lending & similar agreements: | | | | | | | | | |
| - Amortised cost | 13,917 | | (2,199) | | 11,718 | | | (435) | | (11,283) | | — | | — | | 11,718 | |
Deposits by customers and banks(4) | 2,683 | | (923) | | 1,760 | | | — | | — | | 1,760 | | 225,016 | | 226,776 | |
| 18,797 | | (4,343) | | 14,454 | | | (1,017) | | (11,634) | | 1,803 | | 225,059 | | 239,513 | |
(1)Financial collateral is reflected at its fair value but has been limited to the net balance sheet exposure so as not to include any over-collateralisation.
(2)This column includes contractual rights of set-off that are subject to uncertainty under the laws of the relevant jurisdiction.
(3)The balance sheet total is the sum of ‘Net amounts reported on the balance sheet’ that are subject to enforceable netting arrangements and ‘Amounts not subject to enforceable netting arrangements’.
(4)The amounts offset within loans and advances to customers/banks or deposits by customers/banks relate to offset mortgages which are classified as either and that are subject to netting.
| | | | | | | | | | | | | | |
| Annual Report 2022 | Santander UK Group Holdings plc 254 |
| | | | | | | | | | | | | | | | | | | | | | | | | | | | | | | | | | | | | | | | | |
| Strategic Report | Sustainability and Responsible Banking | Governance | Risk review | Financial review | Financial
statements | Shareholder
information |
| | | | | | | | | | | | | |
| | | | | | | | | | | | | |
41. INTEREST RATE BENCHMARK REFORM
Regulatory announcements
In March 2021, the FCA and ICE Benchmark Administration (IBA, the administrator of LIBOR) announced that GBP, Euro, Swiss franc and Japanese yen LIBOR settings, as well as settings for 1-week and 2-month US dollar LIBOR, would cease at the end of 2021, with the remaining US dollar LIBOR settings ceasing at the end of June 2023.
To help mitigate the risk of widespread disruption to legacy LIBOR contracts which had not transitioned by the end of 2021, in September 2021 the FCA confirmed its decision to use powers granted under the UK Benchmarks Regulation, to require continued publication using a synthetic methodology for the 1-month, 3-month and 6-month GBP and Japanese yen LIBOR settings until at least the end of 2022.
In September 2022, the FCA announced that for synthetic yen LIBOR setting, market participants should be prepared for publication to cease permanently at the end of 2022. The FCA also announced the continued publication of the 1-month and 6-month synthetic GBP LIBOR settings for a further 3 months after the end of 2022 until 31 March 2023 to support any remaining transition efforts. The FCA has no intention to use its powers to compel IBA to continue to publish the 1- and 6-month synthetic GBP LIBOR settings beyond this date and these settings will permanently cease immediately after their final publication on 31 March 2023.
In November 2022, the FCA proposed to require the IBA to continue to publish the 1-month, 3-month and 6-month US dollar LIBOR settings under an unrepresentative synthetic methodology until the end of September 2024, after which it is expected to cease permanently. For GBP LIBOR, the FCA announced that they intend to continue to require IBA to publish the 3-month synthetic GBP LIBOR setting until the end of March 2024, after which it will cease permanently.
The effect of these announcements and proposals is that the final LIBOR publication would be the end of September 2024:
–the 3 synthetic Japanese yen LIBOR settings ceased at end of December 2022
–the 1-month and 6-month synthetic GBP LIBOR settings will cease at the end of March 2023
–the overnight and 12-month USD LIBOR settings will cease at the end of June 2023
–the 3-month synthetic GBP LIBOR setting will cease at the end of March 2024, and
–the 1-month, 3-month and 6-month synthetic USD LIBOR settings would cease at the end of September 2024 (proposed).
Amendments to accounting standards
The IASB amended IFRS 9 ‘Financial Instruments’, IAS 39 ‘Financial Instruments: Recognition and Measurement’ and IFRS 7 ‘Financial Instruments: Disclosures’ in 2019 (the Phase 1 amendments) to provide temporary exceptions to specific hedge accounting requirements because of the uncertainty arising from the reform. The exceptions end at the earlier of when the uncertainty regarding the timing and the amount of interest rate benchmark-based cash flows is no longer present, and discontinuance of the hedge relationship (or reclassification of all amounts from the cash flow hedge reserve). The Phase 1 amendments continue to apply to Santander UK's GBP LIBOR cash flow hedges, for remaining legacy contracts, and USD LIBOR cash flow hedges (but not any using 1-week or 2-month USD LIBOR settings).
The IASB made further amendments to various IFRSs (the Phase 2 amendments) in 2020 to address issues that might affect financial reporting during the reform of an interest rate benchmark, including the effects of changes to contractual cash flows or hedging relationships arising from the replacement of an interest rate benchmark with an alternative benchmark rate. The Phase 2 amendments require entities, as a practical expedient, to account for a change in the basis for determining the contractual cash flows by updating the effective interest rate using the guidance in IFRS 9 resulting in no immediate gain or loss being recognised, as long as the change is directly required by IBOR reform and takes place on an economically equivalent basis. The practical expedient was applied to all instruments or contracts that transitioned to alternative benchmark interest rates during 2022 and had no material impact for the Santander UK group. The Phase 2 amendments also provide additional temporary reliefs from applying specific IAS 39 hedge accounting requirements to hedging relationships directly affected by IBOR reform. For GBP LIBOR cash flow hedges of remaining legacy contracts using 1-month and 6-month synthetic settings, the transition to alternative benchmark interest rates will take place no later than March 2023 and, for those using the 3-month synthetic setting, no later than March 2024. For USD LIBOR cash flow hedges, transition will take place no later than June 2023 for those using overnight and 12-month USD LIBOR settings and no later than September 2024 for those using 1-month, 3-month and 6-month synthetic USD LIBOR settings.
Managing LIBOR transition
During 2021, Santander UK along with its customers and counterparties, agreed the transition to alternative reference rates for the majority of agreements referencing the LIBOR settings that ceased at the end of 2021. During 2022, the LIBOR transition project was closed, and local business areas have continued to work with customers and counterparties to further reduce the number of untransitioned agreements, including those referencing synthetic LIBOR and the continuing USD LIBOR settings.
| | | | | | | | | | | | | | |
| Annual Report 2022 | Santander UK Group Holdings plc 255 |
| | | | | | | | | | | | | | | | | | | | | | | | | | | | | | | | | | | | | | | | | |
| Strategic Report | Sustainability and Responsible Banking | Governance | Risk review | Financial review | Financial
statements | Shareholder
information |
| | | | | | | | | | | | | |
| | | | | | | | | | | | | |
The following tables show the notional amounts of assets, liabilities and off-balance sheet commitments at 31 December 2022 and 31 December 2021 affected by IBOR reform that have yet to transition to an alternative benchmark interest rate. | | | | | | | | | | | | | | |
| | | | Group |
| | | | 2022 |
| GBP(2) LIBOR | USD(2) LIBOR | Other(2) | Total |
| £m | £m | £m | £m |
| Assets | | | | |
Derivatives(1) | — | | 1,665 | | — | | 1,665 | |
| | | | |
| Financial assets at amortised cost | 76 | | 245 | | — | | 321 | |
| | | | |
| 76 | | 1,910 | | — | | 1,986 | |
| Liabilities | | | | |
Derivatives(1) | 66 | | 1,846 | | — | | 1,912 | |
| | | | |
| Financial liabilities at amortised cost | — | | 2,491 | | — | | 2,491 | |
| 66 | | 4,337 | | — | | 4,403 | |
| Off-balance sheet commitments given | 2 | | — | | — | | 2 | |
| | | | | | | | | | | | | | |
| | | | |
| | | | 2021 |
| | | | |
| | | | |
| Assets | | | | |
Derivatives(1) | — | | 1,648 | | — | | 1,648 | |
| Other financial assets at fair value through profit and loss | 8 | | — | | — | | 8 | |
| Financial assets at amortised cost | 1,373 | | 81 | | 1 | | 1,455 | |
| | | | |
| 1,381 | | 1,729 | | 1 | | 3,111 | |
| Liabilities | | | | |
Derivatives(1) | 338 | | 1,975 | | — | | 2,313 | |
| Other financial liabilities at fair value through profit and loss | — | | 5 | | — | | 5 | |
| Financial liabilities at amortised cost | 34 | | 2,401 | | — | | 2,435 | |
| 372 | | 4,381 | | — | | 4,753 | |
| Off-balance sheet commitments given | 338 | | 59 | | — | | 397 | |
(1)Many of the Santander UK group's derivatives subject to IBOR reform are standard ISDA contracts and are subject to supplementary ISDA fallback provisions which became effective on 25 January 2021.
(2) Settings for GBP, JPY & NOK LIBOR & 1-week and 2-month USD LIBOR ceased on 31 December 2021 and for EONIA on 3 January 2022. For certain legacy contracts, while 1-month, 3-month and 6-month settings for JPY LIBOR ceased on 31 December 2022, 1-month and 6-month synthetic GBP LIBOR settings have been extended until the end of March 2023 and until the end of March 2024 for the 3-month synthetic GBP LIBOR setting. Overnight, and 12-month USD LIBOR settings will cease on 30 June 2023. For certain legacy contract, 1-month, 3-month and 6-month synthetic USD LIBOR settings would cease at the end of September 2024.
The following tables show the notional amount of derivatives in hedging relationships directly affected by uncertainties related to IBOR reform.
| | | | | | | | | | | | | | | | | | | | | |
| | 2022 | | | 2021 |
| | USD
LIBOR | | Total | | | USD
LIBOR | | Total |
| | £m | | £m | | | £m | | £m |
| Total notional value of hedging instruments | | | | | | | | | |
–Cash flow hedges | | 2,906 | | | 2,906 | | | | 2,586 | | | 2,586 | |
–Fair value hedges | | 178 | | | 178 | | | | 160 | | | 160 | |
| | 3,084 | | | 3,084 | | | | 2,746 | | | 2,746 | |
Maturing after cessation date(1) | | | | | | | | | |
–Cash flow hedges | | 2,906 | | | 2,906 | | | | 2,586 | | | 2,586 | |
–Fair value hedges | | 178 | | | 178 | | | | 160 | | | 160 | |
| | 3,084 | | | 3,084 | | | | 2,746 | | | 2,746 | |
(1)The 2-month USD LIBOR setting ceased on 31 December 2021. Overnight and 12-month USD LIBOR settings will cease on 30 June 2023. For certain legacy contracts, 1-month, 3-month and 6-month synthetic USD LIBOR settings would cease at the end of September 2024.
The Santander UK group’s USD LIBOR cash flow hedges extend beyond the anticipated cessation dates for LIBOR. The Santander UK group expects that USD LIBOR will be replaced by SOFR but there remains uncertainty over the timing and amount of the replacement rate cash flows for USD LIBOR cash flow hedges. Hedging relationships impacted by uncertainty about IBOR reform may experience ineffectiveness due to market participants’ expectations of when the shift from the existing IBOR benchmark rate to an alternative benchmark interest rate will occur or because transition of the hedged item and the hedging instrument could occur at different times.
The Santander UK group will cease to apply the assumptions that the hedged benchmark interest rate, the cash flows of the hedged item and/or hedging instrument will not be altered because of IBOR reform when the uncertainty arising from IBOR reform is no longer present. This will require amendment to hedge documentation by the end of the reporting period in which the changes occur. Cumulative changes in the hedged cash flows and the hedging instrument based on new alternative benchmark rates will also be remeasured when IBOR reform uncertainty is removed.
| | | | | | | | | | | | | | |
| Annual Report 2022 | Santander UK Group Holdings plc 256 |
| | | | | | | | | | | | | | | | | | | | | | | | | | | | | | | | | | | | | | | | | |
| Strategic Report | Sustainability and Responsible Banking | Governance | Risk review | Financial review | Financial
statements | Shareholder
information |
| | | | | | | | | | | | | |
| | | | | | | | | | | | | |
42. DISCONTINUED OPERATIONS AND ASSETS HELD FOR SALE
Discontinued operations
Transfer of the CIB Business
Santander UK plc transferred a significant part of its CIB business to the London branch of Banco Santander SA under a Part VII banking business transfer scheme, which completed on 11 October 2021. The residual parts of the CIB business were wound down or transferred to other segments. For the periods prior to its sale, the CIB business met the requirements for presentation as discontinued operations.
The financial performance and cash flow information relating to the discontinued operations were as follows:
For the years ended 31 December
| | | | | | | | | | | |
| | 2022 | 2021 | 2020 |
| £m | £m | £m |
| Net interest income | — | 33 | | 55 | |
| Net fee and commission income | — | 34 | | 65 | |
| Other operating income | — | 2 | | 2 | |
| Total operating income | — | 69 | | 122 | |
| Operating expenses before credit impairment (charges)/write-backs, provisions and charges | — | (32) | | (62) | |
| Credit impairment (charges)/write-backs | — | 11 | | (6) | |
| Provisions for other liabilities and charges | — | (4) | | (10) | |
| Total operating credit impairment (charges)/write-backs, provisions and charges | — | 7 | | (16) | |
| Profit from discontinued operations before tax | — | 44 | | 44 | |
| Tax on profit from discontinued operations | — | (12) | | (13) | |
| Profit from discontinued operations after tax | — | 32 | | 31 | |
There were no gains or losses recognised on the measurement to fair value less costs to sell or on the disposal of the asset groups constituting the discontinued operations. In 2022, the net cash flows attributable to the operating activities in respect of discontinued operations were £nil outflow (2021: £3,612m outflow, 2020: £1,815m outflow). There were no investing or financing activities in respect of discontinued operations.
Assets held for sale
Sale of property
Management considered the sale of Santander House and Shenley Wood freehold land and buildings, part of an agreement with the developer for the construction of Unity Place, to be highly probable at the balance sheet date. As such, the Santander UK group reclassified these properties, which are included in the Corporate Centre segment and carried at their sales prices, as held for sale. The sale is expected to complete in H2 2023 with no gain or loss.
At 31 December 2022, assets held for sale comprised:
| | | | | | | | |
| |
| 2022 | 2021 |
| £m | £m |
| Assets | | |
| | |
| | |
| | |
| | |
| | |
| | |
| | |
| | |
| | |
| | |
| | |
| | |
| Property, plant and equipment | 49 | | — | |
| | |
| | |
| | |
| Total assets held for sale | 49 | | — | |
| | |
| | |
| | |
| | |
| | |
| | |
| | |
| | |
| | |
| | |
| | |
| | |
| | |
| | |
| | |
43. EVENTS AFTER THE BALANCE SHEET DATE
There have been no significant events between 31 December 2022 and the date of approval of these financial statements which would require a change to or additional disclosure in the financial statements.
44. NOTES TO THE BALANCE SHEET
Restatement in the consolidated Balance sheet
In 2022, the macro hedge of interest rate risk balances increased significantly and are now disclosed separately on the face of the balance sheet rather than being included in Other assets and Other liabilities. Prior periods have been restated accordingly. As a result, at 31 December 2021, £85m (2020: £1,239m) has been reclassified from Other assets into the Macro hedge of interest rate risk asset, and £122m (2020: £188m) has been reclassified from Other liabilities into the Macro hedge of interest rate risk liability.
45. NON-CONTROLLING INTERESTS
| | | | | | | | | | | | |
| Initial interest rate | | 2022 | 2021 |
| % | | £m | £m |
| Santander UK plc issued: | | | | |
| – £300m Step-up Callable Perpetual Reserve Capital Instruments | 7.037 | | | — | | 235 | |
| | | — | | 235 | |
On 14 February 2022, the £300m Step-up Callable Perpetual Reserve Capital Instruments were called for value and redeemed at their principal amount.
| | | | | | | | | | | | | | |
| Annual Report 2022 | Santander UK Group Holdings plc 257 |
| | | | | | | | | | | | | | | | | | | | | | | | | | | | | | | | | | | | | | | | | |
| Strategic Report | Sustainability and Responsible Banking | Governance | Risk review | Financial review | Financial
statements | Shareholder
information |
| | | | | | | | | | | | | |
| | | | | | | | | | | | | |
46. COMPANY FINANCIAL DATA
Company Balance Sheet
At 31 December
| | | | | | | | | | | |
| | 2022 | 2021 |
| Notes | £m | £m |
| Assets | | | |
| Other financial assets at fair value through profit or loss | 4 | 7,888 | | 4,190 | |
| Loans and advances to banks | 5 | 4,800 | | 5,926 | |
| Other financial assets at amortised cost | 6 | 942 | | 838 | |
| Interests in other entities | 7 | 13,640 | | 13,590 | |
| Current tax assets | | 19 | | 15 | |
| Other assets | | 2 | | 2 | |
| Total assets | | 27,291 | | 24,561 | |
| Liabilities | | | |
| Other financial liabilities at fair value through profit or loss | 8 | 7,888 | | 4,190 | |
| Deposits by banks | 9 | — | | 7 | |
| Debt securities in issue | 10 | 4,898 | | 6,013 | |
| Subordinated liabilities | 11 | 942 | | 838 | |
| | | |
| Total liabilities | | 13,728 | | 11,048 | |
| Equity | | | |
| Share capital | 14 | 7,060 | | 7,060 | |
| Other equity instruments | 15 | 2,196 | | 2,191 | |
| Retained earnings | | 4,307 | | 4,262 | |
| Total shareholders’ equity | | 13,563 | | 13,513 | |
| Total liabilities and equity | | 27,291 | | 24,561 | |
The accompanying Notes form an integral part of these Financial Statements.
The profit after tax of the Company attributable to shareholders was £1,206m (2021: £1,499m). As permitted by Section 408 of the UK Companies Act 2006, the Company’s income statement has not been presented.
The Financial Statements were approved and authorised for issue by the Board on 1 March 2023 and signed on its behalf by:
| | | | | |
| Mike Regnier | Madhukar Dayal |
| Chief Executive Officer | Chief Financial Officer |
| Company Registered Number: 08700698 | |
| | | | | | | | | | | | | | |
| Annual Report 2022 | Santander UK Group Holdings plc 258 |
| | | | | | | | | | | | | | | | | | | | | | | | | | | | | | | | | | | | | | | | | |
| Strategic Report | Sustainability and Responsible Banking | Governance | Risk review | Financial review | Financial
statements | Shareholder
information |
| | | | | | | | | | | | | |
| | | | | | | | | | | | | |
Company Cash Flow Statement(1)
At 31 December
| | | | | | | | |
| 2022 | 2021 |
| £m | £m |
| Cash flows from operating activities | | |
| Profit before tax | 1,202 | | 1,495 | |
| Adjustments for: | | |
| Non-cash items included in profit | 9 | | 1 | |
| Net change in operating assets and liabilities | 363 | | 1,937 | |
| | |
| Effects of exchange rate differences | 980 | | (94) | |
| Net cash flows from operating activities | 2,554 | | 3,339 | |
| Cash flows from investing activities | | |
| Purchase of financial assets at amortised cost and financial assets at fair value | (3,802) | | (2,774) | |
| | |
| Investments in other entities | (50) | | — | |
| Net cash flows from investing activities | (3,852) | | (2,774) | |
| Cash flows from financing activities | | |
| Issue of other equity instruments | 750 | | 450 | |
| | |
| Issue of debt securities and subordinated notes | 3,898 | | 2,797 | |
| Repayment of debt securities | (1,446) | | (8) | |
| Repurchase of other equity instruments | (750) | | (1,814) | |
| Issuance costs of debt securities and subordinated notes | (9) | | (500) | |
| Dividends paid on ordinary shares | (1,013) | | (1,346) | |
| Dividends paid on other equity instruments | (143) | | (143) | |
| | |
| Net cash flows from financing activities | 1,287 | | (564) | |
| Change in cash and cash equivalents | (11) | | 1 | |
| Cash and cash equivalents at beginning of the year | 52 | | 51 | |
| Cash and cash equivalents at the end of the year | 41 | | 52 | |
(1) For more information on cash flows and amounts restated see Note 12.
The accompanying Notes form an integral part of these Financial Statements.
| | | | | | | | | | | | | | |
| Annual Report 2022 | Santander UK Group Holdings plc 259 |
| | | | | | | | | | | | | | | | | | | | | | | | | | | | | | | | | | | | | | | | | |
| Strategic Report | Sustainability and Responsible Banking | Governance | Risk review | Financial review | Financial
statements | Shareholder
information |
| | | | | | | | | | | | | |
| | | | | | | | | | | | | |
Company Statement of Changes in Equity
For the years ended 31 December
| | | | | | | | | | | | | | |
| Share capital | Other equity instruments | Retained earnings | Total |
| £m | £m | £m | £m |
| At 1 January 2022 | 7,060 | | 2,191 | | 4,262 | | 13,513 | |
Total comprehensive income:(1) | | | | |
| Profit after tax | — | | — | | 1,206 | | 1,206 | |
| Issue of other equity instruments | — | | 750 | | — | | 750 | |
| Repurchase of other equity instruments | — | | (745) | | (5) | | (750) | |
| Dividends on ordinary shares | — | | — | | (1,013) | | (1,013) | |
| Dividends on other equity instruments | — | | — | | (143) | | (143) | |
| At 31 December 2022 | 7,060 | | 2,196 | | 4,307 | | 13,563 | |
| | | | |
| At 1 January 2021 | 7,060 | | 2,241 | | 4,252 | | 13,553 | |
Total comprehensive income:(1) | | | | |
| Profit after tax | — | | — | | 1,499 | | 1,499 | |
| Issue of other equity instruments | — | | 450 | | — | | 450 | |
| Repurchase of other equity instruments | — | | (500) | | — | | (500) | |
| Dividends on ordinary shares | — | | — | | (1,346) | | (1,346) | |
| Dividends on other equity instruments | — | | — | | (143) | | (143) | |
| At 31 December 2021 | 7,060 | | 2,191 | | 4,262 | | 13,513 | |
(1)Total comprehensive income comprises only the profit for the year; no statement of comprehensive income has been shown for the Company, as permitted by Section 408 of the UK Companies Act 2006.
The accompanying Notes form an integral part of these Financial Statements.
Company Income Statement
For the years ended 31 December
| | | | | | | | | | | | | | |
| | 2022 | 2021 | 2020 |
| Notes | £m | £m | £m |
| Interest and similar income | | 192 | | 221 | | 309 | |
| Interest expense and similar charges | | (196) | | (225) | | (312) | |
| Net interest income | | (4) | | (4) | | (3) | |
| | | | |
| | | | |
| | | | |
| Dividend income | | 1,212 | | 1,497 | | 260 | |
| Other operating income | | — | | 8 | | (15) | |
| Total operating income | | 1,208 | | 1,501 | | 242 | |
| Operating expenses before credit impairment (charges)/write-backs, provisions and charges | 2 | (6) | | (6) | | (7) | |
| | | | |
| | | | |
| | | | |
| Profit before tax | | 1,202 | | 1,495 | | 235 | |
| Tax on profit | | 4 | | 4 | | 5 | |
| Profit after tax | | 1,206 | | 1,499 | | 240 | |
| | | | | | | | | | | | | | |
| Annual Report 2022 | Santander UK Group Holdings plc 260 |
| | | | | | | | | | | | | | | | | | | | | | | | | | | | | | | | | | | | | | | | | |
| Strategic Report | Sustainability and Responsible Banking | Governance | Risk review | Financial review | Financial
statements | Shareholder
information |
| | | | | | | | | | | | | |
| | | | | | | | | | | | | |
46.1 ACCOUNTING POLICIES
These financial statements are prepared for Santander UK Group Holdings plc (the Company) under the Companies Act 2006. The principal activity of the Company is a financial services holding company. Santander UK Group Holdings plc is a public limited company incorporated in England and Wales having a registered office in England.
Compliance with International Financial Reporting Standards
The Company’s financial statements comply with UK-adopted international accounting standards. The financial statements are also prepared in accordance with International Financial Reporting Standards (IFRSs) as issued by the International Accounting Standards Board (IASB), including interpretations issued by the IFRS Interpretations Committee, as there are no applicable differences from IFRSs as issued by the IASB for the periods presented.
Climate change
Management specifically also considered the potential impact of climate change and the transition to a low carbon economy on its Investment in Santander UK plc. Estimates underpinning the determination of whether or not the cost of the investment is impaired are partly based on forecast business performance beyond the time horizon for management's detailed plans. .
Critical judgements and accounting estimates
The preparation of the financial statements requires management to make judgements and accounting estimates that affect the reported amount of assets and liabilities at the date of the financial statements and the reported amount of income and expenses during the reporting period. Management evaluates its judgements and accounting estimates, which are based on historical experience and on various other factors that are believed to be reasonable under the circumstances, on an ongoing basis. Actual results may differ from these accounting estimates under different assumptions or conditions. In preparing the financial statements, no significant judgements have been made in the process of applying the accounting policies, other than those involving estimations about interests in other entities.
Interests in other entities - Investment in subsidiaries
The carrying amount of investments in subsidiaries is based on the application of judgements including the basis of the cost of investment impairment calculation assumptions. Santander UK undertakes an annual assessment to evaluate whether the carrying amount of investments in subsidiaries is impaired, carrying out this assessment more frequently if reviews identify indicators of impairment or when events or changes in circumstances dictate.
| | | | | |
| Key judgements: | –Determining the basis of investment impairment testing methodology, including the need for planning assumptions and internal capital allocations |
| Key estimates: | –Forecast cash flows for investments, including estimated allocations of regulatory capital |
| –Growth rate beyond initial cash flow projections |
| –Discount rates which factor in risk-free rates and applicable risk premiums |
| All of these variables are subject to fluctuations in external market rates and economic conditions beyond management’s control |
The estimation of future cash flows and the level to which they are discounted is inherently uncertain and requires significant judgement and is subject to potential change over time. For more on these assumptions, including changes in the assumptions that would trigger an impairment, see Note 46.7.
46.2 OPERATING EXPENSES BEFORE CREDIT IMPAIRMENT CHARGES, PROVISIONS AND CHARGES
These comprise wages and salaries of £6m (2021: £6m) recharged by the operating company, Santander UK plc. In 2022 and 2021, the Company had no full-time staff as they are all employed by Santander UK plc.
46.3 DIVIDENDS ON ORDINARY SHARES
Dividends on ordinary shares declared and paid during the year are set out in Note 10 to the Consolidated Financial Statements.
46.4 OTHER FINANCIAL ASSETS AT FAIR VALUE THROUGH PROFIT OR LOSS
| | | | | | | | |
| 2022 | 2021 |
| £m | £m |
| Debt securities | 7,888 | | 4,190 | |
| 7,888 | | 4,190 | |
Other financial assets at FVTPL comprised £7,888m (2021: £4,190m) of financial assets mandatorily held at FVTPL. In 2022, as part of MREL requirements, the Company issued £3,991m (2021: £2,847m) debt securities, which were subsequently downstreamed to Santander UK plc.
| | | | | | | | | | | | | | |
| Annual Report 2022 | Santander UK Group Holdings plc 261 |
| | | | | | | | | | | | | | | | | | | | | | | | | | | | | | | | | | | | | | | | | |
| Strategic Report | Sustainability and Responsible Banking | Governance | Risk review | Financial review | Financial
statements | Shareholder
information |
| | | | | | | | | | | | | |
| | | | | | | | | | | | | |
46.5 LOANS AND ADVANCES TO BANKS
Loans and advances to banks comprise mainly amounts due from Santander UK group undertakings. The fair values of loans and advances to banks are equal to their carrying amounts. In 2022 and 2021, there were no material expected credit losses. All of our senior debt issued out of Santander UK Group Holdings plc is downstreamed to our principal operating company Santander UK plc.
46.6 OTHER FINANCIAL ASSETS AT AMORTISED COST
These consist of investments in subordinated notes and have a maturity greater than 10 years.
46.7 INTERESTS IN OTHER ENTITIES
| | | | | | | | |
| 2022 | 2021 |
| £m | £m |
| Interests in ordinary shares of subsidiaries | 11,635 | | 11,635 | |
| £500m Fixed Rate Reset Perpetual AT1 Capital Securities | 495 | | 495 | |
| £750m Fixed Rate Reset Perpetual AT1 Capital Securities | 750 | | 750 | |
| £500m Fixed Rate Reset Perpetual AT1 Capital Securities | 210 | | 210 | |
| £500m Fixed Rate Reset Perpetual AT1 Capital Securities | 500 | | 500 | |
| | |
| £50m Fixed Rate Reset Perpetual Capital Securities | 50 | | — | |
| 13,640 | | 13,590 | |
Details of subsidiaries and joint ventures are set out in the Shareholder information section. For information on AT1 Capital Securities, see Note 33 to the Consolidated Financial Statements. The Company has no interests in joint ventures or associates.
Interests in other entities mainly relate to investments in 100% of the ordinary share capital of Santander UK plc, Santander Financial Services plc and Santander Equity Investments Limited, as well as holdings of AT1 Capital Securities issued by Santander UK plc.
Interests in subsidiaries are held at cost subject to impairment.
The Company’s interests in subsidiaries was as follows:
| | | | | | | | | | | |
| Cost | Impairment | Carrying amount |
| £m | £m | £m |
| At 31 December 2022 | 11,645 | | (10) | | 11,635 | |
| | | |
| At 31 December 2021 | 11,645 | | (10) | | 11,635 | |
Impairment testing
Interests in other entities are tested for impairment annually at 31 December. Interests in other entities are otherwise tested for impairment if reviews identify an indicator of impairment or when events or changes in circumstances dictate. Impairment is required where the carrying value of an investment exceeds its recoverable amount.
Basis of the recoverable amount
The recoverable amount of all interests in other entities was determined based on a value in use (VIU) methodology at each testing date. For each investment, the VIU is calculated by discounting management’s cash flow projections for the investment. The cash flow projections also take account of increased internal capital allocations needed to achieve internal and regulatory capital targets including the leverage ratio. The key assumptions used in the VIU calculation for each investment are set out below.
Carrying amount of investments and key assumptions in the VIU calculation
| | | | | | | | | | | | | | | | | | | | | | | | | | |
| Carrying amount of investment | | Discount rate | | Growth rate beyond initial cash flow projections |
| 2022 | 2021 | | 2022 | 2021 | | 2022 | 2021 |
| Investment | £m | £m | | % | % | | % | % |
| Santander UK plc | 11,268 | | 11,267 | | | 16.9 | | 13.6 | | | 1.6 | | 1.6 | |
| Santander Financial Services plc | 337 | | 337 | | | 16.7 | | 15.6 | | | 1.6 | | 1.6 | |
| Other | 30 | | 31 | | | | | | | |
| 11,635 | | 11,635 | | | | | | | |
| | | | | | | | | | | | | | |
| Annual Report 2022 | Santander UK Group Holdings plc 262 |
| | | | | | | | | | | | | | | | | | | | | | | | | | | | | | | | | | | | | | | | | |
| Strategic Report | Sustainability and Responsible Banking | Governance | Risk review | Financial review | Financial
statements | Shareholder
information |
| | | | | | | | | | | | | |
| | | | | | | | | | | | | |
Management’s judgement in estimating the cash flows of an investment
The VIU calculation uses cash flow projections derived from the latest 3-year plan presented to the Board. For more details, see Note 20 to the Consolidated Financial Statements.
Cash flow projections for the purpose of impairment testing do not take account of any adverse outcomes arising from contingent liabilities (see Note 31 to the Consolidated Financial Statements), whose existence will be confirmed by uncertain future events or where any obligation is not probable or otherwise cannot be measured reliably, nor do they take account of the benefits arising from Santander UK’s transformation plans that had not yet been implemented or committed at 31 December 2022.
Discount rate
The rate used to discount the cash flows is based on the cost of equity assigned to each investment, which is derived using a CAPM. The CAPM depends on a number of inputs reflecting financial and economic variables, including the risk-free rate and a premium to reflect the inherent risk of the investment being evaluated. These variables are based on the market’s assessment of the economic variables and management’s judgement. In determining the discount rate, management have identified the cost of equity associated with market participants that closely resemble our investments and adjusted them for tax to arrive at the pre-tax equivalent rate.
Growth rate beyond initial cash flow projections
The growth rate for periods beyond the initial cash flow projections is used to extrapolate the cash flows in perpetuity because of the long-term perspective of the business. In line with the accounting requirements, management uses the UK Government’s official estimate of the UK long-term average GDP growth rate, as this is lower than management's estimate of the long-term average growth rate of the business.
Investments in Santander UK plc and Santander Financial Services plc
The VIU of each investment remains higher than the carrying value of the investment. The VIU review at 31 December 2022 did not indicate the need for an impairment in the Company’s investments in Santander UK plc and Santander Financial Services plc. Management considered the reduction in headroom and the uncertainty relating to the respective estimates of the VIU for those investments, but determined that there was a sufficient basis to conclude that no impairment was required.
Sensitivities of key assumptions in calculating the VIU of the investment in Santander UK plc
At 31 December 2022 and 2021, the VIU was sensitive to reasonably possible changes in the key assumptions similar to those applied in determining the recoverable amount of goodwill recognised in the Santander UK plc group (see Note 20 to the Consolidated Financial Statements). In addition, given the lack of significant headroom, the VIU is sensitive to the UK long-term average GDP growth rate assumption.
At 31 December 2022 and 2021, a reasonably possible change in the following key assumptions in relation to the VIU calculation for the Company’s investment in Santander UK plc would have resulted in a reduction in headroom, as shown in the table below. The sensitivity analysis presented below has been prepared on the basis that a change in each key assumption would not have a consequential impact on other assumptions used in the impairment review. However, due to the interrelationships between some of the assumptions, a change in one of the assumptions might impact one or more of the other assumptions and could result in a larger or smaller overall impact.
| | | | | | | | | | | |
| | Reduction in headroom |
| | 2022 | 2021 |
| Subsidiary | Reasonably possible change | £m | £m |
| Santander UK plc | Cash flow projections decrease by 5% (2021: 5%) | (773) | | (607) | |
| Discount rate increases by 100 basis points (2021: 100 basis points) | (1,212) | | (1,261) | |
| GDP growth rate decreases by 10 basis points (2021: 10 basis points) | (42) | | (24) | |
The decrease in cash flow projections in the table above includes the impact of holding back the required capital to support the growth of the business. Under current regulatory capital regulations as they apply to Santander UK plc, the calculation is not sensitive overall to the UK long-term average GDP growth rate assumption as the increased profit after tax generated by growth of the business is mostly offset by the need to retain more profit to meet increased regulatory capital requirements driven by the growth in assets.
Sensitivity of VIU changes to current assumptions to achieve nil headroom
Although there was no impairment of the Company's investment in Santander UK plc at 31 December 2022 and 2021, the test remains sensitive to some of the assumptions used, as described above. In addition, the changes in assumptions detailed below for the discount rate and cash flow projections would eliminate the current headroom. As a result, there is a risk of impairment in the future should business performance or economic factors diverge from forecasts.
The sensitivity analysis presented below has been prepared on the basis that a change in each key assumption would not have a consequential impact on other assumptions used in the impairment review. However, due to the interrelationships between some of the assumptions, a change in one of the assumptions might impact one or more of the other assumptions and could result in a larger or smaller overall impact.
| | | | | | | | | | | | | | | | | |
| | | | | |
| 2022 | Carrying value | Value in use | Headroom | Increase in post tax discount rate | Decrease in cash flows |
| Subsidiary | £m | £m | £m | bps | % |
| Santander UK plc | 11,268 | | 15,461 | | 4,193 | | 450 | 27 | |
| | | | | | | | | | | | | | | | | |
| | | | | |
| | | | | |
| 2021 | | | | | |
| Santander UK plc | 11,267 | | 12,147 | | 880 | | 67 | 7 | |
| | | | | | | | | | | | | | |
| Annual Report 2022 | Santander UK Group Holdings plc 263 |
| | | | | | | | | | | | | | | | | | | | | | | | | | | | | | | | | | | | | | | | | |
| Strategic Report | Sustainability and Responsible Banking | Governance | Risk review | Financial review | Financial
statements | Shareholder
information |
| | | | | | | | | | | | | |
| | | | | | | | | | | | | |
Sensitivities of key assumptions in calculating the VIU of the investment in Santander Financial Services plc
At 31 December 2022 and 2021, the VIU was sensitive to reasonably possible changes in the key assumptions for the discount rate and cash flows similar to those applied in determining the recoverable amount of goodwill recognised in the Santander UK plc group (see Note 20 to the Consolidated Financial Statements). In line with the position for Santander UK plc, the VIU is not sensitive to the UK long-term average GDP growth rate assumption overall as the increased profit after tax generated by growth of the business is mostly offset by the need to retain more profit to meet increased regulatory capital requirements driven by the growth in assets.
At 31 December 2022 and 2021, a reasonably possible change in the following key assumptions in relation to the VIU calculation for the Company’s investment in Santander Financial Services plc would have resulted in a reduction in headroom, as shown in the table below. The sensitivity analysis presented below has been prepared on the basis that a change in each key assumption would not have a consequential impact on other assumptions used in the impairment review. However, due to the interrelationships between some of the assumptions, a change in one of the assumptions might impact one or more of the other assumptions and could result in a larger or smaller overall impact.
| | | | | | | | | | | |
| | Reduction in headroom |
| | 2022 | 2021 |
| Subsidiary | Reasonably possible change | £m | £m |
| Santander Financial Services plc | Cash flow projections decrease by 5% (2021: 5%) | (18) | | (19) | |
| Discount rate increases by 100 basis points (2021: 100 basis points) | (29) | | (28) | |
The decrease in cash flow projections in the table above includes the impact of holding back the required capital to support the growth of the business.
Sensitivity of VIU changes to current assumptions to achieve nil headroom
Although there was no impairment of the Company's investment in Santander Financial Services plc at 31 December 2022 and 2021, the test remains sensitive to some of the assumptions used, as described above. In addition, the changes in assumptions detailed below for the discount rate and cash flow projections would eliminate the current headroom. As a result, there is a risk of impairment in the future should business performance or economic factors diverge from forecasts.
The sensitivity analysis presented below has been prepared on the basis that a change in each key assumption would not have a consequential impact on other assumptions used in the impairment review. However, due to the interrelationships between some of the assumptions, a change in one of the assumptions might impact one or more of the other assumptions and could result in a larger or smaller overall impact.
| | | | | | | | | | | | | | | | | | |
| | | | | | |
| 2022 | Carrying value | Value in use | Headroom | Increase in post tax discount rate | | Decrease in cash flows |
| Subsidiary | £m | £m | £m | bps | | % |
| Santander Financial Services plc | 337 | | 359 | | 22 | | 75 | | 6 | |
| | | | | | | | | | | | | | | | | | |
| | | | | | |
| | | | | | |
| 2021 | | | | | | |
| Santander Financial Services plc | 337 | | 376 | | 39 | | 145 | | 10 | |
46.8 OTHER FINANCIAL LIABILITIES AT FAIR VALUE THROUGH PROFIT OR LOSS
| | | | | | | | |
| 2022 | 2021 |
| £m | £m |
| Medium-term notes | 7,888 | | 4,190 | |
| 7,888 | | 4,190 | |
Other financial liabilities at FVTPL comprised £7,888m (2021: £4,190m) of other financial liabilities designated at FVTPL.
In 2022, as part of MREL requirements, the Company issued £3,991m (2021: £2,847m) of debt securities, which were then downstreamed to Santander UK plc.
Gains and losses arising from changes in the credit spread of securities issued by the Santander UK group reverse over the contractual life of the debt, provided that the debt is not repaid at a premium or a discount. The cumulative net gain or loss at 31 December 2022, and net gain or loss for the year attributable to changes in the Santander UK group’s own credit risk on the above securities was £nil (2021: £nil) and has been included in profit and loss to offset credit risk on internal MREL assets held which are required to be recorded at FVTPL in accordance with IFRS 9.
At 31 December 2022, the amount that would be required to be contractually paid at maturity of the securities above was £755m higher (2021: £26m higher) than the carrying value.
| | | | | | | | | | | | | | |
| Annual Report 2022 | Santander UK Group Holdings plc 264 |
| | | | | | | | | | | | | | | | | | | | | | | | | | | | | | | | | | | | | | | | | |
| Strategic Report | Sustainability and Responsible Banking | Governance | Risk review | Financial review | Financial
statements | Shareholder
information |
| | | | | | | | | | | | | |
| | | | | | | | | | | | | |
46.9 DEPOSITS BY BANKS
These consist of amounts due to subsidiaries under loan agreements and are repayable on demand.
46.10 DEBT SECURITIES IN ISSUE
The Company issues notes in the US from time to time pursuant to a shelf registration statement on Form F-3 filed with the SEC in 2021.
| | | | | | | | |
| 2022 | 2021 |
| £m | £m |
| Medium-term notes: | | |
| – Euro 30bn Euro Medium Term Note Programme | 2,387 | | 3,028 | |
| – US SEC-registered Debt Programme – Santander UK Group Holdings plc | 2,511 | | 2,985 | |
| 4,898 | | 6,013 | |
The funding from the Euro 30bn Euro Medium Term Note Programme and the US SEC-registered Debt Programme in the name of Santander UK Group Holdings plc has predominantly been downstreamed to our operating company Santander UK plc.
Debt securities in issue include £2m due from Santander UK group undertakings.
46.11 SUBORDINATED LIABILITIES
| | | | | | | | | | | |
| | 2022 | 2021 |
| Dated subordinated liabilities | Maturity | £m | £m |
| 4.75% Subordinated notes (US$1,000m) | 2025 | 608 | | 541 | |
| 5.625% Subordinated notes (US$500m) | 2045 | 334 | | 297 | |
| | 942 | | 838 | |
46.12 NOTES TO CASH FLOWS
Changes in liabilities arising from financing activities
In addition to the changes in equity arising from financing activities, as set out in the Company Statement of Changes in Equity, the table below shows the changes in liabilities arising from financing activities.
| | | | | | | | | | | | | | | | | | | | | | | | | | | | | | | | | | | | | | | | | | | |
| 2022 | | 2021 |
| Balance sheet line item | | | | | Balance sheet line item | | | |
| Debt securities in issue | Other liabilities at FVTPL(1) | Subordinated liabilities | Other equity instruments | | Dividends paid | Total | | Debt securities in issue | Other liabilities at FVTPL(1) | Subordinated liabilities | Other equity instruments | | Dividends paid | Total |
| £m | £m | £m | £m | | £m | £m | | £m | £m | £m | £m | | £m | £m |
| At 1 January | 6,013 | | 4,190 | | 838 | | 2,191 | | | — | | 13,232 | | | 7,970 | | 1,425 | | 830 | | 2,241 | | | — | | 12,466 | |
| Proceeds from issue of debt securities | — | | 3,889 | | — | | — | | | — | | 3,889 | | | — | | 2,788 | | — | | — | | | — | | 2,788 | |
| Repayment of debt securities | (1,446) | | — | | — | | — | | | — | | (1,446) | | | (1,814) | | — | | — | | — | | | — | | (1,814) | |
| | | | | | | | | | | | | | | |
| | | | | | | | | | | | | | | |
| Issue of other equity instruments | — | | — | | — | | 750 | | | — | | 750 | | | — | | — | | — | | 450 | | | — | | 450 | |
| Repurchase of other equity instruments | — | | — | | — | | (750) | | | — | | (750) | | | — | | — | | — | | (500) | | | — | | (500) | |
| | | | | | | | | | | | | | | |
| Dividends paid | — | | — | | — | | — | | | (1,156) | | (1,156) | | | — | | — | | — | | — | | | (1,489) | | (1,489) | |
| Liability-related other changes | (14) | | (191) | | 1 | | 5 | | | — | | (199) | | | (28) | | (23) | | — | | — | | | — | | (51) | |
| Non-cash changes: | | | | | | | | | | | | | | | |
| – Unrealised foreign exchange | 339 | | — | | 103 | | — | | | — | | 442 | | | (124) | | — | | 8 | | — | | | — | | (116) | |
| – Other changes | 6 | | — | | — | | — | | | 1,156 | | 1,162 | | | 9 | | — | | — | | — | | | 1,489 | | 1,498 | |
| At 31 December | 4,898 | | 7,888 | | 942 | | 2,196 | | | — | | 15,924 | | | 6,013 | | 4,190 | | 838 | | 2,191 | | | — | | 13,232 | |
(1) Liability-related other changes for Other liabilities at FVTPL are not part of the changes in liability arising from financing activities.
| | | | | | | | | | | | | | |
| Annual Report 2022 | Santander UK Group Holdings plc 265 |
| | | | | | | | | | | | | | | | | | | | | | | | | | | | | | | | | | | | | | | | | |
| Strategic Report | Sustainability and Responsible Banking | Governance | Risk review | Financial review | Financial
statements | Shareholder
information |
| | | | | | | | | | | | | |
| | | | | | | | | | | | | |
Footnotes to the cash flow statement
Net cash flows from operating activities includes interest received of £202m (2021: £245m), interest paid of £159m (2021: £240m) and dividends received of £1212m (2021: £1497m).
Restatements in the Company cash flow statement
The presentation of the company cash flow statement has changed to present 'profit before tax' within cash flows from operating activities instead of 'profit after tax'. Prior periods have been restated. As a result, for the year ended 31 December 2021, the adjustment for 'non-cash items included in profit' within cash flows from operating activities has been decreased by £4m.
46.13 CONTINGENT LIABILITIES AND COMMITMENTS
Details of the capital support arrangements entered into by the Company are set out in Note 31 to the Consolidated Financial Statements.
46.14 SHARE CAPITAL
Details of the Company’s share capital are set out in Note 32 to the Consolidated Financial Statements.
46.15 OTHER EQUITY INSTRUMENTS
Details of the Company’s other equity instruments are set out in Note 33 to the Consolidated Financial Statements.
46.16 TRANSACTIONS WITH DIRECTORS AND OTHER KEY MANAGEMENT PERSONNEL
The Directors of Santander UK Group Holdings plc did not receive any remuneration in respect of their services to the Company. The remuneration disclosures in respect of the Santander UK group are set out in Note 37 to the Consolidated Financial Statements.
46.17 RELATED PARTY TRANSACTIONS
The Company’s significant transactions with related parties arise in connection with:
–Dividend income from subsidiaries of £1,212m (2021: £1,497m, 2020: £260m),
–Dividends on ordinary shares declared and paid during the year are set out in Note 10 to the Consolidated Financial Statements.
–Loans and advances to banks include £4,759m due from Santander UK group undertakings,
–Other financial assets at amortised cost, see Note 46.6, all of which are securities issued by Santander UK plc,
–Other financial liabilities at fair value through profit or loss, see Note 46.8, all of which are securities subscribed for by Santander UK plc,
–Deposits by banks, see Note 46.9,
–Debt securities, see Note 46.10.
46.18 EVENTS AFTER THE BALANCE SHEET DATE
See Note 43 to the Consolidated Financial Statements.
46.19. INTEREST RATE BENCHMARK REFORM
At 31 December 2022, the Company had £2,491m (2021: £2,217m) of USD LIBOR-linked Financial liabilities at amortised cost that were affected by IBOR reform and have yet to transition to an alternative benchmark interest rate as provided internally to key management personnel.
Further details of the significant interest rate benchmarks to which hedging relationships are exposed, the extent of risk exposure that is affected by IBOR reform, the effect of IBOR reform on interest rate risk management and how Santander UK's transition to alternative benchmark interest rates is being managed, are disclosed in Note 41 to the Consolidated Financial Statements.
| | | | | | | | | | | | | | |
| Annual Report 2022 | Santander UK Group Holdings plc 266 |
| | | | | | | | | | | | | | | | | | | | | | | | | | | | | | | | | | | | | | | | | |
| Strategic Report | Sustainability and Responsible Banking | Governance | Risk review | Financial review | Financial
statements | Shareholder
information |
| | | | | | | | | | | | | |
| | | | | | | | | | | | | |
| | | | | | | | | | | |
| Shareholder information | | | |
| | Contents | |
| | Subsidiaries and related undertakings | |
| | Forward-looking statements | |
| | | |
| | Risk factors | |
| | Regulation of the Santander UK group | |
| | Articles of Association | |
| | Iran Threat Reduction and Syria Human Rights Act (ITRA) | |
| | Board of Directors | |
| | New York Stock Exchange (NYSE) Corporate Governance | |
| | Other information | |
| | Additional balance sheet and cash flow analysis | |
| | Taxation for US investors | |
| | Glossary of financial services industry terms | |
| | Cross-reference to Form 20-F | |
| | | | | | | | | | | | | | |
| Annual Report 2022 | Santander UK Group Holdings plc 267 |
| | | | | | | | | | | | | | | | | | | | | | | | | | | | | | | | | | | | | | | | | |
| Strategic Report | Sustainability and Responsible Banking | Governance | Risk review | Financial review | Financial
statements | Shareholder
information |
| | | | | | | | | | | | | |
| | | | | | | | | | | | | |
Subsidiaries and related undertakings (audited)
In accordance with Section 409 of the Companies Act 2006, details of the Company’s subsidiaries and related undertakings at 31 December 2022 are set out below.
Subsidiaries
All subsidiaries are owned 100% and consolidated by Santander UK.
Incorporated and registered in England and Wales:
| | | | | | | | | | | | | | |
| Registered office(1) | Direct/Indirect ownership | Share class through which ownership is held | Proportion of ownership interest |
| Name of subsidiary | % |
| 2 & 3 Triton Limited | A | Indirect | Ordinary £1 | — |
| A & L CF June (2) Limited | A | Indirect | Ordinary £1 | — |
| A & L CF June (3) Limited | A | Indirect | Ordinary £1 | — |
| A & L CF March (5) Limited | A | Indirect | Ordinary £1 | — |
| A & L CF September (4) Limited | A | Indirect | Ordinary £1 | — |
| Abbey National Beta Investments Limited | A | Indirect | Ordinary £1 | — |
| Abbey National Business Office Equipment Leasing Limited | A | Indirect | Ordinary £1 | — |
| Abbey National Nominees Limited | A | Indirect | Ordinary £1 | — |
| Abbey National PLP (UK) Limited | A | Indirect | Ordinary £1 | — |
| Abbey National Property Investments | A | Indirect | Ordinary £1 | — |
| Abbey National Treasury Services Investments Limited | A | Indirect | Ordinary £1 | — |
| Abbey National Treasury Services Overseas Holdings | A | Indirect | Ordinary £1 | — |
| Abbey National UK Investments | A | Indirect | Ordinary €0.20 | — |
| | | Ordinary £1 | |
| Abbey Stockbrokers (Nominees) Limited | A | Indirect | Ordinary £1 | — |
| Abbey Stockbrokers Limited | A | Indirect | Ordinary £1 | — |
| Alliance & Leicester Cash Solutions Limited | A | Indirect | Ordinary £1 | — |
| Alliance & Leicester Commercial Bank Limited | A | Indirect | Ordinary £1 | — |
| Alliance & Leicester Investments (Derivatives) Limited | A | Indirect | Ordinary £1 | — |
| Alliance & Leicester Investments (No.2) Limited | A | Indirect | Ordinary £1 | — |
| Alliance & Leicester Investments Limited | A | Indirect | Ordinary £1 | — |
| Alliance & Leicester Limited | G | Indirect | Ordinary £0.50 | — |
| Alliance & Leicester Personal Finance Limited | G | Indirect | Ordinary £1 | — |
| AN (123) Limited | A | Indirect | Ordinary £0.10 | — |
| ANITCO Limited | A | Indirect | Ordinary £1 | — |
| Athena Corporation Limited | A | Indirect | Ordinary £1 | — |
| Cater Allen Holdings Limited | A | Indirect | Ordinary £1 | — |
| Cater Allen International Limited | A | Indirect | Ordinary £1 | — |
| Cater Allen Limited | A | Indirect | Ordinary £1 | — |
| Cater Allen Lloyd's Holdings Limited | A | Indirect | Ordinary £1 | — |
| Cater Allen Syndicate Management Limited | A | Indirect | Ordinary £1 | — |
| First National Motor Business Limited (In liquidation) | F | Indirect | Ordinary £1 | — |
| First National Motor Contracts Limited (In liquidation) | F | Indirect | Ordinary £1 | — |
| First National Motor plc | B | Indirect | Ordinary £1 | — |
| First National Tricity Finance Limited | A | Indirect | Ordinary £1 | — |
| Insurance Funding Solutions Limited | A | Indirect | Ordinary £1 | — |
| Liquidity Limited | A | Indirect | Ordinary A £0.10 | — |
| | | Ordinary B1 £0.10 | |
| | | Ordinary B2 £0.10 | |
| | | Preference £1 | |
(1) Refer to the key at the end of this section for the registered office address.
| | | | | | | | | | | | | | |
| Annual Report 2022 | Santander UK Group Holdings plc 268 |
| | | | | | | | | | | | | | | | | | | | | | | | | | | | | | | | | | | | | | | | | |
| Strategic Report | Sustainability and Responsible Banking | Governance | Risk review | Financial review | Financial
statements | Shareholder
information |
| | | | | | | | | | | | | |
| | | | | | | | | | | | | |
| | | | | | | | | | | | | | |
| Registered office(1) | Direct/Indirect ownership | Share class through which ownership is held | Proportion of ownership interest |
| Name of subsidiary | % |
| Santander (CF Trustee Property Nominee) Limited | P | Trust relationship | Ordinary £1 | — |
| Santander (CF Trustee) Limited | P | Trust relationship | Ordinary £1 | — |
| Santander (UK) Group Pension Scheme Trustees Limited | P | Direct | Ordinary £1 | 100 |
| Santander Asset Finance (December) Limited | G | Indirect | Ordinary £1 | — |
| Santander Asset Finance plc | A | Indirect | Ordinary £0.10 | — |
| Santander Cards Limited | A | Indirect | Ordinary £1 | — |
| Santander Cards UK Limited | A | Indirect | Ordinary £1 | — |
| Santander Consumer (UK) plc | B | Indirect | Ordinary £1 | — |
| Santander Consumer Credit Services Limited | A | Indirect | Ordinary £1 | — |
| Santander Equity Investments Limited | A | Direct | Ordinary £1 | 100 |
| Santander Estates Limited | G | Indirect | Ordinary £1 | — |
| Santander Financial Services plc | A | Direct | Ordinary £1 | 100 |
| Santander Global Consumer Finance Limited | A | Indirect | Ordinary £0.0001 | — |
| Santander Guarantee Company | A | Indirect | Ordinary £1 | — |
| Santander Lending Limited | A | Indirect | Ordinary £1 | — |
| Santander Mortgage Holdings Limited | A | Indirect | Ordinary £1 | — |
| Santander Private Banking UK Limited | A | Indirect | Ordinary £1 | — |
| Santander Secretariat Services Limited | A | Direct | A Ordinary US$0.01 | 100 |
| Santander UK Operations Limited | A | Indirect | Ordinary A £1 | — |
| | | Ordinary B £1 | |
| Santander UK (Structured Solutions) Limited | A | Indirect | Ordinary £0.01 | — |
| Santander UK plc | A | Direct | Ordinary £0.10 | 100 |
| Santander UK Technology Limited | A | Indirect | Ordinary £1 | — |
| Sheppards Moneybrokers Limited | A | Indirect | Ordinary £1 | — |
| Solarlaser Limited | A | Indirect | Ordinary £1 | — |
| SCF Eastside Locks GP Limited | P | Trust relationship | Ordinary £1 | — |
| The Alliance & Leicester Corporation Limited | A | Indirect | Ordinary £1 | — |
| Time Retail Finance Limited (In liquidation) | F | Indirect | Ordinary £1 | — |
| | | Ordinary £0.0001 | |
| Tuttle and Son Limited | A | Indirect | Ordinary £1 | — |
(1) Refer to the key at the end of this section for the registered office address.
Incorporated and registered outside England and Wales:
| | | | | | | | | | | | | | |
| Registered office(1) | Direct/Indirect ownership | Share class through which ownership is held | Proportion of ownership interest |
| Name of subsidiary | % |
| A & L CF (Guernsey) Limited | O | Indirect | Ordinary £1 | — |
| Abbey Business Services (India) Private Limited | N | Indirect | Ordinary INR 10 | — |
| Abbey National International Limited | Q | Indirect | Ordinary £1 | — |
| Santander Cards Ireland Limited | I | Indirect | Ordinary €1 | — |
| | | Ordinary €1.27 | |
| Santander ISA Managers Limited | H | Indirect | Ordinary £1 | — |
| Sovereign Spirit Limited | M | Indirect | Ordinary BMD 1 | — |
(1) Refer to the key at the end of this section for the registered office address, including the country.
| | | | | | | | | | | | | | |
| Annual Report 2022 | Santander UK Group Holdings plc 269 |
| | | | | | | | | | | | | | | | | | | | | | | | | | | | | | | | | | | | | | | | | |
| Strategic Report | Sustainability and Responsible Banking | Governance | Risk review | Financial review | Financial
statements | Shareholder
information |
| | | | | | | | | | | | | |
| | | | | | | | | | | | | |
Other subsidiary undertakings
All entities are registered in England and Wales except for Motor Securities 2018-1 Designated Activity Company which is registered in Ireland.
The Company and its subsidiaries do not own directly, or indirectly, any of the share capital of any of the entities, however they are consolidated by the Santander UK group because the substance of the relationship indicates control, as described in Note 1 to the Consolidated Financial Statements.
| | | | | | | | | | | |
| Registered | Name of entity | Registered |
| Name of entity | office(1) | office(1) |
| Abbey Covered Bonds (Holdings) Limited | E | Holmes Master Issuer plc | A |
| Abbey Covered Bonds (LM) Limited | E | Holmes Trustees Limited | A |
| Abbey Covered Bonds LLP | A | Langton Securities (2008-1) plc (In Liquidation) | D |
| Fosse (Master Issuer) Holdings Limited | C | MAC No.1 Limited | A |
| Fosse Funding (No.1) Limited | C | Motor 2016-1 Holdings Limited | C |
| Fosse Master Issuer plc | C | Motor 2016-1 plc | C |
| Fosse Trustee (UK) Limited | A | Motor 2017-1 Holdings Limited | C |
| Holmes Funding Limited | A | Motor 2017-1 plc (In Liquidation) | D |
| Holmes Holdings Limited | A | Motor Securities 2018-1 Designated Activity Company | K |
(1) Refer to the key at the end of this section for the registered office address.
Related undertakings
All of these entities, which are registered in England and Wales, are accounted for by the equity method of accounting, with 50% ownership being held.
| | | | | | | | | | | | | | |
| Registered office(1) | Direct/Indirect ownership | Share class through which ownership is held | Proportion of ownership interest |
| Name of entity | | % |
| Hyundai Capital UK Limited | J | Indirect | Ordinary £1 | — |
| Volvo Car Financial Services UK Limited | L | Indirect | Ordinary £1 | — |
(1) Refer to the key at the end of this section for the registered office address.
Overseas branches
The Company has no overseas branches. Santander Financial Services plc, a subsidiary, has branch offices in Jersey and the Isle of Man.
Key of registered office addresses
| | | | | | | | | | | |
| A | 2 Triton Square, Regent’s Place, London NW1 3AN | | |
| B | Santander House, 86 Station Road, Redhill RH1 1SR | | |
| C | 1 Bartholomew Lane, London EC2V 2AX | | |
| D | 40a Station Road, Upminster, Essex RM14 2TR | | |
| E | Wilmington Trust SP Services (London) Limited, 1 Kings Arms Yard, London EC2R 7AF | | |
| F | Griffins, Tavistock House South, Tavistock Square, London WC1H 9LG | | |
| G | Carlton Park, Narborough, Leicester LE19 0AL | | |
| H | 287 St. Vincent Street, Glasgow, Scotland G2 5NB | | |
| I | 3 Dublin Langdings, Dublin 1, Ireland | | |
| J | London Court, 39 London Road, Reigate RH2 9AQ | | |
| K | 3rd Floor, Flemming Court, Flemming’s Place, Dublin 4, Ireland | | |
| L | Scandinavia House, Norreys Drive, Maidenhead, Berkshire SL6 4FL | | |
| M | Clarendon House, 2 Church Street, Hamilton HM11, Bermuda | | |
| N | The Residency, 7th Floor, 133/1 Residency Road, Bangalore, KA 560 025, India | | |
| O | Suite 1 North, 1st Floor, Albert House, St. Peter Port, Guernsey GY1 1AJ | | |
| P | 201 Grafton Gate East, Milton Keynes MK9 1AN | | |
| Q | 13-15 Charing Cross, St. Helier, Jersey JE2 3RP | | |
| | | | | | | | | | | | | | |
| Annual Report 2022 | Santander UK Group Holdings plc 270 |
| | | | | | | | | | | | | | | | | | | | | | | | | | | | | | | | | | | | | | | | | |
| Strategic Report | Sustainability and Responsible Banking | Governance | Risk review | Financial review | Financial
statements | Shareholder
information |
| | | | | | | | | | | | | |
| | | | | | | | | | | | | |
Forward-looking statements
The Company and its subsidiaries (together Santander UK) may from time to time make written or oral forward-looking statements. The Company makes written forward-looking statements in this Annual Report and may also make forward-looking statements in its periodic reports to the SEC on Forms 20-F and 6-K, in its offering circulars and prospectuses, in press releases and in other written materials and in oral statements made by its officers, directors or employees to third parties. Examples of such forward-looking statements include, but are not limited to:
–projections or expectations of revenues, costs, profit (or loss), earnings (or loss) per share, dividends, capital structure or other financial items or ratios
–statements of plans, objectives or goals of Santander UK or its management, including those related to products or services
–statements of future economic performance, and
–statements of assumptions underlying such statements
Words such as ‘believes’, ‘anticipates’, ‘expects’, ‘intends’, ‘aims’, ‘plans’, ‘targets’ and similar expressions are intended to identify forward-looking statements, but are not the exclusive means of identifying such statements.
By their very nature, forward-looking statements are not statements of historical or current facts; they cannot be objectively verified, are speculative and involve inherent risks and uncertainties, both general and specific, and risks exist that the predictions, forecasts, projections and other forward-looking statements will not be achieved. Santander UK cautions readers that a number of important factors could cause actual results to differ materially from the plans, objectives, expectations, estimates and intentions expressed in such forward-looking statements made by Santander UK or on its behalf. Some of these factors, which could affect Santander UK’s business, financial condition and/or results of operations, are considered in detail in the Risk review, and include:
–the effects of the war in Ukraine
–the effects of UK economic conditions and disruptions in the global economy and global financial markets
–the effects of the Covid-19 pandemic
–the effects of the UK’s withdrawal from the European Union
–the effects of climate change
–the effects of competition with other financial institutions, including new entrants into the financial services sector
–Santander UK’s ability to maintain its competitive position depending, in part, on the success of new products and services it offers its customers and its ability to continue offering products and services from third parties
–the extent to which Santander UK’s loan portfolio is subject to prepayment risk
–the risk of damage to Santander UK's reputation
–the risk that Santander UK may be unable to manage the growth of its operations
–the extent to which regulatory capital, liquidity and leverage requirements, and any changes to these requirements may affect Santander UK
–liquidity constraints and Santander UK’s ability to access funding on acceptable financial terms
–the effects of an adverse movement in external credit ratings assigned to Santander UK or any of its debt securities
–the effects of any changes in the pension liabilities and obligations of Santander UK
–the effects of fluctuations in interest rates and other market risks
–the extent to which Santander UK may be required to record negative changes in positions recorded at fair value for its financial assets due to changes in market conditions
–risks arising from the integrity and continued existence of reference rates
Santander UK’s ability to control the level of non-performing or poor credit quality loans and whether Santander UK’s loan loss reserves are sufficient to cover loan losses
–the risk that the value of the collateral, including real estate, securing Santander UK’s loans may not be sufficient and that Santander UK may be unable to realise the full value of the collateral securing its loan portfolio
–the effects of the financial services laws, regulations, government oversight, administrative actions and policies and any changes thereto in each location or market in which Santander UK operates
–the risk that Santander UK may become subject to the provisions of the Banking Act 2009, including the bail-in and write down powers thereunder
–the effects of any failure to comply with anti-money laundering, anti-terrorism, anti-bribery and corruption, sanctions and anti-tax evasion laws and regulations, or the risk of any failure to prevent or detect any illegal or improper activities fully or on a timely basis
–the effects of taxation (and any changes to tax), in each location in which Santander UK operates
–Santander UK’s exposure to any risk of loss and damage from civil litigation and/or criminal legal and regulatory proceedings
–the risk of failing to successfully apply or to improve Santander UK’s credit risk management systems
–the risk that Santander UK’s data management policies and processes may not be sufficiently robust
–the effect of cyber-crime on Santander UK’s business
–the risks arising from any non-compliance with Santander UK’s policies, from any employee misconduct or human error, negligence and deliberate acts of harm or dishonesty, including fraud
–the risk of failing to effectively manage changes in Santander UK’s information technology infrastructure and management information systems in a timely manner
–Santander UK’s exposure to unidentified or unanticipated risks despite its risk management policies, procedures and methods and Santander UK’s exposure to risks related to errors in its risk modelling
–the risks arising from Santander UK’s reliance on third parties and affiliates for important infrastructure support, products and services
–the ability of Santander UK to recruit, retain and develop appropriate senior management and skilled personnel
–the effects of any inaccuracy within the judgements and accounting estimates which underpin aspects of the financial statements, and the consequent risk of any material misstatement of Santander UK’s financial results
–the effect of any change in accounting standards
Please refer to our latest filings with the SEC (including, without limitation, the Risk Factors section in this Annual Report on Form 20-F for the year ended 31 December 2022) for a discussion of certain risk factors and forward-looking statements. Undue reliance should not be placed on forward-looking statements when making decisions with respect to any Santander UK member and/or its securities. Investors and others should take into account the inherent risks and uncertainties of forward-looking statements and should carefully consider the foregoing non-exhaustive list of important factors. Forward-looking statements speak only as of the date on which they are made and are based on the knowledge, information available and views taken on the date on which they are made; such knowledge, information and views may change at any time. Santander UK does not undertake any obligation to update or revise any forward-looking statement, whether as a result of new information, future events or otherwise.
| | | | | | | | | | | | | | |
| Annual Report 2022 | Santander UK Group Holdings plc 271 |
| | | | | | | | | | | | | | | | | | | | | | | | | | | | | | | | | | | | | | | | | |
| Strategic Report | Sustainability and Responsible Banking | Governance | Risk review | Financial review | Financial
statements | Shareholder
information |
| | | | | | | | | | | | | |
| | | | | | | | | | | | | |
Page intentionally blank
| | | | | | | | | | | | | | |
| Annual Report 2022 | Santander UK Group Holdings plc 272 |
| | | | | | | | | | | | | | | | | | | | | | | | | | | | | | | | | | | | | | | | | |
| Strategic Report | Sustainability and Responsible Banking | Governance | Risk review | Financial review | Financial
statements | Shareholder
information |
| | | | | | | | | | | | | |
| | | | | | | | | | | | | |
Risk factors
An investment in Santander UK Group Holdings plc (the Company) and its subsidiaries (us, we or Santander UK) involves a number of risks, the material ones of which are set out below.
Geopolitical and macro-economic risks
The war in Ukraine could materially affect our operations and financial position
On 24 February 2022, Russia launched a large-scale military action against Ukraine. The Russian military action has caused an ongoing humanitarian crisis in Europe. It has also significantly impacted global commodity and financial markets, leading to supply chain disruptions and increases in the prices of energy, oil, gas and raw materials. This has led to heightened inflation, which has created further challenges for monetary authorities and our customers.
We do not have a presence in Russia and Ukraine and our direct exposure to Russian and Ukrainian markets and assets is negligible. However, the effect of Russia’s continued military action against Ukraine on global commodity and financial markets and general macroeconomic conditions remains uncertain, and there is a risk that the economic effects of Russia's continued military action against Ukraine could exacerbate the current slowdown in the global economy, which would adversely affect our businesses, results of operations and financial position.
Price pressures on the energy, oil and gas sectors resulting from the Russian military action against Ukraine underline the need to accelerate the decarbonisation transition and present opportunities to finance new energy solutions that can improve energy security in the medium to long term. However, historic reliance on stable and cheap energy has meant that price pressures on the energy, oil and gas sectors resulting from the Russian military action against Ukraine and the resulting increases in energy prices pose risks to economic growth and debt sustainability, contributing to the challenges our customers are facing in terms of cost of living.
The continuation or escalation of the conflict between Russia and Ukraine, including the extension of the conflict to other countries in the region, could lead to further increases in energy prices (particularly gas prices, if supplies to Europe remain interrupted) and heightened inflationary pressures. This could lead to further increases in interest rates, impact financial market stability in the Eurozone and worsen the current cost of living crisis our customers are facing. Such developments would negatively affect the payment capacity of some of our customers, whose likely need for increased support will place additional pressures on the staff in our financial support and call centres.
In response to the Russian military action against Ukraine, the United States of America (US), the European Union (EU), the United Kingdom (UK) and other UN member states and jurisdictions, have imposed, and may further impose, severe financial and economic sanctions and export controls against Russia, Belarus, the so-called Donetsk People’s Republic and the so-called Luhansk People’s Republic. Such sanctions have included freezing/blocking assets, targeting major Russian banks, the Russian Central Bank, and certain Russian companies and individuals, imposing export controls against Russia and Russian interests, as well as disconnecting certain Russian banks from the SWIFT system (Society for Worldwide Interbank Financial Telecommunication). In addition, the sanctions imposed also include a ban on trading in sovereign debt and other securities. Russia has implemented certain countermeasures in response. The scale of sanctions is unprecedented, complex and rapidly evolving, and poses continuously increasing operational and compliance risks to Santander UK. Our corporate framework and policies are designed to ensure compliance with applicable laws, regulations and economic sanctions, including US, UK, EU and UN economic sanctions, in the countries in which we operate. Such sanctions and other measures, as well as the existing and potential further responses from Russia or other countries to such sanctions, tensions and military actions, have resulted in an increasingly fragmented macroeconomic, trade and regulatory environment. Currently, we do not have any loans, credits or contingencies affected by the recent sanctions imposed on Russia. However, we cannot predict whether any of the countries in which we operate will enact additional economic sanctions or trade restrictions in response to the Russian military action against Ukraine or the impact such additional sanctions or restrictions may have on us which may include increased costs and regulatory burdens associated with the compliance of the evolving and complex sanctions landscape. The heightened regulatory, political and media focus on our response to this crisis may also increase our exposure to conduct and reputational risks.
Furthermore, the disruption and volatility in the global financial markets caused by the Russian invasion and the potential of further tightening of financial market conditions due to the conflict could have a material adverse effect on Santander UK’s ability to access funding, capital and liquidity on financial terms acceptable to it and result in an increase in Santander UK’s cost of funding due to widening of credit spreads. This could have a material adverse effect on Santander UK’s operations, financial condition and prospects.
In addition, the risk of cyberattacks on companies and institutions could increase as a result of Russia’s military action against Ukraine and in response to the consequent sanctions imposed by the US, the EU, the UK and other jurisdictions. Such attacks could adversely affect our ability to maintain or enhance our cyber security and data protection measures. While we continue to see increasing ransomware attacks across sectors driven by supply chain tool compromises, and expect this trend to continue, we have not experienced any notable information or cyber security incidents as a result of Russia’s actions against Ukraine. We continue to actively monitor this situation.
Santander UK’s operations, financial condition and prospects are materially impacted by economic conditions in the UK and disruptions in the global economy and global financial markets
Santander UK’s business activities are concentrated in the UK, where it offers a range of banking and financial products and services to UK retail and corporate customers. As a consequence, Santander UK’s operations, financial condition and prospects are significantly affected by the general economic conditions in the UK.
Despite the economic recovery experienced during 2021 in the UK as measures to combat the COVID-19 pandemic were eased, pre-pandemic growth levels were not reached. There remains a risk of an extended period of economic contraction that continues through 2023 as the effects of higher bank rates, Brexit, and higher and more persistent inflation continue to affect supply chains and business and household confidence and finances. Interest rates have risen sharply over the course of 2022 and there is a risk that this trend will continue throughout 2023, putting further pressures on household finances due to a sharp rise of the costs for refinancing their mortgage for some of our customers and significantly higher costs of borrowing overall. Higher mortgage rates could dampen demand in the housing market, leading to a drop in new business or a fall in house prices, reducing the value of the collateral we hold against mortgages. These risks could create further downward pressure on the economy; for example: a large surge in business failures with knock-on effects for the labour market resulting in high rates of unemployment that affect the ability of customers to pay their debts, which could also contribute to negative multiplier effects through delayed investment and spending; and a stronger push towards protectionism as governments look to protect home industries. This could also lead to a longer-term turn in the credit cycle with a broader contraction of credit as lenders attempt to protect themselves from increased losses.
In particular, Santander UK faces, among others, the following risks in this period of economic uncertainty (including the effect of those risks on gross domestic product, inflation, unemployment and house prices):
–Reduced demand for Santander UK’s products and services - particularly the potential for reduced mortgage market volumes.
| | | | | | | | | | | | | | |
| Annual Report 2022 | Santander UK Group Holdings plc 273 |
| | | | | | | | | | | | | | | | | | | | | | | | | | | | | | | | | | | | | | | | | |
| Strategic Report | Sustainability and Responsible Banking | Governance | Risk review | Financial review | Financial
statements | Shareholder
information |
| | | | | | | | | | | | | |
| | | | | | | | | | | | | |
–Inability of Santander UK’s borrowers to make payments on their loans in full or on time.
–The degree of uncertainty concerning economic conditions may adversely affect the accuracy of Santander UK’s estimates, which may, in turn, impact the reliability of the IFRS 9 model and process to determine the sufficiency of Santander UK’s loan loss allowances.
–Lower house or other asset prices, reducing the value of collateral Santander UK holds on mortgage and other lending.
–Higher and more persistent inflation, reducing Santander UK’s profitability and increasing the cost of living for Santander UK's borrowers.
–The value and liquidity of the portfolio of investment securities that Santander UK holds may be adversely affected.
Santander UK is also exposed to:
–Broader geopolitical issues, which remain heightened with the potential for a further pushback against globalism. Further moves towards unilateralism may also cause increased tension and/or hostilities between nations, which could negatively impact the global economy and financial markets. In addition, Russia's invasion of Ukraine has impacted the UK economy, in particular by pushing up energy and oil prices and increasing inflation further;
–Climate change risks which could result in material damage to our customers’ property or businesses or have a material impact on our customers' business models under a transition to a low carbon economy; and
–Social unrest as a result of severe economic disruption.
Adverse changes in the credit quality of Santander UK’s borrowers or counterparties or a general deterioration in UK economic conditions could reduce the recoverability and value of Santander UK’s assets and require an increase in its level of provisions for expected credit losses. There can be no assurance that Santander UK will not have to increase its provisions for loan losses in the future as a result of increases in non-performing loans or for other reasons beyond its control. Material increases in Santander UK’s provision for loan losses and write-off or charge-offs have had and could again have a material adverse effect on its operations, financial condition and prospects. Any significant reduction in the demand for Santander UK products and services, a sustained downturn in the UK economy or changes in central bank interest rates could have a material adverse effect on Santander UK’s operations, financial condition and prospects.
Inflation continued to rise in 2022, mainly driven by increasing energy and food prices. Monetary policy in the UK has been tightened significantly since the end of 2021 and there are expectations of further rate increases with a peak rate in 2023. Our own budget forecasts anticipate a gradual fall back in the inflation rate, following a peak in 2022, to meet the target rate by 2026. Economic instability and downturns beyond the UK may also impact the UK economy as a whole. Europe’s manufacturing base is heavily dependent upon natural gas, and restriction in supply and significantly increased costs are expected to have a material adverse impact on the Eurozone economy, which could lead to disruption and volatility in the global financial markets, as a result of debt sustainability concerns. This could have a material adverse impact on Santander UK, including Santander UK’s ability to access capital and liquidity on financial terms acceptable to Santander UK, which could have a material adverse effect on Santander UK’s operations, financial condition and prospects.
A recessionary economic environment could also lead to rating downgrades affecting the UK, Santander UK or its customers, investments and/or instruments, causing capital impacts due to increased RWAs, an increase in the volatility of wholesale markets and the cost of funding. Fiscal concerns related to the UK have already increased volatility in UK financial markets which necessitated Bank of England intervention in late September 2022.
The Covid-19 pandemic
The Covid-19 pandemic has caused, and the Covid-19 pandemic (or new strains or variations thereof) or unforeseen new diseases or infections have the potential to cause, social disruption and a material economic downturn in the UK and globally. Macroeconomic expectations are that the effects of the Covid-19 pandemic will be long lasting with the level and speed of economic recovery still uncertain, with impacts being felt largely in a tight labour market, supply chain pressures and increased inflation. The Covid-19 pandemic has had a material adverse effect on Santander UK’s operations and income and could continue to have a material adverse effect on its operations, income, financial condition and prospects. To the extent that the residual impacts of the Covid-19 pandemic continue to adversely affect the UK or global economy and/or Santander UK, it may also have the effect of increasing the likelihood and/or magnitude of other risks described herein or may pose other risks which are not presently known to Santander UK or not currently expected to be significant to Santander UK’s business, operations or financial performance.1
In 2022, certain adverse consequences of the Covid-19 pandemic continued to impact the macroeconomic environment, including labour shortages and disruptions of global supply chains, which contributed to rising inflationary pressures. These adverse consequences may persist for some time. If new Covid-19 waves, or the emergence of another infection of similar proportions, force countries to re-adopt measures that restrict economic activity, the macroeconomic environment could deteriorate and adversely impact our business and results of operations, which could include, but is not limited to (i) a decreased demand for our products and services; (ii) material impairment of our loans and other assets including goodwill; (iii) a decline in the value of collateral; (iv) constraints on our liquidity due to market conditions, exchange rates and customer withdrawal of deposits and continued draws on lines of credit; and (v) downgrades to our credit ratings. Any downgrade in our credit rating would likely increase our cost of funding, require us to post additional collateral or take other actions under some of our derivative and other contracts and adversely affect our interest margins and results of operations.
Moreover, our operations could still be impacted by risks from remote working, which were largely deployed as a response to the Covid-19 pandemic. While in 2022 we continued to implement a partial return to our office locations, we still maintain flexibility to work remotely, and our staff have progressively adapted a hybrid approach to working. If we become unable to successfully operate our business from remote locations including, for example, due to failures of our technology infrastructure and controls, or increased cybersecurity risks, this could result in business disruptions that could have a material and adverse effect on our business.
| | | | | | | | | | | | | | |
| Annual Report 2022 | Santander UK Group Holdings plc 274 |
| | | | | | | | | | | | | | | | | | | | | | | | | | | | | | | | | | | | | | | | | |
| Strategic Report | Sustainability and Responsible Banking | Governance | Risk review | Financial review | Financial
statements | Shareholder
information |
| | | | | | | | | | | | | |
| | | | | | | | | | | | | |
The UK’s withdrawal from the European Union (Brexit) could have a material adverse effect on Santander UK’s operations, financial condition and prospects
On 31 January 2020 the UK ceased to be a member of the EU and a limited trade deal was agreed between the UK and the EU with the relevant new regulations coming into force on 1 January 2021.
The trade deal, however, does not include agreements on certain areas such as financial services and data adequacy. As a result, Santander UK has, and will continue to have, a limited ability to provide cross-border services to EU customers and to trade with EU counterparties. The wider and continuing impact of Brexit on financial markets through market fragmentation, reduced access to finance and funding, and a lack of access to certain financial market infrastructure, may affect Santander UK's operations, financial condition and prospects and those of its customers.
Residual risks remain around the impact on the UK’s economy. Brexit has contributed to global pandemic-related supply and labour market constraints and reduced economic output and exports as businesses attempt to adapt the new cross-border procedures and rules applicable in the UK and in the EU to their activities, products, customers and suppliers.
While the longer term effects of the UK’s withdrawal from the EU are difficult to assess, this has also been hampered by overlay of and development of economic risks from the Covid-19 pandemic and the Russian invasion of Ukraine. Further, there is ongoing political and economic uncertainty, such as increased friction with the EU and EU countries, and the possibility of a second referendum on Scottish independence from the UK, which could negatively affect Santander UK’s customers and counterparties and have a material adverse effect on Santander UK’s operations, financial condition and prospects.
Santander UK faces risks from the impact of climate change, which could materially affect Santander UK’s business operations, reputation, clients and customers, as well as the creditworthiness of its counterparties
Climate risk is a risk that manifests through other principal risks, primarily enterprise risk, credit risk and operational risk. Climate change could expose Santander UK to financial risk either through its physical (e.g., climate or weather-related events) or transitional (e.g., changes in climate policy or in the regulation of financial institutions and corporates with respect to climate change risks) effects. Transition risks could be further accelerated by the occurrence of changes in the physical climate.
Physical risks from climate change arise from climate and weather-related events, such as heatwaves, droughts, floods, landslides, storms, sea level rise, coastal erosion and subsidence. These risks could impact our customers in the form of lower revenues due to transport problems, supply chain disruption and other impacts that strain production and lower revenues and higher costs for our customers owing to workers’ health, safety, absenteeism and other workforce-related problems. These risks could also lead to damage to our customers’ property or operations, which could impair asset values and the creditworthiness of customers leading to increased default rates, delinquencies, write-offs and impairment charges in Santander UK’s portfolios. In addition, Santander UK’s premises and resilience may also suffer physical damage due to weather-related events leading to increased costs for Santander UK.
Transition risks arise from the process of adjustment towards a low-carbon economy. Santander UK may face significant and rapid developments in stakeholder expectations, policy, law and regulation which could impact the lending activities Santander UK undertakes, as well as the risks associated with its lending portfolios, and the value of Santander UK’s financial assets. Reputation risk could arise from a failure to meet changing societal, investor or regulatory demands.
Banco Santander S.A. is a founding member of the UN-convened Net Zero Banking Alliance committing Santander UK Group Holdings plc to set and disclose decarbonisation targets for most greenhouse gas intensive sectors and to becoming a net zero bank by 2050. As such, Santander UK Group Holdings plc is implementing and reporting at a group level (including Santander UK plc) against the TCFD recommendations and has disclosed targets to manage climate-related risks and opportunities, however, we do not believe our climate-related disclosure is fully aligned with the TCFD recommendations yet. In order to fulfil these ambitions and reach the relevant targets or any other climate related ambitions or targets Santander UK may commit to in future, Santander UK will need to incorporate climate considerations into its strategy, business model, the products and services it provides to customers and its financial and non-financial risk management processes (including processes to measure and manage the various financial and non-financial risks Santander UK faces as a result of climate change). Failure to adequately embed risks associated with climate change into its risk framework to appropriately measure, manage and disclose the various financial and operational risks it faces as a result of climate change, or failure to adapt Santander UK’s strategy and business model to the changing regulatory requirements and market expectations on a timely basis, may have a material and adverse impact on Santander UK’s level of business growth, competitiveness, profitability, capital requirements, cost of funding, and financial condition. Achieving Santander UK’s climate-related ambitions and targets will also depend on a number of factors outside its control, including (among other things) availability of data to measure and assess the climate impact on Santander UK’s customers, advancements of low-carbon transition technologies and public policies to support the energy transition in the markets where Santander UK operates. If these external factors and other changes do not occur, or do not occur on a timely basis, Santander UK may fail to achieve its climate-related ambitions and targets and this could have a material adverse effect on Santander UK’s business growth, competitiveness, profitability, financial condition and reputation. In 2023, we will continue to work on assessing our financed emissions and establishing interim targets. We will consider key enablers, including government policy as well as our own actions to accelerate the decarbonisation.
For further details on Santander UK’s approach to climate change see “Sustainability & Responsible Banking – Taskforce on Climate-related Financial Disclosures (TCFD)" in the Santander UK Group Holdings plc Annual Report on Form 20-F.
Business model risks
Santander UK is exposed to competition from other financial institutions, including new entrants into the financial services sector
The markets for UK financial services are very competitive and Santander UK has seen strong competition from banks, building societies and other established financial service providers. In addition, Santander UK faces competition from a number of new entrants, non-banks and other providers, including technology companies and large retail companies with strong brand recognition.
The UK government and regulators are actively supporting the emergence of new entrants into the UK financial services market. The internet and mobile technologies are also changing customer behaviour and the competitive environment. There has been a steep rise in customer use of mobile banking in recent years and the Covid-19 pandemic accelerated the strong trends towards customer digital adoption. Santander UK is investing in a multi-year transformation programme, including digitalisation of channels and services and automation of physical channels, to both meet customer preferences and protect its competitive position. There can be no assurance that the transformation programme will deliver the benefits sought from it.
Management expects such competition to continue or intensify as a result of customer behaviour and trends, technological changes, competitor behaviour, the growth in digital banking, new lending models and changes in regulation (including the introduction of Open Banking and changes arising from the Payment Services Directive (PSD2)). As a result of any restructuring or evolution in the market, there may emerge one or more new viable competitors in the UK banking market or a material strengthening of one or more of Santander UK’s existing competitors in that market, limiting Santander UK’s ability to increase its customer base and expand its operations, increasing competition for investment opportunities and potentially reducing Santander UK’s market share.
Any of these competition-related factors or a combination thereof could result in a significant reduction in the profit of Santander UK. Santander UK gives consideration to the competitive position in its management actions, such as pricing, product decisions and our business model. Increasing competition could
| | | | | | | | | | | | | | |
| Annual Report 2022 | Santander UK Group Holdings plc 275 |
| | | | | | | | | | | | | | | | | | | | | | | | | | | | | | | | | | | | | | | | | |
| Strategic Report | Sustainability and Responsible Banking | Governance | Risk review | Financial review | Financial
statements | Shareholder
information |
| | | | | | | | | | | | | |
| | | | | | | | | | | | | |
mean that Santander UK increases rates offered on deposits or lowers the rates it charges on loans, or changes its cost base, any of which could have a material adverse effect on its operations, financial condition and prospects.
The rising rate environment and cost of living crisis may result in competitors reacting quite differently in relation to, amongst other factors, loan pricing, availability, deposit pricing, investment decisions. This has already had, and will continue to have, an impact on the competitive environment and future decisions of Santander UK.
Santander UK’s ability to maintain its competitive position depends, in part, on the success of new products and services it offers its customers and its ability to continue offering products and services from third parties
The success of Santander UK’s operations and its profitability depends, in part, on the success of new products and services it offers to customers and the way in which it offers and provides its products and services. The increasing availability of a wide range of digital or online products and services for customers requires banks like Santander UK to enhance their offerings in order to retain and attract customers. However, Santander UK cannot guarantee that its new products and services or the way in which it offers or provides its products and services will meet the needs or preferences of Santander UK’s customers which may change over time, and such changes may render Santander UK’s products and services obsolete, outdated or unattractive. Santander UK may not be able to develop new products that meet its customers’ changing needs in a timely manner. As Santander UK expands the range of its products and services, some of which may be at an early stage of development in the UK market, it will be exposed to known, new and potentially increasingly complex risks, including conduct risk, and development expenses. Santander UK’s employees and risk management systems, as well as its experience and that of its partners, may not be sufficient or adequate to enable it to properly handle or manage such risks. In addition, the cost of developing products that are not launched is likely to affect its operating results.
Any or all of the above factors, individually or collectively, could have a material adverse effect on Santander UK’s operations, financial condition and prospects.
Santander UK’s loan portfolio is subject to risk of prepayment
Santander UK’s loan portfolio is subject to prepayment risk resulting from the ability of a borrower or issuer to prepay a debt obligation prior to maturity. As a result Santander UK could be required to amortise net premiums into income over a shorter period of time, thereby reducing the corresponding asset yield and net interest income and there is a risk that Santander UK is not able to accurately forecast amortisation schedules for these purposes which may affect its profitability. Prepayment risk also has a significant adverse impact on credit card and mortgage loans, since prepayments could shorten the weighted average life of these assets, which may result in a mismatch with Santander UK’s funding obligations and reinvestment at lower yields. The risk of prepayment and its impact on Santander UK's ability to accurately forecast amortisation schedules is inherent in Santander UK’s commercial activity and an increase in prepayments or a failure to accurately forecast amortisation schedules could have a material adverse effect on Santander UK’s operations, financial condition and prospects.
Damage to Santander UK’s reputation could cause harm to its business prospects
Maintaining a positive reputation is critical to attracting and retaining customers, investors and employees and conducting business transactions with counterparties. Damage to the reputation of Santander UK or Banco Santander S.A. (as the ultimate parent of Santander UK), the reputation of affiliates operating under the ‘Santander’ brand or any of its other brands could therefore cause significant harm to Santander UK’s business and prospects. Harm to Santander UK’s reputation can arise directly or indirectly from numerous sources, including, among others, employee misconduct (including the possibility of employee fraud), litigation, regulatory interventions and enforcement action, failure to deliver minimum standards of service and quality, loss or compromise of customer data, disruption to service due to a cyber-attack, wider IT failures, compliance failures, third party fraud, financial crime, breach of legal or regulatory requirements, unethical behaviour (including adopting inappropriate sales and trading practices), and the activities of customers, suppliers and counterparties and the perception of the financial services industry as a whole. Further, negative publicity regarding Santander UK, whether true or not, may result in harm to Santander UK’s operations, financial condition and prospects.
If Santander UK is unable to manage the growth of its operations, this could have a material adverse impact on its profitability
Santander UK allocates management and planning resources to develop strategic plans for organic growth, and to identify possible acquisitions and disposals and areas for restructuring its businesses when necessary. From time to time, Santander UK evaluates acquisition, disposal, and partnership opportunities that it believes could offer additional value to its shareholders and customers and are consistent with its business strategy. However, Santander UK may not be able to identify suitable acquisition or partnership candidates and may not be able to acquire promising targets or form partnerships on favourable terms, or at all. Furthermore, preparations for acquisitions that Santander UK does not complete can be disruptive. Santander UK bases its assessment of potential acquisitions and partnerships on limited and potentially inexact information and on assumptions with respect to value, operations, profitability and other matters that may prove to be incorrect. Santander UK’s ability to benefit from any such acquisitions and partnerships will depend in part on its successful integration of those businesses. Such integration entails significant risks such as challenges in retaining the customers and employees of the acquired businesses, unforeseen difficulties in integrating operations and systems and unexpected liabilities or contingencies relating to the acquired businesses, including legal claims and regulatory investigations. Moreover, the success of the acquisition or venture will at least in part be subject to a number of political, economic and other factors that are beyond Santander UK’s control. Santander UK can give no assurances that its expectations with regard to integration and synergies will materialise.
Santander UK cannot provide assurance that it will, in all cases, be able to manage its growth effectively or to implement its strategic growth decisions, including its ability to:
–Manage efficiently the operations and employees of expanding businesses
–Maintain or grow its existing customer base
–Successfully execute its strategy
–Fully due diligence and assess the value, strengths and weaknesses of investment or acquisition candidates
–Finance strategic opportunities, investments or acquisitions
–Fully integrate strategic investments, or newly-established entities or acquisitions, in line with its strategy
–Align its current information technology systems adequately with those of an enlarged group
–Apply its risk management policy effectively to an enlarged group
Any or all of these factors, individually or collectively, could have a material adverse effect on Santander UK’s operations, financial condition and prospects.
| | | | | | | | | | | | | | |
| Annual Report 2022 | Santander UK Group Holdings plc 276 |
| | | | | | | | | | | | | | | | | | | | | | | | | | | | | | | | | | | | | | | | | |
| Strategic Report | Sustainability and Responsible Banking | Governance | Risk review | Financial review | Financial
statements | Shareholder
information |
| | | | | | | | | | | | | |
| | | | | | | | | | | | | |
Capital and liquidity risk
Santander UK is subject to regulatory capital, liquidity and leverage requirements that could limit its operations, and changes to these requirements may further limit and could have a material adverse effect on Santander UK’s operations, financial condition and prospects
Capital Requirements Regulation and Capital Requirements Directive IV
Santander UK is subject to capital adequacy requirements applicable to banks and banking groups under retained EU law and as adopted by the Prudential Regulation Authority (PRA). Santander UK is required to maintain a minimum ratio of Common Equity Tier 1 (CET1) capital to risk-weighted assets, Tier 1 capital to risk-weighted assets, total capital to risk-weighted assets and Tier 1 capital (leverage) to total adjusted assets for leverage purposes. Any failure by Santander UK to maintain such ratios above prescribed regulatory minimum levels may result in administrative actions or sanctions. These could potentially include requirements on Santander UK to cease all or certain lines of new business, to raise new capital resources or, in certain circumstances, a requirement for Santander UK's existing capital instruments (potentially including Santander UK’s debt securities) to be subjected to bail-in or write down (for more information, see the risk factor entitled ‘Santander UK may become subject to the provisions of the Banking Act 2009 (the Banking Act), including bail-in and write down powers’).
The EU Capital Requirements Directive IV (CRD IV Directive) and the Capital Requirements Regulation (the CRR and together with the CRD IV Directive, CRD IV) implemented changes proposed by the Basel Committee on Banking Supervision (the Basel Committee) to the capital adequacy framework, known as ‘Basel III’ in the EU. The CRR has been amended through a series of EU regulations, including the Capital Requirements Regulation 2 (CRR 2) and the CRD IV Directive amended by the Capital Requirements Directive V (CRD V Directive). The European Union (Withdrawal) Act 2018 converted the directly applicable elements of CRD IV into UK law on 31 December 2020 and preserved existing UK law implementing the CRD IV directive. Certain elements of the CRR which were ‘onshored’ in this way have now been transposed into the PRA rules.
In implementing CRD IV and the revised versions of CRD IV, the PRA has required the capital resources of UK banks to be maintained at levels which exceed the base capital requirements prescribed by CRD IV and to cover relevant risks in their business. In addition, a series of capital buffers have been established under CRD IV and PRA rules to ensure a bank can withstand a period of stress. Though the results of the PRA’s 2019 stress test (the most recent exercise undertaken to set UK bank capital buffers) did not impact on the level of capital that Santander UK is required to hold, the PRA could, in the future, as a result of stress testing exercises and as part of the exercise of UK macro-prudential capital regulation tools, or through supervisory actions, require Santander UK to increase its capital resources further, which could have a material adverse effect on Santander UK’s operations, financial condition and prospects.
Liquidity Coverage Ratio (LCR)
The LCR is intended to ensure that a bank maintains an adequate level of unencumbered, high quality liquid assets which can be used to offset the net cash outflows the bank could encounter under a short-term significant liquidity stress scenario. The current minimum requirement for LCR is set at 100%. Santander UK is also required to maintain available stable funding equal to at least 100% of its required stable funding (the net stable funding ratio (NSFR)). Santander UK’s current liquidity position is in excess of the minimum requirements set by the PRA, however there can be no assurance that future changes to the applicable liquidity requirements would not have an adverse effect on Santander UK’s financial performance.
Leverage ratios
The Financial Services Act 2012 (the FS Act) also provides the Financial Policy Committee (FPC) of the BoE with certain macro-prudential tools for the management of systemic risk including quarterly setting of the countercyclical capital buffer rate and powers of direction relating to leverage ratios. All major UK banks and banking groups (including Santander UK) are required to hold enough Tier 1 capital (75% of which must be CET1 capital) to satisfy a minimum leverage ratio requirement of 3.25% and enough CET1 capital to satisfy a countercyclical leverage ratio buffer of 35% of each bank’s institution-specific countercyclical capital buffer rate. The PRA requires UK globally systemically important banks (G-SIBs) and Ring Fenced Bodies to hold enough CET1 capital to meet an additional leverage ratio buffer of 35% of the institution-specific G-SIB buffer rate or Other Systemically Important Institutions (O-SII) buffer rate following the implementation of the CRD V Directive on 28 December 2020 (previously the Systemic Risk Buffer rate) and for consolidated groups which include a Ring Fenced Body (as defined in the Financial Services and Markets Act 2000 (FSMA) to hold enough CET1 capital to meet the Additional Leverage Ratio Buffer (ALRB). The FPC can also direct the PRA to adjust capital requirements in relation to particular sectors through the imposition of sectoral capital requirements. Action taken in the future by the FPC in exercise of any of its powers could result in the regulatory capital requirements applied to Santander UK being further increased, which could have a material adverse effect on Santander UK’s operations, financial condition and prospects.
Further regulatory changes
Regulators in the UK and worldwide have proposed that additional loss absorbency requirements should be applied to systemically important institutions to ensure that there is sufficient loss absorbing and recapitalisation capacity available in resolution. The BoE is required to set the Minimum Requirement for Eligible Liabilities (MREL) for all institutions. The BoE required most banks, since 1 January 2022, to be in compliance with the end-state MREL requirements, which Santander UK plc and Santander UK Group Holdings plc are.
Regulators and legislators in the UK have produced a range of proposals for future legislative and regulatory reform which could force Santander UK to comply with certain operational restrictions or take steps to raise further capital or increase Santander UK’s expenses and could therefore have a material adverse effect on Santander UK’s operations, financial condition and prospects. These changes, which could affect Santander UK as a whole, include the UK's implementation of the remaining Basel III standards. The Basel Committee on Banking Supervision has approved a series of significant changes to the Basel regulatory capital and liquidity framework subsequent to Basel III from 7 December 2017, colloquially known as Basel IV or Basel 3.1, including additional capital requirements, higher capital ratios, more stringent eligibility requirements for capital instruments, a new leverage ratio and liquidity requirements. On 30 November 2022, the PRA published a consultation paper (CP) 16/22 on the implementation of the Basel IV standards (which the PRA refers to as Basel 3.1) in the UK (closing on 31 March 2023). This would revise the CRD IV framework already implemented in the UK and would have consequential impacts on the UK implementation of the leverage ratio, and elements of the liquidity and large exposures frameworks. The PRA has proposed a five-year transitional period for implementation that will become effective on 1 January 2025. CRD IV requirements adopted in the UK may change further, including as a result of policy developments associated with the migration of the CRD IV framework into domestic regulatory rules, as well as changes to the way in which the PRA continues to interpret and apply these requirements to UK banks (including as regards individual model approvals or otherwise).
There is a risk that changes to the UK’s capital adequacy regime (including any increase to minimum leverage ratios) may result in increased minimum capital requirements, which could reduce available capital for new business purposes and adversely affect Santander UK’s cost of funding, profitability and ability to pay dividends, or other discretionary payments on its capital instruments, continued organic growth (including increased lending), or pursue acquisitions or other strategic opportunities. Alternatively, Santander UK could be required to restructure its balance sheet to reduce capital charges incurred pursuant to the PRA’s rules or raise additional capital, but at increased cost and subject to prevailing market conditions. In addition, any changes to the eligibility criteria for Tier 1 and Tier 2 capital may affect Santander UK’s ability to raise Tier 1 and Tier 2 capital and impact the recognition of existing Tier 1 and Tier 2 capital resources in the calculation of Santander UK’s capital position. Furthermore, increased capital requirements may negatively affect Santander UK’s return on equity and other financial performance indicators.
| | | | | | | | | | | | | | |
| Annual Report 2022 | Santander UK Group Holdings plc 277 |
| | | | | | | | | | | | | | | | | | | | | | | | | | | | | | | | | | | | | | | | | |
| Strategic Report | Sustainability and Responsible Banking | Governance | Risk review | Financial review | Financial
statements | Shareholder
information |
| | | | | | | | | | | | | |
| | | | | | | | | | | | | |
Santander UK’s business could be affected if its capital is not managed effectively or if these measures limit Santander UK’s ability to manage its balance sheet and capital resources effectively or to access funding on commercially acceptable terms. Effective management of Santander UK’s capital position is important to Santander UK’s ability to operate its business, to continue to grow organically and to pursue its business strategy. There is a risk that implementing and maintaining existing and new liquidity requirements, such as through enhanced liquidity risk management systems, may incur significant costs, and more stringent requirements to hold liquid assets may materially affect Santander UK’s lending business as more funds may be required to acquire or maintain a liquidity buffer, thereby reducing future profitability. This could in turn adversely impact Santander UK’s operations, financial condition and prospects.
Liquidity and funding risks are inherent in Santander UK’s business and could have a material adverse effect on Santander UK’s operations, financial condition and prospects
Liquidity risk is the risk that Santander UK either does not have available sufficient financial resources to meet its obligations as they fall due or can secure them only at excessive cost. This risk is inherent in any retail and commercial banking business and can be heightened by a number of factors such as over-reliance on a particular source of funding, changes in credit ratings or market-wide phenomena such as market dislocation. Santander UK performs comprehensive internal stress testing in order to ensure that it maintains funding profiles and holds a liquid asset buffer in order to manage this risk. However, unforeseen systemic market factors like those experienced during the last financial crisis make it difficult to eliminate these risks completely. There can be no assurance that such circumstances will not reoccur or that they will occur in the same way, but past experience and comprehensive stress testing regimes help Santander UK to consider and manage the potential impacts on its liquidity position. Liquidity constraints may affect Santander UK’s operations and its ability to meet regulatory liquidity requirements or may limit growth possibilities. Disruption and volatility in the global financial markets could have a material adverse effect on Santander UK’s ability to access capital and liquidity on financial terms acceptable to it and in addition to increased funding costs, may result in a shortening in the term of funding it raises.
Santander UK’s cost of funding is related to prevailing interest rates and to its credit spreads. Increases in interest rates and Santander UK’s credit spreads can significantly increase the cost of its funding. Changes in Santander UK’s credit spreads can be market-driven or idiosyncratic in nature and may be influenced by perceptions of its creditworthiness rather than any underlying change in Santander UK’s financial position. Changes to interest rates and Santander UK’s credit spreads occur continuously and may be unpredictable and highly volatile. Market predictions of future central bank policy rate paths may impact Santander UK’s cost of funding, even if central bank actions do not ultimately follow market predictions.
If wholesale markets financing ceases to be available, or becomes excessively expensive, Santander UK may be forced to raise the rates it pays on deposits, with a view to attracting more customers and/or to sell assets, potentially at depressed prices or to reduce growth plans. Santander UK’s cost of funding might also be impacted by increased competition for retail and corporate deposits.
In response to the Covid-19 pandemic, the BoE introduced the Term Funding Scheme with additional incentives for Small and Medium-Sized Enterprises (TFSME). Santander UK has begun repaying drawings ahead of the 2025 contractual maturities and as at 31 December 2022, Santander UK had £25bn of drawings outstanding having repaid £7bn in the fourth quarter of 2022.
Each of the factors described above could have a material adverse effect on Santander UK, including its ability to access capital and liquidity on financial terms acceptable to it and, more generally, on its operations, financial condition and prospects.
Further, Santander UK aims for a funding structure that is consistent with its assets, avoids excessive reliance on short-term wholesale funding, attracts enduring retail and commercial deposits and provides diversification in products and tenor. Santander UK therefore relies, and will continue to rely, on retail and commercial deposits to fund a significant proportion of lending activities. The on-going availability of this type of funding is sensitive to a variety of factors outside Santander UK’s control, such as general economic conditions and the confidence of depositors in the economy and in the financial services industry in general, confidence in Santander UK specifically, Santander UK’s credit rating and the availability and extent of deposit guarantees, as well as competition between banks for deposits or competition with other products, such as mutual funds or, if launched, central bank digital currency. A change in any of these factors could significantly increase the amount of commercial deposit withdrawals in a short period of time, thereby reducing its ability to access deposit funding on appropriate terms, or at all, in the future, and therefore have a material adverse effect on Santander UK’s operations, financial condition and prospects.
Santander UK’s liquidity planning assumes that customers will continue to make a volume of deposits with Santander UK (particularly demand deposits and short-term time deposits), and Santander UK intends to maintain its emphasis on the use of deposits as a source of funds. The short-term nature of some deposits could cause liquidity problems for Santander UK in the future if deposits are not made in the volumes anticipated or are withdrawn at short notice or are not renewed. If a substantial number of depositors withdraw their demand deposits or do not roll over their time deposits upon maturity, there may be a material adverse effect on Santander UK’s operations, financial condition and prospects. This might increase Santander UK’s requirements for wholesale funding or require the execution of contingent options to raise additional liquidity, including the potential curtailing of growth plans.
An adverse movement in Santander UK’s external credit rating would likely increase its cost of funding, require Santander UK to post additional collateral or take other actions under some of its derivative contracts and adversely affect Santander UK’s operations, financial condition and prospects
Credit ratings affect the cost and other terms upon which Santander UK is able to obtain funding. Credit rating agencies regularly evaluate Santander UK, and their credit ratings of Santander UK and Santander UK’s issued debt are based on a number of factors, including Santander UK’s financial strength, the strength of the UK economy and conditions affecting the financial services industry generally.
Any downgrade in the external credit ratings assigned to Santander UK or any of Santander UK’s debt securities could have an adverse impact on Santander UK. In particular, a downgrade in Santander UK’s credit ratings could increase its borrowing costs and could require it to post additional collateral or take other actions under some of derivatives, loan facilities or other financial contracts, and could limit its access to capital markets and have a material adverse effect on its operations, financial condition and prospects. For example, a credit rating downgrade could have a material adverse effect on Santander UK’s ability to sell or market certain products, engage in certain longer-term or derivatives transactions and retain its customers or investors, particularly those who need a minimum rating threshold in order to transact or invest.
Any of these effects of a credit rating downgrade could, in turn, result in outflows and reduce Santander UK’s liquidity and have an adverse effect on Santander UK, including its operations, financial condition and prospects. For example, Santander UK estimates that at 31 December 2022, if Fitch, Moody’s and Standard & Poor’s were concurrently to downgrade the long-term credit ratings of Santander UK plc by one notch, and thereby trigger a short-term credit rating downgrade, this could result in an outflow of £1.4bn of cash and collateral. A hypothetical two notch downgrade would result in a further outflow of £0.7bn of cash and collateral at 31 December 2022. Under the LCR we hold sufficient liquidity to cover these potential outflows. However, while certain potential impacts are contractual and quantifiable, the full consequences of a credit rating downgrade are inherently uncertain, as they depend upon numerous dynamic, complex and inter-related factors and assumptions, including market conditions at the time of any downgrade, whether any downgrade of a firm’s long-term credit rating precipitates downgrades to its short-term credit rating, whether any downgrade precipitates changes to the way that the financial institutions sector is rated, and assumptions about the ratings of other financial institutions and the potential behaviours of various customers, investors and counterparties. Actual outflows will also depend upon certain other factors including any management or restructuring actions that could be taken to reduce cash outflows and the potential liquidity impact from a loss of unsecured funding (such as from money market funds) or loss of secured funding capacity.
| | | | | | | | | | | | | | |
| Annual Report 2022 | Santander UK Group Holdings plc 278 |
| | | | | | | | | | | | | | | | | | | | | | | | | | | | | | | | | | | | | | | | | |
| Strategic Report | Sustainability and Responsible Banking | Governance | Risk review | Financial review | Financial
statements | Shareholder
information |
| | | | | | | | | | | | | |
| | | | | | | | | | | | | |
There can be no assurance that the credit rating agencies will maintain Santander UK’s current credit ratings or outlooks. A failure to maintain favourable credit ratings or outlooks could increase Santander UK’s cost of funding, adversely affect Santander UK’s interest margins, and reduce its ability to secure both long-term and short-term funding. If a downgrade of a Santander UK member’s long-term credit ratings were to occur, it could also impact the short-term credit ratings of other members of Santander UK. The occurrence of any of these events could have a material adverse effect on Santander UK’s operations, financial condition and prospects.
Negative changes to the UK sovereign credit rating, or the perception that further negative changes may occur, could have a material adverse effect on Santander UK’s operations, financial condition, prospects and the marketability and trading value of its securities. This might also have an impact on Santander UK’s own credit rating, borrowing costs and ability to secure funding. Negative changes to the UK sovereign credit rating, or the perception that further negative changes may occur, could also have a material effect in depressing consumer confidence, restricting the availability, and increasing the cost, of funding for individuals and companies, further depressing economic activity, increasing unemployment and reducing asset prices, which could in turn have a material adverse effect on Santander UK’s operations, financial condition and prospects.
Changes in Santander UK’s pension liabilities and obligations could have a materially adverse effect on Santander UK’s operations, financial condition and prospects
The majority of current employees are provided with pension benefits through defined contribution arrangements. Under these arrangements Santander UK’s obligation is limited to the cash contributions paid. Santander UK provides retirement benefits for many of its former and current employees in the UK through a defined benefit pension scheme established under trust. Santander UK plc is the principal employer under this scheme, but it has only limited control over the rate at which it pays into the scheme. Under the UK statutory pension funding requirements employers are usually required to contribute to the schemes at the rate they agree with the scheme trustees although, if they cannot agree, the rate can be set by the Pensions Regulator. The scheme trustees may, in the course of discussions about future valuations, seek higher employer contributions. The scheme trustees’ power in relation to the payment of pension contributions depends on the terms of the trust deed and rules governing the scheme, but, in some cases, the trustees may have the unilateral right to set the employer’s relevant contribution.
The Pensions Regulator has the power to issue a financial support direction to companies within a group in respect of the liability of employers participating in UK defined benefit pension schemes where, amongst other things, that employer is ‘insufficiently resourced’ (as defined for the purposes of the relevant legislation). Such a financial support direction could require the companies to guarantee or provide security for the pension liabilities of those employers or could require additional amounts to be paid into the relevant pension schemes in respect of them.
The Pensions Regulator can also issue contribution notices if it is of the opinion that an employer has taken actions, or failed to take actions, deliberately designed to avoid meeting its pension promises or which are materially detrimental to the scheme’s ability to meet its pension promises. A contribution notice can be issued to any company or individual that is connected with or an associate of such employer in circumstances where the Pensions Regulator considers it reasonable to issue it and multiple notices could be issued to connected companies or individuals for the full amount of the debt. The risk of a contribution notice being imposed may inhibit Santander UK’s freedom to restructure or to undertake certain corporate activities. There is a risk that Santander UK could incur an obligation to make a contribution to the scheme by virtue of section 75 or 75A of the Pensions Act 1995 as a result of a reorganisation or disposal of Santander UK’s businesses.
Should the value of assets to liabilities in respect of the defined benefit schemes operated by Santander UK record a deficit or an increased deficit (as appropriate), due to either a reduction in the value of the pension fund assets (depending on the performance of financial markets) not matched by a fall in the pension fund liabilities and/or an increase in the scheme liabilities not matched by an increase in the pension fund assets due to changes in legislation, mortality assumptions, discount rate assumptions, inflation, or other factors, or there is a change in the actual or perceived strength of the employer’s covenant, this could result in Santander UK having to make increased contributions to reduce or satisfy the deficits which would divert resources from use in other areas of its business and reduce its capital resources. Inflation in particular poses a significant risk to the pension fund as liabilities would be adversely impacted by an increase in long-term inflation. While Santander UK can control a number of the above factors, there are some over which Santander UK has no or limited control. Although the trustee of the schemes is obliged to consult with Santander UK before changing the pension schemes’ investment strategy, the trustee has the final say and the ultimate responsibility for investment strategy rests with the trustee.
Changes in UK legislation and regulation through the Pension Schemes Act 2021 to address perceived failings in pension protection following recent high profile company insolvencies with large pension deficits may also affect Santander UK’s position, Specific areas where concerns have been raised are levels of dividends where there is a pension scheme with a deficit and the length of time taken to address deficits. These changes in legislation or regulation could result in Santander UK having to make increased contributions to reduce or satisfy the deficits which would divert resources from use in other areas of its business and reduce its capital resources.
The scheme has material investments in illiquid assets consisting primarily of unlisted credit, private equity and property. The value of these investments can only be known when they are realised. The value in the accounts is an estimate of the fair value of these investments but the final realised value could be materially different and if less than the value used in the accounts could result in Santander UK having to make increased contributions to reduce or satisfy resulting deficits which would also divert resources from use in other areas of the business and reduce its capital resources.
Any increase in Santander UK’s pension liabilities and obligations as a result of the foregoing factors could have a material adverse effect on Santander UK’s operations, financial conditions and prospects.
Market risks
Santander UK is subject to fluctuations in interest rates and other market risks, which could have a material adverse effect on Santander UK’s operations, financial condition and prospects
Market risk refers to the probability of variations in Santander UK’s net interest income or in the market value of its assets and liabilities due to volatility of interest rates, credit spreads, exchange rates or equity prices.
Changes in interest rates would affect the following areas, among others, of Santander UK’s business:
–Net interest income
–The value of Santander UK’s derivatives transactions
–The value of Santander UK's securities holdings
–The value of Santander UK’s loans and deposits
–The volume of loans originated
Interest rates are highly sensitive to many factors beyond Santander UK’s control, including increased regulation of the financial sector, inflation, monetary policies, domestic and international economic and political conditions. Variations in interest rates could affect the interest earned on Santander UK’s assets and the interest paid on its borrowings, thereby affecting its net interest income, which comprises the majority of its revenue, reducing its growth rate and profitability
| | | | | | | | | | | | | | |
| Annual Report 2022 | Santander UK Group Holdings plc 279 |
| | | | | | | | | | | | | | | | | | | | | | | | | | | | | | | | | | | | | | | | | |
| Strategic Report | Sustainability and Responsible Banking | Governance | Risk review | Financial review | Financial
statements | Shareholder
information |
| | | | | | | | | | | | | |
| | | | | | | | | | | | | |
and potentially resulting in losses. In addition, costs Santander UK incurs putting into place strategies to reduce interest rate exposure could increase in the future, which could have a material adverse effect on Santander UK’s operations, financial condition and prospects.
Increases in interest rates may reduce the volume of loans originated by Santander UK. Sustained high interest rates have historically discouraged customers from borrowing and have resulted in increased delinquencies in outstanding loans and deterioration in the quality of assets. Increases in interest rates may also reduce the propensity of Santander UK’s customers to prepay or refinance fixed-rate loans, reduce the value of its financial assets and reduce gains or require Santander UK to record losses on sales of Santander UK’s loans or securities, which could have a material adverse effect on Santander UK’s operations, financial condition and prospects.
Negative changes in positions recorded at fair value could have a material adverse effect on Santander UK’s operations, financial condition and prospects
Santander UK has material exposures to securities, derivatives and other investments that are recorded at fair value and are therefore exposed to potential negative market changes. A widening of market credit spreads, reflecting the prevailing market conditions would negatively impact asset valuations in future periods and may result in negative changes in the fair values of Santander UK's financial assets. A tightening of Santander UK’s own credit spreads would increase the magnitude of liabilities, thereby reducing net assets.
In addition, the value ultimately realised by Santander UK on disposal of assets and liabilities recorded at fair value may be lower than their current fair value; for example, during the last global financial crisis, financial markets were subject to periods of significant stress resulting in steep falls in perceived or actual financial asset values, particularly due to volatility in global financial markets and the resulting widening of credit spreads.
Santander UK is also exposed to changes in the market value of credit and funding spreads for the valuation of certain derivative contracts, the estimated value of which is negatively exposed to increases in the Credit Valuation Adjustment (CVA) spread and the Funding Fair Valuation Adjustment (FVA) spread over the lifetime of the transaction.
Any of these factors could require Santander UK to record negative changes in fair value which could have a material adverse effect on its operations, financial condition and prospects.
Santander UK is also exposed to changes in UK residential house price index levels, future index growth assumptions and house price index volatility. These impact the valuations of the portfolios of home reversion plans, lifetime mortgages and associated hedges held by Santander UK. In addition, the home reversion assets and mortgages are exposed to any changes in underlying mortality assumptions as maturity dates on these are not fixed and are driven by the vacation of the underlying property on a permanent basis by the plan holder. Specific property risk exists for each individual asset versus the indexed growth assumption at the point of maturity. Lifetime mortgages additionally have prepayment risk which is managed via a FVA based on historic data.
In addition, to the extent that fair values are determined using financial valuation models, such values may be inaccurate or subject to change, as the data used by such models may not be available or may become unavailable due to changes in market conditions, particularly for illiquid assets and in times of economic instability. In such circumstances, Santander UK’s valuation methodologies require it to make assumptions, judgements and estimates in order to establish fair value.
Reliable assumptions are difficult to make and are inherently uncertain. Moreover, valuation models are complex, making them inherently imperfect predictors of actual results. Any consequential impairments or write-downs could have a material adverse effect on Santander UK’s operations, financial condition and prospects.
Santander UK invests in debt securities of the UK government largely for liquidity management purposes. At 31 December 2022, approximately 4% of Santander UK’s total assets and 3% of Santander UK’s securities portfolio were comprised of debt securities issued by the UK government. Any failure by the UK government to make timely payments under the terms of these securities, or a significant decrease in their market value, could have a material adverse effect on Santander UK’s operations, financial condition and prospects.
Santander UK is exposed to risks relating to the integrity and continued existence of reference rates
As previously announced by the Financial Conduct Authority (FCA), all sterling, euro, Swiss franc and Japanese yen LIBOR settings, and the 1-week and 2-month USD LIBOR settings, ceased to be published based on panel bank submissions after 31 December 2021, and the remaining USD LIBOR settings (i.e., overnight, 1-month, 3-month, 6-month and 12-month) will either cease to be published or cease to be representative immediately after 30 June 2023. In September 2021, the FCA announced that it would compel the continued publication of the 1-, 3- and 6-month sterling (and Japanese yen) LIBOR settings after end-2021, using a ‘synthetic’ methodology for a limited time. The FCA announced subsequently that the 1- and 6-month sterling LIBOR 'synthetic' settings “will permanently cease immediately after final publication on 31 March 2023”, and in November 2022, the FCA announced that the 3-month sterling LIBOR 'synthetic' setting would cease to be published after 31 March 2024.
During 2021, Santander UK – along with its customers and counterparties – agreed the transition to alternative reference rates for the majority of agreements referencing the LIBOR settings that ceased at the end of 2021. The number of un-transitioned agreements referencing ‘synthetic’ LIBOR settings has continued to reduce in 2022, with the transition of additional agreements being agreed during the year. Santander UK is also continuing to finalise the transition of agreements referencing continuing USD LIBOR settings.
The transition of LIBOR based agreements has been complex and involved a range of risks (including legal, conduct, system, model, accounting and reputational risks). Changes to, or the replacement of, benchmarks may cause contracts in which they are used to perform differently than in the past or may have other consequential effects. In particular, the transition of contracts from GBP LIBOR to an alternative reference rate (such as SONIA or the BoE base rate) has typically involved an adjustment to the terms of financial contracts to which Santander UK is a party. Whilst Santander UK, and its customers and counterparties, have agreed on the transition for most impacted agreements and Santander UK has taken steps to manage the risks outlined, there can be no assurance that these risks will not crystallise. This could have adverse effects on Santander UK’s operations, financial condition, and prospects.
Credit risks
If the level of non-performing loans increases or the credit quality of Santander UK’s loans deteriorates in the future, or if Santander UK’s loan loss reserves are insufficient to cover loan losses, this could have a material adverse effect on Santander UK’s operations, financial condition and prospects
Risks arising from changes in credit quality and the recoverability of loans and amounts due from counterparties are inherent in a wide range of Santander UK’s businesses. Non-performing or low credit quality loans have in the past, and could continue to, have a material adverse effect on Santander UK’s operations, financial condition and prospects.
In particular, the amount of Santander UK’s reported non-performing loans may increase in the future as a result of growth in Santander UK’s total loan portfolio, including as a result of loan portfolios that Santander UK may acquire in the future (the credit quality of which may turn out to be worse than Santander UK had anticipated), or factors beyond Santander UK’s control, such as adverse changes in the credit quality of Santander UK’s borrowers and counterparties, a general
| | | | | | | | | | | | | | |
| Annual Report 2022 | Santander UK Group Holdings plc 280 |
| | | | | | | | | | | | | | | | | | | | | | | | | | | | | | | | | | | | | | | | | |
| Strategic Report | Sustainability and Responsible Banking | Governance | Risk review | Financial review | Financial
statements | Shareholder
information |
| | | | | | | | | | | | | |
| | | | | | | | | | | | | |
deterioration in the UK or global economic conditions (including without limitation, rising interest rates), the impact of political events, events affecting certain industries or events affecting financial markets and global economies. Broader inflationary pressures that impact a customer's ability to service debt payments could also lead to increased arrears in both unsecured and secured products.
There can be no assurance that Santander UK will be able to effectively control the level of impaired loans in, or the credit quality of, its total loan portfolio, which could have a material adverse effect on Santander UK’s operations, financial condition and prospects.
Interest rates payable on a significant portion of Santander UK’s outstanding mortgage loan products fluctuate over time due to, among other factors, changes in the BoE base rate. As a result, borrowers with variable interest rate mortgage loans are exposed to increased monthly payments when the related mortgage interest rate adjusts upward. Similarly, borrowers of mortgage loans with fixed or introductory rates adjusting to variable rates after an initial period are exposed to the risk of increased monthly payments at the end of this period. Over the last few years both variable and fixed interest rates have been at historically low levels, which has benefited borrowers of new loans and those repaying existing variable rate loans regardless of special or introductory rates. Future increases in borrowers' required monthly payments may result in higher delinquency rates and losses related to non-performing loans going forward. Borrowers seeking to avoid these increased monthly payments by refinancing their mortgage loans may no longer be able to find available replacement loans at comparably low interest rates. These events, alone or in combination, may contribute to higher delinquency rates and losses for Santander UK, which could have a material adverse effect on Santander UK’s operations, financial condition and prospects.
Santander UK’s current loan loss reserves may not be adequate to cover an increase in the amount of non-performing loans or any future deterioration in the overall credit quality of Santander UK’s total loan portfolio. Santander UK’s loan loss reserves are based on Santander UK’s current assessment of various factors affecting the quality of its loan portfolio, including its borrowers’ financial condition, repayment abilities, the realisable value of any collateral, the prospects for support from any guarantor, government macroeconomic policies, interest rates and the legal and regulatory environment. Many of these factors are beyond Santander UK’s control. As a result, there is no precise method for predicting loan and credit losses, and no assurance can be provided that Santander UK’s current or future loan loss reserves will be sufficient to cover actual losses.
If Santander UK’s assessment of and expectations concerning the above-mentioned factors differ from actual developments Santander UK may need to increase its loan loss reserves, which may adversely affect Santander UK’s operations, financial condition and prospects. Additionally, in calculating its loan loss reserves, Santander UK employs qualitative tools and statistical models which may not be reliable in all circumstances and which are dependent upon data that may not be complete. If Santander UK is unable to control or reduce the level of its non-performing or poor credit quality loans, this could have a material adverse effect on Santander UK’s operations, financial condition and prospects.
The value of the collateral, including real estate, securing Santander UK’s loans may not be sufficient, and Santander UK may be unable to realise the full value of the collateral securing Santander UK’s loan portfolio
The value of the collateral securing Santander UK’s loan portfolio may significantly fluctuate or decline due to factors beyond Santander UK’s control, including macroeconomic factors affecting the UK’s economy. Santander UK’s residential mortgage loan portfolio is one of its principal assets, comprising 85% of Santander UK’s loan portfolio at 31 December 2022. As a result, Santander UK is highly exposed to developments in the residential property market in the UK. House price growth was strong in the first half of 2022 with demand for housing also strong. However, in Q3 and Q4 prices started to fall and there remains a level of uncertainty in the outlook for house prices for 2023. The depth of the previous house price declines as well as the continuing uncertainty as to the extent and sustainability of the UK economic downturn and recovery will mean that losses could be incurred on loans should they go into possession.
The value of the collateral securing Santander UK’s loan portfolio may also be adversely affected by force majeure events such as natural disasters like floods or landslides exacerbated by climate change trends. Any force majeure event may cause widespread damage and could have an adverse impact on the economy of the affected region and may therefore impair the asset quality of Santander UK’s loan portfolio in that area.
Santander UK may also not have sufficiently up-to-date information on the value of collateral, which may result in an inaccurate assessment for impairment losses on loans secured by such collateral.
If any of the above events were to occur, Santander UK may need to make additional provisions to cover actual impairment losses of its loans, which could have a material adverse effect on Santander UK’s operations, financial condition and prospects.
Legal and regulatory risks
Santander UK is subject to substantial and evolving regulation and governmental oversight
As a financial services group, Santander UK is subject to extensive financial services laws, regulations, administrative actions and policies in the UK, and in each other location in which Santander UK operates. For a discussion of the principal laws and regulations to which Santander UK is subject, see 'Regulation of the Santander UK group'. The sector continues to face unprecedented levels of government and regulatory intervention and scrutiny, and changes to the regulations governing financial institutions and the conduct of business. In addition, regulatory and governmental authorities have continued to consider further enhanced or new legal or regulatory requirements intended to reduce the probability and impact of future crises (or otherwise assure the stability and operational resilience of institutions under their supervision), enhance consumer protection, address climate change risks, the risk of greenwashing and environmental, social and governance risks generally, and improve controls in relation to financial crime-related risks. Santander UK expect regulatory and government intervention in the banking sector to remain high for the foreseeable future. An intensive approach to supervision is maintained in the UK by the PRA, the FCA, the Competition and Markets Authority (CMA), the Payment Systems Regulator (PSR), the Information Commissioner’s Office (ICO) and the Lending Standards Board (LSB).
As well as being subject to UK regulation, as part of the Banco Santander group, Santander UK is also affected by other regulators such as the Banco de España (the Bank of Spain) and the European Central Bank (ECB), as well as various legal and regulatory regimes (including the US) that have extra-territorial effect. Extensive legislation and implementing regulations affecting the financial services industry have recently been adopted in regions that directly or indirectly affect Santander UK’s business, including Spain, the US, the EU and other jurisdictions.
The manner in which financial services laws, regulations and policies are applied to the operations of financial institutions has gone through great change which is still being implemented and reviewed. Recent proposals and measures taken by governmental, tax and regulatory authorities and further future changes in supervision and regulation (in particular in the UK), are beyond Santander UK’s control and could materially affect Santander UK’s business.
Changes in UK legislation and regulation applicable to the financial sector may also affect Santander UK’s competitive position, particularly if such changes are implemented before international consensus is reached on key issues affecting the industry.
To the extent these laws, regulations and policies apply to it, Santander UK may face higher compliance costs and the need to carefully manage capacity to readily respond to multiple regulatory or government policy changes simultaneously. Any legislative or regulatory actions and any required changes to Santander UK’s business operations resulting from such laws, regulations and policies as well as any deficiencies in Santander UK’s compliance with such laws, regulations and policies could result in significant loss of revenue, could have an impact on Santander UK’s strategy, limit its ability to pursue business opportunities in which Santander UK might otherwise consider engaging, limit Santander UK’s ability to provide certain products and services and/or result in enforcement action
| | | | | | | | | | | | | | |
| Annual Report 2022 | Santander UK Group Holdings plc 281 |
| | | | | | | | | | | | | | | | | | | | | | | | | | | | | | | | | | | | | | | | | |
| Strategic Report | Sustainability and Responsible Banking | Governance | Risk review | Financial review | Financial
statements | Shareholder
information |
| | | | | | | | | | | | | |
| | | | | | | | | | | | | |
(including the imposition of financial and other penalties). They may also affect the value of assets that Santander UK holds, requiring Santander UK to increase its prices thereby reducing demand for Santander UK’s products or otherwise have a material adverse effect on its operations, financial condition and prospects. Accordingly, there can be no assurance that future changes in laws, regulations and policies or in their interpretation or application by Santander UK or by regulatory authorities will not adversely affect Santander UK.
Specific examples of areas where regulatory changes and increased regulatory scrutiny could have a material adverse effect on Santander UK’s operations, financial condition and prospects include, but are not limited to, the following:
–Banking Reform: In accordance with the provisions of the Financial Services (Banking Reform) Act 2013 UK banking groups that hold significant retail deposits, including Santander UK, were required to separate or ‘ring-fence’ their retail banking activities from their wholesale banking activities by 1 January 2019. Santander UK completed its ring-fencing plans in advance of the legislative deadline of 1 January 2019. However, given the complexity of the ring-fencing regulatory regime and the material impact on the way Santander UK conducts its business operations in the UK, there is a risk that Santander UK and/or Santander UK plc may be found to be in breach of one or more ring-fencing requirements. This might occur, for example, if prohibited business activities are found to be taking place within the ring-fence, mandated retail banking activities are found being carried on in a UK entity outside the ring-fenced part of the group or Santander UK breached a PRA ring-fencing rule. If Santander UK were found to be in breach of any of the ring-fencing requirements placed upon it under the ring-fencing regime, it could be subject to supervisory or enforcement action by the PRA, the consequences of which might include substantial financial penalties, imposition of a suspension or restriction on Santander UK’s UK activities or, in the most serious of cases, forced restructuring of the UK group, entitling the PRA (subject to the consent of the UK government) to require the sale of a Santander ring-fenced bank or other parts of the UK group. Following HM Treasury’s publication of the final report of the Independent Panel on Ring-Fencing and Proprietary Trading on 15 March 2022, HM Treasury announced its intention to consult on certain limited reforms to the ring-fencing regime during 2023, alongside broader proposals to raise the threshold above which ring-fencing requirements apply from £25bn to £35bn of retail deposits, and to align the ring-fencing regime with the UK resolution regime. These consultations may result in future changes to the regime or lead to further review or amendment of Santander UK’s operational and compliance arrangements in relation to the regime.
–Competition: Reviews and investigations by competition authorities (which in the UK include the CMA, the FCA and the PSR) into any aspect of Santander UK’s operations or the functioning of any markets in which Santander UK operates.
–Payments: Santander UK has been required to make systems changes and update processes to comply with a number of new payment regulations at a European as well as domestic UK level. Within the UK, the Payment Systems Regulator has mandated Santander UK build systems and processes for both Confirmation of Payee as well as the Contingent Reimbursement Model Code (CRM) which both aim to reduce the level of customer fraud (particularly through our customers' manipulation into making payments known as 'Authorised Push Payment' fraud). Under these standards, Santander UK assumes responsibility for certain categories of customer losses and any inherent failing in system design may lead to fines from regulators and/or compensation being paid to customers. Santander UK also expects to see significant developments in the key UK payment systems architecture - with systems update of the high value Clearing House Automated Payment System (CHAPS) system through the Real Time Gross Settlement (RTGS) renewal as well as the 'New Payments Architecture' for faster payments, BACS and the other lower value retail payment schemes. Transitioning to the ‘New Payments Architecture’ will generate short-term challenges, including in successfully adopting the ISO20022 messaging standard while ensuring payment message completeness in alignment with regulatory requirements. PSD2 has been implemented and transposed into UK legislation in the Payment Services Regulations 2017 and the UK continues to build upon the requirements within the EBA Regulatory Technical Standards via the Open Banking API industry standard and build. Open Banking and PSD2 both have shown that they have the potential to exacerbate a number of existing risks including data loss/data protection, cyber security, fraud and wider financial crime risk, which in turn could give rise to increased costs, litigation risk and risk of regulatory investigation and enforcement activity.
–Data Privacy: Failure to comply with emerging and current laws and regulations concerning data privacy and localisation in a number of jurisdictions across the globe may result in regulatory sanctions. In particular, the General Data Protection Regulation (EU) 2016/679 (GDPR), including the GDPR as it forms part of UK domestic law by virtue of the EUWA (UK GDPR), and the Data Protection Act 2018 (DPA) imposes obligations on data controllers and rights for data subjects. The implementation of the UK GDPR and DPA has required substantial amendments to Santander UK’s procedures and policies. The changes have had, and could continue to have, an adverse impact on Santander UK’s business by increasing its operational and compliance costs. If there are breaches of UK GDPR obligations, Santander UK could face significant administrative and monetary sanctions as well as reputational damage. The occurrence of any of these events could have a material adverse effect on Santander UK’s operations, financial condition and prospects. The Data Protection and Digital Information Bill was introduced on 18 July 2022 and is currently progressing through the various stages of the parliamentary process. Some proposed reforms, such as the requirement to implement a privacy management programme may result in a further increase in compliance and operational costs, if implemented. The proposed changes may also pose a risk to the EU Commission’s adequacy finding in respect of the UK, as the UK’s data protection laws may no longer be considered to be essentially equivalent to those of the EU, which would impact data flows from the EU to the UK.
–Electronic Marketing: For the purposes of the Privacy and Electronic Communications Regulations 2003 (PECR), Santander UK relies on legitimate interests and not consent as a lawful basis for its marketing activity (an opt-out model, rather than an opt-in model). This model limits Santander UK to marketing its own similar products and services only to its own customers who have not opted out of marketing. This model therefore prevents the marketing by Santander UK of Santander group companies’ products and services by electronic means. This may put Santander UK at a competitive disadvantage. It is proposed to move from a legitimate interests to a consent model in the near future. There will be legal and regulatory risks associated with this transition, as well as systems updates costs to operationalise.
–Consumer Duty: In response to a requirement introduced into the FSMA, the FCA has published final rules and guidance on a broad consumer duty that firms undertaking regulated activities with retail clients should observe (the Consumer Duty). The Consumer Duty has three elements: A consumer Principle that provides a high-level expectation of conduct, a set of overarching Cross-cutting Rules which develop and amplify the standards of conduct that the FCA expects under the consumer Principle and a suite of rules and guidance setting more detailed expectations for a firm's conduct according to the four specific outcomes that represent the key elements of the firm and its consumer relationships (products and services, price and value, consumer understanding and consumer support). The Consumer Duty also includes requirements for firms to end unfair charges and fees, make it as easy to switch or cancel products as it was to take them out in the first place, provide helpful and accessible customer support, act quickly to respond to customer queries, provide timely, clear and easily understandable information to customers regarding products and services, provide products and services that are appropriate for their customers, and focus on the real and diverse needs of their customers, including those in vulnerable circumstances, at every stage and in each interaction. Firms will also need to monitor, evidence and report against many of the requirements. Final rules and guidance were published on 27 July 2022 and firms will have until 31 July 2023 to implement its requirements. For closed products or services, the FCA rules come into force on 31 July 2024. The Consumer Duty requires a review of, and changes to, Santander UK’s products, services, policies, systems and procedures against the FCA requirements. The Consumer Duty will affect elements of Santander UK’s business model and strategy, the products and services it offers and the pricing or costs of those products and services, which may in turn affect the revenue and profits that Santander UK is able to generate. It may result in an increase in civil litigation or claims to the Financial Ombudsman Service by customers alleging a breach of the Consumer Duty or in regulatory action by the FCA.
–Insolvency: Changes to the UK corporate insolvency regime were introduced through the Corporate Insolvency and Governance Act 2020, including a pre-insolvency moratorium process for corporates in financial difficulty to give a period of time to seek a rescue or restructure and a new restructuring plan insolvency procedure to enable debt restructures. The Finance Act 2020 re-established certain tax debts owed by corporates as secondary preferential debts, ranking ahead of debts owed to floating charge holders. The Debt Respite Scheme (Breathing Space Moratorium and Mental Health Crisis Moratorium) (England and Wales) Regulations 2020 (Breathing Space Regulations) (which came into force on 4 May 2021) give eligible individuals in England and Wales the ability to apply for a breathing space or mental health crisis moratorium during which creditors may not demand payment of interest or fees that accrue or enforce a debt owed by the applicant. The impact these changes will have in relation to the collection and recovery of loans to retail and corporate customers who are in financial difficulty or default continues to evolve.
| | | | | | | | | | | | | | |
| Annual Report 2022 | Santander UK Group Holdings plc 282 |
| | | | | | | | | | | | | | | | | | | | | | | | | | | | | | | | | | | | | | | | | |
| Strategic Report | Sustainability and Responsible Banking | Governance | Risk review | Financial review | Financial
statements | Shareholder
information |
| | | | | | | | | | | | | |
| | | | | | | | | | | | | |
–Outsourcing and Third Party Risk Management: In March 2021, the PRA published Supervisory Statement 2/21 on outsourcing and third party risk management (SS2/21). The PRA has stated that SS2/21 should be the primary source of reference for Santander UK when interpreting and complying with its requirements on outsourcing and third-party risk management. SS2/21 should be read alongside the EBA guidelines on outsourcing arrangements, and FCA rules and guidance on outsourcing which remain applicable and effective. A major development is that the scope of contracts which should meet the PRA requirements on outsourcing and third-party risk management has increased beyond that set out in the EBA guidelines on outsourcing. The PRA states that it expects material third-party agreements that are not outsourcing to be subject to controls that are as robust as the controls that would apply to outsourcing arrangements with an equivalent level of materiality. Also in March 2021, the PRA published Supervisory Statement 1/21 (SS1/21) which set out its expectations for the operational resilience of Santander UK’s ‘important business services’. These are services that a PRA regulated firm provides which, if disrupted, could pose a risk to that firm’s safety and soundness or, the financial stability of the UK. Santander UK is required to identify and set impact tolerances for all its important business services which must, in all cases, include a time-based metric to measure the tolerable level of disruption to that important business service. Santander UK must ensure it is able to deliver its important business services within impact tolerances in severe but plausible scenarios. If Santander UK is unable to meet the PRA’s requirements on outsourcing and third-party risk management then it may face supervisory measures, which could in turn have a material adverse effect on Santander UK’s operations, financial condition and prospects.
–Climate Change: The UK government has announced its intention to roll out new sustainability disclosure requirements, which will expand on the those required under the TCFD framework, including transition plans to align to net-zero, as well as a new UK green taxonomy. Santander UK Group Holdings plc is implementing the recommendations of TCFD on a group level: further reporting will require additional gathering of data and operationalisation of reporting and there will be legal, reputational and regulatory risks should Santander UK Group Holdings plc fail to adequately report, or to demonstrate appropriate capabilities to transition and support its customers to transition to a low carbon economy.
–Evolving Conduct and Regulatory Policy: The CMA is seeking enhanced consumer protection powers and is considering policy issues that may impact financial services, for example 'loyalty penalties' and the impact of digitalisation on consumer outcomes. There is the potential that the CMA and FCA take different stances on certain policy issues in these spheres.
–National Security and Investment Act: The National Security and Investment Act 2021 came into force on 4 January 2022 in the UK, introducing a new national security screening regime with mandatory suspensory notifications required for corporate and financial transactions in certain sectors which meet the prescribed thresholds. The Act also grants the UK Government wide-ranging powers to intervene in transactions on national security grounds, even where the transaction is outside of the scope of the mandatory notification regime. The UK Government can impose heavy criminal and civil penalties under the Act for non-compliance. In the event that the UK Government intervenes in any of Santander UK's transactions and/or imposes any related penalties on Santander UK, this could result in reputational damage and could have a material adverse effect on Santander UK's operations, financial condition and prospects
Santander UK may become subject to the provisions of the Banking Act, including bail-in and write down powers
The special resolution regime set out in the Banking Act provides HM Treasury, the BoE, the PRA and the FCA with a variety of powers for dealing with UK deposit taking institutions (and, in certain circumstances, their holding companies) that are failing or likely to fail, including: (i) to take a bank or bank holding company into temporary public ownership; (ii) to transfer all or part of the business of a bank to a private sector purchaser; or (iii) to transfer all or part of the business of a bank to a ‘bridge bank’. The special resolution regime also comprises a separate insolvency procedure and administration procedure each of which is of specific application to banks. These insolvency and administration measures may be invoked prior to the point at which an application for insolvency proceedings with respect to a relevant institution could be made.
If an instrument or order were made under the Banking Act in respect of an entity in Santander UK, such instrument or order (as the case may be) may, among other things: (i) result in a compulsory transfer of shares or other securities or property of such entity; (ii) have an impact on the rights of the holders of shares or other securities issued by Santander UK or such entity or result in the nullification or modification of the terms and conditions of such shares or securities; or (iii) result in the de-listing of the shares and/or other securities of such entity. In addition, such an order may affect matters in respect of Santander UK or such entity and/or other aspects of the shares or other securities of Santander UK or such entity, which may negatively affect the ability of Santander UK or such entity to meet its obligations in respect of such shares or securities.
Further, amendments to the Insolvency Act 1986 and secondary legislation have introduced changes to the treatment and ranking of certain debts with the result that certain eligible deposits will rank in priority to the claims of ordinary (i.e. non-preferred) unsecured creditors in the event of an insolvency. This may negatively affect the ability of unsecured creditors to recover sums due to them in an insolvency scenario.
If a ‘bail-in’ order were made under the Banking Act as amended by The Financial Services (Banking Reform) Act 2013 (see further ‘Regulation of Santander UK - The Banking Act 2009’), such an order would be based on the principle that any creditors affected by the 'bail-in' order should receive no less favourable treatment than they would have received had the bank entered into insolvency immediately before the coming into effect of the bail-in power. The bail-in power includes the power to cancel or write down (in whole or in part) certain liabilities or to modify the terms of certain contracts for the purposes of reducing or deferring the liabilities of a bank under resolution and the power to convert certain liabilities into shares (or other instruments of ownership) of the bank. The bail-in power under the Banking Act may potentially be exercised in respect of any unsecured debt securities issued by a bank under resolution or an entity in Santander UK, regardless of when they were issued. Accordingly, the bail-in power under the Banking Act could be exercised in respect of Santander UK’s debt securities. Public financial support would only be used as a last resort, if at all, after having assessed and utilised, to the maximum extent practicable, the resolution tools including the bail-in tool and the occurrence of circumstances in which bail-in powers would need to be exercised in respect of Santander UK or any entity in Santander UK would have a material adverse effect on Santander UK’s operations, financial condition and prospects.
The PRA also has the power to make rules requiring a parent undertaking of a bank to make arrangements to facilitate the exercise of resolution powers, including a power to require a member of a banking group to issue debt instruments. The exercise of such powers could have an impact on the liquidity of Santander UK’s debt instruments and could materially increase Santander UK’s cost of funding.
In addition, the resolution authorities have the power to require institutions and groups to make structural changes to ensure legal and operational separation of ‘critical functions’ from other functions where necessary, or to require institutions to limit or cease existing or proposed activities in certain circumstances. As a result, Santander UK is required to identify such ‘critical functions’ as part of its resolution and recovery planning. If used in respect of Santander UK, these ex ante powers could have a material adverse effect on Santander UK’s operations, financial condition and prospects.
Santander UK must comply with anti-money laundering, anti-terrorism, anti-bribery and corruption, sanctions and anti-tax evasion laws and regulations and a failure to prevent or detect any illegal or improper activities fully or on a timely basis could have a material adverse effect on Santander UK’s operations, financial condition or prospects
Santander UK is required to comply with applicable anti-money laundering (AML), counter-terrorism financing (CTF), anti-bribery and corruption, sanctions, preventing the facilitation of tax evasion and other laws and regulations in the jurisdictions in which Santander UK operates. These laws and regulations require Santander UK, among other things, to conduct customer due diligence (including in respect of sanctions and politically-exposed person screening), ensure customer and transaction information is appropriately recorded, monitored and kept up to date and implement effective financial crime policies and procedures detailing what is required from those responsible in order to counter financial crime risks. The policies and procedures require the implementation and embedding of effective controls and monitoring within the businesses of Santander UK, which in turn requires ongoing changes to systems, technology and operational activities.
| | | | | | | | | | | | | | |
| Annual Report 2022 | Santander UK Group Holdings plc 283 |
| | | | | | | | | | | | | | | | | | | | | | | | | | | | | | | | | | | | | | | | | |
| Strategic Report | Sustainability and Responsible Banking | Governance | Risk review | Financial review | Financial
statements | Shareholder
information |
| | | | | | | | | | | | | |
| | | | | | | | | | | | | |
Santander UK is also required to conduct financial crime training for its staff and to report suspicious transactions and activity to appropriate law enforcement. Comprehensive and risk based financial crime training at a group-wide and business unit level is a key element of effective controls, with the FCA providing guidance on expectations within its Financial Crime Guide. Financial crime is continually evolving. This requires proactive and adaptable responses from Santander UK so that it is able to deter, detect and disrupt threats and criminality effectively. Even known threats can never be fully eliminated, and there will be instances where Santander UK may be used by other parties to engage in money laundering and other illegal or improper activities. Santander UK’s staff, whom Santander UK rely heavily upon to identify such activities and report them, have varying degrees of experience in recognising criminal tactics, making effective, bank-wide mandatory and specialist training provided by the Santander UK Anti-Financial Crime Academy more pertinent.
Where Santander UK outsources any of its customer due diligence, customer screening or anti-financial crime operations, it remains responsible and accountable for full compliance and any breaches. If Santander UK is unable to apply the necessary scrutiny and oversight, or if such oversight proves insufficient to detect illegal or improper activities, there remains a risk of regulatory breach and this could have a material adverse effect on Santander UK's operations, financial condition and prospects.
Over the last decade, AML, CTF, anti-bribery and corruption and sanctions laws and regulations have become, and may continue to become, increasingly complex and detailed. Consequently, financial crime risk has become the subject of enhanced regulatory scrutiny and supervision by regulators globally, and such scrutiny continues to intensify. To manage regulatory scrutiny, Santander UK requires improved systems, sophisticated monitoring and skilled compliance personnel. Navigating the increasing complexity of financial crime regulation is a significant challenge, involving overlapping requirements between different legislation, and, in some instances, conflicts of laws. The divergence of policy approaches between the EU, UK and US in the area of economic sanctions and the evolving financial and trade sanctions imposed on Russia and Belarus due to the war in Ukraine, require additional immediate and longer-term sanctions risk management and compliance efforts for Santander UK.
UK AML and CTF legislation continues to change (for instance through regular updates to the UK’s list of third countries identified as high-risk countries), recent updates to beneficial ownership discrepancy reporting requirements detailed in the UK’s Money Laundering Regulations, or the recent launch of the Register of Overseas Entities and the associated compliance regime, which can lead to substantial amendments to Santander UK’s AML and CTF procedures and policies, with additional training and guidance required for employees. While legislative changes can offer opportunities to increase effectiveness and efficiency in the overall anti-financial crime system, there are also risks of legislative and regulatory divergence from EU requirements. Significant change could adversely impact Santander UK’s business by increasing its operational and compliance costs and reducing the value of its assets and operations, which would in turn have a material adverse effect on Santander UK’s operations, financial condition and prospects.
If Santander UK is unable to fully comply with applicable laws, regulations and expectations, its regulators and relevant law enforcement agencies have the ability and authority to pursue civil and criminal proceedings against it, to impose significant fines and other penalties on it, including requiring a complete review of Santander UK’s business systems, day-to-day supervision by external consultants, imposing restrictions on the conduct of Santander UK’s business and operations and ultimately the revocation of Santander UK’s banking licence. The reputational damage to its business and brand could be severe if Santander UK was found to have materially breached AML, CTF, anti-bribery and corruption, anti-tax evasion or sanctions requirements. Santander UK’s reputation could also suffer if it were unable to protect its customers or its business from being used by criminals for illegal or improper purposes. Criminal penalties could be imposed upon individuals employed by Santander UK. Any of these outcomes could have a material adverse effect on Santander UK’s operations, financial condition and prospects.
At an operational level, geo-political, economic and social changes can provide opportunities to financial criminals and alter the risks posed to banks. Effective intelligence and monitoring systems within strengthened public/private partnerships supported by improved national capabilities to share knowledge on emerging risks and information pre-suspicion are required to help manage these risks. However, there can be no guarantee that any intelligence shared by public authorities or other financial institutions will be accurate or effective in helping Santander UK to combat financial crime, and if, despite such efforts, Santander UK fails to combat financial crime effectively then this could have a material adverse effect on Santander UK’s operations, financial condition and prospects.
In addition, while Santander UK reviews its relevant counterparties’ internal policies and procedures (for example, under its correspondent banking relationships) with respect to such matters, Santander UK, to a large degree, depends upon its relevant counterparties to maintain and properly apply their own appropriate anti-financial crime procedures. Such measures, procedures and compliance may not be completely effective in preventing third parties from using its (and its relevant counterparties’) services as a conduit for money laundering (including illegal cash operations) without its (or its relevant counterparties’) knowledge. There are also risks that other third parties, such as suppliers, could be involved in financial crime. If Santander UK is associated with, or even accused of being associated with, financial crime (or a business involved in financial crime), then its reputation could suffer and it could become subject to civil or criminal proceedings that could result in penalties, sanctions and legal enforcement (including being added to 'black lists' that would prohibit certain parties from engaging in transactions with it), any one of which could have a material adverse effect on Santander UK’s operations, financial condition and prospects.
Santander UK is subject to tax-related risks
Santander UK is subject to the substance and interpretation of UK tax laws and is subject to routine review and audit by tax authorities in relation thereto. Santander UK’s interpretation or application of these tax laws may differ from those of the relevant tax authorities. While Santander UK provides for potential tax liabilities that may arise on the basis of the amounts expected to be paid to the tax authorities, the amounts ultimately paid may differ materially from the amounts provided depending on the ultimate resolution of such matters. In general, changes to tax laws and tax rates, including as a result of policy changes by governments and/or regulators, and penalties for failing to comply with such changes, could have a material adverse effect on Santander UK’s operations, financial condition and prospects. Some of these changes may be specific to the banking/financial services sectors and therefore result in Santander UK incurring an additional tax burden when compared to other industry sectors.
Santander UK is exposed to risk of loss and damage from civil litigation and/or criminal legal and regulatory proceedings
Santander UK faces various legal and regulatory issues that have given rise and may give rise to civil or criminal litigation, arbitration, and/or criminal, tax, administrative and/or regulatory investigations, inquiries or proceedings. Failure to adequately manage the risks arising in connection with legal and regulatory issues, including Santander UK’s obligations under existing applicable laws and regulations or its contractual obligations, including arrangements with its customers and suppliers, or failure to properly implement applicable laws and regulations could result in significant loss or damage including reputational damage, all of which could have a material adverse effect on Santander UK’s operations, financial condition and prospects.
Additionally, the current regulatory environment, with the continuing heightened supervisory focus, combined with the forthcoming regulatory change initiatives, will lead to material operational and compliance costs. Relevant risks include:
–Regulators, agencies and authorities with jurisdiction over Santander UK, including the BoE, the PRA and the FCA, HM Treasury, HM Revenue & Customs (HMRC), the CMA, the Information Commissioner’s Office, the Financial Ombudsman Service (FOS), the PSR, the Serious Fraud Office (SFO), the National Crime Agency (NCA), the Office of Financial Sanctions (OFSI) or the courts, may determine that certain aspects of Santander UK’s business have not been or are not being conducted in compliance with applicable laws or regulations (or that policies and procedures are inadequate to ensure compliance), or, in the case of the FOS, with what is fair and reasonable in the FOS’s opinion. Changes in policy, laws and regulations including in relation to small and medium sized enterprise (SME)
| | | | | | | | | | | | | | |
| Annual Report 2022 | Santander UK Group Holdings plc 284 |
| | | | | | | | | | | | | | | | | | | | | | | | | | | | | | | | | | | | | | | | | |
| Strategic Report | Sustainability and Responsible Banking | Governance | Risk review | Financial review | Financial
statements | Shareholder
information |
| | | | | | | | | | | | | |
| | | | | | | | | | | | | |
dispute resolution and liability for authorised push payment fraud and unauthorised payment fraud, may have significant consequences and lead to material implementation, operational and compliance costs.
–An adverse finding by a regulator, agency or authority could result in the need for extensive changes in systems and controls, business policies, and practices coupled with suspension of sales, restrictions on conduct of business and operations, withdrawal of services, customer redress, fines and reputational damage.
–The increased focus on competition law in financial services and concurrent competition enforcement powers for the FCA and PSR may increase the likelihood of competition law related inquiries or investigations initiated by either the CMA or these authorities. In addition, the CMA’s widening focus on market outcomes may result in increased reviews by the CMA of the markets in which Santander UK operates. Santander UK may be liable for damages to third parties harmed by Santander UK’s conduct of business. For competition law, there are efforts by governments across Europe to promote private enforcement as a means of obtaining redress for harm suffered as a result of competition law breaches. Under the Consumer Rights Act 2015, there is scope for class actions to be used to allow the claims of a whole class of claimants to be heard in a single action in both follow-on and standalone competition cases.
–The alleged historical or current misselling of, or misconduct in relation to, financial products, including the alleged misselling of Payment Protection Insurance (PPI), the alleged overcharging of interest, the alleged inappropriate sale of interest-only mortgages, the alleged unfair use of the standard variable rate in connection with mortgages, the alleged non-disclosure of commission, including auto finance related commission giving rise to an alleged unfair relationship, or alleged misconduct as a result of having sales practices and/or rewards structures that are deemed to have been inappropriate, has given rise to and may in the future give rise to a risk of complaints to FOS and/or civil litigation (including claims management company driven legal or complaints campaigns)(see Note 31 to the Consolidated Financial Statements for legal actions and regulatory matters). Such matters may in the future give rise to the risk of regulatory enforcement action requiring Santander UK to amend sales processes, withdraw products or provide restitution to affected customers, any of which may require additional provisions to be recorded in Santander UK’s financial statements and could adversely impact future revenues from affected products.
–Santander UK may have held and may continue to hold bank accounts for entities or have relationships with entities such as third parties that might be or are subject to scrutiny from various regulators and authorities, including the SFO, the NCA and regulators in the US and elsewhere, which has led and could in the future lead to Santander UK’s conduct being reviewed as part of any such scrutiny.
–Santander UK is (and will continue from time to time to be) subject to certain legal or regulatory investigations, inquiries and proceedings, both civil and criminal including in connection with Santander UK’s lending and payment activities, treatment of customers, relationships with Santander UK’s employees, financial crime, and other commercial or tax matters (see Note 31 to the Consolidated Financial Statements for legal actions and regulatory matters). These may be brought against Santander UK under UK legal or regulatory processes, or under legal or regulatory processes in other jurisdictions, such as the EU and the US, in circumstances where overseas regulators and authorities may have jurisdiction by virtue of its activities or operations.
–In view of the inherent difficulty of predicting the outcome of legal or regulatory proceedings, particularly where opportunistic claimants seek very large or indeterminate damages, cases present novel legal theories, involve a large number of parties or are in the early stages of discovery, or where the approaches of regulators or authorities to legal or regulatory issues and sanctions applied are subject to change, Santander UK cannot state with confidence what the eventual outcome of any pending matters will be and any such pending matters are not disclosed by name because they are under assessment. Santander UK’s provisions in respect of any pending legal or regulatory proceedings are made in accordance with relevant accounting requirements. These provisions are reviewed periodically. However, in light of the uncertainties involved in such legal or regulatory proceedings, there can be no assurance that the ultimate resolution of these matters will not exceed the provisions currently accrued by Santander UK. As a result, the outcome of a particular matter (whether currently provided or otherwise) could have a material adverse effect on Santander UK’s operations, financial condition and prospects.
–The developing legal and regulatory regime in which Santander UK operates requires it to be compliant across all aspects of its business, including the training, authorisation and supervision of personnel and the development of systems, processes and documentation. If Santander UK fails to be compliant with relevant law or regulation, there is a risk of an adverse impact on its business from more proactive regulatory intervention (including by any overseas regulator which establishes jurisdiction), investigation and enforcement activity leading to sanctions, fines, civil or criminal penalties, or other action imposed by or agreed with the regulatory authorities, as well as increased costs associated with responding to regulatory inquiries and defending regulatory actions. Customers of financial services institutions, including Santander UK’s customers, may seek redress if they consider that they have suffered loss for example as a result of the misselling of a particular product, or through incorrect application or enforcement of the terms and conditions of a particular product or in connection with a competition law infringement and Santander UK’s rights under a contract with its customers may in certain circumstances be unenforceable or otherwise impaired.
–The Financial Services and Markets Act 2000 (Designated Consumer Bodies) Order 2013 (the Designated Consumer Bodies Order) was made on 16 December 2013 and came into force on 1 January 2014. The Designated Consumer Bodies Order designates the National Association of Citizens Advice Bureaux, the Consumers’ Association, the General Consumer Council for Northern Ireland and the National Federation of Self Employed and Small Businesses as consumer bodies that may submit a ‘super-complaint’ to the FCA. A ‘super-complaint’ is a complaint made by any of these designated consumer bodies to the FCA on behalf of consumers of financial services where it considers that a feature, or a combination of features, of the market for financial services in the UK is seriously damaging the interests of these customers. Complaints about damage to the interests of individual consumers will continue to be dealt with by the FOS. If a ‘super-complaint’ were to be made against a Santander UK entity by a designated consumer body under the Designated Consumer Bodies Order, any response published or action taken by the FCA could have a material adverse effect on Santander UK’s operations, financial condition and prospects.
Given the: (i) requirement for compliance with an increasing volume of relevant laws and regulations; (ii) more proactive regulatory intervention and enforcement and more punitive sanctions and penalties for infringement; (iii) inherent unpredictability of litigation; (iv) evolution of the jurisdiction of FOS and CMA and related impacts; (v) development of a voluntary dispute resolution service to oversee the resolution of historic complaints from SMEs that meet the relevant eligibility criteria and new complaints from SMEs that would be outside the FOS’ proposed revised jurisdiction; (vi) introduction of a voluntary code to enhance protection for customers who are victims of authorised push payment fraud; and (vii) high volume of new regulations or policy changes from multiple regulators and authorities which Santander UK is mandated to implement within compressed timescales; it is possible that related costs or liabilities could have a material adverse effect on Santander UK’s operations, financial condition and prospects.
Operational risks
Failure to successfully apply or to improve Santander UK’s credit risk management systems could have a material adverse effect on Santander UK’s operations, financial condition and prospects
As a commercial banking group, one of the main types of risks inherent in Santander UK’s business is credit risk. For example, an important feature of Santander UK’s credit risk management system is to employ Santander UK’s own credit rating system to assess the particular risk profile of a customer. This system is primarily generated internally, but, in the case of counterparties with a global presence, also builds off the credit assessment assigned by other Banco Santander Group members. As this process involves detailed analysis of the customer or credit risk, taking into account both quantitative and qualitative factors, it is subject to human and IT systems errors. Where exercising their judgement on current or future credit risk behaviour of Santander UK’s customers, Santander UK’s employees may not always be able to assign a correct credit rating, which may result in a larger exposure to higher credit risks than indicated by Santander UK’s risk rating system. Santander UK may not be able to detect all possible risks before they occur, or its employees may not be able to effectively apply its credit policies and guidelines due to limited tools available to Santander UK, which may increase its credit risk.
Any failure to effectively apply, consistently monitor and refine Santander UK’s credit risk management systems may result in an increase in the level of non-performing loans and higher losses than expected, which could have a material adverse effect on Santander UK’s operations, financial condition and prospects.
| | | | | | | | | | | | | | |
| Annual Report 2022 | Santander UK Group Holdings plc 285 |
| | | | | | | | | | | | | | | | | | | | | | | | | | | | | | | | | | | | | | | | | |
| Strategic Report | Sustainability and Responsible Banking | Governance | Risk review | Financial review | Financial
statements | Shareholder
information |
| | | | | | | | | | | | | |
| | | | | | | | | | | | | |
Santander UK‘s data management policies and processes may not be sufficiently robust
Critical business processes across Santander UK rely on large volumes of data from a number of different systems and sources. If data governance (including data retention and deletion, data quality and data architecture policies and procedures) is not sufficiently robust, manual intervention, adjustments and reconciliations may be required to reduce the risk of error in Santander UK ‘s external reports or in reporting to senior management or regulators. Inadequate policies and processes may also affect Santander UK’s ability to use data to service customers more effectively or to improve Santander UK’s product offering. Santander UK must also comply with requirements under law or regulation which require classification of customers, counterparties, financial transactions or instruments. Santander UK must also comply with the requirements under law or regulation in respect of the use of and protection of customer data and must mitigate the risk of any misuse or loss of data owing to failure of a data management process or an employee breach. Financial institutions that fail to comply with in-country (local) and global regulatory and compliance requirements may face supervisory measures, which could in turn have a material adverse effect on Santander UK’s operations, financial condition and prospects.
Santander UK’s business is subject to risks related to cyber-crime
Santander UK’s systems, software and networks may be vulnerable to unauthorised access, misuse, computer viruses or other malicious code and other events that could have a security impact. The interception, misuse or mishandling of personal, confidential or proprietary information sent to or received from a client, vendor, service provider, counterparty or third party could result in legal liability, regulatory action and reputational harm, and therefore have a material adverse effect on Santander UK’s operations, financial condition and prospects.
In particular, in recent years the computer systems of companies and organisations have been targeted by cyber criminals, activists and nation-state-sponsored groups. Like other financial institutions, Santander UK manages and holds confidential personal information of customers in the conduct of its banking operations, as well as a large number of assets. Consequently, Santander UK has been, and continues to be, subject to a range of cyber-attacks, such as malware, phishing and denial of service.
Cyber-attacks could result in the loss of significant amounts of customer data and other sensitive information, as well as significant levels of liquid assets (including cash). In addition, cyber-attacks could give rise to the disablement of Santander UK’s electronic systems used to service its customers. Any material disruption or degradation of Santander UK’s systems could cause information, including data related to customer requests, to be lost or to be delivered to Santander UK’s clients with delays or errors, which could reduce demand for Santander UK’s services and products. As attempted attacks continue to evolve in both scope and sophistication, Santander UK may incur significant costs in order to modify or enhance its protective measures against such attacks, or to investigate or remediate any vulnerability or resulting breach, or in communicating cyber-attacks to its customers. If Santander UK fails to effectively manage its cyber security risk, the impact could be significant and may include harm to Santander UK reputation and make Santander UK liable for the payment of customer compensation, regulatory penalties and fines. Factors such as failing to apply critical security patches from its technology providers, to manage out obsolete technology or to update Santander UK’s processes in response to new threats could give rise to these consequences, which, if they occur, could have a material adverse effect on Santander UK’s operations, financial condition and prospects. This might also include significant increases in the premiums paid on cyber insurance policies or changes to policy limits and cover.
In addition, Santander UK may also be affected by cyber-attacks against national critical infrastructures in the UK or elsewhere, for example, the telecommunications network or cloud computing providers used by Santander UK. In common with other financial institutions Santander UK is dependent on such networks to provide digital banking services to its customers, connect its systems to suppliers and counterparties, and allow its staff to work effectively from their homes. Any cyber-attack against these networks could negatively affect its ability to service its customers. As Santander UK does not operate these networks it has limited ability to protect Santander UK’s business from the adverse effects of cyber-attack against them. Further, the domestic and global financial services industry, including key financial market infrastructure, may be the target of cyber disruption and attack by cyber criminals, activists or governments looking to cause economic instability. Santander UK has limited ability to protect its business from the adverse effects of cyber disruption or attack against its counterparties and key national and financial market infrastructure. If such a disruption or attack were to occur it could have a material adverse effect on Santander UK’s operations, financial condition and prospects.
Santander UK is exposed to risk from potential non-compliance with policies, employee misconduct, human error, negligence and deliberate acts of harm or dishonesty, including fraud
Santander UK is exposed to risk from potential non-compliance with policies, employee misconduct, human error, negligence and deliberate acts of harm or dishonesty, including fraud. It is not always possible to deter or prevent such errors, acts, omissions and failures and the precautions Santander UK takes to detect and prevent this activity may not always be effective. Any instances could result in regulatory sanctions and cause reputational or financial harm, and therefore have a material adverse effect on Santander UK’s operations, financial condition and prospects.
Any failure to effectively manage changes in Santander UK’s information technology infrastructure and management information systems in a timely manner could have a material adverse effect on Santander UK’s operations, financial condition and prospects
Santander UK’s businesses and its ability to remain competitive depends to a significant extent upon the functionality of its information technology systems and on its ability to upgrade and expand the capacity of its information technology infrastructure on a timely and cost-effective basis. The proper functioning of Santander UK’s financial control, risk management, credit analysis and reporting, accounting, customer service, financial crime, conduct and compliance and other information technology systems, as well as the communication networks between branches and main data processing centres, are critical to its customers, businesses and its ability to compete. Investments and improvements in Santander UK’s information technology infrastructure are regularly reviewed with a view to retain competitive advantage and to ensure that resilience remains within acceptable levels. Conversely any failure to effectively improve, expand or upgrade its information technology infrastructure and management information systems in a timely manner could have a material adverse effect on Santander UK’s operations, financial condition and prospects, and could cause reputational damage to Santander UK.
From time-to-time Santander UK is required to migrate information relating to its customers to new information technology systems. Any failure to manage such migration effectively could have a negative impact on Santander UK’s ability to provide services to its customers and could cause reputational damage to Santander UK.
Santander UK expects its programmes of change to have an effect on its risk profile, both technological and regulatory. Whether it is the opportunities from adoption of cloud technology, systems to support important regulatory initiatives, or the desire to identify, prioritise and remove obsolete systems from operations, the operational risk associated with programmes of systems change is likely to increase and this will therefore remain an area of key focus in Santander UK’s risk management. While internal controls aim to reduce the risk to acceptable levels, there can be no assurance that Santander UK will not suffer material losses from such operational risks in the future, which could have a material adverse effect on Santander UK’s operations, financial condition and prospects.
Santander UK may be exposed to unidentified or unanticipated risks despite its risk management policies, procedures and methods and may be exposed to risk related to errors in Santander UK’s risk modelling
The management of risk is an integral part of Santander UK’s activities. Santander UK seek to monitor and manage its risk exposure through a variety of risk reporting systems. For a further description of our risk management framework see the ‘Risk review’. While Santander UK employs a broad and diversified set of
| | | | | | | | | | | | | | |
| Annual Report 2022 | Santander UK Group Holdings plc 286 |
| | | | | | | | | | | | | | | | | | | | | | | | | | | | | | | | | | | | | | | | | |
| Strategic Report | Sustainability and Responsible Banking | Governance | Risk review | Financial review | Financial
statements | Shareholder
information |
| | | | | | | | | | | | | |
| | | | | | | | | | | | | |
risk monitoring and risk mitigation techniques and strategies, they may not be fully effective in mitigating Santander UK’s risk exposure in all economic market environments or against all types of risk, including risks that Santander UK fails to identify or anticipate.
Some of Santander UK’s tools and metrics for managing risk are based upon its use of observed historical market behaviour. Santander UK applies statistical and other tools to these observations to arrive at quantifications of its risk exposures. These tools and metrics may fail to predict future risk exposures. These risk exposures could, for example, arise from factors Santander UK did not anticipate or correctly evaluate in its statistical models. This would limit its ability to manage its risks. Santander UK's losses thus could be significantly greater than the historical measures indicate. In addition, Santander UK’s quantified modelling does not take all risks into account. Santander UK’s more qualitative approach to managing those risks could prove insufficient, exposing it to material, unanticipated losses. Santander UK could face adverse consequences as a result of decisions, which may lead to actions by management, based on models that include errors or are otherwise inadequately developed, implemented or used, or as a result of the modelled outcome being misunderstood. If existing or potential customers or counterparties believe its risk management is inadequate, they could take their business elsewhere or seek to limit their transactions with Santander UK. These occurrences could have a material adverse effect on Santander UK’s operations, financial condition and prospects.
Santander UK relies on third parties and affiliates for important infrastructure support, products and services
Third party providers and certain affiliates provide key components of Santander UK’s business infrastructure such as loan and deposit servicing systems, back office and business process support, information technology production and support, internet connections and network access. Relying on these third party providers and affiliates is a source of operational and regulatory risk, including with respect to security breaches affecting our third parties and other parties that interact with these providers. As the use and depth of Santander UK’s relationship with these third parties and affiliates increases, including the use of cloud based services, Santander UK increasingly faces the risk of operational failure with respect to its systems. Santander UK may be required to take steps to protect the integrity of its operational systems, thereby increasing its operational costs. In addition, any problems caused by these third parties or affiliates, including as a result of them not providing Santander UK their services for any reason, or performing their services poorly, could adversely affect Santander UK’s ability to deliver products and services to customers and otherwise conduct its business, which could lead to reputational damage, litigation and regulatory investigations and intervention. Replacing these third party vendors or affiliates could also entail significant delays and expense. Further, the operational and regulatory risk Santander UK faces as a result of these arrangements may be increased to the extent that it restructures such arrangements. Any restructuring could involve significant expense to Santander UK and entail significant delivery and execution risk which could have a material adverse effect on Santander UK’s operations, financial condition and prospects.
Santander UK relies on recruiting, retaining and developing appropriate senior management and skilled personnel
Santander UK’s continued success depends in part on the continued service of key members of its senior executive team and other key employees. The ability to continue to attract, develop, train, motivate and retain highly qualified and talented professionals is a key element of Santander UK’s strategy. The successful implementation of Santander UK’s strategy depends on the availability of skilled and appropriate management, both at Santander UK’s head office and in each of its business units. There is also an increasing demand for Santander UK to hire individuals with digital skills such as data scientist, engineering and designer skill sets. Such individuals are very sought after by all organisations, not just the banking industry, and thus Santander UK’s ability to attract and hire this talent will determine how quickly the bank is able to respond to technological change. In light of a shortage of skills currently being seen across the UK, it is increasingly challenging to recruit and retain talent for all roles, with subject matter expert and customer facing roles offering the biggest challenges.
If Santander UK fails to staff its operations appropriately or loses one or more of its key senior executives or other key employees and fails to replace them in a satisfactory and timely manner, it could have a material adverse effect on Santander UK’s operations, financial condition and prospects.
In addition, the financial services industry has and may continue to experience more stringent regulation of employee compensation, which could have an adverse effect on Santander UK’s ability to hire or retain the most qualified employees. If Santander UK fails or is unable to attract and appropriately develop, motivate and retain qualified professionals, it could have a material adverse effect on Santander UK’s operations, financial condition and prospects.
Financial reporting risk
Santander UK’s financial statements are based in part on judgements and accounting estimates which, if inaccurate, could cause material misstatement of Santander UK’s future financial results and financial condition.
The preparation of Santander UK's consolidated financial statements in accordance with IFRS requires management to make judgements, estimates and assumptions in applying the accounting policies that affect the reported amounts of assets, liabilities, income and expenses. Due to the inherent uncertainty in making estimates, actual results reported in future periods may be based on amounts which differ from those estimates. Estimates, judgements and assumptions are continually evaluated and are based on historical experience and other factors, including expectations of future events that are believed to be reasonable under the circumstances. There has been no change in the inherent sensitivity of the areas of judgement in the period. Management has considered the impact of developments in principal risks and uncertainties, as set out in the Risk review, on critical judgements and accounting estimates.
The significant judgements, apart from those involving estimation, made by management in applying Santander UK's accounting policies in these financial statements (key judgements) and the key sources of estimation uncertainty that may have a significant risk of causing a material adjustment to the carrying amount of assets and liabilities within the next financial year (key estimates), which together are considered critical to Santander UK's results and financial position, are set out in Note 1 to the Consolidated Financial Statements in 'Critical judgements and accounting estimates'. Any material differences between estimates and actual results reported in any given financial period, or any material adjustments to the carrying amount of assets and liabilities, could result in reputational damage to Santander UK and could have a material adverse effect on its future financial results and financial condition.
Changes in accounting standards could affect reported earnings
The accounting standard setters and other regulatory bodies periodically change the financial accounting and reporting standards that govern the preparation of Santander UK’s Consolidated Financial Statements. These changes can materially affect how Santander UK records and reports its financial condition and financial results. In some cases, Santander UK could be required to apply a new or revised standard retroactively, resulting in the restatement of prior period financial statements. Any change in reported earnings as a result of the foregoing could have a material adverse effect on Santander UK’s future financial results and financial condition.
| | | | | | | | | | | | | | |
| Annual Report 2022 | Santander UK Group Holdings plc 287 |
| | | | | | | | | | | | | | | | | | | | | | | | | | | | | | | | | | | | | | | | | |
| Strategic Report | Sustainability and Responsible Banking | Governance | Risk review | Financial review | Financial
statements | Shareholder
information |
| | | | | | | | | | | | | |
| | | | | | | | | | | | | |
Regulation of the Santander UK group
As a financial services group, Santander UK is subject to extensive financial services laws, regulations, administrative actions and policies in the UK and in each other location in which Santander UK operates. This intensive approach to supervision is maintained in the UK by the PRA and the FCA. As well as being subject to UK regulation, as a result of forming part of the Banco Santander group, Santander UK is also affected by other regulators, such as the Banco de España and the ECB, as well as various legal and regulatory regimes (including the US) that have extra-territorial effect. Extensive legislation and implementing regulations affecting the financial services industry have recently been adopted in regions that directly or indirectly affect Santander UK’s business, including Spain, the US, the EU and other jurisdictions. In the UK and elsewhere, there is continuing political, competitive and regulatory scrutiny of the banking industry. Political involvement in the regulatory process, in the behaviour and governance of the UK banking sector and in the major financial institutions in which the UK government has a direct financial interest is likely to continue.
Approach of the Financial Conduct Authority (FCA)
As per the FSMA (as amended by the Financial Services Act 2012), the FCA has a strategic objective to ensure that the relevant markets function well. In support of this, the FCA has three operational objectives: to protect consumers from bad conduct, to protect and enhance the integrity of the UK financial system and to promote effective competition in the interests of consumers.
The FCA Handbook sets out rules and guidance across a range of conduct issues with which financial institutions are required to comply including high level principles of business and detailed conduct of business standards and reporting standards.
Regulatory approach of the PRA
As per the Financial Services Act 2012, the PRA has two primary objectives: to promote the safety and soundness of the firms which it regulates and, with respect to insurers, to contribute to the securing of an appropriate degree of protection for policyholders. The PRA has a secondary objective in respect of the promotion of effective competition in the markets for services provided by PRA authorised firms. The PRA’s regulatory and supervisory approach incorporates three key characteristics: to take a judgement-based approach, a forward-looking approach, and a focused approach.
The PRA Rulebook includes regulations and guidance relating to capital adequacy and liquidity, among several other things.
US regulation
Within the Dodd-Frank Act, the so-called Volcker Rule, prohibits ‘banking entities’, including the Santander UK group, from engaging in certain forms of proprietary trading or from sponsoring or investing in certain covered funds, in each case subject to certain exemptions, including exemptions permitting foreign banking entities to engage in trading and fund activities that take place solely outside of the US. The Volcker Rule also contains exclusions and certain exemptions for market-making, hedging, underwriting, trading in US government and agency obligations as well as certain foreign government obligations, and also permits ownership interests in certain types of funds to be retained such as new exclusions for credit funds, venture capital funds, family wealth management vehicles and client facilitation vehicles. The Santander UK group has policies, procedures and controls in place designed to achieve compliance with the Volcker Rule.
The Banking Act 2009
The special resolution regime set out in the Banking Act 2009 provides HM Treasury, the Bank of England, the PRA and the FCA with a variety of powers for dealing with UK deposit taking institutions (and, in certain circumstances, their holding companies) that are failing or likely to fail, including: (i) to take a bank or bank holding company into temporary public ownership; (ii) to transfer all or part of the business of a bank to a private sector purchaser; or (iii) to transfer all or part of the business of a bank to a bridge bank’. The special resolution regime also comprises a separate insolvency procedure and administration procedure each of which is of specific application to banks. These insolvency and administration measures may be invoked prior to the point at which an application for insolvency proceedings with respect to a relevant institution could be made.
The Financial Services (Banking Reform) Act 2013 further amended the Banking Act 2009 to introduce a UK ‘bail-in power’ to implement the BRRD, which contains a bail-in power similar to that contained in the Banking Act and requires EU Member States to provide resolution authorities with the power to write down the claims of unsecured creditors of a failing institution and to convert unsecured claims to equity (subject to certain parameters). The UK bail-in power is an additional power available to the UK resolution authorities under the special resolution regime provided for in the Banking Act 2009. This enables them to recapitalise a failed institution by allocating losses to such institution’s shareholders and unsecured creditors, subject to the rights of such shareholders and unsecured creditors to be compensated under a bail-in compensation order.
Competition
The CMA is the UK’s main competition authority responsible for ensuring that competition and markets work well for consumers. In addition, under the Banking Reform Act, as of 1 April 2015, the FCA has the power to enforce against breaches of the Competition Act 1998 and to refer markets to the CMA for in-depth investigation in the areas of financial services in the UK. As of 1 April 2015, the PSR also has an objective and powers equivalent to those of the FCA to promote competition in the payments industry.
Payments
Within the UK, the Payment Systems Regulator has mandated that Santander UK builds systems and processes for both Confirmation of Payee as well as the Contingent Reimbursement Model Code (CRM) both of which aim to reduce the level of customer fraud (particularly through our customer's manipulation into making payments known as 'Authorised Push Payment' fraud). Under these standards, Santander UK assumes responsibility for certain categories of customer losses, and inherent failings in system design may lead to fines from regulators and/or compensation being paid to customers. Santander UK also expects to see significant developments in the key UK payment systems architecture - with systems update of the high value CHAPS system through Real Time Gross Settlement (RTGS) renewal as well as the 'New Payments Architecture' for faster payments, BACS and the other lower value retail payment schemes. The Second Payment Services Directive (PSD2) has been implemented within the UK and the UK continues to build upon the requirements within the EBA Regulatory Technical Standards via the Open Banking API industry standard and build. Santander UK has also adapted systems and pricing to comply with other European regulations - including the Second Cross Border Payments Regulation which has required Santander UK to baseline the majority of EEA currency payments against their domestic equivalents in price.
Finally, Santander UK has reviewed its use of European payments systems and processes in light of the end of the UK’s transition period with the EU and has concluded that it can remain within the SEPA Payment Scheme and continue to send SEPA Euro Payments via Madrid to EEA beneficiaries. However, as it is not domiciled in the EU, it has needed to exit the other (high value) Euro payment schemes, being EURO1 and Target 2. It has negotiated new arrangements to access those systems via Madrid and a correspondent banking relationship agreement has been agreed and is operational.
| | | | | | | | | | | | | | |
| Annual Report 2022 | Santander UK Group Holdings plc 288 |
| | | | | | | | | | | | | | | | | | | | | | | | | | | | | | | | | | | | | | | | | |
| Strategic Report | Sustainability and Responsible Banking | Governance | Risk review | Financial review | Financial
statements | Shareholder
information |
| | | | | | | | | | | | | |
| | | | | | | | | | | | | |
Financial crime
On 30 May 2018, the Council of EU and the European Parliament amended the Fourth Anti-Money Laundering Directive (the Directive), publishing the amending Directive (EU) No 2018 / 843 (5th AMLD).
The 5th AMLD brought in increased corporate transparency rules, introduced the application of AML rules to firms providing services associated with virtual currencies and further extended enhanced due diligence (EDD) requirements to all transactions with natural persons or legal entities established in third countries identified as high-risk countries (HRTCs) pursuant to Article 9(2) of the Directive.
The UK government transposed the Directive into UK law on 20 December 2019, amending the UK’s Money Laundering, Terrorist Financing and Transfer of Funds (Information on the Payer) Regulations 2017 (MLRs) through the Money Laundering and Terrorist Financing (Amendment) Regulations 2019. The latter came into effect on 10 January 2020 and, among other changes, introduced a requirement to report beneficial ownership discrepancies to Companies House. Further amendments to the MLRs were made by the Money Laundering and Terrorist Financing (Amendment) (EU Exit) Regulations 2020.
On 26 March 2021, HM Treasury published a new statutory instrument, The Money Laundering and Terrorist Financing (Amendment) (High Risk Countries) Regulations 2021 amending the MLRs by replacing references to the European Commission's list of HRTCs (in respect of which EDD and additional specific EDD measures must be taken under the MLRs) with a UK list identified in a new Schedule 3ZA to the MLRs. This was the first exercise of the powers in section 49 of the Sanctions and Anti-Money Laundering Act 2018 (SAMLA). The UK list of HRTCs came into force on 26 March 2021 and has since been amended through The Money Laundering and Terrorist Financing (Amendment)(No.2)(High-Risk Countries) Regulations 2021 coming into force on 13 July 2021, The Money Laundering and Terrorist Financing (Amendment) (No. 3) (High-Risk Countries) Regulations 2021 coming into force on 2 November 2021, Money Laundering and Terrorist Financing (Amendment) (High-Risk Countries) Regulations 2022 coming into force on 29 March 2022, The Money Laundering and Terrorist Financing (High-Risk Countries) (Amendment) (No. 2) Regulations 2022 coming into force on 12 July 2022, and The Money Laundering and Terrorist Financing (High-Risk Countries) (Amendment) (No. 3) Regulations 2022 coming into force on 15 November 2022. These amendments reflect changes to the Financial Action Task Force (FATF) list of jurisdictions under increased monitoring.
In July 2021, the UK government launched two consultations on the MLRs (as amended). The first targeted specific changes to align the UK’s AML/CTF regime with recent amendments to FATF standards and introduce certain technical changes. The second was a 'Call for Evidence' examining the effectiveness and future state of the UK’s AML/CTF regime. Both consultations closed in October 2021. On 24 June 2022, the UK government published a forward-looking review of the UK’s AML/CTF regime in response to the ‘Call for Evidence’ focusing on systemic effectiveness, regulatory effectiveness and supervisory effectiveness. Following the publication of The Money Laundering and Terrorist Financing (Amendment) Regulations 2022 which came into force on 9 March 2022 and served to make certain time-sensitive updates to ensure the UK continues to meet international standards, and , the UK government published The Money Laundering and Terrorist Financing (Amendment) (No. 2) Regulations 2022 in response to their 2021 consultation, coming into force on 1 September with specific measures coming into force on 1 April 2023. These amendments include amongst others, specific obligations in respect of addressing Proliferation Financing risk and amendments to beneficial ownership discrepancy reporting regime, including discrepancy reporting obligations in respect of the Register of Overseas Entities introduced by the Economic Crime (Transparency and Enforcement) Act 2022 which was quickly moved through Parliament in light of Russia’s invasion of Ukraine and came into force in 15 March 2022. Additional key changes introduced by the Economic Crime (Transparency and Enforcement) Act 2022 included strengthening aspects of the Unexplained Wealth Orders regime and increasing the speed at which sanctions designations can be made. On 22 September 2022, the UK government introduced the Economic Crime & Corporate Transparency Bill which aims to deliver long-awaited reforms to tackle economic crime and improve transparency over corporate entities. It is expected that this Bill gains Royal Assent during 2023.
To ensure regulatory continuity post-Brexit, the government introduced SAMLA to provide a legal framework through which it can impose and update sanctions following the UK's departure from the EU. SAMLA grants the UK government the authority to introduce statutory instruments to enable compliance with United Nations (UN) sanctions and other international obligations, and to meet defined discretionary purposes such as promoting national and international peace and security. SAMLA broadly mirrors the EU sanctions regime but enables the UK to act independently by imposing sanctions regulations swiftly without the need to reach a consensus with other EU member states. For example, the UK government introduced the Global Anti-Corruption Sanctions Regulations 2021 which allow the UK government to designate entities and individuals involved in serious corruption around the world. Separately, the Money Laundering and Transfer of Funds (Information) (Amendment) (EU Exit) Regulations 2019 were enacted to ensure that the UK’s AML Regime has continued to operate effectively now that the UK has ceased to be a member of the EU.
The possibility of near-term divergence from EU law was reduced by the FCA's Temporary Transitional Power. Under this, a standstill direction was issued which stipulated that until 31 March 2022 and in terms of certain regulatory obligations, firms could continue to comply with the legal framework in place in the UK immediately before 31 December 2020. Financial crime legislation was covered by the standstill direction.
The US government has continued to actively apply and enforce sanctions against individuals, entities and countries. US sanctions are subject to change without warning and may affect Santander UK’s ability to transact with certain individuals and entities and to operate in certain jurisdictions.
The UK, EU and US are expected to continue to use sanctions to pursue their foreign policy interests and objectives, and the imposition of new, additional, and/or enhanced sanctions is and will remain unpredictable. Any changes in UK, EU and/or US sanctions could affect Santander UK’s business.
The banking sector in the UK continues to be subject to the Suspicious Activity Reporting (SAR) regime laid out in the Proceeds of Crime Act 2002. The regime is one of the key tools to inform law enforcement agencies and the National Crime Agency of suspicious (potentially money laundering or terrorist financing) activity. In 2018, the UK government asked the Law Commission to conduct a review of the legislation underpinning the regime. The review was completed in July 2019 and concluded that the breadth of the legal framework, including the pressure to submit SARs that is driven by individual criminal liability for failing to submit one when ‘suspicious’, means that the SARs regime suffers from very large reporting volumes.
The UK’s SARs Reform Programme, which operates within the confines of the government’s Economic Crime Plan 2019-2022, is exploring how banks could, together with government, target their joint efforts to produce and act quickly on higher value intelligence, thereby acting on some of the Law Commission’s findings. Anti-corruption continues to be a key focus of the UK Governments approach to economic crime. The Economic Crime (Transparency and Enforcement) Act 2022 which came into force on 15 March 2022 contains provisions which will seek to tackle corruption through increased transparency of overseas ownership of UK land and real estate and the strengthening of UWO’s. Anti-corruption remains a topic of global focus, as illustrated by President Biden's ‘Protecting Democracy’ summit in December 2021 during which the US released its first strategy on Countering Corruption and more recently US National Security Advisor Jake Sullivan's speech at the December 2022 International Anti-Corruption Conference (IACC). Sullivan reiterated President Biden and the US administration's commitment to working with other countries to champion democracy and fight corruption.
| | | | | | | | | | | | | | |
| Annual Report 2022 | Santander UK Group Holdings plc 289 |
| | | | | | | | | | | | | | | | | | | | | | | | | | | | | | | | | | | | | | | | | |
| Strategic Report | Sustainability and Responsible Banking | Governance | Risk review | Financial review | Financial
statements | Shareholder
information |
| | | | | | | | | | | | | |
| | | | | | | | | | | | | |
Articles of Association
The following is a summary of the Articles of Association (the Articles) of the Company.
Santander UK Group Holdings plc is a public limited company incorporated and registered in England and Wales under the Companies Act 2006, with registered number 8700698. The Articles do not specifically state or limit the objects of the Company which are therefore unrestricted.
A Director shall not vote on, or be counted in the quorum in relation to, any resolution of the Directors in respect of any contract in which he has an interest, except if no conflict of interest could reasonably be expected to arise from that interest, or any resolution of the Directors concerning his own appointment, or the settlement or variation of the terms or the termination of his or her appointment. Directors are entitled to such remuneration as the directors determine for their services to the Company as directors and for any other service which they undertake for the Company. Directors may delegate to a person or committee the determination of any fee, remuneration or other benefit which may be paid or provided to any Director. No Director is required to retire by reason of his or her age, nor do any special formalities apply to the appointment or re-election of any Director who is over any age limit. No shareholding qualification for Directors is required.
The Company may issue shares with such rights or restrictions as may be determined by ordinary resolution or, if no such resolution has been passed or so far as the resolution does not make specific provision, as the Directors may decide. The Company may by ordinary resolution declare dividends, and the Directors may decide to declare or pay interim dividends. No dividend may be declared or paid unless it is in accordance with shareholders’ respective rights. If dividends are unclaimed for twelve years, the right to the dividend ceases. All dividends or other sums which are payable in respect of shares, and unclaimed after having been declared or become payable, may be invested or otherwise made use of by the Directors for the benefit of the Company until claimed.
Ordinary shares are transferable. Holders of ordinary shares are entitled to receive notice of and to attend any general meeting of the Company. Subject to any special terms as to voting upon which any shares may be issued or may for the time being be held, or any suspension or any abrogation of special rights, as set out in the Articles of Association, on a show of hands every member who is present in person at a general meeting of the Company shall have one vote and every proxy present who has been duly appointed by a member shall have one vote. On a poll every member who is present in person or by proxy shall have one vote for every share of which he is the holder.
The Company pays dividends on its ordinary shares only out of its distributable profits and not out of share capital. Dividends are determined by the Board.
The Company’s Articles of Association authorise it to issue redeemable shares, but the Company’s ordinary shares are not redeemable. There are no sinking fund provisions. Where the shares are partly paid, the Board may make further calls upon the holders in respect of any sum whether in respect of nominal value or premium that is unpaid on their shares. There are no provisions discriminating against any existing or prospective shareholder as a result of such shareholder owning a substantial number of shares of any class. If the Company’s share capital is split into different classes of shares, subject to the provisions of the UK Companies Act 2006, all or any of the rights attached to any class of shares (whether or not the Company is being wound up) may be varied with the consent in writing of the holders of not less than three-quarters in nominal value of the issued shares of that class or with the sanction of a special resolution passed at a separate general meeting of the holders of those shares. Additional quorum and voting requirements apply to such meeting.
General meetings shall be called by at least 14 clear days’ notice (that is, excluding the day of the general meeting and the day on which the notice is given). A general meeting may be called by shorter notice if it is so agreed, in the case of an annual general meeting, by all the shareholders having a right to attend and vote, or in other cases, by a majority in number of the shareholders having a right to attend and vote, being a majority together holding not less than 95% in nominal value of the shares giving the right. The notice shall specify the date, time and place of the meeting and the general nature of the business to be transacted.
There are no restrictions on the rights to own securities for either resident or non-resident shareholders, other than those to which they may be subject as a result of laws and regulations in their home jurisdiction.
| | | | | | | | | | | | | | |
| Annual Report 2022 | Santander UK Group Holdings plc 290 |
| | | | | | | | | | | | | | | | | | | | | | | | | | | | | | | | | | | | | | | | | |
| Strategic Report | Sustainability and Responsible Banking | Governance | Risk review | Financial review | Financial
statements | Shareholder
information |
| | | | | | | | | | | | | |
| | | | | | | | | | | | | |
Disclosure pursuant to Section 219 of the Iran Threat Reduction and Syria Human Rights Act
Pursuant to Section 219 of the Iran Threat Reduction and Syria Human Rights Act of 2012, which added Section 13(r) to the Securities Exchange Act of 1934, as amended (the Exchange Act), an issuer is required to disclose in its annual or quarterly reports, as applicable, whether it or any of its affiliates knowingly engaged in certain activities, transactions or dealings relating to Iran or with individuals or entities designated pursuant to certain Executive Orders. Disclosure is generally required even where the activities, transactions or dealings were conducted in compliance with applicable law.
The following activities are disclosed in response to Section 13(r) with respect to the Banco Santander group and its affiliates. During the period covered by this report:
(a) Santander UK holds seven blocked accounts for five customers that are currently designated by the US under the Specially Designated Global Terrorist (SDGT) sanctions programme. Revenues and profits generated by Santander UK on these accounts in the year ended 31 December 2022 were negligible relative to the overall profits of Banco Santander SA.
(b) Santander Consumer Finance, SA holds through its Belgian branch seven blocked correspondent accounts for an Iranian bank that is currently designated by the US under the SDGT sanctions programme. The accounts have been blocked since 2008. No revenues or profits were generated by the Belgian branch on these accounts in the year ended 31 December 2022.
(c) Santander Brasil holds three blocked accounts for three customers with domicile in Brazil designated by the US under the SDGT sanctions programme. Revenues and profits generated by Santander Brasil on these accounts in the year ended 31 December 2022 were negligible relative to the overall profits of Banco Santander SA.
(d) Santander Consumer Finance, SA also held through its branch in Greece an auto finance loan for a client designated by the US under the SDGT sanctions programme. The relationship was terminated before the year end. Revenues or profits generated by the branch in Greece on this position in the year ended 31 December 2022 were negligible relative to the overall profits of Banco Santander SA.
(e) The Banco Santander group also has certain legacy performance guarantees for the benefit of an Iranian bank that is currently designated by the US under the SDGT sanctions programme (stand-by letters of credit to guarantee the obligations – either under tender documents or under contracting agreements – of contractors who participated in public bids in Iran) that were in place prior to 27 April 2007.
In the aggregate, all of the transactions described above resulted in gross revenues and net profits in the year ended 31 December 2022 which were negligible relative to the overall revenues and profits of the Banco Santander group. The Banco Santander group has undertaken significant steps to withdraw from the Iranian market such as closing its representative office in Iran and ceasing all banking activities therein, including correspondent relationships, deposit taking from Iranian entities and issuing export letters of credit, except for the legacy transactions described above. The Banco Santander group is not contractually permitted to cancel these arrangements without either (i) paying the guaranteed amount (in the case of the performance guarantees), or (ii) forfeiting the outstanding amounts due to it (in the case of the export credits). As such, the Banco Santander group intends to continue to provide the guarantees and hold these assets in accordance with company policy and applicable laws.
| | | | | | | | | | | | | | |
| Annual Report 2022 | Santander UK Group Holdings plc 291 |
| | | | | | | | | | | | | | | | | | | | | | | | | | | | | | | | | | | | | | | | | |
| Strategic Report | Sustainability and Responsible Banking | Governance | Risk review | Financial review | Financial
statements | Shareholder
information |
| | | | | | | | | | | | | |
| | | | | | | | | | | | | |
Board of Directors
1 William Vereker
Chair
Appointed 1 November 2020 (Chair), previously Independent Non-Executive Director from 1 October 2020.
Skills and experience
William is an experienced and well-respected Banker, previously having served as Global Head of Investment Banking for UBS (2013 – 2018), and prior to that holding a number of leadership roles at Nomura, Lehman Brothers and Morgan Stanley. From 2018 to 2019 he served as the Prime Minister’s Business Envoy. He was a Vice Chairman at JP Morgan until October 2020.
Other principal appointments
Chair of Santander UK plc*. Non-Executive Director to the London Stock Exchange Group Plc. Member of the UK Prime Minister's Investment Council. Member and Special Advisor of Delancey Credit and Income Fund GP – Investment Committee. He sits on the Advisory Board of Celonis GmbH and also chairs the Advisory Board of Gonville & Caius College, Cambridge.
Board Committee memberships
Board Nomination Committee (Chair)
2 Lisa Fretwell
Independent Non-Executive Director
Appointed 1 January 2022
Skills and experience
Lisa has 25 years’ experience within the financial services, technology, retail, and manufacturing industries in both business and consulting roles. She holds a first-class honours degree in Chemical engineering from the University of Birmingham and an MBA from Cranfield Business School. She was awarded Business Leader of the Year by Women in Credit in 2020. Lisa joined Santander from Experian, where she was Managing Director of Experian UK’s Data Business from 2019 - 2021. Prior to this, Lisa held various senior roles at Cisco for over 10 years, including Vice President of Software and Operations and Managing Director of Consulting Services and Internet Business Solutions. Lisa also held roles at Capgemini and Procter & Gamble before joining Cisco.
Other principal appointments
Independent Non-Executive Director of Santander UK plc*. Lisa is a Non-Executive Director at Restore plc since 20 April 2022.
Board Committee memberships
Board Audit Committee, Board Risk Committee, Board Responsible Banking Committee
3 Ed Giera
Independent Non-Executive Director, Senior Independent Director
Ed was appointed Independent Non-Executive Director on 19 August 2015 and Senior Independent Non-Executive Director on 15 October 2020.
Skills and experience
Ed’s executive career was with JP Morgan Securities, the investment banking affiliate of JP Morgan Chase & Co. where he held positions as Global Head of Pension Advisory, Head of Capital Markets for the EMEA region, and other senior roles. Ed is currently a Partner and Manager of Boscobel Place Capital LLC, a private investment partnership focused on the global financial services sector, and Principal of EJ Giera LLC, providing corporate finance advisory and fiduciary services. Ed was formerly a Non-Executive Director at Pension Corporation Group Limited, a holding company for the Pension Insurance Corporation Holdings Limited, where he chaired the Board Audit & Risk Committee. He has also served as a Non-Executive Director for ICBC Standard Bank plc; for the Renshaw Bay Real Estate Fund and Renshaw Bay Structured Finance Opportunity Fund, respectively; and for NovaTech LLC.
Other principal appointments
Independent Non-Executive Director of Santander UK plc*. Non-Executive Director and Chair of the Board Risk Committee of Rothesay Life Plc. Director of Rothesay Limited. Partner of Boscobel Place Capital LLC and RB St. James's Place LP. Founder and Principal of E.J. Giera LLC.
Board Committee memberships
Board Audit Committee, Board Nomination Committee, Board Responsible Banking Committee (Chair), Board Risk Committee (Chair), Board Remuneration Committee.
4 Chris Jones
Independent Non-Executive Director, Whistleblowers' Champion
Appointed 30 March 2015
Skills and experience
Chis is a financial expert with a deep understanding and knowledge of financial services and is an experienced INED. Chris was formerly a partner at PwC from 1989 to 2014, focused on the financial services industry from the mid-1980s and was a Senior Audit Partner specialising in the audit of banks and other financial services companies. He also led PwC’s EMEA Financial Services practice and was a member of their Financial Services global leadership team. Chris is a past president of the Association of Corporate Treasurers and chaired their advisory board from 2010 to 2018. Chris is a fellow of both the Institute of Chartered Accountants in England and Wales and The Association of Corporate Treasurers.
Other principal appointments
Independent Non-Executive Director of Santander UK plc*. Independent Non-Executive Director of Legal & General Investment Management (Holdings) Limited and Legal and General Assurance (Pensions Management) Limited. Audit and Risk Committee member of the Wellcome Trust.
Board Committee memberships
Board Audit Committee (Chair), Board Remuneration Committee (Chair), Board Responsible Banking Committee, Board Risk Committee.
5 António Simões
Banco Santander Nominated Non-Executive Director
Appointed 30 April 2021
Skills and experience
António is currently Head of Europe for Banco Santander. He joined the Banco Santander group in September 2020 as regional head of Europe with managerial responsibility and oversight of the bank’s businesses in Europe with reporting lines from the country heads of Spain, UK, Portugal and Poland. Before joining
| | | | | | | | | | | | | | |
| Annual Report 2022 | Santander UK Group Holdings plc 292 |
| | | | | | | | | | | | | | | | | | | | | | | | | | | | | | | | | | | | | | | | | |
| Strategic Report | Sustainability and Responsible Banking | Governance | Risk review | Financial review | Financial
statements | Shareholder
information |
| | | | | | | | | | | | | |
| | | | | | | | | | | | | |
Santander, António spent 13 years at HSBC where he led a number of businesses, both in London and Hong Kong. Most recently he was CEO for Global Private Banking and before that António was CEO for the UK and continental Europe. Previously to joining HSBC, he was a partner at McKinsey & Company in their London office and also worked at Goldman Sachs.
Other principal appointments
Non-Executive Director of Santander UK plc*. Trustee for the Prince’s Trust International. Non-Executive Director of Universia España Red de Universidades, S.A. Director of PagoNxT SL (Spain)*.
6 Pamela Walkden
Banco Santander Nominated Non-Executive Director
Appointed 1 October 2021
Skills and experience
Pamela has served in a number of senior management positions predominantly at Standard Chartered Bank, including as Group Head of Human Resources, Chief Risk Officer, Group Treasurer, Group Head of Asset and Liability Management and Regional Markets, Group Head of Internal Audit, Group Head of Corporate Affairs and Group Manager of Investor Relations.
In addition, she served as an independent member of the UK Prudential Regulation Authority (PRA) Regulatory Reform Panel and as a member of the European Banking Authority Stakeholder Group.
Other principal appointments
Non-Executive Director of Santander UK plc* . Independent Non-Executive Director and Chair of the Audit Committee in Banco Santander SA. Member of the Advisory Board at JD Haspel Limited.
Board Committee memberships
Board Risk Committee, Board Nomination Committee
7 Mike Regnier
Executive Director, Chief Executive Officer
Appointed Chief Executive Officer on 1 April 2022.
Skills and experience
Mike joined Santander UK from Yorkshire Building Society (YBS), where he was a Board member since 2014 and Chief Executive since 2017. He previously held the posts of Chief Commercial Officer and Chief Customer Officer. Mike began his career in strategic management consulting with a focus on Retail and Retail Financial Services. After management positions at Asda, he joined the banking sector and held a number of senior positions at Lloyds Banking Group, including Personal Current Accounts and Credit Cards Director, and Products and Marketing Director for TSB.
Mike has served as a Board Director of Visa UK, and Chairman of the merchant acquirer LTSB Cardnet. He was also Chair of the Building Societies Association from 2019 – 2021. Mike holds an MEng in Engineering, Economics & Management from Oxford, together with an MBA from INSEAD.
Other principal appointments
Chief Executive Officer of Santander UK plc*.
8 Madhukar (Duke) Dayal
Executive Director, Chief Financial Officer
Appointed 16 September 2019
Skills and experience
Duke has extensive financial services experience in a wide range of areas. Before joining Santander UK, he worked for Santander US* in Boston as CFO of Santander Holdings* (April 2016 – July 2019) and President and CEO of Santander Bank NA* (September 2017 – July 2019).
Prior to joining Santander, Duke was with BNP Paribas for six years, where he served as Chief Financial Officer for BNP Paribas USA Holdings, BancWest and Bank of the West in San Francisco. Before that he helped lead a private equity start-up for JP Morgan Chase & Co, Brysam Global Partners. Prior to that, he spent eight years with Citi in a variety of business and finance roles in New York, California, South Korea and Brussels.
Duke also served as a member of the Executive Committee on the Board of Trustees for the Institute of International Banking in New York, as a Board member of the Federal Home Loan Bank of Pittsburgh and is on the Board of Governors for Nottingham Trent University.
Other principal appointments
Chief Financial Officer of Santander UK plc*.
* Part of the Banco Santander group.
| | | | | | | | | | | | | | |
| Annual Report 2022 | Santander UK Group Holdings plc 293 |
| | | | | | | | | | | | | | | | | | | | | | | | | | | | | | | | | | | | | | | | | |
| Strategic Report | Sustainability and Responsible Banking | Governance | Risk review | Financial review | Financial
statements | Shareholder
information |
| | | | | | | | | | | | | |
| | | | | | | | | | | | | |
New York Stock Exchange (NYSE) Corporate Governance – differences in UK and NYSE corporate governance practice
The Company issues notes in the US from time to time pursuant to a shelf registration statement filed with the SEC. As these notes are listed on the NYSE, the Company is required to comply with NYSE corporate governance standards. Under the NYSE corporate governance standards, the Company must disclose any significant ways in which its corporate governance practices differ from those followed by US companies under the NYSE corporate governance standards. We believe the following to be the significant differences between our current corporate governance practices and those applicable to US companies under the NYSE corporate governance standards.
Under the NYSE corporate governance standards, independent Directors must comprise a majority of the Board. As at 31 December 2022, our Board was comprised of a Chair, (who is also a Non-Executive Director), two Executive Directors and five Non-Executive Directors. The Chair, William Vereker, and three of the other Non-Executive Directors, (Lisa Fretwell, Ed Giera and Chris Jones), were independent as defined in the NYSE corporate governance standards. The other two Non-Executive Directors (Antonio Simoes and Pamela Walkden) were not independent according to NYSE corporate governance standards as they are representatives of the ultimate parent company, Banco Santander SA. Lisa Fretwell was appointed as an independent Non-Executive Director, on 1 January 2022.
The NYSE corporate governance standards require that listed US companies have a nominating or corporate governance committee composed entirely of independent Directors and with a written charter addressing certain corporate governance matters. Applicable UK rules do not require companies without equity shares listed on the London Stock Exchange, such as the Company, to have a nominating committee. However, the Company has a Board Nomination Committee, which leads the process for Board appointments. This Committee has written Terms of Reference setting out its role to identify and nominate candidates for Board and Board Committee appointments. As at 31 December 2022, the following Directors made up the Board Nomination Committee: William Vereker (Chair), Ed Giera and Pamela Walkden. Two of the Directors were independent according to NYSE corporate governance standards. The other Director (Pamela Walkden) was not independent according to NYSE corporate governance standards as she is a representative of the ultimate parent company, Banco Santander SA.
In addition, the Board is responsible for monitoring the effectiveness of the Company’s governance practices and making changes as needed to ensure the alignment of the Company’s governance system with current best practices. The Board monitors and manages potential conflicts of interest of management, Board members, shareholders, external advisers and other service providers, including misuse of corporate assets and abuse in related party transactions.
The NYSE corporate governance standards require that listed US companies have a compensation committee composed entirely of independent directors and with a written charter addressing certain corporate governance matters. Under its written Terms of Reference, the Company’s Board Remuneration Committee is primarily responsible for overseeing and supervising Santander UK’s policies and frameworks covering remuneration and reward. As at 31 December 2022, the following Directors were on the Board Remuneration Committee: Chris Jones (Chair) and Ed Giera. Both Directors were independent Directors according to NYSE corporate governance standards.
The NYSE corporate governance standards require that listed US companies have an audit committee that satisfies the requirements of Rule 10A-3 under the US Securities Exchange Act of 1934, as amended (Rule 10A-3), with a written charter addressing certain corporate governance matters, and having a minimum of three members who are all independent as defined in Rule 10A-3. As a wholly-owned subsidiary of a parent that satisfies the requirements of Rule 10A-3(c)(2), the Company is exempt from the requirements of Rule 10A-3. However, the Company does have a Board Audit Committee. As at 31 December 2022, the Board Audit Committee was made up of three Non-Executive Directors: Chris Jones (Chair), Lisa Fretwell and Ed Giera. All members were independent in 2022 as defined in Rule 10A-3.
The scope of the Board Audit Committee’s Terms of Reference as well as the duties and responsibilities of such committee are more limited than that required of audit committees under the NYSE corporate governance standards. For example, the Board Audit Committee does not provide an audit committee report as required by the NYSE corporate governance standards to be included in the Company’s annual proxy statement.
The NYSE corporate governance standards require that listed US companies adopt and disclose corporate governance guidelines, including with respect to the qualification, training and evaluation of their Directors. The NYSE corporate governance standards also require that the Board conducts a self-evaluation at least annually to determine whether it and its committees are functioning effectively. The Board has undertaken regular reviews of Board effectiveness primarily through an internal process led by the Chair. During the year the Board considered feedback gained from the 2022 performance evaluations, which concluded that the performance of the Board and its Committees continues to be effective.
A CEO of a US company listed on the NYSE must annually certify that he or she is not aware of any violation by the company of NYSE corporate government standards. In accordance with NYSE corporate governance standards applicable to foreign private issuers, our CEO is not required to provide the NYSE with such an annual compliance certification.
| | | | | | | | | | | | | | |
| Annual Report 2022 | Santander UK Group Holdings plc 294 |
| | | | | | | | | | | | | | | | | | | | | | | | | | | | | | | | | | | | | | | | | |
| Strategic Report | Sustainability and Responsible Banking | Governance | Risk review | Financial review | Financial
statements | Shareholder
information |
| | | | | | | | | | | | | |
| | | | | | | | | | | | | |
Other information
Designated agent
The designated agent for service of process on Santander UK in the United States is C T Corporation System, 111 Eighth Avenue, New York, New York.
Trustee/paying agent
The names and addresses of the Trustee/paying agent for each class of security registered with the US Securities and Exchange Commission (the SEC) are set out below:
–Senior: Citibank NA, 388 Greenwich Street, New York, New York 10013, United States
–Subordinated: Citibank NA, 388 Greenwich Street, New York, New York 10013, United States
–Capital: Bank of New York Mellon, 240 Greenwich Street, Floor 7E, New York, New York 10286
Documents on display
The Company is subject to the information requirements of the US Securities Exchange Act of 1934. In accordance with these requirements, the Company files its Annual Report and other related documents with the SEC, and which may be accessed at the SEC's website. Information on the operation of the public reference rooms can be obtained by calling the SEC on +1-202-551-8090 or by looking at the SEC’s website. The SEC maintains an internet site that contains reports, proxy and information statements, and other information regarding issuers that file electronically with it. This is accessible at www.sec.gov.
None of the websites referred to in this Annual Report on Form 20-F for the year ended 31 December 2022 (the Form 20-F), including where a link is provided, nor any of the information contained on such websites is incorporated by reference in the Form 20-F.
Legal proceedings
We are party to various legal proceedings in the ordinary course of business. See Notes 29 and 31 the Consolidated Financial Statements.
Material contracts
We are party to various contracts in the ordinary course of business. For the two years ended 31 December 2022, there have been no material contracts entered into outside the ordinary course of business.
Audit fees
See Note 7 to the Consolidated Financial Statements.
Accounting developments under IFRS
See Note 1 to the Consolidated Financial Statements.
Share capital
Details of the Company’s share capital are set out in the Notes to the Consolidated Financial Statements.
Major shareholders
At 31 December 2022, the Company was a subsidiary of Banco Santander SA and Santusa Holding SL. On 23 September 2013, the Company was incorporated with the issuance of two ordinary shares of £1 each which formed the initial share capital of the Company and were held by Banco Santander SA from 11 December 2013. On 10 January 2014, pursuant to a Board resolution dated 10 January 2014, the Company issued 11,267,503,000 ordinary shares of £1 each to Banco Santander SA and Santusa Holding SL in exchange for acquiring all of the ordinary shares of Santander UK plc. On 24 March 2015, the Company cancelled and extinguished 4,207,503,002 ordinary shares. On 25 March 2015, the Company became a public limited company and changed its name from Santander UK Group Holdings Limited to Santander UK Group Holdings plc.
Exchange controls
There are no UK laws, decrees or regulations that restrict our export or import of capital, including the availability of cash and cash equivalents for use by us, or that affect the remittance of dividends or other shareholder payments to non-UK holders of Company shares, except as outlined in the section on Taxation for US Investors below.
| | | | | | | | | | | | | | |
| Annual Report 2022 | Santander UK Group Holdings plc 295 |
| | | | | | | | | | | | | | | | | | | | | | | | | | | | | | | | | | | | | | | | | |
| Strategic Report | Sustainability and Responsible Banking | Governance | Risk review | Financial review | Financial
statements | Shareholder
information |
| | | | | | | | | | | | | |
| | | | | | | | | | | | | |
Additional balance sheet and cash flow analysis
SECURITIES
Securities are classified in the consolidated balance sheet as other financial assets at fair value through profit or loss, other financial assets at amortised cost and financial assets at fair value through other comprehensive income.
Debt securities at amortised cost - Yields
The following table shows the weighted average yields for debt securities not held at fair value at 31 December 2022.
| | | | | | | | | | | | | | | | | |
| Not later than one year | Later than one
year and not
later than five
years | Later than five
years and not
later than ten
years | Later than ten years | Total |
| % | % | % | % | % |
| Weighted average yield | | | | | |
| – Debt securities at amortised cost | — | | 4.58 | | 3.46 | | — | | 4.12 | |
Weighted average yield is calculated using Total clean price x yield for each maturity bucket / Total clean price for each maturity bucket.
LOANS AND ADVANCES TO BANKS
Loans and advances to banks are classified in the consolidated balance sheet as financial assets at amortised cost and include loans and advances to banks classified as reverse repurchase agreements – non trading.
Reconciliation to classifications in the consolidated balance sheet
| | | | | | | | | | | |
| | 2022 | 2021 |
| Note | £m | £m |
| Financial assets at amortised cost: | | — | | — | |
| Loans and advances to banks | | 1,105 | | 1,420 | |
| Reverse repurchase agreements - non trading | 16 | 885 | | 447 | |
| | 1,990 | | 1,867 | |
Maturity analysis
The following table shows loans and advances to banks by maturity at 31 December 2022.
| | | | | | | | | | | | | | | | | |
| Not later than one year | Later than one year and not later than five years | Later than five years and not later than fifteen years | Later than fifteen years | Total |
| £m | £m | £m | £m | £m |
| Fixed interest rate | 1,624 | | — | | — | | — | | 1,624 | |
| Variable interest rate | 358 | | — | | 8 | | — | | 366 | |
| 1,982 | | — | | 8 | | — | | 1,990 | |
| | | | | | | | | | | | | | |
| Annual Report 2022 | Santander UK Group Holdings plc 296 |
| | | | | | | | | | | | | | | | | | | | | | | | | | | | | | | | | | | | | | | | | |
| Strategic Report | Sustainability and Responsible Banking | Governance | Risk review | Financial review | Financial
statements | Shareholder
information |
| | | | | | | | | | | | | |
| | | | | | | | | | | | | |
LOANS AND ADVANCES TO CUSTOMERS
Loans and advances to customers are classified in the consolidated balance sheet as financial assets at fair value through profit or loss, financial assets at amortised cost (including loans and advances to customers classified as reverse repurchase agreements – non trading) and financial assets at fair value through other comprehensive income. Reverse repurchase agreements represent business with professional non-bank customers as part of the liquidity risk management function. The balances below are stated before deducting impairment loss allowances and RV and voluntary termination provisions.
Maturity analysis
The following table shows financial assets at amortised cost: Loans and advances to customers by maturity at 31 December 2022. Overdrafts are included as ‘on-demand’. Loans and advances are included at their contractual maturity; no account is taken of a customer’s ability to repay early where it exists.
| | | | | | | | | | | | | | | | | |
| | Not later than one year | Later than one year and not later than five years | Later than five years and not later than fifteen years | Later than fifteen years | Total |
| £m | £m | £m | £m | £m |
| Loans secured on residential properties | 1,461 | 7,930 | 47,413 | 131,478 | 188,282 |
| Corporate loans | 3,100 | 11,211 | 4,137 | 609 | 19,057 |
| Finance leases | 1,311 | 3,282 | 52 | — | 4,645 |
| Other unsecured advances | 3,497 | 3,340 | 863 | 42 | 7,742 |
| Accrued interest and other adjustments | 18 | 77 | 225 | 584 | 904 |
| Amounts due from immediate parent | — | — | — | — | — |
| Amounts due from fellow subsidiaries and joint ventures | 1,970 | — | — | 2,195 | 4,165 |
| Loans and advances to customers | 11,357 | 25,840 | 52,690 | 134,908 | 224,795 |
We manage our balance sheet on a behavioural basis, rather than on the basis of contractual maturity. Many loans are repaid before their legal maturity, particularly advances secured on residential property.
Interest rate sensitivity
The following table shows the interest rate sensitivity of Financial assets at amortised cost: Loans and advances to customers due after one year at 31 December 2022.
| | | | | | | | | | | |
| Fixed rate | Variable rate | Total |
| £m | £m | £m |
| Loans secured on residential properties | 164,473 | | 23,809 | | 188,282 | |
| Corporate loans | 2,753 | | 16,304 | | 19,057 | |
| Finance leases | 4,643 | | 2 | | 4,645 | |
| Other unsecured advances | 5,392 | | 2,350 | | 7,742 | |
| Accrued interest and other adjustments | 729 | | 175 | | 904 | |
| Amounts due from immediate parent | — | | — | | — | |
| Amounts due from fellow subsidiaries and joint ventures | 4,150 | | 15 | | 4,165 | |
| Loans and advances to customers | 182,140 | | 42,655 | | 224,795 | |
| | | | | | | | | | | | | | |
| Annual Report 2022 | Santander UK Group Holdings plc 297 |
| | | | | | | | | | | | | | | | | | | | | | | | | | | | | | | | | | | | | | | | | |
| Strategic Report | Sustainability and Responsible Banking | Governance | Risk review | Financial review | Financial
statements | Shareholder
information |
| | | | | | | | | | | | | |
| | | | | | | | | | | | | |
SUMMARY OF LOAN LOSS EXPERIENCE
Loans accounted for on a non-accrual basis are credit impaired loans. We define a loan as in default (i.e. credit impaired) for purposes of calculating ECL if it is more than three months past due, or if we have data to make us doubt they can keep up with their payments i.e. they are unlikely to pay. We classify credit impaired loans as Stage 3. For details of loans classified as Stage 3, see the ‘Credit risk’ section of the Risk review. Interest income on financial assets that have become credit-impaired (or Stage 3) is calculated by applying the effective interest rate to their amortised cost (i.e. net of the ECL provision).
In 2022 and 2021 there were no material credit impairment charges on loans and advances to banks, non-trading reverse repurchase agreements, other financial assets at amortised cost and financial assets at FVOCI. As a result, the following tables present Loans and Advances to customers only.
The following tables show additional ratios and the components used in their calculation for the years ended 31 December 2022, 2021, and 2020.
| | | | | | | | |
| 2022 | 2021 |
| £m | £m |
| Allowance for credit losses to total loans | 0.43 | % | 0.43 | % |
| Allowance for credit losses | 955 | | 900 | |
| Total loans outstanding | 219,700 | | 210,600 | |
| Non-accrual loans to total loans | 1.14 | % | 1.38 | % |
| Non-accrual loans outstanding | 2,500 | | 2,900 | |
| Total loans outstanding | 219,700 | | 210,600 | |
| Allowance for credit losses to non-accrual loans | 38.20 | % | 31.03 | % |
| Allowance for credit losses | 955 | | 900 | |
| Non-accrual loans outstanding | 2,500 | | 2,900 | |
| | | | | | | | | | | |
| 2022 | 2021 | 2020 |
| £m | £m | £m |
| Loans secured on residential properties | — | % | — | % | 0.01 | % |
| Net charge-off during the period | 3 | | 5 | | 14 | |
| Average amount outstanding | 185,303 | | 173,779 | | 168,700 | |
| Corporate loans | 0.13 | % | — | % | — | % |
| Net charge-off during the period | 24 | | 58 | | 73 | |
| Average amount outstanding | 19,170 | | 21,876 | | 25,757 | |
| Finance leases | 0.44 | % | — | % | — | % |
| Net charge-off during the period | 19 | | 25 | | 25 | |
| Average amount outstanding | 4,281 | | 5,235 | | 6,409 | |
| Other unsecured advances | 1.28 | % | 1.00 | % | 2.00 | % |
| Net charge-off during the period | 110 | | 103 | | 141 | |
| Average amount outstanding | 8,574 | | 9,787 | | 8,679 | |
| Amounts due from immediate parent | — | % | — | % | — | % |
| Net charge-off during the period | — | | — | | — | |
| Average amount outstanding | 780,000,000 | | — | | — | |
| Amounts due from fellow subsidiaries and joint ventures | — | % | — | % | — | % |
| Net charge-off during the period | — | | — | | — | |
| Average amount outstanding | 3,623 | | 2,665 | | 2,227 | |
| Loans and advances to customers | 0.07 | % | 0.09 | % | 0.12 | % |
| Net charge-off during the period | 156 | | 191 | | 253 | |
| Average amount outstanding | 221,731 | | 213,342 | | 211,772 | |
Discussion of the factors driving material changes in the ratios above or their components
The factors driving significant changes are discussed as follows:
–Allowance for credit losses, exposures, expected credit losses, Stage 3 exposures and related ratios at a consolidated Santander UK group level can be found in the commentary sections in 'Credit performance', 'Credit quality' 'Stage 2 analysis' in 'Santander UK group level - credit risk review' in the Risk review
–More detailed discussion by business segment can be found in the 'Retail Banking: Homes - credit risk review', 'Retail Banking: Everyday Banking - credit risk review', 'Corporate & Commercial Banking - credit risk review' and 'Corporate Centre - credit risk review' sections of the Risk review.
| | | | | | | | | | | | | | |
| Annual Report 2022 | Santander UK Group Holdings plc 298 |
| | | | | | | | | | | | | | | | | | | | | | | | | | | | | | | | | | | | | | | | | |
| Strategic Report | Sustainability and Responsible Banking | Governance | Risk review | Financial review | Financial
statements | Shareholder
information |
| | | | | | | | | | | | | |
| | | | | | | | | | | | | |
DEPOSITS BY CUSTOMERS
The following table shows the average balances and interest rates for deposits by customers by product for the years ended 31 December 2022, 2021, and 2020.
| | | | | | | | | | | | | | | | | | | | | | | | | | |
| 2022 | | | 2021 | | | 2020 | |
| Average Balance | Average Interest Rate(1) | | Average Balance | Average Interest Rate(1) | | Average Balance | Average Interest Rate(1) |
| £m | % | £m | % | | £m | % |
| Demand deposits (including savings and current accounts) | 175,918 | 0.37 | % | | 177,508 | 0.12 | % | | 165,425 | 0.40 | % |
| Time deposits | 12,816 | 1.37 | % | | 12,199 | 0.92 | % | | 17,685 | 1.18 | % |
| Other deposits | 12,543 | 1.01 | % | | 16,683 | 0.03 | % | | 17,571 | 0.27 | % |
Total average balance(1) | 201,277 | 0.47 | % | | 206,390 | 0.16 | % | | 200,681 | 0.47 | % |
(1)Calculated using monthly data.
The UK's statutory fund of last resort for customers of authorised financial services firms is the Financial Services Compensation Scheme (FSCS). The FSCS can pay compensation to customers if a PRA authorised firm is unable, or likely to be unable to pay claims against it for example by depositors.
The following table shows the amounts of insured and uninsured total deposits and time deposits excluding intercompany deposits at 31 December 2022. The table also shows the amount of time deposits that are uninsured, either because they exceed FSCS compensation limits or because they are otherwise uninsured.
| | | | | | | | |
| 2022 | 2021 |
| £m | £m |
| Insured deposits | 131,820 | 128,472 |
| Uninsured deposits | 64,340 | 63,292 |
| Total deposits | 196,160 | 191,764 |
| of which: | | |
| Insured time deposits | 9,242 | 5,683 |
| Uninsured time deposits | 8,272 | 5,258 |
| – Excess over guaranteed limit | 5,202 | 1,988 |
| – Otherwise uninsured | 3,070 | 3,270 |
| Total time deposits | 17,514 | 10,941 |
The following table shows the maturity of uninsured time deposits at 31 December 2022.
| | | | | | | | | | | | | | | | | |
| Under 3 months | 3 to 6 months | 6 to 12 months | Over 12 months | Total |
| £m | £m | £m | £m | £m |
| Deposits by customers | 3,207 | 1,614 | 2,286 | 1,165 | 8,272 |
The following table provides details of the deposit insurance scheme that applies to these deposits.
| | | | | |
| Guarantee fund | Definition |
| Financial Services Compensation Scheme (FSCS) | The FSCS is the UK’s independent statutory compensation fund for customers of authorised financial services firms and pays compensation if a firm is unable to pay claims against it. The FSCS is funded by levies on the industry (and recoveries and borrowings where appropriate). |
| Isle of Man and Jersey Bank Depositor Compensation Schemes (DCSs) | The Isle of Man branch of the Company is a participant in the Isle of Man Depositors’ Compensation Scheme and the Jersey branch of the Company is a participant in the Jersey Bank Depositors Compensation Scheme. These DCSs are independent statutory compensation funds for customers of Isle of Man and Jersey banks and pay compensation if a bank is unable to pay claims against it. The DCSs are funded, if and when required, by contributions from covered banks in the Isle of Man or Jersey that are participants in the DCSs. |
| | | | | | | | | | | | | | |
| Annual Report 2022 | Santander UK Group Holdings plc 299 |
| | | | | | | | | | | | | | | | | | | | | | | | | | | | | | | | | | | | | | | | | |
| Strategic Report | Sustainability and Responsible Banking | Governance | Risk review | Financial review | Financial
statements | Shareholder
information |
| | | | | | | | | | | | | |
| | | | | | | | | | | | | |
DEPOSITS BY BANKS
Deposits by banks are classified in the consolidated balance sheet as financial liabilities at amortised cost and include deposits by banks classified as repurchase agreements – non trading.
Reconciliation to classifications in the consolidated balance sheet
| | | | | | | | | | | |
| | 2022 | 2021 |
| Note | £m | £m |
| Financial liabilities at amortised cost: | | — | — |
| - Deposits by banks | 24 | 28,543 | 33,862 |
| - Repurchase agreements - non trading | 25 | 50 | 43 |
| | 28,593 | 33,905 |
The following table shows the average balances of and interest rates for deposits by banks for the years ended 31 December 2022, 2021, and 2020.
| | | | | | | | | | | | | | | | | | | | | | | | | | |
| 2022 | | | 2021 | | | | 2020 |
| Average Balance | Average Interest Rate(1) | | Average Balance | Average Interest Rate(1) | | Average Balance | Average Interest Rate(1) |
| £m | % | £m | % | £m | % |
| Deposits by banks | 35,098 | 1.44 | | | 24,051 | 0.10 | | | 20,045 | 0.28 | |
(1)Calculated using monthly data.
At 31 December 2022 deposits by foreign banks were £2,211m (2021: £1,179m, 2020: £1,763m).
All bank deposits are uninsured, as the FSCS does not cover financial institutions.
The following table shows the maturity of uninsured deposits by banks at 31 December 2022.
| | | | | | | | | | | | | | | | | |
| Under 3 months | 3 to 6 months | 6 to 12 months | Over 12 months | Total |
| £m | £m | £m | £m | £m |
| Deposits by banks | 3,365 | 36 | 5 | 25,187 | 28,593 |
| | | | | | | | | | | | | | |
| Annual Report 2022 | Santander UK Group Holdings plc 300 |
| | | | | | | | | | | | | | | | | | | | | | | | | | | | | | | | | | | | | | | | | |
| Strategic Report | Sustainability and Responsible Banking | Governance | Risk review | Financial review | Financial
statements | Shareholder
information |
| | | | | | | | | | | | | |
| | | | | | | | | | | | | |
INTEREST RATE SENSITIVITY
Interest rate sensitivity is the relationship between interest rates and net interest income caused by the periodic repricing of assets and liabilities. Our largest administered rate items are residential mortgages and retail deposits, most of which bear interest at variable rates.
We mitigate the impact of interest rate movements on net interest income by repricing our variable rate mortgages and variable rate retail deposits separately, subject to competitive pressures. We also offer fixed-rate mortgages and savings products on which the interest rate is fixed for an agreed period at the start of the contract. We manage the margin on fixed-rate products by using derivatives matching the fixed-rate profiles. We reduce the risk of prepayment by imposing early termination charges if the customers end their contracts early.
We manage the risks from movements in interest rates as part of our overall non-trading position. We do this within limits as set out in the Risk review.
Changes in net interest income – volume and rate analysis
The following table shows changes in interest income, interest expense and net interest income, and is presented using asset and liability classifications in the Consolidated Balance Sheet. It allocates the effects between changes in volume and changes in rate. Volume and rate changes have been calculated on the movement in the average balances and the change in the interest rates on average interest-earning assets and average interest-bearing liabilities. The changes caused by movements in both volume and rate have been allocated to rate changes.
| | | | | | | | | | | | | | | | | | | | | | | |
| | | 2022 / 2021 | | | | 2021 / 2020 |
| | Changes due to
increase/(decrease) in | | | Changes due to
increase/(decrease) in |
| Total change | Volume | Rate | | Total change | Volume | Rate |
| £m | £m | £m | | £m | £m | £m |
| Interest income | | | | | | | |
| Loans and advances to customers | 1,283 | 53 | 1,230 | | (149) | (87) | (62) |
| of which reverse repurchase agreements | 114 | (11) | 125 | | (62) | (26) | (36) |
| Loans and advances to banks | 597 | 2 | 595 | | (29) | 21 | (50) |
| of which reverse repurchase agreements | — | (2) | 2 | | (21) | (18) | (3) |
| Debt securities and other interest earning assets | 112 | (6) | 118 | | (63) | (51) | (12) |
| Assets designated at FVOCI | — | — | — | | — | — | — |
| Total interest income | 1,992 | 49 | 1,943 | | (241) | (117) | (124) |
| Interest expense | | | | | | | |
| Deposits by customers - demand | 433 | (2) | 435 | | (442) | 48 | (490) |
| Deposits by customers - time | 63 | 6 | 57 | | (97) | (65) | (32) |
| Deposits by customers - other | 117 | (1) | 118 | | (37) | (2) | (35) |
| of which repurchase agreements | 117 | (1) | 118 | | (23) | (3) | (20) |
| Deposits by banks | 473 | 11 | 462 | | (22) | 9 | (31) |
| of which repurchase agreements | — | — | — | | (17) | (17) | — |
| Debt securities | 349 | (19) | 368 | | (207) | (167) | (40) |
| Commercial paper | 74 | (1) | 75 | | (35) | 2 | (37) |
| Subordinated liabilities | 16 | (4) | 20 | | (19) | (30) | 11 |
| Other interest-bearing financial liabilities | (8) | (6) | (2) | | 2 | (3) | 5 |
| Total interest expense | 1,517 | (16) | 1,533 | | (857) | (208) | (649) |
| Net interest income | 475 | 65 | 410 | | 616 | 91 | 525 |
| | | | | | | | | | | | | | |
| Annual Report 2022 | Santander UK Group Holdings plc 301 |
| | | | | | | | | | | | | | | | | | | | | | | | | | | | | | | | | | | | | | | | | |
| Strategic Report | Sustainability and Responsible Banking | Governance | Risk review | Financial review | Financial
statements | Shareholder
information |
| | | | | | | | | | | | | |
| | | | | | | | | | | | | |
AVERAGE BALANCE SHEET
Year-end balances may not reflect activity throughout the year, so we present average balance sheets below, using asset and liability classifications from the Consolidated Balance Sheet. They show averages for our significant categories of assets and liabilities, and the related interest income and expense.
| | | | | | | | | | | | | | | | | | | | | | | | | | | | | | | | | | | |
| | | 2022 | | | | 2021 | | | | 2020 |
| | | | | | | | | | | |
| Average balance(1) | Interest | Average rate | | Average balance(1) | Interest | Average rate | | Average balance(1) | Interest | Average rate |
| £m | £m | % | | £m | £m | % | | £m | £m | % |
| Assets | | | | | | | | | | | |
Loans and advances to customers(2) | 230,289 | 5,996 | 2.60 | | | 227,720 | 4,713 | 2.07 | | | 231,885 | 4,862 | 2.10 | |
| of which reverse repurchase agreements | 8,558 | 142 | 1.66 | | | 14,378 | 28 | 0.19 | | | 20,113 | 90 | 0.45 | |
| Loans and advances to banks | 48,321 | 658 | 1.36 | | | 46,416 | 61 | 0.13 | | | 37,506 | 90 | 0.24 | |
| of which reverse repurchase agreements | 816 | 7 | 0.86 | | | 1,138 | 7 | 0.62 | | | 3,056 | 28 | 0.92 | |
| Debt securities and other interest earning assets | 7,314 | 168 | 2.30 | | | 8,174 | 56 | 0.69 | | | 14,330 | 119 | 0.83 | |
| Assets designated at FVOCI | — | — | — | | | — | — | — | | | — | — | — | |
| Total average interest-earning assets, interest income | 285,924 | 6,822 | 2.39 | | | 282,310 | 4,830 | 1.71 | | | 283,721 | 5,071 | 1.79 | |
| Credit impairment loss allowances and RV &VT | (1,057) | — | — | | | (1,325) | — | — | | | (1,071) | — | — | |
| Trading assets | — | — | — | | | — | — | — | | | — | — | — | |
| Derivatives and other non-interest-earning assets | 8,509 | — | — | | | 10,738 | — | — | | | 13,849 | — | — | |
| Other financial assets at FVTPL | 549 | — | — | | | 765 | — | — | | | 896 | — | — | |
| Total average assets | 293,925 | — | — | | | 292,488 | — | — | | | 297,395 | — | — | |
| Liabilities | | | | | | | | | | | |
| Deposits by customers - demand | (175,918) | (651) | 0.37 | | | (177,508) | (218) | 0.12 | | | (165,425) | (660) | 0.40 | |
| Deposits by customers - time | (12,816) | (175) | 1.37 | | | (12,199) | (112) | 0.92 | | | (17,685) | (209) | 1.18 | |
| Deposits by customers - other | (12,192) | (121) | 0.99 | | | (16,387) | (4) | 0.02 | | | (17,111) | (41) | 0.24 | |
| of which repurchase agreements | (8,568) | (120) | 1.40 | | | (12,372) | (3) | 0.02 | | | (14,085) | (26) | 0.18 | |
| Deposits by banks | (34,561) | (496) | 1.44 | | | (23,580) | (23) | 0.10 | | | (19,727) | (45) | 0.23 | |
| of which repurchase agreements | (5) | — | — | | | (6) | — | — | | | (2,767) | (17) | 0.61 | |
| Debt securities | (29,201) | (713) | 2.44 | | | (30,774) | (364) | 1.18 | | | (43,487) | (571) | 1.31 | |
| Commercial paper | (5,121) | (82) | 1.60 | | | (6,013) | (8) | 0.13 | | | (5,717) | (43) | 0.75 | |
| Subordinated liabilities | (1,991) | (108) | 5.42 | | | (2,076) | (92) | 4.43 | | | (2,846) | (111) | 3.90 | |
| Other interest-bearing liabilities | (143) | (4) | 2.80 | | | (308) | (12) | 3.90 | | | (462) | (10) | 2.16 | |
| Total average interest-bearing liabilities, interest expense | (271,943) | (2,350) | 0.86 | | | (268,845) | (833) | 0.31 | | | (272,460) | (1,690) | 0.62 | |
| Trading liabilities | — | — | — | | | — | — | — | | | — | — | — | |
| Derivatives and other non interest-bearing liabilities | (4,701) | — | — | | | (5,579) | — | — | | | (6,381) | — | — | |
| Other financial liabilities at FVTPL | (833) | — | — | | | (1,050) | — | — | | | (1,589) | — | — | |
| Equity | (16,448) | — | — | | | (17,014) | — | — | | | (16,965) | — | — | |
| Total average liabilities and equity | (293,925) | — | — | | | (292,488) | — | — | | | (297,395) | — | — | |
(1) Average balances are based on monthly data.
(2) Loans and advances to customers include Stage 3 assets. See the ‘Credit risk’ section of the Risk review.
Margin and average spread
| | | | | | | | | | | |
| 2022 | 2021 | 2020 |
| % | % | % |
Interest spread(1) | 1.53 | | 1.40 | | 1.17 | |
Net interest margin(2) | 1.56 | | 1.42 | | 1.19 | |
Average spread(3) | 105 | | 105 | | 104 | |
(1) Interest spread is the difference between the rate of interest earned on average interest-earning assets and the rate of interest paid on average interest-bearing liabilities.
(2) NIM is calculated as net interest income divided by average interest earning assets
(3) Average spread is the ratio of average interest-earning assets to interest-bearing liabilities
| | | | | | | | | | | | | | |
| Annual Report 2022 | Santander UK Group Holdings plc 302 |
| | | | | | | | | | | | | | | | | | | | | | | | | | | | | | | | | | | | | | | | | |
| Strategic Report | Sustainability and Responsible Banking | Governance | Risk review | Financial review | Financial
statements | Shareholder
information |
| | | | | | | | | | | | | |
| | | | | | | | | | | | | |
SUMMARISED CONSOLIDATED CASH FLOW STATEMENT
| | | | | | | | |
| 2022 | 2021 |
| £m | £m |
| Net cash flows from operating activities | (5,467) | | 12,153 | |
| Net cash flows from investing activities | (206) | | 3,075 | |
| Net cash flows from financing activities | 2,711 | | (12,643) | |
| Change in cash and cash equivalents | (2,962) | | 2,585 | |
A more detailed Consolidated Cash Flow Statement is contained in the Consolidated Financial Statements.
The major activities and transactions that affected cash flows in 2022 and 2021 were as follows:
In 2022, the net cash outflows from operating activities of £5,467m resulted from outflows generated from an increase in loans and advances to banks and customers, and a decrease in repurchase agreements, partially offset by net cash inflows from an decrease in reverse repurchase agreements and the effects of exchange rate differences. The net cash outflows from investing activities of £206m mainly reflected the net disposal of certain asset backed securities as part of normal liquid asset portfolio management. The net cash inflows from financing activities mainly reflected net cash inflows relating to debt securities in issue. These resulted in cash and cash equivalents decreasing by £2,962m in the year.
In 2021, the net cash inflows from operating activities of £12,153m resulted from net cash inflows generated from profits in the year and higher customer deposits, offset by additional retail and corporate lending. The net cash inflows from investing activities of £3,075m mainly reflected the net disposal of certain asset backed securities as part of normal liquid asset portfolio management. The net cash outflows from financing activities mainly reflected net cash outflows relating to debt securities in issue. These resulted in cash and cash equivalents increasing by £2,585m in the year.
Cash flow requirements
For details of our cash flow requirements over the next 12 months and in the longer term and how we plan to meet them, see the Liquidity risk section of the Risk review.
Material cash requirements
Our material commitments under commercial contracts at 31 December 2022 were as follows:
–For cash flows and maturities relating to Derivatives, Deposits by customers, Deposits by banks, Debt securities in issue, Subordinated liabilities and Lease obligations, see Note 40 to the Consolidated Financial Statements. The maturities of financial liabilities and off-balance sheet commitments table analyses the maturities of the cash flows based on the remaining period to the contractual maturity date at the balance sheet date. In practice, the behavioural profiles of many liabilities show more stability and longer maturity than their contractual maturity. This is especially true of many types of retail and corporate deposits that, while they may be repayable on demand or at short notice, have shown good stability even in times of stress. For further details, see the Liquidity risk section of the Risk review.
–For details of cash flows and maturities relating to Retirement benefit obligations including employer contributions and funding see Note 30 to the Consolidated Financial Statements.
–Purchase obligations: We have entered into outsourcing contracts where, in some cases, there is no minimum specified spending requirement. In these cases, anticipated spending volumes have been included in purchase obligations. Total purchase obligations, all of which are due within 1 year, totalled £469m.
| | | | | | | | | | | | | | |
| Annual Report 2022 | Santander UK Group Holdings plc 303 |
| | | | | | | | | | | | | | | | | | | | | | | | | | | | | | | | | | | | | | | | | |
| Strategic Report | Sustainability and Responsible Banking | Governance | Risk review | Financial review | Financial
statements | Shareholder
information |
| | | | | | | | | | | | | |
| | | | | | | | | | | | | |
Taxation for US investors
The following is a summary, under current law, of the main UK tax considerations relating to the beneficial ownership by a US taxpayer of the shares of the Company. This summary is provided for general guidance and does not address investors that are subject to special rules or that do not hold the shares as capital assets. US residents should consult their local tax advisers, particularly in connection with any potential liability to pay US taxes on disposal, lifetime gift or bequest of their shares.
UK taxation on dividends
Under UK law, income tax is not withheld from dividends paid by UK companies. Shareholders, whether resident in the UK or not, receive the full amount of the dividend actually declared.
UK taxation on capital gains
Under UK law, when you sell shares you may be liable to pay either capital gains tax or corporation tax on chargeable gains. However, if you are either:
–An individual who is not resident in the UK or
–A company which is not resident in the UK,
you will not be liable to UK tax on any capital gains made on disposal of your shares. The exception is if the shares are held in connection with a trade or business that is conducted in the UK through a branch or agency (for capital gains tax purposes) or a permanent establishment (for corporation tax purposes).
UK inheritance tax
Under the current estate and gift tax convention between the US and the UK, shares held by an individual shareholder who is:
–Domiciled for the purposes of the convention in the US and
–Is not for the purposes of the convention a national of the UK will not be subject to UK inheritance tax on:
–The individual’s death or
–On a gift of the shares during the individual’s lifetime.
The exception is if the shares are part of the business property of a permanent establishment of the individual in the UK or, in the case of a shareholder who performs independent personal services, pertain to a fixed base situated in the UK.
| | | | | | | | | | | | | | |
| Annual Report 2022 | Santander UK Group Holdings plc 304 |
| | | | | | | | | | | | | | | | | | | | | | | | | | | | | | | | | | | | | | | | | |
| Strategic Report | Sustainability and Responsible Banking | Governance | Risk review | Financial review | Financial
statements | Shareholder
information |
| | | | | | | | | | | | | |
| | | | | | | | | | | | | |
Glossary of financial services industry terms
| | | | | |
| Term | Definition |
| Active customers | Active customers are defined as those having an open account, with more than a set minimum balance along with certain specified transactions in the prior month. |
| Adjusted cost to income ratio | Adjusted total operating expenses before credit impairment charges and provisions for other liabilities and charges as a percentage of adjusted total operating income. |
| Adjusted RoTE | The adjusted profit after tax attributable to equity holders of the parent divided by average shareholders’ equity less non-controlling interests, other equity instruments and average goodwill and intangible assets. |
| Alternative performance measures (APMs) | A financial measure of historical or future financial performance, financial position or cashflows, other than a financial measure defined or specified under International Financial Reporting Standards. |
| Arrears | Customers are said to be in arrears when they are behind in fulfilling their obligations with the result that an outstanding loan is unpaid or overdue. Such a customer is also said to be in a state of delinquency. When a customer is in arrears, his entire outstanding balance is said to be delinquent, meaning that delinquent balances are the total outstanding loans on which payments are overdue. |
| Asset Backed Securities (ABS) | Securities that represent an interest in an underlying pool of referenced assets. The referenced pool can comprise any assets which attract a set of associated cash flows but are commonly pools of residential or commercial mortgages but could also include leases, credit card receivables, motor vehicles or student loans. |
| Balance weighted Loan to Value (LTV) ratio | Balance weighted LTV = (Loan 1 balance x (Loan 1 Balance/Loan 1 latest property valuation) + (Loan 2 balance x (loan 2 balance/Loan 2 latest property valuation)+ ...) /(Loan 1 balance + Loan 2 balance +...) |
| UK Bank Levy | The government levy that applies to certain UK banks, UK building societies and the UK operations of foreign banks from 1 January 2011. The levy is payable based on a percentage of the chargeable equity and liabilities of the bank at the balance sheet date. |
| Banking NIM | Banking net interest margin. Net interest income divided by average gross customer assets. |
| Basel III | In December 2010, the Basel Committee on Banking Supervision issued the Basel III rules text, which presents the details of strengthened global regulatory standards on bank capital adequacy and liquidity. The standards were implemented in the EU in January 2014. |
| Basis point (bp) | One hundredth of a per cent (i.e. 0.01%), so 100 basis points is 1%. Used in quoting movements in interest rates or yields on securities. |
| Brexit | The withdrawal of the United Kingdom from the European Union. |
| Business Banking | Division, managed under Retail Banking, serving enterprises with a turnover of up to £6.5m per annum. |
| Colleague engagement | Colleague engagement is measured on annual basis in the Group Engagement Survey (GES), conducted by Mercer for Banco Santander. Results are benchmarked against other firms in the UK financial sector and other high performing firms. |
| Commercial Paper | An unsecured promissory note issued to finance short-term credit needs. It specifies the face amount paid to investors on the maturity date. Commercial paper can be issued as an unsecured obligation of Santander UK and is usually issued for periods ranging from one week up to nine months. However, the depth and reliability of some CP markets means that issuers can repeatedly roll over CP issuance and effectively achieve longer term funding. CP can be issued in a range of denominations and can be discounted or interest-bearing. |
| Commercial Real Estate (CRE) | Lending to UK customers, primarily on tenanted property assets, with a focus on the office, retail, industrial and residential sectors. |
Common Equity Tier 1
(CET1) capital | The called-up share capital and eligible reserves less deductions calculated in accordance with the CRD IV implementation rules as per the PRA Policy Statement PS7/13. |
| CET1 capital ratio | CET1 capital as a percentage of risk weighted assets. |
| Consumer Finance | Provides prime auto consumer financing for individuals, businesses, and automotive distribution networks. |
| Contractual maturity | The final payment date of a loan or other financial instrument, at which point all the remaining outstanding principal will be repaid and interest is due to be paid. |
| Corporate Centre | Provides treasury services for asset and liability management of our balance sheet, as well as management of non-core and legacy portfolios. |
| Corporate & Commercial Banking (CCB) | Provides banking products and services to SMEs, mid-sized and larger corporates, typically with annual turnovers of between £2m and £500m, as well as to Local Authorities and Housing Associations. |
| Cost of risk | Cost of risk is credit impairment charge for the 12-month period as a percentage of average gross customer loans. This is a useful measure of the relationship between the size of the credit impairment charge and the book size which investors use as a proxy to compare relative credit risk. |
| Countercyclical capital buffer | A capital buffer required under Basel III to ensure that capital requirements take account of the macro-financial environment in which banks operate. |
| Counterparty credit risk | The risk that the counterparty to a transaction may default before completing the satisfactory settlement of the transaction. |
| Covered bonds | Debt securities backed by a portfolio of mortgages that is segregated from the issuer’s other assets solely for the benefit of the holders of the covered bonds. The Santander UK group issues covered bonds as part of its funding activities. |
| Credit Default Swap (CDS) | A credit derivative contract where the protection seller receives premium or interest-related payments in return for contracting to make payments to the protection buyer in the event of a defined credit event. Credit events normally include bankruptcy, payment default on a reference asset or assets, or downgrades by a rating agency. |
| Credit spread | The yield spread between securities with the same coupon rate and maturity structure but with different associated credit risks, with the yield spread rising as the credit rating worsens. It is the premium over the benchmark or risk-free rate required by the market to accept a lower credit quality. |
| | | | | | | | | | | | | | |
| Annual Report 2022 | Santander UK Group Holdings plc 305 |
| | | | | | | | | | | | | | | | | | | | | | | | | | | | | | | | | | | | | | | | | |
| Strategic Report | Sustainability and Responsible Banking | Governance | Risk review | Financial review | Financial
statements | Shareholder
information |
| | | | | | | | | | | | | |
| | | | | | | | | | | | | |
| | | | | |
| Term | Definition |
| Credit Valuation Adjustment (CVA) | Adjustments to the fair values of derivative assets to reflect the creditworthiness of the counterparty. |
| Capital Requirements Directive IV (CRD IV) | An EU legislative package covering prudential rules for banks, building societies and investment firms. |
| Currency swap | An arrangement in which two parties exchange specific principal amounts of different currencies at inception and subsequently interest payments on the principal amounts. Often, one party will pay a fixed interest rate, while the other will pay a floating exchange rate (though there are also fixed-fixed and floating-floating arrangements). At the maturity of the swap, the principal amounts are usually re-exchanged. |
| Customer funding gap | Customer loans less customer deposits. |
| Debt restructuring | This occurs when the terms and provisions of outstanding debt agreements are changed. This is often done in order to improve cash flow and the ability of the borrower to repay the debt. It can involve altering the repayment schedule as well as reducing the debt or interest charged on the loan. |
| Debt securities | Transferable instruments creating or acknowledging indebtedness. They include debentures, bonds, certificates of deposit, notes and commercial paper. The holder of a debt security is typically entitled to the payment of principal and interest, together with other contractual rights under the terms of the issue, such as the right to receive certain information. Debt securities are generally issued for a fixed term and redeemable by the issuer at the end of that term. Debt securities can be secured or unsecured. |
| Debt securities in issue | Transferable certificates of indebtedness of the Santander UK group to the bearer of the certificates. These are liabilities of the Santander UK group and include commercial paper, certificates of deposit, bonds, and medium-term notes. |
| Default | Financial assets in default represent those that are at least 90 days past due in respect of principal or interest and/or where the assets are otherwise considered to be unlikely to pay, including those that are credit impaired. |
| Default at proxy origination | IFRS 9 requires us to compare lifetime probability of default at origination with our view of lifetime probability of default now. If we do not have data at origination then a proxy origination is defined. |
| Defined benefit obligation | The present value of expected future payments required to settle the obligations of a defined benefit plan resulting from employee service. |
| Defined benefit plan | A pension plan that defines an amount of pension benefit to be provided, usually as a function of one or more factors such as age, years of service or compensation. The employer's obligation can be more or less than its contributions to the fund. |
| Defined contribution plan | A pension plan under which the Santander UK group pays fixed contributions as they fall due into a separate entity (a fund) and will have no legal or constructive obligations to pay further contributions, i.e. the employer's obligation is limited to its contributions to the fund. |
| Derivative | A contract or agreement whose value changes with changes in an underlying index such as interest rates, foreign exchange rates, share prices or indices and which requires no initial investment or an initial investment that is smaller than would be required for other types of contracts with a similar response to market factors. The principal types of derivatives are: swaps, forwards, futures and options. |
| Digital customers | Digital customers reflect the number of customers who have logged onto Retail or Business online banking or mobile app(s) (Retail Mobile includes SanWallet & OnePayFX) at least once in the month. |
| Distributable items | Equivalent to distributable profits under the Companies Act 2006. |
| Economic capital | An internal measure of the minimum equity and preference capital required for the Santander UK group to maintain its credit rating based upon its risk profile. |
| Effective tax rate | The tax on profit/(losses) on ordinary activities as a percentage of profit/(loss) on ordinary activities before taxation. |
| Energy performance certificate (EPC) | A scheme to summarise the energy efficiency of buildings and apply a rating between A – G. |
| Everyday Banking | Provides banking services and unsecured lending to individuals and small businesses as well alongside wealth management for high-net-worth clients. |
| Expected credit loss (ECL) | Represents what the credit risk is likely to cost us either over the next 12 months on qualifying exposures, or defaults over the lifetime of the exposure where there is evidence of a significant increase in credit risk since origination. |
| Expected loss | The product of the probability of default, exposure at default and loss given default. We calculate each factor in accordance with CRD IV and include direct and indirect costs. We base them on our risk models and our assessment of each customer’s credit quality. |
| Exposure at default (EAD) | The maximum loss that a financial institution might suffer if a borrower, counterparty or group defaults on their obligations or assets and off-balance sheet positions have to be realised. |
| | | | | | | | | | | | | | |
| Annual Report 2022 | Santander UK Group Holdings plc 306 |
| | | | | | | | | | | | | | | | | | | | | | | | | | | | | | | | | | | | | | | | | |
| Strategic Report | Sustainability and Responsible Banking | Governance | Risk review | Financial review | Financial
statements | Shareholder
information |
| | | | | | | | | | | | | |
| | | | | | | | | | | | | |
| | | | | |
| Term | Definition |
| |
| Fair value adjustment | An adjustment to the fair value of a financial instrument which is determined using a valuation technique (level 2 and level 3) to include additional factors that would be considered by a market participant that are not incorporated within the valuation model. |
| Financial Conduct Authority (FCA) | The Financial Conduct Authority is a financial regulatory body in the United Kingdom. |
| Financial Services Compensation Scheme (FSCS) | The Financial Services Compensation Scheme is the UK's statutory deposit insurance and investors compensation scheme for customers of authorised financial services firms. |
| Financially empowered people | The number of people we are supporting who are unbanked, underbanked or in a situation of vulnerability to get access to the financial system, receive tailored finance and increase their knowledge and resilience through financial education. |
| First / Second Charge | First charge (also known as first lien): debt that places its holder first in line to collect compensation from the sale of the underlying collateral in the event of a default on the loan. Second charge (also known as second lien): debt that is issued against the same collateral as a higher charge debt but that is subordinate to it. In the case of default, compensation for this debt will only be received after the first charge has been repaid and thus represents a riskier investment than the first charge. |
| Follow-on Rate (FoR) | A mortgage product that tracks and is directly linked to the Bank of England base rate. |
| Forbearance | Forbearance takes place when a concession is made on the contractual terms of a loan in response to an obligor’s financial difficulties. |
| Full time equivalent | Full time equivalent employee units are the on-job hours paid for employee services divided by the number of ordinary-time hours normally paid for a full-time staff member when on the job (or contract employee where applicable). |
| Government lending schemes | Lending provided by banks with some element of government guarantee, including Bounce Back Loan Scheme (BBLS), Coronavirus Business Interruption Loan Scheme (CBILS) and Coronavirus Large Business Interruption Loan Scheme (CLBILS). |
| Homes | Homes provides prime UK mortgage lending to owner occupiers and buy-to-let landlords with small portfolios. |
| Impairment loss allowance (Loan loss allowance) | An impairment loss allowance held on the balance sheet as a result of the raising of a charge against profit for an expected credit loss in the lending book. An impairment loss allowance may be either individual or collective. |
| Individually assessed loan impairment provisions | Impairment is measured individually for assets that are individually significant. For these assets, the Santander UK group measures the amount of the impairment loss as the difference between the carrying amount of the asset or group of assets and the present value of the estimated future cash flows from the asset or group of assets discounted at the original effective interest rate of the asset. |
| Internal Capital Adequacy Assessment Process (ICAAP) | The Santander UK group’s own assessment of its regulatory capital requirements, as part of CRD IV. It takes into account the regulatory and commercial environment in which the Santander UK group operates, the Santander UK group’s Risk Appetite, the management strategy for each of the Santander UK group’s material risks and the impact of appropriate adverse scenarios and stresses on the Santander UK group’s capital requirements. |
| Internal Liquidity Adequacy Assessment Process (ILAAP) | The Santander UK group’s own assessment of the prudent level of liquidity that is consistent with the Santander UK group’s LRA. It documents and demonstrates the Santander UK group’s overall liquidity adequacy – an appropriate level of liquid resources, a prudent funding profile and comprehensive management and control of liquidity and funding risks. |
| Internal ratings-based approach (IRB) | The Santander UK group's method, under the CRD IV framework, for calculating credit risk capital requirements using the Santander UK group’s internal Probability of Default models but with supervisory estimates of Loss Given Default and conversion factors for the calculation of Exposure at Default. |
| International Financial Reporting Standards (IFRS) | A set of international accounting standards developed and issued by the International Accounting Standards Board, consisting of principles-based guidance. |
| Investment grade | A debt security, treasury bill or similar instrument with a credit rating measured by external agencies of AAA to BBB. |
| ISDA Master agreement | Standardised contract developed by ISDA (International Swaps and Derivatives Association) used as an umbrella under which bilateral derivatives contracts are entered into. |
| JA | Judgemental Adjustments: Adjustments made to the ECL estimate outside of the ECL models to reflect management judgements. |
| | | | | | | | | | | | | | |
| Annual Report 2022 | Santander UK Group Holdings plc 307 |
| | | | | | | | | | | | | | | | | | | | | | | | | | | | | | | | | | | | | | | | | |
| Strategic Report | Sustainability and Responsible Banking | Governance | Risk review | Financial review | Financial
statements | Shareholder
information |
| | | | | | | | | | | | | |
| | | | | | | | | | | | | |
| | | | | |
| Term | Definition |
| Level 1 | The fair value of these financial instruments is based on unadjusted quoted prices for identical assets or liabilities in an active market that the Santander UK group has the ability to access at the measurement date. |
| Level 2 | The fair value of these financial instruments is based on quoted prices in markets that are not active or quoted prices for similar assets or liabilities, recent market transactions, inputs other than quoted market prices for the asset or liability that are observable either directly or indirectly for substantially the full term, and inputs to valuation techniques that are derived principally from or corroborated by observable market data through correlation or other statistical means for substantially the full term of the asset or liability. |
| Level 3 | The fair value of these financial instruments is based on inputs to the pricing or valuation techniques that are significant to the overall fair value measurement of the asset or liability are unobservable. |
| Liquid assets coverage of wholesale funding of less than one year | LCR eligible liquidity pool divided by wholesale funding with a residual maturity of less than one year. |
| Liquidity Coverage Ratio (LCR) | The LCR is intended to ensure that a bank maintains an adequate level of unencumbered, high quality liquid assets which can be used to offset the net cash outflows the bank could encounter under a short-term significant liquidity stress scenario. |
| LCR eligible liquidity pool | Assets eligible for inclusion in the LCR as high-quality liquid assets. The LCR eligible liquidity pool also covers both Pillar 1 and Pillar 2 risks. |
| Loan to value ratio (LTV) | The amount of a first mortgage charge as a percentage of the total appraised value of real property. The LTV ratio is used in determining the appropriate level of risk for the loan and therefore the price of the loan to the borrower. LTV ratios may be expressed in a number of ways, including origination LTV and indexed LTV. |
| Loss Given Default (LGD) | The fraction of Exposure at Default that will not be recovered following default. LGD comprises the actual loss (the part that is not recovered), together with the economic costs associated with the recovery process. It is calculated as the expected loss divided by EAD for each month of the forecast period. We base LGD on factors that impact the likelihood and value of any subsequent write-offs, which vary according to whether the product is secured or unsecured. If the product is secured, we take into account collateral values as well as the historical discounts to market/book values due to forced sales type. |
| Loyal customers | Loyal customers are defined as primary banking current account customers who hold an additional product. |
| Master netting agreement | An industry standard agreement which facilitates netting of transactions (such as financial assets and liabilities including derivatives) in jurisdictions where netting agreements are recognised and have legal force. The netting arrangements do not generally result in an offset of balance sheet assets and liabilities for accounting purposes, as transactions are usually settled on a gross basis. |
| Medium-Term Funding (MTF) | Shown at a sterling equivalent value. Consists of senior debt issuance, asset-backed issuance (including securitisation and covered bond issuance) and structured issuance (including firm financing repurchase agreements). |
| Medium-Term Notes (MTNs) | Corporate notes (or debt securities) continuously offered by a company to investors through a dealer. Investors can choose from differing maturities, ranging from nine months to 30 years. They can be issued on a fixed or floating coupon basis or with an exotic coupon; with a fixed maturity date (non-callable) or with embedded call or put options or early repayment triggers. MTNs are most generally issued as senior, unsecured debt. |
| Minimum requirement for own funds and eligible liabilities (MREL) | A requirement under the Bank Recovery and Resolution Directive for EU resolution authorities to set a minimum requirement for own funds and eligible liabilities for banks, implementing the Financial Stability Board’s Total Loss Absorbing Capacity (TLAC) standard. The purpose of MREL is to help ensure that when banks, building societies and investment firms fail, that failure can be managed in an orderly way while minimising risks to financial stability, disruption to critical economic functions, and risks to public funds. |
| Mortgages | Refers to residential and buy to let retail mortgages only and excludes social housing and commercial mortgage properties. |
| Mortgage-Backed Securities (MBS) | Securities that represent interests in groups of mortgages, which may be on residential or commercial properties. Investors in these securities have the right to cash received from future mortgage payments (interest and / or principal). When the MBS references mortgages with different risk profiles, the MBS is classified according to the highest risk class. |
| Net fee and commission income | Fee and commission income minus other fees paid that are not an integral part of the effective interest rate. For retail and corporate products, fee and commission income consists principally of collection services fees, commission on foreign currencies, commission and other fees received from retailers for processing credit card transactions, fees received from other credit card issuers for providing cash advances for their customers through the Santander UK group’s branch and ATM networks, annual fees payable by credit card holders and fees for non-banking financial products. |
| Net interest income | The difference between interest received on assets and interest paid on liabilities. |
| Net Interest Margin (NIM) | Net interest income as a percentage of average interest-earning assets. |
Net Promoter Score
– Business and corporate | Measured by the MarketVue Business Banking from Savanta. This is an ongoing telephone-based survey designed to monitor usage and attitude of UK businesses towards banks. Structured telephone interviews are conducted each year among businesses of all sizes from new start-ups to large corporates and are weighted by region and turnover to be representative of businesses in Great Britain. |
Net Promoter Score
– Retail | The Financial Research Survey (FRS) is a monthly personal finance survey of around 5,000 consumers prepared by the independent market research agency, IPSOS MORI based on mortgages, savings, main current accounts, home insurance, UPLs and credit cards. |
| | | | | | | | | | | | | | |
| Annual Report 2022 | Santander UK Group Holdings plc 308 |
| | | | | | | | | | | | | | | | | | | | | | | | | | | | | | | | | | | | | | | | | |
| Strategic Report | Sustainability and Responsible Banking | Governance | Risk review | Financial review | Financial
statements | Shareholder
information |
| | | | | | | | | | | | | |
| | | | | | | | | | | | | |
| | | | | |
| Term | Definition |
| Net Stable Funding Ratio (NSFR) | The ratio of available stable funding resources to stable funding requirements over a one-year time horizon, assuming a stressed scenario. The Basel III rules require this ratio to be over 100%. |
| Over the counter (OTC) derivatives | Contracts that are traded (and privately negotiated) directly between two parties, without going through an exchange or other intermediary. They offer flexibility because, unlike standardised exchange-traded products, they can be tailored to fit specific needs. |
| Own credit | The effect of the Santander UK group’s own credit standing on the fair value of financial liabilities. |
| Past due | A financial asset such as a loan is past due when the counterparty has failed to make a payment when contractually due. |
| Payment holiday | A period in which a customer has relief from making repayments on a loan. Also known as a payment deferral. |
| People Supported | People supported through our charity partnerships and sponsored programmes. Employee volunteer activities are organised through our flagship Discovery Project programme, the Santander Foundation and Santander Universities. |
| Pillar 1 | The first pillar of the Basel III approach which provides the approach to the calculation of the minimum capital requirements. This is 8% of the bank's risk-weighted assets. |
| Pillar 2 | The part of the CRD IV Accord which sets out the process by which a bank should review its overall capital adequacy and the processes under which the supervisors evaluate how well financial institutions are assessing their risks and take appropriate actions in response to the assessments. |
| Pillar 3 | The part of the CRD IV Accord which sets out the disclosure requirements for firms to publish details of their risks, capital and risk management. The aims are greater transparency and strengthening market discipline. |
| Prime / prime mortgage loans | A US description for mortgages granted to the most creditworthy category of borrowers. |
| Probability of default (PD) | The likelihood of a borrower defaulting in the following month, assuming it has not closed or defaulted since the reporting date. For each month in the forecast period, we estimate the monthly PD from a range of factors. These include the current risk grade for the exposure, which becomes less relevant further into the forecast period, as well as the expected evolution of the account risk with maturity and factors for changing economics. We support this with historical data analysis. |
| Prudential Regulation Authority (PRA) | The UK financial services regulator formed as one of the successors to the FSA. The PRA is part of the Bank of England and is responsible for the prudential regulation and supervision of banks, building societies, credit unions, insurers and major investment firms. It sets standards and supervises financial institutions at the level of the individual firm. |
| Regulatory capital | The amount of capital that the Santander UK group holds, determined in accordance with rules established by the UK PRA for the consolidated Santander UK group and by local regulators for individual Santander UK group companies. |
| Repurchase agreement (Repo) | In a sale and repurchase agreement one party, the seller, sells a financial asset to another party, the buyer, under commitments to reacquire the asset at a later date. The buyer at the same time agrees to resell the asset at the same later date. From the seller's perspective such agreements are securities sold under repurchase agreements (repos) and from the buyer's securities purchased under commitments to resell (reverse repos). |
| Residential Mortgage-Backed Securities (RMBS) | Securities that represent interests in a group of residential mortgages. Investors in these securities have the right to cash received from future mortgage payments (interest and / or principal). |
| Retail deposit spread | Retail Banking customer deposit spreads against the relevant swap rate or LIBOR. Retail Banking customer deposits include savings and bank accounts for personal and business banking customers. |
| Risk Appetite | The level of risk (types and quantum) that the Santander UK group is willing to accept (or not accept) to safeguard the interests of shareholders whilst achieving business objectives. |
| Risk-weighted assets (RWA) | A measure of a bank’s assets adjusted for their associated risks. Risk weightings are established in accordance with the Basel Capital Accord as implemented by the PRA. |
| Securitisation | A process by which a group of assets, usually loans, are aggregated into a pool, which is used to back the issuance of new securities. A company sells assets to a structured entity which then issues securities backed by the assets, based on their value. This allows the credit quality of the assets to be separated from the credit rating of the original company and transfers risk to external investors. Assets used in securitisations include mortgages to create mortgage-backed securities. Santander UK has established securitisation structures as part of its funding and capital management activities. |
| | | | | | | | | | | | | | |
| Annual Report 2022 | Santander UK Group Holdings plc 309 |
| | | | | | | | | | | | | | | | | | | | | | | | | | | | | | | | | | | | | | | | | |
| Strategic Report | Sustainability and Responsible Banking | Governance | Risk review | Financial review | Financial
statements | Shareholder
information |
| | | | | | | | | | | | | |
| | | | | | | | | | | | | |
| | | | | |
| Term | Definition |
| Significant increase in credit risk (SICR) | Assessed by comparing the risk of default of an exposure at the reporting date to the risk of default at origination (after considering the passage of time). |
| SME 1 | SME 1 supports any business with turnover of up to £6.5m who have up to 2 Directors/Shareholders/Partners or who have simple banking needs such as current account, savings or unsecured lending of up to £25,000. |
| Sovereign exposures | Exposures to local and central governments, and government guaranteed counterparties. |
| Stage 1 | Assets have not experienced a significant increase in credit risk since origination. A loss allowance equal to a 12-month ECL is applied. |
| Stage 2 | Assets have experienced a significant increase in credit risk since origination, but no credit impairment has materialised. A loss allowance equal to the lifetime ECL is applied. |
| Stage 3 | Assets that are in default and considered credit impaired. A loss allowance equal to the lifetime ECL is applied. Objective evidence of credit impairment is required. |
| Standardised approach | In relation to credit risk, a method for calculating credit risk capital requirements under CRD IV, using External Credit Assessment Institutions ratings and supervisory risk weights. The Standardised approach is less risk-sensitive than IRB (see 'IRB' above). In relation to operational risk, a method of calculating the operational capital requirement under CRD IV, by the application of a supervisory defined percentage charge to the gross income of eight specified business lines. |
| Stress testing | Stress testing is a management tool that facilitates a forward-looking perspective on risk management, strategic planning, capital, and liquidity and funding planning. |
| Structured entity | An entity that has been designed so that voting or similar rights are not the dominant factor in deciding who controls the entity, such as when any voting rights relate to administrative tasks only and the relevant activities are directed by means of contractual arrangements. |
| Structured finance/notes | A structured note is an instrument which pays a return linked to the value or level of a specified asset or index and sometimes offers capital protection if the value declines. Structured notes can be linked to a range of underlying assets, including equities, interest rates, funds, commodities and foreign currency. |
| Subordinated liabilities | Liabilities which, in the event of insolvency or liquidation of the issuer, are subordinated to the claims of depositors and other creditors of the issuer. |
| Sub-prime | Loans to borrowers typically having weakened credit histories that include payment delinquencies and potentially more severe problems such as court judgements and bankruptcies. They may also display reduced repayment capacity as measured by credit scores, high debt-to-income ratios, or other criteria indicating heightened risk of default. |
| Supranational | An international organisation where member states transcend national boundaries or interests to share in decision-making and vote on issues relating to the organisation’s geographical focus. |
| Standard Variable Rate (SVR) | A mortgage product managed by Santander and not directly linked to the Bank of England base rate. |
| Term Funding Scheme with additional incentives for SMEs (TFSME) | The TFSME allows eligible banks and building societies to access four-year funding at rates very close to Bank Rate. |
| Tier 1 capital | A measure of a bank's financial strength defined by the PRA. It captures Core Tier 1 capital plus other Tier 1 securities in issue but is subject to a deduction in respect of material holdings in financial companies. |
| Tier 2 capital | Defined by the PRA. Broadly, it includes qualifying subordinated debt and other Tier 2 securities in issue, eligible collective impairment allowances, unrealised available for sale equity gains and revaluation reserves. It is subject to deductions relating to the excess of expected loss over regulatory impairment allowance, securitisation positions and material holdings in financial companies. |
| Top 10 company to work for | In line with Banco Santander’s aspiration, we will aim to achieve the accreditation of a Top 10 company to work for, as measured by an industry-wide benchmarking survey, over the medium-term. |
| Total loss absorbing capacity (TLAC) | An international standard for TLAC issued by the Financial Stability Board, which requires global systemically important banks (G-SIBs) to have sufficient loss-absorbing and recapitalisation capacity available in resolution, to minimise impacts on financial stability, maintain the continuity of critical functions and avoid requiring taxpayer support. |
| Total wholesale funding | Comprises the sum of all outstanding debt securities, structured issuance (including firm financing repurchase agreements), subordinated debt and capital issuance, TFSME and non-customer deposits. |
| Trading book | Positions in financial instruments held either with trading intent or in order to hedge other elements of the trading book, which must be free of restrictive covenants on their tradability or ability to be hedged. |
| Unencumbered assets | Assets on our balance sheet not used to secure liabilities or otherwise pledged. |
| UK leverage ratio | CRD IV end-point Tier 1 capital divided by exposures as defined by the European Commission Delegated Regulation 2015/62 of October 2014. In July 2016, the definition was amended to exclude from the calculation for total exposure those assets held against central banks that are matched by deposits in the same currency and of equal or longer maturity. This is a key prudential regulatory measure which provides useful information to investors. |
| Value at Risk (VaR) | An estimate of the potential loss which might arise from market movements under normal market conditions, if the current positions were to be held unchanged for one business day, measured to a confidence level. |
| Wholesale funding with a residual maturity of less than one year | Wholesale funding which has a residual maturity of less than one year at the balance sheet date. |
| Write-down | After an advance has been identified as impaired and is subject to an impairment allowance, the stage may be reached whereby it is concluded that there is no realistic prospect of further recovery. Write-downs will occur when, and to the extent that, the whole or part of a debt is considered irrecoverable. |
| | | | | | | | | | | | | | |
| Annual Report 2022 | Santander UK Group Holdings plc 310 |
| | | | | | | | | | | | | | | | | | | | | | | | | | | | | | | | | | | | | | | | | |
| Strategic Report | Sustainability and Responsible Banking | Governance | Risk review | Financial review | Financial
statements | Shareholder
information |
| | | | | | | | | | | | | |
| | | | | | | | | | | | | |
Cross-reference to Form 20-F
| | | | | | | | | | | |
| Form 20-F Item Number and Caption | | Page |
| PART I | | |
| 1 | Identity of Directors, Senior Management and Advisers | | * |
| 2 | Offer Statistics and Expected Timetable | | * |
| | | |
| 3 | Key Information | Capitalisation and indebtedness | * |
| | Reasons for the offer and use of proceeds | * |
| | Risk factors | 277-291 |
| 4 | Information on the Company | History and development of the company | 85, 102, 197, 199, 224, 227-228, 257, 295 |
| | Business overview | 10-11, 75, 86, 129-130, 142, 147, 170-171, 178, 208-209, 239, 281, 288-289 |
| | Organisational structure | 85, 224, 295 |
| | Property, plant and equipment | 44, 196, 201, 227-228 |
| 4A | Unresolved Staff Comments | | Not applicable |
| 5 | Operating and Financial Review and Prospects | Operating results | 18, 148-150, 154, 166, 171, 177-178, 277-291 |
| | Liquidity and capital resources | 72, 87, 148, 151-156, 159-164, 216-219, 303 |
| | Research and development, patents and licenses, etc. | 86 |
| | Trend information | 10-11, 16-19, 177, 179 |
| | Critical Accounting Estimates | 206-207 |
| | | |
| | | |
| 6 | Directors, Senior Management and Employees | Directors and senior management | 58-61, 292-293 |
| | Compensation | 76-80, 81-84, 196, 200-201, 231-236, 241-243 |
| | Board practices | 58-61, 69-73, 76-80, 243, 292-293 |
| | Employees | 15, 85, 211 |
| | Share ownership | 85, 242-245 |
| | Disclosure of a registrant's action to recover erroneously awarded compensation | Not applicable |
| 7 | Major Shareholders and Related Party Transactions | Major shareholders | 295 |
| | Related party transactions | 129, 243-245 |
| | Interests of experts and counsel | * |
| 8 | Financial Information | Consolidated Statements and Other Financial Information | 185-197, 194-266, 230-231, 236-239, 290 |
| | Significant Changes | 257 |
| 9 | The Offer and Listing |
| * |
| | | |
| | | |
| | | |
| | | |
| | | |
| 10 | Additional Information | Share capital | * |
| | Memorandum and articles of association | 290 |
| | Material contracts | 295 |
| | Exchange controls | 295 |
| | Taxation | 304 |
| | Dividends and paying agents | * |
| | Statements by experts | * |
| | Documents on display | 295 |
| | Subsidiary Information | * |
| 11 | Quantitative and Qualitative Disclosures about Market Risk | | 91-175 |
| 12 | Description of Securities Other Than Equity Securities |
| Exhibit 2.1 |
| | | |
| | | |
| | | |
| PART II | | |
| 13 | Defaults, Dividend Arrearages and Delinquencies | | Not applicable |
| 14 | Material Modifications to the Rights of Security Holders and Use of Proceeds | Not applicable |
| 15 | Controls and Procedures | | 86 |
| 16A | Audit Committee financial expert | | |
| 16B | Code of Ethics | | 87 |
| 16C | Principal Accountant Fees and Services | | 69, 72, 212 |
| 16D | Exemptions from the Listing Standards for Audit Committees | Not applicable |
| 16E | Purchases of Equity Securities by the Issuer and Affiliated Purchasers | Not applicable |
| 16F | Change in Registrant’s Certifying Accountant | | Not applicable |
| 16G | Corporate Governance | | 294 |
| 16H | Mine Safety Disclosure | | Not applicable |
| 16I | Disclosure Regarding Foreign Jurisdictions that Prevent Inspections | Not applicable |
| PART III | | |
| 17 | Financial Statements | | Not applicable |
| 18 | Financial Statements | | 194-198 |
| 19 | Exhibits | | Filed with SEC |
| * Not required for an Annual Report. |
| | | | | | | | | | | | | | |
| Annual Report 2022 | Santander UK Group Holdings plc 311 |
EXHIBIT INDEX
| | | | | |
Exhibits1 | |
| 1.1 | |
| 2.1 | |
| 8.1 | |
| 12.1 | |
| 12.2 | |
| 13.1 | |
| 15.1 | |
| 101.INS* | XBRL Instance Document |
| 101.SCH* | XBRL Taxonomy Extension Schema Document |
| 101.CAL* | XBRL Taxonomy Extension Calculation Linkbase Document |
| 101.DEF* | XBRL Taxonomy Extension Definition Linkbase Document |
| 101.LAB* | XBRL Taxonomy Extension Label Linkbase Document |
| 101.PRE* | XBRL Taxonomy Extension Presentation Linkbase Document |
1 Documents concerning Santander UK Group Holdings plc referred to within the 2022 Annual Report on Form 20-F may be inspected at 2 Triton Square, Regent’s Place, London NW1 3AN, its principal executive offices and registered address.
SIGNATURE
The registrant hereby certifies that it meets all of the requirements for filing on Form 20-F and that it has duly caused and authorized the undersigned to sign this annual report on its behalf.
SANTANDER UK GROUP HOLDINGS plc
| | | | | | | | |
| By: | | /s/ Mike Regnier |
| | Mike Regnier |
| | Chief Executive Officer |
Dated: 7 March, 2023