
UNITED STATES SECURITIES AND EXCHANGE COMMISSION Washington, D.C. 20549 FORM 6-K Report of Foreign Private Issuer Pursuant to Rule 13a-16 or 15d-16 under the Securities Exchange Act of 1934 For the month of February, 2024 Commission File Number 001-37595 SANTANDER UK GROUP HOLDINGS PLC (Translation of registrant's name into English) 2 Triton Square, Regent's Place, London NW1 3AN, England (Address of principal executive office) Indicate by check mark whether the registrant files or will file annual reports under cover of Form 20-F or Form 40-F. Form 20-F . . . .X. . . . Form 40-F . . . . . . . .
1 Santander UK Group Holdings plc The information contained in this report is unaudited and does not comprise statutory accounts within the meaning of section 434 of the Companies Act 2006 (‘the Act’). The statutory accounts for the year ended 31 December 2022 have been filed with the Registrar of Companies. The report of the auditor on those statutory accounts was unqualified, did not draw attention to any matters by way of emphasis and did not contain a statement under section 498(2) or (3) of the Act. This report provides a summary of the unaudited business and financial trends for the year ended 31 December 2023 for Santander UK Group Holdings plc and its subsidiaries (Santander UK), including its principal subsidiary Santander UK plc. The unaudited business and financial trends in this statement only pertain to Santander UK on a statutory basis (the statutory perimeter). Unless otherwise stated, references to results in previous periods and other general statements regarding past performance refer to the business results for the same period in 2022. This report contains non-IFRS financial measures that are reviewed by management in order to measure our overall performance. These are financial measures which management believe provide useful information to investors regarding our results and are outlined as Alternative Performance Measures in Appendix 1. These measures are not a substitute for IFRS measures. A list of abbreviations is included at the end of this report. Santander UK Group Holdings plc Quarterly Management Statement for the year ended 31 December 2023 Paul Sharratt Head of Investor Relations ir@santander.co.uk Stewart Todd Head of Communications and Responsible Banking mediarelations@santander.co.uk For more information: See Investor Update presentation santander.co.uk
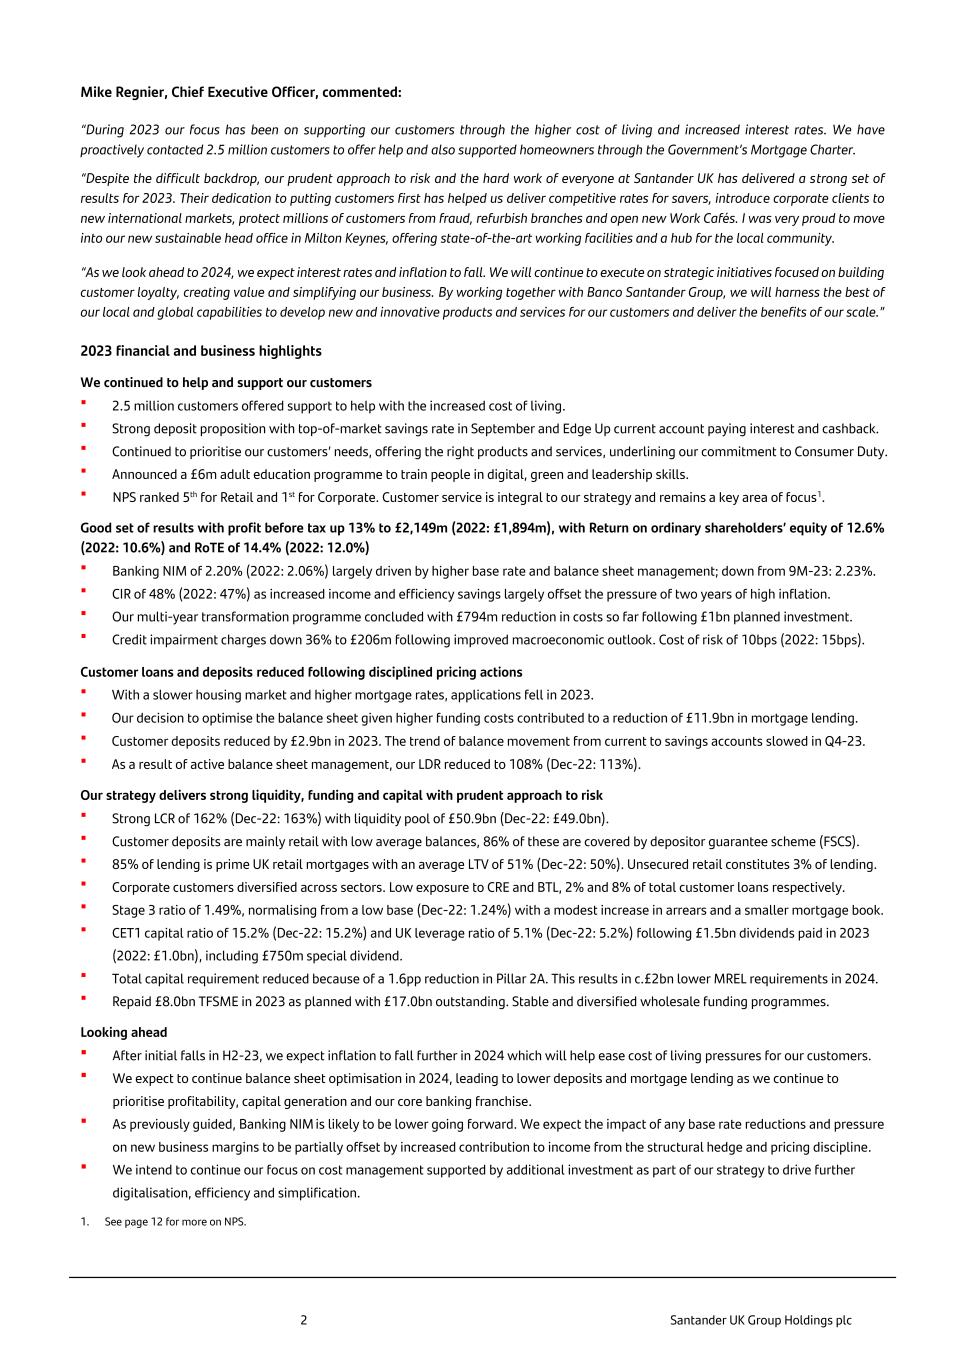
2 Santander UK Group Holdings plc Mike Regnier, Chief Executive Officer, commented: “During 2023 our focus has been on supporting our customers through the higher cost of living and increased interest rates. We have proactively contacted 2.5 million customers to offer help and also supported homeowners through the Government’s Mortgage Charter. “Despite the difficult backdrop, our prudent approach to risk and the hard work of everyone at Santander UK has delivered a strong set of results for 2023. Their dedication to putting customers first has helped us deliver competitive rates for savers, introduce corporate clients to new international markets, protect millions of customers from fraud, refurbish branches and open new Work Cafés. I was very proud to move into our new sustainable head office in Milton Keynes, offering state-of-the-art working facilities and a hub for the local community. “As we look ahead to 2024, we expect interest rates and inflation to fall. We will continue to execute on strategic initiatives focused on building customer loyalty, creating value and simplifying our business. By working together with Banco Santander Group, we will harness the best of our local and global capabilities to develop new and innovative products and services for our customers and deliver the benefits of our scale.” 2023 financial and business highlights We continued to help and support our customers ▪ 2.5 million customers offered support to help with the increased cost of living. ▪ Strong deposit proposition with top-of-market savings rate in September and Edge Up current account paying interest and cashback. ▪ Continued to prioritise our customers’ needs, offering the right products and services, underlining our commitment to Consumer Duty. ▪ Announced a £6m adult education programme to train people in digital, green and leadership skills. ▪ NPS ranked 5th for Retail and 1st for Corporate. Customer service is integral to our strategy and remains a key area of focus1. Good set of results with profit before tax up 13% to £2,149m (2022: £1,894m), with Return on ordinary shareholders’ equity of 12.6% (2022: 10.6%) and RoTE of 14.4% (2022: 12.0%) ▪ Banking NIM of 2.20% (2022: 2.06%) largely driven by higher base rate and balance sheet management; down from 9M-23: 2.23%. ▪ CIR of 48% (2022: 47%) as increased income and efficiency savings largely offset the pressure of two years of high inflation. ▪ Our multi-year transformation programme concluded with £794m reduction in costs so far following £1bn planned investment. ▪ Credit impairment charges down 36% to £206m following improved macroeconomic outlook. Cost of risk of 10bps (2022: 15bps). Customer loans and deposits reduced following disciplined pricing actions ▪ With a slower housing market and higher mortgage rates, applications fell in 2023. ▪ Our decision to optimise the balance sheet given higher funding costs contributed to a reduction of £11.9bn in mortgage lending. ▪ Customer deposits reduced by £2.9bn in 2023. The trend of balance movement from current to savings accounts slowed in Q4-23. ▪ As a result of active balance sheet management, our LDR reduced to 108% (Dec-22: 113%). Our strategy delivers strong liquidity, funding and capital with prudent approach to risk ▪ Strong LCR of 162% (Dec-22: 163%) with liquidity pool of £50.9bn (Dec-22: £49.0bn). ▪ Customer deposits are mainly retail with low average balances, 86% of these are covered by depositor guarantee scheme (FSCS). ▪ 85% of lending is prime UK retail mortgages with an average LTV of 51% (Dec-22: 50%). Unsecured retail constitutes 3% of lending. ▪ Corporate customers diversified across sectors. Low exposure to CRE and BTL, 2% and 8% of total customer loans respectively. ▪ Stage 3 ratio of 1.49%, normalising from a low base (Dec-22: 1.24%) with a modest increase in arrears and a smaller mortgage book. ▪ CET1 capital ratio of 15.2% (Dec-22: 15.2%) and UK leverage ratio of 5.1% (Dec-22: 5.2%) following £1.5bn dividends paid in 2023 (2022: £1.0bn), including £750m special dividend. ▪ Total capital requirement reduced because of a 1.6pp reduction in Pillar 2A. This results in c.£2bn lower MREL requirements in 2024. ▪ Repaid £8.0bn TFSME in 2023 as planned with £17.0bn outstanding. Stable and diversified wholesale funding programmes. Looking ahead ▪ After initial falls in H2-23, we expect inflation to fall further in 2024 which will help ease cost of living pressures for our customers. ▪ We expect to continue balance sheet optimisation in 2024, leading to lower deposits and mortgage lending as we continue to prioritise profitability, capital generation and our core banking franchise. ▪ As previously guided, Banking NIM is likely to be lower going forward. We expect the impact of any base rate reductions and pressure on new business margins to be partially offset by increased contribution to income from the structural hedge and pricing discipline. ▪ We intend to continue our focus on cost management supported by additional investment as part of our strategy to drive further digitalisation, efficiency and simplification. 1. See page 12 for more on NPS.
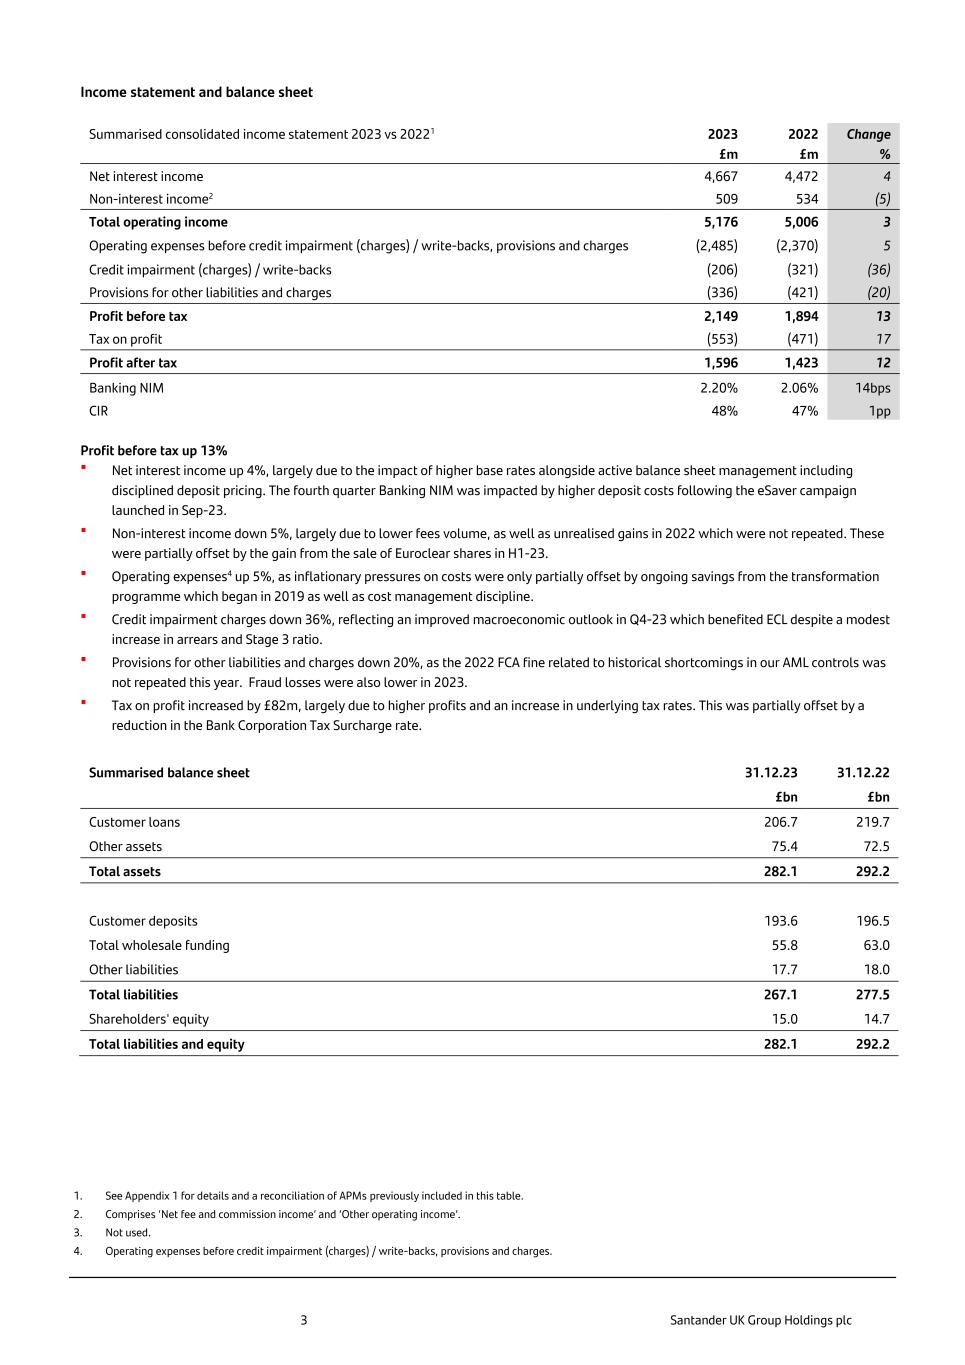
3 Santander UK Group Holdings plc Income statement and balance sheet Summarised consolidated income statement 2023 vs 20221 2023 2022 Change £m £m % Net interest income 4,667 4,472 4 Non-interest income2 509 534 (5) Total operating income 5,176 5,006 3 Operating expenses before credit impairment (charges) / write-backs, provisions and charges (2,485) (2,370) 5 Credit impairment (charges) / write-backs (206) (321) (36) Provisions for other liabilities and charges (336) (421) (20) Profit before tax 2,149 1,894 13 Tax on profit (553) (471) 17 Profit after tax 1,596 1,423 12 Banking NIM 2.20% 2.06% 14bps CIR 48% 47% 1pp Profit before tax up 13% ▪ Net interest income up 4%, largely due to the impact of higher base rates alongside active balance sheet management including disciplined deposit pricing. The fourth quarter Banking NIM was impacted by higher deposit costs following the eSaver campaign launched in Sep-23. ▪ Non-interest income down 5%, largely due to lower fees volume, as well as unrealised gains in 2022 which were not repeated. These were partially offset by the gain from the sale of Euroclear shares in H1-23. ▪ Operating expenses4 up 5%, as inflationary pressures on costs were only partially offset by ongoing savings from the transformation programme which began in 2019 as well as cost management discipline. ▪ Credit impairment charges down 36%, reflecting an improved macroeconomic outlook in Q4-23 which benefited ECL despite a modest increase in arrears and Stage 3 ratio. ▪ Provisions for other liabilities and charges down 20%, as the 2022 FCA fine related to historical shortcomings in our AML controls was not repeated this year. Fraud losses were also lower in 2023. ▪ Tax on profit increased by £82m, largely due to higher profits and an increase in underlying tax rates. This was partially offset by a reduction in the Bank Corporation Tax Surcharge rate. Summarised balance sheet 31.12.23 31.12.22 £bn £bn Customer loans 206.7 219.7 Other assets 75.4 72.5 Total assets 282.1 292.2 Customer deposits 193.6 196.5 Total wholesale funding 55.8 63.0 Other liabilities 17.7 18.0 Total liabilities 267.1 277.5 Shareholders' equity 15.0 14.7 Total liabilities and equity 282.1 292.2 1. See Appendix 1 for details and a reconciliation of APMs previously included in this table. 2. Comprises ‘Net fee and commission income’ and ‘Other operating income’. 3. Not used. 4. Operating expenses before credit impairment (charges) / write-backs, provisions and charges.
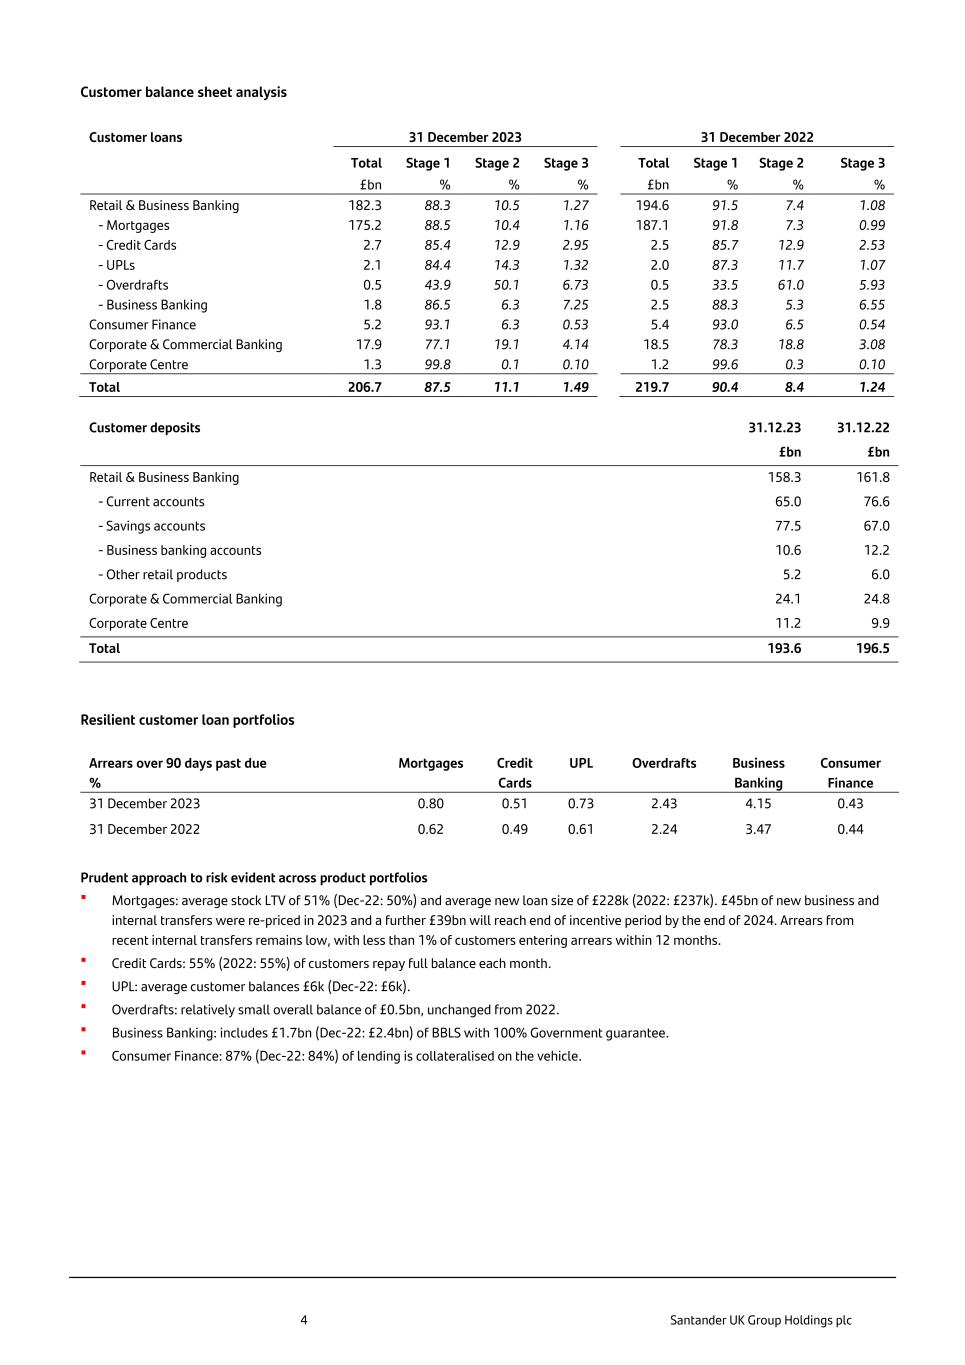
4 Santander UK Group Holdings plc Customer balance sheet analysis Customer loans 31 December 2023 31 December 2022 Total Stage 1 Stage 2 Stage 3 Total Stage 1 Stage 2 Stage 3 £bn % % % £bn % % % Retail & Business Banking 182.3 88.3 10.5 1.27 194.6 91.5 7.4 1.08 - Mortgages 175.2 88.5 10.4 1.16 187.1 91.8 7.3 0.99 - Credit Cards 2.7 85.4 12.9 2.95 2.5 85.7 12.9 2.53 - UPLs 2.1 84.4 14.3 1.32 2.0 87.3 11.7 1.07 - Overdrafts 0.5 43.9 50.1 6.73 0.5 33.5 61.0 5.93 - Business Banking 1.8 86.5 6.3 7.25 2.5 88.3 5.3 6.55 Consumer Finance 5.2 93.1 6.3 0.53 5.4 93.0 6.5 0.54 Corporate & Commercial Banking 17.9 77.1 19.1 4.14 18.5 78.3 18.8 3.08 Corporate Centre 1.3 99.8 0.1 0.10 1.2 99.6 0.3 0.10 Total 206.7 87.5 11.1 1.49 219.7 90.4 8.4 1.24 Customer deposits 31.12.23 31.12.22 £bn £bn Retail & Business Banking 158.3 161.8 - Current accounts 65.0 76.6 - Savings accounts 77.5 67.0 - Business banking accounts 10.6 12.2 - Other retail products 5.2 6.0 Corporate & Commercial Banking 24.1 24.8 Corporate Centre 11.2 9.9 Total 193.6 196.5 Resilient customer loan portfolios Arrears over 90 days past due % Mortgages Credit Cards UPL Overdrafts Business Banking Consumer Finance 31 December 2023 0.80 0.51 0.73 2.43 4.15 0.43 31 December 2022 0.62 0.49 0.61 2.24 3.47 0.44 Prudent approach to risk evident across product portfolios ▪ Mortgages: average stock LTV of 51% (Dec-22: 50%) and average new loan size of £228k (2022: £237k). £45bn of new business and internal transfers were re-priced in 2023 and a further £39bn will reach end of incentive period by the end of 2024. Arrears from recent internal transfers remains low, with less than 1% of customers entering arrears within 12 months. ▪ Credit Cards: 55% (2022: 55%) of customers repay full balance each month. ▪ UPL: average customer balances £6k (Dec-22: £6k). ▪ Overdrafts: relatively small overall balance of £0.5bn, unchanged from 2022. ▪ Business Banking: includes £1.7bn (Dec-22: £2.4bn) of BBLS with 100% Government guarantee. ▪ Consumer Finance: 87% (Dec-22: 84%) of lending is collateralised on the vehicle.
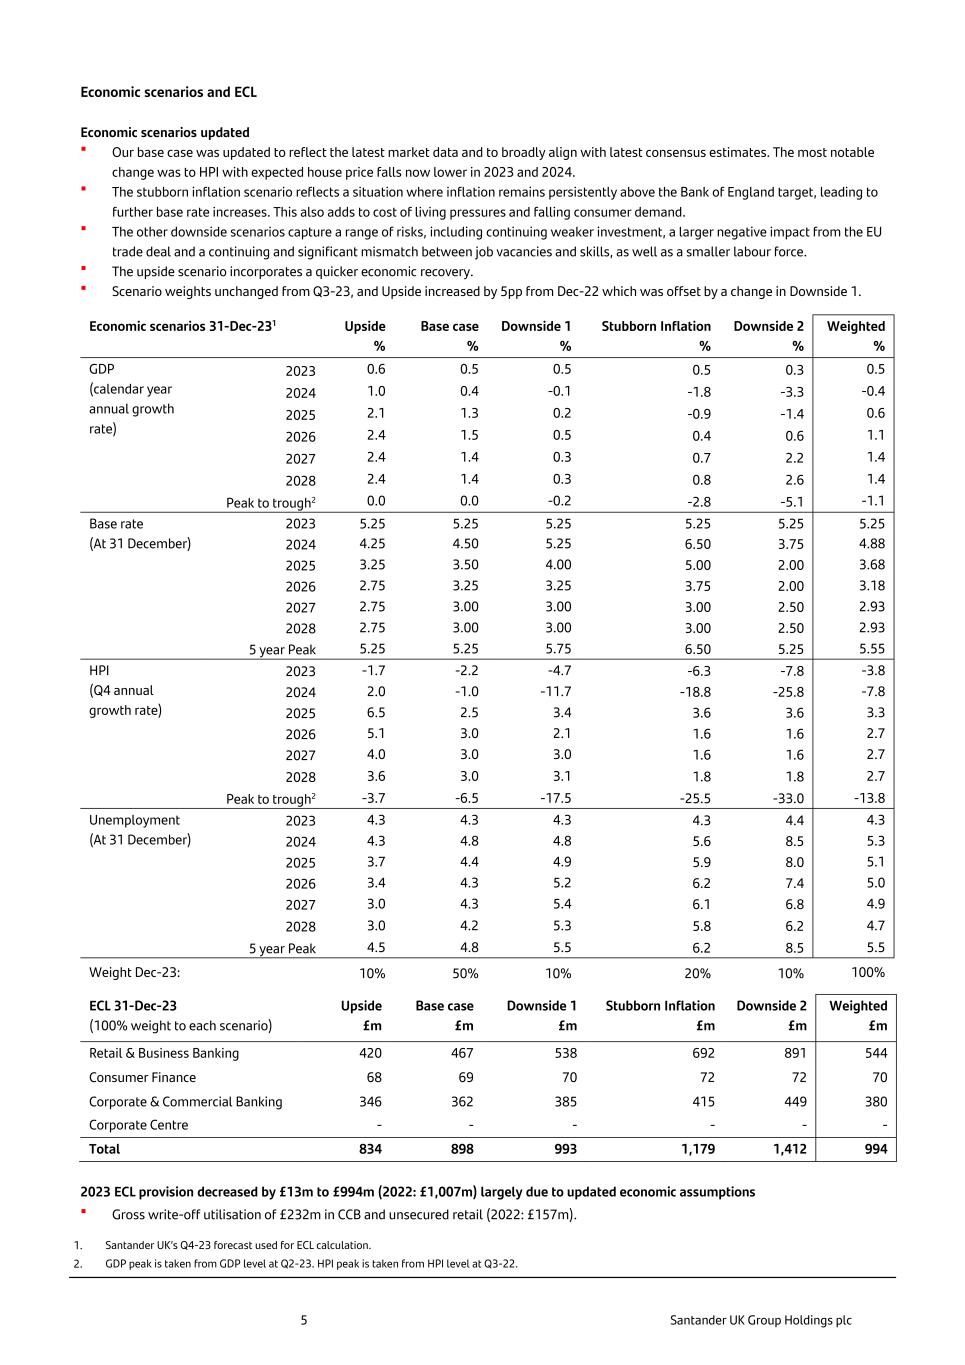
5 Santander UK Group Holdings plc Economic scenarios and ECL Economic scenarios updated ▪ Our base case was updated to reflect the latest market data and to broadly align with latest consensus estimates. The most notable change was to HPI with expected house price falls now lower in 2023 and 2024. ▪ The stubborn inflation scenario reflects a situation where inflation remains persistently above the Bank of England target, leading to further base rate increases. This also adds to cost of living pressures and falling consumer demand. ▪ The other downside scenarios capture a range of risks, including continuing weaker investment, a larger negative impact from the EU trade deal and a continuing and significant mismatch between job vacancies and skills, as well as a smaller labour force. ▪ The upside scenario incorporates a quicker economic recovery. ▪ Scenario weights unchanged from Q3-23, and Upside increased by 5pp from Dec-22 which was offset by a change in Downside 1. Economic scenarios 31-Dec-231 Upside % Base case % Downside 1 % Stubborn Inflation % Downside 2 % Weighted % GDP (calendar year annual growth rate) 2023 0.6 0.5 0.5 0.5 0.3 0.5 2024 1.0 0.4 -0.1 -1.8 -3.3 -0.4 2025 2.1 1.3 0.2 -0.9 -1.4 0.6 2026 2.4 1.5 0.5 0.4 0.6 1.1 2027 2.4 1.4 0.3 0.7 2.2 1.4 2028 2.4 1.4 0.3 0.8 2.6 1.4 Peak to trough2 0.0 0.0 -0.2 -2.8 -5.1 -1.1 Base rate (At 31 December) 2023 5.25 5.25 5.25 5.25 5.25 5.25 2024 4.25 4.50 5.25 6.50 3.75 4.88 2025 3.25 3.50 4.00 5.00 2.00 3.68 2026 2.75 3.25 3.25 3.75 2.00 3.18 2027 2.75 3.00 3.00 3.00 2.50 2.93 2028 2.75 3.00 3.00 3.00 2.50 2.93 5 year Peak 5.25 5.25 5.75 6.50 5.25 5.55 HPI (Q4 annual growth rate) 2023 -1.7 -2.2 -4.7 -6.3 -7.8 -3.8 2024 2.0 -1.0 -11.7 -18.8 -25.8 -7.8 2025 6.5 2.5 3.4 3.6 3.6 3.3 2026 5.1 3.0 2.1 1.6 1.6 2.7 2027 4.0 3.0 3.0 1.6 1.6 2.7 2028 3.6 3.0 3.1 1.8 1.8 2.7 Peak to trough2 -3.7 -6.5 -17.5 -25.5 -33.0 -13.8 Unemployment (At 31 December) 2023 4.3 4.3 4.3 4.3 4.4 4.3 2024 4.3 4.8 4.8 5.6 8.5 5.3 2025 3.7 4.4 4.9 5.9 8.0 5.1 2026 3.4 4.3 5.2 6.2 7.4 5.0 2027 3.0 4.3 5.4 6.1 6.8 4.9 2028 3.0 4.2 5.3 5.8 6.2 4.7 5 year Peak 4.5 4.8 5.5 6.2 8.5 5.5 Weight Dec-23: 10% 50% 10% 20% 10% 100% ECL 31-Dec-23 (100% weight to each scenario) Upside £m Base case £m Downside 1 £m Stubborn Inflation £m Downside 2 £m Weighted £m Retail & Business Banking 420 467 538 692 891 544 Consumer Finance 68 69 70 72 72 70 Corporate & Commercial Banking 346 362 385 415 449 380 Corporate Centre - - - - - - Total 834 898 993 1,179 1,412 994 2023 ECL provision decreased by £13m to £994m (2022: £1,007m) largely due to updated economic assumptions ▪ Gross write-off utilisation of £232m in CCB and unsecured retail (2022: £157m). 1. Santander UK’s Q4-23 forecast used for ECL calculation. 2. GDP peak is taken from GDP level at Q2-23. HPI peak is taken from HPI level at Q3-22.
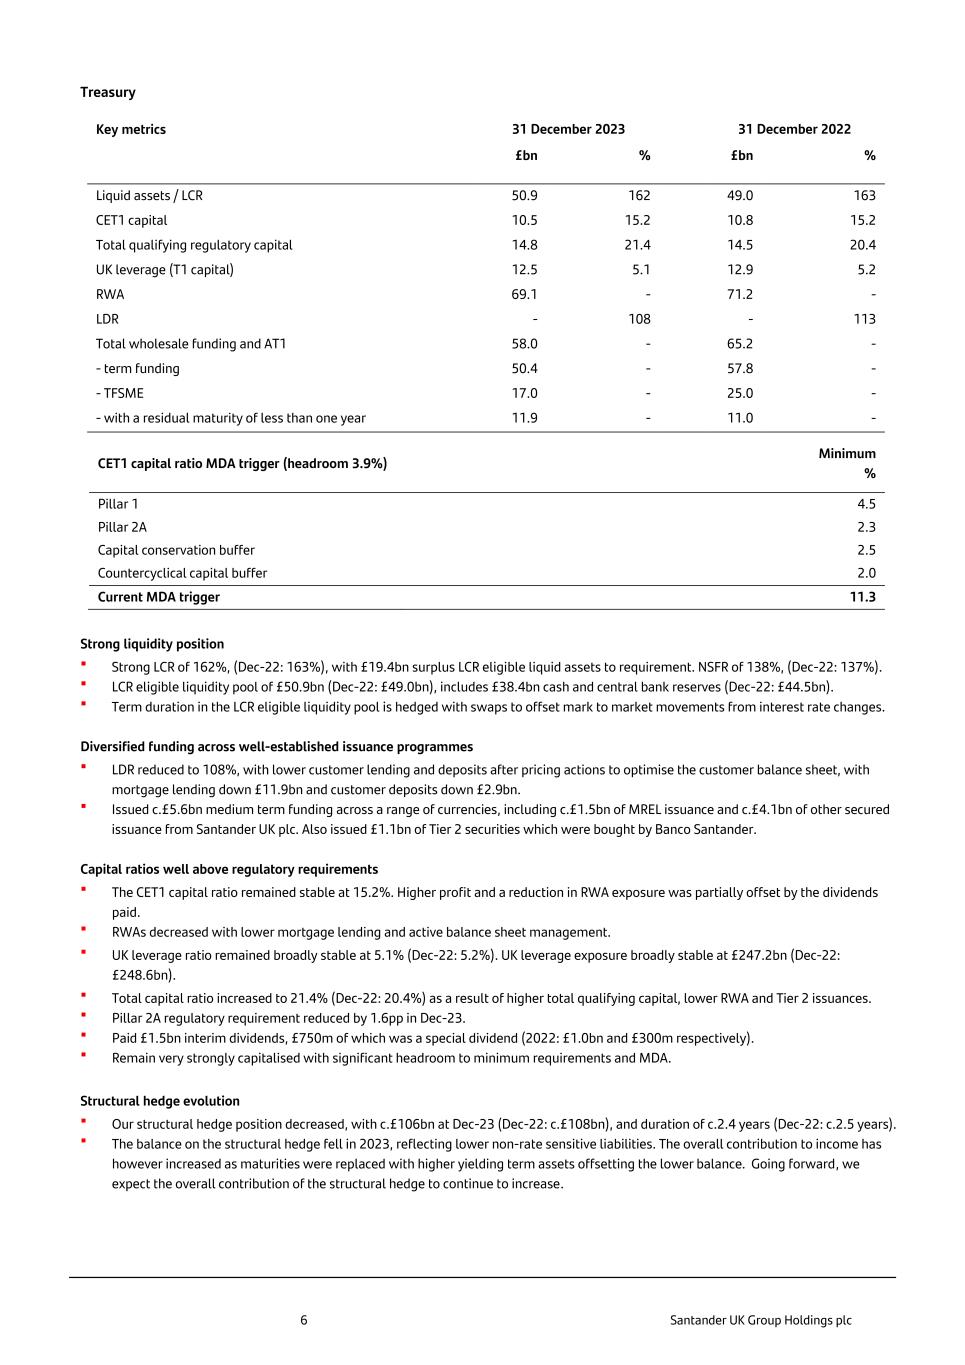
6 Santander UK Group Holdings plc Treasury Key metrics 31 December 2023 31 December 2022 £bn % £bn % Liquid assets / LCR 50.9 162 49.0 163 CET1 capital 10.5 15.2 10.8 15.2 Total qualifying regulatory capital 14.8 21.4 14.5 20.4 UK leverage (T1 capital) 12.5 5.1 12.9 5.2 RWA 69.1 - 71.2 - LDR - 108 - 113 Total wholesale funding and AT1 58.0 - 65.2 - - term funding 50.4 - 57.8 - - TFSME 17.0 - 25.0 - - with a residual maturity of less than one year 11.9 - 11.0 - CET1 capital ratio MDA trigger (headroom 3.9%) Minimum % Pillar 1 4.5 Pillar 2A 2.3 Capital conservation buffer 2.5 Countercyclical capital buffer 2.0 Current MDA trigger 11.3 Strong liquidity position ▪ Strong LCR of 162%, (Dec-22: 163%), with £19.4bn surplus LCR eligible liquid assets to requirement. NSFR of 138%, (Dec-22: 137%). ▪ LCR eligible liquidity pool of £50.9bn (Dec-22: £49.0bn), includes £38.4bn cash and central bank reserves (Dec-22: £44.5bn). ▪ Term duration in the LCR eligible liquidity pool is hedged with swaps to offset mark to market movements from interest rate changes. Diversified funding across well-established issuance programmes ▪ LDR reduced to 108%, with lower customer lending and deposits after pricing actions to optimise the customer balance sheet, with mortgage lending down £11.9bn and customer deposits down £2.9bn. ▪ Issued c.£5.6bn medium term funding across a range of currencies, including c.£1.5bn of MREL issuance and c.£4.1bn of other secured issuance from Santander UK plc. Also issued £1.1bn of Tier 2 securities which were bought by Banco Santander. Capital ratios well above regulatory requirements ▪ The CET1 capital ratio remained stable at 15.2%. Higher profit and a reduction in RWA exposure was partially offset by the dividends paid. ▪ RWAs decreased with lower mortgage lending and active balance sheet management. ▪ UK leverage ratio remained broadly stable at 5.1% (Dec-22: 5.2%). UK leverage exposure broadly stable at £247.2bn (Dec-22: £248.6bn). ▪ Total capital ratio increased to 21.4% (Dec-22: 20.4%) as a result of higher total qualifying capital, lower RWA and Tier 2 issuances. ▪ Pillar 2A regulatory requirement reduced by 1.6pp in Dec-23. ▪ Paid £1.5bn interim dividends, £750m of which was a special dividend (2022: £1.0bn and £300m respectively). ▪ Remain very strongly capitalised with significant headroom to minimum requirements and MDA. Structural hedge evolution ▪ Our structural hedge position decreased, with c.£106bn at Dec-23 (Dec-22: c.£108bn), and duration of c.2.4 years (Dec-22: c.2.5 years). ▪ The balance on the structural hedge fell in 2023, reflecting lower non-rate sensitive liabilities. The overall contribution to income has however increased as maturities were replaced with higher yielding term assets offsetting the lower balance. Going forward, we expect the overall contribution of the structural hedge to continue to increase.
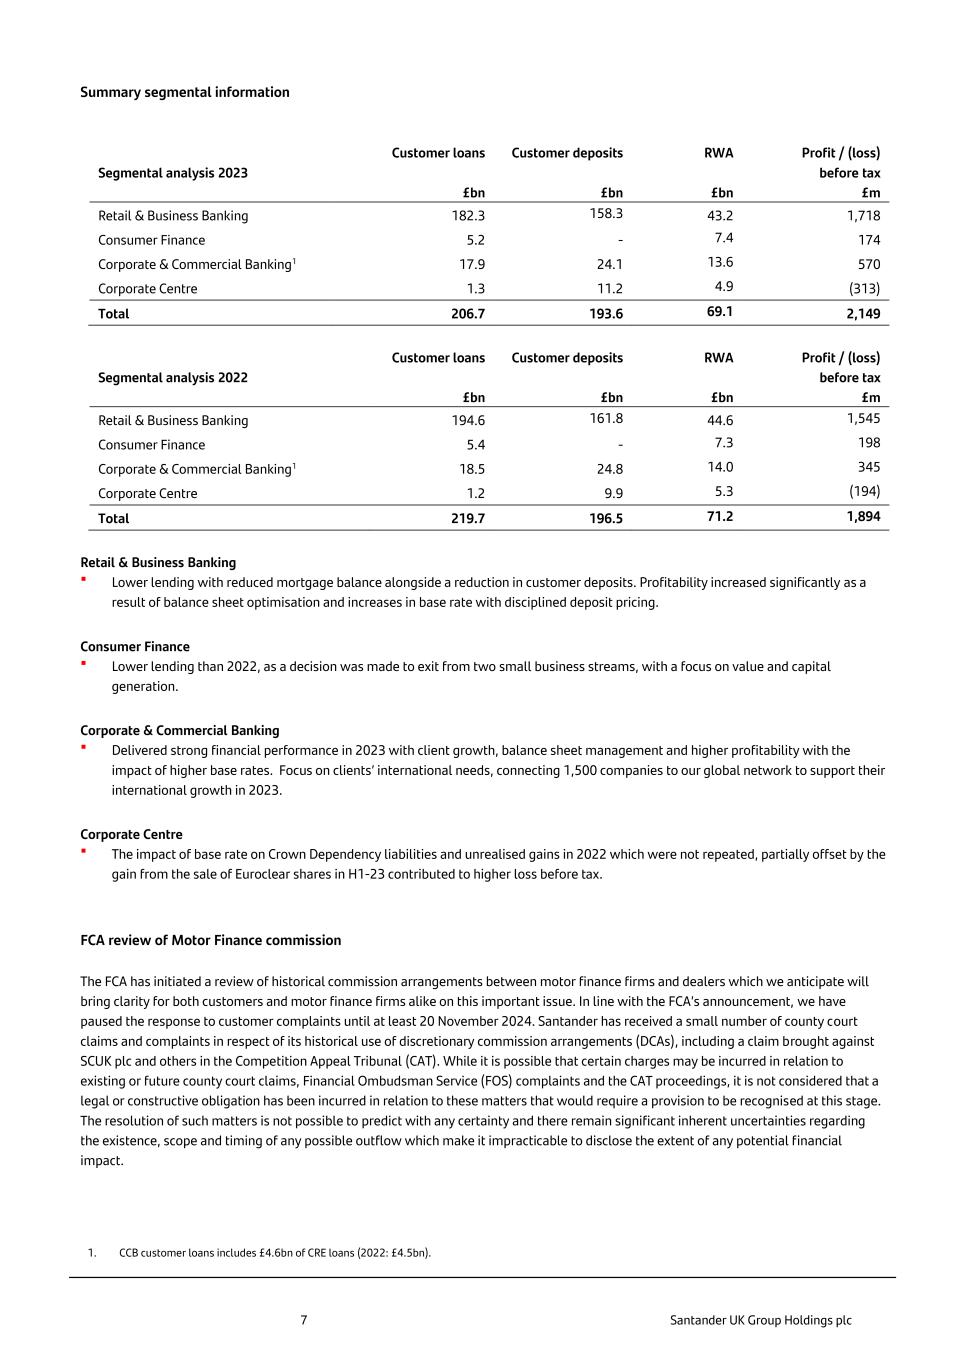
7 Santander UK Group Holdings plc Summary segmental information Segmental analysis 2023 Customer loans Customer deposits RWA Profit / (loss) before tax £bn £bn £bn £m Retail & Business Banking 182.3 158.3 43.2 1,718 Consumer Finance 5.2 - 7.4 174 Corporate & Commercial Banking1 17.9 24.1 13.6 570 Corporate Centre 1.3 11.2 4.9 (313) Total 206.7 193.6 69.1 2,149 Segmental analysis 2022 Customer loans Customer deposits RWA Profit / (loss) before tax £bn £bn £bn £m Retail & Business Banking 194.6 161.8 44.6 1,545 Consumer Finance 5.4 - 7.3 198 Corporate & Commercial Banking1 18.5 24.8 14.0 345 Corporate Centre 1.2 9.9 5.3 (194) Total 219.7 196.5 71.2 1,894 Retail & Business Banking ▪ Lower lending with reduced mortgage balance alongside a reduction in customer deposits. Profitability increased significantly as a result of balance sheet optimisation and increases in base rate with disciplined deposit pricing. Consumer Finance ▪ Lower lending than 2022, as a decision was made to exit from two small business streams, with a focus on value and capital generation. Corporate & Commercial Banking ▪ Delivered strong financial performance in 2023 with client growth, balance sheet management and higher profitability with the impact of higher base rates. Focus on clients’ international needs, connecting 1,500 companies to our global network to support their international growth in 2023. Corporate Centre ▪ The impact of base rate on Crown Dependency liabilities and unrealised gains in 2022 which were not repeated, partially offset by the gain from the sale of Euroclear shares in H1-23 contributed to higher loss before tax. FCA review of Motor Finance commission The FCA has initiated a review of historical commission arrangements between motor finance firms and dealers which we anticipate will bring clarity for both customers and motor finance firms alike on this important issue. In line with the FCA’s announcement, we have paused the response to customer complaints until at least 20 November 2024. Santander has received a small number of county court claims and complaints in respect of its historical use of discretionary commission arrangements (DCAs), including a claim brought against SCUK plc and others in the Competition Appeal Tribunal (CAT). While it is possible that certain charges may be incurred in relation to existing or future county court claims, Financial Ombudsman Service (FOS) complaints and the CAT proceedings, it is not considered that a legal or constructive obligation has been incurred in relation to these matters that would require a provision to be recognised at this stage. The resolution of such matters is not possible to predict with any certainty and there remain significant inherent uncertainties regarding the existence, scope and timing of any possible outflow which make it impracticable to disclose the extent of any potential financial impact. 1. CCB customer loans includes £4.6bn of CRE loans (2022: £4.5bn).
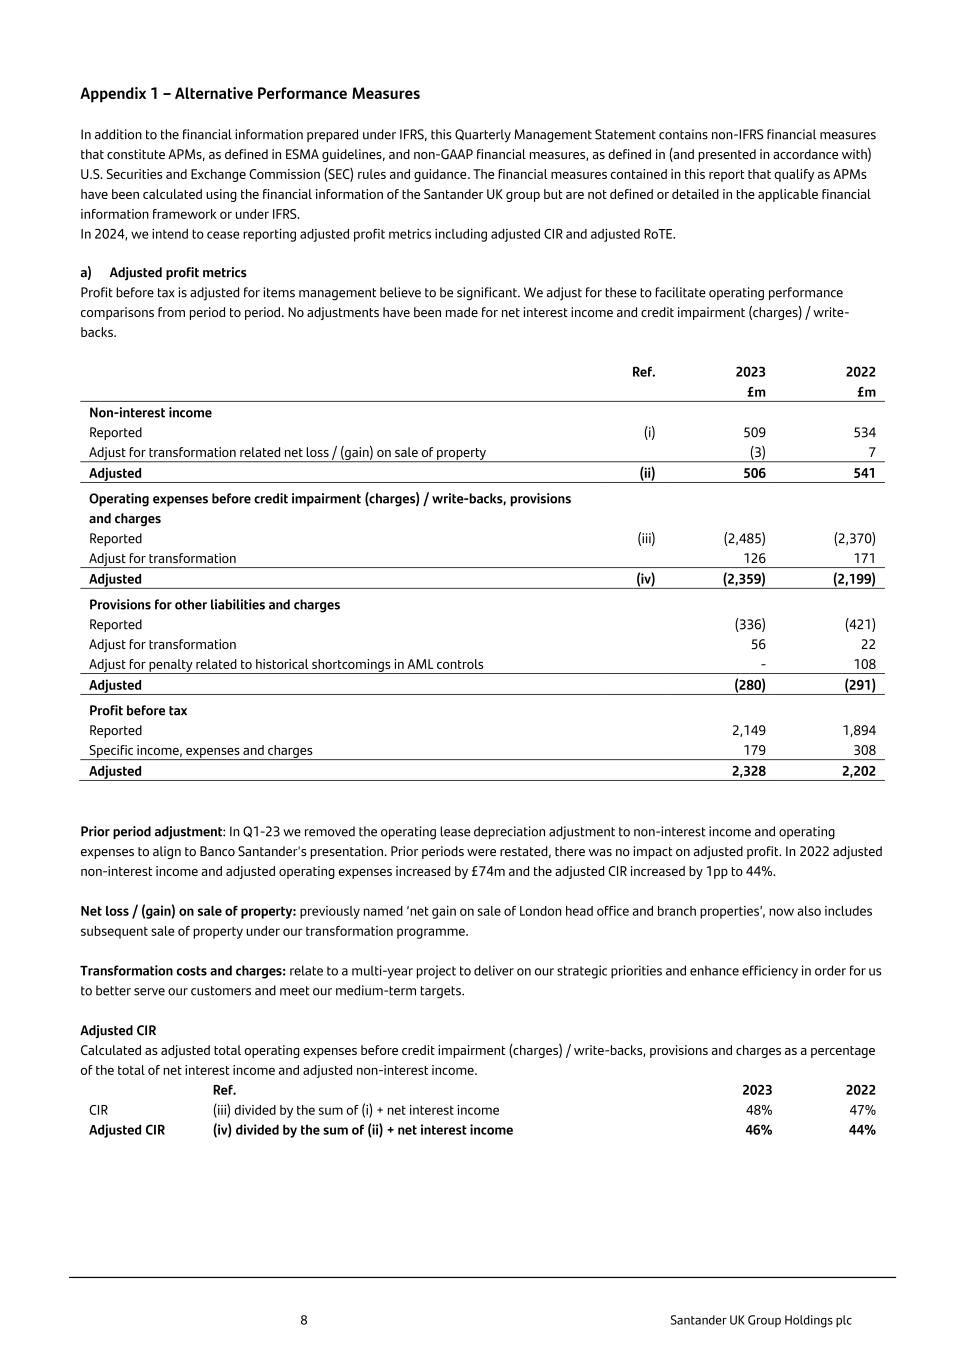
8 Santander UK Group Holdings plc Appendix 1 – Alternative Performance Measures In addition to the financial information prepared under IFRS, this Quarterly Management Statement contains non-IFRS financial measures that constitute APMs, as defined in ESMA guidelines, and non-GAAP financial measures, as defined in (and presented in accordance with) U.S. Securities and Exchange Commission (SEC) rules and guidance. The financial measures contained in this report that qualify as APMs have been calculated using the financial information of the Santander UK group but are not defined or detailed in the applicable financial information framework or under IFRS. In 2024, we intend to cease reporting adjusted profit metrics including adjusted CIR and adjusted RoTE. a) Adjusted profit metrics Profit before tax is adjusted for items management believe to be significant. We adjust for these to facilitate operating performance comparisons from period to period. No adjustments have been made for net interest income and credit impairment (charges) / write- backs. Ref. 2023 2022 £m £m Non-interest income Reported (i) 509 534 Adjust for transformation related net loss / (gain) on sale of property (3) 7 Adjusted (ii) 506 541 Operating expenses before credit impairment (charges) / write-backs, provisions and charges Reported (iii) (2,485) (2,370) Adjust for transformation 126 171 Adjusted (iv) (2,359) (2,199) Provisions for other liabilities and charges Reported (336) (421) Adjust for transformation 56 22 Adjust for penalty related to historical shortcomings in AML controls - 108 Adjusted (280) (291) Profit before tax Reported 2,149 1,894 Specific income, expenses and charges 179 308 Adjusted 2,328 2,202 Prior period adjustment: In Q1-23 we removed the operating lease depreciation adjustment to non-interest income and operating expenses to align to Banco Santander's presentation. Prior periods were restated, there was no impact on adjusted profit. In 2022 adjusted non-interest income and adjusted operating expenses increased by £74m and the adjusted CIR increased by 1pp to 44%. Net loss / (gain) on sale of property: previously named ‘net gain on sale of London head office and branch properties’, now also includes subsequent sale of property under our transformation programme. Transformation costs and charges: relate to a multi-year project to deliver on our strategic priorities and enhance efficiency in order for us to better serve our customers and meet our medium-term targets. Adjusted CIR Calculated as adjusted total operating expenses before credit impairment (charges) / write-backs, provisions and charges as a percentage of the total of net interest income and adjusted non-interest income. Ref. 2023 2022 CIR (iii) divided by the sum of (i) + net interest income 48% 47% Adjusted CIR (iv) divided by the sum of (ii) + net interest income 46% 44%
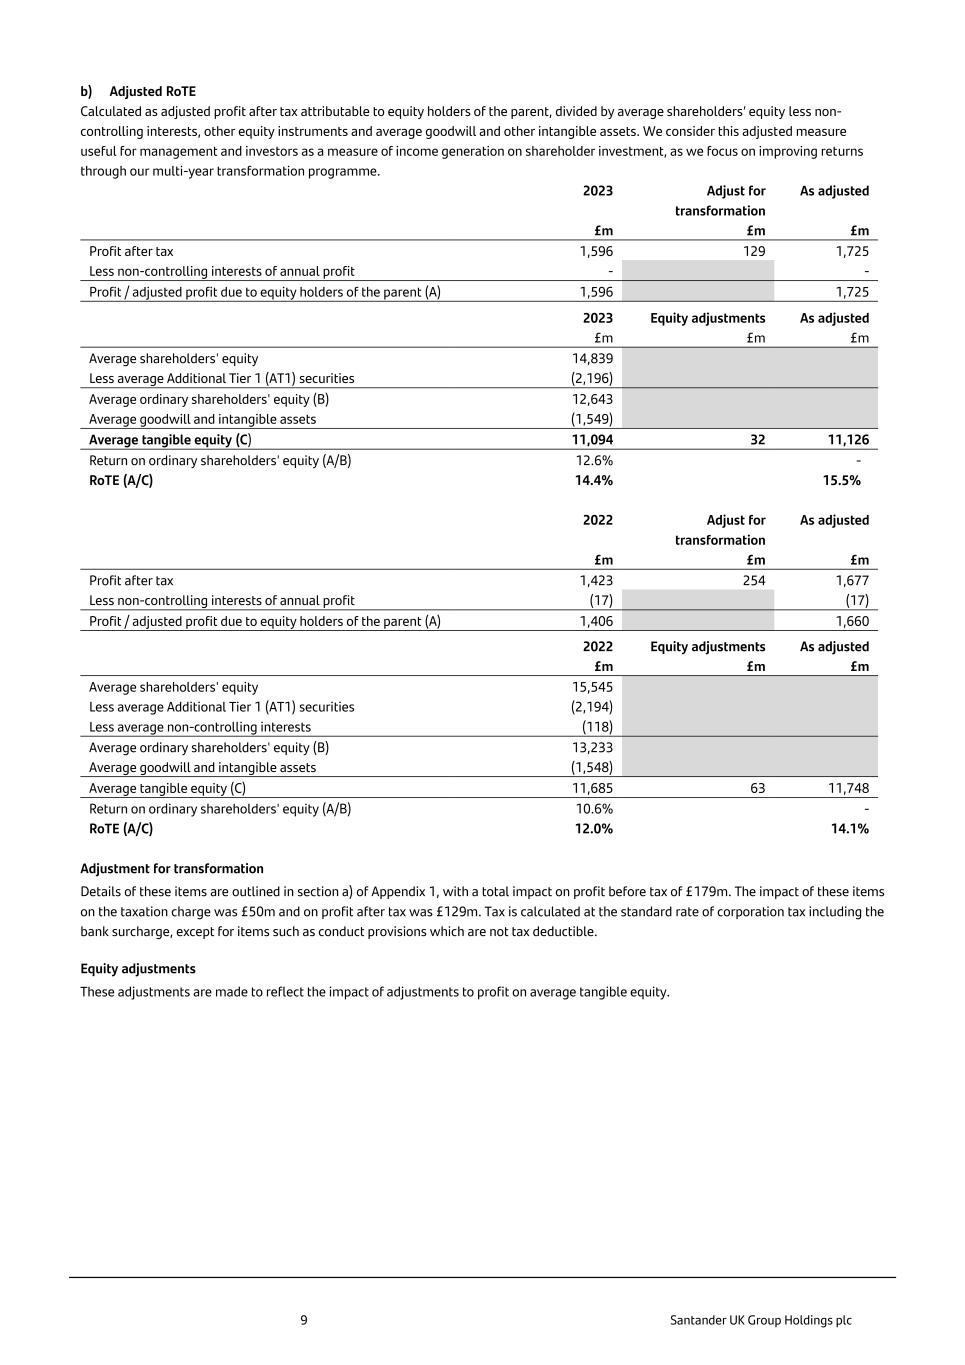
9 Santander UK Group Holdings plc b) Adjusted RoTE Calculated as adjusted profit after tax attributable to equity holders of the parent, divided by average shareholders’ equity less non- controlling interests, other equity instruments and average goodwill and other intangible assets. We consider this adjusted measure useful for management and investors as a measure of income generation on shareholder investment, as we focus on improving returns through our multi-year transformation programme. 2023 Adjust for transformation As adjusted £m £m £m Profit after tax 1,596 129 1,725 Less non-controlling interests of annual profit - - Profit / adjusted profit due to equity holders of the parent (A) 1,596 1,725 2023 Equity adjustments As adjusted £m £m £m Average shareholders' equity 14,839 Less average Additional Tier 1 (AT1) securities (2,196) Average ordinary shareholders' equity (B) 12,643 Average goodwill and intangible assets (1,549) Average tangible equity (C) 11,094 32 11,126 Return on ordinary shareholders' equity (A/B) 12.6% - RoTE (A/C) 14.4% 15.5% 2022 Adjust for transformation As adjusted £m £m £m Profit after tax 1,423 254 1,677 Less non-controlling interests of annual profit (17) (17) Profit / adjusted profit due to equity holders of the parent (A) 1,406 1,660 2022 Equity adjustments As adjusted £m £m £m Average shareholders' equity 15,545 Less average Additional Tier 1 (AT1) securities (2,194) Less average non-controlling interests (118) Average ordinary shareholders' equity (B) 13,233 Average goodwill and intangible assets (1,548) Average tangible equity (C) 11,685 63 11,748 Return on ordinary shareholders' equity (A/B) 10.6% - RoTE (A/C) 12.0% 14.1% Adjustment for transformation Details of these items are outlined in section a) of Appendix 1, with a total impact on profit before tax of £179m. The impact of these items on the taxation charge was £50m and on profit after tax was £129m. Tax is calculated at the standard rate of corporation tax including the bank surcharge, except for items such as conduct provisions which are not tax deductible. Equity adjustments These adjustments are made to reflect the impact of adjustments to profit on average tangible equity.

10 Santander UK Group Holdings plc Appendix 2 – Additional information Mortgage metrics 31.12.23 31.12.22 Stock average LTV1 51% 50% New business average LTV1 66% 69% London lending new business average LTV1 65% 66% BTL proportion of loan book 9% 9% Fixed rate proportion of loan book 89% 89% Variable rate proportion of loan book 8% 7% SVR proportion of loan book 2% 3% FoR proportion of loan book 1% 1% Proportion of customers with a maturing mortgage retained2 77% 81% Average loan size (stock)3 £188k £184k Average loan size (new business) £228k £237k Interest rate risk NII sensitivity4 2023 2022 £m £m +100bps 218 238 -100bps (220) (194) ▪ The table above shows how our net interest income would be affected by a 100bps parallel shift (both up and down) applied instantaneously to the yield curve. Sensitivity to parallel shifts represents the amount of risk in a way that we think is both simple and scalable. Summarised changes to CET1 capital ratio in 2023 CET1 capital ratio % 31 December 2022 CET1 capital ratio 15.2 Profit +2.2pp Dividends on ordinary shares -1.1pp AT1 coupons -0.2pp Special dividend -1.0pp Pension -0.3pp Expected loss less provisions -0.1pp RWA growth and other +0.5pp 31 December 2023 CET1 capital ratio 15.2 1. Balance weighted LTV. 2. Applied to mortgages four months post maturity and is calculated as a 12-month average of retention rates to Sep-23 and Dec-22 respectively. 3. Average initial advance of existing stock. 4. Based on modelling assumptions of repricing behaviour.
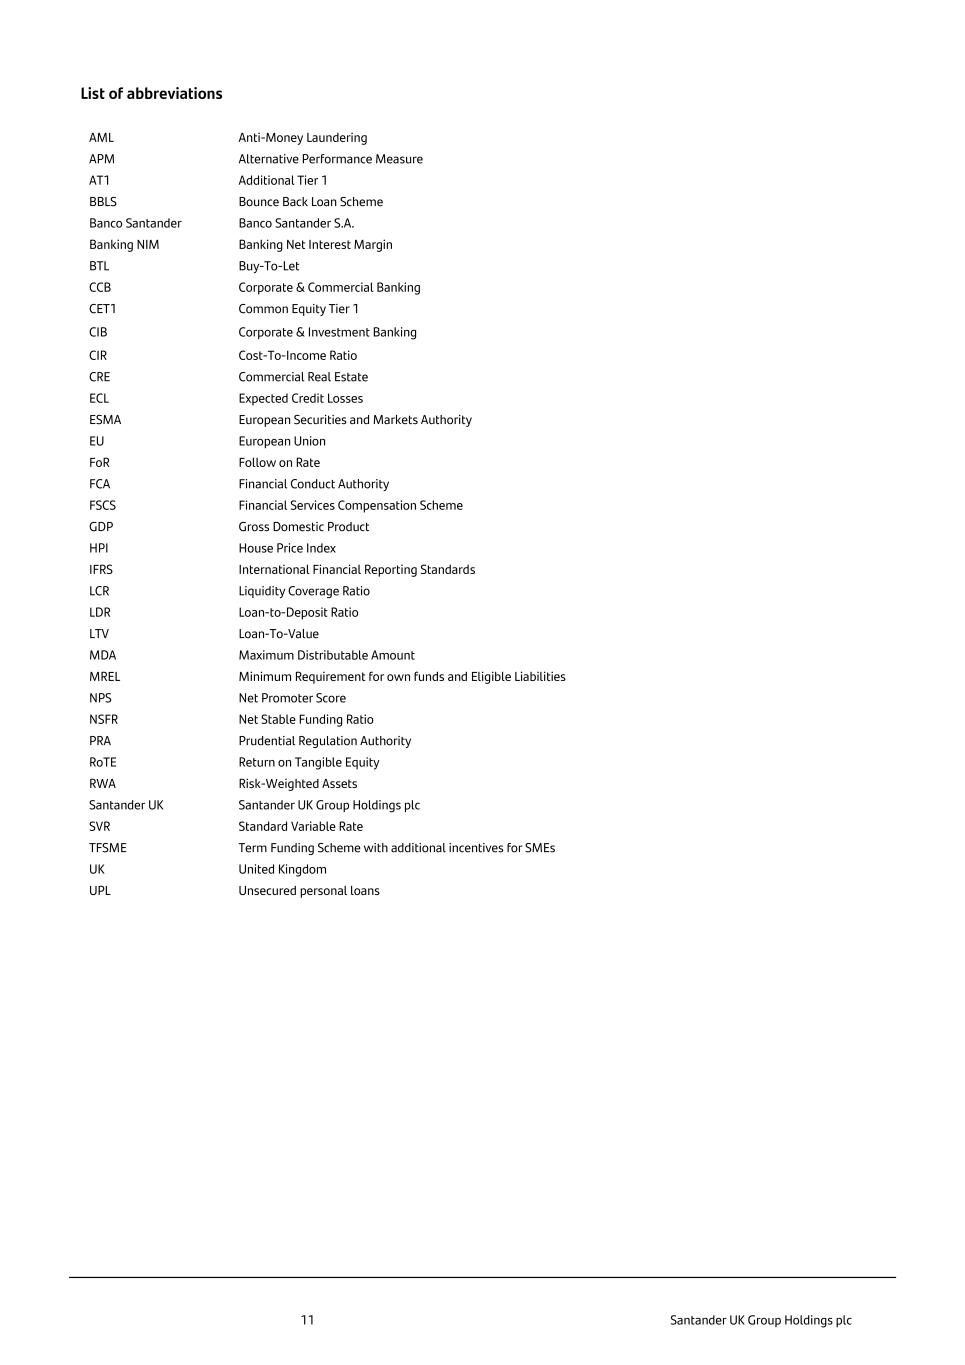
11 Santander UK Group Holdings plc List of abbreviations AML Anti-Money Laundering APM Alternative Performance Measure AT1 Additional Tier 1 BBLS Bounce Back Loan Scheme Banco Santander Banco Santander S.A. Banking NIM Banking Net Interest Margin BTL Buy-To-Let CCB Corporate & Commercial Banking CET1 Common Equity Tier 1 CIB Corporate & Investment Banking CIR Cost-To-Income Ratio CRE Commercial Real Estate ECL Expected Credit Losses ESMA European Securities and Markets Authority EU European Union FoR Follow on Rate FCA Financial Conduct Authority FSCS Financial Services Compensation Scheme GDP Gross Domestic Product HPI House Price Index IFRS International Financial Reporting Standards LCR Liquidity Coverage Ratio LDR Loan-to-Deposit Ratio LTV Loan-To-Value MDA Maximum Distributable Amount MREL Minimum Requirement for own funds and Eligible Liabilities NPS Net Promoter Score NSFR Net Stable Funding Ratio PRA Prudential Regulation Authority RoTE Return on Tangible Equity RWA Risk-Weighted Assets Santander UK Santander UK Group Holdings plc SVR Standard Variable Rate TFSME Term Funding Scheme with additional incentives for SMEs UK United Kingdom UPL Unsecured personal loans

12 Santander UK Group Holdings plc Retail NPS: Our customer experience research was subject to independent third party review. We measured the main banking NPS of 17,015 consumers on a six month basis using a 11-point scale (%Top 2 – %Bottom 7). The reported data is based on the six months ending 31 December 2023, and the competitor set included in the ranking analysis is Barclays, Halifax, HSBC, Lloyds Bank, Nationwide, NatWest Group (Natwest & RBS) and TSB. December 2023: NPS ranked 5th for Retail, we note a margin of error which impacts those from 3rd to 5th and makes their rank statistically equivalent. December 2022: NPS ranked 6th for Retail, we note a margin of error which impacts those from 4th to 6th and makes their rank statistically equivalent. Business & Corporate NPS: Business and corporate NPS is measured by the MarketVue Business Banking from Savanta. This is an ongoing telephone based survey designed to monitor usage and attitude of UK businesses towards banks. 14,500 structured telephone interviews are conducted each year among businesses of all sizes from new start-ups to large corporates. The data is based upon 8,275 interviews made in twelve months ended 15 December 2023 with businesses turning over from £0 - £500m per annum and are weighted by region and turnover to be representative of businesses in Great Britain. NPS recommendation score is based on an 11-point scale (%Top 2 - %Bottom 7). The competitor set included in this analysis is Barclays, RBS, HSBC, Lloyds Bank and NatWest. December 2023: NPS ranked 1st for Business & Corporate. December 2022: NPS ranked 1st for Business & Corporate. Additional information about Santander UK and Banco Santander Santander UK is a financial services provider in the UK that offers a wide range of personal and commercial financial products and services. At 31 December 2023, the bank had around 19,800 employees and serves around 14 million active customers, 7 million digital customers via a nationwide 444 branch network, telephone, mobile and online banking. Santander UK is subject to the full supervision of the FCA and the PRA in the UK. Santander UK plc customers’ eligible deposits are protected by the FSCS in the UK. Banco Santander (SAN SM, STD US, BNC LN) is a leading retail and commercial bank, founded in 1857 and headquartered in Spain and is one of the largest banks in the world by market capitalization. Its primary segments are Europe, North America, South America and Digital Consumer Bank, backed by its secondary segments: Santander Corporate & Investment Banking (Santander CIB), Wealth Management & Insurance (WM&I) and PagoNxt. Its purpose is to help people and businesses prosper in a simple, personal and fair way. Banco Santander is building a more responsible bank and has made a number of commitments to support this objective, including raising over €120 billion in green financing between 2019 and 2025, as well as financially empowering more than 10 million people over the same period. At 30 September 2023, Banco Santander had 1.3 trillion euros in total funds, 166 million total customers, of which 28 million are loyal and 54 million are digital, 9,000 branches and over 212,000 employees. Banco Santander has a standard listing of its ordinary shares on the London Stock Exchange and Santander UK plc has preference shares listed on the London Stock Exchange. None of the websites referred to in this Quarterly Management Statement, including where a link is provided, nor any of the information contained on such websites is incorporated by reference in this Quarterly Management Statement. Disclaimer Santander UK Group Holdings plc (Santander UK) and Banco Santander caution that this announcement may contain forward-looking statements. Such forward-looking statements are found in various places throughout this announcement. Words such as “believes”, “anticipates”, “expects”, “intends”, “aims” and “plans” and other similar expressions are intended to identify forward-looking statements, but they are not the exclusive means of identifying such statements. Forward-looking statements include, without limitation, statements concerning our future business development and economic performance. These forward-looking statements are based on management’s current expectations, estimates and projections, and Santander UK and Banco Santander caution that these statements are not guarantees of future performance. We also caution readers that a number of important factors could cause actual results to differ materially from the plans, objectives, expectations, estimates and intentions expressed in such forward-looking statements. We have identified certain of these factors in the forward-looking statements on page 271 of the Santander UK Group Holdings plc 2022 Annual Report on Form 20-F filed with the U.S. Securities and Exchange Commission (SEC) on 7 March 2023. Investors and others should carefully consider the foregoing factors and other uncertainties and events. Undue reliance should not be placed on forward-looking statements when making decisions with respect to Santander UK, Banco Santander and/or their securities. Such forward-looking statements speak only as of the date on which they are made, and we do not undertake any obligation to update or revise any of them, whether as a result of new information, future events or otherwise. Statements as to historical performance, historical share price or financial accretion are not intended to mean that future performance, future share price or future earnings for any period will necessarily match or exceed those of any prior quarter. Santander UK is a frequent issuer in the debt capital markets and regularly meets with investors via formal roadshows and other ad hoc meetings. In line with Santander UK’s usual practice, over the coming quarter it expects to meet with investors globally to discuss this Quarterly Management Statement, the results contained herein and other matters relating to Santander UK. Nothing in this announcement constitutes or should be construed as constituting a profit forecast.

SIGNATURES Pursuant to the requirements of the Securities Exchange Act of 1934, the registrant has duly caused this report to be signed on its behalf by the undersigned, thereunto duly authorized. SANTANDER UK GROUP HOLDINGS PLC Dated: 1 February 2024 By / s / Mike Regnier Mike Regnier Chief Executive Officer


