Table of Contents
As filed with the Securities and Exchange Commission on October 28, 2016
Registration Statement No. 333-206667
UNITED STATES
SECURITIES AND EXCHANGE COMMISSION
Washington, D.C. 20549
Amendment No. 3
to
Form F-1
REGISTRATION STATEMENT
UNDER
THE SECURITIES ACT OF 1933
IC POWER PTE. LTD.
(Exact name of registrant as specified in its charter)
| Singapore | (Company Registration No. 201511865D) | Not applicable | ||
| 4911 | ||||
(State or other jurisdiction of incorporation or organization) | (Primary Standard Industrial Classification Code Number) | (I.R.S. Employer Identification No.) |
1 Temasek Avenue
# 36-01
Millenia Tower
Singapore 039192
Telephone: +65 6351 1780
(Address, including zip code, and telephone number, including area code, of registrant’s principal executive offices)
C T Corporation System
111 Eighth Avenue
New York, New York 10011
Telephone: + 1 212 894 8940
(Address, including zip code, and telephone number, including area code, of registrant’s agent for service of process)
Copies to:
Scott V. Simpson James A. McDonald Skadden, Arps, Slate, Meagher & Flom (UK) LLP 40 Bank Street London E14 5DS United Kingdom Telephone: +44 20 7519 7000 Facsimile: +44 20 7519 7070 | Mark Bagnall John Vetterli White & Case LLP 200 Biscayne Blvd. Suite 4900 Miami, Florida 33131 Telephone: 305 371 2700 Facsimile: 305 358 5744 |
Approximate date of commencement of proposed sale to the public: As soon as practicable after the effective date of this Registration Statement.
If any of the securities being registered on this Form are to be offered on a delayed or continuous basis pursuant to Rule 415 under the Securities Act of 1933 (the “Securities Act”), check the following box. ¨
If this Form is filed to register additional securities for an offering pursuant to Rule 462(b) under the Securities Act, check the following box and list the Securities Act registration statement number of the earlier effective registration statement for the same offering. ¨
If this Form is a post-effective amendment filed pursuant to Rule 462(c) under the Securities Act, check the following box and list the Securities Act registration statement number of the earlier effective registration statement for the same offering. ¨
If this Form is a post-effective amendment filed pursuant to Rule 462(d) under the Securities Act, check the following box and list the Securities Act registration statement number of the earlier effective registration statement for the same offering. ¨
CALCULATION OF REGISTRATION FEE
| ||||
Title of each class of securities to be registered | Proposed maximum aggregate offering price(1)(2) | Amount of registration fee(3) | ||
Ordinary shares, no par value | $100,000,000 | $11,620 | ||
| ||||
| ||||
| (1) | Includes additional ordinary shares that may be sold upon exercise of a purchase option to be granted to the underwriters. |
| (2) | Estimated solely for the purposes of calculating the registration fee pursuant to Rule 457(o) of the Securities Act of 1933. |
| (3) | Previously paid. |
The Registrant hereby amends this Registration Statement on such date or dates as may be necessary to delay its effective date until the Registrant shall file a further amendment which specifically states that this Registration Statement shall thereafter become effective in accordance with Section 8(a) of the Securities Act or until the Registration Statement shall become effective on such date as the Securities and Exchange Commission, acting pursuant to said Section 8(a), may determine.
Table of Contents
The information in this prospectus is not complete and may be changed. We may not sell these securities until the registration statement filed with the Securities and Exchange Commission is effective. This prospectus is not an offer to sell these securities and is not soliciting an offer to buy these securities in any jurisdiction where the offer or sale is not permitted.
Subject to Completion
Preliminary Prospectus Dated ,2016
PROSPECTUS
Ordinary Shares

This is the initial public offering of ordinary shares, no par value, of IC Power Pte. Ltd., or IC Power, a private company limited by shares incorporated under the laws of Singapore. We expect the public offering price to be between $ and $ per ordinary share.
Prior to this offering, there has been no public market for our ordinary shares. We are in the process of applying to list our ordinary shares on the New York Stock Exchange, or the NYSE, under the symbol “ICP.”
Upon the completion of this offering, and assuming an initial public offering price equal to the mid-point of the price range set forth above, Kenon Holdings Ltd. (NYSE: KEN; TASE: KEN), our current sole shareholder, will continue to control approximately % of the aggregate voting power of our ordinary shares, or approximately % if the underwriters exercise in full their option to purchase up to additional ordinary shares from us. For further information, see “Principal Shareholders.”
Investing in our ordinary shares involves risks. See “Risk Factors” beginning on page 42 to read about certain factors you should consider before purchasing our ordinary shares.
Per Share | Total | |||||||
Initial public offering price | $ | $ | ||||||
Underwriting discounts and commissions(1) | $ | $ | ||||||
Proceeds to us, before expenses | $ | $ | ||||||
| (1) | See “Underwriting” for a description of compensation payable to the underwriters. |
We have agreed to allow the underwriters to purchase up to an additional ordinary shares from us, at the public offering price, less the underwriting discounts and commissions, within days from the date of this prospectus.
The underwriters expect to deliver our ordinary shares to purchasers against payment on or about , 2016.
Neither the U.S. Securities and Exchange Commission, or the SEC, nor any state securities commission has approved or disapproved of these securities or determined if this prospectus is truthful or complete. Any representation to the contrary is a criminal offense.
| BofA Merrill Lynch | Credit Suisse |
| Goldman, Sachs & Co. | UBS Investment Bank | |
| HSBC | Scotiabank | Credicorp Capital | ||
The date of this prospectus is , 2016.
Table of Contents
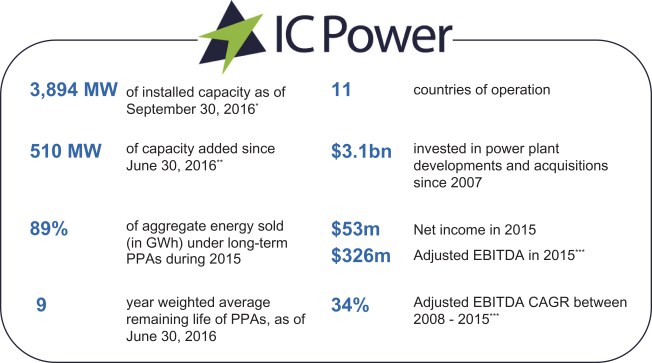
| * | 3,114 MW of proportionate capacity |
| ** | 383 MW of proportionate capacity |
| *** | Adjusted EBITDA in 2015 was $326 million, compared to $41 million in 2008. Adjusted EBITDA is a non-IFRS measure. For a reconciliation of our net income to our Adjusted EBITDA, see “Summary Consolidated Financial and Other Information—Key Financial and Other Operating Information – IC Power and ICP.” |
As of June 30, 2016
| (1) | Includes 193 MW capacity from Las Flores. |
| (2) | Includes 18 MW currently under operation and a cogeneration plant, which is expected to have capacity of 140 MW. |
| (3) | Excludes Agua Clara, a 50 MW wind project, which is expected to commence commercial operations in early 2018. |
Table of Contents
| ii | ||||
| ii | ||||
| iv | ||||
| iv | ||||
| v | ||||
| v | ||||
| v | ||||
| xi | ||||
| 1 | ||||
| 18 | ||||
| 21 | ||||
UNAUDITED PRO FORMA CONDENSED CONSOLIDATED FINANCIAL INFORMATION | 35 | |||
| 42 | ||||
| 80 | ||||
| 83 | ||||
| 84 | ||||
| 84 | ||||
| 86 | ||||
| 87 | ||||
| 88 | ||||
MANAGEMENT’S DISCUSSION AND ANALYSIS OF FINANCIAL CONDITION AND RESULTS OF OPERATIONS | 99 | |||
| 169 | ||||
| 183 | ||||
| 278 | ||||
| 285 | ||||
| 286 | ||||
| 288 | ||||
| 308 | ||||
| 310 | ||||
| 315 | ||||
| 326 | ||||
| 326 | ||||
| 326 | ||||
| 327 | ||||
| F-1 |
Neither we nor the underwriters (nor any of our or their respective affiliates) have authorized anyone to provide any information other than that contained in this prospectus or in any free writing prospectus prepared by or on behalf of us or to which we may have referred you. We take no responsibility for, and can provide no assurance as to the reliability of, any other information that others may give you. If anyone provides you with additional, different, or inconsistent information, you should not rely on it. Neither we nor the underwriters (nor any of our or their respective affiliates) are making an offer to sell the ordinary shares in any jurisdiction where the offer or sale is not permitted. You should assume that the information appearing in this prospectus is accurate only as of the date on the front cover of this prospectus, regardless of the time of delivery of this prospectus or any sale of the ordinary shares. Our business, financial condition, results of operations and liquidity may have changed since the date on the front cover of this prospectus.
i
Table of Contents
Neither we nor any of the underwriters have taken any action to permit a public offering of the ordinary shares outside the United States or to permit the possession or distribution of this prospectus outside the United States. Persons outside the United States who come into possession of this prospectus must inform themselves about and observe any restrictions relating to the offering of the ordinary shares and the distribution of this prospectus outside the United States.
Until , 2016 (the 25th day after the date of this prospectus), all dealers that buy, sell or trade in our ordinary shares, whether or not participating in this offering, may be required to deliver a prospectus. This is in addition to the dealer’s obligation to deliver a prospectus when acting as underwriter and with respect to their unsold allotment or subscription.
As described under “Corporate Formation and Reorganization,” we were formed in May 2015, under the name IC Power Pte. Ltd., or IC Power, to serve as the holding company of I.C. Power Asia Development Ltd. (formerly known as I.C. Power Ltd.), or ICP, and its businesses. On March 17, 2016, Kenon, our current sole shareholder, effected an internal reorganization pursuant to which it transferred all of its equity interests in its wholly-owned subsidiary ICP to us in exchange for (1) 559,309 of our ordinary shares and (2) notes payable by us to Kenon in an aggregate principal amount of $220 million, which transactions we collectively refer to as the Reorganization. Additionally, prior to the completion of this offering, we will be converted into a Singapore public company limited by shares and renamed . Except as otherwise indicated, or unless the context requires otherwise, references to “IC Power,” “the Company,” “we,” “us” and “our” prior to the date of the Reorganization shall refer to ICP and its businesses, and as of the date of the Reorganization and thereafter, to IC Power and its subsidiaries, including ICP.
We present financial statements in accordance with International Financial Reporting Standards, or IFRS, as issued by the International Accounting Standards Board, or IASB, and all financial information included in this prospectus is presented in accordance with IFRS as issued by the IASB, except as otherwise indicated. In particular, this prospectus contains certain non-IFRS financial measures which are defined under “Summary Consolidated Financial and Other Information” and“Business.”
As set forth above, except as otherwise indicated, or unless the context requires otherwise, references to “IC Power,” “the Company,” “we,” “us” and “our” prior to the date of the Reorganization shall refer to ICP and its businesses, and, as of the date of the Reorganization and thereafter, to IC Power and its subsidiaries, including ICP. The financial statements we have included in this prospectus consist of: (1) IC Power’s unaudited condensed consolidated interim statements of income, comprehensive income, changes in equity, and cash flows for the six months ended June 30, 2016 and 2015, unaudited condensed consolidated interim statements of financial position as of June 30, 2016 and December 31, 2015, and the notes thereto. As set forth in Note 2 to these financial statements, as a result of the Reorganization, which occurred in March 2016, IC Power restated the information in these financial statements as of December 31, 2015 and for the six months ended June 30, 2015, reflecting the figures from ICP’s financial statements for those periods; (2) IC Power’s audited statement of profit or loss, changes in equity and cash flow for the period from May 4, 2015 (inception) through December 31, 2015, audited statement of financial position as of December 31, 2015, and the notes thereto; and (3) ICP’s audited consolidated statements of income, comprehensive income, changes in equity, and cash flows for the years ended December 31, 2015, 2014 and 2013, audited consolidated statements of financial position as of December 31, 2015 and 2014, and the notes thereto. Each of IC Power and ICP presents its financial statements in U.S. Dollars.
ICP is our predecessor for accounting reporting purposes. During the period from May 4, 2015 (IC Power’s inception) through December 31, 2015, IC Power did not incur any material expenses or recognize any
ii
Table of Contents
material assets or liabilities. Therefore, IC Power’s consolidated financial statements as of and for the year ended December 31, 2015 have not been restated to retroactively reflect the Reorganization, as there would be no material differences between such restated financial statements and ICP’s audited financial statements as of and for the year ended December 31, 2015. IC Power’s condensed consolidated interim financial statements as of and for the six months ended June 30, 2016 include comparative periods against the six months ended June 30, 2015, which have been adjusted to retroactively reflect the completion of the Reorganization and have been presented using the values from the condensed consolidated interim financial statements of ICP (similar to the pooling-of-interest method).
On January 22, 2016, we acquired two Guatemalan electricity distribution businesses (Distribuidora de Electricidad de Oriente, S.A., or DEORSA, and Distribuidora de Electricidad de Occidente, S.A., or DEOCSA), and two, smaller related businesses (Comercializadora Guatemalteca Mayorista de Electricidad, S.A., or Guatemel, and Redes Eléctricas de Centroamérica, S.A., or RECSA). In accordance with Staff Accounting Bulletin 80 (recodified with slight modifications in Staff Accounting Bulletin 103), we have included in this prospectus for each of DEORSA, DEOCSA, Guatemel and RECSA, unaudited condensed interim statements of financial position as of June 30, 2016 and December 31, 2015, unaudited condensed interim statements of profit or loss and other comprehensive income for the three and six months ended June 30, 2016 and 2015, the 21-day period from January 1, 2016 to January 21, 2016 and the 161-day period from January 22, 2016 to June 30, 2016 (the period in the first six months of 2016 from the date of acquisition), unaudited condensed interim statements of changes in shareholders’ equity for the six months ended June 30, 2016 and 2015, unaudited condensed interim statements of cash flows for the six months ended June 30, 2016 and 2015, and the notes thereto. The unaudited condensed interim financial statements referred to above have been prepared in accordance with International Accounting Standard No. 34 “Interim Financial Reporting.”
We have also included (1) for each of DEORSA and DEOCSA, the restated statements of financial position as of December 31, 2015, 2014, 2013 and January 1, 2013, and the related restated statements of profit or loss and other comprehensive income, changes in shareholders’ equity and cash flows for the years ended December 31, 2015, 2014 and 2013, and the notes thereto, (2) for Guatemel, the restated statements of financial position as of December 31, 2015, 2014 and 2013, and the related restated statements of profit or loss and other comprehensive income, changes in shareholders’ equity and cash flows for the years ended December 31, 2015, 2014 and 2013, and the notes thereto, and (3) for RECSA, the restated statements of financial position as of December 31, 2015, 2014 and 2013, and the related restated statements of profit or loss and other comprehensive income, changes in shareholders’ equity and cash flows for the years ended December 31, 2015, 2014 and 2013, and the notes thereto. The foregoing audited financial statements have been audited in accordance with U.S. Generally Accepted Auditing Standards, or U.S. GAAS, and prepared in accordance with IFRS as issued by the IASB.
Finally, this prospectus also includes the following financial statements of Generandes Perú S.A., or Generandes, prepared in accordance with IFRS as issued by the IASB: (1) unaudited consolidated statements of income, comprehensive income, changes in equity and cash flows for the years ended December 31, 2014 and 2013, unaudited consolidated statements of financial position as of December 31, 2014 and 2013, and the notes thereto; and (2) audited consolidated statements of income, comprehensive income, changes in equity and cash flows for the years ended December 31, 2013 and 2012, audited consolidated statements of financial position as of December 31, 2013, 2012 and 2011, and the notes thereto. Through our wholly-owned subsidiary, Inkia Holdings (Acter) Limited, or Acter Holdings, we owned a 39% interest in Generandes (resulting in a 21% indirect interest in Edegel S.A.A., or Edegel), until we sold our interest in Generandes in September 2014. Prior to the execution of our agreement to sell Generandes in April 2014, we accounted for Generandes under the equity method and reflected our proportional share in the net income of Generandes in share in income of associated companies. As a result of our divestment of Generandes, our proportionate share in Generandes’ results of operations is reflected in discontinued operations for all periods discussed in this prospectus. The financial statements of Generandes are included in this prospectus in accordance with Rule 3-09 of RegulationS-X, which does not require the inclusion of interim financial statements. Generandes’ financial statements have been audited in accordance with U.S. GAAS, except for the financial
iii
Table of Contents
statements as of and for the year ended December 31, 2014, which are not required by Rule 3-09 of Regulation S-X to be audited in accordance with U.S. GAAS or Public Company Accounting Oversight Board standards, as Generandes was an investee that would not be considered a “significant subsidiary” of ours as of and for the year ended December 31, 2014 under Rule 3-09 of Regulation S-X.
All references in this prospectus to (1) “U.S. Dollars,” “Dollars,” “$” or “USD” are to U.S. Dollars; (2) “Guatemalan Quetzales” are to the legal currency of the Republic of Guatemala, or Guatemala; (3) “NIS” or “New Israeli Shekels” are to the legal currency of the State of Israel, or Israel; (4) “S/” or “Peruvian Soles” are to the legal currency of the Republic of Peru, or Peru; (5) “Bs” and “Bolivianos” are to the legal currency of the Plurinational State of Bolivia, or Bolivia; (6) “COP” or “Colombian pesos” are to the legal currency of the Republic of Colombia, or Colombia; (7) “Chilean pesos” are to the legal currency of the Republic of Chile, or Chile; and (8) “S$” or “Singapore Dollars” are to the legal currency of the Republic of Singapore, or Singapore. We have made rounding adjustments to reach some of the figures included in this prospectus. Consequently, numerical figures shown as totals in some tables may not be arithmetic aggregations of the figures that precede them. Conversions included in this prospectus are solely illustrative, and you should not expect that any amounts in Guatemalan Quetzales, New Israeli Shekels, Peruvian Soles, Bolivianos, Colombian pesos, Chilean pesos, or Singapore Dollars actually represent a stated U.S. Dollar amount or that it could be converted into U.S. Dollars at the rate suggested.
NON-IFRS FINANCIAL INFORMATION
In this prospectus, we disclose non-IFRS financial measures, namely Adjusted EBITDA and Net Debt, each as defined in “Summary Consolidated Financial and Other Information.” Each of these measures is an important measure used by us, and our businesses, to assess financial performance. These measures are also used by our competitors, ratings agencies, financial analysts and investors to assess the financial performance of companies within our industry . We believe that the disclosure of Adjusted EBITDA and Net Debt provides transparent and useful information to investors and financial analysts in their review of our, or our subsidiaries’ and associated companies’, operating performance and in the comparison of such operating performance to the operating performance of other companies in the same industry or in other industries that have different capital structures, debt levels and/or income tax rates.
Certain information relating to our industry and market position used or referenced in this prospectus was obtained from internal analysis, surveys, market research, publicly available information and industry publications. Unless otherwise indicated, all sources for industry data are estimates or forecasts contained in or derived from internal or industry sources we believe to be reliable. Market and macroeconomic data used throughout this prospectus was obtained from independent industry publications and other publicly available information. Such data, as well as internal surveys, industry forecasts and market research, while believed to be reliable, have not been independently verified. In addition, in certain cases we have made statements in this prospectus regarding our industry and position in the industry based upon our experience and our own investigation of market conditions. We cannot assure you that any of these assumptions are accurate or correctly reflect our position in the industry, and none of our internal surveys or information has been verified by independent sources.
Market data are inherently predictive and speculative and are not necessarily reflective of actual market conditions. Such statistics are based on market research, which itself is based on sampling and subjective judgments by both the researchers and the respondents, including judgments about what types of products and transactions should be included in the relevant market. In addition, the value of comparisons of statistics for different markets is limited by many factors, including that (1) the markets are defined differently, (2) the underlying information was gathered by different methods and (3) different assumptions were applied in compiling the data. Accordingly, the market statistics included in this prospectus should be viewed with caution.
iv
Table of Contents
REPRESENTATION OF CAPACITY AND PRODUCTION FIGURES
Unless otherwise indicated, statistics provided throughout this prospectus with respect to power generation units are expressed in MW, in the case of the capacity of such power generation units, and in GWh, in the case of the electricity production of such power generation units. Unless otherwise indicated, our capacity figures provided in this prospectus reflect 100% of the capacity of all of our assets, regardless of our ownership interest in the entity that owns each such asset, and our consolidated generation figures provided in this prospectus reflect 100% of the generation figures of our subsidiaries and excludes the generation figures of our associated companies. Excluding the generation figures of AIE (as defined below), whose generation figures are only presented since the date of its acquisition, generation figures for assets acquired during a year are presented for the full year, regardless of the date within the year when the acquisition occurred. As a result, the generation figures provided in this prospectus of Colmito (as defined below), which we acquired in 2013, and ICPNH, Puerto Quetzal, Surpetroil and JPPC (each as defined below), which we acquired in 2014, reflect 100% of the generation figures of these companies for the year ended December 31, 2013 and 2014, respectively, regardless of our date of acquisition of such companies. With respect to capacity figures for the year ended December 31, 2014, and any prior periods thereto, our capacity figures exclude Edegel’s 1,540 MW of capacity, as a result of the sale of our indirect interest in Edegel in September 2014. For information on our ownership interest in each of the operating companies and investments within our generation portfolio, see “Business.”
ENFORCEMENT OF CIVIL LIABILITIES
IC Power is a private company limited by shares incorporated under the laws of Singapore. Some of our directors and officers and certain other persons named in this prospectus reside outside the United States. Additionally, a significant portion of IC Power’s assets and the assets of our directors and officers and certain other persons named in this prospectus are located outside the United States.
As a result, it may not be possible for U.S. investors to effect service of process within the United States upon these persons or to enforce against them or against us in the U.S. courts judgments predicated upon the civil liability provisions of the federal securities laws of the United States. There is doubt as to the enforceability in Singapore, either in original actions or in actions for enforcement of judgments of U.S. courts, of civil liabilities predicated on the U.S. federal securities laws.
CERTAIN TERMS USED IN THIS PROSPECTUS
We have prepared this prospectus using a number of conventions, which you should consider when reading the information contained herein. In this prospectus:
Our Operating Companies and Other Assets
| • | “Agua Clara” means IC Power DR Operations S.A.S., a Dominican Republic corporation; |
| • | “AIE” means Advanced Integrated Energy Ltd., an Israeli corporation; |
| • | “Amayo I” means Consorcio Eólico Amayo S.A., a Panamanian corporation; |
| • | “Amayo II” means Consorcio Eólico Amayo (Fase II) S.A., a Panamanian corporation; |
| • | “CDA” means Cerro del Águila S.A., a Peruvian corporation; |
| • | “Cenérgica” means Compañía de Energía de Centroamérica, S.A. de C.V. (Cenérgica), a Salvadorian corporation; |
| • | “Central Cardones” means Central Cardones S.A., a Chilean corporation; |
v
Table of Contents
| • | “CEPP” means Compañía de Electricidad de Puerto Plata S.A., a Dominican Republic corporation; |
| • | “COBEE” means Compañía Boliviana de Energía Eléctrica S.A., a Canadian corporation; |
| • | “Colmito” means Termoeléctrica Colmito S.A., a Chilean corporation; |
| • | “Corinto” means Empresa Energética Corinto Ltd., a Cayman Islands corporation; |
| • | “DEOCSA” means Distribuidora de Electricidad de Occidente, S.A., a Guatemalan corporation; |
| • | “DEORSA” means Distribuidora de Electricidad de Oriente, S.A., a Guatemalan corporation; |
| • | “Energuate” means DEOCSA and DEORSA, collectively. Energuate is not a legal entity, but serves as the trade name for IC Power’s Guatemalan distribution businesses DEORSA and DEOCSA; |
| • | “Guatemel” means Comercializadora Guatemalteca Mayorista de Electricidad, S.A., a Guatemalan corporation; |
| • | “IC Power” means the registrant, IC Power Pte. Ltd., a Singaporean corporation; |
| • | “ICP” means I.C. Power Asia Development Ltd. (formerly known as I.C. Power Ltd.), an Israeli corporation; |
| • | “ICPDH” means IC Power Distribution Holdings Pte. Ltd., a Singaporean corporation; |
| • | “ICPI” means IC Power Israel Ltd., an Israeli corporation; |
| • | “ICPNH” means IC Power Nicaragua Holdings, a Cayman Islands corporation, formerly known as AEI Nicaragua Holdings Ltd., or AEI Nicaragua; |
| • | “Inkia” means Inkia Energy Limited, a Bermudian corporation; |
| • | “JPPC” means Jamaica Private Power Company Ltd., a Jamaican corporation; |
| • | “Kallpa” means Kallpa Generación S.A., a Peruvian corporation; |
| • | “Kanan” means Kanan Overseas I. Inc., a Panamanian corporation; |
| • | “Nejapa” means Nejapa Power Company S.A., a Panamanian corporation; |
| • | “OIP” means Overseas Investments Peru S.A., a Peruvian corporation; |
| • | “OPC” means OPC Rotem Ltd., an Israeli corporation; |
| • | “Pedregal” means Pedregal Power Company S.de.R.L, a Panamanian corporation; |
| • | “Puerto Quetzal” means Puerto Quetzal Power LLC, a Delaware limited liability company; |
| • | “RECSA” means Redes Eléctricas de Centro América, S.A., a Guatemalan corporation; |
| • | “Samay I” means Samay I S.A., a Peruvian corporation; |
| • | “Surpetroil” means Surpetroil S.A.S., a Colombian corporation; and |
vi
Table of Contents
| • | “Tipitapa Power” means Tipitapa Power Company Ltd., a Cayman Islands corporation. |
Other Relevant Businesses
| • | “Acter Holdings” means Inkia Holdings (Acter) Limited, a Cayman Islands corporation through which we held our interest in Southern Cone; |
| • | “Edegel” means Edegel S.A.A., a Peruvian corporation; |
| • | “Generandes” means Generandes Perú S.A., a Peruvian corporation through which we held our indirect interest in Edegel; |
| • | “Globeleq” means Globeleq Americas Limited, which is the former name of Inkia Americas Limited, a Bermudian corporation; |
| • | “Hadera Paper” means Hadera Paper Ltd., an Israeli corporation; |
| • | “IC” means Israel Corporation Ltd., an Israeli corporation traded on the Tel Aviv Stock Exchange and Kenon’s and ICP’s former parent; |
| • | “Kenon” means Kenon Holdings Ltd., a Singapore company traded on each of the NYSE and the Tel Aviv Stock Exchange; and |
| • | “Southern Cone” means Southern Cone Power Perú S.A., a Peruvian corporation through which we held our interest in Generandes. |
Regulatory Bodies and Electricity System Coordination Entities
| • | “AMM” means Wholesale Market Administrator (Administrador del Mercado Mayorista), a private entity that coordinates the operation of the generation facilities and international interconnections and transmission lines that form the Guatemalan National Electricity System; |
| • | “ANA” means the National Water Authority of Peru(Autoridad Nacional del Agua); |
| • | “CND” means the National Dispatch Center of Panama (Centro Nacional de Despacho); |
| • | “CNDC” means the National Dispatch Committee of Bolivia (Comité Nacional de Despacho de Carga), a governmental entity responsible for planning and coordinating the operation of the generation, transmission and distribution systems that form the SIN in Bolivia; |
| • | “CNEE” means the National Electric Energy Commission of Guatemala (Comisión Nacional de Energía Eléctrica), which was established pursuant to the General Electricity Law of 1996, Decree 93-96, or General Electricity Law (Ley General de Electricidad) and acts as a technical arm of the MEM and which determines the transmission and distribution tariffs and is responsible for ensuring compliance with Guatemalan electricity laws; |
| • | “COES” means the Committee for the Economic Operation of the System (Comité de Operación Económica del Sistema Interconectado Nacional), an independent and private Peruvian entity composed of qualified participants undertaking activities in SEIN which is responsible for planning and coordinating the operation of the generation, transmission and distribution systems that form the SEIN; |
vii
Table of Contents
| • | “CREG” means the Commission for the Regulation of Energy and Gas in Colombia (Comisión de Regulación de Energía y Gas); |
| • | “EA” means the Electricity Authority in Israel, which was established pursuant to the Electricity Sector Law to regulate and supervise, among other things, the provision of essential electric services in Israel and electricity tariffs and, which replaced the previous regulator, Israel’s Public Utilities Authority (Electricity), or the PUAE, on January 1, 2016; |
| • | “Guatemalan National Electricity System” means the Guatemalan national electricity system, which comprises the set of premises, facilities, power plants, transmission lines, substations, distribution grids, electric equipment, loading centers, including all of the electric infrastructure used to supply electricity, whether or not interconnected, within which electric power is transmitted among the country’s several regions; |
| • | “IEC” means Israel Electric Corporation, a government-owned entity, which generates and supplies the majority of electricity in Israel, transmits all of the electricity in Israel, acts as the system operator of Israel’s electricity system, determines the dispatch order of generation units, grants interconnection surveys, and sets spot prices, among other roles; |
| • | “INDECOPI” means the National Institute for the Defense of Competition and Intellectual Property Protection (Instituto Nacional de Defensa de la Competencia y de la Protección de la Propiedad Intelectual), the Peruvian antitrust and intellectual property regulator; |
| • | “INDE” means the National Electrification Institute of Guatemala (Instituto Nacional de Electrificación), a state entity in charge of development of local power production pursuant to the INDE Statutory Law (Ley Orgánica del Instituto Nacional de Electrificación) and consequently in accordance with the General Electricity Law. This entity operates through its three divisions:Empresa de Generación de Energía Eléctrica (EGEE), which is responsible for power generation,Empresa de Transporte y Control de Energía Eléctrica (ETCEE), which is responsible for transmission andEmpresa de Comercialización de Energía (ECOE), which is responsible for trading; |
| • | “MEM” means the Ministry of Energy and Mines of Guatemala (Ministerio de Energía y Minas), which is responsible for enforcing the General Electricity Law and the related regulations and for the coordination of policies between CNEE and the AMM and overseeing energy and mining sectors in Guatemala; |
| • | “MINEM” means the Ministry of Energy and Mines of Peru (Ministerio de Energía y Minas), which is responsible for, among other things, setting national energy policy, proposing and adopting laws and regulations to supervise the energy sector and granting concessions and authorizations to entities who wish to operate in power generation, transmission or distribution in Peru; |
| • | “OC” means the Coordinating Body (Organismo Coordinador), a Dominican governmental authority whose function is to plan and coordinate the operations of the generation, transmission and distribution systems that form the national interconnected electrical system of the Dominican Republic (Sistema Eléctrico Nacional Interconectado); |
| • | “OEFA” means the Organization of Supervision and Environmental Assessment (Organismo de Evaluacióny Fiscalización Ambiental), the Peruvian governmental body responsible for the power plants’ compliance with environmental regulations; |
| • | “OSINERGMIN” means the Supervisory Body of Investment in Energy and Mining (Organismo Supervisor de la Inversión en Energía y Minería), a Peruvian governmental authority which is |
viii
Table of Contents
responsible for, among other things, ensuring that companies comply with the rules and regulations applicable to the energy industry in Peru and for setting the tariffs to be charged to regulated customers; |
| • | “PUAE” means Israel’s Public Utilities Authority (Electricity), which, prior to January 1, 2016, regulated and supervised, among other things, the provision of essential electric services in Israel and electricity tariffs. The PUAE was replaced by the EA on January 1, 2016; |
| • | “Salvadorian CNE” means the National Energy Commission of El Salvador (Comisión Nacional de Energía), a governmental entity which is responsible for proposing and adopting policies and regulations for the Salvadorian energy sector; |
| • | “SEIN” means the national interconnected electrical system of Peru (Sistema Eléctrico Interconectado Nacional); |
| • | “SENACE” means the National Service for Environmental Certification of Sustainable Investments of Peru (Servicio Nacional de Certificación Ambiental para las Inversiones Sostenibles), a Peruvian specialized technical governmental agency in charge of reviewing and approving detailed environmental impact assessments related to projects involving activities, works or services that may cause significant impacts to the environment; |
| • | “SIC” means the national interconnected electrical system of Chile (Sistema Interconectado Central); |
| • | “SIEPAC” means Central American Electrical Interconnection System (Sistema de Interconexión Eléctrica de los Países de América Central) that connects the transmission systems of Nicaragua, Panama, Costa Rica, Honduras, El Salvador and Guatemala through a 230 KW transmission line; |
| • | “SIGET” means the General Superintendency of Electricity and Telecommunications (Superintendencia General de Electricidad y Telecomunicaciones), a Salvadorian entity which is responsible for ensuring that companies comply with the rules and regulations passed by the National Energy Commission of El Salvador (Comisión Nacional de Energía), or Salvadorian CNE, as well as other laws that are applicable to the energy industry in El Salvador; |
| • | “SIN” means a national system formed by generation plants, the interconnected grid, regional transmission lines, distribution lines and consumer loads (Sistema Interconectado Nacional) in each of Bolivia, Colombia and Guatemala; |
| • | “SING” means the Interconnected System of Norte Grande of Chile (Sistema Interconectado Norte Grande); and |
| • | “UPME” means the Mining and Energy Planning Unit (Unidad de Planeación Minero Energética), a special administrative unit of the Ministry of Mines and Energy of Colombia. |
Industry and Other Terms
| • | “availability factor” means the percentage of hours a power generation unit is available for generation of electricity in the relevant period, whether or not the unit is actually dispatched or used for generating power; |
| • | “Btu” means British thermal units; |
| • | “CAGR” means compound annual growth rate; |
ix
Table of Contents
| • | “COD” means the commercial operation date of a development project; |
| • | “distribution” refers to the transfer of electricity from the transmission lines at grid supply points and its delivery to consumers at lower voltages through a distribution system; |
| • | “EPC” means engineering, procurement and construction; |
| • | “firm capacity” means the amount of energy available for production that, pursuant to applicable regulations, must be guaranteed to be available at a given time for injection to a certain power grid; |
| • | “greenfield projects” means projects constructed on unused land with no need to demolish or remodel existing structures; |
| • | “GWh” means gigawatt hours (one GWh is equal to 1,000 MWh); |
| • | “Heat rate” means the number of Btu of energy contained in the fuel required to produce a kWh of energy (Btu/kWh) for thermal plants; |
| • | “HFO” means heavy fuel oil; |
| • | “hydro” means hydroelectric; |
| • | “installed capacity” means the intended full-load sustained output of energy that a generation unit is designed to produce (also referred to as name-plate capacity); |
| • | “IPP” means independent power producer, excluding co-generators and generators for self-consumption; |
| • | “kV” means kilovolt; |
| • | “KWh” means kilowatt hour; |
| • | “MMBtu” means one million metric Btus; |
| • | “MW” means megawatts (one MW is equal to 1,000 Kilowatts or KW); |
| • | “MWh” means megawatt hour; |
| • | “OEM” means original equipment manufacturer; |
| • | “our capacity” or “our installed capacity” means, with respect to each generation asset, 100% of the capacity of such asset, regardless of our ownership interest in the entity that owns such asset; |
| • | “our proportionate capacity” means, with respect to each generation asset, the proportionate capacity of such asset, as determined by our ownership interest in the entity that owns such asset; |
| • | “PPA” means power purchase agreement; |
| • | “transmission” refers to the bulk transfer of electricity from generating facilities to the distribution system at load center station in which the electricity is stabilized by means of the transmission grid; |
| • | “VAD” means the Value Added by Distribution (Valor Agregado de Distribución) charge that is set by the CNEE; |
x
Table of Contents
| • | “VNR” means new replacement value (Valor Nuevo de Reemplazo); |
| • | “VNR of the transmission system” means the estimated cost of replacing a “model” transmission system, including an estimated return on capital; and |
| • | “weighted average availability” refers to the number of hours that a generation facility is available to produce electricity divided by the total number of hours in a year. |
The following tables set forth the historical period-end, average, high and low rates calculated using the daily closing exchange rates, as reported by Bloomberg, for the U.S. Dollar expressed in Peruvian Sol per one U.S. Dollar for the periods indicated:
Peruvian Sol/U.S. Dollar | ||||||||||||||||
Period End(1) | Average(2) | High | Low | |||||||||||||
Year | ||||||||||||||||
2011 | 2.696 | 2.753 | 2.830 | 2.690 | ||||||||||||
2012 | 2.551 | 2.638 | 2.710 | 2.547 | ||||||||||||
2013 | 2.796 | 2.703 | 2.814 | 2.537 | ||||||||||||
2014 | 2.979 | 2.839 | 2.993 | 2.764 | ||||||||||||
2015 | 3.414 | 3.185 | 3.414 | 2.975 | ||||||||||||
| 1. | Represents the closing exchange rate on the last business day of the applicable period. |
| 2. | Represents the average of the closing exchange rates on the last business day of each month during the relevant one-year periods. |
Peruvian Sol/ | ||||||||
High | Low | |||||||
Month | ||||||||
April 2016 | 3.393 | 3.243 | ||||||
May 2016 | 3.377 | 3.304 | ||||||
June 2016 | 3.373 | 3.283 | ||||||
July 2016 | 3.370 | 3.278 | ||||||
August 2016 | 3.398 | 3.302 | ||||||
September 2016 | 3.407 | 3.344 | ||||||
October 2016 (through October 26, 2016) | 3.409 | 3.351 | ||||||
xi
Table of Contents
This summary highlights information presented in greater detail elsewhere in this prospectus and does not contain all of the information that you should consider in making your investment decision. Before deciding whether to invest in our ordinary shares, you should carefully read this entire prospectus, especially the risks of investing in our ordinary shares discussed under the heading “Risk Factors.”
Overview
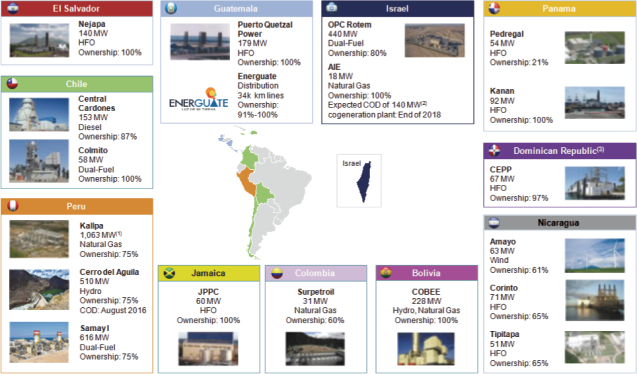
We are a leading owner, developer and operator of power generation facilities located in key energy markets in Latin America, the Caribbean and Israel. Additionally, in January 2016, we completed our acquisition of Energuate (comprised of two electricity distribution companies in Guatemala (DEORSA and DEOCSA)), marking our initial entry in the electricity distribution sector.
The power generation companies within our portfolio utilize a range of energy sources, including natural gas, hydroelectric, heavy fuel oil, or HFO, diesel and wind. We principally focus our generation operations in Latin American markets, which typically have higher growth rates of gross domestic product, or GDP, and lower overall and per capita energy consumption, as compared with more developed markets. We believe that economic growth in Latin American markets will drive increases in overall and per capita energy consumption and therefore require significant additional investments in power generation assets in those markets. As of June 30, 2016, our installed capacity and proportionate capacity were 3,384 MW and 2,731 MW, respectively, including Kanan’s 92 MW thermal generation project in Panama, which reached COD in April 2016, and Samay I’s 616 MW cold-reserve thermoelectric project in Peru, which reached COD in May 2016.
We increased our installed capacity by an additional 510 MW, to 3,894 MW (3,114 MW on a proportionate basis), in August 2016 upon the completion of the three generating units of Cerro del Águila S.A.’s, or CDA’s, 510 MW hydroelectric plant located in Peru. In addition, in August 2015, we acquired Advanced Integrated Energy, or AIE, which currently operates an 18 MW plant in Israel and holds a conditional license for the construction of a cogeneration power station in Israel. AIE commenced construction of the plant in June 2016, and the AIE plant, which is expected to have a capacity of 140 MW, is expected to reach its commercial operation date, or COD, by the end of 2018.
ICP’s activities started in 2007 when Inkia Energy Limited, or Inkia, a subsidiary of Israel Corporation Ltd., or IC, an Israeli conglomerate, acquired Globeleq Americas Limited’s, or Globeleq’s, power generation assets in Latin America, which represented 549 MW of installed capacity. In 2010, IC formed ICP and contributed both Inkia and O.P.C. Rotem Ltd., or OPC, to ICP. In January 2015, IC transferred ICP to Kenon (NYSE: KEN; TASE: KEN), our sole shareholder, in connection with IC’s spin-off of Kenon. In March 2016, as more fully described in “Corporate Formation and Reorganization,” Kenon effected an internal reorganization pursuant to which it transferred all of its equity interests in ICP to us.
Between 2007 and June 30, 2016, we invested approximately $3.0 billion in the acquisition, development and expansion of our power generation assets. Of this amount, 80% represented investments in greenfield development (including investments made in CDA, Samay I and Kanan) and 20% represented acquisitions. We have financed our greenfield development using a combination of cash on hand, debt financing and investments by minority shareholders at the asset level, and have financed the acquisitions of our power generation assets using cash on hand. As of June 30, 2016, of the 2,835 MW that we have added to our installed capacity since Inkia’s formation, 72% was derived from greenfield development projects, consisting primarily of our construction of Kallpa Generación S.A.’s, or Kallpa’s, combined cycle plant, Peru’s largest power generation facility, the construction of OPC’s plant, which became Israel’s first independent power producer, or IPP, and the construction of the Samay I project, a cold-reserve thermoelectric plant in Peru. In the same period, we have
1
Table of Contents
acquired businesses with an aggregate installed capacity of 801 MW in Israel and five countries in Latin America. As of the end of August 2016, we had derived 76% of our installed capacity growth since 2007 from greenfield development efforts.
By successfully pursuing growth opportunities, primarily through contracted greenfield development projects in existing markets and acquisitions of anchor investments in new markets, we have expanded our regional presence, diversified our generation portfolio through the addition of various facilities which use a range of energy sources, and significantly increased our cash flows. In 2015, our Adjusted EBITDA was $326 million, as compared to $41 million in 2008, representing a compound annual growth rate, or CAGR, of 34% during this period. Adjusted EBITDA is a non-IFRS measure. For a reconciliation of our net income to our Adjusted EBITDA, see “Summary Consolidated Financial and OtherInformation—Key Financial and Other Operating Information—IC Power and ICP.”
We typically enter into long-term U.S. Dollar-linked power purchase agreements, or PPAs, to sell capacity and/or energy to customers that we believe have strong credit profiles, such as large local distribution companies or non-regulated customers that are subsidiaries of large multinational corporations. As of December 31, 2015, the weighted average remaining life of our PPAs was 10 years (including the remaining life of the PPAs for CDA, Samay I and Kanan). In the year ended December 31, 2015, 89% of our aggregate energy sales (in gigawatt hours, or GWh) were made pursuant to long-term PPAs. We believe this practice limits our exposure to fluctuations in energy spot market rates and helps us to generate strong and predictable margins and cash flows. We seek to enter into PPAs at prices that are equal to, or higher than, the prevailing spot market rates in the countries in which we operate. Additionally, the majority of our PPAs are indexed to the underlying fuel cost of the related long-term supply agreements. Such indexing generally limits our exposure to fuel price fluctuations, including the effect of such fluctuations on our margins. We believe that the stable and predictable margins and cash flows which generally result from such PPAs helps us to successfully secure significant project and bank/bond financing, with no or limited recourse, from a diverse international lender base during the construction of our greenfield projects, which helps us to successfully develop our project pipeline.
Our power generation portfolio is comprised of facilities located in key power generation markets in Latin America, the Caribbean and Israel, using a range of energy sources. The following charts set forth the relative percentages of our generation business’ installed capacity by energy source as of June 30, 2016, and our generation business’ installed capacity by energy source, as adjusted to reflect the recent completion of the CDA project:
Installed Capacity by Energy Source (as of June 30, 2016)1 | Installed Capacity by Energy Source (September 30, 2016)1 | |
|
| |
| 3,384 MW2 | 3,894 MW2,3,4 |

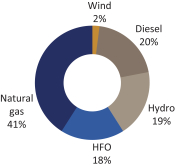
| 1. | Our dual-fueled assets, COBEE, OPC, Samay I and Termoeléctrica Colmito S.A., or Colmito, are categorized as hydroelectric, natural gas, diesel and natural gas, respectively. |
2
Table of Contents
| 2. | Includes 616 MW attributable to Samay I, which reached COD in May 2016. In July 2016, all of the plant’s units were declared unavailable to the system due to damage to the shafts in three of the plant’s four units. We have developed a plan to repair the units, and on August 28, 2016, Kenon announced that we expected all four units to be operational within six months. |
| 3. | Includes 510 MW attributable to CDA, which plant’s three generating units reached COD in August 2016. |
| 4. | Does not include the 140 MW cogeneration power station which AIE began constructing in June 2016 as a greenfield project. Construction of this plant commenced in June 2016 and COD is expected by the end of 2018. |
The following charts set forth the relative percentage of our generation business’ installed capacity by segment as of June 30, 2016, and our generation business’ installed capacity by segment, as adjusted to reflect the recent completion of the CDA project:
Installed Capacity by Segment (as of June 30, 2016) | Installed Capacity by Segment (September 30, 2016) | |
|
| |
| 3,384 MW1 | 3,894 MW1,2,3 |

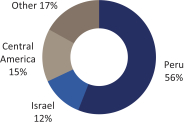
| 1. | Includes 616 MW attributable to Samay I, which reached COD in May 2016. In July 2016, all of the plant’s units were declared unavailable to the system due to damage to the shafts in three of the plant’s four units. We have developed a plan to repair the units, and on August 28, 2016, Kenon announced that we expected all four units to be operational within six months. |
| 2. | Includes 510 MW attributable to CDA, which plant’s three generating units reached COD in August 2016. |
| 3. | Does not include the 140 MW cogeneration power station which AIE began constructing in June 2016 as a greenfield project. Construction of this plant commenced in June 2016 and COD is expected by the end of 2018. |
We are a leader in our largest market, Peru, one of the fastest growing economies in Latin America, with an average GDP growth rate of approximately 4.8% per year from 2010 through 2015 according to the International Monetary Fund, a mature regulatory framework, and a well-run power system. As of and for the year ended December 31, 2015, our operating company in Peru, Kallpa, had an installed capacity of 1,063 MW, representing 11% of Peru’s installed capacity, and generated 12% of the gross energy generated (in GWh) in Peru. Kallpa represented 81% of our net income, 47% of our Adjusted EBITDA, and 40% of our installed capacity as of and for the year ended December 31, 2015. In May 2016, Samay I (our cold-reserve thermoelectric project) reached COD, providing an additional 616 MW of installed capacity to the Peruvian market. In August 2016, we provided an additional 510 MW of installed capacity to the Peruvian market with the completion of the three generating units of CDA. As a result of the completion of this project, our total installed capacity in Peru is 2,189 MW, making us the principal power producer in Peru in terms of installed capacity. Although energy and capacity prices in Peru have recently experienced downward pressure due to oversupply of capacity in the market, we expect demand and spot prices to increase in the medium term as a result of large mining and industrial projects in Peru and sustained growth in underlying demand.
We also operate OPC, the first IPP in Israel, which, in 2013 following decades of state control, opened its electricity market to private power producers. As a result, the electricity market in Israel is still in the early stages of development. Israel’s energy consumption levels have also increased in recent years and are expected to continue to increase in the near-term. As of and for the year ended December 31, 2015, OPC had an installed
3
Table of Contents
capacity of 440 MW, representing approximately 3% of Israel’s installed capacity and 19% of the installed capacity of IPPs, and generated 6% of the gross energy generated (in GWh) in Israel. As of and for the year ended December 31, 2015, OPC represented 38% of our net income, 24% of our Adjusted EBITDA, and 17% of our installed capacity. We believe that OPC’s plant provides us with a strategic advantage as an early entrant to the Israeli electricity market. Additionally, given Israel’s growing economy and the advanced age of its existing state-owned power generation facilities, we believe OPC provides us with the know-how and visibility to pursue additional power project opportunities in Israel, such as the acquisition of AIE, which opportunities may become increasingly available to private sector participants such as us.
In addition to our attractive positions in Peru and Israel, we have also developed an attractive footprint in several markets in Latin America, including Chile and Colombia, and are in the process of opening a development office in Mexico. Additionally, in January 2016, we completed our acquisition of Energuate (comprised of two electricity distribution companies in Guatemala (DEORSA and DEOCSA)), and two smaller, related companies (Guatemel and RECSA). As of December 31, 2015, Energuate provides electric service for approximately 1.6 million regulated customers in Guatemala (representing approximately 55% of Guatemala’s regulated distribution customers in 2015) and distributes energy across approximately 100,000 km2in Guatemala, covering approximately 12 million inhabitants. Energuate operates approximately 34,000 km of distribution lines within Guatemala (representing approximately 70% of Guatemala’s distribution lines) as of December 31, 2015, and holds the non-exclusive right to distribute electricity within its service area until 2048. In the years ended December 31, 2015 and 2014, Energuate sold 2,305 GWh and 2,164 GWh of energy, respectively. We believe that our current platform, coupled with our agile and disciplined decision-making process, enables us to take advantage of opportunities as they arise.
4
Table of Contents
Our Portfolio of Generation Assets
The following table sets forth summary operational information regarding each of our operating companies and associated company in our generation business as of June 30, 2016, according to segment1:
Segment | Country | Entity | Ownership | Fuel | Installed | Proportionate | Type of Asset | Weighted | LTM (GWh)3 | |||||||||||||||||||
Peru | Peru | Kallpa | 75 | % | Natural Gas | 1,063 | 4 | 797 | Greenfield4 | 7 | 6,309 | |||||||||||||||||
| Peru | Samay I | 75 | % | Diesel and Natural Gas | 616 | 462 | Greenfield | 12 | — | |||||||||||||||||||
Israel | Israel | OPC | 80 | % | Natural Gas and Diesel | 440 | 352 | Greenfield | 7 | 5 | 3,929 | |||||||||||||||||
| Israel | AIE | 100 | % | Natural Gas6 | 18 | 18 | Acquired | 15 | 697 | |||||||||||||||||||
Central America | Nicaragua | Corinto | 65 | % | HFO | 71 | 46 | Acquired | 3 | 429 | ||||||||||||||||||
| Nicaragua | Tipitapa Power | 65 | % | HFO | 51 | 33 | Acquired | 3 | 367 | |||||||||||||||||||
| Nicaragua | Amayo I | 61 | % | Wind | 40 | 24 | Acquired | 9 | 159 | |||||||||||||||||||
| Nicaragua | Amayo II | 61 | % | Wind | 23 | 14 | Acquired | 3 | 94 | |||||||||||||||||||
| Guatemala | Puerto Quetzal | 100 | % | HFO | 179 | 179 | Acquired | 1 | 515 | |||||||||||||||||||
| El Salvador | Nejapa | 100 | % | HFO | 140 | 140 | Original Inkia Asset | 1 | 801 | |||||||||||||||||||
| Panama | Kanan | 100 | % | HFO | 92 | 92 | Greenfield | 4 | 269 | |||||||||||||||||||
Other | Bolivia | COBEE | 100 | % | Hydroelectric, Natural Gas | 228 | 228 | Original Inkia Asset | 1 | 277 | ||||||||||||||||||
| Chile | Central Cardones | 87 | % | Diesel | 153 | 133 | Acquired | — | — | |||||||||||||||||||
| Chile | Colmito | 100 | % | Natural Gas and Diesel | 58 | 58 | Acquired | 3 | 263 | |||||||||||||||||||
| Dominican Republic | CEPP | 97 | % | HFO | 67 | 65 | Original Inkia Asset | — | 8 | |||||||||||||||||||
| Jamaica | JPPC | 100 | % | HFO | 60 | 60 | Original Inkia Asset | 2 | 382 | |||||||||||||||||||
| Colombia | Surpetroil | 60 | % | Natural Gas | 31 | 19 | Acquired / Greenfield8 | 1 | 52 | |||||||||||||||||||
| Panama | Pedregal9 | 21 | %10 | HFO | 54 | 11 | Original Inkia Asset | 2 | 298 | |||||||||||||||||||
| Total Operating Capacity | 3,384 | 2,731 | ||||||||||||||||||||||||||
|
|
|
| |||||||||||||||||||||||||
| 1. | Reflects 100% of the capacity of each of our assets, regardless of our ownership interest in the entity that owns each such asset. |
| 2. | Reflects the proportionate capacity of each of our assets, as determined by our ownership interest in the entity that owns each such asset. |
| 3. | Reflects energy sales under PPAs for the 12 months ended June 30, 2016. |
| 4. | Kallpa’s plants were developed as projects constructed on unused land with no need to demolish or remodel existing structures, or greenfield projects, in four different stages between 2005 and 2012, resulting in 870 MW of installed capacity. In addition, Kallpa acquired Las Flores’ power plant in 2014, adding 193 MW to Kallpa’s capacity. |
| 5. | Reflects the weighted average remaining life of OPC’s PPAs with end users based on OPC’s firm capacity. The PPA between OPC and IEC, the government-owned electricity generation, transmission and distribution company in Israel, or the IEC PPA, which extends for |
5
Table of Contents
| an 18-year term and covers OPC’s entire firm capacity, provides OPC with the option to allocate and sell the generated electricity of the power station directly to end users. OPC has exercised this option and sells all of its energy and capacity directly to 20 end users, as of June 30, 2016. For further information on the IEC PPA, see “Business—Regulatory, Environmental and Compliance Matters—Regulation of the Israeli Electricity Sector.” |
| 6. | AIE also holds a conditional license for the construction of a cogeneration power station in Israel. This station will be developed as a greenfield project (at an expected cost of $250 million, including the acquisition price of AIE), based upon a plant with 140 MW of capacity. Construction commenced in June 2016 and COD is expected by the end of 2018. |
| 7. | Reflects energy sales under PPAs since we acquired AIE in August 2015. |
| 8. | When initially acquired by us, Surpetroil had a capacity of 15 MW. As of June 30, 2016, Surpetroil’s capacity has increased to 31 MW as a result of our completion of various greenfield projects. |
| 9. | Although Pedregal is located in Central America, it is a minority investment. Therefore, from an income statement perspective, it is not part of the Central America segment and Pedregal is only reflected in our share in income of associated companies. |
| 10. | Although we have a non-controlling interest in Pedregal, we were party to a management services agreement, which designated us as the administrator responsible for the day-to-day management of Pedregal until the agreement expired in October 2016. We expect to renew the management services agreement in November 2016. However, we may be unable to do so. |
The following table sets forth summary operational information regarding our generation asset in advanced stages of construction as of June 30, 2016.
Country | Entity | Ownership | Fuel | Installed Capacity (MW)1 | Proportionate Capacity2 | Expected | Percentage Developed | Expected Cost | Amount Invested | |||||||||||||||||||||
Peru | CDA | 75% | Hydroelectric | 510 | 383 | August 2016 |
| 98%—Overall completion 99%—Dam construction 100%—Tunnel drilling |
| $959 million | $907 million | 3 | ||||||||||||||||||
|
|
|
|
| ||||||||||||||||||||||||||
Total Capacity of Asset in Advanced Stages of Construction | 510 | 383 | $959 million | $907 million | ||||||||||||||||||||||||||
|
|
|
|
| ||||||||||||||||||||||||||
| 1. | Reflects 100% of the expected capacity, regardless of our ownership interest in the entity that owns the asset. |
| 2. | Reflects the proportionate capacity, as determined by our ownership interest in the entity that owns the asset. |
| 3. | Includes $8 million of intercompany expenses related to services rendered by Kallpa pursuant to a management agreement. |
In April and May 2016, Kanan’s 92 MW thermal generation project and Samay I’s 616 MW cold-reserve thermoelectric project reached their COD, at an aggregate cost of $87 million and $379 million (excluding $26 million of diesel fuel inventory), respectively. In July 2016, all four of Samay I’s units were declared unavailable to the system due to damage to the shafts in three of the plant’s four units. We have developed a plan to repair the units, and on August 28, 2016, Kenon announced that we expected all four units to be operational within six months. We intend to seek coverage for the costs of the outage, including repair costs and loss of profits, as appropriate, from the EPC contractor, equipment manufacturer and/or the insurance coverage (subject to deductibles), and believe we have a reasonable basis to recover these costs, including for loss of profits. For further information on Samay I’s unavailability, see “Business—Generation Segment—Peru— SamayI.” For further information on Samay I’s insurance, see “Business—Insurance.” In August 2016, the three generating units of CDA’s 510 MW run-of-the-river hydroelectric plant in Peru reached their COD, at an estimated cost of approximately $959 million.
6
Table of Contents
As illustrated below, between 2008 and 2015, we have increased our installed capacity at a CAGR of 20%, and our installed capacity has grown 46% during 2016 as a result of the recentcompletion of the Kanan, Samay I and CDA projects. As of the end of August 2016, we had derived 76% of our installed capacity growth since 2007 from our greenfield development efforts.
Installed Capacity (MW)1
(as of June 30, 2016)2
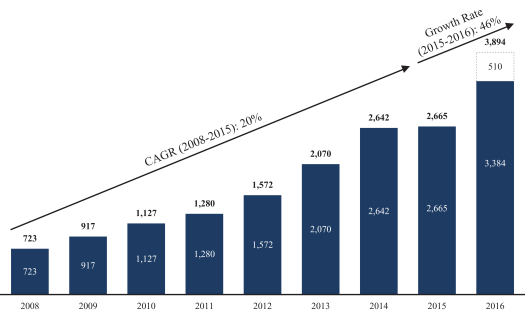
| 1. | Figures for 2008 and 2009 reflect Inkia’s capacity. |
| 2. | Since June 30, 2016, 510 MW have come on line as a result of the completion of the development of CDA’s three generating units. |
The following table sets forth certain consolidated financial and operational data as of the dates and for the periods set forth below:
Six Months | Year Ended December 31, | |||||||||||||||||||
2016 | 2015 | 2015 | 2014 | 2013 | ||||||||||||||||
| ($ millions, except as otherwise indicated) | ||||||||||||||||||||
Sales from continuing operations | $ | 881 | $ | 655 | $ | 1,289 | $ | 1,372 | $ | 873 | ||||||||||
Net income from continuing operations | 16 | 35 | 49 | 128 | 46 | |||||||||||||||
Net income | 16 | 39 | 53 | 256 | 74 | |||||||||||||||
Adjusted EBITDA1 | 188 | 175 | 326 | 395 | 247 | |||||||||||||||
Installed capacity at end of period (in MW)2 | 3,384 | 2,642 | 2,665 | 2,642 | 2,070 | |||||||||||||||
Proportionate capacity at end of period (in MW)3 | 2,731 | 2,149 | 2,170 | 2,108 | 1,608 | |||||||||||||||
| 1. | Adjusted EBITDA is a non-IFRS measure. For a reconciliation of our net income to our Adjusted EBITDA, see “Summary Consolidated Financial and Other Information.” |
| 2. | Reflects 100% of the capacity of each of our assets, regardless of our ownership interest in the entity that owns each such asset. |
| 3. | Reflects the proportionate capacity of each of our assets, as determined by our ownership interest in the entity that owns each such asset. |
7
Table of Contents
Potential Projects
We are constantly monitoring and considering development and acquisition opportunities and are currently assessing projects in Israel and various Latin American countries, such as Argentina, Chile, Colombia, Panama, Peru, the Dominican Republic, Mexico, Nicaragua, El Salvador and Puerto Rico relating to generation or distribution projects or companies. For example, we are starting development of Agua Clara, a 50 MW wind project in the Dominican Republic, which is expected to commence commercial operations in early 2018. With respect to our potential generation projects, such projects range in size from small-scale power facilities (e.g., less than 40 MW) to large-scale power facilities (e.g., approximately 750 MW) and utilize different fuels and technologies, including natural gas, hydroelectric, wind, solar and stranded gas. In some instances, we have acquired land, secured necessary licenses or rights, including temporary concessions and water rights, commissioned studies, made bids, or initiated similar actions, in connection with our assessment of the viability of the relevant project.
In addition to the Latin American opportunities that we are currently considering, we also monitor opportunities in other markets. For example, in August 2015, we acquired 100% of the shares of AIE from Hadera Paper Ltd., or Hadera Paper, for NIS 60 million (approximately $16 million). AIE currently operates an 18 MW plant and also holds a conditional license for the construction of a cogeneration power station in Israel. AIE commenced construction of the plant in June 2016, and the AIE plant is expected to reach its COD by the end of 2018. We expect that the total cost of completing the AIE plant (including the consideration for the acquisition of AIE) will be approximately $250 million.
8
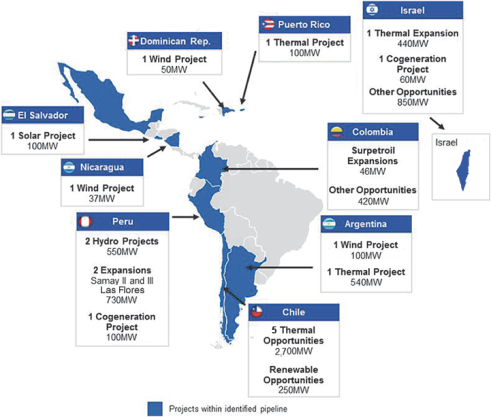
Table of Contents
Set forth below is a map summarizing certain of the markets and projects that we have identified for potential expansion. Development projects imply a high degree of uncertainty, and there is no guarantee that we will proceed with these projects. Ultimately, notwithstanding the number of opportunities that we may consider over the long- and short-terms, we will only pursue those projects that we believe will generate attractive, risk-adjusted returns over the long-term and which we believe we have the management capacity to build and operate. The summary below sets forth projects developed and owned by us, as well as projects owned by third parties, as well as projects that we may be able to acquire by direct negotiations or through tender processes. This summary is not exhaustive, is only provided to show projects which we are evaluating, and should not serve as an indication of any expectation regarding any final outcome. Numerous conditions will need to be met before we can develop or acquire any of the projects listed below:
Competitive Strengths
Strong track record inproject development, with a disciplined approach to capital structure—We leverage our core competencies—project identification, evaluation, development, construction and operation—to develop power generation facilities using various technologies in attractive markets that typically have relatively high GDP growth rates and relatively low levels of per capita energy consumption. For example, in 2012, we completed our third expansion of Kallpa’s gas-powered plant, which is the largest power generation facility in Peru in terms of capacity, by converting it into a combined cycle facility and thereby adding an additional 292 MW to the facility’s capacity. This expansion was completed on time and below budget. Additionally, in 2013, OPC became the first IPP in Israel when we completed the construction of its 440 MW combined cycle power plant. In April, May and August 2016, we also completed the development of Kanan’s 92 MW thermal
9
Table of Contents
generation project in Panama, the development of Samay I’s 616 MW cold-reserve thermoelectric project in Peru and the development of the three generating units of CDA’s 510 MW run-of-the-river hydroelectric plant in Peru, respectively.
Our projects have been developed with a disciplined capital structure, which reflects our commitment to develop projects in accordance with three key fundamental principles. First, we endeavor to construct projects by entering into turnkey engineering, procurement and construction, or EPC, agreements that define the total project cost and transfer most of the risks of construction delays and cost overruns to our EPC contractors. For example, we constructed Samay I and CDA pursuant to EPC contracts. Second, we seek to secure a revenue stream prior to the construction of our plants by sourcing and entering into long-term PPAs, which provide our development projects with predictable projected margins and cash flows, before construction has commenced. Finally, we leverage our EPC contracts and PPAs to secure long-term project financing agreements which are generally stand-alone, secured, project-specific, and with no or limited recourse. Over the course of our history, we have secured different types of financings (e.g., leases, local and international bonds, syndicated loans, etc.) during times of changing financial markets and in connection with our construction of various projects using a range of energy sources.
Long-term PPAs and supply agreements that limit exposure to market fluctuations—Most of our generation subsidiaries typically enter into long-term PPAs, which generally limits their exposure to fluctuations in energy spot market rates, generates stable and predictable margins, and helps to create stability and predictability in our cash flows. In the year ended December 31, 2015, we made 89% of our aggregate energy sales (in GWh) pursuant to long-term PPAs. As of December 31, 2015, the weighted average remaining life of our PPAs was 10 years (including the remaining life of the PPAs for CDA, Samay I and Kanan) and we have historically sought, and will continue to seek, to renew our long-term PPAs as they expire.
As of December 31, 2015, the majority of our PPAs were indexed to the price of the corresponding power plant’s operating fuel prices in U.S. Dollars (for plants that use fuel), and many of our PPAs provided for payment in, or were linked to, the U.S. Dollar, thereby mitigating such plant’s exposure to fuel price and exchange rate fluctuations. Additionally, the counterparties to our long-term PPAs are typically large local distribution companies or non-regulated customers, including subsidiaries of large multi-national corporations, which we believe have strong credit profiles, mitigating the risk of customer default. Some of our major non-regulated customers within Peru and Israel include Southern Peru Copper Corporation, Sociedad Minera Cerro Verde S.A.A. (a subsidiary of Freeport-McMoRan), Compañía Minera Antapaccay S.A. (a subsidiary of Glencore Xstrata) and Oil Refineries Limited, as well as governments and quasi-governmental entities.
As our power facilities utilize and are dependent upon natural gas, hydroelectric, HFO, diesel, wind, or a combination of these energy sources, we seek to enter into long-term supply and transportation agreements to acquire the necessary fuel for our facilities. For example, Kallpa, Samay I and OPC, which own and operate our largest plants, are party to long-term supply agreements, including natural gas supply agreements and transportation services agreements, that are material to their operations.
Attractive footprint in high growth markets—Currently, our principal focus is on Latin American markets, which typically have higher growth rates of GDP and lower overall and per capita energy consumption, as compared with more developed markets. We expect continued growth in these key markets, providing us with the opportunity to generate attractive, risk-adjusted returns through additional investments in power generation assets in those countries.
We are a leader, and the principal power producer, in our largest market, Peru, one of the fastest growing economies in Latin America, with an average GDP growth of approximately 4.8% per year from 2010 through 2015, according to the International Monetary Fund, a mature regulatory framework, and a well-run power system. As of and for the year ended December 31, 2015, our operating company in Peru, Kallpa, had an
10
Table of Contents
installed capacity of 1,063 MW, representing 11% of Peru’s installed capacity, and generated 12% of the gross energy generated (in GWh) in Peru. Kallpa represented 81% of our net income, 47% of our Adjusted EBITDA, and 40% of our installed capacity as of and for the year ended December 31, 2015. In May 2016, Samay I (our cold-reserve thermoelectric project) reached its COD on schedule, providing an additional 616 MW of installed capacity to the Peruvian market. In August 2016, we provided an additional 510 MW of installed capacity to the Peruvian market with the completion of the three generating units of CDA. As a result of the completion of this project, our total installed capacity in Peru is 2,189 MW, making us the principal power producer in Peru in terms of installed capacity. Although energy and capacity prices in Peru have recently experienced downward pressure due to oversupply of capacity in the market, we expect demand and spot prices to increase in the medium term as a result of large mining and industrial projects in Peru and sustained growth in underlying demand.
We also operate OPC, the first IPP in Israel, which, in 2013 following decades of state control, opened its electricity market to private power producers. As a result, the electricity market in Israel is still in the early stages of development. Israel’s energy consumption levels have also increased in recent years and are expected to continue to increase in the near-term. As of and for the year ended December 31, 2015, OPC had an installed capacity of 440 MW, representing approximately 3% of Israel’s installed capacity and 19% of the installed capacity of IPPs, and generated 6% of the gross energy generated (in GWh) in Israel. As of and for the year ended December 31, 2015, OPC represented 38% of our net income, 24% of our Adjusted EBITDA, and 17% of our installed capacity. We believe that OPC’s plant provides us with a strategic advantage as an early entrant to the Israeli electricity market. Additionally, given Israel’s growing economy and the advanced age of its existing state-owned power generation facilities, we believe OPC provides us with the know-how and visibility to pursue additional power project opportunities in Israel, such as the acquisition of AIE, which opportunities may become increasingly available to private sector participants such as us.
In addition to our attractive positions in Peru and Israel, we have also developed an attractive footprint in several markets in Latin America, including Chile and Colombia, and are in the process of opening a development office in Mexico. We believe that our current platform, coupled with our agile and disciplined decision-making process, enables us to take advantage of opportunities as they arise.
Established and disciplined track record inacquiring generation assets—We have acquired numerous generation assets since 2007, resulting in the expansion of our operations by 801 MW (707 MW on a proportionate basis) in Israel and five countries in Latin America. We believe our recognition as a regional generator and developer with a relatively strong balance sheet, and our ability to act quickly with respect to acquisitions has complemented our development capabilities by allowing us to strategically source and execute acquisitions. Furthermore, our positioning as a mid-sized regional market participant allows us to manage projects that are too small for large companies, as well as projects that are too large for small companies. Such acquisitions facilitate our entry into new markets and allow us to act as consolidators in the countries in which we already operate. Our acquisition of Central Cardones S.A., or Central Cardones, in 2011, for example, provided us with an initial footprint in Chile, a dynamic and important power market, and facilitated our acquisition of Colmito in October 2013. Similarly, our acquisition of certain Nicaraguan assets in 2014, representing 185 MW of installed capacity (117 MW on a proportionate basis) provided us with an entry into the Nicaraguan market and diversified our portfolio with operational wind generation assets. Additionally, in August 2015, following completion of our OPC facility, we acquired 100% of the shares of AIE, which currently operates an 18 MW plant and holds a conditional license for the construction of a cogeneration power station in Israel, a new and growing private electricity generation market.
Platform for growth in electricity distribution sector through recent acquisition of Energuate—In January 2016, we further expanded and diversified our portfolio by completing our acquisition of Energuate, which operates distribution companies in Guatemala, a country with a historically stable electricity sector framework. Our purchase of Energuate marks our initial entry into electricity distribution and we believe this purchase will provide us with a platform to further expand our distribution portfolio. As of December 31, 2015,
11
Table of Contents
Energuate provides electric service to approximately 1.6 million regulated customers in Guatemala (representing approximately 55% of Guatemala’s regulated distribution customers in 2015) and distributes energy to a service area of approximately 100,000 km2 in Guatemala, covering primarily rural areas with a population of approximately 12 million inhabitants. Energuate, the largest distribution company in Central America (according to population served), operates approximately 34,000 km of distribution lines within Guatemala (representing approximately 70% of Guatemala’s distribution lines) as of December 31, 2015. We expect that Energuate’s sizeable distribution base and limited exposure to fluctuations in the cost of electricity (both as a result of Energuate’s entry into PPAs and a compensation framework anchored on predefined distribution tariffs) will provide us with predictable cash flows from Energuate’s operations, which we believe will contribute significantly to our further expansion within the distribution industry. We have also created a new corporate platform with highly experienced executives from the Latin American distribution sector to manage our distribution business. We believe that this will provide us with the required organizational support to operate Energuate, as well as a strong platform for future expansion in the distribution business in the region.
Driving operational excellence through partnerships with leading OEMs and reliance on efficient technologies—We seek to optimize our power generation capacity by using leading technologies (e.g., turbines manufactured by Siemens, General Electric, Mitsubishi and Andritz) and entering into long-term service agreements with leading, multi-national original equipment manufacturers, or OEMs. Our technologies and long-term partnerships enable our power generation assets to perform more efficiently and at relatively high levels of reliability. Additionally, our experienced staff is committed to increasing our operating performance and ensuring the disciplined maintenance of our power generation assets. We believe that our generation plants’ weighted average availability rate of 95% for the year ended December 31, 2015 was the result of our optimization efforts and our commitment to improving our operating efficiency and performance.
Additionally, our acquisition or construction of power generation assets that use efficient technologies (e.g., the conversion of Kallpa’s facility into a combined cycle operation in 2012) places our generation assets competitively in the dispatch merit order in certain of the countries in which we operate. For example, Kallpa’s facility, a base load plant and combined cycle gas turbine, is among the first power plants to be dispatched, due to its efficiency and competitiveness in the dispatch stack. Similarly, CDA’s hydroelectric power plant, which plant’s three generating units reached COD in August 2016, is also among the first power plants to be dispatched in Peru. Having a portfolio which includes efficient power plants with lower production costs allows us to potentially earn higher margins than companies that utilize certain other competing technologies in their plants and are therefore less competitive in the dispatch merit order.
Experienced management team with strong local presence—Our management team has extensive experience in the power generation business. Our executive officers have an average of approximately 20 years of experience in the power generation industry, and significant portions of our core management team have been working together in international large power generation companies since 1996. We believe that this overall level of experience contributes to our ability to effectively manage our existing operating companies and to identify, evaluate and integrate high-quality growth opportunities within and outside Latin America. Furthermore, our hands-on management team utilizes a lean decision-making process, which allows us to quickly take advantage of strategic acquisitions and potential developments and opportunities as they materialize. Our managers are compensated, in part, on the basis of our financial performance, which incentivizes them to continue to improve our operating results. Additionally, our local management teams provide in-depth market knowledge and power industry experience. These teams consist primarily of local executives with significant experience in the local energy industry and with local government regulators. We believe that the market-specific experience of our local management provides us with insight into the local regulatory, political and business environment in each of the countries in which we operate.
12
Table of Contents
In addition, in connection with our acquisition of Energuate in January 2016, we recruited an experienced management team for our distribution business’ operations. This management team consists of officers, some of whom were previously employed at Energuate, who work directly with our management team to oversee and manage the Energuate business with us, as well as local executives who manage Energuate’s day-to-day operations. Additionally, this management team has extensive experience managing large distribution companies in various countries throughout Central and South America, including Guatemala.
Business Strategies
Continue to successfully develop greenfield assets in attractive markets—One of our core competencies is identifying, evaluating, constructing, and operating greenfield development projects in our target markets. We will continue to seek to develop power generation assets in countries with relatively stable, growing economies, low levels of per capita energy consumption or developing private energy generation markets. We also seek to develop assets that can be expanded through further investment, or as additional fuels become available, which provides us with the ability to further develop an asset and increase its installed capacity in connection with market trends, industry developments, or changing fuel availability.
We place particular focus on our ability to complete the development of our greenfield projects on time and within budget and will continue to use extensive project planning and contracting mechanisms to minimize our development risk. For example, in connection with our development activities, we typically enter into lump-sum, turnkey EPC contracts to minimize our construction risks and mitigate construction cost overruns, while also entering into long-term PPAs to generate stable and predictable margins and cash flows; we believe this combination facilitates our access to long-term construction financing. Engaging in such practices has allowed us to successfully complete several thermal generation projects, including the conversion of the Kallpa facility, which added an additional 292 MW to the facility’s capacity, and our development of the Samay I 616 MW cold-reserve thermoelectric project. Additionally, our first hydroelectric development, CDA’s plant, is expected to be fully operational at a cost of $1.9 million per MW, making CDA’s plant among the most efficiently constructed hydroelectric facilities in Latin America in terms of cost per MW.
Optimize portfolio to maximize returns while minimizing risk—We regularly assess our portfolio of operating companies and employ disciplined portfolio management principles to optimize our operations in light of changing industry dynamics in a particular country or region, create financing flexibility and address specific risk management and exposure concerns. Our strategy is to optimize the composition of our portfolio by focusing on profitable developments and acquisitions within key power generation markets typically in Latin America, the Caribbean and Israel.
For example, prior to our 2014 acquisition of the Las Flores facility, a 193 MW thermal power generation plant (representing 145 MW on a proportionate basis), Las Flores had operated intermittently due to the lack of a long-term regular supply of natural gas. The Kallpa facility, which is located near the Las Flores plant, had an excess supply of natural gas. We identified these and other potential synergies and, since our acquisition of the Las Flores facility, have been able to significantly improve the operations and generation activities of Las Flores’ plant, while also maximizing the use of the Kallpa facility’s natural gas supply and transportation capabilities. Our acquisition of Puerto Quetzal Power L.L.C., or Puerto Quetzal, serves as another example of our portfolio optimization efforts. In addition to providing us with an attractive entry point into the Guatemalan market, one of the barges we acquired from Puerto Quetzal was redeployed to Panama to allow Kanan to take advantage of a short-term supply shortfall in the Panamanian power market.
Additionally, in 2014, we divested our 21% indirect equity interest in Edegel, one of Peru’s largest power generation companies. While the Edegel investment was a strong cash flow generator which helped to fund the initial stages of our growth, we opted to sell this investment in order to redeploy the proceeds from such
13
Table of Contents
sale into projects in which we have a majority control and which we believe will have a better risk and return profile for our shareholders over the long-term. In addition, while continuing to maintain a majority interest in our key operating businesses, we may sell further minority interests in some of these assets, so as to raise additional capital to re-invest in the business and to further optimize our portfolio to maximize returns to our shareholders.
Complement organic development with dynamic and disciplined acquisitions—We seek to invest in countries and/or assets where we can significantly increase our cash flows and optimize our operations. Therefore, in addition to greenfield developments, we also seek to enter into and/or expand our presence in attractive markets by acquiring controlling interests in operating assets to anchor our geographical expansion. For example, we acquired power generation assets in Nicaragua, Guatemala and Colombia, which represent our initial entry into these markets, through our acquisitions of (1) IC Power Nicaragua Holdings, or ICPNH, which provided us with controlling interests in two HFO and two wind energy Nicaraguan generation companies, (2) Puerto Quetzal, which provided us with three power barges with HFO generators (one of which was transferred to our subsidiary Kanan to allow it to take advantage of supply shortfalls in the Panamanian power market), and (3) Surpetroil S.A.S., or Surpetroil, a company that utilizes stranded natural gas reserves in its production of energy. Chile and Colombia represent important parts of our growth strategy. We continue to seek expansion in Chile and Colombia, and we expect that our assets in these countries will provide us with the initial footprint from which to carry out our organic development strategy in these two markets. Additionally, consistent with our strategy of maintaining controlling interests in our power generation assets, in May 2014, we increased our equity ownership in Jamaica Private Power Company Ltd., or JPPC, (which has an aggregate 60 MW of installed capacity in two HFO generation units in Jamaica) from 16% to 100%, and in January 2015, we increased our equity ownership in Nejapa Power Company L.L.C., or Nejapa, (which has 140 MW of installed capacity at an HFO power generation facility in El Salvador) from 71% to 100%. We will continue to seek to leverage our acquisitions of assets in new markets and/or of assets utilizing a broad range of technologies (which may include new fuels, such as solar power) to generate attractive risk-adjusted returns.
Continue to expand and optimize our operations within the electricity distribution sector—Our recent acquisition of Energuate represents our initial entry into the electricity distribution business. We intend to further expand our portfolio and diversify our revenue streams by applying our disciplined acquisition principles as we seek to purchase additional distribution assets in countries where we believe we can significantly increase our cash flows, optimize our operations, and leverage the experience gained from our acquisition of Energuate. Additionally, we will endeavor to optimize Energuate’s existing distribution operations by targeting Energuate’s electricity losses (both commercial and technical) in the near- to medium-term. Energuate’s management intends to reduce commercial losses (e.g., losses from illegal connections, fraud and billing errors) through improving customer billing practices, increasing targeted inspections and meter replacements, implementing a communication program with local communities and modernizing Energuate’s facilities to reduce tampering, especially in areas where electricity theft has been more prevalent, and reduce technical losses (i.e., losses occurring in the ordinary course of electricity distribution) by investing in the modernization of Energuate’s transmission grid and distribution system. To this end, we intend to invest approximately $30 million in Energuate’s capital expenditures in 2016, and expect that our capital expenditures relating to Energuate will increase in the coming years.
Continue to enter into long-term PPAs with credit-worthy counterparties—In the year ended December 31, 2015, we made 89% of our aggregate energy sales (in GWh) pursuant to long-term PPAs, many of which are denominated in, or linked to, the U.S. Dollar. Our strategy of generating strong and predictable cash flows from long-term PPAs has enabled us to successfully secure financing for our greenfield projects from a diverse international lender base to fund our development and construction projects. Our generation companies seek to enter into long-term capacity PPAs prior to committing to a new project so as to predict expected cash flows and margins of a particular asset, which facilitates its financing. For example, CDA, which plant’s three generating units reached COD in August 2016, has sourced and entered into three long-term PPAs beginning in
14
Table of Contents
2016, 2018 and 2022 for a significant portion of its expected capacity, contracting most of the estimated firm energy it expects to generate between 2018 and 2027. As of June 30, 2016, the weighted average remaining life of CDA’s PPAs based on firm capacity was 12 years. The expected cash flows associated with such PPAs contributed to CDA’s attractive credit profile, which supported the financing of the CDA plant’s development. Similarly, prior to our construction of the Samay I project, the Peruvian government guaranteed capacity payments for 600 MW for a 20-year period at rates above regulated capacity rates, which also provided support for the financing of the plant’s development. We also continue to seek to enter into, or renew, long-term PPAs for our currently operating generation assets. For example, Kallpa entered into two PPAs with Southern Peru Copper Corporation, a 10-year PPA for 120 MW and a 10-year PPA for 70 to 85 MW, both starting in 2017. In addition to significantly improving our access to financing with no or limited recourse, our strategy of contracting our assets’ energy and capacity significantly reduces our exposure to changes in spot prices.
Risk Factors
Investing in our ordinary shares involves risks. You should carefully consider the risks described in “Risk Factors” before making a decision to invest in our ordinary shares. If any of these risks actually occurs, our business, financial condition, results of operations or liquidity could be materially adversely affected. In such case, the trading price of our ordinary shares would likely decline, and you may lose all or part of your investment. The following is a summary of some of the principal risks we face:
| • | risks related to our capital commitments and/or intentions with respect to certain of our operating businesses, including the sufficiency of our liquidity and capital resources in the near-term; |
| • | risks related to the expansion, construction, development, or acquisition, as applicable, of power generation or distribution companies or assets; |
| • | risks related to the expected timing, completion, and terms of certain acquisitions, including the assignment of certain supply and/or transmission agreements; |
| • | an inability to source, enter into and/or renew long-term PPAs and EPC agreements and the amounts to be paid under such agreements; |
| • | an inability to renew and/or enter into supply, transmission and/or distribution agreements on competitive terms, as such agreements expire; |
| • | risks related to expected trends in the countries in which each of our businesses operate, including trends relating to the growth of a particular market, supply and demand imbalances, electrification levels, investments in power generation facilities, government subsidies, and the availability and prices of natural gas and other fuels; |
| • | an inability to respond appropriately, or effectively index our sales prices or expenses, to volatility in commodity prices; |
| • | an inability to secure raw materials, including fuel, to operate our power generation plants; |
| • | risks related to the impact of the decline of crude oil prices on our sales or Adjusted EBITDA; |
| • | risks related to expected or potential changes in tariffs, including distribution tariffs, which may impact our revenues, cash flow, or Adjusted EBITDA; |
15
Table of Contents
| • | risks related to variations in weather, the occurrence of certain hydrological conditions in respect of our hydropower and thermal plants, as well as hurricanes and other storms and disasters, and low levels of wind for our wind facilities; |
| • | risks related to competition from other companies serving our end markets; |
| • | risks related to our counterparties, including risks related to our counterparties’ financial credit, performance risks; |
| • | increased governmental regulation of our business, industry or the business and industries of our customers and suppliers; |
| • | new types of taxes, increases or decreases in taxes, our tax position, or the tax position of our businesses; |
| • | economic, social and political unrest in the countries in which we operate; |
| • | the potential expropriation or nationalization of our operating assets by foreign governments, with or without adequate compensation; and |
| • | risks related to our ability to distribute dividends to our shareholders. |
Company History, Structure and Reorganization
IC Power was incorporated under the laws of Singapore in May 2015 under the name IC Power Pte. Ltd., pursuant to the Companies Act, Chapter 50 of Singapore, or the Singapore Companies Act, to serve as the holding company of ICP and its businesses. Until the completion of this offering, we will remain a wholly-owned subsidiary of Kenon (NYSE: KEN; TASE: KEN), which was formed by IC in 2014 to serve as the holding company of certain interests, including ICP, received by Kenon in connection with IC’s January 2015 spin-off of Kenon to IC’s shareholders.
In March 2016, as more fully described in “Corporate Formation and Reorganization,” Kenon, our current sole shareholder effected an internal reorganization pursuant to which it transferred all of its equity interests in ICP to us. Additionally, prior to the completion of this offering, we will be converted into a Singapore public company limited by shares and renamed .
Our Singapore company registration number is 201511865D.
16
Table of Contents
The graphics below illustrate our corporate structure prior to, and immediately after, the completion of the offering.
| Prior to the Completion of theOffering | After the Completion ofthe Offering | |
|
|

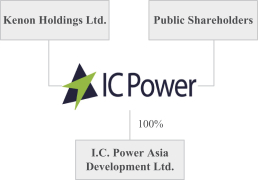
Our registered address is 80 Raffles Place #26-01, UOB Plaza, Singapore 048624. Our principal executive office is located at 1 Temasek Avenue #36-01, Millenia Tower, Singapore 039192 and our telephone number at this address is +65 6351 1780.
17
Table of Contents
Issuer | IC Power Pte. Ltd., a holding company that holds the outstanding equity interests of ICP which, in turn, holds power generation and distribution companies in Latin America, the Caribbean and Israel. Prior to the completion of this offering, we will be converted into a Singapore public company limited by shares and renamed . |
Underwriters | Merrill Lynch, Pierce, Fenner & Smith Incorporated, Credit Suisse Securities (USA) LLC, Goldman, Sachs & Co., UBS Securities LLC, HSBC Securities (USA) Inc., Scotia Capital (USA) Inc., and Credicorp Capital Sociedad Agente de Bolsa S.A. |
Public offering price | We currently expect that the initial public offering price will be between $ and $ per ordinary share. |
Ordinary shares being offered | ordinary shares. |
Ordinary shares outstanding before this offering | ordinary shares. |
Ordinary shares outstanding immediately after this offering | ordinary shares ( ordinary shares if the underwriters exercise in full their option to purchase additional ordinary shares from us). |
Underwriters’ purchase option | We have granted an option to the underwriters, exercisable for 30 days after the date of this prospectus, to purchase up to an additional ordinary shares, at the initial public offering price listed on the cover page of this prospectus, less the underwriting discount. |
Listing | We are in the process of applying for the listing of our ordinary shares on the NYSE under the ticker symbol “ICP.” |
Use of proceeds | Assuming an initial public offering price of $ per share, which is the midpoint of the offering price range set forth on the cover page of this prospectus, we estimate that the net proceeds to us from the sale of our ordinary shares in this offering will be approximately $ million (or $ million if the underwriters exercise in full their option to purchase additional ordinary shares from us), after deducting estimated underwriting discounts and commissions and offering expenses. |
| We intend to use the net proceeds that we receive in this offering, along with readily available cash: |
| • | to develop greenfield projects; |
| • | to acquire companies or assets in the electricity sector (e.g., generation, transmission or distribution companies or assets); |
18
Table of Contents
| • | to prepay in full all obligations under our $145 million note payable to Kenon, which note was issued to Kenon as part of the consideration for Kenon’s contribution of ICP to us in connection with the Reorganization, will bear interest at a rate of LIBOR + 6% per annum from March 17, 2016, and will mature, unless otherwise prepaid, on December 31, 2018; |
| • | to prepay in full all obligations under our $100 million loan agreement with Credit Suisse and the Bank of Nova Scotia, or the Overseas Facility, which facility must be prepaid in the event of our initial public offering. The Overseas Facility bears interest ranging from 90-day LIBOR plus 5.00% to 90-day LIBOR plus 6.50%. For further information on the Overseas Facility, see “Management’s Discussion And Analysis of Financial Condition and Results of Operations—Recent Developments—Overseas Facility”; and |
| • | for general corporate purposes. |
| Except as specified above, we are unable to estimate the amount of the net proceeds from this offering that will be used for any of the purposes described above. Accordingly, we will have broad discretion in the way that we use the net proceeds of this offering. For further information on our use of proceeds, see “Use of Proceeds.” For further information on the greenfield development and acquisition opportunities under current assessment and the status of our development efforts, see “Business—Potential Projects.” |
Payment and settlement | Our ordinary shares are expected to be delivered against payment on , 2016. |
Voting rights | We will have only one class of issued and outstanding ordinary shares, which will have identical rights in all respects (including voting rights) and will rank equally with one another. For further information on our ordinary shares, see “Description of Share Capital.” |
Dividend policy | From time to time, our board of directors may approve the payment of dividends to our shareholders. The declaration and payment of future dividends, if any, will be at the discretion of our board of directors and will depend upon many factors, including our profits, our financial position, earnings, cash flows, capital requirements, level of indebtedness, the progress relating to our strategy plan, statutory and contractual restrictions applicable to the payment of dividends, the conditions prevailing in the market, our overall financial condition, available distributable reserves, and additional factors our board of directors deems appropriate. For further information on our dividend policy, see “Dividend Policy” and for further information on the risks |
19
Table of Contents
related to our dividend policy and our ability to declare dividends to our shareholders, see “Risk Factors—Risks Related to Our OrdinaryShares and this Offering—As a recently-incorporated company, we will not have significant distributable profits to pay dividends.” |
Lock-up agreements | Subject to certain exceptions, we, our executive officers and directors and Kenon, our controlling shareholder, collectively holding all of our ordinary shares outstanding immediately prior to this offering have entered into lock-up agreements with Merrill Lynch, Pierce, Fenner & Smith Incorporated and Credit Suisse Securities (USA) LLC for a period of 180 days after the date of this prospectus. For further information on these lock-up agreements, see “Underwriting—No Sales of Similar Securities.” |
Tax considerations | For a description of certain U.S. federal income tax considerations of the acquisition, ownership and disposition of our ordinary shares, see “Taxation—U.S. Federal Income Tax Considerations.” |
| For a summary of Singapore income tax, goods and services tax and stamp duty considerations relevant to the acquisition, ownership and disposition of our ordinary shares, see “Taxation—Singapore Tax Considerations.” |
Risk factors | See “Risk Factors” included elsewhere in this prospectus for a discussion of factors you should carefully consider before deciding to invest in our ordinary shares. |
We base the number of ordinary shares outstanding following the completion of this offering on the number of ordinary shares outstanding as of the date of this prospectus.
20
Table of Contents
SUMMARY CONSOLIDATED FINANCIAL AND OTHER INFORMATION
The following tables present our summary consolidated financial information and operating statistics. The summary consolidated financial information as of June 30, 2016 and for the six months ended June 30, 2016 and 2015 have been derived from our unaudited condensed consolidated interim financial statements and the notes thereto included elsewhere in this prospectus, in each case including all adjustments that we consider necessary for a fair presentation of the financial position and the results of operations for these periods. The summary consolidated financial information as of December 31, 2015 and 2014 and for the years ended December 31, 2015, 2014 and 2013 have been derived from ICP’s audited consolidated financial statements and the notes thereto included elsewhere in this prospectus, and the consolidated financial information as of December 31, 2013, 2012 and 2011 and for the years ended December 31, 2012 and 2011 have been derived from ICP’s consolidated financial statements and the notes thereto, which are not included in this prospectus. Neither our nor ICP’s historical results for any prior period are necessarily indicative of results expected in any future period. Additionally, the summary consolidated interim financial and operating information as of and for the six months ended June 30, 2016 are not necessarily indicative of the results expected as of and for the year ended December 31, 2016 or for any period subsequent to June 30, 2016.
We also present the summary financial information and operating statistics of DEORSA. DEOCSA, Guatemel and RECSA, each of which we acquired on January 22, 2016. The summary financial information for the six months ended June 30, 2016, the one-hundred and sixty day period from January 22, 2016 to June 30, 2016 (the period in the first half of 2016 from the date of acquisition), the twenty-one day period from January 1, 2016 to January 21, 2016, and the six months ended June 30, 2015 have been derived from the unaudited condensed interim financial statements and the notes thereto included elsewhere in this prospectus for each of DEORSA, DEOCSA, Guatemel and RECSA. The summary condensed financial information for the year ended December 31, 2015 has been derived from the audited financial statements and the notes thereto included elsewhere in this prospectus for each of DEORSA, DEOCSA, Guatemel and RECSA. DEORSA’s, DEOCSA’s, Guatemel’s and RECSA’s historical results for any prior period are not necessarily indicative of results expected in any future period. Additionally, the summary condensed interim financial and operating information for the six months ended June 30, 2016 are not necessarily indicative of the results expected for the year ended December 31, 2016 or for any period subsequent to June 30, 2016.
You should read the summary consolidated financial and operating information set forth below in conjunction with the sections entitled “Unaudited Pro Forma Condensed Consolidated Financial Information,” “Use of Proceeds,” “Capitalization,” “Selected Consolidated Financial and Other Information,” and “Management’s Discussion and Analysis of Financial Condition and Results of Operations” as well as in conjunction with our unaudited condensed consolidated interim financial statements, our audited financial statements, ICP’s audited consolidated financial statements, the condensed interim financial statements of each of DEORSA, DEOCSA, Guatemel and RECSA, the audited financial statements of each of DEORSA, DEOCSA, Guatemel and RECSA, and the notes thereto included elsewhere in this prospectus. Except as otherwise indicated, or unless the context requires otherwise, references to “the Company,” “we,” “us” and “our” prior to the date of the Reorganization shall refer to ICP and its businesses, and as of the date of the Reorganization and thereafter, to IC Power and its subsidiaries, including ICP.
21
Table of Contents
The following table presents our summary consolidated statement of income information for the periods presented:
IC Power Pte. Ltd. | I.C. Power Asia Development Ltd. (formerly known as I.C. Power Ltd.) | |||||||||||||||||||||||||||
Six Months Ended June 30, | Year Ended December 31, | |||||||||||||||||||||||||||
2016 | 2015 | 2015 | 20141 | 20131 | 20121 | 2011 | ||||||||||||||||||||||
| ($ millions) | ||||||||||||||||||||||||||||
Summary Consolidated Statements of Income | ||||||||||||||||||||||||||||
Continuing Operations Information | ||||||||||||||||||||||||||||
Sales | $ | 881 | $ | 655 | $ | 1,289 | $ | 1,372 | $ | 873 | $ | 576 | $ | 526 | ||||||||||||||
Cost of sales (excluding depreciation and amortization) | (644 | ) | (458 | ) | (909 | ) | (936 | ) | (594 | ) | (396 | ) | (377 | ) | ||||||||||||||
Depreciation and amortization | (72 | ) | (54 | ) | (111 | ) | (101 | ) | (72 | ) | (51 | ) | (38 | ) | ||||||||||||||
|
|
|
|
|
|
|
|
|
|
|
|
|
| |||||||||||||||
Gross profit | 165 | 143 | 269 | 335 | 207 | 129 | 111 | |||||||||||||||||||||
|
|
|
|
|
|
|
|
|
|
|
|
|
| |||||||||||||||
General, selling and administrative expenses | (60 | ) | (31 | ) | (71 | ) | (69 | ) | (41 | ) | (37 | ) | (32 | ) | ||||||||||||||
Asset write-off | — | — | — | (35 | ) | — | — | — | ||||||||||||||||||||
Gain on bargain purchase | — | — | — | 68 | 1 | — | 24 | |||||||||||||||||||||
Measurement to fair value of pre-existing share | — | — | — | 3 | — | — | — | |||||||||||||||||||||
Other expenses | (1 | ) | (1 | ) | (6 | ) | (11 | ) | — | — | — | |||||||||||||||||
Other income | 7 | 2 | 11 | 17 | 5 | 7 | — | |||||||||||||||||||||
|
|
|
|
|
|
|
|
|
|
|
|
|
| |||||||||||||||
Operating income | 111 | 113 | 203 | 308 | 172 | 99 | 103 | |||||||||||||||||||||
|
|
|
|
|
|
|
|
|
|
|
|
|
| |||||||||||||||
Financing expenses, net | 74 | 53 | 104 | 119 | 80 | 44 | 36 | |||||||||||||||||||||
|
|
|
|
|
|
|
|
|
|
|
|
|
| |||||||||||||||
Share in income of associated companies | — | — | — | 2 | 2 | 2 | 2 | |||||||||||||||||||||
|
|
|
|
|
|
|
|
|
|
|
|
|
| |||||||||||||||
Income before taxes from continuing operations | 37 | 60 | 99 | 191 | 94 | 57 | 69 | |||||||||||||||||||||
Taxes on income | (21 | ) | (25 | ) | (50 | ) | (63 | ) | (48 | ) | (18 | ) | (16 | ) | ||||||||||||||
|
|
|
|
|
|
|
|
|
|
|
|
|
| |||||||||||||||
Net income from continuing operations | 16 | 35 | 49 | 128 | 46 | 39 | 53 | |||||||||||||||||||||
|
|
|
|
|
|
|
|
|
|
|
|
|
| |||||||||||||||
Net income from discontinued operations, net of tax | — | 4 | 4 | 2 | 128 | 3 | 28 | 4 | 29 | 4 | 20 | 4 | ||||||||||||||||
|
|
|
|
|
|
|
|
|
|
|
|
|
| |||||||||||||||
Net income for the period | $ | 16 | $ | 39 | $ | 53 | $ | 256 | $ | 74 | $ | 68 | $ | 73 | ||||||||||||||
|
|
|
|
|
|
|
|
|
|
|
|
|
| |||||||||||||||
Attributable to: | ||||||||||||||||||||||||||||
Equity holders of IC Power or ICP, as indicated | 7 | 30 | 36 | 227 | 61 | 58 | 60 | |||||||||||||||||||||
Non-controlling interest | 9 | 9 | 17 | 29 | 13 | 10 | 13 | |||||||||||||||||||||
Weighted average number of shares (in millions of shares) of IC Power5 | 0.56 | 0.56 | 0.56 | 0.56 | 0.56 | 0.56 | 0.56 | |||||||||||||||||||||
Earnings per share of IC Power (in USD)5 | 11.6 | 52.9 | 64.4 | 405.9 | 109.1 | 103.7 | 107.3 | |||||||||||||||||||||
Dividends per share of IC Power (in USD)5 | — | — | — | 66.73 | — | — | — | |||||||||||||||||||||
| 1. | During 2015, an immaterial error was identified with respect to the deferred tax calculation relating to the effect of foreign exchange rate on non-monetary assets in previous years in ICP. ICP’s financial information for 2014, 2013 and 2012 has been revised to correct this immaterial error. |
| 2. | Reflects dividends received from Edegel post-equity method accounting. |
| 3. | Reflects (a) the results of Acter Holdings, which consists of our $18 million proportionate share of Generandes’ results of operations during the period and (b) $110 million net gain on sale of discontinued operations as a result of the sale of our interest in Generandes, through which we held our indirect interest in Edegel. |
| 4. | Reflects the results of Acter Holdings, which primarily consists of our proportionate share of Edegel’s results for the period. |
22
Table of Contents
| 5. | In light of the change in IC Power’s capital as a result of the Reorganization, and given the non-comparability of IC Power’s and ICP’s capital structures for each of the periods above, earnings and dividends per share information is based upon IC Power’s capital post-Reorganization for each of the periods above. |
The following table presents our summary consolidated statement of financial position information as of the dates presented:
| IC Power Pte. Ltd. | I.C. Power Asia Development Ltd. (formerly known as I.C. Power Ltd.) | |||||||||||||||||||||||
| As of June 30, | As of December 31, | |||||||||||||||||||||||
2016 | 2015 | 20141 | 20131 | 20121 | 2011 | |||||||||||||||||||
| ($ millions) | ||||||||||||||||||||||||
Summary Consolidated Statement of Financial Position Information | ||||||||||||||||||||||||
Cash and cash equivalents | $ | 234 | $ | 360 | $ | 583 | $ | 517 | $ | 184 | $ | 221 | ||||||||||||
Short-term deposits and restricted cash | 85 | 302 | 208 | 9 | 81 | 171 | ||||||||||||||||||
Trade receivables | 254 | 123 | 181 | 138 | 96 | 75 | ||||||||||||||||||
Total current assets | 742 | 884 | 1,089 | 724 | 416 | 536 | ||||||||||||||||||
Investments in associated companies | 9 | 9 | 10 | 286 | 312 | 283 | ||||||||||||||||||
Property, plant and equipment | 3,500 | 2,972 | 2,515 | 1,875 | 1,583 | 1,247 | ||||||||||||||||||
Total assets | 4,729 | 4,091 | 3,842 | 3,031 | 2,459 | 2,169 | ||||||||||||||||||
Short-term credit from banks and others | 339 | 353 | 162 | 244 | 80 | 81 | ||||||||||||||||||
Trade payables | 281 | 144 | 144 | 92 | 42 | 57 | ||||||||||||||||||
Total current liabilities | 792 | 650 | 452 | 451 | 172 | 217 | ||||||||||||||||||
Long-term loans from banks and others | 1,765 | 1,556 | 1,499 | 788 | 670 | 487 | ||||||||||||||||||
Loans and capital notes from parent | 225 | — | — | 242 | 237 | 219 | ||||||||||||||||||
Debentures | 839 | 656 | 687 | 637 | 516 | 525 | ||||||||||||||||||
Total liabilities | 3,913 | 3,065 | 2,829 | 2,237 | 1,709 | 1,547 | ||||||||||||||||||
Share capital and premium | 559 | 431 | 431 | 431 | 431 | 431 | ||||||||||||||||||
Retained earnings | 428 | 423 | 389 | 204 | 137 | 80 | ||||||||||||||||||
Total equity attributable to the equity holders of IC Power or ICP, as indicated | 609 | 826 | 802 | 649 | 620 | 550 | ||||||||||||||||||
Non-controlling interest | 207 | 200 | 211 | 145 | 130 | 72 | ||||||||||||||||||
|
|
|
|
|
|
|
|
|
|
|
| |||||||||||||
Total equity | 816 | 1,026 | 1,013 | 794 | 750 | 622 | ||||||||||||||||||
|
|
|
|
|
|
|
|
|
|
|
| |||||||||||||
Total liabilities and equity | $ | 4,729 | $ | 4,091 | $ | 3,842 | $ | 3,031 | $ | 2,459 | $ | 2,169 | ||||||||||||
|
|
|
|
|
|
|
|
|
|
|
| |||||||||||||
| 1. | During 2015, an immaterial error was identified with respect to the deferred tax calculation relating to the effect of foreign exchange rate on non-monetary assets in previous years in ICP. ICP’s financial information for 2014, 2013 and 2012 has been revised to correct this immaterial error. |
23
Table of Contents
The following table presents our summary consolidated cash flow information for the periods presented:
| IC Power Pte. Ltd. | I.C. Power Asia Development Ltd. (formerly known as I.C. Power Ltd.) | |||||||||||||||||||||||||||
| Six Months Ended June 30, | Year Ended December 31, | |||||||||||||||||||||||||||
2016 | 2015 | 2015 | 2014 | 2013 | 2012 | 2011 | ||||||||||||||||||||||
| ($ millions) | ||||||||||||||||||||||||||||
Summary Consolidated Cash Flow Information | ||||||||||||||||||||||||||||
Net cash provided by operating activities | $ | 55 | $ | 131 | $ | 320 | $ | 413 | $ | 272 | $ | 122 | $ | 127 | ||||||||||||||
Net cash used in investing activities | (177 | ) | (341 | ) | (621 | ) | (378 | ) | (258 | ) | (293 | ) | (643 | ) | ||||||||||||||
Net cash provided by (used in) financing activities | (6 | ) | 63 | 89 | 47 | 320 | 132 | 623 | ||||||||||||||||||||
|
|
|
|
|
|
|
|
|
|
|
|
|
| |||||||||||||||
Net increase (decrease) in cash and cash equivalents | (128 | ) | (147 | ) | (212 | ) | 82 | 334 | (39 | ) | 107 | |||||||||||||||||
Cash and cash equivalents at beginning of the period | 360 | 583 | 583 | 517 | 184 | 221 | 114 | |||||||||||||||||||||
Effect of changes in the exchange rate on cash and cash equivalents | 2 | — | (11 | ) | (16 | ) | (1 | ) | 2 | — | ||||||||||||||||||
|
|
|
|
|
|
|
|
|
|
|
|
|
| |||||||||||||||
Cash and cash equivalents at end of the period | $ | 234 | $ | 436 | $ | 360 | $ | 583 | $ | 517 | $ | 184 | $ | 221 | ||||||||||||||
|
|
|
|
|
|
|
|
|
|
|
|
|
| |||||||||||||||
Key Financial and Other Operating Information—IC Power and ICP
The following tables set forth certain key financial and operating information for the periods presented:
| IC Power Pte. Ltd. | I.C. Power Asia Development Ltd. (formerly known as I.C. Power Ltd.) | |||||||||||||||||||||||||||
| Six Months Ended June 30, | Year Ended December 31, | |||||||||||||||||||||||||||
2016 | 2015 | 2015 | 20141 | 20131 | 20121 | 2011 | ||||||||||||||||||||||
| ($ millions, except as otherwise indicated) | ||||||||||||||||||||||||||||
Net income from continuing operations | 16 | 35 | 49 | 128 | 46 | 39 | 53 | |||||||||||||||||||||
Net income for the period | 16 | 39 | 53 | 256 | 74 | 68 | 73 | |||||||||||||||||||||
AdjustedEBITDA2 | 188 | 175 | 326 | 395 | 247 | 154 | 120 | |||||||||||||||||||||
Netdebt3 | 2,624 | 1,893 | 4 | 1,903 | 1,557 | 1,143 | 1,001 | 701 | ||||||||||||||||||||
Installed capacity of operating companies and associated companies at end of period (MW) | 3,384 | 2,642 | 2,665 | 2,642 | 2,070 | 1,572 | 1,280 | |||||||||||||||||||||
Proportionate capacity of operating companies and associated companies at end of period (MW) | 2,731 | 2,149 | 2,170 | 2,108 | 1,608 | 1,198 | 979 | |||||||||||||||||||||
Weighted average availability during the period(%) | 92 | % | 94 | % | 95 | % | 94 | % | 94 | % | 93 | % | 91 | % | ||||||||||||||
Gross energy generated (GWh) | 6,737 | 6,020 | 13,109 | 13,156 | 8,820 | 6,339 | 6,011 | |||||||||||||||||||||
Energy sold under PPAs (GWh) | 7,059 | 6,883 | 13,748 | 14,220 | 9,217 | 5,365 | 5,212 | |||||||||||||||||||||
| 1. | During 2015, an immaterial error was identified with respect to the deferred tax calculation relating to the effect of foreign exchange rate on non-monetary assets in previous years in ICP. ICP’s financial information for 2014, 2013 and 2012 has been revised to correct this immaterial error. |
| 2. | We define “Adjusted EBITDA” for each period as net income (loss) for the period before depreciation and amortization, financing expenses, net, income tax expense and asset write-off, excluding share in (income) loss of associated companies, recognized negative goodwill, capital gains (excluding capital gains from sales of fixed assets), and net income from discontinued operations, net of tax (excluding dividends received from discontinued operations). |
Adjusted EBITDA is not recognized under IFRS or any other generally accepted accounting principles as a measure of financial performance and should not be considered as a substitute for net income or loss, cash flow from operations or other measures of operating performance or liquidity determined in accordance with IFRS. Adjusted EBITDA is not intended to represent funds available
24
Table of Contents
for dividends or other discretionary uses because those funds may be required for debt service, capital expenditures, working capital and other commitments and contingencies. Adjusted EBITDA presents limitations that impair its use as a measure of our profitability since it does not take into consideration certain costs and expenses that result from our business that could have a significant effect on our net income, such as finance expenses, taxes and depreciation.
The following table sets forth a reconciliation of our net income to our Adjusted EBITDA for the periods presented. Other companies may calculate Adjusted EBITDA differently, and therefore this presentation of Adjusted EBITDA may not be comparable to other similarly titled measures used by other companies:
| IC Power Pte. Ltd. | I.C. Power Asia Development Ltd. (formerly known as I.C. Power Ltd.) | |||||||||||||||||||||||||||||||||||||||
| Six Months Ended June 30, | Year Ended December 31, | |||||||||||||||||||||||||||||||||||||||
2016 | 2015 | 2015 | 2014(i) | 2013(i) | 2012(i) | 2011 | 2010(ii) | 2009(iii) | 2008(iii) | |||||||||||||||||||||||||||||||
| ($ millions) | ||||||||||||||||||||||||||||||||||||||||
Net income (loss) for the period | $ | 16 | $ | 39 | $ | 53 | $ | 256 | $ | 74 | $ | 68 | $ | 73 | $ | 36 | $ | 66 | $ | (4 | ) | |||||||||||||||||||
Depreciation and amortization(iv) | 77 | 58 | 119 | 108 | 76 | 55 | 41 | 28 | 26 | 20 | ||||||||||||||||||||||||||||||
Financing expenses, net | 74 | 53 | 104 | 119 | 80 | 44 | 36 | 24 | 18 | 27 | ||||||||||||||||||||||||||||||
Income tax expense | 21 | 25 | 50 | 63 | 48 | 18 | 16 | 6 | 8 | �� | 8 | |||||||||||||||||||||||||||||
Asset write-off | — | — | — | 35 | — | — | — | — | — | — | ||||||||||||||||||||||||||||||
Share in (income) loss of associated companies | — | — | — | (2 | ) | (2 | ) | (2 | ) | (2 | ) | (1 | ) | (1 | ) | (2 | ) | |||||||||||||||||||||||
Recognized negative goodwill | — | — | — | (71 | )(v) | (1 | ) | — | (24 | ) | — | — | — | |||||||||||||||||||||||||||
Capital gains (excluding capital gains from sales of fixed assets) | — | — | — | — | — | — | — | — | (35 | ) | — | |||||||||||||||||||||||||||||
Net income from discontinued operations, net of tax (excluding dividends received from discontinued operations) | — | — | (vi) | — | (vi) | (113 | )(vii) | (28 | ) | (29 | ) | (20 | ) | (11 | ) | (17 | ) | (8 | ) | |||||||||||||||||||||
|
|
|
|
|
|
|
|
|
|
|
|
|
|
|
|
|
|
|
| |||||||||||||||||||||
Adjusted EBITDA | $ | 188 | $ | 175 | $ | 326 | $ | 395 | $ | 247 | $ | 154 | $ | 120 | $ | 82 | $ | 65 | $ | 41 | ||||||||||||||||||||
|
|
|
|
|
|
|
|
|
|
|
|
|
|
|
|
|
|
|
| |||||||||||||||||||||
| (i) | During 2015, an immaterial error was identified with respect to the deferred tax calculation relating to the effect of foreign exchange rate on non-monetary assets in previous years in ICP. ICP’s financial information for 2014, 2013 and 2012 has been revised to correct this immaterial error. |
| (ii) | ICP was incorporated in January 2010. Financial data for the year ended December 31, 2010 reflects the consolidated results of Inkia and OPC from April 1, 2010 and June 30, 2010, respectively, the time of their transfer to ICP. |
| (iii) | ICP was incorporated in January 2010. Results for 2008 and 2009 are the results of Inkia. |
| (iv) | Includes depreciation and amortization expenses from cost of sales and general, selling and administrative expenses. |
| (v) | Includes $68 million of income from recognized negative goodwill and $3 million of income from the measurement of fair value. |
| (vi) | Excludes $4 million received from Edegel post-equity method accounting, which is reflected as “dividends received post-equity accounting” in our discontinued operations for that period, but is included in net income (loss) for the period, so is therefore included in Adjusted EBITDA for the period. |
| (vii) | Excludes $15 million received from Edegel post-equity method accounting, which is reflected as “dividends received post-equity accounting” in our discontinued operations for that period, but is included in net income (loss) for the period, so is therefore included in Adjusted EBITDA for the period. |
25
Table of Contents
| 3. | Net debt is calculated as total debt, excluding debt owed to our parent, minus cash and short term deposits and restricted cash. Net debt is not a measure recognized under IFRS. The table below sets forth a reconciliation of our total debt to net debt. |
| IC Power Pte. Ltd. | I.C. Power Asia Development Ltd. (formerly known as I.C. Power Ltd.) | |||||||||||||||||||||||||||
| As of June 30, | As of December 31, | |||||||||||||||||||||||||||
| 2016 | 2015(i) | 2015 | 2014 | 2013 | 2012 | 2011 | ||||||||||||||||||||||
| ($ millions) | ||||||||||||||||||||||||||||
Total debt(ii) | $ | 2,943 | $ | 2,514 | $ | 2,565 | $ | 2,348 | $ | 1,669 | $ | 1,266 | $ | 1,093 | ||||||||||||||
Cash(iii) | 319 | 621 | 662 | 791 | 526 | 265 | 392 | |||||||||||||||||||||
|
|
|
|
|
|
|
|
|
|
|
|
|
| |||||||||||||||
Net debt | $ | 2,624 | $ | 1,893 | $ | 1,903 | $ | 1,557 | $ | 1,143 | $ | 1,001 | $ | 701 | ||||||||||||||
|
|
|
|
|
|
|
|
|
|
|
|
|
| |||||||||||||||
| (i) | Figures are derived from ICP’s unaudited condensed consolidated interim statements of financial position as of June 30, 2015. |
| (ii) | Total debt comprises loans from banks and third parties and debentures, excluding liabilities of disposal group classified as held for sale and loans and notes owed to our parent, and includes long term and short term debt. |
| (iii) | Includes short-term deposits and restricted cash of $85 million and $185 million at June 30, 2016 and 2015, respectively, and $302 million, $208 million, $9 million, $81 million and $171 million at December 31, 2015, 2014, 2013, 2012 and 2011, respectively. |
| 4. | Figure is derived from ICP’s unaudited condensed consolidated interim statements of financial position as of June 30, 2015. |
Set forth below is a summary of certain key historical financial and other operational information, according to our business lines and segments, for the periods set forth below. For all periods prior to our acquisition of Energuate, we operated one business line (generation) and evaluated this business line according to four geographic segments. However, since January 22, 2016, the date on which we completed our acquisition of Energuate, our results of operations reflect an additional business line (distribution). Our distribution business consists entirely of DEORSA and DEOCSA. Guatemel and RECSA, which we also acquired on January 22, 2016, are included within our generation business and have been included in our Central America and Other segments, respectively, as a result of their business lines.
For additional historical information on DEORSA, DEOCSA, Guatemel and RECSA, each of which we acquired in January 2016, including for certain periods prior to our acquisition of these companies, see “—Key Financial and Other Operating Information—DEORSA, DEOCSA, Guatemel and RECSA” below.
| Six Months Ended June 30, 2016 | ||||||||||||||||||||||||||||
| Generation | Distribution | Adjustments | Consolidated Results | |||||||||||||||||||||||||
| Peru | Israel | Central America | Other1 | Guatemala | ||||||||||||||||||||||||
| ($ millions, except as otherwise indicated) | ||||||||||||||||||||||||||||
Sales | 236 | 176 | 157 | 73 | 240 | (1 | ) | 881 | ||||||||||||||||||||
Cost of Sales | (152 | ) | (144 | ) | (121 | ) | (47 | ) | (181 | ) | 1 | (644 | ) | |||||||||||||||
Operating income (loss) | 50 | 15 | 11 | (2 | ) | 32 | 5 | 111 | ||||||||||||||||||||
Operating margins | 21 | % | 9 | % | 7 | % | (3 | )% | 13 | % | (500 | )% | 13 | % | ||||||||||||||
Financing expenses, net | (23 | ) | (7 | ) | (7 | ) | (26 | ) | (11 | ) | — | (74 | ) | |||||||||||||||
Net income (loss) for the period | 19 | 8 | 1 | (31 | ) | 15 | 4 | 16 | ||||||||||||||||||||
|
|
|
|
|
|
|
|
|
|
|
|
|
| |||||||||||||||
Installed capacity of operating companies and associated companies at end of period (MW) | 1,679 | 458 | 596 | 651 | — | — | 3,384 | |||||||||||||||||||||
Proportionate capacity of operating companies at end of period (MW) | 1,259 | 370 | 528 | 574 | — | — | 2,731 | |||||||||||||||||||||
Gross energy generated (GWh) | 3,047 | 1,666 | 1,141 | 882 | — | — | 6,737 | |||||||||||||||||||||
Energy sold under PPAs (GWh) | 3,173 | 1,987 | 1,420 | 479 | — | — | 7,059 | |||||||||||||||||||||
| 1. | In addition to the results of certain of our generation assets, our Other segment also includes expenses and other adjustments relating to our headquarters and intermediate holding companies, including purchase price allocations recorded in connection with our acquisition of Energuate, which allocations were recorded by Inkia, one of our intermediate holding companies. However, as our Other segment is primarily composed of the financial results of certain of our generation assets and their related holding companies, we analyze the results of our Other segment within our discussion of the results of our generation business. |
26
Table of Contents
| Six Months Ended June 30, 2015 | ||||||||||||||||||||||||
| Peru | Israel | Central America | Other1 | Adjustments | Consolidated Results | |||||||||||||||||||
| ($ millions, except as otherwise indicated) | ||||||||||||||||||||||||
Sales | 225 | 157 | 175 | 98 | — | 655 | ||||||||||||||||||
Cost of Sales | (139 | ) | (112 | ) | (140 | ) | (67 | ) | — | (458 | ) | |||||||||||||
Operating income | 53 | 31 | 18 | 6 | 5 | 113 | ||||||||||||||||||
Operating margins | 24 | % | 20 | % | 10 | % | 6 | % | — | 17 | % | |||||||||||||
Financing expenses, net | (20 | ) | (13 | ) | (5 | ) | (15 | ) | — | (53 | ) | |||||||||||||
Net income (loss) for the period | 18 | 13 | 10 | (6 | ) | 4 | 39 | |||||||||||||||||
|
|
|
|
|
|
|
|
|
|
|
| |||||||||||||
Installed capacity of operating companies and associated companies at end of period (MW) | 1,063 | 440 | 504 | 635 | — | 2,642 | ||||||||||||||||||
Proportionate capacity of operating companies at end of period (MW) | 797 | 352 | 436 | 564 | — | 2,149 | ||||||||||||||||||
Gross energy generated (GWh) | 1,928 | 1,937 | 1,123 | 1,032 | — | 6,020 | ||||||||||||||||||
Energy sold under PPAs (GWh) | 3,191 | 1,965 | 1,235 | 492 | — | 6,883 | ||||||||||||||||||
| 1. | In addition to the results of certain of our generation assets, our Other segment also includes expenses and other adjustments relating to our headquarters and intermediate holding companies. |
| Year Ended December 31, 2015 | ||||||||||||||||||||||||
| Peru | Israel | Central America | Other1 | Adjustments | Consolidated Results | |||||||||||||||||||
| ($ millions, except as otherwise indicated) | ||||||||||||||||||||||||
Sales | $ | 448 | $ | 326 | $ | 337 | $ | 178 | — | $ | 1,289 | |||||||||||||
Cost of Sales | (279 | ) | (242 | ) | (265 | ) | (123 | ) | — | (909 | ) | |||||||||||||
Operating income | 102 | 53 | 39 | (1 | ) | 10 | 203 | |||||||||||||||||
Operating margins | 23 | % | 16 | % | 12 | % | — | — | 16 | % | ||||||||||||||
Financing expenses, net | (42 | ) | (23 | ) | (10 | ) | (29 | ) | — | (104 | ) | |||||||||||||
Net income for the period | $ | 31 | $ | 22 | $ | 23 | $ | (31 | ) | $ | 8 | $ | 53 | |||||||||||
|
|
|
|
|
|
|
|
|
|
|
| |||||||||||||
Installed capacity of operating companies and associated companies at end of period (MW) | 1,063 | 458 | 504 | 640 | — | 2,665 | ||||||||||||||||||
Proportionate capacity of operating companies at end of period (MW) | 797 | 370 | 436 | 567 | — | 2,170 | ||||||||||||||||||
Gross energy generated (GWh) | 5,166 | 3,837 | 2,208 | 1,898 | — | 13,109 | ||||||||||||||||||
Energy sold under PPAs (GWh) | 6,327 | 3,976 | 2,450 | 995 | — | 13,748 | ||||||||||||||||||
| 1. | In addition to the results of certain of our generation assets, our Other segment also includes expenses and other adjustments relating to our headquarters and intermediate holding companies. |
27
Table of Contents
| Year Ended December 31, 2014 | ||||||||||||||||||||||||
| Peru | Israel | Central America | Other1 | Adjustments | Consolidated Results | |||||||||||||||||||
| ($ millions, except as otherwise indicated) | ||||||||||||||||||||||||
Sales | $ | 437 | $ | 413 | $ | 308 | $ | 214 | — | $ | 1,372 | |||||||||||||
Cost of Sales | (270 | ) | (252 | ) | (260 | ) | (154 | ) | — | (936 | ) | |||||||||||||
Operating income | 108 | 127 | 21 | 43 | 9 | 308 | ||||||||||||||||||
Operating margins | 25 | % | 31 | % | 7 | % | 20 | % | — | 22 | % | |||||||||||||
Financing expenses, net | (34 | ) | (30 | ) | (8 | ) | (46 | ) | (1 | ) | (119 | ) | ||||||||||||
Net income for the period | $ | 45 | $ | 71 | $ | 9 | $ | 124 | $ | 7 | $ | 256 | ||||||||||||
|
|
|
|
|
|
|
|
|
|
|
| |||||||||||||
Installed capacity of operating companies and associated companies at end of period (MW) | 1,063 | 440 | 504 | 635 | — | 2,642 | ||||||||||||||||||
Proportionate capacity of operating companies at end of period (MW) |
| 797 |
| 352 |
| 395 |
|
| 564 |
| — | 2,108 | ||||||||||||
Gross energy generated (GWh) | 5,920 | 3,465 | 1,965 | 1,806 | — | 13,156 | ||||||||||||||||||
Energy sold under PPAs (GWh) | 6,324 | 3,973 | 2,694 | 1,229 | — | 14,220 | ||||||||||||||||||
| 1. | In addition to the results of certain of our generation assets, our Other segment also includes expenses and other adjustments relating to our headquarters and intermediate holding companies. |
| Year Ended December 31, 2013 | ||||||||||||||||||||||||
| Peru | Israel | Central America | Other1 | Adjustments | Consolidated Results | |||||||||||||||||||
| ($ millions, except as otherwise indicated) | ||||||||||||||||||||||||
Sales | $ | 394 | $ | 187 | $ | 147 | $ | 145 | — | $ | 873 | |||||||||||||
Cost of Sales | (239 | ) | (139 | ) | (127 | ) | (89 | ) | — | (594 | ) | |||||||||||||
Operating income | 101 | 31 | 7 | 23 | 10 | 172 | ||||||||||||||||||
Operating margins | 26 | % | 17 | % | 5 | % | 16 | % | — | 20 | % | |||||||||||||
Financing expenses, net | (34 | ) | (22 | ) | — | (23 | ) | (1 | ) | (80 | ) | |||||||||||||
Net income for the period | $ | 35 | $ | 7 | $ | 5 | $ | 20 | $ | 7 | $ | 74 | ||||||||||||
Installed capacity of operating companies and associated companies at end of period (MW) | 870 | 440 | 140 | 620 | — | 2,070 | ||||||||||||||||||
Proportionate capacity of operating companies at end of period (MW) | 652 | 352 | 99 | 505 | — | 1,608 | ||||||||||||||||||
Gross energy generated (GWh) | 5,459 | 1,357 | 458 | 1,546 | — | 8,820 | ||||||||||||||||||
Energy sold under PPAs (GWh) | 6,268 | 1,813 | 535 | 601 | — | 9,217 | ||||||||||||||||||
| 1. | In addition to the results of certain of our generation assets, our Other segment also includes expenses and other adjustments relating to our headquarters and intermediate holding companies. |
28
Table of Contents
Key Financial and Other Operating Information – DEORSA, DEOCSA, Guatemel and RECSA
Set forth below is a summary of the key historical financial and other operational information of each of DEORSA, DEOCSA, Guatemel and RECSA for the periods set forth below.
DEORSA
Six-month | Six-month | 21-day period | 161-day period June 30, 2016 | |||||||||||||
| ($ thousands, unless otherwise indicated) | ||||||||||||||||
Energy sales | 116,986 | 120,885 | 14,618 | 102,368 | ||||||||||||
Services rendered | 2,697 | 2,366 | 425 | 2,272 | ||||||||||||
Other revenue | 3,049 | 4,838 | 228 | 2,821 | ||||||||||||
|
|
|
|
|
|
|
| |||||||||
Total revenue | 122,732 | 128,089 | 15,271 | 107,461 | ||||||||||||
Cost of sales | ||||||||||||||||
Energy purchases | (78,051 | ) | (75,870 | ) | (8,870 | ) | (69,181 | ) | ||||||||
Other cost of sales | (16,614 | ) | (16,215 | ) | (2,410 | ) | (14,204 | ) | ||||||||
|
|
|
|
|
|
|
| |||||||||
Total cost of sales | (94,665 | ) | (92,085 | ) | (11,280 | ) | (83,385 | ) | ||||||||
|
|
|
|
|
|
|
| |||||||||
Gross profit | 28,067 | 36,004 | 3,991 | 24,076 | ||||||||||||
General, selling and administrative expense | (10,608 | ) | (9,210 | ) | (2,276 | ) | (8,332 | ) | ||||||||
Financial income | 1,188 | 1,002 | 64 | 1,124 | ||||||||||||
Financial expenses | (5,247 | ) | (6,129 | ) | (583 | ) | (4,664 | ) | ||||||||
|
|
|
|
|
|
|
| |||||||||
Profit before income tax | 13,400 | 21,667 | 1,196 | 12,204 | ||||||||||||
Income Tax | (3,554 | ) | (5,675 | ) | (344 | ) | (3,210 | ) | ||||||||
|
|
|
|
|
|
|
| |||||||||
Profit for the period | 9,846 | 15,992 | 852 | 8,994 | ||||||||||||
Energy purchased (GWh) | 630 | 585 | 69 | 560 | ||||||||||||
Total electricity losses (%) | 16.2 | % | 15.4 | % | 19.4 | % | 15.8 | % | ||||||||
Energy distributed to regulated customers (GWh) | 502 | 466 | 53 | 448 | ||||||||||||
Energy distributed to unregulated customers (GWh)1 | 23 | 28 | 3 | 20 | ||||||||||||
| 1. | Unregulated customers consist of end users with a demand exceeding 100 kW, consisting principally of industrial and commercial customers. |
29
Table of Contents
| Year Ended December 31, 2015 | ||||
| ($ thousands, unless otherwise indicated) | ||||
Energy sales | 238,648 | |||
Services rendered | 4,720 | |||
Other revenues | 4,557 | |||
|
| |||
Total revenue | 247,925 | |||
Energy purchases | (156,320 | ) | ||
Other costs of sales | (33,312 | ) | ||
|
| |||
Total cost of sales | (189,632 | ) | ||
|
| |||
Gross profit | 58,293 | |||
General selling and administrative expense | (22,813 | ) | ||
Financial income | 1,927 | |||
Financial expenses | (11,857 | ) | ||
Other income | 4,040 | |||
|
| |||
Profit before income tax | 29,590 | |||
Income tax | (7,070 | ) | ||
|
| |||
Profit for the year | 22,520 | |||
Energy purchased (GWh) | 1,201 | |||
Total electricity losses (%) | 16.7 | % | ||
Energy distributed to regulated customers (GWh) | 950 | |||
Energy distributed to unregulated customers (GWh) | 50 | |||
30
Table of Contents
DEOCSA
Six-month | Six-month | 21-day period from | 161-day period from | |||||||||||||
| ($ thousands, unless otherwise indicated) | ||||||||||||||||
Energy sales | 151,996 | 159,994 | 19,448 | 132,548 | ||||||||||||
Services rendered | 2,360 | 1,719 | 322 | 2,038 | ||||||||||||
Other revenue | 4,028 | 4,200 | 298 | 3,730 | ||||||||||||
|
|
|
|
|
|
|
| |||||||||
Total revenue | 158,384 | 165,913 | 20,068 | 138,316 | ||||||||||||
Cost of Sales | ||||||||||||||||
Energy purchases | (103,077 | ) | (98,845 | ) | (12,000 | ) | (91,077 | ) | ||||||||
Other cost of sales | (18,507 | ) | (17,977 | ) | (2,814 | ) | (15,693 | ) | ||||||||
|
|
|
|
|
|
|
| |||||||||
Total cost of sales | (121,584 | ) | (116,822 | ) | (14,814 | ) | (106,770 | ) | ||||||||
|
|
|
|
|
|
|
| |||||||||
Gross profit | 36,800 | 49,091 | 5,254 | 31,546 | ||||||||||||
General, selling and administrative expense | (20,208 | ) | (17,873 | ) | (3,379 | ) | (16,829 | ) | ||||||||
Financial income | 1,015 | 1,097 | 129 | 886 | ||||||||||||
Financial expenses | (7,906 | ) | (8,869 | ) | (877 | ) | (7,029 | ) | ||||||||
|
|
|
|
|
|
|
| |||||||||
Profit before income tax | 9,701 | 23,446 | 1,127 | 8,574 | ||||||||||||
Income Tax | (2,975 | ) | (6,125 | ) | (336 | ) | (2,639 | ) | ||||||||
|
|
|
|
|
|
|
| |||||||||
Profit for the period | 6,726 | 17,321 | 791 | 5,935 | ||||||||||||
Energy purchased (GWh) | 806 | 767 | 93 | 713 | ||||||||||||
Total electricity losses (%) | 19.5 | % | 17.5 | % | 22.2 | % | 19.1 | % | ||||||||
Energy distributed to regulated customers (GWh) | 621 | 595 | 70 | 555 | ||||||||||||
Energy distributed to unregulated customers (GWh)1 | 34 | 53 | 4 | 31 | ||||||||||||
| 1. | Unregulated customers consist of end users with a demand exceeding 100 kW, consisting principally of industrial and commercial customers. |
31
Table of Contents
Year Ended | ||||
| ($ thousands, unless otherwise indicated) | ||||
Energy sales | 317,967 | |||
Services rendered | 3,547 | |||
Other revenues | 3,128 | |||
|
| |||
Total revenue | 324,642 | |||
Energy purchases | (205,058 | ) | ||
Other cost of sales | (37,516 | ) | ||
|
| |||
Total cost of sales | (242,574 | ) | ||
|
| |||
Gross profit | 82,068 | |||
General selling and administrative expense | (39,282 | ) | ||
Financial income | 2,046 | |||
Financial expenses | (16,980 | ) | ||
Other income | 242 | |||
|
| |||
Profit before income tax | 28,094 | |||
Income tax | (7,041 | ) | ||
|
| |||
Profit for the year | 21,053 | |||
Energy purchased (GWh) | 1,585 | |||
Total electricity losses (%) | 17.7 | % | ||
Energy distributed to regulated customers (GWh) | 1,239 | |||
Energy distributed to unregulated customers (GWh) | 65 | |||
Guatemel
Six-month | Six-month | 21-day period | 161-day period from | |||||||||||||
| ($ thousands) | ||||||||||||||||
Energy sales | 3,116 | 4,248 | 325 | 2,791 | ||||||||||||
Energy purchases | (3,018 | ) | (3,960 | ) | (299 | ) | (2,720 | ) | ||||||||
Other cost of sales | (34 | ) | (27 | ) | (4 | ) | (29 | ) | ||||||||
|
|
|
|
|
|
|
| |||||||||
Gross (loss) profit | 64 | 261 | 22 | 42 | ||||||||||||
General, selling and administrative expenses | (266 | ) | (192 | ) | (81 | ) | (185 | ) | ||||||||
Financial income | 25 | 19 | — | 25 | ||||||||||||
Financial expenses | (19 | ) | (14 | ) | (1 | ) | (18 | ) | ||||||||
Other income | 128 | 129 | 22 | 107 | ||||||||||||
|
|
|
|
|
|
|
| |||||||||
Loss before income tax | (68 | ) | 201 | (38 | ) | (30 | ) | |||||||||
Income tax | 15 | (39 | ) | 8 | 7 | |||||||||||
|
|
|
|
|
|
|
| |||||||||
Net loss for the period | (53 | ) | 163 | (30 | ) | (23 | ) | |||||||||
32
Table of Contents
Year Ended | ||||
| ($ thousands) | ||||
Energy sales | 7,950 | |||
Energy purchases | (7,445 | ) | ||
Other cost of sales | (52 | ) | ||
|
| |||
Gross profit | 453 | |||
Other income | 382 | |||
General, selling and administrative expenses | (435 | ) | ||
Financial income | 44 | |||
Financial expenses | (26 | ) | ||
|
| |||
Income before income tax | 418 | |||
Income Tax | (81 | ) | ||
|
| |||
Net profit for the year | 337 | |||
RECSA
Six-month | Six-month | 21-day period from | 161-day period from | |||||||||||||
| ($ thousands) | ||||||||||||||||
Toll Services | 921 | 863 | 106 | 816 | ||||||||||||
Cost of services | (348 | ) | (297 | ) | (50 | ) | (299 | ) | ||||||||
|
|
|
|
|
|
|
| |||||||||
Gross profit | 573 | 566 | 56 | 517 | ||||||||||||
General, selling and administrative expenses | (160 | ) | (114 | ) | (15 | ) | (145 | ) | ||||||||
Financial income | 8 | 7 | — | 8 | ||||||||||||
Finance expenses | (162 | ) | (149 | ) | (6 | ) | (156 | ) | ||||||||
|
|
|
|
|
|
|
| |||||||||
Profit before income taxes | 260 | 311 | 35 | 225 | ||||||||||||
Income Tax | (68 | ) | (58 | ) | (10 | ) | (58 | ) | ||||||||
|
|
|
|
|
|
|
| |||||||||
Profit for the period | 192 | 254 | 25 | 167 | ||||||||||||
| Year Ended December 31, 2015 | ||||
| ($ thousands) | ||||
Toll services | 1,970 | |||
Cost of services | (734 | ) | ||
|
| |||
Gross Profit | 1,236 | |||
General, selling and administrative expenses | (238 | ) | ||
Financial income | 17 | |||
Financial expenses | (329 | ) | ||
|
| |||
Profit before income taxes | 685 | |||
Income tax | (128 | ) | ||
|
| |||
Profit for the year | 558 | |||
33
Table of Contents
Adjusted EBITDA and Net Debt
Set forth below is the Adjusted EBITDA for DEORSA, DEOCSA, Guatemel and RECSA for the 161-day period from January 22, 2016 to June 30, 2016, as well as a reconciliation to these companies’ net profit. For the period, Adjusted EBITDA is defined as net profit (loss) for the period, before depreciation and amortization, other revenues—government grants, finance expenses, net and income tax expense (benefit). Adjusted EBITDA is a non-IFRS measure and other companies may calculate Adjusted EBITDA differently, and therefore this presentation of Adjusted EBITDA may not be comparable to other similarly titled measures used by other companies.
161-day period from January 22, 2016 to June 30, | ||||||||||||||||
DEORSA | DEOCSA | Guatemel | RECSA | |||||||||||||
| ($ thousands) | ||||||||||||||||
Net profit (loss) for the period | $ | 8,994 | $ | 5,935 | $ | (23 | ) | $ | 167 | |||||||
Depreciation and amortization | 4,821 | 6,208 | 20 | 207 | ||||||||||||
Other Revenues—Government Grants | (1,412 | ) | (1,418 | ) | — | — | ||||||||||
Finance expenses, net | 3,540 | 6,143 | (7 | ) | 147 | |||||||||||
Income tax expense (benefit) | 3,210 | 2,639 | (7 | ) | 58 | |||||||||||
|
|
|
|
|
|
|
| |||||||||
Adjusted EBITDA | $ | 19,153 | $ | 19,507 | $ | (17 | ) | $ | 579 | |||||||
|
|
|
|
|
|
|
| |||||||||
Set forth below is the net debt for DEORSA, DEOCSA, Guatemel and RECSA as of June 30, 2016, as well as a reconciliation to these companies’ total debt. Net debt is defined as total debt attributable to these companies, minus the cash of such companies. Net debt is a non-IFRS measure and is not a measure of liabilities in accordance with IFRS.
| DEORSA | DEOCSA | Guatemel | RECSA | |||||||||||||
| ($ thousands) | ||||||||||||||||
Total debt1 | $ | 104,152 | $ | 160,354 | $ | 197 | $ | 4,583 | ||||||||
Cash2 | 7,086 | 6,687 | 1,294 | 1,218 | ||||||||||||
|
|
|
|
|
|
|
| |||||||||
Net debt | $ | 97,066 | $ | 153,667 | $ | (1,097 | ) | $ | 3,365 | |||||||
|
|
|
|
|
|
|
| |||||||||
| 1. | Total debt comprises current and non-current debt with financial entities, short-term lease payable and non-current finance lease payable. |
| 2. | Includes cash and cash equivalents and restricted cash. |
34
Table of Contents
UNAUDITED PRO FORMA CONDENSED CONSOLIDATED FINANCIAL INFORMATION
On December 29, 2015, IC Power Distribution Holdings Pte. Ltd., or ICPDH, a wholly owned subsidiary of IC Power, entered into an agreement with Deorsa-Deocsa Holdings Ltd. to acquire 100% of the shares of Estrella Coöperatief B.A., or Estrella, a holding company that indirectly owned two electricity distribution companies in Guatemala (approximately 93% of DEORSA and 91% of DEOCSA and 100% of two smaller, related businesses, Guatemel and RECSA, (the four acquired businesses, DEORSA, DEOCSA, Guatemel and RECSA, are collectively referred to in this section as the “Acquired Businesses”)), for a purchase price equal to the base purchase price, plus a deferred payment, and adjusted according to a final working capital adjustment amount. On January 22, 2016, ICPDH completed the acquisition of Estrella, or the Acquisition, for a total consideration of approximately $266 million, which included a base purchase price of approximately $242 million paid at the closing date and a deferred payment of approximately $24 million paid on April 12, 2016 using a combination of cash on hand and a $120 million loan facility entered into in December 2015. The total consideration remains subject to working capital adjustments.
The following unaudited pro forma statements of income for the six months ended June 30, 2016 and the year ended December 31, 2015 are presented to illustrate the effects of IC Power’s completion of the Acquisition and give effect to the Acquisition as if it had occurred in its entirety on January 1, 2015. The statements of income are based on our historical consolidated financial statements, ICP’s historical consolidated financial statements, the historical financial statements of each of DEORSA, DEOCSA, Guatemel, and RECSA, the unaudited historical stand-alone financial statements of each of Deorsa B.V., Deocsa B.V, Guatemel B.V. and Recsa B.V. (the holding companies which directly owned DEORSA, DEOCSA, RECSA and Guatemel, respectively) (collectively, the “Intermediate HoldCos”) prior to the Acquisition (which financial statements are not included in this prospectus), and the unaudited historical stand-alone financial statements of Estrella, the direct parent of the Intermediate HoldCos (collectively, with the Intermediate HoldCos, the “HoldCos”) prior to the Acquisition (which financial statements are not included in this prospectus). As illustrated below, other than their direct or indirect ownership, as applicable, of the Acquired Businesses, the HoldCos did not have material assets or operations, either individually or in the aggregate.
The following unaudited pro forma condensed consolidated statements of income are presented for informational purposes only and do not purport to present what IC Power’s results of operations would have been had the acquisition occurred on the date indicated or to project our future results of operations. The unaudited pro forma condensed consolidated statements of income include assumptions that are believed to be reasonable and represent all material information that is necessary to fairly present pro forma condensed consolidated statements of income. In addition, certain reclassifications have been made to the historical financial statements of the Acquired Businesses to conform to the presentation in IC Power’s financial statements. IC Power’s actual results of operations may differ significantly from the unaudited pro forma amounts reflected herein due to a variety of factors. You should read the unaudited pro forma consolidated statements of income set forth below in conjunction with the sections entitled “Summary Consolidated Financial and Other Information,” “Use of Proceeds,” “Capitalization,” “Selected Consolidated Financial and Other Information,” and “Management’s Discussion and Analysis of Financial Condition and Results of Operations” as well as in conjunction with our unaudited condensed consolidated interim financial statements, our audited financial statements, ICP’s audited consolidated financial statements, the unaudited condensed interim financial statements of each of DEORSA, DEOCSA, Guatemel and RECSA, the audited financial statements of each of DEORSA, DEOCSA, Guatemel and RECSA, and the notes thereto included elsewhere in this prospectus. Except as otherwise indicated, or unless the context requires otherwise, references to “the Company,” “we,” “us” and “our” prior to the date of the Reorganization shall refer to ICP and its businesses, and as of the date of the Reorganization and thereafter, to IC Power and its subsidiaries, including ICP.
35
Table of Contents
IC Power Pte Ltd.
Unaudited Pro Forma Condensed Consolidated Statement of Income
For the Six Months Ended June 30, 2016
For the | From January 1 to January 21, 2016 | For the | ||||||||||||||||||||||||||||||||||||
| ($ millions, except per share data) | IC | DEORSA | DEOCSA | Guatemel** | RECSA** | HoldCo | Consolidation | Proforma | Notes | IC Power | ||||||||||||||||||||||||||||
Continuing operations | ||||||||||||||||||||||||||||||||||||||
Revenue | 881 | 15 | 20 | — | — | — | — | — | 916 | |||||||||||||||||||||||||||||
Cost of sales (excluding depreciation and amortization) | (644 | ) | (12 | ) | (15 | ) | — | — | — | — | — | (671 | ) | |||||||||||||||||||||||||
Depreciation and amortization | (72 | ) | — | (1 | ) | — | — | — | — | — | 3(a) | (73 | ) | |||||||||||||||||||||||||
|
|
|
|
|
|
|
|
|
|
|
|
|
|
|
|
|
| |||||||||||||||||||||
Gross profit | 165 | 3 | 4 | — | — | — | — | — | 172 | |||||||||||||||||||||||||||||
General, selling and administrative expenses | (60 | ) | (1 | ) | (2 | ) | — | — | — | — | — | (63 | ) | |||||||||||||||||||||||||
Other income | 7 | — | — | — | — | — | — | — | 7 | |||||||||||||||||||||||||||||
Other expenses | (1 | ) | — | — | — | — | — | — | — | (1 | ) | |||||||||||||||||||||||||||
|
|
|
|
|
|
|
|
|
|
|
|
|
|
|
|
|
| |||||||||||||||||||||
Profit from operating activities | 111 | 2 | 2 | — | — | — | — | — | 115 | |||||||||||||||||||||||||||||
Finance income | 5 | — | — | — | — | — | — | — | 5 | |||||||||||||||||||||||||||||
Finance expenses | (79 | ) | (1 | ) | (1 | ) | — | — | — | — | — | 3(b) | (81 | ) | ||||||||||||||||||||||||
|
|
|
|
|
|
|
|
|
|
|
|
|
|
|
|
|
| |||||||||||||||||||||
Finance costs, net | (74 | ) | (1 | ) | (1 | ) | — | — | — | — | — | (76 | ) | |||||||||||||||||||||||||
Share of profit in associates | — | — | — | — | — | — | — | — | — | |||||||||||||||||||||||||||||
|
|
|
|
|
|
|
|
|
|
|
|
|
|
|
|
|
| |||||||||||||||||||||
Profit before income tax and discontinued operations | 37 | 1 | 1 | — | — | — | — | — | 39 | |||||||||||||||||||||||||||||
Income tax | (21 | ) | — | — | — | — | — | — | — | 3(c) | (21 | ) | ||||||||||||||||||||||||||
|
|
|
|
|
|
|
|
|
|
|
|
|
|
|
|
|
| |||||||||||||||||||||
Profit from continuing operations | 16 | 1 | 1 | — | — | — | — | — | 18 | |||||||||||||||||||||||||||||
Attributable to: | ||||||||||||||||||||||||||||||||||||||
Equity holders of the Company | 7 | 1 | 1 | — | — | — | — | — | 3(d) | 9 | ||||||||||||||||||||||||||||
Non-controlling interest | 9 | — | — | — | — | — | — | — | 3(d) | 9 | ||||||||||||||||||||||||||||
|
|
|
|
|
|
|
|
|
|
|
|
|
|
|
|
|
| |||||||||||||||||||||
Profit from continuing operations | 16 | 1 | 1 | — | — | — | — | — | 18 | |||||||||||||||||||||||||||||
|
|
|
|
|
|
|
|
|
|
|
|
|
|
|
|
|
| |||||||||||||||||||||
Earnings per share | ||||||||||||||||||||||||||||||||||||||
Basic and diluted earnings per share (in U.S. | 12 | 16 | ||||||||||||||||||||||||||||||||||||
Weighted average shares | 559,310 | 559,310 | ||||||||||||||||||||||||||||||||||||
| * | Includes the results of DEORSA, DEOCSA, Guatemel and RECSA since the date of their acquisition and consolidation on January 22, 2016. |
| ** | Figures amounted to less than $1 million in the aggregate. |
36
Table of Contents
IC Power Pte Ltd.
Unaudited Pro Forma Condensed Consolidated Statements of Income
For the Year Ended December 31, 2015
| ($ millions, except per share data) | IC Power | IC Power | DEORSA | DEOCSA | Guatemel | RECSA | HoldCo | Consolidation | Proforma | Notes | IC Power | |||||||||||||||||||||||||||||||
Continuing operations | ||||||||||||||||||||||||||||||||||||||||||
Sales | — | 1,289 | 245 | 323 | 8 | 2 | — | (2 | ) | — | 1,865 | |||||||||||||||||||||||||||||||
Cost of sales (excluding depreciation and amortization) | — | (909 | ) | (179 | ) | (232 | ) | (8 | ) | (1 | ) | — | 1 | — | (1,328 | ) | ||||||||||||||||||||||||||
Depreciation and amortization | — | (111 | ) | (6 | ) | (9 | ) | — | — | — | — | (7 | ) | 3(a) | (133 | ) | ||||||||||||||||||||||||||
|
|
|
|
|
|
|
|
|
|
|
|
|
|
|
|
|
|
|
| |||||||||||||||||||||||
Gross profit | — | 269 | 60 | 82 | — | 1 | — | (1 | ) | (7 | ) | 404 | ||||||||||||||||||||||||||||||
General, selling and administrative expenses | — | (71 | ) | (21 | ) | (36 | ) | — | — | — | — | — | (128 | ) | ||||||||||||||||||||||||||||
Other income | — | 11 | — | — | — | — | — | — | — | 11 | ||||||||||||||||||||||||||||||||
Other expenses | — | (6 | ) | 1 | (1 | ) | — | — | — | — | — | (6 | ) | |||||||||||||||||||||||||||||
|
|
|
|
|
|
|
|
|
|
|
|
|
|
|
|
|
|
|
| |||||||||||||||||||||||
Profit from operating activities | — | 203 | 40 | 45 | — | 1 | — | (1 | ) | (7 | ) | 281 | ||||||||||||||||||||||||||||||
Finance income | — | 11 | 2 | 2 | — | — | — | 1 | — | 16 | ||||||||||||||||||||||||||||||||
Finance expenses | — | (115 | ) | (13 | ) | (19 | ) | — | — | — | — | (9 | ) | 3(b) | (156 | ) | ||||||||||||||||||||||||||
|
|
|
|
|
|
|
|
|
|
|
|
|
|
|
|
|
|
|
| |||||||||||||||||||||||
Finance costs, net | — | (104 | ) | (11 | ) | (17 | ) | — | — | — | 1 | (9 | ) | (140 | ) | |||||||||||||||||||||||||||
Share of profit in associates | — | — | — | — | — | — | — | — | — | — | ||||||||||||||||||||||||||||||||
|
|
|
|
|
|
|
|
|
|
|
|
|
|
|
|
|
|
|
| |||||||||||||||||||||||
Profit before income tax and discontinued operations | — | 99 | 29 | 28 | — | 1 | — | — | (16 | ) | 141 | |||||||||||||||||||||||||||||||
Income tax | — | (50 | ) | (7 | ) | (7 | ) | — | — | — | — | 2 | 3(c) | (62 | ) | |||||||||||||||||||||||||||
|
|
|
|
|
|
|
|
|
|
|
|
|
|
|
|
|
|
|
| |||||||||||||||||||||||
Profit from continuing operations | — | 49 | 22 | 21 | — | 1 | — | — | (14 | ) | 79 | |||||||||||||||||||||||||||||||
Attributable to: | ||||||||||||||||||||||||||||||||||||||||||
Equity holders of the Company | — | 32 | 20 | 19 | — | 1 | — | — | (14 | ) | 58 | |||||||||||||||||||||||||||||||
Non-controlling interest | — | 17 | 2 | 2 | — | — | — | — | — | 3(d) | 21 | |||||||||||||||||||||||||||||||
Profit | — | 49 | 22 | 21 | — | 1 | — | — | (14 | ) | 3(d) | 79 | ||||||||||||||||||||||||||||||
|
|
|
|
|
|
|
|
|
|
|
|
|
|
|
|
|
|
|
| |||||||||||||||||||||||
Earnings per share | ||||||||||||||||||||||||||||||||||||||||||
Basic and diluted earnings per share (in U.S. Dollars) | 57 | 104 | ||||||||||||||||||||||||||||||||||||||||
Weighted average shares of IC Power** | 559,310 | 559,310 | ||||||||||||||||||||||||||||||||||||||||
| * | Figures amounted to less than $1 million in the aggregate. |
| ** | In light of the change in IC Power’s capital structure as a result of the Reorganization, and given the non-comparability of IC Power’s and ICP’s capital structures for the period above, earnings per share information is based upon IC Power’s capital post-Reorganization. |
37
Table of Contents
IC Power Pte. Ltd.
Notes to Unaudited Pro Forma Condensed Consolidated Statements of Income
For the Six Months Ended June 30, 2016 and the Year Ended December 31, 2015
Note 1—Basis of presentation
The historical consolidated statements of income have been adjusted in the pro forma condensed consolidated statements of income to give effect to pro forma events that are expected to have a continuing impact on our results following the Acquisition and therefore does not present net income from discontinued operations figures for the six months ended June 30, 2016 or the year ended December 31, 2015.
On March 17, 2016, pursuant to a reorganization effected by Kenon, our parent, Kenon transferred all of its equity interests in its wholly-owned subsidiary, ICP, to us. Since this transaction constitutes a reorganization of ICP, the unaudited pro forma consolidated statement of income for the year ended December 31, 2015 was prepared using the values from ICP’s historical audited consolidated financial statements, IC Power’s historical audited financial statements, the historical audited financial statements of each of DEORSA, DEOCSA, Guatemel, and RECSA, and the unaudited historical stand-alone financial statements of each of the HoldCos.
The unaudited pro forma condensed consolidated statement of income for the six months ended June 30, 2016 was prepared using IC Power’s historical condensed consolidated financial statements, the historical condensed interim financial statements of each of DEORSA, DEOCSA, Guatemel, and RECSA, and the historical stand-alone financial statements of each of the HoldCos.
IC Power’s and ICP’s historical audited financial statements were prepared in accordance with IFRS as issued by the IASB and presented in thousands of U.S. Dollars. Each of DEORSA, DEOCSA, Guatemel and RECSA’s historical audited financial statements were also prepared in accordance with IFRS as issued by the IASB and are presented in U.S. Dollars. Additionally, certain reclassifications were made to align DEORSA’s, DEOCSA’s, Guatemel’s and RECSA’s financial statement presentation with those of IC Power.
The unaudited pro forma consolidated statements of income were prepared using the purchase method of accounting as required by the accounting guidance for business combinations in IFRS 3. The purchase price has been allocated to the assets acquired and liabilities assumed based upon management’s preliminary estimate of their respective fair values as of the date of acquisition.
The pro forma adjustments are based upon available information and certain assumptions which management believes are reasonable under the circumstances and which are described in these notes. The unaudited pro forma consolidated condensed statements of income also include certain purchase accounting adjustments, including items expected to have a continuing impact on the consolidated results of IC Power. The fair values of the acquired assets and liabilities have been determined on a provisional basis as permitted according to IFRS 3. We expect to complete the final valuation study before year-end.
38
Table of Contents
Note 2—Business Combinations
As of June 30, 2016, the fair values of the acquired assets and liabilities and the calculation of goodwill have been determined on a provisional basis as permitted according to IFRS 3. We expect to complete the final valuation by the end of 2016.
| (a) | Consideration transferred |
The acquisition closed on January 22, 2016 with an aggregate purchase price of $266 million in cash, subject to working capital adjustments, as follows:
(In US$ thousands) | ||||
Cash consideration | 242,536 | |||
Deferred payment* | 23,750 | |||
|
| |||
Total consideration transferred | 266,286 | |||
|
| |||
(In US$ thousands) | ||||
Cash consideration | 266,286 | |||
Cash and cash equivalents acquired | (60,227 | ) | ||
|
| |||
Net cash flow used on acquisition | 206,059 | |||
|
| |||
| * | The deferred payment was made in April 2016. |
The total consideration remains subject to working capital adjustments.
| (b) | Identifiable assets acquired and liabilities assumed |
The following table summarizes the preliminary purchase price allocation based on the recognized amounts of assets acquired and liabilities assumed at the date of acquisition:
(In US$ thousands) | ||||
Property, plant and equipment | 394,536 | |||
Intangibles | 178,238 | |||
Deferred income tax assets, net | 16,317 | |||
Trade receivables, net* | 125,271 | |||
Cash and cash equivalents | 60,227 | |||
Other assets | 22,528 | |||
Credit from bank and others | (284,456 | ) | ||
Deferred income tax liabilities | (52,385 | ) | ||
Trade payables | (108,193 | ) | ||
Guarantee deposits from customers** | (58,727 | ) | ||
Other liabilities | (37,731 | ) | ||
|
| |||
Total identifiable net assets acquired | 255,625 | |||
|
| |||
| * | The trade receivables comprise gross contractual amounts due of $220,977 thousand, of which $95,706 thousand was expected to be uncollectible at the acquisition date. |
| ** | Deposits in cash received from customers. These deposits bear interests at a weighted average interest rate published by the Guatemalan Central Bank and are refundable to clients when they cease using the electric energy service. |
39
Table of Contents
Measurement of fair values
We have measured the value of the acquired assets, liabilities, and contingent liabilities at fair value on the acquisition date as follows:
| • | Fixed assets were valued considering the market value provided by an appraiser; |
| • | Intangibles were measured based on the valuation of the concessions; |
| • | Deferred taxes were recorded based on the temporary differences between the carrying amount of the assets and liabilities and their tax basis; and |
| • | Non-controlling interests were measured as a proportion of the net assets identified on the acquisition date. |
| (c) | Goodwill |
| Goodwill arising from the acquisition has been recognized as follows: |
| (In US$ thousands) | ||||
Total consideration transferred | 266,286 | |||
Non-controlling interest | 20,707 | |||
Fair value of identifiable net assets | (255,625 | ) | ||
|
| |||
Goodwill | 31,368 | |||
|
| |||
| Goodwill is explained by our strategic interest to expand our presence in the distribution business. The goodwill is attributable mainly to the synergies expected to be achieved from integrating this business into our company. |
Note 3—Pro forma adjustments
The following adjustments have been reflected in the unaudited pro forma condensed consolidated statements of income:
| (a) | The impact of the following acquisition adjustments as a consequence of the Acquisition: |
| (In US$ thousands) | For the 21 day | For the year | ||||||
Amortization due to fair value adjustment to intangible assets | 297 | 5,244 | ||||||
Depreciation due to fair value adjustment to property, plant and equipment | 93 | 1,161 | ||||||
|
|
|
| |||||
Total | 390 | 6,405 | ||||||
| Amortization of intangible assets is calculated using the straight-line method. The fair value of intangible assets was measured based upon the valuation of DEORSA’s and DEOCSA’s concessions, which were granted by the MEM in 1998 to DEORSA and DEOCSA to operate in defined geographic areas for a term of 50 years. The remaining useful lives of DEORSA and DEOCSA’s concessions to operate in their respective defined geographic areas are each 33 years. |
40
Table of Contents
| Depreciation of property, plant and equipment is calculated using the straight-line method. The estimated useful lives of the main acquired technical facilities range from 12 to 26 years. The fair value of property, plant and equipment was valued according to the market value provided by an appraiser and was estimated using the replacement cost method. |
| (b) | The impact of interest expense as a consequence of the Acquisition. |
| (In US$ thousands) | For the 21 day period from January 1, 2016 to January 21, 2016 | For the year ended December 31, 2015 | ||||||
Finance expense relating to the $120 million ICPDH credit agreement to finance the acquisition* | — | 8,167 | ||||||
Fair value adjustments to loans from bank and others | 20 | 343 | ||||||
|
|
|
| |||||
Total | 20 | 8,510 | ||||||
| * | The proforma adjustment was calculated as if the full drawdown of the loan occurred on January 1, 2015 at an annual interest rate of 4.61% (representing 4.00% plus 3-month LIBOR, which is the applicable interest rate under the credit agreement). A 0.125% increase or decrease in LIBOR would result in an increase or decrease in pro forma interest expense of approximately $149 thousand per year. |
| Finance expenses of $8 million relating to the $120 million ICPDH credit agreement that was provided to finance the acquisition was recorded as if the full drawdown of the loan occurred on January 1, 2015. |
| (c) | The income tax impact related to the adjustments described under (a) and (b). |
| (d) | The impact of the adjustments described under (a), (b) and (c) which are attributable to IC Power’s equity holders and non-controlling interests. |
41
Table of Contents
Our business, financial condition, results of operations and liquidity can suffer materially as a result of any of the risks described below. You should carefully consider the risks described below with all of the other information included in this prospectus. If any of the following risks actually occurs, it may materially harm our business, financial condition, results of operations and liquidity. While we have described all of the risks we consider material, these risks are not the only ones we face. We are also subject to the same risks that affect many other companies, such as technological obsolescence, labor relations, geopolitical events, climate change and risks related to the conducting of international operations. Additional risks not known to us or that we currently consider immaterial may also impair our business operations. Additionally, this prospectus also contains forward-looking statements that involve additional risks and uncertainties. Our actual results could differ materially from those anticipated in these forward-looking statements as a result of certain factors, including the risks faced by us described below and elsewhere in this prospectus.
Risks Related to Our Business
Our results of operations and financial condition are dependent upon the economic, environmental, social and political conditions in those countries in which we operate.
We have operating assets in 11 countries, including emerging markets, and we expect to complete construction programs and secure additional development projects in these or other countries. As a result, our results of operations are dependent upon the economic, social and political conditions in each of the countries in which we operate, and we are exposed to a variety of risks, including risks related to:
| • | heightened economic volatility; |
| • | difficulty in enforcing agreements, collecting receivables and protecting assets; |
| • | difficulty in obtaining authorizations, permits and licenses required for the operation of our assets; |
| • | the possibility of encountering unfavorable circumstances from host country laws or regulations; |
| • | fluctuations in revenues, operating margins and/or other financial measures due to currency exchange rate fluctuations and restrictions on currency and earnings repatriation; |
| • | trade protection measures, import or export restrictions, licensing requirements and environmental, local fire and security codes and standards; |
| • | increased costs and risks of developing, staffing and simultaneously managing a number of foreign operations as a result of language and cultural differences; |
| • | issues related to occupational safety, work hazard, and adherence to local labor laws and regulations; |
| • | potentially adverse tax developments or interpretations; |
| • | changes in political, social and/or economic conditions; |
| • | the threat of nationalization and expropriation; |
| • | the presence of corruption in certain countries; |
| • | fluctuations in the availability of funding; |
42
Table of Contents
| • | a potential deterioration in our relationships with the different stakeholders in the communities surrounding our facilities; |
| • | terrorist or other hostile activities; and |
| • | changes in the regulatory and environmental legal framework, including the costs of complying with environmental and energy regulations. |
Additionally, our revenue is derived primarily from the sale of electricity, and the demand for electricity is largely driven by the economic, political and regulatory conditions of the countries in which we operate. Therefore, our results of operations and financial condition are, to a large extent, dependent upon the overall level of economic activity in these emerging market countries. Should economic or political conditions deteriorate in Peru, or in any of the other countries in which we operate, or in emerging markets generally, such an occurrence could have a material adverse effect on our business, financial condition, results of operations or liquidity.
We operate in highly competitive markets.
The worldwide markets for power generation are highly competitive in terms of pricing, quality, development and introduction time, customer service and financing terms. In many of the markets in which we operate, we face downward price pressure and we are or could be exposed to market downturns or slower growth, which may increase in times of declining investment activities, government incentives and/or consumer demand. We face strong competitors, some of which are larger and may have greater resources in a given business area than we have, as well as competitors from emerging markets, which may have better, more efficient cost structures.
For example, in May 2016, Samay I (our cold-reserve thermoelectric project) reached its COD on schedule, providing an additional 616 MW of installed capacity to the Peruvian market. In August 2016, we also provided an additional 510 MW of installed capacity to the Peruvian market with the completion of the development of the three generating units of CDA’s plant. We expect generation capacity and, to a lesser extent, the demand for electricity, to increase in Peru. As the increase in demand is expected to be less than the increase in capacity in the medium-term, this temporary oversupply in the Peruvian market is expected to affect the price levels in Peru. As we sell energy and capacity on the spot market in Peru and expect to enter into, and renegotiate, PPAs during this period of downward pressure on energy prices, the temporary oversupply in the Peruvian market may adversely affect our business or results of operations.
Additionally, in recent years, the power production industry has been characterized by strong and increasing competition with respect to obtaining long-term and short-term PPAs—which provide for the sale of electricity, independent of actual generation allocations or provisions of availability, to financially stable distribution companies or other non-regulated consumers—and acquiring existing power generation assets. In certain markets, these factors have caused reductions in the prices negotiated in PPAs and, in many cases, have caused higher acquisition prices for existing assets through competitive bidding processes. The evolution of competitive electricity markets and the continued development of highly efficient gas-fired power plants have also caused, or are anticipated to cause, price pressure in certain power markets where we sell or intend to sell power. Certain competitors might be more effective and faster in capturing available market opportunities, which in turn may negatively impact our market share.
Any of these factors alone, or in combination, may negatively impact one or more of our businesses and thereby have a material adverse effect on our business, financial condition, results of operations or liquidity.
We primarily operate, and expect to continue to primarily operate, in emerging markets.
We have operations in a number of emerging markets, including Peru, Guatemala, Chile and Colombia. Investing in the securities of a company with operations in emerging markets generally involves a higher degree
43
Table of Contents
of risk than investing in the securities of a company with operations in a more developed market. For example, we are subject to increased political, social and economic instability, which may affect the economic results of the emerging markets in which we operate and which stems from many factors, including:
| • | high interest rates; |
| • | abrupt changes in currency values; |
| • | high levels of inflation; |
| • | exchange controls; |
| • | wage and price controls and increased employment-related regulations; |
| • | regulations on imports of equipment and other necessities (goods and services) relevant to operations; |
| • | changes in governmental, economic or tax policies; and |
| • | social and political tensions, |
any of which could have a material adverse effect on our financial condition, results of operations or liquidity or the value of your investment in our securities.
We are a holding company and are dependent upon cash flows from our subsidiaries and associated company to meet our existing and future obligations.
We are a holding company of various operating companies, and as a result, do not conduct independent operations or possess significant assets other than investments in our businesses. Therefore, we depend upon the receipt of sufficient funds from our businesses (via dividends or loans) to meet our obligations, including to contribute committed capital to our businesses, repay any amounts we may borrow in the future, and to pay dividends or other distributions to our shareholders. However, as our corporate structure includes several intermediate holding companies which, along with our operating subsidiaries and investees, are legally distinct from us and will generally be required to service their debt obligations before making distributions to us, our ability to access such cash flow from our subsidiaries and investees may be limited in some circumstances and we may not have the ability to cause entities in which we own an interest to make distributions to us, even if they are able to do so. Additionally, the terms of existing and future joint ventures, financings, or cooperative operational agreements, ratings considerations, and/or the laws and jurisdictions under which each of our subsidiaries and investees is incorporated may also limit the timing and amount of any dividends, other distributions, loans or loan repayments to us. In the case of ICP and Inkia, subsidiaries and investees with investments in numerous subsidiaries and investees, their ability to make payments to us may be further limited if their subsidiaries and investees are unable to make payments to them.
Additionally, as dividends are generally taxed and governed by the relevant authority in the jurisdiction in which the company is incorporated or where the company is a tax resident, there may be numerous and significant tax or other legal restrictions on the ability of our subsidiaries and investees to remit funds to us, or to remit such funds without our, or our subsidiaries’ and investees’, incurring significant tax liabilities.
We are significantly leveraged.
As of June 30, 2016 and December 31, 2015, we had $2,943 million and $2,565 million of outstanding indebtedness on a consolidated basis, respectively, excluding our $220 million notes payable to Kenon, consisting of a $145 million and $75 million note (which notes were issued to Kenon in March 2016 as part of
44
Table of Contents
the consideration for Kenon’s contribution of ICP to us in connection with the Reorganization, and of which the $75 million note was prepaid in full in October 2016). Some of our debt agreements include financial covenants, affirmative and negative covenants, and/or events of default or mandatory prepayments for contractual breaches, change of control events, and/or material mergers and divestments, among other provisions. For example, in connection with the consummation of our sale of our indirect equity interest in Edegel in 2014, we were required to repay the aggregate principal amount of debt outstanding under Inkia’s then-existing credit facility.
We use a substantial portion of our cash flow from operations or investing activities to make debt service payments, reducing our ability to use cash flow to fund our operations, capital expenditures or future business opportunities. Many of our debt agreements provide for balloon payments (the repayment of the entire principal amount of the loan at final maturity), which repayments may require substantial portions of our cash flow. For further information on the final maturity and amortization of certain of our debt agreements, see “Management’s Discussion and Analysis of Financial Condition and Results of Operations—Liquidity and Capital Resources—Material Indebtedness.” In addition, a number of our credit facilities are secured. For example, the OPC financing agreement and DEORSA’s and DEOCSA’s syndicated facilities, are each secured by certain of our assets. The pledge of a significant percentage of our assets to secure our debt has reduced the amount of collateral that is available for future secured debt or credit support as well as our flexibility in dealing with these secured assets. This level of indebtedness and related security, as well as the terms governing such indebtedness, could have other important consequences for us, including:
| • | increasing our vulnerability to general adverse economic and industry conditions; |
| • | limiting our flexibility in planning for, or reacting to, changes in our business and the industry; |
| • | limiting our ability to enter into long-term power sales or fuel purchases which require credit support; |
| • | limiting our ability to adjust to changing market conditions and placing us at a competitive disadvantage compared to our competitors that are not as highly leveraged; |
| • | limiting our ability to distribute dividends or other payments to our shareholders without leading to a downgrade of our outstanding indebtedness or long-term corporate ratings, if at all; and |
| • | limiting, along with the financial and other restrictive covenants relating to such indebtedness, among other things, our ability to borrow additional funds for working capital including collateral postings, capital expenditures, acquisitions and general corporate or other purposes. |
We also provide performance, and other, guarantees, from time to time, in support of the financing and development of certain of our operating companies. As of June 30, 2016 and December 31, 2015, we had provided performance, or other, guarantees in an aggregate amount of $139 million and $137 million, respectively.
We may be unable to refinance our existing indebtedness or raise additional indebtedness on favorable terms, or at all.
We may need to refinance all, or a portion of, our indebtedness on or before the respective maturity dates. The ability to refinance any such indebtedness, obtain additional financing or comply with our existing lenders’ requirements will depend on, among other things:
| • | our financial condition, or the financial condition of our relevant subsidiaries, at the time of the proposed refinancing; |
45
Table of Contents
| • | the amount of financing outstanding and lender requirements outstanding at the time of the proposed refinancing; |
| • | restrictions in any of our credit agreements, indentures, or other outstanding indebtedness; and |
| • | other factors, including the condition of the financial markets. |
If we do not have adequate access to credit, we may be unable to refinance our existing borrowings and credit facilities on commercially reasonable terms and may be forced to raise financing at a higher cost or on less favorable terms (e.g., by providing collateral, security or guarantees to lenders and/or accepting higher interest rates) when our existing indebtedness matures. Additionally, if we are not able to refinance any of our indebtedness and do not generate sufficient cash flow from operations, and additional borrowings or refinancings or proceeds of asset sales are not available to us, we may not have sufficient cash to enable us to meet all of our obligations. Should future access to capital be unavailable to us, we may have to sell assets or decide not to build new plants or expand or improve existing facilities, any of which could affect our future growth.
If we are unable to manage our interest rate risks effectively, our cash flows and operating results may suffer.
As we continue to draw down on our credit facilities with third parties and raise additional third party financing to fund our capital expenditures (e.g., for use in our development projects and/or acquisitions), we may experience an increase in interest costs. Many of the debt agreements of our operating companies have floating interest rates (e.g., many of the debt instruments are tied to London Interbank Offered Rate, or LIBOR) and a continued increase in interest rates could increase the cost of the capital required to continue to fund our development and expansion efforts. In particular, some of this indebtedness is in the form of Consumer Price Index, or CPI-linked, NIS-denominated bonds. We, or our businesses, may incur further indebtedness in the future that also bears interest at a variable rate or at a rate that is linked to fluctuations in a currency other than the U.S. Dollar.
Although our businesses attempt to manage their interest rate risk by entering into interest rate swaps, there can be no assurance that they will hedge such exposure, in full, effectively or at all in the future. Accordingly, increases in interest rates or changes in the CPI could have a material adverse effect on our or any of our businesses’ business, financial condition, results of operations or liquidity.
Our expansion, development and acquisition strategy may be limited.
Our growth strategy contemplates (1) the expansion, construction or development of power generation facilities and (2) the acquisition, expansion and development of generation and distribution companies in key growth markets. The ability to pursue such growth opportunities successfully will depend upon our ability to identify projects and properties suitable for expansion, construction or acquisitions, and negotiate purchase or engineering, procurement and construction agreements on commercially reasonable terms. Due to growing environmental restrictions, transmission line saturation, obstacles for fuel transportation and a scarcity of sites in which new plants may be located, the development of new assets in the countries in which we operate—such as CDA, Samay I, Kanan and AIE—and in the countries in which we may operate in the future, are subject to increased developmental competition and involve higher development costs than in the past, which could have an adverse impact on our strategy and business.
Additionally, we rely significantly on our ability to successfully access the capital markets as a source of liquidity and such reliance may be increased to the extent that we utilize cash from our operations to distribute funds to our shareholders or repay loans. Our ability to arrange financing with no or limited recourse, and the costs of such capital, are dependent upon numerous factors, some of which are beyond our control. Commercial lending institutions sometimes refuse to provide financing in certain less developed economies, and in these situations we may seek direct or indirect (through credit support or guarantees) project financing from a limited
46
Table of Contents
number of multilateral or bilateral international financial institutions or agencies. As a precondition to making such project financing available, the lending institutions may also require sponsor guarantees for completion risks and governmental guarantees of certain business and sovereign related risks. However, the financing from international financial agencies or governmental guarantees required to complete projects may not be available when needed. If so, we may have to abandon potential projects or invest more of our own funds, which may not be in line with our investment objectives and would leave less funds for other investments and projects.
An inability to identify and source appropriate projects / acquisitions, negotiate the agreements relating to such projects / acquisitions, or secure the necessary funding, could have an adverse impact on our strategy and, as a result, could have a material adverse effect on our business.
Proposed and potential construction or development projects may not be completed or, if completed, may not be completed on time or perform as expected.
We plan to expand our operations through projects constructed on unused land, or greenfield projects. Greenfield projects require us to spend significant sums on engineering, permitting, legal, financial advisory and other expenses in preparation for competitive bids that we may not win or before we determine whether a development project is even feasible, economically attractive or capable of being financed. These activities consume a portion of our management’s focus and could increase our leverage or reduce our consolidated profitability.
Furthermore, once we decide to proceed with a project and, if applicable, enter into a turnkey agreement to commence the construction of a project, its development and construction still involve numerous additional risks, including:
| • | unanticipated cost overruns; |
| • | claims from contractors; |
| • | an inability to obtain financing at affordable rates or at all; |
| • | delays in obtaining necessary permits and licenses, including environmental permits; |
| • | design, engineering, equipment manufacturing, environmental and geological problems and defects; |
| • | adverse changes in the political and regulatory environment in the country in which the project is located; |
| • | opposition by political, environmental and other local groups; |
| • | shortages or increases in the price of equipment, materials or labor; |
| • | work stoppages or other labor disputes; |
| • | adverse weather conditions, natural disasters, accidents or other unforeseen events; and |
| • | an inability to perform under PPAs as a result of any delays in the plants becoming operational or material defects to the plants after reaching COD. |
Any of these risks could result in our financial returns on our projects being lower than expected, or could cause us to operate below expected capacity or availability levels. This, in turn, could result in our experiencing lost revenues and/or increased expenses. Although we maintain insurance to protect against some of
47
Table of Contents
these risks, our insurance coverage may not be sufficient and may not cover some of the costs incurred or profits lost as a result of these risks. As a result, projects may cost more than anticipated and we may be unable to fund principal and interest payments underlying our construction financing obligations, if any. In addition, a default under such a financing obligation could result in us losing our interest in a power generation facility.
For example, our Kanan plant, Samay I plant and the three generating units of CDA reached COD in April 2016, May 2016 and August 2016, respectively. In July 2016, Samay I, Posco (the EPC contractor) and General Electric (the manufacturer of the turbines) inspected the plant’s units, and such inspections revealed damage to the shafts in three of the plant’s four units. As a result, all of the plant’s four units were declared unavailable to the system. Samay I, Posco and General Electric are in the process of testing, analysis and evaluation to determine the root cause of the damage. We have developed a plan to repair the units, and on August 28, 2016, Kenon announced that we expected all four units to be operational within six months. For further information, see “Business—Generation Segment—Peru—Samay I.”
In addition, in August 2015, we acquired 100% of the shares of AIE from Hadera Paper for NIS 60 million (approximately $16 million). AIE, which currently operates an 18 MW plant holds a conditional license for the construction of a cogeneration power station in Israel. We will need to complete the construction of AIE’s facilities, which we expect will cost approximately $250 million (including the consideration paid for the acquisition of AIE). AIE commenced construction of the plant in June 2016, and the AIE plant, which is expected to have a capacity of 140 MW, is expected to reach its COD by the end of 2018. However, there is no guarantee that we will be able to complete AIE’s construction within a timely fashion, at the expected cost, or at all.
Acquisitions may not perform as expected.
We have completed several acquisitions and plan to continue to develop our portfolio through acquisitions in certain attractive markets, including those in which we do not currently operate. For example, in January 2016, we completed our acquisition of Energuate (comprised of two electricity distribution companies in Guatemala (DEORSA and DEOCSA)) and two smaller, related companies (Guatemel and RECSA).
Acquisitions require us to spend significant sums on legal, financial advisory and other expenses and consume a portion of our management’s focus. Acquisitions may increase our leverage or reduce our profitability. Future acquisitions may be large and complex, and we may not be able to complete them successfully or, if completed, such acquisitions may not be completed at the cost or in the time-frame in which they were initially expected.
Although acquired businesses may have significant operating histories at the time we acquire them, we will have no history of owning and operating these businesses and, potentially, limited or no experience operating in these particular lines of business, or operating businesses in the countries in which these acquired businesses are located. For example, prior to our acquisition of Energuate, we had not previously operated or owned companies within the distribution sector, and this may affect our ability to effectively operate Energuate. Future growth in revenues, earnings and cash flow will be partly dependent on our ability to successfully operate within this industry.
Additionally, with respect to our recent acquisition of Energuate and other acquisitions we have made, or may consummate in the future:
| • | acquired businesses may not perform as expected; |
| • | we may incur unforeseen obligations or liabilities, which may entail significant expense; |
| • | the fuel supply needed to operate an acquired generation business at full capacity may not be available; |
48
Table of Contents
| • | acquired businesses may not generate sufficient cash flow to support the indebtedness existing at acquisition, the indebtedness incurred to acquire them or the capital expenditures needed to operate them; |
| • | the rate of return from acquired businesses may be lower than anticipated in our decision to invest our capital to acquire them; |
| • | any benefits gained may not outweigh the management and personnel resources which will need to be diverted from our operations to achieve those benefits; and |
| • | we may not be able to expand as planned, manage the acquired company’s activities and achieve the economies of scale and any expected efficiency or other gains we had planned, which often drive such acquisition decisions. |
Our generation companies may not be able to enter into, or renew existing, long-term contracts for the sale of energy and capacity, contracts which reduce volatility in our results of operations.
Our generation companies sell a substantial majority of their energy under long-term PPAs. Most of our generation companies rely upon PPAs with a limited number of customers for the majority of their energy sales and revenues over the term of such PPAs, which typically range from one to 15 years. Some of our generation companies’ long-term PPAs are at prices above current spot market prices. Depending on market conditions and regulatory regimes, it may be difficult for our generation companies to secure long-term PPAs with new customers, renew existing long-term PPAs as they expire, or enter into long-term PPAs to support the development of new projects. Furthermore, in the case of our generation companies with power plants which are less competitive in the relevant dispatch order (such as older power plants), it may be difficult for these generation companies to enter into long-term PPAs or renew expiring PPAs. As a result, our generation companies have been, and may continue to be, required to sell capacity and energy on the spot market at the rates dictated by such market. For example, following the expiration of CEPP’s PPA in September 2014, CEPP has operated solely as a merchant generator, generating revenue when it has been dispatched during periods when the spot market price in the Dominican Republic exceeded CEPP’s declared marginal cost. Furthermore, as a result of the expiration of certain of Puerto Quetzal’s PPAs in 2015, 38% of Puerto Quetzal’s energy sales were made in the spot market in 2015, whereas only 5% of Puerto Quetzal’s sales were made in the spot market in 2014. The expiration of CEPP and Puerto Quetzal’s respective PPAs has reduced the volume of energy sold by these generators and exposes these generators to the volatility of the spot market in their respective jurisdictions.
In addition, in December 2011, the Bolivian government amended the applicable law to prohibit generation companies from entering into new PPAs. As a result, we will be unable to extend or replace Compañía Boliviana de Energía Eléctrica S.A., or COBEE’s, current PPA, under which we have contracted 18.9% of COBEE’s installed capacity, when it expires in October 2017.
In addition, when the distribution companies in El Salvador organize tenders under the supervision of the General Superintendency of Electricity and Telecommunications (Superintendencia General deElectricidad y Telecomunicaciones), or SIGET, for new long-term PPAs, the bidding rules generally do not permit the participation of HFO-fired generators, such as Nejapa, in tenders for PPAs with terms in excess of five years. An increase in the availability of, and demand for, renewable energy in the other countries in which our generation companies operate could lead to similar prohibitions in those countries and a further reduction in their ability to enter into long-term PPAs.
Furthermore, the introduction of a more efficient energy generation technology could adversely affect the competitiveness of gas-fired energy plants, such as Kallpa, Las Flores, and Samay I in the dispatch order. Similarly, our other generation assets face potential displacements in dispatch merit orders as new, more efficient technologies became available in their markets. Any displacement of dispatch merit orders could affect the competitiveness of our generation assets and thereby impact their ability to enter into long-term PPAs. If our generation companies are unable to enter into long-term PPAs, they may be required to sell electricity into spot
49
Table of Contents
markets at prices that may be below the prices established in their PPAs, including in those countries which are, or may be, experiencing an oversupply in capacity in the short- to medium-term. Because of the volatile nature of power prices, if our generation companies are unable to secure long-term PPAs, they could face increased volatility in their earnings and cash flows and could experience substantial losses during certain periods which could have a material adverse effect on our business, financial condition, results of operations or liquidity.
Supplier concentration may expose us to significant financial credit or performance risk, particularly with respect to those agreements which may expire during the life of our power plants.
We rely on natural gas and HFO to fuel most of our power generation facilities. The delivery of these fuels to our various generation facilities is dependent upon a number of factors, including the continuing financial viability of contractual counterparties and the infrastructure (including barge facilities, roadways and natural gas pipelines) available to serve each generation facility. Any disruption in the fuel delivery infrastructure or failure of a counterparty to perform, may lead to delays, disruptions or curtailments in the production of power at one or more of our generation facilities. This risk of disruption is compounded by the supplier concentration that characterizes many of our operating companies.
We source most of our HFO from a limited number of suppliers. In the event of shipping delays which may affect our suppliers, we may experience delays in the receipt and transportation of our HFO. Additionally, many of our gas suppliers are sole or monopolistic suppliers, and may exercise monopolistic control over their supply of natural gas to us. The Kallpa and Las Flores plants’ generation facilities, for example, rely on a consortium, composed of Pluspetrol Peru Corporation S.A., Pluspetrol Camisea S.A., Hunt Oil Company of Peru L.L.C. Sucursal del Perú, SK Corporation Sucursal Peruana, Sonatrach Peru Corporation S.A.C., Tecpetrol del Perú S.A.C. and Repsol Exploración Perú Sucursal del Perú, which we collectively refer to as the Camisea Consortium, for the provision of natural gas and on a sole supplier for the transportation of such natural gas. If these suppliers cannot perform under their contracts, the Kallpa and Las Flores plants would be unable to generate electricity at their facilities, and such a failure could prevent Kallpa and Las Flores from fulfilling their contractual obligations, which could have a material adverse effect on our business and financial results. Continued supply of natural gas to the Kallpa and Las Flores plants is dependent upon a number of factors, over which we have no control, including:
| • | levels of exploration, drilling, reserves and production of natural gas in the Camisea fields and other areas in Peru and the price of such natural gas; |
| • | accessibility of the Camisea fields and other gas production areas in Peru, which may be affected by weather, natural disasters, geographic and geological conditions, environmental restrictions and regulations, activities of terrorist group or other impediments to access; |
| • | the availability, price and quality of natural gas from alternative sources; |
| • | market conditions for the renewal of such agreements before their expiration and our ability to renew such agreements and the terms of any renewal; and |
| • | the regulatory environment in Peru. |
Upon the commencement of Samay I’s second operational stage, Samay I’s plant will operate as a natural gas-fired power plant, and will be dependent on the provision of natural gas to it by the Camisea Consortium and will also depend upon gas transportation services rendered by Concesionaria Gasoducto Sur Peruano S.A.’s through its natural gas pipeline, which is currently under construction.
Furthermore, as the Camisea Consortium is the principal supplier of natural gas and natural gas transportation services to substantially all generation facilities in Peru fueled by natural gas, a change in the terms
50
Table of Contents
of their agreements with us or other power generators, or a failure by either of these suppliers to meet their contractual obligations, could have a significant effect on Peru’s entire electricity supply and, therefore, prompt the Peruvian governmental authorities to undertake certain remedial actions. Any such actions could adversely affect the operations of the Kallpa or Las Flores plants, or the expected operations of the Samay I plant’s second operational stage.
Similarly, OPC has a gas supply agreement with a single supplier, which provides for the curtailment of OPC’s gas supply in the event of a lack of pipeline capacity. Although OPC has never experienced a significant decline in its gas supply as a result of a lack of pipeline capacity, there can be no assurance that such declines will not occur. OPC also relies on a single transporter for the transport of its natural gas requirements. If such parties are unable to perform under their contracts with OPC, or are forced to curtail, in whole or in part, their supply or transport of natural gas to OPC, OPC would not be able to generate electricity using natural gas, which could adversely affect OPC’s operations and financial performance.
Moreover, certain of our contracts for natural gas are scheduled to expire during the life of the power plants which they service. These contracts have not yet been extended or replaced with one or more contracts on comparable terms. For example, Kallpa, our largest asset, purchases its natural gas requirements for its generation facilities from the Camisea Consortium pursuant to a natural gas supply agreement which expires in June 2022 and which has not yet been extended. If we are unable to renew, or enter into supply contracts and, in particular, enter into long-term supply contracts, we may be required to purchase our natural gas on spot markets at prices that may be significantly greater than the prices we previously paid for such commodities, or may be unable to purchase such commodities on competitive prices at all. As a result, we could face increased volatility in our earnings and cash flows and could experience substantial losses during certain periods which could have a material adverse effect on our business, financial condition, results of operations or liquidity.
Certain of our facilities are affected by climate conditions and changes in the climates or other occurrences of natural phenomena in the countries in which these facilities operate could have a material adverse effect on us.
Certain of our generation facilities are based on hydroelectric power generation. As a result, their operating results are directly impacted by water sources which are, in turn, affected by the amount of rainfall and snowmelt.
The occurrence of natural phenomena, such as El Niño and La Niña, two climactic phenomena that influence rainfall regularity in some of the Latin American countries in which we operate, may result in droughts which affect our results of operations. A prolonged drought in a country in which our generation facilities rely on hydroelectric energy may reduce our ability to operate our hydroelectric plants at full capacity. In addition, a prolonged drought may result in disputes with governments, regulators, local communities, farmers and other stakeholders over water use. As a result of such disputes, we may be forced to enter into agreements which restrict our ability to use water for hydroelectric generation.
Droughts and excessive rainfall also affect the operation of our thermal plants, including those facilities which use natural gas or HFO as fuel, in the following manner:
| • | During periods of drought, thermal plants are used more frequently. Operating costs of thermal plants can be considerably higher than those of hydroelectric plants. Our operating expenses may increase during these periods. |
| • | Our thermal plants require water for cooling and a drought not only reduces the availability of water, but also increases the concentration of chemicals, such as sulfates in the water. The high concentration of chemicals in the water we use for cooling increases the risk of damaging the equipment at our thermal plants as well as the risk of violating relevant environmental regulations. |
51
Table of Contents
As a result, we may have to purchase water from areas that are also experiencing shortages of water. These water purchases may increase our operating costs, as well as the costs relating to our social responsibility commitments. |
| • | Thermal power plants burning gas generate emissions such as sulfur dioxide (SO2) and nitrogen oxide (NOx) gases. When operating with diesel, they also release particulate matter into the atmosphere. Therefore, greater use of thermal plants during periods of drought increases the risk of unsatisfactory performance of the abatement equipment used to control pollutant emissions. |
| • | During excessive rainfall periods, hydroelectric plants increase their generation, which reduces the spot prices in the system, and also reduces the dispatch of thermal power plants. As a result, our thermal plants selling energy to the spot market may face a reduction in their margins due to their lower dispatch or due to sales occurring at the lower spot prices. |
Additionally, certain of our facilities are also exposed to additional climate change risk and to the specific natural phenomena occurring in their respective countries of operation, including earthquakes (due to heightened seismic activity), hurricanes and flooding, landslides, volcanic eruptions, fire, and other natural disasters. For example, in 2007, Peru experienced a 7.9 magnitude earthquake that struck the central coast of Peru. In 2015, Peru has also experienced flooding. The occurrence of any of the natural calamities listed above may cause significant damage to our power stations and facilities.
Furthermore, the production of wind energy depends heavily on suitable wind conditions, which are variable and difficult to predict. Operating results for such plants vary significantly from period to period depending on the wind resource during the periods in question. Therefore, the electricity generated by our wind energy plants may not meet our anticipated production levels or the rated capacity of the turbines located there, which could adversely affect our business.
We could experience severe business disruptions, significant decreases in revenues based on lower demand arising from climate changes or catastrophic events, or significant additional costs to us not otherwise covered by business interruption insurance policies. There may be an important time lag between a major climate change event, accident or catastrophic event and our recovery from any insurance policies, which typically carry non-recoverable deductible amounts, and in any event, are subject to caps per event. Furthermore, many of our supply agreements, including our natural gas supply agreements and transportation services agreements, contain force majeure provisions that allow for the suspension of performance by our counterparties for the duration of certain force majeure events. If a force majeure event were to occur and our counterparties were to temporarily suspend performance under their contracts, we may be forced to find alternative suppliers in the market on short notice (which we may be unable to do) and incur additional costs. Additionally, any of these events could cause adverse effects on the energy demand of some of our customers and of consumers generally in the affected market, the occurrence of which could have a material adverse effect on our business, financial condition, results of operations or liquidity.
We are exposed to electricity spot market, fuel and other commodity price volatility.
Our generation companies purchase and sell electricity in the wholesale spot markets. During the six months ended June 30, 2016 and the years ended December 31, 2015, 2014 and 2013, our generation companies purchased 18%, 17%, 18% and 18% of the electricity that they sold (in GWh) from the spot market, respectively. As a result, we are exposed to spot market prices, which tend to fluctuate substantially. Unlike most other commodities, electric power can only be stored on a very limited basis and generally must be produced concurrently with our use. As a result, power prices are subject to significant volatility from supply and demand imbalances, especially within the spot markets in which we may purchase and sell electricity. Typically, spot market prices for electricity are volatile and the demand for such electricity often reflects the cyclical fluctuating cost of coal, natural gas and oil, rain volumes or the conditions of hydro reservoirs. The Peruvian and Chilean
52
Table of Contents
electricity markets are also indirectly affected by the price of copper, as a result of the electricity-intensive mining industry, which represents a significant source of the electricity demand in these markets. Therefore, a decline in such mining activity could adversely affect us, and any changes in the supply and cost of coal, natural gas and oil, rain volumes, the conditions of hydro reservoirs, the unexpected unavailability of other generating units, or the supply and cost of copper, may impact the volume of electricity demanded by the market. Volatility in market prices for fuel and electricity may result from many factors which are beyond our control and we do not generally engage in hedging transactions to minimize such risks. For further information on the effects of fluctuations in oil prices on our results of operations, see “Management’s Discussion and Analysis of Financial Condition and Results of Operations—Material Factors Affecting Results of Operations—Fluctuations in Oil Prices and Currency Exchange Rates.”
We are exposed to counterparty risks.
Our cash flows and results of operations are dependent upon the continued ability of our generation customers to meet their obligations under their relevant PPAs. Additionally, a small number of customers purchase a significant portion of our output under PPAs that account for a substantial percentage of the anticipated revenue of our generation companies. Although our generation companies evaluate the creditworthiness of their various counterparties, our generation companies may not always be able to, if at all, fully anticipate, detect, or protect against deterioration in a counterparty’s creditworthiness and overall financial condition. The deterioration of creditworthiness or overall financial condition of a material counterparty (or counterparties) could expose us to an increased risk of non-payment or other default under our contracts with them. For example, Compañía de Electricidad de Puerto Plata S.A., or CEPP, our Dominican Republic generation subsidiary, has experienced significant payment delays under its PPAs.
Furthermore, if any of the counterparties to our PPAs were to become insolvent, we may be unable to recover payment under local insolvency laws. For example, under Peruvian insolvency laws, if a private counterparty under any of our PPAs were to become insolvent, our claims with respect to payments due by such counterparty under its relevant contract will rank junior to, among others, the counterparty’s labor, social security, taxes, pension fund and secured obligations. In such a case, our ability to recover payments due on our existing PPAs in Peru may be limited. Any default by any of our key customers could have a material adverse effect on our business, financial condition, results of operations or liquidity.
Our generation businesses rely on power transmission facilities that we do not own or control and that are subject to transmission constraints. If these facilities fail to provide us with adequate transmission capacity, we may be restricted in our ability to deliver wholesale electric power and we may either incur additional costs or forego revenues.
Our generation businesses depend upon transmission facilities owned and operated by others to deliver the wholesale power we sell from our power generation plants. If transmission is disrupted, or if the transmission capacity infrastructure is inadequate, our ability to sell and deliver wholesale power may be adversely impacted. If the power transmission infrastructure in one or more of the markets that we serve is inadequate, our recovery of wholesale costs and profits may be limited. If restrictive transmission price regulation is imposed, the transmission companies may not have sufficient incentive to invest in expansion of transmission infrastructure. We cannot predict whether transmission facilities will be expanded in specific markets to accommodate competitive access to those markets, a failure of which could have a material adverse effect on our business, financial condition, results of operations or liquidity. In addition, in some of the markets in which we operate, different spot prices may occur within the grid as a result of a transmission constraint. As a result, we may need to purchase energy in the spot market in order to fulfill a PPA obligation in one part of the grid, even if we are generating energy in another part of the grid, and such purchase may occur at a spot market price which is higher than our own generation cost.
53
Table of Contents
If any of our generation units are unable to generate energy as a result of a breakdown or other failure, we may be required to purchase energy on the spot market to meet our contractual obligations under the relevant PPAs.
The breakdown or failure of one of our generation facilities may require us to purchase energy in the spot market to meet our contractual obligations under our PPAs, while simultaneously resulting in an increase in the spot market price of energy, resulting in a contraction, or loss, of our margins. In addition, the failure or breakdown of one of our generation units may prevent that particular facility from performing under applicable PPAs which, in certain situations, could result in termination of the PPA or liability for liquidated damages, the occurrence of which could have a material adverse effect on our business, financial condition, results of operations or liquidity. For example, due to unscheduled maintenance of one of its turbines in the first half of 2013, Kallpa was required to make energy purchases on the spot market tomeet its obligations under its PPAs, which increased its cost of sales during this period.
We maintain insurance policies for property value and business interruptions, intended to mitigate any losses due to customary risks. However, we cannot assure you that the scope of damages suffered in such an event would not exceed the policy limits, deductibles, losses, or loss of profits outlined in our insurance coverage. We may be materially and adversely affected if we incur losses that are not fully covered by our insurance policies and such losses could have a material adverse effect on our business, financial condition, results of operations or liquidity. For further information on the risks related to our insurance policies, see “—Our insurance policies may not fully cover damage, and we may not be able to obtain insurance against certain risks.”
Some of the countries in which we operate, or may operate in the future, have experienced terrorist activity and social unrest in the past and it is possible that a resurgence of terrorism in any of these countries could occur in the future.
Some of the countries in which we operate, or may operate in the future, have experienced terrorist activity and social unrest in the past. For example, Peru, the country in which we have our largest operations, experienced terrorist activity that reached its peak of violence against the government and private sector in the late 1980s and early 1990s. In addition, Energuate has experienced violent protests and other hostile activity within its service area from organizations in Guatemala. For the six months ended June 30, 2016, our Peruvian businesses (Kallpa, CDA and Samay I) and Energuate (consisting of DEORSA and DEOCSA) represented 125% and 94% of our net income, respectively, and 40% and 21% of our Adjusted EBITDA, respectively. Any terrorist activities or other hostile actions in Peru, Guatemala or other countries in which we operate could have a material adverse effect on our business, financial condition and results of operation. Adjusted EBITDA is a non-IFRS measure. For a reconciliation of Kallpa, CDA, Samay I, DEORSA and DEOCSA’s net income to their respective Adjusted EBITDA, see “Business—Portfolio Overview.”
The existing security, economic and geopolitical conditions in Israel and the Middle East could affect our operations in Israel. Israel has been and is subject to terrorist activity, with varying levels of severity. Parties with whom we do business have sometimes declined to travel to Israel during periods of heightened unrest or tension, forcing us to make alternative arrangements where necessary. Developments in the political and security situation in Israel may also result in parties with whom we have agreements claiming that they are not obligated to perform their commitments under those agreements pursuant to force majeure provisions. Any deterioration in the security or geopolitical conditions in Israel and/or the Middle East could adversely impact our business relationships and thereby have a material adverse effect on our business, financial condition, results of operations or liquidity.
Israel’s geopolitical situation has led to security issues and, as a result, our Israel-based subsidiary OPC, as well as any additional entities we may develop or acquire in Israel, including AIE, may be exposed to hostile activities (including harm to computer systems or, with respect to our operations, missile attacks on our facilities or attacks on critical infrastructure, such as gas transmission systems or pipelines), security restrictions connected with Israeli bodies/organizations overseas, possible isolations by various bodies for numerous political reasons,
54
Table of Contents
and other limitations. Any of the aforementioned events and conditions could disrupt our and OPC’s operations, which could, in turn, have a material adverse effect on our business, financial condition, results of operations or liquidity. Additionally, should OPC lose its classification as an “essential facility” by the State of Israel, which classification exempts OPC’s key employees from military service in times of emergency, OPC’s employees may be subject to being called upon to perform military service in Israel. Such absence may have an adverse effect upon OPC’s operations, which could, in turn, have a material adverse effect on our business, financial condition, results of operations or liquidity.
Inflation in any of the countries in which we currently, or will, operate could adversely affect us.
If any of the countries in which we currently operate, or in which we may operate in the future, experiences substantial inflation, the costs of our operations could increase and our operating margins could decrease, which could materially and adversely affect our results of operations. A number of the countries in which we operate have experienced significant inflation in prior years, including Peru, our primary country of operation. Inflationary pressures may also impact our margins to the extent that cost increases driven by inflation are not accompanied by corresponding increases in the price of electricity or capacity sold, or limit our ability to trigger the minimum thresholds set forth in the price adjustment mechanisms in our PPAs or long-term supply agreements or access foreign financial markets, and may also prompt government intervention in the economy of the affected country, including the introduction of government policies that may adversely affect the overall performance of such economy. Any of the foregoing could have a material adverse effect on our business, financial condition, results of operations or liquidity.
We have granted rights to the minority shareholders of certain of our subsidiaries.
Although we own a majority of the voting equity in most of our businesses, we have entered into, and may, and in some instances, will be required to, continue to enter into, shareholders’ agreements granting minority rights to the minority shareholders of certain of those entities. For example, we have entered into shareholders’ agreements with, among others, Energía del Pacífico S.A., or Energía del Pacífico, a member of the Quimpac group and the minority shareholder of Kallpa, CDA and Samay I, as well as with Veolia Energy Israel Ltd., or Veolia, the minority shareholder of OPC, and Centrans Energy Services Inc. the minority shareholder of our Nicaraguan assets. Among other things, our shareholders’ agreements generally grant the applicable minority shareholder veto rights over significant acquisitions and dispositions as well as the incurrence of significant debt. Therefore, our ability to develop and operate any of our businesses governed by a shareholders’ agreement may be limited if we are unable to obtain the approval of a minority shareholder for certain corporate actions we deem to be in the best interest of the relevant business. In addition, such shareholders’ agreements may limit our ability to dispose of our interests in any of these businesses. Our operation of our subsidiaries may also subject us to litigation proceedings initiated by the minority shareholders of our subsidiaries. For example, we were involved in litigation proceedings initiated by Crystal Power Corporation Limited, or Crystal Power, who previously held a non-controlling interest in Nejapa, which proceedings resulted in our acquisition of the remaining 29% stake in Nejapa from Crystal Power. For further information on our shareholders’ agreements, see “Business—Shareholders’ Agreements.”
We do not control Pedregal.
We own a minority interest in Pedregal Power Company S.de.R.L, or Pedregal. Pedregal entered into a management services agreement with our wholly-owned subsidiary Inkia Panama Management S.R.L., or Inkia Panama Management, that expired in October 2016, and which we expect to renew in November 2016. Under this agreement, Inkia Panama Management had been designated as the administrator responsible for day-to-day management of Pedregal. Therefore, although we had the right to manage Pedregal, we were still subject to the risk that Pedregal may make business, operational or financial decisions that we did not agree with, as well as the risk that we may have had objectives that differ from those of Pedregal or its controlling shareholder. As such, our ability to control the development and operation of Pedregal has been and may continue to be limited, and we may not be able to realize some or all of the benefits that we expect to realize from our investment in Pedregal. We also may be unable to renew the management services agreement with Pedregal.
55
Table of Contents
In addition, we rely on the internal controls and financial reporting controls of our businesses, including Pedregal, and the failure of our businesses to maintain effective controls or to comply with applicable standards could make it difficult to comply with applicable reporting and audit standards. For example, the preparation of our consolidated financial statements will require the prompt receipt of financial statements from Pedregal. Additionally, in certain circumstances, we may be required to file with our annual reports on Form 20-F, or registration statements filed with the SEC, financial information of Pedregal that has been audited in conformity with SEC rules and regulations and U.S. GAAS audit standards. As we do not control Pedregal, we may not, however, be able to procure such financial statements, or such audited financial statements, as applicable, from Pedregal and this could render us unable to comply with applicable SEC reporting standards.
We could face risks, or barriers to exit, in connection with the disposals or transfers of our businesses or their assets.
We continually assess the strategic composition of our power generation portfolio and may, as a result of our assessments, divest our interests in businesses whose operations are inconsistent with our long-term strategic plan. Divestitures can generate organizational and operational efficiencies, cash for use in our capital investment program and operations, and cash to repay outstanding debt. However, divestitures may also result in a decline in our net income or profitability.
Additionally, we may face exit barriers, including high exit costs or objections from various stakeholders, in connection with dispositions of certain of our operating companies or their assets. For example, pursuant to Israel’s Electricity Sector Law 5756-1996, or Electricity Sector Law, the transfer of control over an entity that holds a generation license in Israel must be approved by the Electricity Authority, or the EA. Additionally, pursuant to OPC’s PPA with IEC and OPC’s syndicated credit agreement, both IEC and OPC’s lenders must consent to our transfer of control of OPC to a third-party. Such restrictions, as well as similar restrictions contained in other shareholders’ agreements or financing agreements in respect of our other operating companies may prohibit us from disposing of our interests in our businesses, and such prohibitions may have a material adverse effect on our development and growth strategy. Furthermore, although we have exported power generation barges (from Guatemala and the Dominican Republic to Panama), we may face opposition from local governments in connection with any decision to sell and/or export any of the power generation barges we have installed or may install from one country to another country.
We require qualified personnel to manage and operate our various businesses and projects.
As a result of our decentralized structure, we require qualified and competent management to independently direct the day-to-day business activities of each of our businesses, execute their respective business and/or project development plans, and service their respective customers, suppliers and other stakeholders, in each case across numerous geographic locations. The services offered by our businesses are highly technical in nature and require specialized training and/or physically demanding work. Therefore, we must be able to retain employees and professionals with the skills necessary to understand the continuously developing needs of our customers, to maximize the value of each of our businesses, and to ensure the timely and successful completion of any expansion or development projects. This includes developing talent and leadership capabilities in the emerging markets in which certain of our businesses operate, where the depth of skilled employees may be limited. Changes in demographics, training requirements and/or the unavailability of qualified personnel could negatively impact the ability of each of our businesses to meet these demands. Unpredictable increases in the demand for our services, or the geographical diversity of our businesses, may exacerbate the risk of not having a sufficient number of trained personnel.
In addition, our operating companies could experience strikes, industrial unrest or work stoppages. In June and November 2015, COBEE’s facilities in Bolivia experienced a brief strike. Although neither of the strikes at our COBEE facilities resulted in a work stoppage nor had a material effect on our results of operations, there can be no assurance that future strikes or industrial unrest will not occur or lead to a work stoppage which
56
Table of Contents
could have an adverse effect on our results of operations. A significant percentage of our employees in Bolivia, Israel and Jamaica are members of unions, and, as of December 31, 2015, approximately 23% of all of our employees were unionized. For further information on our unionized employees, see “Business—Employees.”
If any of our businesses fail to train and retain qualified personnel, or if they experience excessive turnover, strikes or work stoppages, we may experience declining production, maintenance delays or other inefficiencies, increased recruiting, training or relocation costs and other difficulties, any of which could have a material adverse effect on our business, financial condition, results of operations or liquidity.
Our success will also be dependent upon the decision-making of our directors and executive officers as well as the directors and executive officers of our businesses. The loss of any or all of our directors and executive officers could affect the creation or implementation of our short-term plans or long-term strategies or divert our directors and executive officers’ attention from our operations, which could result in a delay in the completion of a project, affect our ability to enter into PPAs, or otherwise have a material adverse effect on our business, financial condition, results of operations or liquidity.
The interruption or failure of our information technology, communication and processing systems or external attacks and invasions of these systems could have an adverse effect on us.
We depend on information technology, communication and processing systems to operate our businesses. Such systems are vital to each of our operating companies’ ability to monitor our power plants’ operations, maintain generation and network performance, adequately generate invoices to customers, achieve operating efficiencies and meet our service targets and standards. Damage to our networks and backup mechanisms may result in service delays or interruptions and limit our ability to provide customers with reliable service over our networks. Some of the risks to our networks and infrastructure include:
| • | physical damage to access lines, including theft, vandalism, terrorism or other similar events; |
| • | energy surges or outages; |
| • | software defects; |
| • | scarcity of network capacity and equipment; |
| • | disruptions beyond our control; |
| • | breaches of security, including cyber-attacks and other external attacks; and |
| • | natural disasters. |
The occurrence of any such event could cause interruptions in service or reduce our generation capacity, either of which could reduce our revenues or cause us to incur additional expenses.
Furthermore, OPC and AIE may be at greater risk for cyber-attacks due to their status as Israeli corporations, as a number of Israeli corporations have been the subject of recent cybersecurity attacks. For example, in January 2016, the EA was the subject of one of the largest cyber-attacks in Israeli history and had to shut down several of its systems in order to address the cyber-attack. Should the EA, IEC, OPC or AIE experience a cyber-attack, this could have a material adverse effect on our business, financial condition or results of operations.
Furthermore, as a distribution company with over 1.6 million customers as of December 31, 2015, Energuate processes and retains certain sensitive and confidential customer information in the ordinary course of
57
Table of Contents
its business. Should Energuate experience a security breach resulting in the misappropriation, loss or unauthorized disclosure of confidential information, this may disrupt Energuate’s business and result in reputational harm and litigation.
Although we have operational insurance with business interruption coverage that may protect us against specific insured events, we may not be insured for all events or for the full amount of the lost margin or additional expense. In addition, the occurrence of any such event may subject us to penalties and other sanctions imposed by the applicable regulatory authorities. The occurrence of damages to our networks and systems could have a material adverse effect on our business, financial condition, results of operations or liquidity.
We are exposed to material litigation and/or administrative proceedings.
We are involved in various litigation proceedings, and may be subject to future litigation proceedings, any of which could result in unfavorable decisions or financial penalties against us, and we will continue to be subject to future litigation proceedings, which could have material adverse consequences to our business.
For example, since 2010, the Peruvian Tax Authority (Superintendencia Nacional de Administración Tributaria), known as SUNAT for its abbreviation in Spanish, has issued tax assessments to Kallpa and its lenders (as lessors under the Kallpa leases) for payment of import taxes allegedly owed by Kallpa and its lenders in connection with the engineering services of the EPC contractors for Kallpa I, II, III and IV. Kallpa and its lenders disputed the tax assessments before SUNAT and, after SUNAT confirmed the assessments, appealed before the Peruvian Tax Administrative Court, or the Tribunal Fiscal. In January 2015, the Tribunal Fiscal rejected Kallpa and its lenders’ appeal in respect of the Kallpa I assessment, and Kallpa subsequently challenged the decision in the Peruvian courts. In order to challenge the administrative ruling of the Tribunal Fiscal in the judicial system, Kallpa and its lenders were required to pay the tax assessment of Kallpa I, plus related interest and fines. In September 2016, the court of first instance denied the challenge brought by Kallpa and its lenders in respect of Kallpa I assessment, and Kallpa and its lenders appealed the decision. A decision of the Tribunal Fiscal of the Kallpa appeals in respect of the Kallpa II and III assessments is still pending. In January 2016, SUNAT issued a ruling in favor of Kallpa, releasing Kallpa from substantially all claims and associated fines related to Kallpa IV. As of June 30, 2016, the total tax exposure related to claims by SUNAT against Kallpa and its lenders in connection with the importation of equipment related to the Kallpa I, II, III and IV projects, equaled S/77 million (approximately $23 million), including interest and fines. For further information on these proceedings, see “Business—Legal Proceedings—Kallpa—Import Tax Assessments.”
Furthermore, in July 2016, the Guatemalan Tax Administrator (Superintendencia de Administración Tributaria), or the SAT, issued a claim against DEORSA and DEOCSA for back taxes for the years 2011 and 2012, alleging that these companies improperly deducted interest and amortization of goodwill relating to the acquisition of these companies in 2011 by their prior owner. DEORSA and DEOCSA have paid $6 million and $11 million for alleged back taxes for 2011 and 2012, respectively, and are required to pay interest and fines for these years in November 2016. The combined amount of interest and fines for these years is estimated to be between $17 million and $24 million; however, the amount is still under discussion with the SAT. In light of the SAT’s actions, and in order to avoid the initiation of complaints by the SAT concerning tax for the years 2013, 2014 and 2015 and any resulting fines and interest, upon instruction of the SAT, DEORSA and DEOCSA revised their tax returns for these years and paid $11 million and $20 million, respectively, corresponding to alleged back taxes and interest for those years. The total payments described above (covering 2011 through 2015) are estimated to be in the range of $65 million to $72 million in the aggregate, depending on the amount of interest and fines for 2011 and 2012.
DEORSA and DEOCSA are disputing the SAT claims and have made all payments subject to a broad reservation of rights, including but not limited to seeking restitution of such payments. DEORSA and DEOCSA and their legal advisors are considering all available remedies with respect to this matter. If DEORSA and DEOCSA are unsuccessful in contesting the claims made by the SAT or seeking compensation for the payments, this will have a material adverse effect on DEORSA and DEOCSA’s respective businesses, financial condition, results of operations and liquidity. Furthermore, if, in the future in light of the court ruling, DEORSA and DEOCSA do not deduct interest and amortization of goodwill relating to the acquisition of these companies in 2011 by their prior
58
Table of Contents
owner, DEORSA and DEOCSA will be subject to higher taxes in the future. In addition, the management of IC Power and Energuate have expended, and will continue to expend, expenses and time to pursue the remedies in connection with these claims. For further information on these claims, see “Business—Legal Proceedings—Energuate Tax Claims.”
Litigation and/or regulatory proceedings are inherently unpredictable, and excessive verdicts do occur. Adverse outcomes in lawsuits and investigations could result in significant monetary damages, including indemnification payments, or injunctive relief that could adversely affect our ability to conduct our business and may have a material adverse effect on our financial condition and results of operations. For example, the Tribunal Fiscal’s decision, with respect to the Kallpa I plant, could have a negative impact on the outstanding rulings and assessments in respect of the Kallpa II and III plants or other plants or projects. In addition, such investigations, claims and lawsuits could involve significant expense and diversion of our management’s attention and resources from other matters, each of which could also have a material adverse effect on our business, financial condition, results of operations or liquidity.
Our insurance policies may not fully cover damage, and we may not be able to obtain insurance against certain risks.
We maintain insurance policies intended to mitigate our losses due to customary risks. These policies cover our assets against loss for physical damage, loss of revenue and also third-party liability. However, we cannot assure you that the scope of damages suffered in the event of a natural disaster or catastrophic event would not exceed the policy limits of our insurance coverage. In addition, we may be required to pay insurance deductibles, which are not recoverable, in order to utilize our insurance policies. We maintain all-risk physical damage coverage for losses resulting from, but not limited to, fire, explosions, floods, windstorms, strikes, riots, mechanical breakdowns and business interruption. Our level of insurance may not be sufficient to fully cover all losses that may arise in the course of our business or insurance covering our various risks may not continue to be available in the future. In addition, we may not be able to obtain insurance on comparable terms in the future. We may be materially and adversely affected if we incur losses that are not fully covered by our insurance policies and such losses could have a material adverse effect on our business, financial condition, results of operations or liquidity. For example, in July 2016, all four of Samay I’s units were declared unavailable to the system due to damage to the shafts in the three of the plant’s four units. We intend to seek coverage for some or all of the costs of the outage through our insurance coverage. However, our insurance coverage may not be sufficient to cover all of our losses. For further information on Samay I’s unavailability, see “Business—Generation Segment—Peru—Samay I.” For further information on our insurance policies, see “Business—Insurance.”
Future expansion into new markets or businesses involves significant costs and risks, and may be unsuccessful.
We are constantly monitoring and assessing development and acquisition opportunities. In particular, we may seek to diversify and expand our operations to certain countries in which we do not currently have a presence, such as Argentina and Mexico, through greenfield development projects and acquisitions. Additionally, in January 2016, we expanded our portfolio by entering into the electricity distribution business through our acquisition of Energuate (comprised of two electricity distribution companies in Guatemala (DEORSA and DEOCSA)) in Guatemala.
Prior to our acquisition of Energuate, we had not operated a distribution business, and we do not have any experience operating in certain of the other countries in which we are considering expansion, such as Argentina and Mexico. In entering into new markets and operating in new businesses, we could face managerial, commercial, technological and regulatory risks. The business strategies, managerial expertise and institutional knowledge that we utilize and have developed over time with regard to power generation in the countries in which we currently operate may not be applicable to the distribution business, or to the energy sectors of the countries in which we are considering expansion.
59
Table of Contents
As expansion into a new market or business will require significant investment of capital and management resources, such expansions will involve many risks, including risks related to:
| • | obtaining the necessary government and regulatory licenses and authorizations to operate; |
| • | the significant capital expenditures required to establish a footprint in these businesses and markets; |
| • | competition from experienced market participants; |
| • | an inability to attract customers, create brand awareness and establish brand credibility; |
| • | an inability to establish relationships with regulators, stakeholders and other market participants; and |
| • | barriers to entry. |
Furthermore, the acquisition of Energuate may not improve, and may even adversely affect, our results of operations, and may expose us to additional risks, liabilities and losses. Additionally, operating the newly-acquired Energuate business will initially involve significant costs and absorb management time and resources and may otherwise distract management from other opportunities or problems in our primary business of power generation and our primary markets, such as Peru and Israel. Similarly, if we acquire companies or assets in new markets such as Argentina and Mexico, we cannot provide assurance that such expansion efforts will be successful, or that we will be able to successfully execute our business plan. If we are unsuccessful in the attempt to expand into new businesses or markets, this could have a material adverse effect on our business, financial condition, results of operations or liquidity.
Risks Related to Government Regulation
The production and profitability of IPPs in Israel may be adversely affected by changes in Israel’s regulatory environment.
The EA, which replaced Israel’s Public Utilities Authority (Electricity), or the PUAE, on January 1, 2016, regulates and supervises, among other things, the provision of essential electric public services in Israel and OPC’s operations can be affected by changes in the EA’s policies, regulations, and tariffs. The EA’s generation component tariff, for example, serves as the base price for OPC’s calculation of the sale price of its energy to its private customers. As a result, its increases or decreases have a related effect on the sales price of OPC’s energy and OPC’s revenues. In addition, the price at which OPC purchases its natural gas from its sole natural gas supplier, the Tamar Group, a group composed of Noble Energy Mediterranean Ltd., or Noble, Delek Drilling Limited Partnership, Isramco Negev 2 Limited Partnership, Avner Oil Exploration Limited Partnership and Dor Gas Exploration Limited Partnership, is predominantly indexed (in excess of 70%) to changes in the EA’s generation component tariff, pursuant to the price formula set forth in OPC’s supply agreement with the Tamar Group. As a result, increases or decreases in this tariff have a related effect on OPC’s cost of sales and margins.
In July 2013, the PUAE published four generation component tariffs/power cost indicators, ranging from NIS 386 per megawatt hour, or MWh, to NIS 333.2 per MWh, instead of the single tariff that had previously been used. In January 2015, the PUAE published new tariffs, which reduced the tariff rates by approximately 10%. In connection with the indexation of their natural gas price formula for OPC’s gas supply agreement with the Tamar Group, OPC and the Tamar Group disagreed as to which of the PUAE’s July 2013 tariffs applied to OPC’s supply agreement and have a similar disagreement with respect to the tariffs published in January 2015. OPC and the Tamar Group remain in discussions with respect to this disagreement.
Additionally, on September 8, 2015, the PUAE published a final decision, which became effective on September 13, 2015, reducing the PUAE generation component tariff by approximately 12% from NIS 300.9 per MWh and NIS 301.5 per MWh to a single tariff of NIS 265.2 per MWh. In October 2016, the EA published a draft decision regarding a further reduction of the generation component tariff. If the draft decision is approved at a public hearing to be held in November 2016, the generation component tariff will be further reduced by approximately 8% from NIS 265.2 per MWh to NIS 242.9 per MWh. The natural gas price formula in OPC’s
60
Table of Contents
supply agreement is subject to a floor mechanism and, as a result of previous declines in the PUAE generation component tariff, OPC began to pay the ultimate floor price in November 2015. Therefore,the potential decline to be considered at the November 2016 public hearing and any further declines in the EA generation component tariff will not result in a corresponding decline in OPC’s natural gas expenses, and will lead to a greater decline in OPC’s margins, which may have a material adverse effect on OPC’s business, results of operations and financial condition.
Furthermore, since 2013, the PUAE had been in the process of determining a system cost tariff. In August 2015, the PUAE published a decision that IPPs in Israel would be obligated to pay system management service charges, which charges are retroactively effective as of June 1, 2013. According to the PUAE decision, as amended in September 2015, the amount of system management service charges that would be payable by OPC from the effective date of June 1, 2013 to June 30, 2015, was approximately NIS 159 million (approximately $41 million), excluding interest rate and linkage costs, based upon the “average rate” of the system management service charges. However, as the rate of the new system management service charges, like other rates of the EA, varies by season (e.g., summer and winter) and by demand period (peak, shoulder and off-peak), IEC’s final calculation of the amount payable by OPC was based upon the applicable time of use rates, which provides different energy rates for different seasons (e.g., summer and winter) and different periods of time during the day, or “Time of Use” rates. In December 2015, OPC received an invoice from IEC (in its capacity as the system manager) regarding the NIS 163 million (approximately $43 million) amount of system management service charges that would be payable by OPC for such period, including interest rate and linkage costs. In February 2016, OPC paid NIS154 million (approximately $41 million) to IEC in satisfaction of this amount (excluding the interest rate, and linkage costs). For further information on Israel’s seasonality and the related EA tariffs, see “Industry—Industry Overview—Israel.” For further information on the effect of EA tariffs on our revenues and margins, see “Management’s Discussion and Analysis of Financial Condition and Results of Operations—Material Factors Affecting Results of Operations—EA Tariffs Affect our Results in our Generation Business’ Israel Segment.”
Additionally, a steering committee was appointed by the State of Israel in July 2013 to propose a comprehensive reform of IEC. Although the steering committee had not published its final recommendations, and there had not been any formal announcements concerning the steering committee’s discussions or negotiations with IEC and the State of Israel for some time, in November 2015 the steering committee announced that it had resumed its discussions regarding comprehensive reform of IEC and the Israeli electricity market. If OPC incurs significant costs or experiences a further reduction in revenues or margins as a result of changes in regulation or the establishment of any new regimes or the implementation of any such laws or governmental regulations, this could have a material adverse effect on our business, financial condition, results of operations or liquidity. For further information on the regulation of the Israeli electricity sector, see “Business—Regulatory, Environmental and Compliance Matters—Regulation of the Israeli Electricity Sector—EA.”
Governments have a high degree of influence in the countries in which we operate.
We operate in 11 countries and therefore are subject to significant and diverse government regulation. The laws and regulations affecting our operations are complex, dynamic and subject to new interpretations or changes. Such regulations affect almost every aspect of our businesses, have broad application and, to a certain extent, limit management’s ability to independently make and implement decisions regarding numerous operational matters. Additionally, governments in many of the markets in which we operate frequently intervene in the economy and occasionally make significant changes in monetary, credit, industry and other policies and regulations. Government actions to control inflation and other policies and regulations have often involved, among other measures, price controls, currency devaluations, capital controls and limits on imports. We have no control over, and cannot predict, what measures or policies governments may enact in the future. The results of operations and financial condition of our businesses may be adversely affected by changes in governmental policy or regulations in the jurisdictions in which we operate if those changes impact, among other things:
| • | consumption of electricity and natural gas; |
| • | supply of electricity and natural gas; |
61
Table of Contents
| • | operation and maintenance of generation, transmission or distribution facilities, including the receipt of provisional and/or permanent operational licenses; |
| • | tariffs or royalties on the use of water for hydroelectric or thermal plants; |
| • | energy policy; |
| • | rules governing the dispatch merit order; |
| • | key permits or operating licenses that we currently hold; |
| • | calculations of marginal costs or spot prices; |
| • | subsidies and incentives; |
| • | regulated rates and tariffs, including under PPAs where tariffs are based on regulated rates; |
| • | labor or other laws; |
| • | the regulatory and environmental legal framework, including the costs of complying with environmental and energy regulations; |
| • | mandatory salary increases; |
| • | public consultations for new projects; |
| • | social responsibility obligations; |
| • | economic growth; |
| • | currency fluctuations and inflation; |
| • | fiscal policy and interest rates; |
| • | capital control policies and liquidity of domestic capital and lending markets; |
| • | tax laws, including the effect of tax laws on distributions from our subsidiaries; |
| • | import/export restrictions; |
| • | acquisitions, construction, or dispositions of power assets; and |
| • | other political, social and economic developments in or affecting the countries in which our operating companies are based. |
Uncertainty over whether governments will implement changes in policy or regulations affecting these or other factors in the future may also contribute to economic uncertainty and heightened volatility in the securities markets or local economies including, for example, increasing volatility in local exchange rates.
Existing or future legislation and regulation or future audits could require material expenditures by us or otherwise have a material adverse effect on our operations. For example, Peruvian regulators have increased their reviews of permitting, licensing and concession applications and have recently imposed time limits on newly-
62
Table of Contents
granted licenses and concessions. Additionally, a regulation that provides that non-regulated customers shall be granted access to the spot market was published in July 2016. This regulation establishes that only large non-regulated customers can access the spot market to cover up to 10% of their maximum demand registered in the last 12 months. However, this statute is not yet enforceable, as the complementary regulatory rules required for its implementation have not yet been approved. Therefore, it remains uncertain as to how such access will be implemented and the impact such access may have on power companies in Peru, including our Peruvian assets. The provision of such access could result in increased competition in the Peruvian generation sector and/or result in increased pressures to reduce contractual prices in Peru. Furthermore, the recent presidential and congressional elections in Peru may impact the development of certain industries, affect the interpretation of existing legislation, or result in the enactment of additional regulations, actions or agencies, which may result in changes in regulations in Peru that adversely affect our business. Peruvian regulators may also enact processes to expand generation capacity in Peru in excess of the rate of demand growth, which expansion could therefore have a negative impact on spot and contractual prices in Peru, which in turn could reduce the margins of our Peruvian assets. Moreover, Peruvian regulators may amend the rules that govern how natural gas prices in Peru are determined and such prices are used to determine the variable fuel cost of thermal generation units that burn such fuel. As a result, any such amendment may affect the order of dispatch of thermal generation units in the Peruvian system (such as Kallpa or Samay I), which may have a material adverse effect on our margins or results of operations.
Additionally, government agencies could take enforcement actions against us and impose sanctions or penalties on us for failure to comply with applicable regulations. Depending on the severity of the infraction, enforcement actions could include the closure or suspension of operations, the imposition of fines or other remedial measures, and the revocation of licenses. Compliance with enhanced regulations could force us to make capital expenditures and divert funds away from planned investments in a manner that could have a material adverse effect on our business, financial condition, results of operations or liquidity.
Due to populist political trends that have become more prevalent in certain of the countries in which we operate over recent years, some of the governments or authorities in countries where we operate might seek to promote efforts to increase government involvement in regulating economic activity, including the energy sector, which could result in the introduction of additional political factors in economic decisions. For example, Bolivia has nationalized natural gas and petroleum assets, as well as generation companies that compete with us. Bolivia has also dictated mandatory salary increases for both public and private companies, affecting the profitability of our company in Bolivia, COBEE. For further information on the risks related to the Bolivian government’s recent nationalization of certain generation companies, see “—The Government of Bolivia has nationalized energy industry assets, and our remaining operations in Bolivia may also be nationalized.”
If we fail to comply with existing regulations and legislation, or reinterpretations of existing regulations and new legislation or regulations, such as those relating to the reduction of anti-competitive conduct, air and water quality, ecological waterflow for hydroelectric plants, noise avoidance, electromagnetic radiation, fuel and other storage facilities, volatile materials, renewable portfolio standards, cybersecurity, emissions or air quality social responsibility, obligations or public consultations, performance standards, climate change, hazardous and solid waste transportation and disposal, protected species and other environmental matters, or changes in the nature of the energy regulatory process, this may have a significant adverse impact on our financial results.
We are also subject to regulatory risks as a result of our acquisition of Energuate in January 2016. For further information on the regulatory risks related to Energuate, see “—Risks Related to Our Acquisition of Energuate—Energuate is subject to comprehensive regulation of its business, which may affect our financial performance.”
63
Table of Contents
The Bolivian government has nationalized energy industry assets, and our remaining operations in Bolivia may also be nationalized.
Bolivia has experienced political and economic instability that has resulted in significant changes in its general economic policies and regulations and the adoption of a new constitution in 2006 that, among other things, prohibits private ownership of certain oil and gas resources. In May 2010, the Bolivian government nationalized Empresa Eléctrica Guaracachi S.A., or Guaracachi, Empresa Eléctrica Valle Hermoso S.A., or Valle Hermoso and Empresa Eléctrica Corani S.A., or Corani, each a significant generation company in Bolivia. In May 2012, the Bolivian government nationalized Transportadora de Electricidad S.A., a transmission company that had previously operated as a subsidiary of Red Eléctrica de España. In December 2012, Electricidad de La Paz S.A. (Electropaz) and Empresa de Luz y Fuerza de Oruro S.A. (Elfeo)—companies which had no previous ownership relationship with the Bolivian government—were also nationalized.
Although there were elections in Bolivia during the third quarter of 2014, and such elections resulted in the re-election of certain key government officials, it is unclear whether the Bolivian government will continue nationalizing entities involved in its power utility market. It is also unclear whether such nationalization (if any) would be adequately compensated for by the Bolivian government. Our subsidiary COBEE is one of the few remaining privately-held generation companies in Bolivia. Although we believe our circumstances differ from those of the nationalized generation companies (because COBEE was not previously owned by the Bolivian government), there is a risk that COBEE will be subject to nationalization. Such nationalization may include the expropriation or nullification of our existing concessions, licenses, permits, agreements and contracts, as well as effective nationalization resulting from changes in Bolivian regulatory restrictions or taxes, among other things, that could have an adverse impact on COBEE’s profitability. If COBEE were indeed nationalized, we cannot assure you that we would receive fair compensation for our interests in COBEE.
We could face nationalization risks in other countries as well. The nationalization of any of our operating companies or power generation plants, even if fair compensation for such nationalization is received, could have a material adverse effect on our business, financial condition, results of operations or liquidity.
Our business and profitability may be adversely affected if water rights are limited or denied.
Certain of our generation facilities rely on hydroelectric power generation. For instance, in Bolivia, our COBEE facilities generate power from, among others, ten run-of-the-river hydroelectric plants in the Zongo river valley and four run-of-the-river hydroelectric plants in the Miguillas river valley. In addition, we recently developed the CDA plant, a 510 MW run-of-the-river hydroelectric project in Peru.
We own water rights in Bolivia granted by the Bolivian Ministry of Energy and Hydrocarbons and in Peru, granted by the National Water Authority (ANA—Autoridad Nacional del Agua). From time to time, local governments and regulators may amend regulations pertaining to water rights. Furthermore, we may be unable to obtain, or otherwise experience difficulty in obtaining, water rights in connection with the construction of new hydroelectric plants, which may impact the viability, design, timing or profitability of a project. Local governments may also try to impose a royalty or tariff for water use on our hydroelectric plants. In addition, several plants are required to leave a percentage of the water available in the river and therefore may not utilize such water in their generation activities (this reserve is commonly referred to as the ‘ecological waterflow’). Local governments may decide to enact a change in the regulation or in the calculation of the ecological waterflow, thereby reducing available volumes of water for power generation in our plants. Any limitations on our current water rights, our ability to obtain additional water rights, or our ability to effectively utilize our existing rights, could have a material adverse effect on our current hydroelectric plants and our hydroelectric projects.
64
Table of Contents
Our equipment, facilities, operations and new projects are subject to numerous environmental, health and safety laws and regulations.
We are subject to a broad range of environmental, health and safety laws and regulations which require us to incur ongoing costs and capital expenditures and expose us to substantial liabilities in the event of non-compliance. These laws and regulations require us to, among other things, minimize risks to the natural and social environment while maintaining the quality, safety and efficiency of our facilities. Furthermore, as our operations are subject to various operational hazards, including personal injury and the loss of life, we are subject to laws and regulations that provide for the health and safety of our employees.
These laws and regulations also require us to obtain and maintain environmental permits, licenses and approvals for the construction of new facilities or the installation and operation of new equipment required for our business. Some of these permits, licenses and approvals are subject to periodic renewal. Government environmental agencies could take enforcement actions against us for any failure to comply with applicable laws and regulations. Such enforcement actions could include, among other things, the imposition of fines, revocation of licenses, suspension of operations or imposition of criminal liability for non-compliance. Environmental laws and regulations can also impose strict liability for the environmental remediation of spills and discharges of hazardous materials and wastes and require us to indemnify or reimburse third parties for environmental damages. As fuel leaks may occur when fuel is received from containerships at sea (as is the case for fuel received in El Salvador and the Dominican Republic), sea water may be inadvertently polluted at the time of fuel receipt; our primary operational environmental risk relates to the potential leaking of such fuel. Although we have operating procedures in place to minimize these, and other, environmental risks, there is no assurance that such procedures will prove successful in avoiding inadvertent spills or discharges.
We expect the enforcement of environmental, health and safety rules to become more stringent over time, making our ability to comply with the applicable requirements and obtain permits and licenses in a timely fashion more difficult. Additionally, compliance with changed or new environmental, health and safety regulations could require us to make significant capital investments in additional pollution controls or process modifications. These expenditures may not be recoverable and may consequently divert funds away from planned investments in a manner that could have a material adverse effect on our business, financial condition, results of operations or liquidity.
While we intend to adopt, and believe that each of our businesses has adopted, appropriate risk management and compliance programs, the nature of our operations means that legal and compliance risks will continue to exist and additional legal proceedings and other contingencies, the outcome of which cannot be predicted with certainty, will arise from time to time. No assurances can be made that we will be found to be operating in compliance with, or be able to detect violations of, any existing or future laws or regulations. A failure to comply with or properly anticipate applicable laws or regulations could have a material adverse effect on our business, financial condition, results of operations or liquidity.
In the case of new project developments, environmental or other regulations may change during the course of our development of such projects, potentially increasing the costs of such projects or making them inviable projects for completion.
Foreign exchange rate fluctuations and controls could have a material adverse effect on our earnings and the strength of our statement of financial position.
Through our businesses, we have facilities and generate costs and revenues in a number of countries in Latin America, the Caribbean and Israel. Although our costs and revenues are generally denominated in the U.S. Dollar, or are linked to the U.S. Dollar as a result of our PPAs or supply agreements, OPC’s revenues, operating expenses, assets and liabilities are denominated in New Israeli Shekels. Therefore, significant fluctuations in the New Israeli Shekel against the U.S. Dollar could have a material adverse effect on our
65
Table of Contents
margins, earnings and the strength of our balance sheet. In our other countries of operation, which generally have a direct or indirect link to the U.S. Dollar, the effects of the indexation may materialize on a delayed basis or may require a minimum threshold to be triggered; inflationary pressures, which impact exchange rate fluctuations, may also impact our margins to the extent that cost increases driven by inflation are not accompanied by corresponding increases in the price of electricity or capacity sold. In addition, some costs, such as payroll and taxes, are normally denominated in local currency, and this denomination exposes us to the foreign exchange fluctuations of the relevant local currency vis-a-vis the U.S. Dollar. Furthermore, Energuate operates, in part, in Guatemalan Quetzales. Therefore, significant fluctuations in the Guatemalan Quetzal against the U.S. Dollar could have a material adverse effect on our earnings and financial condition.
Additionally, our businesses may pay distributions or make payments to us in currencies other than the U.S. Dollar, which we must convert to U.S. Dollars prior to making dividends or other distributions to our shareholders if we decide to make any distributions in the future. Foreign exchange controls in countries in which our businesses operate may further limit our ability to repatriate funds or otherwise convert local currencies into U.S. Dollars. Although exchange rates within Peru, for example, are determined by market conditions, with regular purchase and sale operations by the Peruvian Central Reserve Bank (Banco Central de Reserva del Perú) in the foreign exchange market in order to reduce volatility in the value of Peru’s currency against the U.S. Dollar, this has not always been the case. Should the relevant regulatory bodies in any of the countries in which we operate institute protectionist and interventionist laws and policies or restrictive exchange rate policies in the future, such policies could have a material adverse effect on our operating companies or our financial condition, results of operations or liquidity.
Consequently, as with any international business, our liquidity, earnings, expenses, asset book value, and/or amount of equity may be materially affected by short-term or long-term exchange rate movements or controls. Such movements may give rise to, among other risks, translation risk, which exists where the currency in which the results of a business are reported differs from the underlying currency in which the business’ operations are transacted, which could have a material adverse effect on our business, financial condition, results of operations or liquidity. For further information on the effect of the exchange rates on our results of operations see “Management’s Discussion and Analysis of Financial Condition and Results of Operations—Material Factors Affecting Results of Operations—Fluctuations in Oil Prices and Currency Exchange Rates.”
Our growth may be limited by antitrust laws.
We have acquired a number of operating power generation companies. In the future, we may seek to expand our operations within any of the countries in which we currently, or may in the future, operate. Government policies, specifically antitrust and competition laws in these relevant countries, can impact our ability to execute this strategy successfully.
In Peru, for example, the National Institute for the Defense of Competition and Intellectual Property Protection (Instituto Nacional de Defensa de la Competencia y de la Protección de la Propiedad Intelectual), or INDECOPI, the Peruvian antitrust regulator, reviews acquisition agreements that may result in vertical or horizontal market concentration in the electricity sector and, in connection with such review, may impose conditions upon the parties to such agreements, according to Law 26876 and its regulation, Supreme Decree No. 017-98-ITINCI.
Similarly, in Israel, the Antitrust Authority is authorized to prevent market power accumulation through the regulation of mergers in Israel. Additionally, our expansion activities in Israel may be limited by the Law for Promotion of Competition and Reduction of Concentration—2013, or the Concentration Law. Pursuant to such law, if we, or a company controlled by us, intends to obtain or purchase a license for the production of electricity in the future for a power plant which exceeds 175 MW, such obtainment or purchase will be subject to the procedures set forth in the Concentration Law. In addition to the above limitation, under the Concentration Law, the EA (which in January 2016 replaced the PUAE) has the authority (following consultation with the Antitrust
66
Table of Contents
Authority) to determine competition guidelines and rules regarding the allocation of licenses for the production of electricity. Accordingly, in March 2015, the PUAE published its guidelines, which stipulate that: (1) the maximum capacity of electricity production facilities, using conventional and cogeneration technologies, held or controlled by one person, is capped at MW 1,600, and (2) a person may not hold or control a dominant market share in any particular production technology (e.g., conventional or cogeneration). According to the guidelines, holdings of 40% of the total installed capacity of any particular technology in Israel shall be deemed to raise anti-trust concerns. Entities deemed to be under common control with us would be considered to have capacity of a single person. Therefore, the capacity of entities which may be considered to be under common control with us may prevent IC Power from effecting certain acquisitions or otherwise increasing our operations in Israel.
Additionally, we may consider disposing of certain assets, or equity interests in certain of our operating assets, to further our development and operational expansion. Such dispositions may also be impacted by antitrust and competition laws in the countries in which we operate, if the acquirers of such interest have significant interests in the power generation market, or the purported transaction may cross any of the applicable legal thresholds. For example, our 2014 sale of our 21% indirect interest in Edegel to Edegel’s indirect controlling shareholder was subject to regulatory approval from INDECOPI.
We could be adversely affected by violations of the U.S. Foreign Corrupt Practices Act and similar anti-bribery laws outside of the United States.
The U.S. Foreign Corrupt Practices Act, or the FCPA, and similar anti-bribery laws in other jurisdictions generally prohibit companies and their intermediaries from making improper payments to government officials or other persons for the purpose of obtaining or retaining business. Recent years have seen a substantial increase in anti-bribery law enforcement activity, with more frequent and aggressive investigations and enforcement proceedings by both the Department of Justice and the SEC, increased enforcement activity by non-U.S. regulators, and increases in criminal and civil proceedings brought against companies and individuals. Our policies mandate compliance with these anti-bribery laws. We operate, through our businesses, in countries that are recognized as having governmental and commercial corruption. Additionally, because many of our customers and end users are involved in infrastructure construction and energy production, they are often subject to increased scrutiny by regulators. We cannot assure you that our internal control policies and procedures will protect us from reckless or criminal acts committed by our employees, the employees of any of our businesses, or third party intermediaries. In the event that we believe or have reason to believe that our employees or agents have or may have violated applicable anti-corruption laws, including the FCPA, we may be required to investigate or have outside counsel investigate the relevant facts and circumstances, which can be expensive and require significant time and attention from senior management. Violations of these laws may result in criminal or civil sanctions, inability to do business with existing or future business partners (either as a result of express prohibitions or to avoid the appearance of impropriety), injunctions against future conduct, profit disgorgements, disqualifications from directly or indirectly engaging in certain types of businesses, the loss of business permits or other restrictions which could disrupt our business and have a material adverse effect on our business, financial condition, results of operations or liquidity.
Risks Related to Our Acquisition of Energuate
We may not achieve the expected benefits of the Energuate acquisition.
In January 2016, we acquired Energuate (comprised of two electricity distribution companies in Guatemala (DEORSA and DEOCSA)), with the expectation that this acquisition would result in various benefits to us, including a successful initial entry into the electricity distribution sector. Some of those benefits may not be achieved or, if achieved, may not be achieved at the cost or in the time-frame in which they are expected. Whether we will actually realize the anticipated benefits depends on future events and circumstances, some of which, including market and regulatory conditions, are beyond our control. Future growth in revenues, earnings and cash flow of Energuate will be partly dependent on future economic conditions in Guatemala and conditions in the Guatemalan electricity distribution industry.
67
Table of Contents
Furthermore, the Energuate acquisition represents our initial entry into the electricity distribution business, and we do not have prior experience operating such a business. In addition, we may experience difficulties in integrating Energuate’s financial reporting, which could result in our disclosure controls and procedures and internal controls over financial reporting being considered ineffective. While we are in the process of evaluating and integrating Energuate’s system of controls into our business, we may be unsuccessful in doing so in a timely manner.
The tariffs that Energuate charges for the distribution of electricity are determined by CNEE, and unfavorable changes to the distribution tariffs could have a material adverse effect on our results of operations.
The price that Energuate charges consumers for electricity distributed is based on distribution tariffs, consisting of an electricity charge and a Value Added by Distribution (Valor Agregado de Distribución), or VAD, charge, which is determined on the basis of legal and regulatory proceedings by the National Electric Energy Commission of Guatemala (Comisión Nacional de Energía Eléctrica), or CNEE, every five years. There are seven different tariffs that are applicable to Energuate’s regulated customers, and each of Energuate’s regulated customers purchases electricity at one of these tariff rates. The VAD component of the distribution tariff is revised every five years with semi-annual adjustments for inflation and local currency exchange rates against the U.S. Dollar. The tariffs are set by the CNEE.
The process of establishing the distribution tariffs involves several parties, including distribution companies, and takes place over several stages. While the tariffs are intended to be set on the basis of objective criteria, the CNEE can exercise discretion. The CNEE will reassess the VAD charge in January 2019. If the CNEE revises the distribution tariff in a manner that is not satisfactory to us, due to, among other things, political pressure or an economic crisis, such a revision may have a material adverse effect on our business, financial condition or results of operations. In addition, if the semi-annual adjustments to the VAD component of the distribution tariff are insufficient to fully account for inflation or exchange rate fluctuations, these adjustments may have a material adverse effect on our business, financial condition or results of operations. For further information on the regulation of the Guatemalan electricity distribution sector, “Business—Regulatory, Environmental and Compliance Matters—Regulation of the Guatemalan Electricity Distribution Market.”
We will be required to make significant capital expenditures to improve Energuate’s transmission grid and service quality and reduce electricity losses.
We believe that additional capital expenditures will be required to, among other things, modernize Energuate’s transmission grid, improve service quality and customer satisfaction levels and reduce electricity losses. As such, we intend to invest approximately $30 million in Energuate’s capital expenditures in 2016, and expect that our capital expenditures will increase in the coming years. We may finance this capital expenditure program through cash on hand, internally generated funds or financing from the domestic and international capital markets. Our ability to make these capital expenditures depends on a variety of factors, including our access to domestic and international capital markets, the results of our other subsidiaries and a variety of operating, regulatory or other contingencies. We may not have the financial resources to make the necessary capital expenditures in a timely manner. In addition, should the CNEE’s revision to the distribution tariffs Energuate charges to its regulated customers be unfavorable to us, we may be unable to recoup the costs of our capital expenditure program. A failure to make the necessary capital expenditures in a timely manner and recoup the cost of such program could have a material adverse effect on our business, financial condition, results of operations or liquidity.
68
Table of Contents
A slowdown in the growth of electricity demand in Guatemala could adversely affect Energuate’s business, financial condition and results of operations.
In times of economic crisis, electricity demand in Guatemala has grown at lower rates due to declines in overall levels of economic activity and has resulted in the deterioration of the ability of many consumers to pay their electricity bills. A slowdown in the growth of electricity sales or demand or a decline in collection rates from customers due to a deterioration of Guatemalan economic conditions may have a material adverse effect on our business, financial condition, results of operations or liquidity. Any such slowdown could also result in Energuate having more contracted capacity than is actually needed due to a decrease in electricity demand, resulting in higher tariffs that could trigger social unrest and/or political pressures.
If Energuate is unable to successfully control electricity losses, our results of operations could be adversely affected.
Energuate experiences two types of electricity losses: technical losses and commercial losses. Technical losses occur in the ordinary course of Energuate’s distribution of electricity and include losses due to energy dissipation in conductors and magnetic losses in transformers, while commercial losses result from customers’ illegal connections, fraud and billing errors. Energuate’s technical losses in the six months ended June 30, 2016 and the years ended December 31, 2015 and 2014 were 10.6% of its total energy received during each period, and its commercial losses in the six months ended June 30, 2016 and the years ended December 31, 2015 and 2014 were 7.3%, 6.7% and 7.1% of its total energy received, respectively. The distribution tariffs that Energuate charges its regulated customers include a VAD component, which provides for an allowance determined by the CNEE for losses incurred in the distribution of electricity. To the extent that Energuate’s electricity losses exceed the approximately 14% allowance (which includes both technical and commercial losses) contemplated in the current formula of the VAD component of the distribution tariff, Energuate will bear the cost of such losses.
We intend to reduce commercial losses through improving customer billing practices, increasing targeted inspections and meter replacements, implementing a communication program with local communities and modernizing Energuate’s facilities to reduce tampering, especially in areas where electricity theft has been more prevalent, and we intend to reduce technical losses by investing in the modernization of Energuate’s transmission grid and distribution system. However, these strategies may not effectively combat Energuate’s electricity losses. Should Energuate’s electricity losses remain high or increase, this could have a material adverse effect on our business, financial condition, results of operations or liquidity.
Defaults by Energuate’s consumers due to, among other causes, a reduction in subsidies, could adversely affect our business, results of operations and/or financial condition.
Energuate records a provision for doubtful receivables for past due receivables owed by its customers. Energuate has been, and may continue to be, unable to collect amounts payable from numerous consumers in arrears. If such debts are not totally or partially settled, this may have a material adverse effect on our business, financial condition and results of operations or liquidity. Additionally, the amount of receivables that we are unable to collect may exceed the provision that we have constituted. Should the amount of debts in arrears from Energuate’s consumers exceed the amounts we have provisioned, this could have a material adverse effect on our business, financial conditions, results of operations or liquidity.
The National Electrification Institute of Guatemala (Instituto Nacional de Electrificación), or INDE, currently provides electricity rate subsidies for low-income customers to assist in their payment of their electricity bills, and a significant percentage of Energuate’s regulated customers rely on subsidies from INDE. Due to budgetary constraints, INDE may be required to reduce the subsidies it provides to low-income customers. Should INDE reduce electricity rate subsidies, Energuate’s customers may be unable to bear the cost of their electricity, leading to a decrease in collection rates and an increase in doubtful receivables, which could have a material adverse effect on our business, financial condition, results of operations or liquidity.
69
Table of Contents
Energuate is subject to comprehensive regulation of its business, which may affect our financial performance.
Energuate’s business is subject to extensive regulation by various Guatemalan regulatory authorities, particularly the CNEE. The CNEE regulates and oversees Guatemala’s electricity sector, and establishes Energuate’s distribution tariffs. If Energuate’s contracted capacity and electricity under its PPAs is insufficient to meet customer demand, Energuate will either have to purchase electricity on the spot market or there may be rolling blackouts. Energuate may only make energy purchases on the spot market if authorized by the CNEE. If
Energuate purchases energy in the spot market without CNEE’s authorization, Energuate will be subject to a fine imposed by the CNEE and could result in Energuate not being permitted to pass through the costs associated with the spot market purchases to consumers. If Energuate is obligated by the CNEE to make additional and unexpected capital expenditures and is not allowed to adjust its tariffs accordingly, Energuate will have to bear the cost of these purchases and this may have an adverse effect on Energuate’s business, financial conditions and results of operations.
Furthermore, Energuate has been, and in the future may continue to be, subject to significant fines and penalties by regulatory authorities for, among others, failure to meet quality and delivery standards, some of which may be due to causes out of Energuate’s control, such as service disruptions attributable to problems at generation facilities. Fines relating to Energuate’s failure to meet any quality or delivery standards related to services rendered to customers are payable by granting credits to its customers to offset a portion of their electricity charges, while those not directly related to customers are paid directly to CNEE. In the year ended December 31, 2015, DEORSA and DEOCSA paid fines and penalties of $304 thousand and $199 thousand, respectively, as compared to $393 thousand and $256 thousand, respectively, in the year ended December 31, 2014. In addition, Energuate is currently subject to ongoing proceedings with respect to fines and penalties for failure to meet quality and delivery standards, which may have a material adverse effect on our business, financial condition and results of operations. If Energuate fails to comply with any of these conditions, the Guatemalan government may seek to impose fines and penalties on us, terminate Energuate’s authorizations, or require the sale of Energuate’s assets in satisfaction of any fines and penalties imposed on us, each of which could have a material adverse effect on our business, financial condition and results of operations. For further information on claims against Energuate relating to its service standards, see “Business—Legal Proceedings—Claims Relating to Energuate’s Technical Service Quality.”
In addition, electricity is a utility with high social impact, particularly within the service areas in which Energuate operates. As such, there is frequent public debate and pressure to modify the regulatory framework for the Guatemalan electricity industry. From time to time, various proposals are made to modify the electricity regulatory framework, and such proposals, if implemented, may affect Energuate’s ability to conduct its operations profitably, or at all. In addition, in 2016, a new president was inaugurated in Guatemala, and the new administration may seek to modify the electricity regulatory framework. Both the implementation of Energuate’s strategy for growth and its day-to-day business may be adversely affected by governmental actions, including changes to current legislation, the termination of national and local authorization licenses or permits, the forced sale of Energuate’s distribution assets in a public auction, the creation of more rigid criteria for qualification in public energy auctions, a delay in the revision and implementation of new tariffs or a modification of the tariff regime.
Energuate’s authorizations can be terminated if its service levels fall below those required by its authorization agreements with the MEM.
Energuate conducts its electricity distribution business pursuant to authorization agreements which were executed between DEORSA and the MEM and DEOCSA and the MEM. The authorization agreements require Energuate to comply with certain service and quality standards. CNEE may impose fines in cases where DEORSA and/or DEOCSA fail to meet certain levels of service, quality standards, or meet customer satisfaction. These procedures may ultimately result in the MEM’s revocation of Energuate’s authorizations pursuant to the regulations under the General Electricity Law. In the event that Energuate’s authorizations are terminated,
70
Table of Contents
Energuate’s distribution assets may, after a series of proceedings, be sold in a public auction, as provided for in the General Electricity Law. In addition, Energuate’s authorizations are for a fixed term (until 2048) and renewal is neither automatic nor guaranteed. A termination of Energuate’s authorizations would have immediate negative effects on Energuate’s business and results of operations, which could have a material adverse effect on our business, financial condition and results of operations.
Energuate operates in certain conflict zones which have been and may continue to be subject to high levels of electricity theft and other illicit activity, low collection rates and violent protest.
Energuate’s service area includes “conflict zones”, which are areas characterized by high levels of electricity theft and low collection rates. In certain of the “conflict zones” in which Energuate operates, particularly along the border with Mexico, there is little government control and presence. In such areas, Energuate’s ability to conduct its operations has been, and may continue to be, affected by illicit activities, such as drug trafficking and violent crime.
Furthermore, Energuate has faced opposition in such areas from a variety of organizations, some of whom promote violent protests and energy theft. In recent years, local organizations in Energuate’s service area have conducted violent protests to challenge electricity prices. Energuate has undertaken efforts to improve its relationships with the communities in the service areas in which it operates; however, these efforts may be unsuccessful. Electricity theft and other illicit activity, low collection rates and social protests in certain of the “conflict zones” in which Energuate operates may have a material adverse effect on our business, financial condition and results of operations.
Risks Related to Our Corporate Structure
We are incorporated in Singapore and our shareholders may have greater difficulty in protecting their interests than they would as shareholders of a corporation incorporated in the United States.
Our corporate affairs are governed by our constitution and by the laws governing corporations incorporated in Singapore. The rights of our shareholders and the responsibilities of the members of our board of directors under Singapore law are different from those applicable to a corporation incorporated in the United States. Therefore, our public shareholders may have greater difficulty in protecting their interests in connection with actions taken by our management or members of our board of directors than they would as shareholders of a corporation incorporated in the United States. For example, under Singapore corporate law, only persons who are registered shareholders in our register of members are recognized under Singapore law as our shareholders; only shareholders have legal standing to institute actions against us or otherwise seek to enforce their rights as shareholders. For further information on these, and other differences, between Singapore and Delaware corporation law, see “Description of Share Capital—Comparison of Shareholder Rights.”
It may be difficult to enforce a judgment of U.S. courts for civil liabilities under U.S. federal securities laws against us, our directors or officers in Singapore.
We are incorporated under the laws of Singapore and our officers and certain of our directors are or will be residents outside of the United States. Moreover, a significant portion of our assets and the assets of our directors and officers and certain other persons named in this prospectus are located outside of the United States. As a result, it may be difficult for you to effect service of process within the United States upon these persons.
Although we are incorporated outside the United States, in August 2015, we entered into an appointment agreement with C T Corporation System, whereby we irrevocably appointed C T Corporation System to receive on our behalf service of process in respect of any suit, action or proceeding in any state or federal court sitting in the United States arising out of or in connection with this prospectus. However, since all of the assets owned by us, and a significant portion of our assets and our directors and officers and certain other
71
Table of Contents
persons named in this prospectus, are located outside of the United States, any judgment obtained in the United States against us may not be collectible within the United States. It may also be difficult for you to enforce judgments obtained in the United States in countries outside of the United States predicated upon the civil liability provisions of the federal securities laws of the United States against us and our non-U.S. resident officers and directors. In addition, there is uncertainty as to whether these courts would recognize or enforce judgments of U.S. courts against us or such persons predicated upon the civil liability provisions of the securities laws of the United States. It is also uncertain whether such courts would be competent to hear original actions brought against us or other persons predicated upon the securities laws of the United States or any other state.
Furthermore, there is no treaty between the United States and Singapore providing for the reciprocal recognition and enforcement of judgments in civil and commercial matters, such that a final judgment for the payment of money rendered by any federal or state court in the United States based on civil liability, whether or not predicated solely upon the federal securities laws, would, therefore, not be automatically enforceable in Singapore. Additionally, there is doubt whether a Singapore court may impose civil liability or any punitive damages permitted in the U.S. on us or our directors and officers who reside in Singapore in a suit brought in the Singapore courts against us or such persons with respect to a violation solely of the federal securities laws of the United States.
In addition, holders of book-entry interests in our ordinary shares (i.e. those investors who hold our shares indirectly through custodians) will be required to be registered shareholders as reflected in our register of members in order to have legal standing to bring an action as shareholders and, if successful, to enforce a foreign judgment against us, our directors or our officers in the Singapore courts. Such process could result in administrative delays which may be prejudicial to any legal proceeding or enforcement action.
We are subject to the laws of Singapore, which differ in certain material respects from the laws of the United States.
As a Singapore-incorporated company, we are required to comply with the laws of Singapore, certain of which are capable of extra-territorial application, as well as our constitution. The application of Singapore law, including the Securities and Futures Act, Chapter 289 of Singapore, or the SFA, Singapore Code on Take-over and Mergers and the Singapore Companies Act, may in certain circumstances impose more stringent requirements on us, our shareholders, directors or officers than would otherwise be applicable to a U.S.-incorporated company. The provisions of the SFA prohibit certain forms of market conduct and information disclosures, and impose criminal and civil penalties on corporations, directors and officers in respect of any breach of such provisions.
Additionally, the corporate laws of Singapore and of the United States differ in certain significant respects. As a result, the rights of our shareholders and the obligations of our directors and officers under Singapore law are different from those applicable to a U.S.-incorporated company in material respects, and our shareholders may have more difficulty and less clarity in protecting their interests in connection with actions taken by our management, members of our board of directors or our significant shareholders than would otherwise apply to a U.S.-incorporated company. For further information on these differences, see “Description of Share Capital—Comparison of Shareholder Rights.”
We are a “foreign private issuer” under U.S. securities laws and, as a result, are subject to disclosure obligations that are different from those applicable to U.S. domestic issuers listed on the NYSE.
We are incorporated under the laws of Singapore and a majority of our shares after the completion of this offering will be held by non-U.S. persons. As such, we are considered a “foreign private issuer” under U.S. securities laws. Although we will be subject to the periodic reporting requirements of the Securities Exchange Act of 1934, or the Exchange Act, the periodic disclosure required of foreign private issuers under the Exchange Act is different from the periodic disclosure required of U.S. domestic issuers. Therefore, there may be less
72
Table of Contents
publicly available information about us than is regularly published by or about other public companies in the United States. We are also exempt from certain other sections of the Exchange Act that U.S. domestic issuers are otherwise subject to, including the requirement to provide our shareholders with information statements or proxy statements that comply with the Exchange Act. Moreover, we are not required to comply with Regulation FD, which restricts the selective disclosure of material information. These exemptions and leniencies may reduce the frequency and scope of information and protections to which you may otherwise have been eligible if you held ordinary shares or common stock of a domestic U.S. issuer.
In addition, insiders and large shareholders of ours will be exempt from the reporting and short-swing profit recovery provisions contained in Section 16 of the Exchange Act and will not be obligated to file the reports required by Section 16 of the Exchange Act.
We would lose our foreign private issuer status if a majority of our shares became held by U.S. persons and a majority of our directors or executive officers are U.S. citizens or residents and we fail to meet additional requirements necessary to avoid loss of foreign private issuer status. Although we have elected to comply with domestic NYSE corporate governance rules applicable to U.S. domestic listed companies, our loss of foreign private issuer status would make such provisions mandatory. The regulatory and compliance costs to us under U.S. securities laws as a U.S. domestic issuer may be significantly higher. If we are not a foreign private issuer, we will be required to file periodic reports and registration statements on U.S. domestic issuer forms with the SEC, which are more detailed and extensive than the forms available to a foreign private issuer, and prepare our financial statements under U.S. Generally Accepted Accounting Principles. To the extent we had not already done so, we may also be required to modify certain of our policies to comply with accepted governance practices associated with U.S. domestic issuers and may lose our ability to rely upon exemptions from certain corporate governance requirements on the NYSE that are available to foreign private issuers.
As a foreign private issuer and a “controlled company,” we may, in the future, follow certain home country corporate governance, or controlled company, practices instead of otherwise applicable NYSE corporate governance requirements, and this may result in less investor protection than that accorded to investors under rules applicable to domestic non-controlled U.S. issuers.
As a foreign private issuer, we are permitted to follow certain home country corporate governance practices instead of those otherwise required under the NYSE’s rules for domestic U.S. issuers, provided that we disclose which requirements we are not following and describe the equivalent home country requirement. For example, foreign private issuers are permitted to follow home country practice with regard to director nomination procedures and the approval of compensation of officers. Additionally, we are not required to maintain a board comprised of a majority of independent directors. We also expect to be a “controlled company” within the meaning of the corporate governance standards of the NYSE. However, notwithstanding our ability to follow the corporate governance practices of our home country, Singapore, or to avail ourselves of certain “controlled company” exemptions, we have elected to comply with the corporate governance rules of the NYSE that are applicable to U.S. domestic issuers that are not “controlled companies.” Nevertheless, we may, in the future, decide to rely on the foreign private issuer or “controlled company” exemptions provided by the NYSE and follow home country or controlled company governance practices in lieu of complying with some or all of the NYSE’s requirements.
Availing ourselves of any of these exemptions, as opposed to complying with the requirements that are applicable to a non-controlled U.S. domestic issuer, may provide less protection to you than is accorded to investors under the NYSE’s corporate governance rules. Therefore, any foreign private issuer or “controlled company” exemptions we avail ourselves of in the future may reduce the scope of information and protection to you as an investor.
73
Table of Contents
Singapore corporate law may impede a takeover of our Company by a third party, which could adversely affect the value of our ordinary shares.
The Singapore Code on Take-overs and Mergers and Sections 138, 139 and 140 of the SFA contain certain provisions that may delay, deter or prevent a future takeover or change in control of our Company for so long as we remain a public company with more than 50 shareholders and net tangible assets of S$5 million (approximately $4 million) or more. Any person acquiring an interest, whether by a series of transactions over a period of time or not, either on his own or together with parties acting in concert with such person, in 30% or more of our voting shares, or, if such person holds, either on his own or together with parties acting in concert with such person, between 30% and 50% (both inclusive) of our voting shares, and such person (or parties acting in concert with such person) acquires additional voting shares representing more than 1% of our voting shares in any six-month period, must, except with the consent of the Securities Industry Council in Singapore, extend a mandatory takeover offer for the remaining voting shares in accordance with the provisions of the Singapore Code on Take-overs and Mergers. While the Singapore Code on Take-overs and Mergers seeks to ensure equality of treatment among shareholders, its provisions may discourage or prevent certain types of transactions involving an actual or threatened change of control of our Company. These legal requirements may impede or delay a takeover of our Company by a third party, and thereby have a material adverse effect on the value of our ordinary shares.
In June 2016, the Securities Industry Council of Singapore granted a waiver from the application of the Singapore Code on Take-overs and Mergers to us, subject to certain conditions. Pursuant to the waiver, the Singapore Code on Take-overs and Mergers will not apply to us (except in the case of a tender offer (within the meaning of the U.S. securities laws) where the U.S. Tier I exemption under the Securities Exchange Act of 1934 is available and the offeror relies on the Tier I exemption to avoid full compliance with U.S. tender offer regulations) for so long as we are not listed on a securities exchange in Singapore.
Our directors have general authority to allot and issue new shares on terms and conditions and with any preferences, rights or restrictions as may be determined by our board of directors in its sole discretion.
Under Singapore law, we may only allot and issue new shares with the prior approval of our shareholders in a general meeting. Other than with respect to the issuance of shares pursuant to awards made under our Share Incentive Plan 2016 or Share Option Plan 2016, and subject to the general authority to allot and issue new shares provided by our shareholders annually, pursuant to the provisions of the Singapore Companies Act and our constitution, our board of directors may allot and issue new shares on terms and conditions and with the rights (including preferential voting rights) and restrictions as they may think fit to impose. Any additional issuances of new shares by our directors could adversely impact the market price of our ordinary shares.
We may be classified as a passive foreign investment company, which could result in adverse U.S. federal income tax consequences to U.S. holders of our ordinary shares.
Generally, if for any taxable year, 75% or more of our gross income is passive income, or at least 50% of our assets are held for the production of, or produce, passive income, we would be characterized as a passive foreign investment company for United States federal income tax purposes. There can be no assurance that we will not be considered a passive foreign investment company for any taxable year. If we are characterized as a passive foreign investment company, our U.S. shareholders may suffer adverse tax consequences, including having gains realized on the sale of our ordinary shares treated as ordinary income, rather than capital gain, the loss of the preferential rate applicable to dividends received on our ordinary shares by individuals who are U.S. holders, and having interest charges apply to distributions by us and the proceeds of share sales. For further information on such U.S. tax implications, see “Taxation—U.S. Federal Income Tax Considerations.”
74
Table of Contents
Tax regulations and examinations could have a material adverse effect on us and we may be subject to challenges by tax authorities.
We operate in a number of countries and are therefore regularly examined by and remain subject to numerous tax regulations. Changes in our global mix of earnings could affect our effective tax rate. Furthermore, changes in tax laws could result in higher tax-related expenses and payments. Legislative changes in any of the countries in which our businesses operate could materially impact our tax receivables and liabilities as well as deferred tax assets and deferred tax liabilities. Additionally, the uncertain tax environment in some regions in which our businesses operate could limit our ability to enforce our rights. Some of our businesses operate in countries with complex tax rules, which may be interpreted in a variety of ways and could affect our effective tax rate. Future interpretations or developments of tax regimes or a higher than anticipated effective tax rate could have a material adverse effect on our tax liability, return on investments and business operations.
In addition, we and our businesses operate in, are incorporated in and are tax residents of, various jurisdictions. The tax authorities in the various jurisdictions in which we and our businesses operate, or are incorporated, may disagree with and challenge our assessments of our transactions, tax position, deductions, exemptions, where we or our subsidiaries or businesses are tax resident, or other matters. If we, or our businesses, are unsuccessful in responding to any such challenge from a tax authority, we, or our businesses, may be required to pay additional taxes, interest, fines or penalties, we, or our businesses, may be subject to taxes for the same business in more than one jurisdiction or may also be subject to higher tax rates, withholding or other taxes. Even if we, or our businesses, are successful, responding to such challenges may be expensive, consume time and other resources, or divert management’s time and focus from our operations or businesses or from the operations of our businesses. Therefore, a challenge as to our, or our businesses, tax position or status or transactions, even if unsuccessful, may have a material adverse effect on our business, financial condition, results of operations or liquidity or the business, financial condition, results of operations or liquidity of our businesses.
Risks Related to Our Ordinary Shares and this Offering
There may be circumstances in which the interests of our controlling shareholder could be in conflict with your interests as a shareholder.
Kenon currently owns 100% of our ordinary shares and, upon completion of this offering, will beneficially own % of our ordinary shares and voting power, or % of our ordinary shares and voting power, if the underwriters exercise in full their option to purchase additional ordinary shares from us. As a result of this ownership, Kenon will have a continuing ability to control our affairs and its voting power will constitute a quorum of our shareholders voting on any matter requiring the approval of our shareholders. Kenon will continue to have significant influence over our affairs for the foreseeable future, including with respect to the nomination and election of directors, the issuance of additional ordinary shares or payment of dividends, the consummation of significant corporate transactions, such as the adoption of amendments to our constitution and organizational regulations and approval of mergers or sales of substantially all of our assets.
In certain circumstances, Kenon’s interests as a principal shareholder may conflict with the interests of our other shareholders. Accordingly, this concentration of ownership may harm the market price of our ordinary shares by, among other things:
| • | delaying, defending, or preventing a change of control, even at a per share price that is in excess of the then current price of our ordinary shares; |
| • | impeding a merger, consolidation, takeover, or other business combination involving us, even at a per share price that is in excess of the then current price of our ordinary shares; or |
| • | discouraging a potential acquirer from making a tender offer or otherwise attempting to obtain control of us, even at a per share price that is in excess of the then current price of our ordinary shares. |
75
Table of Contents
Kenon may also cause corporate actions to be taken that conflict with the interests of our other shareholders.
If we fail to develop or maintain an effective system of disclosure controls and internal control over financial reporting, our ability to produce timely and accurate consolidated financial statements or comply with applicable regulations could be impaired.
As a public company, we will be subject to the reporting requirements of the Exchange Act, the Sarbanes-Oxley Act of 2002, or Sarbanes-Oxley, and the listing standards of the NYSE. We expect that the requirements of these rules and regulations will increase our legal, accounting and financial compliance costs, make some activities more difficult, time consuming and costly, and place significant strain on our personnel, systems and resources.
Among other things, Sarbanes-Oxley requires that, as a public company, our principal executive officer and principal financial officer certify the effectiveness of our disclosure controls and procedures and, beginning with our second annual report as a public company, our internal controls over financial reporting. We will also be required to comply with the auditor attestation requirements of Section 404 of Sarbanes-Oxley by the date of filing of our second annual report as a public company. We continue to develop and refine our disclosure controls and procedures and our internal control over financial reporting. Material weaknesses in our disclosure controls or our internal control over financial reporting may be discovered in the future. Any failure to develop or maintain effective controls, or any difficulties encountered in their implementation or improvement, could harm our operating results or cause us to fail to meet our reporting obligations and may result in a restatement of our consolidated financial statements for prior periods. Any failure to implement and maintain effective internal control over financial reporting also could adversely affect the results of management evaluations and independent registered public accounting firm audits of our internal control over financial reporting. Ineffective disclosure controls and procedures or ineffective internal control over financial reporting could also cause investors to lose confidence in our reported financial information, which may have a negative effect on the trading price of our ordinary shares.
Because there is no existing market for our ordinary shares, our initial public offering price may not be indicative of the market price of our ordinary shares after this offering, an active trading market in our ordinary shares may not develop or be sustained and the market price of our ordinary shares could fluctuate significantly, and you could lose all or part of your investment.
There is currently no public market for our ordinary shares, and an active trading market may not develop or be sustained after this offering. Our initial public offering price has been determined through negotiation between us and the underwriters and may not be indicative of the market price for our ordinary shares after this offering. We cannot predict the extent to which investor interest in us will lead to the development of an active trading market on the NYSE. The lack of an active market may reduce the value of your shares and impair your ability to sell your shares at the time or price at which you wish to sell them. An inactive market may also impair our ability to raise capital by selling our ordinary shares and may impair our ability to acquire or invest in other companies, products or technologies by using our ordinary shares as consideration.
In addition, the market price of our ordinary shares could fluctuate significantly as a result of a number of factors, including:
| • | fluctuations in our financial performance; |
| • | economic and stock market conditions generally and specifically as they may impact us, participants in our industry or comparable companies; |
| • | changes in financial estimates and recommendations by securities analysts following our ordinary shares or comparable companies; |
76
Table of Contents
| • | earnings and other announcements by, and changes in market evaluations of, us, participants in our industry or comparable companies; |
| • | our ability to meet or exceed any future earnings guidance we may issue; |
| • | changes in business or regulatory conditions affecting us, participants in our industry or comparable companies; |
| • | changes in accounting standards, policies, guidance, interpretations or principles; |
| • | announcements or implementation by our competitors or us of acquisitions, technological innovations, or other strategic actions by our competitors; or |
| • | trading volume of our ordinary shares or sales of shares by our management team, directors or principal shareholders. |
These and other factors could limit or prevent investors from readily selling their ordinary shares or otherwise negatively affect the liquidity of our ordinary shares, and you could lose all or part of your investment.
We will incur increased costs as a result of becoming a public company.
As a public company, we will incur legal, accounting, insurance and other expenses that we have not incurred as a private company, including costs associated with public company reporting requirements. We also have incurred and will incur costs associated with Sarbanes-Oxley and related rules implemented by the SEC. We expect these rules and regulations to increase our legal and financial compliance costs and to make some activities more time-consuming and costly, although we are currently unable to estimate these costs with any degree of certainty. These and other laws and regulations could also make it more difficult or costly for us to obtain certain types of insurance, including director and officer liability insurance, and we may be forced to accept reduced policy limits and coverage or incur substantially higher costs to obtain the same or similar coverage. These and other laws and regulations could also make it more difficult for us to attract and retain qualified persons to serve on our board of directors, our board committees or as our senior management. Furthermore, if we are unable to satisfy our obligations as a public company, we could be subject to delisting of our ordinary shares, fines, sanctions and other regulatory action and potentially civil litigation.
The market price of our ordinary shares could be adversely affected by future sales of our ordinary shares or the perception that such sales may occur.
Kenon will hold % of our ordinary shares upon completion of the offering (or % if the underwriters exercise in full their option to purchase additional ordinary shares from us) and Kenon’s strategy is to provide its shareholders with direct access to its primary businesses, which includes ICP. Following expiration of the 180-day lockup period (or earlier, if the underwriters consent) Kenon will be under no contractual restriction on sales of its shares.
Sales or issuances of a substantial number of our ordinary shares following this offering or the perception that such sales or distributions might occur, could cause a decline in the market price of our ordinary shares or could impair our ability to obtain capital through a subsequent offering of our equity securities or securities convertible into equity securities. Under our constitution that will be in effect upon closing of this offering, we are authorized to issue up to ordinary shares, of which ordinary shares will be outstanding upon the closing of this offering (or ordinary shares if the underwriters’ option to purchase additional ordinary shares is exercised in full). Of these shares, the ordinary shares sold in this offering will be freely transferable without restriction or further registration under the Securities Act of 1933, or the Securities Act, except for any ordinary shares held by our affiliates (including Kenon) as defined in Rule 144 under the Securities Act.
77
Table of Contents
We will grant registration rights to Kenon, enabling it to require us to file a registration statement to register sales of our ordinary shares held by Kenon, subject to certain conditions. Registration of these ordinary shares under the Securities Act would result in shares becoming freely tradeable without restriction under the Securities Act, except for shares purchased by affiliates. Kenon may also choose to establish programmed selling plans under Rule 10b5-1 of the Exchange Act, for the purpose of effecting sales of our ordinary shares.
If securities or industry analysts do not publish research or reports about our business, or publish negative reports about our business, our share price and trading volume could decline.
The trading market for our ordinary shares will depend, in part, upon the research and reports that securities or industry analysts publish about us or our businesses. We do not have any control over analysts as to whether they will cover us, and if they do, whether such coverage will continue. If analysts do not commence coverage of us, or if one or more of these analysts cease coverage of us or fail to regularly publish reports on us, we could lose visibility in the financial markets, which could cause our share price or trading volume to decline. In addition, if one or more of the analysts who cover us downgrade our ordinary shares or change their opinion of our ordinary shares, our share price may likely decline.
We may issue additional ordinary shares in the future, which may dilute our existing shareholders. We may also issue securities that have rights and privileges that are more favorable than the rights and privileges accorded to our existing shareholders.
We may issue additional securities in the future, including ordinary shares, and options, rights, warrants and other convertible securities for any purpose and for such consideration and on such terms and conditions as we may determine appropriate or necessary, including in connection with equity awards, financings or other strategic transactions. Subject to the annual approval of our shareholders for (1) the creation of new classes of shares, and (2) the granting to our directors of the authority to issue new shares with different or similar rights, and without prejudice to any special right previously conferred on the holders of any of our existing shares or class of shares, and other than with respect to the issuance of shares pursuant to awards made under our Share Incentive Plan 2016 or Share Option Plan 2016, our board of directors will be able to determine the class, designations, preferences, rights and powers of any additional shares, including any rights to share in our profits, losses and dividends or other distributions, any rights to receive assets upon our dissolution or liquidation and any redemption, conversion and exchange rights. Kenon, our significant shareholder, may use its ability to control, or exert influence over, our board of directors to cause us to issue additional ordinary shares, which would dilute existing holders of our ordinary shares, or to issue securities with rights and privileges that are more favorable than those of our ordinary shareholders. There are no statutory rights of first refusal for new share issuances conferred upon our shareholders under the Singapore Companies Act.
As a recently-incorporated company, we will not have significant distributable profits to pay dividends.
Under Singapore law and our constitution, dividends, whether in cash or in specie, must be paid out of our profits available for distribution or in excess of the amount recommended by our directors. As a recently-incorporated company, we do not expect to have significant distributable profits from which dividends may be declared. The availability of distributable profits is assessed on the basis of our standalone unconsolidated accounts (which will be based upon the Singapore Financial Reporting Standards, or the SFRS) and we expect that the opening balance of our retained earnings in such financials will be zero. Therefore, unless we effect a capital reduction, we will be unable to pay dividends to our shareholders unless and until we have generated sufficient distributable reserves. We may incur losses and therefore may not have distributable income that might be distributed to our shareholders as a dividend or other distribution in the foreseeable future. As a result, and until such time, if ever, that we declare dividends with respect to our ordinary shares, a holder of our ordinary shares will only realize income from an investment in our ordinary shares if there is an increase in the market price of our ordinary shares. Any potential increase is uncertain and unpredictable.
78
Table of Contents
Under Singapore law, it is possible to effect a capital reduction exercise up to the value of our ordinary shares, to return cash and/or assets to our shareholders. The completion of a capital reduction exercise, however, may require the approval of the Singapore Courts and we may not be successful in our attempts to obtain such approval.
Any dividend payments on our ordinary shares would be declared in U.S. Dollars, and any shareholder whose principal currency is not the U.S. Dollar would be subject to exchange rate fluctuations.
The ordinary shares will be traded in, and any cash dividends or other distributions to be declared in respect of them, if any, will be denominated in U.S. Dollars. Shareholders whose principal currency is not the U.S. Dollar will be exposed to foreign currency exchange rate risk. Any depreciation of the U.S. Dollar in relation to such foreign currency will reduce the value of such shareholders’ ordinary shares and any appreciation of the U.S. Dollar will increase the value in foreign currency terms. In addition, we will not offer our shareholders the option to elect to receive dividends, if any, in any other currency. Consequently, our shareholders may be required to arrange their own foreign currency exchange, either through a brokerage house or otherwise, which could incur additional commissions or expenses.
79
Table of Contents
SPECIAL NOTE REGARDING FORWARD-LOOKING STATEMENTS
This prospectus contains forward-looking statements that reflect our current expectations and views of future events. Forward-looking statements are contained principally in the sections titled “Prospectus Summary,” “Risk Factors,” “Management’s Discussion and Analysis of Financial Condition and Results of Operations,” “Industry” and “Business.” Some of these forward-looking statements can be identified by terms and phrases such as “anticipate,” “aim,” “should,” “likely,” “foresee,” “believe,” “estimate,” “expect,” “intend,” “continue,” “could,” “may,” “plan,” “project,” “predict,” “will,” “shall” and similar expressions. These forward-looking statements include, but are not limited to, statements relating to:
| • | our goals, and strategies and the goals and strategies of our businesses, including with respect to the expansion of our business; |
| • | potential projects, including the location and nature of such projects; |
| • | our capital commitments and/or intentions with respect to certain of our operating businesses, including the sufficiency of our liquidity and capital resources; |
| • | the nature and extent of future competition in the energy industry in the markets in which we operate; |
| • | expected supply and demand trends in the Peruvian power market; |
| • | our ability to finance existing, and to source and finance new, greenfield projects and acquisitions; |
| • | the expected cost and expected timing of completion of existing projects and the anticipated installed capacity, load factor, and results of such projects; |
| • | the expected timing, completion, and terms of certain acquisitions, including the assignment of certain supply and/or transmission agreements; |
| • | our ability to secure appropriate licenses, including water rights, for any acquisitions or greenfield projects; |
| • | the price of, and our ability to successfully integrate, acquired businesses; |
| • | the expected cash flows from our distribution businesses; |
| • | expected trends in electrification levels in Guatemala; |
| • | the competitive landscape within Energuate’s service areas; |
| • | expected or potential changes in distribution tariffs, including expected or potential quarterly adjustments to these tariffs; |
| • | our planned capital expenditures, including with respect to our plan to reduce electricity losses; |
| • | our ability to successfully pursue greenfield projects and acquisition opportunities; |
| • | our ability to source, enter into and/or renew long-term PPAs and EPC agreements, as applicable, and the amounts to be paid under such agreements; |
| • | our ability to renew and/or enter into supply, transmission and/or distribution agreements on competitive terms, as such agreements expire; |
80
Table of Contents
| • | our ability to secure raw materials, including natural gas and other fuels, to operate our power generation plants; |
| • | the expected price and volume of gas available to OPC and other IPPs in Israel; |
| • | the performance and reliability of our generation plants and our ability to manage our operation and maintenance costs; |
| • | expected trends in the countries in which each of our businesses operate, including trends relating to the growth of a particular market, supply and demand imbalances, and investments in power generation facilities; |
| • | expected revenues under our PPAs; |
| • | expected or potential changes in tariffs, which may impact our revenues or Adjusted EBITDA; |
| • | the impact of fuel price and foreign exchange rate fluctuations on our revenues, net income, Adjusted EBITDA and operating margins; |
| • | the expected cost and timing of our plant repairs, including the Samay I plant; |
| • | our plans to seek coverage for the costs related to the repair and outage of our plants and our ability to recover such costs; |
| • | expected growth in demand for energy in the markets that we serve; |
| • | terms of gas and other supply contracts and our ability to continue to procure gas and other inputs on competitive terms and the ability of our plants to operate using alternate fuels; |
| • | the availability and prices of natural gas and other fuels purchased by, or in competition with, our business; |
| • | the political and macroeconomic outlook for each of the countries in which we operate, many of which are emerging markets, and the impact on our businesses of such conditions; |
| • | the legal and regulatory framework of the energy industry at the national, regional or municipal level in one or more of the countries in which we operate, develop or construct generation assets; |
| • | new types of taxes or increases or decreases in taxes applicable to us or our businesses; |
| • | the potential expropriation or nationalization of our operating assets by foreign governments, with or without adequate compensation; |
| • | our ability to utilize our PPAs, fuel supply and other agreements to hedge against fuel price and exchange rate fluctuations; |
| • | increased development costs, and the impact such increased costs could have on the development of additional power generation assets and the value of our assets, particularly with respect to hydroelectric power plants; |
| • | the effect of weather conditions on generation, consumer energy use, tariffs, or our operating costs; |
| • | expected trends in energy consumption, particularly in Latin America; |
81
Table of Contents
| • | adequacy of our insurance coverage; |
| • | our expectation of renewing the Pedregal management services agreement and the expected timing of such renewal; |
| • | litigation and/or regulatory proceedings or developments and our expectations and strategy with respect to such litigation, proceedings, appeals, developments and/or awards, including the impact of our release of certain provisions; |
| • | with respect to the Guatemala tax claim, the amount of taxes, interest and penalties that we may be required to pay to the SAT, and the expected timing of such payments and our plan to seek remedies; |
| • | our distributable reserves and our ability to distribute dividends to our shareholders; and |
| • | our intended use of proceeds from this initial public offering. |
Although we base these statements on assumptions that we believe to be reasonable when made, these forward-looking statements are not a guarantee of performance, and you should not place undue reliance on such statements. These statements are only predictions based upon our current expectations and projections about future events. Forward-looking statements are subject to many uncertainties and other variable circumstances, many of which are outside of our control, that could cause our actual results and experience to differ materially from those we thought would occur.
These forward-looking statements speak only as of the date of this prospectus. Except as required by law, we undertake no obligation to publicly update or revise any forward-looking statements, whether as a result of new information, future events or otherwise. You should read this prospectus and the documents filed as exhibits to the registration statement, of which this prospectus is a part, completely and with the understanding that our actual future results may be materially different from what we expect.
There are important factors that could cause our actual results, level of activity, performance or achievements to differ materially from the results, level of activity, performance or achievements expressed or implied by the forward-looking statements. In particular, you should consider the numerous risks provided under “Risk Factors” in this prospectus.
82
Table of Contents
CORPORATE FORMATION AND REORGANIZATION
We were incorporated in May 2015 to serve as the holding company of ICP and its businesses.
In March 2016, Kenon, our current sole shareholder, effected a Reorganization pursuant to which it transferred all of its equity interests in its wholly-owned subsidiary ICP, to us, in exchange for (1) 559,309 of our ordinary shares and (2) notes payable by us to Kenon in an aggregate principal amount of $220 million (consisting of a $145 million and $75 million note). For further information on the $220 million notes payable to Kenon, see “Related Party Transactions—$220 Million Notes Payable to Kenon.” Additionally, prior to the completion of this offering, we will be converted into a Singapore public company limited by shares and renamed . The graphics below represent a simplified summary of our organizational structure, excluding intermediate holding companies, immediately prior to and immediately after the Reorganization and prior to the completion of this offering.
| Prior to the Completion ofthe Reorganization | After the Completion ofthe Reorganization | |
|
|

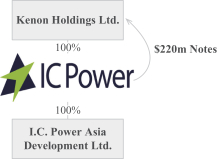
In October 2016, we prepaid in full our $75 million note payable to Kenon. As set forth in “Use of Proceeds,” we intend to use a portion of the net proceeds raised in this offering to prepay in full all obligations under our $145 million note payable to Kenon.
83
Table of Contents
Assuming an initial public offering price of $ per share, which is the midpoint of the offering price range set forth on the cover page of this prospectus, we estimate that the net proceeds to us from the sale of our ordinary shares in this offering will be approximately $ million (or $ million if the underwriters exercise in full their option to purchase additional ordinary shares from us), after deducting estimated underwriting discounts and commissions and offering expenses.
We intend to use the net proceeds that we receive in this offering, along with readily available cash, (1) to develop greenfield projects, (2) to acquire companies or assets in the electricity sector (e.g., generation, transmission or distribution companies or assets), (3) to prepay in full all obligations under our $145 million note payable to Kenon, which was issued to Kenon as part of the consideration for Kenon’s contribution of ICP to us in connection with the Reorganization, bears interest at a rate of LIBOR + 6% per annum from March 17, 2016, and will mature, unless otherwise prepaid, on December 31, 2018, (4) to prepay in full all obligations under the $100 million Overseas Facility, which facility must be prepaid in the event of our initial public offering, and bears interest ranging from 90-day LIBOR plus 5.00% to 90-day LIBOR plus 6.50% (for further information on the Overseas Facility, see “Management’s Discussion and Analysis of Financial Condition and Results of Operations—Recent Developments—Overseas Facility”) and (5) general corporate purposes.
Other than with respect to our prepayment in full of all obligations under our notes payable to Kenon and the Overseas Facility, the amount and timing of our actual use of the net proceeds that we will receive from this offering, and the amount of cash from other sources that we intend to use, if any, in connection with the uses stated above, will depend upon numerous factors, including the cash used in or generated by our operations, the level of our expansion efforts, our ability to identify greenfield development projects or companies or assets to acquire, the development and / or acquisition expenses related to such projects, companies, or assets, as well as the results of our existing development efforts. Our management has discretion over many of these factors. Except as specified above, we are unable to estimate the amount of the net proceeds from this offering that will be used for any of the purposes described above and therefore will have broad discretion in using these proceeds.
For further information on the greenfield development and acquisition opportunities under current assessment and the status of our development efforts, see “Business—Potential Projects.”
From time to time, our board of directors may approve the payment of dividends to our shareholders. Under Singapore law and our constitution, dividends, whether in cash or in specie, must be paid out of our profits. The declaration and payment of future dividends, if any, will be at the discretion of our board of directors and will depend upon many factors, including our profits, our financial position, earnings, cash flows, capital requirements, level of indebtedness, the progress relating to our strategy plan, statutory and contractual restrictions applicable to the payment of dividends, the conditions prevailing in the market, our overall financial condition, available distributable reserves, and additional factors our board of directors deems appropriate. Additionally, because we are a holding company, our ability to pay cash dividends, or declare a distribution-in-kind of the ordinary shares of any of our businesses, may be limited by restrictions on our ability to obtain sufficient funds through dividends from our businesses, including restrictions under the terms of the agreements governing the indebtedness of our businesses.
Dividend payments are not guaranteed and our board of directors may decide, in its absolute discretion, at any time and for any reason, not to pay dividends. Therefore, you may not receive funds without selling your ordinary shares. Any dividends declared on our ordinary shares will be declared and paid in U.S. Dollars.
84
Table of Contents
Under Singapore law and our constitution, dividends, whether in cash or in specie, must be paid out of our profits available for distribution or in excess of the amount recommended by our directors. As a recently-incorporated company, we do not expect to have significant distributable profits from which dividends may be declared. For further information on the dividend restrictions applicable to us as a Singaporean company, see “Description of Share Capital—Constitution—Dividends,” and“Risk Factors—Risks Related to Our OrdinaryShares and this Offering—As arecently-incorporated company, we will not have significant distributable profits to pay dividends.” For further information on certain tax considerations affecting dividend payments, see “Taxation.”
85
Table of Contents
The following table has been derived from our financial statements and sets forth our capitalization as of June 30, 2016 on an actual basis and as adjusted to give effect to (1) the completion of this offering, assuming an initial public offering price of $ per ordinary share, which is the midpoint of the estimated initial public offering price range set forth on the cover page of this prospectus, and after deducting estimated underwriting discounts and estimated offering expenses payable by us and (2) the prepayment in full of all obligations under our notes payable to Kenon, which are in an aggregate principal amount of $220 million (consisting of a $145 million and $75 million note) and were issued to Kenon in connection with the Reorganization, assuming no exercise of the underwriters’ option to purchase additional ordinary shares from us. In October 2016, we prepaid in full our obligations under our $75 million note payable to Kenon.
You should read this table together with the information in “Summary Consolidated Financial and Other Information,” “Selected Consolidated Financial and OtherInformation,” “Use of Proceeds,” “Management’s Discussion and Analysis of Financial Condition and Results of Operations” and our financial statements and the related notes thereto included elsewhere in this prospectus.
June 30, 2016 | Completion of | Repayment of Notes | As Adjusted | |||||||||||||
| ($ millions) | ||||||||||||||||
Cash and cash equivalents | $ | 234 | — | $ | ||||||||||||
Liabilities: | ||||||||||||||||
Debt, of which: | ||||||||||||||||
Long-term1 | ||||||||||||||||
Secured | 2,292 | — | — | |||||||||||||
Unsecured | 459 | — | — | |||||||||||||
Short-term | ||||||||||||||||
Secured | 167 | — | — | |||||||||||||
Unsecured | 25 | — | — | |||||||||||||
Notes payable to Kenon2 | 225 | — | (225) | — | ||||||||||||
|
|
|
|
|
|
|
| |||||||||
| 2,934 | — | (225) | $ | |||||||||||||
|
|
|
|
|
|
|
| |||||||||
Equity: | ||||||||||||||||
Total capital attributable to our equity holders | 609 | — | ||||||||||||||
Non-controlling interest | 207 | — | — | |||||||||||||
Total equity | 816 | — | ||||||||||||||
|
|
|
|
|
|
|
| |||||||||
Total capitalization | 3,750 | (225 | ) | $ | ||||||||||||
|
|
|
|
|
|
|
| |||||||||
| 1. | Includes current portion of long-term indebtedness. |
| 2. | Consists of a $145 million and a $75 million note, plus accrued interest. In October 2016, we prepaid in full our $75 million note payable to Kenon. |
A $1.00 change in the assumed initial public offering price of $ per ordinary share would, in the case of an increase, increase the total capital attributed to our equity holders, total equity and total capitalization by $ and, in the case of a decrease, decrease the total capital attributed to our equity holders, total equity and total capitalization by $ , in each case, after deducting underwriting discounts and commissions and estimated offering expenses.
86
Table of Contents
If you invest in our ordinary shares, your interest will be diluted to the extent of the difference between the initial public offering price per ordinary share and our net tangible book value per ordinary share after this offering. Dilution results from the fact that the initial public offering price per ordinary share is substantially in excess of the net tangible book value per ordinary share. Our net tangible book value as of June 30, 2016, was $ million or $ per ordinary share. Net tangible book value per ordinary share represents the amount of total assets, excluding intangible assets and goodwill, minus the amount of total liabilities, divided by the total number of ordinary shares outstanding at the end of the period.
Without taking into account any other changes in such net tangible book value after June 30, 2016, other than to give effect to our issuance and sale of ordinary shares in this offering, based upon an assumed initial public offering price of $ per ordinary share, which is the midpoint of the range set forth on the cover page of this prospectus, and after deduction of underwriting discounts and commissions and estimated offering expenses payable by us, our pro forma net tangible book value as of June 30, 2016 would have been $ per outstanding ordinary share, or $ per ordinary share. This represents an immediate increase in net tangible book value of $ or % per ordinary share to our existing shareholders and an immediate dilution in net tangible book value of $ or % per ordinary share, or $ or % per ordinary share, to new investors of ordinary shares in this offering. Dilution is determined by subtracting net tangible book value per ordinary share immediately upon the completion of this offering from the assumed initial public offering price per ordinary share.
The following table illustrates such dilution, assuming no exercise of the underwriters’ option to purchase additional ordinary shares:
Assumed initial public offering price per ordinary share | ||||
Pro forma net tangible book value per ordinary share as of June 30, 2016 | ||||
Amount of dilution in pro forma net tangible book value per ordinary share immediately after this offering | ||||
Amount of dilution in pro forma net tangible book value per ordinary share to new investors in the offering |
If the underwriters exercise their option to purchase additional ordinary shares in full in this offering, the pro forma as adjusted net tangible book value after the offering would be $ per ordinary share, the increase in net tangible book value per share to existing shareholders would be $ and the decrease in net tangible book value per share to new investors would be $ per ordinary share, in each case at the initial public offering price of $ per ordinary share.
A $1.00 change in the assumed initial public offering price of $ per ordinary share would, in the case of an increase, increase the dilution per ordinary share to new investors in this offering by $ per ordinary share and, in the case of a decrease, decrease the dilution per ordinary share to new investors in this offering by $ per ordinary share, in each case, after deducting underwriting discounts and commissions and estimated offering expenses. The pro forma information discussed above is illustrative only. Our net tangible book value following the completion of this offering is subject to adjustment based on the actual initial public offering price of our ordinary shares.
87
Table of Contents
SELECTED CONSOLIDATED FINANCIAL AND OTHER INFORMATION
The following tables present our selected consolidated financial and operating information. The selected consolidated financial information as of June 30, 2016 and for the six months ended June 30, 2016 and 2015 have been derived from our unaudited condensed consolidated interim financial statements, and the notes thereto, included elsewhere in this prospectus, in each case including all adjustments that we consider necessary for a fair presentation of the financial position and the results of operations for these periods. The selected consolidated financial information as of December 31, 2015 and 2014 and for the years ended December 31, 2015, 2014 and 2013 have been derived from ICP’s audited consolidated financial statements, and the notes thereto, included elsewhere in this prospectus, and the consolidated financial information as of December 31, 2013, 2012 and 2011 and for the years ended December 31, 2012 and 2011 have been derived from ICP’s consolidated financial statements, and the notes thereto, which are not included in this prospectus. Neither our nor ICP’s historical results for any prior period are necessarily indicative of results expected in any future period. Additionally, the selected consolidated interim financial and operating information as of and for the six months ended June 30, 2016 are not necessarily indicative of the results expected as of and for the year ended December 31, 2016 or for any period subsequent to June 30, 2016.
We also present the selected financial information and operating statistics of DEORSA. DEOCSA, Guatemel and RECSA, each of which we acquired on January 22, 2016. The selected financial information for the six months ended June 30, 2016, the one-hundred and sixty day period from January 22, 2016 to June 30, 2016 (the period in the first half of 2016 from the date of acquisition), the twenty-one day period from January 1, 2016 to January 21, 2016, and the six months ended June 30, 2015 have been derived from the unaudited condensed interim financial statements and the notes thereto included elsewhere in this prospectus for each of DEORSA, DEOCSA, Guatemel and RECSA. The selected condensed financial information for the year ended December 31, 2015 has been derived from the audited financial statements and the notes thereto included elsewhere in this prospectus for each of DEORSA, DEOCSA, Guatemel and RECSA. DEORSA’s, DEOCSA’s, Guatemel’s and RECSA’s historical results for any prior period are not necessarily indicative of results expected in any future period. Additionally, the selected condensed interim financial and operating information for the six months ended June 30, 2016 are not necessarily indicative of the results expected for the year ended December 31, 2016 or for any period subsequent to June 30, 2016.
You should read the selected consolidated financial and operating information set forth below in conjunction with the sections entitled “Summary Consolidated Financial and Other Information,” “Unaudited Pro Forma Condensed Consolidated Financial Information,” “Use of Proceeds,” “Capitalization,” and “Management’s Discussion and Analysis of Financial Condition and Results of Operations” as well as in conjunction with our unaudited condensed consolidated interim financial statements, our audited financial statements, ICP’s audited consolidated financial statements, the condensed interim financial statements of each of DEORSA, DEOCSA, Guatemel and RECSA, the audited financial statements of each of DEORSA, DEOCSA, Guatemel and RECSA, and the notes thereto included elsewhere in this prospectus. Except as otherwise indicated, or unless the context requires otherwise, references to “the Company,” “we,” “us” and “our” prior to the date of the Reorganization shall refer to ICP and its businesses, and as of the date of the Reorganization and thereafter, to IC Power and its subsidiaries, including ICP.
88
Table of Contents
The following table presents our selected consolidated statement of income data for the periods presented:
IC Power Pte. Ltd. | I.C. Power Asia Development Ltd. (formerly known as I.C. Power Ltd.) | |||||||||||||||||||||||||||
Six Months Ended June 30, | Year Ended December 31, | |||||||||||||||||||||||||||
2016 | 2015 | 2015 | 20141 | 20131 | 20121 | 2011 | ||||||||||||||||||||||
| ($ millions) | ||||||||||||||||||||||||||||
Selected Consolidated Statements of Income | ||||||||||||||||||||||||||||
Continuing Operations Information | ||||||||||||||||||||||||||||
Sales | $ | 881 | $ | 655 | $ | 1,289 | $ | 1,372 | $ | 873 | $ | 576 | $ | 526 | ||||||||||||||
Cost of sales (excluding depreciation and amortization) | (644 | ) | (458 | ) | (909 | ) | (936 | ) | (594 | ) | (396 | ) | (377 | ) | ||||||||||||||
Depreciation and amortization | (72 | ) | (54 | ) | (111 | ) | (101 | ) | (72 | ) | (51 | ) | (38 | ) | ||||||||||||||
|
|
|
|
|
|
|
|
|
|
|
|
|
| |||||||||||||||
Gross profit | 165 | 143 | 269 | 335 | 207 | 129 | 111 | |||||||||||||||||||||
|
|
|
|
|
|
|
|
|
|
|
|
|
| |||||||||||||||
General, selling and administrative expenses | (60 | ) | (31 | ) | (71 | ) | (69 | ) | (41 | ) | (37 | ) | (32 | ) | ||||||||||||||
Asset write-off | — | — | — | (35 | ) | — | — | — | ||||||||||||||||||||
Gain on bargain purchase | — | — | — | 68 | 1 | — | 24 | |||||||||||||||||||||
Measurement to fair value of pre-existing share | — | — | — | 3 | — | — | — | |||||||||||||||||||||
Other expenses | (1 | ) | (1 | ) | (6 | ) | (11 | ) | — | — | — | |||||||||||||||||
Other income | 7 | 2 | 11 | 17 | 5 | 7 | — | |||||||||||||||||||||
|
|
|
|
|
|
|
|
|
|
|
|
|
| |||||||||||||||
Operating income | 111 | 113 | 203 | 308 | 172 | 99 | 103 | |||||||||||||||||||||
|
|
|
|
|
|
|
|
|
|
|
|
|
| |||||||||||||||
Financing expenses, net | 74 | 53 | 104 | 119 | 80 | 44 | 36 | |||||||||||||||||||||
|
|
|
|
|
|
|
|
|
|
|
|
|
| |||||||||||||||
Share in income of associated companies | — | — | — | 2 | 2 | 2 | 2 | |||||||||||||||||||||
|
|
|
|
|
|
|
|
|
|
|
|
|
| |||||||||||||||
Income before taxes from continuing operations | 37 | 60 | 99 | 191 | 94 | 57 | 69 | |||||||||||||||||||||
Taxes on income | (21 | ) | (25 | ) | (50 | ) | (63 | ) | (48 | ) | (18 | ) | (16 | ) | ||||||||||||||
|
|
|
|
|
|
|
|
|
|
|
|
|
| |||||||||||||||
Net income from continuing operations | 16 | 35 | 49 | 128 | 46 | 39 | 53 | |||||||||||||||||||||
|
|
|
|
|
|
|
|
|
|
|
|
|
| |||||||||||||||
Net income from discontinued operations, net of tax | — | 4 | 4 | 2 | 128 | 3 | 28 | 4 | 29 | 4 | 20 | 4 | ||||||||||||||||
|
|
|
|
|
|
|
|
|
|
|
|
|
| |||||||||||||||
Net income for the period | $ | 16 | $ | 39 | $ | 53 | $ | 256 | $ | 74 | $ | 68 | $ | 73 | ||||||||||||||
|
|
|
|
|
|
|
|
|
|
|
|
|
| |||||||||||||||
Attributable to: | ||||||||||||||||||||||||||||
Equity holders of IC Power or ICP, as indicated | 7 | 30 | 36 | 227 | 61 | 58 | 60 | |||||||||||||||||||||
Non-controlling interest | 9 | 9 | 17 | 29 | 13 | 10 | 13 | |||||||||||||||||||||
Weighted average number of shares (in millions of shares) of IC Power5 | 0.56 | 0.56 | 0.56 | 0.56 | 0.56 | 0.56 | 0.56 | |||||||||||||||||||||
Earnings per share of IC Power (in USD)5 | 11.6 | 52.9 | 64.4 | 405.9 | 109.1 | 103.7 | 107.3 | |||||||||||||||||||||
Dividends per share of IC Power (in USD)5 | — | — | — | 66.73 | — | — | — | |||||||||||||||||||||
| 1. | During 2015, an immaterial error was identified with respect to the deferred tax calculation relating to the effect of foreign exchange rate on non-monetary assets in previous years in ICP. ICP’s financial information for 2014, 2013 and 2012 has been revised to correct this immaterial error. |
| 2. | Reflects dividends received from Edegel post-equity method accounting. |
| 3. | Reflects (a) the results of Acter Holdings, which consists of our $18 million proportionate share of Generandes’ results of operations during the period and (b) $110 million net gain on sale of discontinued operations as a result of the sale of our interest in Generandes, through which we held our indirect interest in Edegel. |
89
Table of Contents
| 4. | Reflects the results of Acter Holdings, which primarily consists of our proportionate share of Edegel’s results for the period. |
| 5. | In light of the change in IC Power’s capital as a result of the Reorganization, and given the non-comparability of IC Power’s and ICP’s capital structures for each of the periods above, earnings and dividends per share information is based upon IC Power’s capital post-Reorganization for each of the periods above. |
The following table presents our selected consolidated statement of financial position information as of the dates presented:
IC Power Pte. | I.C. Power Asia Development Ltd. (formerly known as I.C. Power Ltd.) | |||||||||||||||||||||||
As of June 30, | As of December 31, | |||||||||||||||||||||||
2016 | 2015 | 20141 | 20131 | 20121 | 2011 | |||||||||||||||||||
| ($ millions) | ||||||||||||||||||||||||
Selected Consolidated Statement of Financial Position Information | ||||||||||||||||||||||||
Cash and cash equivalents | $ | 234 | $ | 360 | $ | 583 | $ | 517 | $ | 184 | $ | 221 | ||||||||||||
Short-term deposits and restricted cash | 85 | 302 | 208 | 9 | 81 | 171 | ||||||||||||||||||
Trade receivables | 254 | 123 | 181 | 138 | 96 | 75 | ||||||||||||||||||
Total current assets | 742 | 884 | 1,089 | 724 | 416 | 536 | ||||||||||||||||||
Investments in associated companies | 9 | 9 | 10 | 286 | 312 | 283 | ||||||||||||||||||
Property, plant and equipment | 3,500 | 2,972 | 2,515 | 1,875 | 1,583 | 1,247 | ||||||||||||||||||
Total assets | 4,729 | 4,091 | 3,842 | 3,031 | 2,459 | 2,169 | ||||||||||||||||||
Short-term credit from banks and others | 339 | 353 | 162 | 244 | 80 | 81 | ||||||||||||||||||
Trade payables | 281 | 144 | 144 | 92 | 42 | 57 | ||||||||||||||||||
Total current liabilities | 792 | 650 | 452 | 451 | 172 | 217 | ||||||||||||||||||
Long-term loans from banks and others | 1,765 | 1,556 | 1,499 | 788 | 670 | 487 | ||||||||||||||||||
Loans and capital notes from parent | 225 | — | — | 242 | 237 | 219 | ||||||||||||||||||
Debentures | 839 | 656 | 687 | 637 | 516 | 525 | ||||||||||||||||||
Total liabilities | 3,913 | 3,065 | 2,829 | 2,237 | 1,709 | 1,547 | ||||||||||||||||||
Share capital and premium | 559 | 431 | 431 | 431 | 431 | 431 | ||||||||||||||||||
Retained earnings | 428 | 423 | 389 | 204 | 137 | 80 | ||||||||||||||||||
Total equity attributable to the equity holders of IC Power or ICP, as indicated | 609 | 826 | 802 | 649 | 620 | 550 | ||||||||||||||||||
Non-controlling interest | 207 | 200 | 211 | 145 | 130 | 72 | ||||||||||||||||||
|
|
|
|
|
|
|
|
|
|
|
| |||||||||||||
Total equity | 816 | 1,026 | 1,013 | 794 | 750 | 622 | ||||||||||||||||||
|
|
|
|
|
|
|
|
|
|
|
| |||||||||||||
Total liabilities and equity | $ | 4,729 | $ | 4,091 | $ | 3,842 | $ | 3,031 | $ | 2,459 | $ | 2,169 | ||||||||||||
|
|
|
|
|
|
|
|
|
|
|
| |||||||||||||
| 1. | During 2015, an immaterial error was identified with respect to the deferred tax calculation relating to the effect of foreign exchange rate on non-monetary assets in previous years in ICP. ICP’s financial information for 2014, 2013 and 2012 has been revised to correct this immaterial error. |
90
Table of Contents
The following table presents our selected consolidated cash flow information for the periods presented:
IC Power Pte. Ltd. | I.C. Power Asia Development Ltd. (formerly known as I.C. Power Ltd.) | |||||||||||||||||||||||||||
Six Months Ended June 30, | Year Ended December 31, | |||||||||||||||||||||||||||
2016 | 2015 | 2015 | 2014 | 2013 | 2012 | 2011 | ||||||||||||||||||||||
| ($ millions) | ||||||||||||||||||||||||||||
Selected Consolidated Cash Flow Information | ||||||||||||||||||||||||||||
Net cash provided by operating activities | $ | 55 | $ | 131 | $ | 320 | $ | 413 | $ | 272 | $ | 122 | $ | 127 | ||||||||||||||
Net cash used in investing activities | (177 | ) | (341 | ) | (621 | ) | (378 | ) | (258 | ) | (293 | ) | (643 | ) | ||||||||||||||
Net cash provided by (used in) financing activities | (6 | ) | 63 | 89 | 47 | 320 | 132 | 623 | ||||||||||||||||||||
|
|
|
|
|
|
|
|
|
|
|
|
|
| |||||||||||||||
Net increase (decrease) in cash and cash equivalents | (128 | ) | (147 | ) | (212 | ) | 82 | 334 | (39 | ) | 107 | |||||||||||||||||
Cash and cash equivalents at beginning of the period | 360 | 583 | 583 | 517 | 184 | 221 | 114 | |||||||||||||||||||||
Effect of changes in the exchange rate on cash and cash equivalents | 2 | — | (11 | ) | (16 | ) | (1 | ) | 2 | — | ||||||||||||||||||
|
|
|
|
|
|
|
|
|
|
|
|
|
| |||||||||||||||
Cash and cash equivalents at end of the period | $ | 234 | $ | 436 | $ | 360 | $ | 583 | $ | 517 | $ | 184 | $ | 221 | ||||||||||||||
|
|
|
|
|
|
|
|
|
|
|
|
|
| |||||||||||||||
Key Financial and Other Operating Information – IC Power and ICP
The following tables set forth certain key financial and operating data for the periods presented:
IC Power Pte. Ltd. | I.C. Power Asia Development Ltd. (formerly known as I.C. Power Ltd.) | |||||||||||||||||||||||||||
Six Months Ended June 30, | Year Ended December 31, | |||||||||||||||||||||||||||
2016 | 2015 | 2015 | 20141 | 20131 | 20121 | 2011 | ||||||||||||||||||||||
| ($ millions, except as otherwise indicated) | ||||||||||||||||||||||||||||
Net income from continuing operations | 16 | 35 | 49 | 128 | 46 | 39 | 53 | |||||||||||||||||||||
Net income for the period | 16 | 39 | 53 | 256 | 74 | 68 | 73 | |||||||||||||||||||||
AdjustedEBITDA2 | 188 | 125 | 326 | 395 | 247 | 154 | 120 | |||||||||||||||||||||
Netdebt3 | 2,624 | 1,893 | 4 | 1,903 | 1,557 | 1,143 | 1,001 | 701 | ||||||||||||||||||||
Installed capacity of operating companies and associated companies at end of period (MW) | 3,384 | 2,642 | 2,665 | 2,642 | 2,070 | 1,572 | 1,280 | |||||||||||||||||||||
Proportionate capacity of operating companies and associated companies at end of period (MW) | 2,731 | 2,149 | 2,170 | 2,108 | 1,608 | 1,198 | 979 | |||||||||||||||||||||
Weighted average availability during the period (%) | 92 | % | 94 | % | 95 | % | 94 | % | 94 | % | 93 | % | 91 | % | ||||||||||||||
Gross energy generated (GWh) | 6,737 | 6,020 | 13,109 | 13,156 | 8,820 | 6,339 | 6,011 | |||||||||||||||||||||
Energy sold under PPAs (GWh) | 7,059 | 6,883 | 13,748 | 14,220 | 9,217 | 5,365 | 5,212 | |||||||||||||||||||||
| 1. | During 2015, an immaterial error was identified with respect to the deferred tax calculation relating to the effect of foreign exchange rate on non-monetary assets in previous years in ICP. ICP’s financial information for 2014, 2013 and 2012 has been revised to correct this immaterial error. |
| 2. | Adjusted EBITDA is a non-IFRS measure. For a reconciliation of our net income to our Adjusted EBITDA, see “Summary Consolidated Financial and Other Information—Key Financial and Other OperatingInformation—IC Power and ICP.” |
| 3. | Net Debt is a non-IFRS measure. For a reconciliation of our total debt to our net debt, see “Summary Consolidated Financial and Other Information—Key Financial and Other Operating Information—IC Power and ICP.” |
| 4. | Figure is derived from ICP’s unaudited condensed consolidated interim statements of financial position as of June 30, 2015. |
91
Table of Contents
Set forth belowis a summary of certain key historical financial and other operational information, according to our business lines and segments, for the periods set forth below. For all periods prior to our acquisition of Energuate, we operated one business line (generation) and evaluated this business line according to four geographic segments. However, since January 22, 2016, the date on which we completed our acquisition of Energuate, our results of operations reflect an additional business line (distribution). Our distribution business consists entirely of DEORSA and DEOCSA. Guatemel and RECSA, which we also acquired on January 22, 2016, are included within our generation business and have been included in our Central America and Other segments, respectively, as a result of their business lines.
For additional historical information on DEORSA, DEOCSA, Guatemel and RECSA, each of which we acquired in January 2016, including for certain periods prior to our acquisition of these companies, see “—Key Financial and Other Operating Information—DEORSA, DEOCSA, Guatemel and RECSA” below.
| Six Months Ended June 30, 2016 | ||||||||||||||||||||||||||||
| Generation | Distribution | Adjustments | Consolidated Results | |||||||||||||||||||||||||
| Peru | Israel | Central America | Other1 | Guatemala | ||||||||||||||||||||||||
| ($ millions, except as otherwise indicated) | ||||||||||||||||||||||||||||
Sales | 236 | 176 | 157 | 73 | 240 | (1 | ) | 881 | ||||||||||||||||||||
Cost of Sales | (152 | ) | (144 | ) | (121 | ) | (47 | ) | (181 | ) | 1 | (644 | ) | |||||||||||||||
Operating income (loss) | 50 | 15 | 11 | (2 | ) | 32 | 5 | 111 | ||||||||||||||||||||
Operating margins | 21 | % | 9 | % | 7 | % | (3 | )% | 13 | % | (500 | )% | 13 | % | ||||||||||||||
Financing expenses, net | (23 | ) | (7 | ) | (7 | ) | (26 | ) | (11 | ) | — | (74 | ) | |||||||||||||||
Net income (loss) for the period | 19 | 8 | 1 | (31 | ) | 15 | 4 | 16 | ||||||||||||||||||||
|
|
|
|
|
|
|
|
|
|
|
|
|
| |||||||||||||||
Installed capacity of operating companies and associated companies at end of period (MW) | 1,679 | 458 | 596 | 651 | — | — | 3,384 | |||||||||||||||||||||
Proportionate capacity of operating companies at end of period (MW) | 1,259 | 370 | 528 | 574 | — | — | 2,731 | |||||||||||||||||||||
Gross energy generated (GWh) | 3,047 | 1,666 | 1,141 | 882 | — | — | 6,737 | |||||||||||||||||||||
Energy sold under PPAs (GWh) | 3,173 | 1,987 | 1,420 | 479 | — | — | 7,059 | |||||||||||||||||||||
| 1. | In addition to the results of certain of our generation assets, our Other segment also includes expenses and other adjustments relating to our headquarters and intermediate holding companies, including purchase price allocations recorded in connection with our acquisition of Energuate, which allocations were recorded by Inkia, one of our intermediate holding companies. However, as our Other segment is primarily composed of the financial results of certain of our generation assets and their related holding companies, we analyze the results of our Other segment within our discussion of the results of our generation business. |
| Six Months Ended June 30, 2015 | ||||||||||||||||||||||||
| Peru | Israel | Central America | Other1 | Adjustments | Consolidated Results | |||||||||||||||||||
| ($ millions, except as otherwise indicated) | ||||||||||||||||||||||||
Sales | 225 | 157 | 175 | 98 | — | 655 | ||||||||||||||||||
Cost of Sales | (139 | ) | (112 | ) | (140 | ) | (67 | ) | — | (458 | ) | |||||||||||||
Operating income | 53 | 31 | 18 | 6 | 5 | 113 | ||||||||||||||||||
Operating margins | 24 | % | 20 | % | 10 | % | 6 | % | — | 17 | % | |||||||||||||
Financing expenses, net | (20 | ) | (13 | ) | (5 | ) | (15 | ) | — | (53 | ) | |||||||||||||
Net income (loss) for the period | 18 | 13 | 10 | (6 | ) | 4 | 39 | |||||||||||||||||
|
|
|
|
|
|
|
|
|
|
|
| |||||||||||||
Installed capacity of operating companies and associated companies at end of period (MW) | 1,063 | 440 | 504 | 635 | — | 2,642 | ||||||||||||||||||
Proportionate capacity of operating companies at end of period (MW) |
| 797 |
| 352 |
| 436 |
|
| 564 |
| — | 2,149 | ||||||||||||
Gross energy generated (GWh) | 1,928 | 1,937 | 1,123 | 1,032 | — | 6,020 | ||||||||||||||||||
Energy sold under PPAs (GWh) | 3,191 | 1,965 | 1,235 | 492 | — | 6,883 | ||||||||||||||||||
| 1. | In addition to the results of certain of our generation assets, our Other segment also includes expenses and other adjustments relating to our headquarters and intermediate holding companies. |
92
Table of Contents
| Year Ended December 31, 2015 | ||||||||||||||||||||||||
| Peru | Israel | Central America | Other1 | Adjustments | Consolidated Results | |||||||||||||||||||
| ($ millions, except as otherwise indicated) | ||||||||||||||||||||||||
Sales | $ | 448 | $ | 326 | $ | 337 | $ | 178 | — | $ | 1,289 | |||||||||||||
Cost of Sales | (279 | ) | (242 | ) | (265 | ) | (123 | ) | — | (909 | ) | |||||||||||||
Operating income | 102 | 53 | 39 | (1 | ) | 10 | 203 | |||||||||||||||||
Operating margins | 23 | % | 16 | % | 12 | % | — | — | 16 | % | ||||||||||||||
Financing expenses, net | (42 | ) | (23 | ) | (10 | ) | (29 | ) | — | (104 | ) | |||||||||||||
Net income for the period | $ | 31 | $ | 22 | $ | 23 | $ | (31 | ) | $ | 8 | $ | 53 | |||||||||||
|
|
|
|
|
|
|
|
|
|
|
| |||||||||||||
Installed capacity of operating companies and associated companies at end of period (MW) | 1,063 | 458 | 504 | 640 | — | 2,665 | ||||||||||||||||||
Proportionate capacity of operating companies at end of period (MW) | 797 | 370 | 436 | 567 | — | 2,170 | ||||||||||||||||||
Gross energy generated (GWh) | 5,166 | 3,837 | 2,208 | 1,898 | — | 13,109 | ||||||||||||||||||
Energy sold under PPAs (GWh) | 6,327 | 3,976 | 2,450 | 995 | — | 13,748 | ||||||||||||||||||
| 1. | In addition to the results of certain of our generation assets, our Other segment also includes expenses and other adjustments relating to our headquarters and intermediate holding companies. |
| Year Ended December 31, 2014 | ||||||||||||||||||||||||
| Peru | Israel | Central America | Other1 | Adjustments | Consolidated Results | |||||||||||||||||||
| ($ millions, except as otherwise indicated) | ||||||||||||||||||||||||
Sales | $ | 437 | $ | 413 | $ | 308 | $ | 214 | — | $ | 1,372 | |||||||||||||
Cost of Sales | (270 | ) | (252 | ) | (260 | ) | (154 | ) | — | (936 | ) | |||||||||||||
Operating income | 108 | 127 | 21 | 43 | 9 | 308 | ||||||||||||||||||
Operating margins | 25 | % | 31 | % | 7 | % | 20 | % | — | 22 | % | |||||||||||||
Financing expenses, net | (34 | ) | (30 | ) | (8 | ) | (46 | ) | (1 | ) | (119 | ) | ||||||||||||
Net income for the period | $ | 45 | $ | 71 | $ | 9 | $ | 124 | $ | 7 | $ | 256 | ||||||||||||
|
|
|
|
|
|
|
|
|
|
|
| |||||||||||||
Installed capacity of operating companies and associated companies at end of period (MW) | 1,063 | 440 | 504 | 635 | — | 2,642 | ||||||||||||||||||
Proportionate capacity of operating companies at end of period (MW) | 797 | 352 | 395 | 564 | — | 2,108 | ||||||||||||||||||
Gross energy generated (GWh) | 5,920 | 3,465 | 1,965 | 1,806 | — | 13,156 | ||||||||||||||||||
Energy sold under PPAs (GWh) | 6,324 | 3,973 | 2,694 | 1,229 | — | 14,220 | ||||||||||||||||||
| 1. | In addition to the results of certain of our generation assets, our Other segment also includes expenses and other adjustments relating to our headquarters and intermediate holding companies. |
93
Table of Contents
| Year Ended December 31, 2013 | ||||||||||||||||||||||||
| Peru | Israel | Central America | Other1 | Adjustments | Consolidated Results | |||||||||||||||||||
| ($ millions, except as otherwise indicated) | ||||||||||||||||||||||||
Sales | $ | 394 | $ | 187 | $ | 147 | $ | 145 | — | $ | 873 | |||||||||||||
Cost of Sales | (239 | ) | (139 | ) | (127 | ) | (89 | ) | — | (594 | ) | |||||||||||||
Operating income | 101 | 31 | 7 | 23 | 10 | 172 | ||||||||||||||||||
Operating margins | 26 | % | 17 | % | 5 | % | 16 | % | — | 20 | % | |||||||||||||
Financing expenses, net | (34 | ) | (22 | ) | — | (23 | ) | (1 | ) | (80 | ) | |||||||||||||
Net income for the period | $ | 35 | $ | 7 | $ | 5 | $ | 20 | $ | 7 | $ | 74 | ||||||||||||
Installed capacity of operating companies and associated companies at end of period (MW) | 870 | 440 | 140 | 620 | — | 2,070 | ||||||||||||||||||
Proportionate capacity of operating companies at end of period (MW) | 652 | 352 | 99 | 505 | — | 1,608 | ||||||||||||||||||
Gross energy generated (GWh) | 5,459 | 1,357 | 458 | 1,546 | — | 8,820 | ||||||||||||||||||
Energy sold under PPAs (GWh) | 6,268 | 1,813 | 535 | 601 | — | 9,217 | ||||||||||||||||||
| 1. | In addition to the results of certain of our generation assets, our Other segment also includes expenses and other adjustments relating to our headquarters and intermediate holding companies. |
Key Financial and Other Operating Information – DEORSA, DEOCSA, Guatemel and RECSA
Set forth below is a summary of the key historical financial and other operational information of each of DEORSA, DEOCSA, Guatemel and RECSA for the periods set forth below.
DEORSA
Six-month period | Six-month period ended | 21-day period from January 1, 2016 to January 21, 2016 | 161-day period from | |||||||||||||
| ($ thousands, unless otherwise indicated) | ||||||||||||||||
Energy sales | 116,986 | 120,885 | 14,618 | 102,368 | ||||||||||||
Services rendered | 2,697 | 2,366 | 425 | 2,272 | ||||||||||||
Other revenue | 3,049 | 4,838 | 228 | 2,821 | ||||||||||||
|
|
|
|
|
|
|
| |||||||||
Total revenue | 122,732 | 128,089 | 15,271 | 107,461 | ||||||||||||
Cost of sales | ||||||||||||||||
Energy purchases | (78,051 | ) | (75,870 | ) | (8,870 | ) | (69,181 | ) | ||||||||
Other cost of sales | (16,614 | ) | (16,215 | ) | (2,410 | ) | (14,204 | ) | ||||||||
|
|
|
|
|
|
|
| |||||||||
Total cost of sales | (94,665 | ) | (92,085 | ) | (11,280 | ) | (83,385 | ) | ||||||||
|
|
|
|
|
|
|
| |||||||||
Gross profit | 28,067 | 36,004 | 3,991 | 24,076 | ||||||||||||
General, selling and administrative expense | (10,608 | ) | (9,210 | ) | (2,276 | ) | (8,332 | ) | ||||||||
Financial income | 1,188 | 1,002 | 64 | 1,124 | ||||||||||||
Financial expenses | (5,247 | ) | (6,129 | ) | (583 | ) | (4,664 | ) | ||||||||
|
|
|
|
|
|
|
| |||||||||
Profit before income tax | 13,400 | 21,667 | 1,196 | 12,204 | ||||||||||||
Income Tax | (3,554 | ) | (5,675 | ) | (344 | ) | (3,210 | ) | ||||||||
|
|
|
|
|
|
|
| |||||||||
Profit for the period | 9,846 | 15,992 | 852 | 8,994 | ||||||||||||
Energy purchased (GWh) | 630 | 585 | 69 | 580 | ||||||||||||
Total electricity losses (%) | 16.2 | % | 15.4 | % | 19.4 | % | 15.8 | % | ||||||||
Energy distributed to regulated customers (GWh) | 502 | 466 | 53 | 448 | ||||||||||||
Energy distributed to unregulated customers (GWh)1 | 23 | 28 | 3 | 20 | ||||||||||||
| 1. | Unregulated customers consist of end users with a demand exceeding 100 kW, consisting principally of industrial and commercial customers. |
94
Table of Contents
Year Ended | ||||
| ($ thousands, unless otherwise indicated) | ||||
Energy sales | 238,648 | |||
Services rendered | 4,720 | |||
Other revenues | 4,557 | |||
|
| |||
Total revenue | 247,925 | |||
Energy purchases | (156,320 | ) | ||
Other costs of sales | (33,312 | ) | ||
|
| |||
Total cost of sales | (189,632 | ) | ||
|
| |||
Gross profit | 58,293 | |||
General selling and administrative expense | (22,813 | ) | ||
Financial income | 1,927 | |||
Financial expenses | (11,857 | ) | ||
Other income | 4,040 | |||
|
| |||
Profit before income tax | 29,590 | |||
Income tax | (7,070 | ) | ||
|
| |||
Profit for the year | 22,520 | |||
Energy purchased (GWh) | 1,201 | |||
Total electricity losses (%) | 16.7 | % | ||
Energy distributed to regulated customers (GWh) | 950 | |||
Energy distributed to unregulated customers (GWh) | 50 | |||
95
Table of Contents
DEOCSA
Six-month | Six-month | 21-day period from | 161-day period from | |||||||||||||
| ($ thousands, unless otherwise indicated) | ||||||||||||||||
Energy sales | 151,996 | 159,994 | 19,448 | 132,548 | ||||||||||||
Services rendered | 2,360 | 1,719 | 322 | 2,038 | ||||||||||||
Other revenue | 4,028 | 4,200 | 298 | 3,730 | ||||||||||||
|
|
|
|
|
|
|
| |||||||||
Total revenue | 158,384 | 165,913 | 20,068 | 138,316 | ||||||||||||
Cost of Sales | ||||||||||||||||
Energy purchases | (103,077 | ) | (98,845 | ) | (12,000 | ) | (91,077 | ) | ||||||||
Other cost of sales | (18,507 | ) | (17,977 | ) | (2,814 | ) | (15,693 | ) | ||||||||
|
|
|
|
|
|
|
| |||||||||
Total cost of sales | (121,584 | ) | (116,822 | ) | (14,814 | ) | (106,770 | ) | ||||||||
|
|
|
|
|
|
|
| |||||||||
Gross profit | 36,800 | 49,091 | 5,254 | 31,546 | ||||||||||||
General, selling and administrative expense | (20,208 | ) | (17,873 | ) | (3,379 | ) | (16,829 | ) | ||||||||
Financial income | 1,015 | 1,097 | 129 | 886 | ||||||||||||
Financial expenses | (7,906 | ) | (8,869 | ) | (877 | ) | (7,029 | ) | ||||||||
|
|
|
|
|
|
|
| |||||||||
Profit before income tax | 9,701 | 23,446 | 1,127 | 8,574 | ||||||||||||
Income Tax | (2,975 | ) | (6,125 | ) | (336 | ) | (2,639 | ) | ||||||||
|
|
|
|
|
|
|
| |||||||||
Profit for the period | 6,726 | 17,321 | 791 | 5,935 | ||||||||||||
Energy purchased (GWh) | 806 | 767 | 93 | 713 | ||||||||||||
Total electricity losses (%) | 19.5 | % | 17.5 | % | 22.2 | % | 19.1 | % | ||||||||
Energy distributed to regulated customers (GWh) | 621 | 595 | 70 | 555 | ||||||||||||
Energy distributed to unregulated customers (GWh)1 | 34 | 53 | 4 | 31 | ||||||||||||
| 1. | Unregulated customers consist of end users with a demand exceeding 100 kW, consisting principally of industrial and commercial customers. |
Year Ended | ||||
| ($ thousands, unless otherwise indicated) | ||||
Energy sales | 317,967 | |||
Services rendered | 3,547 | |||
Other revenues | 3,128 | |||
|
| |||
Total revenue | 324,642 | |||
Energy purchases | (205,058 | ) | ||
Other cost of sales | (37,516 | ) | ||
|
| |||
Total cost of sales | (242,574 | ) | ||
|
| |||
Gross profit | 82,068 | |||
General selling and administrative expense | (39,282 | ) | ||
Financial income | 2,046 | |||
Financial expenses | (16,980 | ) | ||
Other income | 242 | |||
|
| |||
Profit before income tax | 28,094 | |||
Income tax | (7,041 | ) | ||
|
| |||
Profit for the year | 21,053 | |||
Energy purchased (GWh) | 1,585 | |||
Total electricity losses (%) | 17.7 | % | ||
Energy distributed to regulated customers (GWh) | 1,239 | |||
Energy distributed to unregulated customers (GWh) | 65 | |||
96
Table of Contents
Guatemel
Six-month | Six-month | 21-day period | 161-day period from | |||||||||||||
| ($ thousands) | ||||||||||||||||
Energy sales | 3,116 | 4,248 | 325 | 2,791 | ||||||||||||
Energy purchases | (3,018 | ) | (3,960 | ) | (299 | ) | (2,720 | ) | ||||||||
Other cost of sales | (34 | ) | (27 | ) | (4 | ) | (29 | ) | ||||||||
|
|
|
|
|
|
|
| |||||||||
Gross (loss) profit | 64 | 261 | 22 | 42 | ||||||||||||
General, selling and administrative expenses | (266 | ) | (192 | ) | (81 | ) | (185 | ) | ||||||||
Financial income | 25 | 19 | — | 25 | ||||||||||||
Financial expenses | (19 | ) | (14 | ) | (1 | ) | (18 | ) | ||||||||
Other income | 128 | 129 | 22 | 107 | ||||||||||||
|
|
|
|
|
|
|
| |||||||||
Loss before income tax | (68 | ) | 201 | (38 | ) | (30 | ) | |||||||||
Income tax | 15 | (39 | ) | 8 | �� | 7 | ||||||||||
|
|
|
|
|
|
|
| |||||||||
Net loss for the period | (53 | ) | 163 | (30 | ) | (23 | ) | |||||||||
Year Ended December 31, | ||||
| ($ thousands) | ||||
Energy sales | 7,950 | |||
Energy purchases | (7,445 | ) | ||
Other cost of sales | (52 | ) | ||
|
| |||
Gross profit | 453 | |||
Other income | 382 | |||
General, selling and administrative expenses | (435 | ) | ||
Financial income | 44 | |||
Financial expenses | (26 | ) | ||
|
| |||
Income before income tax | 418 | |||
Income Tax | (81 | ) | ||
|
| |||
Net profit for the year | 337 | |||
RECSA
Six-month | Six-month | 21-day period from | 161-day period from | |||||||||||||
| ($ thousands) | ||||||||||||||||
Toll Services | 921 | 863 | 106 | 816 | ||||||||||||
Cost of services | (348 | ) | (297 | ) | (50 | ) | (299 | ) | ||||||||
|
|
|
|
|
|
|
| |||||||||
Gross profit | 573 | 566 | 56 | 517 | ||||||||||||
General, selling and administrative expenses | (160 | ) | (114 | ) | (15 | ) | (145 | ) | ||||||||
Financial income | 8 | 7 | — | 8 | ||||||||||||
Finance expenses | (162 | ) | (149 | ) | (6 | ) | (156 | ) | ||||||||
|
|
|
|
|
|
|
| |||||||||
Profit before income taxes | 260 | 311 | 35 | 225 | ||||||||||||
Income Tax | (68 | ) | (58 | ) | (10 | ) | (58 | ) | ||||||||
|
|
|
|
|
|
|
| |||||||||
Profit for the period | 192 | 254 | 25 | 167 | ||||||||||||
97
Table of Contents
Year Ended | ||||
| ($ thousands) | ||||
Toll services | 1,970 | |||
Cost of services | (734 | ) | ||
|
| |||
Gross Profit | 1,236 | |||
General, selling and administrative expenses | (238 | ) | ||
Financial income | 17 | |||
Financial expenses | (329 | ) | ||
|
| |||
Profit before income taxes | 685 | |||
Income tax | 128 | |||
|
| |||
Profit for the year | 558 | |||
Adjusted EBITDA and Net Debt
Set forth below is the Adjusted EBITDA for DEORSA, DEOCSA, Guatemel and RECSA for the 161-day period from January 22, 2016 to June 30, 2016, as well as a reconciliation to these companies’ net profit. For the period, Adjusted EBITDA is defined as net profit (loss) for the period, before depreciation and amortization, other revenues—government grants, finance expenses, net and income tax expense (benefit). Adjusted EBITDA is a non-IFRS measure and other companies may calculate Adjusted EBITDA differently, and therefore this presentation of Adjusted EBITDA may not be comparable to other similarly titled measures used by other companies.
161-day period from January 22, 2016 to June 30, | ||||||||||||||||
DEORSA | DEOCSA | Guatemel | RECSA | |||||||||||||
| ($ thousands) | ||||||||||||||||
Net profit (loss) for the period | $ | 8,994 | $ | 5,935 | $ | (23 | ) | $ | 167 | |||||||
Depreciation and amortization | 4,821 | 6,208 | 20 | 207 | ||||||||||||
Other Revenues—Government Grants | (1,412 | ) | (1,418 | ) | — | — | ||||||||||
Finance expenses, net | 3,540 | 6,143 | (7 | ) | 147 | |||||||||||
Income tax expense (benefit) | 3,210 | 2,639 | (7 | ) | 58 | |||||||||||
|
|
|
|
|
|
|
| |||||||||
Adjusted EBITDA | $ | 19,153 | $ | 19,507 | $ | (17 | ) | $ | 579 | |||||||
|
|
|
|
|
|
|
| |||||||||
Set forth below is the net debt for DEORSA, DEOCSA, Guatemel and RECSA as of June 30, 2016, as well as a reconciliation to these companies’ total debt. Net debt is defined as total debt attributable to these companies, minus the cash of such companies. Net debt is a non-IFRS measure and is not a measure of liabilities in accordance with IFRS.
| DEORSA | DEOCSA | Guatemel | RECSA | |||||||||||||
| ($ thousands) | ||||||||||||||||
Total debt1 | $ | 104,152 | $ | 160,354 | $ | 197 | $ | 4,583 | ||||||||
Cash2 | 7,086 | 6,687 | 1,294 | 1,218 | ||||||||||||
|
|
|
|
|
|
|
| |||||||||
Net debt | $ | 97,066 | $ | 153,667 | $ | (1,097 | ) | $ | 3,365 | |||||||
|
|
|
|
|
|
|
| |||||||||
| 1. | Total debt comprises current and non-current debt with financial entities. |
| 2. | Includes cash and cash equivalents and restricted cash. |
98
Table of Contents
MANAGEMENT’S DISCUSSION AND ANALYSIS OF FINANCIAL CONDITION AND
RESULTS OF OPERATIONS
This information should be read in conjunction with our unaudited condensed consolidated interim financial statements, and the notes thereto, as of June 30, 2016 and for the six months ended June 30, 2016 and 2015, and ICP’s audited consolidated financial statements, and the notes thereto, as of December 31, 2015 and 2014, and for the years ended December 31, 2015, 2014 and 2013, included elsewhere in this prospectus. These financial statements have been prepared in accordance with IFRS as issued by the IASB. The financial information below also includes certain non-IFRS measures, which are defined under “Summary Consolidated Financial and Other Information” and “Business” and are used by us to evaluate our economic and financial performance. These measures are not identified as accounting measures under IFRS and therefore should not be considered as an alternative measure to evaluate our performance.
Certain information included in this discussion and analysis includes forward-looking statements that are subject to risks and uncertainties, and which may cause actual results to differ materially from those expressed or implied by such forward-looking statements. For further information on important factors that could cause our actual results to differ materially from the results described in the forward-looking statements contained in this discussion and analysis, see “Special Note Regarding Forward-Looking Statements” and “Risk Factors.”
Except as otherwise indicated, or unless the context requires otherwise, references to “the Company,” “we,” “us” and “our” prior to the date of the Reorganization shall refer to ICP and its businesses, and as of the date of the Reorganization and thereafter, to IC Power and its subsidiaries, including ICP.
We are a leading owner, developer and operator of power generation facilities located in key energy markets in Latin America, the Caribbean and Israel. Additionally, in January 2016, we completed our acquisition of Energuate (comprised of two electricity distribution companies in Guatemala (DEORSA and DEOCSA)), marking our initial entry in the electricity distribution sector.
The power generation companies within our portfolio utilize a range of energy sources, including natural gas, hydroelectric, HFO, diesel and wind. We principally focus our generation operations in Latin American markets, which typically have higher growth rates of GDP and lower overall and per capita energy consumption, as compared with more developed markets. We believe that economic growth in Latin American markets will drive increases in overall and per capita energy consumption and therefore require significant additional investments in power generation assets in those markets. As of June 30, 2016, our installed capacity and proportionate capacity were 3,384 MW and 2,731 MW, respectively, including Kanan’s 92 MW thermal generation project in Panama, which reached COD in April 2016, and Samay I’s 616 MW cold-reserve thermoelectric project in Peru, which reached COD in May 2016.
We increased our installed capacity by an additional 510 MW, to 3,894 MW (3,114 MW on a proportionate basis), in August 2016 upon the completion of the three generating units of CDA’s 510 MW hydroelectric plant located in Peru. In addition, in August 2015, we acquired AIE, which currently operates an 18 MW plant in Israel and holds a conditional license for the construction of a cogeneration power station in Israel. AIE commenced construction of the plant in June 2016, and the AIE plant, which is expected to have a capacity of 140 MW, is expected to reach its COD by the end of 2018.
Between 2007 and June 30, 2016, we invested approximately $3.0 billion in the acquisition, development and expansion of our power generation assets. Of this amount, 80% represented investments in greenfield development (including investments made in CDA, Samay I and Kanan) and 20% represented acquisitions. We have financed our greenfield development using a combination of cash on hand, debt financing
99
Table of Contents
and investments by minority shareholders at the asset level, and have financed the acquisitions of our power generation assets using cash on hand. As of June 30, 2016, of the 2,835 MW that we have added to our installed capacity since Inkia’s formation, 72% was derived from greenfield development projects, consisting primarily of our construction of Kallpa’s combined cycle plant, Peru’s largest power generation facility, the construction of OPC’s plant, which became Israel’s first IPP, and the construction of the Samay I project, a cold-reserve thermoelectric plant in Peru. In the same period, we have acquired businesses with an aggregate installed capacity of 801 MW in Israel and five countries in Latin America. As of the end of August 2016, we had derived 76% of our installed capacity growth since 2007 from greenfield development efforts.
In January 2016, we completed our acquisition of Energuate (comprised of two electricity distribution companies in Guatemala (DEORSA and DEOCSA)) and two smaller, related companies (Guatemel and RECSA) for $266 million. As of December 31, 2015, Energuate provides electric service for approximately 1.6 million regulated customers in Guatemala (representing approximately 55% of Guatemala’s regulated distribution customers in 2015) and distributes energy across approximately 100,000 km2in Guatemala, covering approximately 12 million inhabitants. Energuate operates approximately 34,000 km of distribution lines within Guatemala (representing approximately 70% of Guatemala’s distribution lines) as of December 31, 2015, and holds the non-exclusive right to distribute electricity within its service area until 2048. In the years ended December 31, 2015 and 2014, Energuate sold 2,305 GWh and 2,164 GWh of energy, respectively.
By successfully pursuing growth opportunities, primarily through contracted greenfield development projects in existing markets and acquisitions of anchor investments in new markets, we have expanded our regional presence, diversified our generation portfolio through the addition of various facilities which use a range of energy sources, and significantly increased our cash flows. In 2015, our Adjusted EBITDA was $326 million, as compared to $41 million in 2008, representing a CAGR of 34% during this period. Adjusted EBITDA is a non-IFRS measure. For a reconciliation of our net income to our Adjusted EBITDA, see “Summary Consolidated Financial and OtherData—Information—Key Financial and Other OperatingInformation—IC Power and ICP.”
Overview of Financial Information Presented and Accounting Policies
In March 2016, as more fully described in “Corporate Formation and Reorganization,” Kenon effected an internal reorganization pursuant to which it transferred all of its equity interests in ICP to us. In connection therewith, we became the holding company under which ICP and its subsidiaries conduct their operations. ICP is our predecessor for accounting reporting purposes. During the period from May 4, 2015 (IC Power’s inception) through December 31, 2015, IC Power did not incur any material expenses or recognize any material assets or liabilities. Therefore, IC Power’s consolidated financial statements as of and for the year ended December 31, 2015 have not been restated to retroactively reflect the Reorganization, as there would be no material differences between such restated financial statements and ICP’s audited financial statements as of and for the year ended December 31, 2015. As ICP is considered to be our predecessor for accounting reporting purposes, except as otherwise indicated, or unless the context requires otherwise, financial information relating to “the Company,” “we,” “us” and “our” for the years ended December 31, 2015, 2014 and 2013 has been derived from ICP’s audited consolidated financial statements and financial information relating to “the Company,” “we,” “us” and “our” for the six months ended June 30, 2016 has been derived from IC Power’s unaudited condensed consolidated interim financial statements, which include comparative periods against the six months ended June 30, 2015, which have been adjusted to retroactively reflect the completion of the Reorganization and have been presented using the values from the condensed consolidated interim financial statements of ICP (similar to the pooling-of-interest method).
100
Table of Contents
Operating Segments and Presentation of Segment Financial Data
As a holding company, our results of operations are impacted by the financial results of each of our businesses. Set forth below is a summary of the segmentation of each of our businesses. We have included the results of operations of each of our businesses and, where applicable, their segments under “—Operating Results” below.
Business | Entity | Country | Segment | |||
Generation | Kallpa | Peru | ||||
CDA | Peru | Peru | ||||
Samay I | Peru | |||||
OPC | Israel | Israel | ||||
AIE | Israel | |||||
Corinto | Nicaragua | CentralAmerica | ||||
Tipitapa Power | Nicaragua | |||||
Amayo I | Nicaragua | |||||
Amayo II | Nicaragua | |||||
Puerto Quetzal | Guatemala | |||||
Poliwatt | Guatemala | |||||
Guatemel | Guatemala | |||||
Nejapa | El Salvador | |||||
Cenérgica | El Salvador | |||||
Kanan | Panama | |||||
COBEE | Bolivia | Other1 | ||||
Central Cardones | Chile | |||||
Colmito | Chile | |||||
CEPP | Dominican Republic | |||||
JPPC | Jamaica | |||||
Surpetroil | Colombia | |||||
RECSA | Guatemala | |||||
Pedregal2 | Panama | |||||
Inkia & Other | — | |||||
ICP & Other | — | |||||
ICPDH | — | |||||
Distribution
| DEORSA | Guatemala | Distribution | |||
DEOCSA | Guatemala |
| 1. | In addition to the results of certain of our generation assets, our Other segment also includes expenses and other adjustments relating to our headquarters and intermediate holding companies, including purchase price allocations recorded in connection with our acquisition of Energuate, which allocations were recorded by Inkia, one of our intermediate holding companies. However, as our Other segment is primarily composed of the financial results of certain of our generation assets and their related holding companies, we analyze the results of our Other segment within our discussion of the results of our generation business. |
| 2. | Although Pedregal is located in Central America, our interest in Pedregal is a minority interest. Therefore, from an income statement perspective, Pedregal is not part of the Central America segment and is reflected in our “Other” segment in our share in income of associated companies. |
Critical Accounting Policies and Significant Estimates
In preparing our financial statements, we make judgments, estimates and assumptions about the carrying amounts of assets and liabilities that are not readily apparent from other sources. Our estimates and associated assumptions are reviewed on an ongoing basis and are based upon historical experience and various other assumptions that we believe to be reasonable under the circumstances. Actual results may differ from these estimates under different assumptions or conditions.
101
Table of Contents
We believe that the estimates, assumptions and judgments involved in the accounting policies described below have the greatest potential impact on our financial statements. For further detail of the accounting policies and the methods used in the preparation of our consolidated financial statements, see Notes 2 and 3 of ICP’s audited consolidated financial statements as of December 31, 2015.
Impairment Analysis
For each reporting period, we examine whether there have been any events or changes in circumstances which would indicate an impairment of one or more non-monetary assets or cash generating units, or CGUs. When there are indications of an impairment, a review is made as to whether the carrying amount of the non-monetary assets or CGUs exceeds the recoverable amount and, if so, an impairment loss is recognized. An assessment of the impairment of the goodwill in a consolidated company is performed once a year or when triggering events exist.
Under IFRS, the recoverable amount of the asset or CGU is determined based upon the higher of (1) the fair value less costs of disposal, and (2) the present value of the future cash flows expected from the continued use of the asset or CGU in its present condition, including cash flows expected to be received upon the retirement of the asset from service and the eventual sale of the asset (value in use). The future cash flows are discounted to their present value using a discount rate that reflects current market assessments of the time-value of money and the risks specific to the asset or CGU.
The estimates regarding future cash flows are based upon past experience with respect to this asset or similar assets (or CGUs), and on our businesses’ best possible assessments regarding the economic conditions that will exist during the remaining useful life of the asset or CGU. Such estimates rely on the particular business’ current development plans and forecasts. As the actual cash flows may differ, the recoverable amount determined could change in subsequent periods, such that an additional impairment loss may need to be recognized or a previously recognized impairment loss may need to be reversed.
At least once a year, we perform an assessment of the impairment of the goodwill in our CGUs to which goodwill has been allocated. As of December 31, 2015, 2014 and 2013, we determined that the carrying amount of the CGUs to which goodwill has been allocated did not exceed the recoverable amount.
At the end of each reporting period, we assess whether there is any indication that any of the CGUs may be impaired and consider, among other things, whether there are indications of any of the following:
| • | Significant changes in the technological, economic or legal environment in which the CGUs operate, taking into account the country in which each CGU operates; |
| • | Increases in interest rates or other market rates of return, which are likely to affect the discount rates used in calculating each CGU’s recoverable amount; |
| • | Evidence of obsolescence or physical damage of each CGU’s assets; |
| • | Actual performance of each CGU that does not meet expected performance indicators (e.g., its budget); |
| • | Declines in tariffs agreed upon in PPAs and/or in current energy prices; |
| • | Increases in fuel and/or gas prices and other power generation costs; and |
| • | New laws and regulations, or changes in existing laws and regulations, that could have an adverse effect on the power generation industry. |
102
Table of Contents
As of December 31, 2013, our CGUs were performing according to budget and were profitable, and none of the aforementioned indications were present so as to suggest that our CGUs may be impaired. Therefore, we determined that there was no need to measure the recoverable amount of our CGUs to which goodwill has not been allocated as of such date.
During 2014, one of Inkia’s subsidiaries updated its five-year budget as a result of a downward trend in its results combined with anticipated impacts of recent political changes in the country in which the subsidiary operates, which affects the power generation business therein, and expectations of an increase in operating costs and unchanged electricity prices, which will probably lead to a decrease in its profitability. As a result, Inkia considered a potential impairment in this subsidiary and conducted an impairment analysis using the value in use method and a discount rate of 7.6%. Accordingly, Inkia determined that the book value of the subsidiary’s assets exceeded its recoverable amount and therefore recorded an impairment loss of $35 million in the year ended December 31, 2014. At the end of 2015, Inkia performed an impairment test on the long-lived assets of this subsidiary to identify whether the impairment loss should be reversed or whether an additional impairment loss is required. As a result of this assessment, no reversal or additional impairment loss was required as of December 31, 2015. However, due to the sensitivity of the assumptions used, we believe that minor changes in the key assumptions may materially affect the carrying value of this subsidiary in the future.
As of December 31, 2015, our CGUs were performing according to budget and were profitable, and none of the aforementioned indications were present so as to suggest that our CGUsmay be impaired. Therefore, we determined that there was no need to measure the recoverable amount of our CGUs to which goodwill has not been allocated as of such date.
Revenue Recognition
Revenue is recognized to the extent that it is probable that the economic benefits will flow to us and the revenue can be reliably measured, regardless of when the payment is made. Revenue comprises the fair value for the sale of capacity and energy, taking into account contractually defined terms of payment, net of value added tax, rebates and discounts, and after eliminating intra-group sales.
Assuming all other revenue recognition criteria are met, revenues from the sale of capacity and energy are recognized in the period during which the sale occurs. Revenues from our power generation assets are earned and recorded when energy is delivered or capacity is provided at prices specified pursuant to our PPAs or, if the sales were made on the spot market, according to the marginal spot market price at the time of the sale. As a result, the application of our revenue recognition policy is not generally subject to significant estimates or assumptions. However, at the close of each accounting period, we may need to make estimations and assumptions with respect to the volume of energy delivered to our customers during any unbilled period near the end of the relevant accounting period. These estimates are based upon the volume of energy delivered in, and the consumer price index (used to adjust the monthly PPA’s prices) of, the previous month. The differences between the estimated revenue recognized during such period and the actual revenues subsequently realized are recorded in the following accounting period. Historically, these differences have not been significant or material in nature. As revenues generated from our capacity sales are not consumption-based, the calculation of our revenues derived from capacity sales do not involve equivalent estimates or assumptions at the close of each accounting period.
Income Tax
Whenever necessary, we are required to make provisions based on the amount of taxes expected to be paid to the tax authorities. When the final taxable result differs from the amounts initially recognized in the provision as a consequence of estimates, such differences will affect both our income tax and the determination of our deferred tax assets and liabilities.
103
Table of Contents
In addition, in order to determine our income tax provision, it is necessary to make estimates to the extent that we will have to evaluate, on an ongoing basis, the positions taken in tax returns in respect of those situations in which the applicable tax legislation is subject to interpretation. A significant degree of judgment is required to determine our income tax provision, as there are many transactions and calculations for which the ultimate tax determination is uncertain. We recognize liabilities for eventual tax claims based on estimates of whether additional taxes will be due in the future. When the final tax outcome of these matters differs from the amounts initially recognized, such differences will have an impact on our current and deferred income tax assets and our liabilities in the period in which such determination is made.
Deferred tax assets are reviewed at each reporting date and are only recognized to the extent that they are probable and a sufficient taxable base will be available to allow for the total or partial recovery of these assets. Deferred tax assets and liabilities are not discounted. In assessing the realization of deferred tax assets, we take account of the extent to which we believe that it is likely that a portion of the deferred tax assets will not be realized. Our ultimate realization of deferred tax assets depends upon our generation of future taxable income in the periods in which these temporary differences become deductible. To make this assessment, we take into consideration the scheduled reversal of deferred tax liabilities, the projections of future taxable income and tax planning strategies.
Provisions for Contingent Liabilities
A provision for claims is recognized as a liability (assuming that a reliable estimate can be made) because it is a present obligation and it is probable that an outflow of resources embodying economic benefits will be required to settle the obligations. Provisions in general are highly judgmental, especially in cases of legal disputes. We assess the probability of an adverse event and, if the probability is evaluated to be more likely than not, we fully provide for the total amount of the estimated contingent liability. We continually evaluate our pending provisions to determine if accruals are required. It is often difficult to accurately estimate the ultimate outcome of a contingent liability. Different variables can affect the timing and amounts we provide for certain contingent liabilities. These assessments, therefore, are subject to estimates made by us and our legal counsel, and adverse revisions in these estimates of the potential liability could materially impact our financial condition, results of operations or liquidity. For further information on our legal proceedings, see “Business—Legal Proceedings.”
104
Table of Contents
Material Factors Affecting Results of Operations
CapacityGrowth
As set forth below, our capacity, excluding the capacity attributable to those assets that were in advanced stages of construction, was 3,384 MW as of June 30, 2016, representing a 115% growth in capacity since January 1, 2013. Our proportionate capacity, excluding the capacity attributable to CDA, which was in the advanced stages of construction, was 2,731 MW as of June 30, 2016.
Entity | Country | Energy used to | COD/ Date of Acquisition | Installed Capacity (MW)1,2 | Proportionate Capacity3 | |||||||||
Capacity at January 1, 2013 | 1,572 | 1,198 | ||||||||||||
OPC | Israel | Natural gas and diesel | COD—July 2013 | 440 | 352 | |||||||||
Colmito | Chile | Natural gas and diesel | Acquired—October 2013 | 58 | 58 | |||||||||
Total increase in capacity during 2013 | 498 | 410 | ||||||||||||
Capacity at January 1, 2014 | 2,070 | 1,608 | ||||||||||||
Corinto | Nicaragua | HFO | Acquired—March 2014 | 71 | 46 | |||||||||
Tipitapa Power | Nicaragua | HFO | Acquired—March 2014 | 51 | 33 | |||||||||
Amayo I | Nicaragua | Wind | Acquired—March 2014 | 40 | 24 | |||||||||
Amayo II | Nicaragua | Wind | Acquired—March 2014 | 23 | 14 | |||||||||
Surpetroil | Colombia | Natural gas | Acquired—March 2014 | 15 | 9 | |||||||||
Kallpa—Las Flores | Peru | Natural gas | Acquired—April 2014 | 193 | 145 | |||||||||
JPPC | Jamaica | HFO | Acquired Remaining Interest—May 20144 | — | 50 | |||||||||
Puerto Quetzal | Guatemala | HFO | Acquired—September 2014 | 179 | 5 | 179 | ||||||||
Total increase in capacity during 2014 | 572 | 500 | ||||||||||||
Capacity at December 31, 2014 | 2,642 | 2,108 | ||||||||||||
Nejapa | El Salvador | HFO | Acquired Remaining Interest—January 20156 | — | 41 | |||||||||
| AIE7 | Israel | Natural gas | Acquired—August 2015 | 18 | 18 | |||||||||
| Surpetroil | Colombia | Natural gas | COD Plants—2015 | 5 | 3 | |||||||||
Total increase in capacity during 2015 | 23 | 62 | ||||||||||||
| Capacity at December 31, 2015 | 2,665 | 2,170 | ||||||||||||
| Kanan | Panama | HFO | COD—April 2016 | 92 | 92 | |||||||||
| Samay I8 | Peru | Diesel and natural gas9 | COD—May 2016 | 616 | 462 | |||||||||
| Surpetroil10 | Colombia | Natural gas | COD Plants—2016 | 11 | 7 | |||||||||
| Total increase in capacity during the six months ended June 30, 2016 | 719 | 561 | ||||||||||||
|
|
|
| |||||||||||
| Capacity at June 30, 2016 | 3,384 | 2,731 | ||||||||||||
|
|
|
| |||||||||||
| 1. | As a result of our sale of our indirect interest in Edegel in September 2014, our capacity growth summary does not include Edegel’s 1,540 MW of installed capacity during the periods in which we held our indirect interest in Edegel. |
| 2. | Reflects 100% of the capacity of each of our assets, regardless of our ownership interest in the entity that owns each such asset. |
| 3. | Reflects the proportionate capacity of each of our assets, as determined by our ownership interest in the entity that owns each such asset. |
| 4. | In May 2014, we increased our equity ownership in JPPC from 16% to 100%. |
| 5. | In November 2014, Puerto Quetzal transferred a 55 MW power barge to Kanan, reducing Puerto Quetzal’s capacity from 234 MW to 179 MW. |
| 6. | In January 2015, we increased our equity ownership in Nejapa from 71% to 100%. |
| 7. | AIE also holds a conditional license for the construction of a cogeneration power station in Israel. This station will be developed as a greenfield project (at an expected cost of $250 million, including the acquisition price of AIE), based upon a plant with 140 MW of capacity. Construction commenced in June 2016 and COD is expected by the end of 2018. |
| 8. | Samay I reached COD in May 2016. In July 2016, all of the plant’s units were declared unavailable to the system due to damage to the shafts in three of the plant’s four units. We have developed a plan to repair the units, and on August 28, 2016, Kenon announced that we expected all four units to be operational within six months. |
| 9. | The Samay I plant will operate as a cold reserve plant with diesel until natural gas becomes available in the area through a pipeline currently under construction. It is uncertain when the pipeline will be completed. |
| 10. | When initially acquired by us, Surpetroil had a capacity of 15 MW. As of June 30, 2016, Surpetroil’s capacity has increased to 31 MW as a result of our completion of various greenfield projects. |
105
Table of Contents
As a result of our capacity expansion, our consolidated revenues, operating income, finance expenses and net income during the periods discussed in this section substantially increased.
In April and May 2016, we completed the development of Kanan’s thermal generation project in Panama and completed the development of Samay I’s 616 MW cold-reserve thermoelectric project in Peru, respectively, further increasing our installed capacity and proportionate capacity to 3,384 MW and 2,731 MW, respectively. In July 2016, all four of Samay I’s units were declared unavailable to the system due to damage to the shafts in three of the plant’s four units. We have developed a plan to repair the units, and on August 28, 2016, Kenon announced that we expected all four units to be operational within six months. We intend to seek coverage for the costs of the outage, including repair costs and loss of profits, as appropriate, from the EPC contractor, equipment manufacturer and/or the insurance coverage (subject to deductibles), and believe we have a reasonable basis to recover these costs, including for loss of profits. For further information on Samay I’s unavailability, see “Business—Generation Segment—Peru—Samay I.” For further information on Samay I’s insurance, see “Business—Insurance.” We increased our installed capacity by an additional 510 MW, to 3,894 MW (3,114 MW on a proportionate basis), in August 2016 upon the completion of the three generating units of CDA’s 510 MW hydroelectric plant located in Peru.
Macroeconomic Conditions in the Countries in Which We Operate
Macroeconomic conditions may impact the gross domestic production of the countries in which we generate or distribute electricity which may, in turn, affect the consumption of electricity by industrial and individual consumers in those countries. For instance, countries experiencing sustained economic growth generally experience an increase in their consumption of electricity. Additionally, macroeconomic conditions are also likely to affect foreign exchange rates, domestic interest rates and inflation, which each has an effect on our financial and operating costs. Fluctuations in the exchange rates between local currencies in the countries in which we operate and the U.S. Dollar, which is our functional and reporting currency, will generate either gains or losses on monetary assets and liabilities denominated in these local currencies and can therefore affect our profitability. Fluctuations in inflation rates may also increase labor costs and other local expenses of our operations, and we may be unable to pass such increases on to our customers (e.g., to customers who purchase energy or capacity from us pursuant to long-term PPAs, which are not linked to local inflation rates).
For further information on the risks associated with currency fluctuations, see “Risk Factors—Risks Related to Government Regulation—Foreign exchange rate fluctuations and controls could have a material adverse effect on our earnings and the strength of our statement of financial position.”
106
Table of Contents
The following table sets forth the percentage growth in GDP, the currency appreciation / depreciation (relative to the U.S. Dollar), and the annual inflation rate for the periods presented for each of the countries in which we operate:
2015 | 2014 | 2013 | ||||||||||||||||||||||||||||||||||
Country | Inflation | GDP | Currency | Inflation | GDP | Currency | Inflation | GDP | Currency | |||||||||||||||||||||||||||
(%) | ||||||||||||||||||||||||||||||||||||
Peru | 3.5 | 3.3 | (12 | ) | 3.2 | 2.4 | (11 | ) | 2.8 | 5.8 | (4 | ) | ||||||||||||||||||||||||
Israel | (0.6 | ) | 2.6 | (9 | ) | (0.2 | ) | 2.6 | 12 | 1.5 | 3.3 | 7 | ||||||||||||||||||||||||
Central America | ||||||||||||||||||||||||||||||||||||
Nicaragua | 4.0 | 4.5 | (5 | ) | 6.4 | 4.0 | (5 | ) | 5.7 | 4.6 | (4 | ) | ||||||||||||||||||||||||
Guatemala | 2.4 | 4.0 | 1 | 3.4 | 4.0 | 4 | 4.3 | 3.7 | (1 | ) | ||||||||||||||||||||||||||
El Salvador | (0.7 | ) | 2.4 | — | 0.5 | 1.8 | — | 0.8 | 1.7 | — | ||||||||||||||||||||||||||
Panama | 0.1 | 5.8 | — | 2.1 | 6.2 | — | 5.9 | 8.4 | — | |||||||||||||||||||||||||||
Other | ||||||||||||||||||||||||||||||||||||
Bolivia | 4.1 | 4.8 | (1 | ) | 5.2 | 5.2 | — | 5.7 | 6.8 | — | ||||||||||||||||||||||||||
Chile | 4.3 | 2.1 | (15 | ) | 4.6 | 1.8 | (23 | ) | 1.8 | 4.3 | (2 | ) | ||||||||||||||||||||||||
Dominican Republic | 0.8 | 7.0 | (3 | ) | 3.0 | 7.3 | (6 | ) | 4.8 | 4.8 | (6 | ) | ||||||||||||||||||||||||
Jamaica | 4.7 | 1.1 | (6 | ) | 6.4 | (0.5 | ) | (10 | ) | 9.5 | 0.2 | (13 | ) | |||||||||||||||||||||||
Colombia | 5.0 | 3.1 | (37 | ) | 3.7 | 4.6 | (7 | ) | 1.9 | 4.9 | (4 | ) | ||||||||||||||||||||||||
For further information on the macroeconomic conditions of the key countries in which we operate or in which we may operate in the future, see“Industry.”
Availability and Dispatch
The regulatory frameworks in each of the countries in which we currently operate, other than Israel and Jamaica, establish marginal cost systems, and the relevant regulatory agencies determine which generation units are to be dispatched, so as to minimize the cost of energy supplied.
The availability of a power generation asset refers to the percentage of time that a plant is available to generate energy. For example, even though they generally maintain the highest place in the dispatch merit order due to their efficiency and low generation costs, hydroelectric plants are unavailable when they are removed from operation to conserve water in the associated reservoirs or river basins or for maintenance, or when there are unscheduled outages. Thermal plants, which are lower in the dispatch merit order than hydroelectric plants, are unavailable for dispatch when they are removed from operation for maintenance or when there are unscheduled outages. Each of the relevant regulatory agencies considers the average availability of generation plants when it allocates firm capacity, which is the amount of capacity that, pursuant to applicable regulations, an energy sector regulator recognizes and remunerates to each power generation unit for being available to cover the demand in peak hours.
IEC, which is owned by the State of Israel and was the sole large-scale provider of energy in Israel prior to the commencement of OPC’s operations in July 2013, is the system operator of Israel’s electricity system and determines the dispatch order of Israel’s generation units. Pursuant to OPC’s PPA with IEC, which covers OPC’s entire firm capacity, OPC has informed IEC of the exclusion of OPC’s entire capacity, so as to sell such capacity directly to private customers. As a result, OPC’s entire capacity has been allocated to private customers in Israel since July 2013.
107
Table of Contents
The following table sets forth the weighted average availability of our generation plants in each of the countries in which we operate for the periods presented, according to segment:
Year Ended | Year Ended | Year Ended | ||||||||||
Peru | 97 | % | 97 | % | 94 | % | ||||||
Israel | ||||||||||||
OPC | 97 | % | 90 | % | 96 | %1 | ||||||
AIE2 | 58 | % | — | — | ||||||||
Central America | ||||||||||||
Nicaragua | 90 | % | 95 | % | — | |||||||
Guatemala | 94 | % | 97 | % | — | |||||||
El Salvador | 96 | % | 97 | % | 95 | % | ||||||
Panama | 94 | % | 93 | % | 92 | % | ||||||
Other | ||||||||||||
Bolivia | 89 | % | 91 | % | 96 | % | ||||||
Chile | 97 | % | 96 | % | 96 | % | ||||||
Dominican Republic | 81 | % | 89 | % | 87 | % | ||||||
Jamaica | 86 | % | 85 | % | 88 | % | ||||||
Colombia | 96 | % | 84 | % | — | |||||||
| 1. | Reflects average availability of OPC since its COD in July 2013. |
| 2. | Reflects average availability of AIE since our acquisition of it in August 2015. AIE’s average availability during the period was affected by preventive major maintenance that was performed after our acquisition of AIE. In the six months ended June 30, 2016, AIE’s average availability was 97%. |
A substantial portion of the capacity in each of the countries in which we currently operate, other than Israel, Nicaragua and Jamaica, is comprised of hydroelectric plants. The marginal cost of production by these plants is almost nil. As a result, these plants are generally the first to be dispatched, when available. However, the availability of these plants is subject to annual and seasonal variations based on the hydrology of the reservoirs and river basins that provide the water to operate these plants. For example, COBEE’s hydroelectric plants are among the first generation units to be dispatched in Bolivia as a result of the low variable costs associated with these units, and CDA’s plant is among the first generation units dispatched in Peru. We seek to ensure that our hydroelectric units are available to be dispatched when necessary, as such availability is important to our ability to capture the benefits of marginal cost dispatch and the maximization of our margins.
When hydroelectric plants are unavailable or have been fully dispatched, other generation plants are generally dispatched on the basis of cost, with lower cost units, such as thermal gas plants, generally dispatched first. The Kallpa facility units, for example, are among the first generation units to be dispatched in Peru after the hydroelectric plants, since the Kallpa plants are among the lowest-cost thermal generation plants in Peru. Generally, the order in which regulatory agencies will dispatch plants which are neither hydroelectric or gas-powered are: (1) wind-powered; (2) coal-powered; (3) HFO-powered; followed by (4) diesel-powered. As many of the countries in which we operate are seeking to incentivize the production of wind and renewable energy plants, which typically have relatively low operating costs, these countries often dispatch wind-powered plants, such as Amayo I and Amayo II, on a priority basis. Similar to hydroelectric plants, however, the availability of wind-powered plants to be dispatched is limited by the availability of the resource (i.e., whether the wind is blowing).
If our generation plants are available for dispatch and are not dispatched, or are partially dispatched, by the relevant system operator and if our obligations to deliver energy under our PPAs exceed the energy dispatched from our own generation units at any particular time, we purchase energy in the spot market to satisfy these obligations. The price of such energy is generally lower than our generation cost, thereby generally increasing our commercial margin.
108
Table of Contents
Similarly, if our generation plants are not allocated sufficient firm capacity to satisfy our obligations under our PPAs, we purchase capacity in the spot market to satisfy these obligations. The spot capacity price is generally substantially similar to the regulated and PPA capacity price.
The following table sets forth the amount of energy sold under our PPAs and in the spot market, and the amount of energy generated and purchased by our generation companies during the years presented, according to segment1:
Segment | Period | Sales under | Sales in | Net | Energy | |||||||||||||
| (GWh) | ||||||||||||||||||
Peru | Kallpa: | |||||||||||||||||
Six Months Ended June 30, 2016 | 3,173 | 155 | 2,936 | 392 | ||||||||||||||
Six Months Ended June 30, 2015 | 3,191 | — | 1,877 | 1,314 | ||||||||||||||
Year Ended December 31, 2015 | 6,327 | 106 | 5,027 | 1,406 | ||||||||||||||
Year Ended December 31, 2014 | 6,324 | 235 | 5,698 | 861 | ||||||||||||||
Year Ended December 31, 2013 | 6,268 | 84 | 5,265 | 1,087 | ||||||||||||||
Samay I3: | ||||||||||||||||||
Six Months Ended June 30, 2016 | — | 48 | 48 | — | ||||||||||||||
Israel | OPC and AIE: | |||||||||||||||||
Six Months Ended June 30, 2016 | 1,987 | — | 1,629 | 358 | ||||||||||||||
Six Months Ended June 30, 2015 | 1,965 | — | 1,899 | 66 | ||||||||||||||
Year Ended December 31, 2015 | 3,976 | — | 3,759 | 217 | ||||||||||||||
Year Ended December 31, 2014 | 3,973 | — | 3,400 | 573 | ||||||||||||||
Year Ended December 31, 2013 | 1,813 | — | 1,331 | 482 | ||||||||||||||
(since July 2013) | ||||||||||||||||||
Central America | ICPNH: | |||||||||||||||||
Six Months Ended June 30, 2016 | 509 | 8 | 503 | 14 | ||||||||||||||
Six Months Ended June 30, 2015 | 521 | 4 | 516 | 9 | ||||||||||||||
Year Ended December 31, 2015 | 1,062 | 28 | 1,054 | 36 | ||||||||||||||
Year Ended December 31, 2014 | 1,063 | 22 | 1,058 | 27 | ||||||||||||||
Year Ended December 31, 2013 | 1,046 | 52 | 1,042 | 56 | ||||||||||||||
| Puerto Quetzal: | ||||||||||||||||||
Six Months Ended June 30, 2016 | 236 | 145 | 253 | 128 | ||||||||||||||
Six Months Ended June 30, 2015 | 315 | 159 | 329 | 145 | ||||||||||||||
Year Ended December 31, 2015 | 594 | 368 | 641 | 321 | ||||||||||||||
Year Ended December 31, 2014 | 1,005 | 53 | 465 | 593 | ||||||||||||||
Year Ended December 31, 2013 | 1,305 | 24 | 489 | 840 | ||||||||||||||
| Nejapa: | ||||||||||||||||||
Six Months Ended June 30, 2016 | 406 | 75 | 227 | 254 | ||||||||||||||
Six Months Ended June 30, 2015 | 399 | 157 | 233 | 323 | ||||||||||||||
Year Ended December 31, 2015 | 794 | 53 | 436 | 411 | ||||||||||||||
Year Ended December 31, 2014 | 626 | 93 | 373 | 346 | ||||||||||||||
Year Ended December 31, 2013 | 535 | 171 | 457 | 249 | ||||||||||||||
| Kanan: | ||||||||||||||||||
Six Months Ended June 30, 2016 | 269 | 4 | 118 | 155 | ||||||||||||||
Other | COBEE: | |||||||||||||||||
Six Months Ended June 30, 2016 | 138 | 375 | 513 | — | ||||||||||||||
Six Months Ended June 30, 2015 | 131 | 459 | 590 | — | ||||||||||||||
Year Ended December 31, 2015 | 270 | 769 | 1,039 | — | ||||||||||||||
Year Ended December 31, 2014 | 268 | 762 | 1,030 | — | ||||||||||||||
Year Ended December 31, 2013 | 276 | 827 | 1,103 | — | ||||||||||||||
| Central Cardones: | ||||||||||||||||||
Six Months Ended June 30, 2016 | — | — | — | — | ||||||||||||||
Six Months Ended June 30, 2015 | — | 4 | 3 | 1 | ||||||||||||||
Year Ended December 31, 2015 | — | 4 | 3 | 1 | ||||||||||||||
Year Ended December 31, 2014 | — | — | — | — | ||||||||||||||
Year Ended December 31, 2013 | — | — | — | — | ||||||||||||||
109
Table of Contents
Segment | Period | Sales under | Sales in | Net | Energy | |||||||||||||
| (GWh) | ||||||||||||||||||
| Colmito: | ||||||||||||||||||
Six Months Ended June 30, 2016 | 140 | 5 | 5 | 140 | ||||||||||||||
Six Months Ended June 30, 2015 | 132 | 26 | 26 | 132 | ||||||||||||||
Year Ended December 31, 2015 | 255 | 26 | 26 | 255 | ||||||||||||||
Year Ended December 31, 2014 | 250 | — | 5 | 245 | ||||||||||||||
Year Ended December 31, 2013 | — | 46 | 45 | 1 | ||||||||||||||
| CEPP: | ||||||||||||||||||
Six Months Ended June 30, 2016 | 8 | 139 | 139 | 8 | ||||||||||||||
Six Months Ended June 30, 2015 | — | 143 | 143 | — | ||||||||||||||
Year Ended December 31, 2015 | — | 291 | 291 | — | ||||||||||||||
Year Ended December 31, 2014 | 253 | 54 | 236 | 71 | ||||||||||||||
Year Ended December 31, 2013 | 325 | 53 | 332 | 46 | ||||||||||||||
| JPPC: | ||||||||||||||||||
Six Months Ended June 30, 2016 | 160 | — | 160 | — | ||||||||||||||
Six Months Ended June 30, 2015 | 205 | — | 205 | — | ||||||||||||||
Year Ended December 31, 2015 | 427 | — | 427 | — | ||||||||||||||
Year Ended December 31, 2014 | 410 | — | 410 | — | ||||||||||||||
Year Ended December 31, 2013 | 432 | — | 432 | — | ||||||||||||||
| Surpetroil: | ||||||||||||||||||
Six Months Ended June 30, 2016 | 33 | 2 | 35 | — | ||||||||||||||
Six Months Ended June 30, 2015 | 24 | — | 24 | — | ||||||||||||||
Year Ended December 31, 2015 | 43 | — | 43 | — | ||||||||||||||
Year Ended December 31, 2014 | 48 | — | 48 | — | ||||||||||||||
Year Ended December 31, 2013 | 45 | — | 22 | — | ||||||||||||||
| Pedregal: | ||||||||||||||||||
Six Months Ended June 30, 2016 | 150 | 51 | 177 | 24 | ||||||||||||||
Six Months Ended June 30, 2015 | 132 | 63 | 187 | 8 | ||||||||||||||
Year Ended December 31, 2015 | 280 | 102 | 343 | 39 | ||||||||||||||
Year Ended December 31, 2014 | 270 | 135 | 391 | 14 | ||||||||||||||
Year Ended December 31, 2013 | 200 | 205 | 405 | — | ||||||||||||||
Total (excluding Pedregal) | Six Months Ended June 30, 2016 | 7,059 | 956 | 6,566 | 1,449 | |||||||||||||
Six Months Ended June 30, 2015 | 6,883 | 952 | 5,845 | 1,990 | ||||||||||||||
Year Ended December 31,2015 | 13,748 | 1,645 | 12,746 | 2,647 | ||||||||||||||
Year Ended December 31, 2014 | 14,220 | 1,219 | 12,723 | 2,716 | ||||||||||||||
Year Ended December 31, 2013 | 12,045 | 1,257 | 10,518 | 2,761 | ||||||||||||||
| 1. | The information included within the table reflects 100% of the energy sold under PPAs, sold in the spot market, generated, and purchased by our assets, regardless of our ownership interest in the entity that owns each such asset, and also contains information for certain of our assets from periods prior to our acquisition of such asset. For further information on our acquisition of assets during the periods within the table, see “—Capacity Growth.” |
| 2. | Net energy generated is defined as energy delivered at the interconnection to the system. |
| 3. | Samay I reached COD in May 2016. In July 2016, all of the plant’s units were declared unavailable to the system due to damage to the shafts in three of the plant’s four units. We have developed a plan to repair the units, and on August 28, 2016, Kenon announced that we expected all four units to be operational within six months. For further information, see “Business—Generation Segment—Peru— Samay I.” |
Cost of Sales
Our principal costs of sales are natural gas, HFO, lubricants, purchases of capacity and energy on the spot market, transmission costs, personnel, third party services and maintenance costs.
Our costs for natural gas, which include transportation costs, vary primarily based on the quantity of natural gas consumed, the variation of market prices of HFO, to which our natural gas prices are indexed, and whether we consume all of the natural gas that we are obligated to purchase under our natural gas supply contracts. Kallpa’s long-term gas supply contract with the Camisea Consortium, which is also used to supply gas to Las Flores, hedges Kallpa against fluctuations in the price of natural gas, however, Kallpa’s agreement with the Camisea Consortium will expire in June 2022, unless renewed by the parties. Once expired, Kallpa and Las Flores may be required to purchase their natural gas on spot markets at prices that may be greater than the prices
110
Table of Contents
they previously paid for such commodities and could therefore face increased volatility in their earnings and cash flows. The price adjustments in our PPAs, which are generally indexed to the cost of natural gas, generally limit our exposure of such renewal.
The price at which OPC purchases its natural gas from its sole natural gas supplier, the Tamar Group, is predominantly indexed (in excess of 70%) to changes in the EA’s (which replaced the PUAE) generation component tariff, pursuant to the price formula set forth in OPC’s supply agreement with the Tamar Group. As a result, increases or decreases in this tariff have a related effect on OPC’s cost of sales and margins. Additionally, the natural gas price formula in OPC’s supply agreement is subject to a floor mechanism. PUAE generation component tariffs were lower in 2015 as compared to 2012-2014. Additionally, on September 8, 2015, the PUAE published a final decision, which became effective on September 13, 2015, and which further reduced the PUAE generation component tariff by approximately 12% from NIS 300.9 per MWh and NIS 301.5 per MWh to a single tariff of NIS 265.2 per MWh. In addition, in October 2016, the EA published a draft decision regarding a further reduction of the generation component tariff. If the draft decision is approved at a public hearing to be held in November 2016, the generation component tariff will be further reduced by approximately 8% from NIS 265.2 per MWh to NIS 242.9 per MWh. As a result of previous declines in the PUAE generation component tariff, OPC began to pay the ultimate floor price in November 2015. Therefore, the September 2015 decline, the potential decline to be considered at the November 2016 public hearing and any further declines in the EA generation component tariff will not result in a corresponding decline in OPC’s natural gas expenses, and will lead to a greater decline in OPC’s margins.
Our costs for HFO, which include transportation costs, vary primarily based on the quantity of HFO consumed and the variation of market prices of HFO. For example, we generate electricity using HFO in each of the countries comprising our Central America segment, as well as in the Dominican Republic. The price adjustment mechanisms in our PPAs in these countries generally limit our exposure to the price of HFO.
As fuel is a significant cost for most of our operating companies, the price of various fuels (e.g., gas, diesel, or HFO) has a significant effect on our costs. However, as prices in the spot market tend to reflect current fuel prices and, as the majority of our PPAs contain a fuel price adjustment mechanism to reflect increases or decreases in the price of fuel, changes in fuel prices generally result in corresponding changes in revenues as a result of these pass-through mechanisms and do not substantially affect our operating margins. Accordingly, while the decline in global oil prices since 2014 has resulted, in part, in a decline in our revenues for the six months ended June 30, 2016 and the year ended December 31, 2015, such decline in global oil prices did not have a commensurate effect on our operating margins or Adjusted EBITDA for these periods. In some cases, however, the fuel price adjustment mechanisms in our PPAs may not adjust to reflect the full increase or decrease in fuel prices, or may reflect such adjustments on a lagging basis as a result of the indexation mechanisms of our PPAs (which update only periodically and have minimum thresholds) and the indexations of our long-term supply agreements.
Our costs for transmission vary primarily according to the quantity of energy that we sell and the locations of the specific nodes to which our plants are connected in the national interconnected electrical systems of the various countries in which we operate. Under our PPAs and the regulatory regimes under which we sell energy in the spot market, most transmission costs are passed on to our customers.
We incur personnel and third party services costs in the operation of our plants. These costs are usually independent of the volumes of energy produced by our plants. We incur maintenance costs in connection with the ongoing and periodic maintenance of our generation plants. These costs are usually correlated to the volumes of energy produced and the number of running hours of our plants.
Results from Associated Company
Our net income, cash flows from operations and statements of financial condition are affected by the results of Pedregal, in which we hold a 21% indirect equity interest.
We recognize our proportional share in the net income of Pedregal, currently our only associated company, in our statement of income as share in profit in associates. Our share in profit in associated companies was $343 thousand, $274 thousand, $2 million and $2 million during the six months ended June 30, 2016 and the
111
Table of Contents
years ended December 31, 2015, 2014 and 2013, respectively. We record dividends received from Pedregal as cash inflows from operating activities in our statement of cash flows. During the six months ended June 30, 2016 we did not receive dividends from Pedregal. During the years ended December 31, 2015, 2014 and 2013, we received dividends from Pedregal in the aggregate amount of $1 million, $2 million and $5 million, respectively. The carrying value that we recognize for Pedregal in our statement of financial position is adjusted to reflect our proportional share in the net income of Pedregal and the dividends received from Pedregal, which is adjusted to reflect the cumulative translation adjustment to the value of our investment.
We have a non-controlling interest in Pedregal. As a result, our ability to control the development and operation of Pedregal is limited and we may be dependent on Pedregal’s majority shareholders to approve certain operations. The approval of Pedregal’s majority shareholder is also required for distributions of funds to us. We were party to a management services agreement with Pedregal, which agreement expired in October 2016. The management services agreement designated us as the administrator responsible for the day-to-day management of Pedregal, and therefore enabled us to exert a degree of influence with respect to Pedregal’s management and operation. We expect to renew the management services agreement in November 2016 and continue to exert influence over Pedregal’s management and operation. However, we may be unable to do so.
Effects of Outstanding Indebtedness, including Financial Leases
Our total outstanding consolidated indebtedness was $2,943 million and $2,565 million as of June 30, 2016 and December 31, 2015, respectively, excluding our $220 million notes payable to Kenon (consisting of a $145 million and $75 million note), which notes were issued to Kenon in March 2016 as part of the consideration for Kenon’s contribution of ICP to us in connection with the Reorganization. In October 2016, we prepaid in full our $75 million note payable to Kenon. We intend to prepay the $145 million note in full using the proceeds of this offering.
We financed our acquisition of the Kallpa I, II and III turbines and the Las Flores power plant through financial leases. As a result, we have recognized these turbines and power plant as property, plant and equipment and have recognized the related lease obligations as loans from banks and others, but do not recognize any cash flow from financing activities upon our entry into these financing agreements. Payments under these leases are recognized in our statement of cash flows as cash flows from financing activities at the time that these payments are made. The Kallpa I lease matured in March 2016. In May 2016, the proceeds of Kallpa’s 4.875% senior unsecured notes due May 24, 2026 were principally used to repay all of Kallpa’s outstanding debt (including its short-term debt), other than debt relating to the Las Flores lease.
We are also committed to expanding our operations by developing greenfield assets in accordance with three fundamental principles, one of which includes securing long term project financing agreements to finance our development efforts. These financing agreements are generally stand alone, secured, project-specific, and with no or limited recourse. We expect that our commitment to our operational expansion will result in the incurrence of additional indebtedness, which may, in turn, result in an increase in our outstanding consolidated indebtedness.
Furthermore, as we continue to develop our assets by (1) drawing down on our existing credit facilities with third parties, or (2) securing additional third party financing, as discussed above, to fund our capital expenditures with respect to new assets or projects, we may experience an increase in interest costs. Many of our debt agreements have floating interest rates (e.g., many of the debt instruments bear interest rates based on LIBOR) and, notwithstanding any interest rate swaps which we have entered, or may enter, into to address this risk, a continued increase in interest rates could increase our interest expenses and the cost of the capital required to continue to fund our development and expansion efforts. Other than with respect to an aggregate of $589 million and $557 million of our outstanding indebtedness as of June 30, 2016 and December 31, 2015, respectively (representing some or all of the indebtedness of certain of our subsidiaries, including OPC, DEORSA, DEOCSA, ICPI and COBEE, among others), our outstanding indebtedness is either denominated in,
112
Table of Contents
indexed to, or the subject of interest rate swaps tied to, the U.S. Dollar. Additionally, AIE’s NIS 1 billion (approximately $261 million) loan agreement, entered into in July 2016, is not denominated in, indexed to, or the subject of interest rate swaps tied to, the U.S. Dollar. For further information on our outstanding indebtedness, including the interest rate and currency applicable to the indebtedness, see “—Recent Developments” and “—Material Indebtedness.”
Negative Goodwill
Our development strategy contemplates the acquisition of energy assets in attractive markets, from time to time, in connection with our capacity expansion efforts. Based upon the difference between the amount paid, which we record in connection with our acquisition of such assets, and the net asset fair value, we may recognize a gain on bargain purchase at the purchase date.
For the six months ended June 30, 2016 and the year ended December 31, 2015, we did not recognize a gain on bargain purchase. For the year ended December 31, 2014, we recognized gains on bargain purchases of $24 million, $24 million and $20 million in connection with our acquisitions of ICPNH in March 2014, JPPC in May 2014 and Puerto Quetzal in September 2014, respectively.
Income Taxes
We operate through various subsidiaries in several countries and, as a result, are subject to income tax in various jurisdictions. The following table sets forth the corporate income tax rates applicable to us as of December 31, 2015, 2014 and 2013 in Singapore, our country of incorporation, and each of the countries in which we operate:
| Year Ended December 31, | ||||||||||||
2015 | 2014 | 2013 | ||||||||||
| (%) | ||||||||||||
Singapore | 17 | % | — | — | ||||||||
Peru1 | 28 | % | 30 | % | 30 | % | ||||||
Israel2 | 26.5 | % | 26.5 | % | 25 | % | ||||||
Central America | ||||||||||||
Nicaragua3 | 25 | % | 25 | % | 25 | % | ||||||
Guatemala | 25 | % | 28 | % | 31 | % | ||||||
El Salvador | 30 | % | 30 | % | 30 | % | ||||||
Panama | 25 | % | 25 | % | 25 | % | ||||||
Other | ||||||||||||
Bolivia | 25 | % | 25 | % | 25 | % | ||||||
Chile4 | 22.5 | % | 21 | % | 20 | % | ||||||
DominicanRepublic | 27 | % | 28 | % | 29 | % | ||||||
Jamaica5 | 33.3 | % | 33.3 | % | 33.3 | % | ||||||
Colombia6 | 39 | % | 34 | % | 34 | % | ||||||
| 1. | The corporate income tax rate in Peru decreased to 28% in 2015 and is scheduled to decrease to 27% in 2017 and 2018 and 26% in 2019. The dividend tax rate increased to 6.8% in 2015 and is scheduled to increase to 8% in 2017 and 2018 and 9.3% in 2019. Distributions of profits for 2014 are subject to a tax rate of 4.1%. Kallpa, CDA and Samay I have signed legal stability agreements with the relevant tax authority in Peru pursuant to which, during the term of the corresponding agreement, Kallpa, CDA and Samay I, respectively, will be subject to the income tax regime in place at the time each such agreement was entered into, which stipulates a 30% income tax rate, and not the general income tax regime applicable to other firms in Peru. These stability agreements expire in 2020, 2022 and 2024, respectively. Only after these tax agreements expire, or if Kallpa, CDA and Samay I terminate the corresponding agreement, they will be subject to the general income tax regime of Peru and receive the benefit of the changes in the Peruvian income tax rates described above. |
| 2. | The corporate income tax rate in Israel decreased to 25% on January 1, 2016. |
| 3. | The statutory rate in Nicaragua in 2012-2015 is 30%. However, Empresa Energética Corinto Ltd, or Corinto, and Tipitapa Power Company Ltd, or Tipitapa Power, are subject to 25% income tax, based on a Foreign Investment Agreement signed in June 2000, which protects them from any unfavorable changes in the tax law. In addition, Amayo I and Amayo II are tax exempt from income tax |
113
Table of Contents
| payments, in accordance with Law No.532 for Electric Power Generation with Renewable Sources Incentive, up to a period of seven years after their CODs. |
| 4. | The corporate income tax rate in Chile increased to 22.5% in 2015 and 24% in 2016, and is scheduled to increase to 25% in 2017 for shareholders on the attribution method or decrease to 22.5% in 2017 for shareholders on the cash-basis method. The corporate income tax rate is scheduled to increase to 27% in 2018 for shareholders on the cash-basis method. |
| 5. | 33.3% is the rate applied to regulated companies in Jamaica, including the companies regulated by Office of Utilities Regulation. |
| 6. | The aggregate income tax rate of 34% in Colombia is composed of a base corporate income tax rate of 25% plus the “income tax for equality,” or CREE, tax at a rate of 9%. Beginning in 2015, a surcharge to the CREE tax rate of 5% on income in excess of 800 million Colombian pesos (approximately $272 million) would effectively increase the aggregate income tax rate to approximately 39%. The surcharge on the CREE tax increased to 6% in 2016, and is expected to increase to 8% in 2017 and 9% in 2018, effectively increasing the aggregate income tax rate to approximately 40%, 42% and 43% in 2016, 2017 and 2018, respectively, before being eliminated. |
For further information on the tax rates, including withholding tax rates, applicable to our operating companies, see Note 25 to our audited financial statements included in this prospectus.
Effects of Discontinued Operations
In September 2014, we completed the sale of our indirect equity interest in Edegel for $413 million (which resulted in our recognition of $110 million of net profit). As a result, the results of operations of Generandes (the entity through which we held our indirect equity interest in Edegel) are reflected as discontinued operations in our financial statements presented in this prospectus.
As a result of Generandes’ significance to our results of operations for certain periods prior to our disposition of Generandes, we have included Generandes’ consolidated financial statements as of and for the years ended December 31, 2014, 2013 and 2012 in this prospectus in accordance with Rule 3-09 of Regulation S-X. Additional detail on Generandes’ historic financial performance can be found in these separate financial statements.
Factors Affecting Comparability of Operating and Financial Results
Our operational and financial results for the six months ended June 30, 2016 and the years ended December 31, 2015 and 2014 have been affected by our acquisitions of various operating businesses and these effects must be understood in order to assess the comparability of our operating and financial results in the period to period financial analysis set forth below.
Acquisition of Our Distribution Business and Two Smaller, Related Companies
In January 2016, we completed our acquisition of Energuate, comprised of two electricity distribution companies in Guatemala (DEORSA and DEOCSA), and two smaller, related companies (Guatemel and RECSA). We paid $266 million in cash in connection with the acquisition, and assumed debt in an aggregate amount of $284 million. The total consideration remains subject to working capital adjustments.
For all periods prior to the completion of our acquisition of Energuate, we operated one business line (generation) and evaluated this business line according to four geographic segments. However, since January 22, 2016, the date on which we completed our acquisition of Energuate, our results of operations reflect an additional business line (distribution), which we evaluate according to its sole segment, distribution. Our distribution business and its segment consists entirely of DEORSA and DEOCSA. Energuate, which will be one of the principal operations within our business moving forward, contributed $240 million, $53 million and $32 million to our revenues, gross profit, and operating income, respectively, during the six months ended June 30, 2016 (since January 22, 2016, the date of the completion of the acquisition). Guatemel and RECSA are not included within our distribution business and have been included in our Central America and Other segments, respectively, as a result of their business lines.
While the interest, depreciation, maintenance and similar expenses related to, or resulting from, our acquisition and ownership of these businesses are reflected in our results for the six months ended June 30, 2016,
114
Table of Contents
and our consolidated statement of income includes the results of the acquired companies’ operations since January 22, 2016 (the date of the completion of the acquisitions), the results of these businesses are not fully reflected in our results of operations for the six months ended June 30, 2016. The results of these businesses will affect the comparability of our results of operations from all periods prior to the acquisition. We have supplemented the comparative discussion of our results of operations for the six months ended June 30, 2016 and the year ended December 31, 2015 with pro forma statements of income for such periods, which pro forma statements give effect to the acquisition as if it had occurred in its entirety on January 1, 2015. For further information, see “Unaudited Pro Forma Condensed Consolidated Financial Information”
Acquisition of Generation Assets
Additionally, as set forth in “—Material Factors Affecting Results of Operations—Capacity Growth,” during the year ended December 31, 2015, we successfully completed the acquisition of AIE, which provided us with an additional 18 MW of installed capacity in Israel and generated 23 GWh of power (since the date of its acquisition) during the year ended December 31, 2015. Additionally, during the year ended December 31, 2014, excluding Las Flores (whose results of operations are consolidated with Kallpa’s) we successfully completed the acquisition of six generation assets, including the consolidation of JPPC, which collectively provided us with 439 MW in four countries in Latin America and the Caribbean, as set forth in “—Capacity Growth” and an additional 2,062 GWh of power generated in the year ended December 31, 2014. Although our financial results reflect the results of each of our acquired assets for the periods subsequent to our acquisition of such assets, the year-end generation figures presented throughout this prospectus reflect 100% of the generation figures of our consolidated companies for that year, and therefore include the full-year generation figures of our acquired companies, regardless of our date of acquisition of such companies. As a result, our increase in GWh for the years ended December 31, 2015 and 2014 reflects the contribution of our acquired companies, and also includes certain amounts generated by these companies prior to our acquisition of these companies. However, as our financial results for the year ended December 31, 2015 and 2014, such as our sales and cost of sales, reflect the financial results of these acquisitions from the date of consolidation, our operating results for the years ended December 31, 2015 and 2014 may not be comparable to the financial results for the prior period to the extent of businesses acquired in the period.
As we seek to invest in additional assets through the acquisition of controlling interests in new operating assets, these factors may also affect the comparability of our operating and historical financial results in future periods.
EA Tariffs Affect our Results in our Generation Business’ Israel Segment
In Israel, sales of IPPs are generally made on the basis of PPAs for the sale of energy to customers, with prices predominantly linked to the tariff issued by the EA (which replaced the PUAE in January 2016) and denominated in New Israeli Shekels.
The EA operates a “Time of Use” tariff, which provides different energy rates for different seasons (e.g., summer and winter) and different periods of time during the day. Within Israel, the price of energy varies by season and demand period. For further information on Israel’s seasonality and the related EA tariffs, see “Industry—Israel.”
The PUAE’s rates have affected our revenues and income in the periods under review. PUAE tariffs in the period 2012 to 2014 were incrementally higher to reflect higher fuel prices in 2012, which the PUAE determined would be reflected in higher tariffs in 2012-2014. The revenues in our Israel segment in 2015 were affected by the lower PUAE tariffs, as discussed further below. Additionally, on September 8, 2015, the PUAE published a final decision, which became effective on September 13, 2015, which further reduced the PUAE generation component tariff by approximately 12% from NIS 300.9 per MWh and NIS 301.5 per MWh to a single tariff of NIS 265.2 per MWh. Average prices in 2015 were 21% lower than in 2014.
In addition, in October 2016, the EA published a draft decision regarding a further reduction of the generation component tariff. If the draft decision is approved at a public hearing to be held in November 2016, the generation component tariff will be further reduced by approximately 8% from NIS 265.2 per MWh to NIS 242.9 per MWh.
115
Table of Contents
As a result of previous declines in the PUAE generation component tariff, OPC began to pay the ultimate floor price set forth in its supply agreement in November 2015. Therefore, the September 2015 decline, the potential decline to be considered at the November 2016 public hearing and any further declines in the EA generation component tariff will not result in a corresponding decline in OPC’s natural gas expenses, and will lead to a greater decline in the sales price of OPC’s energy, revenues and, therefore, margins. For further information on the EA and the EA tariffs, see “Business—Regulation of the Israeli Electricity Sector—EA.”
CNEE Regulations Affect our Results in our Distribution Business in Guatemala
Energuate’s results of operations are significantly affected by the tariffs that it charges for electricity. The tariffs that Energuate charges to its regulated customers are set by CNEE based on the methodology established by the General Electricity Law and related regulations. Energuate’s tariffs for regulated customers consist of electricity charges designed to allow a model efficient distribution company to cover its operating expenses, complete its capital expenditure plans and recover its cost of capital. Under the General Electricity Law and the regulations of the CNEE, the base tariff is adjusted annually each year on May 1 to reflect anticipated changes in the cost of electricity to be purchased by Energuate during the following year, so as to allow Energuate to recover the projected cost of electricity and capacity purchases, transmission tolls, and electricity losses during the following year. Additionally, an electricity adjustment surcharge is added or subtracted to the base tariff quarterly to reflect variations in the actual cost of electricity and capacity purchases and transmission tolls paid by Energuate against the projected cost envisaged by the tariff. Any resulting variation in each quarter is considered by the CNEE in its determination of the applicable tariffs for the next quarter or subsequent quarters, if, in the latter case, the difference was considered significant by the CNEE and Energuate consented to such variation. Pursuant to CNEE resolutions published in April 2016 and July 2016, the electricity adjustment surcharge payable to Energuate’s customers for the period from May 1, 2016 to October 31, 2016 was determined to be approximately $20 million. In addition, pursuant to the CNEE resolutions published in July 2016, the remaining accumulated electricity adjustment surcharge from prior periods to be payable to Energuate’s customers in subsequent periods was determined to be approximately $35 million, including an annual simple interest rate of 7% on such amount. The VAD component of the distribution tariff is revised every five years with semi-annual adjustments for inflation and local currency exchange rates against the U.S. Dollar. Approximately 57% of each semi-annual adjustment is based on the rate of Guatemalan inflation and the remaining 43% is based on changes in the Quetzal / U.S. Dollar exchange rate. The VAD charges applicable to Energuate were last set in January 2014 and will expire in January 2019. For further information on the tariffs applicable to Energuate, see “Business—Portfolio Overview—Distribution Business—Distribution Tariffs” and“Business—Regulatory, Environmental and Compliance Matters—Regulation of the Guatemalan Electricity Distribution Market—Tariffs and Tolls.”
As Guatemala’s regulated tariff regime is designed to match the electricity charge component of Energuate’s regulated tariff to the cost for the electricity distributed to regulated customers, Energuate does not generate a material portion of its gross margin from the difference between its cost for electricity and the revenue generated from the electricity charge component of its tariffs. Instead, Energuate’s gross margin is primarily generated by the distribution component of Energuate’s regulated tariffs, consisting of VAD charges. In setting the tariff, the range for permitted theoretical after-inflation return on investment for distributors is between 7%—13%. Currently, the tariffs approved for Energuate’s authorizations contemplate approximately a 7% return.
Energuate charges a regulated VAD charge to regulated customers for the distribution of electricity and charges regulated distribution tariffs for the distribution of electricity to its large users. Energuate distributed 95% of the volume of electricity it delivered in the six months ended June 30, 2016 to its regulated customers and 93%, 92% and 92% of the volume of energy it delivered in the years ended December 31, 2015, 2014 and 2013, respectively, to its regulated customers.
In addition, Energuate is required to provide electricity to all customers that consume up to 300 kWh at a reduced tariff known as the “social tariff.” The social tariff includes a VAD charge that is lower than the VAD
116
Table of Contents
charge paid by regulated customers that are not eligible for the social tariff. In the years ended December 31, 2015, 2014 and 2013, 51%, 51% and 52%, respectively, of the energy delivered by Energuate to its customers were delivered to customers whose energy purchases were subject to the social tariff.
Fluctuations in Oil Prices and Currency Exchange Rates
As fuel is a significant cost for most of our operating companies, the prices of the various fuels utilized by our operating companies (e.g., gas, diesel, or HFO) have a significant effect on our results of operations. Many of our PPAs, including all of OPC’s PPAs, are denominated in the applicable local currency and contain an adjustment mechanism so that prices under our PPAs can be adjusted to reflect (among other things) changes in (1) the price of oil (by reference to oil price indices), (2) the price of the underlying fuel, (3) the relevant producer price index and/or (4) changes in the local currency to U.S. Dollar exchange rate. In addition, for most of our gas and other fuel supply agreements, the prices we pay are subject to adjustments based on changes in oil prices (by reference to oil price indices), the price of the underlying fuel, and currency exchange rates. Accordingly, although changes in oil, or other fuel, prices, inflation rates and foreign exchange rates can affect our revenues, net income and Adjusted EBITDA, there is generally not a corresponding effect on our margins.
These adjustments under our PPAs and supply agreements, and regulated tariffs are made on a periodic basis (e.g., monthly, quarterly or annually) and may also be subject to minimum deviation thresholds. Therefore, these adjustments do not fully hedge our margins against changes in fuel prices and such other factors. In addition, we remain subject to variations in oil, or other fuel, prices, inflation and currency exchange rates in the short- to medium-term, until such adjustments are made and to the extent of variations below the threshold. Further, while a significant portion of our sales are made pursuant to PPAs, we do make sales in the spot market and are subject to spot market prices (which are influenced by changes in oil, or other fuel, prices, inflation and exchange rates), and we are also subject to changes in market rates (which are influenced by fuel prices and inflation and exchange rates) when we renew our PPAs. A significant change (even where both fuel costs and PPAs are fully indexed) in the above-mentioned factors can result in an increase or decrease in our margins. For further information on the effects of fluctuations in oil prices on our cost of sales, see “—Cost of Sales.”
With respect to our distribution business, all of Energuate’s PPAs require it to pay in U.S. Dollars or have price terms that are linked to the U.S. Dollar and inflation affects Energuate’s operating costs by increasing some of its operating expenses denominated in Guatemalan Quetzales (and not linked to the U.S. Dollar). However, because the VAD charges applicable to Energuate are adjusted semi-annually to reflect fluctuations in the Guatemalan Quetzal / U.S. Dollar exchange rate and Guatemalan inflation, currency depreciation and inflation have not had significant effects on Energuate’s operating income. Additionally, as the regulated tariff set by CNEE is also adjusted for fluctuations in oil prices, a decrease in oil prices may cause a corresponding decrease in the tariff set by CNEE, leading to a decline in Energuate’s revenues in an amount that generally corresponds to a decline in Energuate’s operating expenses.
Recent Developments
Energuate Tax Claims
In connection with tax claims raised by the SAT, in August 2016, DEORSA and DEOCSA paid $17 million and $31 million to the SAT, respectively, and are required to pay an additional amount, estimated to be $17 million to $24 million (the amount of which is still under discussion with the SAT), in November 2016. For further information on the claim, see “Business—Legal Proceedings—Energuate Tax Claims.”
In order to make the payments to the SAT, we used internally generated cash, and amended the DEORSA and DEOCSA syndicated loan facilities to provide for additional lines of credit. In August 2016, we drew down $16 million and $24 million under the DEORSA syndicated loan facility and DEOCSA syndicated loan facility, respectively. For further information on DEORSA and DEOCSA’s syndicated loan facilities, see
117
Table of Contents
“Material Indebtedness—DEORSA Syndicated Loan Facility” and “Material Indebtedness—DEOCSA Syndicated Loan Facility.”
Overseas Facility
In May 2016, Overseas Investments Peru S.A., or OIP, a wholly-owned subsidiary of IC Power, entered into a $100 million loan agreement, the Overseas Facility, with Credit Suisse and the Bank of Nova Scotia. The Overseas Facility is guaranteed by IC Power and ICP and secured by shares of Inkia. The Overseas Facility includes a mandatory prepayment provision in the event of our initial public offering, upon which payment the pledge will be released. For further information on the use of the proceeds of this initial public offering, see “Use of Proceeds.” The Overseas Facility will mature on November 9, 2017 and bears interest as follows:
| • | 90-day LIBOR plus 5.00% (for the period from the funding date to the 6-month anniversary of the funding date); |
| • | 90-day LIBOR plus 5.75% (for the period from one day after the 6-month anniversary of the funding date to the 12 month anniversary of the funding date); and |
| • | 90-day LIBOR plus 6.50% for any period thereafter. |
The Overseas Facility was fully drawn on August 31, 2016. Pursuant to the Overseas Facility, in October 2016, IC Power fully repaid all its obligations under its $75 million note payable to Kenon. In addition, the Overseas Facility provides that IC Power may make further payments of no more than $75 million to Kenon. For further information on IC Power’s $220 million of notes payable to Kenon, see “Related Party Transactions—$220 Million Notes Payable to Kenon.”
AIE Financing
In July 2016, AIE entered into a NIS1 billion (approximately $261 million) loan agreement with Israel Discount Bank and Harel Insurance Group to finance the construction of AIE’s power plant in Hadera. The financing will mature 18 years after the completion of the construction period, and includes a term loan facility, a standby facility, a debt service reserve amount, or DRSA, facility to finance the DSRA deposit, a guarantee facility to facilitate the issuance of bank guarantees to be issued to third parties, a VAT facility (for the construction period only), a hedging facility (for the construction period only), and a working capital facility (for the operation period only).
The term loan, standby, DSRA, and hedging facilities shall each bear interest at a rate of 2/3 Government CPI-linked Bond + 2.95% + 1/3 Government Bond + 2.95% per annum. The guarantees, VAT and working capital facilities shall each bear interest at a rate of the prime interest rate + 1.5% per annum. These terms are subject to AIE’s credit rating.
Commencement of Development of Agua Clara 50 MW Wind Project
We are starting development of a 50 MW wind project in the Dominican Republic, which is expected to commence commercial operations in early 2018. We have entered into a PPA with a government entity for a period of 20 years; the PPA is subject to the grant of a concession which remains outstanding. We are in the process of selecting an EPC contractor and lenders for the project. The total project cost is estimated to be approximately $100 million, of which approximately 70% is expected to be debt-financed.
118
Table of Contents
Operating Results
The following discussion of our results of operations is based on our unaudited condensed consolidated financial statements and ICP’s audited consolidated financial statements, each prepared in accordance with IFRS as issued by the IASB. The discussion of the results of our business lines is based upon the financial information reported for each of the segments of our business lines, and is presented in the tables below, which set forth the results of each of our business lines and, where applicable, their segments and the reconciliation of these results
of our segments to our consolidated results of operations. However, as our Other segment is primarily composed of the financial results of certain of our generation assets and their related holding companies, we analyze the results of our Other segment within our discussion of the results of our generation business.
For all periods prior to the completion of our acquisition of Energuate, we operated one business line (generation) and evaluated this business line according to four geographic segments, as set forth below. However, since January 22, 2016, the date on which we completed our acquisition of Energuate, our results of operations reflect an additional business line (distribution), which we evaluate according to its sole segment, distribution. Our distribution business and its segment consists entirely of DEORSA and DEOCSA. Our segment information for all periods has been prepared on the same basis as the information that our senior management uses to allocate resources among segments and evaluate their performance. We evaluate and manage the performance of our segments based on information generated from our statutory accounting records maintained in accordance with IFRS, and reflected in our consolidated financial statements.
In the following discussion, references to increases or declines in any period are made by comparison with the corresponding prior period, except as the context otherwise indicates.
Six Months Ended June 30, 2016 Compared to Six Months Ended June 30, 2015
Set forth below are our condensed consolidated statement of income data for the six months ended June 30, 2016 and 2015:
Six Months Ended June 30, | % Change | |||||||||||
2016 | 2015 | |||||||||||
| ($ millions) | ||||||||||||
Consolidated Statements of Income | ||||||||||||
Continuing Operations | ||||||||||||
Sales | 881 | 655 | 35 | |||||||||
Cost of sales (excluding depreciation and amortization) | (644 | ) | (458 | ) | 41 | |||||||
Depreciation and amortization | (72 | ) | (54 | ) | 33 | |||||||
|
|
|
|
|
| |||||||
Gross profit | 165 | 143 | 15 | |||||||||
General, selling and administrative expenses | (60 | ) | (31 | ) | 94 | |||||||
Other income, net | 6 | 1 | 500 | |||||||||
|
|
|
|
|
| |||||||
Operating income | 111 | 113 | (2 | ) | ||||||||
Financing expenses, net | 74 | 53 | 40 | |||||||||
Share in income of companies, net of tax | — | — | — | |||||||||
|
|
|
|
|
| |||||||
Income before taxes from continuing operations | 37 | 60 | (38 | ) | ||||||||
Taxes on income | (21 | ) | (25 | ) | (16 | ) | ||||||
Net income from continuing operations | 16 | 35 | (54 | ) | ||||||||
Net income from discontinued operations, net of tax | — | 4 | — | |||||||||
|
|
|
|
|
| |||||||
Net income for the period | 16 | 39 | (59 | ) | ||||||||
|
|
|
|
|
| |||||||
Attributable to: |
| |||||||||||
Equity holders of the company | 7 | 30 | (77 | ) | ||||||||
Non-controlling interest | 9 | 9 | — | |||||||||
119
Table of Contents
Set forth below are the results of each of our segments and our consolidated results of operations for the six months ended June 30, 2016 and 2015, with the results of our distribution business beginning from the date of its consolidation on January 22, 2016:
Six Months Ended June 30, 2016 | ||||||||||||||||||||||||||||
Generation | Distribution | Adjustments | Consolidated | |||||||||||||||||||||||||
Peru | Israel | Central | Other1 | Guatemala | ||||||||||||||||||||||||
| ($ millions, except as otherwise indicated) | ||||||||||||||||||||||||||||
Sales | 236 | 176 | 157 | 73 | 240 | (1 | ) | 881 | ||||||||||||||||||||
Cost of Sales | (152 | ) | (144 | ) | (121 | ) | (47 | ) | (181 | ) | 1 | (644 | ) | |||||||||||||||
Depreciation and amortization | (25 | ) | (13 | ) | (18 | ) | (15 | ) | (6 | ) | 5 | (72 | ) | |||||||||||||||
|
|
|
|
|
|
|
|
|
|
|
|
|
| |||||||||||||||
Gross profit | 59 | 19 | 18 | 11 | 53 | 5 | 165 | |||||||||||||||||||||
General, selling and administrative expenses | (9 | ) | (4 | ) | (7 | ) | (16 | ) | (24 | ) | — | (60 | ) | |||||||||||||||
Other income, net | — | — | — | 3 | 3 | — | 6 | |||||||||||||||||||||
|
|
|
|
|
|
|
|
|
|
|
|
|
| |||||||||||||||
Operating income | 50 | 15 | 11 | (2 | ) | 32 | 5 | 111 | ||||||||||||||||||||
Financing expenses, net | (23 | ) | (7 | ) | (7 | ) | (26 | ) | (11 | ) | — | (74 | ) | |||||||||||||||
Share in income of associated companies | — | — | — | — | — | — |
| — |
| |||||||||||||||||||
|
|
|
|
|
|
|
|
|
|
|
|
|
| |||||||||||||||
Income (loss) before taxes from continuing operations | 27 | 8 | 4 | (28 | ) | 21 | 5 |
| 37 |
| ||||||||||||||||||
Taxes on income | (8 | ) | — | (3 | ) | (3 | ) | (6 | ) | (1 | ) | (21 | ) | |||||||||||||||
|
|
|
|
|
|
|
|
|
|
|
|
|
| |||||||||||||||
Net income (loss) for the period | 19 | 8 | 1 | (31 | ) | 15 | 4 | 16 | ||||||||||||||||||||
|
|
|
|
|
|
|
|
|
|
|
|
|
| |||||||||||||||
Operating margin | 21 | % | 9 | % | 7 | % | (3 | )% | 13 | % | (500 | )% | 13 | % | ||||||||||||||
| 1. | In addition to the results of certain of our generation assets, our Other segment also includes expenses and other adjustments relating to our headquarters and intermediate holding companies, including purchase price allocations recorded in connection with our acquisition of Energuate, which allocations were recorded by Inkia, one of our intermediate holding companies. However, as our Other segment is primarily composed of the financial results of certain of our generation assets and their related holding companies, we analyze the results of our Other segment within our discussion of the results of our generation business. |
Six Months Ended June 30, 2015 | ||||||||||||||||||||||||
Peru | Israel | Central | Other | Adjustments | Consolidated | |||||||||||||||||||
| ($millions, except as otherwise indicated) | ||||||||||||||||||||||||
Sales | 225 | 157 | 175 | 98 | — | 655 | ||||||||||||||||||
Cost of Sales | (139 | ) | (112 | ) | (140 | ) | (67 | ) | — | (458 | ) | |||||||||||||
Depreciation and amortization | (25 | ) | (12 | ) | (10 | ) | (12 | ) | 5 | (54 | ) | |||||||||||||
|
|
|
|
|
|
|
|
|
|
|
| |||||||||||||
Gross profit | 61 | 33 | 25 | 19 | 5 | 143 | ||||||||||||||||||
General, selling and administrative expenses | (8 | ) | (3 | ) | (7 | ) | (13 | ) | — | (31 | ) | |||||||||||||
Other income, net | — | 1 | — | — | — | 1 | ||||||||||||||||||
|
|
|
|
|
|
|
|
|
|
|
| |||||||||||||
Operating income | 53 | 31 | 18 | 6 | 5 | 113 | ||||||||||||||||||
Financing expenses, net | (20 | ) | (13 | ) | (5 | ) | (15 | ) | — | (53 | ) | |||||||||||||
Share in income of associated companies | — | — | — | — | — | — | ||||||||||||||||||
|
|
|
|
|
|
|
|
|
|
|
| |||||||||||||
Income (loss) before taxes from continuing operations | 33 | 18 | 13 | (9 | ) | 5 | 60 | |||||||||||||||||
Taxes on income | (15 | ) | (5 | ) | (3 | ) | (1 | ) | (1 | ) | (25 | ) | ||||||||||||
|
|
|
|
|
|
|
|
|
|
|
| |||||||||||||
Net income (loss) from continuing operations | 18 | 13 | 10 | (10 | ) | 4 | 35 | |||||||||||||||||
|
|
|
|
|
|
|
|
|
|
|
| |||||||||||||
Net income from discontinued operations, net of tax | — | — | — | 4 | — | 4 | ||||||||||||||||||
Net income (loss) for the period | 18 | 13 | 10 | (6 | ) | 4 | 39 | |||||||||||||||||
|
|
|
|
|
|
|
|
|
|
|
| |||||||||||||
Operating margin | 24 | % | 20 | % | 10 | % | 6 | % | — | 17 | % | |||||||||||||
| 1. | In addition to the results of certain of our generation assets, our Other segment also includes expenses and other adjustments relating to our headquarters and intermediate holding companies. |
120
Table of Contents
Sales
Our sales increased by $226 million, or 35%, to $881 million for the six months ended June 30, 2016 from $655 million for the six months ended June 30, 2015. As discussed in further detail below, this increase was primarily driven by the January 2016 acquisition of our distribution business which, from the date of its consolidation on January 22, 2016, contributed $240 million to our revenues in the six months ended June 30, 2016.
Generation Business
Our revenue from our generation business (including our Other segment) decreased to $641 million for the six months ended June 30, 2016 from $655 million in the same period in 2015, as discussed in further detail below:
Peru Segment
| • | Sales from our generation business’ Peru segment increased by $11 million, or 5%, to $236 million for the six months ended June 30, 2016 from $225 million for the six months ended June 30, 2015, principally as a result of: |
| • | an $8 million contribution to revenues during the six months ended June 30, 2016 from Samay I, which reached COD in May 2016; and |
| • | an $8 million, or 21%, increase in Kallpa’s revenue from ancillary services (principally transmission tolls that are typically passed through to Kallpa’s customers pursuant to its PPAs) to $46 million for the six months ended June 30, 2016 from $38 million during the six months ended June 30, 2015, mainly as a result of a 30% increase in the primary toll system tariff (which increased Kallpa’s revenues by $7 million) during the six months ended June 30, 2016 as compared to the same period in 2015. |
| • | These effects were partially offset by a $5 million, or 3%, decrease in Kallpa’s revenue from energy sales to $147 million for the six months ended June 30, 2016 from $152 million during the six months ended June 30, 2015, primarily as a result of an $13 million, or 8%, decrease in revenue resulting from a $4, or 8%, decline in Kallpa’s average energy price to $44 per MWh in the six months ended June 30, 2016 from $48 per MWh during the six months ended June 30, 2015, principally as a result of an adjustment in the PPA prices for our non-regulated clients as a result of the decline in natural gas prices, as well as the existing excess supply of capacity, in Peru during the six months ended June 30, 2016. This effect was partially offset by a $6 million, or 4%, increase in revenue resulting from a 4% increase in the volume of energy sold by Kallpa to 3,328 GWh during the six months ended June 30, 2016 from 3,191 GWh during the six months ended June 30, 2015. |
Israel Segment
| • | Sales from our generation business’ Israel segment increased by $19 million, or 12%, to $176 million for the six months ended June 30, 2016 from $157 million during the six months ended June 30, 2015, primarily as a result of (1) a $23 million contribution to revenues in the six months ended June 30, 2016 from AIE, which was acquired in August 2015; and (2) an $8 million contribution to revenues in the six months ended June 30, 2016 from OPC’s sale of excess natural gas during the period (which OPC sold as a result of scheduled maintenance occurring at its plant in April and May 2016). |
These factors were partially offset by a $12 million, or 8%, decline in OPC’s revenue from energy sales to $143 million during the six months ended June 30, 2016 from $155 million during the six months ended June 30, 2015, as a result of declines in the EA generation component tariff in
121
Table of Contents
August 2015. As the EA tariff forms the basis for the prices in OPC’s PPAs, the decline in the EA tariff resulted in a 7% decline in the average price of the energy sold by OPC to $75 per MWh during the six months ended June 30, 2016 from $80 per MWh in the same period in 2015. The volume of energy sold by OPC during these periods was relatively stable, as OPC sold 1,941 GWh and 1,965 GWh of energy in the six months ended June 30, 2016 and 2015, respectively.
Central America Segment
| • | Sales from our generation business’ Central America segment declined by $18 million, or 10%, to $157 million for the six months ended June 30, 2016 from $175 million during the six months ended June 30, 2015, principally as a result of: |
| • | a $29 million, or 48%, reduction in Puerto Quetzal’s revenue to $31 million for the six months ended June 30, 2016 from $60 million during the six months ended June 30, 2015 as a result of a $25 million decline in Puerto Quetzal’s revenue from energy sales to $22 million for the six months ended June 30, 2016 from $47 million during the six month ended June 30, 2015 due to (1) the expiration of a PPA, which led to a 20% decline in the volume of energy sold by Puerto Quetzal to 381 GWh during the six months ended June 30, 2016 from 474 GWh during the six months ended June 30, 2015 and (2) a $41, or 41%, decline in Puerto Quetzal’s average energy price to $58 per MWh during the six months ended June 30, 2016 from $99 per MWh during the six months ended June 30, 2015 due to adjustments in PPAs as a result of a decline in HFO prices and a reduction in spot market energy prices as a result of a decline in HFO prices; |
| • | a $15 million, or 28%, reduction in Nejapa’s revenue to $38 million for the six months ended June 30, 2016 from $53 million during the six months ended June 30, 2015, as a result of a $15 million, or 33%, decline in Nejapa’s revenue from energy sales to $31 million for the six months ended June 30, 2016 from $46 million during the six months ended June 30, 2015 due to (1) a $19, or 23%, decline in Nejapa’s average energy price to $64 per MWh during the six months ended June 30, 2016 from $83 per MWh during the six months ended June 30, 2015 due to adjustments in PPAs as a result of a decline in HFO prices and a reduction in spot market energy prices as a result of a decline in HFO prices; and (2) a 13% decrease in the volume of energy sold by Nejapa to 481 GWh during the six months ended June 30, 2016 from 556 GWh during the six months ended June 30, 2015 (principally reflecting a 52% decline in the volume of energy sold on the spot market), which reduced Nejapa’s revenue from energy sales by $5 million; and |
| • | a $13 million, or 23%, reduction in ICPNH’s revenue to $44 million for the six months ended June 30, 2016 from $57 million during the six months ended June 30, 2015, as a result of a $13 million, or 27%, decline in ICPNH’s revenue from energy sales to $36 million for the six months ended June 30, 2016 from $49 million during the six months ended June 30, 2015, primarily due to a $23, or 25%, decline in ICPNH’s average energy price to $70 per MWh during the six months ended June 30, 2016 from $93 per MWh during the six months ended June 30, 2015 due to adjustments in PPAs as a result of a decline in HFO prices. |
| • | These declines were partially offset by: |
| • | $32 million of revenue during the six months ended June 30, 2016 from Kanan, which commenced commercial operations during the period; |
| • | a $4 million, or 80%, increase in Cenérgica’s revenue to $9 million for the six months ended June 30, 2016 from $5 million during the six months ended June 30, 2015, principally as a result of a $3 million, or 100%, increase in Cenérgica’s revenue from energy trading to $6 million for the six months ended June 30, 2016 from $3 million during the six months ended June 30, 2015; and |
122
Table of Contents
| • | $3 million of revenue during the six months ended June 30, 2016 from Guatemel, which was acquired in January 2016. |
Other Segment
| • | Sales from our Other segment decreased by $25 million, or 26%, to $73 million for the six months ended June 30, 2016 from $98 million during the six months ended June 30, 2015, primarily as a result of the following: |
| • | a $9 million, or 38%, decline in JPPC’s revenue to $15 million for the six months ended June 30, 2016 from $24 million during the six months ended June 30, 2015, primarily as a result of a $9 million, or 50%, decline in JPPC’s revenue from energy sales to $9 million for the six months ended June 30, 2016 from $18 million during the six months ended June 30, 2015. This decline was driven by (1) a $5 million, or 36%, decrease in revenue resulting from a $32, or 36%, decline in JPPC’s average energy price to $56 per MWh during the six months ended June 30, 2016 from $88 per MWh during the six months ended June 30, 2015 due to adjustments in PPAs as a result of a decline in HFO prices and (2) a $3 million, or 22%, decrease in revenue resulting from a 22% decline in the volume of energy sold by JPPC to 160 GWh during the six months ended June 30, 2016 from 205 GWh during the six months ended June 30, 2015 due to lower plant availability as a result of scheduled maintenance performed during the first half of 2016; |
| • | an $8 million, or 40%, decline in Colmito’s revenue to $12 million for the six months ended June 30, 2016 from $20 million during the six months ended June 30, 2015, as a result of an $8 million, or 47%, decline in Colmito’s revenue from energy sales to $9 million for the six months ended June 30, 2016 from $17 million during the six months ended June 30, 2015. This decline was driven by (1) a $67, or 52%, decline in Colmito’s average energy price to $62 per MWh during the six months ended June 30, 2016 from $129 per MWh during the six months ended June 30, 2015 due to higher hydrology levels during the six months ended June 30, 2016, which reduced spot market energy prices (as the price in Colmito’s PPA is linked to spot market energy prices); and (2) an 8% decrease in the volume of energy sold by Colmito to 145 GWh during the six months ended June 30, 2016 from 158 GWh during the six months ended June 30, 2015 (which reduced Colmito’s revenue from energy sales by $1 million); and |
| • | a $7 million, or 35%, decline in CEPP’s revenue to $13 million for the six months ended June 30, 2016 from $20 million during the six months ended June 30, 2015, primarily as a result of an $8 million, or 47%, decline in CEPP’s revenue from energy sales to $9 million for the six months ended June 30, 2016 from $17 million during the six months ended June 30, 2015 despite similar volumes of energy sales in the two periods. This decline was driven by a $58, or 49%, decrease in CEPP’s average energy price to $61 per MWh during the six months ended June 30, 2016 from $119 per MWh during the six months ended June 30, 2015 due to a reduction in spot market energy prices as a result of a decline in HFO prices. |
Distribution Business
Sales from our distribution business were $240 million during the period from January 22, 2016 (the date of our acquisition and consolidation of our distribution business) to June 30, 2016.
Cost of Sales (Excluding Depreciation and Amortization)
Our cost of sales (excluding depreciation and amortization) increased by $186 million, or 41%, to $644 million for the six months ended June 30, 2016 from $458 million for the six months ended June 30, 2015. As
123
Table of Contents
discussed in further detail below, this increase was primarily driven by the January 2016 acquisition of our distribution business which, from the date of its consolidation on January 22, 2016, contributed $181 million to our cost of sales (excluding depreciation and amortization) in the six months ended June 30, 2016.
Generation Business
Our cost of sales (excluding depreciation and amortization) from our generation business (including our Other segment) were $463 million during the six months ended June 30, 2016, as compared to $458 million in the same period in 2015, as discussed in further detail below:
Peru Segment
| • | Cost of sales (excluding depreciation and amortization) from our generation business’ Peru segment increased by $13 million, or 9%, to $152 million for the six months ended June 30, 2016 from $139 million for the six months ended June 30, 2015, primarily as a result of the following: |
| • | a $13 million, or 22%, increase in Kallpa’s gas supply, transportation and distribution costs to $73 million for the six months ended June 30, 2016 from $60 million during the six months ended June 30, 2015 as a result of a 48% increase in the volume of gas consumption due to a 56% increase in Kallpa’s energy generation to 2,936 GWh during the six months ended June 30, 2016 from 1,877 GWh during the same period in 2015, which was partially offset by a 7% decrease in the gas price to $2.99/MMBTU for the six month ended June 30, 2016 from $3.22 for the same period in 2015; |
| • | an $11 million, or 28%, increase in Kallpa’s transmission charges to $50 million for the six months ended June 30, 2016 from $39 million during the six months ended June 30, 2015 as a result of a 30% increase in the primary toll system tariff during the six months ended June 30, 2016 as compared to the same period in 2015; and |
| • | a $4 million contribution of cost of sales from Samay I, which commenced commercial operations in May 2016. |
| • | These effects were partially offset by: |
| • | a $10 million decline in energy purchases as a result of the higher volume of energy generated by Kallpa as discussed above; and |
| • | a $6 million decline in maintenance expenses, as a result of scheduled major maintenance and inspection work conducted at Kallpa I during the six months ended June 30, 2015. |
Israel Segment
| • | Cost of sales (excluding depreciation and amortization) from our generation business’ Israel segment increased by $32 million, or 29%, to $144 million for the six months ended June 30, 2016, compared to $112 million in the same period in 2015, primarily as a result of: |
| • | a $21 million contribution to cost of sales in the six months ended June 30, 2016 from AIE, which we acquired in August 2015; and |
| • | a $20 million, or 400%, increase in OPC’s energy purchase costs as a result of a 442% increase in the volume of energy purchased to 358 GWh during the six months ended June 30, 2016 from 66 GWh during the same period in 2015, due to scheduled maintenance performed during April and May 2016. |
124
Table of Contents
| • | These effects were partially offset by an $8 million, or 12%, decrease in OPC’s fuel expense due to: |
| • | a 17% decline in the volume of the energy generated by OPC to 1,583 GWh during the six months ended June 30, 2016 from 1,899 GWh during the same period in 2015 as a result of the maintenance performed during April and May 2016; and |
| • | a 9% decline in the price of the natural gas purchased by OPC. The prices OPC pays for natural gas under its gas supply agreement are indexed to the EA generation component tariff, subject to a floor price. Therefore, in connection with the August 2015 reduction to the EA generation component tariff, OPC’s natural gas prices were lower in the six months ended June 30, 2016 than the same period in 2015. As OPC began to pay the ultimate floor price set forth in its gas supply agreement in November 2015, the decline in tariffs, which led to a reduction in revenues, did not result in a corresponding decrease in gas prices. |
Central America Segment
| • | Cost of sales (excluding depreciation and amortization) from our generation business’ Central America segment declined by $19 million, or 14%, to $121 million for the six months ended June 30, 2016, compared to $140 million in the same period in 2015, primarily as a result of the following: |
| • | a $27 million decline in Puerto Quetzal’s cost of sales mainly due to (1) a $16 million decline in Puerto Quetzal’s fuel expense as a result of a 48% decline in the price of HFO purchased by Puerto Quetzal and a 23% decrease in the volume of energy generated by Puerto Quetzal to 253 GWh during the six months ended June 30, 2016 from 329 GWh during the six months ended June 30, 2015; and (2) a $7 million decrease in Puerto Quetzal’s energy purchase costs as a result of a 12% decrease in the volume of energy purchased by Puerto Quetzal to 128 GWh during the six months ended June 30, 2016 from 145 GWh during the six months ended June 30, 2015 and a 19% decrease in spot purchase prices; |
| • | a $15 million decline in Nejapa’s cost of sales due to (1) a $8 million decrease in Nejapa’s energy purchase costs as a result of a 37% decrease in spot purchase prices and a 21% decrease in the volume of energy purchased by Nejapa to 254 GWh during the six months ended June 30, 2016 from 323 GWh during the six months ended June 30, 2015 and (2) a $7 million decline in Nejapa’s fuel expense as a result of a 3% decline in the volume of energy generated and a 34% decline in the price of HFO purchased by Nejapa; and |
| • | a $12 million decline in ICPNH’s cost of sales due to an $11 million decrease in Corinto and Tipitapa’s fuel expenses as a result of a 41% decline in the price of HFO purchased. |
| • | These effects were partially offset by: |
| • | $28 million of cost of sales during the six months ended June 30, 2016 from Kanan, which commenced commercial operations during the period; |
| • | a $5 million, or 167%, increase in Cenérgica’s cost of sales to $8 million for the six months ended June 30, 2016 from $3 million during the six months ended June 30, 2015, due to a $6 million increase in Cenérgica’s energy purchase costs as a result of an increase in Cenergica’s revenue from energy trading; and |
| • | $2 million of cost of sales during the six months ended June 30, 2016 from Guatemel, which was acquired in January 2016. |
125
Table of Contents
Other Segment
| • | Cost of sales (excluding depreciation and amortization) from our Other segment declined by $20 million, or 30%, to $47 million for the six months ended June 30, 2016, compared to $67 million in the same period in 2015, primarily as a result of the following: |
| • | a $7 million decline in CEPP’s cost of sales, primarily as a result of a $6 million decline in CEPP’s fuel expense as a result of a 47% decline in the price of HFO purchased by CEPP; |
| • | a $7 million decline in Colmito’s cost of sales, primarily due to a $4 million decline in Colmito’s energy purchases (despite a 6% increase in the volume of energy purchased) as a result of a 52% decrease in the spot market energy price during the six months ended June 30, 2016 as compared to the same period in 2015, driven by an increase in hydrology levels in Chile during the six months ended June 30, 2016; and |
| • | a $6 million decline in JPPC’s cost of sales mainly due to a $9 million decline in JPPC’s fuel expense as a result of a 22% decline in the volume of energy generated and a 42% decline in the price of HFO purchased by JPPC. |
Distribution Business
Cost of sales (excluding depreciation and amortization) from our distribution business were $181 million from January 22, 2016 (the date of our acquisition and consolidation of our distribution business) to June 30, 2016.
Depreciation and Amortization
Our depreciation and amortization expenses (including the allocation of cost of sales and general, selling and administrative expenses) increased by $19 million, or 33%, to $77 million for the six months ended June 30, 2016 from $58 million in the same period in 2015, primarily as a result of:
| • | the recognition of a $8 million depreciation and amortization expense for the six months ended June 30, 2016 relating to the distribution business, as a result of our acquisition and consolidation of our distribution business from its acquisition on January 22, 2016; |
| • | a $6 million or 50%, increase in depreciation and amortization expense in our generation business’ Central America segment to $18 million for the six months ended June 30, 2016 from $12 million in the six months ended June 30, 2015, primarily as a result of the depreciation and amortization expenses of Kanan, which commenced commercial operations during the six months ended June 30, 2016; and |
| • | a $4 million, or 29%, increase in depreciation and amortization expense in our Other segment to $18 million for the six months ended June 30, 2016, compared to $14 million in the same period in 2015, primarily as a result of the depreciation and amortization of purchase price adjustments made in connection with our January 2016 acquisition of our distribution business. |
General, Selling and Administrative Expenses
Our general, selling and administrative expenses (excluding depreciation and amortization) increased by $28 million, or 104%, to $55 million for the six months ended June 30, 2016 from $27 million for the six months ended June 30, 2015, primarily as a result of:
| • | the consolidation of $22 million in general, selling and administrative expenses for the six months ended June 30, 2016 as a result of our consolidation of our distribution business from January 22, 2016; |
126
Table of Contents
| • | a $2 million, or 40%, increase in general, selling and administrative expenses in our generation business’ Central America segment’s general, selling and administrative expenses primarily as a result of the recognition of $1 million expenses in Kanan, which commenced commercial operations during the six months ended June 30, 2016; and |
| • | a $2 million, or 18%, increase in our Other segment’s general, selling and administrative expenses primarily as a result of the reorganization of IC Power in March 2016 and pre-IPO expenses. |
Other Income, net
Our other income, net was $5 million for the six months ended June 30, 2016 and consisted of $3 million for compensations received from DEORSA’s and DEOCSA’s energy suppliers due to disruptions in their supply of energy and a $3 million insurance recovery related to the Sainani power plant in Bolivia as a result of the plant being temporarily out of service in 2014.
Other income, net for the six months ended June 30, 2015 was $1 million, primarily related to compensation received from an EPC contractor as a result of a delay in the COD of OPC’s plant.
Operating Income
As a result of the above, our operating income decreased by 2% to $111 million in the six months ended June 30, 2016, resulting in an operating margin of 13%, as compared to an operating income and operating margin of $113 million and 17%, respectively, in the six months ended June 30, 2015.
Financing Expenses, Net
Our financing expenses, net, increased by $21 million, or 40%, to $74 million for the six months ended June 30, 2016, compared to $53 million for the six months ended June 30, 2015, as discussed in further detail below:
Generation Business
Our financing expenses, net from our generation business (including our Other segment) increased by $10 million, or 19%, to $63 million for the six months ended June 30, 2016, compared to $53 million for the six months ended June 30, 2015, as discussed in further detail below by segment.
Peru Segment
| • | Financing expenses, net, from our generation business’ Peru segment increased by $3 million, or 15%, to $23 million for the six months ended June 30, 2016 from $20 million for the six months ended June 30, 2015, primarily as a result of Kallpa’s recognition of a $10 million expense resulting from the early redemption premium paid in respect of the Kallpa bonds redeemed with a portion of the proceeds of Kallpa’s issuance of $350 million of bonds in May 2016. These effects were partially offset by a $7 million positive change in foreign exchange rate gains to a $2 million net gain for the six months ended June 30, 2016 as compared to a $5 million net loss for the six months ended June 30, 2015 as a result of the strengthening of the Peruvian Sol against the U.S. Dollar during the first half of 2016. |
Israel Segment
| • | Financing expenses, net, from our generation business’ Israel segment decreased by $6 million, or 46%, to $7 million for the six months ended June 30, 2016 from $13 million for the six months ended June 30, 2015, primarily as a result of a $4 million decline in OPC’s interest expense from parent company loans as a result of a lower outstanding principal amount owed to I.C. Power Israel, or ICPI (an intermediate holding company whose results are reflected in the Other segment). |
127
Table of Contents
Central America Segment
| • | Financing expenses, net, from our generation business’ Central America segment increased by $2 million, or 40%, to $7 million for the six months ended June 30, 2016 from $5 million for the six months ended June 30, 2015, primarily as a result of the $1 million interest expense recorded by Kanan, which commenced commercial operations during the six months ended June 30, 2016 relating to Kanan’s $55 million credit facility due 2021, or the Kanan Credit Facility. |
Other Segment
| • | Financing expenses, net, from our Other segment increased by $12 million, or 80%, to $27 million for the six months ended June 30, 2016 from $15 million for the six months ended June 30, 2015, primarily as a result of (1) a $5 million interest expense relating to the notes in an aggregate principal amount of $220 million issued by IC Power to Kenon in connection with the reorganization of IC Power in March 2016, (2) a $4 million increase in ICPDH’s interest expense during the six months ended June 30, 2016 as a result of the $120 million loan from Credit Suisse in connection with our acquisition of our distribution business and (3) a $4 million decline in ICPI’s interest income related to a decline in the outstanding principal amount of its intercompany loan with OPC. |
Distribution Business
Financing expenses, net, from our distribution business was $11 million from January 22, 2016 (the date of our acquisition and consolidation of our distribution business) to June 30, 2016.
Taxes on Income
Our taxes on income decreased by $4 million, or 16%, to $21 million for the six months ended June 30, 2016 from $25 million during the six months ended June 30, 2015. This decrease was primarily the result of (1) a $7 million reduction in our generation business’ Peru segment’s tax expense, which was driven principally by a $5 million decline in deferred income tax expenses in CDA related to the effect of foreign exchange rates on non-monetary assets due to the appreciation of the Peruvian Sol during the six month period ended June 30, 2016 compared to the same period of 2015 and (2) a $5 million reduction in our generation business’ Israel segment’s deferred tax expense, which was driven by a decrease in the tax rate from 26.5% to 25%. This decline was partially offset by a $6 million increase in our tax expenses as a result of our consolidation of our distribution business.
Our effective tax rate increased to 57% for the six months ended June 30, 2016 from 42% for the six months ended June 30, 2015, primarily as a result of higher finance expenses and other expenses incurred at various holding companies (which expenses are not deductible) which reduced net income before taxes. This increase was partially offset by the decrease in our generation business’ Israel segment’s tax rate, as discussed above.
In the six months ended June 30, 2016, our effective tax rate was higher than our Singaporean statutory tax rate of 17% primarily due to a higher contribution from our generation business’ Peru segment (where our corporate income tax rate is 30%).
Net income from discontinued operations, net of tax
We did not record any net income from discontinued operations, net of tax, for the six months ended June 30, 2016.
Net income from discontinued operations, net of tax, for the six months ended June 30, 2015 reflected a $4 million dividend received from Edegel (post-equity method accounting).
128
Table of Contents
Net Income for the Period
As a result of the factors described above, our net income for the period decreased to $16 million for the six months ended June 30, 2016 from $39 million for the six months ended June 30, 2015.
Year Ended December 31, 2015 Compared to Year Ended December 31, 2014
Set forth below are our consolidated statements of income data for the years ended December 31, 2015 and 2014:
Years Ended December 31, | % Change | |||||||||||
2015 | 20141 | |||||||||||
| ($ millions) | ||||||||||||
Consolidated Statements of Income | ||||||||||||
Sales | $ | 1,289 | $ | 1,372 | (6 | ) | ||||||
Cost of sales (excluding depreciation and amortization) | (909 | ) | (936 | ) | (3 | ) | ||||||
Depreciation and amortization | (111 | ) | (101 | ) | 10 | |||||||
|
|
|
|
|
| |||||||
Gross profit | 269 | 335 | (20 | ) | ||||||||
General, selling and administrative expenses | (71 | ) | (69 | ) | 3 | |||||||
Asset write-off | — | (35 | ) | (100 | ) | |||||||
Gain on bargain purchase | — | 68 | (100 | ) | ||||||||
Measurement to fair value of pre-existing share | — | 3 | (100 | ) | ||||||||
Other expenses | (6 | ) | (11 | ) | (45 | ) | ||||||
Other income | 11 | 17 | (35 | ) | ||||||||
|
|
|
|
|
| |||||||
Operating income | 203 | 308 | (34 | ) | ||||||||
Financing expenses, net | 104 | 119 | (13 | ) | ||||||||
Share in income of associated companies | — | 2 | (100 | ) | ||||||||
|
|
|
|
|
| |||||||
Income before taxes from continuing operations | 99 | 191 | (48 | ) | ||||||||
Taxes on income | (50 | ) | (63 | ) | (21 | ) | ||||||
|
|
|
|
|
| |||||||
Net income from continuing operations | $ | 49 | $ | 128 | (62 | ) | ||||||
Net income from discontinued operations, net of tax | 4 | 128 | (97 | ) | ||||||||
|
|
|
|
|
| |||||||
Net income for the period | $ | 53 | $ | 256 | (79 | ) | ||||||
|
|
|
|
|
| |||||||
Attributable to: | ||||||||||||
Equity holders of the Company | $ | 36 | $ | 227 | (84 | ) | ||||||
Non-controlling interest | 17 | 29 | (41 | ) | ||||||||
| 1. | During 2015, an immaterial error was identified with respect to the deferred tax calculation relating to the effect of foreign exchange rate on non-monetary assets in previous years in ICP. ICP’s financial information for 2014, 2013 and 2012 has been revised to correct this immaterial error. |
129
Table of Contents
Set forth below are the results of each of our segments and our consolidated results of operations for the years ended December 31, 2015 and 2014:
Year Ended December 31, 2015 | ||||||||||||||||||||||||
Peru | Israel | Central | Other1 | Adjustments | Consolidated | |||||||||||||||||||
| ($ millions, except as otherwise indicated) | ||||||||||||||||||||||||
Sales | $ | 448 | $ | 326 | $ | 337 | $ | 178 | — | $ | 1,289 | |||||||||||||
Cost of Sales | (279 | ) | (242 | ) | (265 | ) | (123 | ) | — | (909 | ) | |||||||||||||
Depreciation and amortization | (49 | ) | (26 | ) | (21 | ) | (25 | ) | 10 | (111 | ) | |||||||||||||
|
|
|
|
|
|
|
|
|
|
|
| |||||||||||||
Gross profit | 120 | 58 | 51 | 30 | 10 | 269 | ||||||||||||||||||
General, selling and administrative expenses | (19 | ) | (6 | ) | (13 | ) | (33 | ) | — | (71 | ) | |||||||||||||
Other income (loss), net | 1 | 1 | 1 | 2 | — | 5 | ||||||||||||||||||
|
|
|
|
|
|
|
|
|
|
|
| |||||||||||||
Operating income | 102 | 53 | 39 | (1 | ) | 10 | 203 | |||||||||||||||||
Financing expenses, net | (42 | ) | (23 | ) | (10 | ) | (29 | ) | — | (104 | ) | |||||||||||||
Share in income of associated companies | — | — | — | — | — | — | ||||||||||||||||||
|
|
|
|
|
|
|
|
|
|
|
| |||||||||||||
Income (loss) before taxes from continuing operations | $ | 60 | $ | 30 | $ | 29 | $ | (30 | ) | $ | 10 | $ | 99 | |||||||||||
Taxes on income | (29 | ) | (8 | ) | (6 | ) | (5 | ) | (2 | ) | (50 | ) | ||||||||||||
|
|
|
|
|
|
|
|
|
|
|
| |||||||||||||
Net income (loss) from continuing operations | 31 | 22 | 23 | (35 | ) | 8 | 49 | |||||||||||||||||
Net income from discontinued operations, net of tax | — | — | — | 4 | — | 4 | ||||||||||||||||||
Net income for the period | $ | 31 | $ | 22 | $ | 23 | $ | (31 | ) | $ | 8 | $ | 53 | |||||||||||
|
|
|
|
|
|
|
|
|
|
|
| |||||||||||||
Operating margin | 23 | % | 16 | % | 12 | % | — | — | 16 | % | ||||||||||||||
| 1. | In addition to the results of certain of our generation assets, our Other segment also includes expenses and other adjustments relating to our headquarters and intermediate holding companies. |
Year Ended December 31, 2014 | ||||||||||||||||||||||||
Peru | Israel | Central | Other1 | Adjustments | Consolidated | |||||||||||||||||||
| ($ millions, except as otherwise indicated) | ||||||||||||||||||||||||
Sales | $ | 437 | $ | 413 | $ | 308 | $ | 214 | — | $ | 1,372 | |||||||||||||
Cost of Sales | (270 | ) | (252 | ) | (260 | ) | (154 | ) | — | (936 | ) | |||||||||||||
Depreciation and amortization | (45 | ) | (25 | ) | (18 | ) | (22 | ) | 9 | (101 | ) | |||||||||||||
|
|
|
|
|
|
|
|
|
|
|
| |||||||||||||
Gross profit | 122 | 136 | 30 | 38 | 9 | 335 | ||||||||||||||||||
General, selling and administrative expenses | (17 | ) | (9 | ) | (9 | ) | (34 | ) | — | (69 | ) | |||||||||||||
Asset write-off | — | — | — | (35 | ) | — | (35 | ) | ||||||||||||||||
Gain on bargain purchase | — | — | — | 68 | — | 68 | ||||||||||||||||||
Measurement to fair value of pre-existing share | — | — | — | 3 | — | 3 | ||||||||||||||||||
Other income (loss), net | 3 | — | — | 3 | — | 6 | ||||||||||||||||||
|
|
|
|
|
|
|
|
|
|
|
| |||||||||||||
Operating income | 108 | 127 | 21 | 43 | 9 | 308 | ||||||||||||||||||
Financing expenses, net | (34 | ) | (30 | ) | (8 | ) | (46 | ) | (1 | ) | (119 | ) | ||||||||||||
Share in income of associated companies | — | — | — | 2 | — | 2 | ||||||||||||||||||
|
|
|
|
|
|
|
|
|
|
|
| |||||||||||||
Income (loss) before taxes from continuing operations | $ | 74 | $ | 97 | $ | 13 | $ | (1 | ) | $ | 8 | $ | 191 | |||||||||||
Taxes on income | (29 | ) | (26 | ) | (4 | ) | (3 | ) | (1 | ) | (63 | ) | ||||||||||||
|
|
|
|
|
|
|
|
|
|
|
| |||||||||||||
Net income (loss) from continuing operations | 45 | 71 | 9 | (4 | ) | 7 | 128 | |||||||||||||||||
Net income from discontinued operations | — | — | — | 128 | — | 128 | ||||||||||||||||||
|
|
|
|
|
|
|
|
|
|
|
| |||||||||||||
Net income for the period | $ | 45 | $ | 71 | $ | 9 | $ | 124 | $ | 7 | $ | 256 | ||||||||||||
|
|
|
|
|
|
|
|
|
|
|
| |||||||||||||
Operating margin | 25 | % | 31 | % | 7 | % | 20 | % | — | 22 | % | |||||||||||||
130
Table of Contents
| 1. | In addition to the results of certain of our generation assets, our Other segment also includes expenses and other adjustments relating to our headquarters and intermediate holding companies. |
Sales
Our sales decreased by $83 million, or 6%, to $1,289 million for the year ended December 31, 2015 from $1,372 million for the year ended December 31, 2014, as set forth in further detail below by segment:
Peru Segment
| • | Sales from our Peru segment increased by $11 million, or 3%, to $448 million for the year ended December 31, 2015 from $437 million for the year ended December 31, 2014, principally as a result of: |
| • | a $15 million, or 21%, increase in Kallpa’s revenue from ancillary services (principally transmission tolls that are typically passed through to Kallpa’s customers pursuant to its PPAs) to $88 million for the year ended December 31, 2015 from $73 million during the year ended December 31, 2014, which primarily resulted from (1) a 41% increase in the primary toll system tariff during 2015 and (2) the creation of new system charges (designed to ensure system reliability and efficiency) and the inclusion of new tolls and tariffs (as a result of the construction of new transmission lines and renewable energy projects) during 2015; |
| • | a $4 million, or 5%, decrease in Kallpa’s revenue from capacity sales in 2015 to $69 million for the year ended December 31, 2015 from $73 million during the year ended December 31, 2014, primarily as a result of (1) 2% decrease in the volume of capacity sales by Kallpa to an average of 913 MW during the year ended December 31, 2015 from 929 MW for the year ended December 31, 2014, as a result of the expiration of a short-term PPA in April 2014 and (2) a 4% |
| decline in average capacity prices as a result of the strengthening of the U.S. Dollar against the Peruvian Nuevo Sol during 2015. The depreciation of the Peruvian Sol affected Kallpa’s distribution PPA prices, as the exchange rate fluctuations did not reach the minimum thresholds set for price adjustments in such PPAs. Kallpa’s average capacity price was $7.6 per MW and $7.9 per MW during the years ended December 31, 2015 and 2014, respectively; and |
| • | Kallpa’s revenue from energy sales was $291 million in each of the years ended December 31, 2015 and 2014, reflecting a $6 million, or 2%, decrease in revenue resulting from a decrease in the volume of energy sales by Kallpa to 6,433 GWh during the year ended December 31, 2015 from 6,559 GWh during the year ended December 31, 2014, which was offset by a $6 million, or 2%, increase in revenue resulting from a $1, or 2%, increase in Kallpa’s average energy price to $45 per MWh during the year ended December 31, 2015 from $44 per MWh during the year ended December 31, 2014, primarily due to the expiration in 2014 of a short-term PPA which provided for the sale of energy at lower than average prices. |
Israel Segment
| • | Sales from our Israel segment decreased by $87 million, or 21%, to $326 million for the year ended December 31, 2015 from $413 million for the year ended December 31, 2014, as a result of a decrease in OPC´s revenue from energy sales. This decrease in sales is largely due to a decline in the PUAE generation component tariff in August 2015, representing an average sales price reduction in 2015 versus 2014 equivalent to 21%, as PUAE tariffs in the period 2012 to 2014 were incrementally higher than in previous years, reflecting higher fuel prices in 2012. This tariff forms the basis of OPC’s energy prices, so that the decline in the tariff in 2015 led to a decline in sales. To a lesser degree, the decline in sales was also the result of the strengthening of the U.S. Dollar |
131
Table of Contents
against the New Israeli Shekel, OPC’s functional currency. As a result of these factors, OPC experienced a 23% decline in the average price of the energy it sold to $80 per MWh in 2015 from $104 per MWh in 2014. In addition, the volume of energy sold by OPC in 2015 decreased slightly to 3,951 GWh in 2015 from 3,973 GWh in 2014. |
| • | OPC’s decline in sales was partially offset by an $8 million increase in sales due to the acquisition of AIE in August 2015. |
Central America Segment
| • | Sales from our Central America segment increased by $29 million, or 9%, to $337 million for the year ended December 31, 2015 from $308 million for the year ended December 31, 2014, as a result of (1) the acquisition of Puerto Quetzal in September 2014 (which generated $109 million in sales in 2015 compared to $33 million in sales in 2014 from the date of acquisition) and (2) a $10 million increase in revenues as a result of higher than normal wind levels at Amayo I and II for the year ended December 31, 2015 as compared to the year ended December 31, 2014 (from the date of acquisition). |
This increase was partially offset by (1) a $32 million, or 24%, reduction in Nejapa’s revenue to $100 million for the year ended December 31, 2015 from $132 million for the year ended December 31, 2014, primarily as a result of a decline in energy prices due to adjustments under Nejapa’s PPAs and a reduction in spot market energy prices as a result of a decline in HFO prices. These effects were partially offset by an increase in the volume of energy sold; and (2) a $24 million, or 23%, reduction in Corinto and Tipitapa’s revenue to $81 million for the year ended December 31, 2015 from $105 million for the year ended December 31, 2014 (from the date of acquisition), primarily as a result of a $33, or 30%, decline in Corinto and Tipitapa’s average energy price to $78 per MWh during the year ended December 31, 2015 from $111 per MWh during the year ended December 31, 2014 due to adjustments under the PPAs of Corinto and Tipitapa as a result of a decline in HFO prices.
Other Segment
| • | Sales from our Other segment decreased by $36 million, or 17%, to $178 million for the year ended December 31, 2015 from $214 million for the year ended December 31, 2014, primarily as a result of: |
| • | a $34 million, or 47%, reduction in CEPP’s revenue to $39 million for the year ended December 31, 2015 from $73 million for the year ended December 31, 2014, primarily as a result of a $33 million, or 52%, decline in CEPP’s revenue from energy sales to $31 million for the year ended December 31, 2015 from $64 million during the year ended December 31, 2014. This decline was driven by (1) a 5% decrease in the volume of energy sold by CEPP to 291 GWh during the year ended December 31, 2015 from 307 GWh during the year ended December 31, 2014, which decreased CEPP’s revenue from energy sales by $2 million, primarily as a result of the expiration of CEPP’s PPA in September 2014 and (2) a $102, or 49%, decrease in CEPP’s average energy price to $106 per MWh during the year ended December 31, 2015 from $208 per MWh during the year ended December 31, 2014 due to a reduction in spot market energy prices as a result of a decline in HFO prices; and |
| • | a $10 million, or 26%, reduction in Colmito’s revenue to $28 million for the year ended December 31, 2015 from $38 million for the year ended December 31, 2014, due to a decrease in Colmito’s PPA prices as a result of a more humid hydrology in 2015 as compared to 2014. The reduction in revenue occurred despite a 12% increase in Colmito’s energy sales volumes as a result of the downward adjustment to its PPA prices. |
132
Table of Contents
Cost of Sales (Excluding Depreciation and Amortization)
Our cost of sales (excluding depreciation and amortization) decreased by $27 million, or 3%, to $909 million for the year ended December 31, 2015 from $936 million for the year ended December 31, 2014.
Peru Segment
| • | Cost of sales from our Peru segment increased by $9 million, or 3%, to $279 million for the year ended December 31, 2015 from $270 million for the year ended December 31, 2014, primarily as a result of: |
| • | a $9 million, or 12%, increase in transmission charges to $86 million in the year ended December 31, 2015 from $77 million during the year ended December 31, 2014, as a result of a 41% increase in the primary toll system tariff during 2015; and |
| • | a $5 million, or 500%, increase in intermediation fees (fees which are split between a generation and distribution company with respect to sales to certain unregulated customers) to $6 million in the year ended December 31, 2015 from $1 million during the year ended December 31, 2014, as a result of new PPAs signed during the second half of 2014, which PPAs included a higher intermediation fee rate than the original PPAs and required that the margins generated by such PPAs were shared with the relevant distribution company. |
| • | These effects were partially offset by a $4 million, or 3%, decline in gas transportation and distribution expenses to $134 million in 2015 from $138 million in 2014, as a result of a 13% decline in Kallpa’s gross energy generation to 5,166 GWh in 2015 from 5,920 GWh in 2014 as a result of scheduled major maintenance performed in February 2015 on Kallpa I, the effect of which was partially offset by an increase in the natural gas prices paid by Kallpa. |
Israel Segment
| • | Cost of sales from our Israel segment decreased by $10 million, or 4%, to $242 million for the year ended December 31, 2015 from $252 million for the year ended December 31, 2014, primarily as a result of: |
| • | a $37 million decline in OPC’s energy purchases as a result of an 10% increase in OPC’s net generation to 3,736 GWh in the year ended December 31, 2015 from 3,400 GWh in the year ended December 31, 2014 which led to a 62% decline in energy purchased from IEC (Israel’s system operator) to 217 GWh in the year ended December 31, 2015 from 573 GWh in the year ended December 31, 2014; and |
| • | a $3 million, or 2%, decline in OPC’s fuel expense to $134 million in the year ended December 31, 2015 from $137 million in the year ended December 31, 2014 due to a decrease in natural gas prices, notwithstanding the increase in OPC’s gas consumption during the year ended December 31, 2015 as a result of the 10% increase in OPC’s energy generation discussed above during the year ended December 31, 2015. OPC’s natural gas purchase prices are linked/indexed to the EA generation component tariff. Therefore, the natural gas prices paid by OPC declined during the period in connection with the August 2015 reduction to the PUAE generation component tariff. As OPC began to pay the ultimate floor price set forth in its supply agreement in November 2015, the decline in tariffs, which led to a reduction in revenues, did not result in a corresponding decrease in gas prices. For further information on this reduction, see “—Material Factors Affecting Results of Operations—EA Tariffs Affect our Results in our Generation Business’ Israel Segment.” |
133
Table of Contents
| • | These effects were partially offset by (1) a $23 million increase in system charge provisions during the year ended December 31, 2015 as a result of additional charges implemented during 2015 and (2) a $7 million contribution to cost of sales in the year ended December 31, 2015 from AIE, which we acquired and consolidated in August 2015. |
Central America Segment
| • | Cost of sales from our Central America segment increased by $5 million, or 2%, to $265 million for the year ended December 31, 2015 from $260 million for the year ended December 31, 2014, primarily as a result of our acquisition of Puerto Quetzal in September 2014 (which incurred cost of sales of $94 million in 2015 as compared to $29 million in 2014 since the acquisition of Puerto Quetzal in September 2014). |
This increase was partially offset by (1) a $34 million, or 29%, decline in Nejapa’s cost of sales despite a 17% increase in energy generation and a 19% increase in energy purchased due to a $21 million decline in Nejapa’s fuel expense as a result of a decline in the price of HFO fuel purchased by Nejapa and a corresponding decline in spot market prices and (2) a $25 million, or 26%, decline in ICPNH’s cost of sales due to a $29 million decline in ICPNH’s fuel expense in 2015 as compared to 2014 (since the acquisition of ICPNH in March 2014) as a result of a decline in the price of HFO fuel purchased by ICPNH.
Other Segment
| • | Cost of sales from our Other segment decreased by $31 million, or 20%, to $123 million for the year ended December 31, 2015 from $154 million for the year ended December 31, 2014, primarily as a result of: |
| • | a $25 million, or 45%, decline in CEPP’s cost of sales, principally resulting from a $13 million decline in CEPP’s fuel expense (despite a 23% increase in generation volume to 298 GWh in 2015 from 242 GWh in 2014) as a result of a 49% decline in the price of HFO purchased by CEPP and a $12 million decline in CEPP’s energy purchases, as CEPP’s purchased no energy during the year ended December 31, 2015 as compared to 71 GWh during the year ended December 31, 2014; and |
| • | an $11 million, or 31%, decline in Colmito’s cost of sales, primarily due to a $13 million decline in Colmito’s energy purchases as a result of a 31% decrease in energy spot purchase prices to $89 per MWh during the year ended December 31, 2015 from $129 per MWh during the year ended December 31, 2014 due to an increase in hydrology levels in Chile. This decline in cost of sales occurred despite a 4% increase in Colmito’s energy purchases to 255 GWh during the year ended December 31, 2015 from 245 GWh during the year ended December 31, 2014, as a result of an increase in the consumption of Colmito’s non-regulated customers. This decline was partially offset by a $2 million increase in Colmito’s fuel expense as a result of a higher natural gas consumption driven by an increase in generation to 26 GWh in 2015 from 5 GWh in 2014. |
| • | These effects were partially offset by our consolidation of JPPC in May 2014 (which incurred cost of sales of $41 million in 2015 as compared to $39 million in 2014 since the date of our consolidation of it). |
134
Table of Contents
Depreciation and Amortization
Our depreciation and amortization expenses (including the allocation in cost of sales and general, selling and administrative expenses) increased by $11 million, or 10%, to $119 million in 2015 from $108 million in 2014, primarily as a result of:
| • | a $4 million or 9%, increase in our Peru segment’s depreciation and amortization expense to $50 million in 2015 from $46 million in 2014, primarily as a result of the acquisition of Las Flores in April 2014; |
| • | a $3 million, or 17%, increase in our Central America segment’s depreciation expense to $21 million in 2015 from $18 million in 2014, primarily as a result of our consolidation of ICPNH and Puerto Quetzal in March and September 2014, respectively; and |
| • | a $3 million, or 14%, increase in our Other segment’s depreciation expense to $25 million in 2015 from $22 million in 2014, primarily as a result of our consolidation of JPPC in May 2014. |
General, Selling and Administrative Expenses
Our general, selling and administrative expenses (excluding depreciation and amortization) increased by $1 million, or 2%, to $63 million for the year ended December 31, 2015 from $62 million for the year ended December 31, 2014, primarily as a result of:
| • | the consolidation of $4 million in general, selling and administrative expenses for the year ended December 31, 2015 as a result of consolidation of ICPNH, Surpetroil, JPPC and Puerto Quetzal from the dates of their respective acquisitions in March 2014, March 2014, May 2014, and September 2014, respectively; and |
| • | a $4 million increase in our general, selling and administrative expenses in connection with the IPO process. |
These effects were partially offset by a $7 million decrease in Inkia’s legal fees as a result of the settlement of litigation relating to Crystal Power in December 2014.
Asset Write-Off
We did not record an asset write-off in 2015.
Our $35 million asset write-off in 2014 is comprised of an impairment charge in respect of Inkia’s impairment of one of its subsidiaries. For further information, see “—Critical Accounting Policies and Significant Estimates—Impairment Analysis.”
Gain on Bargain Purchase
We did not recognize a gain on bargain purchase in 2015.
During the year ended December 31, 2014, we recognized gains on bargain purchases of $68 million, reflecting the acquisitions of:
| • | ICPNH in March 2014, which resulted in our recognition of a gain of $24 million; |
| • | the 84% of the outstanding equity of JPPC which we did not previously own, in May 2014, resulting in our recognition of a gain of $24 million; and |
| • | Puerto Quetzal in September 2014, which resulted in our recognition of a gain of $20 million. |
135
Table of Contents
Other Expenses
Our other expenses decreased by $5 million, or 45%, to $6 million for the year ended December 31, 2015 from $11 million for the year ended December 31, 2014.
In 2015, our “other expenses” consisted primarily of:
| • | $4 million related to the loss on sale of property, plant and equipment, net; and |
| • | a $1 million provision for contingencies. |
In 2014, our “other expenses” consisted primarily of:
| • | an $8 million charge as a result of our retirement of certain of Amayo II’s assets—three wind turbines which were damaged in December 2014 in connection with a blackout in the SIN, which left one wind turbine collapsed and another two wind turbines with severe damage—and the loss of income relating to these assets; and |
| • | $2 million related to a net loss on sale of spare parts. |
Other Income
Our other income decreased $6 million, or 35%, to $11 million for the year ended December 31, 2015 from $17 million for the year ended December 31, 2014.
In 2015, our “other income” consisted primarily of:
| • | $7 million related to insurance claims received in 2015, primarily related to Amayo II’s claims in respect of three wind turbines, which were damaged in December 2014; and |
| • | $1 million related to EPC constructor compensation as a result of a delay in the COD of OPC’s power plant. |
In 2014, our “other income” consisted primarily of:
| • | $7 million related to insurance claims received in 2014, primarily related to Amayo II’s claims in respect of three of its wind turbines, which were damaged in December 2014; and |
| • | $4 million in dividend income from other companies (Edegel). |
Operating Income
As a result of the above, our operating income decreased by 34% to $203 million for 2015, resulting in an operating margin of 16%, as compared to an operating income and operating margin of $308 million and 22%, respectively, for 2014.
Financing Expenses, Net
Our financing expenses, net, declined by $15 million, or 13%, to $104 million for 2015 from $119 million for 2014, as set forth in further detail below by segment:
Peru Segment
| • | Financing expenses, net, from our Peru segment increased by $8 million, or 24%, to $42 million for the year ended December 31, 2015 from $34 million for the year ended December 31, 2014, |
136
Table of Contents
primarily as a result of an $11 million increase in foreign exchange rate losses as a result of the strengthening of the U.S. Dollar against the Peruvian Sol during 2015. This increase was partially offset by a $3 million decline in interest expense from bank and others primarily as a result of lower outstanding debt during 2015. |
Israel Segment
| • | Financing expenses, net, from our Israel segment declined by $7 million, or 23%, to $23 million for the year ended December 31, 2015 from $30 million for the year ended December 31, 2014, primarily as a result of a $3 million decrease in OPC’s interest expense from banks and others to $19 million in 2015 from $22 million in 2014 due to a 0.9% CPI decrease and a $3 million contribution to finance expenses in the year ended December 31, 2014 from AIE, which we acquired and consolidated in August 2015. |
Central America Segment
| • | Financing expenses, net, from our Central America segment increased by $2 million, or 25%, to $10 million for the year ended December 31, 2015 from $8 million for the year ended December 31, 2014, as a result of our recognition of financial expenses of ICPNH and Puerto Quetzal for the full year in 2015 compared to our recognition of these expenses from the dates of acquisition and consolidation of these subsidiaries in March and September 2014, respectively. |
Other Segment
| • | Financing expenses, net, from our Other segment declined by $17 million, or 37%, to $29 million for the year ended December 31, 2015 from $46 million for the year ended December 31, 2014, primarily as a result of (1) the absence of financial expenses in 2015 similar to the $13 million in finance expenses for the year ended December 31, 2014 recorded in connection with our repayment of $95 million of capital notes to IC, reflecting the difference between the nominal value of the capital notes ($95 million) and the book value of the capital notes ($82 million) and (2) a $7 million decrease in interest expense during the year ended December 31, 2015 due to our repayment of $263 million of related party debt owed to IC, our former parent, during May and June 2014. These effects were partially offset by a $3 million increase in interest expense during the year ended December 31, 2015, primarily as a result of the drawing of an additional $93 million under ICPI’s mezzanine loan in June 2014. |
Share in Income of Associated Company
Our share in income of associated company, which is comprised of our proportionate interest in Pedregal’s results of operations, was $274 thousand and $2 million for 2015 and 2014, respectively, as a result of an increase in Pedregal’s net income during the period.
Taxes on Income
Our tax expenses decreased by 21% to $50 million for 2015 from $63 million for 2014, primarily as a result of a decline in OPC’s operating results.
Our effective tax rate increased to 51% for 2015 from 33% for 2014, as a result of (1) the effects of a non-taxable $68 million gain on bargain purchase recorded in 2014 (which consists of a $24 million, $24 million and $20 million gains on bargain purchase recorded in connection with our acquisitions of ICPNH, JPPC and Puerto Quetzal in March, May and September 2014, respectively) and (2) a 120% increase in the deferred tax expense relating to the effect of foreign exchange rate over our non-monetary assets in Peru.
137
Table of Contents
In 2015 and 2014, our effective tax rates were higher than our Israeli statutory tax rate of 26.5% as a result of a higher contribution from our business line’s Peru segment (where our corporate income tax rate is 30%).
Net Income from Discontinued Operations, Net of Tax
Our net income from discontinued operations, net of tax, decreased significantly to $4 million for 2015 from $128 million for 2014.
In 2015, our net income from discontinued operations, net of tax, consisted of $4 million in dividend income from Generandes which, although declared in November 2014 after the consummation of our disposition of Generandes, was distributed to us and received by us in December 2014 and April 2015, respectively, pursuant to the terms of our sale agreement.
In 2014, our net income from discontinued operations, net of tax, consisted of (1) the results of Acter Holdings, which includes our $18 million proportionate share of Generandes’ results of operations during the period and (2) $110 million net gain on sale of discontinued operations as a result of the sale of our interest in Generandes, through which we held our indirect interest in Edegel, which generated $157 million of capital gains, which were partially offset by $47 million of income tax expenses.
Net Income for the Period
As a result of the factors discussed above, our net income for the period decreased by 79% to $53 million for 2015 from $256 million for 2014.
138
Table of Contents
Year Ended December 31, 2014 Compared to Year Ended December 31, 2013
Set forth below are our consolidated statements of income data for the years ended December 31, 2014 and 2013:
Years Ended | % Change | |||||||||||
20141 | 20131 | |||||||||||
| ($ millions) | ||||||||||||
Consolidated Statements of Income | ||||||||||||
Sales | $ | 1,372 | $ | 873 | 57 | |||||||
Cost of sales (excluding depreciation and amortization) | (936 | ) | (594 | ) | 58 | |||||||
Depreciation and amortization | (101 | ) | (72 | ) | 40 | |||||||
|
|
|
|
|
| |||||||
Gross profit | 335 | 207 | 62 | |||||||||
General, selling and administrative expenses | (69 | ) | (41 | ) | 68 | |||||||
Asset write-off | (35 | ) | — | — | ||||||||
Gain on bargain purchase | 68 | 1 | 6,700 | |||||||||
Measurement to fair value of pre-existing share | 3 | — | — | |||||||||
Other expenses | (11 | ) | — | — | ||||||||
Other income | 17 | 5 | 240 | |||||||||
|
|
|
|
|
| |||||||
Operating income | 308 | 172 | 79 | |||||||||
Financing expenses, net | (119 | ) | (80 | ) | 49 | |||||||
Share in income of associated companies | 2 | 2 | — | |||||||||
|
|
|
|
|
| |||||||
Income before taxes from continuing operations | 191 | 94 | 103 | |||||||||
Taxes on income | (63 | ) | (48 | ) | 31 | |||||||
|
|
|
|
|
| |||||||
Net income from continuing operations | $ | 128 | $ | 46 | 178 | |||||||
Net income from discontinued operations, net of tax | 128 | 28 | 357 | |||||||||
|
|
|
|
|
| |||||||
Net income for the period | $ | 256 | $ | 74 | 246 | |||||||
|
|
|
|
|
| |||||||
Attributable to: | ||||||||||||
Equity holders of the Company | $ | 227 | $ | 61 | 272 | |||||||
Non-controlling interest | 29 | 13 | 123 | |||||||||
| 1. | During 2015, an immaterial error was identified with respect to the deferred tax calculation relating to the effect of foreign exchange rate on non-monetary assets in previous years in ICP. ICP’s financial information for 2014, 2013 and 2012 has been revised to correct this immaterial error. |
139
Table of Contents
Set forth below are the results of each of our segments and our consolidated results of operations for the years ended December 31, 2014 and 2013:
| Year Ended December 31, 2014 | |||||||||||||||||||||||
Peru | Israel | Central | Other1 | Adjustments | Consolidated | |||||||||||||||||||
| ($ millions, except as otherwise indicated) | ||||||||||||||||||||||||
Sales | $ | 437 | $ | 413 | $ | 308 | $ | 214 | — | $ | 1,372 | |||||||||||||
Cost of Sales | (270 | ) | (252 | ) | (260 | ) | (154 | ) | — | (936 | ) | |||||||||||||
Depreciation and amortization | (45 | ) | (25 | ) | (18 | ) | (22 | ) | 9 | (101 | ) | |||||||||||||
|
|
|
|
|
|
|
|
|
|
|
| |||||||||||||
Gross profit | 122 | 136 | 30 | 38 | 9 | 335 | ||||||||||||||||||
General, selling and administrative expenses | (17 | ) | (9 | ) | (9 | ) | (34 | ) | — | (69 | ) | |||||||||||||
Asset write-off | — | — | — | (35 | ) | — | (35 | ) | ||||||||||||||||
Gain on bargain purchase | — | — | — | 68 | — | 68 | ||||||||||||||||||
Measurement to fair value of pre-existing share | — | — | — | 3 | — | 3 | ||||||||||||||||||
Other income (loss), net | 3 | — | — | 3 | — | 6 | ||||||||||||||||||
|
|
|
|
|
|
|
|
|
|
|
| |||||||||||||
Operating income | 108 | 127 | 21 | 43 | 9 | 308 | ||||||||||||||||||
Financing expenses, net | (34 | ) | (30 | ) | (8 | ) | (46 | ) | (1 | ) | (119 | ) | ||||||||||||
Share in income of associated companies | — | — | — | 2 | — | 2 | ||||||||||||||||||
|
|
|
|
|
|
|
|
|
|
|
| |||||||||||||
Income (loss) before taxes from continuing operations | $ | 74 | $ | 97 | $ | 13 | $ | (1 | ) | $ | 8 | $ | 191 | |||||||||||
Taxes on income | (29 | ) | (26 | ) | (4 | ) | (3 | ) | (1 | ) | (63 | ) | ||||||||||||
|
|
|
|
|
|
|
|
|
|
|
| |||||||||||||
Net income (loss) from continuing operations | 45 | 71 | 9 | (4 | ) | 7 | 128 | |||||||||||||||||
Net income from discontinued operations | — | — | — | 128 | — | 128 | ||||||||||||||||||
|
|
|
|
|
|
|
|
|
|
|
| |||||||||||||
Net income for the period | $ | 45 | $ | 71 | $ | 9 | $ | 124 | $ | 7 | $ | 256 | ||||||||||||
|
|
|
|
|
|
|
|
|
|
|
| |||||||||||||
Operating margin | 25 | % | 31 | % | 7 | % | 20 | % | — | 22 | % | |||||||||||||
| 1. | In addition to the results of certain of our generation assets, our Other segment also includes expenses and other adjustments relating to our headquarters and intermediate holding companies. |
| Year Ended December 31, 2013 | |||||||||||||||||||||||
Peru | Israel | Central | Other1 | Adjustments | Consolidated | |||||||||||||||||||
| ($ millions, except as otherwise indicated) | ||||||||||||||||||||||||
Sales | $ | 394 | $ | 187 | $ | 147 | $ | 145 | — | $ | 873 | |||||||||||||
Cost of Sales | (239 | ) | (139 | ) | (127 | ) | (89 | ) | — | (594 | ) | |||||||||||||
Depreciation and amortization | (40 | ) | (12 | ) | (9 | ) | (21 | ) | 10 | (72 | ) | |||||||||||||
|
|
|
|
|
|
|
|
|
|
|
| |||||||||||||
Gross profit | 115 | 36 | 11 | 35 | 10 | 207 | ||||||||||||||||||
General, selling and administrative expenses | (16 | ) | (5 | ) | (4 | ) | (16 | ) | — | (41 | ) | |||||||||||||
Gain on bargain purchase | — | — | — | 1 | — | 1 | ||||||||||||||||||
Other income (loss), net | 2 | — | — | 3 | — | 5 | ||||||||||||||||||
|
|
|
|
|
|
|
|
|
|
|
| |||||||||||||
Operating income | 101 | 31 | 7 | 23 | 10 | 172 | ||||||||||||||||||
Financing expenses, net | (34 | ) | (22 | ) | — | (23 | ) | (1 | ) | (80 | ) | |||||||||||||
Share in income of associated companies | — | — | — | 2 | — | 2 | ||||||||||||||||||
|
|
|
|
|
|
|
|
|
|
|
| |||||||||||||
Income before taxes from continuing operations | $ | 67 | $ | 9 | $ | 7 | $ | 2 | $ | 9 | $ | 94 | ||||||||||||
Taxes on income | (32 | ) | (2 | ) | (2 | ) | (10 | ) | (2 | ) | (48 | ) | ||||||||||||
|
|
|
|
|
|
|
|
|
|
|
| |||||||||||||
Net income (loss) from continuing operations | 35 | 7 | 5 | (8 | ) | 7 | 46 | |||||||||||||||||
Net income from discontinued operations, net of tax | — | — | — | 28 | — | 28 | ||||||||||||||||||
|
|
|
|
|
|
|
|
|
|
|
| |||||||||||||
Net income for the period | $ | 35 | $ | 7 | $ | 5 | $ | 20 | $ | 7 | $ | 74 | ||||||||||||
Operating margin | 26 | % | 17 | % | 5 | % | 16 | % | — | 20 | % | |||||||||||||
| 1. | In addition to the results of certain of our generation assets, our Other segment also includes expenses and other adjustments relating to our headquarters and intermediate holding companies. |
140
Table of Contents
Sales
Our sales increased by $499 million, or 57%, to $1,372 million for the year ended December 31, 2014 from $873 million for the year ended December 31, 2013. This increase was primarily driven by (1) the acquisition of the Las Flores plant in 2013 in our Peru segment, (2) the first full year of operations of OPC in our Israel segment, and (3) our acquisition and consolidation of various businesses during 2014, as set forth in further detail below by segment:
Peru Segment
| • | Sales from our Peru segment increased by $43 million, or 11%, to $437 million for the year ended December 31, 2014 from $394 million for the year ended December 31, 2013, primarily as a result of: |
| • | a $24 million, or 9%, increase in Kallpa’s revenue from energy sales to $291 million in 2014 from $267 million during 2013, primarily as a result of a $9 million, or 3%, increase in revenue resulting from an increase in the volume of energy sales by Kallpa to 6,559 GWh in 2014 from 6,352 GWh in 2013 and a $13 million, or 5%, increase in revenue resulting from an increase in Kallpa’s average energy price to $44 per MWh in 2014 from $42 per MWh in 2013 principally due to the commencement of service under certain PPAs with distribution companies which provided for the sale of energy at higher prices, and included a pass-through of the cost of the gas distribution tariff which was imposed on generators in Chilca as of January 1, 2014 in connection with the completion of a gas pipeline constructed by Gas Natural de Lima y Callao S.A., or Calidda, which has a concession to distribute gas from Chilca to Lima, and within Lima; |
| • | a $10 million, or 18%, increase in Kallpa’s revenue from ancillary services (principally transmission tolls that are typically passed through to Kallpa’s customers pursuant to its PPAs) as a result of an increase in the primary toll system tariff during 2014; and |
| • | a $5 million, or 7%, increase in Kallpa’s revenue from capacity sales to $73 million during 2014 from $68 million during 2013, primarily as a result of a 6% increase in revenue resulting from an increase in the volume of capacity sales to an average of 929 MW in 2014 from an average of 880 MW in 2013, which was principally due to our acquisition of the Las Flores plant in April 2014. |
Israel Segment
| • | Sales from our Israel segment increased by $226 million, or 121%, to $413 million for the year ended December 31, 2014 from $187 million for the year ended December 31, 2013, primarily as a result of the first full year of operations of OPC, which commenced commercial operations in July 2013. OPC’s revenue from energy sales increased by $225 million, or 122%, to $410 million for the year ended December 31, 2014, from $185 million for the year ended December 31, 2013, principally as a result of a $225 million, or 119%, increase in revenue resulting from an increase in the volume of energy sold to 3,973 GWh in 2014 from 1,813 GWh in 2013, which reflects a full year of commercial operations of OPC’s plant during 2014 and an increase in the average price of energy sold to $104 per GWh in 2014 from $103 per GWh in 2013. |
Central America Segment
| • | Sales from our Central America segment increased by $161 million, or 110%, to $308 million for the year ended December 31, 2014 from $147 million for the year ended December 31, 2013, |
141
Table of Contents
primarily as a result of our acquisition and consolidation of ICPNH (which generated sales of $125 million in 2014 since our acquisition of it in March 2014) and Puerto Quetzal (which generated sales of $33 million in 2014 since our acquisition of it in September 2014). |
Other Segment
| • | Sales from our Other segment increased by $69 million, or 48%, to $214 million for the year ended December 31, 2014 from $145 million for the year ended December 31, 2013 primarily as a result of our consolidation of JPPC (which generated sales of $41 million in 2014 since our acquisition of it in May 2014), Colmito (which generated sales of $38 million in 2014 since our acquisition of it in October 2013) and Surpetroil (which generated sales of $9 million in 2014 since our acquisition of it in March 2014). These effects were partially offset by a $19 million, or 21%, reduction in CEPP’s revenues to $73 million for the year ended December 31, 2014 from $92 million for the year ended December 31, 2013, primarily as a result of the expiration of its PPA in September 2014 and a change in CEPP’s position in the dispatch order as a result of the entry of an additional, more efficient power plant in the Dominican Republic. |
Cost of Sales (Excluding Depreciation and Amortization)
Our cost of sales (excluding depreciation and amortization) increased by $342 million, or 58%, to $936 million for the year ended December 31, 2014 from $594 million for the year ended December 31, 2013. This increase was primarily driven by (1) the imposition of certain tariffs in Peru as of January 1, 2014 in our Peru segment, (2) the first full year of operations of OPC in our Israel segment, (3) our acquisition and consolidation of various businesses during 2014, as set forth in further detail below by segment:
Peru Segment
| • | Cost of sales from our Peru segment increased by $31 million, or 13%, to $270 million for the year ended December 31, 2014 from $239 million for the year ended December 31, 2013 primarily as a result of: |
| • | a $27 million, or 24%, increase in Kallpa’s gas and gas transportation and distribution costs to $139 million in 2014 from $112 million in 2013, as a result of (1) the commencement of Calidda’s gas distribution services, which increased Kallpa’s gas costs by $18 million, and (2) a $9 million increase in Kallpa’s natural gas costs primarily as a result of an 8% increase in gross energy generated by Kallpa to 5,920 GWh in 2014 from 5,459 GWh in 2013; |
| • | a $13 million, or 20%, increase in Kallpa’s transmission costs to $77 million in 2014 from $64 million in 2013, as a result of a 19% increase in the primary toll system tariff; and |
| • | a $9 million, or 22%, decrease in Kallpa’s cost for purchases of energy and capacity as a result of an 8% increase in energy generated by Kallpa to 5,920 GWh in 2014 from 5,459 GWh in 2013 which resulted in a reduction in Kallpa’s spot market purchases, which partially offset the above-described increases. |
Israel Segment
| • | Cost of sales from our Israel segment increased by $113 million, or 81%, to $252 million for the year ended December 31, 2014 from $139 million for the year ended December 31, 2013 primarily as a result of an increase in the gross energy generated by OPC to 3,465 GWh in 2014 from 1,357 GWh in 2013, reflecting a full year of commercial operations of this plant during 2014, as compared to approximately six months of commercial operations of this plant in 2013 following its COD in July 2013. |
142
Table of Contents
Central America Segment
| • | Cost of sales from our Central America segment increased by $133 million, or 105%, to $260 million for the year ended December 31, 2014 from $127 million for the year ended December 31, 2013 primarily as a result of: |
| • | our acquisition and consolidation of ICPNH (which incurred cost of sales of $98 million in 2014 since our acquisition of it in March 2014) and Puerto Quetzal (which incurred cost of sales of $29 million in 2014 since our acquisition of it in September 2014). The consolidation of these entities increased our cost of sales as follows: (1) our fuel and lubricants costs increased by $98 million; (b) our purchases of energy and capacity increased by $12 million; (c) our maintenance expenses increased by $8 million; and (d) our personnel expenses increased by $4 million; |
| • | an $11 million, or 30%, increase in energy purchased by Nejapa, primarily as a result of an increase in sales in 2014, despite a lower amount of energy generated by Nejapa, which reduction was due to an increase in low cost energy purchased by the electricity system in El Salvador from other SIEPAC countries, primarily Guatemala; and |
| • | a $12 million, or 17%, decrease in Nejapa’s fuel costs as a result of the reduction of its generation activities, which partially offset the increases above. |
Other Segment
| • | Cost of sales from our Other segment increased by $65 million, or 73%, to $154 million for the year ended December 31, 2014 from $89 million for the year ended December 31, 2013 primarily as a result of: |
| • | our consolidation of JPPC (which incurred cost of sales of $40 million in 2014 since our acquisition of it in May 2014) and Surpetroil (which incurred cost of sales of $2 million in 2014 since our acquisition of it in March 2014). The consolidation of these entities increased our cost of sales as follows: (a) our fuel, gas and lubricants costs increased by $34 million; (b) our maintenance expenses increased by $3 million and (c) our personnel expenses increased by $2 million; |
| • | a $36 million increase in our cost of sales as a result of our acquisition and consolidation of Colmito, which we acquired in October 2013, primarily as a result of the $32 million energy and capacity purchases made by Colmito to supply its PPA with ENAP Refinerías S.A., which commenced in January 2014; and |
| • | a $17 million, or 33%, decline in CEPP’s fuel costs in connection with a 29% decrease in CEPP’s gross generation to 242 GWh in 2014 from 339 GWh in 2013 primarily as a result of a change in CEPP’s position in the dispatch order as a result of the entry of an additional, more efficient power plant, which partially offset the above-described increases. |
Depreciation and Amortization
Our depreciation and amortization expenses (including the allocation in cost of sales and general, selling and administrative expenses) increased by $32 million, or 42%, to $108 million in 2014 from $76 million in 2013, primarily as a result of the increase in our depreciable property, plant and equipment as a result of depreciation expenses related to (1) a full year of commercial operations of OPC during 2014, as compared to approximately six months of commercial operations of this plant following its COD in July 2013, which increased OPC’s depreciation from $12 million in 2013 to $25 million in 2014, (2) the acquisitions of ICPNH,
143
Table of Contents
Surpetroil, JPPC, and Puerto Quetzal, which contributed $13 million to our consolidated depreciation in 2014, and (3) the acquisition of Las Flores in April 2014, which increased Kallpa’s depreciation expense by $5 million from $40 million in 2013 to $45 million in 2014.
General, Selling and Administrative Expenses
Our general, selling and administrative expenses (excluding depreciation and amortization) increased by $24 million, or 65%, to $61 million for 2014 from $37 million for 2013. This increase was primarily driven by (1) the consolidation of general, selling and administrative expenses in an aggregate amount of $9 million as a result of our consolidation of ICPNH, Surpetroil, JPPC and Puerto Quetzal from the dates of their respective acquisitions in March 2014, March 2014, May 2014 and September 2014; (2) an $8 million increase in legal fees to $11 million from $3 million, primarily due to a $7 million increase in Inkia’s legal fees as a result of litigation relating to Crystal Power, which was settled in December 2014; (3) a $3 million increase in OPC’s general, selling and administrative expenses to $8 million in 2014 from $5 million in 2013 as a result of the commencement of OPC’s commercial operations in July 2013 (certain of OPC’s general, selling and administrative expenses were capitalized prior to the beginning of OPC’s commercial operations in July 2013); and (4) $2 million increase in amortization as a result of our acquisitions of ICPNH, Surpetroil, JPPC and Puerto Quetzal during the period.
Asset Write-Off
Our $35 million asset write-off in 2014 is comprised of an impairment charge in respect of Inkia’s impairment of one of its subsidiaries. For further information, see “—Critical Accounting Policies and Significant Estimates—Impairment Analysis.”
Gain on Bargain Purchase
Our gain on bargain purchase was $68 million for 2014 compared to $1 million for 2013. This increase was driven by the negative goodwill generated in connection with our acquisition of:
| • | ICPNH in March 2014, which resulted in our recognition of a gain of $24 million; |
| • | the 84% of the outstanding equity of JPPC, which we did not previously own, in May 2014, resulting in our recognition of a gain of $24 million; and |
| • | Puerto Quetzal in September 2014, which resulted in our recognition of a gain of $20 million. |
Other Expenses
Our other expenses increased significantly to $11 million for 2014. This increase was primarily driven by (1) a $7 million charge as a result of our retirement of certain of Amayo II’s assets—three wind turbines which were damaged in December 2014 in connection with a blackout in the SIN, which left one wind turbine collapsed and another two wind turbines with severe damage—and the loss of income relating to these assets and (2) $2 million charge resulting from a net loss on sale of spare parts. For further information on the damaged turbines, see “Business—Property, Plant and Equipment.”
Other Income
Our other income increased significantly to $17 million for 2014 from $4 million for 2013. In 2014, our other income consisted primarily of (1) $7 million related to insurance claims, primarily in respect of Amayo II’s
144
Table of Contents
claims regarding three of its wind turbines which were damaged in December 2014 and (2) $4 million in dividend income from other companies (Edegel). In 2013, our other income consisted of (1) $4 million of non-operating income and (2) $1 million of dividends received from JPPC.
Operating Income
As a result of the above, our operating income increased by 79% to $308 million for 2014, resulting in an operating margin of 22%, as compared to an operating income and operating margin of $172 million and 20%, respectively, for 2013.
Financing Expenses, Net
Our financing expenses, net, increased by 49% to $119 million for 2014 from $80 million for 2013 as set forth in further detail below by segment:
Peru Segment
| • | Financing expenses, net from our Peru segment were $34 million in both 2013 and 2014 reflecting a $3 million increase in interest expense from banks and others to $33 million, primarily as a result of interest expenses relating to Las Flores’ leases (accrued since our acquisition of Las Flores in April 2014). This increase was partially offset by a $4 million decline in foreign currency loss due to the depreciation of the Peruvian Sol against the U.S. Dollar during 2014. |
Israel Segment
| • | Financing expenses, net, from our Israel segment increased by $8 million, or 36%, to $30 million for the year ended December 31, 2014 from $22 million for the year ended December 31, 2013 primarily as a result of a $6 million increase in OPC´s interest expense from banks and others to $23 million in 2014 from $17 million in 2013. Prior to OPC’s COD in July 2013, OPC’s interest expense was capitalized. |
Central America Segment
| • | Financing expenses, net, from our Central America segment increased by $8 million, or 100%, to $8 million for the year ended December 31, 2014, primarily as a result of the recognition of $7 million of interest expense relating to ICPNH’s debt, as a result of our acquisition, and consolidation, of ICPNH in March 2014. |
Other Segment
| • | Financing expenses, net, from our Other segment increased by $23 million, or 100%, to $46 million for the year ended December 31, 2014 from $23 million for the year ended December 31, 2013 primarily as a result of (1) the recognition of $13 million in finance expenses as a result of repaying $95 million of capital notes to IC, reflecting the difference between the nominal value of the capital notes ($95 million) and the book value of the capital notes ($82 million); (2) a $9 million increase in Inkia’s interest expense from banks and others to $21 million in 2014 from $12 million in 2013, primarily as a result of our incurrence of a full year of interest expense in respect of Inkia’s incremental $150 million senior notes, which were issued in September 2013, and interest expense relating to Inkia’s $125 million credit facility (which was entered into in December 2013 and fully paid in August 2014); (3) a $3 million increase in interest expense in respect of ICPI’s NIS 350 million (approximately $93 million) mezzanine financing agreement, which ICPI entered into in June 2014; and (4) a $2 million increase in Colmito’s interest expense from banks and others, |
145
Table of Contents
primarily as a result of Colmito’s incurrence of additional debt in February 2014. These effects were partially offset by a $4 million decrease in interest expense on loans from IC, ICP’s former parent company, to $7 million for the year ended December 31, 2014 from $11 million for the year ended December 31, 2013, as a result of our repayment of the full outstanding amount of the loans owed to IC during May and June 2014. |
Share in Income of Associated Company
Our share in income of associated company, which is comprised of our proportionate interest in Pedregal’s results of operations, was $2 million for each of 2014 and 2013.
Taxes on Income
Our tax expenses increased to $63 million for 2014 from $48 million for 2013. Our tax expense in 2014 was affected by (1) a $23 million increase in OPC’s income tax expense as a result of an increase in OPC’s income before taxes, due to a full year of commercial operation, as compared to 2013 in which OPC commenced commercial operations in July; (2) an increase in the statutory income tax rate to 26.5% in 2014 from 25% in 2013; and (3) the recognition of a $2 million income tax expense as a result of our acquisition and consolidation of ICPNH, Puerto Quetzal, JPPC and Surpetroil during the period.
These effects were partially offset by (1) a $9 million deferred income tax gain arising from the $35 million write-off of assets recorded during 2014; and (2) a $3 million decline in our generation business’ Peru segment’s income tax expenses primarily as a result of a decline in Kallpa’s, CDA’s and Samay I’s deferred income tax expenses to $8 million in 2014 from $12 million in 2013, due to the translation effects of each company’s non-monetary assets as a result of their payment of taxes in a currency that is different from their functional currency.
Our effective tax rate decreased to 33% for 2014 from 51% for 2013, as a result of the effects of a non-taxable $68 million gain on bargain purchase recorded in 2014 (which consists of a $24 million, $24 million and $20 million gains on bargain purchase recorded in connection with our acquisitions of ICPNH, JPPC and Puerto Quetzal in March, May and September 2014, respectively). In 2014 and 2013, our effective tax rates were higher than our Israeli statutory tax rates of 26.5% and 25%, respectively, as a result of a higher contribution from our business line’s Peru segment (where our corporate income tax rate is 30%).
Net Income from Discontinued Operations, Net of Tax
Our net income from discontinued operations, net of tax, increased significantly to $128 million for 2014 from $28 million for 2013, reflecting (1) the results of Acter Holdings, which includes our $18 million proportionate share of Generandes’ results of operations during the period, as compared to our $28 million proportionate share of Generandes results of operations in 2013 and (2) $110 million net gain on sale of discontinued operations as a result of the sale of our interest in Generandes, through which we held our indirect interest in Edegel, which generated $157 million of capital gains, which were partially offset by $47 million of income tax expenses.
Net Income for the Period
As a result of the factors discussed above, our net income for the period increased by 246% to $256 million for 2014 from $74 million for 2013.
Liquidity and Capital Resources
As of June 30, 2016 and December 31, 2015, we had cash and cash equivalents of $234 million and $360 million, respectively. In addition, we had no short-term deposits as of June 30, 2016 and short-term deposits of $50 million as of December 31, 2015.
146
Table of Contents
Our principal sources of liquidity have traditionally consisted of cash flows from operating activities, including dividends received from entities in which we own non-controlling interests; short-term and long-term borrowings; and sales of bonds in domestic and international capital markets. We do not have funds designated for, or subject to, permanent reinvestment in any country in which we operate. Distributions of the earnings of our foreign subsidiaries are subject to the withholding taxes imposed by the foreign subsidiaries’ jurisdictions of incorporation. From time to time, however, we may be unable to receive dividends from our subsidiaries and associated company as a result of a lack of distributable reserves or limitations under our contractual arrangements. For example, the sale of our indirect interest in Edegel constituted an “asset sale” under Inkia’s indenture, pursuant to which Inkia was required to use the $235 million net proceeds from Inkia’s sale of its interest in Edegel within 30 months of Inkia’s receipt of such net proceedsto reinvest in its operations through acquisitions, or capital expenditures, or to repay certain debt, failing which we must use any remaining proceeds to offer to repurchase these notes at 100% of principal amount plus accrued interest. Inkia has fully invested the net cash proceeds from the Edegel sale through, among others, debt repayments and our acquisition of Energuate and two smaller, related companies.
In addition, we are also limited in usage of certain cash, with such restricted cash constituting an aggregate amount of $85 million, $252 million and $88 million as of June 30, 2016, December 31, 2015 and December 31, 2014, respectively, either because such cash deposits are time deposits or as a result of the loan covenants relating to our Bolivian, Nicaraguan and Israeli assets. For further information on potential limitations to our ability to receive dividends from certain of the entities in which we hold interests, see “Risk Factors—Risks Related to Our Business—We are a holding company and are dependent upon cash flows from our subsidiaries and associated company to meet our existing and future obligations,” “Risk Factors—Risks Related to Our Business—We are significantly leveraged” and Notes 14 and 19 to our audited financial statements included in this prospectus.
Our principal needs for liquidity generally consist of capital expenditures related to the development and construction of generation projects and the acquisition of other generation companies; working capital requirements (e.g., maintenance costs that extend the useful life of our plants); and dividends on our ordinary shares. As part of our growth strategy, we expect to develop, construct and operate greenfield projects in the markets that we serve as well as start projects or acquire controlling interests in operating assets within and outside Latin America. Our development of greenfield projects and our acquisition activities in the future may require us to make significant capital expenditures and/or raise significant capital. We believe that our liquidity is sufficient to cover our working capital needs in the ordinary course of our business.
In connection with tax claims raised by the Guatemalan Tax Administrator, or the SAT, in August 2016, DEORSA and DEOCSA paid $48 million to the SAT and are required to pay an additional amount, estimated to be $17 million to $24 million (the amount of which is still under discussion with the SAT), in November 2016. For further information on these claims, see “—Recent Developments—Energuate Tax Claims.”
In October 2016, we prepaid in full our $75 million note payable to Kenon. For further information on our notes payable to Kenon, see “Related Party Transactions—$220 Million Notes Payable to Kenon.”
147
Table of Contents
Cash Flows
Six Months Ended June 30, 2016 Compared to Six Months Ended June 30, 2015
The following table sets forth our cash flows from our operating, investing and financing activities for the six months ended June 30, 2016 and 2015:
Six Months Ended June 30, | ||||||||
2016 | 2015 | |||||||
| ($ millions) | ||||||||
Cash flows provided by (used in) operating activities | $ | 55 | $ | 131 | ||||
Cash flows used in investing activities | (177) | (341) | ||||||
Cash flows provided by (used in) financing activities | (6) | 63 | ||||||
|
|
|
| |||||
Net change in cash in period | (128) | (147) | ||||||
Cash—opening balance | 360 | 583 | ||||||
Effect of exchange rate on the cash | 2 | — | ||||||
|
|
|
| |||||
Cash—closing balance | 234 | 436 | ||||||
|
|
|
| |||||
Cash Flows Provided by Operating Activities
Cash flows provided by our operating activities are our primary source of liquidity and decreased by 58% to $55 million for the six months ended June 30, 2016 from $130 million for the six months ended June 30, 2015. This decrease was primarily driven by a $47 million decrease in OPC’s net cash flows from operating activities, primarily as a result of a $41 million system costs provision paid by OPC in February 2016, and an $11 million VAT payment by Kallpa due to the prepayment of lease agreements.
Cash Flows Used in Investing Activities
Cash flows used in our investing activities decreased by 48% to $177 million for the six months ended June 30, 2016 from $341 million for the six months ended June 30, 2015. This decrease was primarily driven by (1) a $206 million increase in proceeds of short-term deposits and restricted cash, net, as a result of the release of funds held in escrow for the account of ICPDH and the release of short-term deposits, both in connection with our acquisition of Energuate, and (2) a $134 million decline in acquisitions of property, plant and equipment, as discussed below. These effects were partially offset by $206 million used for our acquisition of Energuate, net of cash acquired.
During the six months ended June 30, 2016, net cash used in investing included primarily: (1) $206 million disbursed for business combination (net of the cash acquired) related to our acquisition of Energuate; and (2) $199 million related to acquisitions of property, plant and equipment, of which $66 million was used in the construction of the Samay I plant, $63 million was used in the construction of the CDA plant, and $11 million was used in Kanan’s project installation and connection to Panama’s power system. These effects were partially offset by $230 million in short-term deposits and restricted cash, net, mainly related to the funds released by ICPDH in connection with our acquisition of Energuate.
During the six months ended June 30, 2015, cash flows used in our investing activities primarily consisted of (1) acquisitions of property, plant and equipment of $333 million, of which $173 million was used in connection with the construction of the Samay I plant, $114 million was used in connection with the construction of the CDA plant, and $11 million was used in Kanan’s project installation and interconnection to Panama’s power system; and (2) payments of value added tax, net of project under construction of $25 million. Additionally, during the six months ended June 30, 2015, we received proceeds of short-term deposits and restricted cash, net, in the aggregate amount of $24 million.
148
Table of Contents
Cash Flows Used in Financing Activities
Cash flows used by our financing activities were $6 million for the six months ended June 30, 2016 compared to cash flows provided by our financing activities of $63 million for the six months ended June 30, 2015.
During the six months ended June 30, 2016, we received aggregate proceeds of $466 million from our incurrence of long-term debt, which included:
| • | $347 million from the May 2016 issuance of Kallpa bonds; |
| • | $55 million borrowed under the Kanan Credit Facility; |
| • | $44 million borrowed under the CDA Finance Facility; and |
| • | $20 million borrowed under the Samay I Finance Facility. |
Additionally, we used cash to distribute dividends of $18 million to our subsidiaries´ minority shareholders and used cash to make payments of long-term debt and capital notes of $374 million, including cash used for the repayment of Kallpa’s bonds with the proceeds from Kallpa’s issuance of $350 million of bonds in May 2016. In addition, in the six months ended June 30, 2016, $59 million was used to pay interest on borrowings and $31 million as used to pay issuance expenses and premium in connection with the Kallpa bonds.
During the six months ended June 30, 2015, we received aggregate proceeds of $187 million from our incurrence of long-term debt, including $85 million and $99 million borrowed under the CDA Finance Facility and the Samay I Finance Facility, respectively. Additionally, we paid $20 million in connection with the purchase of the shares of Crystal Power (the former shareholder) in Nejapa, and used cash to make payments of $52 million on our long-term debt and pay $48 million interest on borrowings.
Year Ended December 31, 2015 Compared to Year Ended December 31, 2014
The following table sets forth our cash flows from our operating, investing and financing activities for the years ended December 31, 2015 and 2014:
Year Ended December 31, | ||||||||
2015 | 2014 | |||||||
| ($ millions) | ||||||||
Cash flows provided by operating activities | $ | 320 | $ | 413 | ||||
Cash flows (used in) investing activities | (621 | ) | (378 | ) | ||||
Cash flows provided by financing activities | 89 | 47 | ||||||
|
|
|
| |||||
Net change in cash in period | (212 | ) | 82 | |||||
Cash—opening balance | 583 | 517 | ||||||
Effect of exchange rate on the cash | (11 | ) | (16 | ) | ||||
|
|
|
| |||||
Cash—closing balance | $ | 360 | $ | 583 | ||||
|
|
|
| |||||
Cash Flows Provided by Operating Activities
Cash flows provided by our operating activities decreased by 23% to $320 million for 2015 from $413 million for 2014. This decrease was primarily driven by (1) a $107 million decrease in OPC’s net cash flows from operating activities, primarily as a result of a lower generation component tariff, which serves as the base for the price calculation for the billing of OPC’s customers; and (2) a $22 million decline in cash flows provided by dividends from discontinued operations in in connection with our sale of Edegel in 2014.
These factors were partially offset by (1) a $15 million increase in ICPNH’s net cash flows from operating activities primarily as a result of our consolidation of a full year of ICPNH’s operations and increased
149
Table of Contents
net cash flows from operating activities of ICPNH as a result of increased revenue from Amayo I and Amayo II as a result of better wind conditions; (2) a $9 million increase in CEPP’s net cash flows from operating activities, primarily as a result of the collection of $31 million from its accounts receivable as a result of the debt recognition and payment agreement signed by CEPP, the Dominican regulator and three distribution companies in September 2015; (3) a $7 million increase in Inkia’s net cash flows from operating activities primarily as a result of lower legal expenses during 2015; and (4) a $3 million increase in net cash flows from operating activities in Chile primarily as a result of better 2015 operating results in Central Cardones and Colmito.
Cash Flows Used in Investing Activities
Cash flows used in our investing activities increased by 64% to $621 million for 2015 from $378 million for 2014. This increase was primarily driven by (1) our receipt of $360 million of net proceeds in connection with the sale of our indirect equity interest in Edegel in September 2014, and (2) a $92 million increase in acquisition of property, plant and equipment, as set forth below. These effects were partially offset by a $138 million decline in short-term deposits and restricted cash, net, and (2) a $61 million decline in cash flows used in investing activities to $9 million in 2015 (in connection with the acquisition of AIE in 2015) from $70 million in 2014 (in connection with the acquisitions of ICPNH, JPPC, Surpetroil and Puerto Quetzal during 2014).
During 2015, investing activities for which we used cash primarily consisted of (1) acquisitions of property, plant and equipment of $518 million, which primarily consisted of $225 million used in the construction of Samay I, $187 million used in the construction of CDA’s plant, $29 million used in Kanan’s project installation and interconnection to Panama’s power system and $9 million used in the acquisition of AIE; (2) $83 million for short-term deposits and restricted cash, net, principally related to the funds received by ICPDH, which acquired indirect equity interests in Energuate, RECSA and Guatemel, in connection with the short-term loan for the acquisition of such businesses in January 2016; and (3) $17 million related to the acquisition of intangibles.
During 2014, cash flows used in our investing activities primarily consisted of (1) acquisitions of property, plant and equipment of $426 million, of which $260 million was used in connection with the construction of CDA’s plant and $85 million was used in connection with the construction of Samay I; (2) $221 million for short-term deposits and restricted cash, net, in connection with the opening of time deposits related to the proceeds from Edegel sale; and (3) $70 million (net of cash received) to complete the acquisitions of ICPNH, JPPC, Surpetroil and Puerto Quetzal. The effects of these expenditures were partially offset by $360 million of net proceeds received by us in connection with the sale of our indirect equity interest in Edegel in September 2014.
Cash Flows Provided by Financing Activities
Cash flows provided by our financing activities increased by 89% to $89 million for 2015 compared to $47 million for 2014.
During 2015, we received aggregate proceeds of $226 million from the incurrence of long-term debt and $6 million from equity investments from certain of our partners, as follows:
| • | $138 million borrowed under the Samay I Finance Facility; |
| • | $85 million borrowed under the CDA Finance Facility; |
| • | $3 million borrowed under Tipitapa Power’s loan agreement; and |
| • | $6 million from the investment of Energía del Pacífico in CDA and the investment of the minority partner in Surenergy. |
150
Table of Contents
The receipt of such proceeds were offset by repayments of long-term notes, debentures and capital notes of $138 million in 2015.
During 2014, we received aggregate proceeds of $667 million from our issuance of long-term debt and $20 million from equity investments from certain of our partners, as follows:
| • | $319 million borrowed under the CDA Finance Facility; |
| • | $153 million borrowed under the Samay I Finance Facility; |
| • | $93 million borrowed under ICPI’s credit facility; |
| • | $43 million from the issuance of the COBEE bonds; |
| • | $25 million from the issuance of the CEPP bonds; |
| • | $23 million borrowed under Colmito’s credit facility; |
| • | $2 million borrowed under Tipitapa Power’s loan agreement; and |
| • | $20 million from the investment of Energía del Pacífico in Samay I. |
In addition, in 2014, we made payments of $300 million to IC, our former parent. In May 2014, we repaid $168 million of intercompany debt owed to IC. In June 2014, we repaid $95 million of capital notes owed to IC and declared and distributed dividends of $37 million to IC.
Year Ended December 31, 2014 Compared to Year Ended December 31, 2013
The following table sets forth our cash flows from our operating, investing and financing activities for the years ended December 31, 2014 and 2013:
Year Ended December 31, | ||||||||
2014 | 2013 | |||||||
| ($ millions) | ||||||||
Cash flows provided by operating activities | $ | 413 | $ | 272 | ||||
Cash flows (used in) investing activities | (378 | ) | (258 | ) | ||||
Cash flows provided by financing activities | 47 | 320 | ||||||
|
|
|
| |||||
Net change in cash in period | 82 | 334 | ||||||
Cash—opening balance | 517 | 184 | ||||||
Effect of exchange rate on the cash | (16 | ) | (1 | ) | ||||
|
|
|
| |||||
Cash—closing balance | $ | 583 | $ | 517 | ||||
|
|
|
| |||||
Cash Flows Provided by Operating Activities
Cash flows provided by our operating activities increased by 52% to $413 million for 2014 from $272 million for 2013. This increase was primarily driven by a $141 million increase in OPC’s net cash flows from operating activities, reflecting a full year of commercial operations of OPC during 2014, as compared to approximately six months of commercial operations in 2013.
Cash Flows Used in Investing Activities
Cash flows used in our investing activities increased by 47% to $378 million for 2014 from $258 million for 2013. This increase was primarily driven by (1) a $296 million increase in short-term deposits and
151
Table of Contents
restricted cash, net, resulting in proceeds in an aggregate amount of $221 million being deposited during 2014, (2) a $132 million change in our acquisition of property, plant and equipment (in particular, higher disbursements related to the development of CDA’s plant during 2014, the beginning of construction of Samay I and Kanan, and the acquisitions of ICPNH, JPPC, Surpetroil and Puerto Quetzal) and (3) a $42 million increase resulting from business combinations. The effects of these expenditures were partially offset by $360 million of net proceeds received in connection with the sale of our indirect equity interest in Edegel in September 2014.
During 2014, investing activities for which we used cash primarily consisted of (1) acquisitions of property, plant and equipment of $426 million, of which $260 million was used in connection with the construction of CDA’s plant and $85 million was used in connection with the construction of Samay I, (2) $221 million for short-term deposits and restricted cash, net in connection with the opening of time deposits related to the proceeds from Edegel sale and (3) $70 million (net of cash received) to complete the acquisitions of ICPNH, JPPC, Surpetroil and Puerto Quetzal. The effects of these expenditures were partially offset by $360 million of net proceeds received by us in connection with our sale of our indirect equity interest in Edegel in September 2014.
During 2013, investing activities for which we used cash primarily consisted of acquisitions of property, plant and equipment of $294 million, of which $185 million was used in connection with the construction of CDA’s plant, $57 million was used to complete the construction of OPC’s combined cycle plant, and $28 million was used to complete the acquisition of Colmito. The effects of these expenditures were partially offset by our receipt of proceeds in connection with the maturity of $74 million in time deposits.
Cash Flows Provided by Financing Activities
Cash inflows provided by our financing activities decreased by 85% to $47 million for 2014 from $320 million for 2013. This change was primarily driven by our receipt of long-term loans, the issuance of debentures, the receipt of short-term credit from banks and the payments made to IC.
During 2014, we received aggregate proceeds of $667 million from our issuance of long-term debt and $20 million from equity investments from certain of our partners, as follows:
| • | $319 million borrowed under the CDA Finance Facility; |
| • | $153 million borrowed under the Samay I Finance Facility; |
| • | $93 million borrowed under ICPI’s credit facility; |
| • | $43 million from the issuance of the COBEE bonds; |
| • | $25 million from the issuance of the CEPP bonds; |
| • | $23 million borrowed under Colmito’s credit facility; |
| • | $2 million borrowed under Tipitapa Power’s loan agreement; and |
| • | $20 million from the investment of Energía del Pacífico in Samay I. |
In addition, in 2014, we made payments of $300 million to IC, our former parent. In May 2014, we repaid $168 million of intercompany debt owed to IC. In June 2014, we repaid $95 million of capital notes owed to IC and declared and distributed dividends of $37 million to IC.
152
Table of Contents
During 2013, we received aggregate proceeds of $323 million from our issuance of long-term debt, $125 million from short-term borrowings and $28 million from equity investments from certain of our partners, as follows:
| • | $143 million borrowed under the CDA Finance Facility; |
| • | $163 million from the issuance of the Inkia bonds; |
| • | $17 million borrowed under the OPC financing agreement; |
| • | $125 million borrowed under Inkia’s short-term credit facility; and |
| • | $28 million from the investment of Energía del Pacífico in CDA. |
Cash flows from financing activities in 2014 and 2013 included the repayments of long-term loans and debentures of $111 million (excluding interest payments of $95 million) and $67 million (excluding interest payments of $60 million), respectively.
Tabular Disclosure of Contractual Obligations
The following table sets forth our contractual obligations and commercial commitments (including future interest payments) as of December 31, 2015, on a consolidated basis.
Payments Due by Period | ||||||||||||||||||||
Total | Less than | One to Three | Three to Five | More than | ||||||||||||||||
| ($ millions) | ||||||||||||||||||||
Credit from banks and others | $ | 187 | $ | 187 | $ | — | $ | — | $ | — | ||||||||||
Loans from banks and others, debentures, and lease agreements1 | 3,326 | 309 | 591 | 555 | 1,871 | |||||||||||||||
Trade payables | 144 | 144 | — | — | — | |||||||||||||||
Other payables and credit balances | 85 | 85 | — | — | — | |||||||||||||||
Purchase obligations2 | 3,608 | 260 | 559 | 594 | 2,195 | |||||||||||||||
Operating and maintenance agreements3 | 320 | 25 | 43 | 45 | 207 | |||||||||||||||
Obligations under EPC Contract Retirement4 | 66 | 66 | — | — | — | |||||||||||||||
|
|
|
|
|
|
|
|
|
| |||||||||||
Total contractual obligations and commitments | $ | 7,736 | $ | 1,076 | $ | 1,193 | $ | 1,194 | $ | 4,273 | ||||||||||
|
|
|
|
|
|
|
|
|
| |||||||||||
| 1. | Consists of estimated future payments of principal, interest and premium on loans from banks and others, debentures, and lease agreements, calculated based on interest rates and foreign exchange rates applicable as of December 31, 2015 and assuming that all amortization payments and payments at maturity on loans from banks and others, debentures, and lease agreements, will be made on their scheduled payment dates. Also includes the interest rate swaps relating to these obligations, which are calculated based on the LIBOR interest rate set forth in the applicable interest rate swap contract plus the applicable fixed spread. |
| 2. | Consists of purchase commitments for natural gas and gas transportation pursuant to binding obligations which include all significant terms, including fixed or minimum quantities to be purchased; fixed, minimum or variable price provisions; and the approximate timing of the transaction. Based upon the applicable purchase prices as of December 31, 2015. |
| 3. | Consists of future payments to be made under services contract with Siemens based on its projections of the hours of service of Kallpa’s turbines. |
| 4. | Consists of future payments to be made under EPC contract, assuming that all progress and completion payments will be made on their scheduled payment dates. |
Additionally, in connection with CDA’s entry into the CDA Finance Facility, we committed to make up to $44 million of additional contingent equity contributions in CDA (which represents our proportionate interest of the $59 million of additional contingent equity contributions requested by the lenders to CDA’s shareholders)
153
Table of Contents
to cover any additional costs in excess of CDA’s original $910 million budget. Our $44 million obligation is supported by a customary letter of credit. During 2015, we made equity contributions in an aggregate amount of $7 million in CDA, thereby reducing our additional contingent equity contributions commitment to $37 million.
Capital Expenditures
Development Projects During the Six Months Ended June 30, 2016 and the Year Ended December 31, 2015
In the six months ended June 30, 2016 and the year ended December 31, 2015, we spent $140 million and $441 million (in each case, excluding intracompany expenses related to services rendered by Kallpa pursuant to a management agreement), respectively, on capital expenditures relating to our assets which were in advanced stages of construction:
| • | Kanan’s thermal generation units, representing 92 MW of capacity, had an estimated development cost of $87 million (including $40 million of intercompany costs related to Kanan’s acquisition of the barges from two of our subsidiaries). The capital required for this project was sourced from a combination of cash generated from operating activities and cash generated by financing activities. As of December 31, 2015, Kanan had invested $80 million in the development of the barges. In April 2016, Kanan reached its COD, with a total development cost of $87 million. |
| • | Samay I, a cold-reserve open-cycle diesel and natural gas (dual-fired) thermoelectric plant in Mollendo, Arequipa (southern Peru), representing 616 MW of capacity (when operated with diesel fuel), had an estimated construction cost of $380 million. This project was financed by the Samay I Finance Facility, a $311 million seven-year syndicated secured loan agreement, which was obtained in December 2014, and equity contributions of $78 million. As of December 31, 2015, Samay I had invested $340 million in its development. Samay I reached COD in May 2016, with a total development cost of $379 million (excluding $26 million of diesel fuel inventory, which was financed with a short-term facility) and $311 million of total drawings under the Samay I Finance Facility (representing the full amount available under the facility). |
In July 2016, all four of Samay I’s units were declared unavailable to the system due to damage to the shafts in three of the plant’s four units. We have developed a plan to repair the units, and on August 28, 2016, Kenon announced that we expected all four units to be operational within six months. We intend to seek coverage for the costs of the outage, including repair costs and loss of profits, as appropriate, from the EPC contractor, equipment manufacturer and/or the insurance coverage (subject to deductibles), and believe we have a reasonable basis to recover these costs, including for loss of profits. For further information on Samay I’s unavailability, see “Business—Generation Segment—Peru—SamayI.” For further information on Samay I’s insurance, see “Business—Insurance.”
| • | CDA, a run-of-the-river hydroelectric plant on the Mantaro River in central Peru, representing 510 MW of installed capacity, had an estimated construction cost of approximately $959 million (comprised of CDA’s original $910 million budget and up to $59 million of additional contingent equity contributions requested by CDA’s lenders in connection with CDA’s entrance into the CDA Finance Facility). This project was financed by the CDA Finance Facility, a $591 million syndicated credit facility, which was obtained in 2012, and equity contributions of $328 million (including $10 million of additional contingent equity contributions), which contributions have already been made. As of June 30, 2016 and December 31, 2015, CDA had invested $907 million and $834 million in its development, respectively. As of June 30, 2016, CDA had drawn $591 million, representing the full amount available, under the CDA Finance Facility. |
154
Table of Contents
The three generating units of CDA reached COD in August 2016, at a total estimated development cost of approximately $959 million.
We anticipate that we will be required to spend approximately $92 million on capital expenditures relating to the CDA and AIE construction projects from June 30, 2016 until the end of 2016. We expect that we will meet our intended capital expenditures through a combination of cash generated from operating activities, cash generated by financing activities, including drawing down, or receiving disbursements from new debt financings, the refinancing of any existing indebtedness as it becomes due, and the use of proceeds raised in connection with this offering.
Development Projects During the Years Ended December 31, 2014 and 2013
In the year ended December 31, 2014, we spent $352 million on capital expenditures relating to our assets under construction, including:
| • | $85 million used in connection with the construction of Samay I. This project was financed by the Samay I Finance Facility, which provided $153 million, as well as equity contributions of $51 million from ICP and Energía del Pacífico, Samay I’s other shareholder. As of December 31, 2014, Samay I had invested $101 million in the development of this plant; and |
| • | $260 million used in connection with the construction of CDA’s plant. This project was also financed by the CDA Finance Facility, which provided $319 million. As of December 31, 2014, CDA had invested $633 million in the development of this plant. |
Kanan also invested $44 million in the development of its barges during the year ended December 31, 2014, which consisted of $40 million of intercompany costs related to Kanan’s acquisition of the barges from two of our subsidiaries and $4 million of intercompany interest expense.
In the year ended December 31, 2013, we spent $242 million on capital expenditures relating to our assets under construction, including:
| • | $185 million used in connection with the construction of CDA. This project was also financed by the CDA Finance Facility, which provided $143 million, as well as equity contributions of $28 million from Energía del Pacífico, CDA’s other shareholder. As of December 31, 2013, CDA had invested $361 million in the development of this plant; |
| • | $57 million related to OPC’s construction of its 440 MW combined cycle plant in Israel. This project was financed by the OPC Financing Agreement, which represented NIS 1,800 million (approximately $460 million), as well as equity contributions of NIS 315 million (approximately $87 million) and NIS 79 million (approximately $22 million) from ICP and Dalkia Israel Ltd., which was OPC’s other shareholder during this period, respectively. As of December 31, 2013, OPC had invested $508 million in the development of this plant. We completed the construction of OPC’s plant in July 2013 at a cost of $508 million; and |
| • | $2 million used in connection with the construction of Samay I. As of December 31, 2013, Samay I had invested $2 million in the development of this plant. |
155
Table of Contents
Potential Projects
We are constantly monitoring and considering development and acquisition opportunities and are currently assessing projects in Israel and various Latin American countries, such as in Argentina, Chile, Colombia, Panama, Peru, the Dominican Republic, Mexico, Nicaragua, El Salvador and Puerto Rico. For example, we are starting development of Agua Clara, a 50 MW wind project in the Dominican Republic, which is expected to commence commercial operations in early 2018. These potential projects range in size from small-scale power facilities (e.g., less than 40 MW) to large-scale power facilities (e.g., approximately 750 MW) and utilize different fuels and technologies, including natural gas, hydroelectric, wind, solar and stranded gas. In some instances, we have acquired land, secured necessary licenses or rights, including temporary concessions and water rights, commissioned studies, made bids, or initiated similar actions, in connection with our assessment of the viability of the relevant project. We are also considering acquiring companies and assets in power generation and related businesses (e.g., transmission and distribution companies or assets).
There is no guarantee that we will proceed with any such projects. Ultimately, notwithstanding the number of opportunities that we may consider over the long- and short-terms, we will only pursue those projects that we believe will generate attractive, risk-adjusted returns over the long-term and which we believe we have the management capacity to build and operate. In addition, in some cases, we may not obtain the relevant approval to develop a project. Furthermore, in many cases, we will need to win tenders, obtain additional rights, permits, licenses, land purchases and water rights and may need to negotiate with counterparties, or conduct valuations and environmental studies, each of which could take years to satisfy, or may not be satisfied at all.
We expect to finance our development and acquisition activity through a combination of cash generated by financing activities, in particular, the entry into new debt financings, which are generally stand-alone, secured, project-specific, and with no or limited recourse, cash generated from operating activities, and the proceeds raised in this offering.
Material Indebtedness
As of June 30, 2016, our total outstanding consolidated indebtedness (excluding the $220 million notes payable to Kenon (consisting of a $145 million and a $75 million note), of which the $75 million note was prepaid in October 2016, and the $145 million note is intended to be prepaid using the cash proceeds from this offering) was $2,943 million, consisting of $339 million of short-term indebtedness, including the current portion of long-term indebtedness, and $2,604 million of long-term indebtedness.
As of December 31, 2015, our total outstanding consolidated indebtedness was $2,565 million, consisting of $353 million of short-term indebtedness, including the current portion of long-term indebtedness, and $2,212 million of long-term indebtedness. We had no outstanding loans or notes owed to Kenon as of December 31, 2015.
Other than with respect to an aggregate of $589 million and $557 million of our outstanding indebtedness as of June 30, 2016 and December 31, 2015, respectively (representing some or all of the indebtedness of certain of our subsidiaries, including OPC, DEORSA, DEOCSA, ICPI and COBEE, among others), our outstanding consolidated indebtedness is primarily denominated in, indexed to, or the subject of interest rate swaps tied to, the U.S. Dollar. Additionally, AIE’s NIS 1 billion (approximately $261 million) loan agreement, entered into in July 2016, is not denominated in, indexed to, or the subject of interest rate swaps tied to, the U.S. Dollar.
The following table sets forth selected information regarding our principal outstanding short-term and long-term debt, as of June 30, 2016 and December 31, 2015. In May 2016, we, through OIP, our wholly-owned
156
Table of Contents
subsidiary, entered into a $100 million loan agreement, which we fully drew in August 2016. In addition, in August 2016, DEORSA and DEOCSA drew down $16 million and $24 million under the DEORSA syndicated loan facility and the DEOCSA syndicated loan facility, respectively. For further information on the additional financing agreements entered into since June 30, 2016, see “—Recent Developments.”
Outstanding 2016 | Outstanding Principal Amount as 2015 | Interest Rate | Final maturity | Amortization | ||||||||||||||
| ($ millions) | ||||||||||||||||||
ICP: | ||||||||||||||||||
Hapoalim | 12 | 12 | 1.25% | 2016 | Bullet payment at final maturity | |||||||||||||
ICPDH: | ||||||||||||||||||
ICPDH credit agreement | 119 | 117 | LIBOR+4.00% | December 2016 | Bullet payment at final maturity | |||||||||||||
Inkia: | ||||||||||||||||||
Inkia notes | 448 | 448 | 8.375% | April 2021 | Bullet payment at final maturity | |||||||||||||
OPC: | ||||||||||||||||||
Financing agreement1 | 373 | 377 | 2 | 4.85% - 5.36% | July 2031 | Quarterly principal payments commencing in 2013–maturity | ||||||||||||
IC Power Israel3: | ||||||||||||||||||
Tranche A | — | 41 | 4.85% - 7.75% | January 2016 | Bullet payment no later than final maturity | |||||||||||||
Tranche B | 54 | 55 | 7.75% | 2029 | Annual principal payments 2017–maturity | |||||||||||||
Cerro del Águila: | ||||||||||||||||||
Tranche A | 337 | 310 |
| LIBOR+4.25% - 5.50% |
| August 2024 | 33 quarterly principal payments commencing in August 2016 | |||||||||||
Tranche B | 181 | 167 | | LIBOR+4.25% - 6.25% | | August 2024 | Bullet payment at final maturity | |||||||||||
Tranche D1 | 42 | 38 |
| LIBOR+2.75% - 3.60% |
| August 2024 | 33 quarterly principal payments commencing in August 2016–maturity | |||||||||||
Tranche D2 | 22 | 21 | | LIBOR+2.75% - 3.60% | | August 2027 | 12 quarterly principal payments commencing in May 2024–maturity | |||||||||||
Samay I | 307 | 285 | | LIBOR+2.125% - 2.625% | | December 2021 | 29% principal in 23 quarterly payments commencing in July 2016–maturity 71% principal in bullet payment at final maturity | |||||||||||
Kallpa: | ||||||||||||||||||
Kallpa I lease | — | 2 | LIBOR+3.00% | March 2016 | Monthly principal payments to maturity | |||||||||||||
Kallpa II lease4 | — | 29 | LIBOR+2.05% | December 2017 | Monthly principal payments to maturity | |||||||||||||
Kallpa III lease4 | — | 38 | 7.57% | July 2018 | Monthly principal payments to maturity | |||||||||||||
Las Flores lease | 91 | 94 | 7.15% | October 2023 | Quarterly principal payments to maturity | |||||||||||||
Kallpa bonds due 20224 | — | 149 | 8.50% | May 2022 | Between 0.25 and 5.00% of principal payable on a quarterly basis commencing in May 2013–maturity | |||||||||||||
Kallpa syndicated loan4 | — | 59 | LIBOR+6.00% | October 2019 | Monthly principal payments January 2013–maturity | |||||||||||||
Kallpa bonds due 2026 | 325 | — | 4.875% | May 2026 | Bullet payment at final maturity | |||||||||||||
COBEE: | ||||||||||||||||||
COBEE IIIbonds5 | 21 | 23 | 6 | Various | Various | Four annual principal payments commencing in February 2017 | ||||||||||||
157
Table of Contents
Outstanding 2016 | Outstanding Principal | Interest Rate | Final maturity | Amortization | ||||||||||
| ($ millions) | ||||||||||||||
COBEE IVbonds7 | 42 | 42 | Various | Various | Series A: bullet payment at final maturity Series B: 4 semi-annual principal payments commencing in July 2018 Series C: 8 semi-annual principal payments commencing in July 2020 | |||||||||
CEPP: | ||||||||||||||
CEPP bonds | 10 | 10 | 6.00% | January-March 2019 | Bullet payment at final maturity | |||||||||
Central Cardones: | ||||||||||||||
Tranche 1 | 24 | 26 | LIBOR+1.90% | August 2021 | 24 semi-annual principal payments to maturity | |||||||||
Tranche 2 | 16 | 18 | LIBOR+2.75% | February 2017 | Bullet payment at final maturity | |||||||||
Colmito: | ||||||||||||||
Banco Bice | 17 | 16 | 7.9% | December 2028 | Semi-annual principal payments to maturity | |||||||||
JPPC: | ||||||||||||||
Royal Bank of Canada | 2 | 4 | LIBOR+5.5% | March 2017 | Quarterly principal payments to maturity | |||||||||
Burmeister & Wain Scandinavian Contractor | 1 | 1 | 3.59% | August 2018 | Monthly principal payments to maturity | |||||||||
ICPNH: | ||||||||||||||
Amayo I | 45 | 47 | Various | February 2023 | Quarterly principal payments to maturity | |||||||||
Amayo II | 32 | 34 | Various | September 2025 | Quarterly principal payments to maturity | |||||||||
Tipitapa Power | 7 | 9 | 8.35% | November 2018 | Quarterly principal payments to maturity | |||||||||
Corinto | 8 | 9 | 8.35% | December 2018 | Quarterly principal payments to maturity | |||||||||
Puerto Quetzal: | ||||||||||||||
Banco Industrial | 13 | 15 | LIBOR+4.5% | September 2019 | Quarterly principal payments to maturity | |||||||||
Surpetroil: | ||||||||||||||
Surpetroil leases | 1 | 1 | Various | 2015-2017 | Monthly principal payments to maturity | |||||||||
Veolia Energy Israel Ltd. Capital Note | — | 5 | — | 2016-2019 | This capital note has no amortization schedule | |||||||||
Kanan: | ||||||||||||||
Kanan Credit Facility | 54 | — | LIBOR+3.00% | March 2021 | Quarterly principal payments to maturity | |||||||||
DEORSA: | ||||||||||||||
Syndicated loan | 103 | 8 | — | Various | 2021-2025 | Quarterly principal payments to maturity | ||||||||
DEOCSA: | ||||||||||||||
Syndicated loan | 159 | 9 | — | Various | 2021-2025 | Quarterly principal payments to maturity | ||||||||
RECSA: | ||||||||||||||
Banco G&T Continental | 3 | — | 7% | 2020 | Annual principal payments to maturity | |||||||||
Short Term Loans from Banks | 74 | 62 | Various | 2016 | These loans have no amortization schedule | |||||||||
|
|
|
| |||||||||||
Total | 2,943 | 2,565 | ||||||||||||
|
|
|
| |||||||||||
| 1. | The consortium includes Bank Leumi Le-Israel B.M. and institutional entities from the following groups: Clal Insurance Company Ltd.; Amitim Senior Pension Funds; Phoenix Insurance Company Ltd.; and Harel Insurance Company Ltd. |
| 2. | Represents NIS 1,469 million converted into U.S. Dollars at the exchange rate for New Israeli Shekels into U.S. Dollars of NIS 3,902 to $1.00. All debt has been issued in Israeli currency (NIS) linked to CPI. |
158
Table of Contents
| 3. | The mezzanine financing agreement also includes a Tranche C, pursuant to which up to NIS 350 million, at an interest rate of 11% per annum, may be drawn, subject to certain conditions, and only to cover shortfall amounts. No Tranche C debt was outstanding under this facility as of December 31, 2015. |
| 4. | Repaid in full in May 2016 in connection with Kallpa’s issuance of its $350 million 4.875% senior unsecured notes due May 24, 2026. For further information on this issuance, see “—Kallpa BondsDue 2026.” |
| 5. | Represents $3.5 million of 6.50% notes due 2017, $5.0 million of 6.75% notes due 2017, Bs.44.2 million ($6.3 million) of 9.00% notes due 2020, and Bs.42.9 million ($6.2 million) of 7.00% notes due 2022. |
| 6. | Includes Bs.44.2 million ($6.3 million), the aggregate principal amount outstanding of COBEE’s 9.00% notes due 2020 as of December 31, 2015, and Bs.42.9 million ($6.2 million), the aggregate principal amount outstanding of COBEE’s 7.00% notes due 2022, in each case converted into U.S. Dollars at the exchange rate for Bolivianos into U.S. Dollars of Bs.6.96 to $1.00 as reported by the Bolivian Central Bank (Banco Central de Bolivia) on December 31, 2015. Includes premium of $2 million. |
| 7. | Represents $4.0 million of 6.0% notes due 2018, $4.0 million of 7.0% notes due 2020, Bs.84 million ($12.1 million) of 7.8% notes due 2024, $5.0 million of 6.70% notes due 2019 and Bs.105 million ($15.1 million) of 7.8% notes due 2024. Includes premium of $2 million. |
| 8. | Includes 246 million Guatemalan Quetzales, the aggregate principal amount of Guatemalan Quetzales-denominated loans outstanding under the syndicated loan facility, converted into U.S. Dollars at the exchange rate for Guatemalan Quetzales into U.S. Dollars of 7.64 to $1.00 as reported by the Central Bank of Guatemala on June 30, 2016. |
| 9. | Includes 339 million Guatemalan Quetzales, the aggregate principal amount of Guatemalan Quetzales-denominated loans outstanding under the syndicated loan facility, converted into U.S. Dollars at the exchange rate for Guatemalan Quetzales into U.S. Dollars of 7.64 to $1.00 as reported by the Central Bank of Guatemala on June 30, 2016. |
Some of the debt instruments to which our operating companies are party require that Inkia, Kallpa, OPC, COBEE, CEPP and JPPC comply with financial covenants, semi-annually or quarterly. For further information, see Note 14 to our audited financial statements included in this prospectus. Under each of these debt instruments, the creditor has the right to accelerate the debt or restrict the company from declaring and paying dividends if, at the end of any applicable period the applicable entity is not in compliance with the defined financial covenants ratios.
The instruments governing a substantial portion of the indebtedness of our operating companies contain clauses that would prohibit these companies from paying dividends or making other distributions in the event that the relevant entity was in default on its obligations under the relevant instrument.
As of December 31, 2015, substantially all of the assets of Kallpa, other than the Kallpa I, Kallpa II, Kallpa III and Las Flores turbines, which were under leasing agreements with financial institutions, were mortgaged or pledged as security for the financing agreements to which Kallpa is a party. As set forth below, in March and May 2016, the leases in respect of the Kallpa I, Kallpa II and Kallpa III turbines were repaid in full. The only asset that remains pledged pursuant to a leasing agreement is the Las Flores plant.
In addition, all of the assets of Kanan have been pledged as security for the credit facility to which Kanan is a party.
We have entered into hedging arrangements with respect to a portion of our long term debt, swapping variable interest for fixed rate interest. For further information on our hedging arrangements, see Note 29 to our audited financial statements included in this prospectus.
Inkia Notes
In April 2011, Inkia issued and sold $300 million aggregate principal amount of its 8.375% Senior Notes due 2021, which are listed on the Global Exchange Market of the Irish Stock Exchange. Interest on these notes is payable semi-annually in arrears in April and October of each year and these notes mature in April 2021. Inkia used the net proceeds of the sale of these notes to finance a portion of its equity contributions to CDA, to repurchase all of its secured indebtedness, and for working capital and general corporate purposes.
In September 2013, Inkia issued and sold $150 million aggregate principal amount of its 8.375% Senior Notes due 2021, which constituted additional notes under the indenture governing the 8.375% Senior Notes due 2021 issued in 2011. Inkia used the net proceeds of the sale of these notes to fund its projects under construction, both through greenfield projects and acquisitions, and for working capital and general corporate purposes.
In September 2014, Inkia received the requisite consents necessary to amend the indenture governing its 8.375% Senior Notes due 2021 in connection with (1) the contribution by Inkia’s former parent company, IC, of
159
Table of Contents
certain of its businesses and associated companies, including Inkia, to Kenon, thereby permitting the spin-off of Kenon from IC in January 2015 without requiring a change of control offer to be made to holders of the notes, and (2) the sale by Inkia of all its equity interests in Acter Holdings, which indirectly held all of Inkia’s equity interest in Edegel, to Enersis S.A. and the repayment of certain indebtedness in connection therewith, which amended the asset sale covenant to require that Inkia apply the net proceeds received from such sale within 30 months of Inkia’s receipt of such net proceeds (i.e., prior to March 2017).
As of June 30, 2016 and December 31, 2015, the aggregate principal amount outstanding under these notes was $457 million ($448 million net of transaction costs) and $457 million ($448 million net of transaction costs), respectively.
OPC Financing Agreement
In January 2011, OPC entered into a financing agreement with a consortium of lenders led by Bank Leumi LeIsrael Ltd., or Bank Leumi, for the financing of its power plant project. As part of the financing agreement, the lenders committed to provide OPC a long-term credit facility (including a facility for variances in the construction costs), a working capital facility, and a facility for financing the debt service, in the overall amount of NIS 1,800 million (approximately $460 million). As part of the financing agreement, certain restrictions were provided with respect to distributions of dividends and repayments of shareholders’ loans, commencing from the third year after the completion of OPC’s power plant. In October 2015, OPC and the consortium of lenders agreed to shorten the “lock-up period” (which restricted the payment of dividends and any type of distributions until the third anniversary of the completion of the OPC plant’s construction) from December 31, 2016 to June 30, 2015. The loans are CPI-linked and are repayable on a quarterly basis beginning in the fourth quarter of 2013 until 2031.
We have provided a guarantee to the lending consortium and hold cash collateral available for the benefit of the lending consortium. As of June 30, 2016 and December 31, 2015, the outstanding amount of the loan is NIS 1,435 million (approximately $373 million) and NIS 1,469 million (approximately $377 million), respectively.
ICPDH Credit Agreement
In December 2015, we, through our subsidiary ICPDH entered into a credit agreement with Credit Suisse AG for $120 million to finance our acquisition of Energuate and two smaller, related companies. The loan is guaranteed by Inkia and fully secured by a pledge provided by ICPDH, which indirectly holds our interests in Energuate, RECSA and Guatemel. The pledged property includes ICPDH’s indirect equity interests in Energuate, RECSA and Guatemel.
The loan will accrue interest at a rate per annum of LIBOR + 4.00% and matures on December 29, 2016. We fully drew down this facility in connection with the completion of our acquisition of Energuate, RECSA and Guatemel. As of June 30, 2016 and December 31, 2015, the aggregate principal amount outstanding under this facility was $120 million ($119 million net of transaction costs) and $120 million ($117 million net of transaction costs), respectively.
The net proceeds that we receive in this offering will not be used to repay amounts owed under this credit agreement.
ICPI Mezzanine Financing Agreement
In June 2014, we, through our subsidiary ICPI, entered into a mezzanine financing agreement for NIS 350 million (approximately $93 million) to repay capital notes owed to IC. The agreement was entered into with Mivtachim the Workers Social Insurance Fund and Makefet Fund Pension and Provident Center. The loan is secured by all of ICPI’s assets (excluding the assets that are pledged to secure certain senior debt) and the free
160
Table of Contents
cash flow deriving from OPC and is composed of three facilities: Facility A for NIS 150 million (approximately $40 million) (which was fully repaid in January 2016), Facility B for NIS 200 million (approximately $53 million), and Facility C (only to cover shortfall amounts) for NIS 350 million (approximately $93 million). Facility C has not been used. All facilities are CPI-linked.
The principal of Facility B Loan will bear interest at a rate of 7.75% per year and accrue annually. Principal and any linkage differentials thereon shall be paid in consecutive equal annual installments until March 31, 2029, commencing on the earlier of: (1) the final maturity date of Facility A and (2) the first anniversary after the end of OPC’s “lock-up period.” As of June 30, 2016 and December 31, 2015, the aggregate principal amount outstanding under these facilities was $54 million and $97 million, respectively.
CDA Finance Facility
In August 2012, CDA, as borrower, Sumitomo Mitsui Banking Corporation, as administrative agent, certain financial institutions, as lenders, and other parties thereto, entered into a senior secured syndicated credit facility in an aggregate principal amount not to exceed $591 million to finance the construction of CDA’s plant. Loans under this facility were disbursed in three tranches.
Tranche A loans under this facility, in an aggregate principal amount of up to $342 million, initially bear interest at the rate of LIBOR plus 4.25% per annum, increasing over time beginning on the date after the interest payment date occurring after August 2017 to LIBOR plus 5.50% per annum. Principal of the Tranche A loans will be payable in 33 quarterly installments commencing on the first quarterly payment date occurring after the project acceptance by CDA. Tranche A loans will be guaranteed by Corporación Financiera de Desarollo S.A., or COFIDE.
Tranche B loans under this facility, in an aggregate principal amount of up to $184 million, initially bear interest at the rate of LIBOR plus 4.25% per annum, increasing over time beginning on the date after the interest payment date occurring after August 2017 to LIBOR plus 6.25% per annum. Principal of the Tranche B loans will be payable in August 2024. Tranche B loans will be will be guaranteed by COFIDE.
Tranche D loans under this facility, in an aggregate principal amount of up to $65 million, initially bear interest at the rate of LIBOR plus 2.75% per annum, increasing over time beginning on the date after the interest payment date occurring after August 2017 to LIBOR plus 3.60% per annum. Principal of the Tranche D loans will be payable in 45 quarterly installments commencing on the first quarterly payment date occurring after the project acceptance by CDA. Tranche D loans will be secured by a credit insurance policy provided by SACE S.p.A.—Servizi Assicurativi del Commercio Estero.
All loans under this facility are secured by:
| • | pledges of CDA’s movable assets and offshore and onshore collateral accounts; |
| • | a pledge of 100% of the equity interests in CDA; |
| • | mortgages of the CDA plant and CDA’s generation and transmission concessions; |
| • | a collateral assignment of insurances and reinsurances in respect of CDA; and |
| • | a conditional assignment of CDA’s rights under certain contracts, including the CDA EPC contract and CDA’s PPAs. |
In connection with the January 2015 spin-off of Kenon from IC, we replaced the guarantee previously provided by IC to the syndicate of lenders with a guarantee from IC Power to the syndicate of lenders. As of June 30, 2016 and December 31, 2015, the aggregate principal amount outstanding under this facility was $591 million and $547 million ($536 million net of transaction costs), respectively.
161
Table of Contents
Samay I Finance Facility
In December 2014, Samay I entered into a $311 million, seven-year syndicated secured loan agreement with a syndicate including The Bank of Tokyo-Mitsubishi, as administrative agent, and certain financial institutions, as lenders, and other parties thereto, or the Samay I Finance Facility, to build an open-cycle diesel and natural gas (dual-fired) thermoelectric plant in Mollendo, Arequipa (southern Peru), with an installed capacity of approximately 616 MW. The loan will initially bear interest at a rate of LIBOR plus 2.125% per annum, increasing to LIBOR plus 2.375% per annum beginning on the date after the interest payment date occurring at the end of 2017 and increasing further to LIBOR plus 2.625% per annum from the date after the interest payment date occurring at the end of 2020 through maturity; 29% of the total principal is payable in 23 quarterly payments commencing in July 2016; the other 71% of the total principal is payable at maturity. As of June 30, 2016 and December 31, 2015, the aggregate principal amount outstanding under this facility was $311 million ($307 million net of transaction costs) and $291 million ($285 million net of transaction costs), respectively. Loans under this facility are secured by pledges of Samay I’s movable assets and onshore collateral accounts; a pledge over 100% of the equity interests in Samay I; mortgages of the Samay I real estate property, plant and generation and transmission concessions; collateral assignments of insurances and reinsurances in respect of Samay I; a conditional assignment of Samay I rights under certain contracts, including Samay I’s EPC contract; and trust agreement over certain cash flows of Samay I.
Kallpa Leases
In March 2006, Kallpa entered into separate capital lease agreements with Citibank del Perú, Citileasing and Banco de Crédito del Perú, each amended in November 2006, December 2007 and July 2008, followed by a leaseback agreement with Citibank del Perú in April 2007, amended in December 2007 and July 2008, under which the lessors provided financing for the construction of the Kallpa I facility in an aggregate amount of $56 million. Under these lease agreements, Kallpa made monthly payments to the lessors through the expiration of these leases in March 2016. In March 2016, upon expiration of these leases, Kallpa executed its option to purchase the property related to the Kallpa I plant for a nominal cost. These leases were secured by substantially all of the assets of Kallpa, including Kallpa’s sales under its PPAs.
In December 2007, Kallpa entered into a capital lease agreement with Banco de Crédito del Perú under which the lessor provided a total amount of approximately $82 million for the construction of the Kallpa II turbine. Under this lease agreement, Kallpa made aggregate monthly payments to the lessors through the expiration of this lease in December 2017. Upon expiration of this lease, Kallpa has an option to purchase the property related to the Kallpa II plant for a nominal cost. This lease was secured by substantially all of the assets of Kallpa, including Kallpa’s sales under its PPAs.
In October 2008, Kallpa entered into a capital lease agreement with Scotiabank Perú under which the lessor provided financing for the construction of the Kallpa III turbine in an aggregate amount of $88 million. Under this lease agreement, Kallpa made monthly payments to the lessors through the expiration of this lease in July 2018. Upon expiration of this lease, Kallpa had an option to purchase the property related to the Kallpa III plant for a nominal cost. This lease was secured by substantially all of the assets of Kallpa, including Kallpa’s sales under its PPAs.
In April 2014, Kallpa entered into a capital lease agreement with Banco de Crédito del Perú under which the lessor provided financing for the acquisition of Las Flores from Duke Energy Corp. in an aggregate amount of $108 million. Under this lease agreement, Kallpa will make quarterly payments to the lessors through the expiration of this lease in October 2023.
As of June 30, 2016 and December 31, 2015, the aggregate principal amount outstanding under the Kallpa leases was $91 million and $163 million, respectively.
162
Table of Contents
In May 2016, in connection with Kallpa’s issuance of its $350 million 4.875% senior unsecured notes due May 2026, Kallpa repaid the $27 million outstanding under the Kallpa II lease in full and repaid the $35 million outstanding under the Kallpa III lease in full. Accordingly, of the leases discussed above, only the Las Flores lease agreement remains outstanding.
Kallpa Bonds Due 2022
In November 2009, Kallpa issued $172 million aggregate principal amount of its 8.50% bonds due 2022. Holders of these bonds were required to make subscription payments under a defined payment schedule during the 21 months following the date of issue. Kallpa received proceeds of these bonds in the aggregate amount of $19 million, $36 million and $117 million in 2009, 2010 and 2011, respectively. The proceeds of these bonds were used for capital expenditures related to Kallpa’s conversion of its open-cycle turbines to a combined-cycle plant. Interest on these bonds is payable quarterly. Principal amortization payments under these bonds in amounts varying between 0.25% and 5.00% of the outstanding principal amount of these bonds commenced in May 2013. These bonds were secured by Kallpa’s combined-cycle plant and substantially all of Kallpa’s other assets, including Kallpa’s sales under its PPAs. As of December 31, 2015, the aggregate principal amount outstanding under these bonds was $149 million.
In May 2016, in connection with Kallpa’s issuance of its $350 million 4.875% senior unsecured notes due May 2026, Kallpa repaid the outstanding amounts under the bonds ($143 million).
Kallpa Syndicated Loan
In November 2009, Kallpa entered into a secured credit agreement with The Bank of Nova Scotia, Banco de Crédito del Perú and German Investment and Development Corporation (DEG) in the aggregate amount of $105 million to finance capital expenditures related to Kallpa’s combined-cycle plant. The loans under this credit agreement were secured by Kallpa’s combined-cycle plant and substantially all of Kallpa’s other assets, including Kallpa’s sales under its PPAs. The loans under this credit agreement bore interest payable monthly in arrears at a rate of LIBOR plus a margin of 5.50% per annum through November 2012, 5.75% per annum from November 2012 through November 2015 and 6.00% from November 2015 through maturity in October 2019. Scheduled amortizations of principal were payable monthly commencing in January 2013 through maturity in October 2019. As of December 31, 2015, the aggregate principal amount outstanding under these loans was $59 million.
In May 2016, in connection with Kallpa’s issuance of its $350 million 4.875% senior unsecured notes due May 2026, Kallpa repaid the $54 million outstanding under the syndicated loan in full.
Kallpa Bonds Due 2026
In May 2016, Kallpa issued $350 million 4.875% senior unsecured notes due May 24, 2026. The proceeds of the notes were principally used to repay all of Kallpa’s outstanding debt in May 2016, other than debt relating to the Las Flores lease. The remainder of the proceeds were used for general corporate purposes. Interest will accrue on the notes from May 24, 2016 and will be payable on May 24 and November 24 of each year, beginning on November 24, 2016. Principal will be fully paid at maturity.
As of June 30, 2016, the outstanding amount of these notes was $325 million (net of transaction costs).
COBEE Bonds
COBEE III Bonds. In February 2010, COBEE approved a bond program under which COBEE is permitted to offer bonds in aggregate principal amount of up to $40 million in multiple series. In March 2010, COBEE issued and sold three series of notes in the aggregate principal amount of $14 million. The aggregate gross proceeds of these notes, which were issued at a premium, were $17 million. COBEE will amortize the premium of these notes over the respective terms of these notes, reducing the interest expense related to these notes. The Series A Notes, in the aggregate principal amount of $4 million pay interest semi-annually at the rate of 5.00% per annum through maturity in February 2014. Principal on these notes is payable at maturity. The Series B Notes, in the aggregate principal amount of $4 million, pay interest semi-annually at the rate of
163
Table of Contents
6.50% per annum through maturity in February 2017. Principal on these notes will be paid in two equal annual installments commencing in February 2016. The Series C Notes, in the principal amount of Bs.44.2 million (approximately $6 million), pay interest semi-annually at the rate of 9.00% per annum through maturity in January 2020. Principal on these notes will be paid in four equal annual installments commencing in February 2017.
In April 2012, COBEE issued and sold two additional series of notes in the aggregate principal amount of $11 million. The aggregate gross proceeds of these notes, which were issued at a premium, were $13 million. We will amortize the premium of these notes over the respective terms of these notes, reducing the interest expense related to these notes. The first series of these notes, in the aggregate principal amount of $5 million pays interest semi-annually at the rate of 6.75% per annum through maturity in March 2017. Principal on these notes is payable at maturity. The second series of these notes, in the aggregate principal amount of Bs.43 million (approximately $6 million), pays interest semi-annually at the rate of 7% per annum through maturity in February 2022. As of June 30, 2016 and December 31, 2015, the outstanding amount of these notes was $21 million and $23 million (including a $2 million premium), respectively.
COBEE IV Bonds. In May 2013, COBEE approved a bond program under which COBEE is permitted to offer bonds in aggregate principal amount of up to $60 million in multiple series. In February 2014, COBEE issued and sold three series of notes in the aggregate principal amount of $20 million. The aggregate gross proceeds of these notes, which were issued at a premium, were $21 million. The Series A Notes, in the aggregate principal amount of $4 million pay interest semi-annually at the rate of 6.0% per annum through maturity in January 2018. Principal on the Series A Notes is payable at maturity. The Series B Notes, in the aggregate principal amount of $4 million pay interest semi-annually at the rate of 7.0% per annum through maturity in January 2020. Principal on the Series B Notes will be paid in four equal semi-annual installments commencing in July 2018. The Series C Notes, in the aggregate principal amount of Bs. 84 million (approximately $12 million) pay interest semi-annually at the rate of 7.8% per annum through maturity in January 2024. Principal on the Series C Notes will be paid in eight semi-annual installments commencing in July 2020.
In November 2014, COBEE issued and sold two series of notes in the aggregate principal amount of $20 million. The aggregate gross proceeds of these notes, which were issued at a premium, were $22 million. The first series of these notes, in the aggregate principal amount of $5 million, pays interest semi-annually at the rate of 6.70% per annum through maturity in October 2019. The second series of these notes in the aggregate principal amount of Bs.105 million (approximately $15 million), pays interest semi-annually at the rate of 7.80% per annum through maturity in October 2024. As of June 30, 2016 and December 31, 2015, the outstanding amount of these notes was $42 million (including $2 million premium) and $42 million (including a $2 million premium), respectively.
CEPP Bonds
In December 2010, CEPP approved a program bond offering under which CEPP is permitted to offer bonds in aggregate principal amount of up to $25 million in multiple series. In 2011 and 2010, CEPP issued and sold $20 million and $5 million of its 7.75% bonds due in 2013 and 2014. CEPP used the proceeds of this offering to finance its continuing operations and repay intercompany debt. Interest on these bonds was payable monthly and principal of these bonds was due at maturity in May 2014. During the first quarter of 2014, CEPP issued $25 million of its 6.00% bonds due in January and March 2019. Part of these funds were used to prepay $15 million of its 7.75% bonds outstanding due in May 2014. As of June 30, 2016 and December 31, 2015, the aggregate principal amount outstanding under these bonds was $10 million and $10 million, respectively.
Central Cardones
In connection with our acquisition of Central Cardones in December 2011, we consolidated the amounts outstanding under Central Cardones’ credit agreement entered with Banco de Crédito e Inversiones and Banco Itaú Chile. The loans under this credit agreement were issued in two tranches of $37 million and $21 million, respectively. Loans under the first tranche bear interest at the rate of LIBOR plus 1.9% per annum, and the principal of this tranche is payable in 24 semi-annual installments through maturity in August 2021. Loans under
164
Table of Contents
the second tranche bear interest at the rate of LIBOR plus 2.75% per annum, interest is payable semi-annually, and the loan matures in February 2017. As of June 30, 2016 and December 31, 2015, the aggregate principal amount outstanding under these loans was $40 million and $44 million, respectively.
Colmito
In January 2014, Colmito entered into a 12,579 million Chilean pesos (approximately $23 million)14-year credit agreement with Banco Bice. The loan under this facility bears interest at a rate of 7.9% Chilean pesos per annum and is paid semi-annually through maturity in December 2028. Principal on this facility is payable semi-annually. In February 2014, Colmito entered into a cross-currency swap closing at a fixed interest rate of 6.025% in U.S. Dollars. As of June 30, 2016 and December 31, 2015, the aggregate principal amount outstanding under this loan was 11,699 million Chilean pesos (approximately $17 million) and 11,887 million Chilean pesos (approximately $16 million), respectively.
JPPC
In March 2012, JPPC entered into a five-year $21 million syndicated loan agreement with RBC Royal Bank (Trinidad and Tobago) Limited, RBC Royal Bank (Jamaica) Limited and RBC Merchant Bank (Caribbean) Limited. The loan under this facility bears interest at a rate of LIBOR + 5.5% per annum and is payable in quarterly installments. Principal on this facility is payable in quarterly payments. JPPC entered into an interest rate swap contract to fix its interest at a rate of 6.46% per annum. As of June 30, 2016 and December 31, 2015, the aggregate principal amount outstanding under this loan was $2 million (excluding transaction costs) and $4 million (excluding transaction costs), respectively.
ICPNH
In October 2007, Amayo I entered into a 15-year $71 million loan agreement with Banco Centroamericano de Integración Económica, or CABEI. The term loan is secured by a first degree mortgage over all of the improvements executed on Amayo I’s project site, cessation of all of the project contracts, and the creation and maintenance of a reserve account for $2 million, to be controlled by CABEI. The loans under this facility bear interest at a rate of 8.45% or LIBOR + 4.00% per annum and are payable in quarterly installments.
In November 2010, Amayo II entered into a 15-year $45 million syndicated loan agreement with Nederlandse Financierings-Maatschappij Voor Ontwikkelingslanden N.V. (FMO) and CABEI. The syndicated loan is secured by a first and second lien mortgage agreement, a first and second lien industrial pledge agreement, and a first and second lien contract pledge agreement. The loans under this facility bears interest at a rate of 10.76% (Mezzanine Loan), 8.53% (FMO Senior Loan) and a variable interest rate of LIBOR + 5.75% per annum and are payable in quarterly installments.
In November 2013 and November 2014, Tipitapa Power entered into a five-year $7 million loan agreement and a four-year $5 million loan agreement, respectively, with Banco de América Central, or BAC. The term loans are secured by a commercial lien, industrial lien and a mortgage on the property. The loans under this facility bear interest at a rate of 8.35% and are payable in quarterly installments.
In December 2013, Corinto entered into a five-year $15 million loan agreement with BAC. The term loan is secured by a commercial lien and a mortgage on the barge Margarita II. The loan under this facility bears interest at a rate of 8.35% and is payable in quarterly installments.
As of June 30, 2016 and December 31, 2015, the aggregate principal amount outstanding under these loans was $92 million and $99 million, respectively.
165
Table of Contents
Kanan Credit Facility
In May 2016, Kanan entered into a $55 million credit facility due 2021, or the Kanan Credit Facility. The Kanan Credit Facility replaced a short-term bridge loan from the Bank of Nova Scotia, which Kanan entered into in January 2016 to repay $50 million of an intercompany loan, reimburse costs and expenses incurred in connection with the Kanan project and purchase fuel, raw materials and other expenses. The Kanan Credit Facility bears interest on a quarterly basis at LIBOR + 3.00%. Scheduled amortizations of principal are payable quarterly commencing in June 2016 through maturity in March 2021. The Kanan Credit Facility is secured by all of Kanan’s assets. As of June 30, 2016, the outstanding amount of the Kanan Credit Facility is $54 million.
DEORSA Syndicated Loan Facility
In May 2011, DEORSA entered into a $90 million, 10-year syndicated secured loan agreement with a syndicate including Banco Agromercantil de Guatemala, S.A., as the manager of the guarantee and administrative agent, and certain financial institutions, as lenders, and other parties thereto, to finance the acquisition of DEORSA by its prior owner, to refinance DEORSA’s existing indebtedness as of the closing date of the acquisition, and to finance DEORSA’s working capital requirements. Loans under this loan agreement are secured by a pledge over DEORSA’s shares and a $41 million guarantee from DEORSA. The U.S. Dollar-denominated loans under this agreement bear interest at a fixed rate of 6.00% for the first two years and at a rate of 90-day US LIBOR plus 4.70% per annum through maturity on May 19, 2021. Guatemalan Quetzales-denominated loans under this agreement bear interest at a variable interest rate calculated by the weighted average rate (TASA Activa Promedio Ponderada), as published by the Guatemalan Central Bank (Banco deGuatemala) for the most recent date as of the first day of the relevant interest period, less 5.6%, per annum. Scheduled amortizations of the aggregate principal amount outstanding under this agreement (generally 2.81%) are payable in quarterly installments through maturity.
In April 2015, the loan agreement was amended and restated and, in accordance therewith, the amounts available under the facility were increased by $21 million to fund, among other things, DEORSA’s operating and investment activities, repayment of certain outstanding indebtedness, and general corporate purposes. The additional $21 million facility is also secured by pledged collateral and a $9 million guarantee from DEORSA. The U.S. Dollar-denominated loans under the additional facility bear interest at a rate of 90-day US LIBOR plus 4.70% per annum (with a floor rate of 5.90%) for the first year and at a rate of 90-day US LIBOR plus 4.75% per annum (with a floor rate of 6.0%) through maturity on February 19, 2025. Guatemalan Quetzales-denominated loans under the additional facility bears interest at a variable interest rate calculated by the weighted average rate (TASA Activa Promedio Ponderada), as published by the Guatemalan Central Bank for the most recent date as of the first day of the relevant interest period, less 6.10%, per annum. Scheduled amortizations of the aggregate principal amount outstanding under the additional facility are payable in quarterly installments commencing in May 2018 through maturity.
As of June 30, 2016 and December 31, 2015 (which date was prior to our acquisition of DEORSA), the aggregate principal amount outstanding under the syndicated loan facility was $103 million and $112 million, respectively.
In August 2016, DEORSA drew down an additional $16 million under the DEORSA syndicated loan facility in order to make payments to the SAT in connection with tax claims raised by the SAT against Energuate in July 2016. For further information on the Energuate tax claims, see “Business—Legal Proceedings—Energuate Tax Claims.”
DEOCSA Syndicated Loan Facility
In May 2011, DEOCSA entered into a $150 million, 10-year syndicated secured loan agreement with a syndicate including Banco Agromercantil de Guatemala, S.A., as the manager of the guarantee and
166
Table of Contents
administrative agent, and certain financial institutions, as lenders, and other parties thereto, to finance the acquisition of DEOCSA by its previous owner, to refinance DEOCSA’s existing indebtedness as of the closing date of the acquisition, and to finance DEOCSA’s working capital requirements. Loans under this loan agreement are secured by a pledge over DEOCSA’s shares and a $55 million guarantee from DEOCSA. The U.S. Dollar-denominated loans under this agreement bear interest at a fixed rate of 6.00% for the first two years and at a rate of 90-day US LIBOR plus 4.70% per annum through maturity on May 19, 2021. Guatemalan Quetzales-denominated loans under this agreement bear interest at a variable interest rate calculated by the weighted average rate (TASA Activa Promedio Ponderada), as published by the Guatemalan Central Bank for the most recent date as of the first day of the relevant interest period, less 5.6%, per annum. Scheduled amortizations of the aggregate principal amount outstanding under this agreement (generally 2.81%) are payable in quarterly installments through maturity.
In April 2015, the loan agreement was amended and restated and, in accordance therewith, the amounts available under the facility were increased by $32 million to fund, among other things, DEOCSA’s operating and investment activities, repayment of certain outstanding indebtedness, and general corporate purposes. The additional $32 million facility is also secured by pledged collateral and a 105 thousand Guatemalan Quetzales (approximately $14 thousand) guarantee from DEOCSA. The U.S. Dollar-denominated loans under the additional facility bears interest at a rate of 90-day US LIBOR plus 4.70% per annum (with a floor rate of 5.90%) for the first year and at a rate of 90-day US LIBOR plus 4.75% per annum (with a floor rate of 6.0%) through maturity on February 19, 2025. Guatemalan Quetzales-denominated loans under the additional facility bear interest at a variable interest rate calculated by the weighted average rate (TASA Activa Promedio Ponderada), as published by the Guatemalan Central Bank) for the most recent date as of the first day of the relevant interest period, less 6.10%, per annum. Scheduled amortizations of the aggregate principal amount outstanding under the additional facility are payable in quarterly installments commencing in May 2018 through maturity.
As of June 30, 2016 and December 31, 2015 (which date was prior to our acquisition of DEOCSA), the aggregate principal amount outstanding under the syndicated loan facility was $159 million and $172 million, respectively.
In August 2016, DEOCSA drew down an additional $24 million under the DEOCSA syndicated loan facility in order to make payments to the SAT in connection with tax claims raised by the SAT against Energuate in July 2016. For further information on the Energuate tax claims, see “Business—Legal Proceedings—Energuate Tax Claims.”
Short-Term Loans
Our consolidated short term debt was $339 million (including $146 million of the current portion of long-term debt) as of June 30, 2016. Our consolidated short term debt was $353 million as of December 31, 2015, including $174 million of the current portion of our long-term indebtedness.
CEPP, COBEE, Puerto Quetzal, Samay I, CDA, Kanan, JPPC and Surpetroil have borrowed under short-term lines of credit with financial institutions in the Dominican Republic, Bolivia, Guatemala, Peru, Peru, Panama, Jamaica and Colombia, respectively, under which they have borrowed $3 million, $7 million, $7 million, $32 million, $14 million, $6 million, $4 million and $2 million, respectively, in the six months ended June 30, 2016. These short-term borrowings are primarily used to finance these businesses’ respective operating activities.
Trend Information
As a result of the completion of various plants in Peru in recent years and others expected to enter into operation during 2016 and 2017 (including Samay I, our 616 MW cold-reserve thermoelectric plant that reached COD in May 2016, and CDA, our 510 MW run-of-the-river hydroelectric plant, which plant’s three generating units reached COD in August 2016), the generation capacity in Peru increased at a faster rate than the demand for
167
Table of Contents
such electricity, resulting in a temporary oversupply of capacity in the Peruvian market and therefore a corresponding downward pressure on energy and capacity prices. We expect this trend in energy prices to continue in 2016 and 2017. Our Peruvian energy and capacity is mainly sold pursuant to long-term PPAs and we do not have any major PPAs scheduled to expire prior to 2017. However, for 2016 and 2017, we will face the current soft energy price market for any upcoming new PPA negotiations and for spot market sales. Currently, no significant new additions of base load units are expected to be completed for the Peruvian system other than those contemplated for 2016 and 2017 and, as a result, energy prices are anticipated to recover progressively over the next few years as the system energy demand increases.
Quantitative and Qualitative Disclosures about Market Risk
For quantitative and qualitative information on our market risk, see Note 29 to our audited financial statements included in this prospectus.
Research and Development, Patents and Licenses, Etc.
We did not have significant research and development expenses during the six months ended June 30, 2016 and the years ended December 31, 2015, 2014 and 2013.
Off-Balance Sheet Arrangements
We are not party to any off-balance sheet arrangements.
168
Table of Contents
Industry Overview
Overview of Electricity Generation Industry
Our generation businesses operate in power utility markets in Latin America, Israel and the Caribbean, each of which are governed by different degrees of regulation and regulatory systems (as further explained below) and provide varying degrees of incentives for private investment. These markets are typically characterized by relatively high rates of growth of GDP and lower overall and per capita energy consumption, as compared with more developed markets.
In the Latin American and Caribbean markets that we serve, the power utility market regulation generally allows for the sale and delivery of power from power generators (private or state-owned) to distribution companies (private or state-owned) and to non-regulated customers. Israel, another market that we serve, has recently undergone significant structural changes. Until July 2013, when OPC reached COD as the first IPP in Israel, IEC, a state-owned entity, operated as the sole large-scale provider of electricity in the country. Since then, other IPPs have begun operating in Israel and several other IPPs are expected to enter this market.
In the countries in which our generation businesses operate, there is typically structural segregation between the companies involved in power generation and the companies involved in power transmission and distribution. In most of these countries, the government operates the power grid, and transmission services are provided on an open access basis (i.e. the transmission company must transmit power through the grid, and in exchange, the transmission company charges a transmission rate set by the supervisory authority or resulting from a competitive process). In the markets where private and state-owned entities compete in the power generation sector, transmission and distribution services are conducted subject to exclusive franchises, effectively regulating the transmission and distribution operations.
Although operating permits are required in each of the countries in which we operate, the markets in these countries generally have no material regulatory barriers to entry. The financial resources required to enter these markets and the significant costs associated with the construction of power facilities, however, pose barriers to entry.
The following discussion sets forth a brief description of the key electricity generation markets in which our generation companies operate.
Peru
The power utility market in Peru is currently our primary market of operation and, driven by the growth in GDP and the expansion of energy coverage, Peruvian energy consumption has grown in recent years. According to the Peruvian National Institute of Statistics and Informatics (Instituto Nacional de Estadística e Informática—INEI), Peru had a population of approximately 31 million as of December 31, 2015. Peruvian GDP grew by 3.3%, 2.4% and 5.8% in 2015, 2014 and 2013, respectively. An increase in domestic demand, resulting from growth in the overall economic activity of Peru, an increase in the population’s income and consumption and an increase in investment in infrastructure, has also led to an increase in investments in value-added manufacturing processes to create products to serve the domestic market and for export. In addition, the availability and extraction of natural resources, in particular metals, has led to increased energy-intensive mining activity, which, according to the Ministry of Energy and Mines of Peru (Ministerio de Energía y Minas), or MINEM, has supported the increase in Peru’s energy consumption from 29,492 GWh in 2010 to 39,509 GWh in 2015, representing a CAGR of 6%. Nonetheless, the generation capacity in Peru is expected to increase at a faster rate than the demand for such electricity, resulting in a temporary oversupply of capacity in the Peruvian market, which may result in downward pressure on negotiated and spot energy and capacity prices in Peru in the short- to medium-term.
169
Table of Contents
As of the date of this prospectus, spot prices in the Peruvian electricity market are at historically low levels primarily due to a sustained increase in installed capacity, which has been boosted by thermal power plants fueled by gas from the Camisea fields. A moderate demand growth, coupled with the increase in installed capacity has increased the reserve margin in Peru from 25.9% in 2011 to 43.3% in 2015 and the reserve margin is expected to peak at 52.2% in 2016 after CDA, Samay I, and other projects reach COD. However, according to the COES, demand is expected to increase as a result of large mining and industrial projects such as Las Bambas, Cerro Verde, Toquepala, Antamina, Toromocho and Cuajone, among others, as well as sustained growth in underlying demand. As a result, the COES expects the maximum demand to grow at a 7.5% CAGR between 2016 and 2019.
In 2017, an additional plant, which is expected to bring between 500MW and 600 MW of additional firm capacity to Peru, is expected to come on line, further increasing Peru’s supply of installed capacity. Total firm capacity is expected to increase at a 4.4% CAGR between 2016 and 2019. According to the COES, this additional increase in supply, coupled with sustained demand growth, is expected to apply downward pressure to the reserve margin. The COES expects the reserve margin to reach 39.4% in 2019 (a decrease of 13 percentage points, as compared to the expected reserve margin in 2016). These factors may have implications for spot prices in the medium-term and may provide the conditions for an improvement in future PPA prices.
The following chart sets forth the historical and expected evolution of firm capacity, demand and the reserve margin in Peru:
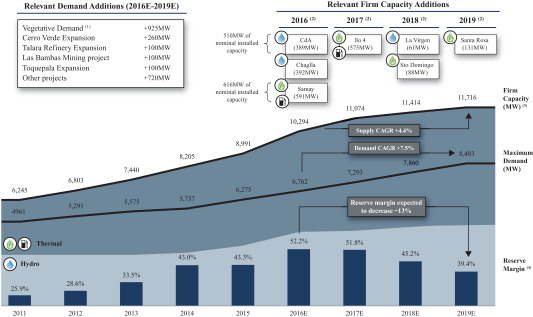
| Source: | COES “Estudio de verificacion del margen de reserva firme objetivo (MRFO) del SEIN, Periodo 2016-2019” |
| Historical | data obtained from the same studies for 2012-2015 period. |
| (1) | Underlying demand growth. |
| (2) | Firm capacity for wind and solar energy projects is defined as zero so these projects are not included. Firm capacity as declared by COES. |
| (3) | Firm capacity considers cold reserve plants. For the forecast period (2016-2019) the COES assumes that a 201 MW thermal power station is out of service for maintenance purposes. |
| (4) | Reserve margin calculated as (Firm Capacity minus Maximum Demand) / Maximum Demand. |
170
Table of Contents
The following chart presents a breakdown of installed capacity in Peru based on generation technology and fuel source, as of December 31, 2015:
Installed Capacity by Generation Technology | Installed Capacity by Fuel Source
| |
|
|
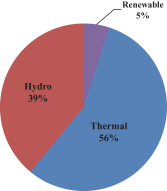
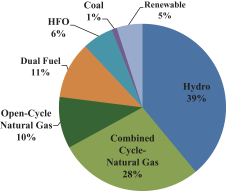
The power utility market in Peru has experienced significant changes in the past 20 years, as a result of privatizations following structural reforms initiated in 1992. In that context, the Peruvian power industry underwent a structural reform characterized by: (1) the enactment of a new regulatory model under the Electricity Concessions’ Law (Ley de Concesiones Eléctricas), or Law 25844; (2) the restructuring and reorganization of the vertically integrated state owned power utilities into non vertically integrated generation, transmission and distribution companies; (3) the privatization of most of the state owned utilities; (4) the promotion of private investment; (4) the regulation of the remuneration model for distribution and transmission activities based on cost-efficient standards; (5) the creation of an “open access” principle for the use of transmission and distribution networks; (6) the creation of a compensation system between generators that operates independently from contractual arrangements; and (7) the segmentation of power consumers as “regulated” and “non-regulated,” the latter being entitled to directly contract the supply of electricity from generators. From a regulatory perspective, the Peruvian system has split the regulatory roles among (1) an independent regulator, the Supervisory Body of Investment in Energy and Mining (Organismo Supervisor de la Inversión en Energía y Minería), or OSINERGMIN, (2) a policy body, the MINEM, and (3) a market operator that is a private entity, the Committee for the Economic Operation of the System (Comité de Operación Económica del Sistema Interconectado Nacional), or the COES. The structure and its separation have remained constant since the start of the reforms in 1992 and the economic model (i.e., marginal cost system) upon which the reform has been built is effectively embedded in the general electricity laws of Peru, providing long-term economic stability for investment.
The Law to Ensure Effective Development of Power Generation (Ley para Asegurar el Desarrollo Eficiente de la Generación Eléctrica), or Law 28832, published on July 23, 2006, and together with The Law of Power Concessions (Ley de Concesiones Eléctricas), or Law 25844, published on November 1992, introduced further changes to the power utility market and strengthened the model, mainly aiming to: (1) maintain the economic principles used in Law 25844 and add new measures to facilitate competition in the wholesale market; (2) reduce government intervention in establishing power generation tariffs; (3) allow power generation tariffs for regulated power consumers to reflect a competitive market, facilitating the construction of new generation plants when required; and (4) ensure a sufficient supply of power by reducing the power system’s exposure to the risks of high prices and rationing inherent to situations of undersupply of natural gas or transportation congestion. Law 28832 was approved as a consequence of a severe crisis in the Peruvian electricity market that resulted from, among other causes, OSINERGMIN defining the tariff at which distribution companies purchased electricity to supply to regulated customers at levels that did not reflect market conditions and were not attractive for generators to sell to distribution companies. The changes introduced by this law strengthened the model and incorporated mechanisms to effectively transfer risks from generators to end users that were not contemplated when the reforms were approved in 1992.
171
Table of Contents
The reforms of 1992, together with the Peruvian Constitution of 1993, liberalized ownership across the Peruvian electricity sector and opened it to private investment, effectively eliminating any ownership restriction based upon nationality (except within 50 km of Peru’s international land borders, where certain restrictions apply) or otherwise. The privatization and concession award process was structured based upon the need to attract foreign investment and expertise that the country lacked. As a result of such ownership rules, the majority shareholders of almost all the private companies acting in the Peruvian electricity market are controlled by foreign investors. The second largest investors in the electricity sector are the Peruvian private pension funds administrated by the Private Pension Funds Administrators.
Since 1992, the Peruvian market has been operating based upon a marginal generation cost system. This system is embedded in the general electricity laws of Peru and is administrated by the COES. In such capacity the COES has as its main mandate the satisfaction of all the demand for electricity at any given time (i.e., periods of 15 minutes each) with the most efficient generation assets available at such time, independently of contractual arrangements between generators and their clients. For this purpose, the COES determines which generation facilities will be in operation at any given time with an objective of minimizing the overall system energy cost. Energy units are dispatched (i.e., ordered by the COES to inject energy into the system) on a real-time basis; units with lower variable generation costs are dispatched first and then other less efficient generation units will be dispatched, until the electricity demand is satisfied.
The variable cost for the most expensive generation unit dispatched in each 15-minute time period determines the price of electricity in such time period for those generation companies that sell or buy power on the spot market price during such time period. The COES determines, for each such 15-minute period, the spot market at which such transactions among generators take place and acts as a clearinghouse of all such transactions.
Generation companies in the Peruvian electricity market sell their capacity and energy under PPAs or in the spot market. The principal consumers under PPAs are distribution companies and non-regulated customers. Under regulations governing the Peruvian power sector, customers with a capacity demand above 2,500 kW participate in the non-regulated power market and can enter into PPAs directly with generation companies at freely-negotiated prices. Customers with a capacity demand between 200 kW and 2,500 kW may choose to participate in the non-regulated power market or contract as a regulated client with a distribution company. PPAs to sell capacity and energy to distribution companies for resale to regulated customers must be made at fixed prices based on public bids received by the distribution companies from generation companies or at the applicable bus bar tariff set by the OSINERGMIN. Generation companies are authorized to buy and sell capacity and energy in the spot market to cover their needs and their commitments under their PPAs. Customers that are entitled to participate in the non-regulated power market must enter into PPAs with generation or distribution companies covering all their electricity demand as they are not allowed to purchase energy or capacity directly in the spot market.
Within Peru, power is generally generated by hydroelectric or thermal power stations, including those power stations that use natural gas as fuel. The power generated by these power stations varies in accordance with the rainy seasons and rainfall patterns in each year. For example, greater amounts of hydroelectric power are dispatched between November and April in Peru – the Peruvian rainy season – than between May and October, when the volume of rainfall declines and operators have less water available for electricity generation in the reservoirs serving their plants. During periods of drought, thermal plants are used more frequently. During periods of excessive rainfall when hydroelectric plants increase their generation, there may be a reduction in the spot market prices in the system and also a reduced dispatch of thermal power plants. Accordingly, revenues within the Peruvian generation industry are generally subject to seasonality and the effects of rainfall. Although generators in Peru act to reduce this exposure to seasonality by contracting long-term PPAs, this effect cannot be completely neutralized. For further information on the impact of seasonality on our operations, see “Business— Generation Business—Seasonality.”
172
Table of Contents
For further information on Peru’s regulatory environment, see “Business—Regulatory, Environmental and Compliance Matters—Regulation of the Peruvian Electricity Sector.”
The following table sets forth a summary of energy sales in the Peruvian market for the periods presented:
Energy Sales | ||||||||
Under PPAs | ||||||||
Year Ended December 31, | Distribution | Non-regulated | ||||||
| (GWh) | ||||||||
2011 | 17,888 | 13,904 | ||||||
2012 | 18,961 | 14,661 | ||||||
2013 | 19,880 | 15,841 | ||||||
2014 | 20,663 | 16,465 | ||||||
2015 | 21,988 | 17,521 | ||||||
The demand for power and electricity in Peru is served by a variety of generation companies, including our subsidiary Kallpa, Edegel, a subsidiary of Enel, ElectroPerú, a state-owned generation company whose primary generation facilities are hydroelectric plants, Engie Energía Perú S.A. (formerly EnerSur S.A.), and Duke Energy Egenor S. en C. por A., a subsidiary of Duke Energy Corp.
The following table sets forth a summary of the principal generation companies in Peru, indicating their capacity by type of generation, as of December 31, 2015:
| Capacity as of December 31, 2015 | ||||||||||||||||||||||||||||||||||||
Hydro | Combined | Open- | Dual Fuel | HFO | Coal | Other | Total | Percentage | ||||||||||||||||||||||||||||
| (MW) | (%) | |||||||||||||||||||||||||||||||||||
Engie Energía Perú S.A. (formerly EnerSur S.A.) | 137 | 806 | — | 497 | 156 | 142 | — | 1,738 | 18 | |||||||||||||||||||||||||||
Edegel | 783 | 484 | 313 | 106 | — | — | — | 1,686 | 18 | |||||||||||||||||||||||||||
Kallpa | — | 870 | 193 | — | — | — | — | 1,063 | 11 | |||||||||||||||||||||||||||
ElectroPerú | 898 | — | — | — | 13 | — | — | 911 | 9 | |||||||||||||||||||||||||||
Egenor | 359 | — | 175 | — | — | — | 16 | 550 | 6 | |||||||||||||||||||||||||||
Other generation companies | 1,526 | 570 | 306 | 416 | 387 | — | 464 | 3,669 | 38 | |||||||||||||||||||||||||||
|
|
|
|
|
|
|
|
|
|
|
|
|
|
|
|
|
| |||||||||||||||||||
Total | 3,703 | 2,730 | 987 | 1,019 | 556 | 142 | 480 | 9,617 | 100 | |||||||||||||||||||||||||||
|
|
|
|
|
|
|
|
|
|
|
|
|
|
|
|
|
| |||||||||||||||||||
Israel
According to the Israel Central Bureau of Statistics, Israel had a population of approximately 8 million as of December 31, 2015. Israeli GDP grew by 2.6%, 2.8% and 3.2% in 2015, 2014 and 2013, respectively. Demand for electric power has increased in Israel in recent years due to, among other reasons, population growth, higher living standards and climate change.
Israel’s power generation units utilize fossil fuels almost exclusively. As of December 31, 2015, the installed capacity in Israel was approximately 16,789 MW, of which 10,645 MW was fueled by natural gas based upon information available from IEC’s financial report for 2014 and the EA.
173
Table of Contents
The following charts present a breakdown of installed capacity in Israel based on fuel source as of December 31, 2015:
Installed Capacity by Fuel Source
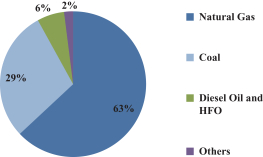
Until July 2013, the state-owned IEC operated as the sole large-scale provider of electricity in Israel. However, PUAE (which was replaced by the EA in January 2016) incentives have encouraged private investments in the Israeli power generation market and OPC and other IPPs now operate in the market with significant capacity. For example, in May 2014, Dorad Energy Ltd., or Dorad, became the second IPP to reach COD in Israel, adding capacity of 860 MW to the Israeli power market. In July 2015, the first of two units of the power plant of Dalia Power Energies Ltd., or Dalia, reached its COD. In September 2015, the second unit reached its COD, adding, together with the first unit, 910 MW to the Israeli power market. Several other IPPs are in the process of constructing power plants, and are expected to reach their COD in the coming years.
As of December 31, 2015, OPC had installed capacity of 440 MW, representing approximately 3% of Israel’s installed capacity and 19% of the installed capacity of IPPs (excluding self-generators), which had an aggregate installed capacity of approximately 2,334 MW as of December 31, 2015, according to the EA.
Sales of IPPs are generally made on the basis of PPAs for the sale of energy to customers, with prices predominantly linked to the tariff issued by the EA and denominated in New Israeli Shekels. The EA operates a “Time of Use” tariff, which provides different energy rates for different seasons (e.g., summer and winter) and different periods of time during the day. Within Israel, the price of energy varies by season and demand period, with tariffs varying based upon the season—summer (July, August), winter (January, February, December) and transition (March-June, September-November)—and demand (peak, shoulder and off-peak). Generally, the tariffs in the winter and summer seasons are higher than those in the transition season, making Israeli power generators, including OPC, more profitable, generally, in the winter and summer months, as compared to other months of the year.
The following tables set forth the tariffs and consumption blocks for each of the seasons set forth below, as of September 2015. The tariffs, which were last published by the PUAE, remained unchanged in the latest publications of the updated set of the tariffs in January 2016 and July 2016, following the replacement of the PUAE by the EA:
Regulated “Generation Component” Tariff | ||||||||||||
Winter | Transition | Summer | ||||||||||
| (NIS per MWh) | ||||||||||||
Peak | 647 | 282 | 713 | |||||||||
Shoulder | 371 | 217 | 268 | |||||||||
Off-Peak | 195 | 166 | 165 | |||||||||
Weighted tariff | 265 | |||||||||||
174
Table of Contents
Hours per Consumption Block1 | ||||||||||||
Winter | Transition | Summer | ||||||||||
| (Hours) | ||||||||||||
Peak | 404 | 2,002 | 308 | |||||||||
Shoulder | 208 | 906 | 308 | |||||||||
Off-Peak | 1,548 | 2,204 | 872 | |||||||||
| 1. | The hours per consumption block may vary due to changes in the dates of weekdays, weekends and public holidays. |
For information on the risks associated with the indexation of OPC’s revenues and cost of sales to the EA’s generation component tariff and its potential impact on OPC’s business, financial condition and results of operations, see “Risk Factors—Risks Related to Government Regulation—The production and profitability of IPPs in Israel may be adversely affected by changes in Israel’s regulatory environment.”
The following table sets forth a summary of energy sales in the Israeli market for the periods presented:
Energy Sales | ||||
Year Ended December 31, | Distribution | |||
| (GWh) | ||||
2011 | 53,100 | |||
2012 | 57,900 | |||
2013 | 56,900 | |||
2014 | 58,296 | |||
IEC has been classified by the Electricity Sector Law as an “essential service provider” and, as such, is subject to basic obligations concerning the proper management of the Israeli power utility market. These obligations include the filing of development plans, management of Israel’s power system, management of Israel’s power transmission and distribution systems, provision of backup and infrastructure services to IPPs and consumers, and the purchase of power from IPPs. IEC also transmits all of the electricity in Israel.
For further information on Israel’s regulatory environment, see “Business—Regulatory, Environmental and Compliance Matters—Regulation of the Israeli Electricity Sector.” For information on the risks related to changes in Israel’s regulatory environment, see “Risk Factors—Risks Related to Government Regulation—The production and profitability of IPPs in Israel may be adversely affected by changes in Israel’s regulatory environment.”
Nicaragua
According to the World Bank, Nicaragua had a population of approximately 6 million as of December 31, 2015. Nicaraguan GDP grew by an estimated 4.5, 4.0% and 4.6% in 2015, 2014 and 2013, respectively.
Nicaragua’s interconnected power system had an installed capacity of approximately 1,058 MW, consisting of thermal, wind, hydroelectric, geothermal and biomass power stations using HFO or diesel, which accounted for 56%, 18%, 11%, 8% and 6%, respectively, of Nicaragua’s capacity as of December 31, 2015 according to the National Dispatch Committee of Bolivia (Comité Nacional de Despacho de Carga), or CNDC. Nicaragua is part of the SIEPAC, thereby permitting the creation of a Central American wholesale power generation market. For information on Nicaragua’s regulatory environment, see“Business—Regulatory, Environmental and Compliance Matters—Regulation of the Nicaraguan Electricity Sector.”
175
Table of Contents
The following table sets forth a summary of capacity and energy sales in the Nicaraguan market for the periods presented:
| Capacity Sales | Energy Sales | |||||||||||||||
Year Ended December 31, | Under PPAs | Spot Market | Under PPAs | Spot Market | ||||||||||||
| (MW) | (GWh) | |||||||||||||||
2011 | 702 | 112 | 3,353 | 130 | ||||||||||||
2012 | 728 | 72 | 3,536 | 91 | ||||||||||||
2013 | 740 | 72 | 3,695 | 133 | ||||||||||||
2014 | 749 | 72 | 3,933 | 140 | ||||||||||||
2015 | 736 | 79 | 4,051 | 185 | ||||||||||||
Guatemala
According to the World Bank, Guatemala had a population of approximately 16 million as of December 31, 2015. Guatemalan GDP grew by 4.0% in each of 2015 and 2014 and 3.7% in 2013.
Guatemala’s interconnected power system had an installed capacity of approximately 3,174 MW, consisting of hydro, thermal and other technologies, which accounted for 33%, 62%, and 5%, respectively, of Guatemala’s capacity as of December 31, 2015 according to the Guatemalan electricity wholesale market administrator, or AMM (Administrador del Mercado Mayorista).
Guatemala, which is also a member of the SIEPAC, was a net exporter of energy in 2015.
All capacity sales in Guatemala are made pursuant to PPAs. The following table sets forth a summary of capacity and energy sales in the Guatemalan market for the periods presented:
Capacity Sales | Energy Sales | |||||||||||
Year Ended December 31, | Under PPAs | Under PPAs | Spot Market | |||||||||
| (MW) | (GWh) | |||||||||||
2011 | 1,491 | 7,286 | 1,019 | |||||||||
2012 | 1,533 | 7,500 | 1,056 | |||||||||
2013 | 1,564 | 7,394 | 1,785 | |||||||||
2014 | 1,635 | 8,223 | 1,899 | |||||||||
2015 | 1,672 | 8,984 | 1,502 | |||||||||
El Salvador
According to the World Bank, El Salvador had a population of approximately 6 million as of December 31,2015. Salvadorian GDP grew by 2.4%, 1.8% and 1.7% in 2015, 2014 and 2013, respectively.
Hydroelectric plants accounted for 31% of El Salvador’s capacity as of December 31, 2015 and geothermal plants accounted for 13%, based upon information available from the SIGET. The remaining 56% of El Salvador’s capacity was provided by thermal plants powered by HFO, diesel and bio-mass.
Prior to August 2011, a market for capacity sales did not exist and customers of electricity, including non-regulated consumers, purchased only energy. However, as a result of regulatory changes, and similar to generation companies operating in the Peruvian market, Salvadorian generation companies sell capacity and energy under PPAs or in the spot market. For further information on these reforms and El Salvador’s regulatory environment, see “Business—Regulatory, Environmental and Compliance Matters—Regulation of the Salvadorian Electricity Sector.”
176
Table of Contents
The following table sets forth a summary of capacity and energy sales in the Salvadorian market for the periods presented:
| Capacity Sales | Energy Sales | |||||||||||||||
Year Ended December 31, | Under PPAs | Spot Market | Under PPAs | Spot Market | ||||||||||||
| (MW) | (GWh) | |||||||||||||||
2011 | 555 | 404 | 2,745 | 3,011 | ||||||||||||
2012 | 655 | 332 | 3,122 | 2,761 | ||||||||||||
2013 | 715 | 285 | 3,823 | 2,177 | ||||||||||||
2014 | 764 | 271 | 4,176 | 1,891 | ||||||||||||
2015 | 515 | 581 | 3,828 | 2,482 | ||||||||||||
Panama
According to the World Bank, Panama had a population of approximately 4 million as of December 31, 2015. Panamanian GDP grew by 5.8%, 6.2% and 8.4% in 2015, 2014 and 2013, respectively.
Panama’s interconnected power system had an installed capacity of approximately 2,844 MW, mainly consisting of hydro, thermal, coal and other technologies, which accounted for 57%, 32%, 4% and 6%, respectively, of Panama’s capacity as of December 31, 2015, according to the National Dispatch Center of Panama (Centro Nacional de Despacho), or CND.
The following table sets forth a summary of capacity and energy sales in the Panamanian market for the periods presented:
| Energy Sales | ||||||||
Year Ended December 31, | Under PPAs | Spot Market | ||||||
| (GWh) | ||||||||
2011 | 6,696 | 2,053 | ||||||
2012 | 7,217 | 1,884 | ||||||
2013 | 7,359 | 2,615 | ||||||
2014 | 7,542 | 3,193 | ||||||
2015 | 8,858 | 2,656 | ||||||
An energy deficit has accumulated in Panama’s generation market, and such deficit has recently increased as a result of an extended dry season, which led to increased electricity shortages. For example, in 2014, as an emergency measure, the Panamanian government called for an emergency bid to attempt to cover electricity shortfalls in the short-term. We submitted a bid in response to this request and, in October 2014, Kanan was awarded a five-year contract to supply energy in Panama in connection with the Panamanian government’s effort. As a result of Panama’s energy deficit, the Panamanian government may solicit additional bids in the future and we may submit a bid and further expand our operations in Panama in connection with such requests.
Bolivia
According to the World Bank, Bolivia had a population of approximately 11 million as of December 31, 2015. Bolivian GDP grew by 4.8%, 5.2% and 6.8% in 2015, 2014 and 2013, respectively.
Based upon information available from the CNDC, Bolivia’s national dispatch committee, as of December 31, 2015, thermal plants fueled by natural gas accounted for 72% of Bolivian capacity and hydroelectric plants accounted for 25%. As of December 31, 2015, thermal plants in Bolivia had a capacity of 1,446 MW and hydroelectric plants in Bolivia had a capacity of 483 MW, according to the CNDC.
177
Table of Contents
Following the nationalization of Guaracachi, Valle Hermoso and Corani in May 2010 by the Bolivian government, all of the generation companies currently developing power projects in Bolivia are government-owned entities. It is unclear whether the Bolivian government will continue nationalizing entities involved in its power utility market and it is unclear whether such nationalization (if any) would be adequately compensated for by the Bolivian government. For further information on the Bolivian government’s acts of nationalization, see“Risk Factors—Risks Related to Government Regulation—TheBolivian government has nationalized energy industry assets, and our remaining operations in Bolivia may also be nationalized.”
In December 2011, the Bolivian government amended the applicable law to prohibit generation companies from entering into new PPAs. For further information on risks related to our inability to renew, enter into, or replace long-term PPAs, see “Risk Factors—Risks Related to Our Business–Our generation companies may not be able to enter into, or renew existing, long-term contracts for the sale of energy and capacity, contracts which reduce volatility inour results of operations.” For further information on Bolivia’s regulatory environment, see“—Our Description of Operations—Regulatory, Environmental and Compliance Matters—Regulation of the Bolivian Electricity Sector.”
Bolivian generation companies sell capacity and energy under PPAs or in the spot market. The following table sets forth a summary of capacity and energy sales in the Bolivian market for the periods presented:
Capacity Sales | Energy Sales | |||||||||||||||
Under PPAs | Spot Market | Under PPAs | Spot Market | |||||||||||||
Year Ended December 31, | Non-regulated | Non-regulated | ||||||||||||||
| (MW) | (GWh) | |||||||||||||||
2011 | 47 | 1,005 | 368 | 5,934 | ||||||||||||
2012 | 43 | 1,060 | 369 | 6,236 | ||||||||||||
2013 | 47 | 1,119 | 368 | 6,645 | ||||||||||||
2014 | 44 | 1,254 | 357 | 7,121 | ||||||||||||
2015 | 47 | 1,317 | 360 | 7,583 | ||||||||||||
In Bolivia, wages are periodically increased by governmental decree and, as a result, labor costs, which already represent a significant portion of the operating expenses of Bolivian generation and distribution companies, are expected to continue to increase and represent a greater portion of generation expenses.
Chile
According to the World Bank, Chile had a population of approximately 18 million as of December 31,2015. Chilean GDP grew by 2.1%, 1.8% and 4.3% in 2015, 2014 and 2013, respectively.
Two of Chile’s four power systems represent a significant portion of its 20,076 MW electricity market. The largest of such systems is the Central Interconnected System, or the SIC, which has a capacity of 15,411 MW, primarily consisting of hydroelectric stations, dual-fueled power stations using liquid natural gas or diesel, coal-based power stations, and wind farms and solar power stations which accounted for 41%, 33%, 16% and 11%, respectively, of the SIC’s capacity as of December 31, 2015. The SIC serves approximately 93% of the Chilean population. The second largest power system is the Interconnected System of Norte Grande of Chile (Sistema Interconectado Norte Grande), or SING, which has a capacity of 4,183 MW and serves approximately 6% of the Chilean population.
In 1982, Chile became the first country in the region to adopt the marginal generation cost system. Chile still uses the marginal generation cost system to ensure demand for power is met at the minimum system cost. For further information on Chile’s regulatory environment, see“Business—Regulatory, Environmental and Compliance Matters—Regulation of the Chilean Electricity Sector.”
178
Table of Contents
The following table sets forth a summary of capacity and energy sales in the SIC for the periods presented:
| Capacity Sales | Energy Sales | |||||||||||||||
Year Ended December 31, | Under PPAs | Spot Market | Under PPAs | Spot Market | ||||||||||||
| (MW) | (GWh) | |||||||||||||||
2011 | 4,663 | 1,205 | 38,364 | 5,440 | ||||||||||||
2012 | 4,754 | 1,438 | 36,966 | 9,315 | ||||||||||||
2013 | 5,351 | 1,334 | 41,147 | 6,630 | ||||||||||||
2014 | 5,832 | 1,248 | 44,234 | 8,032 | ||||||||||||
2015 | 5,853 | 1,253 | 44,772 | 8,130 | ||||||||||||
Dominican Republic
According to the Dominican Republic’s National Statistics Office (Oficina Nacional de Estadística), the Dominican Republic had a population of approximately 10 million as of December 31,2015. The Dominican Republic’s GDP grew by 7.0%, 7.3% and 4.8% in 2015, 2014 and 2013, respectively; the significant growth in 2014 primarily resulted from the decline in international fuel prices.
Based upon information available from the Coordinating Body (Organismo Coordinador), or OC, as of December 31, 2015, HFO plants accounted for 48% of the Dominican Republic’s capacity and hydroelectric plants accounted for 16%. The remainder of the Dominican Republic’s capacity was provided by open-cycle and combined-cycle plants fueled by natural gas, thermal plants fueled by coal, and wind plants. As of December 31, 2015, thermal plants in the Dominican Republic had a capacity of 3,732 MW, hydroelectric plants in the Dominican Republic had a capacity of 612 MW and wind plants had a capacity of 85 MW, according to the OC.
The large-scale theft of power from the grid is prevalent in the Dominican Republic. Since generation and distribution companies do not pass through the cost associated with such theft to consumers, the government must provide significant subsidies to these companies. For information on the Dominican Republic’s regulatory environment, see“Business—Regulatory, Environmental and Compliance Matters—Regulation of the Dominican Republic Electricity Sector.”
Dominican Republic generation companies sell capacity and energy under PPAs or in the spot market. The following table sets forth a summary of capacity and energy sales in the Dominican Republic market for the periods presented:
| Capacity Sales | Energy Sales | |||||||||||||||||||||||
| Under PPAs | Spot Market | Under PPAs | Spot Market | |||||||||||||||||||||
Year Ended December 31, | Distribution | Other | Distribution | Other | ||||||||||||||||||||
| (MW) | (GWh) | |||||||||||||||||||||||
2011 | 1,377 | 111 | 529 | 9,877 | 1,107 | 2,615 | ||||||||||||||||||
2012 | 1,429 | 238 | 634 | 11,084 | 1,792 | 2,657 | ||||||||||||||||||
2013 | 1,676 | 212 | 569 | 10,929 | 2,164 | 3,114 | ||||||||||||||||||
2014 | 1,453 | 163 | 822 | 10,045 | 1,389 | 4,109 | ||||||||||||||||||
2015 | 1,110 | 183 | 1,010 | 9,411 | 1,557 | 4,268 | ||||||||||||||||||
Jamaica
According to the World Bank, Jamaica had a population of approximately 3 million as of December 31, 2015. Jamaican GDP grew by 1.1%, decreased by 0.5% and grew by 0.2% in 2015, 2014 and 2013, respectively. Jamaica’s interconnected power system had an installed capacity of approximately 935 MW, consisting of thermal and renewable technologies, which accounted for 94% and 6%, respectively, of Jamaica’s capacity as of December 31, 2015, according to the Jamaica Public Service Company.
179
Table of Contents
Unlike the other Latin American and Caribbean countries in which we operate, or may operate in the future, Jamaica does not employ a marginal cost regulatory framework. As a result, the relevant regulatory agencies do not determine which generation units are to be dispatched, so as to minimize the cost of energy supplied. All capacity and energy sales in the Jamaican market are made pursuant to PPAs.
The following table sets forth a summary of capacity and energy sales in the Jamaican market for the periods presented:
| Capacity Sales | Energy Sales | |||||||
Year Ended December 31, | Under PPAs | Under PPAs | ||||||
| (MW) | (GWh) | |||||||
2011 | 789 | 4,137 | ||||||
2012 | 854 | 4,135 | ||||||
2013 | 854 | 4,142 | ||||||
2014 | 938 | 4,107 | ||||||
2015 | 935 | 4,209 | ||||||
Colombia
According to the World Bank, Colombia had a population of approximately 48 million as of December 31, 2015. Colombia’s GDP grew by 3.1%, 4.6% and 4.9% in 2015, 2014 and 2013, respectively.
Colombia’s interconnected power system had an installed capacity of approximately 16,342 MW, consisting of hydro, thermal plants, minor plants and cogenerators, which accounted for 66%, 29%, 4% and 1%, respectively, of Colombia’s capacity as of December 31, 2015, according to the Mining and Energy Planning Unit (Unidad de Planeación Minero Energética), or UPME. For information on Colombia’s regulatory environment, see “Business—Regulatory, Environmental and Compliance Matters—Regulation of theColombian Electricity Sector.”
The following table sets forth a summary of energy sales and consumption in the Colombian market for the periods presented:
| Energy Sales | Energy Consumption | |||||||||||||||
Year Ended December 31, | Under PPAs | Spot Market | Regulated | Non-regulated | ||||||||||||
| (GWh) | (GWh) | |||||||||||||||
2011 | 62,179 | 16,787 | 38,231 | 18,536 | ||||||||||||
2012 | 67,183 | 17,016 | 39,175 | 19,800 | ||||||||||||
2013 | 71,375 | 14,948 | 40,282 | 20,237 | ||||||||||||
2014 | 69,846 | 15,544 | 42,323 | 20,867 | ||||||||||||
2015 | 71,549 | 16,905 | 44,629 | 21,187 | ||||||||||||
Overview of Electricity Distribution Market
Guatemala
Background
During the 1970s, the Guatemalan government was the only distributor of electricity in Guatemala through Instituto Nacional de Electrificación, or INDE, and Empresa Eléctrica de Guatemala, S.A., or EEGSA. In the next two decades, the Guatemalan electricity sector became increasingly privatized, and in 1994, the Guatemalan government adopted a new law to deregulate and privatize the Guatemalan electricity industry in order to encourage privately funded growth. In 1996, the Guatemalan government adopted the General Electricity Law (Ley General de Electricidad), which created a legal and regulatory framework designed to reduce government intervention and attract private investment into the sector.
180
Table of Contents
Operations and regulations
Guatemalan distribution companies acquire electricity on behalf of their clients through PPAs from generation facilities, transport such electricity to their grids, and then deliver electricity through low-voltage and medium-voltage transmission lines to regulated customers and large users and perform a range of related services such as metering, billing and management. Distribution companies also collect tolls from large users for their use of the transmission grid.
The General Electricity Law provides that transmission companies and distribution companies must permit physical connections to the transmission and distribution systems for all customers in exchange for a toll. Large users are entitled to receive electricity from any source and transmission and distribution companies must allow such electricity to pass through their transmission and distribution lines. Distribution and transmission companies are entitled to collect distribution tariffs and transmission tolls for the use of their systems. Failure to provide such access by a transmission or distribution company may lead to fines and ultimately to the termination of such company’s distribution authorization.
There are three large distribution companies authorized to distribute electricity in Guatemala: EEGSA, which serves Guatemala City, Sacatepéquez and Escuintla (urban areas), and DEORSA and DEOCSA (which operate under the brand name “Energuate”). Guatemala has an electricity distribution market model that supports free access to any person or legal entity that fulfils the requirements of the General Electricity Law. Authorizations for distribution services are granted on a non-exclusive basis for specific geographic areas and have terms of up to 50 years. Although authorizations to provide distribution services are non-exclusive, the investment required to establish a competing distribution system is a substantial barrier to entry. In addition to these large distribution companies, there are approximately 15 municipal distributors operating in the AMM.
Distribution companies are required to have PPAs in place with generation companies for the supply of sufficient electricity for the current year and the next year. Each year, the AMM estimates the demand for each distribution company for the period from May 1 through April 30 of the following year. Each distribution company is then required to establish its own projection of demand for the following period from May 1 through April 30. If there is a disagreement between the AMM and the distribution companies regarding the demand estimation, the electricity regulator will decide the estimation of the demand.
The industry is regulated by MEM, CNEE and AMM. The MEM is responsible for enforcing the General Electricity Law and the related regulations and for the coordination of policies between CNEE and the AMM. The CNEE acts as the technical arm of the MEM and determines the transmission and distribution tariffs while ensuring compliance with electricity laws. The AMM is a private entity that coordinates the operation of the generation facilities and international interconnections and transmission lines that form the Guatemalan National Electricity System. The AMM is responsible for the safety and operation of the Guatemalan National Electricity System, performing economically efficient dispatch, and managing electricity resources in a manner that seeks to minimize operating costs, including failure costs within restrictions imposed by the transmission system and service quality requirements.
For further information on distribution tariffs, see “Business—Regulatory, Environmental and Compliance Matters—Regulation of the Guatemalan Electricity Distribution Market—Tariffs and Tolls.”
For further information on macroeconomic conditions in Guatemala, see “—Overview of Electricity Generation Industry—Guatemala.”
Potential Markets
The following discussion sets forth brief descriptions of the electricity markets in Argentina and Mexico, which we have identified as potential countries in which we may expand our operations in the near- to medium-term.
181
Table of Contents
Argentina
According to the World Bank, Argentina had a population of approximately 43 million as of December 31, 2015. Argentinian GDP increased by 0.5% and 2.9% in 2014 and 2013, respectively.
Argentina’s interconnected power system had an installed capacity of approximately 33,480 MW, as of December 31, 2015. Thermal, hydroelectric, nuclear and other plants accounted for 61%, 36%, 3% and 1%, respectively, of Argentina’s installed capacity as of December 31, 2015.
The following table sets forth a summary of installed capacity and energy consumption in the Argentinian market for the periods presented:
Year Ended December 31, | Installed capacity | Energy Demand | ||||||
2011 | 29,872 | 116,507 | ||||||
2012 | 31,250 | 121,188 | ||||||
2013 | 31,377 | 125,234 | ||||||
2014 | 31,405 | 126,467 | ||||||
2015 | 33,480 | 132,021 | ||||||
Mexico
According to the World Bank, Mexico had a population of approximately 127 million as of December 31, 2015. Mexican GDP increased by 2.5%, 2.3% and 1.3% in 2015, 2014 and 2013, respectively.
As of December 31, 2015, Mexico’s interconnected power system had an installed capacity of approximately 68,044 MW, of which the Federal Electricity Commission (Comisión Federal de Electricidad) (Mexico’s state-owned power utility), IPPs and other accounted for 61.6%, 19.0% and 19.4%, respectively. Thermal, hydroelectric, wind and other plants accounted for 72%, 18%, 4% and 6%, respectively, of Mexico’s installed capacity as of December 31, 2015.
Mexico has undertaken reforms of its electricity market in an effort to drive significant investments in new generation capacity.For example, in 2016, the Federal Electricity Commission granted concessions to construct approximately 1.7 GW of additional solar and wind energy generation capacity. In addition, Petróleos Mexicanos, or PEMEX, has announced that it aims to reach an installed capacity of approximately 3.0 GW in the medium-term by partnering with power companies for the development of cogeneration plants. The Mexican government has also announced initiatives towards the development of significant renewable energy capacity, targeting the addition of approximately 4.6 GW of wind capacity over the next decade.
The following table sets forth a summary of effective capacity and energy consumption in the Mexican market for the periods presented:
| Effective Capacity | Energy Consumption | |||||||||||||||
Year Ended December 31, | Total Public System | IPPs | Internal Sales | Final | ||||||||||||
| (MW) | (GWh) | |||||||||||||||
2011 | 52,512 | 11,907 | 200,946 | 432,069 | ||||||||||||
2012 | 53,114 | 12,418 | 206,480 | 440,934 | ||||||||||||
2013 | 54,035 | 12,851 | 206,130 | 445,640 | ||||||||||||
2014 | 54,379 | 12,851 | 208,015 | 457,243 | ||||||||||||
2015 | 54,853 | 12,952 | 212,201 | 472,557 | ||||||||||||
182
Table of Contents
We are a leading owner, developer and operator of power generation facilities located in key energy markets in Latin America, the Caribbean and Israel. Additionally, in January 2016, we completed our acquisition of Energuate (comprised of two electricity distribution companies in Guatemala (DEORSA and DEOCSA)), marking our initial entry in the electricity distribution sector.
The power generation companies within our portfolio utilize a range of energy sources, including natural gas, hydroelectric, HFO, diesel and wind. We principally focus our generation operations in Latin American markets, which typically have higher growth rates of GDP and lower overall and per capita energy consumption, as compared with more developed markets. We believe that economic growth in Latin American markets will drive increases in overall and per capita energy consumption and therefore require significant additional investments in power generation assets in those markets. As of June 30, 2016, our installed capacity and proportionate capacity were 3,384 MW and 2,731 MW, respectively, including Kanan’s 92 MW thermal generation project in Panama, which reached COD in April 2016, and Samay I’s 616 MW cold-reserve thermoelectric project in Peru, which reached COD in May 2016.
We increased our installed capacity by an additional 510 MW, to 3,894 MW (3,114 MW on a proportionate basis), in August 2016 with the completion of the three generating units of CDA’s 510 MW hydroelectric plant located in Peru. In addition, in August 2015, we acquired AIE, which currently operates an 18 MW plant in Israel and holds a conditional license for the construction of a cogeneration power station in Israel. AIE commenced construction of the plant in June 2016, and the AIE plant, which is expected to have a capacity of 140 MW, is expected to reach its COD by the end of 2018.
Between 2007 and June 30, 2016, we invested approximately $3.0 billion in the acquisition, development and expansion of our power generation assets. Of this amount, 80% represented investments in greenfield development (including investments made in CDA, Samay I and Kanan) and 20% represented acquisitions. We have financed our greenfield development using a combination of cash on hand, debt financing and investments by minority shareholders at the asset level, and have financed the acquisitions of our power generation assets using cash on hand. As of June 30, 2016, of the 2,835 MW that we have added to our installed capacity since Inkia’s formation, 72% was derived from greenfield development projects, consisting primarily of our construction of Kallpa’s combined cycle plant, Peru’s largest power generation facility, the construction of OPC’s plant, which became Israel’s first IPP, and the construction of the Samay I project, a cold-reserve thermoelectric plant in Peru. In the same period, we have acquired businesses with an aggregate installed capacity of 801 MW in Israel and five countries in Latin America. In August 2016, we had derived 76% of our installed capacity growth since 2007 from greenfield development efforts.
By successfully pursuing growth opportunities, primarily through contracted greenfield development projects in existing markets and acquisitions of anchor investments in new markets, we have expanded our regional presence, diversified our generation portfolio through the addition of various facilities which use a range of energy sources, and significantly increased our cash flows. In 2015, our Adjusted EBITDA was $326 million, as compared to $41 million in 2008, representing a CAGR of 34% during this period. Adjusted EBITDA is a non-IFRS measure. For a reconciliation of our net income to our Adjusted EBITDA, see “Summary Consolidated Financial and OtherInformation—Key Financial and Other OperatingInformation—IC Power and ICP.”
Additionally, in January 2016, we completed our acquisition of Energuate (comprised of two electricity distribution companies in Guatemala (DEORSA and DEOCSA)) and two smaller, related companies (Guatemel and RECSA). As of December 31, 2015, Energuate provides electric service for approximately 1.6 million regulated customers in Guatemala (representing approximately 55% of Guatemala’s regulated distribution customers in 2015) and distributes energy across approximately 100,000 km2in Guatemala, covering approximately 12 million inhabitants. Energuate operates approximately 34,000 km of distribution lines within Guatemala (representing approximately 70% of Guatemala’s distribution lines) as of December 31, 2015, and
183
Table of Contents
holds the non-exclusive right to distribute electricity within its service area until 2048. In the years ended December 31, 2015 and 2014, Energuate sold 2,305 GWh and 2,164 GWh of energy, respectively.
We were incorporated in Singapore in May 2015 under the name IC Power Pte. Ltd., pursuant to the Singapore Companies Act. Until the completion of this offering, we will remain a wholly-owned subsidiary of Kenon (NYSE: KEN; TASE: KEN), which was formed by IC in 2014 to serve as the holding company of certain interests, including ICP, received by Kenon in connection with IC’s January 2015 spin-off of Kenon to IC’s shareholders. In addition to its interest in us, Kenon also holds interests in Qoros Automotive Co., Ltd., ZIM Integrated Shipping Ltd. and Primus Green Energy, Inc. In March 2016, ICP and its businesses were contributed to us by our parent, Kenon, through a Reorganization described in further detail in “Corporate Formation and Reorganization.” Set forth below is a description of the operations of ICP and its businesses. Except as otherwise indicated, or unless the context requires otherwise, references to “IC Power,” “the Company,” “we,” “us” and “our” prior to the date of the Reorganization shall refer to ICP and its businesses, and as of the date of the Reorganization and thereafter, to IC Power and its subsidiaries, including ICP.
Our generation activities are conducted through various operating companies in which, with the exception of Pedregal, we hold controlling interests. The following graphic sets forth our generation companies as of June 30, 2016 (the percentage of holdings stated alongside each generation company are, in some cases, indirect holdings):
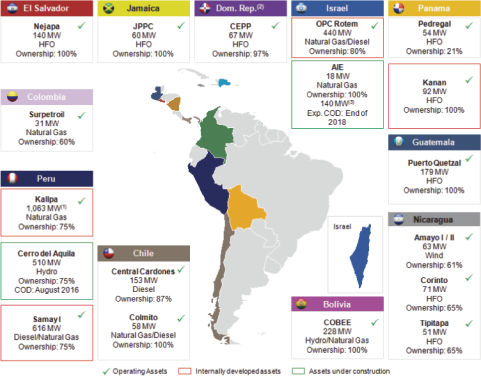
| (1) | Includes 193 MW capacity from Las Flores. |
| (2) | Excludes Agua Clara, a 50 MW wind project, which is expected to commence commercial operations in early 2018. |
| (3) | Includes 18 MW currently under operation and a cogeneration plant, which is expected to have capacity of 140 MW. |
184
Table of Contents
The following table sets forth summary operational information regarding each of our operating companies and associated company in our generation business as of June 30, 2016, according to segment1:
Segment | Country | Entity | Ownership | Fuel | Installed | Proportionate | Type of Asset | Weighted | LTM (GWh)3 | |||||||||||||||||||
Peru | Peru | Kallpa | 75 | % | Natural Gas | 1,063 | 4 | 797 | Greenfield4 | 7 | 6,309 | |||||||||||||||||
| Peru | Samay I | 75 | % | Diesel and Natural Gas | 616 | 462 | Greenfield | 12 | — | |||||||||||||||||||
Israel | Israel | OPC | 80 | % | Natural Gas and Diesel | 440 | 352 | Greenfield | 7 | 5 | 3,929 | |||||||||||||||||
| Israel | AIE | 100 | % | Natural Gas6 | 18 | 18 | Acquired | 15 | 697 | |||||||||||||||||||
Central America | Nicaragua | Corinto | 65 | % | HFO | 71 | 46 | Acquired | 3 | 429 | ||||||||||||||||||
| Nicaragua | Tipitapa Power | 65 | % | HFO | 51 | 33 | Acquired | 3 | 367 | |||||||||||||||||||
| Nicaragua | Amayo I | 61 | % | Wind | 40 | 24 | Acquired | 9 | 159 | |||||||||||||||||||
| Nicaragua | Amayo II | 61 | % | Wind | 23 | 14 | Acquired | 3 | 94 | |||||||||||||||||||
| Guatemala | Puerto Quetzal | 100 | % | HFO | 179 | 179 | Acquired | 1 | 515 | |||||||||||||||||||
| El Salvador | Nejapa | 100 | % | HFO | 140 | 140 | Original Inkia Asset | 1 | 801 | |||||||||||||||||||
| Panama | Kanan | 100 | % | HFO | 92 | 92 | Greenfield | 4 | 269 | |||||||||||||||||||
Other | Bolivia | COBEE | 100 | % | Hydroelectric, Natural Gas | 228 | 228 | Original Inkia Asset | 1 | 277 | ||||||||||||||||||
| Chile | Central Cardones | 87 | % | Diesel | 153 | 133 | Acquired | — | — | |||||||||||||||||||
| Chile | Colmito | 100 | % | Natural Gas and Diesel | 58 | 58 | Acquired | 3 | 263 | |||||||||||||||||||
| Dominican Republic | CEPP | 97 | % | HFO | 67 | 65 | Original Inkia Asset | — | 8 | |||||||||||||||||||
| Jamaica | JPPC | 100 | % | HFO | 60 | 60 | Original Inkia Asset | 2 | 382 | |||||||||||||||||||
| Colombia | Surpetroil | 60 | % | Natural Gas | 31 | 19 | Acquired / Greenfield8 | 1 | 52 | |||||||||||||||||||
| Panama | Pedregal9 | 21 | %10 | HFO | 54 | 11 | Original Inkia Asset | 2 | 298 | |||||||||||||||||||
Total Operating Capacity | 3,384 | 2,731 | ||||||||||||||||||||||||||
|
|
|
| |||||||||||||||||||||||||
| 1. | Reflects 100% of the capacity of each of our assets, regardless of our ownership interest in the entity that owns each such asset. |
| 2. | Reflects the proportionate capacity of each of our assets, as determined by our ownership interest in the entity that owns each such asset. |
| 3. | Reflects energy sales under PPAs for the 12 months ended June 30, 2016. |
| 4. | Kallpa’s plants were developed as greenfield projects in four different stages between 2005 and 2012, resulting in 870 MW of installed capacity. In addition, Kallpa acquired Las Flores’ power plant in 2014, adding 193 MW to Kallpa’s capacity. |
| 5. | Reflects the weighted average remaining life of OPC’s PPAs with end users based on OPC’s firm capacity. The IEC PPA (as defined below), which extends for an 18-year term and covers OPC’s entire firm capacity, provides OPC with the option to allocate and sell the generated electricity of the power station directly to end users. OPC has exercised this option and sells all of its energy and capacity directly to 20 end users, as of June 30, 2016 For further information on the IEC PPA, see “Business—Regulatory, Environmental and Compliance Matters—Regulation of the Israeli Electricity Sector.” |
| 6. | AIE also holds a conditional license for the construction of a cogeneration power station in Israel. This station will be developed as a greenfield project (at an expected cost of $250 million, including the acquisition price of AIE), based upon a plant with 140 MW of capacity. Construction commenced in June 2016 and COD is expected by the end of 2018. |
| 7. | Reflects energy sales under PPAs since we acquired AIE in August 2015. |
185
Table of Contents
| 8. | When initially acquired by us, Surpetroil had a capacity of 15 MW. As of June 30, 2016, Surpetroil’s capacity has increased to 31 MW as a result of our completion of various greenfield projects. |
| 9. | Although Pedregal is located in Central America, it is a minority investment. Therefore, from an income statement perspective, it is not part of the Central America segment and Pedregal is only reflected in our share in income of associated companies. |
| 10. | Although we have a non-controlling interest in Pedregal, we were party to a management services agreement, which designated us as the administrator responsible for the day-to-day management of Pedregal until the agreement expired in October 2016. We expect to renew the management services agreement in November 2016. However, we may be unable to do so. |
The following table sets forth summary operational information regarding our generation asset in advanced stages of construction as of June 30, 2016:
Country | Entity | Ownership | Fuel | Installed | Proportionate | Expected | Percentage | Expected Cost | Amount Invested | |||||||||||||||||||||||
Peru | CDA | 75 | % | Hydroelectric | 510 | 383 | August 2016 | 98%—Overall completion 99%—Dam construction 100%—Tunnel drilling | $ | 959 million | $ | 907 million3 | ||||||||||||||||||||
Total Capacity of Asset in Advanced Stages of Construction | 510 | 383 | $ | 959 million | $ | 907 million | ||||||||||||||||||||||||||
|
|
|
|
|
|
|
| |||||||||||||||||||||||||
| 1. | Reflects 100% of the expected capacity, regardless of our ownership interest in the entity that owns the asset. |
| 2. | Reflects the proportionate capacity, as determined by our ownership interest in the entity that owns the asset. |
| 3. | Includes $8 million of intercompany expenses related to services rendered by Kallpa pursuant to a management agreement. |
In April and May 2016, Kanan’s 92 MW thermal generation project and Samay I’s 616 MW cold-reserve thermoelectric project reached their COD, at an aggregate cost of $87 million and $379 million (excluding $26 million of diesel fuel inventory), respectively. In July 2016, all four of Samay I’s units were declared unavailable to the system due to damage to the shafts in three of the plant’s four units. We have developed a plan to repair the units, and on August 28, 2016, Kenon announced that we expected all four units to be operational within six months. We intend to seek coverage for the costs of the outage, including repair costs and loss of profits, as appropriate, from the EPC contractor, equipment manufacturer and/or the insurance coverage (subject to deductibles), and believe we have a reasonable basis to recover these costs, including for loss of profits. For further information on Samay I’s insurance, see “—Insurance.” For further information on Samay I’s unavailability, see “—Generation Segment—Peru—Samay I.” In August 2016, the three generating units of CDA’s 510 MW run-of-the-river hydroelectric plant in Peru reached their COD, at an estimated cost of approximately $959 million.
Competitive Strengths
Strong track record inproject development, with a disciplined approach to capital structure—We leverage our core competencies—project identification, evaluation, development, construction and operation—to develop power generation facilities using various technologies in attractive markets that typically have relatively high GDP growth rates and relatively low levels of per capita energy consumption. For example, in 2012, we completed our third expansion of Kallpa’s gas-powered plant, which is the largest power generation facility in Peru in terms of capacity, by converting it into a combined cycle facility and thereby adding an additional 292 MW to the facility’s capacity. This expansion was completed on time and below budget. Additionally, in 2013, OPC became the first IPP in Israel when we completed the construction of its 440 MW combined cycle power plant. In April, May and August 2016, we also completed the development of Kanan’s 92 MW thermal generation project in Panama, the development of Samay I’s 616 MW cold-reserve thermoelectric project in Peru and the development of the three generating units of CDA’s 510 MW run-of-the-river hydroelectric plant in Peru, respectively.
Our projects have been developed with a disciplined capital structure, which reflects our commitment to develop projects in accordance with three key fundamental principles. First, we endeavor to construct projects by entering into turnkey EPC agreements that define the total project cost and transfer most of the risks of
186
Table of Contents
construction delays and cost overruns to our EPC contractors. For example, we constructed Samay I and CDA pursuant to EPC contracts. Second, we seek to secure a revenue stream prior to the construction of our plants by sourcing and entering into long-term PPAs, which provide our development projects with predictable projected margins and cash flows, before construction has commenced. Finally, we leverage our EPC contracts and PPAs to secure long-term project financing agreements which are generally stand-alone, secured, project-specific, and with no or limited recourse. Over the course of our history, we have secured different types of financings (e.g., leases, local and international bonds, syndicated loans, etc.) during times of changing financial markets and in connection with our construction of various projects using a range of energy sources.
Long-term PPAs and supply agreements that limit exposure to market fluctuations—Most of our generation subsidiaries typically enter into long-term PPAs, which generally limits their exposure to fluctuations in energy spot market rates, generates stable and predictable margins, and helps to create stability and predictability in our cash flows. In the year ended December 31, 2015, we made 89% of our aggregate energy sales (in GWh) pursuant to long-term PPAs. As of December 31, 2015, the weighted average remaining life of our PPAs was 10 years (including the remaining life of the PPAs for CDA, Samay I and Kanan) and we have historically sought, and will continue to seek, to renew our long-term PPAs as they expire.
As of December 31, 2015, the majority of our PPAs were indexed to the price of the corresponding power plant’s operating fuel prices in U.S. Dollars (for plants that use fuel), and many of our PPAs provided for payment in, or were linked to, the U.S. Dollar, thereby mitigating such plant’s exposure to fuel price and exchange rate fluctuations. Additionally, the counterparties to our long-term PPAs are typically large local distribution companies or non-regulated customers, including subsidiaries of large multi-national corporations, which we believe have strong credit profiles, mitigating the risk of customer default. Some of our major non-regulated customers within Peru and Israel include Southern Peru Copper Corporation, Sociedad Minera Cerro Verde S.A.A. (a subsidiary of Freeport-McMoRan), Compañía Minera Antapaccay S.A. (a subsidiary of Glencore Xstrata), and Oil Refineries Limited, as well as governments and quasi-governmental entities.
As our power facilities utilize and are dependent upon natural gas, hydroelectric, HFO, diesel, wind, or a combination of these energy sources, we seek to enter into long-term supply and transportation agreements to acquire the necessary fuel for our facilities. For example, Kallpa, Samay I and OPC, which own and operate our largest plants, are party to long-term supply agreements, including natural gas supply agreements and transportation services agreements, that are material to their operations.
Attractive footprint in high growth markets—Currently, our principal focus is on Latin American markets, which typically have higher growth rates of GDP and lower overall and per capita energy consumption, as compared with more developed markets. We expect continued growth in these key markets, providing us with the opportunity to generate attractive, risk-adjusted returns through additional investments in power generation assets in those countries.
We are a leader, and the principal power producer, in our largest market, Peru, one of the fastest growing economies in Latin America, with an average GDP growth of approximately 4.8% per year from 2010 through 2015, according to the International Monetary Fund, a mature regulatory framework, and a well-run power system. As of and for the year ended December 31, 2015, our operating company in Peru, Kallpa, had an installed capacity of 1,063 MW, representing 11% of Peru’s installed capacity, and generated 12% of the gross energy generated (in GWh) in Peru. Kallpa represented 81% of our net income, 47% of our Adjusted EBITDA, and 40% of our installed capacity as of and for the year ended December 31, 2015. In May 2016, Samay I (our cold-reserve thermoelectric project) reached its COD on schedule, providing an additional 616 MW of installed capacity to the Peruvian market. In August 2016, we provided an additional 510 MW of installed capacity to the Peruvian market with the completion of the three generating units of CDA. As a result of the completion of this project, our total installed capacity in Peru is 2,189 MW, making us the principal power producer in Peru in terms of installed capacity. Although energy and capacity prices in Peru have recently experienced downward pressure due to oversupply of capacity in the market, we expect demand and spot prices to increase in the medium term as a result of large mining and industrial projects in Peru and sustained growth in underlying demand.
187
Table of Contents
We also operate OPC, the first IPP in Israel, which, in 2013 following decades of state control, opened its electricity market to private power producers. As a result, the electricity market in Israel is still in the early stages of development. Israel’s energy consumption levels have also increased in recent years and are expected to continue to increase in the near-term. As of and for the year ended December 31, 2015, OPC had an installed capacity of 440 MW, representing approximately 3% of Israel’s installed capacity and 19% of the installed capacity of IPPs, and generated 6% of the gross energy generated (in GWh) in Israel. As of and for the year ended December 31, 2015, OPC represented 38% of our net income, 24% of our Adjusted EBITDA, and 17% of our installed capacity. We believe that OPC’s plant provides us with a strategic advantage as an early entrant to the Israeli electricity market. Additionally, given Israel’s growing economy and the advanced age of its existing state-owned power generation facilities, we believe OPC provides us with the know-how and visibility to pursue additional power project opportunities in Israel, such as the acquisition of AIE, which opportunities may become increasingly available to private sector participants such as us.
In addition to our attractive positions in Peru and Israel, we have also developed an attractive footprint in several markets in Latin America, including Chile and Colombia, and are in the process of opening a development office in Mexico. We believe that our current platform, coupled with our agile and disciplined decision-making process, enables us to take advantage of opportunities as they arise.
Established and disciplined track record inacquiring generation assets—We have acquired numerous generation assets since 2007, resulting in the expansion of our operations by 801 MW (707 MW on a proportionate basis) in Israel and five countries in Latin America. We believe our recognition as a regional generator and developer with a relatively strong balance sheet, and our ability to act quickly with respect to acquisitions has complemented our development capabilities by allowing us to strategically source and execute acquisitions. Furthermore, our positioning as a mid-sized regional market participant allows us to manage projects that are too small for large companies, as well as projects that are too large for small companies. Such acquisitions facilitate our entry into new markets and allow us to act as consolidators in the countries in which we already operate. Our acquisition of Central Cardones in 2011, for example, provided us with an initial footprint in Chile, a dynamic and important power market, and facilitated our acquisition of Colmito in October 2013. Similarly, our acquisition of certain Nicaraguan assets in 2014, representing 185 MW of installed capacity (117 MW on a proportionate basis) provided us with an entry into the Nicaraguan market and diversified our portfolio with operational wind generation assets. Additionally, in August 2015, following completion of our OPC facility, we acquired 100% of the shares of AIE, which currently operates an 18 MW plant and holds a conditional license for the construction of a cogeneration power station in Israel, a new and growing private electricity generation market.
Platform for growth in electricity distribution sector through recent acquisition of Energuate—In January 2016, we further expanded and diversified our portfolio by completing our acquisition of Energuate, which operates distribution companies in Guatemala, a country with a historically stable electricity sector framework. Our purchase of Energuate marks our initial entry into electricity distribution and we believe this purchase will provide us with a platform to further expand our distribution portfolio. As of December 31, 2015, Energuate provides electric service to approximately 1.6 million regulated customers in Guatemala (representing approximately 55% of Guatemala’s regulated distribution customers in 2015) and distributes energy to a service area of approximately 100,000 km2 in Guatemala, covering primarily rural areas with a population of approximately 12 million inhabitants. Energuate, the largest distribution company in Central America (according to population served), operates approximately 34,000 km of distribution lines within Guatemala (representing approximately 70% of Guatemala’s distribution lines) as of December 31, 2015. We expect that Energuate’s sizeable distribution base and limited exposure to fluctuations in the cost of electricity (both as a result of Energuate’s entry into PPAs and a compensation framework anchored on predefined distribution tariffs) will provide us with predictable cash flows from Energuate’s operations, which we believe will contribute significantly to our further expansion within the distribution industry. We have also created a new corporate platform with highly experienced executives from the Latin American distribution sector to manage our distribution business. We believe that this will provide us with the required organizational support to operate Energuate, as well as a strong platform for future expansion in the distribution business in the region.
188
Table of Contents
Driving operational excellence through partnerships with leading OEMs and reliance on efficient technologies—We seek to optimize our power generation capacity by using leading technologies (e.g., turbines manufactured by Siemens, General Electric, Mitsubishi and Andritz) and entering into long-term service agreements with leading, multi-national OEMs. Our technologies and long-term partnerships enable our power generation assets to perform more efficiently and at relatively high levels of reliability. Additionally, our experienced staff is committed to increasing our operating performance and ensuring the disciplined maintenance of our power generation assets. We believe that our generation plants’ weighted average availability rate of 95% for the year ended December 31, 2015 was the result of our optimization efforts and our commitment to improving our operating efficiency and performance.
Additionally, our acquisition or construction of power generation assets that use efficient technologies (e.g., the conversion of Kallpa’s facility into a combined cycle operation in 2012) places our generation assets competitively in the dispatch merit order in certain of the countries in which we operate. For example, Kallpa’s facility, a base load plant and combined cycle gas turbine, is among the first power plants to be dispatched, due to its efficiency and competitiveness in the dispatch stack. Similarly, CDA’s hydroelectric power plant, which plant’s three generating units reached COD in August 2016, is also among the first power plants to be dispatched in Peru. Having a portfolio which includes efficient power plants with lower production costs allows us to potentially earn higher margins than companies that utilize certain other competing technologies in their plants and are therefore less competitive in the dispatch merit order.
Experienced management team with strong local presence—Our management team has extensive experience in the power generation business. Our executive officers have an average of approximately 20 years of experience in the power generation industry, and significant portions of our core management team have been working together in international large power generation companies since 1996. We believe that this overall level of experience contributes to our ability to effectively manage our existing operating companies and to identify, evaluate and integrate high-quality growth opportunities within and outside Latin America. Furthermore, our hands-on management team utilizes a lean decision-making process, which allows us to quickly take advantage of strategic acquisitions and potential developments and opportunities as they materialize. Our managers are compensated, in part, on the basis of our financial performance, which incentivizes them to continue to improve our operating results. Additionally, our local management teams provide in-depth market knowledge and power industry experience. These teams consist primarily of local executives with significant experience in the local energy industry and with local government regulators. We believe that the market-specific experience of our local management provides us with insight into the local regulatory, political and business environment in each of the countries in which we operate.
In addition, in connection with our acquisition of Energuate in January 2016, we recruited an experienced management team for our distribution business’ operations. This management team consists of officers, some of whom were previously employed at Energuate, who work directly with our management team to oversee and manage the Energuate business with us, as well as local executives who manage Energuate’s day-to-day operations. Additionally, this management team has extensive experience managing large distribution companies in various countries throughout Central and South America, including Guatemala.
Business Strategies
Continue to successfully develop greenfield assets in attractive markets—One of our core competencies is identifying, evaluating, constructing, and operating greenfield development projects in our target markets. We will continue to seek to develop power generation assets in countries with relatively stable, growing economies, low levels of per capita energy consumption or developing private energy generation markets. We also seek to develop assets that can be expanded through further investment, or as additional fuels become available, which provides us with the ability to further develop an asset and increase its installed capacity in connection with market trends, industry developments, or changing fuel availability.
189
Table of Contents
We place particular focus on our ability to complete the development of our greenfield projects on time and within budget and will continue to use extensive project planning and contracting mechanisms to minimize our development risk. For example, in connection with our development activities, we typically enter into lump-sum, turnkey EPC contracts to minimize our construction risks and mitigate construction cost overruns, while also entering into long-term PPAs to generate stable and predictable margins and cash flows; we believe this combination facilitates our access to long-term construction financing. Engaging in such practices has allowed us to successfully complete several thermal generation projects, including the conversion of the Kallpa facility, which added an additional 292 MW to the facility’s capacity, and our development of the Samay I 616 MW cold-reserve thermoelectric project. Additionally, our first hydroelectric development, CDA’s plant, is expected to be fully operational at a cost of $1.9 million per MW, making CDA’s plant among the most efficiently constructed hydroelectric facilities in Latin America in terms of cost per MW.
Optimize portfolio to maximize returns while minimizing risk—We regularly assess our portfolio of operating companies and employ disciplined portfolio management principles to optimize our operations in light of changing industry dynamics in a particular country or region, create financing flexibility and address specific risk management and exposure concerns. Our strategy is to optimize the composition of our portfolio by focusing on profitable developments and acquisitions within key power generation markets typically in Latin America, the Caribbean and Israel.
For example, prior to our 2014 acquisition of the Las Flores facility, a 193 MW thermal power generation plant (representing 145 MW on a proportionate basis), Las Flores had operated intermittently due to the lack of a long-term regular supply of natural gas. The Kallpa facility, which is located near the Las Flores plant, had an excess supply of natural gas. We identified these and other potential synergies and, since our acquisition of the Las Flores facility, have been able to significantly improve the operations and generation activities of Las Flores’ plant, while also maximizing the use of the Kallpa facility’s natural gas supply and transportation capabilities. Our acquisition of Puerto Quetzal serves as another example of our portfolio optimization efforts. In addition to providing us with an attractive entry point into the Guatemalan market, one of the barges we acquired from Puerto Quetzal was redeployed to Panama to allow Kanan to take advantage of a short-term supply shortfall in the Panamanian power market.
Additionally, in 2014, we divested our 21% indirect equity interest in Edegel, one of Peru’s largest power generation companies. While the Edegel investment was a strong cash flow generator which helped to fund the initial stages of our growth, we opted to sell this investment in order to redeploy the proceeds from such sale into projects in which we have a majority control and which we believe will have a better risk and return profile for our shareholders over the long-term. In addition, while continuing to maintain a majority interest in our key operating businesses, we may sell further minority interests in some of these assets, so as to raise additional capital to re-invest in the business and to further optimize our portfolio to maximize returns to our shareholders.
Complement organic development with dynamic and disciplined acquisitions—We seek to invest in countries and/or assets where we can significantly increase our cash flows and optimize our operations. Therefore, in addition to greenfield developments, we also seek to enter into and/or expand our presence in attractive markets by acquiring controlling interests in operating assets to anchor our geographical expansion. For example, we acquired power generation assets in Nicaragua, Guatemala and Colombia, which represent our initial entry into these markets, through our acquisitions of (1) ICPNH, which provided us with controlling interests in two HFO and two wind energy Nicaraguan generation companies, (2) Puerto Quetzal, which provided us with three power barges with HFO generators (one of which was transferred to our subsidiary Kanan to allow it to take advantage of supply shortfalls in the Panamanian power market), and (3) Surpetroil, a company that utilizes stranded natural gas reserves in its production of energy. Chile and Colombia represent important parts of our growth strategy. We continue to seek expansion in Chile and Colombia, and we expect that our assets in these countries will provide us with the initial footprint from which to carry out our organic development strategy in these two markets. Additionally, consistent with our strategy of maintaining controlling interests in our power
190
Table of Contents
generation assets, in May 2014, we increased our equity ownership in JPPC (which has an aggregate 60 MW of installed capacity in two HFO generation units in Jamaica) from 16% to 100%, and in January 2015, we increased our equity ownership in Nejapa (which has 140 MW of installed capacity at an HFO power generation facility in El Salvador) from 71% to 100%. We will continue to seek to leverage our acquisitions of assets in new markets and/or of assets utilizing a broad range of technologies (which may include new fuels, such as solar power) to generate attractive risk-adjusted returns.
Continue to expand and optimize our operations within the electricity distribution sector—Our recent acquisition of Energuate represents our initial entry into the electricity distribution business. We intend to further expand our portfolio and diversify our revenue streams by applying our disciplined acquisition principles as we seek to purchase additional distribution assets in countries where we believe we can significantly increase our cash flows, optimize our operations, and leverage the experience gained from our acquisition of Energuate. Additionally, we will endeavor to optimize Energuate’s existing distribution operations by targeting Energuate’s electricity losses (both commercial and technical) in the near- to medium-term. Energuate’s management intends to reduce commercial losses (e.g., losses from illegal connections, fraud and billing errors) through improving customer billing practices, increasing targeted inspections and meter replacements, implementing a communication program with local communities and modernizing Energuate’s facilities to reduce tampering, especially in areas where electricity theft has been more prevalent, and reduce technical losses (i.e., losses occurring in the ordinary course of electricity distribution) by investing in the modernization of Energuate’s transmission grid and distribution system. To this end, we intend to invest approximately $30 million in Energuate’s capital expenditures in 2016, and expect that our capital expenditures relating to Energuate will increase in the coming years.
Continue to enter into long-term PPAs with credit-worthy counterparties—In the year ended December 31, 2015, we made 89% of our aggregate energy sales (in GWh) pursuant to long-term PPAs, many of which are denominated in, or linked to, the U.S. Dollar. Our strategy of generating strong and predictable cash flows from long-term PPAs has enabled us to successfully secure financing for our greenfield projects from a diverse international lender base to fund our development and construction projects. Our generation companies seek to enter into long-term capacity PPAs prior to committing to a new project so as to predict expected cash flows and margins of a particular asset, which facilitates its financing. For example, CDA, which plant’s three generating units reached COD in August 2016, has sourced and entered into three long-term PPAs beginning in 2016, 2018 and 2022 for a significant portion of its expected capacity, contracting most of the estimated firm energy it expects to generate between 2018 and 2027. As of June 30, 2016, the weighted average remaining life of CDA’s PPAs based on firm capacity was 12 years. The expected cash flows associated with such PPAs contributed to CDA’s attractive credit profile, which supported the financing of the CDA plant’s development. Similarly, prior to our completion of the Samay I project, the Peruvian government guaranteed capacity payments for 600 MW for a 20-year period at rates above regulated capacity rates, which also provided support for the financing of the plant’s development. We also continue to seek to enter into, or renew, long-term PPAs for our currently operating generation assets. For example, Kallpa entered into two PPAs with Southern Peru Copper Corporation, a 10-year PPA for 120 MW and a 10-year PPA for 70 to 85 MW, both starting in 2017. In addition to significantly improving our access to financing with no or limited recourse, our strategy of contracting our assets’ energy and capacity significantly reduces our exposure to changes in spot prices.
Background and History
ICP was incorporated in January 2010 as a limited liability company under the laws of the State of Israel. ICP holds a 100% interest in Inkia and ICPI.
Inkia was formed in June 2007 by IC as a special purpose vehicle to acquire Globeleq’s power generation assets and property in Latin America and the Caribbean. In April 2010, IC transferred the shares of Inkia to ICP.
191
Table of Contents
In February 2010, IC purchased 80% of OPC from Ofer Brothers (Energy Holdings) Ltd, or Ofer Energy. In April 2010, ICPI was incorporated as a wholly-owned subsidiary of IC, and the shares of OPC owned by IC were transferred from IC to ICPI. In June 2010, IC transferred the shares of ICPI to ICP.
In January 2016, ICP completed its acquisition of Energuate (comprised of two electricity distribution companies in Guatemala (DEORSA and DEOCSA)), marking our initial entry in the electricity distribution sector, and two smaller, related companies (Guatemel and RECSA).
As set forth above, in March 2016, ICP and its businesses were contributed to us by our parent, Kenon, through a Reorganization described in further detail in “Corporate Formation andReorganization.” Additionally, prior to the completion of this offering, we will be converted into a Singapore public company limited by shares and renamed .
Set forth below is a further summary of the history and development of ICP’s portfolio of assets.
Original Inkia Assets
In June 2007, Inkia acquired the outstanding shares of Globeleq, which indirectly owned:
| • | 100% of the outstanding shares of Kallpa—When Inkia acquired its interest in Kallpa in 2007, Kallpa I was still under commissioning and reached its COD a few days after Inkia’s acquisition of Kallpa. Between July 2007 and August 2012, we developed the Kallpa I, Kallpa II and Kallpa III turbines and completed the conversion of the Kallpa facility from an open-cycle to a combined-cycle operation. In October 2009, Quimpac agreed to subscribe to newly-issued shares of Kallpa, representing 25% of Kallpa’s issued and outstanding shares, thereby reducing Inkia’s interest in Kallpa to 75%; |
| • | 100% of the outstanding shares of COBEE and Cenérgica, S.A. de C.V., or Cenérgica; |
| • | 97% of the outstanding shares of CEPP; |
| • | 87% of the outstanding shares of Nejapa Holdings, the sole member of Nejapa—In October 2008, Nejapa Holdings issued additional shares to Crystal Power pursuant to a shareholder’s agreement, thereby reducing Inkia’s interest in Nejapa to 71%. We increased our ownership interest in Nejapa to 100% in January 2015; |
| • | 68% of the outstanding shares of Southern Cone Power Perú S.A., or Southern Cone, which at the time owned 39% of the outstanding shares of Generandes, which, in turn, owned 54% of the outstanding shares of Edegel—In 2010, we purchased the remaining 32% of Southern Cone’s share capital. We divested of Southern Cone, thereby divesting of our 21% indirect equity interest in Edegel, in September 2014; |
| • | 21% of the outstanding shares of Pedregal; and |
| • | 16% of the outstanding shares of JPPC—We increased our ownership interest in JPPC to 100% in May 2014. |
In April 2010, IC transferred 100% of the outstanding shares of Inkia to ICP.
ICPI
In February 2010, IC purchased 80% of OPC from Ofer Energy.
192
Table of Contents
In June 2010, IC transferred 100% of the outstanding shares of OPC to ICPI, a wholly-owned subsidiary of ICP.
Additional Portfolio Changes
Since ICP’s formation in 2010, ICP has added the following assets to its portfolio:
| • | 87% of the outstanding shares of Central Cardones in December 2011; |
| • | 100% of the outstanding shares of Colmito in October 2013; |
| • | 100% of the outstanding shares of ICPNH in March 2014; through ICPNH, we indirectly hold 65% interests in Corinto and Tipitapa Power and 61% interests in Amayo I and Amayo II; |
| • | 60% of the outstanding shares of Surpetroil in March 2014; |
| • | Las Flores’s 193 MW power plant in April 2014; |
| • | 100% of the outstanding shares of Puerto Quetzal in September 2014; and |
| • | 100% of the outstanding shares of a holding company in January 2016 which indirectly holds: |
| • | 93% of the outstanding shares of DEORSA; |
| • | 91% of the outstanding shares of DEOCSA; and |
| • | 100% of the outstanding shares of two smaller, related companies (Guatemel and RECSA). |
ICP also formed CDA, Samay I and Kanan in July 2010, July 2010 and August 2013, respectively, and acquired AIE (which currently operates an 18 MW plant) in August 2015, to carry out the greenfield development projects of each of these respective companies.
193
Table of Contents
The table below presents information, by country, about our installed capacity as of the dates indicated. For information on our ownership interest in each of these assets during the periods below, see “—Portfolio Overview.”
As of June 30, | As of December 31, | |||||||||||||||||||||||||||||||||||
2015 | 2014 | 2013 | 2012 | 2011 | 2010 | 2009 | 2008 | |||||||||||||||||||||||||||||
(MW) | ||||||||||||||||||||||||||||||||||||
Original Inkia Assets1: | ||||||||||||||||||||||||||||||||||||
El Salvador (Nejapa)2 | 140 | 140 | 140 | 140 | 140 | 140 | 140 | 140 | 140 | |||||||||||||||||||||||||||
Panama (Pedregal) | 54 | 54 | 54 | 54 | 54 | 54 | 54 | 54 | 54 | |||||||||||||||||||||||||||
Bolivia (COBEE) | 228 | 228 | 228 | 228 | 228 | 228 | 228 | 228 | 228 | |||||||||||||||||||||||||||
Dominican Republic (CEPP) | 67 | 67 | 67 | 67 | 67 | 67 | 67 | 67 | 67 | |||||||||||||||||||||||||||
Jamaica (JPPC)3 | 60 | 60 | 60 | 60 | 60 | 60 | 60 | 60 | 60 | |||||||||||||||||||||||||||
|
|
|
|
|
|
|
|
|
|
|
|
|
|
|
|
|
| |||||||||||||||||||
| 549 | 549 | 549 | 549 | 549 | 549 | 549 | 549 | 549 | ||||||||||||||||||||||||||||
Greenfield: | ||||||||||||||||||||||||||||||||||||
Peru (Kallpa)4 | 870 | 870 | 870 | 870 | 870 | 578 | 578 | 368 | 174 | |||||||||||||||||||||||||||
Israel (OPC) | 440 | 440 | 440 | 440 | — | — | — | — | — | |||||||||||||||||||||||||||
Panama (Kanan) | 92 | — | — | — | — | — | — | — | — | |||||||||||||||||||||||||||
Colombia (Surpetroil)5 | 16 | 5 | — | — | — | — | — | — | — | |||||||||||||||||||||||||||
Peru (Samay I) | 616 | 6 | — | — | — | — | — | — | — | |||||||||||||||||||||||||||
|
|
|
|
|
|
|
|
|
|
|
|
|
|
|
|
|
| |||||||||||||||||||
| 2,034 | 1,315 | 1,310 | 1,310 | 870 | 578 | 578 | 368 | 174 | ||||||||||||||||||||||||||||
Acquired Assets: | ||||||||||||||||||||||||||||||||||||
Peru (Las Flores) | 193 | 193 | 193 | — | — | — | — | — | — | |||||||||||||||||||||||||||
Israel (AIE)7 | 18 | 18 | — | — | — | — | — | — | — | |||||||||||||||||||||||||||
Nicaragua (ICPNH) | 185 | 185 | 185 | — | — | — | — | — | — | |||||||||||||||||||||||||||
Guatemala (Puerto Quetzal) | 179 | 179 | 179 | — | — | — | — | — | — | |||||||||||||||||||||||||||
Chile (Central Cardones) | 153 | 153 | 153 | 153 | 153 | 153 | — | — | — | |||||||||||||||||||||||||||
Chile (Colmito) | 58 | 58 | 58 | 58 | — | — | — | — | — | |||||||||||||||||||||||||||
Colombia (Surpetroil)5 | 15 | 15 | 15 | — | — | — | — | — | — | |||||||||||||||||||||||||||
|
|
|
|
|
|
|
|
|
|
|
|
|
|
|
|
|
| |||||||||||||||||||
| 801 | 801 | 783 | 211 | 153 | 153 | — | — | — | ||||||||||||||||||||||||||||
|
|
|
|
|
|
|
|
|
|
|
|
|
|
|
|
|
| |||||||||||||||||||
Total installed capacity | 3,384 | 2,665 | 2,642 | 2,070 | 1,572 | 1,280 | 1,127 | 917 | 723 | |||||||||||||||||||||||||||
|
|
|
|
|
|
|
|
|
|
|
|
|
|
|
|
|
| |||||||||||||||||||
Asset in Advanced Stages of Construction: | ||||||||||||||||||||||||||||||||||||
Peru (CDA) | 510 | 8 | — | — | — | — | — | — | — | |||||||||||||||||||||||||||
|
|
|
|
|
|
|
|
|
|
|
|
|
|
|
|
|
| |||||||||||||||||||
Total | 510 | — | — | — | — | — | — | — | ||||||||||||||||||||||||||||
|
|
|
|
|
|
|
|
|
|
|
|
|
|
|
|
|
| |||||||||||||||||||
| 1. | Does not reflect the installed capacity of Edegel, an original Inkia asset. In September 2014, we divested our indirect 21% equity interest in Edegel. |
| 2. | In January 2015, we acquired the 29% of Nejapa’s outstanding equity interest that we did not own, which increased our equity interest in Nejapa from 71% to 100%. |
| 3. | In May 2014, we acquired the 84% of JPPC’s outstanding equity interest that we did not own, which increased our equity interest in JPPC from 16% to 100%. |
| 4. | When Inkia acquired its interest in Kallpa in 2007, Kallpa I was still under commissioning and reached its COD a few days after Inkia’s acquisition of Kallpa. Between July 2007 and August 2012, we developed the Kallpa II and Kallpa III turbines and completed the conversion of the Kallpa facility from an open-cycle to a combined-cycle operation. |
| 5. | When initially acquired by us, Surpetroil had a capacity of 15 MW. As of June 30, 2016, Surpetroil’s capacity has increased to 31 MW as a result of our completion of various greenfield projects. |
| 6. | In May 2016, Samay I reached COD. In July 2016, damage to the shafts was detected in three of the four units of the Samay I plant. As a result, all of the plant’s four units have been declared unavailable to the system. We have developed a plan to repair the units, and on August 28, 2016, Kenon announced that we expected all four units to be operational within six months. |
| 7. | AIE also holds a conditional license for the construction of a cogeneration power station in Israel. This station will be developed as a greenfield project (at an expected cost of $250 million, including the acquisition price of AIE), based upon a plant with 140 MW of capacity. Construction commenced in June 2016 and COD is expected by the end of 2018. |
| 8. | In August 2016, the three generating units of CDA reached COD. |
194
Table of Contents
Portfolio Overview
Our generation operations are focused in Latin American and Caribbean markets—primarily Peru—characterized by relatively high rates of GDP growth and relatively low base levels of per capita energy consumption (in comparison to those of developed markets). In July 2013, we commenced commercial operations in Israel, operating the first large-scale private power plant in the country. Our portfolio includes power generation plants that operate on a range of energy sources, including natural gas, hydroelectric, HFO, diesel and wind. As of June 30, 2016, our installed capacity and proportionate capacity were 3,384 MW and 2,731 MW, respectively, including Kanan’s 92 MW thermal generation project in Panama, which reached COD in April 2016, and Samay I’s 616 MW cold-reserve thermoelectric project in Peru, which reached COD in May 2016. We increased our installed capacity by an additional 510 MW, to 3,894 MW (3,114 MW on a proportionate basis), in August 2016 upon the completion of the three generating units of CDA’s 510 MW hydroelectric plant located in Peru.
We own, operate and develop power plants to generate and sell electricity to distribution companies and non-regulated customers under long-term PPAs and to the spot market. Our largest generation asset is our Kallpa facility, a combined-cycle plant in Peru that includes three gas-fired generation turbines and is the largest power plant in Peru, in terms of capacity. In 2015, 89% of our energy and capacity sales were pursuant to long-term PPAs, reducing our exposure to fluctuating electricity and fuel prices. Our generation businesses sold 15,393 GWh of electricity during the year ended December 31, 2015; 6,366 GWh of this electricity, representing 41% of volume sold, to distribution companies, 7,382 GWh of electricity, representing 48% of volume sold, to consumers in the non-regulated markets, and 1,645 GWh of electricity, representing 11% of volume sold, in the spot markets. During the year ended December 31, 2015, our operations in Peru generated 35% of our consolidated revenues, 81% of our net income and 47% of our Adjusted EBITDA.
The following charts set forth the relative percentages of our generation business’ installed capacity by energy source as of June 30, 2016, and our generation business’ installed capacity by energy source, as adjusted to reflect the recent completion of the CDA project:
Installed Capacity by Energy Source (as of June 30, 2016)1 | Installed Capacity by Energy Source (September 30, 2016)1 | |
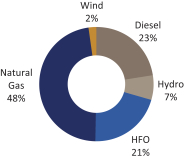 |
| |
| 3,384 MW2 | 3,894 MW2,3,4 |
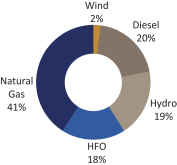
| 1. | Our dual-fueled assets, COBEE, OPC, Samay I and Colmito, are categorized as hydroelectric, natural gas, diesel and natural gas, respectively. |
| 2. | Includes 616 MW attributable to Samay I, which reached COD in May 2016. In July 2016, all of the plant’s units were declared unavailable to the system due to damage to the shafts in three of the plant’s four units. We have developed a plan to repair the units, and on August 28, 2016, Kenon announced that we expected all four units to be operational within six months. |
| 3. | Includes 510 MW attributable to CDA, which plant’s three generating units reached COD in August 2016. |
| 4. | Does not include the 140 MW cogeneration power station which AIE began constructing in June 2016 as a greenfield project. Construction of this plant commenced in June 2016 and COD is expected by the end of 2018. |
195
Table of Contents
The following charts set forth the relative percentage of our generation business’ installed capacity by segment as of June 30, 2016, and our generation business’ installed capacity by segment, as adjusted to reflect the recent completion of the CDA project:
Installed Capacity by Segment (as of June 30, 2016) | Installed Capacity by Segment (September 30, 2016) | |
|
| |
| 3,384 MW1 | 3,894 MW1,2,3 |
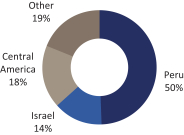
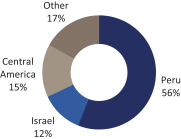
| 1. | Includes 616 MW attributable to Samay I, which reached COD in May 2016. In July 2016, all of the plant’s units were declared unavailable to the system due to damage to the shafts in three of the plant’s four units. We have developed a plan to repair the units, and on August 28, 2016, Kenon announced that we expected all four units to be operational within six months. |
| 2. | Includes 510 MW attributable to CDA, which plant’s three generating units reached COD in August 2016. |
| 3. | Does not include the 140 MW cogeneration power station which AIE began constructing in June 2016 as a greenfield project. Construction of this plant commenced in June 2016 and COD is expected by the end of 2018. |
196
Table of Contents
The following table sets forth summary financial information for our subsidiaries and associated company for the six months ended June 30, 2016:
Six Months Ended June 30, 2016 | ||||||||||||||||||||||||
Entity | Ownership Interest (%) | Sales | Cost of Sales | Adjusted EBITDA1 | Outstanding Debt2 | Net Debt3 | ||||||||||||||||||
| ($ millions) | ||||||||||||||||||||||||
GENERATION | ||||||||||||||||||||||||
Peru segment | ||||||||||||||||||||||||
Kallpa | 75 | $ | 228 | $ | 148 | $ | 71 | $ | 417 | $ | 402 | |||||||||||||
Samay I | 75 | 8 | 4 | 4 | 339 | 324 | ||||||||||||||||||
Asset in advance stages of construction | ||||||||||||||||||||||||
CDA | 75 | — | — | — | 597 | 583 | ||||||||||||||||||
Israel segment | ||||||||||||||||||||||||
OPC | 80 | 153 | 123 | 27 | 373 | 326 | ||||||||||||||||||
AIE | 100 | 23 | 21 | 1 | — | (16 | ) | |||||||||||||||||
Central America segment | ||||||||||||||||||||||||
ICPNH4 | 61-65 | 44 | 25 | 16 | 92 | 78 | ||||||||||||||||||
PuertoQuetzal5 | 100 | 31 | 27 | 3 | 19 | 11 | ||||||||||||||||||
Nejapa6 | 100 | 38 | 31 | 6 | — | (11 | ) | |||||||||||||||||
Cenérgica | 100 | 9 | 8 | 1 | — | (2 | ) | |||||||||||||||||
Guatemel | 100 | 3 | 2 | — | — | (1 | ) | |||||||||||||||||
Kanan | 100 | 32 | 28 | 3 | 60 | 55 | ||||||||||||||||||
Other | ||||||||||||||||||||||||
COBEE | 100 | 22 | 8 | 13 | 69 | 44 | ||||||||||||||||||
Central Cardones | 87 | 6 | — | 4 | 40 | 35 | ||||||||||||||||||
Colmito | 100 | 12 | 10 | 1 | 17 | 16 | ||||||||||||||||||
CEPP | 97 | 13 | 10 | 2 | 12 | 9 | ||||||||||||||||||
JPPC7 | 100 | 15 | 15 | (1 | ) | 7 | 4 | |||||||||||||||||
Surpetroil8 | 60 | 4 | 3 | — | 3 | 3 | ||||||||||||||||||
RECSA | 100 | — | — | 1 | 3 | 2 | ||||||||||||||||||
DISTRIBUTION | ||||||||||||||||||||||||
DEORSA | 93 | 135 | 102 | 19 | 103 | 96 | ||||||||||||||||||
DEOCSA | 91 | 105 | 79 | 21 | 159 | 152 | ||||||||||||||||||
Holdings9 | ||||||||||||||||||||||||
ICPDH | 100 | — | — | — | 119 | 119 | ||||||||||||||||||
Inkia &Other | 100 | — | — | — | 448 | 10 | 374 | |||||||||||||||||
IC Power & Other | 100 | — | — | (4 | ) | 66 | 11 | 21 | ||||||||||||||||
|
|
|
|
|
|
|
|
|
| |||||||||||||||
TOTAL | $ | 881 | $ | 644 | $ | 188 | $ | 2,943 | $ | 2,624 | ||||||||||||||
|
|
|
|
|
|
|
|
|
| |||||||||||||||
| 1. | “Adjusted EBITDA” for each entity for the period is defined as net income (loss) before depreciation and amortization, finance expenses, net and income tax expense (benefit). |
Adjusted EBITDA is not recognized under IFRS or any other generally accepted accounting principles as a measure of financial performance and should not be considered as a substitute for net income or loss, cash flow from operations or other measures of operating performance or liquidity determined in accordance with IFRS. Adjusted EBITDA is not intended to represent funds available for dividends or other discretionary uses because those funds may be required for debt service, capital expenditures, working capital and other commitments and contingencies. Adjusted EBITDA presents limitations that impair its use as a measure of profitability since it does not take into consideration certain costs and expenses that result from each business that could have a significant effect on its net income, such as financial expenses, taxes, depreciation, capital expenses and other related charges.
197
Table of Contents
The following tables set forth a reconciliation of net income (loss) to Adjusted EBITDA for our generation subsidiaries for the six months ended June 30, 2016:
| Kallpa | CDA | Samay I | OPC | AIE | ICPNH | Puerto Quetzal | ||||||||||||||||||||||
| ($ millions) | ||||||||||||||||||||||||||||
Net income (loss)(i) | $ | 16 | $ | 2 | $ | 2 | $ | 8 | $ | — | $ | 6 | $ | (1 | ) | |||||||||||||
Depreciation and amortization | 23 | — | 1 | 12 | 1 | 5 | 2 | |||||||||||||||||||||
Finance expenses (income), net | 23 | — | — | 7 | — | 4 | 1 | |||||||||||||||||||||
Income tax expense (benefit) | 9 | (2 | ) | 1 | — | — | 1 | 1 | ||||||||||||||||||||
|
|
|
|
|
|
|
|
|
|
|
|
|
| |||||||||||||||
Adjusted EBITDA | $ | 71 | $ | — | $ | 4 | $ | 27 | $ | 1 | $ | 16 | $ | 3 | ||||||||||||||
|
|
|
|
|
|
|
|
|
|
|
|
|
| |||||||||||||||
| (i) | Reflects net income after elimination and consolidation adjustment |
| Nejapa | Cenérgica | Kanan | Guatemel | COBEE | Central Cardones | Colmito | ||||||||||||||||||||||
| ($ millions) | ||||||||||||||||||||||||||||
Net income (loss) | $ | 3 | $ | 1 | $ | (6 | ) | $ | — | $ | 7 | $ | 1 | $ | (1 | ) | ||||||||||||
Depreciation and amortization | 2 | — | 7 | — | 2 | 2 | 1 | |||||||||||||||||||||
Finance expenses, net | — | — | 2 | — | 2 | 1 | 1 | |||||||||||||||||||||
Income tax expense | 1 | — | — | — | 2 | — | — | |||||||||||||||||||||
|
|
|
|
|
|
|
|
|
|
|
|
|
| |||||||||||||||
Adjusted EBITDA | $ | 6 | $ | 1 | $ | 3 | $ | — | $ | 13 | $ | 4 | $ | 1 | ||||||||||||||
|
|
|
|
|
|
|
|
|
|
|
|
|
| |||||||||||||||
| CEPP | JPPC | Surpetroil | RECSA | ICPDH | Inkia & Other | IC Power & Other | ||||||||||||||||||||||
| ($ millions) | ||||||||||||||||||||||||||||
Net income (loss) | $ | — | $ | (2 | ) | $ | (1 | ) | $ | — | $ | (4 | ) | $ | (19 | ) | $ | (11 | ) | |||||||||
Depreciation and amortization | 2 | 2 | 1 | 1 | — | 5 | — | |||||||||||||||||||||
Finance expenses, net | — | — | — | — | 4 | 11 | 7 | |||||||||||||||||||||
Income tax expense (benefit) | — | (1 | ) | — | — | — | 3 | — | ||||||||||||||||||||
|
|
|
|
|
|
|
|
|
|
|
|
|
| |||||||||||||||
Adjusted EBITDA | $ | 2 | $ | (1 | ) | $ | — | $ | 1 | $ | — | $ | — | $ | (4 | ) | ||||||||||||
|
|
|
|
|
|
|
|
|
|
|
|
|
| |||||||||||||||
DEOCSA | DEORSA | IC Power | ||||||||||
| ($ millions) | ||||||||||||
Net income | $ | 6 | $ | 9 | $ | 16 | ||||||
Depreciation and amortization | 5 | (i) | 3 | (i) | 77 | |||||||
Finance expenses, net | 7 | 4 | 74 | |||||||||
Income tax expense | 3 | 3 | 21 | |||||||||
|
|
|
|
|
| |||||||
Adjusted EBITDA | $ | 21 | $ | 19 | $ | 188 | ||||||
|
|
|
|
|
| |||||||
| ||||||||||||
| (i) Includes “Other revenues—government grants”, which is presented as a separate line item in the relevant company’s financial statements, but is included within depreciation and amortization in IC Power’s consolidated financial statements. | ||||||||||||
| 2. | Includes short-term and long-term debt and excludes loans and notes owed to a parent company. |
198
Table of Contents
| 3. | Net debt is defined as total debt attributable to each of the companies, excluding debt owed to a parent company, and the cash and short term deposits and restricted cash of the relevant company. Net debt is not a measure recognized under IFRS. The tables below set forth a reconciliation of total debt to net debt for us and our subsidiaries. |
| Kallpa | CDA | Samay I | OPC | AIE | ICPNH | Puerto Quetzal | Nejapa | Cenérgica | Kanan | |||||||||||||||||||||||||||||||
| ($ millions) | ||||||||||||||||||||||||||||||||||||||||
Total debt | $ | 417 | $ | 597 | $ | 339 | $ | 373 | $ | — | $ | 92 | $ | 19 | $ | — | $ | — | $ | 60 | ||||||||||||||||||||
Cash | 15 | 14 | 15 | 47 | 16 | 14 | 8 | 11 | 2 | 5 | ||||||||||||||||||||||||||||||
|
|
|
|
|
|
|
|
|
|
|
|
|
|
|
|
|
|
|
| |||||||||||||||||||||
Net Debt | $ | 402 | $ | 583 | $ | 324 | $ | 326 | $ | (16 | ) | $ | 78 | $ | 11 | $ | (11 | ) | $ | (2 | ) | $ | 55 | |||||||||||||||||
|
|
|
|
|
|
|
|
|
|
|
|
|
|
|
|
|
|
|
| |||||||||||||||||||||
| Guatemel | COBEE | Central Cardones | Colmito | CEPP | JPPC | Surpetroil | RECSA | ICPDH | Inkia & Other | |||||||||||||||||||||||||||||||
| ($ millions) | ||||||||||||||||||||||||||||||||||||||||
Total debt | $ | — | $ | 69 | $ | 40 | $ | 17 | $ | 12 | $ | 7 | $ | 3 | $ | 3 | $ | 119 | $ | 448 | ||||||||||||||||||||
Cash | 1 | 25 | 5 | 1 | 3 | 3 | — | 1 | — | 74 | ||||||||||||||||||||||||||||||
|
|
|
|
|
|
|
|
|
|
|
|
|
|
|
|
|
|
|
| |||||||||||||||||||||
Net Debt | $ | (1) | $ | 44 | $ | 35 | $ | 16 | $ | 9 | $ | 4 | $ | 3 | $ | 2 | $ | 119 | $ | 374 | ||||||||||||||||||||
|
|
|
|
|
|
|
|
|
|
|
|
|
|
|
|
|
|
|
| |||||||||||||||||||||
IC Power | DEOCSA | DEORSA | Total IC | |||||||||||||
| ($ millions) | ||||||||||||||||
Total debt | $ | 66 | $ | 159 | $ | 103 | $ | 2,943 | ||||||||
Cash | 45 | 7 | 7 | 319 | ||||||||||||
|
|
|
|
|
|
|
| |||||||||
Net debt | $ | 21 | $ | 152 | $ | 96 | $ | 2,624 | ||||||||
|
|
|
|
|
|
|
| |||||||||
| 4. | Through ICPNH, we indirectly hold 65% interests in Corinto and Tipitapa Power and 61% interests in Amayo I and Amayo II. |
| 5. | Figures include Puerto Quetzal and Poliwatt Limited (one of our subsidiaries that performs administrative functions and maintains certain licenses on behalf of Puerto Quetzal). |
| 6. | Figures include amounts related to Nejapa’s branch and main office. |
| 7. | Figures include JPPC and Private Power Operator Ltd. (our subsidiary that employs JPPC’s employees and performs administrative-related functions). |
| 8. | Figures include Surpetroil and Surenergy S.A.S ESP (our subsidiary that performs administrative functions and maintains certain licenses on behalf of Surpetroil). |
| 9. | In addition to the results of certain of our generation assets, our Other segment also includes expenses and other adjustments relating to our headquarters and intermediate holding companies, including purchase price allocations recorded in connection with our acquisition of Energuate, which allocations were recorded by Inkia, one of our intermediate holding companies. |
| 10. | Reflects $448 million of Inkia’s debt. |
| 11. | Includes $12 million of our outstanding debt and $54 million of ICPI debt. |
199
Table of Contents
The following table sets forth summary financial information for our subsidiaries and associated company for the six months ended June 30, 2015 and presents information derived from ICP’s financial statements for the period:
Six Months Ended June 30, 2015 | ||||||||||||||||||||||||
Entity | Ownership Interest (%) | Sales | Cost of Sales | Adjusted EBITDA1 | Outstanding debt | Net debt2 | ||||||||||||||||||
| ($ millions) | ||||||||||||||||||||||||
Peru segment | ||||||||||||||||||||||||
Kallpa | 75 | $ | 225 | $ | 139 | $ | 78 | $ | 438 | $ | 409 | |||||||||||||
Assets in advance stages of construction | ||||||||||||||||||||||||
CDA | 75 | — | — | — | 546 | 453 | ||||||||||||||||||
Samay I | 75 | — | — | — | 244 | 221 | ||||||||||||||||||
Israel segment | ||||||||||||||||||||||||
OPC | 80 | 157 | 112 | 43 | 422 | 210 | ||||||||||||||||||
Central America segment | ||||||||||||||||||||||||
ICPNH3 | 61-65 | 57 | 37 | 18 | 104 | 88 | ||||||||||||||||||
Puerto Quetzal4 | 100 | 60 | 54 | 5 | 22 | 16 | ||||||||||||||||||
Nejapa5 | 100 | 53 | 46 | 6 | — | (27 | ) | |||||||||||||||||
Cenérgica | 100 | 5 | 3 | 1 | — | (1 | ) | |||||||||||||||||
Asset in advance stages of construction | ||||||||||||||||||||||||
Kanan | 100 | — | — | — | — | (4 | ) | |||||||||||||||||
Other segment | ||||||||||||||||||||||||
COBEE | 100 | 22 | 8 | 11 | 79 | 54 | ||||||||||||||||||
Central Cardones | 87 | 8 | 2 | 6 | 47 | 43 | ||||||||||||||||||
Colmito | 100 | 20 | 17 | 2 | 18 | 16 | ||||||||||||||||||
CEPP | 97 | 20 | 17 | 3 | 25 | 24 | ||||||||||||||||||
JPPC6 | 100 | 24 | 21 | 2 | 7 | 3 | ||||||||||||||||||
Surpetroil7 | 60 | 4 | 2 | 1 | 3 | 2 | ||||||||||||||||||
Holdings8 | ||||||||||||||||||||||||
Inkia & Other | 100 | — | — | — | 448 | 9 | 302 | |||||||||||||||||
ICP & Other | 100 | — | — | (1 | ) | 111 | 10 | 84 | ||||||||||||||||
|
|
|
|
|
|
|
|
|
| |||||||||||||||
Total | $ | 655 | $ | 458 | $ | 175 | $ | 2,514 | $ | 1,893 | ||||||||||||||
|
|
|
|
|
|
|
|
|
| |||||||||||||||
| 1. | “Adjusted EBITDA” for each entity is defined as net income (loss), excluding net income from discontinued operations, net of tax (excluding dividends received from discontinued operations), before depreciation and amortization, finance expenses, net, and income tax expense (benefit). |
| Adjusted EBITDA is not recognized under IFRS or any other generally accepted accounting principles as measures of financial performance and should not be considered as substitutes for net income or loss, cash flow from operations or other measures of operating performance or liquidity determined in accordance with IFRS. Adjusted EBITDA is not intended to represent funds available for dividends or other discretionary uses because those funds may be required for debt service, capital expenditures, working capital and other commitments and contingencies. Adjusted EBITDA presents limitations that impair its use as a measure of profitability since it does not take into consideration certain costs and expenses that result from each business that could have a significant effect on its net income, such as financial expenses, taxes, depreciation, capital expenses and other related charges. |
| The following tables set forth a reconciliation of net income (loss) to Adjusted EBITDA for our subsidiaries for the six months ended June 30, 2015: |
| Kallpa | CDA | Samay I | OPC | ICPNH | Puerto Quetzal | |||||||||||||||||||
| ($ millions) | ||||||||||||||||||||||||
Net income (loss)(i) | $ | 24 | $ | (4 | )(ii) | $ | (2 | ) | $ | 13 | $ | 8 | $ | 1 | ||||||||||
Depreciation and amortization | 25 | — | — | 12 | 5 | 2 | ||||||||||||||||||
Finance expenses, net | 18 | 1 | 1 | 13 | 4 | 1 | ||||||||||||||||||
Income tax expense | 11 | 3 | 1 | 5 | 1 | 1 | ||||||||||||||||||
|
|
|
|
|
|
|
|
|
|
|
| |||||||||||||
Adjusted EBITDA | $ | 78 | $ | — | $ | — | $ | 43 | $ | 18 | $ | 5 | ||||||||||||
|
|
|
|
|
|
|
|
|
|
|
| |||||||||||||
| (i) | Reflects net income (loss) after elimination and consolidation of adjustments. |
| (ii) | Non-operating income relating to swaps. |
200
Table of Contents
| Nejapa | Cenérgica | COBEE | Central Cardones | Colmito | ||||||||||||||||
| ($ millions) | ||||||||||||||||||||
Net income (loss)(i) | $ | 2 | $ | 1 | $ | 5 | $ | 2 | $ | 1 | ||||||||||
Depreciation and amortization | 3 | — | 2 | 2 | — | |||||||||||||||
Finance expenses, net | — | — | 3 | 1 | 1 | |||||||||||||||
Income tax expense | 1 | — | 1 | 1 | — | |||||||||||||||
|
|
|
|
|
|
|
|
|
| |||||||||||
Adjusted EBITDA | $ | 6 | $ | 1 | $ | 11 | $ | 6 | $ | 2 | ||||||||||
|
|
|
|
|
|
|
|
|
| |||||||||||
| (i) | Reflects net income (loss) after elimination and consolidation of adjustments. |
| CEPP | JPPC | Surpetroil | ICP& Other | Total | ||||||||||||||||
| ($ millions) | ||||||||||||||||||||
Net income (loss)(i) | $ | 2 | $ | — | $ | (1 | ) | $ | (13 | ) | $ | 39 | ||||||||
Depreciation and amortization | 1 | 2 | 1 | 3 | 58 | |||||||||||||||
Finance expenses, net | (1 | ) | — | 1 | 10 | 53 | ||||||||||||||
Income tax expense | 1 | — | — | (1 | ) | 25 | ||||||||||||||
|
|
|
|
|
|
|
|
|
| |||||||||||
Adjusted EBITDA | $ | 3 | $ | 2 | $ | 1 | $ | (1 | ) | $ | 175 | |||||||||
|
|
|
|
|
|
|
|
|
| |||||||||||
| (i) | Reflects net income (loss) after elimination and consolidation of adjustments. |
| 2. | Net debt is defined as total debt attributable to the relevant subsidiary, minus the cash and short term deposits and restricted cash of such companies. Net debt is not a measure of liabilities in accordance with IFRS. The tables below set forth a reconciliation of net debt to total debt for our subsidiaries. |
| Kallpa | CDA | Samay I | OPC | ICPNH | Puerto Quetzal | Nejapa | Cenérgica | Kanan | ||||||||||||||||||||||||||||
| ($ millions) | ||||||||||||||||||||||||||||||||||||
Total debt | $ | 438 | $ | 546 | $ | 244 | $ | 422 | $ | 104 | $ | 22 | $ | — | $ | — | $ | — | ||||||||||||||||||
Cash, short term deposits and restricted cash | 29 | 93 | 23 | 212 | 16 | 6 | 27 | 1 | 4 | |||||||||||||||||||||||||||
|
|
|
|
|
|
|
|
|
|
|
|
|
|
|
|
|
| |||||||||||||||||||
Net Debt | $ | 409 | $ | 453 | $ | 221 | $ | 210 | $ | 88 | $ | 16 | $ | (27 | ) | $ | (1 | ) | $ | (4 | ) | |||||||||||||||
|
|
|
|
|
|
|
|
|
|
|
|
|
|
|
|
|
| |||||||||||||||||||
| COBEE | Central Cardones | Colmito | CEPP | JPPC | Surpetroil | Inkia & Other | ICP& Other | Total | ||||||||||||||||||||||||||||
| ($ millions) | ||||||||||||||||||||||||||||||||||||
Total debt | $ | 79 | $ | 47 | $ | 18 | $ | 25 | $ | 7 | $ | 3 | $ | 448 | $ | 111 | $ | 2,514 | ||||||||||||||||||
Cash, short term deposits and restricted cash | 25 | 4 | 2 | 1 | 4 | 1 | 146 | 27 | 621 | |||||||||||||||||||||||||||
|
|
|
|
|
|
|
|
|
|
|
|
|
|
|
|
|
| |||||||||||||||||||
Net Debt | $ | 54 | $ | 43 | $ | 16 | $ | 24 | $ | 3 | $ | 2 | $ | 302 | $ | 84 | $ | 1,893 | ||||||||||||||||||
|
|
|
|
|
|
|
|
|
|
|
|
|
|
|
|
|
| |||||||||||||||||||
| 3. | Through ICPNH, we indirectly hold 65% interests in Corinto and Tipitapa Power and 61% interests in Amayo I and Amayo II. |
| 4. | Figures include Puerto Quetzal and Poliwatt Limited (one of our subsidiaries that performs administrative functions and maintains certain licenses on behalf of Puerto Quetzal). |
| 5. | In January 2015, we acquired Crystal Power’s 29% stake in Nejapa in connection with the settlement of our shareholder dispute with Crystal Power. Figures include amounts related to Nejapa’s branch and main office. |
| 6. | Figures include JPPC and Private Power Operator Ltd. (one of our subsidiaries that employs JPPC’s employees and performs administrative-related functions). |
| 7. | Figures include Surpetroil and Surenergy S.A.S ESP (one of our subsidiaries that performs administrative functions and maintains certain licenses on behalf of Surpetroil). |
| 8. | In addition to the results of certain of our generation assets, our Other segment also includes expenses and adjustments relating to our headquarters and intermediate holding companies. |
| 9. | Reflects $448 million of Inkia’s outstanding debt. |
| 10. | Includes $12 million of outstanding ICP debt and $99 million of ICPI debt. |
201
Table of Contents
The following table sets forth summary financial information for our generation subsidiaries for the year ended December 31, 2015:
Year Ended December 31, 2015 | ||||||||||||||||||||||||
Entity | Ownership Interest (%) | Sales | Cost of Sales | Adjusted EBITDA1 | Outstanding debt2 | Net debt3 | ||||||||||||||||||
| ($ millions) | ||||||||||||||||||||||||
Peru segment | ||||||||||||||||||||||||
Kallpa | 75 | $ | 448 | $ | 279 | $ | 152 | $ | 416 | $ | 388 | |||||||||||||
Assets in advance stages of construction | ||||||||||||||||||||||||
CDA | 75 | — | — | — | 536 | 519 | ||||||||||||||||||
Samay I | 75 | — | — | — | 285 | 253 | ||||||||||||||||||
Israel segment | ||||||||||||||||||||||||
OPC | 80 | 318 | 235 | 79 | 383 | 255 | ||||||||||||||||||
AIE | 100 | 8 | 7 | — | — | — | ||||||||||||||||||
Central America segment | ||||||||||||||||||||||||
ICPNH4 | 61-65 | 111 | 73 | 36 | 99 | 76 | ||||||||||||||||||
Puerto Quetzal5 | 100 | 109 | 94 | 10 | 15 | 7 | ||||||||||||||||||
Nejapa6 | 100 | 100 | 85 | 12 | 6 | (3 | ) | |||||||||||||||||
Cenérgica | 100 | 17 | 13 | 4 | 1 | (1 | ) | |||||||||||||||||
Asset in advance stages of construction | ||||||||||||||||||||||||
Kanan | 100 | — | — | — | — | (3 | ) | |||||||||||||||||
Other segment | ||||||||||||||||||||||||
COBEE | 100 | 43 | 18 | 21 | 69 | 50 | ||||||||||||||||||
Central Cardones | 87 | 14 | 2 | 10 | 44 | 39 | ||||||||||||||||||
Colmito | 100 | 28 | 25 | 3 | 16 | 15 | ||||||||||||||||||
CEPP | 97 | 39 | 31 | 6 | 13 | 8 | ||||||||||||||||||
JPPC7 | 100 | 45 | 41 | 2 | 5 | 1 | ||||||||||||||||||
Surpetroil8 | 60 | 8 | 6 | 1 | 3 | 2 | ||||||||||||||||||
Holdings9 | ||||||||||||||||||||||||
Inkia & Other | 100 | 1 | — | (4 | ) | 565 | 10 | 273 | ||||||||||||||||
IC Power & Other | 100 | — | — | (6 | ) | 109 | 11 | 24 | ||||||||||||||||
|
|
|
|
|
|
|
|
|
|
|
| |||||||||||||
Total | $ | 1,289 | $ | 909 | $ | 326 | $ | 2,565 | $ | 1,903 | ||||||||||||||
|
|
|
|
|
|
|
|
|
| |||||||||||||||
| 1. | “Adjusted EBITDA” for each entity for the period is defined as income (loss) before depreciation and amortization, finance expenses, net and income tax expense (benefit). |
Adjusted EBITDA is not recognized under IFRS or any other generally accepted accounting principles as a measure of financial performance and should not be considered as a substitute for net income or loss, cash flow from operations or other measures of operating performance or liquidity determined in accordance with IFRS. Adjusted EBITDA is not intended to represent funds available for dividends or other discretionary uses because those funds may be required for debt service, capital expenditures, working capital and other commitments and contingencies. Adjusted EBITDA presents limitations that impair its use as a measure of profitability since it does not take into consideration certain costs and expenses that result from each business that could have a significant effect on its net income, such as financial expenses, taxes, depreciation, capital expenses and other related charges.
202
Table of Contents
The following tables set forth a reconciliation of net income (loss) to Adjusted EBITDA for our generation subsidiaries for the year ended December 31, 2015:
Kallpa | CDA | Samay I | OPC | AIE | ICPNH | Puerto | ||||||||||||||||||||||
| ($ millions) | ||||||||||||||||||||||||||||
Net income (loss)(i) | $ | 43 | $ | (8 | ) | $ | (4 | ) | $ | 20 | $ | 2 | $ | 17 | $ | 2 | ||||||||||||
Depreciation and amortization | 50 | — | — | 26 | — | 10 | 3 | |||||||||||||||||||||
Finance expenses, net | 36 | 3 | 3 | 26 | (3 | ) | 9 | 2 | ||||||||||||||||||||
Income tax expense (benefit) | 23 | 5 | 1 | 7 | 1 | — | 3 | |||||||||||||||||||||
|
|
|
|
|
|
|
|
|
|
|
|
|
| |||||||||||||||
Adjusted EBITDA | $ | 152 | $ | — | $ | — | $ | 79 | $ | — | $ | 36 | $ | 10 | ||||||||||||||
|
|
|
|
|
|
|
|
|
|
|
|
|
| |||||||||||||||
| (i) | Reflects net income after elimination and consolidation adjustment |
Nejapa | Cenérgica | Kanan | COBEE | Central | Colmito | |||||||||||||||||||
| ($ millions) | ||||||||||||||||||||||||
Net income (loss) | $ | 4 | $ | 2 | $ | — | $ | 10 | $ | 3 | $ | 1 | ||||||||||||
Depreciation and amortization | 4 | 1 | — | 4 | 4 | 1 | ||||||||||||||||||
Finance expenses, net | — | — | — | 5 | 2 | 1 | ||||||||||||||||||
Income tax expense (benefit) | 4 | 1 | — | 2 | 1 | — | ||||||||||||||||||
|
|
|
|
|
|
|
|
|
|
|
| |||||||||||||
Adjusted EBITDA | $ | 12 | $ | 4 | $ | — | $ | 21 | $ | 10 | $ | 3 | ||||||||||||
|
|
|
|
|
|
|
|
|
|
|
| |||||||||||||
CEPP | JPPC | Surpetroil | Inkia | IC Power | Total | |||||||||||||||||||
| ($ millions) | ||||||||||||||||||||||||
Net income (loss) | $ | 3 | $ | (2 | ) | $ | (1 | ) | $ | (32 | ) | $ | (7 | ) | $ | 53 | ||||||||
Depreciation and amortization | 3 | 4 | 3 | 6 | — | 119 | ||||||||||||||||||
Finance expenses, net | (1 | ) | 1 | — | 20 | — | 104 | |||||||||||||||||
Income tax expense (benefit) | 1 | (1 | ) | (1 | ) | 2 | 1 | 50 | ||||||||||||||||
|
|
|
|
|
|
|
|
|
|
|
| |||||||||||||
Adjusted EBITDA | $ | 6 | $ | 2 | $ | 1 | $ | (4 | ) | $ | (6 | ) | $ | 326 | ||||||||||
|
|
|
|
|
|
|
|
|
|
|
| |||||||||||||
| 2. | Includes short-term and long-term debt. |
| 3. | Net debt is defined as total debt attributable to each of the companies, excluding debt owed to a parent company, and the cash and short term deposits and restricted cash of the relevant company. Net debt is not a measure recognized under IFRS. The tables below set forth a reconciliation of total debt to net debt for us and our subsidiaries. |
Kallpa | CDA | Samay I | OPC | AIE | ICPNH | Puerto | Nejapa | Cenérgica | ||||||||||||||||||||||||||||
| ($ millions) | ||||||||||||||||||||||||||||||||||||
Total debt | $ | 416 | $ | 536 | $ | 285 | $ | 383 | $ | — | $ | 99 | $ | 15 | $ | 6 | $ | 1 | ||||||||||||||||||
Cash, short term deposits and restricted cash | 28 | 17 | 32 | 128 | — | 23 | 8 | 9 |
| 2 |
| |||||||||||||||||||||||||
|
|
|
|
|
|
|
|
|
|
|
|
|
|
|
|
|
| |||||||||||||||||||
Net Debt | $ | 388 | $ | 519 | $ | 253 | $ | 255 | $ | — | $ | 76 | $ | 7 | $ | (3 | ) | $ | (1 | ) | ||||||||||||||||
|
|
|
|
|
|
|
|
|
|
|
|
|
|
|
|
|
| |||||||||||||||||||
Kanan | COBEE | Central | Colmito | CEPP | JPPC | Surpetroil | Inkia & | ICP & | Total | |||||||||||||||||||||||||||||||
| ($ millions) | ||||||||||||||||||||||||||||||||||||||||
Total debt | — | $ | 69 | $ | 44 | $ | 16 | $ | 13 | $ | 5 | $ | 3 | $ | 565 | $ | 109 | $ | 2,565 | |||||||||||||||||||||
Cash, short term deposits and restricted cash | 3 | 19 | 5 | 1 | 5 | 4 | 1 | 292 | 85 | 662 | ||||||||||||||||||||||||||||||
|
|
|
|
|
|
|
|
|
|
|
|
|
|
|
|
|
|
|
| |||||||||||||||||||||
Net Debt | $ | (3 | ) | $ | 50 | $ | 39 | $ | 15 | $ | 8 | $ | 1 | $ | 2 | $ | 273 | $ | 24 | $ | 1,903 | |||||||||||||||||||
|
|
|
|
|
|
|
|
|
|
|
|
|
|
|
|
|
|
|
| |||||||||||||||||||||
203
Table of Contents
| 4. | Through ICPNH, we indirectly hold 65% interests in Corinto and Tipitapa Power and 61% interests in Amayo I and Amayo II. |
| 5. | Figures include Puerto Quetzal and Poliwatt Limited (one of our subsidiaries that performs administrative functions and maintains certain licenses on behalf of Puerto Quetzal). |
| 6. | Figures include amounts related to Nejapa’s branch and main office. |
| 7. | Figures include JPPC and Private Power Operator Ltd. (our subsidiary that employs JPPC’s employees and performs administrative-related functions). |
| 8. | Figures include Surpetroil and Surenergy S.A.S ESP (our subsidiary that performs administrative functions and maintains certain licenses on behalf of Surpetroil). |
| 9. | In addition to the results of certain of our generation assets, our Other segment also includes expenses and other adjustments relating to our headquarters and intermediate holding companies. |
| 10. | Includes $448 million of Inkia’s debt and $117 million of ICPDH’s debt. |
| 11. | Includes $12 million of our outstanding debt and $97 million of ICPI debt. |
The following table sets forth summary financial information for our generation subsidiaries as of and for the year ended December 31, 2014:
Year Ended December 31, 2014 | ||||||||||||||||||||||||
Entity | Ownership (%) | Sales | Cost of | Adjusted | Outstanding | Net Debt3 | ||||||||||||||||||
| ($ millions) | ||||||||||||||||||||||||
Peru segment | ||||||||||||||||||||||||
Kallpa | 75 | $ | 437 | $ | 270 | $ | 154 | $ | 453 | $ | 428 | |||||||||||||
Assets in advanced stages of construction | ||||||||||||||||||||||||
CDA | 75 | — | — | — | 444 | 338 | ||||||||||||||||||
Samay I | 75 | — | — | — | 145 | 11 | ||||||||||||||||||
Israel segment | ||||||||||||||||||||||||
OPC | 80 | 413 | 252 | 153 | 419 | 231 | ||||||||||||||||||
Central America segment | ||||||||||||||||||||||||
ICPNH4 | 61-65 | 125 | 98 | 22 | 108 | 92 | ||||||||||||||||||
Puerto Quetzal5 | 100 | 33 | 29 | 3 | 32 | 14 | ||||||||||||||||||
Nejapa6 | 71 | 132 | 119 | 11 | — | (23 | ) | |||||||||||||||||
Cenérgica | 100 | 18 | 14 | 4 | — | (4 | ) | |||||||||||||||||
Asset in advanced stages of construction | ||||||||||||||||||||||||
Kanan | 100 | — | — | — | — | (4 | ) | |||||||||||||||||
Other | ||||||||||||||||||||||||
COBEE | 100 | 41 | 18 | 19 | 85 | 43 | ||||||||||||||||||
Central Cardones | 87 | 11 | 2 | 7 | 48 | 44 | ||||||||||||||||||
Colmito | 100 | 38 | 36 | 2 | 20 | 19 | ||||||||||||||||||
CEPP | 97 | 73 | 56 | 16 | 30 | 22 | ||||||||||||||||||
JPPC7 | 100 | 41 | 39 | 1 | 8 | 4 | ||||||||||||||||||
Surpetroil8 | 60 | 9 | 3 | 5 | 3 | 2 | ||||||||||||||||||
Holdings9 | ||||||||||||||||||||||||
Inkia & Other | 100 | 1 | — | 1 | 447 | 10 | 262 | |||||||||||||||||
ICP & Other | 100 | — | — | (3 | ) | 106 | 11 | 78 | ||||||||||||||||
|
|
|
|
|
|
|
|
|
|
|
| |||||||||||||
Total | $ | 1,372 | $ | 936 | $ | 395 | $ | 2,348 | $ | 1,557 | ||||||||||||||
|
|
|
|
|
|
|
|
|
| |||||||||||||||
| 1. | “Adjusted EBITDA” for each entity for the period is defined as net income (loss) before depreciation and amortization, financing expenses, net, income tax expense (benefit) and asset write-off, excluding share in income (loss) from associates, gain on bargain purchase, measurement to fair value of pre-existing share and net income from discontinued operations, net of tax (excluding dividends received from discontinued operations). |
Adjusted EBITDA is not recognized under IFRS or any other generally accepted accounting principles as a measure of financial performance and should not be considered as a substitute for net income or loss, cash flow from operations or other measures of operating performance or liquidity determined in accordance with IFRS. Adjusted EBITDA is not intended to represent funds available for dividends or other discretionary uses because those funds may be required for debt service, capital expenditures, working capital and other commitments and contingencies. Adjusted EBITDA presents limitations that impair its use as a measure of profitability since it |
204
Table of Contents
| does not take into consideration certain costs and expenses that result from each business that could have a significant effect on its net income, such as financial expenses, taxes, depreciation, capital expenses and other related charges. |
| The following tables set forth a reconciliation of net income (loss) to Adjusted EBITDA for our generation subsidiaries for the year ended December 31, 2014: |
Kallpa | CDA | Samay I | OPC | ICPNH | Puerto | |||||||||||||||||||
| ($ millions) | ||||||||||||||||||||||||
Net income (loss)(i) | $ | 50 | $ | (5 | ) | — | $ | 71 | $ | 6 | $ | (1 | ) | |||||||||||
Depreciation and amortization | 46 | — | — | 25 | 8 | 1 | ||||||||||||||||||
Financing expenses, net | 35 | — | — | 31 | 7 | 1 | ||||||||||||||||||
Income tax expense | 23 | 5 | — | 26 | 1 | 2 | ||||||||||||||||||
|
|
|
|
|
|
|
|
|
|
|
| |||||||||||||
Adjusted EBITDA | $ | 154 | $ | — | $ | — | $ | 153 | $ | 22 | $ | 3 | ||||||||||||
|
|
|
|
|
|
|
|
|
|
|
| |||||||||||||
| (i) | Reflects net income after elimination and consolidation adjustments. |
Nejapa | Cenérgica | COBEE | Central | Colmito | ||||||||||||||||
| ($ millions) | ||||||||||||||||||||
Net income (loss) | $ | 4 | $ | 2 | $ | 9 | $ | (1 | ) | $ | — | |||||||||
Depreciation and amortization | 5 | 1 | 4 | 4 | 1 | |||||||||||||||
Financing expenses, net | — | — | 4 | 2 | 1 | |||||||||||||||
Income tax expense | 2 | 1 | 2 | 2 | — | |||||||||||||||
|
|
|
|
|
|
|
|
|
| |||||||||||
Adjusted EBITDA | $ | 11 | $ | 4 | $ | 19 | $ | 7 | $ | 2 | ||||||||||
|
|
|
|
|
|
|
|
|
| |||||||||||
CEPP | JPPC | Surpetroil | Inkia & | ICP & | Total | |||||||||||||||||||
| ($ millions) | ||||||||||||||||||||||||
Net income (loss) | $ | 9 | $ | (2 | ) | $ | 2 | $ | 131 | $ | (19 | ) | $ | 256 | ||||||||||
Depreciation and amortization | 3 | 3 | 1 | 6 | — | 108 | ||||||||||||||||||
Financing expenses, net | 1 | 1 | 1 | 23 | 12 | 119 | ||||||||||||||||||
Income tax expense (benefit) | 3 | (1 | ) | 1 | (8 | ) | 4 | 63 | ||||||||||||||||
Asset write-off | — | — | — | 35 | — | 35 | ||||||||||||||||||
Share in income (loss) from associates | — | — | — | (2 | ) | — | (2 | ) | ||||||||||||||||
Gain on bargain purchase | — | — | — | (68 | ) | — | (68 | ) | ||||||||||||||||
Measurement to fair value of pre-existing share | — | — | — | (3 | ) | — | (3 | ) | ||||||||||||||||
Net income from discontinued operations, net of tax (excluding dividends received from discontinued operations) | — | — | — | (113 | ) | — | (113 | ) | ||||||||||||||||
|
|
|
|
|
|
|
|
|
|
|
| |||||||||||||
Adjusted EBITDA | $ | 16 | $ | 1 | $ | 5 | $ | 1 | $ | (3 | ) | $ | 395 | |||||||||||
|
|
|
|
|
|
|
|
|
|
|
| |||||||||||||
| 2. | Includes short-term and long-term debt. |
| 3. | Net debt is defined as total debt attributable to each of the companies, excluding debt owed to a parent company, and the cash and short term deposits and restricted cash of the relevant company. Net debt is not a measure recognized under IFRS. The tables below set forth a reconciliation of total debt to net debt for us and our subsidiaries. |
Kallpa | CDA | Samay I | OPC | ICPNH | Puerto | Nejapa | Cenérgica | Kanan | COBEE | |||||||||||||||||||||||||||||||
| ($ millions) | ||||||||||||||||||||||||||||||||||||||||
Total debt | $ | 453 | $ | 444 | $ | 145 | $ | 419 | $ | 108 | $ | 32 | $ | — | $ | — | $ | — | $ | 85 | ||||||||||||||||||||
Cash, short term deposits and restricted cash | 25 | 106 | 134 | 188 | 16 | 18 | 23 | 4 | 4 | 42 | ||||||||||||||||||||||||||||||
|
|
|
|
|
|
|
|
|
|
|
|
|
|
|
|
|
|
|
| |||||||||||||||||||||
Net debt | $ | 428 | $ | 338 | $ | 11 | $ | 231 | $ | 92 | $ | 14 | $ | (23 | ) | $ | (4 | ) | $ | (4 | ) | $ | 43 | |||||||||||||||||
|
|
|
|
|
|
|
|
|
|
|
|
|
|
|
|
|
|
|
| |||||||||||||||||||||
205
Table of Contents
Central Cardones | Colmito | CEPP | JPPC | Surpetroil | Inkia & | ICP & | Total | |||||||||||||||||||||||||
| ($ millions) | ||||||||||||||||||||||||||||||||
Total debt | $ | 48 | $ | 20 | $ | 30 | $ | 8 | $ | 3 | $ | 447 | $ | 106 | $ | 2,348 | ||||||||||||||||
Cash, short term deposits and restricted cash | 4 | 1 | 8 | 4 | 1 | 185 | 28 | 791 | ||||||||||||||||||||||||
|
|
|
|
|
|
|
|
|
|
|
|
|
|
|
| |||||||||||||||||
Net debt | $ | 44 | $ | 19 | $ | 22 | $ | 4 | $ | 2 | $ | 262 | $ | 78 | $ | 1,557 | ||||||||||||||||
|
|
|
|
|
|
|
|
|
|
|
|
|
|
|
| |||||||||||||||||
| 4. | Through ICPNH, we indirectly hold 65% interests in Corinto and Tipitapa Power and 61% interests in Amayo I and Amayo II. |
| 5. | Reflects 100% of Puerto Quetzal’s financial results from the date of consolidation (September 2014). Figures include Puerto Quetzal and Poliwatt Limited (one of our subsidiaries that performs administrative functions and maintains certain licenses on behalf of Puerto Quetzal). |
| 6. | Figures include amounts related to Nejapa’s branch and main office. |
| 7. | Figures include JPPC and Private Power Operator Ltd. (our subsidiary that employs JPPC’s employees and performs administrative-related functions). |
| 8. | Figures include Surpetroil and Surenergy S.A.S ESP (our subsidiary that performs administrative functions and maintains certain licenses on behalf of Surpetroil). |
| 9. | In addition to the results of certain of our generation assets, our Other segment also includes expenses and other adjustments relating to our headquarters and intermediate holding companies. |
| 10. | Reflects $447 million of Inkia’s debt. |
| 11. | Includes $12 million of our outstanding debt and $94 million of ICPI debt. |
The following table sets forth summary financial information for our generation subsidiaries as of and for the year ended December 31, 2013:
Year Ended December 31, 2013 | ||||||||||||||||||||||||
Entity | Ownership | Sales | Cost of | Adjusted | Outstanding | Net debt3 | ||||||||||||||||||
| ($ millions) | ||||||||||||||||||||||||
Peru segment | ||||||||||||||||||||||||
Kallpa | 75 | $ | 394 | $ | 239 | $ | 141 | $ | 365 | $ | 351 | |||||||||||||
Assets in advanced stages of construction | ||||||||||||||||||||||||
CDA | 100 | — | — | — | 109 | 52 | ||||||||||||||||||
Samay I | 100 | — | — | — | — | (28 | ) | |||||||||||||||||
Israel segment | ||||||||||||||||||||||||
OPC | 80 | 187 | 139 | 43 | 487 | 424 | ||||||||||||||||||
Central America segment | ||||||||||||||||||||||||
Nejapa4 | 71 | 135 | 121 | 11 | — | (17 | ) | |||||||||||||||||
Cenérgica | 100 | 12 | 6 | 6 | — | (1 | ) | |||||||||||||||||
Other | ||||||||||||||||||||||||
COBEE | 100 | 41 | 18 | 18 | 50 | 31 | ||||||||||||||||||
Central Cardones | 87 | 11 | 2 | 7 | 51 | 48 | ||||||||||||||||||
Colmito5 | 100 | 1 | — | — | — | — | ||||||||||||||||||
CEPP | 97 | 92 | 69 | 21 | 38 | 28 | ||||||||||||||||||
Holdings6 | ||||||||||||||||||||||||
Acter7 | 100 | — | — | — | 122 | — | ||||||||||||||||||
Inkia &Other8 | 100 | — | — | — | 447 | 9 | 295 | |||||||||||||||||
ICP & Other | 100 | — | — | — | — | (40 | ) | |||||||||||||||||
|
|
|
|
|
|
|
|
|
|
|
| |||||||||||||
Total | $ | 873 | $ | 594 | $ | 247 | $ | 1,669 | $ | 1,143 | ||||||||||||||
|
|
|
|
|
|
|
|
|
| |||||||||||||||
| 1. | “Adjusted EBITDA” for each entity for the period is defined as net income before depreciation and amortization, financing expenses, net and income tax expense, excluding share in income (loss) from associates, gain on bargain purchase and net income from discontinued operations, net of tax (excluding dividends received from discontinued operations). |
Adjusted EBITDA is not recognized under IFRS or any other generally accepted accounting principles as a measure of financial performance and should not be considered a substitute for net income or loss, cash flow from operations or other measures of operating |
206
Table of Contents
| performance or liquidity determined in accordance with IFRS. Adjusted EBITDA is not intended to represent funds available for dividends or other discretionary uses because those funds may be required for debt service, capital expenditures, working capital and other commitments and contingencies. Adjusted EBITDA presents limitations that impair its use as a measure of profitability since it does not take into consideration certain costs and expenses that result from each business that could have a significant effect on our net income, such as finance expenses, taxes, depreciation, capital expenses and other related charges. |
| The following tables set forth a reconciliation of net income from continuing operations to Adjusted EBITDA for our generation subsidiaries for the year ended December 31, 2013: |
Kallpa | CDA | Samay I | OPC | Nejapa | Cenérgica | COBEE | ||||||||||||||||||||||
| ($ millions) | ||||||||||||||||||||||||||||
Net income (loss)(i) | $ | 42 | $ | (7 | ) | $ | — | $ | 6 | $ | 3 | $ | 4 | $ | 8 | |||||||||||||
Depreciation and amortization | 40 | — | — | 12 | 6 | 1 | 4 | |||||||||||||||||||||
Financing expenses, net | 33 | 1 | — | 22 | — | — | 3 | |||||||||||||||||||||
Income tax expense | 26 | 6 | — | 3 | 2 | 1 | 3 | |||||||||||||||||||||
|
|
|
|
|
|
|
|
|
|
|
|
|
| |||||||||||||||
Adjusted EBITDA | $ | 141 | $ | — | $ | — | $ | 43 | $ | 11 | $ | 6 | $ | 18 | ||||||||||||||
|
|
|
|
|
|
|
|
|
|
|
|
|
| |||||||||||||||
| (i) | Reflects net income after elimination and consolidation adjustments. |
| Central Cardones | Colmito | CEPP | Acter | Inkia & Other | ICP & Other | Total | ||||||||||||||||||||||
| ($ millions) | ||||||||||||||||||||||||||||
Net income(i) | $ | 2 | $ | — | $ | 12 | $ | — | $ | 4 | $ | — | $ | 74 | ||||||||||||||
Depreciation and amortization | 4 | — | 3 | — | 6 | — | 76 | |||||||||||||||||||||
Financing expenses, net | 1 | — | 1 | — | 19 | — | 80 | |||||||||||||||||||||
Income tax expense | — | — | 5 | — | 2 | — | 48 | |||||||||||||||||||||
Share in income (loss) from associates | — | — | — | — | (2 | ) | — | (2 | ) | |||||||||||||||||||
Gain on bargain purchase | — | — | — | — | (1 | ) | — | (1 | ) | |||||||||||||||||||
Net income from discontinued operations, net of tax (excluding dividends received from discontinued operations) | — | — | — | — | (28 | ) | — | (28 | ) | |||||||||||||||||||
|
|
|
|
|
|
|
|
|
|
|
|
|
| |||||||||||||||
Adjusted EBITDA | $ | 7 | $ | — | $ | 21 | $ | — | $ | — | $ | — | $ | 247 | ||||||||||||||
|
|
|
|
|
|
|
|
|
|
|
|
|
| |||||||||||||||
| (i) | Reflects net income after elimination and consolidation adjustments. |
| 2. | Includes short-term and long-term debt and excludes loans and notes owed to a parent company. |
| 3. | Net debt is defined as total debt attributable to each of the companies, excluding debt owed to a parent company, and the cash and short term deposits and restricted cash of the relevant company. Net debt is not a measure recognized under IFRS. The tables below set forth a reconciliation of total debt to net debt for us and our subsidiaries. |
Kallpa | CDA | Samay I | OPC | Nejapa | Cenérgica | COBEE | Central | Colmito | CEPP | Acter | Inkia & | ICP & | Total | |||||||||||||||||||||||||||||||||||||||||||
| ($ millions) | ||||||||||||||||||||||||||||||||||||||||||||||||||||||||
Total debt | $ | 365 | $ | 109 | $ | — | $ | 487 | $ | — | $ | — | $ | 50 | $ | 51 | $ | — | $ | 38 | $ | 122 | $ | 447 | $ | — | $ | 1,669 | ||||||||||||||||||||||||||||
Cash, short term deposits and restricted cash | 14 | 57 | 28 | 63 | 17 | 1 | 19 | 3 | — | 10 | 122 | 152 | 40 | 526 | ||||||||||||||||||||||||||||||||||||||||||
|
|
|
|
|
|
|
|
|
|
|
|
|
|
|
|
|
|
|
|
|
|
|
|
|
|
|
| |||||||||||||||||||||||||||||
Net debt | $ | 351 | $ | 52 | $ | (28 | ) | $ | 424 | $ | (17 | ) | $ | (1 | ) | $ | 31 | $ | 48 | $ | — | $ | 28 | $ | — | $ | 295 | $ | (40 | ) | $ | 1,143 | ||||||||||||||||||||||||
|
|
|
|
|
|
|
|
|
|
|
|
|
|
|
|
|
|
|
|
|
|
|
|
|
|
|
| |||||||||||||||||||||||||||||
| 4. | Figures include amounts related to Nejapa’s branch and main office. |
| 5. | Reflects 100% of Colmito’s financial results from the date of consolidation (October 2013). |
| 6. | In addition to the results of certain of our generation assets, our Other segment also includes expenses and other adjustments relating to our headquarters and intermediate holding companies. |
207
Table of Contents
| 7. | Acter Holdings, the wholly-owned subsidiary that previously held our indirect interest in Edegel prior to September 2014. |
| 8. | Prior to the date of JPPC’s consolidation (May 2014), JPPC was an investment carried at cost basis, and any dividends were paid to Inkia were reflected in Inkia & Other during the relevant periods. |
| 9. | Reflects $447 million of Inkia’s debt. |
The following table sets forth summary operational information for our generation subsidiaries and our associated company as of and for the six months ended June 30, 2016:
Six Months Ended June 30, 2016 | ||||||||||||||||||||||||||||
Entity | Installed Capacity | Proportionate | Gross | Availability | Average heat | Average | Average | |||||||||||||||||||||
| Operating Companies | ||||||||||||||||||||||||||||
Peru segment | ||||||||||||||||||||||||||||
Kallpa | 1,063 | 797 | 2,997 | 94 | 8,931 | 55 | 25 | |||||||||||||||||||||
Samay I | 616 | 462 | 51 | 100 | 10,174 | 167 | 83 | |||||||||||||||||||||
Israel segment | ||||||||||||||||||||||||||||
OPC | 440 | 352 | 1,613 | 83 | 6,742 | 75 | 39 | |||||||||||||||||||||
AIE4 | 18 | 18 | 53 | 97 | 4,221 | 65 | 61 | |||||||||||||||||||||
Central America segment | ||||||||||||||||||||||||||||
ICPNH | 185 | 117 | 522 | 88 | 5,847 | 85 | 34 | |||||||||||||||||||||
Puerto Quetzal | 179 | 179 | 266 | 91 | 9,048 | 81 | 43 | |||||||||||||||||||||
Nejapa | 140 | 140 | 231 | 98 | 9,600 | 79 | 57 | |||||||||||||||||||||
Kanan | 92 | 92 | 122 | 59 | 9,926 | 114 | 114 | |||||||||||||||||||||
Other | ||||||||||||||||||||||||||||
COBEE | 228 | 228 | 531 | 93 | 13,856 | 43 | 43 | |||||||||||||||||||||
Central Cardones | 153 | 133 | — | 100 | — | — | — | |||||||||||||||||||||
Colmito | 58 | 58 | 6 | 100 | 9,251 | 76 | 76 | |||||||||||||||||||||
CEPP | 67 | 65 | 142 | 79 | 9,519 | 81 | 81 | |||||||||||||||||||||
JPPC | 60 | 60 | 168 | 76 | 8,213 | 87 | 87 | |||||||||||||||||||||
Surpetroil | 31 | 19 | 35 | 95 | 11,961 | 85 | 85 | |||||||||||||||||||||
Pedregal | 54 | 11 | 182 | 97 | 8,843 | 84 | 84 | |||||||||||||||||||||
|
|
|
|
|
|
|
|
|
|
|
|
|
| |||||||||||||||
Total | 3,384 | 2,731 | 6,919 | |||||||||||||||||||||||||
|
|
|
|
|
| |||||||||||||||||||||||
| 1. | Reflects 100% of the capacity of each of our assets, regardless of the ownership interest in the entity that owns each such asset. |
| 2. | Reflects the proportionate capacity of each of our assets, as determined by the ownership interest in the entity that owns each such asset. |
| 3. | Heat rate is defined as the number of British thermal units, or Btus, of energy contained in the fuel required to produce a kilowatt-hour of energy (btu/kWh) for thermal plants. |
| 4. | AIE also holds a conditional license for the construction of a cogeneration power station in Israel. This station will be developed as a greenfield project (at an expected cost of $250 million, including the acquisition price of AIE), based upon a plant with 140 MW of capacity. Construction commenced in June 2016 and COD is expected by the end of 2018. |
208
Table of Contents
The following table sets forth summary operational information for our generation subsidiaries and our associated company as of and for the six months ended June 30, 2015:
| Six Months Ended June 30, 2015 | ||||||||||||||||||||||||||||
Entity | Installed capacity (MW)1 | Proportionate Capacity2 | Gross energy generated (GWh) | Availability factor (%) | Average heat rate3 | Average sales price ($ per MWh) | Average fuel cost ($ per MWh) | |||||||||||||||||||||
| Operating Companies | ||||||||||||||||||||||||||||
Peru segment | ||||||||||||||||||||||||||||
Kallpa | 1,063 | 797 | 1,928 | 94 | 7,349 | 59 | 33 | |||||||||||||||||||||
Israel segment | ||||||||||||||||||||||||||||
OPC | 440 | 352 | 1,937 | 99 | 6,709 | 80 | 36 | |||||||||||||||||||||
Central America segment | ||||||||||||||||||||||||||||
ICPNH | 185 | 117 | 536 | 89 | 8,996 | 109 | 52 | |||||||||||||||||||||
Puerto Quetzal | 179 | 179 | 349 | 93 | 9,121 | 126 | 77 | |||||||||||||||||||||
Nejapa | 140 | 140 | 238 | 97 | 9,564 | 95 | 85 | |||||||||||||||||||||
Other | ||||||||||||||||||||||||||||
COBEE | 228 | 228 | 617 | 88 | 13,697 | 37 | 7 | |||||||||||||||||||||
Central Cardones | 153 | 133 | 4 | 100 | 9,900 | 212 | 166 | |||||||||||||||||||||
Colmito | 58 | 58 | 26 | 85 | 8,622 | 120 | 110 | |||||||||||||||||||||
CEPP | 67 | 65 | 147 | 85 | 9,487 | 132 | 80 | |||||||||||||||||||||
JPPC | 60 | 60 | 214 | 83 | 7,963 | 115 | 74 | |||||||||||||||||||||
Surpetroil | 15 | 9 | 24 | 96 | 14,900 | 103 | 27 | |||||||||||||||||||||
Pedregal | 54 | 11 | 194 | 92 | 8,869 | 115 | 76 | |||||||||||||||||||||
|
|
|
|
|
| |||||||||||||||||||||||
Total | 2,642 | 2,149 | 6,214 | |||||||||||||||||||||||||
|
|
|
|
|
| |||||||||||||||||||||||
| 1. | Reflects 100% of the capacity of each of our assets, regardless of our ownership interest in the entity that owns each such asset. |
| 2. | Reflects the proportionate capacity of each of our assets, as determined by our ownership interest in the entity that owns each such asset. |
| 3. | Heat rate is defined as the number of BTUs of energy contained in the fuel required to produce a kilowatt-hour of energy (btu/kWh) for thermal plants. |
209
Table of Contents
The following table sets forth summary operational information for our generation subsidiaries and our associated company as of and for the year ended December 31, 2015:
Year Ended December 31, 2015 | ||||||||||||||||||||||||||||
Entity | Installed Capacity | Proportionate | Gross energy | Availability | Average heat | Average | Average | |||||||||||||||||||||
| Operating Companies | ||||||||||||||||||||||||||||
Peru segment | ||||||||||||||||||||||||||||
Kallpa | 1,063 | 797 | 5,166 | 97 | 7,868 | 57 | 28 | |||||||||||||||||||||
Israel segment | ||||||||||||||||||||||||||||
OPC | 440 | 352 | 3,811 | 99 | 6,730 | 80 | 36 | |||||||||||||||||||||
AIE4 | 18 | 18 | 26 | 5 | 58 | 6 | 4,630 | 53 | 40 | |||||||||||||||||||
Central America segment | ||||||||||||||||||||||||||||
ICPNH | 185 | 117 | 1,095 | 90 | 8,926 | 99 | 51 | |||||||||||||||||||||
Puerto Quetzal | 179 | 179 | 673 | 94 | 9,107 | 113 | 74 | |||||||||||||||||||||
Nejapa | 140 | 140 | 440 | 96 | 9,591 | 117 | 83 | |||||||||||||||||||||
Other | ||||||||||||||||||||||||||||
COBEE | 228 | 228 | 1,081 | 89 | 13,594 | 39 | 16 | |||||||||||||||||||||
Central Cardones | 153 | 133 | 4 | 97 | 11,241 | 217 | 229 | |||||||||||||||||||||
Colmito | 58 | 58 | 27 | 99 | 9,221 | 95 | 114 | |||||||||||||||||||||
CEPP | 67 | 65 | 298 | 81 | 9,470 | 125 | 73 | |||||||||||||||||||||
JPPC | 60 | 60 | 445 | 86 | 7,989 | 101 | 69 | |||||||||||||||||||||
Surpetroil | 20 | 12 | 43 | 96 | 13,829 | 104 | 38 | |||||||||||||||||||||
Pedregal | 54 | 11 | 356 | 94 | 8,859 | 107 | 71 | |||||||||||||||||||||
|
|
|
|
|
|
|
|
|
|
|
|
|
| |||||||||||||||
Total | 2,665 | 2,170 | 13,465 | |||||||||||||||||||||||||
|
|
|
|
|
| |||||||||||||||||||||||
| 1. | Reflects 100% of the capacity of each of our assets, regardless of the ownership interest in the entity that owns each such asset. |
| 2. | Reflects the proportionate capacity of each of our assets, as determined by the ownership interest in the entity that owns each such asset. |
| 3. | Heat rate is defined as the number of Btus of energy contained in the fuel required to produce a kilowatt-hour of energy (btu/kWh) for thermal plants. |
| 4. | AIE also holds a conditional license for the construction of a cogeneration power station in Israel. This station will be developed as a greenfield project (at an expected cost of $250 million, including the acquisition price of AIE), based upon a plant with 140 MW of capacity. Construction commenced in June 2016 and COD is expected by the end of 2018. |
| 5. | Reflects gross energy generated (GWh) since we acquired AIE in August 2015. |
| 6. | Reflects average availability since we acquired AIE in August 2015. AIE’s average availability during the period was affected by preventive major maintenance that was performed after our acquisition of AIE. In the six months ended June 30, 2016, AIE’s average availability was 97%. |
210
Table of Contents
The following table sets forth summary operational information for our generation subsidiaries and our associated company as of and for the year ended December 31, 2014:
Year Ended December 31, 2014 | ||||||||||||||||||||||||||||
Entity1 | Installed capacity | Proportionate | Gross energy | Availability | Average heat | Average | Average | |||||||||||||||||||||
| Operating Companies | ||||||||||||||||||||||||||||
Peru segment | ||||||||||||||||||||||||||||
Kallpa | 1,063 | 797 | 5,920 | 97 | 7,105 | 55 | 24 | |||||||||||||||||||||
Israel segment | ||||||||||||||||||||||||||||
OPC | 440 | 352 | 3,465 | 90 | 6,754 | 104 | 40 | |||||||||||||||||||||
Central America segment | ||||||||||||||||||||||||||||
ICPNH | 185 | 117 | 1,099 | 95 | 9,011 | 143 | 96 | |||||||||||||||||||||
Puerto Quetzal | 179 | 179 | 490 | 97 | 9,182 | 126 | 137 | |||||||||||||||||||||
Nejapa | 140 | 99 | 376 | 97 | 9,597 | 178 | 158 | |||||||||||||||||||||
Other | ||||||||||||||||||||||||||||
COBEE | 228 | 228 | 1,085 | 91 | 13,786 | 40 | 15 | |||||||||||||||||||||
Central Cardones | 153 | 133 | — | 97 | 12,238 | — | ||||||||||||||||||||||
Colmito | 58 | 58 | 6 | 95 | 8,521 | 148 | 241 | |||||||||||||||||||||
CEPP | 67 | 65 | 242 | 89 | 9,539 | 227 | 146 | |||||||||||||||||||||
JPPC | 60 | 60 | 425 | 85 | 8,306 | 182 | 137 | |||||||||||||||||||||
Surpetroil | 15 | 9 | 48 | 84 | 14,900 | 140 | 21 | |||||||||||||||||||||
Pedregal | 54 | 11 | 405 | 93 | 8,800 | 196 | 129 | |||||||||||||||||||||
|
|
|
|
|
|
|
|
|
|
|
|
|
| |||||||||||||||
Total | 2,642 | 2,108 | 13,561 | |||||||||||||||||||||||||
|
|
|
|
|
| |||||||||||||||||||||||
| 1. | Does not include Edegel, which we sold in September 2014. |
| 2. | Reflects 100% of the capacity of each of our assets, regardless of our ownership interest in the entity that owns each such asset. |
| 3. | Reflects the proportionate capacity of each of our assets, as determined by the ownership interest in the entity that owns each such asset. |
| 4. | Heat rate is defined as the number of Btus of energy contained in the fuel required to produce a kilowatt-hour of energy (btu/kWh) for thermal plants. |
211
Table of Contents
The following table sets forth summary operational information for our generation subsidiaries and our associated company as of and for the year ended December 31, 2013:
Year Ended December 31, 2013 | ||||||||||||||||||||||||||||
Entity1 | Installed capacity | Proportionate Capacity3 | Gross energy | Availability | Average heat | Average | Average | |||||||||||||||||||||
| Operating Companies | ||||||||||||||||||||||||||||
Peru segment | ||||||||||||||||||||||||||||
Kallpa | 870 | 652 | 5,459 | 93 | 7,366 | 53 | 21 | |||||||||||||||||||||
Israel segment | ||||||||||||||||||||||||||||
OPC5 | 440 | 352 | 1,357 | 96 | 6,746 | 103 | 38 | |||||||||||||||||||||
Central America segment | ||||||||||||||||||||||||||||
Nejapa | 140 | 99 | 458 | 95 | 9,564 | 185 | 156 | |||||||||||||||||||||
Other | ||||||||||||||||||||||||||||
COBEE | 228 | 228 | 1,161 | 96 | 13,942 | 37 | 16 | |||||||||||||||||||||
Central Cardones | 153 | 133 | — | 98 | — | — | — | |||||||||||||||||||||
Colmito | 58 | 58 | 46 | 91 | — | 11 | — | |||||||||||||||||||||
CEPP | 67 | 65 | 339 | 87 | 9,665 | 234 | 154 | |||||||||||||||||||||
JPPC | 60 | 10 | 447 | 88 | 8,159 | 191 | 143 | |||||||||||||||||||||
Pedregal | 54 | 11 | 420 | 93 | 8,800 | 201 | 137 | |||||||||||||||||||||
|
|
|
|
|
|
|
|
|
|
|
|
|
| |||||||||||||||
Total | 2,070 | 1,608 | 9,687 | |||||||||||||||||||||||||
|
|
|
|
|
| |||||||||||||||||||||||
| 1. | Does not include Edegel, which we sold in September 2014. |
| 2. | Reflects 100% of the capacity of each of our assets, regardless of the ownership interest in the entity that owns each such asset. |
| 3. | Reflects the proportionate capacity of each of our assets, as determined by our ownership interest in the entity that owns each such asset. |
| 4. | Heat rate is defined as the number of Btus of energy contained in the fuel required to produce a kilowatt-hour of energy (btu/kWh) for thermal plants. |
| 5. | Reached its COD in July 2013. |
Generation Business
Peru Segment
The following summaries provide a description of the portfolio of our generation assets in our Peru segment.
Kallpa
We own 75% of Kallpa; the remaining 25% is held by Energía del Pacífico. Energía del Pacífico is a member of the Quimpac group, a Peruvian chemical company. Energía del Pacífico also holds a 25% interest in both CDA and Samay I. Kallpa is our largest asset and the third largest power generation company in Peru in terms of installed capacity as of December 31, 2015. Kallpa owns and operates two power plants, including the largest power generation facility in terms of capacity in Peru, our largest market, which utilizes natural gas for its operations. The Kallpa facility’s combined cycle plants have a capacity of 870 MW, representing approximately 9% of the total capacity in Peru, as of December 31, 2015, following the 2012 conversion of this facility’s three natural gas-powered open-cycle generation turbines into combined cycle turbines with a 292 MW steam turbine. We completed the conversion of the Kallpa facility in August 2012 at a cost of $337 million.
The Kallpa facility’s combined-cycle plants are among the most efficient plants in Peru (by cost of operations in U.S. Dollars per MW capacity) and were among the most efficient thermal plants in Peru in terms of heat rate in 2015, according to the COES. As a result of Kallpa’s efficiency and low cost of operations, Kallpa has a strong competitive position in the Peruvian market and is currently the largest thermoelectric power plant in Peru (according to market share, in terms of energy dispatched by thermoelectric power plants during 2015).
212
Table of Contents
In April 2014, Kallpa purchased the 193 MW single turbine natural gas-fired plant “Las Flores,” which reached its COD in May 2010 and is located in Chilca, Peru, for $114 million, increasing Kallpa’s installed capacity from 870 MW to 1,063 MW, representing approximately 11% of the total installed capacity in Peru as of December 31, 2015. Prior to Kallpa’s acquisition of Las Flores in 2014, the Las Flores plant had operated intermittently due to the lack of a long-term regular supply of natural gas and an associated natural gas transportation contract. The Kallpa facility, which is located near the Las Flores plant, had an excess of available gas supply, and was, therefore, in a position to significantly improve the Las Flores plant’s operations and generation activities. Since Kallpa’s acquisition of Las Flores, Las Flores has been able to utilize Kallpa’s excess gas supply and enjoys several synergies in the use and transport of gas to its facility.
Additionally, Las Flores holds environmental permits for a future 190 MW gas-fired expansion and has sufficient space to locate such a facility, as well as a combined cycle expansion, on its existing premises. In July 2015, Kallpa received environmental approval to convert both its existing unit and the future gas turbine in Las Flores, if developed, into a combined-cycle plant. If completed, these expansion projects, which we have not committed to initiate, would increase the capacity of Las Flores’ plant by 400 MW from 193 MW to approximately 593 MW.
Kallpa has a long-term contract for the supply of natural gas not exceeding 100% of its installed capacity. The price that Kallpa pays for its supply of natural gas is based on a base price in U.S. Dollars set on the date of the supply agreement, indexed each year based on two producer price indices, with discounts available based on the volume of natural gas consumed. Kallpa’s PPAs are indexed to the underlying fuel cost under the related long-term supply agreements, which generally limits Kallpa’s exposure to fuel price fluctuations, including the impact of such fluctuations on our margins.
During the six months ended June 30, 2016 and the years ended December 31, 2015, 2014 and 2013, Kallpa generated revenues of $228 million, $448 million, $437 million and $394 million, respectively, representing 26%, 35%, 32% and 45% of our consolidated revenues, respectively. During the year ended December 31, 2015, Kallpa generated 5,166 GWh, representing 12% of the Peruvian interconnected system’s energy production.
In the year ended December 31, 2015, approximately 98% of Kallpa’s aggregate energy sales (in GWh) were made pursuant to PPAs, respectively. As of December 31, 2015, all of Kallpa’s PPAs were indexed to the price of the corresponding power plant’s operating fuel prices in U.S. Dollars and provided for payment in, or were linked to, the U.S. Dollar, thereby generally limiting Kallpa’s exposure to fuel price and exchange rate fluctuations. As of December 31, 2015, the weighted average remaining life of Kallpa’s PPAs based on firm capacity was seven years. Kallpa has committed to sell more than 50% of its available energy (in MWh) in every year up to 2021.
The following table sets forth certain information regarding each of Kallpa’s turbines for each of the periods presented:
As of | For the Years Ended December 31, | |||||||||||||||||||||||||||||||
2015 | 2014 | 2013 | ||||||||||||||||||||||||||||||
Turbine | Year of | Installed | Gross Energy | Availability | Gross Energy | Availability | Gross Energy | Availability | ||||||||||||||||||||||||
| (MW) | (GWh) | (%) | (GWh) | (%) | (GWh) | (%) | ||||||||||||||||||||||||||
Kallpa I1 | 2007 | 186 | 954 | 91 | 1,243 | 96 | 1,251 | 96 | ||||||||||||||||||||||||
Kallpa II1 | 2009 | 195 | 1,126 | 99 | 1,266 | 97 | 1,229 | 96 | ||||||||||||||||||||||||
Kallpa III1 | 2010 | 197 | 1,218 | 99 | 1,262 | 96 | 1,212 | 94 | ||||||||||||||||||||||||
Kallpa IV2 | 2012 | 292 | 1,759 | 95 | 2,027 | 98 | 1,767 | 86 | ||||||||||||||||||||||||
Las Flores | 2014 | 193 | 109 | 100 | 122 | 96 | — | — | ||||||||||||||||||||||||
|
|
|
|
|
|
|
| |||||||||||||||||||||||||
Total | 1,063 | 5,166 | 5,920 | 5,459 | ||||||||||||||||||||||||||||
|
|
|
|
|
|
|
| |||||||||||||||||||||||||
213
Table of Contents
| 1. | Reflects the effective capacity of the turbine at its COD. |
| 2. | Reflects the installed capacity. Kallpa IV is the steam turbine built to convert the Kallpa plant to combined cycle, which reached its COD in August 2012. |
Kallpa’s turbines are maintained according to a predefined schedule based upon the running hours of each turbine and the manufacturer specifications particular to it. Kallpa anticipates the first maintenance of its Kallpa IV turbine to occur in 2017 or 2018. Kallpa’s maintenance schedule is coordinated with, and approved by, the COES. Kallpa is a party to a services contract with Siemens Energy, Inc. and a supply and support contract with Siemens Power Generation, Inc., each of which provides for an 18-year term of service for each of the Kallpa I, II and III turbines, or the equivalent of 100,000 hours of operation, beginning in March 2006, in December 2007, and in July 2008, respectively. These agreements have been amended to include Las Flores, thereby requiring the OEM to supply spare parts, hardware and maintenance services to Las Flores during the term of the agreement. We also have relationships with the OEM and Sulzer, which each periodically perform onsite analyses and make annual recommendations regarding line maintenance. Spare parts for the Kallpa IV turbine are generally available and can be obtained from the OEM as well as from other suppliers.
Kallpa also generates revenue from ancillary services (principally transmission tolls that are typically passed through to Kallpa’s customers pursuant to its PPAs). During the six months ended June 30, 2016 and the years ended December 31, 2015, 2014 and 2013, Kallpa generated revenues from ancillary services of $46 million, $88 million, $73 million and $59 million, respectively, representing 20%, 20%, 17% and 15% of Kallpa’s consolidated revenues for those years, respectively.
Through Inkia, we have entered into a shareholders’ agreement, which grants protective minority rights to Energía del Pacífico, our 25% partner in Kallpa. For example, we and Energía del Pacífico have agreed that each will submit projects related to generation or transmission of energy in Peru to Kallpa and will not develop such projects other than through Kallpa, subject to limited exceptions. For further information on our shareholders’ agreements, see “—Shareholders’ Agreements” and the risks related to our shareholders’ agreements and“Risk Factors—Risks Related to Our Business—We have granted rights to the minority shareholders of certain of our subsidiaries.”
Cerro del Aguila (CDA)
We own 75% of CDA; the remaining 25% is held by Energía del Pacífico. CDA’s plant has an installed capacity of 510 MW, and is the largest privately-owned hydroelectric plant in Peru and among the largest in Latin America.
In October 2010, Kallpa entered into—and in June 2011, Kallpa transferred to CDA—a concession agreement with the Government of Peru that provides a concession, which grants Kallpa, for an unlimited term, the right to construct and operate a run-of-the-river hydroelectric project on the Mantaro River in central Peru. The CDA plant is located 16 kilometers downstream of Peru’s largest hydroelectric complex, formed by the Mantaro and the Restitución hydroelectric plants, with a capacity of 800 MW and 208 MW, respectively, and the Junin water reservoir, the largest in Peru. The Mantaro plants form the largest hydroelectric complex in Peru (in terms of capacity and generation), run as a year round base load unit and has stable generation levels. The Junin water reservoir is expected to provide a relatively constant water flow for the downstream power plants, benefiting CDA’s hydrology. CDA holds water rights granted by the National Water Authority (ANA—Autoridad Nacionaldel Agua) in connection with the operation of the CDA plant. We estimate that the CDA plant will have an average annual load factor of 70%, which is significantly above the average (60%) for similar projects in Latin America. The CDA plant consists of a 6 kilometer headacre tunnel and a 17 kilometer transmission line.
CDA has entered into three PPAs—a 15-year PPA with ElectroPerú covering 200 MW of capacity and the associated energy that commences in 2016, a 10-year PPA with Luz del Sur S.A.A., Edelnor and Edecañete, covering 202 MW of capacity and the associated energy that commences in January 2018 and a 10-year PPA
214
Table of Contents
with Edelnor and Luz de Sur, covering 81 MW that commences in January 2022—which will account for a significant portion of CDA’s expected generation capacity. Assuming a consumption factor of approximately 0.70 and certain volumes of capacity, peak and off-peak sales occurring at each PPA’s average price (from the beginning of the PPA until 2020), we expect CDA’s PPA with ElectroPerú to generate annual revenues in the range of $85 to $90 million per full year, CDA’s PPA with Luz del Sur S.A.A., Edelnor S.A.A. and Edecañete S.A. to generate annual revenues in the range of $65 to $70 million per full year and CDA’s PPA with Edelnor, Luz del Sur S.A.A. and Edecañete to generate annual revenues in the range of $20 to $22 million per full year. Kallpa has provided bank guarantees of $4 million and CDA has undertaken to provide bank guarantees of $19 million to secure obligations under the PPAs. As of June 30, 2016, the weighted average remaining life of CDA’s PPAs based on firm capacity was 12 years. The PPA with ElectroPerú has an average price of $54/MWh, capacity payments of $6.3/kW-month, is denominated in U.S. Dollars and is indexed to the U.S. producer price index. The first PPA with Luz del Sur S.A.A., Edelnor S.A.A. and Edecañete S.A. has an average price of $50/MWh, capacity payments of $6.5/kW-month, is denominated in the Peruvian Sol, but indexed to natural gas prices in Peru, which are denominated in U.S. Dollars, and indexed to the U.S. producer price index. The second PPA with Luz del Sur S.A.A., Edelnor S.A.A. and Edecañete S.A. has an average price of $37/MWh, capacity payments of $6.3/kW-month, is denominated in the Peruvian Sol, but indexed to natural gas prices in Peru, which are denominated in U.S. Dollars, and indexed to the U.S. producer price index. Although CDA operates a hydroelectric plant, its PPAs are indexed to natural gas prices, exposing CDA to fluctuations in such prices.
The three generating units of CDA reached COD in August 2016. Prior to this, CDA did not recognize any revenues or operating income from its operations. Construction of the CDA plant is estimated to cost approximately $959 million. The CDA plant is expected to be fully operational at a cost of $1.9 million per MW, making the CDA plant among the most efficiently constructed hydroelectric facilities in Latin America industry in terms of cost per MW. Development of the CDA plant was financed with a $591 million syndicated credit facility, or the CDA Finance Facility, with export credit agencies, development banks and private banks, and collateralized by the assets of the project. The remaining portion of the cost of the CDA plant has been substantially financed with equity from each of Inkia and Energía del Pacífico. As of June 30, 2016, Inkia (through which we hold our interest in CDA) and Energía del Pacífico have invested $246 million and $82 million in CDA, respectively. In connection with the CDA Finance Facility, each of Inkia and Energía del Pacífico entered into an equity contribution and retention agreement with the administrative agent under the CDA Finance Facility and agreed, among other things, to provide contingent equity and credit support to cover cost overruns (this support obligation is limited, in Inkia’s case, to $44 million). As of June 30, 2016, CDA had invested $907 million into its development and had fully drawn the CDA Finance Facility. For further information regarding the terms of the CDA Finance Facility, see“Management’s Discussion and Analysis of Financial Condition and Results of Operations—Liquidity and Capital Resources—Material Indebtedness—CDA Finance Facility.”
In November 2011, CDA and Astaldi S.p.A. and GyM S.A., as contractors operating under the consortium name of Consorcio Río Mantaro S.A., or Río Mantaro, individually entered into a turnkey engineering, procurement and construction contract for the construction of the CDA plant, or the CDA EPC, pursuant to which each of Astaldi S.p.A. and GyM S.A. committed, on a joint and several basis, to construct the CDA plant by February 2016 and provide all services necessary for the design, engineering, procurement, construction, testing and commissioning of the CDA plant for approximately $700 million, payable on a monthly basis to Río Mantaro based upon construction completed in the previous calendar month. CDA’s payments to Río Mantaro are subject to adjustments made in accordance with the CDA EPC.
In April 2014, Astaldi S.p.A. and GyM S.A., the contractors under the CDA EPC delivered a claim to CDA, demanding a six-month extension for the completion of the construction of the CDA plant (from early 2016 to September 2016) and an approximately $92 million increase in the total contract price of the CDA plant’s development. In March 2015, we, together with the CDA EPC contractors, amended the CDA EPC to address such claims. Pursuant to the amendment, we have agreed to pay, subject to certain conditions, an additional $40 million and granted the extensions previously requested by the CDA EPC contractors.
215
Table of Contents
Should CDA experience any delays or be placed off-line, CDA’s 15-year PPA would require CDA to pay a penalty to ElectroPerú. Although the terms of the CDA EPC entitle CDA to demand the payment of liquidated damages from Río Mantaro due to delays in the commercial operation of CDA, there is no certainty that such payments, if received, would cover the entirety of the penalties imposed under the PPA.
Samay I
We own 75% of Samay I; the remaining 25% is held by Energía del Pacífico. In November 2013, Samay I won a public bid auction conducted by MINEM to build a cold-reserve open-cycle diesel and natural gas (dual-fired) thermoelectric plant in Mollendo, Arequipa in southern Peru, with an installed capacity of approximately 616 MW (when operated with diesel fuel) at an estimated cost of $380 million. The two-bid auction, which was won by Samay I and a subsidiary of Engie, is part of an effort by the Peruvian government to promote the construction of a power node in southern Peru, which will be fueled by natural gas once a natural gas pipeline (the Gasoducto Sur Peruano, currently under construction) delivers gas to the area. Approximately 82% of the cost of the Samay I plant was financed with a $311 million seven-year syndicated secured loan agreement with Bank of Tokyo-Mitsubishi, Sumitomo Mitsui Banking Corporation and HSBC. The remaining 18% was financed with equity contributions from each of Inkia and Energía del Pacífico. Samay I invested $379 million (excluding $26 million of diesel fuel inventory) into the development of its facility and has fully drawn the $311 million Samay I Finance Facility (as defined below). For further information on the Samay I Finance Facility, see “Management’s Discussion and Analysis of Financial Condition and Results of Operations—Material Indebtedness—Samay I Finance Facility.”
The Samay I plant is expected to have three operational stages. First, it will operate as a cold reserve plant with diesel until natural gas becomes available in the area through a pipeline currently under construction. It is uncertain when the pipeline will be completed. Second, once natural gas becomes available to the facility through the new natural gas pipeline, the Samay I plant will have the obligation to operate as a natural gas-fired power plant and will be able to do so with minor investments by us in Samay I’s facilities. When fueled by natural gas, the Samay I plant will have an installed capacity of approximately 720 MW. Finally, following an additional investment in the conversion of the Samay I plant, which we have not committed to make, the Samay I plant could operate as a combined cycle thermoelectric plant, which would increase Samay I’s installed capacity to approximately 1,080 MW. Samay I has entered into an agreement with the State of Peru, with a term of 20 years, under which Samay I will receive fixed monthly capacity payments denominated in U.S. Dollars and we will pass-through all of the variable costs during the cold reserve phase, representing an aggregate amount of approximately $1 billion in revenues from the Samay I plant over the 20-year term of this agreement. The amount of monthly payments required to make up the total amount to which Samay I is entitled will be calculated by the COES, and will be paid by all generators that form part of the national interconnected electrical system of Peru (Sistema Eléctrico Interconectado Nacional), or SEIN who, in their turn collect the corresponding fee from their customers through a surcharge in the transmission tariffs applicable to, and payable by, all end consumers. The surcharge does not involve the use of state funds or any appropriation process, being a mechanism that has been used for almost 20 years in Peru to cover the cost of various energy projects.
In the past, access to a supply of natural gas has been a primary factor that has limited the development of new power projects in Peru. For example, Las Flores plant operated intermittently for four years when it did not have access to a firm supply of natural gas to support its operations. In contrast, in addition to receiving a 20-year stream of capacity payments, Samay I has an advantage in being one of only two power generation companies that have defined rights to a natural gas supply and transportation capacity once the Gasoducto Sur Peruano is completed. The developer of such pipeline has a contractual obligation under its concession agreement with the State of Peru to build a branch of the pipeline to connect it with the Samay I plant. Our strategic development of the Samay I plant will provide us with a significant advantageous position in the future southern Peru power node, which will develop once the Gasoducto Sur Peruano is completed. Pursuant to the terms of its tender, Samay I must receive gas and transportation services pursuant to terms which are similar to other power plants located in other parts of Peru and served by the existing TGP pipe line, such as the Kallpa
216
Table of Contents
plant. According to Law 29970, natural gas transportation costs of the Samay I plant will be eventually subsidized by additional tariffs on the electricity transmission toll periodically determined by OSINERGMIN with the purpose of decentralizing the generation of electricity with natural gas, which is one of the main purposes of the State of Peru developing the southern Peru power node. ElectroPerú has commenced negotiations with suppliers and concessionaires for the supply and transport of natural gas to each of Samay I and the other plant with a defined right to the firm supply of natural gas. However, as ElectroPerú may not be successful in obtaining an agreement which conforms to the conditions as contemplated in the tender documents of the cold reserve bidding process, we believe Samay I has the right to reject entering into any supply and transportation agreements which do not comply with the conditions set forth in its tender.
In connection with the construction of its facility, Samay I entered into three EPC contracts with the following parties: (1) Posco Engineering & Construction Co., Ltd., or Posco, and Santos CMI Inc. (USA), for the design, construction and installation of the power station; (2) Abengoa Perú S.A. for the construction of the transmission line; and (3) Siemens Energy, Inc., Siemens S.A.C. and Siemens Power Generation, Inc. for the construction of the substation.
In May 2016, Samay I reached its COD on schedule, in accordance with the terms of its agreement with the Peruvian government, with a total development cost of $379 million (excluding $26 million of diesel fuel inventory). In July 2016, Samay I, Posco (the EPC contractor) and General Electric (the manufacturer of the turbines) inspected the plant’s units, and such inspections revealed damage to the shafts in three of the plant’s four units. As a result, all of the plant’s four units were declared unavailable to the system. The MINEM and OSINERGMIN have been informed that there has been aforce majeure event which has caused the plant to be placed offline. Samay I has also notified the project lenders and its insurance providers of the incident.
Samay I, Posco and General Electric are in the process of testing, analysis and evaluation to determine the root cause of the damage. We have developed a plan to repair the units, and on August 28, 2016, Kenon announced that we expected all four units to be operational within six months. Samay I continues to receive payments under its PPA, but such payments may be subject to adjustments depending on the amount of time the plant is unavailable when called for dispatch. We intend to seek coverage for the costs of the outage, including repair costs and loss of profits, as appropriate, from the EPC contractor, equipment manufacturer and/or the insurance coverage (subject to deductibles), and believe we have a reasonable basis to recover these costs, including for loss of profits. For further information on Samay I’s insurance, see “—Insurance.”
Edegel
Prior to September 2014, we held a 21% indirect equity interest in Edegel, the largest generator of electricity in Peru. We owned this interest via Inkia’s wholly-owned subsidiary Southern Cone, which had a 39% equity interest in Generandes, an entity that, in turn, had a 54% equity interest in the outstanding shares of Edegel. Empresa Nacional de Electricidad S.A., or Endesa Chile, a subsidiary of Enel SpA, one of the world’s largest electricity companies, indirectly owned 29% of Edegel; the remaining shares were held publicly. Endesa Chile also owned 61% of Generandes. In September 2014, we completed the sale of our indirect equity interest in Edegel. As a result, the results of operations of Generandes (the entity through which we held our indirect equity interest in Edegel) are reflected as discontinued operations in our financial statements presented in this prospectus.
In this prospectus, we also include consolidated financial statements of Generandes as of and for the years ended December 31, 2014 and 2013, pursuant to Rule 3-09 of Regulation S-X. These financial statements have been audited according to U.S. GAAS, except for the financial statements as of and for the year ended December 31, 2014, which are not required to be audited by Rule 3-09 of Regulation S-X because Generandes is not considered a “significant subsidiary” of ours for the year ended December 31, 2014.
217
Table of Contents
Israel Segment
The following summaries provide a description of the portfolio of our generation assets in our Israel segment.
OPC
Our 80% stake in OPC is held indirectly through ICPI. The remaining 20% is held by Veolia, which, in 2015, was acquired by Oaktree Capital Management, an investment management firm. In July 2013, OPC became Israel’s first IPP by commencing commercial operation of its power station, located in Mishor Rotem industrial zone in the south of Israel. The OPC plant was constructed for an aggregate cost of approximately $508 million. OPC’s combined cycle plant has a capacity of 440 MW, representing approximately 3% of the installed capacity and approximately 19% of the installed capacity provided by IPPs in Israel as of December 31, 2015. Given Israel’s growing economy and the advanced age of the existing state-owned power generation facilities, we believe OPC provides us with a strategic position in the Israeli electricity market and thereby provides us with an opportunity to participate in additional power projects in Israel, which we believe may become available to private sector participants in connection with Israel’s growing energy industry.
OPC purchases natural gas from the Tamar Group, pursuant to a natural gas supply agreement that expires upon the earlier of June 2029 or the date on which OPC consumes the entire contractual capacity. The EA’s generation component tariff is the base for the natural gas price linkage formula in the agreement between OPC and the Tamar Group. For further information on OPC’s gas supply agreement, see “—Raw Materials andSuppliers—Natural Gas Supply and Transportation Agreements.”
During the six months ended June 30, 2016 and the years ended December 31, 2015, 2014 and 2013, OPC generated revenues of $153 million, $318 million, $413 million and $187 million, respectively, representing 17%, 25%, 30% and 21% of our consolidated revenues, respectively. During the year ended December 31, 2015, OPC generated 3,811 GWh.
The following table sets forth certain information for OPC’s plant for each of the periods presented:
As of June 30, 2016 | For the Year Ended December 31, | |||||||||||||||||||||||||||
2015 | 2014 | 2013 | ||||||||||||||||||||||||||
Plant | Installed Capacity | Gross Energy | Availability | Gross Energy | Availability | Gross Energy | Availability | |||||||||||||||||||||
| (MW) | (GWh) | (%) | (GWh) | (%) | (GWh) | (%) | ||||||||||||||||||||||
OPC1 | 440 | 3,811 | 99 | % | 3,465 | 90 | % | 1,357 | 96 | % | ||||||||||||||||||
| 1. | Commenced commercial operations in July 2013. |
OPC has a PPA with IEC, the government-owned electricity generation, transmission and distribution company in Israel, or the IEC PPA. The term of the IEC PPA lasts until 20 years after the power station’s COD (i.e. 20 years from July 2013). The IEC PPA is a “capacity and energy” agreement, committing OPC to provide the entire net available capacity of its power station to IEC and to generate power at such volumes and schedules as required by IEC. The terms of the IEC PPA allow OPC to carve out energy and capacity for direct sales to private consumers, and OPC has accordingly allocated the entire capacity of the plant to private consumers since COD. As a result, OPC supplies energy to approximately 20 end users according to long-term PPAs (generally for a minimum of 10 years). Under the IEC PPA, OPC can also elect to revert back to supplying to IEC instead of to private customers. As of December 31, 2015, the weighted average remaining life of OPC’s PPAs with end users based on firm capacity was seven years. In the year ended December 31, 2015, OPC’s energy and capacity sales to end users represented 98% of OPC’s total energy and capacity sales.
Mitsubishi Heavy Industries of Japan provides the long-term servicing of the power station, for a term of 100,000 hours of operation, or 12 years based upon the expected operations of the power station, which is consistent with our strategy of entering into long-term servicing agreements with OEMs to help ensure the efficiency and productivity of our generation plants.
218
Table of Contents
In March 2014, one of our subsidiaries was awarded a tender published by the Israel Land Authority to lease a plot of land adjacent to the OPC site. The plot, which is large enough to house another combined cycle or similar generation facility, may be used to expand OPC’s capacity in the long-term.
We have entered, through our subsidiary ICPI, into a shareholders’ agreement which grants minority rights to OPC’s minority shareholder. For further information on our shareholders’ agreements, see“—Shareholders’ Agreements” and for further information on the risks related to our shareholders’ agreements, see“Risk Factors—Risks Related to Our Business—We have granted rights to the minority shareholders of certain of our subsidiaries.” For further information on the regulation of the Israeli electricity sector, see “—Regulatory, Environmental and Compliance Matters—Regulation of the Israeli Electricity Sector.”
AIE
In August 2015, we acquired 100% of the shares of AIE from Hadera Paper, a large paper and paper product manufacturer in Israel. The consideration for the transaction was NIS 60 million (approximately $16 million), of which approximately NIS 24 million (approximately $6 million) was provided in the form of a loan to be converted into consideration (and considered a payment to Hadera Paper) upon the completion of Hadera Paper’s sale of certain equipment to us, as discussed below. AIE, which currently operates an 18 MW plant, holds a conditional license for the construction of a cogeneration power station in Israel. AIE commenced construction of the plant in June 2016. We expect that the total cost of completing the AIE plant (including the consideration for the acquisition of AIE) will be approximately $250 million, based upon a plant with 140 MW of capacity. In January 2016, AIE entered into an approximately $150 million EPC contract in connection with the project. The AIE plant is expected to reach its COD by the end of 2018. In July 2016, AIE entered into a NIS 1 billion (approximately $261 million) loan agreement to finance the construction of the AIE plant. The financing consists of an approximately $200 million long-term facility intended to cover the cost of construction (representing approximately 80% of the total project cost) and approximately $61 million in additional facilities. For further information on the AIE financing, see “Management’s Discussion and Analysis of Financial Condition and Results of Operations—Recent Developments—AIE Financing.”
AIE’s power plant is expected to supply the electricity and steam needs of Hadera Paper’s facility as well as to provide electricity to end users in Israel. The power plant will operate using natural gas and diesel fuel and is expected to have a relatively high level of energy utilization due to usage of the cogeneration technology, which supplies electricity and steam in a single production process.
In June 2015, AIE entered into an agreement with Hadera Paper for AIE’s supply of electricity and steam from the AIE power plant to be constructed by us to Hadera Paper’s facility from closing and for a period of 18 years from the date the power plant reaches its COD. Pursuant to this agreement, Hadera Paper will acquire all of its electricity and steam needs from AIE. The agreement provides for minimum quantities of steam to be purchased by Hadera Paper, which will be subject to adjustment. Until AIE reaches its COD, AIE will supply steam and electricity to Hadera Paper using its old equipment purchased.
Additionally, Hadera Paper has a gas supply agreement with the Tamar Group and a related gas transport agreement with Israel Natural Gas Lines Ltd., both of which were assigned to AIE in connection with the acquisition.
In connection with the acquisition, Hadera Paper agreed to sell certain equipment that it uses to produce steam, and approximately 25 MW of additional capacity, within its manufacturing plant to AIE. AIE will also lease from Hadera Paper the land on which the power generation plant is located for a period of 20 years from AIE’s plant’s COD.
219
Table of Contents
In the six months ended June 30, 2016 and the year ended December 31, 2015, AIE generated revenues of $23 million and $8 million, representing 3% and 1% of our consolidated revenues, respectively.
Central America Segment
The following summaries provide a description of the portfolio of our generation assets in our Central America segment.
Nicaragua
ICPNH
Our operations in Nicaragua are carried out through ICPNH. We own 100% of ICPNH, which we acquired in March 2014 and which was formerly known as AEI Nicaragua. ICPNH owns and operates four power generation plants located throughout Nicaragua through its indirect (1) 65% equity interest in Corinto, (2) 65% equity interest in Tipitapa Power, (3) 61% equity interest in Amayo I, and (4) 61% equity interest in Amayo II. Corinto and Tipitapa Power, which have a combined capacity of 122 MW, are powered by HFO. The Corinto and Tipitapa Power plants house fuel storage tanks on site with capacity of approximately 90 thousand barrels and 63 thousand barrels, respectively. Amayo I and Amayo II have a combined capacity of 63 MW of wind power energy. Collectively, these four entities represent a capacity of 185 MW, approximately 17% of the total capacity of the Nicaraguan interconnected system as of December 31, 2015.
During the six months ended June 30, 2016 and the years ended December 31, 2015 and 2014 (since the date of our acquisition of ICPNH in March), ICPNH generated revenues of $44 million, $111 million and $125 million, respectively, representing 5%, 9% and 9% of our consolidated revenues, respectively. During the year ended December 31, 2015, ICPNH generated 1,095 GWh, representing 25% of the Nicaraguan interconnected system’s energy requirements. ICPNH has committed to sell its available energy, as follows:
| • | Corinto has commitments for 70% of its available energy in every year up to December 2018; |
| • | Tipitapa Power has commitments for 100% of its available energy in every year up to December 2018; |
| • | Amayo I has commitments for 100% of its available energy in every year up to March 2024; and |
| • | Amayo II has commitments for 100% of its available energy in every year up to March 2025. |
The following table sets forth certain information for ICPNH’s plants for each of the periods presented:
As of June 30, 2016 | For the Years Ended December 31, | |||||||||||||||||||||||||||||||
2015 | 2014 | 2013 | ||||||||||||||||||||||||||||||
Plant | Year of | Installed | Gross Energy | Availability | Gross Energy | Availability | Gross Energy | Availability | ||||||||||||||||||||||||
| (MW) | (GWh) | (%) | (GWh) | (%) | (GWh) | (%) | ||||||||||||||||||||||||||
Corinto | 1999 | 71 | 476 | 93 | 494 | 93 | 515 | 92 | ||||||||||||||||||||||||
Tipitapa Power | 1999 | 51 | 345 | 92 | 327 | 98 | 326 | 97 | ||||||||||||||||||||||||
Amayo I | 2009 | 40 | 186 | 94 | 174 | 98 | 148 | 97 | ||||||||||||||||||||||||
Amayo II | 2010 | 23 | 88 | 70 | 104 | 96 | 96 | 97 | ||||||||||||||||||||||||
|
|
|
|
|
|
|
| |||||||||||||||||||||||||
Total | 185 | 1,095 | 1,099 | 1,085 | ||||||||||||||||||||||||||||
|
|
|
|
|
|
|
| |||||||||||||||||||||||||
In December 2014, ICPNH’s wind farm complex in Nicaragua sustained damage in connection with a blackout in the SIN, which left one wind turbine collapsed and another two wind turbines with severe damage. The contracted operator had the responsibility to replace the turbines. In early 2016, the three damaged turbines, which represented 10% of all of our installed capacity at our Amayo I and Amayo II plants, were replaced and re-commenced commercial operations.
220
Table of Contents
In March 2016, a unit of ICPNH’s barge-mounted power plant (Corinto) sustained damage in connection with a machinery breakdown. The relevant unit has an installed capacity of 18 MW, and represents 25% of all our installed capacity at the Corinto plant. This event is covered by insurance. Repairs are under way, and the relevant unit is expected to come back online in November 2016.
Guatemala
Puerto Quetzal
We own 100% of Puerto Quetzal, which represents our initial entry into the Guatemalan power generation market. Puerto Quetzal, which we acquired in September 2014, utilized three floating power barges with HFO generators, representing 234 MW, at the time of its acquisition. In November 2014, Puerto Quetzal transferred one of its three power barges, which has a capacity of 55 MW, to our Panamanian subsidiary Kanan. As a result, Puerto Quetzal now operates two power barges with an aggregate capacity of 179 MW, representing approximately 5% of the total capacity in the Guatemala interconnected system as of December 31, 2015. The Puerto Quetzal plant houses fuel storage tanks on site with capacity of approximately 200 thousand barrels.
In the fourth quarter of 2015, Puerto Quetzal entered into two PPAs, representing approximately 26 MW of capacity in the aggregate as of December 31, 2015.
During the six months ended June 30, 2016 and the years ended December 31, 2015 and 2014 (since the date of our acquisition of Puerto Quetzal in September 2014), Puerto Quetzal generated revenues of $31 million, $109 million and $33 million, respectively, representing 4%, 8% and 2% of our consolidated revenues, respectively. During the year ended December 31, 2015, Puerto Quetzal generated 673 GWh, representing 7% of the Guatemalan system’s energy requirements.
The following table sets forth certain information for Puerto Quetzal’s plant for each of the periods presented:
As of 2016 | For the Years Ended December 31, | |||||||||||||||||||||||||||||||
2015 | 2014 | 2013 | ||||||||||||||||||||||||||||||
Plant | Year of | Installed | Gross Energy | Availability | Gross Energy | Availability | Gross Energy | Availability | ||||||||||||||||||||||||
| (MW) | (GWh) | (%) | (GWh) | (%) | (GWh) | (%) | ||||||||||||||||||||||||||
Puerto Quetzal | 1993 | 179 | 673 | 94 | 490 | 97 | 525 | 95 | ||||||||||||||||||||||||
Guatemel
In January 2016, we acquired 100% of Guatemel–an electricity trading company that supplies large users within Guatemala’s unregulated sector—in connection with our acquisition of Energuate.
Guatemel enters into sales contracts with its customers under which it sells a specified amount of capacity to each customer. Customers are charged a capacity charge based on the amount of capacity purchased and an energy charge based on the amount of energy actually consumed. Guatemel pays transmission tolls and distribution tariffs to the transmission and distribution companies that deliver the electricity it sells to its customers, including Energuate. As of December 31, 2015, 2014 and 2013, Guatemel had agreements to supply capacity and electricity to 46, 58 and 65 large customers, respectively, which consumed an average of 57 GWh, 74 GWh and 96 GWh annually, respectively.
Guatemel enters into PPAs in order to obtain the capacity and electricity that it then on sells to unregulated customers. In the event that Guatemel requires capacity or electricity in excess of that supplied under its PPAs in order to meet customer demand under its sales contracts, Guatemel makes spot market purchases, only if authorized by CNEE.
221
Table of Contents
El Salvador
Nejapa
We own 100% of Nejapa in El Salvador as a result of our acquisition in January 2015 of Crystal Power’s 29% stake in Nejapa for $20 million in connection with the settlement of a shareholder dispute with Crystal Power. Prior to this settlement, we owned 71% of Nejapa’s outstanding equity.
Nejapa owns and operates 27 diesel generators (located in a single facility) powered by HFO. Nejapa has a capacity of 140 MW, representing 9% of the total capacity of El Salvador as of December 31, 2015. The Nejapa plant houses fuel storage tanks on site with capacity of approximately 47,000 barrels. In addition, Cenérgica, one of our wholly-owned subsidiaries, maintains a fuel depot and marine terminal and owns three fuel storage tanks with an aggregate capacity of 240,000 barrels in Acajutla, El Salvador.
During the six months ended June 30, 2016 and the years ended December 31, 2015, 2014 and 2013, Nejapa generated revenues of $38 million, $100 million, $132 million and $135 million, respectively, representing 4%, 8%, 10% and 15% of our consolidated revenues, respectively. During the year ended December 31, 2015, Nejapa generated 440 GWh, representing 8% of the national interconnected electrical system of El Salvador. Nejapa has committed to sell over 50% of its available energy (in MWh) in every year up to 2017.
The following table sets forth certain information for Nejapa’s plant for each of the periods presented:
As of 2016 | For the Years Ended December 31, | |||||||||||||||||||||||||||||||
2015 | 2014 | 2013 | ||||||||||||||||||||||||||||||
Plant | Year of | Installed | Gross Energy | Availability | Gross Energy | Availability | Gross Energy | Availability | ||||||||||||||||||||||||
| (MW) | (GWh) | (%) | (GWh) | (%) | (GWh) | (%) | ||||||||||||||||||||||||||
Nejapa | 1995 | 140 | 440 | 96 | 376 | 97 | 458 | 95 | ||||||||||||||||||||||||
Panama
Kanan
We own 100% of Kanan. In October 2014, Kanan was awarded a five-year contract in connection with the Panamanian government’s call for emergency bids to attempt to cover electricity shortfalls in Panama in the short-term. Kanan’s contract to supply energy in Panama, with a maximum contractual capacity of 86 MW, became effective in December 2015. To facilitate Kanan’s supply of this energy, we have transferred thermal generation units, in the form of barges, from our subsidiaries Puerto Quetzal and CEPP to Kanan with a total capacity of 92 MW, which would have represented approximately 3% of the total capacity of Panama as of December 31, 2015 had Kanan reached COD in 2015. As a result, Kanan’s capacity of 92 MW consists of (1) a 55 MW power barge transferred to Kanan by Puerto Quetzal in November 2014, and (2) a 37 MW power barge transferred to Kanan by CEPP in November 2014. Both barges were successfully relocated to Panama and connected to the Panamanian power system. In April 2016, Kanan reached its COD (with a total development cost of $87 million) and commenced full commercial operations with an installed capacity of 92 MW.
During the six months ended June 30, 2016, Kanan generated $32 million of revenue, representing 4% of our consolidated revenues.
222
Table of Contents
Other Segment
The following summaries provide a description of the portfolio of our generation assets in our Other segment.
Bolivia
COBEE
We own 100% of COBEE. COBEE is the third largest generator of electricity in Bolivia, generating power from ten run-of-the-river hydroelectric plants in the Zongo river valley, four run-of-the-river hydroelectric plants in the Miguillas river valley, and two open-cycle natural gas powered generation turbines at a plant located in El Alto-Kenko, adjacent to La Paz, Bolivia. We own water rights in connection with our operation of COBEE. COBEE has capacity of 228 MW, representing 12% of the total capacity of Bolivia as of December 31, 2015.
During the six months ended June 30, 2016 and the years ended December 31, 2015, 2014 and 2013, COBEE generated revenues of $22 million, $43 million, $41 million and $41 million, respectively, representing 2%, 3%, 3% and 5% of our consolidated revenues, respectively. During the year ended December 31, 2015, COBEE generated 1,081 GWh, representing 13% of the national interconnected electrical system of Bolivia’s energy requirements.
The following table sets forth certain information for each of COBEE’s plants for each of the periods presented:
As of 2016 | For the Years Ended December 31, | |||||||||||||||||||||||||||||||||||
2015 | 2014 | 2013 | ||||||||||||||||||||||||||||||||||
Plant | Year of | Elevation | Installed | Gross | Availability | Gross | Availability | Gross | Availability | |||||||||||||||||||||||||||
| (meters) | (MW) | (GWh) | (%) | (GWh) | (%) | (GWh) | (%) | |||||||||||||||||||||||||||||
Zongo Valley plants: | ||||||||||||||||||||||||||||||||||||
Zongo | 1997 | 4,264 | 11 | 10 | 98 | 9 | 99 | 8 | 98 | |||||||||||||||||||||||||||
Tiquimani | 1997 | 3,889 | 9 | 13 | 98 | 11 | 99 | 11 | 99 | |||||||||||||||||||||||||||
Botijlaca | 1938 | 3,492 | 7 | 39 | 99 | 34 | 97 | 38 | 97 | |||||||||||||||||||||||||||
Cutichucho | 1942 | 2,697 | 23 | 128 | 95 | 91 | 80 | 104 | 85 | |||||||||||||||||||||||||||
Santa Rosa | 2006 | 2,572 | 18 | 86 | 97 | 84 | 98 | 82 | 96 | |||||||||||||||||||||||||||
Sainani1 | 1956 | 2,210 | 10 | 24 | 34 | 15 | 17 | 71 | 98 | |||||||||||||||||||||||||||
Chururaqui | 1966 | 1,830 | 25 | 139 | 96 | 127 | 95 | 144 | 98 | |||||||||||||||||||||||||||
Harca | 1969 | 1,480 | 26 | 162 | 95 | 156 | 95 | 166 | 97 | |||||||||||||||||||||||||||
Cahua | 1974 | 1,195 | 28 | 163 | 94 | 163 | 95 | 171 | 98 | |||||||||||||||||||||||||||
Huaji | 1999 | 945 | 30 | 180 | 92 | 198 | 96 | 205 | 97 | |||||||||||||||||||||||||||
Miguillas Valley plants | ||||||||||||||||||||||||||||||||||||
Miguillas | 1931 | 4,140 | 4 | 9 | 91 | 9 | 99 | 9 | 99 | |||||||||||||||||||||||||||
Angostura | 1936 | 3,827 | 6 | 19 | 92 | 19 | 99 | 20 | 99 | |||||||||||||||||||||||||||
Choquetanga | 1939 | 3,283 | 6 | 37 | 95 | 37 | 98 | 40 | 99 | |||||||||||||||||||||||||||
Carabuco | 1958 | 2,874 | 6 | 42 | 94 | 43 | 97 | 45 | 98 | |||||||||||||||||||||||||||
El Alto-Kenko2 | 1995 | 4,050 | 19 | 30 | 50 | 90 | 93 | 46 | 87 | |||||||||||||||||||||||||||
|
|
|
|
|
|
|
| |||||||||||||||||||||||||||||
Total | 228 | 1,081 | 1,086 | 1,160 | ||||||||||||||||||||||||||||||||
|
|
|
|
|
|
|
| |||||||||||||||||||||||||||||
| 1. | Plant was temporarily out of service due to damages sustained as a result of landslides in March 2014. The plant, which cost approximately $5 million to repair, came back on line in August 2015. The company maintains insurance which covers the loss of revenue as a result of property damage and business interruption for up to 12 months. |
| 2. | Reflects the effective capacity of El Alto—Kenko, which is comprised of two open-cycle turbines. The turbines have an installed capacity of 29 MW. However, as a result of the high altitude of the turbines (which are located at 4,050 meters above sea level), the installed capacity of these turbines are de-rated, resulting in an effective capacity of 19 MW. |
223
Table of Contents
Although the Bolivian government has nationalized entities in its power utility market, as recently as 2012, we are unaware of any steps the Bolivian government may take, or is currently taking, with respect to nationalizations within the Bolivian power utility market, generally, or with respect to COBEE, in particular. For further information on the risks related to the Bolivian government’s nationalization of certain generation companies, see“Risk Factors—Risks Related to Government Regulation–TheBolivian government has nationalized energy industry assets, and our remaining operations in Bolivia may also be nationalized.”
Chile
Central Cardones
We own 87% of Central Cardones; the remaining 13% is held by Central Cardones’ former controlling shareholder, South World Consulting S.A., an energy consulting and business development firm. We acquired our interest in Central Cardones in December 2011 to obtain an initial footprint in the Chilean power market. Central Cardones owns and operates one open-cycle diesel Siemens turbine located in the northern part of the SIC and was the first Chilean power facility to be included in our portfolio. Central Cardones has an installed capacity of 153 MW, representing 0.8% of the total installed capacity of Chile as of December 31, 2015. Central Cardones’ power plant is used primarily for cold reserve capacity as a peaking unit, generally operating only in extraordinary situations. Central Cardones receives revenues from its allocation of available system capacity and does not have any customers. During the six months ended June 30, 2016 and the years ended December 31, 2015, 2014 and 2013, Central Cardones generated revenues of $6 million, $14 million, $11 million and $11 million, respectively, representing less than 1%, 1%, 1% and 1% of our consolidated revenues, respectively.
The following table sets forth certain information for Central Cardones’ plant for each of the periods presented:
As of 2016 | For the Years Ended December 31, | |||||||||||||||||||||||||||||||
2015 | 2014 | 2013 | ||||||||||||||||||||||||||||||
Plant | Year of | Installed | Gross Energy | Availability | Gross Energy | Availability | Gross Energy | Availability | ||||||||||||||||||||||||
| (MW) | (GWh) | (%) | (GWh) | (%) | (GWh) | (%) | ||||||||||||||||||||||||||
Central Cardones | 2009 | 153 | 4 | 97 | 0.04 | 97 | — | 98 | ||||||||||||||||||||||||
Colmito
We own 100% of Colmito. Colmito, which we acquired in September 2013, owns and operates a dual fuel open-cycle Rolls Royce aeroderivative turbine that commenced operation in August 2008. Although the Colmito plant previously operated with diesel fuel as a backup for the SIC, the plant was connected to a natural gas pipeline in February 2015, and has begun to purchase natural gas on a seasonal basis to generate energy. Colmito’s generation facility is located in the central part of the SIC. Colmito has an installed capacity of 58 MW, representing 0.3% of the total installed capacity of Chile as of December 31, 2015.
During the six months ended June 30, 2016 and the years ended December 31, 2015, 2014 and 2013, Colmito generated revenues of $12 million, $28 million, $38 million and $1 million, respectively, representing 1%, 2%, 3% and 0.1% of our consolidated revenues, respectively. During the year ended December 31, 2015, Colmito generated 27 GWh, representing 0.1% of the SIC system’s energy requirements. Colmito has committed to sell over 50% of its available energy in every year up to 2017.
224
Table of Contents
The following table sets forth certain information for Colmito’s plant for each of the periods presented:
As of | For the Years Ended December 31, | |||||||||||||||||||||||||||||||
2015 | 2014 | 2013 | ||||||||||||||||||||||||||||||
Plant | Year of | Installed | Gross Energy | Availability | Gross Energy | Availability | Gross Energy | Availability | ||||||||||||||||||||||||
| (MW) | (GWh) | (%) | (GWh) | (%) | (GWh) | (%) | ||||||||||||||||||||||||||
Colmito | 2008 | 58 | 27 | 99 | 5.9 | 95 | 46 | 91 | ||||||||||||||||||||||||
Dominican Republic
CEPP
We own 97% of CEPP; the remaining 3% is held by Basic Energy LTD Bahamas. CEPP owns and operates 12 generation units powered by HFO at two plants located in Puerto Plata, Dominican Republic. The CEPP I plant is located on land and consists of three Wartsila V32 diesel generators burning HFO with a combined capacity of 17 MW. The CEPP II plant generates power on a barge near the shore, which contains nine Wartsila V32 diesel generators burning HFO, that is moored at a pier adjacent to the CEPP I plant and has capacity of 50 MW. In the third quarter of 2013, CEPP purchased second a barge with a capacity of 37 MW for $5 million. This barge contains seven engines, five with 5.5 MW of capacity and two with 5 MW of capacity. CEPP completely refurbished this barge at a total cost of $16 million, and, in November 2014, transferred this barge to our subsidiary Kanan.
Excluding the capacity associated with the refurbished barge that has been transferred to Kanan, CEPP has a capacity of 67 MW, representing approximately 2% of the total capacity in the Dominican Republic as of December 31, 2015. The CEPP I plant and the CEPP II plant also have fuel storage tanks on-site with an aggregate storage capacity of 56,000 barrels.
During the six months ended June 30, 2016 and the years ended December 31, 2015, 2014 and 2013, CEPP generated revenues of $13 million, $39 million, $73 million and $92 million, respectively, representing 2%, 3%, 5% and 11% of our consolidated revenues, respectively. During the year ended December 31, 2015, CEPP generated 298 GWh, representing 2% of the national interconnected electrical system of the Dominican Republic’s energy requirements.
The following table sets forth certain information for each of CEPP’s plants for the periods presented:
As of | For the Years Ended December 31, | |||||||||||||||||||||||||||||||
2015 | 2014 | 2013 | ||||||||||||||||||||||||||||||
Plant | Year of | Installed | Gross Energy | Availability | Gross Energy | Availability | Gross Energy | Availability | ||||||||||||||||||||||||
| (MW) | (GWh) | (%) | (GWh) | (%) | (GWh) | (%) | ||||||||||||||||||||||||||
CEPP I | 1990 | 16 | 67 | 74 | 51 | 34 | 78 | 87 | ||||||||||||||||||||||||
CEPP II | 1994 | 51 | 231 | 83 | 191 | 42 | 261 | 87 | ||||||||||||||||||||||||
|
|
|
|
|
|
|
| |||||||||||||||||||||||||
Total | 67 | 298 | 242 | 339 | ||||||||||||||||||||||||||||
|
|
|
|
|
|
|
| |||||||||||||||||||||||||
Prior to September 2014, CEPP was party to two long-term PPAs, representing 75% of its capacity, with Empresa Distribuidora de Electricidad del Norte S.A., or Edenorte, and had experienced significant payment delays with respect to such PPAs. As a result, CEPP’s payment cycle spanned three to six months, as compared to the typical payment cycle of our other business which spans 30 to 45 days. Notwithstanding such significant delays, which characterize Edenorte’s payment patterns in both the PPA and spot market in the Dominican Republic, Edenorte has historically paid its outstanding obligations, in full, including interest accrued on late payments. To finance its operating activities in light of such payment cycle, CEPP utilizes its working capital
225
Table of Contents
line of credit with local banks. For further information on CEPP’s counterparty risks, see “Risk Factors—Risks Related to Our Business—We are exposed tocounterparty risks.” For further information on CEPP’s line of credit with financial institutions in the Dominican Republic, see “Management’s Discussion and Analysis of Financial Condition and Results of Operations—Material Indebtedness—Short-Term Loans.”
Each of CEPP’s PPAs expired in September 2014, and as of the date of this prospectus have not yet been extended or replaced with one or more PPAs on comparable terms. As a result, CEPP made 100% of its energy sales in the spot market in 2015 and sells the capacity previously contracted under such PPAs on the spot market, at the rates dictated by such market, and subject to the aforementioned significant payment delays.
Agua Clara
We are starting development of a 50 MW wind project in the Dominican Republic, which is expected to commence commercial operations in early 2018. We have entered into a PPA with a government entity for a period of 20 years; the PPA is subject to the grant of a concession which remains outstanding. We are in the process of selecting an EPC contractor and lenders for the project. The total project cost is estimated to be approximately $100 million, of which approximately 70% is expected to be debt-financed.
Jamaica
JPPC
We own 100% of JPPC, as a result of our purchase in May 2014 of the 84% of JPPC’s outstanding equity interest that we did not own, which increased our equity interest in JPPC from 16% to 100%. JPPC owns and operates two diesel generation units burning HFO and a combined-cycle steam turbine at a plant located in Kingston, Jamaica. JPPC has capacity of 60 MW, representing approximately 6% of the total capacity of the Jamaican interconnected system as of December 31, 2015. JPPC’s plant has fuel storage tanks on site with an aggregate storage capacity of 50,000 barrels.
During the six months ended June 30, 2016 and the years ended December 31, 2015 and 2014 (since the date of our acquisition of JPPC in May 2014), JPPC generated revenues of $15 million, $45 million and $41 million, respectively, representing 2%, 3% and 3% of our consolidated revenues, respectively. During the year ended December 31, 2015, JPPC generated 445 GWh, representing 11% of the Jamaican interconnected system’s energy requirements. JPPC has committed to sell over 50% of its available energy in every year up to 2018.
The following table sets forth certain information for JPPC’s plant for each of the periods presented:
As of | For the Years Ended December 31, | |||||||||||||||||||||||||||||||
| 2015 | 2014 | 2013 | ||||||||||||||||||||||||||||||
Plant | Year of | Installed | Gross Energy | Availability | Gross Energy | Availability | Gross Energy | Availability | ||||||||||||||||||||||||
| (MW) | (GWh) | (%) | (GWh) | (%) | (GWh) | (%) | ||||||||||||||||||||||||||
JPPC | 1998 | 60 | 445 | 86 | 425 | 85 | 447 | 88 | ||||||||||||||||||||||||
Colombia
Surpetroil
We own 60% of Surpetroil, which we acquired in March 2014 and which represents our initial entry into the Colombian power generation market; the remaining 40% is owned by Mr. Yesid Gasca Duran. Surpetroil is dedicated to power generation utilizing stranded and associated natural gas reserves and operates four power plants fueled by natural gas in different parts of Colombia. Surpetroil also transports and distributes compressed
226
Table of Contents
natural gas within Colombia. The Surpetroil plant has a generation capacity of 20 MW, representing approximately 0.12% of the total capacity in the Colombian interconnected system as of December 31, 2015. Of this capacity, only 10 MW (Surpetroil’s Purificación plant) are connected to the Colombian interconnected system.
When initially acquired by us, Surpetroil had a capacity of 15 MW. Surpetroil has various small-scale opportunities to install additional capacity using stranded gas under development and has completed such installations during the course of 2015 and 2016. As of June 30, 2016, Surpetroil’s capacity has increased to 31 MW as a result of our completion of various greenfield projects.
During the six months ended June 30, 2016 and the years ended December 31, 2015 and 2014 (since the date of our acquisition of Surpetroil in March), Surpetroil generated revenues of $4 million, $8 million and $9 million, respectively, representing less than 1%, 1% and 1% of our consolidated revenues in each of the periods, respectively. During the year ended December 31, 2015, Surpetroil generated 43 GWh, and primarily provided energy to Enertolima, an affiliate of Enel Group, via the Purificación plant.
As of 2016 | For the Years Ended December 31, | |||||||||||||||||||||||||||
2015 | 2014 | 2013 | ||||||||||||||||||||||||||
Plant | Year of | Installed | Gross Energy | Availability | Gross Energy | Availability | Gross Energy | Availability | ||||||||||||||||||||
| (MW) | (GWh) | (%) | (GWh) | (%) | (GWh) | (%) | ||||||||||||||||||||||
La Hocha | 2011 | 2 | 10 | 84 | 47 | 98 | 22 | 97 | ||||||||||||||||||||
Purificación | 2014 | 10 | 19 | 100 | 1 | 1 | 1 | — | — | |||||||||||||||||||
Entrerios | 2015 | 3 | 12 | 98 | — | — | — | — | ||||||||||||||||||||
Geopark | 2015 | 16 | 2 | 100 | — | — | — | — | ||||||||||||||||||||
|
|
|
|
|
|
| ||||||||||||||||||||||
| 31 | 43 | 48 | 22 | |||||||||||||||||||||||||
|
|
|
|
|
|
| ||||||||||||||||||||||
| 1. | As a result of gas unavailability during December 2014. |
Guatemala
RECSA
In January 2016, we acquired 100% of RECSA – an electricity transmission company that supports Guatemala’s electrical system by operating 32 km of transmission lines and eight sub-stations—in connection with our acquisition of Energuate.
RECSA operates its transmission lines under a 50-year authorization granted by the Guatemalan government that will expire in 2057. Generators, transportation companies, distributors, electricity brokers and unregulated customers pay for their connection to, and use of, RECSA’s transmission lines. The tolls charged for use of RECSA’s lines were set by CNEE in January 2015, and will expire in January 2017.
Panama
Pedregal
We own 21% of Pedregal; of the remaining 79%, (1) 55% is held by IEH Jamaica (Cayman), a private equity investment firm; (2) 12% is held by Burmeister & Wain Scandinavian Contractor A/S, an operating company of the Mitsui Group; and (3) 11% is held by The Industrialization Fund for Developing Countries, a fund focusing on promoting economic activities in developing countries. Although Pedregal is located in Central America, it is not included as part of our Central America segment because we do not consolidate Pedregal’s results in our income statement, but account for our investment in Pedregal under the equity method, recording our share in income of associated companies.
227
Table of Contents
Pedregal owns and operates three generation units powered by HFO at a plant located in Pacora, Panama. Although we have a non-controlling interest in Pedregal, Pedregal entered into a management services agreement with our wholly-owned subsidiary Inkia Panama Management that expired in October 2016. Under this agreement, Inkia Panama Management had been designated as the administrator responsible for day-to-day management of Pedregal. We expect to renew the management services agreement in November 2016. However, we may be unable to do so.
Pedregal has an installed capacity of 54 MW, representing approximately 2% of the total installed capacity in the Panamanian interconnected system as of December 31, 2015. Pedregal’s plant also has fuel storage tanks on site with an aggregate storage capacity of 51,402 barrels. During the year ended December 31, 2015, Pedregal generated 356 GWh, representing 4% of the Panamanian interconnected system’s energy requirements. Pedregal has committed to sell over 60% of its available energy in 2016.
For further information on the risks related to our ownership of a minority interest in Pedregal, see “Risk Factors—Risks Related to Our Business—We do not control Pedregal.”
Distribution Business
History and Background
In January 2016, we completed our acquisition of:
| • | Energuate, the trade name for our Guatemalan electricity distribution business, which consists of: |
| • | DEORSA, in which we hold a 93% interest; the remaining 7% interest is held by private minority shareholders; and |
| • | DEOCSA, in which we hold a 91% interest; the remaining 9% interest is held by private minority shareholders, |
from Deorsa-Deocsa Holdings Limited, an investment company of Actis LLP, a private equity firm, which had acquired the businesses in 2011. We paid $266 million in cash for the businesses (as well as Guatemel and RECSA) and assumed debt of $284 million. We funded the payment of the acquisition through internally generated funds and a $120 million loan facility, which we entered into in December 2015.
DEORSA and DEOCSA were both founded in 1998, when the Guatemalan government conducted an auction for these companies as part of the privatization of the Guatemalan electricity sector. As a result of the auction, DEORSA and DEOCSA were sold to Union Fenosa, a gas company, and employees of DEORSA and DEOCSA.
Energuate
Energuate consists of two electricity distribution companies in Guatemala that, as of December 31, 2015, provided services for approximately 1.6 million regulated customers in Guatemala (representing approximately 55% of Guatemala’s regulated distribution customers in 2015) and distributed energy to a service area of approximately 100,000 km2 in Guatemala, covering primarily rural areas with a population of approximately 12 million inhabitants. Energuate operates approximately 34,000 km of distribution lines within Guatemala (representing approximately 70% of Guatemala’s distribution lines) as of December 31, 2015. Energuate operates in 20 of Guatemala’s 22 departments and holds the non-exclusive right to distribute electricity within its service areas until 2048.
In the years ended December 31, 2015, 2014 and 2013, Energuate sold 2,305 GWh, 2,164 GWh and 2,017 GWh of energy, respectively.
228
Table of Contents
Service Area
Energuate has authorizations to provide electricity distribution services within its service area until 2048. Energuate operates in 20 of Guatemala’s 22 departments, excluding Guatemala City and Sacatepéquez, covering approximately 100,000 km2 and approximately 12 million inhabitants. DEORSA’s service area covers the northern and eastern regions of Guatemala, while DEOCSA’s service area covers the south western region of Guatemala. DEOCSA’s authorization also includes the Department of Guatemala, but DEOCSA does not operate within this department. While EEGSA, the other large Guatemalan distribution company, has an authorization to provide electricity distribution services within certain of the departments in Energuate’s service area, Energuate does not face actual competition within these departments.
The following map indicates the areas in which DEORSA and DEOCSA operate.
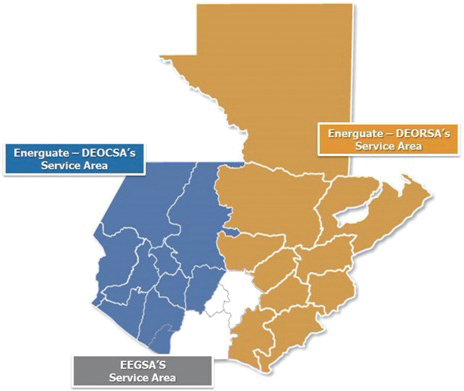
Compared to the urban and residential departments in which the other large Guatemalan distribution company, EEGSA, operates, Energuate’s service area is predominantly rural and characterized by lower electrification levels and underdeveloped infrastructure. For example, in Energuate’s service area, there are still some households that utilize propane and wood for cooking, illumination and other household needs. As such, we believe that Energuate’s service area has room for further growth in electricity distribution. In addition, the Guatemalan government has historically implemented projects to increase electrification levels in Guatemala and we believe the Guatemalan government will continue to promote access to electricity through policies such as subsidies for low-consumption rural clients.
229
Table of Contents
The following chart shows the growth of electrification levels in Guatemala between 2009 and 2015.
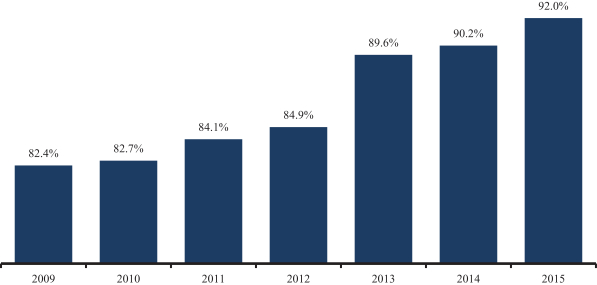
Customer Base
As of December 31, 2015, Energuate provides electric service to approximately 1.6 million customers, which includes both regulated and unregulated customers. Energuate’s customer base is divided into four categories:
| • | Residential (some of whom receive subsidies for their purchase of electricity); |
| • | Commercial (small- to medium-sized enterprises, such as local hospitals, gas stations, irrigation pumps and small-sized agricultural facilities); |
| • | Industrial (large-sized enterprises, such as hotel and resort complexes, commercial malls and large-scale agricultural facilities); and |
| • | Other (which includes certain government entities, such as municipalities). |
230
Table of Contents
The following table sets forth the volume of energy purchased, the percentage of purchased energy lost, the volume of energy distributed to Energuate’s consumers and the number of Energuate’s consumers by category, during the periods indicated.
Six Months | Year Ended December 31, | |||||||||||||||
2016 | 2015 | 2014 | 2013 | |||||||||||||
Energy purchased (GWh) | 1,436 | 2,785 | 2,631 | 2,520 | ||||||||||||
Total electricity losses (%) | 18.0 | 17.3 | % | 17.7 | % | 20.0 | % | |||||||||
Energy distributed (GWh) | 1,183 | 2,305 | 2,164 | 2,017 | ||||||||||||
To regulated customers | 1,126 | 2,149 | 1,991 | 1,862 | ||||||||||||
Residential | 844 | 1,604 | 1,483 | 1,405 | ||||||||||||
Commercial | 129 | 245 | 234 | 228 | ||||||||||||
Industrial | 23 | 34 | 27 | 19 | ||||||||||||
Other customers | 130 | �� | 266 | 246 | 210 | |||||||||||
To unregulated customers1 | 57 | 156 | 173 | 155 | ||||||||||||
Number of customers | 1,656,637 | 1,634,773 | 1,579,725 | 1,534,923 | ||||||||||||
Regulated customers | 1,656,499 | 1,634,616 | 1,579,555 | 1,534,758 | ||||||||||||
Residential | 1,652,091 | 1,630,204 | 1,575,204 | 1,530,474 | ||||||||||||
Commercial | 4,036 | 4,037 | 3,991 | 3,917 | ||||||||||||
Industrial | 76 | 79 | 65 | 75 | ||||||||||||
Other customers | 296 | 296 | 295 | 292 | ||||||||||||
Unregulated customers1 | 138 | 157 | 170 | 165 | ||||||||||||
| 1. | Unregulated customers consist of end users with a demand exceeding 100 kW, consisting principally of industrial and commercial customers. |
Distribution Tariffs
Under the General Electricity Law and the regulations of the CNEE, the tariffs that Energuate charges to its regulated customers are subject to the approval of the CNEE. Energuate charges distribution tariffs for all electricity delivered through its distribution system, whether to its customers or customers of wholesale electricity brokers.
There are seven different tariffs that are applicable to Energuate’s regulated customers. Each of Energuate’s regulated customers agrees to purchase electricity from Energuate at one of these tariff rates. Energuate’s schedule of tariffs includes:
| • | a social tariff available to customers with a demand of up to 300 kWh per month; |
| • | a regular tariff, available to all customers that purchase electricity at low voltage; |
| • | a low voltage peak tariff available to customers that have their greatest demand during hours of peak demand (between 6:00 p.m. and 10:00 p.m.); |
| • | a low voltage off-peak tariff available to customers that have their greatest demand during off-peak hours; |
| • | a medium voltage peak tariff available to customers that have their greatest demand during peak hours; |
| • | a medium tension off-peak tariff available to customers that have their greatest demand during off-peak hours; and |
231
Table of Contents
| • | a tariff available to governmental entities that purchase electricity for public lighting. |
For further information on the seven tariffs applicable to Energuate’s regulated customers, see “Regulatory, Environmental and Compliance Matters—Regulation of the Guatemalan Electricity DistributionMarket—Tariffs and Tolls.” The following table sets forth the volume of energy delivered by Energuate to its customers by tariff during the periods indicated.
Year ended December 31, | ||||||||||||
2015 | 2014 | 2013 | ||||||||||
| (GWh) | ||||||||||||
Tariff | ||||||||||||
Social tariff | 1,175 | 1,102 | 1,039 | |||||||||
Regular tariff | 407 | 363 | 348 | |||||||||
Low voltage peak tariff | 98 | 72 | 33 | |||||||||
Low voltage off-peak tariff | 148 | 163 | 197 | |||||||||
Medium voltage peak tariff | 14 | 2 | 2 | |||||||||
Medium voltage off-peak tariff | 177 | 197 | 172 | |||||||||
Public lighting tariff | 250 | 240 | 210 | |||||||||
|
|
|
|
|
| |||||||
Energy distributed | 2,305 | 2,164 | 2,017 | |||||||||
The tariffs collected by Energuate are comprised of :
| • | an electricity charge, updated quarterly and designed to reimburse the distribution company for the cost of electricity and capacity that it purchases and transmission tolls to the interconnection point with Energuate’s grid. The electricity charge consists of a base tariff and an electricity adjustment surcharge. Under the General Electricity Law and the regulations of the CNEE, the base tariff is adjusted annually each year on May 1 to reflect anticipated changes in the cost of electricity to be purchased by Energuate during the following year. The electricity adjustment surcharge is adjusted quarterly to reflect variations in the actual cost of electricity purchased by Energuate against the projected cost; and |
| • | a VAD charge designed to permit a model efficient distribution company to cover its operating expenses, complete its capital expenditure plans and recover its cost of capital. |
The VAD component of the distribution tariff is revised every five years with semi-annual adjustments for inflation and local currency exchange rates against the U.S. Dollar. The VAD charges are set by the CNEE. The VAD charge was last set in January 2014 and will expire in January 2019. In setting tariffs for system operation in Guatemala, the range for permitted theoretical after-inflation return on investment for distributors is between 7%—13%. Currently, the tariffs approved for Energuate’s authorizations contemplate approximately a 7.0% return. For further information on the calculation of distribution tariffs, see“—Regulatory, Environmental and Compliance Matters—Regulation of the Guatemalan Electricity Distribution Market—Tariffs and Tolls.”
Authorizations
In 1998, the MEM granted authorizations to DEORSA and DEOCSA to use public property (including rivers) and impose easements on private lands, thus enabling them to deliver electricity over their respective distribution systems in their service areas for a period of 50 years. The authorizations allow Energuate to conduct its operations and include the right to use public roads and other public domain spaces and to obtain easements over certain state-owned and private lands in order to construct, maintain and operate its distribution system.
The authorizations granted are not exclusive. However, due to the high cost of constructing a distribution system, we do not expect significant competition from other distribution companies within Energuate’s service area in the near- to medium-term.
232
Table of Contents
The authorizations impose certain obligations on Energuate, such as the obligation to provide service to all consumers requesting such service within areas that are located within 200 meters of Energuate’s distribution lines and maintain safety and quality standards, as well as customer satisfaction levels. The authorizations may be revoked at the discretion of MEM if Energuate fails to meet these standards, among others. In the event that Energuate’s authorizations are revoked, the MEM may sell Energuate’s distribution assets through a public auction. For further information on Energuate’s authorizations to provide electricity distribution services in Guatemala, see “—Regulation of the Guatemalan Electricity Distribution Market—Regulated Customers and Distribution Authorizations.”
Billing
Energuate bills its customers on a monthly basis. Most of Energuate’s customers have meters installed to record electricity usage, and customers are sent invoices each month based on their total electricity consumption. Payments are required to be made 30 days from billing. By law, customers can accumulate two invoices without making a payment before their supply of electricity can be terminated. Customers who fail to pay a bill will receive an interest charge on their subsequent bill for amounts not paid in the preceding month. Unpaid invoices are sent to Energuate’s internal collections department, and generally, Energuate will cease supplying its services when a customer repeatedly fails to make payments. Energuate records a monthly provision for doubtful accounts based on its past collection experience and management estimates regarding future collections. Amounts are written off when the collections department deems the account to be irrecoverable. In the years ended December 31, 2015, 2014, and 2013, DEORSA’s collection rates (which reflect the amounts collected divided by the total billed amounts) were 98.3%, 98.3% and 97.0%, respectively, and DEOCSA’s collection rates were 94.4%, 95.1% and 94.3%, respectively.
Power Purchase Agreements and Spot Market Purchases
Energuate purchases the electricity it distributes to its customers through PPAs with generation companies including, for example, our subsidiary Puerto Quetzal. Guatemalan distribution companies are required by the General Electricity Law to maintain PPAs with generating companies at all times to cover 100% of the maximum expected demand for the current year, as well as the next year. Should the contracted capacity and electricity under its PPAs be insufficient to meet the demand of its customers, Energuate makes purchases on the spot market, only if authorized by CNEE. As of December 31, 2015, Energuate was party to over 100 PPAs. Distribution companies can only purchase capacity and energy and enter into PPAs through a public bidding process supervised by the CNEE.
The following table sets forth the supplier, the amount of contracted capacity and the expiration date of Energuate’s seven largest effective PPAs, covering 73% of Energuate’s contracted capacity.
Supplier | Contracted Capacity | Expiration | ||||||
Jaguar Energy Guatemala LLC | 200 | April 2030 | ||||||
Instituto Nacional de Electrificación | 76 | April 2017 | ||||||
Eólico San Antonio El Sitio, Sociedad Anónima | 50 | April 2030 | ||||||
Renace, Sociedad Anónima | 45 | April 2030 | ||||||
Instituto Nacional de Electrificación | 38 | April 2030 | ||||||
Hidro Xacbal, Sociedad Anónima | 30 | April 2030 | ||||||
Duke Energy Guatemala y Compañía, Sociedad en Comandita por Acciones | 18 | April 2017 | ||||||
Under most of its PPAs, Energuate pays a capacity charge and an energy charge. Energuate pays a specified amount for each MW of capacity purchased under these PPAs and an electricity charge for the kWh of electricity actually delivered to Energuate. Most of Energuate’s PPAs also provide that the electricity charge is indexed to changes in published quotations for the type of fuel used by the generator. In addition, Energuate is required to pay certain additional costs incurred by the generators to provide electricity including connection costs, transmission tolls, additional costs imposed by the CNEE and other similar costs.
233
Table of Contents
Service Standards
Pursuant to its authorizations, Energuate is required to meet specified standards with respect to the quality and delivery of the electricity distributed to its customers. The quality standards refer to the electricity’s voltage levels. A breach may be deemed to have occurred when there are changes in the voltage level. A monetary fine is imposed under Energuate’s authorizations for breaches exceeding certain limits, with such fines credited towards the affected consumer’s next bill. Delivery standards refer to the frequency and duration of interruptions in the supply of electricity.
Energuate is also required to survey its customers annually to assess their satisfaction levels. The survey covers perceived service quality, technical services (measuring interruptions or blackouts during the year) and overall customer service. If customer satisfaction levels set by the CNEE are not achieved, Energuate may be fined. If Energuate repeatedly incurs such fines, does not pay fines that have been imposed or otherwise repeatedly provides deficient service, its authorizations may be revoked. Additionally, in the event that Energuate’s authorizations are revoked, the MEM may sell Energuate’s distribution assets through a public auction.
Energuate may be subject to other monetary fines and penalties for failure to comply with other terms of its authorization agreements. In the year ended December 31, 2015, DEORSA and DEOCSA paid fines and penalties of $304 thousand and $199 thousand, respectively, as compared to $393 thousand and $256 thousand, respectively, in the year ended December 31, 2014. For further information on claims against Energuate relating to its service standards, see “Business—Legal Proceedings—Claims Relating to Energuate’s Technical Service Quality.”
The following table sets forth the results of the annual customer survey for DEORSA, DEOCSA and EEGSA, the other significant electricity distribution company in Guatemala, for the periods presented.
For the Year Ended December 31, | ||||||||||||
2015 | 2014 | 2013 | ||||||||||
DEORSA | ||||||||||||
Product Quality (%) | 71.5 | 72.4 | 81.6 | |||||||||
Technical Service (%) | 70.1 | 70.9 | 77.8 | |||||||||
Customer Service (%) | 93.1 | 72.5 | 94.0 | |||||||||
DEOCSA | ||||||||||||
Product Quality (%) | 59.9 | 78.3 | 77.6 | |||||||||
Technical Service (%) | 59.5 | 76.9 | 75.8 | |||||||||
Customer Service (%) | 88.1 | 76.7 | 91.9 | |||||||||
EEGSA | ||||||||||||
Product Quality (%) | 78.6 | 86.6 | 87.7 | |||||||||
Technical Service (%) | 75.1 | 87.0 | 85.4 | |||||||||
Customer Service (%) | 92.1 | 89.5 | 93.7 | |||||||||
In connection with our acquisition of Energuate, we established a goal to improve Energuate’s customer satisfaction levels by improving service standards, reducing interruptions, and improving customer service by achieving faster response times.
Electricity Losses
Energuate experiences electricity losses in the form of technical and commercial losses. Technical losses are those that occur in the ordinary course of Energuate’s distribution of electricity or those resulting from the specific characteristics of Energuate’s distribution network, and include losses due to energy dissipation in conductors and magnetic losses in transformers. Commercial losses are those resulting from illegal connections,
234
Table of Contents
fraud or billing errors. Energuate’s technical losses in the six months ended June 30, 2016 and the years ended December 31, 2015 and 2014 were 10.6% of its total energy received during each period, and its commercial losses in the six months ended June 30, 2016 and the years ended December 31, 2015 and 2014 were 7.3%, 6.7% and 7.1% of its total energy received, respectively. The distribution tariffs that Energuate charges its regulated customers include a VAD component, which provides for an allowance for losses incurred in the distribution of electricity determined by the CNEE. To the extent that Energuate’s electricity losses exceed the approximately 14% allowance (which includes both technical and commercial losses) contemplated in the current formula of the VAD component of the distribution tariff, Energuate will bear the cost of such losses.
Our management has established a goal to reduce Energuate’s electricity losses. We intend to reduce commercial losses through improving customer billing practices, increasing targeted inspections and meter replacements, implementing a communication program with local communities and modernizing Energuate’s facilities to reduce tampering, especially in areas where electricity theft has been more prevalent, and reduce technical losses by investing in the modernization of Energuate’s transmission grid and distribution system. In particular, Energuate will inspect around 10,000 specifically targeted meters each month for evidence of fraud and replace approximately 93,000 old meters each year.
Distribution Network
Electricity is transferred from supply points connected with the Guatemalan National Electricity System, to customers through Energuate’s distribution system, which consists of a wide network of overhead lines, cables and substations carrying successively lower voltages. As of December 31, 2015, Energuate’s distribution system included approximately 34,000 km of distribution lines, representing approximately 70% of Guatemala’s distribution lines.
Transmission, Construction and Maintenance Services
Energuate pays tolls for transmission of electricity over the primary and secondary transmission systems. These tolls are subject to the approval of the CNEE and will expire on December 31, 2016. The cost of transmission tolls are included in the electricity charge in Energuate’s tariffs, which are then passed through to Energuate’s customers.
Energuate has outsourced certain construction and maintenance activities to various third parties, who provide the following services to Energuate:
| • | 24-hour emergency services, including call center, fault response, building security and personal security services; |
| • | building new connections and installations; |
| • | providing connection and disconnection services; and |
| • | maintaining and repairing installations and equipment, including substations, transformers and meeting stations. |
Seasonality
Seasonality does not have a significant impact on the demand for electricity in Energuate’s service area. Demand for electricity is consistent throughout the year due to a steady number of daylight hours throughout the year and limited use of heating and air conditioning systems within Energuate’s service areas.
235
Table of Contents
Employees
As of December 31, 2015, Energuate had a total of 788 employees, divided into operative, administrative and customer service employees. From time to time, Energuate contracts for the service of temporary employees. As of December 31, 2015, approximately 60% of Energuate’s employees were unionized and were members of one of four labor unions, each of which are currently party to collective bargaining agreements with DEORSA and DEOCSA, which are expected to expire in December 2016. These agreements will be extended automatically a month before the date of expiration if a specified notice is otherwise not provided. However, if a specified notice is provided, the agreements will be renegotiated, not terminated, and must meet certain conditions related to salary. The collective bargaining agreements include, among other things, a 5% annual increase in salaries, which cannot be eliminated or reduced. In the case of Energuate’s employees, the increase was effective for the years of 2014, 2015 and 2016.
Guatemala Distribution Service Providers
The electricity distribution market in Guatemala is predominantly served by three companies: DEORSA and DEOCSA (which operate under the brand name “Energuate”) and EEGSA. In addition, there are approximately 15 municipal distributors operating in the AMM. EEGSA operates in an urban and suburban service area, including the departments of Guatemala (which includes the country’s capital, Guatemala City), Sacatepéquez and Escuintla and holds an authorization over the service area until 2048.
DEORSA and DEOCSA are the only large distribution companies which operate distribution systems in their service areas, and therefore do not face significant competition for regulated customers within their service areas. While EEGSA’s authorization permits it to operate in certain of Energuate’s departments, Energuate does not face competition from EEGSA in these departments. However, DEORSA and DEOCSA’s authorizations are non-exclusive and MEM may grant an authorization to a competing distribution company in their service areas. Given the cost of constructing a competing distribution system, we do not believe any other distribution company will establish a widespread service to regulated customers in DEORSA and DEOCSA’s service areas in the near- to medium-term.
Potential Projects
We are constantly monitoring and considering development and acquisition opportunities and are currently assessing projects in Israel and various Latin American countries, such as Argentina, Chile, Colombia, Panama, Peru, the Dominican Republic, Mexico, Nicaragua, El Salvador and Puerto Rico relating to generation or distribution projects or companies. For example, we are starting development of a 50MW wind project in the Dominican Republic, which is expected to commence commercial operations in early 2018. With respect to our potential generation projects, such projects range in size from small-scale power facilities (e.g., less than 40 MW) to large-scale power facilities (e.g., approximately 750 MW) and utilize different fuels and technologies, including natural gas, hydroelectric, wind, solar and stranded gas. In some instances, we have acquired land, secured necessary licenses or rights, including temporary concessions and water rights, commissioned studies, made bids, or initiated similar actions, in connection with our assessment of the viability of the relevant project.
Set forth below is a map summarizing certain of the markets and projects that we have identified for potential expansion. Development projects imply a high degree of uncertainty, and there is no guarantee that we will proceed with these projects. Ultimately, notwithstanding the number of opportunities that we may consider over the long- and short-terms, we will only pursue those projects that we believe will generate attractive, risk-adjusted returns over the long-term and which we believe we have the management capacity to build and operate. In addition, in some cases, we may not obtain the relevant approval to develop a project. Furthermore, in many
cases, we will need to win tenders, obtain additional rights, permits, licenses, land purchases and water rights and may need to negotiate with counterparties or conduct valuations and environmental studies, each of which could take years to satisfy, or may not be satisfied at all. The summary below sets forth projects developed and owned
236
Table of Contents
by us, as well as projects owned by third parties, that we may be able to acquire by direct negotiations or through tender processes. This summary is not exhaustive, is only provided to show projects which we are evaluating, and should not serve as an indication of any expectation regarding any final outcome:
Chile
We believe that Chile is one of the most attractive power markets in Latin America, characterized by a highly-efficient and investor-friendly model with a stable regulatory framework and electricity demand growth.
We are constantly monitoring and assessing opportunities in Chile. The acquisitions of Colmito and Central Cardones provide us with the initial footprint from which to carry out our organic development strategy in this key market. Currently, we have identified opportunities in the thermal and renewables segments. In the thermal segment, we have already acquired lands and a 50-year land concession from the government on which we may develop thermal projects representing an installed capacity of 2,700 MW. In the renewables segment, we are currently analyzing potential opportunities in the hydroelectric, wind and solar sectors. Chile represents one of the most attractive markets in Latin America, but historically it has also been one of the most challenging markets in Latin America in which to obtain environmental permits. As such, opportunities may take time to materialize.
Israel
Following recent government initiatives encouraging investments in the Israeli power generation market, the entrance of private developers has opened the door for a range of opportunities. We believe the OPC plant, the first IPP in the country, provides us with a first-mover’s advantage to further expand our presence in this fast growing, but stable market. In addition, we acquired an additional plot of land adjacent to OPC, which is large enough to house another combined cycle or similar generation facility to expand OPC’s capacity in the long-term, among other potential opportunities. The acquisition of the additional plot of land remains subject to final government approval.
237
Table of Contents
Colombia
Colombia’s investment grade status, high growth and mature regulatory framework make Colombia similar to Peru and one of the main target countries within our strategic plan. Factors such as the attractive niche of stranded gas reserves and the proximity of such reserves to industrial areas create an appealing opportunity for us. For these reasons, our strategic acquisition of a 60% equity interest in Surpetroil, a company that utilizes stranded natural gas reserves, serves as an important entry point into the Colombian market. By having a local presence in the market, we have been able to identify new opportunities, such as a large project portfolio of small-scale stranded gas and mini-hydros, that we are currently pursuing.
Peru
Peru, our current core market, represents an attractive geography for further expansion, especially in the hydro segment. Peru has one of the fastest growing economies in Latin America, with a long-term strong outlook for power demand coupled with a mature regulatory framework and a well-run power system. For these reasons, Peru remains a key growth focus for us and we have several opportunities under various states of development in this country. In the hydro segment, we have secured land and are pursuing environmental approval for two hydroelectric projects with a combined capacity of approximately 550 MW. We believe our strong presence in the Peruvian market gives us a competitive advantage at the time of materializing opportunities, helping to identify and assess new developments in advance of other market participants.
In addition, we may pursue opportunities to expand the installed capacity of our existing operating assets in Peru. For example, the Samay I plant, which reached COD in May 2016, will operate as a cold reserve plant with diesel and currently has an installed capacity of 616 MW. Once natural gas becomes available to the facility through the Gasoducto Sur Peruano, the Samay I plant will operate as a natural gas-fired power plant and will be able to do so without us making any additional investments in Samay I’s facilities. When fueled by natural gas, the Samay I plant will have an installed capacity of approximately 720 MW. Finally, following an additional investment in the conversion of the Samay I plant, which we have not committed to make, the Samay I plant could operate as a combined cycle thermoelectric plant, which would increase Samay I’s installed capacity to approximately 1,080 MW.
Furthermore, we may pursue opportunities to increase the installed capacity of the Las Flores plant, which has the environmental approvals and a permit to increase its installed capacity through the construction of a 190 MW gas-fired expansion. In addition, Las Flores has sufficient space to locate a combined-cycle expansion on its existing premises. The combined cycle expansion has also been granted environmental approvals. Following the gas-powered expansion and an additional investment in the conversion of the Las Flores plant, neither of which we have committed to do, the Las Flores plant could operate as a combined cycle thermoelectric plant, reflecting an increase in capacity by 400 MW from 193 MW to 593 MW.
Mexico
Mexico is enjoying strong momentum in the energy and infrastructure sectors following market reforms in 2013 and 2014. The reform of the electricity sector has driven, and is expected to continue to drive, significant investments in new generation capacity. In addition, PEMEX, a Mexican state-owned petroleum company, has announced that it aims to reach an installed capacity of approximately 3.1 GW in the medium-term by partnering with power companies for the development of cogeneration plants. The Mexican government has also announced initiatives towards the development of significant renewable energy capacity, seeking to add approximately 4.6 GW of wind capacity over the next decade. Given the market’s expected growth, strong demand and stability, we have decided to open an office in Mexico which is fully dedicated to the sourcing of opportunities and we hope to materialize prospects in the short to medium term as a result of these efforts.
238
Table of Contents
Argentina
As part of a new Argentinian government plan, the Argentinian government has introduced a new pricing scheme for energy generation companies, which implies an increase of approximately 25% to previous energy tariffs. In addition, as an effort to foster investments and add additional capacity to the system, the Argentinian government launched a 1 GW public auction for renewable energy, with the goal of reaching 8% and 20% of installed capacity coming from renewable energy sources by 2017 and 2020, respectively. It is expected that additional tenders will follow for renewable energy plants, as well as large-scale combined cycle plants.
We are constantly monitoring and assessing opportunities in Argentina, both in thermal and renewable energy. We are currently assessing opportunities for a 540 MW thermal project and a 100 MW wind project.
We apply a disciplined approach to evaluating potential development projects. We will not pursue projects or enter into countries at any cost, and are willing to lose competitive bids if the expected returns on a project do not provide the appropriate risk premium. When we decide to pursue a development project, we first endeavor to construct projects by entering into turnkey EPC agreements that define the total project cost and transfer significant part of the risks of construction delays and cost overruns to our EPC contractors. Second, we seek to secure a revenue stream as early as possible in the development process of our plants by sourcing and entering into long-term PPAs, which provide our development projects with predictable projected margins and cash flows before construction has commenced. Finally, we leverage our EPC contracts and PPAs to secure long-term project financing agreements which are generally stand-alone, secured, project-specific and with no or limited recourse. We have not entered into EPC agreements, PPAs or financing agreements in connection with these potential projects.
Generation Customers
Our generation businesses’ customers include governments, local distribution companies, and/or non-regulated customers, depending upon the operating company and the particular country of operation. Our generation companies seek to enter into long-term PPAs with power purchasers. In the year ended December 31, 2015, approximately 89% of our capacity and energy sales were made pursuant to long-term PPAs. Additionally, the majority of our capacity has been contracted for sale, according to long-term agreements. For example, in 2015, Kallpa signed seven long-term PPAs with various distribution companies and non-regulated customers for the sale of electricity and Kallpa has committed to sell over 50% of its available energy (in MWh) in every year through 2021.
In attempting to limit the effects of such counterparty risks, each of our generation companies analyzes the creditworthiness and financial strengths of its various counterparties during the PPA negotiations as well as during the life of the agreement. Where the creditworthiness of the power purchaser is deemed to be below standard, various contractual agreements and structures are negotiated (such as letters of credit, liquidity facilities, and government guarantees) to provide the credit support.
Under the terms of most of our generation businesses’ PPAs, the power purchaser is contractually obligated to purchase energy, and sometimes capacity and/or ancillary services, from the power generator based upon a base price (denominated either in U.S. Dollars or in the local currency) that is adjusted for (1) fluctuations in exchange rates, (2) the U.S. inflation index, (3) a local inflation index, (4) fluctuations in the cost of operating fuel, (5) supply of natural gas, (6) transmission costs and/or (7) spot prices in the case of an interruption of the supply or transportation of natural gas. Many of these PPAs differentiate between peak and off-peak periods. Utilizing PPAs allows our generation companies to lock in gross margins and provides us and our generation companies with earnings stability.
239
Table of Contents
As of December 31, 2015, the weighted average remaining life of our PPAs based on firm capacity was 10 years (including the remaining life of the PPAs for CDA, Samay I and Kanan). The following table sets forth a summary of the significant PPAs for our generation companies as ofDecember 31, 20151:
Company | Principal Customer | Commencement | Expiration | Contracted | ||||||||||
| (MW) | ||||||||||||||
| Operating Companies and Associated Company | ||||||||||||||
Peru Segment | ||||||||||||||
Kallpa | Edelnor S.A.A., Luz del Sur S.A.A., Hidrandina S.A., Edecañete S.A.A., Electosureste S.A., Seal S.A.3 | January 2014 | December 2021 | 350 | ||||||||||
| Edelnor S.A.A., Luz del Sur S.A.A., Hidrandina S.A., Electosureste S.A., Seal S.A., Electrosur S.A.4 | January 2014 | December 2023 | 210 | |||||||||||
| Sociedad Minera Cerro Verde S.A.A.5 | January 2011 | December 2020 | 140 | |||||||||||
| Compañía Minera Antapaccay S.A.6 | November 2011 | December 2025 | 100 | |||||||||||
| Southern Perú Copper Corporation | April 2017 | April 2027 | 120 | |||||||||||
| Southern Perú Copper Corporation (Toquepala)7 | May 2017 | May 2027 | 70-85 | |||||||||||
Israel Segment8 | ||||||||||||||
OPC | PPA with Israel ElectricCorporation9 | July 2013 | June 2032 | 440 | ||||||||||
AIE | Hadera Paper | August 2015 | September 2018 | 12 | ||||||||||
| Hadera Paper | September 2018 | August 2036 | 39 | |||||||||||
Central America Segment | ||||||||||||||
Corinto | Distribuidora de Electricidad del Norte S.A., Distribuidora de Electricidad del Sur S.A. | June 1999 | December 2018 | 50 | ||||||||||
Tipitapa Power | Distribuidora de Electricidad del Norte S.A., | |||||||||||||
| Distribuidora de Electricidad del Sur S.A. | April 1999 | December 2018 | 51 | |||||||||||
Amayo I and Amayo II | Distribuidora de Electricidad del Norte S.A., | March 2009 | March 2024 | 40 | ||||||||||
| Distribuidora de Electricidad del Sur S.A., | March 2010 | March 2025 | 23 | |||||||||||
Nejapa | Seven distribution companies | August 2013 | January 2018 | 71 | ||||||||||
| Seven distribution companies | August 2013 | July 2017 | 39 | |||||||||||
| Seven distribution companies | January 2015 | December 2017 | 30 | |||||||||||
Puerto Quetzal | Comegsa | January 2013 | April 2017 | 20/30 | ||||||||||
| CCEESA | September 2015 | December 2017 | 12 | |||||||||||
| MEL | February 2013 | December 2017 | 15 | |||||||||||
Other Segment | ||||||||||||||
COBEE10 | Minera San Cristóbal | December 2008 | October 2017 | 43 | ||||||||||
Colmito | ENAP Refinerías S.A. | January 2014 | December 2017 | 35 | ||||||||||
JPPC | Jamaica Public Services Company | January 1998 | January 2018 | 60 | ||||||||||
Surpetroil | GEOPARK | November 2015 | October 2016 | 7 | ||||||||||
| PETROSUD | March 2015 | June 2018 | 2 | |||||||||||
Pedregal | Empresa de Distribución Eléctrica Metro-Oeste, S.A., Empresa de Distribución Eléctrica Chiriqui, S.A. | February 2013 | December 2016 | 25 | ||||||||||
| Elektra Noreste, S.A. | February 2013 | December 2016 | 13 | |||||||||||
| Empresa de Distribución Eléctrica Metro-Oeste, S.A., Empresa de Distribución Eléctrica Chiriqui, S.A. | January 2014 | December 2016 | 5 | |||||||||||
| Elektra Noreste, S.A. | January 2014 | December 2016 | 2 | |||||||||||
| Assets in Advanced Stages of Construction | ||||||||||||||
CDA | ElectroPerú | August 2016 | December 2030 | 200 | ||||||||||
| Luz del Sur S.A.A.11 | January 2018 | December 2027 | 202 | |||||||||||
| Edelnor S.A.A. | January 2022 | December 2031 | 81 | |||||||||||
Samay I | Peruvian Investment Promotion Agency | May 2015 | April 2035 | 600 | ||||||||||
Kanan | Empresa de Distribución Eléctrica Chiriqui (EDECHI) | December 2015 | December 2020 | 7 | ||||||||||
| Empresa de Distribución Eléctrica Elektra Nor Este S.A. (ENSA) | December 2015 | December 2020 | 34 | |||||||||||
| Empresa de Distribución Eléctrica Metro Oeste S.A. (EDEMET) | December 2015 | December 2020 | 45 | |||||||||||
240
Table of Contents
| 1. | Many of our PPAs, excluding OPC’s and AIE’s PPAs, provide for payment in, or are linked to, the U.S. Dollar. The majority of the PPAs are indexed to the price of the corresponding power plant’s operating fuel prices in U.S. Dollars (for plants that use fuel). Although OPC’s PPAs are not linked to the U.S. Dollar, IEC, who has contracted to purchase all of OPC’s energy and capacity, purchases our gas pursuant to an agreement which, as a result of a number of other factors, ties IEC’s gas purchases to the U.S. Dollar. |
| 2. | Where a range is presented, contracted capacity varies monthly for the duration of the PPA. |
| 3. | Kallpa executed 14 PPAs, two PPAs with each of the following seven entities: (i) Edelnor S.A.A., (ii) Luz del Sur S.A.A., (iii) Edecañete S.A., (iv) Electrosur S.A., (v) Electro Sur Este S.A.A., (vi) Sociedad Eléctrica del Sur Oeste S.A. and (vii) Electro Puno S.A.A. Each of Electrosur S.A. and Electro Puno S.A.A. assigned their PPAs to Hidrandina S.A. in August 2012 and in October 2012, respectively. The 350 MW capacity represents the aggregate contracted capacity among these 14 PPAs. |
| 4. | Kallpa executed 12 PPAs, two PPAs with each of the following six entities: (i) Edelnor S.A.A., (ii) Luz del Sur S.A.A., (iii) Electrosur S.A., (iv) Electro Sur Este S.A.A., (v) Electro Puno S.A.A. and (vi) Sociedad Eléctrica del Sur Oeste S.A. Electro Puno S.A.A. assigned its PPAs to Hidrandina S.A. in October 2012. The 210 MW capacity represents the aggregate contracted capacity among these 12 PPAs. |
| 5. | A subsidiary of Freeport McMoRan, Inc. |
| 6. | A subsidiary of Glencore Xstrata. |
| 7. | Contracted capacity will be determined during the first six months of supply after the client begins operations. Minimum of 70 MW and maximum of 85 MW. |
| 8. | OPC’s and AIE’s PPAs provide for payment in New Israeli Shekels. |
| 9. | The terms of the IEC PPA provide OPC with the option to allocate and sell the generated electricity of the power station directly to end users. OPC has exercised this option and sells its energy and capacity directly to 24 end users as of December 31, 2015 (20 end users as of June 30, 2016), who primarily consist of Israeli industrial companies, such as Oil Refineries Limited and Granit Group. OPC has entered into PPAs with end users which cover a range of 5 MW to 107 MW of capacity, with each PPA covering, on average, 25 MW of capacity. As of December 31, 2015, the weighted average remaining life of OPC’s PPAs with end users based on firm capacity is seven years. For further information on the IEC PPA, see“—Regulatory, Environmental and Compliance Matters—Regulation of the Israeli Electricity Sector.” |
| 10. | In December 2011, the Bolivian government amended the applicable law to prohibit generation companies from entering into new PPAs. As a result, COBEE will be unable to extend or replace its current PPA, under which it has contracted 19% of its capacity, when it expires in October 2017. For further information on risks related on our inability to renew, enter into, or replace long-term PPAs, see “Risk Factors—Risks Related to Our Business–Our generation companies may not be able to enter into, or renew existing, long-term contracts for the sale of energy and capacity, contracts which reduce volatility in our results of operations.” |
| 11. | Represents capacity under three separate PPAs. |
Distribution Customers
For further information on the customers within our distribution business, see “—Distribution Business—Customer Base.”
Raw Materials and Suppliers
Our power facilities utilize natural gas, hydroelectric, HFO, diesel, wind or a combination of these energy sources. The price volatility, availability and purchase price of these materials (other than wind and water) depend upon the specific fuel and the market in which the fuel is to be used.
Kallpa, our largest asset, is party to several supply agreements, including long-term natural gas supply agreements and transportation services agreements that are material to its operations. While Nejapa and CEPP purchase the HFO necessary for their operations in the El Salvador and Dominican spot markets, respectively, JPPC, Nejapa, Corinto, Tipitapa and Puerto Quetzal purchase the HFO necessary for their operations from several fuel suppliers in connection with long-term supply agreements. The sole provider of natural gas in Bolivia is a government-owned company. Therefore, the terms for transmission and delivery of natural gas to COBEE are set by government decree.
Natural Gas Supply and Transportation Agreements
Kallpa purchases its natural gas requirements for its generation facilities from the Camisea Consortium, pursuant to a natural gas supply agreement. Under this agreement, the Camisea Consortium has agreed to supply Kallpa’s natural gas requirements, subject to a daily maximum amount, and Kallpa has agreed to acquire natural gas exclusively from the Camisea Consortium. The Camisea Consortium is obligated to provide a maximum of
241
Table of Contents
4.3 million cubic meters of natural gas per day to Kallpa’s plant and Kallpa is obligated to purchase a minimum of 2.2 million cubic meters of natural gas per day. Should Kallpa fail to consume the contractual minimum volume on any given day, it may make up the consumption volume shortage on any day during the following 18 months. The price that Kallpa pays to the Camisea Consortium for the natural gas supplied is based upon a base price in U.S. Dollars set on the date of the agreement, indexed each year based on two producer price indices: Fuels and Related Products Power Index and Oil Field and Gas Field Machinery Index, with discounts available based on the volume of natural gas consumed. This agreement expires in June 2022. For information on the risks related to Kallpa’s inability to renew, extend or replace this agreement prior to its expiration, see “Risk Factors—Risks Related to Our Business—Supplier concentration may expose us to significant financial credit or performance risk, particularly with respect to those agreements which may expire during the life of our power plants.”
Kallpa’s natural gas transportation services are rendered by TGP pursuant to a natural gas firm transportation agreement and an interruptible gas transportation agreement. In April 2014, the firm transportation agreement was further modified to include the transportation agreement between Duke Energy Egenor S. en C. por A. and Las Flores. These agreements both expire in December 2033.
Additionally, Kallpa is party to two additional natural gas transportation agreements that expire in April 2030 and April 2033, respectively.
Additionally, on April 1, 2014, Kallpa entered into an agreement with TGP to cover the period up to the completion of the expansion of TGP’s pipeline facilities.
Set forth below is a summary of the natural gas transportation services under these agreements (in cubic meters of gas per day):
Periods | Firm | Interruptible | ||
Initial Date of Dispatch up to pipeline expansion | 3,474,861 | 1,329,593 | ||
April 22, 2016 - March 20, 2020 | 4,854,312 | 764,463 | ||
March 20, 2020 - January 1, 2021 | 4,655,000 | 764,463 | ||
January 2, 2021 - March 31, 2030 | 4,655,000 | 530,000 | ||
April 1, 2030 - March 31, 2033 | 3,883,831 | 1,301,169 | ||
April 1, 2033 - December 31, 2033 | 2,948,831 | 1,301,169 |
Natural gas distribution services are rendered by Cálidda, under a natural gas distribution agreement. Under such agreement, which expires on December 31, 2033, Cálidda is obliged to distribute up to approximately 3.71 million cubic meters of natural gas per day to Kallpa.
OPC purchases natural gas from the Tamar Group, composed of Noble Energy Mediterranean Ltd., Delek Drilling Limited Partnership, Isramco Negev 2 Limited Partnership, Avner Oil Exploration Limited Partnership and Dor Gas Exploration Limited Partnership, or collectively, the Tamar Group, pursuant to a natural gas supply agreement. Under this agreement, the Tamar Group has agreed to supply OPC’s natural gas requirements, subject to a contractual maximum amount of 10.6 billion cubic meters.
The price that OPC pays to the Tamar Group for the natural gas supplied is based upon a base price in New Israeli Shekels set on the date of the agreement, indexed to changes in the “Production Cost” tariff, which is part of the “Time of Use” tariff and the U.S. Dollar representative exchange rate. As a result, increases or decreases in the EA’s generation tariff have a related effect on OPC’s cost of sales and margins. In addition, the natural gas price formula in OPC’s supply agreement is subject to a floor mechanism. As a result of previous declines in the PUAE’s (which preceded the EA) generation component tariff, OPC began to pay the ultimate floor price in November 2015. Therefore, the September 2015 decline, which reduced the PUAE generation
242
Table of Contents
component tariff by approximately 12%, the potential additional approximately 8% decline to be considered at a November 2016 public hearing, and any further declines in the EA generation component tariff, will not result in a corresponding decline in OPC’s natural gas expenses, and will therefore lead to a greater decline in OPC’s margins, which may have a material adverse effect on OPC’s business, results of operations and financial condition. For information on the risks associated with the impact of the EA’s generation tariff on OPC’s supply agreement with the Tamar Group, see “Risk Factors—Risks Related to Government Regulation—The production and profitability of IPPs in Israel may be adversely affected by changes in Israel’s regulatory environment.”
OPC’s agreement with the Tamar Group expires upon the earlier of June 2029 or the date on which OPC consumes the entire contractual capacity. For information on the Israeli Natural Gas Council’s resolution regarding the pro rata distribution of natural gas in the event of gas shortages in Israel, see “—Regulatory, Environment and Compliance Matters—Regulation of the Israeli Electricity Sector.”
OPC’s agreement with the Tamar Group provides for the curtailment of OPC’s gas supply in the event of insufficient gas supply, and notes that certain other Tamar Group customers have priority over OPC for supply and may therefore not be curtailed even if OPC were curtailed. However, in December 2012, the Israeli Natural Gas Council issued Resolution No. 6/2012, or the Gas Authority Resolution, with respect to the regulation of the usage of capacity of the natural gas pipeline from the Tamar rig in case of a shortage of capacity of the gas pipeline, and such regulation differs from the provision included in OPC’s agreement with the Tamar Group. We believe that the pro-rata mechanism stipulated in the Gas Authority Resolution may increase the gas volume delivered to OPC pursuant to OPC’s agreement with the Tamar Group in the event of gas pipeline capacity shortages. The manner in which the Gas Authority Resolution would be implemented, if at all and, if implemented, its potential effect on OPC’s agreement with the Tamar Group, if any, remains unknown. On April 12, 2016, in preparation for a potential shortage which may have resulted due to Tamar Group’s scheduled maintenance, the director of the Natural Gas Authority sent notification to Tamar Group’s gas purchasers, which notice set forth the allocation of gas during such shortage in manner that was substantially different from Resolution No. 6/2012. Pursuant to the notification, the system manager (currently IEC) would be responsible for allocating the gas among electricity generating gas buyers. Gas buyers who are users of the high-pressure national transmission system (such as OPC) would be allocated gas on a pro rata basis while low-pressure distribution network users would be prioritized. The legal validity of this notification, and its practical effect on OPC, if any, during a potential shortage is unknown.
The Tamar Group has, in the past, worked on the expansion of the transmission capacity of natural gas from the Tamar gas field, which expansion will eventually increase the pipeline capacity from the platform to the shore, and to the transmission system. However, following delays in the Israeli Anti-Trust Authority’s approval of, among others, Noble, a part owner and the operator of the Tamar lease as a result of Noble’s cross holdings in additional gas fields (primarily the Leviathan gas field), Noble announced that it was suspending all of its projects in Israel, including the Tamar expansion project, until all regulatory issues were resolved. On August 16, 2015, a revised natural gas framework arrangement between the Tamar Group, the Leviathan group, and the Israeli government was approved by the Israeli government. Pursuant to such arrangement, new IPPs may now, among other things, select to purchase gas at a base price which reflects the average price paid by the three major conventional IPPs—Dorad, Dalia and OPC. In response to petitions filed against the natural gas framework arrangement, on March 27, 2016, the Supreme Court of the State of Israel affirmed the natural gas framework arrangement, with the exception of the stability provisions (which, subject to certain conditions, protected the Tamar Group and the Leviathan Group from future regulatory changes). The Supreme Court concluded that the Israeli government should provide stability assurances and provisions through an alternate legal mechanism and indicated that provided the Israeli government had one year to resolve this matter. On May 22, 2016, the Israeli government reaffirmed its August 16, 2015 decision concerning the natural gas framework with an alternative arrangement with respect to “maintaining a regulatory environment which encourages investments.” On June 2, 2016, the Petroleum Commissioner at the Ministry of National Infrastructures, Energy and Water Resources, approved the development plan of the Leviathan field. As of the date of this prospectus, no new petitions have been filed against the updated natural gas arrangement.
243
Table of Contents
Once such matter has been resolved, Noble is expected to continue with the Tamar expansion project (together with the Tamar Group) and the development of the Leviathan field (together with the Leviathan group). In the event that the Tamar expansion project is not completed, the possible result could be a lack of pipeline capacity in the future, which could result in the curtailment of OPC’s gas supply.
HFO and Diesel Supply
Our operating companies that rely on HFO and diesel obtain their supply of HFO and diesel either through acquisitions on the spot market or pursuant to short- to medium-term supply agreements. The supply agreements that our operating companies enter into for HFO and diesel are generally linked to the Platts, McGraw Hill Financial Index.
Competition
Our major competitors in the Latin American and Caribbean countries in which our generation companies operate are generally the large international power utility corporations operating in these countries. Local competitors also exist in each of these countries and account for varying market shares, depending upon the country of interest.
Set forth below is a discussion of competition among power generation companies in certain of our markets of operation. For further information on competition within our distribution business, see “—Distribution Business—Guatemala Distribution Service Providers.”
Peru
In Peru, power generation companies compete along a number of dimensions, including the ability to (1) source and enter into long-term PPAs with power purchases, (2) source and secure land for the development or expansion of additional power generation plants, (3) source and secure natural gas to fuel power generation stations, (4) win tenders by the Peruvian government to build cold, or other generation supply, reserve plants, and (5) maintain or increase market share in the growing Peruvian electricity market, particularly in connection with the balance of energy supply and demand within Peru. In Peru, we compete with state-owned generation companies (although their relative weight in the market has been diminishing over time since the privatization process started in the 1990s), as well as large international and domestic private generators.
The following table sets forth the quantity of energy generated by each of the principal generation companies in Peru for the periods presented:
Gross Energy Generation | ||||||||||||||||||||||||
For the Year Ended December 31, | ||||||||||||||||||||||||
| 2015 | 2014 | 2013 | ||||||||||||||||||||||
Company | (GWh) | Market | (GWh) | Market | (GWh) | Market | ||||||||||||||||||
Kallpa Generación S.A. | 5,166 | 11.60 | 5,920 | 14.17 | 5,459 | 13.76 | ||||||||||||||||||
Edegel1 (a subsidiary of Enel) | 8,370 | 18.79 | 8,848 | 21.17 | 8,700 | 21.93 | ||||||||||||||||||
Engie Energía Perú S.A. (formerly EnerSur S.A.) | 7,172 | 16.10 | 7,098 | 16.98 | 7,719 | 19.46 | ||||||||||||||||||
ElectroPerú S.A. (a state-owned generation company) | 7,172 | 16.10 | 7,041 | 16.85 | 7,272 | 18.33 | ||||||||||||||||||
Duke Energy Egenor S. en C. por A2 (a subsidiary of Duke | 2,648 | 5.95 | 2,534 | 6.06 | 2,727 | 6.87 | ||||||||||||||||||
Other generation companies | 14,012 | 31.46 | 10,351 | 24.77 | 7,793 | 19.65 | ||||||||||||||||||
|
|
|
|
|
|
|
|
|
|
|
| |||||||||||||
Total | 44,540 | 100.0 | 41,792 | 100.0 | 39,670 | 100.0 | ||||||||||||||||||
|
|
|
|
|
|
|
|
|
|
|
| |||||||||||||
| 1. | Includes Edegel and Chinango S.A.C. |
244
Table of Contents
| 2. | Includes Egenor and Termoselva S.R.L. |
Israel
Within Israel, our major competitors are IEC and private power generators, such as Dorad Energy Ltd. and Dalia, who, as a result of recent government initiatives encouraging investments in the Israeli power generation market, have constructed, and are constructing, power stations with significant capacity.
Until OPC reached COD in July 2013, IEC operated as the sole large-scale provider of electricity in Israel. In May 2014, Dorad Energy Ltd. became the second IPP to reach COD in Israel, adding a capacity of 860 MW to the Israeli electric market. In July 2015, the first of two units of the power plant of Dalia reached COD. In September 2015, the second unit reached its COD, adding, together with the first unit, 910 MW to the Israeli electric market. Several other IPPs are in the process of constructing power plants, and are expected to reach COD in the coming years. As of the date of this prospectus, IEC has not published generation and energy and capacity sales information for IPPs.
Nicaragua
The electricity market in Nicaragua is served by a variety of generation companies, including (1) ICPNH, (2) ALBA de Nicaragua, S.A. (ALBANISA), (3) PENSA Proyecto Eléctrico de Nicaragua, S.A, (4) Enel SpA and (5) Generadora de Occidente, Ltda. ICPNH competes with each of these companies for the right to supply capacity and energy to distribution companies and other non-regulated customers as well as exports to SIEPAC.
The following table sets forth the quantity of energy generated by each of the principal generation companies in Nicaragua for the periods presented:
Gross Energy Generation | ||||||||||||||||||||||||
For the Year Ended December 31, | ||||||||||||||||||||||||
| 2015 | 2014 | 2013 | ||||||||||||||||||||||
Company | (GWh) | Market | (GWh) | Market | (GWh) | Market | ||||||||||||||||||
ICPNH | 1,095 | 24.88 | 1,099 | 26.71 | 1,085 | 28.03 | ||||||||||||||||||
ALBA de Nicaragua, S.A. (ALBANISA) | 886 | 20.13 | 745 | 18.11 | 535 | 13.82 | ||||||||||||||||||
PENSA Proyecto Eléctrico de Nicaragua, S.A. | 451 | 10.24 | 430 | 10.45 | 424 | 10.95 | ||||||||||||||||||
Enel SpA | 283 | 6.42 | 354 | 8.60 | 435 | 11.23 | ||||||||||||||||||
Generadora de Occidente, Ltda. | 370 | 8.42 | 266 | 6.47 | 258 | 6.66 | ||||||||||||||||||
Other generation companies | 1,316 | 29.91 | 1,220 | 29.65 | 1,134 | 29.29 | ||||||||||||||||||
|
|
|
|
|
|
|
|
|
|
|
| |||||||||||||
Total | 4,401 | 100.0 | 4,114 | 100.0 | 3,871 | 100.0 | ||||||||||||||||||
|
|
|
|
|
|
|
|
|
|
|
| |||||||||||||
Guatemala
The electricity market in Guatemala is served by a variety of generation companies, including (1) Puerto Quetzal, (2) El Instituto Nacional de Electrificación (INDE), (3) Energías San José S.A., and (4) Duke Energy Guatemala y Cia, S.C.A. Puerto Quetzal competes with each of these companies for the right to supply capacity and energy to distribution companies and other non-regulated customers, as well as ancillary services to the grid. In addition, Puerto Quetzal competes directly, or through its trading arm Poliwatt Limitada, for the export of energy and capacity to various countries in SIEPAC.
245
Table of Contents
The following table sets forth the quantity of energy generated by each of the principal generation companies in Guatemala for the periods presented:
Gross Energy Generation | ||||||||||||||||||||||||
For the Year Ended December 31, | ||||||||||||||||||||||||
| 2015 | 2014 | 2013 | ||||||||||||||||||||||
Company | (GWh) | Market | (GWh) | Market | (GWh) | Market | ||||||||||||||||||
Puerto Quetzal | 673 | 6.53 | 490 | 4.67 | 514 | 5.38 | ||||||||||||||||||
El Instituto Nacional de Electrificación (INDE) | 1,969 | 19.11 | 3,159 | 30.09 | 2,763 | 28.91 | ||||||||||||||||||
Energías San José, S. A. | 1,045 | 10.14 | 970 | 9.24 | 916 | 9.58 | ||||||||||||||||||
Duke Energy Guatemala y CIA, S. C. A. | 675 | 6.55 | 872 | 8.31 | 905 | 9.47 | ||||||||||||||||||
Other generation companies | 5,940 | 57.66 | 5,007 | 47.69 | 4,460 | 46.66 | ||||||||||||||||||
|
|
|
|
|
|
|
|
|
|
|
| |||||||||||||
Total | 10,302 | 100.0 | 10,498 | 100.0 | 9,558 | 100.0 | ||||||||||||||||||
|
|
|
|
|
|
|
|
|
|
|
| |||||||||||||
El Salvador
The electricity market in El Salvador is served by a variety of generation companies, including (1) Nejapa, (2) Comisión Ejecutiva Hidroeléctrica del Río Lempa, a state-owned generation company whose primary generation facilities are hydroelectric plants, (3) LaGeo S.A. de C.V., a state-owned generation company whose primary generation facilities are geothermal plants, (4) Duke Energy International, a subsidiary of Duke Energy Corp., (5) Inversiones Energéticas, S.A. de C.V., and (6) Termopuerto, S.A. de C.V. Nejapa competes with each of these companies for the right to supply capacity and energy to distribution companies and other non-regulated customers, as well as for exports to SIEPAC.
The following table sets forth the quantity of energy generated by each of the principal generation companies in El Salvador for the periods presented:
Gross Energy Generation | ||||||||||||||||||||||||
For the Year Ended December 31, | ||||||||||||||||||||||||
| 2015 | 2014 | 2013 | ||||||||||||||||||||||
Company | (GWh) | Market | (GWh) | Market | (GWh) | Market | ||||||||||||||||||
Nejapa | 440 | 7.97 | 376 | 6.08 | 458 | 7.37 | ||||||||||||||||||
Comisión Ejecutiva Hidroeléctrica del Río Lempa | 1,349 | 24.43 | 1,718 | 27.76 | 1,790 | 28.81 | ||||||||||||||||||
LaGeo S.A. de C.V. | 1,432 | 25.93 | 1,558 | 25.17 | 1,560 | 25.11 | ||||||||||||||||||
Duke Energy International | 853 | 15.43 | 821 | 13.26 | 826 | 13.29 | ||||||||||||||||||
Inversiones Energéticas, S.A. de C.V. | 491 | 8.89 | 574 | 9.27 | 599 | 9.64 | ||||||||||||||||||
Termopuerto, S.A. de C.V. | 493 | 8.93 | 476 | 7.69 | 303 | 4.88 | ||||||||||||||||||
Other generation companies | 465 | 8.42 | 667 | 10.77 | 677 | 10.90 | ||||||||||||||||||
|
|
|
|
|
|
|
|
|
|
|
| |||||||||||||
Total | 5,523 | 100.0 | 6,188 | 100.0 | 6,211 | 100.0 | ||||||||||||||||||
|
|
|
|
|
|
|
|
|
|
|
| |||||||||||||
Panama
The electricity market in Panama is served by a variety of generation companies, including (1) Pedregal, (2) ACP, (3) AES Panamá, S.R.L, (4) Celsia SA ESP and (5) Enel Fortuna, S.A. Pedregal competes with each of these companies for the right to supply capacity and energy to distribution companies and other non-regulated customers, as well as for exports to SIEPAC.
246
Table of Contents
The following table sets forth the quantity of energy generated by each of the principal generation companies in Panama for the periods presented:
Gross Energy Generation | ||||||||||||||||||||||||
For the Year Ended December 31, | ||||||||||||||||||||||||
| 2015 | 2014 | 2013 | ||||||||||||||||||||||
Company | (GWh) | Market | (GWh) | Market | (GWh) | Market | ||||||||||||||||||
Pedregal | 356 | 3.31 | 405 | 4.40 | 420 | 4.79 | ||||||||||||||||||
ACP | 828 | 7.70 | 1,029 | 11.18 | 551 | 6.28 | ||||||||||||||||||
AES Panamá, S.R.L. | 2,497 | 23.22 | 1,993 | 21.66 | 2,160 | 24.63 | ||||||||||||||||||
Celsia SA ESP | 1,444 | 13.43 | 1,565 | 17.00 | 1,750 | 19.95 | ||||||||||||||||||
Enel Fortuna, S.A. | 1,658 | 15.42 | 1,130 | 12.28 | 1,224 | 13.96 | ||||||||||||||||||
Other hydros | 1,777 | 16.53 | 1,473 | 16.00 | 1,191 | 13.58 | ||||||||||||||||||
Other thermal | 1,047 | 9.74 | 1,311 | 14.25 | 1,408 | 16.05 | ||||||||||||||||||
Solar & wind | 428 | 3.97 | 189 | 2.05 | — | |||||||||||||||||||
EOR | 17 | 0.16 | 108 | 1.17 | 68 | 0.78 | ||||||||||||||||||
|
|
|
|
|
|
|
|
|
|
|
| |||||||||||||
Total | 10,752 | 100.0 | 9,203 | 100.0 | 8,772 | 100.0 | ||||||||||||||||||
|
|
|
|
|
|
|
|
|
|
|
| |||||||||||||
Bolivia
The electricity market in Bolivia is primarily served by a variety of generation companies, including COBEE, Guaracachi, Valle Hermoso and Corani. Prior to May 2010, Guaracachi was a subsidiary of Rurelec Plc, Valle Hermoso was a subsidiary of the Bolivian Generating Group, and Corani was a subsidiary of Engie S.A. In May 2010, the Bolivian government nationalized each of these generation companies and began negotiations with the owners of these generation companies with respect to the compensation to be paid for these assets. In October 2011, the Bolivian government reached compensation settlements related to the nationalization of Valle Hermoso and Corani, and in 2014, reached compensation settlements related to the nationalization of Guaracachi.
The following table sets forth the quantity of energy generated by each of the principal generation companies in Bolivia for the periods presented:
Gross Energy Generation | ||||||||||||||||||||||||
For the Year Ended December 31, | ||||||||||||||||||||||||
| 2015 | 2014 | 2013 | ||||||||||||||||||||||
Company | (GWh) | Market | (GWh) | Market | (GWh) | Market | ||||||||||||||||||
COBEE | 1,081 | 12.97 | 1,086 | 13.86 | 1,160 | 15.17 | ||||||||||||||||||
Guaracachi | 1,999 | 23.98 | 2,078 | 26.52 | 2,104 | 28.63 | ||||||||||||||||||
Valle Hermoso | 1,070 | 12.84 | 1,457 | 18.59 | 1,318 | 17.94 | ||||||||||||||||||
Corani | 938 | 11.25 | 923 | 11.78 | 930 | 12.66 | ||||||||||||||||||
Other generation companies | 3,247 | 38.96 | 2,292 | 29.25 | 1,836 | 24.99 | ||||||||||||||||||
|
|
|
|
|
|
|
|
|
|
|
| |||||||||||||
Total | 8,335 | 100.0 | 7,837 | 100.0 | 7,348 | 100.0 | ||||||||||||||||||
|
|
|
|
|
|
|
|
|
|
|
| |||||||||||||
Chile (SIC)
The electricity market in Chile is served by a variety of generation companies, including (1) Central Cardones, (2) Colmito, (3) Endesa and (4) Colbún. We compete in the SIC system, Chile’s largest power system, with each of these companies for the right to supply capacity and energy to distribution companies and other non-regulated customers. A transmission line is under construction to connect the SIC with SING, Chile’s second largest power system. Once completed, we also expect to compete with power plants in the SING system.
247
Table of Contents
The following table sets forth the quantity of energy generated by each of the principal generation companies in SIC for the periods presented:
Gross Energy Generation | ||||||||||||||||||||||||
For the Year Ended December 31, | ||||||||||||||||||||||||
| 2015 | 2014 | 2013 | ||||||||||||||||||||||
Company | (GWh) | Market | (GWh) | Market | (GWh) | Market | ||||||||||||||||||
Central Cardones | 4 | 0.01 | — | — | — | — | ||||||||||||||||||
Colmito | 27 | 0.05 | 6 | 0.01 | 46 | 0.09 | ||||||||||||||||||
Endesa S.A. | 11,759 | 22.23 | 12,312 | 23.58 | 15,184 | 29.88 | ||||||||||||||||||
Colbún S.A. | 11,805 | 22.32 | 12,170 | 23.31 | 10,363 | 20.39 | ||||||||||||||||||
AES Gener S.A. | 5,047 | 9.54 | 5,296 | 10.14 | 5,420 | 10.67 | ||||||||||||||||||
Empresa Eléctrica Guacolda S.A. | 4,548 | 8.60 | 4,889 | 9.36 | 5,115 | 10.06 | ||||||||||||||||||
Empresa Eléctrica Pehuenche S.A. | 2,980 | 5.63 | 3,006 | 5.76 | 2,583 | 5.08 | ||||||||||||||||||
Other generation companies | 16,731 | 31.63 | 14,531 | 27.83 | 12,109 | 23.83 | ||||||||||||||||||
|
|
|
|
|
|
|
|
|
|
|
| |||||||||||||
Total | 52,901 | 100.0 | 52,210 | 100.0 | 50,820 | 100.0 | ||||||||||||||||||
|
|
|
|
|
|
|
|
|
|
|
| |||||||||||||
Dominican Republic
The power and electricity market in the Dominican Republic is served by a variety of generation companies, including (1) CEPP, (2) affiliates of AES Corp., which own one combined-cycle plant fueled by natural gas and two open-cycle plants fueled by natural gas, as well as equity interests in two plants fueled with coal, (3) Empresa de Generación Hidroeléctrica Dominicana, a state-owned generation company whose primary generation facilities are hydroelectric plants, (4) Empresa Generadora de Electricidad Haina, S.A., (5) Compañía de Electricidad de San Pedro de Macorís, (6) Gas Natural SDG, S.A. (Gas Natural Fenosa), (7) Transcontinental Capital Corp. (Bermuda) Ltd (Seaboard), and (8) Consorcio Laesa Ltd. CEPP competes with each of these companies for the right to supply capacity and energy to distribution companies and other non-regulated customers.
The following table sets forth the quantity of energy generated by each of the principal generation companies in the Dominican Republic for the periods presented:
Gross Energy Generation | ||||||||||||||||||||||||
For the Year Ended December 31, | ||||||||||||||||||||||||
| 2015 | 2014 | 2013 | ||||||||||||||||||||||
Company | (GWh) | Market | (GWh) | Market | (GWh) | Market | ||||||||||||||||||
CEPP | 298 | 1.99 | 242 | 1.80 | 339 | 2.45 | ||||||||||||||||||
Affiliates of AES Corp. | 5,311 | 35.48 | 5,443 | 40.40 | 5,075 | 36.62 | ||||||||||||||||||
Empresa de Generación Hidroeléctrica Dominicana | 2,688 | 17.96 | 1,260 | 9.35 | 1,860 | 13.42 | ||||||||||||||||||
Empresa Generadora de Electricidad Haina, S.A. | 1,006 | 6.72 | 2,731 | 20.27 | 1,739 | 12.55 | ||||||||||||||||||
Compañía de Electricidad de San Pedro de Macorís | 934 | 6.23 | 113 | 0.84 | 290 | 2.09 | ||||||||||||||||||
Gas Natural SDG, S.A. (Gas Natural Fenosa) | 1,012 | 6.76 | 919 | 6.82 | 1,096 | 7.91 | ||||||||||||||||||
Transcontinental Capital Corp. (Bermuda) Ltd (Seaboard) | 842 | 5.62 | 1,006 | 7.47 | 1,330 | 9.60 | ||||||||||||||||||
Consorcio Laesa Ltd | 612 | 4.09 | 471 | 3.50 | 737 | 5.32 | ||||||||||||||||||
Other generation companies | 2,287 | 15.28 | 1,285 | 9.54 | 1,391 | 10.04 | ||||||||||||||||||
|
|
|
|
|
|
|
|
|
|
|
| |||||||||||||
Total | 14,970 | 100.0 | 13,470 | 100.0 | 13,857 | 100.0 | ||||||||||||||||||
|
|
|
|
|
|
|
|
|
|
|
| |||||||||||||
Colombia
The electricity market in Colombia is served by a variety of generation companies, including (1) Surpetroil, (2) Empresas Públicas de Medellín E.S.P, (3) Emgesa S.A. E.S.P, (4) Isagen S.A. E.S.P and
248
Table of Contents
(5) Generadora y Comercializadora de Energía del Caribe S.A. E.S.P. Surpetroil competes with each of these companies for the right to supply energy and reliability to distribution companies and other non-regulated customers. Surpetroil also competes in the off-grid generation market.
The following table sets forth the quantity of energy generated by each of the principal generation companies in Colombia for the periods presented:
Gross Energy Generation | ||||||||||||||||||||||||
For the Year Ended December 31, | ||||||||||||||||||||||||
2015 | 2014 | 2013 | ||||||||||||||||||||||
Company | (GWh) | Market | (GWh) | Market | (GWh) | Market | ||||||||||||||||||
Surpetroil | 43 | 0.06 | 23 | 0.04 | 22 | 0.04 | ||||||||||||||||||
Empresas Públicas de Medellín E.S.P | 13,994 | 21.03 | 13,626 | 21.18 | 14,518 | 23.34 | ||||||||||||||||||
Emgesa E.SP | 13,749 | 20.66 | 13,691 | 21.28 | 12,877 | 20.70 | ||||||||||||||||||
Isagen S.A. E.SP | 12,821 | 19.27 | 10,609 | 16.49 | 10,322 | 16.60 | ||||||||||||||||||
Generadora y Comercializadora de Energía del Caribe | 6,972 | 10.48 | 7,508 | 11.67 | 6,834 | 10.99 | ||||||||||||||||||
Other generation companies | 18,970 | 28.51 | 18,871 | 29.34 | 17,624 | 28.34 | ||||||||||||||||||
|
|
|
|
|
|
|
|
|
|
|
| |||||||||||||
Total | 66,548 | 100.0 | 64,328 | 100.0 | 62,197 | 100.0 | ||||||||||||||||||
|
|
|
|
|
|
|
|
|
|
|
| |||||||||||||
Seasonality
Within the Latin American and the Caribbean countries in which we operate, power is generally generated by hydroelectric or thermal power stations. The hydroelectric stations are an efficient source of power generation due to the cost savings of fuel associated with thermal power generation. The power generated by these hydroelectric power stations varies in accordance with the rainy seasons and rainfall patterns of each country in each year. For example, greater amounts of hydroelectric power are dispatched between November and April in Peru—the Peruvian rainy season—than between May and October, when the volumes of rainfall declines and operators have less water available for electricity generation in the reservoirs serving their plants. During periods of lesser rainfall, greater volumes of thermoelectric power are dispatched. Therefore, Kallpa provides our Peruvian generation segment with a hedge during drier periods (in which less hydroelectric power is generally dispatched), while CDA provides our Peruvian generation segment with a hedge during the rainy season (in which less thermoelectric power is generally dispatched).
By contrast, in El Salvador greater amounts of hydroelectric power are dispatched between May and October—the Salvadorian rainy season—than between November and April, when the volumes of Salvadorian rainfall declines and the hydroelectric units have less water available for electricity generation. El Salvador’s hydroelectric plant is also subject to annual variations depending on climactic conditions, such as the El Niño phenomenon. For the same reasons, the volume of power generated by thermal power stations is also variable. Furthermore, our Nicaraguan assets which rely on wind generate less volume of power during the Nicaraguan rainy season between May and October, as those months tend to experience less wind. Accordingly, our revenues are subject to seasonality, the effects of rainfall, and the type of energy generated in each country of operation (whether hydroelectric or thermal, and whether generated using natural gas, HFO or diesel). Although we act to reduce this exposure to seasonality by contracting long-term PPAs for most of our capacity, this effect cannot be completely neutralized.
Within Israel, electricity demand is sensitive to temperatures and tends to be greater in the summer season (July to August) because of the use of air conditioners and in the winter season (December to February) because of the use of heating devices, as compared with the other months of the year. As a result, the tariffs in the winter and summer seasons are higher than those in the transition seasons, making Israeli power generators, such as OPC, more profitable, generally, in the winter and summer months, as compared to other months of the
249
Table of Contents
year. These seasonal increases are partially offset by an increase in fuel costs during those periods. For further information on the seasonality of tariffs in Israel, see “Industry—Industry Overview—Israel.”
For further information on the seasonality within our distribution business, see “—Distribution Operations—Seasonality.”
250
Table of Contents
Property, Plant and Equipment
The following table provides certain information regarding our power plants that are owned, leased or under construction, as of June 30, 2016:
Company/Plant | Location | Installed Capacity | Fuel Type | |||||
| (MW) | ||||||||
| Operating Companies | ||||||||
Peru Segment | ||||||||
Kallpa: | ||||||||
Kallpa I, II, III and IV | Chilca district, Peru | 870 | Natural gas (combined cycle) | |||||
Las Flores | Chilca district, Peru | 193 | Natural gas | |||||
|
| |||||||
Kallpa Total | 1,063 | |||||||
|
| |||||||
Samay I1 | Mollendo, Peru | 616 | Diesel and natural gas | |||||
|
| |||||||
Israel Segment | ||||||||
OPC | Mishor Rotem, Israel | 440 | Natural gas and diesel (combined cycle) | |||||
AIE2 | Hadera, Israel | 18 | Natural gas | |||||
|
| |||||||
Central America Segment | ||||||||
ICPNH | ||||||||
Corinto3 | Chinandega, Nicaragua | 71 | HFO | |||||
Tipitapa Power | Managua, Nicaragua | 51 | HFO | |||||
Amayo I | Rivas, Nicaragua | 40 | Wind | |||||
AmayoII4 | Rivas, Nicaragua | 23 | Wind | |||||
|
| |||||||
ICPNH Total | 185 | |||||||
|
| |||||||
Puerto Quetzal | Escuintla, Guatemala | 179 | HFO | |||||
|
| |||||||
Nejapa | Nejapa, El Salvador | 140 | HFO | |||||
|
| |||||||
Kanan | Colon, Panama | 92 | HFO | |||||
Other Segment | ||||||||
CEPP | Puerto Plata, Dominican Republic | 67 | HFO | |||||
|
| |||||||
COBEE: | ||||||||
Zongo Valley plants: | ||||||||
Zongo | Zongo Valley, Bolivia | 11 | Hydroelectric | |||||
Tiquimani | Zongo Valley, Bolivia | 9 | Hydroelectric | |||||
Botijlaca | Zongo Valley, Bolivia | 7 | Hydroelectric | |||||
Cutichucho | Zongo Valley, Bolivia | 23 | Hydroelectric | |||||
Santa Rosa | Zongo Valley, Bolivia | 18 | Hydroelectric | |||||
Sainani | Zongo Valley, Bolivia | 10 | Hydroelectric | |||||
Chururaqui | Zongo Valley, Bolivia | 25 | Hydroelectric | |||||
Harca | Zongo Valley, Bolivia | 26 | Hydroelectric | |||||
Cahua | Zongo Valley, Bolivia | 28 | Hydroelectric | |||||
Huaji | Zongo Valley, Bolivia | 30 | Hydroelectric | |||||
|
| |||||||
| 187 | ||||||||
|
| |||||||
Miguillas Valley plants: | ||||||||
Miguillas | Miguillas Valley, Bolivia | 4 | Hydroelectric | |||||
Angostura | Miguillas Valley, Bolivia | 6 | Hydroelectric | |||||
Choquetanga | Miguillas Valley, Bolivia | 6 | Hydroelectric | |||||
Carabuco | Miguillas Valley, Bolivia | 6 | Hydroelectric | |||||
|
| |||||||
| 22 | ||||||||
|
| |||||||
El Alto-Kenko | La Paz, Bolivia | 19 | Natural gas | |||||
|
| |||||||
COBEE Total | 228 | |||||||
|
| |||||||
Central Cardones | Copiapó, Chile | 153 | Diesel | |||||
|
| |||||||
Colmito | Concón, Chile | 58 | Natural gas and diesel | |||||
|
| |||||||
JPPC | Kingston, Jamaica | 60 | HFO | |||||
|
| |||||||
Surpetroil | ||||||||
La Hocha | Huila, Colombia | 2 | Natural gas | |||||
Purificación | Tolima, Colombia | 10 | Natural gas | |||||
Entrerios | Casanare, Colombia | 3 | Natural gas | |||||
Geopark | Casanare, Colombia | 16 | Natural gas | |||||
|
| |||||||
Surpetroil Total | 31 | |||||||
|
| |||||||
251
Table of Contents
Company/Plant | Location | Installed Capacity | Fuel Type | |||||
| (MW) | ||||||||
| Asset in Advanced Stages of Construction | ||||||||
CDA5 | Huancavelica, Peru | 510 | Hydroelectric | |||||
| 1. | Samay I reached COD in May 2016. In July 2016, damage to the shafts was detected in three of the four units of the Samay I plant. As a result, all of the plant’s four units have been declared unavailable to the system. We have developed a plan to repair the units, and on August 28, 2016, Kenon announced that we expected all four units to be operational within six months. |
| 2. | AIE also holds a conditional license for the construction of a cogeneration power station in Israel. This station will be developed as a greenfield project (at an expected cost of $250 million, including the acquisition price of AIE), based upon a plant with 140 MW of capacity. Construction commenced in June 2016 and COD is expected by the end of 2018. |
| 3. | In March 2016, a unit of ICPNH’s barge-mounted power plant (Corinto) sustained damage in connection with a machinery breakdown. The relevant unit has an installed capacity of 18 MW, and represents 25% of all our installed capacity at the Corinto plant. This event is covered by insurance. Repairs are under way, and the relevant unit is expected to come back online in November 2016. |
| 4. | Wind farm complex sustained damage in December 2014 in connection with a blackout in the Nicaragua’s National Interconnection System, which left one wind turbine collapsed and another two wind turbines with severe damage. In early 2016, the three damaged turbines, which represented 10% of all of our installed capacity at our Amayo I and Amayo II plants, were replaced and re-commenced commercial operations. |
| 5. | The three generating units of CDA reached COD in August 2016. |
In addition:
| • | Cenérgica owns three fuel storage tanks on site with an aggregate capacity of 240,000 barrels and maintains a fuel depot and marine terminal located on a 6.5 hectare site that we lease in Acajutla, El Salvador; |
| • | we were awarded a tender published by the Chilean government for a lease of land in Northern Chile, which is intended for the construction of a power station with a capacity of at least 350 MW; and |
| • | we were awarded a tender published by the Israel Land Authority to lease an approximately 592,000 square foot plot adjacent to the OPC site, which can be utilized to extend OPC’s capacity in Israel. |
For further information regarding our plants, see “—Portfolio Overview.”
We believe that we have satisfactory title to our plants and facilities in accordance with standards generally accepted in the electric power industry, other than title to certain land on which CEPP’s facilities are located. With respect to CEPP, the Dominican Corporation of State Electricity Companies (Corporación Dominicana de Empresas Eléctricas Estatales) has transferred the land titles on which CEPP’s facilities are located to CEPP and CEPP is in the process of obtaining the definitive titles documenting CEPP’s appointment as the beneficiary.
For further information on Energuate’s property, plant and equipment, see “—Distribution Business—Distribution Network.”
We lease our principal executive offices in Lima, Peru and various other office space in the markets that we serve. We own all of our production facilities, other than the Las Flores power plant. We lease the Las Flores facility under a capital lease as described in “Management’s Discussion and Analysis of Financial Condition and Results of Operations—Tabular Disclosure of Contractual Obligations—Material Indebtedness—Kallpa Leases.”
252
Table of Contents
We believe that all of our production facilities are in good operating condition. As of June 30, 2016 and December 31, 2015, the consolidated net book value of our property, plant and equipment was $3,500 million and $2,972 million.
Maintenance and Spare Parts
Our operating subsidiaries regularly perform comprehensive maintenance on their facilities, including maintenance to turbines, engines, generators, transformers, the balance of plant and substations, as well as civil works maintenance. Maintenance is typically performed according to a predefined schedule at fixed intervals, based on running hours or otherwise according to manufacturer or engineering specifications. Maintenance is either performed by our trained employees, or is outsourced to third party contractors. In some cases, our operating subsidiaries have entered into long-term service agreements for their maintenance.
Each of our operating subsidiaries has arrangements to obtain spare parts, as necessary. Our operating subsidiaries generally purchase their spare parts from the OEMs, as well as from other suppliers. In some cases, these operating subsidiaries have entered into long-term supply contracts for spare parts.
For further information on maintenance services received by Energuate, see “—Distribution Business—Energuate—Transmission, Construction and Maintenance Services.”
Insurance
We carry insurance for our plants against material damage and consequent business interruption through comprehensive “all-risks” insurance policies. These all-risk insurance policies provide for total replacement values of $2.4 billion for property damage and $563 million for business interruption and are renewed annually, with the most recent renewal occurring in December 2015. Specifically, our Kallpa and OPC plants are covered by insurance policies which provide for total replacement values of $734 million and $400 million for property damages per year, respectively, and $265 million and $120 million for business interruption damages per18-month period, respectively. In some cases, we rely on insurance policies in the event that any of our plants sustain damages or experience business interruptions as a result of the actions of, or a breach under the relevant agreement by, suppliers, customers or other third parties whose liability obligations are contractually limited. Our insurance coverage is underwritten by some of the largest international reinsurance companies, including Mapfre S.A., Munich Re, Zurich Insurance Group Ltd, ACE Limited, American International Group, Inc., Allianz SE and Swiss Re Ltd, among others.
The material damage insurance for our operations provides insurance coverage for losses due to accidents resulting from fire, explosion and machinery breakdown, among others. This coverage has a maximum indemnification limit of $600 million per event (combined material damage and business interruption coverage). These policies have deductibles of up to $2 million, depending on the plant.
The business interruption coverage under each of these policies provides insurance for losses resulting from interruptions due to any material damage covered by the policy. The losses are covered until the plant production is fully re-established, with maximum indemnity periods ranging from 12 to 30 months.
We carry insurance for CDA to protect against certain risks associated with this project. We carry a (1) construction all-risk policy with a limit of $679 million, (2) consequent delay in start-up policy with a limit of $180 million with a 24-month indemnity period, and (3) third-party liability policy with a limit of $25 million.
We carry insurance for Samay I to protect against certain risks associated with this project. We also carry a (1) construction all-risk policy with a limit of $320 million, (2) consequent delay in start-up policy with a limit of $86 million with a 18-month indemnity period, and (3) third-party liability policy with a limit of $40 million. Additionally, we carry a property damage and business interruption insurance policy for Samay I to
253
Table of Contents
protect against risks of direct physical loss or damage due to machinery breakdown, earthquake and the other main risks associated with the operation of the Samay I plant. Coverage includes (1) property damage with a limit of $294 million and (2) business interruption with an 18-month indemnity period with a limit of $73 million. Additionally, we have third party liability and terrorism insurance policies, covering (1) third-party liability with a limit of $50 million and (2) terrorism with a limit of $150 million. In July 2016, all four of Samay I’s units were declared unavailable to the system. We intend to seek coverage for the costs of the outage, including repair costs and loss of profits, as appropriate, from the EPC contractor, equipment manufacturer and/or the insurance coverage (subject to deductibles), and believe we have a reasonable basis to recover these costs, including for loss of profits. For further information on Samay I’s unavailability, see “—Portfolio Overview—Generation Business—Peru Segment—Samay I.”
We do not anticipate having any difficulties in renewing any of our insurance policies and believe that our insurance coverage is reasonable in amount and consistent with industry standards applicable to energy generation companies operating in the same markets.
Employees
As of December 31, 2015, we had a total of 1,309 employees. All of our employees are employed on a full-time basis, and are usually divided into one of the following functions: plant operation and maintenance, administrative support, corporate management, budget and finance, legal and project management.
The table below sets forth our breakdown of employees by main category of activity and by segment as of the dates indicated1:
As of December 31, | ||||||||||||
2015 | 2014 | 2013 | ||||||||||
Number of employees by category of activity: | ||||||||||||
Plant operation and maintenance | 894 | 842 | 445 | |||||||||
Administrative support | 305 | 310 | 159 | |||||||||
Corporate management, budget and finance | 38 | 33 | 23 | |||||||||
Other, including project management | 72 | 50 | 32 | |||||||||
|
|
|
|
|
| |||||||
Total | 1,309 | 1,235 | 659 | |||||||||
|
|
|
|
|
| |||||||
Number of employees by segment: | ||||||||||||
Peru | 230 | 182 | 149 | |||||||||
Israel | 66 | 61 | 58 | |||||||||
Central America | 389 | 443 | 127 | |||||||||
Other | 624 | 549 | 325 | |||||||||
|
|
|
|
|
| |||||||
Total | 1,309 | 1,235 | 659 | |||||||||
|
|
|
|
|
| |||||||
| 1. | Does not include Energuate’s employees, as we acquired Energuate in January 2016. For further information on Energuate’s employees, see “—Distribution Operations—Transmission, Construction and Maintenance Services.” |
As of December 31, 2015, we did not employ a material number of temporary employees.
As of December 31, 2015, approximately 23% of our employees were unionized, representing a significant portion of our employees in Israel, Bolivia and Jamaica. As of December 31, 2015, approximately 45% of OPC’s employees were represented by Histadrut Labor Federation, the general federation of labor in Israel, approximately 72% of COBEE’s employees were represented by the Sindicato Unico de Trabajadores de Luz y Fuerza COBEE and approximately 27% of JPPC’s employees were represented by Union of Technical Administrative and Supervisory Personnel. We negotiate a collective bargaining with each union on an annual basis. In June 2015, COBEE’s facilities in Bolivia experienced a brief strike, which did not result in a work stoppage and did not have a material effect on our operations.
254
Table of Contents
As our operations are subject to various hazards, our management places a high priority on, and closely monitors, the health and safety of our employees. We have installed policies, procedures and training programs to reduce workplace accidents at each of our operating companies.
Additionally, we have a competitive compensation structure for our employees and the managers of each of our operating subsidiaries. Compensation for such managers typically consists of a base salary, as well as a year-end bonus, which is based on the personal performance of the manager and the performance of the relevant operating subsidiary.
Shareholders’ Agreements
We hold a majority stake in most of our operating companies—Kallpa, OPC, CEPP, Central Cardones, Surpetroil, Corinto, Tipitapa Power, Amayo I, Amayo II, CDA, and Samay I—and a non-controlling interest in Pedregal. The operations of these companies are subject to shareholders’ and/or member agreements. Although the terms of each of these shareholder and member agreements vary, they generally provide, in certain circumstances and subject to certain conditions: (1) each shareholder with the right to elect a specified number of directors and/or appoint specified executive officers; (2) for the distribution of dividends in proportion to each shareholder’s equity interest; (3) the minority shareholder with veto rights with respect to significant corporate actions (e.g., mergers, share issuances, the amendment of governing documents, and the entry into PPAs or other contracts in excess of a specified value) and certain approval protocol with respect to the budget of the relevant company; (4) each party with a right of first refusal with respect to any potential sale of equity interests in the relevant company; and (5) specifications of additional equity contributions, if any.
Additionally, we and Energía del Pacífico, the minority shareholder in each of Kallpa, Samay I, and CDA, have agreed that we will each submit projects related to generation or transmission of energy in Peru to Kallpa and will not develop such projects other than through Kallpa, unless both parties agree to incorporate a new investment vehicle. Similarly, we have provided tag-along rights to Mr. Yesid Gasca Duran, the minority shareholder in Surpetroil, with respect to any new projects which we may develop or acquire in Colombia.
Legal Proceedings
Set forth below is a discussion of a significant legal proceeding to which our subsidiary is party. As of the date of this prospectus, we are not party to any other significant legal proceedings.
Energuate Tax Claims
In July 2016, the Guatemalan Tax Administrator, or the SAT, issued a claim against DEORSA and DEOCSA for back taxes for the years 2011 and 2012, alleging that these companies improperly deducted interest and amortization of goodwill relating to the acquisition of these companies in 2011 by their prior owner in a leveraged buy-out.
As background, in February 2015, the SAT issued a binding tax opinion, or the Tax Opinion, confirming that such deductions were legitimate. The government of Guatemala changed in January 2016. After the new government took power and despite the previous Tax Opinion, in July 2016, the SAT filed a complaint against DEORSA and DEOCSA that unilaterally reversed the Tax Opinion. The complaint requested the payment of alleged back taxes, interest, and fines in relation to tax years 2011 and 2012 on the grounds that the structure of the 2011 acquisition was used to generate tax deductions for interest and amortization of goodwill.
In August 2016, the court hearing the SAT complaint ordered DEORSA and DEOCSA to pay $6 million and $11 million, respectively, in alleged back taxes immediately, plus interest and fines. DEORSA and DEOCSA have paid $6 million and $11 million, respectively, for alleged back taxes for 2011 and 2012. The combined amount of interest and fines for these years is estimated to be between $17 million and $24 million; however, the amount is still under discussion with the SAT, and is required to be paid in November 2016.
In light of the SAT’s actions, and in order to avoid the initiation of complaints by the SAT concerning the tax years 2013, 2014 and 2015 and any resulting fines and interest, upon instruction of the SAT, DEORSA
255
Table of Contents
and DEOCSA revised their tax returns for these years and paid $11 million and $20 million, respectively, corresponding to alleged back taxes and interest for those years. The total payments described above (covering 2011 through 2015) are estimated to be in the range of $65 million to $72 million in the aggregate, depending on the amount of interest and fines for 2011 and 2012.
DEORSA and DEOCSA are disputing the SAT claims and have made all payments subject to a broad reservation of rights, including but not limited to seeking restitution of such payments. DEORSA and DEOCSA and their legal advisors are considering all available remedies with respect to this matter. If DEORSA and DEOCSA are unsuccessful in contesting the claims made by the SAT or seeking compensation for the payments, this will have a material adverse effect on DEORSA and DEOCSA’s respective businesses, financial condition, results of operations and liquidity. Furthermore, if, in the future in light of the court ruling, DEORSA and DEOCSA do not deduct interest and amortization of goodwill relating to the acquisition of these companies in 2011 by their prior owner, DEORSA and DEOCSA will be subject to higher taxes in the future.
Kallpa—Import Tax Assessments
Since 2010, SUNAT has issued tax assessments to Kallpa and its lenders (as lessors under the Kallpa leases) for payment of import taxes allegedly owed by Kallpa and its lenders in connection with the engineering services related to the EPC contractors of Kallpa I, II, III and IV. The assessments were made on the basis of the allegation that Kallpa and its lenders should have included the value of the engineering services rendered by the contractor of the relevant project in the tax base of the imported equipment for the import taxes. Kallpa disagrees with these tax assessments on the grounds that the engineering services rendered to design and build the power plant are not part of the value of the imported goods but a separate service for which Kallpa paid its corresponding taxes because all such equipment, according to SUNAT’s allegation, could be deemed a plant with respect to the unit in connection with which it was imported. Kallpa and its lenders disputed the tax assessments before SUNAT and, after SUNAT confirmed the assessments, appealed before the Tribunal Fiscal.
In January 2015, Kallpa and its lenders were notified that the Tribunal Fiscal had rejected their appeal in respect of the Kallpa I assessment. Kallpa and its lenders disagreed with the Tribunal Fiscal’s decision and challenged this decision in the Peruvian courts. In order to challenge the Kallpa I ruling, Kallpa and its lenders were required to pay the tax assessment of Kallpa I in the aggregate amount of approximately $12.3 million, which amount consists of the tax assessment for Kallpa I, plus related interest and fines. In April 2015, Kallpa and its lenders made the final payment (under protest) regarding Kallpa I’s tax assessment in order to appeal the administrative ruling of the Tribunal Fiscal in the judicial system. Kallpa has reimbursed the lenders for each of the amounts due under the terms and conditions set forth in the operation agreement dated July 31, 2008, as amended, by and among Citibank del Perú S.A., Citileasing S.A., Banco de Crédito del Perú, Scotiabank Perú, and Kallpa. In September 2016, the court of first instance denied the challenge brought by Kallpa and its lenders in respect of the Tribunal Fiscal’s decision over the Kallpa I assessment. Kallpa and its lenders appealed the decision in September 2016. To the extent that the appeal is successful, Kallpa and its lenders will be entitled to seek the return of the amounts paid to SUNAT. A decision of the Tribunal Fiscal of the appeals in respect of the Kallpa II and III assessments is still pending.
In January 2016, SUNAT issued a ruling in favor of Kallpa, releasing Kallpa from substantially all claims and associated fines related to Kallpa IV, as SUNAT concluded that the Kallpa IV unit could not be deemed a plant and therefore, the engineering services rendered in connection with the Kallpa IV project could not be incorporated into the value of the imported equipment. As of June 30, 2016, the total tax exposure related to claims by SUNAT against Kallpa and its lenders in connection with the importation of equipment related to the Kallpa I, II, III and IV projects, equaled S/77 million (approximately $23 million), including interest and fines.
SUNAT 2012 Income Tax Audit
On February 15, 2016, as a result of the 2012 income tax audit, SUNAT issued a preliminary income tax assessment against us on the basis that certain interest accrued on our debt and some maintenance expenses amounting to approximately S/22 million (approximately $7 million) should not have been deducted from our 2012 taxable income but rather treated as an asset. On March 11, 2016, SUNAT issued a final tax assessment for approximately S/16.5 million (approximately $5 million), related to the interest expenses accrued during the
256
Table of Contents
construction of the steam turbine (Kallpa IV) as part of the combined-cycle conversion of the plant. We will appeal this assessment before SUNAT. Our management and our tax counsel consider that this appeal will more likely than not be successful as the Tribunal Fiscal has previously issued precedents that allow for the deduction of interest expenses in similar circumstances based on the language of article 37a) of the Peruvian Income Tax Law; accordingly, no provision has been recorded in our financial statements. As of June 30, 2016, the total amount that SUNAT claims should be subject to tax is S/16.5 million (approximately $5 million), representing a potential tax liability of S/11.0 million (approximately $3.0 million), including interest and fines, for Kallpa.
Claims Relating to Energuate’s Technical Service Quality
Energuate is obligated to compensate its customers for failures to meet technical service quality requirements set by the CNEE. The CNEE has initiated sanctions processes against DEORSA and DEOCSA for failures to comply with technical service quality standards amounting to approximately $12 million and $11 million as of December 31, 2015, respectively. For further information on the quality of service standards applicable to Energuate, see“—Regulatory, Environmental and Compliance Matters—Regulation of the Guatemalan Electricity Distribution Market—Quality of Service Regulation.”Although Energuate’s management believes that it has meritorious defenses to these claims, there can be no assurance as to the ultimate outcomes of these matters. In the opinion of DEORSA and DEOCSA’s management, adverse outcomes relating to these claims are not probable. Consequently, as of December 31, 2015, DEORSA and DEOCSA have not accrued provisions for these contingences.
Regulatory, Environmental and Compliance Matters
In Latin America, Central America and the Caribbean, where we primarily operate, the electricity market allows for sale and delivery of power from power generators (private or government owned) to distribution companies (private or government owned) and to industrial (i.e., non-regulated) consumers. In these countries there is typically structural segregation of power generation companies and transmission and distribution companies. In most of these countries there is a government-owned power grid and transmission services are provided on open access basis, i.e. the transmission company must transmit power through the grid and in exchange, charges a transmission rate set by the supervisory authority or based on a competitive proceeding or regulated tariff. Whereas in these markets private and government-owned entities compete for power generation, its transmission and distribution are conducted subject to exclusive franchises; therefore, the transmission and distribution operations are regulated in markets in which we operate.
In these countries, delivery and sale of power is subject to a regulatory regime (typical of privatized electricity markets) which includes supervision by an independent supervisory entity for the electricity market. For further information on the regulatory risks related our operations, see “Risk Factors—Risks Related to Government Regulation–Our equipment, facilities, operations and new projects are subject to numerous environmental, health and safety laws and regulations.”
Regulation of the Peruvian Electricity Sector
In Peru, power is generated by companies which primarily operate hydroelectric and natural gas based power stations. The general electricity laws in Peru form the statutory framework governing the electricity market in Peru and cover, among other things:
| • | generation, transmission, and distribution and trading of electricity; |
| • | operation of the energy market; and |
| • | generation prices, capacity prices and other tariffs. |
All entities that generate, transmit or distribute power to third parties in Peru operate subject to the general electricity laws in Peru. Power generating companies in Peru, such as Kallpa, are impacted by, among other things, regulation applicable to transmission and distribution companies.
Although significant private investment has been made in the electricity market in Peru and independent supervisory entities have been created to supervise and regulate the electricity market, the State of Peru has
257
Table of Contents
remained, in actual fact, in the role of supervisor and regulator. In addition, the State of Peru owns multiple power generation and distribution companies in Peru, although their market participation has diminished over time and face significant legal restrictions to engage in new projects or investments.
Regulatory Entities
There are five entities in charge of regulation, operation and supervision of the electricity market in Peru in general, and of our operations in Peru, in particular:
MINEM—The Ministry of Energy and Mines, responsible for:
(a) setting national energy policy; (b) proposing and adopting laws and regulations to supervise the energy sector; (c) controlling expansion plans for SEIN; (d) approving proposed expansion plans by the COES; (e) promoting scientific research and investment in energy; and (f) granting concessions or authorizations, as applicable, to entities to operate in power generation, transmission or distribution in Peru.
OSINERGMIN—the Supervisor Body of Investment in Energy and Mining is an independent governmental regulatory agency responsible, among other things, for:
(a) supervising compliance of different entities with laws and regulations concerning power generation, transmission, distribution and trading; (b) setting transmission (electricity and natural gas) and distribution (electricity and natural gas) tariffs; (c) setting and enforcing price levels in the electricity market in Peru and setting tariffs for customers subject to regulated tariffs; (d) imposing fines and compensations for violations of the laws and regulations; (e) handling claims made by, against or between consumers and players in the electricity market; (f) supervising public tenders with regard to PPAs between generation companies and distribution companies for the supply to regulated consumers; and (g) supervising operations of the COES.
Generation tariffs for the sale of energy by generation companies to distribution companies are generally determined based on tenders where OSINERGMIN sets a cap price that is not disclosed to participants except when the respective bid is unsuccessful because no party has made an offer below such price cap. In addition, OSINERGMIN annually specifies energy prices, known as the regulated tariff, which is used by market participants only in exceptional situations, as most of the PPAs with distribution companies are based on the results of the tenders. OSINERGMIN also determines the annual capacity prices used in agreements between generation companies and distribution companies, as well as in the spot market.
COES—the Committee for the Economic Operation of the System is an independent private entity composed of qualified participants undertaking activities in the SEIN(i.e., electric power generators, transmission companies, distributors and major non regulated users) which is responsible, among others, for:
(a) planning and co-ordination of the power generation system for all power generation and transmission units, in order to ensure reliable generation at minimum cost; (b) setting spot market prices based on marginal cost; (c) managing the clearing house of the spot market transactions between generation companies (excess and shortage of actual generation vs. demand pursuant to PPAs); (d) allocating firm capacity and firm energy to generation units; (e) submitting proposals to OSINERGMIN for issuing regulatory standards, including technical standards and procedures used as guidelines for carrying out COES directives; (f) determining on a monthly basis the amounts owed between generators as consideration for energy injected into the grid and for ancillary services; and (g) proposing expansion plans for the transmission grid.
INDECOPI—the Antitrust and Intellectual Property Authority in Peru.
OEFA—OEFA is a specialized technical governmental agency, dependent on the Ministry of Environment, and responsible for enforcing, overseeing, controlling and declaring sanctions in respect of environmental matters. It has the authority to directly oversee certain industries, such as mining, energy (electric power, oil and gas), fishing and manufacturing (beer, paper, cement, tannery among others). On March 4, 2011, OEFA took on the responsibility of verifying the compliance with environmental regulations of companies operating in the hydrocarbon, mining, industrial, fishing and energy industries.
258
Table of Contents
SENACE—SENACE was created by Law No. 29968, enacted on December 20, 2012. SENACE is a specialized technical governmental agency, dependent on the Ministry of Environment, and is in charge of reviewing and approving detailed environmental impact assessments related to projects involving activities, works or services that may have a significant impact on the environment. The implementation of SENACE is expected to occur in the following four stages: (1) establishment of its governing bodies; (2) development and implementation of its internal management guidelines and policies; (3) transfer of its jurisdiction from other governmental entities; and (4) monitoring of the jurisdiction transfer process. The first stage of this implementation began in April 2013 pursuant to a schedule approved by Supreme Decree No. 003-2013-MINAM.
Generation Companies
Since 1992, the Peruvian market has been operating based upon a marginal generation cost system. Such system is embedded in the general electricity laws of Peru and is administrated by the COES. In such capacity the COES has as its main mandate to satisfy all the demand of electricity at any given time (i.e., periods of 15 minutes each) with the most efficient generation assets available at such time, independently of contractual arrangements between generators and their clients. For such purpose, the COES determines which generation facilities will be in operation at any given time with the objective of minimizing the overall system energy cost. Energy units are dispatched (i.e., ordered by the COES to inject energy into the system) on a real-time basis; units with lower variable generation costs are dispatched first and other less efficient generation units will be ordered to dispatch until the electricity demand is satisfied.
The variable cost for the most expensive generation unit dispatching in each 15-minute time period determines the spot price of electricity in said time period. Generally, the variable cost used for dispatch is audited by the COES, based on actual fuel costs, the plant efficiency, and variable maintenance costs. However, as natural gas supply and transportation contracts contain high levels of take-or-pay, the calculation of variable costs for these units is not straightforward. As a result, generators with power plants utilizing natural gas are allowed to declare the variable cost of their plants once a year and such declared cost may differ from the actual cost of such plant and this declaration will be the variable cost applicable for dispatch purposes for the next 12 months, being the declared cost part of the commercial strategy of the corresponding generator.
The spot market price is determined by the COES and is the price at which generation companies sell or buy power on the spot market during each 15-minute period. All injections and withdrawals of electricity are valued at the spot market price of the 15-minute period when they are made. Any generation companies with excess generation over energy sold pursuant to PPAs in each 15-minute interval, sell their excess energy at spot prices to generation companies with lower generation than their contractual obligations under PPAs for that time period. COES defines, on a monthly basis, the amounts that are owed by each generator with a net “buyer” position to generators with a net “seller” position. Generators with a net seller position directly invoice and collect from generators with a net buyer position the amounts liquidated by the COES, respectively, not being the COES involved in the payment procedure or providing any form of payment guarantee. Distribution companies and regulated consumers cannot purchase power off the grid at spot prices. Distribution companies must enter into agreements that guarantee offtakes of regulated consumers located in their concession areas. Regulated consumers must enter into agreements with distribution companies or, in the case of a large consumer, may contract directly with power generation companies.
Power generation companies are also paid capacity fees by SEIN, based on their firm capacity and other variables. Capacity transactions are subject to Law 25844. This law stipulates a methodology for calculating the capacity payments for each generation unit. Firm capacity calculation varies by type of technology, but is principally based upon the unit’s effective capacity and its ability to supply energy continuously during the peak hours of the dry season, and also taking into consideration the historic availability statistics of the unit. Capacity payments are based primarily upon the unit’s firm capacity and the regulated capacity price, but it is also affected by other variables, such as the expected supply-demand balance, the approved reserve margin, and the merit
259
Table of Contents
order of the generation unit. PPAs are commercial agreements, independent of actual allocation of generation or actual provision of availability. Generation companies that generate over any 15-minute period insufficient energy to satisfy the supply obligations under their PPAs purchase in the spot market the energy required to satisfy such supply obligations, based on COES procedures, from other generation companies with excess generation or availability during any such period. The energy price for those transactions is the spot price, and the capacity price is regulated and set by OSINERGMIN. Due to short term constraints in the gas supply and power transmission systems, which were generating distorting price signals in the spot market, the Peruvian government issued Emergency Decree 049-2008, extended by Emergency Decree 079-2010 and Law 30115. Pursuant to this decree, the COES is required to simulate energy spot prices without accounting for limitations due to shortage in supply and transportation of natural gas and for limitations on the transmission system. The latter scheme caps spot prices at a maximum amount of S/ 313.5 per megawatt hour. Generation companies with units that are called to dispatch that have a variable cost higher than the spot price determined pursuant to the referenced emergency decree are compensated for the difference in their cost by transmission surcharges imposed on all end consumers of the SEIN (i.e., regulated and non-regulated customers) and collected by distribution companies. As of the date of this prospectus, the aforementioned government decree will be in force until December 2016. Emergency decrees are legislative statutes that are exceptionally issued by the executive branch of the Peruvian government which can only be issued on circumstances and in areas specified in the Peruvian Constitution and are effective for a limited time period.
Sales of electricity under PPAs are not regulated unless they involve sales to distribution companies for resale to regulated customers. The latter PPAs are subject to price caps set by OSINERGMIN prior to the corresponding public bidding process where generators submit their bids. Generation and distribution companies may also enter into contracts resulting from a direct negotiation and not a bidding process, but only when the regulated tariff approved by OSINERGMIN is applicable. As with capacity transactions under PPAs, the financial settlement of energy transactions under PPAs is independent of the actual dispatch of energy by any particular generation unit. Generators accrue receivables from the counterparties to their PPAs based on the contract price in their PPAs and the amount of energy delivered from the SEIN, irrespective of the amount of energy that was produced by the generator counterparty to the PPA. The COES’s dispatch of generation units in the SEIN is designed to satisfy the demand of electricity of the SEIN at any given time in the most efficient manner possible and the COES is not under any obligation to dispatch a particular generation unit to fulfill a generator’s PPA commitments.
The general electricity laws of Peru require generators with an installed capacity in excess of 500 kW that use renewable energy sources (including hydro projects that do not exceed 20 MW) to obtain a definitive generation concession, and generators with an installed capacity in excess of 500 kW that use thermal energy sources to obtain a generation authorization. A concession for electricity generation activity is granted by the State of Peru acting through the MINEM and embedded in an agreement between the generator and the MINEM, while an authorization is merely a unilateral permit granted by the MINEM. Authorizations and concessions are granted by the MINEM for an unlimited period of time and their termination, respectively, is subject to the same considerations and requirements under the procedures set forth in the Law 25844 and related regulations. However, according to Legislative Decree 1221, the concessions granted as a result of an investment promotion process will have a term of up to 30 years.
The definitive concession allows its titleholder to use public lands and infrastructure, and obtain easements imposed by the MINEM (in lieu of easements agreed with the owner of the affected land plots) for the construction and operation of generation plants, substations or transmission lines and distribution networks, as applicable. The definitive concession is granted by a ministerial resolution issued by the MINEM. Also, definitive concessions for generation with renewable energy sources, with an installed capacity equal to or less than 10 MW are granted by resolution of the Energy and Mines Regional Directorate (Dirección Regional de Energía y Minas) of the corresponding regional government. In all cases a definitive concession involves the execution of a concession agreement under the form of a public deed. The concession agreement is based on a standard form and is recorded in the public registries.
260
Table of Contents
Under the general electricity laws in Peru, the titleholders of authorizations have most of the rights and benefits of concessionaires and have basically, the same obligations than concessionaires.
Definitive concessions and authorizations may be terminated by relinquishment or breach upon the occurrence of certain termination events set forth in Law 25844 and upon completion of a procedure regulated by the general electricity laws in Peru. Termination events include: (1) failure to provide evidence of registration of the concession agreement in the public registry within the term of twenty business days following such registration; (2) non-compliance with the schedule for completion of the project included in the concession agreement, unless otherwise authorized by the MINEM due to force majeure; (3) failure to operate for at least 876 hours during a calendar year, without justified cause; and (4) failure by the concessionaire, after being penalized, to operate the facilities in accordance with COES’ operative regulations, unless otherwise authorized by the MINEM by justified reasons. The termination procedure for breach of the project schedule may be suspended by the concessionaire upon delivery of a new project schedule that is guaranteed with a performance bond, thereby providing a mechanism that in practice substantially reduces the risk of termination for such cause. According to Legislative Decree 1221, this guaranteed schedule will be approved only once.
Without prejudice to the above, Law 25844 provides that if the State of Peru declares the termination of a definitive concession for a reason different from those mentioned above (i.e., termination at will), the concessionaire shall be indemnified at the present value of the net cash flow of future funds generated by the concession’s activities, using the discount rate set forth in article 79 of such law (12% on an annual basis). As of the date of this prospectus, we believe no concession has been terminated by the Peruvian government invoking its authority to terminate at will.
Termination of a definitive concession is declared by a ministerial resolution issued by MINEM. In such case, MINEM shall ensure the continuity of the operation of the generation plant by appointing a temporary administrator of the assets (intervención), until the concession is transferred to a new concessionaire. MINEM shall appoint a consultant to make a valuation of the concession and its assets, elaborate the corresponding bidding rules and organize a tender procedure. MINEM shall award the definitive concession to the best bid offered. The product of the tender shall be used to pay the costs of the temporary administration, the costs of the tender procedure, and any balance shall be allocated in favor of the former concessionaire. The procedure for termination of an authorization is similar to that of a concession. We believe that no definitive concession or authorization of a project that actually started construction or operation has been terminated, as of the date of this prospectus.
Transmission Companies
Transmission in the SEIN grid is operated by the individual companies that conform the transmission system and is centrally coordinated by the COES. Expansion plans for the transmission grid are proposed by the COES to MINEM for final approval; prior to executing the COES expansion plan, the Peruvian government prepares the transmission plan. Transmission companies who wish to participate in construction of the transmission system specified in the expansion plan are required to submit their bid for a tender organized by the Peruvian Agency for the Promotion of Private Investments (ProInversión). The transmission company awarded the tender may operate the line over the term of its concession (usually 30 years) and would be eligible to receive tariff payments paid by all the final users in the SEIN, as specified in the tender document and incorporated into its concession contract. The development of any transmission activity requires a definitive concession if the installation of the transmission lines will be within Peruvian state properties or if an easement from MINEM will be required.
The group of transmission lines created pursuant to such tenders after 2006 are known as “guaranteed transmission lines.” Transmission lines not included in plans such as the aforementioned, independently constructed by transmission companies after 2006, are known as “complementary transmission lines”; tariffs for use of these lines are determined by OSINERGMIN and are paid based upon actual use. Transmission lines
261
Table of Contents
created prior to 2006 are categorized into two groups. Transmission lines available for use by all generation companies are categorized as principal transmission lines; transmission lines only used by specific generation or distribution companies and only available to these generation companies are categorized as secondary transmission lines. The Kallpa facilities transmit the power generated by their plants through secondary transmission lines built prior to 2006, which then connect to primary and guaranteed transmission lines.
On July 2, 2016, OSINERGMIN issued Resolution 164-2016-OS/CD, or the Transmission Toll Resolution, which sets forth a new methodology, starting in May 2017 and ending in May 2021, for the calculation of the transmission tolls payable by generation companies to transmission companies for a generator’s use of the secondary and complementary transmission lines within the grid. Pursuant to the current methodology, a generation company must pay a transmission toll for each of the secondary or complementary transmission lines utilized by it; the new methodology set forth in the Transmission Toll Resolution provides that each generation company must pay a transmission toll for each of the secondary and complementary transmission systems within the grid, regardless of whether such generation company uses any particular secondary or complementary transmission system within the grid.
The Kallpa (including Las Flores) and CDA plants transmit the power generated by their plants through certain of the secondary transmission lines built prior to 2006, which then connect to primary and guaranteed transmission lines. The implementation of the methodology set forth in the Transmission Toll Resolution will nonetheless obligate the Kallpa and CDA plants to provide payments to the remaining secondary and complementary transmission lines in the system, notwithstanding Kallpa’s and CDA’s usage of other secondary transmission lines. Additionally, although transmission tolls paid by Kallpa are typically passed through to Kallpa’s customers pursuant to its PPAs, it is unclear whether transmission tolls paid in respect of those secondary and complementary transmission lines that are not utilized by Kallpa for the transmission of their energy (as required by the Transmission Toll Resolution) can be passed through to Kallpa’s customers under its PPAs.
The methodology introduced by the Transmission Toll Resolution is currently expected to be applied during the tariff setting process to take place in May 2017.
Distribution Companies
According to the general electricity laws in Peru, distribution companies are required to provide energy to regulated customers at regulated prices. Distribution companies may also provide energy to customers not subject to regulated prices—pursuant to PPAs. As of the date of this prospectus, the only private distribution companies holding a distribution concession are: Luz del Sur, Edelnor, Edecañete, Electro Dunas and Coelvisac. These five companies distributed 73% of all energy distributed by distribution companies in Peru in 2014. The remainder of power is sold by state-owned entities.
Prior to July 2006, pricing in all contracts between generation companies and distribution companies with respect to sale of power to end customers at regulated prices, included energy tariffs composed of payment for capacity, energy and transmission, as determined by OSINERGMIN. Distribution companies sell energy on the regulated market at cost plus an additional distribution charge known as VAD. After July 2006, most of the agreements result from tenders in which generation companies bid prices. Bid prices include payment for capacity and energy.
The energy purchased by distribution companies from generation companies at regulated prices pursuant to old PPAs accounted for less than 56% of total purchasing in 2014—and is expected to decrease in coming years.
Since July 2006, pursuant to Law 28832, contracts to sell energy to distribution companies for resale to regulated customers may be made at fixed prices based on public bids of generation companies or at regulated
262
Table of Contents
prices set by the OSINERGMIN. After the bidding process is concluded, a distribution company will be entitled to purchase energy from the winning bidder at the bid price for the life of the relevant PPA. The prices obtained through the public bid process are subject to a maximum energy price set by the OSINERGMIN prior to bidding. If all the bids are higher than the price set by the OSINERGMIN, the public bids are disregarded and no PPA will be awarded. The process may be repeated until the prices that are offered are below the cap set by the OSINERGMIN for each process.
Regulated tariffs are annually set by OSINERGMIN through a public procedure conducted by the Adjunct Manager´s Office for Tariff Regulation (Gerencia Adjunta de Regulación Tarifaria) and are effective from the month of May of each year. During this process, the OSINERGMIN will take into account a proposal delivered by the COES.
The price components of the regulated tariffs are: (1) the regulated price of energy; (2) the capacity price in peak hours; and, (3) the transmission toll, and are calculated considering the following:
| • | a projection of demand for the next 24 months, considering generation and transmission facilities scheduled to start operations during such period. The projection assumes, as a constant, the cross-border (i.e., Ecuador) supply and demand based on historical data of transactions in the last year; |
| • | an operations program that minimizes the operation and rationing costs for the period taking into account the hydrology, reservoirs, fuel costs and a rate of return (Tasa de Actualización) of 12% annual. The evaluation period includes a projection of the next 24 months and the 12 months precedent to March 31 of each year considering historic data; |
| • | a forecast of the short-term marginal costs of the expected operations program, adapted to the hourly blocks (bloques horarios) established by OSINERGMIN; |
| • | determination of the basic price of energy (precio básico de la energía) for the hourly blocks of the evaluation period, as a weighted average of the marginal costs previously calculated and the electricity demand, updated to March 31 of the corresponding year; |
| • | determination of the most efficient type of generation unit to supply additional power to the system during the hour of maximum peak demand during the year (demanda máxima anual) and the annual investment costs, considering a rate of return of 12% on an annual basis; |
| • | the base price of capacity in peak hours (precio básico de la potencia de punta) is determined following the procedure established in the general electric laws of Peru, considering as a cap the annual investment costs (which include connection and operation and maintenance costs). An additional margin to the basic price shall be included if the reserve of the system is insufficient; |
| • | calculation of the nodal factors of energy (factores nodales de energía) for each bar of the system. The factor shall be equal to 1.00 for the bar where the basic price is set; |
| • | the capacity price in peak hours (precio de la potencia de punta en barra) is calculated for each bar of the system, adding to the basic price of capacity in peak hours the unit values of the Transmission Toll and the Connection Toll referred to in Article 60 of Law 25844; and |
| • | the bus bar price of energy (precio de energía en barra) is calculated for each bar of the system, multiplying the nodal basic price of energy (precio básico de la energía nodal) of each hourly block by the respective nodal factor of energy. |
The development of electricity distribution activities requires a definitive concession if such activities are dedicated to public service and the demand exceeds 500 kW.
263
Table of Contents
Peruvian Energy Policy 2010-2040
The Energy Policy 2010-2040 was approved by Supreme Decree 064-2010-EM. By this document, the Peruvian government set forth the following objectives in order to improve the energy market:
| • | develop a diversified energy matrix, based on renewable energy resources and efficiency. The government, among other measures, will prioritize the development of efficient hydroelectric projects for electricity generation; |
| • | competitive energy supply. One of the main guidelines is to promote private investment in energy projects. The Peruvian government has a subsidiary role in the economy as mandated by the Peruvian Constitution; |
| • | universal access to energy supply. Among other guidelines, the Peruvian government shall develop plans to ensure the supply of power and hydrocarbons; |
| • | promote a more efficient supply chain and efficient energy use. Comprises promoting the automation of the energy market through technological repowering; |
| • | achieve energy self-sufficiency. For such purpose, the Peruvian government will promote the use of energy resources located in the country; |
| • | develop an energy sector with minimal environmental impact and low carbon in a sustainable development framework. Promote the use of renewable energy and eco-friendly technologies that avoid environmental damage and promote obtaining Certified Emission Reductions by the energy projects developed; |
| • | strengthen the institutional framework of the energy sector. Maintain a legal stability intended to promote development of the sector in the long term. Likewise, simplification and optimization of administrative and institutional structure of the sector will be promoted; |
| • | regional market integration for a long-term development. Regional interconnection agreements will permit the development of infrastructure for energy uses; and |
| • | developing the natural gas industry and its use in household activities, transportation, commerce and industry as well as efficient power generation. |
Regulation of the Nicaraguan Electricity Sector
The electricity market in Nicaragua is subject to the Nicaraguan Electrical Industry Law and regulations based thereupon, which apply to the electricity sector and the wholesale power market. The Electrical Industry Law is subject to supervision by local authorities.
The regulation of the Nicaraguan electricity market governs three sectors of the electricity market, which are vertically unbundled: generation, transmission and distribution. Units which use renewable resources, such as wind, geothermal and biomass, are dispatched with priority over thermal units. Transmission is administered by a government-owned company and distribution is carried out by a sole private company, which is subject to regulated prices.
The power pricing mechanism in Nicaragua is based on a free market where generation companies compete for dispatch, and the spot price is determined on an hourly basis, based on marginal cost and considering the last unit dispatched in such hour. All power generation companies are required to obtain a license from the Nicaragua’s Ministry of Energy and Mines for the right to generate and sell power to the national grid. Generation companies can sell energy to distribution companies or to non-regulated customers.
264
Table of Contents
Regulation of the Salvadorian Electricity Sector
Through July 2011, the electricity market in El Salvador was based on purchase and sale of power by competitive price tenders by generation companies. In August 2011, the electricity market in El Salvador was re-structured and is now essentially similar to electricity markets in other Latin American countries in which we operate. Currently, generation units are dispatched based on the variable cost thereof, and prices are determined by the variable cost of the most expensive unit operating. Due to this change, local distribution companies have issued a first tender for purchase of power over a two- to three-year term. In conjunction with this tender, Nejapa was awarded a contract to provide 71 MW over a four- to five-year term, through January 2018 and a 39 MW PPA over a four-year period until July 2017.
Regulation of the Bolivian Electricity Sector
The electricity market in Bolivia is subject to Bolivia’s Electricity Act and regulations based there upon, which apply to the electricity sector and the wholesale power market in Bolivia and which is subject to supervision by local authorities. The power pricing system in Bolivia is based on a free market where generation companies compete for dispatch of their generation units, and the spot price is determined based on marginal cost (similar to Peru), with free access to transmission and distribution systems. However, major customers purchase power at regulated tariffs. The price for energy and power generation in this country is based on marginal cost. According to Bolivia’s 2009 constitution, all power generation companies in Bolivia are required to obtain a license from the relevant authority for the right to generate and sell power on the national grid. As of the date of this prospectus, COBEE operates in accordance with the interim licenses awarded to it. There is no certainty that we will obtain the necessary permanent licenses.
In December 2011, the Bolivian government amended the applicable law to prohibit generation companies from entering into new PPAs. For further information on the risks related the potential nationalization of our assets in Bolivia, see “Risk Factors—Risks Related to Government Regulation–TheBolivian government has nationalized energy industry assets, and our remaining operations in Bolivia may also be nationalized.”
Regulation of the Chilean Electricity Sector
The electricity market in Chile consists of three sectors: generation, transmission and distribution. Power generation is open to competition, whereas transmission and distribution are conducted by monopolies subject to regulated prices.
The electricity market in Chile uses the marginal generation cost method to determine the sequence of dispatch of power stations, thereby ensuring that demand for power is satisfied at the minimum system cost. This method, launched in 1982, is now used in many countries.
Chile has four power systems, of which two of these are its major systems. The largest system is the SIC, with capacity of 15,911 MW, primarily consisting of hydroelectric, coal-based power stations and dual power stations using natural gas (imported as liquid natural gas) or diesel. SIC serves more than 93% of the Chilean population.
The second largest system is the SING, with capacity of 4,183 MW. SING covers a 700 kilometer stretch of Chile’s northern coast line. SING serves 6% of Chile’s population and is a major power supplier for the country’s copper mining industry.
The two other power systems located in the south of Chile are relatively smaller.
Central Cardones and Colmito are part of the SIC power grid. The National Energy Commission (Comisión Nacional de Energía) is an independent government regulator which determines distribution tariffs,
265
Table of Contents
among other things. Prices used by generation companies to sell power to distribution companies for regulated customers (those customers who consume up to 2 MW) are determined by regulated tenders. Power prices for non-regulated customers are determined by direct negotiations and by tenders, with no intervention by government entities. Tariffs for expansion of the transmission system are determined by international tenders.
Regulation of the Dominican Republic Electricity Sector
The regulatory framework of the electricity sectors in the Dominican Republic is essentially similar to the one in Peru. Power generation in the Dominican Republic is based on free competition among private and government-owned generation companies, whereas the transmission and distribution grid is controlled by government-owned companies. The main source of revenues for generation companies is direct energy sale to distribution companies and from sale of energy and availability in the spot market.
The large-scale theft of power from the grid is prevalent in the Dominican Republic. Since generation and distribution companies do not pass through the cost associated with such theft to consumers, the government must provide significant subsidies to these companies.
Regulation of the Colombian Electricity Sector
Since 1994, the electricity sector in Colombia has allowed private companies to participate in the different types of businesses in the industry chain. The different activities of the electricity sector are governed by Law 142 of 1994, or the Public Service Code and Law 143 of 1994, or the Electricity Code. The industry’s activities are also governed by the regulations and technical standards issued by the Commission for the Regulation of Energy and Gas in Colombia (Comisión de Regulación de Energía y Gas), or CREG. The wholesale energy market began operating in July 2005, and since then generating companies must submit price bids and report the quantity of energy available on a daily basis in a competitive environment.
The Colombian Electricity Act regulates the generation, trading, transmission and distribution of electricity. Under the law, any company, domestic or foreign, may undertake any of these activities. New companies, however, must engage exclusively in one of these activities. Trading can be combined with either generation or distribution. The system formed by generation plants, the interconnected grid, regional transmission lines, distribution lines and consumer loads is referred to as the SIN. Utility companies are required to ensure continuous and efficient service, facilitate the access of low-income users through subsidies granted by the government, inform users regarding efficient and safe use of services, protect the environment, allow access and interconnection to other public service companies and large customers, cooperate with the authorities in the event of an emergency to prevent damage to users and report to the authority any commercial start-up of operations.
The Colombian electricity market includes two types of customers: non-regulated and regulated. Non-regulated customers (those who consume a minimum of 100 kWh or 55,000 kWh per month) can negotiate freely with generation companies, distribution companies or traders. Regulated customers (all other customers) must purchase energy through public bids and establish bilateral two-party agreements, which normally last from one to five years.
The maximum market share for generators is limited by law. The limit for generators is 25.0% of firm energy. Firm energy refers to the maximum electric energy that a generation plant is able to deliver on a continuous basis during a year in extremely dry conditions, such as in the case of the “El Niño” phenomenon. Such limits are applied to economic groups, including companies that are controlled by, or under common control with, other companies. In addition, generators may not own more than a 25.0% interest in a distributor, and vice versa. However, this limitation only applies to individual companies and does not preclude cross-ownership by companies of the same corporate group.
266
Table of Contents
A generator, distributor, trader or an integrated company, i.e., a firm combining generation, transmission and distribution activities, cannot own more than 15.0% of the equity in a transmission company if the latter represents more than 2.0% of the national transmission business in terms of revenues. A distribution company can own more than 25.0% of an integrated company’s equity if the market share of the integrated company is less than 2% of national generation revenues. Any company created before enactment of the Electricity Code is prohibited from merging with another company created after the enactment thereof.
The Ministry of Mines and Energy of Colombia defines the government’s policy for the energy sector. Other government entities which play an important role in the electricity industry include (1) the Public Utility Superintendency of Colombia, which is in charge of overseeing and inspecting the utility companies, (2) the Superintendency of Industry and Commerce, which is in charge of evaluating market competency, (3) CREG, which is in charge of regulating the energy and gas sectors and (4) the UPME, which is in charge of planning the expansion of the generation and transmission network.
CREG is empowered to issue regulations that govern technical and commercial operations and to set charges for regulated activities. CREG’s main functions are to establish conditions for gradual deregulation of the electricity sector toward an open and competitive market, approve charges for transmission and distribution networks and charges to regulated customers, establish the methodology for calculating and establishing maximum tariffs for supplying the regulated market, establish regulations for planning and coordination of operations of the SIN and establish technical requirements for quality, reliability and security of supply, and protection of customers’ rights.
Regulation of the Israeli Electricity Sector
IEC
IEC, in which the State of Israel maintains a 99.846% equity interest, operates as a vertically integrated electricity company. IEC generates and supplies the majority of electricity in Israel according to licenses granted by virtue of the Electricity Sector Law and transmits and distributes all of the electricity in Israel. In addition, IEC acts as the “System Operator” of Israel’s electricity system, determining the dispatch order of generation units, granting interconnection surveys, and setting spot prices, etc. within Israel. IEC is required, among other things, to provide service to the general public, purchase electricity from IPPs, provide infrastructure and certain backup services, and act to ensure provision of all of its services, including services pursuant to a development plan approved in accordance with the Electricity Sector Law.
The objective of the Electricity Sector Law enacted in 1996, is “to regulate the activity in the electricity market for the good of the public, guaranteeing reliability, availability, quality, efficiency, while concurrently creating conditions for competition and minimizing costs.”
IEC is classified as an “Essential Service Provider,” as defined in the Electricity Sector Law. As such, it is subject to statutory obligations and operations for proper management of the electricity market in favor of the entire public without discrimination, including filing development plans, management of the power system, management of the power transmission and distribution systems, providing backup and infrastructure services to IPPs and to consumers, and purchasing power from IPPs.
IEC was declared a monopoly by the Israeli Antitrust Authority in all segments of the electricity sector: generation, transmission, distribution, supply and provision of backup services for electricity customers and manufactures.
Pursuant to the Electricity Sector Law, the Minister of National Infrastructures, Energy and Water Resources, or the Minister of Energy, has an overall responsibility for the electricity sector in Israel, including responsibility for IEC and its overall supervision. In July 2013, the State of Israel appointed a steering
267
Table of Contents
committee, tasked with proposing a comprehensive reform of IEC and the Israeli electricity market. The committee was mandated to review the electricity market structure, while focusing on unbundling the electricity market, the implementation of competition in the competitive sectors, the financial stabilization of IEC, and the development of a plan to improve IEC’s efficiency. Although the steering committee has not published its final recommendations, and there had not been any recent formal announcements concerning the steering committee’s discussions or negotiations with IEC and the State of Israel for some time, in November 2015 the steering committee announced that it had resumed its discussions regarding comprehensive reform of IEC and the Israeli electricity market. The effect of any such reforms on either OPC or AIE is uncertain.
EA
The EA, which was established on January 1, 2016, replaced the PUAE, which was established in 1996 in accordance with the Electricity Sector Law. The EA is responsible for granting licenses (although licenses for facilities with a capacity of more than 100 MW are also subject to approval by the Minister of Energy), supervising the holders of such licenses, setting the tariffs and determining the standards of service which are required from a holder of an Essential Service Provider license. As such, the EA oversees both the government-owned IEC and the IPPs.
The EA determines the electricity tariffs to the public, based on the costs of IEC which the EA decides to recognize, and including a fair rate of return on equity. The EA sets different tariffs for the various electricity segments. In addition, the EA sets the tariffs that IEC pays for electricity purchased from IPPs. The Electricity Sector Law provides that IEC will collect payments pursuant to the tariffs set by the EA and that IEC will make payments to another license holder or a customer, pursuant to the relevant tariffs.
Each year, the EA performs an annual update of the various components of the costs recognized in the tariffs, and publishes a new set of tariffs accordingly. In April 2012, the generation component tariff increased 6% to NIS 366.6 per MWh. In July 2013, the PUAE published four generation component tariffs/power cost indicators, ranging from NIS 386 per MWh to NIS 333.2 per MWh, instead of the single tariff that had previously been used. In January 2015, the PUAE reduced the tariff rates by approximately 10% to NIS 300.9 per MWh and NIS 301.5 per MWh effective as of February 1, 2015. On September 8, 2015, the PUAE published a final decision, which became effective on September 13, 2015, reducing the PUAE generation component tariff by approximately 12% from NIS 300.9 per MWh and NIS 301.5 per MWh to a single tariff of NIS 265.2 per MWh. In addition, in October 2016, the EA published a draft decision regarding a further reduction of the generation component tariff. If the draft decision is approved at a public hearing to be held in November 2016, the generation component tariff will be further reduced by approximately 8% from NIS 265.2 per MWh to NIS 242.9 per MWh. OPC’s operations can be affected by changes in the PUAE’s policies, regulations, and tariffs. The EA’s generation component tariff, for example, serves as the base price for OPC’s calculation of the sale price of its energy to its private customers. As a result, increases or decreases in this tariff have a related effect on the sales price of OPC’s energy and OPC’s revenues. In addition, the price at which OPC purchases its natural gas from its sole natural gas supplier, the Tamar Group, is predominantly indexed (in excess of 70%) to changes in the EA’s generation component tariff, pursuant to the price formula set forth in OPC’s supply agreement with the Tamar Group. As a result, its increases or decreases have a related effect on OPC’s cost of sales and margins. In addition, the natural gas price formula in OPC’s supply agreement is subject to a floor mechanism. As a result of previous declines in the PUAE generation component tariff, OPC began to pay the ultimate floor price in November 2015. Therefore, the September 2015 decline,the potential decline to be considered at the November 2016 public hearing and any further declines in the EA generation component tariff will not result in a corresponding decline in OPC’s natural gas expenses, and will therefore lead to a greater decline in OPC’s margins, which may have a material adverse effect on OPC’s business, results of operations and financial condition.
Furthermore, since 2013, the PUAE had been in the process of determining a system cost tariff. In August 2015, the PUAE published a decision that IPPs in Israel would be obligated to pay system management service charges, which charges are retroactively effective as of June 1, 2013. According to the PUAE decision, as amended in September 2015, the amount of system management service charges that would be payable by OPC from the effective date of June 1, 2013 to June 30, 2015, was approximately NIS 159 million (approximately $41 million), excluding interest rate and linkage costs, based upon the “average rate” of the system management
268
Table of Contents
service charges. However, as the rate of the new system management service charges, like other rates of the EA, varies by season (e.g., summer and winter) and by demand period (peak, shoulder and off-peak), IEC’s final calculation of the amount payable by OPC was based upon the applicable time of use rates, which provides different energy rates for different seasons (e.g., summer and winter) and different periods of time during the day, or “Time of Use” rates. In December 2015, OPC received an invoice from IEC (in its capacity as the system manager) regarding the NIS 163 million (approximately $43 million) amount of system management service charges that would be payable by OPC for such period, including interest rate and linkage costs. In February 2016, OPC paid NIS154 million (approximately $41 million) to IEC in satisfaction of this amount (excluding the interest rate, and linkage costs). On August 28, 2016, the EA published a decision to change the method of calculation of the interest rate and to reduce the interest rate payable by IPPs (including OPC) with respect to system management service charges payable by them from the effective date of June 1, 2013 to September 13, 2015 (amounting to approximately 2.5% of the total amounts payable by IPPs in respect of the system management charges). For further information on Israel’s seasonality and the related EA tariffs, see “Industry—Industry Overview—Israel.” For further information on the effect of EA tariffs on our revenues and margins, see “Management’s Discussion and Analysis of Financial Condition and Results of Operations—Material Factors Affecting Results of Operations—EA Tariffs Affect our Results in our Generation Business’ Israel Segment.”
Additionally, on November 19, 2015, as a part of the legislative process regarding the State of Israel’s 2015—2016 budget, new legislation was approved by the Knesset (the Israeli parliament) incorporating, among other things, amendments to the Electricity Sector Law-1996. According to an amendment to the Electricity Sector Law, which was published on November 30, 2015, and became effective on January 1, 2016, the PUAE was replaced by the EA, which was merged with the electricity unit of the Israeli Ministry of National Infrastructures, Energy and Water Resource and is therefore subordinate to the Minister of National Infrastructures, Energy and Water Resources. As a result, the Minister of National Infrastructures, Energy and Water Resources may overrule the EA’s decisions, demand a rehearing of specific decisions (excluding tariff decisions, which remain entirely in the EA’s independent authority), and controls the EA’s key board appointments and policies.
Any decisions of the PUAE, including decisions regarding licenses and tariffs, prior to this date will remain in force and are deemed to have been made by the EA.
Regulatory Framework for Conventional IPPs
The regulatory framework for current and under construction conventional IPPs was set by the PUAE in 2008. An IPP may choose to allocate its generation capacity, as “permanently available capacity,” or PAC, or as “variable available capacity,” or VAC. PAC means capacity that is allocated to IEC and is dispatched according to IEC’s instructions. PAC receives a capacity payment for the capacity allocated to IEC, as well as energy payment to cover the energy costs, in the event that the unit is dispatched. VAC refers to capacity that is allocated to private consumers, and sold according to an agreement between the IPP and a third party. Under VAC terms, an IPP may sell the capacity to IEC on a short-term basis. IEC may purchase electricity from the VAC allocated to it, based on a bid price. An IPP may choose to allocate its capacity between 70% to 90% as PAC, with the remaining 30% to 10% as VAC, or 100% VAC.
In December 2014, the PUAE published a new regulatory framework for conventional IPPs, which shall apply to conventional IPPs who have commenced commercial operations as of January 2019. The new framework allows an IPP to choose between a transaction with IEC (similar to PAC regulation), and a bilateral agreement with a third party.
OPC’s Regulatory Framework
OPC operates according to a tender issued by the state of Israel in 2001 and, in accordance therewith, OPC and IEC executed the IEC PPA in 2009, which stipulates the regulatory framework of OPC. OPC’s framework differs from the general regulatory framework for IPPs, as set by the PUAE and described above.
269
Table of Contents
According to the IEC PPA, OPC may sell electricity in one or more of the following ways:
| 1. | Capacity and Energy to IEC: according to the IEC PPA, OPC is obligated to allocate its full capacity to IEC. In return, IEC shall pay OPC a monthly payment for each available MW, net, that was available to IEC. |
In addition, when IEC requests to dispatch OPC, IEC shall pay OPC for the starting of the power plant (an amount that covers the starting costs), as well as a variable payment for each operating hour. IEC shall also pay the fuel cost of OPC.
| 2. | Sale of energy to end users: OPC is allowed to inform IEC, subject to an advanced notice, that it is releasing itself in whole or in part from the allocation of capacity to IEC, and extract (in whole or in part) the capacity allocated to IEC, in order to sell electricity to private customers pursuant to the Electricity Sector Law. OPC may, subject to an advanced notice, re-include the excluded capacity (in whole or in part) as capacity sold to IEC. |
OPC informed IEC, as required by the IEC PPA, of the exclusion of the entire capacity of its power plant, in order to sell such capacity to private customers. Since July 2013, the entire capacity of OPC has been allocated to private customers. Under the IEC PPA, OPC can also elect to revert back to supplying to IEC instead of to private customers.
The IEC PPA includes a transmission and backup appendix, which requires IEC to provide transmission and backup services to OPC and its customers, for private transactions between OPC and its customers, and the tariffs payable by OPC to IEC for these services. Moreover, upon entering a PPA between OPC and an individual consumer, OPC becomes the sole electricity provider for this customer, and IEC is required to supply power to this customer when OPC is unable to do so, in exchange for a payment by OPC according to the tariffs set by the EA for this purpose. For further information on the risks associated with the indexation of the EA’s generation tariff and its potential impact on OPC’s business, financial condition and results of operations, see “Risk Factors—Risks Related to Government Regulation—The production and profitability of IPPs in Israel may be adversely affected by changes in Israel’s regulatory environment.”
Regulatory Framework for Cogeneration IPPs
The regulatory framework for current and under construction cogeneration IPPs was established by the PUAE in its 2008 and 2013 decisions. The primary difference between the regulation of cogeneration IPPs (as compared to the regulation of conventional IPPs) is that, as long as the cogeneration production unit meets the definition of a “Cogeneration Production Unit” as stipulated in the regulations (which require such unit to, among other things, meet a certain efficiency rate), and if the cogeneration IPP so wishes, IEC will be obliged to purchase energy from such IPP in accordance with the following provisions:
| 1. | At peak and shoulder times, one of the following shall apply: |
a. each year, the IPP may sell up to 70% of the total electrical energy, calculated annually, produced in its facility to IEC—for up to 12 years from the date of the grant of the license; and
b. each year, the IPP may sell up to 50% of the total electrical energy, calculated annually, produced in its facility to IEC—for up to 18 years from the date of the grant of the license.
| 2. | At low demand times, IPPs with units with an installed capacity of up to 175 MW, may sell electrical energy produced by it with a capacity of up to 35 MW, calculated annually (in accordance with the duration applicable to the IPP with respect to peak and shoulder time, as set forth above). |
270
Table of Contents
According to regulations published by the PUAE in January 2015, if a cogeneration facility no longer qualifies as a “Cogeneration Production Unit,” such cogeneration facility may be entitled, under certain circumstances, to operate under the regulatory framework for conventional IPPs, with certain modifications and limitations.
AIE’s Regulatory Framework
AIE holds a conditional license for the construction of a cogeneration power station in Israel. As set forth above, AIE must meet certain conditions before it will be subject to the regulatory framework for cogeneration IPPs and be considered a “Cogeneration Production Unit.” For example, AIE will have to obtain a certain efficiency rate which will depend, in large part, upon the steam consumption of AIE’s consumers. In circumstances where AIE no longer satisfies such conditions and therefore no longer qualifies as a “Cogeneration Production Unit,” AIE may be entitled to operate under the special regulatory framework set forth in the regulations published by the PUAE in January 2015, as described above in “—Regulatory Framework for Cogeneration IPPs.”
Regulation of the Guatemalan Electricity Distribution Market
The General Electricity Law and the Liberalization of the Electricity Sector
The General Electricity Law provided for the liberalization of the electricity industry and authorized the creation of two new institutions to regulate the electricity sector: the CNEE and the AMM. Regulations implementing the General Electricity Law were adopted by the Executive through the MEM in 1997 and 1998, and amended in 2007 and 2008.
The CNEE and the AMM were created in 1997 and 1998, respectively, completing the legal framework for the privatized electricity sector.
The electricity industry in Guatemala is governed by the General Electricity Law and related regulations. The General Electricity Law was adopted in 1996 to liberalize the electricity sector.
Limitations on Activities of Industry Participants
The General Electricity Law provides that no individual company may engage directly in more than one of the following businesses: generation, transmission, or distribution services. However, the General Electricity Law allows any company engaging in any such specific business to own stock or other interests in companies engaging in any other specific business within the industry. It also allows generators to own transmission lines in certain cases.
Deregulation of Generation
The General Electricity Law provides that a governmental license is only required to operate transmission and distribution assets, and, in the case of a power plant, only when electricity is being generated through government-owned resources (i.e. hydro and geothermal). Otherwise, generation activities are not regulated.
Unrestricted Access to Transmission and Distribution Systems
The General Electricity Law provides that transmission and distribution companies must grant all customers the ability to connect to their transmission and distribution grids in exchange for toll payments. Unregulated customers are entitled to choose freely their supplier and to acquire electricity from any source and transmission and distribution companies must allow such electricity to flow through their transmission lines.
271
Table of Contents
Distribution and transmission companies are entitled to collect distribution or transmission tolls for the use of their grids. Failure to provide such access by a transmission or distribution company may lead to fines and ultimately the termination of that company’s distribution authorization, and potentially the appointment of a receiver of the distributor and the sale of its assets.
Unregulated Customers
The General Electricity Law provides that no public price regulation may be established relating to PPAs entered into by end users that have power demand greater than 100 kW. The MEM has the authority to lower or remove the threshold power demand that defines customers as “unregulated customers.” Unregulated customers are entitled to choose as their supplier the distribution company operating the distribution grid to which the unregulated customer is connected, any generator that supplies electricity to the Guatemalan National Electricity System or any electricity broker.
Regulated Customers and Distribution Authorizations
The General Electricity Law provides that those companies in the distribution business that have been granted an authorization from the MEM may use public property (including rivers) and acquire mandatory easements on privately owned lands as necessary to carry on their business activities. The General Electricity Law provides that the MEM may authorize a company to use the public domain and impose easements on private lands to distribute or transmit electricity. Authorizations for distribution services are granted on a non-exclusive basis for specific geographic areas and have terms of up to 50 years. Although authorizations to provide distribution services are non-exclusive, the investment required to establish a competing distribution system is a substantial barrier to entry.
The General Electricity Law provides that a distribution company must provide service to all those demanding the supply of electric energy that are located within 200 meters of its distribution lines. In addition, a distributor must provide electricity to all parties who demand their services within the service area covered by the distributor’s authorization, provided the interested party provides for its connection to the distributor’s system. A distributor must also provide electricity to all parties who demand the distributor’s service and furnish their own lines or those of a third party. A distributor must provide these services at prices and quality levels determined by the CNEE.
All tariffs charged by distribution companies to regulated customers are determined and revised by the CNEE pursuant to legal and regulatory proceedings.
Principal Regulatory Authorities
Ministry of Energy and Mines (MEM)
The MEM is the Guatemalan government’s highest-ranking regulator of the electricity industry. The MEM is responsible for enforcing the General Electricity Law and the related regulations and for the coordination of policies between the CNEE and the AMM. The MEM also has the authority to grant operating authorizations to distribution, transmission and generation companies.
National Electric Energy Commission (CNEE)
The Guatemalan electricity industry is regulated by the CNEE, a regulatory agency created pursuant to the General Electricity Law. The CNEE acts as the technical arm of the MEM. The CNEE is comprised of three members who are appointed by the Guatemalan government. The members are nominated by the MEM, the national universities, and the board of the AMM. The Guatemalan President then chooses one member from each
272
Table of Contents
of the lists of candidates submitted by these entities to form a three-director board of the CNEE. Members hold office for five years. The General Electricity Law establishes the following powers and duties for the CNEE:
| • | Determine transmission and distribution tariffs; |
| • | Enforce the sector’s laws and regulations and impose fines and penalties as legally prescribed; |
| • | Supervise compliance by the holders of any kind of authorization to carry on business in the electricity sector, protect the rights of end-users, and prevent anti-competitive, abusive and discriminatory activities; |
| • | Conduct arbitration proceedings and exercise powers of review in case of controversy among any parties subject to the General Electricity Law and its regulations; |
| • | Issue technical rules and performance standards for the electricity sector and enforce accepted international practices; and |
| • | Issue regulations and rules to secure access to and use of the transmission lines and distribution grids. |
Wholesale Market Administrator (AMM)
The Guatemalan wholesale market is managed by the AMM, an independent private entity created pursuant to the General Electricity Law. The AMM coordinates the operation of the generators, international interconnections, and transmission lines that form the Guatemalan National Electricity System. The AMM is in charge of overseeing the safety and operation of the Guatemalan National Electricity System and the efficient dispatch of electricity, with the mission to minimize operating costs, including costs from losses, and compliance with service quality requirements. The AMM is also responsible for scheduling the operation of the system and managing the dispatch of electricity on the basis of lowest available marginal cost.
All policies and rules of the AMM are subject to approval by the CNEE. If a generation company, transmission company, distribution company, electricity broker or large user does not operate its facilities in accordance with the regulations established by the AMM, the CNEE has the ability to impose fines and, in the case of serious breaches, may require that a company disconnect from the Guatemalan National Electricity System.
The Wholesale Electricity and Capacity Markets
The Guatemalan wholesale electricity and capacity markets are “open border” markets that allow market participants to purchase energy and capacity from generators and to sell energy and capacity to customers inside and outside Guatemala. Participation in the wholesale electricity market is not mandatory, but all agents must abide by AMM rulings and instructions, even if they are not wholesale market participants. The parties that may, but are not required to, participate in the wholesale electricity and capacity market include:
| • | generators with an installed capacity of more than 10 MW; |
| • | distribution companies with 20,000 or more customers; |
| • | transmission companies with a system connected to plants with capacity of more than 10 MW; |
| • | electricity brokers buying or selling 10 MW or more, including importers and exporters; and |
| • | unregulated customers. |
273
Table of Contents
Purchases and sales of capacity are conducted through the fixed-term wholesale capacity market. Generators may sell generating capacity at negotiated prices through medium- or long-term PPAs with distribution companies, unregulated customers or electricity brokers. Distribution companies are required to have PPAs covering at least 100% of their projected capacity needs for the current year and the following year. Distribution companies may only enter into PPAs through public bids conducted under the supervision of the CNEE.
Generators may sell uncommitted electricity in the spot market at prices determined as described below. Other participants in the wholesale electricity market may buy electricity in the spot market to cover shortages under their PPAs or to sell excess electricity. The AMM dispatches electricity in the spot market based on the marginal variable cost of the generators offering electricity, giving priority to electricity produced at the lowest marginal cost.
The prevailing price in the spot market for electricity is established on an hourly basis based on the cost of the last dispatched plant needed to cover demand.
Participants in the wholesale market can also trade capacity, permitting generators that are unable to supply their committed capacity to purchase additional capacity and other market participants who have contracted to purchase capacity in excess of their need to sell their excess capacity. Prices in the capacity market are set by the AMM based on the theoretical cost of installing efficient power generation.
Operation of the Guatemalan National Electricity System
The AMM runs the Guatemalan National Electricity System in real time, arranging any re-dispatches deemed necessary to correct differences between actual and projected power demand to ensure that the Guatemalan National Electricity System runs safely and efficiently. In the event of electricity failures and emergencies, the AMM is responsible for ensuring that service be reestablished and normal operation of the Guatemalan National Electricity System is achieved.
All participants in the wholesale electricity market are required to abide by the operating and dispatch instructions issued by the AMM. The commercial practices and rules of the AMM create the framework within which the participants are obligated to carry on their business in the wholesale electricity market.
All parties connected to the Guatemalan National Electricity System, including large generation facilities, distribution companies, transmission companies, electricity brokers and unregulated customers that choose not to participate in the wholesale market, as well as small generators, transmission companies and distribution companies that cannot participate in the wholesale market, are required to submit to the directions of the AMM in all that concerns technical standards for the adequate operation of the Guatemalan National Electricity System.
Quality of Service Regulation
The CNEE establishes minimum levels of quality for electricity services. In addition, the CNEE imposes certain obligations on distribution companies related to quality standards, and fines them for failure to comply with such quality standards and other obligations. The CNEE regulates the quality parameters of the supplied electricity (tension, frequency and disturbances), establishes parameters for continuity (number and length of interruptions) and minimum standards for customer service. An interruption is defined as any period of time over three minutes during which electricity is not available.
The CNEE monitors the number of interruptions, the length of time of each interruption and the total number of customers affected. If a distribution company experiences excessive interruptions, it must indemnify the affected customers.
274
Table of Contents
Each distribution company is required to survey its customers annually to obtain information regarding its compliance with required customer service regulations. The CNEE publishes the results of these surveys. Fines and other sanctions can also be imposed if a distribution company does not comply with CNEE customer service standards or if there are other service complaints.
If a distribution company does not comply with the CNEE’s regulations regarding the quality of the supplied electricity and implementation of electricity services and quality of service, it can be fined and, ultimately, its authorization can be revoked. In addition, the General Electricity Law provides for an appointment of a receiver and the sale of the distribution company’s assets.
Tariffs and Tolls
Distribution Tariffs
Pursuant to the General Electricity Law, distributors charge consumers a price for electricity sales based on distribution tariffs, consisting of an electricity charge and a VAD charge, which are determined on the basis of the legal and regulatory proceedings by the CNEE every five years. As a general rule, customers (whether regulated or not) who are connected at the same voltage level must pay the same distribution tariff, and therefore there is only one distribution tariff per voltage. The VAD component of the distribution tariff covers the operating expenses, capital expenditures, and the cost of capital of a model efficient distribution company and is revised every five years with semi-annual adjustments for inflation and local currency exchange rates against the U.S. Dollar. The tariffs are set by the CNEE in accordance with the applicable legal and regulatory proceedings.
The process of establishing the distribution tariffs involves several parties, including distribution companies, and takes place over several stages. While the tariffs are intended to be set on the basis of objective criteria, the CNEE can exercise discretion. The prices for electricity charged to unregulated customers are not regulated by the CNEE; however, unregulated customers must pay a regulated tariff, equal to the applicable VAD charge, for delivery of electricity through the facilities of a distribution company, as a toll. Therefore, while the customers who are connected at the same voltage level pay the same distribution tariff, the price difference between regulated, unregulated and social tariffs arises from generation costs which vary among different categories.
Regulated Tariffs
The CNEE adjusts the purchase and transmission costs of distributors and publishes a schedule of tariff rates for regulated customers every three months. These tariffs currently include:
| • | a social tariff available to customers that demand up to 300 kWh per month; |
| • | a regular tariff, available to all customers that purchase electricity at low voltage; |
| • | three additional tariffs available to customers that purchase electricity for delivery at low voltages (of which two are applicable to Energuate’s customers); |
| • | three tariffs available to customers that purchase electricity for delivery at medium voltage (of which two are applicable to Energuate’s customers); and |
| • | a tariff available to governmental entities that purchase electricity for public lighting. |
The social tariff, the regular tariff and the public lighting tariff consist solely of an electricity charge, a VAD charge and a monthly fixed charge for connection to the distribution system.
The three additional low voltage tariffs and three medium voltage tariffs are available for:
| • | customers that purchase capacity and electricity only during hours of peak demand which are between 6:00 p.m. and 10:00 p.m.; |
275
Table of Contents
| • | customers that purchase capacity and electricity only during off-peak hours (between 10:00 p.m. and 6:00 a.m.); and |
| • | customers that purchase capacity and electricity during any time of the day. |
Customers that request these tariffs enter into a contract with the distribution company to purchase a specified amount of capacity. These tariffs consist of a fixed capacity consumption charge for each contracted kW, an electricity charge for the electricity used by the customer, a capacity consumption charge and a monthly fixed charge for connection to the distribution system. The capacity consumption charge consists of two components: a generation and transmission component and a distribution component. Customers are charged the capacity consumption charge based on the maximum amount of capacity demanded during any billing cycle.
The electricity charge and the generation and transmission components of the capacity consumption charge are adjusted in the same manner as the electricity charge under the social tariff, the regular tariff and the public lighting tariff. The capacity charge and the distribution component of the maximum capacity charge are adjusted in the same manner as the VAD charges under the social tariff, the regular tariff and the public lighting tariff.
Tariff Adjustments
The VAD charges for each distribution company are established by the CNEE every five years and are calculated to equal an annuity over 30 years of the New Replacement Value of the distribution system of a model efficient distribution company. The New Replacement Value of a distribution system is determined by calculating the replacement value of a distribution network economically adjusted such that it would allow the distribution company to offer the services as if provided by a distribution company operating in the same area. The replacement value of the distribution system is determined based on a discount rate set by the CNEE, based on studies conducted by independent consultants. The calculation of the VAD for a distribution company uses as a benchmark the costs estimated of a model efficient distribution company serving a similar distribution area and accounts for the following costs:
| • | an allowance for electricity losses as determined by the CNEE; |
| • | administrative costs; and |
| • | costs of maintaining and operating the distribution systems, including the cost of capital. |
The VAD charged by DEORSA and DEOCSA until January 2019 was established in January 2014. New VAD charges applicable to DEORSA and DEOCSA are scheduled to be established in January 2019. The process of establishing the VAD charges requires the distribution company to engage an independent consultant approved by the CNEE to calculate the components of the VAD (including the New Replacement Value) applicable to the distribution company’s system. If the distributor fails to deliver the requested corrections, the CNEE can hire a consultant to calculate the VAD applicable to the distribution company’s system. Following the submission of the VAD calculated by the independent consultants to the CNEE, the CNEE decides whether to approve the VAD calculated by the consultants. In the event that the CNEE does not approve the new VAD charges, the dispute is submitted to an arbitration panel composed of three individuals, one named by the distribution company, one named by the CNEE and one named by mutual agreement.
The arbitration panel must rule within 60 days. In one instance, the General Electricity Law and its regulations were construed such that the CNEE was not bound to adopt the decision of the arbitration panel and is free to set the VAD at its discretion.
The VAD charges are adjusted semi-annually to reflect the effect of fluctuations in the Quetzal/Dollar exchange rate on the Dollar-denominated components of the New Replacement Value calculation and the effects of Guatemalan inflation on the Quetzal-denominated components of the New Replacement Value calculation.
276
Table of Contents
The energy charge is designed to allow a distribution company to recover the costs of the electricity that it purchases and the costs of transmission of such electricity to the connection points of its own grid. The energy charge component of the regulated tariffs consists of a base tariff and an electricity adjustment surcharge. Under the General Electricity Law and the regulations of the CNEE, the base tariff is adjusted annually to reflect anticipated changes in the cost of the electricity to be purchased by the distribution company during the following year. The electricity adjustment surcharge is adjusted quarterly to reflect variations in the actual cost of electricity purchased by the distribution company from the projected cost. These mechanisms attempt to achieve neutrality of the costs incurred by the distributor on the client’s behalf.
The Social Tariff
In 2001, Guatemala enacted the Social Tariff Law (Ley de la Tarifa Social para el Suministro de Energía Eléctrica) which requires that a special tariff, called the “social tariff”, be made available to customers with electricity consumption of up to 300 kWh per month. Under regulations adopted by the CNEE, distribution companies solicit bids for PPAs to supply the electricity to be delivered to customers eligible for the social tariff. INDE has been the only bidder for these PPAs and has agreed to provide electricity under these PPAs at below market rates, which effectively lowers the base tariff applicable to these customers. In addition, the VAD charge applicable to customers eligible for the social tariff is lower than the VAD charge that is part of the regular tariff as a result of technical characteristics related to the calculation of the VAD applicable to these customers.
Transmission Tolls
The General Electricity Law provides that all parties that connect to the Guatemalan National Electricity System, including all generation companies, transportation companies, distribution companies, electricity brokers and unregulated customers, must pay for their connection to and use of the Guatemalan National Electricity System. The secondary transmission tolls for electricity can be negotiated by the generation companies, distribution companies or unregulated customers using the Guatemalan National Electricity System. In the absence of a negotiated price, tolls for the use of the secondary transmission lines, substations and distribution installations are set according to regulations issued by the CNEE.
There are separate tolls applicable to the primary transmission system and the secondary transmission system. Both tolls are determined on the basis of the variable transmission revenue of replicating a “model” transmission system, including an estimated return on capital, or VNR, of the transmission system. The VNR of a transmission system is the estimated cost of replicating a “model” transmission system including an estimated return on capital.
The tolls for the primary transmission system are determined by the CNEE based on information provided by the owners of the transmission facilities and the AMM. CNEE revises transmission tolls for the primary transmission system every two years and whenever new generation capacity is connected to the Guatemalan National Electricity System or a portion of the secondary transmission system is upgraded to become part of the primary transmission system. The primary transmission toll is collected by the AMM.
Transmission tolls for the secondary transmission system are negotiated between the owners of these transmission facilities and the generators and electricity brokers that use these transmission facilities. If these parties cannot reach an agreement with respect to transmission tolls, the transmission tolls are established by the CNEE according to applicable regulations. The transmission tolls for distribution facilities should be equal to the VAD charge. However, there have been instances where the transmission tolls were lower than the VAD charge.
Transmission tolls for use of the primary transmission system are paid by generation companies or importers and are included as part of the cost in the tariffs paid by regulated customers. Transmission tolls for use of the secondary transmission system are paid by distribution companies, electricity brokers or unregulated customers. Transmission tolls for use of the secondary transmission system paid by distribution companies are included as part of the cost in the tariffs paid by regulated customers, if authorized by the CNEE.
277
Table of Contents
Directors and Senior Management
The following table sets forth information regarding IC Power’s directors as of the date of this prospectus.
Name | Age | Position | Date Elected | Term Expires | ||||||
Laurence N. Charney | 69 | Chairman of the Audit Committee | 2015 | 2016 | ||||||
Yoav Doppelt | 47 | Chairman of the Board of Directors | 2015 | 2016 | ||||||
Cyril Pierre-Jean Ducau | 38 | Director | 2015 | 2016 | ||||||
Dr. Bill Foo | 59 | Audit Committee Member | 2015 | 2016 | ||||||
Tzahi Goshen | 41 | Audit Committee Member | 2015 | 2016 | ||||||
Aviad Kaufman | 46 | Director | 2015 | 2016 | ||||||
Arunava Sen | 56 | Audit Committee Member | 2015 | 2016 | ||||||
The following table sets forth information regarding IC Power’s expected senior management as of the date of this prospectus:
Name | Age | Position | ||
Javier García-Burgos | 46 | Chief Executive Officer | ||
Alberto Triulzi | 59 | Chief Financial Officer | ||
Roberto Cornejo | 53 | Chief Operating Officer — Generation | ||
Cristián Fierro | 48 | Chief Operating Officer — Distribution | ||
Juan Carlos Camogliano | 53 | Chief Investment Officer | ||
Frank Sugrañes | 51 | Chief Technical Officer | ||
Daniel Urbina | 47 | General Counsel |
Our business address is the business address of all of our directors and senior management.
Biographies of our Directors and Senior Management
Laurence N. Charney. Mr. Charney currently serves as the chairman of the audit committee of Kenon. Mr. Charney retired from Ernst & Young LLP, or Ernst & Young, in June 2007, where, over the course of his more than 35-year career, he served as Senior Audit Partner, Practice Leader and Senior Advisor. Since his retirement from Ernst & Young, Mr. Charney has served as a business strategist and financial advisor to boards, senior management and investors of early stage ventures, private businesses and small to mid-cap public corporations across the consumer products, energy, high-tech/software, media/entertainment, and non-profit sectors. His most recent affiliations include board tenures with Pacific Drilling S.A. and Kenon, as well as Marvel Entertainment, Inc. (through December 2009) and TG Therapeutics, Inc (from March 2012 through the current date). Mr. Charney is a graduate of Hofstra University with a Bachelor’s Degree in Business Administration (Accounting), and has also completed an Executive Master’s program at Columbia University. Mr. Charney maintains active membership with the American Institute of Certified Public Accountants and the New York State Society of Certified Public Accountants.
Yoav Doppelt. Mr. Doppelt currently serves as the chairman of our board of directors. Mr. Doppelt is the Chief Executive Officer of Kenon and has served in this capacity since its inception in 2014. Mr. Doppelt also served as the Chief Executive Officer of XT Investments Group (formerly known as Ofer Investments Group) from its inception in 2007 to 2014 and served as the Chief Executive Officer of XT Capital (formerly known as Ofer Hi-Tech) from 2001 to 2014, each of which may be associated with the same ultimate beneficiary, Mr. Idan Ofer. Mr. Doppelt joined the XT Group (formerly known as Ofer Group) in 1996 and has been with XT Capital since its inception in 1997, defining the vision and operational methodology of its private equity and high-tech
278
Table of Contents
investments. Mr. Doppelt has held various finance and managerial positions in the XT Group since joining. Mr. Doppelt has previously served as a member of the board of directors of a number of public companies and was actively involved in numerous investments within the private equity and high-tech arenas. Currently, Mr. Doppelt serves as a member of the board of directors of ZIM Integrated Shipping Services, Ltd. Mr. Doppelt has extensive operational and business experience in growth companies and has successfully led several private equity exit transactions. Recently, Mr. Doppelt has been actively involved in the public offering of equity and debt instruments in the U.S. Mr. Doppelt holds a Bachelor’s Degree in Economics and Management from the Faculty of Industrial Management at the Technion—Israel Institute of Technology, Haifa, Israel and a Master’s of Business Administration from Haifa University, Israel.
Cyril Pierre-Jean Ducau. Mr. Ducau is the Managing Director of Quantum Pacific Ventures Limited and a member of the board of directors of Kenon, Pacific Drilling S.A., Quantum Pacific Shipping Services Pte. Ltd., Ansonia Holdings Singapore B.V., and other private companies, each of which may be associated with the same ultimate beneficiary, Mr. Idan Ofer. He was previously Head of Business Development of Quantum Pacific Advisory Limited in London from 2008 to 2012. Prior to joining Quantum Pacific Advisory Limited, Mr. Ducau was Vice President in the Investment Banking Division of Morgan Stanley & Co. International Ltd. in London and, during his tenure there from 2000 to 2008, he held various positions in the Capital Markets, Leveraged Finance and Mergers and Acquisitions teams. Prior to that, Mr. Ducau gained experience in consultancy working for Arthur D. Little in Munich and investment management with Credit Agricole UI Private Equity in Paris. Mr. Ducau graduated from ESCP Europe Business School (Paris, Oxford, Berlin) and holds a Master of Science in business administration and a Diplom Kaufmann.
Dr. Bill Foo. Dr. Bill Foo is a director and corporate advisor of several private, listed and non-profit entities, including Unigestion Asia Pte. Ltd., Mewah International Inc., CDL Hospitality Trusts, Academies Australasia Group Ltd. and chairing the Salvation Army and Heartware Network Youth Charity organizations. Prior to his retirement, Dr. Foo worked in financial services for over 30 years, including serving as CEO of ANZ Singapore and South East Asia Head of Investment Banking for Schroders. Dr. Foo has also worked in various positions at Citibank and Bank of America and has been a director of several listed and government-related entities, including International Enterprise Singapore (Trade Agency), where he chaired the Audit Committee for several years. Dr. Foo has a Master’s Degree in Business Administration from McGill University and a Bachelor of Business Administration from Concordia University and an honorary Doctor of Commerce from James Cook University Australia.
Tzahi Goshen. Mr. Goshen is the Chief Financial Officer of Kenon and has served in this capacity since its inception in 2014. Prior to joining Kenon as Chief Financial Officer, Tzahi Goshen served as the Controller of IC since 2008, which, along with Kenon, may be associated with the same ultimate beneficiary, Mr. Idan Ofer. Mr. Goshen was responsible for all aspects of IC’s financial reporting as a public company. Mr. Goshen also served as the Controller of Gemini Israel Funds Ltd., a venture capital fund, from 2006 to 2008. Mr. Goshen has vast experience in overseeing the corporate financial activities of traded companies, including acquisitions, tax planning, accounting and reporting, and internal auditing. Mr. Goshen holds a Bachelor’s Degree in Accounting from the College of Management and is a certified public accountant in Israel.
Aviad Kaufman.Mr. Kaufman is the Chief Financial Officer of Quantum Pacific (UK) LLP and is also a board member of IC, Israel Chemicals Ltd. and Kenon, each of which may be associated with the same ultimate beneficiary, Mr. Idan Ofer. From 2008 until 2012, Mr. Kaufman served as Chief Financial Officer of Quantum Pacific Advisory Limited. From 2002 until 2007, Mr. Kaufman served as Director of International Taxation and fulfilled different senior corporate finance roles at Amdocs Ltd. Previously, Mr. Kaufman held various consultancy positions with KPMG. Mr. Kaufman is a certified public accountant and holds a Bachelor’s Degree in Accounting and Economics from the Hebrew University in Jerusalem (with distinction), and a Master’s of Business Administration in Finance from Tel Aviv University.
Arunava Sen. Mr. Sen is CEO and Managing Director of Coromandel Advisors Pte Ltd, a Singapore-based company that provides strategic and transactional advice to global investors in the infrastructure and clean
279
Table of Contents
energy sectors. Between August 2010 and February 2015, Mr. Sen was CEO and Managing Director of Lanco Power International Pte Ltd, a Singapore-registered company focused on the development of power projects globally. Previously, Mr. Sen held several senior roles at Globeleq Ltd, a Houston-based power investment company, including COO, CEO—Latin America and CEO—Asia. In 1999, Mr. Sen co-founded and was COO of Hart Energy International, a Houston-based company that developed and invested in power businesses in Latin America and the Caribbean. From 1994 to 1999, Mr. Sen was a Senior Vice President of Coastal Power Company, where he was responsible for business development and asset management in South Asia. Between 1990 and 1993, Mr. Sen served as Vice President of Hart Associates Inc., a Washington, DC-based company that pioneered environmental projects in Eastern Europe. Mr. Sen is currently a director on the board of Romo Wind A.G. and a member of the investment committee of Armstrong Asset Management Pte Ltd. A qualified Chartered Accountant, Mr. Sen holds a B.Com. degree from the University of Calcutta and an M.S. degree in Finance from The American University in Washington, DC.
Javier García-Burgos. Mr. García-Burgos has served as our Chief Executive Officer since 2015, and has served as the Chief Executive Officer of ICP since 2011. Simultaneously, Mr. García-Burgos served as the Chief Executive Officer of Inkia from 2007 to date, Chief Executive Officer of Kallpa from 2005 to 2015 and Chief Executive Officer of Southern Cone from 2002 to 2014. Previously, Mr. García-Burgos served as Regional Director for Globeleq in South America from 2002 to 2007, Planning and Control Vice President of Edegel in 2001, Planning and Control Manager of Edegel from 2000 to 2001, Development Manager of Edegel from 1998 to 2000 and in other positions with Edegel beginning in 1996. Mr. García-Burgos has over 19 years of experience in the energy industry, having served as a board member of approximately 20 power companies in 12 countries. Mr. García-Burgos holds a Bachelor’s Degree in Aerospace Engineering from San Diego State University and a Master’s of Business Administration fromEscuela de Administración de Negocios para Graduados (ESAN) in Peru.
Alberto Triulzi. Mr. Triulzi has served as our Chief Financial Officer since 2015 and has served as the Chief Financial Officer of ICP since 2013. Previously, Mr. Triulzi served as Chief Executive Officer of Nejapa and Cenérgica from 2008 to 2013, Chief Finance and Administration Officer of EGE Haina from 2001 to 2008, Chief Financial Officer of Edegel from 1995 to 2001, Vice President and Controller of Edesur S.A. from 1992 to 1995, Project Development Manager for Entergy Corporation from 1988 to 1992, and executive consultant for Stone and Webster Management Consultants from 1983 to 1988. Mr. Triulzi also served as a member of the board of directors of Generandes from 2006 to 2014 and as an alternate member of the board of directors of Edegel from 2006 to 2014. Mr. Triulzi also served as a member of the board of directors of Edesur S.A. from 1995 to 1997, Transener S.A. from 1993 to 1996 and Central Térmica Costanera (Buenos Aires) from 1993 to 1995, and as Chairman of Argelec S.A. in 1994. Mr. Triulzi holds a Bachelor’s Degree in Economics and a Master’s of Business Administration in Finance, both from Loyola University.
Roberto Cornejo. Mr. Cornejo has served as our Chief Operating Officer—Generation since 2015, and has served as the Chief Operating Officer of ICP since 2011. Previously, Mr. Cornejo served as the Chief Operating Officer and Commercial Vice President of Inkia from 2007 to 2011, as a Commercial Vice President for Edegel from 2000 to 2007 and as Commercial Manager for Edegel from 1997 to 2000. Mr. Cornejo has over 19 years of experience in the energy industry in Latin America. He holds a Bachelor’s Degree in Industrial Engineering from the Pontificia Universidad Católica del Perú and a Master’s Degree in Business Administration from theUniversidaddel Pacífico in Peru.
Cristián Fierro.Mr. Fierro has served as our Chief Operating Officer—Distribution since 2016. Previously, Mr. Fierro served as the Chief Executive Officer of Distribution Business for Latin America—Endesa and Chief Executive Officer of Chilectra (Chile) from 2010 to 2014, Chief Executive Officer of Ampla (Brazil) from 2007 to 2010, Chief Executive Officer of Coelce (Brazil) from 2003 to 2007 and in other executive positions in Chile and Argentina within the Enersis Group during 1992 – 2007. Mr. Fierro has over 24 years of experience in the energy industry, having served as a board member of over 10 power companies in five countries. Mr. Fierro holds an Electrical Engineering Degree from Universidad de Chile and a Master’s Degree in Business Administration from Instituto de Altos Estudios-Universidad Austral (IAE) in Argentina.
280
Table of Contents
Juan Carlos Camogliano. Mr. Camogliano has served as our Chief Investment Officer since 2015 and has served as the Chief Investment Officer of ICP since 2011. Mr. Camogliano has also served as the Vice President of Business Development at Inkia since 2008. Previously, Mr. Carmogliano worked at Suez Energy Peru, a member of the Suez Group (now Engie), as Planning, Project and Business Development Vice President from 2006 to 2007, Planning and Project Vice President from 2004 to 2005, and Commercial Vice President and Chief Financial Officer from 2001 to 2004. He worked in the trading department of Morgan Stanley from 2000 to 2001 and in the commercial and development department of Edegel from 1997 to 2000. Mr. Camogliano has over 17 years of experience in the power industry. He holds a Bachelor’s Degree in Mechanical Engineering from the Peruvian Navy School and a Master’s of Business Administration fromEscuela de Administración de Negocios para Graduados (ESAN) in Peru.
Frank Sugrañes. Mr. Sugrañes has served as our Chief Technical Officer since 2015, and has served as the Technical Officer of ICP since 2011 and has also served as the Vice President of Production at Inkia since 2009. Previously, he was Senior Director of Operations for Ashmore Energy International, or AEI, responsible for operations worldwide and reporting to the Vice President of Operations, from 2004 to 2009. Additionally, Mr. Sugrañes was assigned to different positions during his tenure at AEI such as General Manager of Pantanal Energia Power Plant in Cuiaba, Brazil from 2002 to 2004 and General Manager of Jamaica Private Power Co. in Kingston, Jamaica from 2008 to 2009. Mr. Sugrañes has close to 25 years of experience in the energy industry. He holds a Bachelor’s Degree in Civil Engineering and a Master’s of Construction Management from Texas A&M University.
Daniel Urbina. Mr. Urbina has served as our General Counsel since 2015, and has served as the General Counsel of ICP for the Americas region since 2011 and has also served as General Counsel of Inkia since 2008. Previously, he served as Vice President and Legal Advisor for the Americas region at Standard Chartered Bank (New York) from 2005 to 2008 and was Head of Legal and Compliance for Standard Chartered Bank Peru from 2000 to 2005. Mr. Urbina also served as legal director of the Ministry of the Presidency of Peru from 1999 to 2000. He holds a Law Degree from theUniversidad de Lima in Peru and a Master’s in Laws Degree from Columbia University. He is admitted to practice in the state of New York and in Lima, Peru.
Board Practices
As a foreign private issuer, we are permitted to follow certain home country corporate governance practices instead of those otherwise required under the NYSE’s rules for domestic U.S. issuers, provided that we disclose which requirements we are not following and describe the equivalent home country requirement. Additionally, as Kenon will hold % of our ordinary shares upon completion of the offering (or % if the underwriters exercise in full their option to purchase additional ordinary shares from us), we expect to be a “controlled company” within the meaning of the corporate governance standards of the NYSE. However, we have elected to apply the corporate governance rules of the NYSE that are applicable to U.S. domestic issuers that are not “controlled” companies.
Board of Directors
Our constitution gives our board of directors general powers to manage our business. The board of directors, which consists of seven directors, and of which Mr. Yoav Doppelt serves as our Chairman, oversees and provides policy guidance on our strategic and business planning processes, oversees the conduct of our business by senior management and is principally responsible for the succession planning for our key executives. Under our constitution, the number of directors must not be fewer than 5 nor more than 12 persons.
Director Independence. Pursuant to the NYSE’s listing standards, listed companies are required to have a majority of independent directors. Under the NYSE’s listing standards, (1) a director employed by us or that has, or had, certain relationships with us during the last three years, cannot be deemed to be an independent director, and (2) directors will qualify as independent only if our board of directors affirmatively determines that
281
Table of Contents
they have no material relationship with us, either directly or as a partner, shareholder or officer of an organization that has a relationship with us. Ownership of a significant amount of our ordinary shares, by itself, does not constitute a material relationship.
Although we are permitted to follow home country practice in lieu of the requirement to have a board of directors comprised of a majority of independent directors, we have determined that we are in compliance with this requirement and that a majority of our board of directors is independent according to the NYSE’s listing standard. Our board of directors has affirmatively determined that Mr. Laurence N. Charney, Mr. Cyril Pierre-Jean Ducau, Dr. Bill Foo, Mr. Aviad Kaufman and Mr. Arunava Sen, representing five of our seven directors, are currently “independent directors” as defined under the applicable rules and regulations of the NYSE.
Election and Removal of Directors. For further information on the election and removal of directors, see “Description of Share Capital—Constitution—Election and Re-election of Directors.”
Service Contracts. None of our board members has a service contract with us or any of our businesses providing for benefits upon termination of employment.
Indemnifications and Limitations on Liability. For information on the indemnification and limitations on liability of our directors, see “Description of Share Capital—Constitution—Limitations of Liability and Indemnification Matters.”
Committees of our Board of Directors
We have established three committees, which report regularly to our board of directors on matters relating to the specific areas of risk the committees oversee: the audit committee, the nominating and corporate governance committee and the compensation committee. Although we are permitted to follow home country practices with respect to our establishment of audit, nominating and corporate governance and compensation committees, we have determined that we are in compliance with the NYSE’s requirements in these respects.
Audit Committee
We have established an audit committee to review and discuss with management significant financial, legal and regulatory risks and the steps management takes to monitor, control and report such exposures; our audit committee also oversees the periodic enterprise-wide risk evaluations conducted by management. Specifically, our audit committee oversees the process concerning:
| • | the quality and integrity of our financial statements and internal controls; |
| • | the appointment, compensation, retention, qualifications and independence of our independent registered public accounting firm; |
| • | the performance of our internal audit function and independent registered public accounting firm; |
| • | our compliance with legal and regulatory requirements; and |
| • | related party transactions. |
At the time of the completion of the offering, the members of our audit committee, Mr. Laurence N. Charney, Dr. Bill Foo, Mr. Tzahi Goshen and Mr. Arunava Sen, will meet the requirements for financial literacy, and each of Mr. Laurence N. Charney, Dr. Bill Foo and Mr. Arunava Sen, will be independent directors, as defined under the applicable rules and regulations of each of the SEC and the NYSE. Our board of directors has determined that each of our audit committee members will have the requisite financial sophistication as defined under the applicable rules and regulations of the NYSE. Our audit committee will operate under a written charter that satisfies the applicable standards of each of the SEC and the NYSE.
282
Table of Contents
Nominating and Corporate Governance Committee
Our nominating and corporate governance committee oversees the management of risks associated with board governance, director independence and conflicts of interest. Specifically, our nominating and corporate governance committee is responsible for identifying qualified candidates to become directors, recommending to the board of directors candidates for all directorships, overseeing the annual evaluation of the board of directors and its committees and taking a leadership role in shaping our corporate governance.
Our nominating and corporate governance committee will consider candidates for director who are recommended by its members, by other board members and members of our management, as well as those identified by any third-party search firms retained by it to assist in identifying and evaluating possible candidates. The nominating and corporate governance committee will also consider recommendations for director candidates submitted by our shareholders. The nominating and corporate governance committee will evaluate and recommend to the board of directors qualified candidates for election, re-election or appointment to the board, as applicable.
When evaluating director candidates, the nominating and corporate governance committee seeks to ensure that the board of directors has the requisite skills, experience and expertise and that its members consist of persons with appropriately diverse and independent backgrounds. The nominating and corporate governance committee will consider all aspects of a candidate’s qualifications in the context of our needs, including: personal and professional integrity, ethics and values; experience and expertise as an officer in corporate management; experience in the industry of any of our portfolio businesses and international business and familiarity with our operations; experience as a board member of another publicly traded company; practical and mature business judgment; the extent to which a candidate would fill a present need on the board of directors; and the other ongoing commitments and obligations of the candidate. However, the nominating and corporate governance committee does not have any minimum criteria for director candidates. Consideration of new director candidates will typically involve a series of internal discussions, review of information concerning candidates and interviews with selected candidates.
As a foreign private issuer, we are permitted to follow home country practice in lieu of the requirement to have a nominating and corporate governance committee comprised entirely of independent directors. Nonetheless, we have determined that we are in compliance with this requirement and that the members of our nominating and corporate governance committee, , are independent directors as defined under the applicable rules and regulations of the NYSE. Our nominating and corporate governance committee operates under a written charter that satisfies the applicable standards of the NYSE.
Compensation Committee
Our compensation committee assists our board in reviewing and approving the compensation structure of our directors and officers, including all forms of compensation to be provided to our directors and officers. The compensation committee is responsible for, among other things:
| • | reviewing and determining the compensation package for our Chief Executive Officer and other senior executives; |
| • | reviewing and making recommendations to our board with respect to the compensation of our non-employee directors; |
| • | reviewing and approving corporate goals and objectives relevant to the compensation of our Chief Executive Officer and other senior executives, including evaluating their performance in light of such goals and objectives; and |
283
Table of Contents
| • | reviewing periodically and approving and administering stock options plans, long-term incentive compensation or equity plans, programs or similar arrangements, annual bonuses, employee pension and welfare benefit plans for all employees, including reviewing and approving the granting of options and other incentive awards. |
As a foreign private issuer, we are permitted to follow home country practice in lieu of the requirement to have a compensation committee comprised entirely of independent directors. Nonetheless, we have determined that we are in compliance with this requirement and that the members of our compensation committee, , are independent directors as defined under the applicable rules and regulations of the NYSE. Our compensation committee operates under a written charter that satisfies the applicable standards of the NYSE.
Code of Ethics and Ethical Guidelines
Our board of directors has adopted a code of ethics that describes our commitment to, and requirements in connection with, ethical issues relevant to business practices and personal conduct.
Compensation
For the year ended December 31, 2015, the aggregate compensation expense relating to our executive officers was approximately $5 million. No amounts in respect of pension, retirement or similar benefits have been accrued in any of the periods presented in this prospectus. We have a competitive compensation structure for our executive officers. Compensation for such executive officers typically consists of a base salary, as well as a year-end bonus, which is based on the personal performance of our executive officer, our performance, and the performance of our businesses.
Share Incentive Plan 2016 and Share Option Plan 2016
We will establish the Share Incentive Plan 2016 and the Share Option Plan 2016 for our directors and management. The Share Incentive Plan 2016 and the Share Option Plan 2016 provides for grants of our shares, and stock options in respect of our shares, respectively, to our management and directors, as well as to the directors and officers of our subsidiaries or associated companies, pursuant to awards, which may be granted to such individuals by us from time to time. Such awards may be subject to a vesting period and may be subject to conditions including performance conditions as determined by a committee of our board of directors. The number of shares issuable pursuant to an award may be subject to adjustment upon the occurrence of certain dilutive events, and we may elect to settle an award in cash. The total number of shares underlying awards which may be granted under the Share Incentive Plan 2016 and delivered pursuant to the exercise of options granted under the Share Option Plan 2016 shall not, in the aggregate, exceed 3% of our total issued shares (excluding treasury shares).
284
Table of Contents
The following table sets forth information with respect to the beneficial ownership of our ordinary shares outstanding (1) immediately prior to this offering, (2) immediately following the offering, assuming no exercise of the underwriters’ option to purchase additional ordinary shares, and (3) immediately following the offering, assuming the underwriters’ option to purchase additional ordinary shares is exercised in full by:
| • | each person known to us to own beneficially more than 5% of our issued ordinary shares; and |
| • | each of our directors, director nominees, and executive officers individually and as a group. |
The calculations in the table below are based on shares outstanding as of , 2016 which comprise our entire issued and outstanding share capital as of that date.
Beneficial ownership is determined in accordance with the rules and regulations of the SEC. In computing the number of shares beneficially owned by a person and the percentage ownership of that person, we have included shares that the person has the right to acquire within 60 days, including through the exercise of any option, warrant or other right or the conversion of any other security. These shares, however, are not included in the computation of the percentage ownership of any other person.
Prior to this Offering | After this Offering (Assuming no Exercise of the Underwriters’ Option) | After this Offering (Assuming the Underwriters’ Option is Exercised in Full) | ||||||||||||||||||||||
Total | Total % of Share Capital | Total | Total % of Share Capital | Total | Total % of Share | |||||||||||||||||||
Kenon Holdings Ltd.1 | 100% | |||||||||||||||||||||||
All directors and executive officers as a group2 | — | — | ||||||||||||||||||||||
| 1. | Kenon Holdings Ltd. is a publicly traded corporation (NYSE: KEN; TASE: KEN). |
| 2. | Each individual beneficially owns less than 1% of Kenon’s ordinary shares. |
285
Table of Contents
We are party to numerous related party transactions with certain of our affiliates.
Our audit committee, pursuant to its charter, must review and approve all related party transactions. Our audit committee has a written policy with respect to the approval of related party transactions and considers a number of factors when determining whether to approve a related party transaction, including considering whether the related party transaction is on terms and conditions no less favorable to us than may reasonably be expected in arm’s-length transactions with unrelated parties.
Set forth below is a summary of our material related party transactions.
Reorganization
In March 2016, Kenon completed an internal restructuring, pursuant to which we received 100% of the outstanding shares of ICP, thereby becoming the direct holding company of ICP and its power generation and distribution businesses. In connection with the Reorganization, we issued additional ordinary shares to Kenon and also issued a $145 million note (the proceeds of which have been pledged by Kenon to IC in connection with Kenon’s pledge of our shares, as set forth below) and a $75 million note, each payable to Kenon. In October 2016, we prepaid in full our $75 million note payable to Kenon.
Kenon had previously pledged 66% of the ICP shares it owned to IC as security for Kenon’s $200 million credit facility with IC. To facilitate the transfer of the ICP shares to us, IC released Kenon’s pledge over the 66% of ICP’s share capital. This pledge was replaced by our pledge to IC of 66% of ICP’s share capital. In addition, Kenon also pledged 66% of our outstanding share capital to IC in connection with the Reorganization.
Pursuant to the terms of Kenon’s $200 million credit facility with IC, our pledge over 66% of the shares of ICP shall be released upon the effectiveness of the registration statement of which this prospectus is a part. In addition, Kenon’s pledge over our shares is expected to be released upon the closing of this offering, subject to Kenon’s satisfaction of the following financial ratio: (1) the product of the 5-day average closing price per share of our ordinary shares listed on the NYSE and the total number of our ordinary shares held by Kenon to (2) Kenon’s standalone net debt appearing on its most recent unconsolidated financial statements is at least equal to 2:1.
$220 Million Notes Payable to Kenon
In connection with the Reorganization, we issued a $145 million note (the proceeds of which have been pledged by Kenon to IC in connection with Kenon’s pledge of our shares, as set forth below) and a $75 million note, each payable to Kenon. The proceeds of the notes were applied by us towards the purchase consideration for our acquisition of Kenon’s entire equity interest in ICP. The notes bear interest at a rate of LIBOR + 6% per annum from March 17, 2016, and will mature, unless otherwise prepaid, on December 31, 2018. In connection with the terms of the March 2016 amendment to Kenon’s $200 million credit facility with IC, Kenon also pledged via a security assignment its rights, title and interest over the $145 million note to IC.
In October 2016, we prepaid in full our $75 million note payable to Kenon. We intend to use a portion of the net proceeds that we receive in this offering to prepay in full our obligations under our $145 million note payable to Kenon.
The foregoing summary of our notes payable to Kenon is subject to, and is qualified in its entirety by, the full text of our loan agreements with Kenon, which have been filed as exhibits to the registration statement of which this prospectus is a part and is incorporated by reference herein.
Registration Rights Agreement
In connection with the initial public offering of our ordinary shares, we expect to enter into a registration rights agreement with Kenon with regard to the shares that will be owned by Kenon, as well as in respect of any shares which Kenon may receive or acquire during the term of such agreement (all such shares, the
286
Table of Contents
Registrable Securities). Under the registration rights agreement, Kenon will have the right to cause us to register under the Securities Act, and other applicable laws, the offer and sale by Kenon of the Registrable Securities. Subject to the terms and conditions of our registration rights agreement, this registration right will allow Kenon or certain qualified assignees of Kenon holding any Registrable Securities to require registration of such Registrable Securities and to include any such Registrable Securities in a registration by us of ordinary shares, including ordinary shares offered by us or by any other shareholder. In connection with any registration of ordinary shares held by Kenon or certain qualified assignees of Kenon, we will agree to indemnify Kenon and its officers, directors and controlling persons from and against any liabilities under the Securities Act or otherwise arising from the registration statement or prospectus. We will agree to bear all costs and expenses incidental to any registration, excluding any underwriting discounts.
The foregoing summary of the registration rights agreements is subject to, and is qualified in its entirety by, the full text of our registration rights agreement with Kenon, the form of which has been filed as an exhibit to the registration statement of which this prospectus is a part and is incorporated by reference herein.
Sales of Electricity and Gas
OPC sells electricity through PPAs to some entities that may be considered to be related parties (as they may be considered to be under common control with it). OPC recorded revenues from related parties in the amount of NIS 570 million (approximately $146 million), NIS 746 million (approximately $208 million) and NIS 347 million (approximately $96 million) in the years ended December 31, 2015, 2014 and 2013, respectively.
OPC and AIE also sell an immaterial amount of gas to some entities that may be considered related parties.
Loans from Former Parent
ICP has, in the past, entered into loan agreements with its former parent, IC, pursuant to which it borrowed funds from IC. The interest expenses for these loans were $20 million and $15 million in the years 2014 and 2013, respectively; portions of the interest expense for 2013 were capitalized in property, plant and equipment during this period.
There are currently no loans outstanding to IC.
Transactions with Bank Leumi
Bank Leumi, which holds approximately 14% of Kenon’s ordinary shares, is the arranger of, and lender under, OPC’s NIS 1,800 million (approximately $460 million) financing agreement. Additionally, OPC makes deposits in the ordinary course of its business in a deposit account maintained at Bank Leumi on commercially reasonable terms.
For further information on OPC financing agreement with Bank Leumi, see “Management’s Discussion and Analysis of Financial Condition and Results of Operations—Material Indebtedness—OPC Financing Agreement” and the full text of OPC financing agreement, a copy of which has been filed as an exhibit to the registration statement of which this prospectus is a part and is incorporated by reference herein.
287
Table of Contents
The following is a description of the material terms of our constitution as will be in effect as of the completion of this offering, and of specific provisions of Singapore law.
Upon the completion of this offering, we will have ordinary shares, no par value, issued and outstanding.
We currently have only one class of issued and outstanding shares, which have identical rights in all respects and rank equally with one another. There is no authorized share capital under Singapore law. There is a provision in our constitution to enable us in specified circumstances to issue shares with preferential, deferred or other special rights or restrictions as our directors may determine, subject to the provisions of the Singapore Companies Act and our constitution.
All ordinary shares presently issued are fully paid and existing shareholders are not subject to any calls on shares. Although Singapore law does not recognize the concept of “non-assessability” with respect to newly-issued shares, we note that any purchaser of our ordinary shares who has fully paid up all amounts due with respect to such shares will not be subject under Singapore law to any personal liability to contribute to our assets or liabilities in such purchaser’s capacity solely as a holder of such shares. We believe that this interpretation is substantively consistent with the concept of “non-assessability” under most, if not all, U.S. state corporations laws. All shares are in registered form. We cannot, except in the circumstances permitted by the Singapore Companies Act, grant any financial assistance for the acquisition or proposed acquisition of our own shares.
Constitution
The following description of our constitution as will be in effect as of the completion of this offering is a summary and is qualified by reference to that constitution, a copy of which will be filed with the SEC.
New Shares
Under Singapore law, new shares may be issued only with the prior approval of our shareholders in a general meeting. General approval may be sought from our shareholders in a general meeting for the issue of shares. Approval, if granted, will lapse at the earlier of:
| • | the conclusion of the next annual general meeting; |
| • | the expiration of the period within which the next annual general meeting is required by law to be held (i.e., within 18 months from our incorporation date (and in the case of subsequent periods, 15 months)) or six months from our financial year end, being December 31, whichever is earlier; or |
| • | the subsequent revocation or modification of approval by our shareholders acting at a duly convened general meeting. |
Our shareholders have provided such general authority to our directors to issue new shares until the conclusion of our 2016 annual general meeting. Subject to this, the issuance of shares pursuant to awards made under our Share Incentive Plan 2016 or Share Option Plan 2016, and the provisions of the Singapore Companies Act and our constitution, all new shares are under the control of the directors who may allot and issue new shares to such persons on such terms and conditions and with the rights and restrictions as they may think fit to impose.
Preference Shares
Our constitution provides that we may issue shares of a different class with preferential, deferred, qualified or other special rights, privileges or conditions as our board of directors may determine. Under the
288
Table of Contents
Singapore Companies Act, our preference shareholders will have the right to attend any general meeting insofar as the circumstances set forth below apply and in a poll at such general meeting, to have at least one vote for every preference share held:
| • | upon any resolution concerning the winding-up of our Company; |
| • | upon any resolution which varies the rights attached to such preference shares; or |
| • | when the dividends to be paid on our preference shares are more than 12 months in arrears, for the period they remain unpaid. |
We may, subject to the prior approval in a general meeting of our shareholders, issue preference shares which are, or at our option, subject to redemption provided that such preference shares may not be redeemed out of capital unless:
| • | all the directors have made a solvency statement in relation to such redemption; and |
| • | we have lodged a copy of the statement with the Singapore Registrar of Companies. |
Further, the preference shares must be fully paid-up before they are redeemed.
Register of Members
Under the Singapore Companies Act, we are required to maintain a register of members into which certain information is required to be entered, including among others, the names and addresses of our registered shareholders, the date at which each registered shareholder was entered in the register, the date at which any person has ceased to be a member during the previous seven years, the date of every allotment of shares to registered shareholders and the number of shares comprised in each allotment. Although the Singapore Companies Act and our constitution does not prescribe a time within which we are required to update our register of members, we will endeavor to do so in a timely manner, once we have received the necessary information and transfer form from the transferor or transferee. For information on such forms and the procedures required to register transfers of, our ordinary shares, see “—Transfer of Ordinary Shares.”
Under the Singapore Companies Act, if (1) the name of any person is without sufficient cause entered in or omitted from the register of members, or (2) default is made or there is unnecessary delay in entering in the register of members the fact of any person having ceased to be a registered shareholder, the person aggrieved, any registered shareholder of the Company or the Company, may apply to the Singapore courts for rectification of the register, and the court may either refuse the application or order rectification of the register, and may also direct the Company to pay damages sustained by any party to the application. The Singapore courts will not entertain any application for the rectification of a register of members in respect of an entry which was made in the register more than 30 years before the date of the application.
Transfer of Ordinary Shares
Subject to applicable securities laws in relevant jurisdictions and our constitution, our ordinary shares are freely transferable. Shares may be transferred by a duly signed instrument of transfer in any usual or common form or in a form acceptable to our directors. The directors may decline to register any transfer unless, among other things, evidence of payment of any stamp duty payable with respect to the transfer is provided together with other evidence of ownership and title as the directors may require. We will replace lost or destroyed certificates for shares upon notice to us and upon, among other things, the applicant furnishing evidence and indemnity as the directors may require and the payment of all applicable fees.
289
Table of Contents
Shareholders who hold our shares electronically in book-entry form through the facilities of the Depository Trust Company, or DTC, and that wish to become registered shareholders must contact the broker, bank, nominee or other institution that holds their shares and complete a transfer of these shares from DTC or its nominee to themselves (by transferring such shares to an account maintained by Computershare Trust Company, N.A., our transfer agent and registrar) according to the transfer procedures of the broker, bank, nominee or other institution holding these shares.
Election and Re-election of Directors
Under our constitution, our shareholders may by ordinary resolution, appoint any person to be a director and our board of directors shall have power at any time and from time to time to appoint any person to be a director either to fill a casual vacancy or as an additional director, provided that any person so appointed by our board of directors shall hold office only until the next annual general meeting, and shall then be eligible for re-election.
Our constitution provides that, subject to the Singapore Companies Act, no person other than a director retiring at a general meeting is eligible for appointment as a director at any general meeting, without the recommendation of the board of directors for election, unless (1) in the case of a member or members who in aggregate hold(s) more than fifty percent of the total number of our issued and paid-up shares (excluding treasury shares), not less than ten days, or (2) in the case of a member or members who in aggregate hold(s) more than five percent of the total number of our issued and paid-up shares (excluding treasury shares), not less than 120 days, before the date of the notice provided to members in connection with the general meeting, a written notice signed by such member or members (other than the person to be proposed for appointment) who (a) are qualified to attend and vote at the meeting for which such notice is given, and (b) have held shares representing the prescribed threshold in (1) or (2) above, for a continuous period of at least one year prior to the date on which such notice is given, is lodged at our registered office. Such a notice must also include the consent of the person nominated.
Shareholders’ Meetings
We are required to hold an annual general meeting each year. Our first annual general meeting must be held not more than 18 months from our incorporation date and subsequently, not more than 15 months after the holding of the last preceding annual general meeting, in each case, not later than six months from our financial year end, being December 31. We must, on the written request of shareholders representing not less than 5% of the total voting rights of all shareholders having the right to vote at the meeting, or not less than 100 shareholders who have paid up an average sum, per shareholder, of $500, give to our shareholders who are entitled to receive notice of the next annual general meeting (1) notice of any resolution which may properly be moved and is intended to be moved at the meeting; and (2) a statement of not more than 1,000 words with respect to the matter referred to in any proposed resolution or the business to be dealt with at that meeting. A copy of the resolution shall be given to our shareholders in the same manner and, so far as practicable, at the same time as notice of the meeting.
We are not obliged to give notice of the resolution or to circulate any statement unless (1) a copy of the written request is deposited at our registered office (a) in the case of a request requiring notice of a resolution, not less than six weeks before the meeting; and (b) in the case of any other request, not less than one week before the meeting; and (2) there is deposited with the request a sum reasonably sufficient to meet our expenses in giving effect thereto.
We are not required to circulate any statement if the Singapore courts are satisfied, upon our application or of any other person who claims to be aggrieved, that the rights of shareholders to make such requests are being abused to secure needless publicity for defamatory matter.
290
Table of Contents
Additionally, the directors may convene an extraordinary general meeting whenever they think fit, and they must convene an extraordinary general meeting upon the written request of shareholders representing not less than 10% of the paid-up capital as at the date of deposit of the request which carries the right to vote at general meetings (disregarding paid-up capital held as treasury shares), to propose resolutions to be passed. The request must state the object(s) of the meeting, must be signed by the shareholders requesting the meeting, and must be deposited at our registered office. In addition, two or more shareholders holding not less than one-tenth of our total number of issued shares (excluding our treasury shares) may call a meeting of our shareholders. The Singapore Companies Act requires not less than:
| • | 14 days’ written notice to be given by us of a general meeting to pass an ordinary resolution; and |
| • | 21 days’ written notice to be given by us of a general meeting to pass a special resolution, |
to every one of our members and to our auditors. Our constitution further provides that in computing the notice period, both the day on which the notice is served, or deemed to be served, and the day for which the notice is given shall be excluded.
Only registered shareholders of our Company will be entitled to attend, speak and vote at any meeting of shareholders. At the time of the offering, the ordinary shares that are the subject of this offering will be allotted to, issued to, and registered in the name of the DTC or its nominee, and so long as the ordinary shares that are the subject of this offering are held through DTC, DTC or its nominee will be registered in our register of shareholders as our shareholder and will be considered our shareholder or member for all purposes under the Singapore Companies Act and our constitution, and owners of book-entry interests in our shares will not be considered our shareholders or members. Therefore, under the Singapore Companies Act and our constitution, you will not be recognized as a shareholder of our Company, and do not have a right to attend and to vote at general meetings of our company. Participants must rely on the procedures of DTC through which they own book-entry interests in order to exercise any rights of shareholders under the Singapore Companies Act and our constitution. Owners of book-entry interests in our shares who wish to become a registered shareholder must (pursuant to the transfer procedures of the broker, bank, nominee, or other institution that holds their shares, as well as the transfer procedures in our constitution) transfer their interest in us, as represented by their book-entry interests, from DTC or its nominee, to themselves by transferring such shares to an account maintained by Computershare Trust Company, N.A., our transfer agent and registrar. Under our constitution, such transfer of shares will be effected, and the owner will become a registered shareholder, when the transfer is recorded and the name of the transferee is entered in our register of shareholders as a registered shareholder of the shares which are the subject of the transfer. For further information on the procedures required to register transfers of our ordinary shares, see “—Transfer of Ordinary Shares.”
Unless otherwise required by law or by our constitution, voting at general meetings is by ordinary resolution, requiring the affirmative vote of a simple majority of the shares present in person or represented by proxy at the meeting and entitled to vote on the resolution. An ordinary resolution suffices, for example, for appointments of directors. A special resolution, requiring an affirmative vote of not less than three-fourths of the shares present in person or represented by proxy at the meeting and entitled to vote on the resolution, is necessary for certain matters under Singapore law, such as an alteration of our constitution. Proxies need not be shareholders of our Company.
Voting Rights
Voting at any meeting of shareholders is by a show of hands unless a poll is duly demanded before or on the declaration of the result of the show of hands by: (1) the chairman of the meeting (being a person entitled to vote thereat), (2) at least three shareholders entitled to vote thereat and who are present in person or by proxy or by attorney or, in the case of a corporation, by a representative or (3) at least one shareholder present in person or by proxy or by attorney or, in the case of a corporation, by a representative entitled to vote thereat, in each case
291
Table of Contents
(a) representing in the aggregate not less than 5% of the total voting rights of all shareholders having the right to vote at the general meeting or (b) holding in the aggregate not less than 5% of the total number of our paid-up shares (excluding treasury shares). The election of a chairman of a meeting or any adjournment of such meeting may be decided by a show of hands or on a poll. If voting is by a show of hands, every shareholder who is entitled to vote and who is present in person or by proxy at the meeting has one vote. On a poll, every shareholder who is present in person or by proxy or by attorney, or in the case of a corporation, by a representative, has one vote for every share held by him or which he represents. Proxies need not be shareholders.
Only those shareholders who are registered in our register of members will be entitled to vote at any meeting of shareholders. Therefore, DTC, or its nominee, will grant an omnibus proxy to DTC participants holding our shares in book-entry form through a broker, bank, nominee, or other institution that is a direct or indirect participant in the DTC. Such shareholders will have the right to instruct their broker, bank, nominee or other institution holding these shares on how to vote such shares by completing the voting instruction form provided by the applicable broker, bank, nominee, or other institution. Whether voting is by a show of hands or by a poll, DTC’s vote will be voted by the chairman of the meeting according to the results of the DTC’s participants’ votes (which results will reflect the instructions received from shareholders that own our shares electronically in book-entry form).
Dividends
From time to time, our board of directors may approve the payment of dividends to our shareholders. Any declaration and payment of future dividends will be at the discretion of our board of directors and will depend upon many factors, including our profits, our financial position, earnings, cash flows, capital requirements, level of indebtedness, the progress relating to our strategy plan, statutory and contractual restrictions applicable to the payment of dividends, the conditions prevailing in the market, our overall financial condition, available distributable reserves, and additional factors our board deems appropriate.
Under Singapore corporate law, no dividend may be paid except out of profits and we do not expect to have significant distributable profits at the time of the completion of the offering. Any dividends would be limited by the amount of available distributable reserves, which, under Singapore law, will be assessed on the basis of our standalone unconsolidated accounts (which will be based upon the SFRS). We expect that the opening balance of our retained earnings in such financials will be zero. However, under Singapore law, it is possible to effect a capital reduction exercise to return cash and/or assets to our shareholders. The completion of a capital reduction exercise may require the approval of the Singapore Courts, and we may not be successful in our attempts to obtain such approval.
Additionally, because we are a holding company, our ability to pay cash dividends, or declare a distribution-in-kind of the ordinary shares of any of our businesses, may be limited by restrictions on our ability to obtain sufficient funds through dividends from our businesses, including restrictions under the terms of the agreements governing the indebtedness of our businesses. Subject to the foregoing, the declaration and payment of future dividends, if any, will be at the discretion of our board of directors and will depend upon many factors, including our profits, our financial position, earnings, cash flows, capital requirements, level of indebtedness, the progress relating to our strategy plan, statutory and contractual restrictions applicable to the payment of dividends, the conditions prevailing in the market, our overall financial condition, available distributable reserves, and additional factors our board of directors deems appropriate. Generally, a final dividend is declared out of profits disclosed by the accounts presented to the annual general meeting, and requires approval of our shareholders. However, our board of directors can declare interim dividends without the approval of our shareholders.
292
Table of Contents
Bonus and Rights Issues
In a general meeting, our shareholders may, upon the recommendation of the directors, capitalize any reserves or profits and distribute them as fully paid bonus shares to the shareholders in proportion to their shareholdings. Subject to the provisions of the Singapore Companies Act and our constitution, our board of directors may also issue rights to take up additional ordinary shares to our shareholders in proportion to their respective shareholdings. Such rights are subject to any condition attached to such issue and the regulations of any stock exchange on which our ordinary shares are listed, as well as U.S. federal and blue sky securities laws applicable to such issue.
Takeovers
The Singapore Code on Take-overs and Mergers, the Singapore Companies Act and the SFA regulate, among other things, the acquisition of ordinary shares of Singapore-incorporated public companies. Any person acquiring an interest, whether by a series of transactions over a period of time or not, either on his own or together with parties acting in concert with such person, in 30% or more of our voting shares, or, if such person holds, either on his own or together with parties acting in concert with such person, between 30% and 50% (both amounts inclusive) of our voting shares, and if such person (or parties acting in concert with such person) acquires additional voting shares representing more than 1% of our voting shares in any six-month period, must, except with the consent of the Securities Industry Council in Singapore, extend a mandatory takeover offer for the remaining voting shares in accordance with the provisions of the Singapore Code on Take-overs and Mergers.
“Parties acting in concert” comprise individuals or companies who, pursuant to an agreement or understanding (whether formal or informal), cooperate, through the acquisition by any of them of shares in a company, to obtain or consolidate effective control of that company. Certain persons are presumed (unless the presumption is rebutted) to be acting in concert with each other. They include:
| • | a company and its related companies, the associated companies of any of the company and its related companies, companies whose associated companies include any of these companies and any person who has provided financial assistance (other than a bank in the ordinary course of business) to any of the foregoing for the purchase of voting rights; |
| • | a company and its directors (including their close relatives, related trusts and companies controlled by any of the directors, their close relatives and related trusts); |
| • | a company and its pension funds and employee share schemes; |
| • | a person and any investment company, unit trust or other fund whose investment such person manages on a discretionary basis but only in respect of the investment account which such person manages; |
| • | a financial or other professional adviser, including a stockbroker, and its clients in respect of shares held by the adviser and persons controlling, controlled by or under the same control as the adviser and all the funds managed by the adviser on a discretionary basis, where the shareholdings of the adviser and any of those funds in the client total 10% or more of the client’s equity share capital; |
| • | directors of a company (including their close relatives, related trusts and companies controlled by any of such directors, their close relatives and related trusts) which is subject to an offer or where the directors have reason to believe a bona fide offer for the company may be imminent partners; and |
| • | an individual and such person’s close relatives, related trusts, any person who is accustomed to act in accordance with such person’s instructions and companies controlled by the individual, such |
293
Table of Contents
person’s close relatives, related trusts or any person who is accustomed to act in accordance with such person’s instructions and any person who has provided financial assistance (other than a bank in the ordinary course of business) to any of the foregoing for the purchase of voting rights. |
Subject to certain exceptions, a mandatory takeover offer must be in cash or be accompanied by a cash alternative at not less than the highest price paid by the offeror or parties acting in concert with the offeror during the offer period and within the six months prior to the commencement of the offer period.
Under the Singapore Code on Take-overs and Mergers, where effective control of a company is acquired or consolidated by a person, or persons acting in concert, a general offer to all other shareholders is normally required. An offeror must treat all shareholders of the same class in an offeree company equally. A fundamental requirement is that shareholders in the company subject to the takeover offer must be given sufficient information, advice and time to consider and decide on the offer. These legal requirements may impede or delay a takeover of our Company by a third party.
In June 2016, the Securities Industry Council of Singapore granted a waiver from the application of the Singapore Code on Take-overs and Mergers to us, subject to certain conditions. Pursuant to the waiver, the Singapore Code on Take-overs and Mergers will not apply to us (except in the case of a tender offer (within the meaning of the U.S. securities laws) where the U.S. Tier I exemption under the Securities Exchange Act of 1934 is available and the offeror relies on the Tier I exemption to avoid full compliance with U.S. tender offer regulations) for so long as we are not listed on a securities exchange in Singapore.
Liquidations or Other Return of Capital
On a liquidation, dissolution, winding-up or other return of capital, subject to any special rights attaching to any other class of shares, holders of ordinary shares will be entitled to participate in any surplus assets in proportion to their shareholdings.
Limitations on Rights to Hold or Vote Ordinary Shares
Except as discussed above under “—Takeovers,” there are no limitations imposed by the laws of Singapore or by our constitution on the right of non-resident shareholders to hold or vote ordinary shares.
Limitations of Liability and Indemnification Matters
Our constitution provides that, subject to the provisions of the Singapore Companies Act, every director, auditor, secretary or other officer of our Company and our subsidiaries and affiliates shall be entitled to be indemnified by our Company against all costs, interest, charges, losses, expenses and liabilities incurred by him or her in the execution and discharge of his or her duties (and where he serves at our request as a director, officer, employee or agent of any of our subsidiaries or affiliates) or in relation thereto including any liability by him in defending any proceedings, civil or criminal, which relate to anything done or omitted or alleged to have been done or omitted by him as a director, officer or employee or agent of the Company and in which judgment is given in his favour (or the proceedings otherwise disposed of without any finding or admission of any material breach of duty on his part) or in which he is acquitted or in connection with any application under statute for relief from liability in respect of any such act or omission in which relief is granted to him by the court, provided that there is no conflict with the Singapore Companies Act and every other Singapore act for the time being in force concerning companies and affecting our Company. Without prejudice to the generality of the foregoing, no director, secretary or other officer of our Company shall be liable for the acts, receipts, neglects or defaults of any other director or officer or for joining in any receipt or other act for conformity or for any loss or expense happening to our Company through the insufficiency or deficiency of title to any property acquired by order of the directors for or on behalf of our Company or for the insufficiency or deficiency of any security in or upon which any of the moneys of our Company shall be invested or for any loss or damage arising from the
294
Table of Contents
bankruptcy, insolvency or tortious act of any person with whom any moneys, securities or effects shall be deposited or left or for any other loss, damage or misfortune whatever which shall happen in the execution of the duties of his or her office or in relation thereto unless the same shall happen through his or her own negligence, default, breach of duty or breach of trust.
The limitation of liability and indemnification provisions in our constitution may discourage shareholders from bringing a lawsuit against directors for breach of their fiduciary duties. They may also reduce the likelihood of derivative litigation against directors and officers, even though an action, if successful, might benefit us and our shareholders. A shareholder’s investment may be harmed to the extent we pay the costs of settlement and damage awards against directors and officers pursuant to these indemnification provisions.
Insofar as indemnification for liabilities arising under the Securities Act may be permitted to our directors, officers and controlling persons pursuant to the foregoing provisions, or otherwise, we have been advised that, in the opinion of the SEC, such indemnification is against public policy as expressed in the Securities Act, and is, therefore, unenforceable.
Comparison of Shareholder Rights
We are incorporated under the laws of Singapore. The following discussion summarizes material differences between the rights of holders of our ordinary shares and the rights of holders of the common stock of a typical corporation incorporated under the laws of the state of Delaware which result from differences in governing documents and the laws of Singapore and Delaware.
This discussion does not purport to be a complete statement of the rights of holders of our ordinary shares under applicable law in Singapore and our constitution or the rights of holders of the common stock of a typical corporation under applicable Delaware law and a typical certificate of incorporation and bylaws.
The Singapore Companies Act contains the default articles that apply to a Singapore-incorporated company to the extent they are not excluded or modified by a company’s constitution. They provide examples of the common provisions adopted by companies in their constitution. However, as is the usual practice for companies incorporated in Singapore, we have specifically excluded the application of these provisions in our constitution.
Delaware | Singapore—IC Power Pte. Ltd. | |
| Board of Directors | ||
| A typical certificate of incorporation and bylaws would provide that the number of directors on the board of directors will be fixed from time to time by a vote of the majority of the authorized directors. Under Delaware law, a board of directors can be divided into classes and cumulative voting in the election of directors is only permitted if expressly authorized in a corporation’s certificate of incorporation. | The constitution of companies will typically state the minimum and maximum number of directors as well as provide that the number of directors may be increased or reduced by shareholders via ordinary resolution passed at a general meeting, provided that the number of directors following such increase or reduction is within the maximum and minimum number of directors provided in our constitution and the Singapore Companies Act, respectively. Our constitution provides that, unless otherwise determined by a general meeting, the minimum number of directors is five and the maximum number is 12. | |
295
Table of Contents
Delaware | Singapore—IC Power Pte. Ltd. | |
| Limitation on Personal Liability of Directors | ||
| A typical certificate of incorporation provides for the elimination of personal monetary liability of directors for breach of fiduciary duties as directors to the fullest extent permissible under the laws of Delaware, except for liability (1) for any breach of a director’s loyalty to the corporation or its stockholders, (2) for acts or omissions not in good faith or which involve intentional misconduct or a knowing violation of law, (3) under Section 174 of the Delaware General Corporation Law (relating to the liability of directors for unlawful payment of a dividend or an unlawful stock purchase or redemption) or (4) for any transaction from which the director derived an improper personal benefit. A typical certificate of incorporation would also provide that if the Delaware General Corporation Law is amended so as to allow further elimination of, or limitations on, director liability, then the liability of directors will be eliminated or limited to the fullest extent permitted by the Delaware General Corporation Law as so amended. | Pursuant to the Singapore Companies Act, any provision (whether in the constitution, any contract or otherwise) exempting or indemnifying a director against any liability which by law would otherwise attach him in respect of any negligence, default, breach of duty or breach of trust of which he may be guilty in relation to us will be void. Nevertheless, a director may be released by our shareholders for breaches of duty to us, except in the case of fraud, illegality, insolvency and oppression or disregard of minority interests.
Our constitution provides that, subject to the provisions of the Singapore Companies Act and every other act for the time being in force concerning companies and affecting us, every director, auditor, secretary or other officer of us and our subsidiaries and affiliates shall be entitled to be indemnified by us against all liabilities incurred by him in the execution and discharge of his duties and where he serves at our request as a director, officer, employee or agent of any subsidiary or affiliate of ours or in relation thereto, including any liability incurred by him in defending any proceedings, whether civil or criminal, which relate to anything done or omitted or alleged to have been done or omitted by him as an officer or employee of ours, and in which judgment is given in his favor (or the proceedings otherwise disposed of without any finding or admission of any material breach of duty on his part) or in which he is acquitted, or in connection with an application under statute in respect of such act or omission in which relief is granted to him by the court.
For further details on the indemnification of directors under the Singapore Companies Act, see “—Indemnification of Officers, Directors and Employees” below. | |
| Interested Shareholders | ||
| Section 203 of the Delaware General Corporation Law generally prohibits a Delaware corporation from engaging in specified corporate transactions (such as mergers, stock and asset sales, and loans) with an “interested stockholder” for three years following the time that the stockholder becomes an interested stockholder. Subject to specified exceptions, an “interested stockholder” is a person or group that owns 15% or more of the corporation’s outstanding voting | There are no comparable provisions in Singapore with respect to public companies which are not listed on the Singapore Exchange Securities Trading Limited. | |
296
Table of Contents
Delaware | Singapore—IC Power Pte. Ltd. | |
stock (including any rights to acquire stock pursuant to an option, warrant, agreement, arrangement or understanding, or upon the exercise of conversion or exchange rights, and stock with respect to which the person has voting rights only), or is an affiliate or associate of the corporation and was the owner of 15% or more of the voting stock at any time within the previous three years.
A Delaware corporation may elect to “opt out” of, and not be governed by, Section 203 through a provision in either its original certificate of incorporation, or an amendment to its original certificate or bylaws that was approved by majority stockholder vote. With a limited exception, this amendment would not become effective until 12 months following its adoption. | ||
| Removal of Directors | ||
| A typical certificate of incorporation and bylaws provide that, subject to the rights of holders of any preferred stock, directors may be removed at any time by the affirmative vote of the holders of at least a majority, or in some instances a supermajority, of the voting power of all of the then outstanding shares entitled to vote generally in the election of directors, voting together as a single class. A certificate of incorporation could also provide that such a right is only exercisable when a director is being removed for cause (removal of a director only for cause is the default rule in the case of a classified board). | According to the Singapore Companies Act, directors of a public company may be removed before expiration of their term of office with or without cause by ordinary resolution (that is a resolution which is passed by a simple majority of those shareholders present and voting in person or by proxy). Notice of the intention to move such a resolution has to be given to us not less than 28 days before the meeting at which it is moved. We shall then give notice of such resolution to our shareholders not less than 14 days before the meeting. Where any director removed in this manner was appointed to represent the interests of any particular class of shareholders or debenture holders, the resolution to remove such director will not take effect until such director’s successor has been appointed.
Our constitution provides that we may, by ordinary resolution of which special notice has been given, remove any director before the expiration of his period of office, notwithstanding anything in our constitution or in any agreement between us and such director and appoint another person in place of the director so removed. | |
| Filling Vacancies on the Board of Directors | ||
| A typical certificate of incorporation and bylaws provide that, subject to the rights of the holders of any preferred stock, any vacancy, whether arising through death, resignation, retirement, disqualification, removal, an | The constitution of a Singapore company typically provides that the directors have the power to appoint any person to be a director, either to fill a vacancy or as an addition to the existing directors, but so that the | |
297
Table of Contents
Delaware | Singapore—IC Power Pte. Ltd. | |
| increase in the number of directors or any other reason, may be filled by a majority vote of the remaining directors, even if such directors remaining in office constitute less than a quorum, or by the sole remaining director. Any newly elected director usually holds office for the remainder of the full term expiring at the annual meeting of stockholders at which the term of the class of directors to which the newly elected director has been elected expires. | total number of directors will not at any time exceed the maximum number fixed in the constitution. Any newly elected director shall hold office until the next following annual general meeting, where such director will then be eligible for re-election. Our constitution provides that the shareholders may by ordinary resolution, or the directors may, appoint any person to be a director as an additional director or to fill a vacancy provided that any person so appointed by the directors will only hold office until the next annual general meeting, and will then be eligible for re-election. | |
| Amendment of Governing Documents | ||
| Under the Delaware General Corporation Law, amendments to a corporation’s certificate of incorporation require the approval of stockholders holding a majority of the outstanding shares entitled to vote on the amendment. If a class vote on the amendment is required by the Delaware General Corporation Law, a majority of the outstanding stock of the class is required, unless a greater proportion is specified in the certificate of incorporation or by other provisions of the Delaware General Corporation Law. Under the Delaware General Corporation Law, the board of directors may amend bylaws if so authorized in the charter. The stockholders of a Delaware corporation also have the power to amend bylaws. | Our constitution may be altered by special resolution (that is a resolution passed by at least a three-fourths majority of the shares entitled to vote, present in person or by proxy at a meeting for which not less than 21 days written notice is given). The board of directors has no right to amend the constitution. | |
| Meetings of Shareholders | ||
Annual and Special Meetings
Typical bylaws provide that annual meetings of stockholders are to be held on a date and at a time fixed by the board of directors. Under the Delaware General Corporation Law, a special meeting of stockholders may be called by the board of directors or by any other person authorized to do so in the certificate of incorporation or the bylaws. | Annual General Meetings
All companies are required to hold an annual general meeting once every calendar year. The first annual general meeting must be held within 18 months of our incorporation and subsequently, not more than 15 months may elapse between annual general meetings. | |
Quorum Requirements
Under the Delaware General Corporation Law, a corporation’s certificate of incorporation or bylaws can specify the number of shares which constitute the quorum required to conduct business at a meeting, provided that in no event shall a quorum consist of less than one-third of the shares entitled to vote at a meeting. | Extraordinary General Meetings
Any general meeting other than the annual general meeting is called an “extraordinary general meeting.” Two or more members (shareholders) holding not less than 10% of the total number of issued shares (excluding treasury shares) may call an extraordinary general meeting. In addition, the constitution usually also provides that general meetings may be convened in accordance with the Singapore Companies Act by the directors. | |
298
Table of Contents
Delaware | Singapore—IC Power Pte. Ltd. | |
Notwithstanding anything in the constitution, the directors are required to convene a general meeting if required to do so by requisition (that is written notice to directors requiring that a meeting be called) by shareholder(s) holding not less than 10% of our paid-up capital carrying voting rights.
Our constitution provides that the directors may, whenever they think fit, convene an extraordinary general meeting.
Quorum Requirements
Our constitution provides that shareholders entitled to vote holding in aggregate 331/3% of our total issued and paid-up shares, present in person or by proxy at a meeting, shall be a quorum. In the event a quorum is not present, the meeting may be adjourned for one week. | ||
| Indemnification of Officers, Directors and Employers | ||
Under the Delaware General Corporation Law, subject to specified limitations in the case of derivative suits brought by a corporation’s stockholders in its name, a corporation may indemnify any person who is made a party to any third-party action, suit or proceeding on account of being a director, officer, employee or agent of the corporation (or was serving at the request of the corporation in such capacity for another corporation, partnership, joint venture, trust or other enterprise) against expenses, including attorney’s fees, judgments, fines and amounts paid in settlement actually and reasonably incurred by him or her in connection with the action, suit or proceeding through, among other things, a majority vote of a quorum consisting of directors who were not parties to the suit or proceeding, if the person:
• acted in good faith and in a manner he or she reasonably believed to be in or not opposed to the best interests of the corporation or, in some circumstances, at least not opposed to its best interests; and
• in a criminal proceeding, had no reasonable cause to believe his or her conduct was unlawful.
Delaware corporate law permits indemnification by a corporation under similar circumstances for expenses | The Singapore Companies Act specifically allows us to indemnify our officers against liability incurred by the officers to a person other than the company, except when the indemnity is (1) against any liability of the officer to pay a fine in criminal proceedings, (2) a penalty in respect of non-compliance with any regulatory requirements, (3) any liability incurred by the officer in defending criminal proceedings in which he or she is convicted, (4) in civil proceedings brought by us or a related company in which judgment is given against the officer, or (5) in connection with an application for a relief from liability in which the court refuses to grant the officer relief. We are also allowed to provide funds to our directors to meet expenditures incurred or to be incurred by the director, or to enable him or her to avoid incurring expenditure in defending himself or herself in connection with any alleged negligence, default, breach of duty or breach of trust by him or her in relation to us: (1) in any criminal or civil proceedings, (2) in any investigation by a regulatory authority, (3) against any action proposed to be taken by a regulatory authority, or (4) in connection with an application for relief.
In cases where, inter alia, an officer is sued by us, the Singapore Companies Act gives the court the power to relieve directors either wholly or partially from the | |
299
Table of Contents
Delaware | Singapore—IC Power Pte. Ltd. | |
(including attorneys’ fees) actually and reasonably incurred by such persons in connection with the defense or settlement of a derivative action or suit, except that no indemnification may be made in respect of any claim, issue or matter as to which the person is adjudged to be liable to the corporation unless the Delaware Court of Chancery or the court in which the action or suit was brought determines upon application that the person is fairly and reasonably entitled to indemnity for the expenses which the court deems to be proper.
To the extent a director, officer, employee or agent is successful in the defense of such an action, suit or proceeding, the corporation is required by Delaware corporate law to indemnify such person for reasonable expenses incurred thereby. Expenses (including attorneys’ fees) incurred by such persons in defending any action, suit or proceeding may be paid in advance of the final disposition of such action, suit or proceeding upon receipt of an undertaking by or on behalf of that person to repay the amount if it is ultimately determined that that person is not entitled to be so indemnified. | consequences of their negligence, default, breach of duty or breach of trust. However, Singapore case law has indicated that such relief will not be granted to a director who has benefited as a result of his or her breach of trust. In order for relief to be obtained, it must be shown that (1) the director acted reasonably; (2) the director had acted honestly; and (3) it is fair, having regard to all the circumstances of the case including those connected with such director’s appointment, to excuse the director.
Our constitution provides that, subject to the provisions of the Singapore Companies Act and every other act for the time being in force concerning companies and affecting us, every director, auditor, secretary or other officer of ours and our subsidiaries and affiliates shall be entitled to be indemnified by us against all costs, interest, charges, losses, expenses and liabilities incurred by him in the execution and discharge of his duties and where he serves at our request as a director, officer, employee or agent of any subsidiary or affiliate of ours or in relation thereto, including any liability incurred by him in defending any proceedings, whether civil or criminal, which relate to anything done or omitted or alleged to have been done or omitted by him as a director, officer or employee or agent of ours, and in which judgment is given in his favor (or the proceedings otherwise disposed of without any finding or admission of any material breach of duty on his part) or in which he is acquitted, or in connection with an application under statute in respect of such act or omission in which relief is granted to him by the court. |
| Shareholder Approval of Business Combinations | ||
Generally, under the Delaware General Corporation Law, completion of a merger, consolidation, or the sale, lease or exchange of substantially all of a corporation’s assets or dissolution requires approval by the board of directors and by a majority (unless the certificate of incorporation requires a higher percentage) of outstanding stock of the corporation entitled to vote.
The Delaware General Corporation Law also requires a special vote of stockholders in connection with a business combination with an “interested stockholder” as defined in section 203 of the Delaware General Corporation Law. For further information on such provisions, see “—Interested Shareholders” above. | The Singapore Companies Act mandates that specified corporate actions require approval by the shareholders in a general meeting, notably:
• notwithstanding anything in our constitution, directors are not permitted to carry into effect any proposals for disposing of the whole or substantially the whole of our undertaking or property unless those proposals have been approved by shareholders in a general meeting;
• subject to the constitution of each amalgamating company, an | |
300
Table of Contents
Delaware | Singapore—IC Power Pte. Ltd. | |
amalgamation proposal must be approved by the shareholders of each amalgamating company via special resolution at a general meeting; and
• notwithstanding anything in our constitution, the directors may not, without the prior approval of shareholders, issue shares, including shares being issued in connection with corporate actions. | ||
| Shareholder Action Without a Meeting | ||
| Under the Delaware General Corporation Law, unless otherwise provided in a corporation’s certificate of incorporation, any action that may be taken at a meeting of stockholders may be taken without a meeting, without prior notice and without a vote if the holders of outstanding stock, having not less than the minimum number of votes that would be necessary to authorize such action, consent in writing. It is not uncommon for a corporation’s certificate of incorporation to prohibit such action. | There are no equivalent provisions under the Singapore Companies Act in respect of passing shareholders’ resolutions by written means that apply to public companies. | |
| Shareholder Suits | ||
| Under the Delaware General Corporation Law, a stockholder may bring a derivative action on behalf of the corporation to enforce the rights of the corporation. An individual also may commence a class action suit on behalf of himself or herself and other similarly situated stockholders where the requirements for maintaining a class action under the Delaware General Corporation Law have been met. A person may institute and maintain such a suit only if such person was a stockholder at the time of the transaction which is the subject of the suit or his or her shares thereafter devolved upon him or her by operation of law. Additionally, under Delaware case law, the plaintiff generally must be a stockholder not only at the time of the transaction which is the subject of the suit, but also through the duration of the derivative suit. The Delaware General Corporation Law also requires that the derivative plaintiff make a demand on the directors of the corporation to assert the corporate claim before the suit may be prosecuted by the derivative plaintiff, unless such demand would be futile. | Derivative actions
A shareholder may apply to the court for leave to bring an action in our name and on our behalf, irrespective of whether we are listed for quotation in the Singapore or overseas, or intervene in an action to which we are a party for the purpose of prosecuting, defending or discontinuing the action on our behalf.
Applications are generally made by our shareholders or individual directors, but courts are given the discretion to allow such persons as they deem proper to apply (e.g., beneficial owner of shares).
It should be noted that this provision of the Singapore Companies Act is primarily used by minority shareholders to bring an action in the name and on behalf of us or intervene in an action to which we are a party for the purpose of prosecuting, defending or discontinuing the action on our behalf.
Class actions
The concept of class action suits, which allows individual shareholders to bring an action seeking to | |
301
Table of Contents
Delaware | Singapore—IC Power Pte. Ltd. | |
represent the class or classes of shareholders, generally does not exist in Singapore. However, it is possible as a matter of procedure for a number of shareholders to lead an action and establish liability on behalf of themselves and other shareholders who join in or who are made parties to the action.
These shareholders are commonly known as “lead plaintiffs.” Further, there are circumstances under the provisions of certain Singapore statutes where shareholders may file and prove their claims for compensation in the event that we have been convicted of a criminal offense or has a court order for the payment of a civil penalty made against it. | ||
| Dividends or Other Distributions; Repurchases and Redemptions | ||
The Delaware General Corporation Law permits a corporation to declare and pay dividends out of statutory surplus or, if there is no surplus, out of net profits for the fiscal year in which the dividend is declared and/or for the preceding fiscal year as long as the amount of capital of the corporation following the declaration and payment of the dividend is not less than the aggregate amount of the capital represented by the issued and outstanding stock of all classes having a preference upon the distribution of assets.
Under the Delaware General Corporation Law, any corporation may purchase or redeem its own shares, except that generally it may not purchase or redeem these shares if the capital of the corporation is impaired at the time or would become impaired as a result of the redemption. A corporation may, however, purchase or redeem out of capital shares that are entitled upon any distribution of its assets to a preference over another class or series of its shares if the shares are to be retired and the capital reduced. | The Singapore Companies Act provides that no dividends may be paid to shareholders except out of profits.
The Singapore Companies Act does not provide a definition on when profits are deemed to be available for the purpose of paying dividends and this is accordingly governed by case law. Our constitution provides that no dividend may be paid otherwise than out of our profits.
Acquisition of a company’s own shares
The Singapore Companies Act generally prohibits a company from acquiring its own shares subject to certain exceptions. Any contract or transaction by which a company acquires or purports to acquire its own shares is void. However, provided that it is expressly permitted to do so by our constitution and subject to the special conditions of each permitted acquisition contained in the Singapore Companies Act, we may:
• redeem redeemable preference shares (the redemption of these shares will not reduce our capital). Preference shares may be redeemed out of capital if all the directors make a solvency statement in relation to such redemption in accordance with the Singapore Companies Act;
• whether or not we are listed on a securities exchange in Singapore or any securities exchange outside of | |
302
Table of Contents
Delaware | Singapore—IC Power Pte. Ltd. | |
Singapore, make an off-market purchase of our own shares if such off-market purchase is made in accordance with an equal access scheme authorized in advance at a general meeting;
• whether or not we are listed on a securities exchange in Singapore or any securities exchange outside Singapore, make a purchase or an acquisition of our own shares under a contingent purchase contract which has been authorized in advance at a general meeting by a special resolution;
• payment of some or all of the costs by a company listed on a securities exchange in Singapore or any securities exchange outside Singapore associated with scheme, arrangement or plan under which any shareholder of the company may purchase or sell shares for the sole purpose of rounding off any odd-lots which he owns; and
• give financial assistance if the giving of the assistance will not materially prejudice our interests or the interests of our shareholders, or our ability to pay our creditors subject to our satisfaction of certain conditions that are prescribed in the Singapore Companies Act.
We may also purchase our own shares by an order of a Singapore court.
The total number of ordinary shares that may be acquired by us in a relevant period may not exceed 20% of the total number of ordinary shares in that class as of the date of any resolution passed pursuant to the relevant share repurchase provisions under the Singapore Companies Act. Where, however, we have reduced our share capital by a special resolution or a Singapore court made an order to such effect, the total number of ordinary shares shall be taken to be the total number of ordinary shares in that class as altered by the special resolution or the order of the court. Payment must be made out of our distributable profits or capital, provided that we are solvent and we do not expect to have significant distributable profits at the time of the completion of the offering. |
303
Table of Contents
Delaware | Singapore—IC Power Pte. Ltd. | |
Financial assistance for the acquisition of shares
Under the Singapore Companies Act, a public company may not give financial assistance to any person whether directly or indirectly for the purpose of:
• the acquisition or proposed acquisition of our ordinary shares or units of such shares; or
• the acquisition or proposed acquisition of shares in our holding company or units of such shares.
Financial assistance may take the form of a loan, the giving of a guarantee, the provision of security, the release of an obligation, the release of a debt or otherwise.
However, it should be noted that we may provide financial assistance for the acquisition of our ordinary shares or shares in our holding company if it complies with the requirements (including approval by special resolution) set out in the Singapore Companies Act.
Our constitution provides that subject to the provisions of the Singapore Companies Act, we may purchase or otherwise acquire our own shares upon such terms and in such manner as we may from time to time think fit. These shares may be held as treasury shares or cancelled as provided in the Singapore Companies Act or dealt with in such manner as may be permitted under the Singapore Companies Act. On cancellation of the shares, the rights and privileges attached to those shares will expire. | ||
| Transactions with Officers and Directors | ||
| Under the Delaware General Corporation Law, some contracts or transactions in which one or more of a corporation’s directors has an interest are not void or voidable because of such interest provided that some conditions, such as obtaining the required approval and fulfilling the requirements of good faith and full disclosure, are met. Under the Delaware General Corporation Law, either (1) the stockholders or the board of directors must approve in good faith any such contract or transaction after full disclosure of the | Under the Singapore Companies Act, directors and chief executive officers are not prohibited from dealing with us, but where they have an interest in a transaction with us, that interest must be disclosed to the board of directors. In particular, every director and chief executive officer who is in any way, whether directly or indirectly, interested in a transaction or proposed transaction with us must, as soon as practicable after the relevant facts have come to the knowledge of the director or the chief | |
304
Table of Contents
Delaware | Singapore—IC Power Pte. Ltd. | |
| material facts or (2) the contract or transaction must have been “fair” as to the corporation at the time it was approved. If board approval is sought, the contract or transaction must be approved in good faith by a majority of disinterested directors after full disclosure of material facts, even though less than a majority of a quorum. | executive officer, as the case may be, declare the nature of such director’s or chief executive officer’s interest at a board of directors’ meeting.
In addition, every director and chief executive officer who holds any office or possesses any property whereby whether, directly or indirectly, duties or interests might be created in conflict with such director’s or chief executive officer’s duties or interests as director or chief executive officer, is required to declare the fact and the nature, character and extent of the conflict at a meeting of directors.
The Singapore Companies Act extends the scope of this statutory duty of a director or chief executive officer to disclose any interests by pronouncing that an interest of a member of a director’s or chief executive officer’s family (including spouse, son, adopted son, step-son, daughter, adopted daughter and stepdaughter) will be treated as an interest of the director or the chief executive officer, as the case may be.
There is however no requirement for disclosure where the interest of the director or chief executive officer consists only of being a member or creditor of a corporation which is interested in the proposed transaction with us if the interest may properly be regarded as immaterial. Where the proposed transaction relates to any loan to us, no disclosure need be made where the director has only guaranteed or joined in guaranteeing the repayment of such loan, unless our constitution provides otherwise. | |
Further, where the proposed transaction is to be made with or for the benefit of a related corporation (i.e. the holding company, subsidiary or subsidiary of a common holding company) no disclosure need be made of the fact that the director or chief executive officer is also a director or chief executive officer of that corporation, unless our constitution provides otherwise.
Subject to specified exceptions, the Singapore Companies Act prohibits us from (1) making a loan or a quasi-loan to our directors or to directors of our related corporations, or giving a guarantee or any security in connection with such a loan or quasi-loan (2) entering into a credit transaction as creditor for the benefit of our directors or directors of our related corporations, or giving a guarantee or any security in connection with such a credit transaction, (3) arranging an assignment to or assumption by us of | ||
305
Table of Contents
Delaware | Singapore—IC Power Pte. Ltd. | |
| any rights, obligations or liabilities under a transaction which, if it had been entered into by us, would have been a restricted transaction and (4) taking part in an arrangement under which another person enters into a transaction which, if entered into by us, would have been a restricted transaction and such person obtains a benefit from us or our related corporations pursuant thereto. Companies are also prohibited from doing any of the foregoing in relation to a director’s spouse or children (whether adopted or naturally or stepchildren), or giving a guarantee or security in connection with such a loan. | ||
| Dissenters’ Rights | ||
| Under the Delaware General Corporation Law, a stockholder of a corporation participating in some types of major corporate transactions may, under varying circumstances, be entitled to appraisal rights pursuant to which the stockholder may receive cash in the amount of the fair market value of his or her shares in lieu of the consideration he or she would otherwise receive in the transaction. | There are no equivalent provisions under the Singapore Companies Act. | |
| Cumulative Voting | ||
| Under the Delaware General Corporation Law, a corporation may adopt in its certificate of incorporation that its directors shall be elected by cumulative voting. When directors are elected by cumulative voting, a stockholder has the number of votes equal to the number of shares held by such stockholder times the number of directors nominated for election. The stockholder may cast all of such votes for one director or among the directors in any proportion. | There is no equivalent provision under the Singapore Companies Act in respect of companies incorporated in Singapore. | |
| Anti-Takeover Measures | ||
| Under the Delaware General Corporation Law, the certificate of incorporation of a corporation may give the board the right to issue new classes of preferred stock with voting, conversion, dividend distribution, and other rights to be determined by the board at the time of issuance, which could prevent a takeover attempt and thereby preclude shareholders from realizing a potential premium over the market value of their shares. | The constitution of a Singapore company typically provides that the company may allot and issue new shares of a different class with preferential, deferred, qualified or other special rights as its board of directors may determine with the prior approval of the company’s shareholders in a general meeting. Our constitution provides that our shareholders may grant to our board the general authority to issue such preference shares until the next general meeting. For further information, see “RiskFactors—Risks Related to our Corporate Structure—Our directors havegeneral authority to allot and issue new shares on terms and conditions and with any preferences, rights | |
306
Table of Contents
Delaware | Singapore—IC Power Pte. Ltd. | |
| or restrictions as may be determined by our board ofdirectors in its sole discretion,”and“Description of Share Capital—Constitution—Preference Shares.” | ||
| In addition, Delaware law does not prohibit a corporation from adopting a stockholder rights plan, or “poison pill,” which could prevent a takeover attempt and also preclude shareholders from realizing a potential premium over the market value of their shares. | Singapore law does not generally prohibit a corporation from adopting “poison pill” arrangements which could prevent a takeover attempt and also preclude shareholders from realizing a potential premium over the market value of their shares.
However, under the Singapore Code on Take-overs and Mergers, if, in the course of an offer, or even before the date of the offer announcement, the board of the offeree company has reason to believe that a bona fide offer is imminent, the board must not, except pursuant to a contract entered into earlier, take any action, without the approval of shareholders at a general meeting, on the affairs of the offeree company that could effectively result in any bona fide offer being frustrated or the shareholders being denied an opportunity to decide on its merits.
For further information on the Singapore Code on Take-overs and Mergers, including information relating to the waiver we have received from the Securities Industry Council of Singapore; see “Description of Share Capital—Constitution—Takeovers.” | |
Exchange Listing
We are in the process of applying for the listing of our ordinary shares on the NYSE under the ticker symbol “ICP.”
Transfer Agent and Registrar
The transfer agent and registrar for our ordinary shares is Computershare Trust Company, N.A.
307
Table of Contents
SHARES ELIGIBLE FOR FUTURE SALE
We are issuing ordinary shares in this offering, assuming no exercise of the underwriters’ option to purchase additional shares, representing approximately % of our total outstanding ordinary shares (after giving effect to this offering). All of the ordinary shares sold in this offering will be freely transferable by persons other than our “affiliates” without restriction or further registration under the Securities Act. Sales of substantial amounts of our ordinary shares in the public market could adversely affect prevailing market prices of our ordinary shares. Prior to this offering, there has been no public market for our ordinary shares, and although we are in the process of applying to list our ordinary shares on the NYSE, we cannot assure you that a regular trading market will develop in the ordinary shares.
Lock-up Agreements
We, our executive officers and directors and Kenon, our controlling shareholder, have entered into lock-up agreements with the representatives of the underwriters. Pursuant to such lock-up agreements, such persons have agreed that, subject to certain exceptions, from the date of this prospectus continuing through the date 180 days after the date of this prospectus, they will not offer, pledge, sell, agree to sell, directly or indirectly, or otherwise dispose of any ordinary shares or any securities convertible or exchangeable for our ordinary shares, without the prior written consent of the representatives.
Rule 144
All of our ordinary shares outstanding prior to this offering may be sold publicly in the United States only if they are subject to an effective registration statement under the Securities Act or pursuant to an exemption from the registration requirement such as those provided by Rule 144 and Rule 701 promulgated under the Securities Act. In general, under Rule 144 as currently in effect, beginning 90 days after the date of this prospectus, a person (or persons whose shares are aggregated) who at the time of a sale is not, and has not been during the three months preceding the sale, an affiliate of us and, in the case of our ordinary shares that are restricted securities, has beneficially owned our restricted securities for at least six months will be entitled to sell the restricted securities without registration under the Securities Act, subject only to the availability of current public information about us, and will be entitled to sell restricted securities beneficially owned for at least one year without restriction. Persons who are our affiliates and have beneficially owned our restricted securities for at least six months may sell within any three-month period a number of restricted securities that does not exceed the greater of the following:
| • | 1% of the number of our ordinary shares then outstanding which will equal approximately shares immediately after this offering, assuming the underwriters do not exercise their option to purchase additional ordinary shares; and |
| • | the average weekly trading volume of our ordinary shares on the NYSE during the four calendar weeks preceding the date on which notice of the sale is filed with the SEC. |
Sales by our affiliates under Rule 144 are also subject to certain requirements relating to manner of sale, notice and the availability of current public information about us.
Rule 701
In general, under Rule 701 under the Securities Act as currently in effect, each of our employees, consultants or advisors who purchases our ordinary shares from us in connection with a compensatory stock plan or other written agreement executed prior to the completion of this offering is eligible to resell such ordinary shares in reliance on Rule 144 under the Securities Act, but without compliance with some of the restrictions, including the holding period, contained in Rule 144 under the Securities Act.
308
Table of Contents
Registration Rights Agreement
In connection with the initial public offering of our ordinary shares, we expect to enter into a registration rights agreement with Kenon with regard to the shares that will be owned by Kenon, as well as in respect of any shares which Kenon may receive or acquire during the term of such agreement (all such shares, the Registrable Securities). Under the registration rights agreement, Kenon will have the right to cause us to register under the Securities Act, and other applicable laws, the offer and sale by Kenon of the Registrable Securities. Subject to the terms and conditions of our registration rights agreement, this registration right will allow Kenon or certain qualified assignees of Kenon holding any Registrable Securities to require registration of such Registrable Securities and to include any such Registrable Securities in a registration by us of ordinary shares, including ordinary shares offered by us or by any other shareholder. In connection with any registration of ordinary shares held by Kenon or certain qualified assignees of Kenon, we will agree to indemnify Kenon and its officers, directors and controlling persons from and against any liabilities under the Securities Act or otherwise arising from the registration statement or prospectus. We will agree to bear all costs and expenses incidental to any registration, excluding any underwriting discounts.
The foregoing summary of the registration rights agreements is subject to, and is qualified in its entirety by, the full text of our registration rights agreement with Kenon, a copy of which has been filed as an exhibit to the registration statement of which this prospectus is a part and is incorporated by reference herein.
309
Table of Contents
U.S. Federal Income Tax Considerations
The following discussion is a summary of U.S. federal income tax considerations generally applicable to the acquisition, ownership and disposition of our ordinary shares under the United States Internal Revenue Code of 1986, as amended, or the Code. Unless otherwise stated, this description addresses only the U.S. federal income tax consequences to U.S. Holders (as defined below) that are initial purchasers of our ordinary shares pursuant to the offering and that will hold such ordinary shares as capital assets (generally, property held for investment). This description does not address tax considerations applicable to holders that may be subject to special tax rules, including, without limitation:
| • | banks, financial institutions or insurance companies; |
| • | real estate investment trusts, regulated investment companies or grantor trusts; |
| • | dealers or traders in securities, commodities or currencies; |
| • | tax-exempt entities or organizations, including individual retirement accounts; |
| • | certain former citizens or long-term residents of the U.S.; |
| • | persons that received our ordinary shares as compensation for the performance of services; |
| • | persons that will hold our ordinary shares as part of a “hedging,” “integrated” or “conversion” transaction or as a position in a “straddle” for U.S. federal income tax purposes; |
| • | entities classified as partnerships for U.S. federal income tax purposes or other pass-through entities, or holders that will hold our ordinary shares through such an entity; |
| • | U.S. Holders whose “functional currency” is not the U.S. Dollar; or |
| • | holders that own or have owned directly or indirectly 10.0% or more of the voting power or value of our ordinary shares. |
Moreover, this description does not address the U.S. federal estate, gift or alternative minimum tax consequences, or any state, local or foreign tax consequences, of the acquisition, ownership and disposition of our ordinary shares.
This description is based on the Code existing, proposed and temporary U.S. Treasury Regulations and judicial and administrative interpretations thereof, in each case as in effect and available on the date hereof. All of the foregoing is subject to change, which change could apply retroactively and could affect the tax consequences described below. The U.S. Internal Revenue Service, or the IRS, may take a different position concerning the tax consequences of the acquisition, ownership and disposition of our ordinary shares and such a position may be sustained. Holders should consult their tax advisers concerning the U.S. federal, state, local and foreign tax consequences of purchasing, owning and disposing of our ordinary shares in their particular circumstances.
For purposes of this description, a “U.S. Holder” is a beneficial owner of our ordinary shares that, for U.S. federal income tax purposes, is:
| • | a citizen or resident of the U.S.; |
| • | an entity treated as a corporation for U.S. federal income tax purposes created or organized in or under the laws of the U.S. or any state thereof, including the District of Columbia; |
310
Table of Contents
| • | an estate the income of which is subject to U.S. federal income taxation regardless of its source; or |
| • | a trust if such trust has validly elected to be treated as a U.S. person for U.S. federal income tax purposes or if (1) a court within the U.S. is able to exercise primary supervision over its administration and (2) one or more U.S. persons have the authority to control all of the substantial decisions of such trust. |
If an entity treated as a partnership for U.S. federal income tax purposes holds our ordinary shares, the tax treatment of a partner in such partnership will generally depend on the status of the partner and the activities of the partnership. Such a partner or partnership should consult its tax advisor as to the particular U.S. federal income tax consequences of acquiring, owning and disposing of our ordinary shares in its particular circumstance.
Unless otherwise indicated, this discussion assumes that the Company is not, and will not become, a passive foreign investment company, or a “PFIC”, for U.S. federal income tax purposes. See “—Passive Foreign Investment Company Considerations” below.
HOLDERS SHOULD CONSULT THEIR TAX ADVISORS WITH RESPECT TO THE U.S. FEDERAL, STATE, LOCAL AND FOREIGN TAX CONSEQUENCES OF ACQUIRING, OWNING AND DISPOSING OF OUR ORDINARY SHARES.
Distributions
The gross amount of any distribution made to U.S. Holders with respect to our ordinary shares before reduction for any Singaporean taxes withheld therefrom will generally be includible in income as ordinary dividend income to the extent such distribution is paid out of our current or accumulated earnings and profits as determined under U.S. federal income tax principles. To the extent that the amount of any distribution exceeds our current and accumulated earnings and profits, it will be treated first as a tax-free return of basis in our ordinary shares and thereafter as capital gain. We do not expect to maintain calculations of our earnings and profits under U.S. federal income tax principles. Therefore, U.S. Holders should expect that the entire amount of any distribution generally will be reported as ordinary dividend income. Non-corporate U.S. Holders may qualify for the lower rates of taxation applicable to “qualified dividend income” provided that such Holders satisfy holding period requirements and do not engage in hedging transactions, and provided that the Company is not a PFIC for the taxable year in which it pays a dividend, or during the preceding taxable year. Dividends will not be eligible for the dividends received deduction generally allowed to corporate U.S. Holders.
Sale, Exchange or Other Disposition of Ordinary Shares
U.S. Holders will recognize gain or loss on the sale, exchange or other disposition of our ordinary shares equal to the difference between the amount realized on such sale, exchange or other disposition and their adjusted tax basis in our ordinary shares, which gain or loss will be long-term capital gain or loss if the shares were held for more than one year at the time of disposition. The adjusted tax basis in an ordinary share generally will be equal to the cost of such ordinary share. Long-term capital gains are generally eligible for a preferential rate of taxation for certain non-corporate U.S. Holders. The deductibility of capital losses for U.S. federal income tax purposes is subject to limitations under the Code.
Passive Foreign Investment Company Considerations
If we were to be classified as a PFIC in any taxable year, a U.S. Holder would be subject to special rules generally intended to reduce or eliminate any benefits from the deferral of U.S. federal income tax that a U.S. Holder could derive from investing in a non-U.S. company that does not distribute all of its earnings on a current basis.
311
Table of Contents
A non-U.S. corporation will be classified as a PFIC for federal income tax purposes in any taxable year in which, after applying certain look-through rules with respect to the income and assets of subsidiaries, either:
| • | at least 75% of its gross income is “passive income”; or |
| • | at least 50% of the average quarterly value of its total gross assets is attributable to assets that produce “passive income” or are held for the production of passive income. |
Passive income for this purpose generally includes dividends, interest, royalties, rents, gains from commodities and securities transactions, and the excess of gains over losses from the disposition of assets which produce passive income. If a non-U.S. corporation owns at least 25% by value of the stock of another corporation, the non-U.S. corporation is treated for purposes of the PFIC tests as owning its proportionate share of the assets of the other corporation and as receiving directly its proportionate share of the other corporation’s income. For publicly traded corporations, the PFIC asset test described above is applied using the fair market value of the non-U.S. corporation’s assets. If we are classified as a PFIC in any year with respect to which a U.S. Holder owns our ordinary shares, we will generally continue to be treated as a PFIC with respect to such U.S. Holder in all succeeding years during which the U.S. Holder owns our ordinary shares, regardless of whether we continue to meet the tests described above, unless certain elections are made by the U.S. Holder.
Based on our analysis of our source and amounts of our gross income, the composition of our gross assets, our intended use of proceeds of this offering, and the nature of our business, we believe that we were not a PFIC for the taxable year ended December 31, 2015, and do not expect to be classified as a PFIC for the taxable year ending December 31, 2016. However, because PFIC status is based on our income, assets and activities for the entire taxable year, it is not possible to determine whether we will be characterized as a PFIC for the 2016 taxable year until after the close of the taxable year. Moreover, we must determine our PFIC status annually based on tests which are factual in nature, and our status in future years will depend on our income, assets and activities in each of those years, including, potentially, on how quickly we are able to utilize the cash proceeds from this offering in our business. There can be no assurance that we will not be considered a PFIC for any taxable year.
If a U.S. Holder owns ordinary shares during any year in which we are a PFIC, the U.S. Holder generally will be required to file an IRS Form 8621 (Information Return by a Shareholder of a Passive Foreign Investment Company or Qualified Electing Fund) with respect to the company, generally with the U.S. Holder’s federal income tax return for that year.
If we were a PFIC, certain information reporting consequences may apply and certain elections (including a mark-to-market election) may be available to U.S. Holders with respect to our ordinary shares that may mitigate some of the adverse tax consequences resulting from PFIC treatment. U.S. Holders should consult their tax advisors regarding whether we are a PFIC and the potential application of the PFIC rules.
Foreign Asset Reporting
Individual U.S. Holders with over $50,000 in foreign financial assets may be required to report information relating to an interest in our ordinary shares by filing IRS Form 8938 (Statement of Specified Foreign Financial Assets) with their federal income tax return. U.S. Holders are urged to consult their tax advisors regarding their information reporting obligations, if any, with respect to their ownership and disposition of our ordinary shares.
Non-U.S. Holders
A “Non-U.S. Holder” is a beneficial owner of our ordinary shares that is neither a U.S. Holder nor an entity treated as a partnership for U.S. federal income tax purposes.
312
Table of Contents
A non-U.S. Holder generally will not be subject to U.S. federal income or withholding tax on dividends received on ordinary shares, unless such holder conducts a trade or business in the U.S. and such income is effectively connected with that trade or business (or, if required by an applicable income tax treaty, the dividends are attributable to a permanent establishment or fixed base that such holder maintains in the U.S.).
A non-U.S. Holder generally will not be subject to U.S. federal income or withholding tax on any gain realized on the sale or exchange of such ordinary shares unless:
| • | such gain is effectively connected with conduct of a trade or business in the U.S. (or, if required by an applicable income tax treaty, the gain is attributable to a permanent establishment or fixed base that such holder maintains in the U.S.); or |
| • | such holder is an individual and has been present in the U.S. for 183 days or more in the taxable year of such sale or exchange, and certain other conditions are met. |
THE ABOVE DESCRIPTION IS NOT INTENDED TO CONSTITUTE A COMPLETE ANALYSIS OF ALL TAX CONSEQUENCES RELATING TO ACQUISITION, OWNERSHIP AND DISPOSITION OF OUR ORDINARY SHARES. HOLDERS SHOULD CONSULT THEIR TAX ADVISORS CONCERNING THE TAX CONSEQUENCES OF THEIR PARTICULAR SITUATION.
Singapore Tax Considerations
The following discussion is a summary of Singapore income tax, goods and services tax, or GST and stamp duty considerations relevant to the acquisition, ownership and disposition of our ordinary shares by an investor who is not tax resident or domiciled in Singapore and who does not carry on business or otherwise have a presence in Singapore. The statements made herein regarding taxation are general in nature and based upon certain aspects of the current tax laws of Singapore and administrative guidelines issued by the relevant authorities in force as of the date hereof and are subject to any changes in such laws or administrative guidelines or the interpretation of such laws or guidelines occurring after such date, which changes could be made on a retrospective basis. The statements made herein do not purport to be a comprehensive or exhaustive description of all of the tax considerations that may be relevant to a decision to acquire, own or dispose of our ordinary shares and do not purport to deal with the tax consequences applicable to all categories of investors, some of which (such as dealers in securities) may be subject to special rules. Prospective shareholders are advised to consult their own tax advisers as to the Singapore or other tax consequences of the acquisition, ownership of or disposal of our ordinary shares, taking into account their own particular circumstances. The statements below are based upon the assumption that we are tax resident in Singapore for Singapore income tax purposes. It is emphasized that neither we nor any other persons involved in this prospectus accepts responsibility for any tax effects or liabilities resulting from the acquisition, holding or disposal of our ordinary shares.
Income Taxation Under Singapore Law
Dividends with Respect to Ordinary Shares
Under the one-tier corporate tax system which currently applies to all Singapore tax resident companies, tax on corporate profits is final, and dividends paid by a Singapore tax resident company will be exempt from further Singapore tax in the hands of a shareholder, whether or not the shareholder is a company or an individual and whether or not the shareholder is a Singapore tax resident.
Capital Gains upon Disposition of Ordinary Shares
Under Singapore’s territorial basis of taxation, only income which is sourced in Singapore or received in Singapore from outside Singapore (foreign-sourced) will fall within Singapore’s income tax net.
313
Table of Contents
There is no capital gains tax in Singapore. There are no specific laws or regulations which deal with the characterization of whether a gain is income or capital in nature. Gains arising from the disposal of our ordinary shares may be construed to be of an income nature and subject to Singapore income tax, if they arise from activities which the Inland Revenue Authority of Singapore regards as the carrying on of a trade or business in Singapore. However, under Singapore income tax laws, any gains derived by a divesting company from its disposal of ordinary shares in an investee company between June 1, 2012 and May 31, 2022 (both dates inclusive) are generally not taxable if immediately prior to the date of the relevant disposal, the investing company has held at least 20% of the ordinary shares in the investee company for a continuous period of at least 24 months.
Notwithstanding the above, with respect to gains on disposal derived by foreign investors, there may be grounds to support an offshore claim (so that such claims will not be subject to Singapore income tax) if: (1) the foreign investor is not a tax resident in Singapore; (2) the foreign investor does not maintain a permanent establishment in Singapore, to which the divestment gains may effectively be connected; and (3) the entire process (including the negotiation, deliberation, execution of the acquisition and sale, etc.) leading up to the actual acquisition and sale of the shares is performed outside of Singapore.
Goods and Services Tax
The issue or transfer of ownership of our ordinary shares would be exempt from Singapore GST. Hence, the holders would not incur any GST on the subscription or subsequent transfer of the shares.
Stamp Duty
Where our ordinary shares evidenced in certificated forms are disposed of and the instrument of transfer is executed in Singapore, stamp duty is payable on the instrument of transfer at the rate of 0.2% of the consideration for or market value of our ordinary shares, whichever is higher.
Where such instrument of transfer is executed outside Singapore or no instrument of transfer is executed, no stamp duty is payable on the acquisition of our ordinary shares. However, stamp duty will be payable if such instrument of transfer is executed outside Singapore and is received in Singapore.
The instrument of transfer for our ordinary shares evidenced in certificated forms must be stamped within 14 days of execution if such instrument of transfer is executed in Singapore, or, within 30 days after receiving such instrument of transfer in Singapore if such instrument of transfer is executed outside of Singapore. The stamp duty is borne by the purchaser unless there is an agreement to the contrary.
However, on the basis that any transfer instruments in respect of our ordinary shares traded on the NYSE are executed outside Singapore through our transfer agent and share registrar in the United States for registration in our branch share register maintained in the United States (without any transfer instruments being received in Singapore), there should be no stamp duty payable in Singapore on such transfers.
Tax Treaties Regarding Withholding Taxes
There is no comprehensive avoidance of double taxation agreement between the United States and Singapore which applies to withholding taxes on dividends or capital gains.
314
Table of Contents
Merrill Lynch, Pierce, Fenner & Smith Incorporated and Credit Suisse Securities (USA) LLC are acting as representatives, or the representatives, of each of the underwriters named below. Subject to the terms and conditions set forth in an underwriting agreement, we have agreed to sell to the underwriters, and each of the underwriters has agreed, severally and not jointly, to purchase from us, the number of our ordinary shares set forth opposite its name below.
| Underwriter | Number | |||
Merrill Lynch, Pierce, Fenner & Smith | ||||
Credit Suisse Securities (USA) LLC | ||||
Goldman, Sachs & Co. | ||||
UBS Securities LLC | ||||
HSBC Securities (USA) Inc. | ||||
Scotia Capital (USA) Inc. | ||||
Credicorp Capital Sociedad Agente de Bolsa S.A.1 | ||||
|
| |||
Total | ||||
|
| |||
| 1. | Credicorp Capital Sociedad Agente de Bolsa S.A., one of the underwriters, is not a broker-dealer registered with the SEC and therefore may not make sales of our ordinary shares in the United States or to U.S. persons. To the extent that Credicorp Capital Sociedad Agente de Bolsa S.A. intends to make sales of our ordinary shares, it will only make such sales outside the United States to certain non-U.S. persons. |
Subject to the terms and conditions set forth in the underwriting agreement, the underwriters have agreed, severally and not jointly, to purchase all of our ordinary shares sold under the underwriting agreement if any of these ordinary shares are purchased. If an underwriter defaults, the underwriting agreement provides that the purchase commitments of the non-defaulting underwriters may be increased or the underwriting agreement may be terminated.
We and ICP have agreed to indemnify the several underwriters against certain liabilities, including liabilities under the Securities Act, or to contribute to payments the underwriters may be required to make in respect of those liabilities.
The underwriters are offering our ordinary shares, subject to prior sale, when, as and if issued to and accepted by them, subject to approval of legal matters by their counsel, including the validity of our ordinary shares, and other conditions contained in the underwriting agreement, such as the receipt by the underwriters of officer’s certificates and legal opinions. The underwriters reserve the right to withdraw, cancel or modify offers to the public and to reject orders in whole or in part.
In connection with any offers and sales of our ordinary shares, the underwriters may offer and sell our ordinary shares outside the United States through any of their respective affiliates that are qualified to make offers and sales of securities in jurisdictions outside the United States.
Commissions and Discounts
The representatives have advised us that the underwriters propose initially to offer our ordinary shares to the public at the public offering price set forth on the cover page of this prospectus and to dealers at that price less a concession not in excess of $ per ordinary share. After the initial offering, the public offering price, concession or any other term of the offering may be changed.
315
Table of Contents
The following table shows the public offering price, underwriting discount and proceeds before expenses to us. The information assumes either no exercise or full exercise by the underwriters of their option to purchase additional ordinary shares.
| Per Ordinary Share | Without Option | With Option | ||||||||||
Public offering price | $ | $ | $ | |||||||||
Underwriting discount | $ | $ | $ | |||||||||
Proceeds, before expenses, to IC Power | $ | $ | $ | |||||||||
The expenses of the offering, not including the underwriting discount, are estimated at $ and are payable by us.
Option to Purchase Additional Ordinary Shares
We have granted an option to the underwriters, exercisable for 30 days after the date of this prospectus, to purchase up to additional ordinary shares at the public offering price, less the underwriting discount. If the underwriters exercise this option, each will be obligated, subject to conditions contained in the underwriting agreement, to purchase a number of additional ordinary shares proportionate to that underwriter’s initial amount reflected in the above table.
No Sales of Similar Securities
We, our controlling shareholder, Kenon, and our executive officers and directors have agreed not to sell or transfer any of our ordinary shares or securities convertible into, exchangeable for, exercisable for, or repayable with our ordinary shares, for 180 days after the date of this prospectus without first obtaining the prior written consent of the representatives. Specifically, we and these other persons have agreed, with certain limited exceptions, not to directly or indirectly:
| • | offer, pledge, sell or contract to sell any of our ordinary shares; |
| • | sell any option or contract to purchase any of our ordinary shares; |
| • | purchase any option or contract to sell any of our ordinary shares; |
| • | grant any option, right or warrant to purchase any of our ordinary shares; |
| • | lend or otherwise dispose of or transfer any of our ordinary shares; |
| • | exercise any right with respect to the registration of our ordinary shares or file or cause to be filed any registration statement under the Securities Act related to our ordinary shares; or |
| • | enter into any swap or other agreement that transfers, in whole or in part, directly or indirectly, the economic consequence of ownership of any of our ordinary shares; |
in each case, whether any such swap or transaction is to be settled by delivery of our ordinary shares or other securities, in cash or otherwise.
This lock-up provision applies to our ordinary shares and to securities convertible into or exchangeable or exercisable for or repayable with our ordinary shares. It also applies to our ordinary shares owned now or acquired later by the person subject to this lock-up provision or for which the person subject to this lock-up provision later acquires the power of disposition.
316
Table of Contents
This lock-up provision does not apply to the following:
| • | the sale of our ordinary shares to the underwriters in the offering; |
| • | transfers of our ordinary shares: (1) as a bona fide gift or gifts; (2) to any trust for the direct or indirect benefit of the transferor or their immediate family (for purposes of this provision, ‘‘immediate family’’ shall mean any relationship by blood, marriage or adoption, not more remote than first cousin); (3) as a distribution to limited partners or stockholders of the transferor; or (4) to the affiliates of or to any investment fund or other entity controlled or managed by the transferor; provided in each case that (1) the representatives receive a signed lock-up agreement for the balance of the lock-up period from each donee, trustee, distributee, or transferee, (2) any such transfer shall not involve a disposition for value, and (3) no public filing or report by any party (including, the donor, the donee, transferor or transferee) under the Exchange Act or any other U.S., state or foreign securities laws or regulations or other public announcement in any jurisdiction shall be required or shall be made voluntarily regarding such transfer; and |
| • | sales of our ordinary shares acquired in open market transactions after completion of this offering; provided that no public filing or report by any party (including the transferor or transferee under the Exchange Act or any other U.S., state or foreign securities laws or regulations or other public announcement in any jurisdiction shall be required or shall be made voluntarily regarding such sales. |
New York Stock Exchange Listing
We are in the process of applying to list our ordinary shares on the NYSE, under the symbol “ICP.” In order to meet the requirements for listing on that exchange, the underwriters have undertaken to sell a minimum number of our ordinary shares to a minimum number of beneficial owners as required by that exchange.
Before this offering, there has been no public market for our ordinary shares. The initial public offering price will be determined through negotiations among us and the underwriters. In addition to prevailing market conditions, the factors to be considered in determining the initial public offering price are
| • | the valuation multiples of publicly traded companies that the underwriters believe to be comparable to us, |
| • | our financial information, |
| • | the history of, and the prospects for, our Company and the industry in which we compete, |
| • | an assessment of our management, its past and present operations, and the prospects for, and timing of, our future revenues, |
| • | the present state of our development, and |
| • | the above factors in relation to market values and various valuation measures of other companies engaged in activities similar to ours. |
An active trading market for our ordinary shares may not develop. It is also possible that after the offering our ordinary shares will not trade in the public market at or above the initial public offering price.
The underwriters do not expect to sell more than 5% of our ordinary shares in the aggregate to accounts over which they exercise discretionary authority.
317
Table of Contents
Price Stabilization, Short Positions and Penalty Bids
Until the distribution of our ordinary shares is completed, SEC rules may limit underwriters and selling group members from bidding for and purchasing our ordinary shares. However, the representatives may engage in transactions that stabilize the price of our ordinary shares, such as bids or purchases to peg, fix or maintain that price.
In connection with the offering, the underwriters may purchase and sell our ordinary shares in the open market. These transactions may include short sales, purchases on the open market to cover positions created by short sales and stabilizing transactions. Short sales involve the sale by the underwriters of a greater number of our ordinary shares than they are required to purchase in the offering. “Covered” short sales are sales made in an amount not greater than the underwriters’ option to purchase additional ordinary shares described above. The underwriters may close out any covered short position by either exercising their option to purchase additional ordinary shares or purchasing our ordinary shares in the open market. In determining the source of our ordinary shares to close out the covered short position, the underwriters will consider, among other things, the price of our ordinary shares available for purchase in the open market as compared to the price at which they may purchase our ordinary shares through the option granted to them. “Naked” short sales are sales in excess of such option. The underwriters must close out any naked short position by purchasing our ordinary shares in the open market. A naked short position is more likely to be created if the underwriters are concerned that there may be downward pressure on the price of our ordinary shares in the open market after pricing that could adversely affect investors who purchase in the offering. Stabilizing transactions consist of various bids for or purchases of our ordinary shares made by the underwriters in the open market prior to the completion of the offering.
The underwriters may also impose a penalty bid. This occurs when a particular underwriter repays to the underwriters a portion of the underwriting discount received by it because the representatives have repurchased shares sold by or for the account of such underwriter in stabilizing or short covering transactions.
Similar to other purchase transactions, the underwriters’ purchases to cover the syndicate short sales may have the effect of raising or maintaining the market price of our ordinary shares or preventing or retarding a decline in the market price of our ordinary shares. As a result, the price of our ordinary shares may be higher than the price that might otherwise exist in the open market. The underwriters may conduct these transactions on the New York Stock Exchange, in the over-the-counter market or otherwise.
Neither we nor any of the underwriters make any representation or prediction as to the direction or magnitude of any effect that the transactions described above may have on the price of our ordinary shares. In addition, neither we nor any of the underwriters make any representation that the representatives will engage in these transactions or that these transactions, once commenced, will not be discontinued without notice.
Electronic Distribution
In connection with the offering, certain of the underwriters or securities dealers may distribute prospectuses by electronic means, such as e-mail.
Other Relationships
The underwriters and their respective affiliates are full service financial institutions engaged in various activities, which may include sales and trading, commercial and investment banking, advisory, investment management, investment research, principal investment, hedging, market making, brokerage and other financial and non-financial activities and services. Certain of the underwriters and their respective affiliates have provided, and may in the future provide, a variety of these services to us and to persons and entities with relationships with us, for which they received or will receive customary fees and expenses. In the ordinary course of their various business activities, the underwriters and their respective affiliates, officers, directors and employees may
318
Table of Contents
purchase, sell or hold a broad array of investments and actively trade securities, derivatives, loans, commodities, currencies, credit default swaps and other financial instruments for their own account and for the accounts of their customers, and such investment and trading activities may involve or relate to our assets, securities and/or instruments (directly, as collateral securing other obligations or otherwise) and/or persons and entities with relationships with us. The underwriters and their respective affiliates may also communicate independent investment recommendations, market color or trading ideas and/or publish or express independent research views in respect of such assets, securities or instruments and may at any time hold, or recommend to clients that they should acquire, long and/or short positions in such assets, securities and instruments. In addition, (1) Credit Suisse has recently provided lending and other financial services to various of our affiliates, (2) an affiliate of Credicorp Capital Sociedad Agente de Bolsa S.A. has provided lending and other financial services to four of our subsidiaries, (3) HSBC provides lending and other financial services to two of our affiliates in connection with ongoing projects, and (4) the Bank of Nova Scotia has provided lending services to five of our affiliates and other financial services in connection with financings to our affiliates.
Selling Restrictions
Our ordinary shares offered by this prospectus may not be offered or sold, directly or indirectly, nor may this prospectus or any other offering material or advertisements in connection with the offer and sale of any such securities be distributed or published in any jurisdiction, except under circumstances that will result in compliance with the applicable rules and regulations of that jurisdiction. Persons into whose possession this prospectus comes are advised to inform themselves about and to observe any restrictions relating to the offering and the distribution of this prospectus. This prospectus does not constitute an offer to sell or a solicitation of an offer to buy any of our ordinary shares offered by this prospectus in any jurisdiction in which such an offer or a solicitation is unlawful.
Notice to Prospective Investors in the European Economic Area
In relation to each member state of the European Economic Area, or Member State, no offer of our ordinary shares which are the subject of the offering has been, or will be made to the public in that Member State, other than under the following exemptions under the Prospectus Directive (as defined below):
(a) to any legal entity which is a qualified investor as defined in the Prospectus Directive;
(b) to fewer than 150 natural or legal persons (other than qualified investors as defined in the Prospectus Directive), subject to obtaining the prior consent of the representatives for any such offer; or
(c) in any other circumstances falling within Article 3(2) of the Prospectus Directive,
provided that no such offer of our ordinary shares referred to in (a) to (c) above shall result in a requirement for the Company or any underwriter to publish a prospectus pursuant to Article 3 of the Prospectus Directive, or supplement a prospectus pursuant to Article 16 of the Prospectus Directive.
Each person located in a Member State to whom any offer of our ordinary shares is made or who receives any communication in respect of an offer of our ordinary shares, or who initially acquires any of our ordinary shares will be deemed to have represented, warranted, acknowledged and agreed to and with each underwriter and the Company that (1) it is a “qualified investor” within the meaning of the law in that Member State implementing Article 2(1)(e) of the Prospectus Directive; and (2) in the case of any of our ordinary shares acquired by it as a financial intermediary as that term is used in Article 3(2) of the Prospectus Directive, our ordinary shares acquired by it in the offer have not been acquired on behalf of, nor have they been acquired with a view to their offer or resale to, persons in any Member State other than qualified investors, as that term is defined in the Prospectus Directive, or in circumstances in which the prior consent of the representatives has been given to the offer or resale; or where our ordinary shares have been acquired by it on behalf of persons in any Member State other than qualified investors, the offer of those ordinary shares to it is not treated under the Prospectus Directive as having been made to such persons.
319
Table of Contents
The Company, the underwriters and their respective affiliates will rely upon the truth and accuracy of the foregoing representations, acknowledgments and agreements.
This prospectus has been prepared on the basis that any offer of our ordinary shares in any Member State will be made pursuant to an exemption under the Prospectus Directive from the requirement to publish a prospectus for offers of our ordinary shares. Accordingly any person making or intending to make an offer in that Member State of our ordinary shares which are the subject of the offering contemplated in this prospectus may only do so in circumstances in which no obligation arises for the Company or any of the underwriters to publish a prospectus pursuant to Article 3 of the Prospectus Directive in relation to such offer. Neither the Company nor the underwriters have authorized, nor do they authorize, the making of any offer of our ordinary shares in circumstances in which an obligation arises for the Company or the underwriters to publish a prospectus for such offer.
For the purposes of this provision, the expression an “offer of our ordinary shares to the public” in relation to any of our ordinary shares in any Member State means the communication in any form and by any means of sufficient information on the terms of the offer and our ordinary shares to be offered so as to enable an investor to decide to purchase or subscribe for our ordinary shares, as the same may be varied in that Member State by any measure implementing the Prospectus Directive in that Member State, the expression “Prospectus Directive��� means Directive 2003/71/EC (as amended) and includes any relevant implementing measure in each Member State.
Notice to Prospective Investors in the United Kingdom
In addition, in the United Kingdom, this document is being distributed only to, and is directed only at, and any offer subsequently made may only be directed at persons who are “qualified investors” (as defined in the Prospectus Directive) (1) who have professional experience in matters relating to investments falling within Article 19 (5) of the Financial Services and Markets Act 2000 (Financial Promotion) Order 2005, as amended, or the Order and/or (2) who are high net worth companies (or persons to whom it may otherwise be lawfully communicated) falling within Article 49(2)(a) to (d) of the Order (all such persons together being referred to as “relevant persons”). This document must not be acted on or relied on in the United Kingdom by persons who are not relevant persons. In the United Kingdom, any investment or investment activity to which this document relates is only available to, and will be engaged in with, relevant persons.
Notice to Prospective Investors in Switzerland
Our ordinary shares may not be publicly offered in Switzerland and will not be listed on the SIX Swiss Exchange, or SIX, or on any other stock exchange or regulated trading facility in Switzerland. This document has been prepared without regard to the disclosure standards for issuance prospectuses under art. 652a or art. 1156 of the Swiss Code of Obligations or the disclosure standards for listing prospectuses under art. 27 ff. of the SIX Listing Rules or the listing rules of any other stock exchange or regulated trading facility in Switzerland. Neither this document nor any other offering or marketing material relating to our ordinary shares or the offering may be publicly distributed or otherwise made publicly available in Switzerland.
Neither this document nor any other offering or marketing material relating to the offering, the Company, our ordinary shares have been or will be filed with or approved by any Swiss regulatory authority. In particular, this document will not be filed with, and the offer of our ordinary shares will not be supervised by, the Swiss Financial Market Supervisory Authority FINMA, or FINMA, and the offer of our ordinary shares has not been and will not be authorized under the Swiss Federal Act on Collective Investment Schemes, or CISA. The investor protection afforded to acquirers of interests in collective investment schemes under the CISA does not extend to acquirers of our ordinary shares.
320
Table of Contents
Notice to Prospective Investors in Australia
No placement document, prospectus, product disclosure statement or other disclosure document has been lodged with the Australian Securities and Investments Commission in relation to the offering. This prospectus does not constitute a prospectus, product disclosure statement or other disclosure document under the Corporations Act 2001, or the Corporations Act, and does not purport to include the information required for a prospectus, product disclosure statement or other disclosure document under the Corporations Act.
Any offer in Australia of our ordinary shares may only be made to persons, or the Exempt Investors, who are “sophisticated investors” (within the meaning of section 708(8) of the Corporations Act), “professional investors” (within the meaning of section 708(11) of the Corporations Act) or otherwise pursuant to one or more exemptions contained in section 708 of the Corporations Act so that it is lawful to offer our ordinary shares without disclosure to investors under Chapter 6D of the Corporations Act.
Our ordinary shares applied for by Exempt Investors in Australia must not be offered for sale in Australia in the period of 12 months after the date of allotment under the offering, except in circumstances where disclosure to investors under Chapter 6D of the Corporations Act would not be required pursuant to an exemption under section 708 of the Corporations Act or otherwise or where the offer is pursuant to a disclosure document which complies with Chapter 6D of the Corporations Act. Any person acquiring our ordinary shares must observe such Australian on-sale restrictions.
This prospectus contains general information only and does not take account of the investment objectives, financial situation or particular needs of any particular person. It does not contain any securities recommendations or financial product advice. Before making an investment decision, investors need to consider whether the information in this prospectus is appropriate to their needs, objectives and circumstances, and, if necessary, seek expert advice on those matters.
Notice to Prospective Investors in Hong Kong
Our ordinary shares have not been offered or sold and will not be offered or sold in Hong Kong, by means of any document, other than (a) to “professional investors” as defined in the Securities and Futures Ordinance (Cap. 571) of Hong Kong and any rules made under that Ordinance; or (b) in other circumstances which do not result in the document being a “prospectus” as defined in the Companies Ordinance (Cap. 32) of Hong Kong or which do not constitute an offer to the public within the meaning of that Ordinance. No advertisement, invitation or document relating to our ordinary shares has been or may be issued or has been or may be in the possession of any person for the purposes of issue, whether in Hong Kong or elsewhere, which is directed at, or the contents of which are likely to be accessed or read by, the public of Hong Kong (except if permitted to do so under the securities laws of Hong Kong) other than with respect to our ordinary shares which are or are intended to be disposed of only to persons outside Hong Kong or only to “professional investors” as defined in the Securities and Futures Ordinance and any rules made under that Ordinance.
Notice to Prospective Investors in Japan
Our ordinary shares have not been and will not be registered under the Financial Instruments and Exchange Law of Japan (Law No. 25 of 1948, as amended) and, accordingly, will not be offered or sold, directly or indirectly, in Japan, or for the benefit of any Japanese Person or to others for re-offering or resale, directly or indirectly, in Japan or to any Japanese Person, except in compliance with all applicable laws, regulations and ministerial guidelines promulgated by relevant Japanese governmental or regulatory authorities in effect at the relevant time. For the purposes of this paragraph, “Japanese Person” shall mean any person resident in Japan, including any corporation or other entity organized under the laws of Japan.
321
Table of Contents
Notice to Prospective Investors in the People’s Republic of China
This offering has not been approved or registered in the People’s Republic of China, or the PRC. This prospectus may not be circulated or distributed in the PRC and our ordinary shares may not be offered or sold, and will not be offered or sold to any person for the re-offering or resale, directly or indirectly, to any person in the PRC, except to the extent consistent with applicable laws and regulations of the PRC. For the purpose of this paragraph, the PRC does not include Taiwan and the special administrative regions of Hong Kong and Macau.
Notice to Prospective Investors in Singapore
This prospectus has not been will not be lodged or registered as a prospectus by the Monetary Authority of Singapore. Accordingly, this prospectus and any other document or material in connection with the offer or sale, or invitation for subscription or purchase, of our ordinary shares may not be issued, circulated or distributed, nor may our ordinary shares be offered or sold, or be made the subject of an invitation for subscription or purchase, whether directly or indirectly, to persons in Singapore other than (1) to an institutional investor under Section 274 of the SFA, (2) to a relevant person pursuant to Section 275(1), or any person pursuant to Section 275(1A), and in accordance with the conditions specified in Section 275, of the SFA, or (3) otherwise pursuant to, and in accordance with the conditions of, any other applicable provision of the SFA.
Where our ordinary shares are initially subscribed for or purchased pursuant to an offer made in reliance of our exemptions under Section 274 or 275 of the SFA, within the period of six months from the date of the initial subscription or purchase, these ordinary shares should only be sold in Singapore to institutional investors (as defined in Section 4A(1)(c) of the SFA), relevant persons (as defined in Section 275(2) of the SFA) or any person pursuant to Section 275(1A) of the SFA.
Where the ordinary shares are subscribed for or purchased under Section 275 of the SFA by a relevant person which is:
| (a) | a corporation (which is not an accredited investor (as defined in Section 4A of the SFA)) the sole business of which is to hold investments and the entire share capital of which is owned by one or more individuals, each of whom is an accredited investor; or |
| (b) | a trust (where the trustee is not an accredited investor) whose sole purpose is to hold investments and each beneficiary of the trust is an individual who is an accredited investor, |
securities (as defined in Section 239(1) of the SFA) of that corporation or the beneficiaries’ rights and interest (howsoever described) in that trust shall not be transferred within six months after that corporation or that trust has acquired our ordinary shares pursuant to an offer made under Section 275 of the SFA except:
| (a) | to an institutional investor(as defined in Section 4A(1)(c) of the SFA) or to a relevant person (as defined in Section 275(2) of the SFA), or to any person pursuant to an offer that is made on terms that such securities of that corporation or such rights or interest in that trust are acquired at a consideration of not less than S$200,000 (or its equivalent in a foreign currency) for each transaction, whether such amount is to be paid for in cash or by exchange of securities or other assets, and further, for corporations, in accordance with the conditions, specified in Section 275 of the SFA; |
| (b) | where no consideration is or will be given for the transfer; or |
| (c) | where the transfer is by operation of law. |
322
Table of Contents
Notice to Prospective Investors in Argentina
This prospectus has not been registered with the Comisión Nacional de Valores and may not be offered publicly in Argentina. The prospectus may not be publicly distributed in Argentina. Neither we nor the underwriters will solicit the public in Argentina in connection with this prospectus.
Notice to Prospective Investors in Brazil
The offer of our ordinary shares described in this prospectus will not be carried out by any means that would constitute a public offering in Brazil under Law No. 6,385, of December 7, 1976, as amended, and under CVM Rule No. 400, of December 29, 2003, as amended. The offer and sale of our ordinary shares have not been and will not be registered with the Brazilian Securities Commission (Comissão de Valores Mobiliários). Our ordinary shares have not been offered or sold, and will not be offered or sold in Brazil, except in circumstances that do not constitute a public offering or distribution under Brazilian laws and regulations.
Notice to Prospective Investors in Canada
The ordinary shares may be sold only to purchasers purchasing, or deemed to be purchasing, as principal that are accredited investors, as defined in National Instrument 45-106Prospectus Exemptions or subsection 73.3(1) of theSecurities Act (Ontario), and are permitted clients, as defined in National Instrument 31-103Registration Requirements, Exemptions and Ongoing Registrant Obligations. Any resale of the ordinary shares must be made in accordance with an exemption from, or in a transaction not subject to, the prospectus requirements of applicable securities laws.
Securities legislation in certain provinces or territories of Canada may provide a purchaser with remedies for rescission or damages if this prospectus (including any amendment thereto) contains a misrepresentation, provided that the remedies for rescission or damages are exercised by the purchaser within the time limit prescribed by the securities legislation of the purchaser’s province or territory. The purchaser should refer to any applicable provisions of the securities legislation of the purchaser’s province or territory for particulars of these rights or consult with a legal advisor.
Pursuant to section 3A.3 (or, in the case of securities issued or guaranteed by the government of a non-Canadian jurisdiction, section 3A.4) of National Instrument 33-105Underwriting Conflicts (NI 33-105), the underwriters are not required to comply with the disclosure requirements of NI 33-105 regarding underwriter conflicts of interest in connection with this offering.
Notice to Prospective Investors in Chile
The offer of our ordinary shares described herein is governed by the General Rule (Norma de Carácter General) 336 of June 27, 2012, issued by the Chilean Superintendency of Securities and Insurance, or the SVS. The offer relates to our ordinary shares not registered with the Securities Registry or the Registry of Foreign Securities of the SVS, so our ordinary shares are not subject to the oversight of the SVS. Since our ordinary shares are unregistered securities in Chile, we have no obligation to deliver in Chile public information regarding our ordinary shares. Our ordinary shares may not be sold in a public offering in Chile unless they are registered in the Securities Registry or the Registry of Foreign Securities of the SVS.
Notice to Prospective Investors in Colombia
Our ordinary shares have not been and will not be offered in Colombia through a public offering of securities pursuant to Colombian laws and regulations, nor will they be registered in the Colombian National Registry of Securities and Issuers or listed on a regulated securities trading system such as the Colombian Stock Exchange.
323
Table of Contents
Notice to Prospective Investors in Mexico
Our ordinary shares described in this prospectus are not being offered, sold or traded in Mexico pursuant to, and do not constitute, a public offering (oferta pública) in accordance with the Mexican Securities Market Law (Ley del Mercado de Valores), as amended, or LMV, or the general rules, regulations and other general provisions, the General Issuer’s Rules, issued by the Mexican Banking and Securities Commission (Comisión Nacional Bancaria y de Valores), or CNBV, nor is the offering contemplated hereby being authorized by the CNBV; therefore, any such ordinary shares may not be offered or sold publicly, or otherwise be the subject of brokerage activities, in Mexico, except pursuant to a private placement exemption or other exemptions set forth in the LMV. As such, this offering can be made to any person in Mexico so long as the offering is conducted on a direct and personal basis and it complies, among other requirements as set forth under the LMV and the General Issuer’s Rules, with the following:
| (a) | it is made to persons who are institutional investors (inversionistas institucionales) within the meaning of Article 2, Roman numeral XVII, of the LMV and regarded as such pursuant to the laws of Mexico, or qualified investors (inversionistas calificados) within the meaning of Article 2, Roman numeral XVI, of the LMV, and have the income, assets or qualitative characteristics provided for under Article 1, Roman numeral XIII of the General Issuer’s Rules, which require maintenance, in average over the past year, of investments in securities (within the meaning of the LMV) for an amount equal or greater than 1,500,000 Investment Units (Unidades de Inversión), or UDIs, or in each of the last two years had a gross annual income equal to or greater than 500,000 UDIs; or |
| (b) | it is made to persons who are shareholders of companies which fulfill their corporate purpose exclusively or substantially with such securities (e.g., investment companies authorized to invest in such securities); or |
| (c) | it is made pursuant to a plan or applicable program for our or our affiliates’ employees or groups of employees; or |
| (d) | it is made to less than 100 persons, to the extent such persons do not qualify under (a), (b) or (c) above. |
In identifying proposed purchasers for our ordinary shares in Mexico, the underwriters will only contact persons or entities whom they reasonably believe are within one of the four categories described in the immediately preceding paragraph in items (a) through (d). The underwriters may further require you to expressly reiterate that you fall into one of the above mentioned categories, that you further understand that the private offering of our ordinary shares has less documentary and information requirements than public offerings do, and to waive the right to claim on any lacking thereof.
This prospectus may not be publicly distributed in Mexico, whether through mass media to indeterminate subjects or otherwise, and it is not intended to serve as an application for the registration of our ordinary shares before the CNBV or listing of our ordinary shares before the Mexican Stock Exchange (Bolsa Mexicana de Valores, S.A.B. de C.V.), or the BMV, nor as a prospectus in connection with a public offering in Mexico. This prospectus is solely our responsibility and has not been reviewed or authorized by the CNBV. The CNBV has not assessed or passed on the investment quality of our ordinary shares, our solvency, liquidity or credit quality or the accuracy or completeness of the information provided in this prospectus. In making an investment decision, all investors, including any Mexican investors who may acquire our ordinary shares from time to time, must rely on their own review and examination of the Company. The acquisition of our ordinary shares by an investor who is a resident of Mexico will be made under its own responsibility.
324
Table of Contents
Notice to Prospective Investors in Panama
Our ordinary shares have not been, and will not be, registered for public offering in Panama with the Panamanian Superintendency of the Securities Market (Superintendencia del Mercado de Valores, previously the National Securities Commission of Panama) under Decree-Law 1 of July 8, 1999, as reformed by Law 67 of 2011, or the Panamanian Securities Act. Accordingly, our ordinary shares may not be offered or sold in Panama or to persons domiciled in Panama, except in certain limited transactions exempted from the registration requirements of the Panamanian Securities Act. Our ordinary shares do not benefit from tax incentives accorded by the Panamanian Securities Act, and are not subject to regulation or supervision by the Panamanian Superintendency of the Securities Market as long as our ordinary shares are privately offered to no more than 25 persons domiciled in Panama and result in the sale to no more than 10 of such persons.
Notice to Prospective Investors in Peru
Our ordinary shares may not be offered or sold in Peru except in compliance with the requirements under applicable securities laws. The information contained in this prospectus has not been and will not be registered with or approved by the Peruvian Superintendency of Capital Markets (Superintendencia del Mercado de Valores) or the Lima Stock Exchange (Bolsa de Valores de Lima). Accordingly, our ordinary shares may not be offered or sold in Peru, except if such offering is considered a private offering under the applicable securities laws and regulations of Peru. Institutional investors in Peru, as defined by Peruvian legislation, must rely on their own examination of the terms of this offering to determine their ability to invest in our ordinary shares.
Notice to Prospective Investors in the Dubai International Financial Centre
This prospectus relates to an Exempt Offer in accordance with the Offered Securities Rules of the Dubai Financial Services Authority, or the DFSA. This prospectus is intended for distribution only to persons of a type specified in the Offered Securities Rules of the DFSA. It must not be delivered to, or relied on by, any other person. The DFSA has no responsibility for reviewing or verifying any documents in connection with Exempt Offers. The DFSA has not approved this prospectus nor taken steps to verify the information set forth herein and has no responsibility for the prospectus. Our ordinary shares to which this prospectus relates may be illiquid and/or subject to restrictions on their resale. Prospective purchasers of our ordinary shares offered should conduct their own due diligence on our ordinary shares. If you do not understand the contents of this prospectus you should consult an authorized financial advisor.
Notice to Prospective Investors in Israel
This document does not constitute a prospectus under the Israeli Securities Law, 5728-1968, and has not been filed with or approved by the Israel Securities Authority. In Israel, this prospectus is being distributed only to, and is directed only at, investors listed in the first addendum, or the Addendum, to the Israeli Securities Law, consisting primarily of joint investment in trust funds, provident funds, insurance companies, banks, portfolio managers, investment advisors, members of the Tel Aviv Stock Exchange, underwriters purchasing for their own account, venture capital funds, entities with equity in excess of NIS 50 million and “qualified individuals,” each as defined in the Addendum (as it may be amended from time to time), collectively referred to as qualified investors. Qualified investors may be required to submit written confirmation that they fall within the scope of the Addendum.
325
Table of Contents
We estimate the expenses in connection with the issuance and distribution of our ordinary shares in this offering, other than underwriting discounts and commissions, as follows:
SEC registration fee | $ | |||
NYSE listing fee | ||||
Printing expenses | ||||
Legal fees and expenses | ||||
Accountants’ fees and expenses | ||||
FINRA filing fee | ||||
Miscellaneous costs | ||||
|
| |||
Total | $ | |||
|
|
We anticipate that the total underwriting discounts and commissions on ordinary shares sold by us will be approximately $ , or % of the gross proceeds of the offering. We will be responsible for the underwriting discounts and commissions related to this offering and for the expenses of the offering listed above.
All amounts in the table are estimates except the SEC registration fee, the NYSE listing fee and the Financial Industry Regulatory Authority, Inc., or FINRA, filing fee.
Certain legal matters in connection with this offering relating to U.S. law will be passed upon for us by Skadden, Arps, Slate, Meagher & Flom (UK) LLP, London, United Kingdom. The validity of our ordinary shares offered by this prospectus and other legal matters concerning this offering relating to Singapore law will be passed upon for us by Wong Partnership LLP, Singapore. Certain legal matters concerning this offering will be passed upon for the underwriters by White & Case LLP, Miami, Florida, with respect to U.S. law and Morgan Lewis Stamford LLC, Singapore, with respect to Singapore law.
The financial statements of IC Power Pte. Ltd. as of December 31, 2015 and for the period from May 4, 2015 (inception) through December 31, 2015 have been included herein in reliance upon the report of Somekh Chaikin, a Member Firm of KPMG International, independent registered public accounting firm, appearing elsewhere herein, and upon the authority of said firm as experts in accounting and auditing.
The consolidated financial statements of I.C. Power Asia Development Ltd. (formerly known as I.C. Power Ltd.)’s and its subsidiaries as of December 31, 2015 and 2014 and for each of the three years in the period ended December 31, 2015 have been included herein in reliance upon the report of Somekh Chaikin, a Member Firm of KPMG International, independent registered public accounting firm, appearing elsewhere herein, and upon the authority of said firm as experts in accounting and auditing.
The financial statements of Distribuidora de Electricidad de Oriente, S.A. as of December 31, 2015, 2014, 2013 and January 1, 2013 and for the years ended December 31, 2015, 2014 and 2013 have been audited by Deloitte Guatemala, S.A., independent auditors, as stated in their report appearing elsewhere herein (which report expresses an unqualified opinion and includes explanatory paragraphs referring to that (i) the financial statements as of December 31, 2015, 2014, 2013 and January 1, 2013, and for the years ended December 31, 2015, 2014 and 2013 have been restated for the correction of errors and expanded certain disclosures from those previously presented and (ii) a subsequent event relating to a legal proceeding initiated by the Guatemalan Tax Administration), are included in reliance upon the report of such firm given upon their authority as experts in accounting and auditing.
326
Table of Contents
The financial statements of Distribuidora de Electricidad de Occidente, S.A. as of December 31, 2015, 2014, 2013 and January 1, 2013 and for the years ended December 31, 2015, 2014 and 2013 have been audited by Deloitte Guatemala, S.A., independent auditors, as stated in their report appearing elsewhere herein (which report expresses an unqualified opinion and includes explanatory paragraphs referring to that (i) the financial statements as of December 31, 2015, 2014, 2013 and January 1, 2013, and for the years ended December 31, 2015, 2014 and 2013 have been restated for the correction of errors and expanded certain disclosures from those previously presented and (ii) a subsequent event relating to a legal proceeding initiated by the Guatemalan Tax Administration), are included in reliance upon the report of such firm given upon their authority as experts in accounting and auditing.
The financial statements of Comercializadora Guatemalteca Mayorista de Electricidad, S.A. as of December 31, 2015, 2014, 2013 and for the years ended December 31, 2015, 2014 and 2013 have been audited by Deloitte Guatemala, S.A., independent auditors, as stated in their report appearing elsewhere herein (which report expresses an unqualified opinion and includes an explanatory paragraph referring to that the financial statements as of December 31, 2015, 2014, 2013 and for the years ended December 31, 2015, 2014 and 2013 have been restated for the correction of errors and expanded certain disclosures from those previously presented), are included in reliance upon the report of such firm given upon their authority as experts in accounting and auditing.
The financial statements of Redes Eléctricas de Centro América, S.A. as of December 31, 2015, 2014, 2013 and for the years ended December 31, 2015, 2014 and 2013 have been audited by Deloitte Guatemala, S.A., independent auditors, as stated in their report appearing elsewhere herein (which report expresses an unqualified opinion and includes an explanatory paragraph referring to that the financial statements as of December 31, 2015, 2014 and 2013 and for the years ended December 31, 2015 and 2014 have been restated for the correction of errors and expanded certain disclosures from those previously presented), are included in reliance upon the report of such firm given upon their authority as experts in accounting and auditing.
The consolidated financial statements of Generandes Perú S.A. and subsidiaries as of December 31, 2013, 2012 and 2011 and for the years ended December 31, 2013 and 2012, have been included herein in reliance upon the report of Caipo y Asociados S. Civil de R.L., a Member Firm of KPMG International, independent auditors, appearing elsewhere herein, and upon the authority of said firm as experts in accounting and auditing.
WHERE YOU CAN FIND MORE INFORMATION
We have filed with the SEC a registration statement on Form F-1 (including amendments and relevant exhibits and schedules) under the Securities Act covering the ordinary shares to be sold in this offering. This prospectus, which is part of the registration statement, does not contain all of the information set forth in the registration statement and the exhibits and schedules to the registration statement. For further information, we refer you to the registration statement and the exhibits and schedules filed as part of the registration statement. If a document has been filed as an exhibit to the registration statement, we refer you to the copy of the document that has been filed. Each summary or outline in this prospectus of a document filed as an exhibit to the registration statement incorporating by reference particular items, sections or paragraphs of such exhibit is qualified in its entirety by the full contents of such exhibit.
We will make available free of charge on or through our Internet website,http://www.icpower-group.com, all of our annual and interim reports and all amendments to those reports as soon as reasonably practicable after such material is filed electronically with, or furnished to, the SEC. Copies of our investor information will also be available on our website and we will provide electronic or paper copies of these documents free of charge upon request. The SEC also maintains a website athttp://www.sec.gov that will contain reports and other information that we file electronically with the SEC.
We are not currently subject to the informational requirements of the Exchange Act. Immediately upon completion of this offering, we will become subject to periodic reporting and other informational requirements of
327
Table of Contents
the Exchange Act as applicable to foreign private issuers. As a foreign private issuer, we will be exempt from the rules under the Exchange Act relating to the furnishing and content of proxy statements and information statements, and our officers, directors and principal shareholders will be exempt from the reporting and short-swing profit recovery provisions contained in Section 16 of the Exchange Act. In addition, we will not be required under the Exchange Act to file periodic reports and financial statements with the SEC as frequently or as promptly as United States companies whose securities are registered under the Exchange Act. However, we will be required to file with the SEC, within four months after the end of our fiscal year ended December 31, 2015 and each subsequent fiscal year, an annual report on Form 20-F containing consolidated financial statements which will be examined and reported on, with an opinion expressed, by an independent registered public accounting firm. You can inspect and copy the registration statements, reports and other information filed with the SEC at the public reference facility maintained by the SEC at 100 F. Street, N.E., Washington, DC 20549. You can request copies of these documents upon payment of a duplicating fee by writing to the SEC. Please call the SEC at 1-800-SEC-0330 for further information on the operation of the public reference facility. Our SEC filings will also be available to the public on the SEC’s internet website athttp://www.sec.gov.
328
Table of Contents
INDEX TO THE FINANCIAL STATEMENTS
F-1
Table of Contents
| Distribuidora de Electricidad de Occidente, S.A.—DEOCSA Unaudited Condensed Interim Financial Statements as of June 30, 2016 and for the Six and Three Month Periods Ended June 30, 2016 and 2015 | ||||
| F-173 | ||||
| F-174 | ||||
| F-176 | ||||
Unaudited Condensed Interim Statements of Cash Flows for the six months ended June 30, 2016 and 2015 | F-177 | |||
| Notes to the Unaudited Condensed Interim Financial Statements | F-179 | |||
| Comercializadora Guatemalteca Mayorista de Electricidad, S.A.—GUATEMEL Unaudited Condensed Interim Financial Statements as of June 30, 2016 and for the Six and Three Month Periods Ended June 30, 2016 and 2015 | ||||
| F-195 | ||||
| F-196 | ||||
| F-198 | ||||
Unaudited Condensed Interim Statements of Cash Flows for the six months ended June 30, 2016 and 2015 | F-199 | |||
Notes to the Unaudited Condensed Interim Financial Statements | F-200 | |||
| Redes Eléctricas de Centroamérica, S.A.—RECSA Unaudited Condensed Interim Financial Statements as of June 30, 2016 and for the Six and Three Month Periods Ended June 30, 2016 and 2015 | ||||
| F-210 | ||||
| F-211 | ||||
| F-213 | ||||
Unaudited Condensed Interim Statements of Cash Flows for the six months ended June 30, 2016 and 2015 | F-214 | |||
Notes to the Unaudited Condensed Interim Financial Statements | F-215 | |||
| Distribuidora de Electricidad de Oriente, S.A.—DEORSA Restated Financial Statements as of December 31, 2015, 2014 and 2013 and January 1, 2013, and for the Years Ended December 31, 2015, 2014 and 2013 | ||||
| F-225 | ||||
| F-227 | ||||
F-2
Table of Contents
F-3
Table of Contents
| F-532 | ||||
Unaudited Consolidated Statements of Cash Flows for the Years Ended December 31, 2014 and 2013 | F-533 | |||
| F-534 | ||||
| Generandes Perú S.A. Consolidated Financial Statements for the Years Ended December 31, 2013 and 2012 | ||||
| F-604 | ||||
Consolidated Statements of Financial Position as of December 31, 2013, 2012 and 2011 | F-606 | |||
Consolidated Statements of Income for the Years Ended December 31, 2013 and 2012 | F-607 | |||
Consolidated Statements of Comprehensive Income for the Years Ended December 2013 and 2012 | F-608 | |||
Consolidated Statements of Changes in Equity for the Years Ended December 31, 2013 and 2012 | F-609 | |||
Consolidated Statements of Cash Flows for the Years Ended December 31, 2013 and 2012 | F-610 | |||
| F-611 | ||||
F-4
Table of Contents
IC Power Pte Ltd.
Condensed Consolidated Interim
Financial Statements
As at June 30, 2016
(Unaudited)
In thousands of U.S. Dollars
Table of Contents
IC POWER PTE LTD.
Condensed Consolidated Interim Financial Statements as at June 30, 2016 (Unaudited)
Contents
F-6
Table of Contents
Condensed Consolidated Interim Statements of Financial Position (Unaudited) as at
June 30 2016 | December 31 *2015 | |||||||
US$ thousands | US$ thousands | |||||||
Current assets | ||||||||
Cash and cash equivalents | 234,311 | 359,666 | ||||||
Short-term deposits and restricted cash | 85,159 | 301,955 | ||||||
Trade receivables | 254,105 | 123,273 | ||||||
Other receivables and debit balances | 70,102 | 45,101 | ||||||
Income tax receivable | 12,183 | 3,926 | ||||||
Inventories | 86,286 | 50,351 | ||||||
|
|
|
| |||||
Total current assets | 742,146 | 884,272 | ||||||
|
|
|
| |||||
Non-current assets | ||||||||
Restricted cash | 13,178 | 16,371 | ||||||
Trade receivables | 23,113 | — | ||||||
Investment in associated company | 9,337 | 8,993 | ||||||
Deposits and other debit balances, including derivative instruments | 52,903 | 49,661 | ||||||
Income tax receivable | 10,587 | 10,119 | ||||||
Deferred taxes, net | 21,520 | 2,693 | ||||||
Property, plant and equipment | 3,499,555 | 2,971,958 | ||||||
Intangible assets | 356,219 | 147,244 | ||||||
|
|
|
| |||||
Total non-current assets | 3,986,412 | 3,207,039 | ||||||
|
|
|
| |||||
Total assets | 4,728,558 | 4,091,311 | ||||||
|
|
|
| |||||
Current liabilities | ||||||||
Credit from banks and others | 338,732 | 352,618 | ||||||
Trade payables | 281,001 | 143,958 | ||||||
Other payables and credit balances, including derivative instruments | 99,727 | 106,880 | ||||||
Guarantee deposits from customers | 63,545 | — | ||||||
Provisions | 847 | 41,686 | ||||||
Income taxes payable | 7,676 | 4,689 | ||||||
|
|
|
| |||||
Total current liabilities | 791,528 | 649,831 | ||||||
|
|
|
| |||||
Non-current liabilities | ||||||||
Loans from banks and others | 1,765,055 | 1,556,225 | ||||||
Loans from parent company | 224,693 | 17 | ||||||
Debentures | 839,120 | 655,847 | ||||||
Derivative instruments | 44,029 | 35,625 | ||||||
Deferred taxes, net | 197,562 | 140,428 | ||||||
Other long term liabilities | 50,875 | 27,219 | ||||||
|
|
|
| |||||
Total non-current liabilities | 3,121,334 | 2,415,361 | ||||||
|
|
|
| |||||
Total liabilities | 3,912,862 | 3,065,192 | ||||||
|
|
|
| |||||
Equity | ||||||||
Share capital and premium | 559,310 | 559,310 | ||||||
Merger reserve | (348,738 | ) | (128,738 | ) | ||||
Capital reserves | (31,066 | ) | (27,096 | ) | ||||
Retained earnings | 428,930 | 422,450 | ||||||
|
|
|
| |||||
Total equity attributable to the equity holders of the Company | 608,436 | 825,926 | ||||||
|
|
|
| |||||
Non-controlling interests | 207,260 | 200,193 | ||||||
|
|
|
| |||||
Total equity | 815,696 | 1,026,119 | ||||||
|
|
|
| |||||
Total liabilities and equity | 4,728,558 | 4,091,311 | ||||||
|
|
|
| |||||
Arunava Sen Director |
| Javier Garcia Acting Chief Executive Officer |
|
| Alberto Triulzi Acting Chief Financial Officer |
|
| * | Restated—See Note 2 regarding the effect of group reorganization that took place on March 17, 2016 |
The notes to the condensed interim consolidated financial statements are an integral part thereof.
F-7
Table of Contents
Condensed Consolidated Interim Statements of Income (Unaudited)
For the six months period ended June 30 | ||||||||
2016 | *2015 | |||||||
US$ thousands | US$ thousands | |||||||
Continuing operations | ||||||||
Sales | 881,116 | 655,022 | ||||||
Cost of sales (excluding depreciation and amortization) | (644,331 | ) | (458,481 | ) | ||||
Depreciation and amortization | (71,722 | ) | (54,121 | ) | ||||
|
|
|
| |||||
Gross profit | 165,063 | 142,420 | ||||||
General, selling and administrative expenses | (59,728 | ) | (31,220 | ) | ||||
Other expenses | (990 | ) | (849 | ) | ||||
Other income | 6,229 | 2,573 | ||||||
|
|
|
| |||||
Operating income | 110,574 | 112,924 | ||||||
|
|
|
| |||||
Financing expenses | 78,956 | 57,254 | ||||||
Financing income | (4,694 | ) | (4,315 | ) | ||||
|
|
|
| |||||
Financing expenses, net | 74,262 | 52,939 | ||||||
|
|
|
| |||||
Share in income of associated company | 343 | 116 | ||||||
|
|
|
| |||||
Income before taxes | 36,655 | 60,101 | ||||||
|
|
|
| |||||
Taxes on income | (20,971 | ) | (24,976 | ) | ||||
|
|
|
| |||||
Net income from continuing operations | 15,684 | 35,125 | ||||||
|
|
|
| |||||
Discontinued operations | ||||||||
Net income from discontinued operations, net of tax | — | 3,850 | ||||||
|
|
|
| |||||
Net income for the period | 15,684 | 38,975 | ||||||
|
|
|
| |||||
Attributable to: | ||||||||
Equity holders of the Company | 6,480 | 29,583 | ||||||
Non-controlling interests | 9,204 | 9,392 | ||||||
|
|
|
| |||||
Net income for the period | 15,684 | 38,975 | ||||||
|
|
|
| |||||
Earnings per share | ||||||||
Basic and diluted earnings per share (in USD) | 11.59 | 52.89 | ||||||
Earnings per share—Continuing operations | ||||||||
Basic and diluted earnings per share (in USD) | 11.59 | 46.01 | ||||||
Earnings per share—Discontinued operations | ||||||||
Basic and diluted earnings per share (in USD) | — | 6.88 | ||||||
| * | See Note 2 regarding the effect of group reorganization that took place on March 17, 2016 |
The notes to the condensed interim consolidated financial statements are an integral part thereof.
F-8
Table of Contents
Condensed Consolidated Interim Statements of Comprehensive Income (Unaudited)
For the six months period ended June 30 | ||||||||
2016 | *2015 | |||||||
US$ thousands | US$ thousands | |||||||
Net income for the period | 15,684 | 38,975 | ||||||
|
|
|
| |||||
Components of other comprehensive loss items that will be subsequently reclassified to profit or loss | ||||||||
Foreign currency translation differences in respect of foreign operations | 3,449 | 2,339 | ||||||
Group’s share in comprehensive income from investment in associated companies | — | (193 | ) | |||||
Cash flow hedges—effective fair value | (11,337 | ) | 5,094 | |||||
Cash flow hedges—Reclassified to profit or loss of the period | 62 | 1,759 | ||||||
Remeasurement of defined benefit obligation | (368 | ) | — | |||||
Tax benefit on other comprehensive income | 3,180 | (1,630 | ) | |||||
|
|
|
| |||||
Other comprehensive income (loss) for the period, net of tax | (5,014 | ) | 7,369 | |||||
|
|
|
| |||||
Total comprehensive income for the period | 10,670 | 46,344 | ||||||
|
|
|
| |||||
Attributable to: | ||||||||
Equity holders of the company | 2,510 | 35,323 | ||||||
Non-controlling interests | 8,160 | 11,021 | ||||||
|
|
|
| |||||
Total comprehensive income for the period | 10,670 | 46,344 | ||||||
|
|
|
| |||||
| * | See Note 2 regarding the effect of group reorganization that took place on March 17, 2016 |
The notes to the condensed interim consolidated financial statements are an integral part thereof.
F-9
Table of Contents
Condensed Consolidated Interim Statements of Changes in Equity (Unaudited)
Attributable to equity holders of the Company | Non- | Total equity | ||||||||||||||||||||||||||||||||||||||
Share capital | Merger reserve | Translation | Hedging | Controlling | Employee | Retained | Total | |||||||||||||||||||||||||||||||||
US$ thousands | US$ thousands | US$ thousands | US$ thousands | US$ thousands | US$ thousands | US$ thousands | US$ thousands | US$ thousands | US$ thousands | |||||||||||||||||||||||||||||||
For the six-month period ended June 30, 2016 | ||||||||||||||||||||||||||||||||||||||||
Balance as at January 1, 2016* | 559,310 | (128,738 | ) | (33,349 | ) | (16,987 | ) | 23,240 | — | 422,450 | 825,926 | 200,193 | 1,026,119 | |||||||||||||||||||||||||||
Non-controlling interests in respect of business combination, note 4 | — | — | — | — | — | — | — | — | 20,707 | 20,707 | ||||||||||||||||||||||||||||||
Dividends to non-controlling interests in subsidiaries | — | — | — | — | — | — | — | — | (23,484 | ) | (23,484 | ) | ||||||||||||||||||||||||||||
Non-controlling Shareholder contribution | — | — | — | — | — | — | — | — | 1,684 | 1,684 | ||||||||||||||||||||||||||||||
Controlling shareholder loans as part of the reorganization* | — | (220,000 | ) | — | — | — | — | — | (220,000 | ) | — | (220,000 | ) | |||||||||||||||||||||||||||
Profit for the period | — | — | — | — | — | — | 6,480 | 6,480 | 9,204 | 15,684 | ||||||||||||||||||||||||||||||
Other comprehensive loss for the period, net of tax | — | — | 2,448 | (6,080 | ) | — | (338 | ) | — | (3,970 | ) | (1,044 | ) | (5,014 | ) | |||||||||||||||||||||||||
|
|
|
|
|
|
|
|
|
|
|
|
|
|
|
|
|
|
|
| |||||||||||||||||||||
Balance as at June 30, 2016 | 559,310 | (348,738 | ) | (30,901 | ) | (23,067 | ) | 23,240 | (338 | ) | 428,930 | 608,436 | 207,260 | 815,696 | ||||||||||||||||||||||||||
|
|
|
|
|
|
|
|
|
|
|
|
|
|
|
|
|
|
|
| |||||||||||||||||||||
| * | See Note 2 regarding the reorganization that took place on March 17, 2016 |
The notes to the condensed interim consolidated financial statements are an integral part thereof.
F-10
Table of Contents
IC POWER PTE LTD.
Condensed Consolidated Interim Statements of Changes in Equity (Unaudited) (cont’d)
Attributable to equity holders of the Company | Non- | Total equity | ||||||||||||||||||||||||||||||||||
Share capital | Merger | Translation | Hedging | Controlling | Retained | Total | ||||||||||||||||||||||||||||||
US$ thousands | US$ thousands | US$ thousands | US$ thousands | US$ thousands | US$ thousands | US$ thousands | US$ thousands | US$ thousands | ||||||||||||||||||||||||||||
For the six-month period ended June 30, 2015 | ||||||||||||||||||||||||||||||||||||
Balance as at January 1, 2015* | 559,310 | (128,738 | ) | (28,495 | ) | (12,796 | ) | 23,240 | 389,306 | 801,827 | 210,833 | 1,012,660 | ||||||||||||||||||||||||
Acquisition of non-controlling interests | — | — | — | — | — | (1,922 | ) | (1,922 | ) | (18,078 | ) | (20,000 | ) | |||||||||||||||||||||||
Dividends to non-controlling interests in subsidiaries | — | — | — | — | — | — | — | (4,254 | ) | (4,254 | ) | |||||||||||||||||||||||||
Non-controlling Shareholder contribution | — | — | — | — | — | — | — | 5,310 | 5,310 | |||||||||||||||||||||||||||
Profit for the period | — | — | — | — | — | 29,583 | 29,583 | 9,392 | 38,975 | |||||||||||||||||||||||||||
Other comprehensive loss for the period, net of tax | — | — | 1,853 | 4,080 | — | (193 | ) | 5,740 | 1,629 | 7,369 | ||||||||||||||||||||||||||
|
|
|
|
|
|
|
|
|
|
|
|
|
|
|
|
|
| |||||||||||||||||||
Balance as at June 30, 2015 | 559,310 | (128,738 | ) | (26,642 | ) | (8,716 | ) | 23,240 | 416,774 | 835,228 | 204,832 | 1,040,060 | ||||||||||||||||||||||||
|
|
|
|
|
|
|
|
|
|
|
|
|
|
|
|
|
| |||||||||||||||||||
| * | See Note 2 regarding the reorganization that took place on March 17, 2016 |
The notes to the condensed interim consolidated financial statements are an integral part thereof.
F-11
Table of Contents
IC POWER PTE LTD.
Condensed Consolidated Interim Statements of Changes in Equity (Unaudited) (cont’d)
Attributable to equity holders of the Company | Non- | Total equity | ||||||||||||||||||||||||||||||||||
Share capital | Merger reserve | Translation | Hedging | Controlling | Retained | Total | ||||||||||||||||||||||||||||||
US$ thousands | US$ thousands | US$ thousands | US$ thousands | US$ thousands | US$ thousands | US$ thousands | US$ thousands | US$ thousands | ||||||||||||||||||||||||||||
For the year ended December 31, 2015* | ||||||||||||||||||||||||||||||||||||
Balance as at January 1, 2015 | 559,310 | (128,738 | ) | (28,495 | ) | (12,796 | ) | 23,240 | 389,306 | 801,827 | 210,833 | 1,012,660 | ||||||||||||||||||||||||
Acquisition of non-controlling interests | — | — | — | — | — | (1,922 | ) | (1,922 | ) | (18,078 | ) | (20,000 | ) | |||||||||||||||||||||||
Dividends to non-controlling interests in subsidiaries | — | — | — | — | — | — | — | (12,340 | ) | (12,340 | ) | |||||||||||||||||||||||||
Non-controlling Shareholder contribution | — | — | — | — | — | — | — | 6,110 | 6,110 | |||||||||||||||||||||||||||
Profit for the year | — | — | — | — | — | 35,335 | 35,335 | 16,898 | 52,233 | |||||||||||||||||||||||||||
Other comprehensive loss for the year, net of tax | — | — | (4,854 | ) | (4,191 | ) | — | (269 | ) | (9,314 | ) | (3,230 | ) | (12,544 | ) | |||||||||||||||||||||
|
|
|
|
|
|
|
|
|
|
|
|
|
|
|
|
|
| |||||||||||||||||||
Balance as at December 31, 2015 | 559,310 | (128,738 | ) | (33,349 | ) | (16,987 | ) | 23,240 | 422,450 | 825,926 | 200,193 | 1,026,119 | ||||||||||||||||||||||||
|
|
|
|
|
|
|
|
|
|
|
|
|
|
|
|
|
| |||||||||||||||||||
| * | Restated—See Note 2 regarding the reorganization that took place on March 17, 2016 |
The notes to the condensed interim consolidated financial statements are an integral part thereof.
F-12
Table of Contents
Condensed Consolidated Interim Statements of Cash Flows (Unaudited)
For the six month period ended | ||||||||
2016 | 2015 | |||||||
US$ thousands | US$ thousands | |||||||
Cash flows from operating activities | ||||||||
Net income for the period | 15,684 | 38,975 | ||||||
Adjustments: | ||||||||
Depreciation and amortization | 77,669 | 58,318 | ||||||
Financing expenses, net | 74,262 | 52,939 | ||||||
Share in income of associated company | (343 | ) | (116 | ) | ||||
Bad debt expense | 10,636 | 165 | ||||||
Income tax expenses | 20,971 | 24,976 | ||||||
Inventory write off | 60 | — | ||||||
Loss on disposal of property, plant and equipment | 435 | 2,221 | ||||||
|
|
|
| |||||
| 199,374 | 177,478 | |||||||
|
|
|
| |||||
Change in inventories | (34,627 | ) | (1,449 | ) | ||||
Change in trade and other receivables | (46,298 | ) | (9,728 | ) | ||||
Change in trade and other payables | (2,593 | ) | (30,498 | ) | ||||
Change in provisions and employee benefits | (40,077 | ) | 10,101 | |||||
|
|
|
| |||||
| 75,779 | 145,904 | |||||||
|
|
|
| |||||
Income taxes paid | (20,423 | ) | (19,983 | ) | ||||
Dividend received | — | 637 | ||||||
Dividend received from discontinued operations | — | 3,850 | ||||||
|
|
|
| |||||
Net cash provided by operating activities | 55,356 | 130,408 | ||||||
|
|
|
| |||||
Cash flows from investing activities | ||||||||
Proceeds from sale of property, plant and equipment | 235 | 188 | ||||||
Value Added Tax, net of project under construction | 585 | (25,010 | ) | |||||
Interest received | 2,979 | 3,425 | ||||||
Short-term deposits and restricted cash, net | 229,854 | 23,676 | ||||||
Business combinations | (206,059 | ) | — | |||||
Acquisition of fixed assets | (199,339 | ) | (332,876 | ) | ||||
Acquisition of intangible assets | (3,852 | ) | (7,287 | ) | ||||
Payment of consideration retained | (1,448 | ) | (2,800 | ) | ||||
|
|
|
| |||||
Net cash used in investing activities | (177,045 | ) | (340,684 | ) | ||||
|
|
|
| |||||
Cash flows from financing activities | ||||||||
Expenses paid by Kenon Holdings on behalf of the Company, net | 104 | — | ||||||
Proceeds from non-controlling shareholder contribution | 1,684 | 5,310 | ||||||
Short-term credit from banks and others, net | 11,629 | (5,614 | ) | |||||
Receipt of long-term loans, capital notes and debentures | 466,316 | 186,890 | ||||||
Repayment of long-term loans and debentures and capital notes | (373,867 | ) | (51,511 | ) | ||||
Interest paid | (58,846 | ) | (47,970 | ) | ||||
Dividend paid to non-controlling interest | (17,837 | ) | (4,254 | ) | ||||
Payment of issuance expenses | (25,904 | ) | — | |||||
Payment of consent fee | (9,515 | ) | — | |||||
Acquisition of non-controlling interests | — | (20,000 | ) | |||||
|
|
|
| |||||
Net cash provided by (used in) financing activities | (6,236 | ) | 62,851 | |||||
|
|
|
| |||||
Net decrease in cash and cash equivalents | (127,925 | ) | (147,425 | ) | ||||
Cash and cash equivalents at beginning of the period | 359,666 | 583,296 | ||||||
Effect of changes in the exchange rate on cash and cash equivalents | 2,570 | 407 | ||||||
|
|
|
| |||||
Cash and cash equivalents at end of the period | 234,311 | 436,278 | ||||||
|
|
|
| |||||
Non-cash investing transactions: | ||||||||
Amortization of transaction costs capitalized | (4,156 | ) | (18,844 | ) | ||||
Purchase of fixed assets on credit and others | (6,178 | ) | (22,646 | ) | ||||
The notes to the condensed interim consolidated financial statements are an integral part thereof.
F-13
Table of Contents
Notes to the Condensed Consolidated Interim Financial Statements as at June 30, 2016 (Unaudited)
Note 1—The Reporting Entity
IC Power Pte. LTD (hereinafter—“the Company”) is a private holding company incorporated in Singapore on May 4, 2015 to serve as the holding company of IC Power Ltd and its businesses. On March 28, 2016, IC Power Ltd changed its name to I.C. Power Asia Development Ltd (hereinafter—“ICP”).
The Company is a wholly owned subsidiary of Kenon Holdings Ltd. (hereinafter—“Kenon” or “the Parent Company”). Kenon is a publicly listed company in the New York Stock Exchange and the Tel Aviv Stock Exchange.
The registered office of the Company is 80 Raffles Place #26-01, UOB Plaza, Singapore 04864. The Company’s principal executive office is located at 1 Temasek Avenue #36-01, Millenia Tower, Singapore 039192.
As of January 6, 2015, ICP was a wholly-owned subsidiary of Israel Corporation Ltd. (hereinafter—“Israel Corp.”). On January 7, 2015, Israel Corp. transferred all of ICP’s shares to Kenon as part of its internal reorganization.
On March 17, 2016, as part of the reorganization process carried out by Kenon in order to list the Company’s shares on the US stock exchange, Kenon transferred all of ICP´s shares to the Company, see Note 2 for further information.
The Group’s condensed financial statements as at June 30, 2016 include those of the Company and its subsidiaries (hereinafter—“the Group”) and as well as the Group’s share in associated companies. The Group is engaged, through subsidiaries, in the operation of power generation plants and in the development of energy projects in Peru, Chile, Colombia, Dominican Republic, Bolivia, El Salvador, Jamaica, Nicaragua, Guatemala and Israel. Since January 22, 2016, the Group is also involved in the distribution business, see Note 10.
Note 2—Group Reorganization
The Company is in the process of applying for listing its ordinary shares on the US Stock Exchange under the symbol “ICP”. On March 17, 2016, under a reorganization executed by Kenon, it transferred all of its equity interests in its wholly-owned subsidiary ICP, which holds power generation companies in Latin America, the Caribbean and Israel, to the Company.
Under the Share Purchase Agreement, the Company:
| (a) | issued 559,309 ordinary shares to Kenon at an aggregate subscription price of U5$559,310 thousand. |
| (b) | was provided with a controlling shareholder loans of US$ 75,000 thousand and US$ 145,000 thousand, which were provided by Kenon to finance the remaining payment for the transfer of the shares. These loans bear an annual interest rate of LIBOR+6% and their maturity date is December 31, 2018. |
Since this transaction is a reorganization of ICP, the Company´s consolidated financial statements are presented using the values from the consolidated financial statements of ICP. Regarding the equity structure, the issued share capital and premium in all periods presented reflect that of the Company
F-14
Table of Contents
IC POWER PTE. LTD.
Notes to the Condensed Consolidated Interim Financial Statements as at June 30, 2016 (Unaudited)
Note 2—Group Reorganization (cont’d)
with other amounts in equity—e.g. retained earnings and capital reserves being those from the consolidated financial statements of ICP. The resulting difference was recognized as a merger reserve.
The controlling shareholder loans were recognized and initially measured at fair value in the consolidated financial statements as deduction of the equity against parent company loan at the date of the reorganization.
In its consolidated financial statements, the Company restated its comparatives and adjusted its current reporting period before the date of the transaction in order to reflect the transaction retrospectively.
Note 3—Basis of Preparation of the Financial Statements
| A. | Declaration of compliance with International Financial Reporting Standards (IFRS) as issued by the IASB |
The condensed consolidated interim financial statements were prepared in accordance with IAS 34 “Financial Reporting for Interim Periods” and do not include all of the information required in a complete set of annual financial statements. These statements should be read together with the financial statements of the Company and ICP for the year ended December 31, 2015 that were authorized on February 23, 2016 and March 30, 2016, respectively (hereinafter—“the Annual Financial Statements”).
The condensed consolidated interim financial statements were approved by the Company’s Board of Directors on August 29, 2016.
| B. | Significant Accounting Policies |
The Group had applied the same accounting policies and methods of computation in these condensed consolidated interim financial statements as in its Annual Financial Statements. Following the Group’s reorganization and the business combination (see Note 4), the Group had implemented additional accounting policies, as follows:
i. Reorganizations in Common Control Transactions
Common control transactions that involve the setup of a new group company and the combination of entities under common control are recorded using the book values of the parent company.
ii. Revenue
Revenues from the operation of electric energy distribution and other income from exploitation are measured at the fair value of the consideration received. Estimated customer returns, rebates and other similar allowances are deducted from the revenue recognized.
Revenues from the distribution of electric energy are recognized based on the energy delivered, through invoicing and the estimate of sales from the energy supplied which has not been billed yet at the reporting date.
Revenues from toll services is recognized when the services are rendered.
iii. Government Grants
Government grants related to distribution projects are not recognized until there is reasonable assurance that the Group will comply with the conditions attaching to them and that the grants will be received.
Government grants related to distribution projects are deducted from the related assets. They are recognized in statement of income over the useful life of the related asset as a reduced depreciation.
F-15
Table of Contents
IC POWER PTE. LTD.
Notes to the Condensed Consolidated Interim Financial Statements as at June 30, 2016 (Unaudited)
Note 3—Basis of Preparation of the Financial Statements (cont’d)
B. Significant Accounting Policies (cont’d)
iv. Useful Life of Property, Plant and Equipment and Intangible Assets
Further to Notes 2.O.iii and 2.P.iii to the Annual Financial Statements, the following is the average useful life of the main assets acquired as part of the business combination:
| Years | ||
Substations, medium voltage equipment and transf.MV/LV | 30-40 | |
Meters and connections | 10-25 | |
Concessions | 33* |
| * | The concessions are amortized over the remaining life of the licenses from the date of the business combination. |
v. Deposits Received from Consumers
Deposits received from consumers, plus interest accrued and less any outstanding debt for past services, are refundable to the users when they cease using the electric energy service rendered by the Group. The Group has classified these deposits as current liabilities based on the facts that the Group does not have legal rights to defer this payment in a period that exceed a year. However, the Group does not anticipate making significant payments in the next year.
vi.Energy Purchases
Costs from energy purchases either acquired in the spot market or from contracts with suppliers are recorded on an accrual basis according to the energy actually delivered. Purchases of electric energy, including those which have not yet been billed as of the reporting date, are recorded based on estimates of the energy supplied at the prices prevailing in the spot market or agreed-upon in the respective purchase agreements, as the case may be.
C. Functional currency and presentation currency
The United States dollar is the currency representing the main economic environment in which the Company operates and, accordingly, the dollar constitutes the functional and presentation currency in these financial statements. Currencies other than the dollar constitute foreign currency.
D. Estimates
The preparation of interim financial statements in conformity with IFRSs requires management to make judgments, estimates and assumptions that affect the application of accounting policies and the reported amounts of assets and liabilities, income and expenses. Actual results may differ from these estimates.
F-16
Table of Contents
IC POWER PTE. LTD.
Notes to the Condensed Consolidated Interim Financial Statements as at June 30, 2016 (Unaudited)
Note 3—Basis of Preparation of the Financial Statements (cont’d)
D. Estimates (cont’d)
In preparing these condensed consolidated interim financial statements, the significant judgments made by management in applying the Group’s accounting policies and the key sources of estimation uncertainty were the same as those that applied to the Annual Financial Statements. Following the business combination (see Note 4), additional significant estimates are used as follows:
i. Energy Purchase Provision
The Group records on a monthly basis the provision of energy purchased not yet billed by estimating the energy received since the last measurement from the supplier. This provision consists in estimating the energy received since the last invoice from the supplier in the frontier spots and valuing it at the prices that the different energy suppliers define in the contract of energy purchase with the Group.
ii. Energy Supplied Pending Invoicing
In each monthly close period, the Group records the amount of the accrued revenue not invoiced on the sale of electric energy. This amount consists in estimating the energy delivered since the last measurement date of the consumers and the accounting close period at the tariffs approved by the authorities.
iii. Application of IFRIC 12 “Service Concession Arrangements”
Interpretation No. 12 “Service Concession Arrangements” (IFRIC 12) establishes some accounting guidelines for private entities that provide public services under a service concession agreement or similar arrangement. IFRIC 12 is applicable to license holders depending, among other things, on the extent to which the grantor controls or regulates the services and any significant residual interest in the assets at the end of the term of the arrangement.
Considering that IFRIC 12 establishes general guidelines and principles, judgment is required to determine whether it is applicable due to the specific nature of each service concession or license and the complexity inherent in the different concepts included in its interpretation.
The Group has examined the characteristics, conditions and terms currently in effect under its electric energy distribution license and the guidelines established by IFRIC 12. On the basis of such analysis, the Group concluded that its license is outside the scope of IFRIC 12, primarily because the grantor does not control any significant residual interest in the infrastructure at the end of the term of the arrangement and the possibility of renewal.
The Group accounts for the assets acquired or constructed in connection with the Concessions in accordance with IAS 16 Property, plant and equipment.
F-17
Table of Contents
IC POWER PTE. LTD.
Notes to the Condensed Consolidated Interim Financial Statements as at June 30, 2016 (Unaudited)
Note 4—Business combination
On December 29, 2015, IC Power Distribution Holdings Pte, Limited (hereinafter—“ICP Distribution”), a wholly owned subsidiary of the company, entered into an agreement with Deorsa-Deocsa Holdings Ltd. to acquire 100% of the shares of Estrella Cooperatief BA, a holding company that indirectly owned two distribution companies in Guatemala (90.6% of Distribuidora de Electricidad de Occidente S.A.-DEOCSA and 92.68% of Distribuidora de Electricidad de Oriente S.A.-DEORSA) and 100% of two smaller related businesses (Redes Electricas de Centroamerica S.A.-RECSA and Comercializadora Guatemalteca Mayorista de Electricidad S.A.-GUATEMEL), collectively referred as “Energuate” for a purchase price equal to (i) the base purchase price, plus (ii) the deferred payment, and (iii) the final adjustment amount. On January 22, 2016, ICP Distribution closed the acquisition of Estrella Cooperatief BA for a total consideration of US$ 266,286 thousand which included a base price of US$ 242,536 thousand paid at the closing date and a deferred payment of US$ 23,750 thousand paid on April 12, 2016. The consideration agreed is subject to working capital adjustments.
As at June 30, 2016 the fair values of the acquired assets and liabilities and the calculation of goodwill have been determined on a provisional basis as permitted according to IFRS 3. The Company expects to complete the final valuation until the end of 2016.
A. Consideration transferred
The following table summarizes the acquisition-date fair value of each major class of consideration transferred:
| In thousands of US$ | Note | |||||||
Cash consideration | 242,536 | |||||||
Deferred payment | 23,750 | |||||||
|
| |||||||
Total consideration transferred | 266,286 | |||||||
|
| |||||||
| In thousands of US$ |
| |||||||
Cash consideration | 266,286 | |||||||
Cash and cash equivalent acquired | (60,227 | ) | ||||||
|
| |||||||
Net cash flow used on acquisition | 206,059 | |||||||
|
| |||||||
F-18
Table of Contents
IC POWER PTE. LTD.
Notes to the Condensed Consolidated Interim Financial Statements as at June 30, 2016 (Unaudited)
Note 4—Business combination (cont’d)
B. Identifiable assets acquired and liabilities assumed
The following table summarizes the recognized amounts of assets acquired and liabilities assumed at the date of acquisition:
| In thousands of US$ | Note | |||||||
Property, plant and equipment | 6 | 394,536 | ||||||
Intangibles | 7 | 178,238 | ||||||
Deferred income tax assets, net | 16,317 | |||||||
Trade receivables, net (a) | 125,271 | |||||||
Cash and cash equivalents | 60,227 | |||||||
Other assets | 22,528 | |||||||
Credit from bank and others | 8 | (284,456 | ) | |||||
Deferred income tax liabilities | (52,385 | ) | ||||||
Trade payables | (108,193 | ) | ||||||
Guarantee deposits from customers (b) | (58,727 | ) | ||||||
Other liabilities | (37,731 | ) | ||||||
|
| |||||||
Total identifiable net assets acquired | 255,625 | |||||||
|
| |||||||
| (a) | The trade receivables comprise gross contractual amounts due of US$ 220,977 thousand, of which US$ 95,706 thousand was expected to be uncollectible at the acquisition date. |
| (b) | Deposits in cash received from customers. These deposits bear interests at a weighted average interest rate published by the Guatemalan Central Bank and are refundable to clients when they cease using the electric energy service. |
Measurement of fair values
The Company has measured the value of the acquired assets, liabilities, and contingent liabilities at fair value on January 22, 2016, the date in which the Company gained control over Estrella Cooperatief BA. Additional information regarding the fair value measurement of the main items acquired is as follows:
| • | Fixed assets were valued considering the market value provided by an appraiser; |
| • | Intangibles were measured based on the valuation of its Concessions; |
| • | Deferred taxes were recorded based on the temporary differences between the carrying amount of the assets and liabilities and their tax basis; and, |
| • | Non-controlling interests were measured as a proportion of the net assets identified on the acquisition date. |
F-19
Table of Contents
IC POWER PTE. LTD.
Notes to the Condensed Consolidated Interim Financial Statements as at June 30, 2016 (Unaudited)
Note 4—Business combination (cont’d)
C. Goodwill
Goodwill arising from the acquisition has been recognized as follows:
| In thousands of US$ | Note | |||||||
Total consideration transferred | 4.A | 266,286 | ||||||
Non-controlling interest | 20,707 | |||||||
Fair value of identifiable net assets | 4.B | (255,625 | ) | |||||
|
| |||||||
Goodwill* | 31,368 | |||||||
|
| |||||||
| * | This amount is not deductible for tax purposes and was determined in Quetzales. |
Goodwill is explained by the strategic interest of the Company to expand its presence in the distribution business. The goodwill is attributable mainly to the synergies expected to be achieved from integrating this business into the Group.
Recognition of revenues and profit or loss
During the period from the acquisition date to June 30, 2016 the revenues and profit or loss contributed by Estrella Cooperatief BA. to the consolidated results are US$ 243,347 thousand and US$ 10,796 thousand, respectively. If the acquisition had occurred on 1 January 2016, management estimates that contribution to consolidated revenue would have been US$ 281,870 thousand, and to consolidated profit for the period would have been US$ 12,514 thousand. In determining these amounts, management has assumed that the fair value adjustments, determined provisionally, that arose on the date of acquisition would have been the same if the acquisition had occurred on January 1, 2016.
Note 5—Cash and Cash Equivalents
As at June 30 2016 | As at December 31 2015 | |||||||
US$ thousands | US$ thousands | |||||||
Cash and balance in banks (a) | 211,734 | 252,154 | ||||||
Time deposits (b) | 22,577 | 106,511 | ||||||
Mutual Fund (c) | — | 1,001 | ||||||
|
|
|
| |||||
| 234,311 | 359,666 | |||||||
|
|
|
| |||||
| (a) | Cash and balance in banks include checking accounts that are freely available and earn interest at market rates ranging from 0.05% to 4.50% p.a, except for Cerro del Aguila (CDA) and Samay, which can only use their funds for project costs payments. |
| (b) | Time deposits are short-term investments made for periods ranging from one day to three months, depending on immediate cash requirements of the Group, and they earn interest at short-term deposit rates in US Dollars and other currencies ranging from 0.06% to 9.10% p.a. |
| (c) | Mutual funds are short-term investments managed by a trustee, with a conservative profile. The funds were released and transferred to cash and balance in banks on January 11, 2016. |
F-20
Table of Contents
IC POWER PTE. LTD.
Notes to the Condensed Consolidated Interim Financial Statements as at June 30, 2016 (Unaudited)
Note 6—Property, Plant and Equipment, net
During the six months ended June 30, 2016, the Group acquired assets with a cost of approximately US$ 209,673 thousand, mainly for the construction of Cerro del Aguila and Samay facilities, and US$ 394,536 thousand in connection with Estrella Cooperatief BA business combination, see Note 4.
As at June 30 2016 | As at December 31 2015 | |||||||
US$ thousands | US$ thousands | |||||||
Cost | ||||||||
Beginning balance | 3,653,399 | 3,085,841 | ||||||
Additions | 209,673 | 576,121 | ||||||
Translation differences affecting reserves | 2,860 | (6,421 | ) | |||||
Business combination | 394,536 | 8,981 | ||||||
Transfers and reclassifications | (5,950 | ) | (2,066 | ) | ||||
Disposals and retirements | (15,750 | ) | (9,057 | ) | ||||
|
|
|
| |||||
Ending balance | 4,238,768 | 3,653,399 | ||||||
|
|
|
| |||||
Accumulated depreciation | ||||||||
Beginning balance | 681,441 | 570,742 | ||||||
Additions | 71,887 | 114,474 | ||||||
Translation differences affecting reserves | 1,218 | (827 | ) | |||||
Transfers and reclassifications | (252 | ) | 1,157 | |||||
Disposals and retirements | (15,081 | ) | (4,105 | ) | ||||
|
|
|
| |||||
Ending balance | 739,213 | 681,441 | ||||||
|
|
|
| |||||
Net cost | 3,499,555 | 2,971,958 | ||||||
|
|
|
| |||||
Note 7—Intangibles assets and goodwill, net
During the six months ended June 30, 2016 as a result of the business combination described in Note 4 the Group recorded intangibles by US$ 178,238 thousand principally related to the concessions of DEORSA and DEOCSA and estimated a preliminary goodwill of US$ 31,368 thousand.
F-21
Table of Contents
IC POWER PTE. LTD.
Notes to the Condensed Consolidated Interim Financial Statements as at June 30, 2016 (Unaudited)
Note 8—Credit from Banks and Others
| In thousands of US$ | Nominal annual interest rate | Currency | Maturity | Carrying | ||||||||
Beginning balance | 2,564,690 | |||||||||||
Business combination | ||||||||||||
Deocsa | ||||||||||||
Syndicated loan-various banks | Libor+4.70% - Libor+4.75% | USD | 2021/2025 | 123,772 | ||||||||
Syndicated loan-various banks | TAPP minus 5.6% - TAPP minus 6.1% | GTQ | 2021/2025 | 46,606 | ||||||||
Deorsa | �� | |||||||||||
Syndicated loan-various banks | Libor+4.70% - Libor+4.75% | USD | 2021/2025 | 76,587 | ||||||||
Syndicated loan-various banks | TAPP minus 5.6% - TAPP minus 6.1% | GTQ | 2021/2025 | 33,987 | ||||||||
Recsa | ||||||||||||
Banco G&T Continental | 7% | GTQ | 2020 | 3,236 | ||||||||
Guatemel | ||||||||||||
Finance lease | TAPP minus 2.47% | GTQ | 2017 | 268 | ||||||||
|
| |||||||||||
Subtotal Business combination | 284,456 | |||||||||||
|
| |||||||||||
Payments of long-term debt | ||||||||||||
Loans from bank and others | (150,200 | ) | ||||||||||
Finance leases | (72,277 | ) | ||||||||||
Debentures | (151,390 | ) | ||||||||||
|
| |||||||||||
Subtotal Payments of long-term debt | (373,867 | ) | ||||||||||
|
| |||||||||||
Proceeds of long-term debt | ||||||||||||
Kallpa Generación: | ||||||||||||
Bonds (a) | 4.875% | USD | 2026 | 347,403 | ||||||||
Kanan: | ||||||||||||
Scotiabank (b) | Libor+3% (minimum 3.5%) | USD | 2021 | 55,000 | ||||||||
Cerro del Águila: | ||||||||||||
Syndicated Loan (c) | From 2.75% to 6.25% + Libor 3M | USD | 2027 | 43,913 | ||||||||
Samay: | ||||||||||||
Syndicated Loan (c) | Libor+2.125% | USD | 2021 | 20,000 | ||||||||
|
| |||||||||||
Subtotal Proceeds of long-term debt | 466,316 | |||||||||||
|
| |||||||||||
Short-term loans from banks | ||||||||||||
Samay: | ||||||||||||
Interbank (d) | 2.90% | USD | 2017 | 31,959 | ||||||||
IC Power Asia Development | ||||||||||||
Bank Hapoalim (f) | 3.16% | NIS | 2016 | 25,000 | ||||||||
Cerro del Águila: | ||||||||||||
Banco de Crédito (e) | Libor 6M + 1.02% | USD | 2017 | 14,000 | ||||||||
Kanan: | ||||||||||||
Scotiabank (b) | Libor+3% (minimum 3.5%) | USD | 2016 | 6,000 | ||||||||
Payments of short term loans, net | (65,330 | ) | ||||||||||
|
| |||||||||||
Subtotal short-term loans from banks | 11,629 | |||||||||||
|
| |||||||||||
Other movements | (10,317 | ) | ||||||||||
|
| |||||||||||
Ending balance | 2,942,907 | |||||||||||
|
| |||||||||||
F-22
Table of Contents
IC POWER PTE. LTD.
Notes to the Condensed Consolidated Interim Financial Statements as at June 30, 2016 (Unaudited)
Note 8—Credit from Banks and Others (cont’d)
TAPP: Active weighted average rate—Tasa activa promedio ponderada
| (a) | On May 24, 2016, Kallpa issued senior notes for an aggregate principal amount of US$ 350,000 thousand in the international capital market under the rule 144A Regulation S. These notes were issued under-par (99.258%) and accrue interest at a fixed rate of 4.875% and will be payable semi-anually with final maturity in May 2026. Principal will be full paid at maturity. The net proceeds from this issue in the amount of US$347,403 thousand were used to repay in full the outstanding balance of: (i) the finance lease agreements (Kallpa II and Kallpa III); (ii) the Kallpa bonds due 2022, (iii) the syndicated loan and (iv) the US$ 45,000 thousand short-term loans. The remainder was used for general corporate purposes. |
| (b) | On January 15, 2016, Kanan Overseas I received a 60- day bridge loan in the aggregate amount of US$ 61,000 thousand from Bank of Nova Scotia, as part of the three Credit Facilities approved. These proceeds were used to repay US$ 50,000 thousand of an intercompany loan with Inkia Energy Ltd.; reimburse costs and expenses incurred in the project; and purchase fuel, raw material and other expenses. The original expiration of this loan was extended up to May 31, 2016. |
| On May 23, 2016 this loan was replaced by a US$ 55,000 thousand 5-year credit facility and by a US$ 6,000 thousand short term loan. The credit facility bears interest on a quarterly basis at LIBOR 3M plus a margin of 3.00%. Scheduled amortizations of principal are payable quarterly commencing in June 2016 through maturity in March 2021. The loans are guaranteed by all of Kanan’s assets. |
| (c) | On February 3, 2016 and February 4, 2016, Cerro del Aguila received proceeds in the aggregate amount of US$ 43,913 thousand under its finance credit facility. After this disbursement, Cerro del Aguila has drawn US$ 590,913 thousand (equivalent to 100% of the total debt approved). |
| In addition, on February 6, 2016 Samay I received proceeds in the aggregate amount of US$ 20,000 thousand under its finance credit facility. After this disbursement, Samay I has drawn US$ 311,000 thousand (equivalent to 100% of the total debt approved). |
| (d) | On February 5, 2016, Samay I signed a short term facility with Interbank for an aggregate of US$ 31,960 thousand to purchase diesel. The facility was paid out under 5 disbursements. It accrues interest at a fixed rate of 2.90% and will expire on February 28, 2017. |
| (e) | On June 30, 2016, Cerro del Aguila received proceeds in the aggregate amount of US$ 14,000 thousand under a short term facility signed with Banco de Credito in order to cover working capital needs, mainly due to a delay in VAT reimbursements. The facility accrues interest at a variable rate of LIBOR 6M plus a margin of 1.02% and will expire on December 30, 2016. |
| (f) | On January 12, 2016, IC Power Asia Development entered into a short-term loan agreement with Bank Hapoalim B.M. The loan bears interest at a fixed rate of 3.16% per annum and was paid together with the principal in one single payment on April 30, 2016. |
| (g) | On May 9, 2016, Overseas Investments Peru S.A., a 100% fully owned subsidiary of the Company, signed a US$ 100,000 thousand Credit Facility with Credit Suisse AG. The proceeds from this facility will be available at the Borrower´s request and subject to meet certain conditions precedent. |
| This facility with final maturity on November 9, 2017 will bear an interest rate of 90-day Libor plus 5.00% (from the funding date to the 6-month anniversary of the funding date); 90-day Libor plus 5.75% (from one day after the 6-month anniversary to the 12 month anniversary of the funding date); and 90-day Libor plus 6.50% thereafter. |
F-23
Table of Contents
IC POWER PTE. LTD.
Notes to the Condensed Consolidated Interim Financial Statements as at June 30, 2016 (Unaudited)
Note 9—Financial instruments
Financial instruments measured at fair value for disclosure purposes only
The carrying amounts of certain financial assets and liabilities, including cash and cash equivalents, deposits and restricted cash, trade receivables, other receivables, trade payables, other payables and derivative instruments are the same or proximate to their fair value.
The fair values of the rest of the financial liabilities, together with the carrying amounts in the condensed consolidated statements of financial position, are as follows:
As at June 30, 2016 | As at December 31, 2015 | |||||||||||||||
Carrying amount | Fair value | Carrying amount | Fair value | |||||||||||||
Loans | 2,005,548 | 2,263,353 | 1,729,669 | 1,944,570 | ||||||||||||
Debentures | 845,560 | 1,015,054 | 671,247 | 764,878 | ||||||||||||
Leases | 91,799 | 93,392 | 163,774 | 175,957 | ||||||||||||
|
|
|
|
|
|
|
| |||||||||
| 2,942,907 | 3,371,799 | 2,564,690 | 2,885,405 | |||||||||||||
|
|
|
|
|
|
|
| |||||||||
Loans from parent company | 224,693 | 225,006 | 17 | 17 | ||||||||||||
|
|
|
|
|
|
|
| |||||||||
| 3,167,600 | 3,596,805 | 2,564,707 | 2,885,422 | |||||||||||||
|
|
|
|
|
|
|
| |||||||||
Fair value hierarchy
The table below presents recurring fair value measurements for financial instruments and financial liabilities. These fair value measurements are categorized into different levels in the fair value hierarchy based on the inputs to the valuation technique used. The different levels are defined as follow.
Level 1: Quoted prices (unadjusted) in active markets for identical assets or liabilities that the Group can access at the measurement date.
Level 2: Inputs other than quoted prices included within Level 1 that are observable for the assets or liability, either directly or indirectly.
Level 3: Unobservable inputs for the asset or liability.
As at June 30, 2016 | As at December 31, 2015 | |||||||
Level 2 | ||||||||
US$ thousands | ||||||||
Financial Assets | ||||||||
Derivatives not used for hedging | 2,622 | 2,864 | ||||||
|
|
|
| |||||
| 2,622 | 2,864 | |||||||
Financial Liabilities | ||||||||
Derivatives used for hedging | 54,722 | 44,909 | ||||||
Derivatives not used for hedging | 3,407 | 3,276 | ||||||
|
|
|
| |||||
| 58,129 | 48,185 | |||||||
F-24
Table of Contents
IC POWER PTE. LTD.
Notes to the Condensed Consolidated Interim Financial Statements as at June 30, 2016 (Unaudited)
Note 9—Financial instruments (cont’d)
Fair value hierarchy (cont’d)
The Group determines Level 2 fair values for derivatives using discounted cash flow technique, which uses contractual cash flows and a market-related discount rate.
Note 10—Segment Information
A. Basis for segmentation
The basis of segmentation and the measurement basis for the segment profit or loss are the same as was presented in Note 27 regarding operating segments in ICP’s annual financial statements, other than as described hereunder.
As a result of the recent acquisition described in Note 4, the Company added to the reportable segments the distribution activity of the new acquisition as a separate segment. Electricity trading company “GUATEMEL” and electricity transmission company “RECSA” are not included within our distribution business and have been included in our Central America and Other segments, respectively, as a result of their businesses lines.
B. Information about reportable segments
For management purposes, the Group is organized into business units as follows:
Distribution | Generation Segment | |||||||||||||||||||||||||||
Guatemala | Peru | Israel | Central America | Others | Adjustments | Total | ||||||||||||||||||||||
For the six months ended June 30, 2016 | ||||||||||||||||||||||||||||
Sales | 240,488 | 236,151 | 175,866 | 156,587 | 72,925 | (901 | ) | 881,116 | ||||||||||||||||||||
Cost of Sales | (180,876 | ) | (152,158 | ) | (144,375 | ) | (120,820 | ) | (47,003 | ) | 901 | (644,331 | ) | |||||||||||||||
Depreciation and amortization | (6,486 | ) | (24,707 | ) | (13,500 | ) | (17,301 | ) | (14,599 | ) | 4,871 | (71,722 | ) | |||||||||||||||
|
|
|
|
|
|
|
|
|
|
|
|
|
| |||||||||||||||
Gross profit | 53,126 | 59,286 | 17,991 | 18,466 | 11,323 | 4,871 | 165,063 | |||||||||||||||||||||
General, selling and administrative expenses | (23,812 | ) | (8,965 | ) | (3,422 | ) | (7,267 | ) | (16,313 | ) | 51 | (59,728 | ) | |||||||||||||||
Other income, net | 2,671 | 9 | — | (128 | ) | 2,687 | — | 5,239 | ||||||||||||||||||||
|
|
|
|
|
|
|
|
|
|
|
|
|
| |||||||||||||||
Operating income | 31,985 | 50,330 | 14,569 | 11,071 | (2,303 | ) | 4,922 | 110,574 | ||||||||||||||||||||
Financing expenses, net | (11,215 | ) | (22,677 | ) | (7,031 | ) | (6,717 | ) | (26,658 | ) | 36 | (74,262 | ) | |||||||||||||||
Share in income of associated companies | — | — | — | — | 343 | — | 343 | |||||||||||||||||||||
|
|
|
|
|
|
|
|
|
|
|
|
|
| |||||||||||||||
Income before taxes | 20,770 | 27,653 | 7,538 | 4,354 | (28,618 | ) | 4,958 | 36,655 | ||||||||||||||||||||
Taxes on income | (5,847 | ) | (8,356 | ) | 418 | (3,762 | ) | (2,794 | ) | (630 | ) | (20,971 | ) | |||||||||||||||
|
|
|
|
|
|
|
|
|
|
|
|
|
| |||||||||||||||
Net income for the period | 14,923 | 19,297 | 7,956 | 592 | (31,412 | ) | 4,328 | 15,684 | ||||||||||||||||||||
|
|
|
|
|
|
|
|
|
|
|
|
|
| |||||||||||||||
Segment assets | 516,452 | 2,132,079 | 601,154 | 462,901 | 1,235,502 | (228,867 | ) | 4,719,221 | ||||||||||||||||||||
Investment in associated companies | — | — | — | 9,337 | 9,337 | |||||||||||||||||||||||
Segment liabilities | 443,423 | 1,647,031 | 459,548 | 299,164 | 1,119,496 | (55,800 | ) | 3,912,862 | ||||||||||||||||||||
F-25
Table of Contents
IC POWER PTE. LTD.
Notes to the Condensed Consolidated Interim Financial Statements as at June 30, 2016 (Unaudited)
Note 10—Segment Information (cont’d)
B. Information about reportable segments (cont’d)
Peru | Israel | Central America | Other Segment | Adjustments | Total | |||||||||||||||||||
For the six months ended June 30, 2015 | ||||||||||||||||||||||||
Sales | 224,941 | 157,567 | 174,669 | 97,845 | — | 655,022 | ||||||||||||||||||
Cost of Sales | (139,416 | ) | (112,137 | ) | (139,891 | ) | (67,037 | ) | — | (458,481 | ) | |||||||||||||
Depreciation and amortization | (24,867 | ) | (11,792 | ) | (10,297 | ) | (11,755 | ) | 4,590 | (54,121 | ) | |||||||||||||
|
|
|
|
|
|
|
|
|
|
|
| |||||||||||||
Gross profit | 60,658 | 33,638 | 24,481 | 19,053 | 4,590 | 142,420 | ||||||||||||||||||
General, selling and administrative expenses | (8,198 | ) | (3,016 | ) | (6,451 | ) | (13,626 | ) | 71 | (31,220 | ) | |||||||||||||
Other income, net | 78 | 1,000 | 254 | 392 | — | 1,724 | ||||||||||||||||||
|
|
|
|
|
|
|
|
|
|
|
| |||||||||||||
Operating income | 52,538 | 31,622 | 18,284 | 5,819 | 4,661 | 112,924 | ||||||||||||||||||
Financing expenses, net | (20,016 | ) | (13,206 | ) | (4,886 | ) | (14,831 | ) | — | (52,939 | ) | |||||||||||||
Share in income of associated companies | — | — | — | 116 | — | 116 | ||||||||||||||||||
|
|
|
|
|
|
|
|
|
|
|
| |||||||||||||
Income before taxes | 32,522 | 18,416 | 13,398 | (8,896 | ) | 4,661 | 60,101 | |||||||||||||||||
Taxes on income | (14,619 | ) | (5,017 | ) | (3,014 | ) | (1,537 | ) | (789 | ) | (24,976 | ) | ||||||||||||
|
|
|
|
|
|
|
|
|
|
|
| |||||||||||||
Net income from continuing operations | 17,903 | 13,399 | 10,384 | (10,433 | ) | 3,872 | 35,125 | |||||||||||||||||
|
|
|
|
|
|
|
|
|
|
|
| |||||||||||||
Segment assets | 1,975,871 | 732,635 | 471,500 | 1,080,943 | (221,599 | ) | 4,039,350 | |||||||||||||||||
Investment in associated companies | — | — | — | 8,916 | — | 8,916 | ||||||||||||||||||
Segment liabilities | 1,424,718 | 623,750 | 280,667 | 848,989 | (169,918 | ) | 3,008,206 | |||||||||||||||||
F-26
Table of Contents
IC POWER PTE. LTD.
Notes to the Condensed Consolidated Interim Financial Statements as at June 30, 2016 (Unaudited)
Note 10—Segment Information (cont’d)
B. Information about reportable segments (cont’d)
Peru | Israel | Central America | Other Segment | Adjustments | Total | |||||||||||||||||||
For the year ended December 31, 2015 | ||||||||||||||||||||||||
Sales | 447,679 | 326,061 | 336,544 | 178,455 | — | 1,288,739 | ||||||||||||||||||
Cost of Sales | (278,957 | ) | (242,383 | ) | (264,932 | ) | (122,710 | ) | — | (908,982 | ) | |||||||||||||
Depreciation and amortization | (49,496 | ) | (25,435 | ) | (20,416 | ) | (24,956 | ) | 9,386 | (110,917 | ) | |||||||||||||
|
|
|
|
|
|
|
|
|
|
|
| |||||||||||||
Gross Profit | 119,226 | 58,243 | 51,196 | 30,789 | 9,386 | 268,840 | ||||||||||||||||||
General, selling and administrative expenses | (18,663 | ) | (6,056 | ) | (13,124 | ) | (34,154 | ) | 138 | (71,859 | ) | |||||||||||||
Other income, net | 1,115 | 1,000 | 1,220 | 1,875 | — | 5,210 | ||||||||||||||||||
|
|
|
|
|
|
|
|
|
|
|
| |||||||||||||
Operating income | 101,678 | 53,187 | 39,292 | (1,490 | ) | 9,524 | 202,191 | |||||||||||||||||
Financing expenses, net | (41,470 | ) | (23,360 | ) | (10,273 | ) | (28,860 | ) | (67 | ) | (104,030 | ) | ||||||||||||
Share in income of associated companies | — | — | — | 274 | — | 274 | ||||||||||||||||||
|
|
|
|
|
|
|
|
|
|
|
| |||||||||||||
Income before taxes | 60,208 | 29,827 | 29,019 | (30,076 | ) | 9,457 | 98,435 | |||||||||||||||||
Taxes on income | (29,621 | ) | (7,642 | ) | (5,938 | ) | (5,339 | ) | (1,512 | ) | (50,052 | ) | ||||||||||||
|
|
|
|
|
|
|
|
|
|
|
| |||||||||||||
Net income from continuing operations | 30,587 | 22,185 | 23,081 | (35,415 | ) | 7,945 | 48,383 | |||||||||||||||||
|
|
|
|
|
|
|
|
|
|
|
| |||||||||||||
Segment assets | 1,985,256 | 652,922 | 454,816 | 1,214,080 | (224,756 | ) | 4,082,318 | |||||||||||||||||
Investment in associated companies | — | — | — | 8,993 | — | 8,993 | ||||||||||||||||||
Segment liabilities | 1,498,066 | 539,668 | 287,332 | 870,701 | (130,575 | ) | 3,065,192 | |||||||||||||||||
Note 11—Commitments
A. OPC Rotem Ltd
Further to that stated in Note 17 of ICP’s annual financial statements, in February 2016 OPC paid in February the principle amount of the system management cost provision in the amount of NIS 154,000 thousand (US$ 40,892 thousand).
On June 30, 2016, the PUA published a resolution for hearing, which reduced the interest rate previously stipulated in the original PUA decision. As a result of the hearing, the system management cost provision was reduced to a total amount of NIS 3,257 thousand (US$ 847 thousand).
B. Advanced Integrated Energy Ltd. (AIE)
SerIDOM Servicios Integrados:
On January 21, 2016 AIE contracted with SerIDOM Servicios Integrados IDOM, S.A.U (hereinafter—“SerIDOM”) for the design, engineering, procurement and construction of combined cycle cogeneration power plant, with an installed capacity of 140 MW, on lump sum, turnkey basis. In accordance with the
F-27
Table of Contents
IC POWER PTE. LTD.
Notes to the Condensed Consolidated Interim Financial Statements as at June 30, 2016 (Unaudited)
Note 11—Commitments (cont’d)
B. Advanced Integrated Energy Ltd. (AIE) (cont’d)
EPC contract, SerIDOM committed to complete construction of the power plant by July 2018. The total cost of the contract is approximately $150 million.
Payment of the consideration is based on progress of the construction and compliance with milestones. SerIDOM committed to compensate AIE in a case of delay or non-compliance with any of its contractual obligations up to the amounts stipulated in the EPC contract, and provided AIE a bank guarantee and a parent company guarantee to secure these commitments.
Note 12—Contingent Liabilities
Details of new claims received and material changes in contingent liabilities since the annual financial statements are described as follows:
A.Kallpa Generación S.A.
| 1. | Import Tax Assessment against Kallpa |
Further to that stated in Note 31(b) of ICP’s annual financial statements, on January 27, 2016, the amount of the claim in connection with Kallpa IV was reduced in S/. 17,220 thousand (US$ 5,240 thousand) without interests, from S/. 17,719 thousand to S/. 499 thousand (from US$ 5,392 thousand to US$ 152 thousand) referred to the engineering services assessment. On February 12, 2016, Kallpa filed an appeal against the part of the resolution that refers to the insurance. As of the date herein, such appeal is pending to be submitted by SUNAT to the Tax Court. Regarding Kallpa I process, a hearing was held on the week of May 25, 2016.
As of the end of June 2016, the total tax exposure related to these assessments is as follows:
Stage | Amount (In thousand S/.) | Amount (In thousand US$) | ||||||||||
Kallpa I | Superior Court of Lima | 32,605 | 9,904 | |||||||||
Kallpa II | Peruvian Tax Court | 22,161 | 6,732 | |||||||||
Kallpa III | Peruvian Tax Court | 21,421 | 6,507 | |||||||||
Kallpa IV | SUNAT | 881 | 268 | |||||||||
|
|
|
| |||||||||
| 77,068 | 23,411 | |||||||||||
|
|
|
| |||||||||
Management and the Company´s legal advisors are of the opinion that Kallpa’s appeals be will more likely than not be successful; accordingly, no provision was recorded in the financial statements.
| 2. | Income Tax Audit 2012 |
On April 18, 2016, as a result of the 2012 income tax audit, SUNAT notified Kallpa with tax assessment for the infringement of a declaration of an inaccurate credit balance. SUNAT states that
F-28
Table of Contents
IC POWER PTE. LTD.
Notes to the Condensed Consolidated Interim Financial Statements as at June 30, 2016 (Unaudited)
Note 12—Contingent Liabilities (cont’d)
A.Kallpa Generación S.A. (cont’d)
the financial expenses by Kallpa (“Commitment fees”, “Financing” and “Legal”) in the amount of S/. 16,528 thousand (US$ 5,030 thousand), on the basis that certain interest accrued on our debt and some maintenance expenses should not have been deducted from Kallpa´s 2012 taxable income but rather treated as an asset. On May 16, 2016, Kallpa filed a complaint appeal against the SUNAT assessment which is pending.
Kallpa’s management and its tax counsel consider that its appeal will more likely than not be successful on the basis that the Peruvian Tax Court has issued precedent that admits the deduction of interest expenses in similar circumstances based on the clear language of article 37a of the Peruvian Income Tax Law; accordingly, no provision was recorded in the financial statements.
As of result of the business combinations described in Note 4, the Company assumed the following main contingencies:
B.Distribuidora de Electricidad de Occidente S.A. (DEOCSA)
| 1. | Compensations for Technical Service Quality: |
Based on the current legal framework in Guatemala, the Company is obliged to compensate its customers for failures in technical service quality. The CNEE establishes parameters for continuity (number and length of interruptions) and establishes fines for failure to comply with such parameters. As of June 30, 2016, sanction processes initiated by the National Energy Electric Commission related to this fines in an aggregate amount of US$ 13,840 thousand (Q. 105,705 thousand). The recognition of these compensations to customers in accordance with the regulations issued by the CNEE depends on the following future events:
| • | That the service, continues being rendered. |
| • | The future consumption volume of the regulated costumers with charge from power. |
| • | The continuity of the regulation. |
| • | That the customer files the claim or that CNEE obliges to compensation. |
| • | The compensation mechanism is not applicable to most of the company’s customers. |
In the opinion of the Company’s management and its legal advisors, a favorable outcome from this claim is more likely than not to occur. Consequently, no provision was recorded at June 30, 2016.
| 2. | Sanction processes initiated by the National Energy Electric Commission (CNEE) in an aggregate amount of US$ 1,654 thousand (Q. 12,630 thousand) as of June 30, 2016. Based on the current legal framework, the Company is required to pay the CNEE penalties for non-compliance of the article 134 of the General Electricity Law and its Regulations. The Company has recorded a provision amounting to US$ 1,654 thousand (Q. 12,630 thousand) as of June 30, 2016 in connection with sanctions in the Administrative Contentious and Revoke instance that based on the Company’s management and its legal advisors an adverse outcome from these claims is more likely than not. |
F-29
Table of Contents
IC POWER PTE. LTD.
Notes to the Condensed Consolidated Interim Financial Statements as at June 30, 2016 (Unaudited)
Note 12—Contingent Liabilities (cont’d)
B.Distribuidora de Electricidad de Occidente S.A. (DEOCSA) (cont’d)
| 3. | Sanction processes initiated by the National Energy Electric Commission in an aggregate amount up to US$ 2,993 thousand (Q. 22,866 thousand) as of June 30, 2016. The CNEE establishes minimum levels of quality for electricity services. In addition, the CNEE imposes certain obligations on distribution companies related to required quality levels, and establishes fines for failure to comply with such quality levels and other obligations that should be compensated to users. Sanctions included herein relates to failure of quality parameters of the supplied electricity (tension, frequency and disturbances), and minimum standards for customer service. The Company has recorded a provision amounting to US$ 2,448 thousand (Q. 18,696 thousand) on those processes that the Company’s management and its legal advisors believe that an adverse outcome is more likely than not to occur. |
| 4. | Civil petitions submitted by third parties for damages and several injuries to the Company in the amounts of US$ 5,869 thousand (Q. 44,820 thousand) as of June 30, 2016. The Company has recorded a provision amounting to US$ 85 thousand (Q. 650 thousand) on those processes that the Company’s management and its legal advisors believe that an adverse outcome is more likely than not to occur. |
| 5. | Administrative Contentious Processes |
The Company faces several Administrative Contentious Processes, most against resolutions issued by the CNEE amounting US$ 666 thousand (Q. 5,087 thousand) as of June 30, 2016 because of failures in quality service. The Company has recorded a provision amounting to US$ 382 thousand (Q. 2,921 thousand) on those processes that the Company’s management and its legal advisors believe that an adverse outcome is more likely than not to occur.
C.Distribuidora de Electricidad de Oriente S.A. (DEORSA)
| 1. | Compensations for Technical Service Quality: |
Based on the current legal framework in Guatemala, the Company is obliged to compensate its customers for failures in technical service quality. The CNEE establishes parameters for continuity (number and length of interruptions) and establishes fines for failure to comply with such parameters. As of June 30, 2016, sanction processes initiated by the National Energy Electric Commission related to this fines in an aggregate amount of US$ 16,548 thousand (Q. 126,386 thousand). The recognition of these compensations to customers in accordance with the regulations issued by the CNEE depends on the following future events:
| • | That the service, continues being rendered. |
| • | The future consumption volume of the regulated costumers with charge from power. |
| • | The continuity of the regulation. |
| • | That the customer files the claim or that CNEE obliges to compensation. |
| • | The compensation mechanism is not applicable to most of the company’s customers. |
F-30
Table of Contents
IC POWER PTE. LTD.
Notes to the Condensed Consolidated Interim Financial Statements as at June 30, 2016 (Unaudited)
Note 12—Contingent Liabilities (cont’d)
C.Distribuidora de Electricidad de Oriente S.A. (DEORSA)(cont’d)
In the opinion of the Company’s management and its legal advisors, a favorable outcome from this claim is more likely than not to occur. Consequently, no provision was recorded as at June 30, 2016.
| 2. | Sanction processes initiated by the National Energy Electric Commission (CNEE) in an aggregate amount of US$ 3,856 thousand (Q. 29,476 thousand) as of June 30, 2016. Based on the current legal framework, the Company is required to pay the CNEE penalties for non-compliance of the article 134 of the General Electricity Law and its Regulations. The Company has recorded a provision amounting to US$ 2,447 thousand (Q. 18,688 thousand) as of June 30, 2016 in connection with sanctions in the Administrative Contentious and Revoke instance that based on the Company’s management and its legal advisors an adverse outcome from these claims is more likely than not. |
| 3. | Sanction processes initiated by the National Energy Electric Commission in an aggregate amount up to US$ 5,532 thousand (Q. 42,252 thousand) as of June 30, 2016. The CNEE establishes minimum levels of quality for electricity services. In addition, the CNEE imposes certain obligations on distribution companies related to required quality levels, and establishes fines for failure to comply with such quality levels and other obligations that should be compensated to users. Sanctions included herein relates to failure of quality parameters of the supplied electricity (tension, frequency and disturbances), and minimum standards for customer service. The Company has recorded a provision amounting to US$ 1,854 thousand (Q. 14,156 thousand) on those processes that the Company’s management and its legal advisors believe that an adverse outcome is more likely than not to occur. |
| 4. | Civil petitions submitted by third parties for damages and several injuries to the Company in the amounts of US$ 11,197 thousand (Q. 85,515 thousand) as of June 30, 2016. The Company has recorded a provision amounting to US$ 229 thousand (Q. 1,751 thousand) on those processes that the Company’s management and its legal advisors believe that an adverse outcome is more likely than not to occur. |
| 5. | Administrative Contentious Processes: |
The Company faces several Administrative Contentious Processes, most against resolutions issued by the CNEE amounting US$ 745 thousand (Q. 5,693 thousand) as of June 30, 2016 because of failures in quality service. The Company has recorded a provision amounting to US$ 192 thousand (Q. 1,464 thousand) on those processes that the Company’s management and its legal advisors believe that an adverse outcome is more likely than not to occur.
Note 13—Income Tax
On January 5, 2016 Amendment 216 to the Israeli Income Tax Ordinance (New Version)—1961 (hereinafter—“the Ordinance”) was passed in the Knesset. As part of the amendment, ICP’s tax rate was reduced by 1.5%, from 26.5% to a rate of 25% as from 2016. The effect of the change on the Company’s consolidated financial statements as at June 30, 2016 was a decrease in the deferred tax liabilities and taxes on income in the amount of US$ 2,296 thousand.
F-31
Table of Contents
IC POWER PTE. LTD.
Notes to the Condensed Consolidated Interim Financial Statements as at June 30, 2016 (Unaudited)
Note 14—Subsequent Events
a. Energuate
On July 26, 2016, Energuate became aware of a legal proceeding initiated by the Guatemalan Tax Administration (“SAT”) for payment of purported back taxes for approximately $17,171 thousand (Q. 130,499 thousand) for the years 2011 and 2012. Such amount is subject to interest charges and penalties. The SAT alleges that Energuate deduction of the interest expenses and amortization of goodwill from the taxable income were improper. The transaction dates back to 2011, when prior controlling shareholders acquired the shares of DEOCSA and DEORSA and were subsequently merged. The SAT may further seek purported back taxes for the years 2013, 2014 and 2015.
At a hearing on August 9, 2016, Energuate reached an understanding with tax authorities where it will conditionally pay within the next 60 days the 2011 and 2012 principal, interest and penalties claimed by the SAT. In order to release the bank accounts’ seizure imposed by the tribunal, to reduce any resulting penalties by the SAT and to prevent further legal demands from the SAT for the purported back taxes for the years 2013, 2014 and 2015, Energuate paid $18,093 thousand (Q. 137,505 thousand) including taxes, penalties and interests for the years 2014 and 2015 on August 9, 2016, $17,171 thousand (Q. 130,499 thousand) related to taxes for the years 2011 and 2012 on August 10, 2016, and $13,189 thousand (Q. 100,236 thousand) including taxes, penalties and interests for the year 2013 on August 19, 2016. A payment of approximately $27,143 thousand (Q. 206,289 thousand) subject to recalculation as of the date of payment, related to penalties and interests for year 2011 and 2012 will be made during 60 days beginning August 10, 2016. Furthermore, Energuate has notified the SAT that is making all such payments reserving all legal rights to seek restitution of such payments by contesting legally the merits of the SAT claim. Energuate’s management and its legal advisors consider that Energuate has all legal rights and hence, that it will initiate the necessary legal procedures to pursue the collection of the amounts paid in connection with such claim.
Since the inception of the transactions in 2011 and up to date, the opinion of Energuate’s management and its legal and tax advisors is that the transactions that generated the interest expenses and the amortization of goodwill deductions are legitimate tax deductions. This position was confirmed in February 2015 by a binding ruling issued by the SAT. Hence, Energuate’s management considers, based on the opinion of its tax and legal advisors that there is a probability greater than 50% in the recoverability of these payments as a result of the final outcome of this claim and of the other recourses to be initiated by Energuate. These payments will be treated as income tax payments in excess and presented in the third quarter financial statements as account receivable.
b. Samay I
The four operating units of Samay I were declared operational in May 2016. The Samay I plant was expected to have very limited dispatch for its first phase, while it runs on diesel fuel. Once natural gas becomes available for Samay I, within the next 3 or 4 years, the plant is expected to increase its dispatch. The plant was dispatched in May, June and part of July 2016 with a less than 5% load factor.
In July 2016, the plant demonstrated above normal operational indicators. Samay I, Posco (EPC Contractor) and General Electric (GE) inspected the units. Those inspections revealed structural damage to units 2, 3, and 4. All four units were declared unavailable to the system. Additionally, Government entities (Ministry of Energy and Mines and OSINERGMIN) were informed of the force majeure event and the Lenders and the Insurance counterparties were informed of the occurrences.
F-32
Table of Contents
IC POWER PTE. LTD.
Notes to the Condensed Consolidated Interim Financial Statements as at June 30, 2016 (Unaudited)
Note 14—Subsequent Events (cont’d)
b. Samay I (cont’d)
Based upon preliminary estimates, repair schedules indicate that all four units should be operational within the next 6 months, but Samay continues to assess the situation and no definitive determination has been made as to when the units will return to operation .The plant is intended to operate as a reserve facility (expected to have very limited dispatch) in its current initial phase until gas becomes available to the plant. Samay continues to receive payments under its PPA, but it is subject to penalties depending on the amount of time the plant is not available.
Samay intends to seek coverage for the costs of such outage, including repair costs, penalties and loss of profit, as appropriate, from the EPC contractor, equipment manufacturer and/or the insurance coverage (subject to deductibles).
c. Cerro del Aguila (CDA)
On August 3, 2016, two out of the three units of CDA were declared fully operational. On August 25, 2016, the third generating unit of CDA was declared fully operational, reaching the commercial operation date (“COD”) of the power plant. With the completion of this unit, CDA is now capable of generating 510MW, making IC Power the principal power producer in Peru.
d. Advanced Integrated Energy Ltd.
Senior Facilities Agreement:
On July 4, 2016, AIE entered into a Senior Facilities Agreement (hereinafter—“the Senior Facilities Agreement”) with Israel Discount Bank Ltd. (hereinafter—“Discount”) and Harel Insurance Company Ltd. (hereinafter—“Harel”) to finance the construction of the Power Plant.
Pursuant to the Senior Facilities Agreement, the lenders committed to provide AIE up to NIS 1,006,000 thousands (approximately $260,000 thousands) of financing for (i) along-term credit facility (including a facility for variances in the construction and related costs), (ii) a working capital facility, (iii) a debt service reserve account and VAT facility, (iv) a guarantees facility and (v) a hedging facility.
As of the date of these financial statements, AIE has not yet satisfied all of the customary conditions to draw under the facilities.
F-33
Table of Contents
IC Power Ltd.
Consolidated Financial
Statements
As at December 31, 2015
In thousands of U.S. Dollars
Table of Contents
IC POWER LTD.
Contents
PAGE | ||||
| F-36 | ||||
| F-37 | ||||
| F-38 | ||||
| F-39 | ||||
| F-40 | ||||
| F-43 | ||||
| F-44 | ||||
F-35
Table of Contents
Somekh Chaikin KPMG Millennium Tower 17 Ha’arba’a Street, PO Box 609 Tel Aviv 61006 Israel |
Telephone Fax Internet |
972 3 684 8000 972 3 684 8444 www.kpmg.co.il |
Report of Independent Registered Public Accounting Firm
The Board of Directors and Shareholders of IC Power Ltd
We have audited the accompanying consolidated statements of financial position of IC Power Ltd. and subsidiaries (the Company) as at December 31, 2015 and 2014, and the related consolidated statements of income, comprehensive income, changes in equity and cash flows for each of the years in the three-year period ended December 31, 2015. These consolidated financial statements are the responsibility of the Company’s management. Our responsibility is to express an opinion on these consolidated financial statements based on our audits.
We conducted our audits in accordance with the standards of the Public Company Accounting Oversight Board (United States). Those standards require that we plan and perform the audit to obtain reasonable assurance about whether the financial statements are free of material misstatement. An audit includes examining, on a test basis, evidence supporting the amounts and disclosures in the financial statements. An audit also includes assessing the accounting principles used and significant estimates made by management, as well as evaluating the overall financial statement presentation. We believe that our audits provide a reasonable basis for our opinion.
In our opinion, the consolidated financial statements referred to above present fairly, in all material respects, the financial position of the Company as of December 31, 2015 and 2014, and the results of its operations and its cash flows for each of the years in the three-year period ended December 31, 2015, in conformity with International Financial Reporting Standards as issued by the International Accounting Standards Board.

Somekh Chaikin
Certified Public Accountants (Isr.)
Member Firm of KPMG International
Tel Aviv, Israel
March 30, 2016
Somekh Chaikin, a partnership registered under the Israeli Partnership Ordinance, is the Israeli member firm of KPMG International, a Swiss cooperative. |
F-36
Table of Contents
Consolidated Statements of Financial Position as at December 31
2015 | 2014 | |||||||||||
Note | US$ thousands | US$ thousands | ||||||||||
Current assets | ||||||||||||
Cash and cash equivalents | 6 | 359,587 | 583,296 | |||||||||
Short-term deposits and restricted cash | 7 | 301,955 | 207,646 | |||||||||
Trade receivables | 8 | 123,273 | 181,358 | |||||||||
Other receivables and debit balances | 9 | 45,389 | 58,106 | |||||||||
Income tax receivable | 3,926 | 3,332 | ||||||||||
Inventories | 10 | 50,351 | 55,335 | |||||||||
|
|
|
| |||||||||
Total current assets | 884,481 | 1,089,073 | ||||||||||
|
|
|
| |||||||||
Non-current assets | ||||||||||||
Restricted cash | 7 | 16,371 | 28,351 | |||||||||
Investments in associated companies | 11 | 8,993 | 9,625 | |||||||||
Deposits and other debit balances, including derivative instruments | 49,661 | 28,233 | ||||||||||
Income tax receivable | 10,119 | 6,779 | ||||||||||
Deferred taxes, net | 24 | 2,693 | *25,743 | |||||||||
Property, plant and equipment | 12 | 2,971,952 | 2,515,099 | |||||||||
Intangible assets | 13 | 147,244 | 138,734 | |||||||||
|
|
|
| |||||||||
Total non-current assets | 3,207,033 | 2,752,564 | ||||||||||
|
|
|
| |||||||||
Total assets | 4,091,514 | 3,841,637 | ||||||||||
|
|
|
| |||||||||
Current liabilities | ||||||||||||
Credit from banks and others | 14 | 352,618 | 161,486 | |||||||||
Trade payables | 15 | 143,958 | 143,639 | |||||||||
Other payables and credit balances, including derivative instruments | 16 | 106,630 | 112,680 | |||||||||
Provisions | 17 | 41,686 | 27,187 | |||||||||
Income taxes payable | 4,689 | 6,766 | ||||||||||
|
|
|
| |||||||||
Total current liabilities | 649,581 | 451,758 | ||||||||||
|
|
|
| |||||||||
Non-current liabilities | ||||||||||||
Loans from banks and others | 14 | 1,556,225 | 1,499,504 | |||||||||
Debentures | 14 | 655,847 | 686,942 | |||||||||
Derivative instruments | 16 | 35,625 | 21,045 | |||||||||
Deferred taxes, net | 24 | 140,428 | *145,746 | |||||||||
Other long term liabilities | 16 | 27,219 | 23,982 | |||||||||
|
|
|
| |||||||||
Total non-current liabilities | 2,415,344 | 2,377,219 | ||||||||||
|
|
|
| |||||||||
Total liabilities | 3,064,925 | 2,828,977 | ||||||||||
|
|
|
| |||||||||
Equity | 18 | |||||||||||
Share capital and premium | 430,572 | 430,572 | ||||||||||
Capital reserves | (27,096 | ) | (18,051 | ) | ||||||||
Retained earnings | 422,920 | *389,306 | ||||||||||
|
|
|
| |||||||||
Total equity attributable to the equity holders of the Company | 826,396 | 801,827 | ||||||||||
|
|
|
| |||||||||
Non-controlling interest | 19 | 200,193 | *210,833 | |||||||||
|
|
|
| |||||||||
Total equity | 1,026,589 | 1,012,660 | ||||||||||
|
|
|
| |||||||||
Total liabilities and equity | 4,091,514 | 3,841,637 | ||||||||||
|
|
|
| |||||||||
|
|
| ||
|
|
| ||
Arunava Sen Director | Javier Garcia Chief Executive Officer | Alberto Triulzi Chief Financial Officer |

(*) Immaterial adjustment of comparative data—See Note 3 regarding basis of preparation.
The accompanying notes are an integral part of these financial statements.
F-37
Table of Contents
Consolidated Statements of Income for the Year Ended December 31
2015 | 2014 | 2013 | ||||||||||||||
Note | US$ thousands | US$ thousands | US$ thousands | |||||||||||||
Continuing Operations | ||||||||||||||||
Sales | 1,288,739 | 1,372,230 | 873,370 | |||||||||||||
Cost of sales (excluding depreciation and amortization) | 20 | (908,982 | ) | (936,722 | ) | (593,802 | ) | |||||||||
Depreciation and amortization | 12(G) | (110,917 | ) | (100,996 | ) | (71,627 | ) | |||||||||
|
|
|
|
|
| |||||||||||
Gross profit | 268,840 | 334,512 | 207,941 | |||||||||||||
General, selling and administrative expenses | 21 | (71,390 | ) | (68,673 | ) | (41,180 | ) | |||||||||
Asset write-off | 12 | — | (34,673 | ) | — | |||||||||||
Gain on bargain purchase | 4 | — | 68,210 | 1,320 | ||||||||||||
Measurement to fair value of pre-existing share | 4 | — | 2,674 | — | ||||||||||||
Other expenses | 23 | (6,280 | ) | (10,806 | ) | (708 | ) | |||||||||
Other income | 22 | 11,490 | 16,883 | 4,240 | ||||||||||||
|
|
|
|
|
| |||||||||||
Operating income | 202,660 | 308,127 | 171,613 | |||||||||||||
|
|
|
|
|
| |||||||||||
Financing expenses | 24 | 114,713 | 112,897 | 85,694 | ||||||||||||
Finance expenses on IC capital notes settlement | 24 | — | 12,602 | — | ||||||||||||
Financing income | 24 | (10,684 | ) | (6,137 | ) | (5,543 | ) | |||||||||
|
|
|
|
|
| |||||||||||
Financing expenses, net | 104,029 | 119,362 | 80,151 | |||||||||||||
|
|
|
|
|
| |||||||||||
Share in income of associated companies | 11 | 274 | 2,000 | 1,929 | ||||||||||||
|
|
|
|
|
| |||||||||||
Income before taxes from continuing operations | 98,905 | 190,765 | 93,391 | |||||||||||||
|
|
|
|
|
| |||||||||||
Taxes on income | 25 | (50,052 | ) | *(62,841 | ) | *(48,054 | ) | |||||||||
|
|
|
|
|
| |||||||||||
Net income from continuing operations | 48,853 | 127,924 | 45,337 | |||||||||||||
|
|
|
|
|
| |||||||||||
Discontinued Operations | ||||||||||||||||
Net income from discontinued operations, net of tax | 5 | 3,850 | 128,055 | 28,427 | ||||||||||||
|
|
|
|
|
| |||||||||||
Net income for the year | 52,703 | 255,979 | 73,764 | |||||||||||||
|
|
|
|
|
| |||||||||||
Attributable to: | ||||||||||||||||
Owners of the company | 35,805 | 226,904 | 60,902 | |||||||||||||
Non-controlling interest | 19 | 16,898 | 29,075 | 12,862 | ||||||||||||
|
|
|
|
|
| |||||||||||
Net income for the year | 52,703 | 255,979 | 73,764 | |||||||||||||
|
|
|
|
|
| |||||||||||
Earnings per share | ||||||||||||||||
Basic and diluted earnings per share (in USD) | 28 | 3.6 | *22.7 | *6.1 | ||||||||||||
Earnings per share—Continuing operations | ||||||||||||||||
Basic and diluted earnings per share (in USD) | 28 | 3.2 | *9.9 | *3.2 | ||||||||||||
| (*) | Immaterial adjustment of comparative data—See Note 3 regarding basis of preparation. |
The accompanying notes are an integral part of these financial statements.
F-38
Table of Contents
Consolidated Statement of Comprehensive Income for the Year Ended December 31
2015 | 2014 | 2013 | ||||||||||
US$ thousands | US$ thousands | US$ thousands | ||||||||||
Net income for the year | 52,703 | 255,979 | 73,764 | |||||||||
|
|
|
|
|
| |||||||
Components of other comprehensive income | ||||||||||||
Items that will be subsequently reclassified to profit or loss | ||||||||||||
Foreign currency translation differences in respect of foreign operations | (6,280 | ) | (9,771 | ) | 2,006 | |||||||
Foreign currency translation differences from discontinued operations that will be transferred to profit or loss | — | — | (26,268 | ) | ||||||||
Foreign currency translation differences in respect of foreign operations from discontinued operations recognized in profit and loss | — | (24,891 | ) | — | ||||||||
Group’s share in comprehensive income from investment in Associated companies | (269 | ) | (17 | ) | (104 | ) | ||||||
Change in fair value of derivatives used to hedge cash flows | (9,076 | ) | (8,820 | ) | (18,582 | ) | ||||||
Income tax on other comprehensive income | 3,081 | 2,303 | 5,554 | |||||||||
|
|
|
|
|
| |||||||
Other comprehensive loss for the year, net of tax | (12,544 | ) | (41,196 | ) | (37,394 | ) | ||||||
|
|
|
|
|
| |||||||
Total comprehensive income for the year | 40,159 | *214,783 | *36,370 | |||||||||
|
|
|
|
|
| |||||||
Attributable to: | ||||||||||||
Owners of the company | 26,491 | 189,805 | 26,329 | |||||||||
Non-controlling interest | 13,668 | 24,978 | 10,041 | |||||||||
|
|
|
|
|
| |||||||
Total comprehensive income for the year | 40,159 | 214,783 | 36,370 | |||||||||
|
|
|
|
|
| |||||||
| (*) | Immaterial adjustment of comparative data—See Note 3 regarding basis of preparation. |
The accompanying notes are an integral part of these financial statements.
F-39
Table of Contents
Consolidated Statement of Changes in Equity
Attributable to equity holders of the Company | Non- controlling | Total equity | ||||||||||||||||||||||||||||||
Share capital and premium | Translation | Hedging reserve | Controlling | Retained | Total | |||||||||||||||||||||||||||
US$ thousands | US$ thousands | US$ thousands | US$ thousands | US$ thousands | US$ thousands | US$ thousands | US$ thousands | |||||||||||||||||||||||||
For the year ended December 31, 2015 | ||||||||||||||||||||||||||||||||
Balance as at January 1, 2015 | 430,572 | (28,495 | ) | (12,796 | ) | 23,240 | 389,306 | 801,827 | 210,833 | 1,012,660 | ||||||||||||||||||||||
Acquisition of non-controlling interests, note 19 | — | — | — | — | (1,922 | ) | (1,922 | ) | (18,078 | ) | (20,000 | ) | ||||||||||||||||||||
Dividends to non-controlling interests in subsidiaries, note 19 | — | — | — | — | — | — | (12,340 | ) | (12,340 | ) | ||||||||||||||||||||||
Non-controlling Shareholder contribution | — | — | — | — | — | — | 6,110 | 6,110 | ||||||||||||||||||||||||
Profit for the year | — | — | — | — | 35,805 | 35,805 | 16,898 | 52,703 | ||||||||||||||||||||||||
Other comprehensive income for the year, net of tax | — | (4,854 | ) | (4,191 | ) | — | (269 | ) | (9,314 | ) | (3,230 | ) | (12,544 | ) | ||||||||||||||||||
|
|
|
|
|
|
|
|
|
|
|
|
|
|
|
| |||||||||||||||||
Balance as at December 31, 2015 | 430,572 | (33,349 | ) | (16,987 | ) | 23,240 | 422,920 | 826,396 | 200,193 | 1,026,589 | ||||||||||||||||||||||
|
|
|
|
|
|
|
|
|
|
|
|
|
|
|
| |||||||||||||||||
The accompanying notes are an integral part of these financial statements.
F-40
Table of Contents
IC POWER LTD.
Condensed Consolidated Interim Statement of Changes in Equity (cont’d)
| Attributable to equity holders of the Company | Non- | Total equity | ||||||||||||||||||||||||||||||
Share capital and premium | Translation | Hedging | Controlling | Retained | Total | |||||||||||||||||||||||||||
US$ thousands | US$ thousands | US$ thousands | US$ thousands | US$ thousands | US$ thousands | US$ thousands | US$ thousands | |||||||||||||||||||||||||
For the year ended December 31, 2014 | ||||||||||||||||||||||||||||||||
Balance as at January 1, 2014 | 430,572 | 3,445 | (7,637 | ) | 23,240 | *199,726 | 649,346 | *144,257 | 793,603 | |||||||||||||||||||||||
Non-controlling interests in respect of business combination | — | — | — | — | — | — | 35,800 | 35,800 | ||||||||||||||||||||||||
Dividends to non-controlling interests in subsidiaries | — | — | — | — | — | — | (13,910 | ) | (13,910 | ) | ||||||||||||||||||||||
Dividends to Former Parent company | — | — | — | — | (37,324 | ) | (37,324 | ) | — | (37,324 | ) | |||||||||||||||||||||
Non-controlling Shareholder contribution | — | — | — | — | — | — | 19,577 | 19,577 | ||||||||||||||||||||||||
Transactions with controlling shareholder | — | — | — | — | — | — | 131 | 131 | ||||||||||||||||||||||||
Profit for the year | — | — | — | — | 226,904 | 226,904 | 29,075 | 255,979 | ||||||||||||||||||||||||
Other comprehensive income for the year, net of tax | — | (31,940 | ) | (5,159 | ) | — | — | (37,099 | ) | (4,097 | ) | (41,196 | ) | |||||||||||||||||||
|
|
|
|
|
|
|
|
|
|
|
|
|
|
|
| |||||||||||||||||
Balance as at December 31, 2014 | 430,572 | (28,495 | ) | (12,796 | ) | 23,240 | 389,306 | 801,827 | 210,833 | 1,012,660 | ||||||||||||||||||||||
|
|
|
|
|
|
|
|
|
|
|
|
|
|
| �� | |||||||||||||||||
| (*) | Immaterial adjustment of comparative data—See Note 3 regarding basis of preparation. |
The accompanying notes are an integral part of these financial statements.
F-41
Table of Contents
IC POWER LTD.
Condensed Consolidated Interim Statement of Changes in Equity (cont’d)
Attributable to equity holders of the Company | Non- | Total equity | ||||||||||||||||||||||||||||||
Share capital and premium | Translation | Hedging | Controlling | Retained | Total | |||||||||||||||||||||||||||
US$ thousands | US$ thousands | US$ thousands | US$ thousands | US$ thousands | US$ thousands | US$ thousands | US$ thousands | |||||||||||||||||||||||||
For the year ended December 31, 2013 | ||||||||||||||||||||||||||||||||
Balance as at January 1, 2013 | 430,572 | 28,211 | 2,170 | 20,965 | *138,824 | 620,742 | *129,334 | 750,076 | ||||||||||||||||||||||||
Dividends to non-controlling interests in subsidiaries | — | — | — | — | — | — | (23,266 | ) | (23,266 | ) | ||||||||||||||||||||||
Non-controlling Shareholder contribution | — | — | — | — | — | — | 27,602 | 27,602 | ||||||||||||||||||||||||
Controlling shareholder reserve | — | — | — | 2,275 | — | 2,275 | 546 | 2,821 | ||||||||||||||||||||||||
Profit for the year | — | — | — | — | 60,902 | 60,902 | 12,862 | 73,764 | ||||||||||||||||||||||||
Other comprehensive income for the year, net of tax | — | (24,766 | ) | (9,807 | ) | — | — | (34,573 | ) | (2,821 | ) | (37,394 | ) | |||||||||||||||||||
|
|
|
|
|
|
|
|
|
|
|
|
|
|
|
| |||||||||||||||||
Balance as at December 31, 2013 | 430,572 | 3,445 | (7,637 | ) | 23,240 | *199,726 | 649,346 | *144,257 | 793,603 | |||||||||||||||||||||||
|
|
|
|
|
|
|
|
|
|
|
|
|
|
|
| |||||||||||||||||
| (*) | Immaterial adjustment of comparative data—See Note 3 regarding basis of preparation. |
The accompanying notes are an integral part of these financial statements.
F-42
Table of Contents
Consolidated Statements of Cash Flows for the Year Ended December 31
2015 | 2014 | 2013 | ||||||||||
US$ thousands | US$ thousands | US$ thousands | ||||||||||
Cash flows from operating activities | ||||||||||||
Net income for the year | 52,703 | *255,979 | *73,764 | |||||||||
Adjustments: | ||||||||||||
Depreciation and amortization | 119,427 | 108,413 | 75,570 | |||||||||
Asset write-off | — | 34,673 | — | |||||||||
Financing expenses, net | 104,029 | 119,362 | 80,151 | |||||||||
Share in income of associated companies | (274 | ) | (2,000 | ) | (1,929 | ) | ||||||
Fuel inventories write-off | 623 | 1,991 | 558 | |||||||||
Bad debt expense | — | 628 | — | |||||||||
Bonus plan transactions | — | 2,541 | 3,763 | |||||||||
Income tax expenses | 50,052 | *62,841 | *48,054 | |||||||||
Gain on bargain purchase (negative goodwill) | — | (68,210 | ) | (1,320 | ) | |||||||
Measurement to fair value of pre-existing share | — | (2,674 | ) | — | ||||||||
Loss (gain) on disposal of property, plant and equipment | 3,421 | 7,859 | (17 | ) | ||||||||
Net income from discontinued operations, net of tax | — | (114,028 | ) | (28,546 | ) | |||||||
|
|
|
|
|
| |||||||
| 329,981 | 407,375 | 250,048 | ||||||||||
|
|
|
|
|
| |||||||
Change in inventories | 4,361 | 12,420 | (2,083 | ) | ||||||||
Change in trade and other receivables | 35,924 | 21,132 | (53,972 | ) | ||||||||
Change in trade and other payables | (31,235 | ) | 521 | 48,204 | ||||||||
Change in provisions and employee benefits | 12,857 | (4,046 | ) | 21,767 | ||||||||
|
|
|
|
|
| |||||||
| 351,888 | 437,402 | 263,964 | ||||||||||
|
|
|
|
|
| |||||||
Income taxes paid | (36,204 | ) | (56,531 | ) | (23,685 | ) | ||||||
Dividend received | 637 | 5,877 | 5,534 | |||||||||
Dividend received from discontinued operations | 3,850 | 26,350 | 25,890 | |||||||||
|
|
|
|
|
| |||||||
Net cash provided by operating activities | 320,171 | 413,098 | 271,703 | |||||||||
|
|
|
|
|
| |||||||
Cash flows from investing activities | ||||||||||||
Proceeds from sale of property, plant and equipment | 514 | 213 | 3,999 | |||||||||
Short term deposits and restricted cash, net | (83,408 | ) | (221,472 | ) | 74,108 | |||||||
Business combinations | (9,441 | ) | (69,986 | ) | (27,850 | ) | ||||||
Payment of consideration retained | (3,795 | ) | — | — | ||||||||
Acquisition of fixed assets | (517,821 | ) | (425,880 | ) | (293,841 | ) | ||||||
Acquisition of intangible assets | (16,844 | ) | (11,483 | ) | (9,123 | ) | ||||||
Value Added Tax, net of project under construction | 2,121 | (13,160 | ) | (8,082 | ) | |||||||
Interest received | 7,923 | 3,518 | 2,931 | |||||||||
Sale of associate, qualified as discontinued operations | — | 359,938 | — | |||||||||
|
|
|
|
|
| |||||||
Net cash used in investment activities | (620,751 | ) | (378,312 | ) | (257,858 | ) | ||||||
|
|
|
|
|
| |||||||
Cash flows from financing activities | ||||||||||||
Acquisition of non-controlling interests | (20,000 | ) | — | — | ||||||||
Dividend paid to non-controlling interest | (12,340 | ) | (13,910 | ) | (23,266 | ) | ||||||
Receipt of long-term loans, Capital notes and Debentures | 226,169 | 666,621 | 323,063 | |||||||||
Repayment of long-term loans, Debentures and Capital notes | (138,234 | ) | (374,152 | ) | (80,660 | ) | ||||||
Interest paid | (93,832 | ) | (94,627 | ) | (59,722 | ) | ||||||
Proceeds from non-controlling Shareholder contribution | 6,110 | 19,577 | 27,602 | |||||||||
Short-term credit from banks and others, net | 123,453 | 19,927 | 138,630 | |||||||||
Dividends paid to Former parent company | — | (37,324 | ) | — | ||||||||
Payment of issuance expenses | (2,620 | ) | (9,187 | ) | (5,686 | ) | ||||||
Payment of consent fee | (400 | ) | (1,012 | ) | — | |||||||
Effect of discontinued operations | — | (128,709 | ) | — | ||||||||
|
|
|
|
|
| |||||||
Net cash provided by financing activities | 88,306 | 47,204 | 319,961 | |||||||||
|
|
|
|
|
| |||||||
Net increase in cash and cash equivalents | (212,274 | ) | 81,990 | 333,806 | ||||||||
Cash and cash equivalents at beginning of the year | 583,296 | 516,804 | 183,671 | |||||||||
Effect of changes in the exchange rate on cash and cash equivalents | (11,435 | ) | (15,498 | ) | (673 | ) | ||||||
|
|
|
|
|
| |||||||
Cash and cash equivalents at end of the year | 359,587 | 583,296 | 516,804 | |||||||||
|
|
|
|
|
| |||||||
Non-cash investing transactions: | ||||||||||||
Acquisition of fixed assets under lease contract | — | (107,688 | ) | — | ||||||||
Amortization of transaction costs capitalized | (11,967 | ) | (34,020 | ) | (1,105 | ) | ||||||
Purchase of fixed assets on credit and others | (46,327 | ) | (9,000 | ) | (17,923 | ) | ||||||
| (*) | Immaterial adjustment of comparative data—See Note 3 regarding basis of preparation. |
The accompanying notes are an integral part of these financial statements.
F-43
Table of Contents
Notes to the Consolidated Financial Statements as at December 31, 2015
A. The Reporting Entity
I.C. Power Ltd. (hereinafter—“the Company”) is an Israeli-resident company that was incorporated on January 4, 2010 as a private company and its registered address is 23 Aranha St., Tel-Aviv, Israel. The Company’s administrative offices are located in Lima, Peru.
As of January 6, 2015, IC Power Ltd. was a wholly-owned subsidiary of Israel Corporation Ltd. (hereinafter—“IC” or “the Former Parent Company”). On January 7, 2015, Israel Corp. transferred all of IC Power Shares to Kenon Holdings Ltd (“Kenon” or “The Parent Company”) as part of its internal reorganization. Kenon is a publicly listed company in both the New York Stock Exchange and Tel Aviv Stock Exchange.
The Group’s financial statements include those of the Company and its subsidiaries (hereinafter—“the Group”) as well as the Group’s share in associated companies. The Group is engaged, through subsidiaries, in the operation of power generation plants and in the development of energy projects.
The Group, through its operating subsidiaries and associates, provides electricity generation using different technologies such as hydroelectric, natural gas and diesel turbines and heavy fuel oil engines, in Peru, Chile, Colombia, Dominican Republic, Bolivia, El Salvador, Jamaica, Nicaragua, Guatemala, and Israel. As a result of IC Power’s acquisition of various assets during the course of 2014 and of the sale of its 21% indirect equity interest in Edegel (one of the largest generator in Peru, in which the company owned an indirect equity as of September 3, 2014, see note 5), the Group has a capacity of approximately 2,665 MWs as of December 31, 2015 (2,642 MWs as of December 31, 2014 including Edegel).
Entity | Country | Percentage of | Energy Used to Operate | Capacity | Month Commenced Operation/ Month Initially Acquired | |||||||||
Operating Companies | ||||||||||||||
Kallpa | Peru | 75 | % | Natural gas | 870 | July 2007 | ||||||||
COBEE | Bolivia | 100 | % | Hydroelectric and natural gas | 228 | June 2007 | ||||||||
Central Cardones | Chile | 87 | % | Diesel | 153 | December 2011 | ||||||||
Nejapa | El Salvador | 100 | % | Heavy fuel oil | June 2007—January | |||||||||
| 140 | 2015 | |||||||||||||
CEPP | Dominican Republic | 97 | % | Heavy fuel oil | 67 | June 2007 | ||||||||
JPPC | Jamaica | 100 | % | Heavy fuel oil | 60 | June 2007—May 2014 | ||||||||
Colmito | Chile | 100 | % | Natural gas and diesel | 58 | October 2013 | ||||||||
Corinto | Nicaragua | 65 | % | Heavy fuel oil | 71 | March 2014 | ||||||||
Tipitapa | Nicaragua | 65 | % | Heavy fuel oil | 51 | March 2014 | ||||||||
Amayo I | Nicaragua | 61 | % | Wind | 40 | March 2014 | ||||||||
Amayo II | Nicaragua | 61 | % | Wind | 23 | March 2014 | ||||||||
Surpetroil | Colombia | 60 | % | Natural gas | 20 | March 2014 | ||||||||
Kallpa—Las Flores | Peru | 75 | % | Natural gas | 193 | April 2014 | ||||||||
PQP | Guatemala | 100 | % | Heavy fuel oil | 179 | September 2014 | ||||||||
OPC | Israel | 80 | % | Diesel and natural gas | 440 | July 2013 | ||||||||
Advanced Integrated Energy Ltd | Israel | 100 | % | Natural gas | 18 | August 2015 | ||||||||
F-44
Table of Contents
IC POWER LTD.
Notes to the Consolidated Financial Statements as at December 31, 2015
Note 1—General (cont’d)
A. The Reporting Entity (cont’d)
Entity | Country | Percentage of | Energy Used to Operate | Capacity | Month Commenced Month Initially | |||||||||||||||
Investments | ||||||||||||||||||||
Pedregal | Panama | 21 | % | Heavy fuel oil | 54 | June 2007 | ||||||||||||||
Total operating capacity as of December 31, 2015 | 2,665 | |||||||||||||||||||
Project Pipeline | ||||||||||||||||||||
CDA | Peru | 75 | % | Hydroelectric | 510 | |||||||||||||||
Samay I | Peru | 75 | % | | Diesel and natural gas | | 600 | |||||||||||||
Kanan | Panama | 100 | % | Heavy fuel oil | 92 | |||||||||||||||
Total pipeline capacity | 1,202 | |||||||||||||||||||
B. Definitions
| 1. | The Corporation or the Company—IC Power Ltd. |
| 2. | The Group—IC Power Ltd. and its subsidiaries. |
| 3. | Subsidiaries—companies whose financial statements are fully consolidated with those of the Corporation, directly or indirectly. |
| 4. | Associated companies—companies, not including subsidiaries, where the Company has significant influence over their monetary and operating policies and the Company’s investment therein is included based on the equity method of accounting. |
| 5. | Investee companies—subsidiaries and associated companies. |
| 6. | Related parties—within the meaning thereof in International Accounting Standard 24, 2009 regarding “Related parties”. |
Note 2—Significant Accounting Policies
The principal accounting policies applied in the preparation of these consolidated financial statements are set out below. The Group has consistently applied the following accounting policies to all periods presented in these consolidated financial statements, unless otherwise stated.
A. Basis of Preparation
i. Compliance with IFRS
The consolidated financial statements have been prepared in accordance with International Financial Reporting Standards (IFRS) issued by International Accounting Standards Board (IASB).
F-45
Table of Contents
IC POWER LTD.
Notes to the Consolidated Financial Statements as at December 31, 2015
Note 2—Significant Accounting Policies (cont’d)
A. Basis of Preparation (cont’d)
i. Compliance with IFRS (cont’d)
The consolidated financial statements were authorized for issuance on March 30, 2016 by the Board of Directors.
ii. Historical cost convention
The consolidated financial statements have been prepared on the historical cost basis, except for the following assets and liabilities: derivative financial instruments; deferred tax assets and liabilities; provisions; assets and liabilities for employee benefits; and investments in associates. For further information regarding the measurement of these assets and liabilities see Note 2 regarding significant accounting policies.
iii. New standards and interpretations not yet adopted
Certain new standards and interpretations have been published that are not mandatory for December 31, 2015 and have not early adopted by the Group. The Group’s assessment of the impact of these new standards and interpretations is set out below:
IFRS 9, Financial instruments:addresses the classification, measurement and recognition of financial assets and financial liabilities and introduces new rules for hedge accounting. In July 2014, the IASB made further changes to the classification and measurement rules and also introduce a new impairment model. The standard is effective for accounting periods beginning on or after January 1, 2018. Early adoption is permitted. The group does not expect any impact from the new classification, measurement and derecognition rules on its financial assets and financial liabilities. The Group is examining the effects of IFRS 9 (2014) on the financial statements with no plans for early adoption.
IFRS 15, Revenue from contracts with customers:deals with revenue recognition and establishes principles for reporting useful information to users of financial statements about the nature, amount, timing and uncertainty of revenue and cash flows arising from an entity’s contracts with customers. Revenue is recognized when a customer obtains control of a good or service and thus has the ability to direct the use and obtain the benefits from the good or service.
IFRS 16, Leases:The standard replaces IAS 17 – Leases and its related interpretations. The standard’s instructions annul the existing requirement from lessees to classify leases as operating or finance leases. Instead of this, for lessees, the new standard presents unified model for the accounting treatment of all leases according to which the lessee has to recognize an asset and liability in respect of the lease in its financial statements. Similarly, the standard determines new and expanded disclosure requirements from those required at present. The standard will become effective for annual periods as of January 1, 2019, with the possibility of early adoption, so long as the company has also early adopted IFRS 15 – Revenue from contracts with customers. The standard includes a number of alternatives for the implementation of transitional provisions, so that companies can choose one of the following alternatives at the implementation date: full retrospective implementation or implementation from the effective date while adjusting the balance of retained earnings at that date. The Group has not yet commenced examining the effects of adopting the amendments on the financial statements.
F-46
Table of Contents
IC POWER LTD.
Notes to the Consolidated Financial Statements as at December 31, 2015
Note 2—Significant Accounting Policies (cont’d)
A. Basis of Preparation (cont’d)
There are no other IFRSs or IFRIC interpretations that are not yet effective that would be expected to have a material impact on the Group.
B. Basis of Consolidation
i. Business Combinations
The Group accounts for business combinations using the acquisition method when control is transferred to the Group (see (B) (ii)). The consideration transferred in the acquisition is measured at fair value, as are the identifiable net assets acquired. Any goodwill that arises is tested annually for impairment. Any gain on a bargain purchase gain is recognized in profit or loss immediately. Transaction costs are expensed as incurred, except if related to the issue of debt or equity securities.
The consideration transferred does not include amounts related to the settlement of pre-existing relationships. Such amounts are recognized in profit or loss.
Any contingent consideration is measured at fair value at the acquisition date. If an obligation to pay contingent consideration that meets the definition of a financial instrument is classified as equity, then it is not re-measured and settlement is accounted for within equity. Otherwise, subsequent changes to the fair value of the contingent consideration are recognized in profit or loss.
ii. Subsidiaries
Subsidiaries are entities controlled by the Group. The Group controls an entity when it is exposed to, or has rights to, variable returns from its involvement with the entity and has the ability to affect those returns through its power over the entity. The financial statements of subsidiaries are included in the consolidated financial statements from the date on which control commences until the date on which control ceases.
The Group has no interests in structured entities as of December 31, 2015 and 2014.
iii. Non-Controlling Interest (NCI)
NCI are measured at their proportionate share of the acquiree’s identifiable net assets at the acquisition date.
Changes in the Group’s interest in a subsidiary that do not result in a loss of control are accounted for as equity transactions.
iv. Loss of Control
When the Group loses control over a subsidiary, it derecognizes the assets and liabilities of the subsidiary, and any related NCI and other components of equity. Any resulting gain or loss is recognized in profit or loss. Any interest retained in the former subsidiary is measured at fair value when control is lost.
F-47
Table of Contents
IC POWER LTD.
Notes to the Consolidated Financial Statements as at December 31, 2015
Note 2—Significant Accounting Policies (cont’d)
B. Basis of Consolidation (cont’d)
v. Associates
Associates are all entities over which the group has significant influence but not control, over the financial and operating policies, generally accompanying a shareholding of between 20% and 50% of the voting rights. Investments in associates are accounted for using the equity method. Under the equity method, the investment is initially recognized at cost, and the carrying amount is increased or decreased to recognize the investor’s share of the profit or loss of the investee after the date of acquisition. The group’s investment in associates includes goodwill identified on acquisition. If the ownership interest in an associate is reduced but significant influence is retained, only a proportionate share of the amounts previously recognized in OCI is reclassified to profit or loss where appropriate.
The Group’s share of post-acquisition profit or loss is recognized in the income statement, and its share of post-acquisition movements in OCI is recognized in OCI with a corresponding adjustment to the carrying amount of the investment. When the group’s share of losses in an associate equals or exceeds its interest in the associate, including any long-term interests that, in substance, form part of the entity’s net investment in the associate, the group does not recognize further losses, unless it has incurred legal or constructive obligations or made payments on behalf of the associate.
vi. Transactions Eliminated on Consolidation
Intra-group balances and transactions, and any unrealized income and expenses arising from intra-group transactions, are eliminated. Unrealized gains arising from transactions with equity accounted investees are eliminated against the investment to the extent of the Group’s interest in the investee. Unrealized losses are eliminated in the same way as unrealized gains, but only to the extent that there is no evidence of impairment.
C. Consolidation of COBEE Financial Statements
The Bolivian government under the mandate of Evo Morales has nationalized companies that were privatized during President Gonzalo Sánchez de Lozada’s 1993-1997 administration and some other companies that were never owned by the Bolivian government.
As of the date of this report, the Bolivian government has not taken any specific action nor threatened to take any specific action against COBEE. Currently, the Company has full control of COBEE´s operations and maintains all the associated economic rights and risks. Therefore, COBEE´s financial statements are consolidated in the accompanying consolidated financial statements.
D. Segment reporting
The Group is only involved in the power generation business. There is no other relevant activity or line of business identified. Therefore, senior management team evaluates the business from a geographic perspective. They receive and review the information about the operating results and assets performance as of subsidiary level as well as of country level.
F-48
Table of Contents
IC POWER LTD.
Notes to the Consolidated Financial Statements as at December 31, 2015
Note 2—Significant Accounting Policies (cont’d)
D. Segment reporting (cont’d)
Peru, Israel and Central America are the reportable segments identified for IC Power consolidated financial statements. The geographic regions included in our Other segment are Bolivia, Chile, the Dominican Republic, Jamaica, Colombia and Panama.
The senior management, which has been identified as being the chief operating decision maker, consists of the Chief Executive Officer, Chief Financial Officer, Chief Operating Officer, Chief Investment Officer, Chief Technical Officer and General Counsel.
E. Foreign Currency Translation
i. Functional and presentation Currency
Items included in the financial statements of each of the group’s entities are measured using the currency of the primary economic environment in which the entity operates (‘the functional currency’). The consolidated financial statements are presented in U.S. Dollars, which is the Company’s functional and presentation currency.
ii. Transactions and balances
Transactions in foreign currencies are translated to the respective functional currencies of Group entities at the exchange rates at the dates of the transactions.
Monetary assets and liabilities denominated in foreign currencies are translated to the functional currency at the exchange rate at the reporting date. Non-monetary assets and liabilities that are measured at fair value in a foreign currency are translated into the functional currency at the exchange rate when the fair value was determined. Non-monetary items that are measured based on historical cost in a foreign currency are translated at the exchange rate at the date of the transaction. Foreign currency differences are generally recognized in profit and loss.
However, foreign currency differences arising from the retranslation of the following items are recognized in OCI:
| • | Available-for sale equity investments (except on impairment, in which case foreign currency differences that have been recognized in OCI are reclassified to profit or loss); and |
| • | Qualifying cash flow hedges to the extent the hedges are effective. |
iii. Foreign Operation
The assets and liabilities of foreign operations, including goodwill and fair value adjustments arising on acquisition, are translated into U.S. Dollars at the exchange rates at the reporting date. The income and expenses of foreign operations are translated into U.S. Dollars at the exchange rates at the dates of the transactions.
F-49
Table of Contents
IC POWER LTD.
Notes to the Consolidated Financial Statements as at December 31, 2015
Note 2—Significant Accounting Policies (cont’d)
E. Foreign Currency Translation (cont’d)
iii. Foreign Operation (cont’d)
Foreign currency differences are recognized in OCI and accumulated in the translation reserve, except to the extent that the translation difference is allocated to NCI.
When a foreign operation is disposed entirely or partially such that, control or significant influence is lost, the cumulative amount in the translation reserve related to that foreign operation is reclassified to profit or loss as part of the gain or loss on disposal. If the Group disposes a part of its interest in a subsidiary but retains control, then the relevant proportion of the cumulative amount is reattributed to NCI. When the Group disposes of only part of an associate while retaining significant influence, the relevant proportion of the cumulative amount is reclassified to profit or loss.
F. Discontinued Operation
A discontinued operation is a component of the Group’s business, the operations and cash flows of which can be clearly distinguished from the rest of the Group and which:
| • | Represents a separate major line of business or geographic area of operations |
| • | Is part of a single coordinated plan to dispose of a separate major line of business or geographic area of operations; or |
| • | Is a subsidiary acquired exclusively with a view to re-sale |
Classification as a discontinued operation occurs at the earlier of disposal or when the operation meets the criteria to be classified as held-for-sale.
When an operation is classified as a discontinued operation, the comparative statement of profit or loss and OCI is re-presented as if the operation had been discontinued from the start of the comparative year.
G. Revenue
Revenue is recognized to the extent that it is probable that the economic benefits will flow to the Group and the revenue can be reliably measured. Revenue comprises the fair value for the sale of electricity, net of value-added-tax, rebates and discounts and after eliminating sales within the Group.
Revenues from the sale of energy are recognized in the period during which the sale occurs. The revenues from the generation business are recorded based upon output delivered and capacity provided at rates specified pursuant to our Power Purchase Agreements (PPAs), or at marginal costs determined on the spot market, if the sales are made on the spot market.
Our revenues are determined substantially by long-term, U.S. dollar-linked PPAs. PPAs are usually entered into at prices that are equivalent to, or higher than, the prevailing spot market rates, the majority
F-50
Table of Contents
IC POWER LTD.
Notes to the Consolidated Financial Statements as at December 31, 2015
Note 2—Significant Accounting Policies (cont’d)
G. Revenue (cont’d)
of which are indexed to the underlying fuel cost of the related long-term supply agreements. Under the terms of the majority of our PPAs, the power purchaser is contractually obligated to purchase its energy requirements, and sometimes capacity and/or ancillary services, from the power generator based upon a base price (denominated either in U.S. Dollars or in the local currency) that is generally adjusted for a combination of some of the following: (1) fluctuations in exchange rates, (2) the U.S. inflation index, (3) a local inflation index, (4) fluctuations in the cost of operating fuel, (5) supply costs of natural gas, and (6) transmission costs. Additionally, in Peru, PPAs include provisions that change the contractual unitary energy prices in the case of an interruption of the supply or transportation of natural gas through the use of a methodology based on spot prices existing on the dates in which the interruption event occurred. Many of the prices in our PPAs differentiate between peak and off-peak periods. As of December 31, 2015, the weighted average remaining life of our PPAs based on firm capacity was 10 years (including the remaining life of the PPAs for our assets in advanced stages of construction: CDA, Samay I and Kanan).
H. Employee Benefits
i. Short-term Employee Benefits
Short-term employee benefits are expensed as the related service is provided. A liability is recognized for the amount expected to be paid if the Group has a present legal or constructive obligation to pay this amount as a result of past service provided by the employee, and the obligation can be estimated reliably.
The employee benefits are classified, for measurement purposes, as short-term benefits or as other long-term benefits depending on when the Group expects the benefits to be wholly settled.
ii. Bonus plans Transactions
The Group’s senior executives receive remuneration in the form of share-appreciations rights, which can only be settled in cash (cash-settled transactions). The cost of cash-settled transactions is measured initially at the grant date. With respect to grants made to the Company’s senior executives, or the executives of certain of the Company’s subsidiaries, this benefit is calculated by dividing the price paid by the Former Parent Company for Inkia (US$543 million) by the number of Inkia shares outstanding on the grant date and is expensed over the period until the vesting date with recognition of a corresponding liability. With respect to grants made to OPC’s senior executives, this benefit is calculated by determining the present value of the settlement (execution) price set forth in the plan. The liability is re-measured at each reporting date and at the settlement date based on the formulas described above. Any changes in the liability are recognized as operating expenses in profit or loss. For further information on the characteristics of the share appreciation rights provided to certain of the Group’s senior executives, see Note 16(b).
iii. Termination Benefits
Severance pay is charged to the income statement when there is a clear obligation to pay termination of employees before they reach the customary age of retirement according to a formal, detailed plan, without any reasonable chance of cancellation, The benefits given to employees upon voluntary retirement are charged when the Group proposes a plan to the employees encouraging voluntary retirement, it is expected that the proposal will be accepted and the number of employee acceptances can be estimated reliably.
F-51
Table of Contents
IC POWER LTD.
Notes to the Consolidated Financial Statements as at December 31, 2015
Note 2—Significant Accounting Policies (cont’d)
I. Finance Income and Finance Costs
The Group’s finance income and finance costs include:
| • | Interest income; |
| • | Interest expense; |
| • | The net gain or loss on the disposal of available-for-sale financial assets; |
| • | The net gain or loss on financial assets at fair value through profit or loss; |
| • | The foreign currency gain or loss on financial assets and financial liabilities; |
| • | The fair value loss on contingent consideration classified as financial liability; |
| • | Impairment losses recognized on financial assets (other than trade receivables); |
| • | The net gain or loss on hedging instruments that are recognized in profit or loss; and |
| • | The reclassification of net gains previously recognized in OCI. |
Interest income or expense is recognized using the effective interest method.
J. Earnings per share
The Group presents basic earnings per share (EPS) data for its common shares. Basic EPS is calculated by dividing profit or loss attributable to ordinary equity holders of the parent entity by the weighted average number of ordinary shares outstanding during the period.
K. Income Tax
Income tax expense comprises current and deferred tax. It is recognized in profit or loss except to the extent that it relates to a business combination, or items recognized directly in equity or in OCI.
i. Current Tax
Current tax comprises the expected tax payable or receivable on the taxable income or loss for the year and any adjustment to tax payable or receivable in respect of previous years. The amount of current tax payable or receivable is the best estimate of the tax amount to be paid or received that reflects uncertainty related to income taxes. It is measured using tax rates enacted or substantively enacted at the reporting date, Current tax also includes any tax liability arising from dividends.
Current tax assets and liabilities are offset only if certain criteria are met.
F-52
Table of Contents
IC POWER LTD.
Notes to the Consolidated Financial Statements as at December 31, 2015
Note 2—Significant Accounting Policies (cont’d)
K. Income Tax (cont’d)
ii. Deferred Tax
Deferred tax is recognized in respect of temporary differences between the carrying amounts of assets and liabilities for financial reporting purposes and the amounts used for taxation purposes. Deferred tax is not recognized for:
| • | Temporary differences on the initial recognition of assets or liabilities in a transaction that is not a business combination and that affects neither accounting nor taxable profit or loss; |
| • | Temporary differences related to investments in subsidiaries and associates to the extent that the Group is able to control the timing of the reversal of the temporary differences and it is not probable that they will not reverse in the foreseeable future; and |
| • | Taxable temporary differences arising on the initial recognition of goodwill. |
Deferred tax assets are recognized for unused tax losses, unused tax credits and deductible temporary differences to the extent that it is probable that future taxable profits will be available against which they can be used. Future taxable profits are determined based on business plans for individual subsidiaries in the Group. Deferred tax assets are reviewed at each reporting date and are reduced to the extent that it is no longer probable that the related tax benefit will be realized; such reductions are reversed when the probability of future taxable profit improves.
Unrecognized deferred tax assets are reassessed at each reporting date and recognized to the extent that it has become probable that future taxable profits will be available against which they can be used.
Deferred tax is measured at the tax rates that are expected to be applied to temporary differences when they reverse, using tax rates enacted or substantively enacted at the reporting date.
Deferred tax assets and liabilities are offset if there is a legally enforceable right to offset current tax liabilities and assets, and they relate to taxes levied by the same tax authority on the same taxable entity, or on different tax entities, but they intend to settle current tax liabilities and assets on a net basis or their tax assets and liabilities will be realized simultaneously.
The Group regularly reviews its deferred tax assets for recoverability, taking into consideration all available evidence, both positive and negative, including historical pre-tax and taxable income, projected future pre-tax and taxable income and the expected timing of the reversals of existing temporary differences. In arriving at these judgments, the weight given to the potential effect of all positive and negative evidence is commensurate with the extent to which it can be objectively verified.
The Group believes its tax positions are in compliance with applicable tax laws and regulations. Tax benefits are recognized only for tax positions that are more likely than not to be sustained upon examination by tax authorities. The Group believes that its liabilities for unrecognized tax benefits, including related interest, are adequate in relation to the potential for additional tax assessments. There is a risk, however, that the amounts ultimately paid upon resolution of audits could be materially different from the amounts previously included in our income tax expense and, therefore, could have a material impact on our tax provision, net income and cash flows.
F-53
Table of Contents
IC POWER LTD.
Notes to the Consolidated Financial Statements as at December 31, 2015
Note 2—Significant Accounting Policies (cont’d)
K. Income Tax (cont’d)
iii. Uncertain tax positions:
A provision for uncertain tax positions, including additional tax and interest expenses, is recognized when it is more probable than not that the Group will have to use its economic resources to pay the obligation.
L. Inventories
Inventories consist of fuel, spare parts, materials and supplies and are valued at the lower of cost or net realizable value. Cost is determined by using the average cost method.
M. Trade Receivables
Trade receivables are amounts due from customers for the energy and capacity in the ordinary course of business. If collection is expected in one year or less (or in the normal operating cycle of the business if longer), they are classified as current assets. If not, they are presented as non-current assets.
N. Cash and Cash Equivalents
In the consolidated statement of cash flows, cash and cash equivalents includes cash on hand, deposits held at call with banks, other short-term highly liquid investments with original maturities of three months or less.
O. Property, Plant and Equipment
i. Recognition and Measurement
Items of property, plant and equipment comprise mainly power station structures, power distribution facilities and related offices. These items are measured at historical cost less accumulated depreciation and accumulated impairment losses.
Historical cost includes expenditure that is directly attributable to the acquisition of the items:
| • | The cost of materials and direct labor; |
| • | any other costs directly attributable to bringing the assets to a working condition for their intended use; |
| • | when the Group has an obligation to remove the assets or restore the site, an estimate of the costs of dismantling and removing the items and restoring the site on which they are located; and |
| • | Capitalized borrowing costs. |
If significant parts of an item of property, plant and equipment items have different useful lives, then they are accounted for as separate items (major components) of property, plant and equipment.
Any gain or loss on disposal of an item of property, plant and equipment is recognized in profit or loss in the year the asset is derecognized.
F-54
Table of Contents
IC POWER LTD.
Notes to the Consolidated Financial Statements as at December 31, 2015
Note 2—Significant Accounting Policies (cont’d)
O. Property, Plant and Equipment (cont’d)
ii. Subsequent Costs
Subsequent expenditure is capitalized only if it is probable that the future economic benefits associated with the expenditure will flow to the Group, and its cost can be measured reliably
iii. Depreciation
Depreciation is calculated to write off the cost of items of property, plant and equipment less their estimated residual values using the straight-line method over their estimated useful lives, and is generally recognized in profit or loss. Leased assets are depreciated over the shorter of the lease term and their useful lives unless it is reasonably certain that the Group will obtain ownership by the end of the lease term. Land is not depreciated.
The following useful lives shown on an average basis are applied across the Group:
Years | ||
Roads, buildings and leasehold improvements | 3 - 50 | |
Installation, machinery and equipment | ||
Thermal power plants | 10 - 35 | |
Hydro-electric | 70 - 90 | |
Wind power plants | 25 | |
Power generation and electrical | 20 | |
Dams | 18 | |
Office furniture and equipment, motor vehicles and other equipment | 3 - 16 |
Depreciation methods, useful lives and residual values are reviewed at each reporting date and adjusted if appropriate.
F-55
Table of Contents
IC POWER LTD.
Notes to the Consolidated Financial Statements as at December 31, 2015
Note 2—Significant Accounting Policies (cont’d)
P. Intangible Assets
i. Recognition and Measurement
Goodwill | Goodwill arising on the acquisition of subsidiaries is measured at cost less accumulated impairment losses. In respect of equity accounted investees, the carrying amount of goodwill is included in the carrying amount of the investment; and any impairment loss is allocated to the carrying amount of the equity investee as a whole. | |
Research and development | Expenditures on research activities are recognized in profit and loss as incurred.
Development activities involve expenditures incurred in connection with the design and evaluation of future power plant projects before the technical feasibility and commercial viability is fully completed, however the Group intends to and has sufficient resources to complete the development and to use or sell the asset.
At each reporting date, the Group performs an evaluation of each project in order to identify facts and circumstances that suggest that the carrying amount of the assets may exceed their recoverable amount | |
Customer relationships | Intangible assets acquired as part of a business combination and are recognized outside of goodwill if the assets are separable or arise from contractual or other legal rights and their fair value can be measured reliably | |
Other intangible assets | Other intangible assets, including licenses, patents and trademarks, which are acquired by the Group and have finite useful lives, are measured at cost less accumulated amortization and any accumulated impairment losses. | |
ii. Subsequent Expenditure
Subsequent expenditure is capitalized only when it increases the future economic benefits embodied in the specific asset to which it relates. All other expenditure, including expenditure on internally generated goodwill is expensed as incurred.
iii. Amortization
Amortization is calculated to write-off the cost of intangible assets less their estimated residual values using the straight-line method over their useful lives, and is generally recognized in profit or loss. Goodwill is not amortized.
F-56
Table of Contents
IC POWER LTD.
Notes to the Consolidated Financial Statements as at December 31, 2015
Note 2—Significant Accounting Policies (cont’d)
P. Intangible Assets (cont’d)
iii. Amortization (cont’d)
The estimated useful lives for current and comparative period are as follows:
Years | ||||
Customer relationship | 1-12 | |||
Licenses | 22-27 | |||
Trademarks | 10 | |||
Amortization methods and useful lives are reviewed at each reporting date and adjusted if appropriate.
Q. Financial Instruments
The Group classifies non-derivative financial assets into the following categories: financial assets at fair value through profit and loss, held-to-maturity financial assets, loans and receivables and available-for-sale financial assets.
The Group classifies non-derivative financial liabilities into the other financial liabilities category.
i. Non-derivative Financial Assets and Financial Liabilities—Recognition and de-Recognition
The Group initially recognizes loans and receivables and debt securities issued on the date that they are originated. All other financial assets and financial liabilities are recognized initially on the trade date.
The Group derecognizes a financial asset when the contractual rights to the cash flows from the asset expire, or it transfers the rights to receive the contractual cash flows in a transaction in which substantially all of the risks and rewards of ownership and does not retains control over the transferred asset. Any interest in such derecognized financial asset that is created or retained by the Group is recognized as a separate asset or liability.
The Group derecognizes a financial liability when its contractual obligations are discharged, or cancelled or expire.
Financial assets and financial liabilities are offset and the net amount presented in the consolidated statement of financial position when, and only when, the Group currently has a legally enforceable right to offset the amounts and intends either to settle them on a net basis or to realize the asset and settle the liability simultaneously.
F-57
Table of Contents
IC POWER LTD.
Notes to the Consolidated Financial Statements as at December 31, 2015
Note 2—Significant Accounting Policies (cont’d)
Q. Financial Instruments (cont’d)
ii. Non-derivative Financial Assets—Measurement
Financial assets at fair value through profit and loss | A financial asset is classified at fair value through profit or loss if it is classified as held for trading or is designated as such on initial recognition. Direct attributable transaction costs are recognized in profit or loss as incurred. Financial assets at fair value through profit or loss are measured at fair value, and changes therein, including any interest or dividend income, are recognized in profit or loss. | |
Held-to-maturity financial assets | These assets are initially measured at fair value plus any direct attributable transaction costs. Subsequent to initial recognition, they are measured at amortized cost using the effective interest method. | |
Loans and receivables | These assets are initially measured at fair value plus any directly attributable transaction costs. Subsequent to initial recognition, they are measured at amortized cost using the effective interest method, less any impairment losses | |
Available-for-sale financial assets | These assets are initially measured at fair value plus any directly attributable transaction costs. Subsequent to initial recognition, they are measured at fair value and changes therein, other than impairment losses and foreign currency differences on debt instruments, are recognized in OCI and accumulated in the fair value reserve. When these assets are derecognized, the gain or loss accumulated in equity is reclassified to profit or loss. | |
iii. Non-derivative Financial Liabilities—Measurement
Non-derivative financial liabilities are initially recognized at fair value less any direct attributable transaction costs. Subsequent to initial recognition, these liabilities are measured at amortized cost using the effective interest method.
iv. Derivative Financial Instruments and Hedge Accounting
The Group holds derivative financial instruments to hedge its foreign currency and interest rate risk exposures.
Derivatives are recognized initially at fair value; any direct attributable transaction costs are recognized in profit or loss as incurred. Subsequent to initial recognition, derivatives are measured at fair value, and changes therein are generally recognized in profit or loss.
Cash flow hedges
When a derivative is designated as a cash flow hedging instrument, the effective portion of changes in the fair value of the derivative is recognized in OCI and accumulated in the hedging reserve in equity. Any ineffective portion of changes in the fair value of the derivative is recognized immediately in profit or loss.
F-58
Table of Contents
IC POWER LTD.
Notes to the Consolidated Financial Statements as at December 31, 2015
Note 2—Significant Accounting Policies (cont’d)
Q. Financial Instruments (cont’d)
Cash flow hedges (cont’d)
The amount accumulated in equity is reclassified to profit or loss in the same period or periods during which the hedged forecast cash flows affects profit or loss or the hedged item affects profit or loss.
If the forecast transaction is no longer expected to occur, the hedge no longer meets the criteria for hedge accounting, the hedging instrument expires or is sold, terminated or exercised, or the designation is revoked, then hedge accounting is discontinued prospectively. If the forecast transaction is no longer expected to occur, then the amount accumulated in equity is reclassified to profit or loss.
R. Share Capital—Ordinary Shares
Incremental costs directly attributable to the issue of ordinary shares, net of any tax effects, are recognized as a deduction from equity.
S. Impairment
i. Non-derivative Financial Assets
Financial assets not classified as at fair value through profit or loss, including an interest in an equity- account investee, are assessed at each reporting date to determine whether there is objective evidence of impairment.
Objective evidence that financial assets are impaired includes:
| • | Default or delinquency by a debtor; |
| • | Restructuring of an amount due to the Group on terms that the Group would not consider otherwise; |
| • | Indications that a debtor or issuer will enter bankruptcy; |
| • | Adverse changes in the payment status of borrowers or issuers; |
| • | The disappearance of an active market for a security because of financial difficulties; or |
| • | Observable data indicating that there is measurable decrease in expected cash flows from a group of financial assets. |
F-59
Table of Contents
IC POWER LTD.
Notes to the Consolidated Financial Statements as at December 31, 2015
Note 2—Significant Accounting Policies (cont’d)
S. Impairment (cont’d)
i. Non-derivative Financial Assets (cont’d)
For an investment in an equity security, objective evidence of impairment includes a significant or prolonged decline in its fair value below its cost.
Available-for-sale financial assets | Impairment losses on available-for-sale financial assets are recognized by reclassifying the losses accumulated in the fair value reserve to profit or loss. The amount reclassified is the difference between the acquisition cost (net of any principal repayment and amortization) and the current fair value, less any impairment loss previously recognized in profit or loss. If the fair value of an impaired available-for-sale debt security subsequently increases and the increase can be related objectively to an event occurring after the impairment loss was recognized, then the impairment loss is reversed through profit or loss; otherwise, it is reversed through OCI | |
Equity-account investees | An impairment loss in respect of an equity-accounted investee is measured by comparing the recoverable amount of the investment with its carrying amount. An impairment loss is recognized in profit or loss, and is reversed if there has been a favorable change in the estimates used to determine the recoverable amount and only to the extent that the investment’s carrying amount, after the reversal of the impairment loss, does not exceed the carrying amount of the investment that would have been determined by the equity method if no impairment loss had been recognized. . | |
ii. Non-Financial Assets
At each reporting date, the Group reviews the carrying amounts of its non-financial assets (other than inventories and deferred tax assets) to determine whether there is any indication of impairment. If any such indication exists, then the asset’s recoverable amount is estimated. Goodwill is tested annually for impairment or whenever impairment indicators exist.
The recoverable amount of an asset or cash generating unit (hereinafter “CGU”) is the greater of its value in use and its fair value less costs to sell. Value in use is based on the estimated future cash flows, discounted to their present value using a pre-tax discount rate that reflects current market assessments of the time value of money and the risks specific to the asset or CGU.
An impairment loss is recognized if the carrying amount of an asset or CGU exceeds its recoverable amount. Impairment losses are recognized in profit or loss. They are allocated first to reduce the carrying amount of any goodwill allocated to the CGU, and then to reduce the carrying amounts of the other assets in the CGU on a pro rata basis.
An impairment loss in respect of goodwill is not reversed. For other assets, an assessment is performed at each reporting date for any indications that these losses have decreased or no longer exist. An impairment loss is reversed if there has been a change in the estimates used to determine the recoverable amount and is reversed only to the extent that the asset’s carrying amount does not exceed the carrying amount that would have been determined, net of depreciation or amortization, if no impairment loss had been recognized.
F-60
Table of Contents
IC POWER LTD.
Notes to the Consolidated Financial Statements as at December 31, 2015
Note 2—Significant Accounting Policies (cont’d)
T. Provisions
A provision is recognized if, as a result of a past event, the Group has a present legal or constructive obligation that can be estimated reliably, and it is probable that an outflow of economic benefits will be required to settle the obligation.
Provisions are determined by discounting the expected future cash flows at a pre-tax rate that reflects current market assessments of the time value of money and the risks specific to the liability. The unwinding of the discount is recognized as finance cost.
U. Leases
i. Determining Whether an Arrangement Contains a Lease
At inception of an arrangement, the Group determines whether the arrangement is or contains a lease.
At inception or on reassessment of an arrangement that contains a lease, the Group separates payments and other consideration required by the arrangement into those for the lease and those for the other elements on the basis of their relative fair values. If the Group concludes for a finance lease that is impracticable to separate the payments reliably, then an asset and a liability are recognized at an amount equal to the fair value of the underlying asset; subsequently, the liability is reduced as payments are made and an imputed finance cost on the liability is recognized using the Group’s incremental borrowing rate.
ii. Leased Assets
Assets held by the group under leases that transfer to the Group substantially all of the risks and rewards of ownership are classified as finance leases. The leased assets are measured initially at an amount equal to the lower of their fair value and the present value of the minimum lease payments. Subsequent to initial recognition, the assets are accounted for in accordance with the accounting policy applicable to that asset.
Asset held under other leases are classified as operating leases and are not recognized in the Group’s consolidated statement of financial position.
iii. Lease Payments
Payments made under operating leases, other than conditional lease payments, are recognized in profit or loss on a straight-line basis over the term of the lease. Lease incentives received are recognized as an integral part of the total lease expense, over the term of the lease.
Minimum lease payments made under finance leases are apportioned between the finance expense and the reduction of the outstanding liability. The finance expense is allocated to each period during the lease term so as to produce a constant periodic rate if interest on the remaining balance of the liability.
F-61
Table of Contents
IC POWER LTD.
Notes to the Consolidated Financial Statements as at December 31, 2015
Note 3—Basis of Preparation of Financial Statements
a)Use of judgments and estimates
The preparation of accounting estimates used in the preparation of the Group’s financial statements requires management of the Company to make assumptions regarding circumstances and events that involve considerable uncertainty. Management of the Company prepares the estimates on the basis of past experience, various facts, external circumstances, and reasonable assumptions according to the pertinent circumstances of each estimate.
The preparation of the consolidated financial statements in conformity with IFRS requires management to make judgments, estimates and assumptions that affect the application of accounting policies and the reported amount of assets, liabilities, income and expenses. Actual results may differ from these estimates.
Estimates and underlying assumptions are reviewed on an ongoing basis. Revisions to accounting estimates are recorded prospectively.
Information about assumptions, estimation uncertainties and critical judgments that have the most significant effect on the amounts recognized in the consolidated financial statements is included in the following notes:
| • | Note 4—Fair value adjustments for business combination in accordance with IFRS 3, and the measurement of assets, liabilities and goodwill; |
| • | Notes 12 and 13—Useful life of the property, plant and equipment and intangible assets; |
| • | Note 13—Key assumptions used for discounted cash flow projections; |
| • | Note 25—Utilization of tax losses. |
| • | Note 31—Probability of occurrence and uncertainty of amount of liabilities for contingent liabilities. |
b)Immaterial adjustment of comparative data
During 2015, an error was identified with respect to the deferred tax calculation relating to the effect of foreign exchange rate on non-monetary assets in previous years. The Company examined the materiality of this error based on quantitative and qualitative parameters and concluded that the adjustment was immaterial and therefore corrected its financial statements of previous years without reissuing its consolidated financial statements for 2014 and 2013.
| i. | The effect of the correction on the statement of financial position: |
December 31, 2014 | ||||||||||||
As presented | Effect of | As presented in | ||||||||||
US$ thousands | US$ thousands | US$ thousands | ||||||||||
Deferred tax assets | 42,609 | (16,866 | ) | 25,743 | ||||||||
Deferred tax liabilities | (144,719 | ) | (1,027 | ) | (145,746 | ) | ||||||
Retained earnings | (402,708 | ) | 13,402 | (389,306 | ) | |||||||
Non-controlling interest | (215,324 | ) | 4,491 | (210,833 | ) | |||||||
F-62
Table of Contents
IC POWER LTD.
Notes to the Consolidated Financial Statements as at December 31, 2015
Note 3—Basis of Preparation of Financial Statements (cont’d)
b)Immaterial adjustment of comparative data (cont’d)
| ii. | The effect of the correction on equity |
December 31, 2013 | ||||||||||||
As presented | Effect of | As presented in | ||||||||||
US$ thousands | US$ thousands | US$ thousands | ||||||||||
Retained earnings | (203,751 | ) | 4,025 | (199,726 | ) | |||||||
Non-controlling interest | (145,606 | ) | 1,349 | (144,257 | ) | |||||||
January 1, 2013 | ||||||||||||
As presented | Effect of the | As presented in | ||||||||||
US$ thousands | US$ thousands | US$ thousands | ||||||||||
Retained earnings | (137,336 | ) | (1,488 | ) | (138,824 | ) | ||||||
Non-controlling interest | (128,835 | ) | (499 | ) | (129,334 | ) | ||||||
| iii. | The effect of the correction on the statement of income and the statement of profit or loss and comprehensive income: |
For the year ended December 31, 2014 | ||||||||||||
As presented | Effect of | As presented in | ||||||||||
US$ thousands | US$ thousands | US$ thousands | ||||||||||
Taxes on income | 50,322 | 12,519 | 62,841 | |||||||||
Net income for the year | 268,498 | (12,519 | ) | 255,979 | ||||||||
Other comprehensive income for the year, net of tax |
| 227,302 |
|
| (12,519 | ) |
| 214,783 |
| |||
Basic and diluted earnings per share from continuing operations (in USD) |
| 10.8 |
|
| (0.9 | ) |
| 9.9 |
| |||
Basic and diluted earnings per share (in USD) |
| 23.6 |
|
| (0.9 | ) |
| 22.7 |
| |||
For the year ended December 31, 2013 | ||||||||||||
As presented | Effect of | As presented in | ||||||||||
US$ thousands | US$ thousands | US$ thousands | ||||||||||
Taxes on income | 40,693 | 7,361 | 48,054 | |||||||||
Net income for the year | 81,125 | (7,361 | ) | 73,764 | ||||||||
Other comprehensive income for the year, net of tax | 43,731 | (7,361 | ) | 36,370 | ||||||||
Basic and diluted earnings per share from continuing operations (in USD) | 3.8 | (0.6 | ) | 3.2 | ||||||||
Basic and diluted earnings per share (in USD) | 6.7 | (0.6 | ) | 6.1 | ||||||||
F-63
Table of Contents
IC POWER LTD.
Notes to the Consolidated Financial Statements as at December 31, 2015
Note 3—Basis of Preparation of Financial Statements (cont’d)
b)Immaterial adjustment of comparative data (cont’d)
The aforesaid correction is included in the comparative data of these financial statements by marking the corrected items with “immaterial adjustment”.
Note 4—Business combinations
A. Subsidiaries acquired in 2015
Advanced Integrated Energy Ltd.—
On June 8, 2015 IC Power executed an agreement with Hadera Paper Ltd., pursuant to which IC Power agreed to acquire from Hadera Paper 100% of the shares in Advanced Integrated Energy Ltd. (hereinafter—“AIE”) and the Hadera Paper’s energy center. AIE holds a conditional license for the construction of a 120MW cogeneration power station in Israel.. The total payment amounts to NIS 60 million (approximately US$15.6 million) which involves two transactions:
| a) | A business combination in the amount of NIS 36,000 thousand (US$ 9,441 thousand) as follows: (i) On August 10, 2015, after fulfilling the conditions precedent contemplated in the aforementioned agreement, IC Power completed the acquisition of AIE and paid NIS 1,755 thousand (approximately US$ 460 thousand) to Hadera Paper Ltd. for the acquisition of the shares. (ii) IC Power through AIE paid NIS 34,245 thousand (approximately US$ 8,981 thousand) for the repayment of the loan between Hadera Paper Ltd. and its former shareholder. |
The purchase price allocation was as follows: Property, plant and equipment: US$8,981 thousand; Intangible: US$464 thousand; deferred tax liabilities: US$123 thousand; and goodwill: US$119 thousand.
| b) | AEI acquired Hadera Paper’s energy center in the aggregate amount of NIS 24,000 (approximately US$ 6,294 thousand). The Hadera Paper’s energy center generates electricity with a 18MW steam turbine. |
Additional investments by IC Power will be required to enable AIE to complete construction of the power plant, which is expected to commence operations in the second half of 2018.
B.Subsidiaries acquired in 2014
| 1. | During 2014, IC Power acquired the following companies: |
AEI Nicaragua Holdings Ltd.
On February 18, 2014, IC Power entered into an agreement with AEI Power Ltd. to acquire all of the shares of AEI Nicaragua Holdings Ltd and AEI Jamaica Holdings Ltd for a purchase price of US$ 54,144 thousand. On March 12, 2014, Inkia took control of AEI Nicaragua Holdings and paid US$36,644 thousand to AEI Power Ltd. in connection with the acquisition. As a result of the post-closing purchase price adjustments, AEI Ltd refunded US$ 6,523 thousand to IC Power on April 14, 2014; therefore, the final purchase price of AEI Nicaragua Holdings was US$ 30,121 thousand.
F-64
Table of Contents
IC POWER LTD.
Notes to the Consolidated Financial Statements as at December 31, 2015
Note 4—Business combinations (cont’d)
B.Subsidiaries acquired in 2014 (cont’d)
| 1. | During 2014, IC Power acquired the following companies: (cont’d) |
AEI Jamaica Holdings Ltd.
On May 30, 2014, IC Power took control of AEI Jamaica Holdings and paid US$17,500 thousand to AEI Power Ltd. in connection with the acquisition. As a result of the post-closing purchase price adjustments, IC Power paid an additional of US$3,177 thousand to AEI Power Ltd. on July 1, 2014; therefore, the final purchase price of AEI Jamaica Holdings was US$20,677 thousand.
As of result of this transaction, IC Power increased its ownership from 15.57% to 100% in Jamaica Private Power Company (a subsidiary of AEI Jamaica Holdings). The measurement to fair value of IC Power’s pre-existing share in Jamaica Power Company resulted in a gain of US$2,674 thousand (US$6,044 thousand less US$ 3,370 thousand carrying amount of such investment at the acquisition date).
Surpetroil
On March 12, 2014, IC Power through its subsidiary Samay III signed a share purchase agreement with Yesid Gasca and Adriana Lopez to acquire a 60% stake of Surpetroil SAS, a company involved in power generation, natural gas transport and distribution using Colombia’s stranded gas, as well as a 60% stake in 2 companies: Surenergy SAS ESP (Colombia) and Surpetroil SAC (Peru) for a total purchase price of US$18,000 thousand. On March 28, 2014, IC Power took control of Surpetroil and paid US$12,000 thousand at closing. The remaining US$6,000 thousand has been retained by IC Power to be reinvested by the minority shareholders in new projects.
AEI Guatemala Holdings Ltd.
On August 13, 2014, IC Power entered into an agreement with AEI Power Ltd. to acquire all of the shares of AEI Guatemala Holdings Ltd for a purchase price of US$29,000 thousand. On September 17, 2014, IC Power completed the acquisition of AEI Guatemala Holdings and paid US$29,000 thousand to AEI Power Ltd.
On October 22, 2014, IC Power paid an additional of US$5,568 thousand as a result of the post-closing purchase price adjustments, and US$350 thousand for reorganization costs. Therefore, the final purchase price of AEI Guatemala Holdings was US$34,918 thousand.
F-65
Table of Contents
IC POWER LTD.
Notes to the Consolidated Financial Statements as at December 31, 2015
Note 4—Business combinations (cont’d)
B.Subsidiaries acquired in 2014 (cont’d)
| 2. | Identifiable assets acquired and liabilities assumed |
The following table summarizes the recognized amounts of assets acquired and liabilities assumed at the date of acquisition:
| In thousands of US$ | Note | AEI | AEI | Surpetroil | AEI | Total | ||||||||||||||||||
Property, plant and equipment | 12 | 157,211 | 39,585 | 15,173 | 60,896 | 272,865 | ||||||||||||||||||
Intangible | 13 | 20,783 | 3,305 | 5,168 | 925 | 30,181 | ||||||||||||||||||
Deferred income tax assets | 2,375 | 179 | 201 | 76 | 2,831 | |||||||||||||||||||
Trade receivables, net | 29,072 | 5,998 | 900 | 31,939 | 67,909 | |||||||||||||||||||
Other assets | 40,716 | 24,325 | 1,835 | 38,777 | 105,653 | |||||||||||||||||||
Short-term borrowings | — | (1,722 | ) | (2,361 | ) | (17,500 | ) | (21,583 | ) | |||||||||||||||
Long-term debt | (115,241 | ) | (10,199 | ) | (2,390 | ) | (23,021 | ) | (150,851 | ) | ||||||||||||||
Deferred income tax liabilities | (33,722 | ) | (1,102 | ) | (2,671 | ) | (7,550 | ) | (45,045 | ) | ||||||||||||||
Other liabilities | (16,804 | ) | (9,532 | ) | (2,901 | ) | (29,181 | ) | (58,418 | ) | ||||||||||||||
Non-controlling interest | (30,618 | ) | — | (5,182 | ) | — | (35,800 | ) | ||||||||||||||||
|
|
|
|
|
|
|
|
|
| |||||||||||||||
Total net assets | 53,772 | 50,837 | 7,772 | 55,361 | 167,742 | |||||||||||||||||||
Fair value of pre-existing share | — | (6,044 | ) | — | — | (6,044 | ) | |||||||||||||||||
Total consideration | (30,121 | ) | (20,677 | ) | (18,000 | ) | (34,918 | ) | (103,716 | ) | ||||||||||||||
|
|
|
|
|
|
|
|
|
| |||||||||||||||
Gain on bargain purchase | 23,651 | 24,116 | — | 20,443 | 68,210 | |||||||||||||||||||
Goodwill* | — | — | 10,228 | — | 10,228 | |||||||||||||||||||
Cash consideration | 30,121 | 20,677 | 12,000 | 34,918 | 97,716 | |||||||||||||||||||
Consideration retained by IC Power | — | — | 6,000 | — | 6,000 | |||||||||||||||||||
|
|
|
|
|
|
|
|
|
| |||||||||||||||
Total consideration transferred | 30,121 | 20,677 | 12,000 | 34,918 | 97,716 | |||||||||||||||||||
Cash and cash equivalent acquired | (19,310 | ) | (5,371 | ) | (168 | ) | (2,881 | ) | (27,730 | ) | ||||||||||||||
|
|
|
|
|
|
|
|
|
| |||||||||||||||
Net cash flow on acquisition | 10,811 | 15,306 | 11,832 | 32,037 | 69,986 | |||||||||||||||||||
|
|
|
|
|
|
|
|
|
| |||||||||||||||
| * | This amount is not deductible for tax purposes. |
| 3. | Measurement of fair values |
IC Power has measured the value of the acquired assets, liabilities, and contingent liabilities considering the fair value basis on March 12, 2014; March 28, 2014; May 30, 2014; and on September 17, 2014, dates in which IC Power took control of AEI Nicaragua Holdings, Surpetroil, AEI Jamaica Holdings and AEI Guatemala Holdings, respectively. The criteria considered to measure the fair value of the main items were the following:
| • | Fixed assets were valued considering the market value provided by an appraiser; |
| • | Intangibles consider the valuation of its Power Purchase Agreements (“PPAs”); |
| • | Contingent liabilities were determined over the average probability established by third party legal processes; |
F-66
Table of Contents
IC POWER LTD.
Notes to the Consolidated Financial Statements as at December 31, 2015
Note 4—Business combinations (cont’d)
B.Subsidiaries acquired in 2014 (cont’d)
| 3. | Measurement of fair values (cont’d) |
| • | Deferred taxes were valued based on the temporary differences between the accounting and tax basis of the business combination; and, |
| • | Non-controlling interests were measured as a proportional basis of the net assets identified on the acquisition date. |
| 4. | Gain of bargain purchase |
After reviewing and analyzing the fair values of the Nicaraguan, Jamaican and Guatemalan assets and compare them to the carrying value, a gain on bargain purchase of US$23,651, US$24,116 and US$20,443, respectively, was determined. The differences between fair value and carrying value are derived in principal:
| • | Seller’s need to complete transaction. |
| • | Lack of alternative buyers. |
| • | Regions low interest from international power players. |
| 5. | Recognition of Revenues and Profit or Loss |
During the period from the acquisition date to December 31, 2014 the revenues and profit or loss contributed by these acquired companies to the consolidated results are as follows:
Companies acquired | Control Date | Revenues | Profit (loss)* | |||||||||
AEI Nicaragua Holdings Ltd | March 12, 2014 | 124,578 | 5,874 | |||||||||
Surpetroil S.A.S. | March 28, 2014 | 9,263 | 1,759 | |||||||||
AEI Jamaica Holdings Ltd. | May 30, 2014 | 40,752 | (2,242 | ) | ||||||||
AEI Guatemala Holdings Ltd. | September 17, 2014 | 33,302 | (1,028 | ) | ||||||||
|
|
|
| |||||||||
Total | 207,895 | 4,363 | ||||||||||
|
|
|
| |||||||||
| * | These figures do not include any effect arising from the purchase price allocation adjustments and from non-controlling interest. |
Note 5—Discontinued operations
On September 3, 2014, Inkia Americas Holdings Ltd. (the “Seller”), and IC Power as guarantor of the Seller, closed the sale of its shares in Inkia Holdings (Acter) Limited (“Acter”), that indirectly holds the equivalent of 39.01% of Generandes Peru SA, the holding company of Edegel SAA for a total consideration of US$413,000 thousand in cash.
As a consequence of the sale of Acter, IC Power transferred all the following companies to Enersis: Southern Cone Power Ltd., Latin America Holding I Ltd., Latin America Holding II Ltd. and Southern Cone Power Peru S.A.A.
F-67
Table of Contents
IC POWER LTD.
Notes to the Consolidated Financial Statements as at December 31, 2015
Note 5—Discontinued operations (cont’d)
Pursuant to the terms of the Share Purchase Agreement, prior to the consummation of the Acter Disposition, Acter was required to repay the outstanding indebtedness (the “Acter Debt”) held with Credit Suisse AG, Cayman Islands Branch. In order to repay the Acter Debt, Seller received a short-term loan from IC Power on August 26, 2014 in an amount of US$125,000 thousand (the “Acter Contribution”), and used the proceeds to repay the Acter Debt on August 27, 2014.
On April 30, 2015, Inkia received US$3,850 thousand as a final dividend from Enersis equivalent to the remaining portion on 2014 Generandes’ earnings as of September 3, 2014.
(a)Results of discontinued operation
In thousands of US$ | ||||||||||||
2015 | 2014 | 2013 | ||||||||||
Administrative expenses | — | (568 | ) | (119 | ) | |||||||
Dividends received post equity-accounting | 3,850 | 14,523 | — | |||||||||
Other income | — | 72 | — | |||||||||
Financing income | — | 47 | — | |||||||||
Finance cost | — | (6,384 | ) | (313 | ) | |||||||
Share of profit in associates | — | 11,542 | 30,089 | |||||||||
Income tax | — | (1,049 | ) | (1,230 | ) | |||||||
|
|
|
|
|
| |||||||
| 3,850 | 18,183 | 28,427 | ||||||||||
|
|
|
|
|
| |||||||
Capital Gain on Acter sale | — | 132,246 | — | |||||||||
Recycling of foreign exchange | — | 24,891 | — | |||||||||
Income tax on gain on sale of discontinued operation | — | (47,265 | ) | — | ||||||||
|
|
|
|
|
| |||||||
Net gain on sale of discontinued operations | — | 109,872 | — | |||||||||
|
|
|
|
|
| |||||||
Net income from discontinued operation, net of tax | 3,850 | 128,055 | 28,427 | |||||||||
|
|
|
|
|
| |||||||
The net income from discontinued operations is 100% attributable to the owner of the Company.
(b)Cash flows from discontinued operation:
In thousands of US$ | ||||||||||||
2015 | 2014 | 2013 | ||||||||||
Net cash provided by operating activities | 3,850 | 26,350 | 25,890 | |||||||||
Net cash provided by investing activities | — | 359,938 | — | |||||||||
Net cash used in financing activities | — | (128,709 | ) | — | ||||||||
|
|
|
|
|
| |||||||
Net cash flow from discontinued operations | 3,850 | 257,579 | 25,890 | |||||||||
|
|
|
|
|
| |||||||
On September 16, 2014, the Company received the consent to reinvest the Net Cash Proceeds related to the Acter Disposition within 30 months (originally was 365 days) of such asset sale.
Inkia must reinvest the net cash proceeds from the Edegel sale (US$235 million). As of December 31, 2015, Inkia has used $96 million of these net proceeds, to reinvest or to repay qualifying debt pursuant to the terms of such indenture. As a result of Energuate acquisition in January 2016, described in note 32, Inkia has fully invested the net cash proceeds from the Edegel Sale.
F-68
Table of Contents
IC POWER LTD.
Notes to the Consolidated Financial Statements as at December 31, 2015
Note 5—Discontinued operations (cont’d)
(c)Effect of disposal on the financial position of the Group
The net cash proceeds from Acter disposition are as follows:
In thousands | ||||
2014 | ||||
Consideration received | 413,000 | |||
Transaction costs | (5,844 | ) | ||
|
| |||
Total net proceeds | 407,156 | |||
Income tax paid | (47,265 | ) | ||
Other | 47 | |||
|
| |||
Net cash proceeds from Acter disposition | 359,938 | |||
|
| |||
The net cash proceeds from Acter disposition which have to reinvest are as follows:
In thousands | ||||
2014 | ||||
Net cash proceeds from Acter disposition | 359,938 | |||
Payment of Inkia’s short-term credit facility | (125,000 | ) | ||
|
| |||
| 234,938 | ||||
|
| |||
The disposal group comprised assets and liabilities as following:
In thousands | ||||
2014 | ||||
Assets: | ||||
Other receivables | 104 | |||
Income tax receivable | 49 | |||
Investment in associated companies (Note 11) | 280,113 | |||
|
| |||
Total assets of disposal group | 280,266 | |||
|
| |||
Liabilities: | ||||
Other payables | 5,355 | |||
|
| |||
Total liabilities of disposal group | 5,355 | |||
|
| |||
Net assets of disposal group | 274,911 | |||
|
| |||
F-69
Table of Contents
IC POWER LTD.
Notes to the Consolidated Financial Statements as at December 31, 2015
Note 6—Cash and cash equivalents
As at December 31 | ||||||||
2015 | 2014 | |||||||
US$ thousands | US$ thousands | |||||||
Cash and balance in banks | 252,075 | 393,631 | ||||||
Mutual fund (a) | 1,001 | — | ||||||
Time deposits (b) | 106,511 | 189,665 | ||||||
|
|
|
| |||||
| 359,587 | 583,296 | |||||||
|
|
|
| |||||
| (a) | Mutual funds are short-term investments managed by a trustee with a conservative profile. |
| (b) | Time deposits corresponds to short-term investments made for periods ranging from one day to three months, depending on immediate cash requirements of the Group, and earn interest at short-term deposit rates in US Dollars and other currencies ranging from 0.23% to 10.55% p.a. |
The Group’s exposure to credit risk, interest rate risk and currency risk and a sensitivity analysis with respect to the financial assets and liabilities is detailed in Note 29, regarding “Financial Instruments and Risk Management”.
Note 7—Short-term deposits and restricted cash
As at December 31 | ||||||||
2015 | 2014 | |||||||
US$ thousands | US$ thousands | |||||||
Short-Term deposits in banks (a) | 50,000 | 119,316 | ||||||
Restricted cash—current (b) | 251,955 | 88,330 | ||||||
|
|
|
| |||||
| 301,955 | 207,646 | |||||||
Restricted cash—non-current (b) | 16,371 | 28,351 | ||||||
|
|
|
| |||||
| 318,326 | 235,997 | |||||||
|
|
|
| |||||
| (a) | Corresponds to 180-day time deposits set by Inkia from the proceeds of the Acter sale, see Note 5. |
| (b) | Corresponds to amounts held in escrow accounts as collateral for loans and contractual obligations, such as debt service reserve accounts and time deposits that guarantee letters of credit. They earn interest at market interest rates of 0.03% to 6.2%. It includes mainly US$ 117,395 thousand in IC Power Distribution Holdings Pte. Ltd. for the acquisition of Energuate (see Note 31), and US$ 50,231 thousand of distributions received from OPC that are guarantying the amortization of ICPI mezzanine Loan-Tranch A. |
Note 8—Trade receivables
As at December 31 | ||||||||
2015 | 2014 | |||||||
US$ thousands | US$ thousands | |||||||
Open accounts | 123,377 | 181,462 | ||||||
Less—allowance for doubtful debts | (104 | ) | (104 | ) | ||||
|
|
|
| |||||
| 123,273 | 181,358 | |||||||
|
|
|
| |||||
F-70
Table of Contents
IC POWER LTD.
Notes to the Consolidated Financial Statements as at December 31, 2015
Note 9—Other receivables and debit balances, including derivative instruments
As at December 31 | ||||||||
2015 | 2014 | |||||||
US$ thousands | US$ thousands | |||||||
Government agencies (a) | 23,267 | 31,822 | ||||||
Advances to suppliers | 304 | 26 | ||||||
Prepaid expenses | 9,350 | 10,679 | ||||||
Employees | 396 | 2,069 | ||||||
Insurance claims (b) | 3,944 | 8,040 | ||||||
Other receivables | 8,128 | 5,470 | ||||||
|
|
|
| |||||
| 45,389 | 58,106 | |||||||
|
|
|
| |||||
| (a) | The balance corresponds mainly to the VAT incurred in the construction of Cerro del Aguila and Samay I (“Puerto Bravo”) projects. Both projects have the tax benefit of recovering the VAT incurred during the construction stage on a regular basis. |
| (b) | As of December 31, 2015, it corresponds to the accounts receivables recorded in Amayo II and Cobee in connection with its insurance claims for Business Interruption and for property damage by US$1,615 thousand and US$2,329 thousand, respectively. |
Note 10—Inventories
As at December 31 | ||||||||
2015 | 2014 | |||||||
US$ thousands | US$ thousands | |||||||
Fuel (a) | 5,786 | 11,873 | ||||||
Spare parts (b) | 44,565 | 43,462 | ||||||
|
|
|
| |||||
| 50,351 | 55,335 | |||||||
|
|
|
| |||||
| (a) | The plants in El Salvador, Nicaragua, Guatemala, Jamaica and Dominican Republic consume heavy fuel and the plants in Chile consume diesel for the generation of electric energy. These plants must purchase fuel in the international market and import it into the respective countries. The plants must take into consideration demand for the electric energy, available supply and transportation cost and timing when purchasing fuel. |
| (b) | Corresponds to spare parts held in storage to be used in maintenance work. |
During 2015, the Group recorded an expense of US$623 thousand in cost of sales to present its fuel inventories at net realizable value (US$1,991 thousand during 2014).
F-71
Table of Contents
IC POWER LTD.
Notes to the Consolidated Financial Statements as at December 31, 2015
Note 11—Investments in associated companies
In thousands of US$ | ||||||||||||||||||||||||||||
Equity accounted Investee | Interest | Beginning | Equity | Cumulative | Other | Dividends | Total | |||||||||||||||||||||
| 2015 | ||||||||||||||||||||||||||||
Associates | ||||||||||||||||||||||||||||
Pedregal | 21.22 | % | 9,625 | 274 | — | (269 | ) | (637 | ) | 8,993 | ||||||||||||||||||
|
|
|
|
|
|
|
|
|
|
|
| |||||||||||||||||
Total | 9,625 | 274 | — | (269 | ) | (637 | ) | 8,993 | ||||||||||||||||||||
|
|
|
|
|
|
|
|
|
|
|
| |||||||||||||||||
In thousands of US$ | ||||||||||||||||||||||||||||
Equity accounted Investee | Interest | Beginning | Equity | Cumulative | Others | Dividends | Total | |||||||||||||||||||||
| 2014 | ||||||||||||||||||||||||||||
Associates | ||||||||||||||||||||||||||||
Generandes Peru | 39.00 | % | 276,538 | 11,542 | 3,860 | (280,113 | ) | (11,827 | ) | — | ||||||||||||||||||
Pedregal | 21.22 | % | 9,847 | 2,000 | — | — | (2,222 | ) | 9,625 | |||||||||||||||||||
|
|
|
|
|
|
|
|
|
|
|
| |||||||||||||||||
Total | 286,385 | 13,542 | 3,860 | (280,113 | ) | (14,049 | ) | 9,625 | ||||||||||||||||||||
|
|
|
|
|
|
|
|
|
|
|
| |||||||||||||||||
During the last quarter of 2013, the Company announced its decision to sell its 39.01% direct equity in Generandes Peru S.A. (Holding of Edegel S.A.A.)
In April 2014, the board of directors of the Company approved the sale of Generandes Peru S.A. IC Power recorded its investment in Generandes Peru S.A. as an associate, applying the equity method until April 30, 2014. Since such date, the Company has classified this investment as held for sale at the lowest amount between its carrying amount of US$ 280,113 thousand and its fair value less costs to sell amount of approximately US$407,156 thousand.
On April 30, 2014, Inkia Americas Holdings Ltd. (the “Seller”) and the Company as guarantor of the Seller, signed a share purchase agreement with Enersis SA (Enersis) for the sale of its shares in Inkia Holdings (Acter) Limited that owns 21.14% indirect equity in Edegel S.A.A. for a sale price of US$413,000 thousand.
On September 3, 2014, Inkia Americas Holdings Ltd. completed the sale of its shares in Inkia Holdings (Acter) Limited, that has directly the equivalent of 39.01% of Generandes Peru S. A., see note 5.
F-72
Table of Contents
IC POWER LTD.
Notes to the Consolidated Financial Statements as at December 31, 2015
Note 12—Property, plant and equipment
A. Composition
As at December 31, 2015 | ||||||||||||||||||||||||||||
Balance at | Additions | Disposals | Translation | Acquisitions | Transfers | Balance at | ||||||||||||||||||||||
US$ thousands | US$ thousands | US$ thousands | US$ thousands | US$ thousands | US$ thousands | US$ thousands | ||||||||||||||||||||||
Cost | ||||||||||||||||||||||||||||
Land, roads, buildings and leasehold improvements | 279,421 | 4,612 | (144 | ) | (502 | ) | — | 3,775 | 287,162 | |||||||||||||||||||
Installations, machinery and equipment | 1,793,041 | 35,095 | (5,719 | ) | (4,954 | ) | — | 36,859 | 1,854,322 | |||||||||||||||||||
Dams | 138,260 | — | (929 | ) | — | — | 979 | 138,310 | ||||||||||||||||||||
Plants under construction | 789,681 | 477,231 | (176 | ) | (393 | ) | 8,981 | (14,949 | ) | 1,260,375 | ||||||||||||||||||
Office furniture and equipment and motor vehicles | 22,673 | 1,571 | (1,376 | ) | (446 | ) | — | (3,431 | ) | 18,991 | ||||||||||||||||||
Spare parts to plants | 38,399 | 48,873 | (304 | ) | (41 | ) | — | (30,707 | ) | 56,220 | ||||||||||||||||||
Other equipment | 24,366 | 8,733 | (409 | ) | (85 | ) | — | 5,408 | 38,013 | |||||||||||||||||||
|
|
|
|
|
|
|
|
|
|
|
|
|
| |||||||||||||||
| 3,085,841 | 576,115 | (9,057 | ) | (6,421 | ) | 8,981 | (2,066 | ) | 3,653,393 | |||||||||||||||||||
|
|
|
|
|
|
|
|
|
|
|
|
|
| |||||||||||||||
Accumulated depreciation | ||||||||||||||||||||||||||||
Land, roads, buildings and leasehold Improvements | 64,025 | 6,631 | (34 | ) | (56 | ) | — | 826 | 71,392 | |||||||||||||||||||
Installations, machinery and equipment | 429,623 | 102,367 | (2,021 | ) | (677 | ) | — | 1,365 | 530,657 | |||||||||||||||||||
Dams | 45,489 | 1,499 | (224 | ) | — | — | — | 46,764 | ||||||||||||||||||||
Office furniture and equipment and motor vehicles | 14,115 | 2,307 | (1,251 | ) | (94 | ) | — | (3,208 | ) | 11,869 | ||||||||||||||||||
Spare parts to plants | 11,314 | 795 | (188 | ) | — | — | — | 11,921 | ||||||||||||||||||||
Other equipment | 6,176 | 875 | (387 | ) | — | — | 2,174 | 8,838 | ||||||||||||||||||||
|
|
|
|
|
|
|
|
|
|
|
|
|
| |||||||||||||||
| 570,742 | 114,474 | (4,105 | ) | (827 | ) | — | 1,157 | 681,441 | ||||||||||||||||||||
|
|
|
|
|
|
|
|
|
|
|
|
|
| |||||||||||||||
Balance as at December 31, 2015 | 2,515,099 | 461,641 | (4,952 | ) | (5,594 | ) | 8,981 | (3,223 | ) | 2,971,952 | ||||||||||||||||||
|
|
|
|
|
|
|
|
|
|
|
|
|
| |||||||||||||||
F-73
Table of Contents
IC POWER LTD.
Notes to the Consolidated Financial Statements as at December 31, 2015
Note 12—Property, plant and equipment (cont’d)
A. Composition (cont’d)
As at December 31, 2014 | ||||||||||||||||||||||||||||||||
Balance at | Additions | Disposals | Write-off | Translation | Acquisitions as part of | Transfers And | Balance at of year | |||||||||||||||||||||||||
US$ thousands | US$ thousands | US$ thousands | US$ thousands | US$ thousands | US$ thousands | US$ thousands | US$ thousands | |||||||||||||||||||||||||
Cost | ||||||||||||||||||||||||||||||||
Land, roads, buildings and leasehold improvements | 252,464 | 24,829 | (317 | ) | — | (4,907 | ) | 6,997 | 355 | 279,421 | ||||||||||||||||||||||
Installations, machinery and equipment | 1,469,269 | 107,475 | (8,704 | ) | — | (55,095 | ) | 259,194 | 20,902 | 1,793,041 | ||||||||||||||||||||||
Dams | 138,538 | — | (278 | ) | — | — | — | — | 138,260 | |||||||||||||||||||||||
Plants under construction | 387,773 | 405,771 | (314 | ) | — | (23 | ) | 480 | (4,006 | ) | 789,681 | |||||||||||||||||||||
Office furniture and equipment and motor vehicles | 16,819 | 3,625 | (825 | ) | — | (477 | ) | 2,769 | 762 | 22,673 | ||||||||||||||||||||||
Spare parts to plants | 28,076 | 29,714 | (1,147 | ) | — | (1,099 | ) | 3,004 | (20,149 | ) | 38,399 | |||||||||||||||||||||
Other equipment | 20,290 | 5,174 | (735 | ) | — | (1,112 | ) | 421 | 328 | 24,366 | ||||||||||||||||||||||
|
|
|
|
|
|
|
|
|
|
|
|
|
|
|
| |||||||||||||||||
| 2,313,229 | 576,588 | (12,320 | ) | — | (62,713 | ) | 272,865 | (1,808 | ) | 3,085,841 | ||||||||||||||||||||||
|
|
|
|
|
|
|
|
|
|
|
|
|
|
|
| |||||||||||||||||
Accumulated depreciation | ||||||||||||||||||||||||||||||||
Land, roads, buildings and leasehold Improvements | 55,782 | 6,232 | (28 | ) | 2,229 | (190 | ) | — | — | 64,025 | ||||||||||||||||||||||
Installations, machinery and equipment | 325,298 | 92,395 | (2,205 | ) | 17,356 | (3,198 | ) | — | (23 | ) | 429,623 | |||||||||||||||||||||
Dams | 28,944 | 1,674 | (30 | ) | 14,901 | — | — | — | 45,489 | |||||||||||||||||||||||
Office furniture and equipment and motor vehicles | 11,810 | 2,854 | (636 | ) | 120 | (33 | ) | — | — | 14,115 | ||||||||||||||||||||||
Spare parts to plants | 10,638 | 1,037 | (286 | ) | — | — | — | (75 | ) | 11,314 | ||||||||||||||||||||||
Other equipment | 5,802 | 443 | (130 | ) | 67 | (3 | ) | — | (3 | ) | 6,176 | |||||||||||||||||||||
|
|
|
|
|
|
|
|
|
|
|
|
|
|
|
| |||||||||||||||||
| 438,274 | 104,635 | (3,315 | ) | 34,673 | (3,424 | ) | — | (101 | ) | 570,742 | ||||||||||||||||||||||
|
|
|
|
|
|
|
|
|
|
|
|
|
|
|
| |||||||||||||||||
Balance as at December 31, 2014 | 1,874,955 | 471,953 | (9,005 | ) | (34,673 | ) | (59,289 | ) | 272,865 | (1,707 | ) | 2,515,099 | ||||||||||||||||||||
|
|
|
|
|
|
|
|
|
|
|
|
|
|
|
| |||||||||||||||||
F-74
Table of Contents
IC POWER LTD.
Notes to the Consolidated Financial Statements as at December 31, 2015
Note 12—Property, plant and equipment (cont’d)
B. Depreciated balances
As at December 31 | ||||||||
2015 | 2014 | |||||||
US$ thousands | US$ thousands | |||||||
Land, roads, buildings and leasehold improvements | 215,770 | 215,396 | ||||||
Installations, machinery and equipment | 1,323,665 | 1,363,418 | ||||||
Dams | 91,546 | 92,771 | ||||||
Plants under construction | 1,260,375 | 789,681 | ||||||
Office furniture and equipment and motor vehicles | 7,122 | 8,558 | ||||||
Spare parts to plants | 44,299 | 27,085 | ||||||
Other equipment | 29,175 | 18,190 | ||||||
|
|
|
| |||||
| 2,971,952 | 2,515,099 | |||||||
|
|
|
| |||||
C. During the period ended December 31, 2015, the Group acquired assets with a cost of US$ 576,115 thousand, mainly for the construction of the Cerro del Aguila, Samay I and Kanan projects.
During the period ended December 31, 2014, the Group acquired assets with a cost of US$576,588 thousand, mainly for the construction of the Cerro del Aguila and Samay I projects, the acquisition of Las Flores power plant, and US$ 272,865 thousand in connection with AEI Nicaragua Holdings Ltd, AEI Jamaica Holdings Ltd, AEI Guatemala Holdings Ltd and Surpetroil business combinations, see note 4.
| (1) | Cerro del Aguila (CDA) is a run-of-the-river hydroelectric project on the Mantaro River located in Huancavelica, in central Peru. The plant will have an installed capacity of 510 MW. Construction of the hydroelectric plant is underway (approximately 90% advanced as of December 31, 2015). It is expected that CDA will commence commercial operation during the second half of 2016 and it is estimated to cost approximately US$ 959,000 thousand. The CDA Project is financed with a US$ 591,000 thousand syndicated credit facility, representing 62% of the total estimated cost of the project, with export credit agencies, development banks and private banks, and is collateralized by the assets of the project. The remaining 38% of the CDA Project’s cost will be financed with equity from each of Inkia and Energía del Pacífico (the minority shareholder of Kallpa, CDA and Samay I), in proportion to their ownership interests in CDA. As of December 31, 2015, CDA shareholders has already funded US$328,000 thousand. |
| (2) | On November 29, 2013, Samay I won a public bid auction conducted by the Peruvian Investment Promotion Agency to build an open cycle diesel and natural gas (dual-fired) thermoelectric plant in Mollendo, Arequipa (Southern Peru), with an installed capacity of approximately 600 MW at an estimated cost of US$ 380,000 thousand, approximately 82% of which is to be financed with a US$ 311,000 thousand seven-year syndicated secured loan agreement with Bank of Tokyo, Sumitomo and HSBC and approximately 18% of which has been financed with equity from Inkia and Energía del Pacífico. Samay I’s agreement with the Peruvian government is for a 20-year period, with fixed monthly capacity payments and pass-through of all variable costs. Construction of Samay I’s thermoelectric plant is in its early stages and it is expected that Samay I will commence commercial operations in mid-2016, in accordance with the terms of its agreement with the Peruvian government. |
F-75
Table of Contents
IC POWER LTD.
Notes to the Consolidated Financial Statements as at December 31, 2015
Note 12—Property, plant and equipment (cont’d)
| (3) | In April 2014, Kallpa Generacion S.A., a subsidiary of Inkia, completed its US$ 114,000 thousand purchase of the 193 MW single turbine natural gas fired plant “Las Flores”, located in Chilca, Peru. Las Flores, which commenced its commercial operation in May 2010, permits for a future 190 MW gas-fired expansion and has sufficient space to locate such a facility, as well as a combined cycle expansion, on its existing premises. |
D.When there is any indication of impairment, the Group’s entities perform impairment tests for their long lived assets using fair values less cost to sell based on independent appraisals or value in use estimations, with similar assumptions as those described in note 13(d). In September 2014, a subsidiary of Inkia updated its five-year budget; as a result of a downward trend in its results combined with anticipated impacts of recent political changes in the country in which the subsidiary operates, which affects the power generation business therein, and expectations of an increase in operating costs and unchanged electricity prices, which will lead to a decrease in its forecast profitability. As a result, Inkia considered a potential impairment in this subsidiary and conducted an impairment analysis using the value in use method and a discount rate of 7.6%. Accordingly, Inkia determined that the book value of the subsidiary’s assets exceeded its recoverable amount and therefore recorded an impairment loss of US$34,673 thousand.
At the end of 2015, Inkia performed an impairment test on the long lived assets of this subsidiary in order to identify whether the impairment loss is reversed or whether an additional impairment loss is required. As a result of this, no additional impairment loss is required as of December 31, 2015. However, due to the sensitively of the assumptions used, management believes that minor changes in the key assumptions may affect materially the carrying value of this subsidiary in the future.
E. The amount of borrowing costs capitalized during 2015 was US$31,596 thousand (US$ 52,124 thousand during 2014).
F. Property, plant and equipment include assets acquired through finance leases. At December 31, 2015 and 2014, the cost and corresponding accumulated depreciation of such assets are as follows:
In thousands of US$ | ||||||||||||||||||||||||
As of December 31, 2015 | As of December 31, 2014 | |||||||||||||||||||||||
Cost | Accumulated | Net cost | Cost | Accumulated | Net cost | |||||||||||||||||||
Land, roads, buildings and leasehold improvements | 42,281 | (5,545 | ) | 36,736 | 42,280 | (4,488 | ) | 37,792 | ||||||||||||||||
Installations, machinery and equipment | 275,674 | (104,401 | ) | 171,273 | 279,735 | (88,886 | ) | 190,849 | ||||||||||||||||
|
|
|
|
|
|
|
|
|
|
|
| |||||||||||||
| 317,955 | (109,946 | ) | 208,009 | 322,015 | (93,374 | ) | 228,641 | |||||||||||||||||
|
|
|
|
|
|
|
|
|
|
|
| |||||||||||||
G. The composition of the depreciation expense is as follows:
As at December 31 | ||||||||
2015 | 2014 | |||||||
US$ thousands | US$ thousands | |||||||
Depreciation charged to results | 114,253 | 104,337 | ||||||
Depreciation charged to fixed assets* | 221 | �� | 298 | |||||
|
|
|
| |||||
| 114,474 | 104,635 | |||||||
|
|
|
| |||||
| * | Depreciation expenses on motor vehicles of projects under construction (CDA and Samay I) are capitalized. |
F-76
Table of Contents
IC POWER LTD.
Notes to the Consolidated Financial Statements as at December 31, 2015
Note 12—Property, plant and equipment (cont’d)
As at December 31 | ||||||||
2015 | 2014 | |||||||
US$ thousands | US$ thousands | |||||||
Depreciation charged to cost of sales | 105,743 | 96,920 | ||||||
Depreciation charged to general, selling and administrative expenses | 8,510 | 7,417 | ||||||
|
|
|
| |||||
Depreciation charged to results | 114,253 | 104,337 | ||||||
|
|
|
| |||||
Amortization of intangibles charged to costs of sales | 5,174 | 4,076 | ||||||
|
|
|
| |||||
Depreciation and amortization charged to results | 119,427 | 108,413 | ||||||
|
|
|
| |||||
H.The Company owns fully depreciated assets that are still in operation. As at December 31, 2015, the original cost of such assets was US$88,804 thousand (US$66,387 as at December 31, 2014).
Note 13—Intangible assets
A. Composition:
Goodwill | Client | Licenses | Software | Development | Total | |||||||||||||||||||
US$ thousands | US$ thousands | US$ thousands | US$ thousands | US$ thousands | US$ thousands | |||||||||||||||||||
Cost | ||||||||||||||||||||||||
Balance as at January 1, 2014 | 51,627 | 16,601 | 1,012 | 1,195 | 33,106 | 103,541 | ||||||||||||||||||
Acquisitions as part of business Combinations | 10,228 | 24,473 | 49 | — | 5,659 | 40,409 | ||||||||||||||||||
Acquisitions—self Development | — | — | 21 | 263 | 15,516 | 15,800 | ||||||||||||||||||
Reclassification | — | — | — | — | (1,905 | ) | (1,905 | ) | ||||||||||||||||
Translation differences | (1,826 | ) | — | 1 | (73 | ) | — | (1,898 | ) | |||||||||||||||
|
|
|
|
|
|
|
|
|
|
|
| |||||||||||||
Balance as at December 31, 2014 | 60,029 | 41,074 | 1,083 | 1,385 | 52,376 | 155,947 | ||||||||||||||||||
|
|
|
|
|
|
|
|
|
|
|
| |||||||||||||
Acquisitions as part of business combinations | 119 | — | — | — | 464 | 583 | ||||||||||||||||||
Acquisitions—self development | — | — | — | 194 | 15,070 | 15,264 | ||||||||||||||||||
Reclassification | — | — | 14 | 63 | (191 | ) | (114 | ) | ||||||||||||||||
Translation differences | (2,022 | ) | — | — | (3 | ) | (10 | ) | (2,035 | ) | ||||||||||||||
|
|
|
|
|
|
|
|
|
|
|
| |||||||||||||
Balance as at December 31, 2015 | 58,126 | 41,074 | 1,097 | 1,639 | 67,709 | 169,645 | ||||||||||||||||||
|
|
|
|
|
|
|
|
|
|
|
| |||||||||||||
Amortization and declines in value | ||||||||||||||||||||||||
Balance as at January 1, 2014 | — | 9,196 | 301 | 488 | 3,171 | 13,156 | ||||||||||||||||||
Amortization for the year | — | 3,395 | 77 | 122 | 482 | 4,076 | ||||||||||||||||||
Translation differences | — | — | — | (19 | ) | — | (19 | ) | ||||||||||||||||
|
|
|
|
|
|
|
|
|
|
|
| |||||||||||||
Balance as at December 31, 2014 | — | 12,591 | 378 | 591 | 3,653 | 17,213 | ||||||||||||||||||
|
|
|
|
|
|
|
|
|
|
|
| |||||||||||||
Amortization for the year | — | 4,297 | 71 | 196 | 610 | 5,174 | ||||||||||||||||||
Reclassification | — | — | — | 13 | — | 13 | ||||||||||||||||||
Translation differences | — | — | — | — | 1 | 1 | ||||||||||||||||||
|
|
|
|
|
|
|
|
|
|
|
| |||||||||||||
Balance as at December 31, 2015 | — | 16,888 | 449 | 800 | 4,264 | 22,401 | ||||||||||||||||||
|
|
|
|
|
|
|
|
|
|
|
| |||||||||||||
Carrying value | ||||||||||||||||||||||||
As at December 31, 2014 | 60,029 | 28,483 | 705 | 794 | 48,723 | 138,734 | ||||||||||||||||||
As at December 31, 2015 | 58,126 | 24,186 | 648 | 839 | 63,445 | 147,244 | ||||||||||||||||||
|
|
|
|
|
|
|
|
|
|
|
| |||||||||||||
F-77
Table of Contents
IC POWER LTD.
Notes to the Consolidated Financial Statements as at December 31, 2015
Note 13—Intangible assets (cont’d)
| (a) | Intangible assets comprise mainly assets identified as a result of the business combination, such as the acquisition of “client relationships” and others in the purchase of its subsidiaries. |
Amortization of intangibles is included in “depreciation and amortization” in the income statement.
(b) Development cost corresponds to expenditures incurred in the design and evaluation of future power plant facilities in the countries in which the Company currently operates. These projects have different level of advance such as: temporal concessions, environmental impact studies in process and others.
As of December 31, 2015, balance of intangible assets mainly corresponds to cost incurred in the construction and improvements of public access roads in connection with CDA project, and the development costs of two hydroelectrical projects in Peru and two thermal projects in Chile.
(c) Goodwill arises from the following Group entities (cash generating unit):
In thousands of US$ | ||||||||
2015 | 2014 | |||||||
Nejapa Power Company LLC and Compañia de Energía de Centroamerica S.A. de C.V. | 40,693 | 40,693 | ||||||
Kallpa Generación S.A. | 10,934 | 10,934 | ||||||
Surpetroil S.A.C.* | 6,383 | 8,402 | ||||||
Advanced Integrated Energy Limited (AIE)* | 116 | — | ||||||
|
|
|
| |||||
Book value | 58,126 | 60,029 | ||||||
|
|
|
| |||||
| * | Goodwill in Colombia’s and Israel’s subsidiaries recorded in pesos colombianos and shekels, respectively; translated into US dollars at the exchange rate at the reporting date. |
(d) Impairment testing
The recoverable amount of each CGU is based on the estimated value in use using discounted cash flows. The cash flows are derived from the 5-year budget approved by the Board of Directors and its Shareholders.
The key assumptions used in the estimation of the recoverable amount are set below. The values assigned to key assumptions represent management’s assessment of future trends in the power sector and have been based on historic data from external and internal sources.
| (Percentage) | 2015 | 2014 | ||||||
Discount rate | ||||||||
Peru | 7.4 | 6.9 | ||||||
El Salvador | 10.0 | 9.2 | ||||||
Colombia | 9.2 | 11.1 | ||||||
Terminal value growth rate | 1.2 – 2.0 | 1.2 – 2.0 | ||||||
F-78
Table of Contents
IC POWER LTD.
Notes to the Consolidated Financial Statements as at December 31, 2015
Note 13—Intangible assets (cont’d)
The discount rate is a post-tax measure based on the characteristics of each CGU with a possible debt leveraging of 48% in 2015 and of 43% in 2014.
The cash flow projections included specific estimates for five years and a terminal growth rate thereafter. The terminal growth rate was determined based on management’s estimate of the long term inflation
In addition to the discount and growth rates, the key assumptions used to estimate future cash flows, based on past experience and current sector forecasts, are as follows:
| • | Existing power purchase agreements (PPAs) signed |
| • | Investment schedule—The Company Management has used the updated investment schedule in countries in which those companies operate, in order that the supply satisfies the demand growth in an efficient manner. |
| • | The production mix of each country was determined using specifically-developed internal forecast models that consider factors such as prices and availability of commodities, forecast demand of electricity, planned construction or the commissioning of new capacity in the country’s various technologies. |
| • | Fuel prices have been calculated based on existing supply contracts and on estimated future prices including a price differential adjustment specific to every product according to local characteristics. |
| • | Assumptions for energy sale and purchase prices and output of generation facilities are made based on complex specifically-developed internal forecast models for each country. |
| • | Demand—Demand forecast has taken into consideration the most probable economic performance as well as growth forecasts of different sources. |
| • | Technical performance—The forecast takes into consideration that the power plants have an appropriate preventive maintenance that permits their proper functioning. |
(e)Sensitivity to changes in assumptions
With regard to the assessment of value in use of the CGUs, management believes that minor changes in the above key assumptions may affect materially the carrying value of Surpetroil (US$ 6,383 thousand as of December 31, 2015) to exceed its recoverable amount. Other than that management believes that no reasonably possible change in any of the above key assumptions would cause the carrying value of Nejapa, Kallpa and AIE to materially exceed its recoverable amount.
F-79
Table of Contents
IC POWER LTD.
Notes to the Consolidated Financial Statements as at December 31, 2015
Note 14—Loans from banks and others
This note provides information regarding the contractual conditions of the Group’s interest bearing loans and credit, which are measured based on amortized cost. Additional information regarding the Group’s exposure to interest risks, foreign currency and liquidity risk, is provided in Note 29, in connection with financial instruments.
A. Composition
As at December 31, 2015 | As at December 31, 2014 | |||||||||||||||||||||||||
| Nominal annual | US$ thousands | US$ thousands | ||||||||||||||||||||||||
Interest rate | Currency | Maturity | Current | Non-Current | Current | Non-Current | ||||||||||||||||||||
Short-term loans from banks | ||||||||||||||||||||||||||
IC Power Distribution Holdings | ||||||||||||||||||||||||||
Credit Suisse (D) | LIBOR + 4% | USD | 2016 | 117,334 | — | — | — | |||||||||||||||||||
Cepp | ||||||||||||||||||||||||||
BHD Bank | 2.48% / 3.80% | USD | 2016/2015 | 3,000 | — | 5,000 | — | |||||||||||||||||||
Kallpa Generación | ||||||||||||||||||||||||||
Banco de Crédito del Perú | 1.15% | USD | 2015 | — | — | 29,107 | — | |||||||||||||||||||
Banco de Crédito del Perú | 0.69% | USD | 2016 | 30,000 | — | — | — | |||||||||||||||||||
Scotiabank Perú | 0.63% | USD | 2016 | 15,000 | — | — | — | |||||||||||||||||||
Cobee | ||||||||||||||||||||||||||
Various entities | 5.50% / 6.00% | BOB | 2016/2015 | 4,525 | — | 12,503 | — | |||||||||||||||||||
Nejapa | ||||||||||||||||||||||||||
Scotiabank El Salvador | 5.50% | USD | 2016 | 5,000 | — | — | — | |||||||||||||||||||
Banco America Central | 4.25% | USD | 2016 | 1,200 | — | — | — | |||||||||||||||||||
IC Power Chile Inv | ||||||||||||||||||||||||||
Scotiabank | TAB + 1.20% | CLP | 2016 | 489 | — | — | — | |||||||||||||||||||
Cenergica | ||||||||||||||||||||||||||
Banco America Central | 4.25% | USD | 2016 | 700 | — | — | — | |||||||||||||||||||
Surpetroil | ||||||||||||||||||||||||||
Various entities | DTF+2.95%/4.15% | COP | ||||||||||||||||||||||||
| IBR+4.25% | 2016/2015 | 2,069 | — | 1,527 | — | |||||||||||||||||||||
PQP | ||||||||||||||||||||||||||
Banco Industrial Guatemala | 4.75% | USD | 2015 | — | — | 10,000 | — | |||||||||||||||||||
|
|
|
|
|
|
|
| |||||||||||||||||||
Subtotal | 179,317 | — | 58,137 | — | ||||||||||||||||||||||
Loans from Banks and others | ||||||||||||||||||||||||||
Financial institutions: | ||||||||||||||||||||||||||
Cerro del Aguila(E) | ||||||||||||||||||||||||||
Tranche A | LIBOR+4.25%- | |||||||||||||||||||||||||
| LIBOR +5.50% | USD | �� | 2024 | 4,199 | 306,064 | — | 257,022 | |||||||||||||||||||
Tranche B | LIBOR+4.25%- | |||||||||||||||||||||||||
| LIBOR +6.25% | USD | 2024 | 2,261 | 164,803 | — | 138,396 | ||||||||||||||||||||
Tranche 1D | LIBOR+2.75%- | |||||||||||||||||||||||||
| LIBOR +3.60% | USD | 2024 | 519 | 37,827 | — | 31,766 | ||||||||||||||||||||
Tranche 2D | LIBOR+2.75%- | |||||||||||||||||||||||||
| LIBOR +3.60% | USD | 2027 | 280 | 20,369 | — | 17,105 | ||||||||||||||||||||
Samay I(F) | ||||||||||||||||||||||||||
Sumitomo /HSBC / Bank of Tokyo | LIBOR+2.125%- | USD | ||||||||||||||||||||||||
| LIBOR +2.625% | 2021 | 3,030 | 282,369 | — | 144,636 | |||||||||||||||||||||
F-80
Table of Contents
IC POWER LTD.
Notes to the Consolidated Financial Statements as at December 31, 2015
Note 14—Loans from banks and others (cont’d)
A. Composition (cont’d)
As at December 31, 2015 | As at December 31, 2014 | |||||||||||||||||||||||||
| Nominal annual | US$ thousands | US$ thousands | ||||||||||||||||||||||||
Interest rate | Currency | Maturity | Current | Non-Current | Current | Non-Current | ||||||||||||||||||||
Kallpa Generación(G) | ||||||||||||||||||||||||||
Syndicated Loan—Various entities | LIBOR+6.00% | USD | 2019 | 17,384 | 41,279 | 13,895 | 58,663 | |||||||||||||||||||
Central Cardones(H) | ||||||||||||||||||||||||||
Tranche One | ||||||||||||||||||||||||||
BCI / Banco Itaú | LIBOR+1.9% | USD | 2021 | 3,535 | 22,008 | 3,276 | 25,536 | |||||||||||||||||||
Tranche Two | ||||||||||||||||||||||||||
BCI / Banco Itaú | LIBOR+2.75% | USD | 2017 | — | 17,884 | — | 19,384 | |||||||||||||||||||
Colmito(I) | ||||||||||||||||||||||||||
Banco Bice | 7.90% | CLP | 2028 | 524 | 15,799 | 622 | 19,176 | |||||||||||||||||||
Consorcio Eólico Amayo, S.A.(J) | ||||||||||||||||||||||||||
Banco Centroamericano de Integración | 8.45%- | |||||||||||||||||||||||||
Económica | LIBOR +4% | USD | 2023 | 4,428 | 42,704 | 4,533 | 47,147 | |||||||||||||||||||
Consorcio Eólico Amayo (Fase II), S.A. (K) | ||||||||||||||||||||||||||
Various entities | LIBOR+5.75%, | |||||||||||||||||||||||||
| 8.53%,10.76% | USD | 2025 | 2,930 | 31,279 | 2,838 | 34,209 | ||||||||||||||||||||
Empresa Energética Corinto, Ltd. | ||||||||||||||||||||||||||
Banco de América Central (BAC) | 8.35% | USD | 2018 | 2,865 | 6,527 | 2,634 | 9,392 | |||||||||||||||||||
Tipitapa Power Company, Ltd. | ||||||||||||||||||||||||||
Banco de América Central (BAC) | 8.35% | USD | 2018 | 2,568 | 6,130 | 1,951 | 5,781 | |||||||||||||||||||
Jamaica Private Power Company | ||||||||||||||||||||||||||
Royal Bank of Canada | LIBOR + 5.50% | USD | 2017 | 4,011 | — | 2,983 | 3,990 | |||||||||||||||||||
Burmeister & Wain Scandinavian Contractor A/S | 3.59% | USD | 2018 | 326 | 571 | 315 | 897 | |||||||||||||||||||
PQP (L) | ||||||||||||||||||||||||||
Banco Industrial | LIBOR + 4.50% | USD | 2019 | 4,268 | 10,743 | 4,757 | 17,034 | |||||||||||||||||||
Surpetroil S.A.S | ||||||||||||||||||||||||||
Banco Corpbanca Colombia S.A | 3.95% | COP | 2015 | — | — | 135 | — | |||||||||||||||||||
Banco Pichincha | 7.33% | COP | 2017 | 128 | 95 | — | — | |||||||||||||||||||
OPC Rotem Ltd | ||||||||||||||||||||||||||
Lenders Consortium (M) | 4.85%-5.36% | NIS | 2031 | 16,272 | 360,295 | 18,818 | 381,246 | |||||||||||||||||||
Veolia Energy Israel Ltd. (N) | 2016 | 5,080 | — | — | 19,060 | |||||||||||||||||||||
IC Power Israel Ltd(O) | ||||||||||||||||||||||||||
Facility A—Amitim and Menora Pension Funds | 4.85%/7.75% | NIS | 2016 | 41,313 | — | — | 39,902 | |||||||||||||||||||
Facility B—Amitim and Menora Pension Funds | 7.75% | NIS | 2029 | 4,251 | 51,020 | — | 53,203 | |||||||||||||||||||
IC Power Ltd | ||||||||||||||||||||||||||
Bank Hapoalim New York | 1.25% | NIS | 2016 | 12,000 | — | — | 12,003 | |||||||||||||||||||
AGS | ||||||||||||||||||||||||||
Veolia Energy Israel Ltd | NIS | 2017 | — | 414 | — | — | ||||||||||||||||||||
|
|
|
|
|
|
|
| |||||||||||||||||||
Sub total | 132,172 | 1,418,180 | 56,757 | 1,335,548 | ||||||||||||||||||||||
|
|
|
|
|
|
|
| |||||||||||||||||||
F-81
Table of Contents
IC POWER LTD.
Notes to the Consolidated Financial Statements as at December 31, 2015
Note 14—Loans from banks and others (cont’d)
A. Composition (cont’d)
As at December 31, 2015 | As at December 31, 2014 | |||||||||||||||||||||||||
| Nominal annual | US$ thousands | US$ thousands | ||||||||||||||||||||||||
Interest rate | Currency | Maturity | Current | Non-Current | Current | Non-Current | ||||||||||||||||||||
Liabilities in respect of finance leases: | ||||||||||||||||||||||||||
Kallpa Generación | ||||||||||||||||||||||||||
Banco de Crédito del Perú/ Citibank (P) | LIBOR+3.00% | USD | 2016 | 2,334 | — | 8,901 | 2,335 | |||||||||||||||||||
Banco de Crédito del Perú (Q) | LIBOR+2.05% | USD | 2017 | 8,802 | 19,865 | 6,473 | 28,667 | |||||||||||||||||||
Scotiabank Perú (R) | 7.57% | USD | 2018 | 7,508 | 30,248 | 7,140 | 37,755 | |||||||||||||||||||
Banco de Crédito del Perú (S) | 7.15% | USD | 2023 | 6,624 | 87,816 | 6,624 | 94,440 | |||||||||||||||||||
Surpetroil S.A.S. | ||||||||||||||||||||||||||
Banco de Occidente S.A. | DTF + 3.5% | COP | 2017 | 461 | 116 | 444 | 759 | |||||||||||||||||||
| 25,729 | 138,045 | 29,582 | 163,956 | |||||||||||||||||||||||
|
|
|
|
|
|
|
| |||||||||||||||||||
Sub total | 157,901 | 1,556,225 | 86,339 | 1,499,504 | ||||||||||||||||||||||
Debentures | ||||||||||||||||||||||||||
Cobee | ||||||||||||||||||||||||||
Bonds Cobee II (T) | 9.40% | USD | 2015 | — | — | 6,803 | — | |||||||||||||||||||
Bonds Cobee III-1B (U) | 6.50% | USD | 2017 | 1,750 | 1,750 | — | 3,500 | |||||||||||||||||||
Bonds Cobee III-1C (bolivianos) (U) | 9.00% | BOB | 2020 | — | 6,343 | — | 6,343 | |||||||||||||||||||
Bonds Cobee III-2 (U) | 6.75% | USD | 2017 | — | 5,000 | — | 5,000 | |||||||||||||||||||
Bonds Cobee III-3 (bolivianos) (U) | 7.00% | BOB | 2022 | — | 6,160 | — | 6,160 | |||||||||||||||||||
Bonds Cobee IV-1A (V) | 6.00% | USD | 2018 | — | 3,977 | — | 3,967 | |||||||||||||||||||
Bonds Cobee IV-1B (V) | 7.00% | USD | 2020 | — | 3,972 | — | 3,964 | |||||||||||||||||||
Bonds Cobee IV-1C (bolivianos) (V) | 7.80% | BOB | 2024 | — | 12,023 | — | 12,020 | |||||||||||||||||||
Cobee Bonds-IV Issuance 3 (V) | 6.70% | USD | 2019 | — | 4,961 | — | 4,950 | |||||||||||||||||||
Cobee Bonds-IV Issuance 4 (bolivianos) (V) | 7.80% | BOB | 2024 | — | 15,035 | — | 15,029 | |||||||||||||||||||
Kallpa Generación | ||||||||||||||||||||||||||
Kallpa Bonds (W) | 8.50% | USD | 2022 | 13,650 | 135,455 | 10,207 | 149,105 | |||||||||||||||||||
Inkia Energy Ltd | ||||||||||||||||||||||||||
Inkia Bonds (X) | 8.375% | USD | 2021 | — | 447,524 | — | 447,357 | |||||||||||||||||||
Cepp | ||||||||||||||||||||||||||
Cepp Bonds (Y) | 6.00% | USD | 2019 | — | 9,924 | — | 24,755 | |||||||||||||||||||
|
|
|
|
|
|
|
| |||||||||||||||||||
| 15,400 | 652,124 | 17,010 | 682,150 | |||||||||||||||||||||||
|
|
|
|
|
|
|
| |||||||||||||||||||
Cobee | ||||||||||||||||||||||||||
Cobee Bonds (Premium) | USD-BOB | 2017-2024 | — | 3,723 | — | 4,792 | ||||||||||||||||||||
|
|
|
|
|
|
|
| |||||||||||||||||||
Subtotal | 15,400 | 655,847 | 17,010 | 686,942 | ||||||||||||||||||||||
|
|
|
|
|
|
|
| |||||||||||||||||||
Total | 352,618 | 2,212,072 | 161,486 | 2,186,446 | ||||||||||||||||||||||
|
|
|
|
|
|
|
| |||||||||||||||||||
| DTF: | “Depósitos a Término Fijo”. Fixed-term deposits rate calculated by Colombia’s Central Bank. |
| IBR: | “Indicador Bancario de Referencia”. Bank Indicator of Reference calculated by Colombia’s Central Bank. |
| TAB: | “Tasa Activa Bancaria”. Short-term credits average interest rate calculated by Chile’s Bank’s Association. |
| TRE: | “Tasa de Referencia”. Weighted average for time deposits rates, calculated by Bolivia’s Central Bank. |
F-82
Table of Contents
IC POWER LTD.
Notes to the Consolidated Financial Statements as at December 31, 2015
Note 14—Loans from banks and others (cont’d)
| B. | Classified by currency and interest rates |
Weighted | As at December 31 | |||||||||||
2015 | 2015 | 2014 | ||||||||||
% | US$ thousands | US$ thousands | ||||||||||
Short-term loans from banks | ||||||||||||
In dollars | 3.57 | % | 172,234 | 15,000 | ||||||||
Other | 6.50 | % | 7,083 | 43,137 | ||||||||
|
|
|
| |||||||||
| 179,317 | 58,137 | |||||||||||
|
|
|
| |||||||||
| Non-current liabilities (including current maturities) Debentures: | ||||||||||||
In dollars | 8.21 | % | 629,014 | 661,200 | ||||||||
In other currencies | 6.14 | % | 42,233 | 42,752 | ||||||||
|
|
|
| |||||||||
| 671,247 | 703,952 | |||||||||||
|
|
|
| |||||||||
Loans from banks: | ||||||||||||
In dollars | 5.10 | % | 1,206,358 | 860,145 | ||||||||
In Shekels (*) | 5.69 | % | 490,645 | 493,169 | ||||||||
In other currencies | 7.87 | % | 17,123 | 19,931 | ||||||||
|
|
|
| |||||||||
| 1,714,126 | 1,373,245 | |||||||||||
|
|
|
| |||||||||
| 2,385,373 | 2,077,197 | |||||||||||
|
|
|
| |||||||||
| (*) | Does not include Veolia Energy Israel Ltd |
| C. | Liability in respect of financing lease |
Information regarding the financing lease liability broken down by payment dates is presented below:
As at December 31, 2015 | As at December 31, 2014 | |||||||||||||||||||||||
Minimum lease rentals | Interest | Present value of rentals | Minimum lease rentals | Interest | Present value of rentals | |||||||||||||||||||
| US$ thousands | US$ thousands | US$ thousands | US$ thousands | US$ thousands | US$ thousands | |||||||||||||||||||
Less than one year | 35,501 | 9,772 | 25,729 | 40,722 | 11,140 | 29,582 | ||||||||||||||||||
From one year to five years | 134,976 | 26,053 | 108,923 | 153,396 | 33,122 | 120,274 | ||||||||||||||||||
More than five years | 31,454 | 2,332 | 29,122 | 48,725 | 5,043 | 43,682 | ||||||||||||||||||
|
|
|
|
|
|
|
|
|
|
|
| |||||||||||||
| 201,931 | 38,157 | 163,774 | 242,843 | 49,305 | 193,538 | |||||||||||||||||||
|
|
|
|
|
|
|
|
|
|
|
| |||||||||||||
F-83
Table of Contents
IC POWER LTD.
Notes to the Consolidated Financial Statements as at December 31, 2015
Note 14—Loans from banks and others (cont’d)
Short-term loans from banks
| D. | Credit Suisse—On December 29, 2015, IC Power Distribution Holdings Pte. Ltd., together with certain of its subsidiaries, executed a one-year secured credit agreement with Credit Suisse AG in an aggregate principal amount of US$120,000 thousand to finance a portion of the acquisition of Estrella Cooperatief B.A., a holding company that indirectly owns 90.6% and 92.7% of two operating companies that operate an electricity distribution business in Guatemala and 100% of two smaller related businesses (the acquired businesses are referred to as “Energuate”). The loan under this facility bears interest on a quarterly basis at LIBOR plus a margin of 4% per annum and was secured with the shares of Estrella Cooperatief B.A. For additional information see Note 32. |
| As of December 31, 2015, the outstanding principal amount under this facility was US$120,000 thousand. (US$ 117,334 thousand, net of transaction costs). |
Long term loans from banks and others
| E. | In August 2012, CDA, as borrower, Sumitomo Mitsui Banking Corporation, as administrative agent, Sumitomo Mitsui Banking Corporation, as SACE agent, the Bank of Nova Scotia, as Offshore Collateral Agent, Scotiabank Perú, S.A.A., as onshore collateral agent, and certain financial institutions, as lenders, entered into a senior secured syndicated credit facility for an aggregate principal amount not to exceed US$ 591,000 thousand to finance the construction of CDA’s project. Loans under this facility will be disbursed in three tranches. |
| The loans under this credit agreement are secured by CDA’s power plant and related assets, comprise three tranches and bear interest payable on quarterly basis in arrears at a rate of LIBOR plus a margin. The margin applicable to each tranche is as follows: |
Tranche | Amount* | From July 2014 to August | From August 2017 to August | From august 2020 to august | From august 2023 to maturity | |||||||||||||||
A | 341,843 | 4.25 | % | 4.75 | % | 5.25 | % | 5.50 | % | |||||||||||
B | 184,070 | 4.25 | % | 5.00 | % | 5.75 | % | 6.25 | % | |||||||||||
D | 65,000 | 2.75 | % | 3.25 | % | 3.60 | % | 3.60 | % | |||||||||||
| * | Up to |
Tranche A loans under this facility, in an aggregate principal amount of up to US$341,843 thousand, will initially bear interest at the rate of LIBOR plus 4.25% per annum, increasing over time beginning on the date after the interest payment date occurring after August 17, 2017 to LIBOR plus 5.50% per annum from the date after the interest payment date occurring after August 17, 2023 through maturity. Principal of the Tranche A loans will be payable in 33 quarterly installments commencing on the first quarterly payment date occurring after the project acceptance by CDA. Tranche A loans will be guaranteed by Corporación Financiera de Desarollo S.A. (COFIDE).
F-84
Table of Contents
IC POWER LTD.
Notes to the Consolidated Financial Statements as at December 31, 2015
Note 14—Loans from banks and others (cont’d)
Long term loans from banks and others (cont’d)
Tranche B loans under this facility, in an aggregate principal amount of up to US$ 184,070 thousand, will initially bear interest at the rate of LIBOR plus 4.25% per annum, increasing over time beginning on the date after the interest payment date occurring after August 17, 2017 to LIBOR plus 6.25% per annum from the date after the interest payment date occurring after August 17, 2023 through maturity. Principal of the Tranche B loans are payable on August 17, 2024. Tranche B loans are guaranteed by COFIDE.
Tranche D loans under this facility, in an aggregate principal amount of up to US$65,000 thousand, are divided in two parts: Tranche 1D, in an aggregate principal amount of up to US$ 42,250 thousand and Tranche 2D, in an aggregate principal amount of up to US$22,750 thousand. Both parts will initially bear interest at the rate of LIBOR plus 2.75% per annum, increasing over time beginning on the date after the interest payment date occurring after August 17, 2017 to LIBOR plus 3.60% per annum from the date after the interest payment date occurring after August 17, 2023 through maturity. Principal of Tranche 1D and Tranche 2D will be payable in 33 and 12 quarterly installments, respectively. Tranche 1D payments will commence on the first quarterly payment date occurring after the project acceptance by CDA and Tranche 2D payments will commence 33 quarters after project acceptance by CDA. All Tranche D loans are secured by a credit insurance policy provided by SACE S.p.A. – Servizi Assicurativi del Commercio Estero, or SACE.
On August 17, 2013 CDA entered into interest rate swap closings: 100% of Tranche A was swapped at a fixed all-in interest rate of 7.2450% until August 2024 and 50% of Tranche B was swapped at a fixed all-in interest rate of 5.3777% until February 2016.
As of December 31, 2015, CDA has received proceeds from these facilities in the aggregate amount of US$ 547,000 thousand (US$85,000 thousand, US$319,000 thousand and US$143,000 during 2015, 2014 and 2013, respectively). This amount is shown net of US$10,678 thousand of transaction costs.
| F. | In December 2014, Samay I S.A. signed a project finance credit agreement with: The Bank of Tokyo-Mitsubishi, Sumitomo Mitsui Banking Corporation and HSBC Bank in order to finance US$ 311,000 thousand, approximately 82% of the total cost of the project. This loan will initially bear interest at the rate of LIBOR plus 2.125% per annum, increasing to LIBOR plus 2.375% in December 2017 and to LIBOR plus 2.625% in December 2020 through maturity in December 2021. On December 18, 2014 Samay entered into an interest rate swap closing at a fixed all-in interest rate of 2.919% (Libor at 0.794 plus 2.125%) for 40% of total notional and only during the construction period. On September 16, 2015 Samay entered into an interest rate swap closing at a fixed all-in interest rate of 4.2343% for 93% of total notional beginning after the construction period. Samay has received proceeds from this facility in the aggregate amount of US$ 291,000 thousand (US$138,000 thousand and US$ 153,000 thousand, during 2015 and 2014, respectively). This amount is shown net of US$ 5,601 thousand of transaction costs. |
| G. | Kallpa Syndicated Loan—In November 2009, Kallpa entered into a secured credit agreement in the aggregate amount of US$ 105,000 thousand to finance capital expenditures related to Kallpa’s |
F-85
Table of Contents
IC POWER LTD.
Notes to the Consolidated Financial Statements as at December 31, 2015
Note 14—Loans from banks and others (cont’d)
Long term loans from banks and others (cont’d)
| combined-cycle plant. The loans under this credit agreement are secured by Kallpa’s combined-cycle plant substantially all of Kallpa’s other assets, including Kallpa’s revenues under its PPAs. The loan under this credit agreement bears interest payable monthly in arrears at a rate of LIBOR plus a margin of 5.50% per annum through November 2012, 5.75% per annum from November 2012 through November 2015 and 6.00% from November 2015 through maturity in October 2019. Scheduled amortizations of principal are payable monthly commencing in February 2013 through maturity in October 2019. As of December 31, 2015, the outstanding balance under this credit agreement was US$ 58,663 thousand (US$ 72,558 thousand as of December 31, 2014). |
| H. | In connection with Inkia’s acquisition of Central Cardones in December 2011, Inkia consolidated the amounts outstanding under Central Cardones’ credit agreement entered with Banco de Crédito e Inversiones and Banco Itaú Chile. The loans under this credit agreement were issued in two tranches of US$ 37,296 thousand and US$ 20,884 thousand, respectively. Loans under the first tranche bear interest at the rate of LIBOR plus 1.9% per annum, and the principal of this tranche is payable in 20 semi-annual installments through maturity in August 2021. Interest rate under these loans is swapped at an all-in rate of 6.80%. Loans under the second tranche bear interest at the rate of LIBOR plus 2.75% per annum, interest is payable semi-annually, and the loan matures in February 2017. As of December 31, 2015, the outstanding principal amount under these loans was US$43,427 thousand (US$48,196 thousand as of December 31, 2014). |
| I. | In January 2014, Colmito Spa signed a credit agreement with Banco Bice in an aggregate amount of Chilean pesos 12,579,160 thousand (US$ 22,600 thousand). This loan bears an interest rate of 7.9% in Chilean pesos and is paid semiannually until final maturity in December 2028. In February 2014 Colmito entered into a cross currency swap closing at a fixed interest rate of 6.025% in U.S. Dollars. As of December 31, 2015, the outstanding balance under this loan was US$ 16,323 thousand (US$ 19,798 thousand as of December 31,2014). |
As of result of the business combinations described in note 4, Inkia assumed the following main long-term loans:
| J. | Consorcio Eolico Amayo S.A.—In October 2007, Amayo I entered into a 15 year US$ 71,250 thousand loan agreement with Banco Centroamericano de Integración Economica (CABEI). This loan is secured by a first degree mortgage over all the improvements executed on Amayo I’s project site, cessation of all the project contracts and the creation and maintenance of a reserve account for US$2,400 thousand, to be controlled by CABEI. Part of this loan (US$50,343 thousand) bears an interest rate of 8.45% and the other part (US$20,907 thousand) an interest rate of LIBOR+4%, and is payable in quarterly installments until final maturity in February 2023. As of December 31, 2015, the outstanding balance under this loan was US$47,131 thousand (US$ 51,680 thousand as of December 31,2014). |
| K. | Consorcio Eolico Amayo (Fase II) S.A.—In November 2010, Amayo II entered into a 15 year US$ 45,000 thousand loan agreement with Nederlandse Financierings-Maatschappij Voor Ontwikkelingslanden N.V (FMO) Banco Centroamericano de Integración Economica (CABEI). This syndicated loan is secured by a list of guarantees. Loans under this credit agreement bear |
F-86
Table of Contents
IC POWER LTD.
Notes to the Consolidated Financial Statements as at December 31, 2015
Note 14—Loans from banks and others (cont’d)
Long term loans from banks and others (cont’d)
| interest rates of 10.76%, 8.53% and LIBOR+5.75%. Loans with variable interest rate are swapped at an all-in rate of 8.31% until December 2019 and 8.25% from December 2019 until September 2022. All three loans are payable in quarterly installments until final maturity in September 2025. As of December 31, 2015, the outstanding balance under this loan was US$34,210 thousand (US$ 37,047 thousand as of December 31,2014). |
| L. | Puerto Quetzal Power LLC – In March 2012, Puerto Quetzal Power LLC (“PQP”) signed a loan agreement with seven financial institutions for an amount of US$ 35.0 million. The loan is payable in quarterly installments until September 2019. Interest is accrued at LIBOR plus 4.5% annually. PQP entered into an interest rate swap contract to fix its interest at a rate of 6.0% per annum. The loan is secured by a pledge of substantially all of the assets of PQP and Poliwatt Ltd (“Poliwatt”), including PQP and its subsidiaries shares. As of December 31, 2015, the outstanding balance under this loan was US$ 15,011 thousand (US$ 21,791 thousand as of December 31, 2014). |
| M. | OPC Lenders Consortium |
In January 2011, OPC entered into a financing agreement with a consortium of lenders led by Bank Leumi L’Israel Ltd. for the financing of its power plant project. The financing consortium includes Bank Leumi and institutional entities from the following groups: Clal Insurance Company Ltd.; Amitim Senior Pension Funds; Phoenix Insurance Company Ltd.; and Harel Insurance Company Ltd (hereinafter—“OPC’s lenders”). As part of the financing agreement, the lenders committed to provide OPC a long-term credit facility (including a facility for variances in the construction costs), a working capital facility, and a facility for financing the debt service, in the overall amount of approximately NIS 1,800 million (approximately US$460 million). The loans are CPI linked and is repaid on a quarterly basis beginning in the fourth quarter of 2013 until 2031. As part of the financing agreement, OPC had certain restrictions to make distributions of dividends and repayments of shareholders’ loans, only after the third year after the completion of OPC’s power plant. On October 13, 2015, OPC and the senior lenders amended the Facility Agreement to remove this restriction.
As part of the Facility Agreement, OPC is required to keep a Debt Service Reserve equivalent to the following two quarterly debt payments (hereinafter- “the reserve”) within the period of two years following power plant construction completion. As of December 31, 2015 the amount of the reserve is NIS 66,210 thousand (equivalent to US$16,968 thousand).
As of December 31, 2015 and 2014, the outstanding balance under this facility was NIS 1,469,363 thousand (US$ 376,567 thousand) and NIS 1,555,847 thousand (US$400,064 thousand), respectively.
| N. | Veolia Energy Israel Ltd.—It corresponds to equity contributions made by Veolia Energy Israel Ltd. (previously Dalkia Israel Ltd.) (OPC’s minority shareholder) and presented as a capital note. |
On October 19, 2015, OPC paid to its shareholders in the amount of NIS 222,496 thousands (approximately US$ 57,911 thousand) as repayment of these capital notes, of which NIS 59,000 thousand (approximately US$15,357 thousand) were paid toVeolia Energy Israel Ltd.
F-87
Table of Contents
IC POWER LTD.
Notes to the Consolidated Financial Statements as at December 31, 2015
Note 14—Loans from banks and others (cont’d)
Long term loans from banks and others (cont’d)
As of December 31, 2015 and 2014 the balance of the capital notes is NIS 19,821 thousands (US$ 5,080 thousand) and NIS 71,649 thousands (US$19,060 thousand), respectively.
| O. | IC Power Israel Ltd. (“ICPI”)—On June 22, 2014, ICPI entered into a mezzanine financing agreement with Mivtachim Social Insurance and Makefet Fund Pension (“Amitim Pension Funds”) and Menora Mivtachim Insurance Ltd in the aggregate amount of NIS 350,000 thousand (US$ 93,105 thousand), consisting of three Facilities: (i) Tranche A bridge loan for NIS 150,000 thousand, bearing interest of 4.85% p.a. to be repaid until March 31, 2017; (ii) Tranche B long-term loan for NIS 200,000 thousand, bearing interest of 7.75% p.a., repayable on annual basis until March 2029; and (iii) Tranche C (only to cover shortfall amounts) for NIS 350,000 thousand. As of December 31, 2015, no disbursements have been made under Tranche C. These loans are linked to CPI. |
As of December 31, 2015 and 2014, the outstanding balance under this facility was NIS 376,872 thousand (US$ 96,584 thousand) and NIS 362,085 thousand (US$ 93,105 thousand), respectively.
During January 2016, Tranche A was prepaid for a total of NIS 161,746 thousand (approximately US$40,680 thousand), see Note 32.
Liabilities in respect of finance leases
| P. | Citibank Perú and Banco de Crédito del Perú—In March 2006, Kallpa entered into a capital lease agreement with Citibank del Perú S.A., Citileasing S,A. and Banco de Crédito del Perú under which the lessors provided financing for the construction of the Kallpa I facility at Chilca in an aggregate amount of US$ 56,000 thousand. Under the lease agreements, Kallpa will make monthly payments beginning in December 2007 until the expiry of the lease in March 2016. These leases are secured by the assets of Kallpa in Peru. As of December 31, 2015, the aggregate outstanding principal amount under this lease was US$2,334 thousand (US$11,236 thousand as of December 31,2014). The lease bears an interest rate of 90 day LIBOR plus 3.00%. |
| Q. | Banco de Crédito del Perú—In December 2007, Kallpa entered into a capital lease agreement with Banco de Crédito del Perú under which the lessor provided financing for the construction of the Kallpa II turbine in an aggregate amount of US$ 81,500 thousand. Under the lease agreement, Kallpa will make monthly payments beginning in December 2009 until the expiry of the lease in December 2017. These leases are secured by the assets of Kallpa in Peru. As of December 31, 2015, the aggregate outstanding principal amount under this lease was US$ 28,667 thousand (US$ 35,140 thousand as of December 31,2014). The lease bears an interest rate of 90 day LIBOR plus 2.05%. Kallpa entered into an interest rate swap to fix the interest rate at an all-in rate of 6.55%, see note 16(a). |
| R. | Scotiabank—In October 2008, Kallpa entered into a capital lease agreement with Scotiabank Perú under which the lessor provided financing for the construction of the Kallpa III turbine in an aggregate amount of US$ 88,000 thousand. Under the lease agreement, Kallpa will make monthly |
F-88
Table of Contents
IC POWER LTD.
Notes to the Consolidated Financial Statements as at December 31, 2015
Note 14—Loans from banks and others (cont’d)
Liabilities in respect of finance leases (cont’d)
| payments beginning in September 2010 until the expiry of the lease in July 2018. As of December 31, 2015, the aggregate outstanding principal amount under this lease was US$ 37,756 thousand (US$ 44,895 thousand as of December 31,2014). The lease bears a fixed interest rate of 7.57% p.a |
| S. | In April 2014, Kallpa entered into a capital lease agreement with Banco de Crédito del Perú for US$ 107,688 thousand in order to finance the acquisition of the 193MW single turbine natural gas fired plant Las Flores from Duke Energy. Under the lease agreement, Kallpa will make quarterly payments beginning in July 2014 until the expiry of the lease in October 2023. As of December 31, 2015, the aggregate outstanding principal amount under this lease was US$ 94,440 thousand (US$ 101,064 thousand as of December 31,2014). The lease bears a fixed interest rate of 7.15% p.a. |
Debentures
| T. | Bonds Cobee II—In October 2008, COBEE issued and sold in the Bolivian market US$ 20,403 thousand aggregate principal amount of its 9.40% notes due 2015 Interest is escrowed monthly by the trustee and is paid semiannually. Principal on these notes is payable in three equal installments in 2013, 2014 and 2015. As of December 31, 2015, the total principal amount under these bonds was fully paid (the aggregate outstanding principal amount was US$ 6,803 thousand as of December 31, 2014). |
| U. | Bonds Cobee III—In February 2010, COBEE approved a bond program under which it is permitted to offer bonds in aggregate principal amounts of up to US$ 40,000 thousand in multiple series. On March 12, 2010, COBEE issued and sold in the Bolivian market three series of notes in the aggregate principal amount of US$ 13,844 thousand. |
The aggregate gross proceeds of these notes, which were issued at a premium, were US$17,251 thousand. The Series A Notes, in the aggregate principal amount of US$4,000 thousand pay interest semi-annually at the rate of 5.00% per annum through maturity in February 2014. Principal on these notes is payable at maturity. The Series B Notes, in the aggregate principal amount of US$ 3,500 thousand, pay interest semi-annually at the rate of 6.50% per annum through maturity in February 2017. Principal on these notes will be paid in two equal annual installments commencing in February 2016. The Series C Notes, in the principal amount of Bs. 44.2 million (US$ 6,343 thousand), pay interest semi-annually at the rate of 9.00% per annum through maturity in January 2020. Principal on these notes will be paid in four equal annual installments commencing in February 2017.
In April 2012, COBEE issued and sold two additional series of notes in the aggregate principal amount of US$ 11,160 thousand. The aggregate gross proceeds of these notes, which were issued at premium, were US$ 12,919 thousand. COBEE will amortize the premium reducing the interest expense related to these notes. The first series of these notes, in the aggregate of US$5,000 thousand pays interest semi-annually at the rate of 6.75% per annum through final maturity in April 2017. Principal on these notes is payable at maturity. The second series of these notes in the aggregate principal amount of Bs. 43 million (US$6,160 thousand), pays interest semi-annually at
F-89
Table of Contents
IC POWER LTD.
Notes to the Consolidated Financial Statements as at December 31, 2015
Note 14—Loans from banks and others (cont’d)
Debentures (cont’d)
the rate of 7% per annum through maturity in February 2022. These funds were used mainly to pay a tranche of Bolivian bonds due in June 2012.
| V. | Bonds Cobee IV—In May 2013, COBEE approved a bond program under which COBEE is permitted to offer bonds in aggregate principal amount of up to US$60,000 thousand in multiple series. In February 2014, COBEE issued and sold three series of notes in the aggregate principal amount of US$19,934 thousand. The aggregate gross proceeds of these notes, which were issued at a premium, were US$ 20,617 thousand. The Series A Notes, in the aggregate principal amount of US$3,967 thousand pay interest semi-annually at the rate of 6.0% per annum through maturity in January 2018. The Series B Notes, in the aggregate principal amount of US$ 3,964 thousand pay interest semi-annually at the rate of 7.0% per annum through final maturity in January 2020. The Series C Notes, in the aggregate principal amount of Bs. 84 million (US$12,020 thousand) pay interest semi-annually at the rate of 7.8% per annum through maturity in January 2024. |
In November 2014, COBEE issued and sold two series of notes in the aggregate principal amount of US$20,086 thousand. The aggregate gross proceeds of these notes, which were issued at a premium, were US$ 22,100. The first series of these Notes, in the aggregate principal amount of US$ 4,950 thousand pay interest semi-annually at the rate of 6.70% per annum through maturity in October 2019. The second series of these notes in the aggregate principal amount of Bs. 105 million (US$15,029 thousand) pay interest semi-annually at the rate of 7.80% per annum through maturity in October 2024.
| W. | Kallpa Bonds—In November 2009, Kallpa issued US$172,000 thousand aggregate principal amount of its 8.5% Bonds due 2022. Holders of these bonds are required to make subscription payments under a defined payment schedule during the 21 months following the date of issue. The proceeds of these bonds were used for capital expenditures related to Kallpa’s combined-cycle plant. Interest on these bonds accrues based on the principal received by Kallpa and is payable quarterly. Principal amortization payments under these bonds in amounts varying between 0.25% and 5.00% of the outstanding principal amount of these bonds commenced in May 2014 and will continue until maturity in May 2022. These bonds are secured by Kallpa’s combined-cycle plant and related assets. As of December 31, 2015, the aggregate outstanding principal amount of these bonds was US$ 149,105 thousand (US$ 159,312 thousand as of December 31, 2014). |
| X. | Inkia Bonds—On April 4, 2011, Inkia issued senior unsecured notes for an aggregate principal amount of US$ 300,000 thousand in the international capital market under the rule 144A Regulation S. These notes accrue interest at a rate of 8.375% and will be payable semi-annually with final maturity in April 2021 and were recognized initially at fair value plus any directly attributable transaction costs. The proceeds from this issue were used mainly to finance Inkia’s equity contribution in the construction of Cerro del Aguila Project and to repurchase all of the Inkia Bonds. |
On September 9, 2013, Inkia reopened its 8.375% senior notes due 2021 for an aggregate principal amount of US$ 150,000 thousand. The new notes have terms and conditions identical to the initial
F-90
Table of Contents
IC POWER LTD.
Notes to the Consolidated Financial Statements as at December 31, 2015
Note 14—Loans from banks and others (cont’d)
Debentures (cont’d)
US$300,000 thousand notes issued on April 4, 2011 and were issued at 104.75% plus accrued interest from April 4, 2013, resulting in gross proceeds of US$ 157,125 thousand plus US$ 5,653 thousand of accrued interest. The proceeds from this issue will be used mainly for working capital and general corporate purposes. Subsequent to initial recognition, these notes are measured at amortized cost using the effective interest method. As of December 31, 2015, the outstanding principal amount under these notes was US$447,524 thousand (US$447,357 thousand as of December 31, 2014).
On September 5, 2014, Inkia requested the consents to its bondholders regarding certain proposed amendments to the Indenture: (i) Perform the IC split without being required to repurchase the bonds at a price equal to 101% of the aggregate principal; (ii) Request the repayment of the US$150,000 thousand Credit Suisse/IC Power/Inkia Loan from the net proceeds of the Edegel sale; and (iii) Extend the investment period of the net proceeds from the Edegel sale from 12 to 30 months.
On September 16, 2014, Inkia received the consents from holders of a majority of its outstanding US$450,000 thousand Senior Notes due 2021 and paid US$1,012 thousand in fees related to obtain these consents.
| Y. | In December 2010, CEPP approved a program bond offering under which CEPP is permitted to offer bonds in aggregate principal amount of up to US$ 25,000 thousand in multiple series. In 2011 and 2010, CEPP issued and sold US$ 20,326 thousand and US$ 4,674 thousand of its 7.75% Bonds. CEPP used the proceeds of this offering to finance its continuing operations and repay intercompany debt. Interest on these bonds is payable monthly and principal of these bonds is due at maturity in May 2014. During the first quarter of 2014, CEPP issued and sold US$ 25,000 thousand of its 6.00% Bonds due in January and March 2019. Part of these funds was used to prepay US$ 15,000 thousand of its 7.75% Bonds outstanding due in May 2014. In October 2015, US$ 15,000 thousand in CEPP’s bonds were repurchased. As of December 31, 2015, the outstanding principal amount net of transaction costs under these notes was US$ 9,924 thousand (US$24,755 thousand as of December 31, 2014). |
F-91
Table of Contents
IC POWER LTD.
Notes to the Consolidated Financial Statements as at December 31, 2015
Note 14—Loans from banks and others (cont’d)
Debentures (cont’d)
| Z. | As at December 31, 2015, the main covenants that certain Group entities must comply with during the term of the debts are as follows: |
Covenant | ||||||||||
Group entities | Shareholder | Debt service to coverage ratio | Collateral ratio | Maximum leverage | Interest rate | |||||
Kallpa Generación S.A. | Not required | Not less than 1.20 | Not required | No more than 3.0 | Required | |||||
COBEE (Bonds) | Not required | >=1.2 | Not required | <=1.2 | Not required | |||||
Central Cardones | Not required | >=1.1 | Not required | Not required | Not required | |||||
JPPC (Jamaica) | Not required | Not less than 1.10 | Not required | Debt to capital no more than 40% | Not required | |||||
Amayo I (Nicaragua) | Not required | Not less than 1.25 | Not required | Not required | Not required | |||||
Amayo II (Nicaragua) | Not required | Not less than 1.20 | Not required | Financial debt to Net Worth not in excess of 70:30 | Not required | |||||
Corinto (Nicaragua) | Not required | Not required | Not required | Maximum debt to EBITDA of 3.0 | Not required | |||||
Tipitapa (Nicaragua) | Not required | Not required | Not required | Maximum debt to EBITDA of 2.75. | Not required | |||||
| >= US$ | ||||||||||
Nejapa (El Salvador) | 40 million | >=1.50 | Not required | <=3.0 | Not required | |||||
Other than with respect to the covenants referred to above, and the restrictions set forth in Note 19, there are no significant restrictions on the ability of the Company’s subsidiaries to repay loans or advances or to transfer funds to the Company.
Compliance with the covenants referred to above is overseen by the Group’s Management. As of December 31, 2015, JPPC (Jamaica) does not comply with their Debt service to coverage covenant. Therefore, its financial debt has been classified as current liability. Other than JPPC, in the Group’s Management opinion, the obligations have been complied with as of December 31, 2015 and 2014.
Note: Inkia has to comply only with incurrence ratios when it plans to issue new debt.
Note 15—Trade payables
As at December 31 | ||||||||
2015 | 2014 | |||||||
US$ thousands | US$ thousands | |||||||
Open accounts | 143,947 | 143,621 | ||||||
Checks payable | 11 | 18 | ||||||
|
|
|
| |||||
| 143,958 | 143,639 | |||||||
|
|
|
| |||||
F-92
Table of Contents
IC POWER LTD.
Notes to the Consolidated Financial Statements as at December 31, 2015
Note 16—Other payables and long term liabilities, including derivative instruments
As at December 31, 2015 | As at December 31, 2014 | |||||||||||||||
Current | Non-current | Current | Non-current | |||||||||||||
US$ thousands | US$ thousands | US$ thousands | US$ thousands | |||||||||||||
Financial instruments not used for hedging (1) | 1,080 | 2,196 | 1,318 | 2,798 | ||||||||||||
Financial instruments used for hedging (1) | 11,480 | 33,429 | 14,868 | 18,247 | ||||||||||||
|
|
|
|
|
|
|
| |||||||||
| 12,560 | 35,625 | 16,186 | 21,045 | |||||||||||||
|
|
|
|
|
|
|
| |||||||||
Loans from former parent company | — | — | 592 | — | ||||||||||||
Loans from parent company | 32 | — | — | — | ||||||||||||
Employees and payroll-related agencies | 2,869 | — | 3,402 | — | ||||||||||||
Accrued expenses | 9,904 | 3,299 | 15,589 | — | ||||||||||||
Government agencies | 4,504 | — | 4,527 | — | ||||||||||||
Interests payable | 22,307 | — | 17,259 | — | ||||||||||||
Share appreciation rights liability (2) | — | — | 1,396 | — | ||||||||||||
Employee Benefits | — | 6,549 | — | 6,194 | ||||||||||||
Deferred income | 1,483 | 1,464 | 1,526 | 2,936 | ||||||||||||
Dismantling liability | — | 14,649 | — | 10,072 | ||||||||||||
Consideration retained related to Surpetroil acquisition | 2,204 | — | 6,000 | — | ||||||||||||
Other (3) | 50,767 | 1,258 | 46,203 | 4,780 | ||||||||||||
|
|
|
|
|
|
|
| |||||||||
| 94,070 | 27,219 | 96,494 | 23,982 | |||||||||||||
|
|
|
|
|
|
|
| |||||||||
| 106,630 | 62,844 | 112,680 | 45,027 | |||||||||||||
|
|
|
|
|
|
|
| |||||||||
1. As of December 31, 2015 and 2014, the derivatives maintained by the Group are as follow:
In thousands of US$ | ||||||||||||
Notional amount | Fair value | |||||||||||
2015 | 2014 | |||||||||||
Hedge derivatives (i) | ||||||||||||
Interest rate swap (a) | 67,500 | — | (607 | ) | ||||||||
Interest rate swap (b) | 384,093 | (30,979 | ) | (23,514 | ) | |||||||
Interest rate swap (c) | 100,683 | (196 | ) | (718 | ) | |||||||
Interest rate swap (d) | 124,400 | (9,004 | ) | (351 | ) | |||||||
Interest rate swap (e) | 15,553 | (3,880 | ) | (2,523 | ) | |||||||
Exchange rate swap (f) | 158,270 | (850 | ) | (5,402 | ) | |||||||
|
|
|
| |||||||||
| (44,909 | ) | (33,115 | ) | |||||||||
Trading derivatives (ii) | ||||||||||||
Interest rate swap (g) | 42,000 | (2,994 | ) | (3,769 | ) | |||||||
Interest rate swap (h) | 14,500 | (7 | ) | (29 | ) | |||||||
Interest rate swap (i) | 8,443 | (275 | ) | (318 | ) | |||||||
|
|
|
| |||||||||
| (3,276 | ) | (4,116 | ) | |||||||||
F-93
Table of Contents
IC POWER LTD.
Notes to the Consolidated Financial Statements as at December 31, 2015
Note 16—Other payables and long term liabilities, including derivative instruments (cont’d)
1. (cont’d)
| (i) | Hedge derivatives |
Entity | Financing | Underlying item | Description | Fixed rate | Expiration | |||||||
(a) | Kallpa | Kallpa II lease | Libor plus 2.05% | 83% Kallpa II debt | 6.55% | May 2015 | ||||||
(b) | CDA | Syndicated | Libor plus 4.25% | 100% - Tranche A | 7.25-8.50% | Aug 2024 | ||||||
(c) | CDA | Syndicated | Libor plus 4.25% | 50% - Tranche B | 5.38% | Feb 2016 | ||||||
(d) | Samay I | Syndicated | Libor plus 2.125% | 93% total debt | 4.23% | Dec 2021 | ||||||
(e) | Colmito | Loan | 7.90% in Chilean Pesos | 69% total debt | 6.025% in US$ | Jun 2028 | ||||||
(f) | CDA | EPC payments in | Spot exchange rate in | S/403 million | S/2.546 for | Jan 2016 | ||||||
| Nuevos Soles | Nuevos Soles | each US$1 |
| (ii) | The Group has three additional interest swap agreements that are accounted for as trading derivatives because these derivatives were already in place when Inkia took control of the subsidiaries: |
Entity | Financing | Underlying item | Description | Fixed rate | Expiration | |||||||
(g) | Cardones | Syndicated | Libor plus 1.9% | 100% - Tranche I | 6.80% | Aug 2021 | ||||||
(h) | JPPC | Loan | Libor plus 5.5% | 71% | 6.46% | Mar 2017 | ||||||
(i) | Amayo II | Syndicated | Libor plus 5.75% | 84% - BCIE facility | 8.31% | Dec 2019 | ||||||
| Amayo II | Syndicated | Libor plus 5.75% | 49% - BCIE facility | 8.25% | Sep 2022 (*) |
| (*) | starts in Dec 2019 |
The gain arising from the volatility of the fair value of these interest rate swaps is shown in Note 24. During 2015, 2014 and 2013, the Group recorded gains of US$3,400 thousand, US$133 thousand and US$ 2,645 thousand, respectively.
2. On December 27, 2011, OPC established for a group of its senior executives a share appreciation rights plan (the “OPC Plan”). The OPC Plan provides the economic benefit of up to 0.9% of the increase appreciation between the base price at the time of the grant date (US$194 per unit) and the resulting valuation at the settlement date (exercise date) of the OPC Plan. The OPC Plan is subject to a vesting period which ended on December 31, 2012 and a lockup period that matured on December 31, 2016. The settlement (execution) price is based on the value resulting from multiplying eight times OPC’s EBITDA (earnings before income tax during the preceding four fiscal quarters) less net financial liabilities (debt with financial institutions including accrued interest net of cash, part of the restricted cash, and cash equivalents) and less US$120 million. By the end of December 2013, OPC had granted 3,600 units. During 2014 2,293 units were exercised and US$ 2,486 thousand share rights appreciation payments were paid. As of December 31, 2014, the liability in connection with the OPC Plan amounted to US$1,396 million. The OPC Plan was fully settled during 2015.
3. It corresponds mainly to payables related to CDA and Puerto Bravo projects in the amount of US$36,025 thousand and US$29,697 thousand in 2015 and 2014, respectively.
F-94
Table of Contents
IC POWER LTD.
Notes to the Consolidated Financial Statements as at December 31, 2015
Note 17—Provisions
The amount corresponds to a provision made by an IC Power´s subsidiary as a result of a regulator charge. Expenses related to this provision were recognized in the cost of sales in the amount of US$14,657 thousand and US$8,626 thousand in 2015 and 2014, respectively.
Note 18—Share Capital and Reserves
A. Share Capital and Premium
Ordinary shares | ||||||||
2015 | 2014 | |||||||
| Thousands of shares of NIS 0.01 par value | ||||||||
Issued and paid-up share capital as at December 31 | 10,000 | 10,000 | ||||||
Authorized share capital | 10,000 | 10,000 | ||||||
Each ordinary share from the Corporation’s share capital has the right to dividends and to distribution of the Corporation’s assets upon liquidation, in proportion to the par value of each share, without taking any premium paid in respect thereof, all subject to the Corporation’s Articles of Association. Each of the shares entitles its holder to participate in the Corporation’s General Meetings and to one vote.
In accordance with the local laws that regulate the operations of the Group’s operating entities, a reserve of up to a certain limit of their share capital is required to be established through annual transfers of profit.
B. Translation reserve of foreign operations
The translation reserve includes all the foreign currency differences stemming from translation of financial statements of foreign activities.
C. Capital reserves
Capital reserves include mainly a hedge fund, which includes the effective part of the accrued net change in the fair value of instruments hedging the cash flows and that relate to hedged transactions not yet realized that have not yet been recorded on the statement of income.
D. Dividends
In 2014, the Company´s Board of Directors decided to pay dividends. The total dividend paid was US$37,324 thousand (US$3.73 thousand per ordinary share). No dividends were paid during 2015.
F-95
Table of Contents
IC POWER LTD.
Notes to the Consolidated Financial Statements as at December 31, 2015
Note 19—Non-controlling interest
The following tables summarize the information relating to each of IC Power’s subsidiaries that has non-controlling interest.
2015 In thousands of US$ | Kallpa | Cerro del | Samay I S.A. | Nicaragua | OPC | Others. | Intra-group | Total | ||||||||||||||||||||||||
NCI percentage | 25.10 | % | 25.10 | % | 25.10 | % | 35.42 | % | 20.00 | % | ||||||||||||||||||||||
Current assets | 92,120 | 23,841 | 47,766 | 43,390 | 158,762 | 39,661 | ||||||||||||||||||||||||||
Non-current assets | 638,325 | 847,015 | 344,052 | 172,917 | 471,800 | 275,886 | ||||||||||||||||||||||||||
Current liabilities | (188,291 | ) | (25,909 | ) | (36,075 | ) | (22,044 | ) | (113,662 | ) | (28,911 | ) | ||||||||||||||||||||
Non-current liabilities | (356,900 | ) | (556,277 | ) | (289,560 | ) | (121,142 | ) | (405,334 | ) | (159,863 | ) | ||||||||||||||||||||
|
|
|
|
|
|
|
|
|
|
|
| |||||||||||||||||||||
Net assets | 185,254 | 288,670 | 66,183 | 73,121 | 111,566 | 126,773 | ||||||||||||||||||||||||||
|
|
|
|
|
|
|
|
|
|
|
|
|
|
|
| |||||||||||||||||
Carrying amount of NCI | 46,499 | 72,456 | 16,612 | 25,899 | 22,313 | 15,525 | 889 | 200,193 | ||||||||||||||||||||||||
|
|
|
|
|
|
|
|
|
|
|
|
|
|
|
| |||||||||||||||||
Revenues | 447,679 | — | — | 111,428 | 318,066 | 91,134 | ||||||||||||||||||||||||||
Profit | 44,088 | (8,579 | ) | (4,049 | ) | 14,469 | 20,128 | 15,475 | ||||||||||||||||||||||||
OCI | (53 | ) | (1,079 | ) | (6,057 | ) | — | (453 | ) | (2 | ) | |||||||||||||||||||||
|
|
|
|
|
|
|
|
|
|
|
|
|
|
|
| |||||||||||||||||
Profit (loss) attributable to NCI | 11,066 | (2,153 | ) | (1,016 | ) | 5,125 | 4,026 | 235 | (385 | ) | 16,898 | |||||||||||||||||||||
OCI attributable to NCI | (13 | ) | (271 | ) | (1,520 | ) | — | (91 | ) | (1,335 | ) | — | (3,230 | ) | ||||||||||||||||||
|
|
|
|
|
|
|
|
|
|
|
|
|
|
|
| |||||||||||||||||
Cash flow Operating activities | 120,438 | — | — | 42,480 | 81,100 | |||||||||||||||||||||||||||
Investing activities | (13,589 | ) | (180,771 | ) | (236,207 | ) | (5,088 | ) | (1,768 | ) | ||||||||||||||||||||||
Dividends paid to NCI | (7,530 | ) | — | — | (4,401 | ) | — | (409 | ) | (12,340 | ) | |||||||||||||||||||||
Financing activities | (91,084 | ) | 95,000 | 138,000 | (26,139 | ) | (126,943 | ) | ||||||||||||||||||||||||
Effect of changes in the exchange rate | (5,334 | ) | (2,929 | ) | (3,266 | ) | (489 | ) | 1,244 | |||||||||||||||||||||||
|
|
|
|
|
|
|
|
|
| |||||||||||||||||||||||
Net increase (decrease) in cash equivalents | 2,901 | (88,700 | ) | (101,473 | ) | 6,363 | (46,367 | ) | ||||||||||||||||||||||||
|
|
|
|
|
|
|
|
|
| |||||||||||||||||||||||
| (a) | Includes Empresa Energética Corinto, Tipitapa Power Company, Centrans Energy Holdings (Amayo) and Arctas Amayo (Fase II). |
F-96
Table of Contents
IC POWER LTD.
Notes to the Consolidated Financial Statements as at December 31, 2015
Note 19—Non-controlling interest (cont’d)
2014 In thousands of US$ | Kallpa | Cerro del | Samay I S.A. | Nejapa | Nicaragua | OPC | Others. | Intra-group | Total | |||||||||||||||||||||||||||
NCI percentage | 25.10 | % | 25.10 | % | 25.10 | % | 29.00 | % | 35.42 | % | 20.00 | % | ||||||||||||||||||||||||
Current assets | 83,954 | 128,242 | 138,153 | 46,395 | 52,850 | 230,775 | 70,515 | |||||||||||||||||||||||||||||
Non-current assets | 645,927 | 645,303 | 102,554 | 19,872 | 172,240 | 487,598 | 281,683 | |||||||||||||||||||||||||||||
Current liabilities | (153,302 | ) | (25,138 | ) | (18,713 | ) | (9,179 | ) | (23,376 | ) | (118,847 | ) | (35,072 | ) | ||||||||||||||||||||||
Non-current liabilities | (405,360 | ) | (461,108 | ) | (144,679 | ) | (639 | ) | (131,327 | ) | (507,635 | ) | (206,572 | ) | ||||||||||||||||||||||
|
|
|
|
|
|
|
|
|
|
|
|
|
| |||||||||||||||||||||||
Net assets | 171,219 | 287,299 | 77,315 | 56,449 | 70,387 | 91,891 | 110,554 | |||||||||||||||||||||||||||||
|
|
|
|
|
|
|
|
|
|
|
|
|
|
|
|
|
| |||||||||||||||||||
Carrying amount of NCI | 42,976 | 72,112 | 19,406 | 16,370 | 24,931 | 18,378 | 13,258 | 3,402 | *210,833 | |||||||||||||||||||||||||||
|
|
|
|
|
|
|
|
|
|
|
|
|
|
|
|
|
| |||||||||||||||||||
Revenues | 436,673 | — | — | 131,396 | 124,578 | 413,578 | 111,644 | |||||||||||||||||||||||||||||
Profit | 53,090 | (4,447 | ) | (1,419 | ) | 3,502 | 4,472 | 71,045 | 11,687 | |||||||||||||||||||||||||||
OCI | 1,150 | (6,938 | ) | (245 | ) | — | — | (9,041 | ) | (1,995 | ) | |||||||||||||||||||||||||
|
|
|
|
|
|
|
|
|
|
|
|
|
|
|
|
|
| |||||||||||||||||||
Profit attributable to NCI | 13,326 | (1,116 | ) | (356 | ) | 1,016 | 1,584 | 14,209 | 860 | (448 | ) | *29,075 | ||||||||||||||||||||||||
OCI attributable to NCI | 289 | (1,742 | ) | (62 | ) | — | — | (1,808 | ) | (798 | ) | 24 | (4,097 | ) | ||||||||||||||||||||||
|
|
|
|
|
|
|
|
|
|
|
|
|
|
|
|
|
| |||||||||||||||||||
Cash flow Operating activities | 116,915 | — | — | 6,621 | 16,605 | 187,768 | ||||||||||||||||||||||||||||||
Investing activities | (26,259 | ) | (247,724 | ) | (88,644 | ) | (567 | ) | 19,522 | (48,515 | ) | |||||||||||||||||||||||||
Dividends paid to NCI | (7,530 | ) | — | — | — | (5,687 | ) | — | (693 | ) | (13,910 | ) | ||||||||||||||||||||||||
Financing activities | (71,452 | ) | 296,868 | 195,135 | (38 | ) | (14,758 | ) | (29,295 | ) | ||||||||||||||||||||||||||
Effect of changes in the exchange rate | (824 | ) | — | (265 | ) | — | �� | 411 | (14,914 | ) | ||||||||||||||||||||||||||
|
|
|
|
|
|
|
|
|
|
|
| |||||||||||||||||||||||||
Net increase (decrease) in cash equivalents | 10,850 | 49,144 | 106,226 | 6,016 | 16,093 | 95,044 | ||||||||||||||||||||||||||||||
|
|
|
|
|
|
|
|
|
|
|
| |||||||||||||||||||||||||
| (*) | Immaterial adjustment of comparative data—See Note 3 regarding basis of preparation. |
| (a) | Includes Empresa Energética Corinto, Tipitapa Power Company, Centrans Energy Holdings (Amayo) and Arctas Amayo (Fase II). |
F-97
Table of Contents
IC POWER LTD.
Notes to the Consolidated Financial Statements as at December 31, 2015
Note 19—Non-controlling interest (cont’d)
2013 US$ thousands | Kallpa | Cerro del | Nejapa Holdings | OPC Rotem Ltd. | Others | Intra-group | Total | |||||||||||||||||||||
NCI percentage | 25.10 | % | 25.10 | % | 29.00 | % | 20.00 | % | ||||||||||||||||||||
Current assets | 71,948 | 72,670 | 44,455 | 108,698 | 56,402 | |||||||||||||||||||||||
Non-current assets | 541,079 | 372,671 | 23,827 | 557,672 | 138,972 | |||||||||||||||||||||||
Current liabilities | (113,532 | ) | (30,767 | ) | (14,352 | ) | (80,372 | ) | (51,441 | ) | ||||||||||||||||||
Non-current liabilities | (352,515 | ) | (114,897 | ) | (983 | ) | (556,296 | ) | (67,304 | ) | ||||||||||||||||||
|
|
|
|
|
|
|
|
|
| |||||||||||||||||||
Net assets | 146,980 | 299,677 | 52,947 | 29,702 | 76,629 | |||||||||||||||||||||||
|
|
|
|
|
|
|
|
|
|
|
|
|
| |||||||||||||||
Carrying amount of NCI | 36,892 | 75,219 | 15,355 | 5,940 | 7,005 | 3,846 | *144,257 | |||||||||||||||||||||
|
|
|
|
|
|
|
|
|
|
|
|
|
| |||||||||||||||
Revenues | 394,055 | — | 134,919 | 187,397 | 102,247 | |||||||||||||||||||||||
Profit | 43,665 | (7,064 | ) | 5,316 | 6,502 | 14,279 | ||||||||||||||||||||||
OCI | 1,396 | (13,805 | ) | — | 1,474 | — | ||||||||||||||||||||||
|
|
|
|
|
|
|
|
|
|
|
|
|
| |||||||||||||||
Profit attributable to NCI | 10,960 | (1,773 | ) | 1,542 | 1,300 | 670 | 163 | *12,862 | ||||||||||||||||||||
OCI attributable to NCI | 350 | (3,465 | ) | — | 294 | — | — | (2,821 | ) | |||||||||||||||||||
|
|
|
|
|
|
|
|
|
|
|
|
|
| |||||||||||||||
Cash Flow Operating activities | 142,495 | — | 17,468 | 46,526 | ||||||||||||||||||||||||
Investing activities | (16,566 | ) | (178,664 | ) | (2,670 | ) | 7,507 | |||||||||||||||||||||
Dividends paid to NCI | (23,266 | ) | — | — | — | — | (23,266 | ) | ||||||||||||||||||||
Financing activities | (135,043 | ) | 235,090 | (14,393 | ) | 5,201 | ||||||||||||||||||||||
Effect of changes in the exchange rate | (1,245 | ) | — | — | 3,322 | |||||||||||||||||||||||
|
|
|
|
|
|
|
| |||||||||||||||||||||
Net increase (decrease) in cash equivalents | (33,625 | ) | 56,426 | 405 | 62,555 | |||||||||||||||||||||||
|
|
|
|
|
|
|
| |||||||||||||||||||||
| (*) | Immaterial adjustment of comparative data—See Note 3 regarding basis of preparation. |
F-98
Table of Contents
IC POWER LTD.
Notes to the Consolidated Financial Statements as at December 31, 2015
Note 19—Non-controlling interest (cont’d)
Restrictions on assets and liabilities
Inkia´s subsidiaries have no restrictions to transfer cash or other assets to the parent company as long as each subsidiary is in compliance with the covenants derived from the borrowing agreements described in note 14.
OPC had originally restrictions to transfer cash or paid dividends up to the third anniversary of Construction Completion. On October 13, 2015, OPC and its seniors lenders amended this restriction to pay dividends, which ended on June 30, 2015. Therefore, on October 19, 2015, OPC paid NIS 295,000 thousand (equivalent to US$76,783 thousand). Out of this total, NIS 222,496 thousand (equivalent to US$57,912 thousand) was paid as repayment of capital notes and NIS 72,504 thousand (equivalent to US$18,871 thousand) as intercompany loan. As of December 31, 2015 and 2014, the cash and cash equivalents at OPC´s financial statements amounted to US$111,301 thousands and US$157,668 thousands respectively.
Inkia has restrictions to transfer cash or other assets to the Company. Pursuant to its senior notes agreement, dividend payments are treated as restricted payments and are subject to mainly the following conditions:
| • | Inkia is able to incur at least US$1.00 of additional indebtedness pursuant to the incurrence covenant test (unconsolidated interest coverage ratio is equal or greater than 2.0 to 1.0); and |
| • | The amount (dividend payments) cannot exceed the sum of: 100% of cumulative consolidated net income of the company accrued on a cumulative basis, beginning on January 1, 2011 to the end of the most recent fiscal quarter for which financial statements have been provided to the Trustee, deducting any non-cash charges or expense (other than depreciation and amortization), non-cash gains and the cumulative effect of changes in accounting principles. |
Non-controlling interest acquisition
On December 31, 2014 Crystal Power Company (“Crystal”) and Inkia reached a settlement agreement in application of which Inkia bought the shares of Crystal in Nejapa Holdings for a consideration of US$20,000 thousand which become effective on January 6, 2015.
As a result of this agreement, Inkia increased its indirect holdings in Nejapa Power LLC from 70.85% to 100%. The difference between the consideration paid and the book value of US$1,922 thousand has been recorded as part of the Company’s shareholders´ equity, in the retained earnings category.
F-99
Table of Contents
IC POWER LTD.
Notes to the Consolidated Financial Statements as at December 31, 2014
Note 20—Cost of sales
For the year ended December 31 | ||||||||||||
2015 | 2014 | 2013 | ||||||||||
US$ thousands | US$ thousands | US$ thousands | ||||||||||
Payroll and related expenses | 35,635 | 31,369 | 22,301 | |||||||||
Transmission costs | 140,517 | 126,195 | 85,533 | |||||||||
Capacity and energy purchases | 151,725 | 204,266 | 137,135 | |||||||||
Fuel, gas and lubricants (a) | 468,966 | 503,095 | 286,484 | |||||||||
Maintenance expenses | 37,470 | 26,787 | 17,590 | |||||||||
Intermediation fees (b) | 6,223 | 1,067 | — | |||||||||
Other | 68,446 | 43,943 | 44,759 | |||||||||
|
|
|
|
|
| |||||||
| 908,982 | 936,722 | 593,802 | ||||||||||
|
|
|
|
|
| |||||||
| (a) | Fuel cost is primarily heavy fuel oil consumed by the thermal plants in El Salvador, the Dominican Republic, Jamaica, Nicaragua and Guatemala. |
| (b) | Fees paid by Kallpa in connection with the profit shared on certain PPAs signed with distribution companies. |
Note 21—General and administrative expenses
For the year ended December 31 | ||||||||||||
2015 | 2014 | 2013 | ||||||||||
US$ thousands | US$ thousands | US$ thousands | ||||||||||
Payroll and related expenses | 33,896 | 28,431 | 20,010 | |||||||||
Bad and doubtful debts | — | 628 | — | |||||||||
Depreciation and amortization | 8,510 | 7,417 | 3,943 | |||||||||
Legal fees (a) | 4,462 | 11,118 | 3,205 | |||||||||
Deferred compensation | — | 2,541 | 3,763 | |||||||||
Consultant and professional services | 11,725 | 7,957 | 3,465 | |||||||||
Third party services | 5,559 | 3,737 | 2,627 | |||||||||
Community goodwill | 1,631 | 1,795 | 704 | |||||||||
Other expenses | 5,607 | 5,049 | 3,463 | |||||||||
|
|
|
|
|
| |||||||
| 71,390 | 68,673 | 41,180 | ||||||||||
|
|
|
|
|
| |||||||
| (a) | The 2015 reduction in legal fees is mainly explained by the settlement agreement signed with Crystal on December 31, 2014. During 2014, Inkia incurred in US$ 6,797 thousand in legal fees in connection with Crystal legal process. |
F-100
Table of Contents
IC POWER LTD.
Notes to the Consolidated Financial Statements as at December 31, 2015
Note 22—Other income
For the year ended December 31 | ||||||||||||
2015 | 2014 | 2013 | ||||||||||
US$ thousands | US$ thousands | US$ thousands | ||||||||||
Other income | ||||||||||||
Insurance claims (a) | 6,917 | 7,452 | — | |||||||||
Termination of contract compensation (b) | 550 | — | — | |||||||||
Release of contingency accrual (c) | 545 | — | — | |||||||||
Reimbursement of capital investment in lieu of income taxes | 380 | — | — | |||||||||
Capital gain on sale of property, plant and equipment, net | — | — | 17 | |||||||||
Dividend incomes from other companies | — | 3,655 | 623 | |||||||||
EPC constructor compensation | 1,000 | 1,990 | — | |||||||||
Other | 2,098 | 3,786 | 3,600 | |||||||||
|
|
|
|
|
| |||||||
| 11,490 | 16,883 | 4,240 | ||||||||||
|
|
|
|
|
| |||||||
| (a) | Corresponds mainly to Consorcio Eolico Amayo (Fase II) and COBEE claims in relation to three wind towers damaged and Sainani plant, respectively. |
| (b) | Includes termination of contract compensation received by Kallpa forma Compañía Minera Raura. |
| (c) | Comprises JPPC holdings release of part of its contingency accruals. |
Note 23—Other expenses
For the year ended December 31 | ||||||||||||
2015 | 2014 | 2013 | ||||||||||
US$ thousands | US$ thousands | US$ thousands | ||||||||||
Other expenses | ||||||||||||
Loss on sale of property, plant and equipment, net | 3,421 | 7,751 | — | |||||||||
Provision for contingencies | 1,056 | — | — | |||||||||
Net loss on sale of spare parts | 956 | 1,627 | — | |||||||||
Other | 847 | 1,428 | 708 | |||||||||
|
|
|
|
|
| |||||||
| 6,280 | 10,806 | 708 | ||||||||||
|
|
|
|
|
| |||||||
F-101
Table of Contents
IC POWER LTD.
Notes to the Consolidated Financial Statements as at December 31, 2015
Note 24—Financing income and expenses
For the year ended December 31 | ||||||||||||
2015 | 2014 | 2013 | ||||||||||
US$ thousands | US$ thousands | US$ thousands | ||||||||||
Financing income | ||||||||||||
Interest income from bank deposits | (2,668 | ) | (1,827 | ) | (438 | ) | ||||||
Net income from change in exchange rates | — | (2,007 | ) | — | ||||||||
Net change in fair value of derivative financial instruments, note 16(a) | (3,400 | ) | (133 | ) | (2,645 | ) | ||||||
Interest on commercial operations | (4,616 | ) | (2,170 | ) | (2,460 | ) | ||||||
|
|
|
|
|
| |||||||
| (10,684 | ) | (6,137 | ) | (5,543 | ) | |||||||
|
|
|
|
|
| |||||||
Financing expenses | ||||||||||||
Interest expenses to banks and others | 98,922 | 101,942 | 68,132 | |||||||||
Interest expense on loans from former parent company (a) | — | 6,971 | 11,273 | |||||||||
Finance expenses on IC capital settlement (a) | — | 12,602 | — | |||||||||
Consent fee, note 14 | — | 1,012 | — | |||||||||
Net expenses from change in exchange rates | 11,906 | — | 4,460 | |||||||||
Other expenses | 3,885 | 2,972 | 1,829 | |||||||||
|
|
|
|
|
| |||||||
| 114,713 | 125,499 | 85,694 | ||||||||||
|
|
|
|
|
| |||||||
| 104,029 | 119,362 | 80,151 | ||||||||||
|
|
|
|
|
| |||||||
| (a) | On May 29, 2014, Inkia paid US$ 167,811 thousand of the full outstanding amount of the loans owed to the Former Parent Company. Interests related to these loans were US$ 3,158 thousand and US$ 7,472 thousand in 2014 and 2013, respectively. |
On June 29, 2014, IC Power paid US$ 94,865 thousand of the full outstanding amount of the loans owed to Israel Corporation (IC). As a result of this payment, the Group recorded a finance expense of US$ 16,415 thousand, including US$ 12,602 thousand arising from the difference between the nominal value and the book value of the capital notes (US$ 3,801 thousand in 2013).
Note 25—Taxes on Income
A. Taxes on income included in the income statements:
For the year ended December 31 | ||||||||||||
2015 | 2014 | 2013 | ||||||||||
US$ thousands | US$ thousands | US$ thousands | ||||||||||
Continuing operations | ||||||||||||
Current taxes on income | 29,189 | 45,420 | 34,845 | |||||||||
Expenses from deferred taxes | 20,863 | 17,421 | 13,209 | |||||||||
|
|
|
|
|
| |||||||
| 50,052 | 62,841 | 48,054 | ||||||||||
|
|
|
|
|
| |||||||
In 2014, US$1,518 thousand of previously unrecognized tax losses was used to reduce our current tax expense in Israel. No previously unrecognized tax benefits were used in 2015 or 2013 to reduce our current tax expense.
F-102
Table of Contents
IC POWER LTD.
Notes to the Consolidated Financial Statements as at December 31, 2015
Note 25—Taxes on Income (cont’d)
B. Reconciliation between the theoretical tax on the pre-tax income and the tax expenses
For the year ended December 31 | ||||||||||||
2015 | 2014 | 2013 | ||||||||||
US$ thousands | US$ thousands | US$ thousands | ||||||||||
Income before taxes from continuing operations | 98,905 | 190,765 | 93,391 | |||||||||
Statutory tax rate | 26.5 | % | 26.5 | % | 25 | % | ||||||
|
|
|
|
|
| |||||||
Tax computed at the principal tax rate applicable to the Corporation | 26,210 | 50,553 | 23,348 | |||||||||
Increase (decrease) in tax in respect of: | ||||||||||||
Corporation’s share in profits of associated companies | (93 | ) | (623 | ) | (618 | ) | ||||||
Exempt income (1) | (5,509 | ) | (21,466 | ) | (423 | ) | ||||||
Income subject to tax at a different tax rate | 5,480 | 5,072 | 5,986 | |||||||||
Expenses incurred by holding companies in jurisdictions with nil income tax | 6,569 | 10,929 | 7,036 | |||||||||
Non-deductible expenses | 5,636 | 3,269 | 375 | |||||||||
Differences between the measurement base of income reported for tax purposes and the income reported in the financial statements arising from the translation of non-monetary assets (2) | 49,303 | 22,438 | 24,414 | |||||||||
Differences between the measurement base of income reported for tax purposes and the income reported in the financial statements arising from the exchange differences from monetary items (3) | (37,170 | ) | (13,898 | ) | (12,273 | ) | ||||||
Tax losses and other tax benefits for the period regarding which deferred taxes were not created | 1,676 | 290 | 80 | |||||||||
Utilization of losses and benefits from prior years for which deferred taxes were not created | — | (1,518 | ) | — | ||||||||
Taxes in respect of foreign dividend | — | 8,047 | — | |||||||||
Taxes in respect of prior years | (294 | ) | — | 61 | ||||||||
Impact of change in tax rate | — | (3,131 | ) | 50 | ||||||||
Other differences | (1,756 | ) | 2,879 | 18 | ||||||||
|
|
|
|
|
| |||||||
Taxes on income included in the statement of income | 50,052 | 62,841 | 48,054 | |||||||||
|
|
|
|
|
| |||||||
| 1. | US$ 5,509 thousand of exempt income in Amayo I and Amayo II in Nicaragua in 2015 (US$ 219 thousand in 2014). US$ 21,247 thousand and US$ 423 thousand of exempt income related to gain on bargain purchase in 2014 and 2013, respectively. |
| 2. | Deferred tax related to the effect of foreign exchange rate on non-monetary assets. In 2014 and 2013, the company corrected its financial statements and recorded additional deferred income tax expenses in connection with this effect of US$ 12,519 thousand and US$ 7,361 thousand; for further information see note 3(b). |
| 3. | Exchange differences arising from monetary liabilities reflected only in the taxable income for tax purposes. |
F-103
Table of Contents
IC POWER LTD.
Notes to the Consolidated Financial Statements as at December 31, 2015
Note 25—Taxes on Income (cont’d)
C. Deferred tax assets and liabilities
1. Deferred tax assets and liabilities recognized
The deferred taxes in respect of companies in Israel are calculated based on the tax rate expected to apply at the time of the reversal as detailed above. Deferred taxes in respect of subsidiaries operating outside of Israel were calculated based on the tax rates relevant for each country.
The deferred tax assets and liabilities are allocated to the following items:
Property, | Employee | In respect of | Derivative | Controlling | Intangibles | Undistributed | Non- | Other | Total | |||||||||||||||||||||||||||||||
US$ thousands | ||||||||||||||||||||||||||||||||||||||||
Balance as at | ||||||||||||||||||||||||||||||||||||||||
January 1, 2014 | (81,920 | ) | 821 | 22,725 | 7,058 | (10,554 | ) | (2,450 | ) | — | (2,971 | ) | 1,627 | (65,664 | ) | |||||||||||||||||||||||||
Changes in 2014: | ||||||||||||||||||||||||||||||||||||||||
Reclassification | (5,276 | ) | — | — | — | 5,276 | — | — | — | — | — | |||||||||||||||||||||||||||||
Changes in respect of business combinations | (30,402 | ) | 76 | 34 | — | — | (9,072 | ) | — | (4,841 | ) | 1,991 | (42,214 | ) | ||||||||||||||||||||||||||
Amounts recorded to equity reserve | — | — | — | 2,470 | — | — | — | — | (167 | ) | 2,303 | |||||||||||||||||||||||||||||
Translation differences | 4,576 | (46 | ) | (1,494 | ) | (1 | ) | 24 | — | — | — | (66 | ) | 2,993 | ||||||||||||||||||||||||||
Impact of change in tax rate | (1,786 | ) | — | 4,972 | — | — | (11 | ) | — | — | (44 | ) | 3,131 | |||||||||||||||||||||||||||
Amounts recorded in income statement | (12,376 | ) | (27 | ) | 9,220 | (2,140 | ) | 4,829 | 1,173 | — | (22,438 | ) | 1,207 | (20,552 | ) | |||||||||||||||||||||||||
|
|
|
|
|
|
|
|
|
|
|
|
|
|
|
|
|
|
|
| |||||||||||||||||||||
Balance as at December 31, 2014 | (127,184 | ) | 824 | 35,457 | 7,387 | (425 | ) | (10,360 | ) | — | (30,250 | ) | 4,548 | (120,003 | ) | |||||||||||||||||||||||||
|
|
|
|
|
|
|
|
|
|
|
|
|
|
|
|
|
|
|
| |||||||||||||||||||||
Changes in 2015: | ||||||||||||||||||||||||||||||||||||||||
Changes in respect of business combinations | — | — | — | — | — | (124 | ) | — | — | — | (124 | ) | ||||||||||||||||||||||||||||
Amounts recorded to equity reserve | — | — | — | 3,081 | — | — | — | — | — | 3,081 | ||||||||||||||||||||||||||||||
Translation differences | 352 | (1 | ) | (153 | ) | — | 4 | 6 | — | — | (34 | ) | 174 | |||||||||||||||||||||||||||
Amounts recorded in income statement | 2,864 | (222 | ) | 26,639 | 869 | 421 | 1,502 | (2,681 | ) | (49,303 | ) | (952 | ) | (20,863 | ) | |||||||||||||||||||||||||
|
|
|
|
|
|
|
|
|
|
|
|
|
|
|
|
|
|
|
| |||||||||||||||||||||
Balance as at December 31, 2015 | (123,968 | ) | 601 | 61,943 | 11,337 | — | (8,976 | ) | (2,681 | ) | (79,553 | ) | 3,562 | (137,735 | ) | |||||||||||||||||||||||||
|
|
|
|
|
|
|
|
|
|
|
|
|
|
|
|
|
|
|
| |||||||||||||||||||||
F-104
Table of Contents
IC POWER LTD.
Notes to the Consolidated Financial Statements as at December 31, 2015
Note 25—Taxes on Income (cont’d)
C. Deferred tax assets and liabilities (cont’d)
2. The deferred taxes are presented in the statements of financial position as follows:
As at December 31 | ||||||||
2015 | 2014 | |||||||
US$ thousands | US$ thousands | |||||||
Non-current assets | 2,693 | 25,743 | ||||||
Non-current liabilities | (140,428 | ) | (145,746 | ) | ||||
|
|
|
| |||||
| (137,735 | ) | (120,003 | ) | |||||
|
|
|
| |||||
D. Taxation of companies in Israel
On August 5, 2013 the Knesset passed the Law for Changes in National Priorities (Legislative Amendments for Achieving Budget Objectives in the Years 2013 and 2014) – 2013. As part of the legislation, the Company tax rate was raised by 1.5% to a rate of 26.5% as from 2014.
Current taxes for the reported periods are calculated according to the tax rates presented above.
(a) On January 5, 2016 Amendment 216 to the Income Tax Ordinance (New Version) – 1961 (hereinafter – “the Ordinance”) was passed in the Knesset. As part of the amendment, the Company tax rate would be reduced by 1.5% to a rate of 25% as from 2016. If the law had been substantively enacted before December 31, 2015, the effect of the change on the financial statements as at December 31, 2015 would have been reflected in a decrease in the deferred tax liabilities in the amount of US$ 2,303 thousand. The effect of the change in the deferred tax balances would have been recognized against deferred tax expenses in the amount of US$ 2,303 thousand.
(b) On January 12, 2012 Amendment 188 to the Ordinance was issued, by which the Temporary Order was amended so that Standard 29 shall not apply also when determining the taxable income for 2010 and 2011. On July 31, 2014 Amendment 202 to the Ordinance was issued, by which the Temporary Order was extended to the 2012 and 2013 tax years.
In June 2011, OPC received an approval from the Taxes Authority in Israel such that the electricity production activities will be considered manufacturing activities and the Company’s power station will constitute an “Industrial Enterprise” as defined in the Law for Encouragement of Industry upon fulfillment of the all the conditions provided by the Taxes Authority in Israel.
“Industrial Companies” as defined in the Law for the Encouragement of Industry (Taxes) – 1969 are entitled to benefits of which the most significant ones are as follows:
(a) Higher rates of depreciation.
(b) Amortization in three equal annual portions of issuance expenses when registering shares for trading as from the date the shares of the company were registered.
(c) An 8-year period of amortization for patents and know-how serving in the development of the enterprise.
(d) The possibility of submitting consolidated tax returns by companies in the same line of business.
F-105
Table of Contents
IC POWER LTD.
Notes to the Consolidated Financial Statements as at December 31, 2015
Note 25—Taxes on Income (cont’d)
E. Taxation of Non-Israeli Subsidiaries
Non-Israeli subsidiaries are assessed based on the tax laws in their resident countries. Withholding tax rates shown below are provided based on domestic legislation of relevant countries and may be decreased under tax treaties.
Current income tax from operations in El Salvador includes income tax from the consolidation of Nejapa Power Branch and Cenergica. Income tax rate in El Salvador is 30% for the years ended December 31, 2015, 2014 and 2013. In addition, a 5% to 25% withholding tax is applicable depending on whether the payments are to countries with preferential tax regimes or nil taxes. Currently, Nejapa´s and Cenergica´s parent company is domiciliated in Panama and therefore is subject to 5% withholding tax.
In the Dominic Republic, Compañía de Electricidad de Puerto Plata (CEPP) was subject to the greater of 27%, 28% and 29% income tax rate on taxable income in 2015, 2014 and 2013, or 1% of taxable assets. During 2015, 2014 and 2013, CEPP qualified to pay income tax on the basis of taxable income; and a 10% withholding tax on dividend distribution.
In Bolivia the company has 25% income tax and a 12.5% withholding tax on the Bolivian branch profits credited to the shareholder.
In December 2014, a tax reform Law was enacted in Peru. Among other changes, the Law decreases corporate income tax rates and increases withholding tax rates on dividends. The corporate income tax rate will reduce from 30% in 2014 to: 28%, in 2015 and 2016, to 27%, in 2017 and 2018 and to 26% starting 2019. The withholding tax rates will increase from 4.1% in 2014 to: 6.8% in 2015 and 2016, 8.0% in 2017 and 2018; and 9.3% starting 2019. Kallpa, CDA and Samay I have signed tax stability agreements that expire in 2020, 2022 and 2024, respectively. Only after these tax agreements expire, Kallpa, CDA and Samay I will be affected by the changes in income tax and withholding tax rates described above.
In September 2014, a tax reform in Chile was enacted, which makes substantial changes to the Chilean tax system, including two alternative mechanisms for computing shareholder-level income taxation beginning on January 1, 2017 (accrued income and cash-basis methods), additional corporate tax rate increases, and other substantial modifications. The selection should be made before the end of 2016 and it will remain in effect for 5 years.
| a) | Accrued income basis: shareholders would be taxed on income attributed to them as of the end of the year in which the income is generated. These profits would be taxed at the shareholders level whether or not they are distributed. The underlying corporate income tax paid at the entity level may be used by shareholders as a credit to reduce the Chilean shareholder tax. Therefore, the combined total company and shareholder Chilean income tax burden remains at 35%. Future distributions are not subject to taxation. |
Therefore, under this method the taxation of a Chilean entity is performed in two stages:
| • | Company: 25% of accrued profits (using the maximum corporate income tax applicable for 2018). |
F-106
Table of Contents
IC POWER LTD.
Notes to the Consolidated Financial Statements as at December 31, 2015
Note 25—Taxes on Income (cont’d)
E. Taxation of Non-Israeli Subsidiaries (cont’d)
| • | Shareholders: 35% of accrued profits (whether or not distributions received, with 100% of corporate income tax paid, resulting in an effective tax rate to shareholders of 10%). |
b) Cash basis: A company pays corporate income tax based on its annual result. Shareholders will only pay in Chile the relevant tax on effective profit distributions and will be entitled to use the tax paid as credit with certain limitations. Only 65% of the corporate income tax is creditable and reduces the 35% shareholder level tax (as opposed to 100% under the accrued income basis). Taxation under this mechanism is also performed in two stages:
| • | Company: 27% of accrued profits (using the maximum corporate income tax applicable for 2018). |
| • | Shareholders: 35% of cash disbursement (65% of corporate income tax is creditable against the shareholder level tax, resulting in an effective tax rate to shareholders of 17.5%. However, if the shareholder is a resident company of a country with a tax treaty in effect with Chile, 100% of the tax is creditable, resulting in an effective tax rate to shareholders of 8%) |
As a result, the corporate income tax rate increased gradually from 20% in 2013 to: 21% in 2014; 22.5% in 2015; and it will increase to 24% in 2016; and 25% in 2017 for shareholders on the accrued income method, and 25.5% in 2017 for shareholders on the cash-basis method. Starting 2018 onwards, the income tax rate will be 25% for shareholders on the accrued income method and 27% for shareholders on the cash-basis method.
In Nicaragua, Empresa Energética Corinto and Tipitapa Power Company are subject to 25% income tax, based on a Foreign Investment Agreement signed in June 2000, which protect the companies from any unfavorable changes in the tax Law. In addition, Consorcio Eólico Amayo S.A and Consorcio Eólico Amayo Fase II, are tax exempt from income tax payments up to a period of seven years since the beginning of operations of the plants, in accordance with Law No.532 for Electric Power Generation with Renewable Sources Incentive. In addition, a 10% to 17% withholding tax is applicable depending on whether the payments are to countries with preferential tax regimes or nil taxes.
In Guatemala, PQP was subject to a 25% and 28% income tax rate in 2015 and 2014, respectively, and a 5% withholding tax on dividend distributions.
In January 2013, a tax reform was enacted in Colombia, which established an income tax rate of 25%, except for those contributors that by express disposition handle special rates, not less than 3% of the net worth of the shareholders ‘equity on the last day of the immediately previous taxable period. In addition, a 9% equity income tax (CREE) was created as a contribution to generate employment and social investment.
Deferred tax liability on undistributed earnings
Subsidiaries pay dividends on quarterly basis as long as they are in compliance with covenants derived from the borrowings agreements described in Note 14. Deferred tax is recognized for temporary differences related to undistributed earnings in subsidiaries that will reverse it in the foreseeable future. During 2015, the Company recorded an expense of US$2,681 thousand in connection with this timing difference.
F-107
Table of Contents
IC POWER LTD.
Notes to the Consolidated Financial Statements as at December 31, 2015
Note 25—Taxes on Income (cont’d)
Distributions of the earnings of foreign subsidiaries are subject to the withholding taxes imposed by the foreign subsidiaries´ jurisdictions of incorporation. The Company does not have funds designated for, or subject to, permanent reinvestment in any country in which it operates.
Note 26—Related and Interested Parties
A. Balances with interested and related parties
As at December 31 | ||||||||
2015 | 2014 | |||||||
US$ thousands | US$ thousands | |||||||
Trade receivables | 14,472 | 19,347 | ||||||
Loan from Bank Leumi | 41,677 | 62,228 | ||||||
Other receivables | 290 | — | ||||||
Other payables | 33 | — | ||||||
Former Parent company | — | 592 | ||||||
Parent company | 32 | — | ||||||
| * | Not including deposits and balances in banks. |
B. Transactions with interested and related parties
As at December 31 | ||||||||||||
2015 | 2014 | 2013 | ||||||||||
US$ thousands | US$ thousands | US$ thousands | ||||||||||
Sales | 146,884 | 208,457 | 96,075 | |||||||||
Finance expenses | 2,219 | 5,215 | 4,229 | |||||||||
IC Power executive officers do not receive compensation directly from IC Power; each is also an executive officer of Kallpa and receives compensation directly from Kallpa. The aggregate annual compensation expenses related to IC Power executive officers during 2015, 2014 and 2013 were US$4,704 thousand, US$3,479 thousand and US$5,540 thousand, respectively.
Note 27— Segment Information
A. Basis for segmentation
The Company is only involved in the power generation business. There is no other relevant activity or line of business identified. Therefore, senior management team evaluates the business from a geographic perspective. They receive and review the information about the operating results and assets performance as of subsidiary level as well as of country level.
Peru, Israel, Central America and Other are the reportable segments identified for IC Power consolidated financial statements. The geographic regions included in our Other segment are Bolivia, Chile, the Dominican Republic, Jamaica, Colombia and Panama.
F-108
Table of Contents
IC POWER LTD.
Notes to the Consolidated Financial Statements as at December 31, 2015
Note 27— Segment Information (cont’d)
B. Information about reportable segments
For management purposes, the Group is organized into business units based on its geographic area, as follows:
Peru | Israel | Central | All other | Adjustments | Total | |||||||||||||||||||
For the year ended December 31, 2015 | ||||||||||||||||||||||||
Continuing Operations | ||||||||||||||||||||||||
Sales | 447,679 | 326,061 | 336,544 | 178,455 | 1,288,739 | |||||||||||||||||||
Cost of Sales | (278,957 | ) | (242,383 | ) | (264,932 | ) | (122,710 | ) | (908,982 | ) | ||||||||||||||
Depreciation and amortization | (49,496 | ) | (25,435 | ) | (20,416 | ) | (24,956 | ) | 9,386 | (110,917 | ) | |||||||||||||
Gross Profit | 119,226 | 58,243 | 51,196 | 30,789 | 9,386 | 268,840 | ||||||||||||||||||
General, selling and administrative expenses | (18,663 | ) | (6,056 | ) | (13,124 | ) | (33,685 | ) | 138 | (71,390 | ) | |||||||||||||
Other income, net | 1,115 | 1,000 | 1,220 | 1,875 | — | 5,210 | ||||||||||||||||||
|
|
|
|
|
|
|
|
|
|
|
| |||||||||||||
Operating income | 101,678 | 53,187 | 39,292 | (1,021 | ) | 9,524 | 202,660 | |||||||||||||||||
Financing expenses, net | 41,470 | 23,360 | 10,273 | 28,859 | 67 | 104,029 | ||||||||||||||||||
Share in losses (income) of associated companies | — | — | — | 274 | 274 | |||||||||||||||||||
|
|
|
|
|
|
|
|
|
|
|
| |||||||||||||
Income before taxes from continuing operations | 60,208 | 29,827 | 29,019 | (29,606 | ) | 9,457 | 98,905 | |||||||||||||||||
Taxes on income | (29,621 | ) | (7,642 | ) | (5,938 | ) | (5,339 | ) | (1,512 | ) | (50,052 | ) | ||||||||||||
|
|
|
|
|
|
|
|
|
|
|
| |||||||||||||
Net income from continuing operations | 30,587 | 22,185 | 23,081 | (34,945 | ) | 7,945 | 48,853 | |||||||||||||||||
|
|
|
|
|
|
|
|
|
|
|
| |||||||||||||
Discontinued operations | ||||||||||||||||||||||||
Net income from discontinued operations | 3,850 | 3,850 | ||||||||||||||||||||||
|
|
|
|
|
|
|
|
|
|
|
| |||||||||||||
Net income for the period | 30,587 | 22,185 | 23,081 | (31,095 | ) | 7,945 | 52,703 | |||||||||||||||||
|
|
|
|
|
|
|
|
|
|
|
| |||||||||||||
Segment assets | 1,985,256 | 652,922 | 454,816 | 1,214,283 | (224,756 | ) | 4,082,521 | |||||||||||||||||
Investment in associated companies | — | — | — | 8,993 | — | 8,993 | ||||||||||||||||||
Segment liabilities | 1,498,066 | 539,668 | 287,332 | 870,434 | (130,575 | ) | 3,064,925 | |||||||||||||||||
F-109
Table of Contents
IC POWER LTD.
Notes to the Consolidated Financial Statements as at December 31, 2015
Note 27— Segment Information (cont’d)
B. Information about reportable segments (cont’d)
Peru | Israel | Central | All other | Adjustments | Total | |||||||||||||||||||
For the year ended December 31, 2014 | ||||||||||||||||||||||||
Continuing Operations | ||||||||||||||||||||||||
Sales | 436,673 | 413,578 | 307,618 | 214,361 | — | 1,372,230 | ||||||||||||||||||
Cost of Sales | (269,528 | ) | (253,077 | ) | (259,573 | ) | (154,544 | ) | — | (936,722 | ) | |||||||||||||
Depreciation and amortization | (44,853 | ) | (25,261 | ) | (17,881 | ) | (22,231 | ) | 9,230 | (100,996 | ) | |||||||||||||
Gross Profit | 122,292 | 135,240 | 30,164 | 37,586 | 9,230 | 334,512 | ||||||||||||||||||
General, selling and administrative expenses | (17,302 | ) | (8,422 | ) | (8,956 | ) | (34,316 | ) | 323 | (68,673 | ) | |||||||||||||
Asset write-off | — | — | — | (34,673 | ) | — | (34,673 | ) | ||||||||||||||||
Gain on bargain purchase | — | — | — | 68,210 | — | 68,210 | ||||||||||||||||||
Measurement to fair value of pre-existing share | — | — | — | 2,674 | — | 2,674 | ||||||||||||||||||
Other income, net | 3,224 | — | 60 | 3,311 | (518 | ) | 6,077 | |||||||||||||||||
|
|
|
|
|
|
|
|
|
|
|
| |||||||||||||
Operating income | 108,214 | 126,818 | 21,268 | 42,792 | 9,035 | 308,127 | ||||||||||||||||||
Financing expenses, net | (34,574 | ) | (30,571 | ) | (7,881 | ) | (45,751 | ) | (585 | ) | (119,362 | ) | ||||||||||||
Share in losses (income) of associated companies | — | — | — | 2,000 | — | 2,000 | ||||||||||||||||||
|
|
|
|
|
|
|
|
|
|
|
| |||||||||||||
Income before taxes from continuing operations | 73,640 | 96,247 | 13,387 | (959 | ) | 8,450 | 190,765 | |||||||||||||||||
Taxes on income | (29,331 | ) | (25,202 | ) | (4,759 | ) | (2,567 | ) | (982 | ) | *(62,841 | ) | ||||||||||||
|
|
|
|
|
|
|
|
|
|
|
| |||||||||||||
Net income from continuing operations | 44,309 | 71,045 | 8,628 | (3,526 | ) | 7,468 | 127,924 | |||||||||||||||||
|
|
|
|
|
|
|
|
|
|
|
| |||||||||||||
Segment assets | 1,738,775 | 718,373 | 451,782 | 1,159,793 | (236,711 | ) | 3,832,012 | |||||||||||||||||
Investment in associated companies | — | — | — | 9,625 | — | 9,625 | ||||||||||||||||||
Segment liabilities | 1,210,058 | 626,482 | 273,879 | 739,921 | (21,363 | ) | 2,828,977 | |||||||||||||||||
| (*) | Immaterial adjustment of comparative data—See Note 3 regarding basis of preparation. |
F-110
Table of Contents
IC POWER LTD.
Notes to the Consolidated Financial Statements as at December 31, 2015
Note 27— Segment Information (cont’d)
B. Information about reportable segments (cont’d)
Peru | Israel | Central | All other | Adjustments | Total | |||||||||||||||||||
For the year ended December 31, 2013 | ||||||||||||||||||||||||
Continuing Operations | ||||||||||||||||||||||||
Sales | 394,055 | 187,397 | 147,397 | 144,521 | — | 873,370 | ||||||||||||||||||
Cost of Sales | (238,610 | ) | (138,913 | ) | (127,208 | ) | (89,150 | ) | 79 | (593,802 | ) | |||||||||||||
Depreciation and amortization | (39,501 | ) | (12,179 | ) | (9,252 | ) | (20,250 | ) | 9,555 | (71,627 | ) | |||||||||||||
Gross Profit | 115,944 | 36,305 | 10,937 | 35,121 | 9,634 | 207,941 | ||||||||||||||||||
General, selling and administrative expenses | (16,910 | ) | (4,931 | ) | (3,831 | ) | (15,572 | ) | 64 | (41,180 | ) | |||||||||||||
Gain on bargain purchase | — | — | — | 1,320 | — | 1,320 | ||||||||||||||||||
Other income, net | 1,463 | (584 | ) | 378 | 2,506 | (231 | ) | 3,532 | ||||||||||||||||
|
|
|
|
|
|
|
|
|
|
|
| |||||||||||||
Operating income | 100,497 | 30,790 | 7,484 | 23,375 | 9,467 | 171,613 | ||||||||||||||||||
Financing expenses, net | (34,094 | ) | (21,915 | ) | (276 | ) | (23,232 | ) | (634 | ) | (80,151 | ) | ||||||||||||
Share in losses (income) of associated companies | — | — | — | 1,929 | — | 1,929 | ||||||||||||||||||
|
|
|
|
|
|
|
|
|
|
|
| |||||||||||||
Income before taxes from continuing operations | 66,403 | 8,875 | 7,208 | 2,072 | 8,833 | 93,391 | ||||||||||||||||||
Taxes on income | (32,008 | ) | (2,373 | ) | (2,205 | ) | (9,689 | ) | (1,779 | ) | *(48,054 | ) | ||||||||||||
|
|
|
|
|
|
|
|
|
|
|
| |||||||||||||
Net income from continuing operations | 34,395 | 6,502 | 5,003 | (7,617 | ) | 7,054 | 45,337 | |||||||||||||||||
|
|
|
|
|
|
|
|
|
|
|
| |||||||||||||
Segment assets | 1,082,402 | 666,370 | 86,865 | 1,224,025 | (315,905 | ) | 2,743,757 | |||||||||||||||||
Investment in associated companies | — | — | — | 286,385 | — | 286,385 | ||||||||||||||||||
Segment liabilities | 612,484 | 636,668 | 21,138 | 1,054,620 | (88,371 | ) | 2,236,539 | |||||||||||||||||
| (*) | Immaterial adjustment of comparative data—See Note 3 regarding basis of preparation. |
C. Major customers
In 2015 and 2014, IC Power does not have any major customers.
Revenues from Luz del Sur represented US$150,332 thousand of the total sales in 2013. These revenues are attributable to the Peru segment.
F-111
Table of Contents
IC POWER LTD.
Notes to the Consolidated Financial Statements as at December 31, 2015
Note 28—Earnings per share
Basic EPS amounts are calculated by dividing the profit for the year attributable to ordinary equity holders by the weighted average number of ordinary shares outstanding during the year. The following reflects the income and share data used in the EPS computations:
As at December 31 | ||||||||||||
2015 | 2014 | 2013 | ||||||||||
US$ thousands | US$ thousands | US$ thousands | ||||||||||
Net income for continuing operations | 31,955 | 98,849 | 32,475 | |||||||||
Net income from discontinued operations | 3,850 | 128,055 | 28,427 | |||||||||
Net income for the year | 35,805 | 226,904 | 60,902 | |||||||||
|
|
|
|
|
| |||||||
Weighted average number of ordinary shares for basic EPS (in thousands) | 10,000 | 10,000 | 10,000 | |||||||||
|
|
|
|
|
| |||||||
Earnings per ordinary share from continuing operations | 3.2 | 9.9 | 3.2 | |||||||||
Earnings per ordinary share from discontinuing operations | 0.4 | 12.8 | 2.8 | |||||||||
Earnings per ordinary share | 3.6 | 22.7 | 6.1 | |||||||||
|
|
|
|
|
| |||||||
Note 29—Financial Instruments and Risk Management
General
The Group has extensive international activity in which it is exposed to credit, liquidity and market risks (including currency, interest, inflation and other price risks). In order to reduce the exposure to these risks, the Group holds derivative financial instruments, (including forward transactions, SWAP transactions, and options) for the purpose of economic (not accounting) hedging of foreign currency risks, inflation risks, commodity price risks, interest risks and risks relating to the price of inputs. Furthermore, the Company holds derivative financial instruments to hedge its risk in respect of changes in the cash flows of issued bonds, and such instruments are accounting hedges.
This note presents information about the Group’s exposure to each of the above risks, and the Group’s objectives, policies and processes for measuring and managing the risk.
The risk management of the Group companies is executed by them as part of the ongoing current management of the companies. The Group companies monitor on a regular basis. The hedge policies with respect to all the different types of exposures are discussed by the boards of directors of the companies.
The comprehensive responsibility for establishing the base for the Group’s risk management and for supervising its implementation lies with the Board of Directors and the senior management of the Group.
Credit risk
Counterparty credit risk is the risk that the financial benefits of contracts with a specific counterparty will be lost if a counterparty defaults on their obligations under the contract. This includes any cash
F-112
Table of Contents
IC POWER LTD.
Notes to the Consolidated Financial Statements as at December 31, 2015
Note 29—Financial Instruments and Risk Management (cont’d)
amounts owed to the Group by those counterparties, less any amounts owed to the counterparty by the Group where a legal right of set-offs exist and also includes the fair values of contracts with individual counterparties which are included in the financial statements. The maximum exposure to credit risk at each reporting date is the carrying value of each class of financial assets mentioned in this note.
Liquidity risk
Liquidity risk is the risk that the Group will not have sufficient funds to meet liabilities. The Group monitors its risk to shortage of funds through use of cash forecasts which identify the liquidity requirements of the Group. These are reviewed regularly to ensure sufficient financial headroom exists for at least a 6 month period.
Market risks
Market risk is the risk that changes in market prices, such as foreign exchange rates, the CPI, interest rates and prices of capital products and instruments will affect the fair value of the future cash flows of a financial instrument.
Currency risk
The Group is exposed to currency risk in respect of assets and liabilities that are not denominated in dollars. A subsidiary of the Group, whose functional currency is the NIS, makes investments in fixed assets in various currencies (dollar, yen, NIS and euro). This company executes partial hedges against its functional currency.
Interest rate risk
The Group is exposed to changes in interest rates in respect of loans bearing variable interest rates and in respect of loans that the interest on them is determined as a margin from Government debentures.
The Group did not establish a policy for limiting the exposure and it hedges against this exposure according to forecasts of future interest rates. The Group enters into transactions mainly in order to reduce the cash flow risk in respect of interest rates and it takes a loan against a deposit in order to fix the interest rate.
Inflation risk
The Group has CPI-linked loans. The Group is exposed to high payments of interest and principal as the result of an increase in the CPI. It is noted that part of the Group’s anticipated revenues will be linked to the CPI. The Group does not hedge this exposure beyond the expected hedge included in its revenues.
F-113
Table of Contents
IC POWER LTD.
Notes to the Consolidated Financial Statements as at December 31, 2015
Note 29—Financial Instruments and Risk Management (cont’d)
A. Credit risk
(1) Exposure to credit risk
The carrying amount of financial assets represents the maximum credit exposure. The maximum exposure to credit risk at the reporting date was:
As at December 31 | ||||||||
2015 | 2014 | |||||||
Carrying amount | ||||||||
US$ thousands | US$ thousands | |||||||
Cash and cash equivalents | 359,587 | 583,296 | ||||||
Short term Deposits and restricted cash | 301,955 | 207,646 | ||||||
Trade receivables | 123,273 | 181,358 | ||||||
Other receivables | 12,468 | 47,427 | ||||||
Deposits and other long-term receivables including derivative instruments | 40,843 | 7,672 | ||||||
|
|
|
| |||||
| 838,126 | 1,027,399 | |||||||
|
|
|
| |||||
The maximum exposure to credit risk for trade receivables, at the reporting date by geographic region was:
As at December 31 | ||||||||
2015 | 2014 | |||||||
Carrying amount | ||||||||
US$ thousands | US$ thousands | |||||||
South America | 53,325 | 52,809 | ||||||
Israel | 31,306 | 41,260 | ||||||
Others | 38,642 | 87,289 | ||||||
|
|
|
| |||||
| 123,273 | 181,358 | |||||||
|
|
|
| |||||
(2) Aging of debts and impairment losses
The aging of trade receivables at the reporting date was:
As at December 31 | As at December 31 | |||||||||||||||
2015 | 2014 | |||||||||||||||
Gross | Impairment | Gross | Impairment | |||||||||||||
US$ thousands | US$ thousands | US$ thousands | US$ thousands | |||||||||||||
Not past due | 109,502 | — | 133,360 | — | ||||||||||||
Past due to 3 months | 12,210 | — | 25,427 | — | ||||||||||||
Past due 3 to 6 months | 301 | — | 12,330 | — | ||||||||||||
Past due 6 to 9 months | 101 | — | 9,866 | — | ||||||||||||
Past due 9 to 12 months | 932 | — | 13 | — | ||||||||||||
Past due more than one year | 331 | (104 | ) | 466 | (104 | ) | ||||||||||
|
|
|
|
|
|
|
| |||||||||
| 123,377 | (104 | ) | 181,462 | (104 | ) | |||||||||||
|
|
|
|
|
|
|
| |||||||||
F-114
Table of Contents
IC POWER LTD.
Notes to the Consolidated Financial Statements as at December 31, 2015
Note 29—Financial Instruments and Risk Management (cont’d)
A. Credit risk (cont’d)
(2) Aging of debts and impairment losses (cont’d)
The movement in the provision for impairment in respect of trade receivables during the year was as follows:
For the year ended December 31 | ||||||||
2015 | 2014 | |||||||
| US$ thousands | US$ thousands | |||||||
Balance as at January 1 | 104 | 697 | ||||||
Impairment loss on trade receivables recognized in the period | — | 1,187 | ||||||
Write off of customer receivables defined as uncollectible | — | (1,221 | ) | |||||
Cancellation of provision previously recognized | — | (559 | ) | |||||
|
|
|
| |||||
Balance as at December 31 | 104 | 104 | ||||||
|
|
|
| |||||
B. Liquidity risk
Liquidity risk is the risk that the Company will encounter difficulty in meeting the obligations associated with its financial liabilities that are settled by delivering cash or another financial asset. The Company’s approach to managing liquidity is to ensure, as far as possible, that it will always have sufficient liquidity to meet its liabilities when due, under both normal and stressed conditions, without incurring unacceptable losses or risking damage to the Company’s reputation.
The following are the contractual maturities of financial liabilities, including estimated interest payments:
Set forth below are the anticipated repayment dates of the financial liabilities, including an estimate of the interest payments. This disclosure does not include amounts regarding which there are offset agreements:
As at December 31, 2015 | ||||||||||||||||||||||||
Book value | Projected flows | Up to 1 year | 1–2 | 2–5 | More | |||||||||||||||||||
US$ thousands | ||||||||||||||||||||||||
Non-derivative financial liabilities | ||||||||||||||||||||||||
Credit from banks and others* | 179,317 | 187,484 | 187,484 | — | — | — | ||||||||||||||||||
Trade payables | 143,958 | 143,958 | 143,958 | — | — | — | ||||||||||||||||||
Other payables and credit balances | 85,215 | 85,215 | 85,215 | — | — | — | ||||||||||||||||||
Non-convertible debentures** | 671,247 | 951,308 | 69,115 | 62,267 | 261,256 | 558,670 | ||||||||||||||||||
Loans from banks and others** | 1,550,352 | 2,172,581 | 203,972 | 214,583 | 490,088 | 1,263,938 | ||||||||||||||||||
Liabilities in respect of financing lease | 163,774 | 201,929 | 35,501 | 49,955 | 67,749 | 48,724 | ||||||||||||||||||
Financial liabilities hedging instruments | ||||||||||||||||||||||||
Interest SWAP contracts | 44,059 | 44,059 | 10,630 | 9,474 | 16,514 | 7,441 | ||||||||||||||||||
Forward contracts on exchange rate | 850 | 850 | 850 | — | — | — | ||||||||||||||||||
Financial liabilities not for hedging | ||||||||||||||||||||||||
Interest SWAP contracts and options | 3,276 | 3,276 | 1,080 | 1,081 | 940 | 175 | ||||||||||||||||||
|
|
|
|
|
|
|
|
|
|
|
| |||||||||||||
| 2,842,048 | 3,790,660 | 737,805 | 337,360 | 836,547 | 1,878,948 | |||||||||||||||||||
|
|
|
|
|
|
|
|
|
|
|
| |||||||||||||
F-115
Table of Contents
IC POWER LTD.
Notes to the Consolidated Financial Statements as at December 31, 2015
Note 29—Financial Instruments and Risk Management (cont’d)
B. Liquidity risk (cont’d)
| * | Not including current maturities. |
| ** | Including current maturities. |
As at December 31, 2014 | ||||||||||||||||||||||||
Book value | Projected flows | Up to 1 year | 1–2 | 2–5 | More | |||||||||||||||||||
US$ thousands | ||||||||||||||||||||||||
Non-derivative financial liabilities | ||||||||||||||||||||||||
Credit from banks and others* | 58,137 | 58,646 | 58,646 | — | — | — | ||||||||||||||||||
Trade payables | 143,639 | 143,639 | 143,639 | — | — | — | ||||||||||||||||||
Other payables and credit balances | 90,170 | 90,170 | 90,170 | — | — | — | ||||||||||||||||||
Non-convertible debentures** | 703,952 | 1,058,547 | 74,800 | 71,816 | 259,191 | 652,740 | ||||||||||||||||||
Loans from banks and others** | 1,392,305 | 1,969,288 | 134,568 | 141,343 | 520,035 | 1,173,342 | ||||||||||||||||||
Liabilities in respect of financing lease | 193,538 | 242,842 | 40,722 | 35,529 | 89,425 | 77,166 | ||||||||||||||||||
Financial liabilities hedging instruments | ||||||||||||||||||||||||
Interest SWAP contracts | 27,713 | 27,713 | 10,105 | 7,018 | 7,164 | 3,426 | ||||||||||||||||||
Forward contracts on exchange rate | 5,402 | 5,402 | 4,763 | 639 | — | — | ||||||||||||||||||
Financial liabilities not for hedging | ||||||||||||||||||||||||
Interest SWAP contracts and options | 4,116 | 4,116 | 1,318 | 985 | 1,390 | 423 | ||||||||||||||||||
|
|
|
|
|
|
|
|
|
|
|
| |||||||||||||
| 2,618,972 | 3,600,363 | 558,731 | 257,330 | 877,205 | 1,907,097 | |||||||||||||||||||
|
|
|
|
|
|
|
|
|
|
|
| |||||||||||||
| * | Not including current maturities. |
| ** | Including current maturities. |
The following tables indicate the periods in which the cash flows associated with derivatives that are cash flow hedges are expected to occur.
For the year ended December 31, 2015 | ||||||||||||||||||||||||
Book | Projected | Up to | 1–2 | 2–5 | More 5 years | |||||||||||||||||||
US$ thousands | ||||||||||||||||||||||||
Interest rate swap contracts | 44,059 | 44,059 | 10,630 | 9,474 | 16,514 | 7,441 | ||||||||||||||||||
Forward contracts on exchange rates | 850 | 850 | 850 | — | — | — | ||||||||||||||||||
|
|
|
|
|
|
|
|
|
|
|
| |||||||||||||
| 44,909 | 44,909 | 11,480 | 9,474 | 16,514 | 7,441 | |||||||||||||||||||
|
|
|
|
|
|
|
|
|
|
|
| |||||||||||||
For the year ended December 31, 2014 | ||||||||||||||||||||||||
Book | Projected | Up to | 1–2 | 2–5 | More | |||||||||||||||||||
US$ thousands | ||||||||||||||||||||||||
Interest rate swap contracts | 27,713 | 27,713 | 10,105 | 7,018 | 7,164 | 3,426 | ||||||||||||||||||
Forward contracts on exchange rates | 5,402 | 5,402 | 4,763 | 639 | — | — | ||||||||||||||||||
|
|
|
|
|
|
|
|
|
|
|
| |||||||||||||
| 33,115 | 33,115 | 14,868 | 7,657 | 7,164 | 3,426 | |||||||||||||||||||
|
|
|
|
|
|
|
|
|
|
|
| |||||||||||||
F-116
Table of Contents
IC POWER LTD.
Notes to the Consolidated Financial Statements as at December 31, 2015
Note 29—Financial Instruments and Risk Management (cont’d)
C. CPI and foreign currency risks
(1) Exposure to CPI and foreign currency risks
The Group’s exposure to CPI and foreign currency risk, based on nominal amounts, is as follows:
As at December 31, 2015 | ||||||||||||||||||||
Dollar | Foreign currency | |||||||||||||||||||
Shekel | Euro | Other | ||||||||||||||||||
Unlinked | CPI | |||||||||||||||||||
| US$ thousands | ||||||||||||||||||||
Non-derivative instruments | ||||||||||||||||||||
Cash and cash equivalents | 217,587 | 102,757 | — | 1 | 39,242 | |||||||||||||||
Short-term investments, deposits and loans | 223,790 | 72,967 | — | — | 5,198 | |||||||||||||||
Trade receivables | 51,511 | 31,306 | — | — | 40,456 | |||||||||||||||
Other receivables and debit balances | 7,327 | 614 | — | — | 4,526 | |||||||||||||||
Deposits, loans and debit balances | 550 | 19,565 | — | — | 17,865 | |||||||||||||||
|
|
|
|
|
|
|
|
|
| |||||||||||
Total financial assets | 500,765 | 227,209 | — | 1 | 107,287 | |||||||||||||||
|
|
|
|
|
|
|
|
|
| |||||||||||
Credit from banks and others* | (172,234 | ) | — | — | — | (7,083 | ) | |||||||||||||
Trade payables | (93,305 | ) | (30,254 | ) | — | (79 | ) | (20,320 | ) | |||||||||||
Other payables and credit balances | (68,879 | ) | (2,484 | ) | (2,469 | ) | — | (11,383 | ) | |||||||||||
Long-term loans from banks and others and Debentures** | (1,847,372 | ) | (5,494 | ) | (473,151 | ) | — | (59,356 | ) | |||||||||||
|
|
|
|
|
|
|
|
|
| |||||||||||
Total financial liabilities | (2,181,790 | ) | (38,232 | ) | (475,620 | ) | (79 | ) | (98,142 | ) | ||||||||||
|
|
|
|
|
|
|
|
|
| |||||||||||
Total non-derivative financial instruments, net | (1,681,025 | ) | 188,977 | (475,620 | ) | (78 | ) | 9,145 | ||||||||||||
|
|
|
|
|
|
|
|
|
| |||||||||||
Derivative instruments | (45,321 | ) | — | — | — | — | ||||||||||||||
|
|
|
|
|
|
|
|
|
| |||||||||||
Net exposure | (1,726,346 | ) | 188,977 | (475,620 | ) | (78 | ) | 9,145 | ||||||||||||
|
|
|
|
|
|
|
|
|
| |||||||||||
| * | Not including current maturities. |
| ** | Including current maturities. |
F-117
Table of Contents
IC POWER LTD.
Notes to the Consolidated Financial Statements as at December 31, 2015
Note 29—Financial Instruments and Risk Management (cont’d)
C. CPI and foreign currency risks (cont’d)
(1) Exposure to CPI and foreign currency risks (cont’d)
As at December 31, 2014 | ||||||||||||||||||||
Dollar | Foreign currency | |||||||||||||||||||
Shekel | Euro | Other | ||||||||||||||||||
Unlinked | CPI | |||||||||||||||||||
| US$ thousands | ||||||||||||||||||||
Non-derivative instruments | ||||||||||||||||||||
Cash and cash equivalents | 384,514 | 157,940 | — | 203 | 40,639 | |||||||||||||||
Short-term investments, deposits and loans | 172,500 | 30,124 | — | — | 5,022 | |||||||||||||||
Trade receivables | 90,277 | 41,260 | — | — | 49,821 | |||||||||||||||
Other receivables and debit balances | 9,586 | 1,249 | — | — | 36,592 | |||||||||||||||
Deposits, loans and debit balances | 1,140 | — | — | — | 6,210 | |||||||||||||||
|
|
|
|
|
|
|
|
|
| |||||||||||
Total financial assets | 658,017 | 230,573 | — | 203 | 138,284 | |||||||||||||||
|
|
|
|
|
|
|
|
|
| |||||||||||
Credit from banks and others* | (15,000 | ) | — | — | — | (43,137 | ) | |||||||||||||
Trade payables | (62,026 | ) | (55,237 | ) | — | — | (26,376 | ) | ||||||||||||
Other payables and credit balances | (56,985 | ) | (1,881 | ) | — | (56 | ) | (31,248 | ) | |||||||||||
Long-term loans from banks and others and Debentures** | (1,713,683 | ) | (19,060 | ) | (493,168 | ) | — | (63,884 | ) | |||||||||||
|
|
|
|
|
|
|
|
|
| |||||||||||
Total financial liabilities | (1,847,694 | ) | (76,178 | ) | (493,168 | ) | (56 | ) | (164,645 | ) | ||||||||||
|
|
|
|
|
|
|
|
|
| |||||||||||
Total non-derivative financial instruments, net | (1,189,677 | ) | 154,395 | (493,168 | ) | 147 | (26,361 | ) | ||||||||||||
|
|
|
|
|
|
|
|
|
| |||||||||||
Derivative instruments | (36,909 | ) | — | — | — | — | ||||||||||||||
|
|
|
|
|
|
|
|
|
| |||||||||||
Net exposure | (1,226,586 | ) | 154,395 | (493,168 | ) | 147 | (26,361 | ) | ||||||||||||
|
|
|
|
|
|
|
|
|
| |||||||||||
| * | Not including current maturities. |
| ** | Including current maturities. |
(2) Sensitivity analysis
A strengthening at the rate of 5%–10% of the dollar exchange rate against the following currencies would have increased (decreased) the income or loss by the amounts shown below. This analysis assumes that all other variables, in particular interest rates, remain constant. The analysis is performed on the same basis for 2014.
As at December 31, 2015 | ||||||||||||||||
10% increase | 5% increase | 5% decrease | 10% decrease | |||||||||||||
US$ thousands | ||||||||||||||||
Non-derivative instruments | ||||||||||||||||
Shekel/dollar | 40,717 | 21,576 | (24,395 | ) | (52,080 | ) | ||||||||||
Shekel/euro | — | — | — | — | ||||||||||||
Dollar/euro | 8 | 4 | (4 | ) | (8 | ) | ||||||||||
Dollar/other | 1,015 | 481 | (435 | ) | (831 | ) | ||||||||||
CPI | (56,247 | ) | (28,123 | ) | 28,123 | 56,247 | ||||||||||
F-118
Table of Contents
IC POWER LTD.
Notes to the Consolidated Financial Statements as at December 31, 2015
Note 29—Financial Instruments and Risk Management (cont’d)
C. CPI and foreign currency risks (cont’d)
(2) Sensitivity analysis (cont’d)
As at December 31, 2014 | ||||||||||||||||
10% increase | 5% increase | 5% decrease | 10% decrease | |||||||||||||
US$ thousands | ||||||||||||||||
Non-derivative instruments | ||||||||||||||||
Shekel/dollar | 40,110 | 21,286 | (25,237 | ) | (50,865 | ) | ||||||||||
Shekel/euro | 6 | 3 | -3 | -6 | ||||||||||||
Dollar/euro | 20 | 10 | (10 | ) | (20 | ) | ||||||||||
Dollar/other | (2,813 | ) | (1,333 | ) | 1,206 | 2,302 | ||||||||||
CPI | (57,731 | ) | (28,865 | ) | 28,865 | 57,731 | ||||||||||
Set forth below is a sensitivity analysis in connection with the Corporation’s foreign-currency derivative instruments as at December 31, 2015 and December 31, 2014. A change in the exchange rates of the main currencies as at December 31, would have increased (decreased) the income or loss by the amounts shown below. This analysis assumes that all other variables, in particular interest rates, remain constant.
As at December 31, 2015 | ||||||||||||||||
10% increase | 5% increase | 5% decrease | 10% decrease | |||||||||||||
US$ thousands | ||||||||||||||||
Derivative instruments | ||||||||||||||||
Dollar/other | (1,079 | ) | (970 | ) | (718 | ) | (571 | ) | ||||||||
As at December 31, 2014 | ||||||||||||||||
10% increase | 5% increase | 5% decrease | 10% decrease | |||||||||||||
US$ thousands | ||||||||||||||||
Derivative instruments | ||||||||||||||||
Dollar/other | (7,881 | ) | (6,700 | ) | (3,966 | ) | (2,372 | ) | ||||||||
F-119
Table of Contents
IC POWER LTD.
Notes to the Consolidated Financial Statements as at December 31, 2015
Note 29—Financial Instruments and Risk Management (cont’d)
D. Interest rate risk
(1) Type of interest
Set forth below is detail of the type of interest borne by the Group’s interest-bearing financial instruments:
As at December 31 | ||||||||
2015 | 2014 | |||||||
Carrying amount | ||||||||
US$ thousands | ||||||||
Fixed rate instruments | ||||||||
Financial assets | 401,671 | 239,629 | ||||||
Financial liabilities | (1,431,787 | ) | (1,479,700 | ) | ||||
|
|
|
| |||||
| (1,030,116 | ) | (1,240,071 | ) | |||||
|
|
|
| |||||
Variable rate instruments | ||||||||
Financial assets | 29,363 | 26,682 | ||||||
Financial liabilities | (1,132,904 | ) | (849,172 | ) | ||||
|
|
|
| |||||
| (1,103,541 | ) | (822,490 | ) | |||||
|
|
|
| |||||
(2) Fair value sensitivity analysis for fixed-rate instruments
The Group’s assets and liabilities bearing fixed interest are not measured at fair value through the statement of income, and the Group does not designate derivatives (interest rate swaps) as hedging instruments under a fair value hedge accounting model. Therefore, a change in the interest rates as at the date of the report would not be expected to affect the income or loss in respect of changes in the value of fixed-interest assets and liabilities.
(3) Cash flow sensitivity analysis for variable rate instruments
This analysis assumes that all other variables, in particular foreign currency rates, remain constant. The analysis is performed on the same basis for 2014.
As at December 31, 2015 | ||||||||||||||||
Impact on income or loss | ||||||||||||||||
1% decrease | 0.5% decrease | 0.5% increase | 1% increase | |||||||||||||
US$ thousands | ||||||||||||||||
Non-derivative instruments | (2,490 | ) | (1,244 | ) | 1,241 | 2,480 | ||||||||||
|
|
|
|
|
|
|
| |||||||||
As at December 31, 2014 | ||||||||||||||||
Impact on income or loss | ||||||||||||||||
1% decrease | 0.5% decrease | 0.5% increase | 1% increase | |||||||||||||
in interest | in interest | in interest | in interest | |||||||||||||
US$ thousands | ||||||||||||||||
Non-derivative instruments | (39,200 | ) | (19,039 | ) | 17,987 | 34,988 | ||||||||||
|
|
|
|
|
|
|
| |||||||||
F-120
Table of Contents
IC POWER LTD.
Notes to the Consolidated Financial Statements as at December 31, 2015
Note 29—Financial Instruments and Risk Management (cont’d)
E. Fair value
(1) Fair value compared with book value
The Group’s financial instruments mostly include non-derivative assets, such as: cash and cash equivalents, investments, deposits and short-term loans, receivables and debit balances, investments and long-term receivables; non-derivative liabilities: such as: short-term credit, payables and credit balances, long-term loans and other liabilities; as well as derivative financial instruments.
Due to their nature, the fair value of the financial instruments included in the Group’s working capital is generally identical or approximates the value, according to which they are stated in the accounts. The fair value of the long-term deposits and receivables and the long-term liabilities also approximates their stated value, as these financial instruments bear interest at a rate that approximates the accepted market rate of interest.
(2) Fair Value of Financial Assets and Liabilities
Accounting standards define a financial instrument as cash, ownership in an entity, or a contract by means of which the contractual right or obligation to receive or deliver cash or another financial instrument has been vested in or imposed on an entity. Fair value is defined as the amount for which an asset could be exchanged or liability settled, between knowledgeable, willing parties in an arm’s length transaction, assuming a going concern.
When a financial instrument is traded in an active and liquid market, its quoted market price in an actual transaction provides the best evidence of its fair value.
When a quoted market price is not available, or may not be indicative of the fair value of the instrument, to determine such fair value, the current market value of another instrument that is substantially similar, discounted cash flow analysis or other estimation techniques may be used, all of which are significantly affected by assumptions used.
Although Management uses its best judgment in estimating the fair value of these financial instruments, there are inherent weaknesses in any estimation technique. As a result, the fair value may not be indicative of the net realizable or liquidation value.
As of December 31, 2015 and 2014, management considers that the book values of the financial instruments do not differ significantly from their estimated fair values; based on the methodologies and assumptions mentioned below:
| • | Cash and cash equivalent items and short-term deposits do not represent a credit risk or significant interest rate risk. Therefore, it has been assumed that their carrying value is approximate to their market value. |
| • | Derivative financial instruments are recorded at their estimated market value; therefore, there are no differences between their carrying value and their estimated market value. |
| • | For accounts receivable and payable with a maturity of less than one year, it has been considered that their fair values are not significantly different from their carrying values. |
F-121
Table of Contents
IC POWER LTD.
Notes to the Consolidated Financial Statements as at December 31, 2015
Note 29—Financial Instruments and Risk Management (cont’d)
E. Fair value (cont’d)
(2) Fair Value of Financial Assets and Liabilities (cont’d)
| • | For short term loans and long-term interest bearing borrowings that accrue interest contracted at fixed rates, it has been estimated that their book value does not differ significantly from their market value, insofar as the interest rates of loans in effect do not differ significantly compared to year-end market interest rates. |
(3) Hierarchy of fair value
The following table presents an analysis of the financial instruments measured at fair value, using an evaluation method. The various levels were defined as follows:
| • | Level 1: Quoted prices (not adjusted) in an active market for identical instruments. |
| • | Level 2: Observed data, direct or indirect, not included in Level 1 above. |
As at December 31, 2015 | ||||||||||||
Level 1 | Level 2 | Total | ||||||||||
US$ thousands | ||||||||||||
Liabilities | ||||||||||||
Derivatives used for hedging | — | (44,909 | ) | (44,909 | ) | |||||||
Derivatives not used for hedging | — | (3,276 | ) | (3,276 | ) | |||||||
Assets | ||||||||||||
Derivatives not used for hedging (a) | — | 2,864 | 2,864 | |||||||||
As at December 31, 2014 | ||||||||||||
| Level 1 | Level 2 | Total | ||||||||||
US$ thousands | ||||||||||||
Liabilities | ||||||||||||
Derivatives used for hedging | — | (33,115 | ) | (33,115 | ) | |||||||
Derivatives not used for hedging | — | (4,116 | ) | (4,116 | ) | |||||||
Assets | ||||||||||||
Derivatives not used for hedging | — | 322 | 322 | |||||||||
| (a) | Includes US$2,703 thousand AIE’s embedded derivative not used for hedging. This embedded derivative corresponds to the fair value of AIE’s gas agreement which lets AIE to resell its not-used gas on the corresponding market to a third party |
(4) Accounting classifications and fair values
The following table shows the carrying amounts and fair values of financial assets and financial liabilities, including their levels in the fair value hierarchy. It does not include fair value information for financial assets and financial liabilities not measured at fair value if the carrying amount is a reasonable approximation of fair value.
F-122
Table of Contents
IC POWER LTD.
Notes to the Consolidated Financial Statements as at December 31, 2015
Note 29—Financial Instruments and Risk Management (cont’d)
E. Fair value (cont’d)
(4) Accounting classifications and fair values (cont’d)
The fair value measurements have been categorized as Level 2 based on market comparison technique. The fair values are based on quotes. Similar contracts are traded in an active market and the quotes reflect the actual transactions in similar instruments.
In thousands of U.S. dollars | ||||||||||||||||||||||||||||||||||||||||||||||||||||
Carrying amount | Fair Value | |||||||||||||||||||||||||||||||||||||||||||||||||||
| Note | Held-for | Designated | Fair value – instruments | Held-to- maturity | Loan and | Available | Other | Total | Level 1 | Level 2 | Level 3 | Total | ||||||||||||||||||||||||||||||||||||||||
31 December 2015 | ||||||||||||||||||||||||||||||||||||||||||||||||||||
Financial assets measured at fair value | ||||||||||||||||||||||||||||||||||||||||||||||||||||
Interest rate swap not used for hedging | 161 | — | — | — | — | — | — | 161 | — | 161 | — | 161 | ||||||||||||||||||||||||||||||||||||||||
Embedded derivative not used for hedging | 2,703 | — | — | — | — | — | — | 2,703 | — | 2,703 | — | 2,703 | ||||||||||||||||||||||||||||||||||||||||
|
|
|
|
|
|
|
|
|
|
|
|
|
|
|
|
|
|
|
|
|
|
|
| |||||||||||||||||||||||||||||
| 2,864 | — | — | — | — | — | — | 2,864 | — | 2,864 | — | 2,864 | |||||||||||||||||||||||||||||||||||||||||
|
|
|
|
|
|
|
|
|
|
|
|
|
|
|
|
|
|
|
|
|
|
|
| |||||||||||||||||||||||||||||
Financial assets not measured at fair value | ||||||||||||||||||||||||||||||||||||||||||||||||||||
Cash and cash equivalents | — | — | — | — | 359,587 | — | — | 359,587 | — | — | — | — | ||||||||||||||||||||||||||||||||||||||||
Short term deposits and restricted cash | — | — | — | — | 301,955 | — | — | 301,955 | — | — | — | — | ||||||||||||||||||||||||||||||||||||||||
Trade receivables | — | — | — | — | 123,273 | — | — | 123,273 | — | — | — | — | ||||||||||||||||||||||||||||||||||||||||
Other receivables and debit balances | — | — | — | — | 12,467 | — | — | 12,467 | — | — | — | — | ||||||||||||||||||||||||||||||||||||||||
Deposits, loans and debit balances, excluding derivatives | — | — | — | — | 37,980 | — | — | 37,980 | — | — | — | — | ||||||||||||||||||||||||||||||||||||||||
Interest rate swap not used for hedging | — | — | — | — | — | — | — | — | — | — | — | — | ||||||||||||||||||||||||||||||||||||||||
|
|
|
| �� |
|
|
|
|
|
|
|
|
|
|
|
|
|
|
|
|
|
|
|
| ||||||||||||||||||||||||||||
| — | — | — | — | 835,262 | — | — | 835,262 | — | — | — | — | |||||||||||||||||||||||||||||||||||||||||
|
|
|
|
|
|
|
|
|
|
|
|
|
|
|
|
|
|
|
|
|
|
|
| |||||||||||||||||||||||||||||
Financial liabilities measured at fair value | ||||||||||||||||||||||||||||||||||||||||||||||||||||
Interest rate swap used for hedging | — | — | 44,059 | — | — | — | — | 44,059 | — | 44,059 | — | 44,059 | ||||||||||||||||||||||||||||||||||||||||
Forward exchange contracts used for hedging | — | — | 850 | — | — | — | — | 850 | — | 850 | — | 850 | ||||||||||||||||||||||||||||||||||||||||
Interest rate swap not used for hedging | 3,276 | — | — | — | — | — | — | 3,276 | — | 3,276 | — | 3,276 | ||||||||||||||||||||||||||||||||||||||||
Forward exchange contracts not used for hedging | — | — | — | — | — | — | — | — | — | — | — | — | ||||||||||||||||||||||||||||||||||||||||
|
|
|
|
|
|
|
|
|
|
|
|
|
|
|
|
|
|
|
|
|
|
|
| |||||||||||||||||||||||||||||
| 3,276 | — | 44,909 | — | — | — | — | 48,185 | — | 48,185 | — | 48,185 | |||||||||||||||||||||||||||||||||||||||||
|
|
|
|
|
|
|
|
|
|
|
|
|
|
|
|
|
|
|
|
|
|
|
| |||||||||||||||||||||||||||||
Financial liabilities not measured at fair | ||||||||||||||||||||||||||||||||||||||||||||||||||||
Loan from banks and others | — | — | — | — | — | — | 1,729,669 | 1,729,669 | — | 1,944,570 | — | 1,944,570 | ||||||||||||||||||||||||||||||||||||||||
Liabilities in respect of finance leases | — | — | — | — | — | — | 163,774 | 163,774 | — | 175,957 | — | 175,957 | ||||||||||||||||||||||||||||||||||||||||
Debentures | — | — | — | — | — | — | 671,247 | 671,247 | — | 764,878 | — | 764,878 | ||||||||||||||||||||||||||||||||||||||||
Loan from former parent company | — | — | — | — | — | — | — | — | — | — | — | — | ||||||||||||||||||||||||||||||||||||||||
Trade payables | — | — | — | — | — | — | 143,958 | 143,958 | — | — | — | — | ||||||||||||||||||||||||||||||||||||||||
Other payables and credit balances | — | — | — | — | — | — | 85,215 | 85,215 | — | — | — | — | ||||||||||||||||||||||||||||||||||||||||
|
|
|
|
|
|
|
|
|
|
|
|
|
|
|
|
|
|
|
|
|
|
|
| |||||||||||||||||||||||||||||
| — | — | — | — | — | — | 2,793,863 | 2,793,863 | — | 2,885,405 | — | 2,885,405 | |||||||||||||||||||||||||||||||||||||||||
|
|
|
|
|
|
|
|
|
|
|
|
|
|
|
|
|
|
|
|
|
|
|
| |||||||||||||||||||||||||||||
F-123
Table of Contents
IC POWER LTD.
Notes to the Consolidated Financial Statements as at December 31, 2015
Note 29—Financial Instruments and Risk Management (Cont’d)
E. Fair value (cont´d)
(4) Accounting classifications and fair values (cont´d)
In thousands of U.S. dollars | ||||||||||||||||||||||||||||||||||||||||||||||||||||
Carrying amount | Fair Value | |||||||||||||||||||||||||||||||||||||||||||||||||||
| Note | Held-for trading | Designated value | Fair value – instruments | Held-to- maturity | Loan and | Available for-sale | Other financial | Total | Level 1 | Level 2 | Level 3 | Total | ||||||||||||||||||||||||||||||||||||||||
31 December 2014 | ||||||||||||||||||||||||||||||||||||||||||||||||||||
Financial assets measured at fair value | ||||||||||||||||||||||||||||||||||||||||||||||||||||
Interest rate swap not used for hedging | 322 | — | — | — | — | — | — | 322 | — | 322 | — | 322 | ||||||||||||||||||||||||||||||||||||||||
|
|
|
|
|
|
|
|
|
|
|
|
|
|
|
|
|
|
|
|
|
|
|
| |||||||||||||||||||||||||||||
| 322 | — | — | — | — | — | — | 322 | — | 322 | — | 322 | |||||||||||||||||||||||||||||||||||||||||
Financial assets not measured at fair value | ||||||||||||||||||||||||||||||||||||||||||||||||||||
Cash and cash equivalents | — | — | — | — | 583,296 | — | — | 583,296 | — | — | — | — | ||||||||||||||||||||||||||||||||||||||||
Short term deposits and restricted cash | — | — | — | — | 207,646 | — | — | 207,646 | — | — | — | — | ||||||||||||||||||||||||||||||||||||||||
Trade receivables | — | — | — | — | 181,358 | — | — | 181,358 | — | — | — | — | ||||||||||||||||||||||||||||||||||||||||
Other receivables and debit balances | — | — | — | — | 47,427 | — | — | 47,427 | — | — | — | — | ||||||||||||||||||||||||||||||||||||||||
Deposits, loans and debit balances, excluding derivatives | — | — | — | — | 7,350 | — | — | 7,350 | — | — | — | — | ||||||||||||||||||||||||||||||||||||||||
|
|
|
|
|
|
|
|
|
|
|
|
|
|
|
|
|
|
|
|
|
|
|
| |||||||||||||||||||||||||||||
| — | — | — | — | 1,027,077 | — | — | 1,027,077 | — | — | — | — | |||||||||||||||||||||||||||||||||||||||||
|
|
|
|
|
|
|
|
|
|
|
|
|
|
|
|
|
|
|
|
|
|
|
| |||||||||||||||||||||||||||||
Financial liabilities measured at fair value | ||||||||||||||||||||||||||||||||||||||||||||||||||||
Interest rate swap used for hedging | — | — | 27,713 | — | — | — | — | 27,713 | — | 27,713 | — | 27,713 | ||||||||||||||||||||||||||||||||||||||||
Forward exchange contracts used for hedging | — | — | 5,402 | — | — | — | — | 5,402 | — | 5,402 | — | 5,402 | ||||||||||||||||||||||||||||||||||||||||
Interest rate swap not used for hedging | 4,116 | — | — | — | — | — | — | 4,116 | — | 4,116 | — | 4,116 | ||||||||||||||||||||||||||||||||||||||||
Forward exchange contracts not used for hedging | — | — | — | — | — | — | — | — | — | — | — | — | ||||||||||||||||||||||||||||||||||||||||
|
|
|
|
|
|
|
|
|
|
|
|
|
|
|
|
|
|
|
|
|
|
|
| |||||||||||||||||||||||||||||
| 4,116 | — | 33,115 | — | — | — | — | 37,231 | — | 37,231 | — | 37,231 | |||||||||||||||||||||||||||||||||||||||||
|
|
|
|
|
|
|
|
|
|
|
|
|
|
|
|
|
|
|
|
|
|
|
| |||||||||||||||||||||||||||||
Financial liabilities not measured at fair | ||||||||||||||||||||||||||||||||||||||||||||||||||||
Loan from banks and others | — | — | — | — | — | — | 1,450,442 | 1,450,442 | — | 1,564,217 | — | 1,564,217 | ||||||||||||||||||||||||||||||||||||||||
Liabilities in respect of finance leases | — | — | — | — | — | — | 193,538 | 193,538 | — | 212,835 | — | 212,835 | ||||||||||||||||||||||||||||||||||||||||
Debentures | — | — | — | — | — | — | 703,952 | 703,952 | — | 819,572 | — | 819,572 | ||||||||||||||||||||||||||||||||||||||||
Loan from former parent company | — | — | — | — | — | — | 592 | 592 | — | — | — | — | ||||||||||||||||||||||||||||||||||||||||
Trade payables | — | — | — | — | — | — | 143,639 | 143,639 | — | — | — | — | ||||||||||||||||||||||||||||||||||||||||
Other payables and credit balances | — | — | — | — | — | — | 89,578 | 89,578 | — | — | — | — | ||||||||||||||||||||||||||||||||||||||||
|
|
|
|
|
|
|
|
|
|
|
|
|
|
|
|
|
|
|
|
|
|
|
| |||||||||||||||||||||||||||||
| — | — | — | — | — | — | 2,581,741 | 2,581,741 | — | 2,596,624 | — | 2,596,624 | |||||||||||||||||||||||||||||||||||||||||
|
|
|
|
|
|
|
|
|
|
|
|
|
|
|
|
|
|
|
|
|
|
|
| |||||||||||||||||||||||||||||
F-124
Table of Contents
IC POWER LTD.
Notes to the Consolidated Financial Statements as at December 31, 2015
Note 29—Financial Instruments and Risk Management (Cont’d)
E. Fair value (cont’d)
(5) Measurement of fair values
The following table shows the valuation techniques used in measuring Level 2 fair values as at December 31, 2015 and 2014, as well as the significant unobservable inputs used.
Type | Valuation technique | Significant | Inter-relationship | |||
| Interest rate Swaps | The group applies standard valuation techniques such as:discounted cash flowsfor fixed and variables coupons (estimated with forward curves) using as discounted rates theprojected LIBORzero coupon curve. The observable inputs are obtained through market information suppliers. | Not applicable | Not applicable | |||
| Foreign Exchange Forwards | The Group applies standard valuation techniques which include market observable parameters such as the implicit exchange rate calculated with forward points. These variables are obtained through market information suppliers. | Not applicable | Not applicable | |||
| Credit from banks, others and debentures | Discounted cash flows with market interest rate | Not applicable | Not applicable | |||
F-125
Table of Contents
IC POWER LTD.
Notes to the Consolidated Financial Statements as at December 31, 2015
Note 30—Commitments
(a)IC Power Ltd
As of December 31, 2015, IC Power has issued guarantees for a total amount of US$ 42,349 thousand, as follows:
Guarantee party | Description | Amount | Amount | Cash | ||||||||||
OPC Rotem Ltd. | Exposure of non-payment default | |||||||||||||
| resulting from “Ex post payments” | 12,000 | 3,184 | — | |||||||||||
OPC Rotem Ltd. | Facility agreement (1) | 45,000 | 11,940 | 22,500 | ||||||||||
OPC Rotem Ltd. | Ensure payments of IPP Rotem Operation and Maintenance Ltd. | — | 350 | — | ||||||||||
OPC Rotem Ltd. | PUA/EA Standards requirements— | |||||||||||||
| infrastructure services | 38,595 | 10,240 | — | |||||||||||
OPC Rotem Ltd. | PUA/EA Standards requirements— | |||||||||||||
| infrastructure services | 32,235 | 8,553 | — | |||||||||||
Advanced Integrated Energy Ltd. | Conditional license | 822 | 218 | — | ||||||||||
Advanced Integrated Energy Ltd. | INGL agreement | 295 | 78 | — | ||||||||||
Advanced Integrated Energy Ltd. | GSPA agreement | — | 6,600 | — | ||||||||||
Advanced Integrated Energy Ltd. | Supply and generation licenses | 4,471 | 1,186 | — | ||||||||||
| (1) | On December 2014, in light of the Israel Corporation Ltd. split, the corporate guarantee issued by IC was replaced and a cash collateral deposited into a designated pledged account of OPC. |
(b)Inkia Energy Ltd
As of December 31, 2015, Inkia has issued standard by letters of credit for a total amount of US$ 94,240 thousand for guarantee, as follows:
Guarantee party | Description | Amount thousand) | Cash | |||||||
Kanan overseas I, Inc | Power Purchase agreement | 18,334 | 9,220 | (1) | ||||||
Kanan overseas I, Inc | Storage and handling agreement | 600 | — | |||||||
Lihuen S.A. | Bid Process in Chile | 1,300 | 902 | (2) | ||||||
Samay I S.A. | Bond performance | 15,000 | — | |||||||
Cerro del Aguila S.A. | Contingent equity for over costs | 36,701 | — | |||||||
Kanan overseas I, Inc | Construction execution | 9,200 | — | |||||||
Kanan overseas I, Inc | Bid process in Panama | 2,475 | — | |||||||
Kanan overseas II, Inc | Bid process in Panama | 8,750 | — | |||||||
Cerro del Aguila S.A. | Power Purchase agreement | 376 | — | |||||||
Cerro del Aguila S.A. | Power Purchase agreement | 1,504 | — | |||||||
F-126
Table of Contents
IC POWER LTD.
Notes to the Consolidated Financial Statements as at December 31, 2015
Note 30—Commitments (cont’d)
(b)Inkia Energy Ltd (cont’d)
| (1) | Present as part of restricted cash non-current in the consolidated statement of financial position |
| (2) | Cash collateral for storage and handling agreement and Bid process in Chile |
(c)Cobee, Bolivia
Concession from the Bolivia Government
As of December 2010, COBEE was engaged in the generation of electricity under a concession granted to it by the Government of Bolivia, in October 1990 for a period of 40 years. The Bolivian government unilaterally transformed by supreme decree, all concessions to generate, transmit and distribute electricity to special temporary licenses. However, to date, the government has not issued regulations nor approved any procedure or guideline to convert such special temporary licenses into permanent licenses.
Power Purchase Agreement (PPA)
In March 2008, COBEE signed a long-term PPA agreement with Minera San Cristobal. Pursuant to the agreement, COBEE will supply 43 MW of availability and energy, commencing from December 22, 2008. The PPA agreement provides a fixed price for availability, and an energy price that is linked to the price of natural gas for production of electricity in Bolivia. Surplus energy and availability are sold in the spot market. The PPA agreement is scheduled to expire in 2017.
In December 2011, the Bolivian Government amended the applicable law to prohibit generation companies from entering new PPAs. Therefore, COBEE will be unable to extend or replace this PPA.
(d)Kallpa, Peru
Power Purchase Agreements (PPA)
As of December 31, 2015, Kallpa has entered into twenty seven PPAs with unregulated consumers to provide capacity and the associated energy of 522 MW (twenty three PPAs of 510 MW as of December 31, 2014). These contracts have various commencement dates, and vary in duration between 2013 and 2028. Also, as of December 31, 2015, Kallpa has signed twenty eight PPAs with 8 distribution companies for 660 MW (thirteen PPAs with 7 distribution companies for 580 MW as of December 31, 2014).
The Peruvian market functions on the marginal cost method in which the generators bid their marginal cost to the market regulator who instructs the most efficient generators to produce electricity for the system. In the event Kallpa is not capable to meet its commitments under the contracts, Kallpa will be required to purchase energy in the spot market.
Gas Supply and Transportation
Kallpa purchases natural gas for its generation facilities from the Camisea consortium under an exclusive natural gas supply agreement dated January 2, 2006, as amended. Under this agreement, the Camisea Consortium agreed to supply Kallpa’s natural gas requirements, subject to a daily maximum amount and Kallpa agreed to acquire natural gas exclusively from the Camisea Consortium.
F-127
Table of Contents
IC POWER LTD.
Notes to the Consolidated Financial Statements as at December 31, 2015
Note 30—Commitments (cont’d)
(d)Kallpa, Peru (cont’d)
Gas Supply and Transportation (cont’d)
The Camisea consortium is obligated to provide a maximum of 4,250,000 cubic meters of natural gas per day to our Kallpa plant and Kallpa is obligated to purchase a minimum of approximately 2,225,000 cubic meters of natural gas per day as follows:
Cubic meters per day | ||||||||
To be provided by | Minimum | |||||||
First gas turbine | 1,200,000 | 648,000 | ||||||
Second gas turbine | 1,300,000 | 702,000 | ||||||
Third gas turbine | 1,300,000 | 650,000 | ||||||
Combined cycle | 450,000 | 225,000 | ||||||
|
|
|
| |||||
Total | 4,250,000 | 2,225,000 | ||||||
|
|
|
| |||||
In the event that Kallpa does not consume the contracted minimum on any given day, Kallpa is permitted to use that lacking quantity on any day during the course of the following 18 months from the day of under-consumption.
The price that Kallpa pays to the Camisea consortium for the natural gas supplied is based on a base price in U.S. dollars set on the date of the agreement, indexed monthly based on a basket of market prices for heavy fuel oil, with discounts available based on the volume of natural gas consumed. This agreement expires in June 2022.
Kallpa’s natural gas transportation services are rendered by Transportadora de Gas del Peru S.A. (TGP) pursuant to a natural gas firm transportation agreement dated December 2007, as amended. In April 2014, this agreement was further modified to include the transportation agreement between Duke Energy Egenor S. en C. por A. and Las Flores. Pursuant to the modified agreement, TGP is obligated to transport up to 3,354,182 cubic meters of natural gas per day from the Camisea Consortium’s delivery point located at the Camisea natural gas fields to Kallpa’s facilities. This obligation will be reduced, first, by approximately 199,312 cubic meters per day beginning in March 2020 and, second, 206,039 cubic meters per day beginning in April 2030 as follows:
Cubic meters | ||||
From August 14, 2010 to March 31, 2014 | 3,154,870 | |||
From April 1, 2014 to March 20, 2020 | 3,354,182 | |||
From March 21, 2020 to March 31, 2030 | 3,154,870 | |||
From April 1, 2030 to December 31, 2033 | 2,948,831 | |||
This agreement expires in December 2033. Additionally, Kallpa is party to two additional gas transportation agreements, to become effective at the completion of the expansion of TGP’s pipeline facilities (which is currently expected to occur during the second half of 2016). Pursuant to the first agreement, TGP will be obligated to transport up to 565,130 cubic meters of natural gas per day from
F-128
Table of Contents
IC POWER LTD.
Notes to the Consolidated Financial Statements as at December 31, 2015
Note 30—Commitments (cont’d)
(d)Kallpa, Peru (cont’d)
Gas Supply and Transportation (cont’d)
the Camisea Consortium’s delivery point located at the Camisea natural gas fields to Kallpa’s facilities. This agreement expires in April 2030. Pursuant to the second agreement, TGP will be obligated to transport up to 935,000 cubic meters of natural gas per day from the Camisea Consortium’s delivery point located at the Camisea natural gas fields to Kallpa’s facilities. This agreement expires in April 2033. Additionally on April 1, 2014, Kallpa entered into an agreement with TGP to cover the period up to the completion of the expansion of TGP’s pipeline facilities. Pursuant to this agreement, TGP is obligated to transport up to 120,679 cubic meters of natural gas per day from the Camisea Consortium’s delivery point located at the Camisea natural gas fields to Kallpa’s facilities. Pursuant to the terms of each of these agreements, Kallpa pays a regulated tariff approved by the OSINERGMIN (Power Regulatory Entity in Peru).
(e)Samay I, Peru
Power Node Bid Awarded
On November 29, 2013, Samay I won one of the public bid auctions promoted by the Peruvian Investment Promotion Agency (“Proinversion”) to build an open cycle diesel and natural gas (dual-fired) thermoelectric plant in Mollendo, Arequipa (southern Peru), with an installed capacity of approximately 600MW. The project has two operational stages: (i) cold reserve plant operating in diesel until natural gas becomes available in the area; and (ii) natural gas-fired power plant operating once a new natural gas pipeline is built and natural gas is available. The agreement with the Peruvian government is for a 20-year period with fixed monthly capacity payments and pass-through of all variable costs during the cold reserve phase.
The total investment for this plant is expected to be around US$ 380 million and to be funded with around 82% of debt and the remaining 18% with equity. The power plant is required to enter into commercial operation no later than April 30, 2016. As of December 31,2015, Samay I has reached a level of completion of 97%.
(f) CDA, Peru
Power Purchase Agreements (PPA)
As of December 31, 2015, CDA has entered into three PPAs and the associated energy of 483 MW of capacity. A 15-year PPA with ElectroPerú to provide 200 MW of capacity and the associated energy that commences during second half of 2016, a 10-year PPA with distribution companies (Luz del Sur S.A.A., Edelnor and Edecañete) awarded in December 2011 to provide 202 MW of capacity and the associated energy that commences in January 2018 with final expiration in December 2030, and a10-year PPA with Edelnor awarded in December 2015 to provide 83 MW of capacity and the associated energy that commences in January 2022 with final expiration in December 2031.
(g)OPC, Israel
Power Purchase Agreements (PPA)
On November 2, 2009, OPC signed a power purchase agreement (“the PPA”) with Israel Electric Company Ltd. (“IEC”) whereby OPC undertook to construct a power plant within 49-52 months from
F-129
Table of Contents
IC POWER LTD.
Notes to the Consolidated Financial Statements as at December 31, 2015
Note 30—Commitments (cont’d)
(g)OPC, Israel (cont’d)
Power Purchase Agreements (PPA) (cont’d)
the PPA signing date, while IEC undertook to purchase capacity and energy from OPC over a period of twenty (20) years from the commencement date of commercial operation (“COD”) of the plant. The PPA is a “capacity and energy” agreement, meaning, a right of OPC to provide the plant’s entire production capacity to IEC and to produce electricity in the quantities and on the dates as required by IEC.
Power Purchase Agreements with end users
The PPA with IEC provides OPC with the option to allocate and sell the generated electricity of the power station directly to end users. OPC has exercised this option and sells all of its energy and capacity directly to end users. Most of the agreements are for a period of 10 years. The consideration, tariff, are set based on the TAOZ, the generation component of the time-of-use electricity tariff, less a discount from the generation component. Both the TAOZ and the generation component are determined by the Public Utility Authority - Electricity (PUA) and are updated from time to time.
If the consideration is less than a minimum tariff of the generation component, the Company has the right to terminate the agreements.
Natural supply gas agreement
On November 25, 2012, OPC signed an agreement with Noble Energy Mediterranean Ltd., Delek Drilling Limited Partnership, Isramco Negev 2 Limited Partnership, Avner Oil Exploration Limited Partnership and Dor Gas Exploration Limited Partnership (“Tamar Partners”) regarding the natural gas supply to the power plant. The agreement shall terminate upon the earlier of: a 16 years term as from the date of gas flow to the power plant or until OPC has consumed the entire contractual quantity. In addition, each party has the right to extend the period of the agreement for a period of up two additional years under certain conditions or until the date of consuming the total contract quantity, whichever is earlier (the “Tamar Agreement”).
The price of the gas is linked to changes in the “Production Cost” Tariff, which is part of the TAOZ, and partially linked to the USD representative exchange rate, and includes “a floor price”. According to the Agreement, OPC shall purchase natural gas with a total contractual quantity of 10.6 BCM (billions of cubic meters). OPC is under a “take or pay” obligation regarding a certain annual quantity of natural gas based on a mechanism set forth in the Tamar Agreement. The Tamar Agreement contains certain conditions that provide in the future flexibility to reduce the minimum annual quantity.
On December 28, 2015 the agreement received the Israeli Antitrust Authority, (“Authority”) approval.
In July 2013 the PUA published a Decision updating the existing “Production Cost” Tariff by indicating two new tariffs. The PUA indicated in the Decision that the existing “Production Cost” Tariff shall be replaced by the tariff equal to 33.32 Agurot/KWh. On September 3, 2013 the Tamar Partners informed the Company that following their review of the new tariffs, they concluded that the relevant tariff for calculating the natural gas price was 38.60 Agurot/KWh (which is the second tariff
F-130
Table of Contents
IC POWER LTD.
Notes to the Consolidated Financial Statements as at December 31, 2015
Note 30—Commitments (cont’d)
(g)OPC, Israel (cont’d)
Natural supply gas agreement (cont’d)
published by the PUA in its July 2013 Decision), and therefore the contract price for the natural gas should be calculated accordingly. Based on the clarification published by the PUA on October 20, 2013, stating that the definition replacing the “Production Cost” Tariff reflects a tariff equal to 33.32 Agurot/KWh and the Company legal advisors, the Company is of the opinion that the lower tariff in the amount of 33.32 Agurot/KWh shall apply for the purpose of calculating the contract price under the natural gas supply agreement and therefore rejects the Tamar Partners’ position and does not include a provision in the financial statements.
In January 2015 the PUA updated the generation component of the time-of-use electricity tariff (TAOZ). This tariff is the basis for the price calculation between OPC and the end users, and for the natural gas price indexation according to the gas purchase agreement. According to the tariff update, the generation component will be divided into a number of different tariffs. In this decision, the PUA clarified that the generation component that replaces the former component is 33.32 Agurot/Kwh. The weighted average generation component according the update is 30.09 Agurot/Kwh. As a result of this adjustment, the generation component was reduced by approximately 10% starting February 2015.
Israeli Electricity Reform
In July 2013, the Government of Israel appointed a steering committee ( “the Steering Committee”) for the purpose to reform IEC and the Israeli electricity industry. Pursuant to the document appointing the Steering Committee, its tasks include examination of the optimum structure for the electricity industry and IEC, while placing emphasis on the encouragement of competition in the electricity industry, ensuring the financial strength of IEC, consideration of an efficiency plan for IEC and a proposal of an overall reform for the electricity industry and IEC. At the end of December 2015 no final decision as to the manner and nature of the reform of IEC and the electricity market has been determined by the Israeli government.
System Management Charges
In August 2015, Israel’s Public Utilities Authority (the PUA) published a Decision that Independent Power Producers (IPPs) in Israel would be obligated to pay the system management service charges, retroactively effective as of June 1, 2013. According to the PUA Decision, the amount of the system management service charges payable by OPC from the effective date of July 6, 2013 to June 2015, is approximately NIS 163 million (approximately US$43 million), including interest rate and linkage costs.
In the financial statements for 2014 OPC recorded a provision for system management service charges and diesel surcharges in the aggregate amount of US$70 million as of December 31, 2014. In the Company’s opinion, due to the PUA decision, it is more likely than not that OPC will not be charged more than the amount that was indicated in the August 2015 PUA Decision. Therefore, OPC revised the provision as of December 31, 2014 such that the total balance as of December 31, 2014 is US$27 million and the total balanced equaled approximately US$43 million by June 2015.
In August 2015 the PUA published for public hearings a tariff update. Such tariff reflects a decline in the average tariff by approximately 7%. OPC charges privately negotiated tariffs to sell electricity to end users
F-131
Table of Contents
IC POWER LTD.
Notes to the Consolidated Financial Statements as at December 31, 2015
Note 30—Commitments (cont’d)
(g)OPC, Israel (cont’d)
System Management Charges (cont’d)
under its PPAs. Such tariffs are expressed as a discount to the generation component tariff included within the PUA tariff, therefore a decline in public tariffs will result in a corresponding decline in OPC’s tariffs and accordingly its revenues. OPC’s main cost of sales is natural gas and prices for the natural gas under the supply agreement with the Tamar Group are indexed to the PUA generation component tariff and NIS/US$ exchange rate. However the supply agreement also contains a floor price and as a result of above mentioned declines in the PUA generation component tariff, OPC will soon begin to pay the floor price, which will result in a decline in OPC’s margins. The new tariffs became effective as of September 9, 2015.
(h)Nejapa El Salvador
Power Purchase Agreement
In May 2013, Nejapa entered into two PPAs that were awarded as a result of two tenders for 71.2 MW and 38.8 MW of capacity, with 54-month and 48-month terms, respectively. Each PPA was divided among the seven distribution companies that conducted the tenders. The term of each PPA commenced in August 2013.
In December 2014, Nejapa entered into PPA with seven distribution companies for 30 MW of capacity with 36-month term starting from January 2015.
(i) Poliwatt, Guatemala
Power Purchase Agreements (PPA)
As of December 31, 2015, Poliwatt has entered into twelve PPAs to provide capacity and energy of 166 MW. These contracts have various commencement dates, and vary in duration between 2016 and 2017.
(j) IC Power Nicaragua, Nicaragua
Power Purchase Agreements (PPA)
As of December 31, 2015, Tipitapa Power Company and Empresa Energetica Corinto have entered into two PPAs with Distribuidora de Electricidad del Norte (“DISNORTE”) and Distribuidora de Electricidad del Sur (“DISSUR”) to supply and sell energy and capacity.
In addition, Consorcio Eólico Amayo and Consorcio Eólico Amayo (Fase II) also entered into PPAs with these distribution companies, and are committed to supply and sell all the energy at the supply node as part of the wholesale market.
(k)IC Power Nicaragua, Nicaragua
Power Purchase Agreements
These contracts have various commencement dates, and vary in duration, as follows:
Company | Commencement | Expiration | Contracted | |||
Tipitapa Power Company | June 1999 | December 2018 | 51 | |||
Empresa Energetica Corinto | April 1999 | December 2018 | 50 | |||
Consorcio Eólico Amayo | March 2009 | March 2024 | 40 | |||
Consorcio Eólico Amayo (Fase II) | March 2010 | March 2025 | 23 |
F-132
Table of Contents
IC POWER LTD.
Notes to the Consolidated Financial Statements as at December 31, 2015
Note 30—Commitments (cont’d)
(l) Kanan Overseas I, Inc, Panama
Power Purchase Agreement
In October 2014, Kanan was awarded a contract to supply energy with a maximum contractual capacity of 86 megawatts with distributions companies for a 5 year term that effective started in December, 2015. For such purpose, Kanan is installing a power plant to operate thermal generation units with a total capacity of 92 megawatts. Kanan is expected to reach commercial operations in March 2016.
Note 31—Contingent Liabilities
The main contingencies for the Group’s subsidiaries and associates are described as follows:
(a) Cerro del Aguila (CDA)
Río Mantaro Claim
In March 2015, CDA and the CDA EPC contractors amended the CDA EPC to address the claim delivered by the EPC contractors to CDA in April 2014, which demanded a six-month extension for the construction of the CDA Project and an approximately US$92 million increase in the total contract price of the CDA Project. Pursuant to the amendment, the CDA EPC contractors shall renounce any and all past, existing, or future claims against CDA, based on facts or events that occurred or were known, on or before the date of the amendment, in exchange for CDA’s (i) payment of US$40 million, subdivided into 4 payments over the course of the remaining construction period and subject to the achievement of certain milestones, and (ii) grant of the extensions of the CDA Project construction schedule that were previously requested by the CDA EPC contractors, which range between four and six months in length, depending upon the applicable CDA unit.
The amendment to the CDA EPC was subject to the approval of the lenders under the CDA Project Finance Facility. Upon the receipt of such approval, CDA paid the first of the four US$10 million payments owed to the CDA EPC Contractors under the amendment on May 21, 2015. The payment of the remaining US$30 million will be contingent upon the CDA EPC contractors’ satisfaction of certain construction milestones specified in the amendment to the CDA EPC.
CDA is expected to commence commercial operation in the second half of 2016. As a result of the settlement with the CDA EPC contractors, the estimated cost of the CDA Project is not expected to exceed US$960 million.
(b)Kallpa Generación S.A.
Import Tax Assessment against Kallpa
Since 2010, the Peru Customs Authority (known as “SUNAT” for its abbreviation in Spanish) issued tax assessments to Kallpa and its lenders for payment of import taxes allegedly owed by Kallpa in connection with imported equipment for installation and construction of Kallpa I, II, III and IV. The assessments were made on the basis that Kallpa did not include the value of the engineering services rendered by the contractor of the project in the tax base of import taxes. Kallpa disagrees with this tax assessment on the grounds that the engineering services rendered include the design of the plant and not the design of the imported equipment. Kallpa appealed the tax assessments before SUNAT in first instance and before the Peruvian Tax Court (known as “Tribunal Fiscal”) in second instance. SUNAT
F-133
Table of Contents
IC POWER LTD.
Notes to the Consolidated Financial Statements as at December 31, 2015
Note 31—Contingent Liabilities (cont’d)
(b)Kallpa Generación S.A. (cont’d)
Import Tax Assessment against Kallpa (cont’d)
and the Peruvian Tax Court are administrative institutions under the Ministry of Economy and Finance. As of December 31, 2014, the decisions of the Peruvian Tax Court on this matter were pending.
In January 2015, Kallpa was notified that the Tax Court rejected Kallpa’s appeal regarding the Kallpa I assessment. Kallpa disagrees with the court’s decision and filed an appeal before the Superior Court of Lima in April 2015. In order to appeal, Kallpa had to pay under protest the the tax assessment of Kallpa I in the amount of approximately S/. 37.9 million (US$ 12.3 million), include interests and fines.
As of the end of December 2015, the total tax exposure related to these assessments is as follows:
Stage | Amount | Amount | ||||||||
Kallpa I (1) | Superior Court of Lima | 32.5 | 9.6 | |||||||
Kallpa II | Peruvian Tax Court | 22.2 | 6.5 | |||||||
Kallpa III | Peruvian Tax Court | 21.4 | 6.3 | |||||||
Kallpa IV (2) | SUNAT | 30.0 | 8.8 | |||||||
|
|
|
| |||||||
| 106.1 | 31.2 | |||||||||
|
|
|
| |||||||
| (1) | Amount recorded as a long-term account receivable. This amount was originally S/. 37.9 million but S/. 5.4 million (that corresponded to VAT) was recovered. |
| (2) | Amount reduced to S/. 0.8 million (S/. 0.5 million without interest) on January 27, 2016 |
On January 27, 2016, the amount of the claim in connection with Kallpa IV was reduced in S/. 17.2 million (US$ 5.0 million) without interests, from S/. 17.7 million to S/. 0.5 million (from US$ 5.1 million to US$ 0.1 million) referred to the engineering services assessment. On February 12, 2016, Kallpa filed an appeal against the part of the resolution that refers to the insurance. As of the date herein, such appeal is pending to be submitted by SUNAT to the Tax Court.
Management and the Company’s legal advisors are of the opinion that Kallpa’s appeals be will more likely than not be successful; accordingly, no provision was recorded in the financial statements.
(c)Compañía Boliviana de Energía Electrica (“COBEE”)
Energy Tariff Adjustment in Bolivia
As a result of a tariff review conducted byAutoridad de Fiscalización y Control Social(“AE”), the Bolivian electricity supervisory authority, the AE concluded that COBEE had collected excessive electricity tariffs equal to an amount of US$ 7,300 thousand and as a result, the AE determined COBEE’s account in the electricity price stabilization fund (the “Stabilization Account”) should be debited with said excess.
After several filings, the amount of the excess was reduced to approximately US$5,219 thousand and the Stabilization Account was credited in proportion to said reduction. COBEE continues to challenge this conclusion.
In September 2013, the AE issued Resolution 498-2014(“Resolution VIII”), revoking resolutions V and VII and calculating an aggregate adjustment amount of US$ 5,400 thousand. Cobee challenged this last ruling, claiming review and recognition of US$ 500 thousand as last discussion item.
F-134
Table of Contents
IC POWER LTD.
Notes to the Consolidated Financial Statements as at December 31, 2015
Note 31—Contingent Liabilities (cont’d)
(c)Compañía Boliviana de Energía Electrica (“COBEE”) (cont’d)
Energy Tariff Adjustment in Bolivia (cont’d)
As of the date herein, the AE has issued Resolution 20-2014 (“Resolution IX”), accepting COBEE’s petition, in part, and ruling a US$ 5,000 thousand as aggregate adjustment amount for the tariffs period 2006-2008.
Management considers that the result of these proceedings is uncertain. However, the risk derived from this process in immaterial because COBEE has not recorded the net revenues assigned in the stabilization account due to COBEE’s inability to collect such balances. These revenues offset the contingency described above.
(d)Nejapa Power Company, LLC
Legal Process with a Minority shareholder
Crystal Power, Nejapa’s minority shareholder brought claims against Nejapa Holdings and Inkia Salvadorian, Limited, collectively, the Inkia Defendants, as well as against the majority shareholder of Nejapa Holdings, and certain subsidiaries of El Paso Corporation (the former owner of Inkia’s interest in Nejapa Holdings), before the Court of the State of Texas at Brazoria County. The claims against the Inkia Defendants included claims relating to an issuance of new shares to Crystal Power by Nejapa Holdings, and allegations that Crystal Power had taken actions (i) preventing Nejapa Holdings from making distributions into an account opened by a New York Court as a result of an interpleader action filed by Nejapa Holdings, (ii) causing Nejapa to distribute dividends disproportionately and (iii) causing Inkia Salvadorian, Limited to use its majority position to harm Crystal Power. Crystal Power did not specify the amount of monetary damages against the Inkia Defendants.
The Inkia Defendants have asserted defenses in respect of these claims.
The plaintiff filed a request for partial summary judgment before the Texas State District Court of Brazoria County. The Brazoria Court denied the motion. The Inkia Defendants filed a claim against the plaintiff in the Texas State District Court of Harris County requesting the court to order the plaintiff to withdraw its claims pursuant to contractual undertakings under a settlement agreement entered into with El Paso Corporation.
The Parties were ordered by the Brazoria Court to assist a mediation hearing during July 2014. No settlement resulted from such hearing. A second mediation session was ordered by the Brazoria Court on October 30, 2014.
On December 31, 2014 the parties reached a settlement agreement in application of which the Inkia Defendants bought the shares of Crystal in Nejapa Holdings for a consideration of US$ 20,000 thousand which become effective on January 6, 2015. The parties agreed to file the dismissal motions and judgments to the courts for filing and entry. The parties have agreed to release, discharge and forever hold harmless the other party and each of their present and former parents, subsidiaries, affiliates, predecessors, managing agents, employees, among others. As a result of this agreement, Inkia owns 100% of the shares in Nejapa Power LLC.
F-135
Table of Contents
IC POWER LTD.
Notes to the Consolidated Financial Statements as at December 31, 2015
Note 32—Subsequent Events
(a) Advanced Integrated Energy Ltd.
On January 21, 2016 AIE contracted with SerIDOM Servicios Integrados IDOM, S.A.U (hereinafter—“SerIDOM”) for the design, engineering, procurement and construction of combined cycle cogeneration power plant on lump sum, turnkey basis. In accordance with the EPC contract, SerIDOM committed to complete construction of the power plant by July 2018. The cost of the contract is approximately $150 million.
Payment of the consideration is based on progress of the construction and compliance with milestones. SerIDOM committed to compensate AIE in a case of delay or non-compliance with any of its contractual obligations up to the amounts stipulated in the EPC contract, and provided AIE a bank guarantee and a parent company guarantee to secure these commitments.
(b) Energuate acquisition
On January 22, 2016, IC Power Distribution Holdings Pte. Ltd executed an agreement with Deorsa-Deocsa Holdings an investment company of Actis, LLP, to acquire 100% of Estrella Cooperatief B.A. which indirectly owns 90.6% and 92.7% of two electricity distribution companies in Guatemala and 100% of two smaller related businesses (the four acquired businesses are collectively referred to as “Energuate”), for a total consideration of $265 million, using a combination of cash on hand and a $120 million loan facility, which IC Power entered into in December 2015, see note 14.
Energuate’s two electricity distribution companies provide services for approximately 1.6 million households in Guatemala (representing approximately 60% of Guatemala’s distribution clients) and distribute energy across an approximately 100,000 km2 area in Guatemala.
As of the date of the approval of the financial statements, the initial accounting for the business combination is incomplete. Therefore, the company did not present all the disclosures required under IFRS 3.
(c) Cerro del Aguila
On February 3, 2106 and February 04, 2016, Cerro del Aguila received proceeds in the aggregate amount of US$ 43,913 thousand under its finance credit facility. After this disbursement, Cerro del Aguila has drawn US$ 590,913 thousand (equivalent to 100% of the total debt approved).
(d) IC Power Israel
On January 2016, the Company repaid Tranche A facility in amount of NIS 161,746 thousand (US$ 40,680 thousand) including the interest accrued.
(e) Samay I
On February 6, 2016 Samay I received proceeds in the aggregate amount of US$ 20,000 thousand under its finance credit facility. After this disbursement, Samay I has drawn US$ 311,000 thousand (equivalent to 100% of the total debt approved).
F-136
Table of Contents
IC POWER LTD.
Notes to the Consolidated Financial Statements as at December 31, 2015
Note 32—Subsequent Events (cont’d)
(f) Kallpa Generación S.A.
On February 15, 2016, As a result of 2012 income tax audit performed by the Peruvian tax authority (“SUNAT”), SUNAT issued a preliminary income tax assessment for approximately S/. 22 million (US$ 6.5 million) on the basis that certain interest accrued on Kallpa’s debt and some maintenance expenses should not have been deducted from the 2012 Kallpa’s taxable income but rather treated as an asset. On March 11, 2016, SUNAT issue a final tax assessment for approximately S/. 16.5 million (US$ 4.8 million) related to the interest expenses accrued during construction. Kallpa will appeal this assessment before SUNAT,
Kallpa’s management and its tax counsel consider that its appeal will more likely than not be successful on the basis that the Peruvian Tax Court has issued precedent that admits the deduction of interest expenses in similar circumstances based on the clear language of article 37a) of the Peruvian Income Tax Law; accordingly, no provision was recorded in the financial statements.
(g) Transfer of the Company’s share
On March 17, 2016, as part of the reorganization process carried out by the Parent Company in order to list the Company’s activity in the US stock exchange, the Parent Company transferred all of the shares of the Company to IC Power Pte. Ltd. (“ICPS”), a wholly owned subsidiary of Kenon incorporated in Singapore.
F-137
Table of Contents
IC POWER PTE. LTD
Financial Statements
As at December 31, 2015
In U.S. Dollars
Table of Contents
Contents
Page | ||||
Report of Independent Registered Public Accounting Firm | F-140 | |||
| F-141 | ||||
| F-142 | ||||
| F-143 | ||||
| F-144 | ||||
| F-145 | ||||
F-139
Table of Contents
Somekh Chaikin KPMG Millennium Tower 17 Ha’arba’a Street, PO Box 609 Tel Aviv 6100601 Israel | Telephone Fax Internet | 972 3 684 8000 972 3 684 8444 www.kpmg.com/il |
Report of Independent Registered Public Accounting Firm
The Board of Directors and Shareholders
IC Power PTE. Ltd
We have audited the accompanying statement of financial position of IC Power PTE. Ltd. (hereinafter—the company) as of December 31, 2015 and the related statements of profit or loss, changes in equity and cash flows for the period from May 4, 2015 (the date in which the company has incorporated) to December 31, 2015. These financial statements are the responsibility of the Company’s management. Our responsibility is to express an opinion on these financial statements based on our audit.
We conducted our audit in accordance with the standards of the Public Company Accounting Oversight Board (United States). Those standards require that we plan and perform the audit to obtain reasonable assurance about whether the financial statements are free of material misstatement. An audit includes examining, on a test basis, evidence supporting the amounts and disclosures in the financial statements. An audit also includes assessing the accounting principles used and significant estimates made by management, as well as evaluating the overall financial statement presentation. We believe that our audit provides a reasonable basis for our opinion.
In our opinion, the financial statements referred to above present fairly, in all material respects, The financial position of the company, as of December 31, 2015, and the results of its operations and its cash flows for the period from May 4, 2015 (the date in which the company has incorporated) to December 31, 2015 in conformity with International Financial Reporting Standards as issued by the International Accounting Standards Board.
Somekh Chaikin
Certified Public Accountants (Isr.)
Member Firm of KPMG International
Tel Aviv, Israel
February 23, 2016
| Somekh Chaikin, an Israeli partnership and a member firm of the KPMG network of independent member firms affiliated with KPMG International Cooperative (“KPMG International”), a Swiss entity. |
F-140
Table of Contents
Statement of Financial Position as at December 31
2015 | ||||||||
Note | US$ dollars | |||||||
Current assets | ||||||||
Cash and Cash equivalents | 79,441 | |||||||
|
| |||||||
Total current assets | 79,441 | |||||||
|
| |||||||
Non-current assets Property, plant and equipment | 6,061 | |||||||
|
| |||||||
Total Non-current assets | 6,061 | |||||||
|
| |||||||
Total Assets | 85,502 | |||||||
|
| |||||||
Current liabilities | ||||||||
Loans from related parties | 7 | 305,080 | ||||||
| Other payables | 4 | 250,519 | ||||||
|
| |||||||
| Total liabilities | 555,599 | |||||||
|
| |||||||
Equity | ||||||||
Share capital | 1 | |||||||
Accumulated deficit | (470,098 | ) | ||||||
|
| |||||||
Total equity | 5 | (470,097 | ) | |||||
|
| |||||||
Total liabilities and equity | 85,502 | |||||||
|
| |||||||
|
|
| ||
|
|
| ||
Yoav Doppelt Chairman of the Board | Javier Garcia Acting Chief Executive Officer | Alberto Triulzi Acting Chief Financial Officer |


Date of approval of the financial statements: February 23, 2016
The accompanying notes are an integral part of these financial statements.
F-141
Table of Contents
Statement of Profit or Loss for the period from May 4, 2015 to December 31
2015 | ||||||||
Note | US$ dollars | |||||||
General and administrative expenses | 6 | 469,316 | ||||||
Financing expenses | 782 | |||||||
|
| |||||||
Loss for the period | 470,098 | |||||||
|
| |||||||
The accompanying notes are an integral part of these financial statements.
F-142
Table of Contents
Statement of Changes in Equity for the period from May 4, 2015 to December 31, 2015
Share capital | Accumulated | Total | ||||||||||
US$ dollars | US$ dollars | US$ dollars | ||||||||||
Opening balance—May 4, 2015 (incorporation date) | — | — | — | |||||||||
Issuance of share | 1 | — | 1 | |||||||||
Loss for the period | — | (470,098 | ) | (470,098 | ) | |||||||
|
|
|
|
|
| |||||||
Balance as at December 31, 2015 | 1 | (470,098 | ) | (470,097 | ) | |||||||
|
|
|
|
|
| |||||||
The accompanying notes are an integral part of these financial statements.
F-143
Table of Contents
Statement of Cash Flow for the period from May 4, 2015 to December 31
2015 | ||||
US$ dollars | ||||
Cash flow from operating activities | ||||
Loss for the period | (470,098 | ) | ||
Adjustments: | ||||
Depreciation | 1,034 | |||
Financing expenses | 782 | |||
|
| |||
| 1,816 | ||||
Changes in other payables | 250,519 | |||
|
| |||
Net cash used in operating activities | (217,763 | ) | ||
|
| |||
Cash flow from investing activities | ||||
Acquisition of Property, plant and equipment | (7,095 | ) | ||
|
| |||
Net cash used in investing activities | (7,095 | ) | ||
|
| |||
Cash flow from financing activities | ||||
Loans received from related parties | 305,080 | |||
Issuance of share | 1 | |||
|
| |||
Net cash provided by financing activities | 305,081 | |||
|
| |||
Net increase in cash and cash equivalents | 80,223 | |||
Cash and cash equivalent at the incorporation date | — | |||
Effect of changes in the exchange rate on cash and cash equivalents | (782 | ) | ||
|
| |||
Cash and cash equivalents at the end of the year | 79,441 | |||
|
| |||
The accompanying notes are an integral part of these financial statements.
F-144
Table of Contents
Notes to the Financial Statements as at December 31, 2015
Note 1—The Reporting Entity
A. The Reporting Entity:
IC POWER PTE. LTD (hereinafter—the Company) is a private holding company incorporated in Singapore on May 4, 2015 to serve as the holding company of IC Power Ltd (hereinafter—ICP) and its businesses.
The Company is a wholly owned subsidiary of Kenon Holdings Ltd. (hereinafter—Kenon).
The registered office of the Company is 80 Raffles Place #26-01, UOB Plaza, Singapore 048624. The Company’s principal executive office is located at 1 Temasek Avenue #36-01, Millenia Tower, Singapore 039192.
The Company is in the process of applying to list its ordinary shares on the New York Stock Exchange under the symbol “ICP”. Prior to the completion of this initial public offering, Kenon, will effect a reorganization pursuant to which it will transfer all of its equity interests in its wholly-owned subsidiary ICP, which holds power generation companies in Latin America, the Caribbean and Israel, to the company in exchange for (i) receipt of the company’s ordinary shares issued for such purpose and (ii) issuance of a note payable to Kenon in an aggregate principal amount of $220 million.
B. Definitions:
| (1) | The company—IC POWER PTE. LTD |
| (2) | Related parties—within the meaning thereof in International Accounting Standard 24, 2009 regarding “Related parties”. |
Note 2—Basis of Presentation and Measurement
(a)Basis of Presentation
These financial statements have been prepared in accordance with International Financial Reporting Standards (IFRS) as issued by the International Accounting Standards Board (IASB).
The financial statements were approved by the Company’s Board of Directors on February 23, 2016.
(b)Functional and presentation currency
The financial statements are presented in United States Dollars (“US Dollars”; $), which is the functional currency of the Company.
(c)Measurement
These financial statements have been prepared on the historical cost basics.
F-145
Table of Contents
IC POWER PTE. LTD
Notes to the Financial Statements as at December 31, 2015
Note 2—Basis of Presentation and Measurement (cont’d)
(d)Use of estimates and judgment
In preparation of the financial statements in accordance with IFRS as issued by the IASB, Company management is required to use judgment when making estimates and assumptions that affect implementation of the accounting policies and the amounts of assets, liabilities, income and expenses. It is clarified that the actual results may be different from these estimates.
Note 3—Significant Accounting Policies
The Company has applied the following accounting policy to the period presented in these financial statements:
A. Foreign currency transactions
Monetary assets and liabilities denominated in foreign currencies at the reporting date are translated to the functional currency at the exchange rate at that date. The foreign currency gain or loss on monetary items is the difference between amortized cost in the functional currency at the beginning of the period, adjusted for effective interest and payments during the period, and the amortized cost in foreign currency translated at the exchange rate at the end of the period. Non-monetary assets and liabilities that are measured at fair value in a foreign currency are translated into the functional currency at the exchange rate when the fair value was determined. Foreign currency differences are recognized in profit and loss.
B. Cash and cash equivalents
These items includes cash on hand, deposits held at call with banks, other short-term highly liquid investments with original maturities of three months or less and bank overdrafts
C. Property, plant and equipment
The cost of Property, plant and equipment includes expenditure that is directly attributable to the acquisition of the asset.
Subsequent costs
The cost of replacing part of a fixed asset item and other subsequent expenses are capitalized if it is probable that the future economic benefits associated with them will flow to the Group and their cost can be measured reliably. The carrying amount of the replaced part of a fixed asset item is derecognized. The costs of day-to-day servicing are recognized in profit or loss as incurred.
Depreciation
Depreciation is a systematic allocation of the depreciable amount of an asset over its useful life. The depreciable amount is the cost of the asset, or other amount substituted for cost, less its residual value. An asset is depreciated from the date it is ready for use, meaning the date it reaches the location and condition required for it to operate in the manner intended by management.
The company uses the straight-line method of depreciation.
F-146
Table of Contents
IC POWER PTE. LTD
Notes to the Financial Statements as at December 31, 2015
Note 3—Significant Accounting Policies (cont’d)
D. Non-derivative financial assets
1)Recognition and de-recognition
The Company initially recognizes receivables and deposits issued on the date that they are originated. The Company derecognizes a financial asset when the contractual rights to the cash flows from the asset expire.
2)Measurement
Receivables are measured initially at fair value plus any directly attributable transaction costs. Subsequent to initial recognition, they are measured at amortized cost using the effective interest method, less any impairment losses.
E. Non-derivative financial liabilities
1)Recognition and de-recognition
The company initially recognizes financial liabilities on the trade date at which the company becomes a party to the contractual provisions of the instrument. Financial liabilities are derecognized when the obligation of the company, as specified in the agreement, expires or when it is discharged or cancelled.
2)Measurement
Non-derivative financial liabilities are initially recognized at fair value less any direct attributable transaction costs. Subsequent to initial recognition, these liabilities are measured at amortized cost using the effective interest method.
Note 4—Other Payables
December 31 2015 | ||||
US$ dollars | ||||
Director fees | 199,000 | |||
Other | 51,519 | |||
|
| |||
| 250,519 | ||||
|
| |||
Note 5—Equity
Common stock
At December 31, 2015, the authorized, subscribed in common stock is represented by 1 share, with par value US$1. At December 31, 2015 the company structure is as follows:
Percentage of interest in capital | Number of shareholders | Interest percentage | ||
100% | 1 | 100% |
As a part of the reorganization described in note 1, the company expects to issue new shares.
F-147
Table of Contents
IC POWER PTE. LTD
Notes to the Financial Statements as at December 31, 2015
Note 6—General and administrative expenses
For the period | ||||
US$ dollars | ||||
Director fees | 199,000 | |||
Salaries, wages and related expenses | 111,224 | |||
Professional fees | 119,733 | |||
Depreciation | 1,034 | |||
Others | 38,325 | |||
|
| |||
| 469,316 | ||||
|
| |||
Note 7—Related Parties
A. Balances with related parties as at
December 31 | ||||
US$ dollars | ||||
Current liabilities: | ||||
Loans from related parties | 305,080 | |||
Director fees | 199,000 | |||
|
| |||
| 504,080 | ||||
|
| |||
The loans from related parties arise from company expenses paid by Inkia Energy and Kenon Holdings. These loans bear no interest expenses and are expected to be paid or settled within the following twelve months.
B. Transactions with related parties for the period from May 4, 2015 until
December 31 | ||||
US$ dollars | ||||
Director fees | 199,000 | |||
Senior management salary | 97,850 | |||
|
| |||
| 296,850 | ||||
|
| |||
C. All the related parties transactions made on market terms excluding the loans received from the related parties which are interest-free loans.
Note 8—Subsequent event
On January 20, 2016, the Israel Tax Authority (hereinafter—ITA) approved an exemption from withholding tax upon transferring of ICP from Kenon to the company. ITA’s approval is contingent upon the completion of the transfer of the shares of ICP from Kenon to the company, within 45 days from the date of the issuance of this approval.
F-148
Table of Contents
Distribuidora de Electricidad de
Oriente, S. A.—DEORSA
Condensed Interim Financial Statements as of June 30, 2016
and December 31, 2015 and for the six and three-month periods ended June 30,
2016 and 2015 (unaudited)
Table of Contents
Distribuidora de Electricidad de Oriente, S. A.
Condensed Interim Financial Statements as of June, 30, 2016 and December 31, 2015 and for the six and three-month period ended June 30 2016 and 2015 (unaudited)
Content | Pages | |
Condensed interim statements of profit or loss and other comprehensive income | F-151 | |
| F-152 | ||
Condensed interim statements of changes in shareholders’ equity | F-154 | |
| F-155 | ||
| F-157 | ||
Table of Contents
Distribuidora de Electricidad de Oriente, S. A.—DEORSA
Condensed interim statements of profit or loss and other comprehensive income
For the six and three-month period ended June 30, 2016 and 2015 and the 21-day period from January 1,
2016 to January 21, 2016 and the 161 day period from January 22, 2016 to June 30, 2016 (unaudited)
(Stated in Thousands of U.S. Dollars, except otherwise indicated)
Notes | Six months | Six | Three | Three | 21 day | 161 days | ||||||||||||||||||||||
Revenue | ||||||||||||||||||||||||||||
Energy sales | 5 | 116,986 | 120,885 | 60,842 | 58,518 | 14,618 | 102,368 | |||||||||||||||||||||
Services rendered | 2,697 | 2,366 | 1,507 | 1,405 | 425 | 2,272 | ||||||||||||||||||||||
Other revenue | 3,049 | 4,838 | 1,406 | 3,755 | 228 | (1) | 2,821 | (1) | ||||||||||||||||||||
|
|
|
|
|
|
|
|
|
|
|
| |||||||||||||||||
Total revenue | 122,732 | 128,089 | 63,755 | 63,678 | 15,271 | 107,461 | ||||||||||||||||||||||
Costs of sales | ||||||||||||||||||||||||||||
Energy purchases | 6 | (78,051 | ) | (75,870 | ) | (38,537 | ) | (39,478 | ) | (8,870 | ) | (69,181 | ) | |||||||||||||||
Other costs of sales | (16,614 | ) | (16,215 | ) | (8,689 | ) | (8,382 | ) | (2,410 | )(2) | (14,204 | )(2) | ||||||||||||||||
|
|
|
|
|
|
|
|
|
|
|
| |||||||||||||||||
Total costs of sales | (94,665 | ) | (92,085 | ) | (47,226 | ) | (47,860 | (11,280 | ) | (83,385 | ) | |||||||||||||||||
|
|
|
|
|
|
|
|
|
|
|
| |||||||||||||||||
Gross profit | 28,067 | 36,004 | 16,529 | 15,818 | 3,991 | 24,076 | ||||||||||||||||||||||
General, selling and administrative expense | (10,608 | ) | (9,210 | ) | (5,359 | ) | (4,382 | ) | (2,276 | ) | (8,332 | ) | ||||||||||||||||
Financial income | 1,188 | 1,002 | 337 | 661 | 64 | 1,124 | ||||||||||||||||||||||
Financial expenses | (5,247 | ) | (6,129 | ) | (1,620 | ) | (3,289 | ) | (583 | ) | (4,664 | ) | ||||||||||||||||
|
|
|
|
|
|
|
|
|
|
|
| |||||||||||||||||
Profit before income tax | 13,400 | 21,667 | 9,887 | 8,808 | 1,196 | 12,204 | ||||||||||||||||||||||
Income tax | 7 | (3,554 | ) | (5,675 | ) | (2,594 | ) | (2,307 | ) | (344 | ) | (3,210 | ) | |||||||||||||||
|
|
|
|
|
|
|
|
|
|
|
| |||||||||||||||||
Profit for the period | 9,846 | 15,992 | 7,293 | 6,501 | 852 | 8,994 | ||||||||||||||||||||||
|
|
|
|
|
|
|
|
|
|
|
| |||||||||||||||||
Other comprehensive (loss) income, net of income tax | ||||||||||||||||||||||||||||
Items that will not be reclassified subsequently to profit or loss: | ||||||||||||||||||||||||||||
Translation differences | (68 | ) | (400 | ) | 786 | 190 | (7 | ) | (61 | ) | ||||||||||||||||||
Remeasurement of defined benefit obligation | (213 | ) | — | (213 | ) | — | — | (213 | ) | |||||||||||||||||||
Items that would be reclassified subsequently to profit or loss: | ||||||||||||||||||||||||||||
Cash flow hedge | 102 | 52 | 6 | 591 | 37 | 65 | ||||||||||||||||||||||
|
|
|
|
|
|
|
|
|
|
|
| |||||||||||||||||
Total comprehensive Income for the period | 9,667 | 15,644 | 7,872 | 7,282 | 882 | 8,785 | ||||||||||||||||||||||
|
|
|
|
|
|
|
|
|
|
|
| |||||||||||||||||
| (1) | Includes revenues recognized from government grants of US$182 for the 21-day period from January 1, 2016 to January 21, 2016 and US$1,412 for the 161-day period from January 22, 2016 to June 30, 2016. |
| (2) | Includes amortization of intangible of US$65 and US$504 for the 21-day period from January 1, 2016 to January 21, 2016 and for the 161-day period from January 22, 2016 to June 30, 2016, respectively. |
The accompanying notes are part of these condensed interim financial statements.
F-151
Table of Contents
Distribuidora de Electricidad de Oriente, S. A.—DEORSA
Condensed interim statements of financial position
As of June 30 2016 and as of December 31, 2015 (Unaudited)
(Stated in Thousands of U.S. Dollars, except otherwise indicated)
Notes | June 30, 2016 | December 31, | ||||||||||
Assets | ||||||||||||
Non-current assets: | ||||||||||||
Property, plant and equipment | 10 | 213,851 | 213,288 | |||||||||
Intangible assets | 47,898 | 48,115 | ||||||||||
Other receivables | 2,186 | 2,268 | ||||||||||
Long-term trade receivables | 8 | 6,266 | 6,261 | |||||||||
|
|
|
| |||||||||
Total non-current assets | 270,201 | 269,932 | ||||||||||
|
|
|
| |||||||||
Current assets: | ||||||||||||
Other assets | 190 | 31 | ||||||||||
Inventory | 968 | 853 | ||||||||||
Trade receivables | 8 | 34,879 | 32,894 | |||||||||
Other receivables | 854 | 1,603 | ||||||||||
Taxes receivable | 269 | 92 | ||||||||||
Account receivables from related parties | 9 | 16,395 | 842 | |||||||||
Restricted cash | 1,848 | 1,848 | ||||||||||
Cash and cash equivalents | 11 | 5,238 | 36,049 | |||||||||
|
|
|
| |||||||||
Total current assets | 60,641 | 74,212 | ||||||||||
|
|
|
| |||||||||
Total assets | 330,842 | 344,144 | ||||||||||
|
|
|
| |||||||||
The accompanying notes are part of these condensed interim financial statements.
F-152
Table of Contents
Distribuidora de Electricidad de Oriente, S. A.—DEORSA
Condensed interim statements of financial position
As of June 30, 2016 and as of December 31, 2015 (Unaudited)
(Stated in Thousands of U.S. Dollars, except otherwise indicated)
Notes | June 30, 2016 | December 31, | ||||||||||
Shareholders’ equity and liabilities | ||||||||||||
Shareholders’ equity: | ||||||||||||
Capital stock | 44,018 | 44,018 | ||||||||||
Legal reserve | 8,794 | 6,951 | ||||||||||
Accumulated other comprehensive loss—cash flows hedge | — | (102 | ) | |||||||||
Accumulated other comprehensive loss-remeasurement of defined benefit obligation | (1,712 | ) | (1,499 | ) | ||||||||
Accumulated other comprehensive loss—Translation differences | (3,281 | ) | (3,213 | ) | ||||||||
Retained earnings | 23,189 | 31,202 | ||||||||||
|
|
|
| |||||||||
Total shareholders’ equity | 71,008 | 77,357 | ||||||||||
|
|
|
| |||||||||
Non-current liabilities: | ||||||||||||
Debt with financial entities—long term | 12 | 89,369 | 96,780 | |||||||||
Deferred revenues | 70,333 | 71,982 | ||||||||||
Provisions | 7,602 | 7,421 | ||||||||||
Deferred income tax, net | 7,299 | 6,462 | ||||||||||
Other long-term liabilities | 1,995 | 2,089 | ||||||||||
|
|
|
| |||||||||
Total non-current liabilities | 176,598 | 184,734 | ||||||||||
|
|
|
| |||||||||
Current liabilities: | ||||||||||||
Debt with financial entities—short term | 12 | 14,783 | 14,786 | |||||||||
Other financial obligations—short term | — | 219 | ||||||||||
Accounts payables to related parties | 9 | 163 | 181 | |||||||||
Trade and other accounts payable | 33,175 | 36,367 | ||||||||||
Creditors | 24 | 20 | ||||||||||
Taxes payables | 5,109 | 4,044 | ||||||||||
Other liabilities | 28,108 | 25,067 | ||||||||||
Employee benefits payable | 1,874 | 1,369 | ||||||||||
|
|
|
| |||||||||
Total current liabilities | 83,236 | 82,053 | ||||||||||
|
|
|
| |||||||||
Total liabilities | 259,834 | 266,787 | ||||||||||
|
|
|
| |||||||||
Total liabilities and shareholders’ equity | 330,842 | 344,144 | ||||||||||
|
|
|
| |||||||||
The accompanying notes are part of these condensed interim financial statements.
F-153
Table of Contents
Distribuidora de Electricidad de Oriente, S. A.—DEORSA
Condensed interim statements of changes in shareholder’s equity
For the period ended June 30, 2016 and 2015 (unaudited)
(Stated in Thousands of U.S. Dollars, except otherwise indicated)
Accumulated other comprehensive income | ||||||||||||||||||||||||||||
Capital | Legal | Retained | Cash flows | Remeasurement of defined | Translation | Total | ||||||||||||||||||||||
Balances as of January 1, 2015 | 44,018 | 6,834 | 42,848 | (317 | ) | (994 | ) | (2,759 | ) | 89,630 | ||||||||||||||||||
Movements for the six-month period ended June 30, 2015 | ||||||||||||||||||||||||||||
Transfer to legal reserve | — | 630 | (630 | ) | — | — | — | — | ||||||||||||||||||||
Cash dividends declared | — | — | (34,044 | ) | — | — | — | (34,044 | ) | |||||||||||||||||||
Gain from cash flow hedge, net of Income Tax | — | — | — | 52 | — | — | 52 | |||||||||||||||||||||
Profit of the period | — | — | 15,992 | — | — | — | 15,992 | |||||||||||||||||||||
Translation differences | — | — | — | — | — | (400 | ) | (400 | ) | |||||||||||||||||||
|
|
|
|
|
|
|
|
|
|
|
|
|
| |||||||||||||||
Balances as of June 30, 2015 | 44,018 | 7,464 | 24,166 | (265 | ) | (994 | ) | (3,159 | ) | 71,230 | ||||||||||||||||||
|
|
|
|
|
|
|
|
|
|
|
|
|
| |||||||||||||||
Balances as of January 1, 2016 | 44,018 | 6,951 | 31,202 | (102 | ) | (1,499 | ) | (3,213 | ) | 77,357 | ||||||||||||||||||
Movements for the six -month period ended June 30, 2016 | �� | |||||||||||||||||||||||||||
Transfer to legal reserve | — | 1,843 | (1,843 | ) | — | — | — | — | ||||||||||||||||||||
Cash dividends declared | — | — | (16,016 | ) | — | — | — | (16,016 | ) | |||||||||||||||||||
Remeasurement of defined benefit obligation net of income tax | — | — | — | — | (213 | ) | — | (213 | ) | |||||||||||||||||||
Gain from cash flow hedge, net of Income Tax | — | — | — | 102 | — | — | 102 | |||||||||||||||||||||
Profit of the period | — | — | 9,846 | — | — | — | 9,846 | |||||||||||||||||||||
Translation differences | — | — | — | — | — | (68 | ) | (68 | ) | |||||||||||||||||||
|
|
|
|
|
|
|
|
|
|
|
|
|
| |||||||||||||||
Balances as of June 30, 2016 | 44,018 | 8,794 | 23,189 | — | (1,712 | ) | (3,281 | ) | 71,008 | |||||||||||||||||||
|
|
|
|
|
|
|
|
|
|
|
|
|
| |||||||||||||||
The accompanying notes are part of these condensed interim financial statements.
F-154
Table of Contents
Distribuidora de Electricidad de Oriente, S. A.—DEORSA
Condensed interim statements of cash flows
For the six and three-month period ended June 30, 2016 and 2015 (unaudited)
(Stated in Thousands of U.S. Dollars, except otherwise indicated)
Six-month June, 2016 | Six-month June, 2015 | |||||||
Cash flows from operating activities: | ||||||||
Profit for the period | 9,846 | 15,992 | ||||||
Adjustments from: | ||||||||
Depreciation and amortization | 5,428 | 6,021 | ||||||
Accrued revenue—government grants | (1,594 | ) | (1,657 | ) | ||||
Impairment losses recognized on receivables from doubtful accounts | 2,527 | 2,220 | ||||||
Provision for contingencies | 68 | — | ||||||
Interest from deposits received from consumers | 1,522 | 1,288 | ||||||
Effective cash flows hedge | (67 | ) | (96 | ) | ||||
Finance costs recognized in profit or loss | 3,543 | 3,377 | ||||||
Exchange differences | 90 | (190 | ) | |||||
Income tax expense | 3,554 | 5,675 | ||||||
Changes in working capital: | ||||||||
Inventory | (738 | ) | 412 | |||||
Other assets | (159 | ) | (395 | ) | ||||
Trade receivables | (4,554 | ) | (748 | ) | ||||
Related parties | (55 | ) | (770 | ) | ||||
Other receivables | 829 | 885 | ||||||
Taxes receivables | — | 259 | ||||||
Severance pay compensation | 32 | (157 | ) | |||||
Provision for contingencies | (200 | ) | (146 | ) | ||||
Taxes payables | (24 | ) | 1,008 | |||||
Other liabilities | 1,527 | 2,295 | ||||||
Trade and other accounts payable | (3,168 | ) | (3,661 | ) | ||||
Creditors | 4 | (615 | ) | |||||
Employee benefits payable | 505 | 229 | ||||||
|
|
|
| |||||
Cash from operating activities | 18,916 | 31,226 | ||||||
Income tax paid | (1,773 | ) | (9,407 | ) | ||||
Payment of interest | (3,543 | ) | (3,377 | ) | ||||
|
|
|
| |||||
Net cash flows generated from operating activities | 13,600 | 18,442 | ||||||
|
(Continues |
) | ||||||
F-155
Table of Contents
DISTRIBUIDORA DE ELECTRICIDAD DE ORIENTE, S. A.—DEORSA
Condensed interim statements of cash flows
For the six and three-month period ended June 30, 2016 and 2015 (unaudited)
(Stated in Thousands of U.S. Dollars, except otherwise indicated)
| Six-month period ended June, 2016 | Six-month period ended June, 2015 | |||||||
Cash flows from investing activities: | ||||||||
Payments for property, plant and equipment | (4,949 | ) | (6,334 | ) | ||||
Payments for intangible assets | (381 | ) | (212 | ) | ||||
Proceeds from disposal of property, plant and equipment | 10 | — | ||||||
|
|
|
| |||||
Net cash used in investing activities | (5,320 | ) | (6,546 | ) | ||||
Cash flows from financing activities: | ||||||||
Funds received from government grants | — | 2,460 | ||||||
Proceeds (payments) of loans from related parties | (15,516 | ) | 4,853 | |||||
Long term creditors | (92 | ) | 32 | |||||
Loan obtained from a bank | 1,013 | 40,586 | ||||||
Payment of bank loans | (8,408 | ) | (24,443 | ) | ||||
Payment of dividends | (16,016 | ) | (34,044 | ) | ||||
|
|
|
| |||||
Net cash flow used in financing activities | (39,019 | ) | (10,556 | ) | ||||
|
|
|
| |||||
Net (decrease) increase in cash and cash equivalents | (30,739 | ) | 1,340 | |||||
Cash and cash equivalents at the beginning of the period | 36,049 | 24,390 | ||||||
Effects of exchange rates changes on cash and cash equivalents | (72 | ) | (9 | ) | ||||
|
|
|
| |||||
Cash and cash equivalents at the end of the period | 5,238 | 25,721 | ||||||
|
|
|
| |||||
The accompanying notes are part of these condensed interim financial statements.
F-156
Table of Contents
Distribuidora de Electricidad de Oriente, S. A.—DEORSA
Notes to the condensed interim financial statements
As of June 30 2016 and December 31, 2015 and for the six and three-month period ended June 30,
2016 and 2015 (unaudited)
(Stated in Thousands of U.S. Dollars, except otherwise indicated)
1. Operations of the company and basis of preparation of the condensed interim financial statements
a. Operations of the Company
Distribuidora de Electricidad de Oriente, Sociedad Anónima—DEORSA (hereinafter “DEORSA” or the “Company”), a majority-owned subsidiary of DEORSA B.V., was incorporated on October 18, 1998 in the Republic of Guatemala in accordance with the commercial laws of the country and was authorized to operate for an indefinite term. It is located in the City of Guatemala and its address is Diagonal 6, 10-50, zone 10.
The Company’s main activity consists of the distribution of electricity to final consumers in the eastern departments of the Republic of Guatemala, such as: El Progreso, Santa Rosa, Jalapa, Jutiapa, Chiquimula, Zacapa, Izabal, Baja Verapaz, Alta Verapaz and El Petén.
Under Agreement No. 381-98 of the Ministry of Energy and Mining dated November 23, 1998 theEmpresa de Distribución de Energía Eléctrica del INDE (the Electric Energy Distribution Company of INDE)—Eastern Region—EDEEROR, was authorized to transfer to the Company for a fifty-year period the service of final distribution of electricity in the abovementioned departments (the “Concession”).
All the revenues and the non-current assets of the Company are generated and are located respectively in Guatemala.
On January 22, 2016, I.C. Power Ltd. through IC Power Distribution Holding Pte. Limited, a wholly-owned subsidiary of Kenon Holdings Ltd (“Kenon”), acquired 100% of the shares of DEORSA BV, owner of 92.70% of the Company’s capital stock. As a result, I.C. Power Ltd. took the effective control for directing the financial and operating policies of the Company. On March 17, 2016, as part of the reorganization process carried out by Kenon in order to list I.C. Power Pte. Ltd. in the US stock exchange, Kenon transferred all of the shares of I.C. Power Ltd. to I.C. Power Pte. Ltd. (“ICPS”), a wholly owned subsidiary of Kenon incorporated in Singapore.
b. Basis of preparation of the condensed interim financial statements
The unaudited condensed interim financial statements have been prepared in accordance with the International Accounting Standard No. 34 Interim Financial Information. Selected explanatory notes are included to explain the events and transactions that are significant for the understanding of the changes in the financial position and the results of the Company for the six-month period ended June 30, 2016 and 2015. These unaudited condensed interim financial statements do not include all of the information required by the complete annual financial statements prepared in accordance with the International Financial Reporting Standards.
These unaudited condensed interim financial statements should be read in conjunction with the Company’s financial statements as of December 31, 2015, 2014 and 2013 and January 1, 2013 and for the years ended December 31, 2015, 2014 and 2013 issued on September 10, 2016.
The financial information as of December 31, 2015 presented in these unaudited condensed interim financial statements is derived from our financial statements as of December 31, 2015, 2014 and 2013 and January 1, 2013 and for the years ended December 31, 2015, 2014 and 2013 issued on September 10, 2016.
F-157
Table of Contents
Distribuidora de Electricidad de Oriente, S. A.—DEORSA
Notes to the condensed interim financial statements
As of June 30 2016 and December 31, 2015 and for the six and three-month period ended June 30,
2016 and 2015 (unaudited)
(Stated in Thousands of U.S. Dollars, except otherwise indicated)
In the opinion of management, these unaudited condensed interim financial statements reflect all normal recurring adjustments, which are necessary for a fair representation of financial results for the interim periods presented.
As described above, since January 22, 2016, I.C. Power Ltd. took effective control for directing the financial and operating policies of the Company and on March 17, 2016, Kenon transferred all of the shares of DEORSA BV of I.C. Power Ltd. to I.C. Power Pte. Ltd. The Company has prepared these condensed financial statements for consolidation purposes of I.C. Power Pte. Ltd. and its consolidated subsidiary Inkia Energy Ltd., and it has included as additional information the results of operations for the 21-day period from January 1, 2016 to January 21, 2016 and the 161 -day period from January 22, 2016 to June 30, 2016.
The results of operations for six and three-month periods ended June 30, 2016 and 2015 or for the 21-day period from January 1, 2016 to January 21, 2016 and for the 161-day period from January 22, 2016 to June 30, 2016 are not necessarily indicative of the results for the full year. The Company believes that the disclosures are adequate to make the information presented not misleading.
2. Application of new and revised international financial reporting standards
2.1 Adoption of new and revised standards
The Company has adopted all of the new and revised standards and interpretations issued by the IASB that are relevant to its operations and that are mandatorily effective at June 30, 2016, as described in note 2.1 to the Company’s financial statements as of December 31, 2015, 2014 and 2013 and January 1, 2013 and for the years ended December 31, 2015, 2014 and 2013 issued on September 10, 2016. The new and revised standards and interpretations adopted did not have impact on these condensed interim financial statements.
2.2 New accounting pronouncements
During the six -month period ended June 30, 2016, there were no new accounting pronouncements applicable to the Company, besides to the new and revised IFRSs that have been issued but are not yet mandatorily effective as described in note 2.1 to the financial statements as of December 31, 2015, 2014 and 2013 and for the years ended December 31, 2015, 2014 and 2013 issued on September 10, 2016 .The management of the Company foresee that the application of these new or revised standards will not have a material impact over these condensed interim financial statements except for IFRS 15 and IFRS 16 that the Company is evaluating and cannot, at this time, estimate the potential impact on its future financial condition, results of operations and cash flows.
3. Significant accounting policies
The accounting policies applied by the Company in these condensed interim financial statements are consistent with those followed in the preparation of the annual financial statements as of December 31, 2015, 2014 and 2013 and January 1, 2013 and for the years ended December 31, 2015, 2014 and 2013 issued on September 10, 2016, except for the adoption of new standards and interpretations effective as of January 1, 2016. The Company has not early adopted any other standard, interpretation or amendment that has been issued but is not yet effective.
F-158
Table of Contents
Distribuidora de Electricidad de Oriente, S. A.—DEORSA
Notes to the condensed interim financial statements
As of June 30 2016 and December 31, 2015 and for the six and three-month period ended June 30,
2016 and 2015 (unaudited)
(Stated in Thousands of U.S. Dollars, except otherwise indicated)
The preparation of interim financial statements requires management to make judgements, estimates and assumptions that affect the application of accounting policies and the reported amounts of assets and liabilities, income and expenses. Actual results may differ from these estimates.
In preparing these condensed interim financial statements, the significant judgements made by management in applying the Company’s accounting policies and the key sources of estimation uncertainty were the same as those that applied to the financial statements as of December 31, 2015, 2014 and 2013 and January 1, 2013 and for the years ended December 31, 2015, 2014 and 2013 issued on September 10, 2016.
4. Monetary unit and exchange rate
The legal currency of Guatemala is the quetzal, represented by the symbol “Q” in the condensed interim financial statements.
As of June 30, 2016 and December 31, 2015, the reference exchange rate published by the Central Bank of Guatemala was Q.7.64 and Q. 7.63, respectively.
There are no exchange restrictions in Guatemala for the repatriation of capital, payment to creditors or for any other purpose; foreign currency may be freely negotiated for any amount in banks of the banking system or in authorized foreign currency exchange offices, in accordance with the current law in effect, per Decree number 94—2000 Law of Free Negotiation of Currencies.
5. Energy sales
Revenues from electric energy sales obtained during the six and three-month periods ended June 30, 2016 and 2015, is presented as follows:
Six month period | Three month period ended June 30 | |||||||||||||||
2016 | 2015 | 2016 | 2015 | |||||||||||||
Simple LV | 86,628 | 86,398 | 45,922 | 42,453 | ||||||||||||
Public Lighting | 11,435 | 12,785 | 5,755 | 5,945 | ||||||||||||
LV on demand OP | 7,671 | 8,723 | 3,847 | 4,085 | ||||||||||||
Non-regulated tariff | 3,589 | 4,917 | 1,584 | 2,173 | ||||||||||||
LV on demand P | 5,479 | 5,609 | 2,749 | 2,663 | ||||||||||||
MV on demand OP | 946 | 1,031 | 439 | 442 | ||||||||||||
MV on demand | 195 | 192 | 69 | 83 | ||||||||||||
Non-regulated special tariff | 1,043 | 1,230 | 477 | 674 | ||||||||||||
|
|
|
|
|
|
|
| |||||||||
| 116,986 | 120,885 | 60,842 | 58,518 | |||||||||||||
|
|
|
|
|
|
|
| |||||||||
The abbreviations indicated above correspond to:
LV: Low voltage; MV: medium voltage; OP: Off-peak; P: peak.
Revenues associated with non-regulated tariff decreased in the second semester of 2016, primarily due to lower average base rate approved by the National Commission of Electric Energy (CNEE in Spanish) of (13.8%) partially offset by higher energy supplied of 6.1%.
F-159
Table of Contents
Distribuidora de Electricidad de Oriente, S. A.—DEORSA
Notes to the condensed interim financial statements
As of June 30 2016 and December 31, 2015 and for the six and three-month period ended June 30,
2016 and 2015 (unaudited)
(Stated in Thousands of U.S. Dollars, except otherwise indicated)
6. Energy purchases
During the six and three-month periods ended June 30, 2016 and 2015 electric energy purchases were as follows:
Six month period ended June 30 | Three month period ended June 30 | |||||||||||||||
2016 | 2015 | 2016 | 2015 | |||||||||||||
Contracts with suppliers | 71,449 | 46,687 | 36,232 | 23,172 | ||||||||||||
In the spot market | 6,602 | 29,183 | 2,305 | 16,306 | ||||||||||||
|
|
|
|
|
|
|
| |||||||||
| 78,051 | 75,870 | 38,537 | 39,478 | |||||||||||||
|
|
|
|
|
|
|
| |||||||||
The Company manages an average of 60 days of credit with its suppliers from the receipt date of the invoice. Suppliers do not charge interest on the late payment of outstanding invoices.
During this semester of 2016, energy purchases increased by $2,181 compared to the corresponding period in 2015. The increase was primarily due to a 7.7% increase in the volume of kWhs purchased, partially offset by lower average purchase price because of the entry of new power purchase contracts.
The variance between energy purchase on contracts with suppliers and energy purchase in the energy spot market is due to the fact that since the end of the first semester of 2015, the Company initiated the purchases under a contract with Jaguar, an energy supplier, in which the price was lower than the cost of energy purchased in the spot market, and also, credit conditions were advantageous.
7. Income tax
Income tax expense is provided on an interim basis based on management’s estimate of the annual effective income tax rate and includes the tax effects of certain discrete items, such as changes in tax laws or tax rates or other unusual or non-recurring tax adjustments in the interim period in which they occur. Management regularly monitors the assumptions used in estimating its annual effective tax rate and adjusts estimates accordingly. If actual results differ from management’s estimates, reported income tax expense in future periods could be materially affected.
For the six and three-month periods ended June 30, 2016 and 2015, income tax expense was US$ 3,554,US$ 5,675 and US$2,594 and US$2,307, respectively. The related effective tax rates were 27%, 26% and 26% and 26%, respectively. The higher effective income tax rate for the Company during the six and three- month period ended June 30, 2016 is mainly explained by a higher impact of the interest from deposits received from consumers, which are non-deductible for income tax purposes, over the projected profit before tax estimated by the Company as of by December 31, 2016, with respect to the projected profit before tax estimated by the Company by the previous comparative period.
For the six-month period ended June 30, 2015, the higher income tax paid, shown in the statement of cash flows, is caused by payments for correction of tax returns of 2011, 2012, 2013 and 2014 that were accrued as of December 31, 2014 (Note 14 of the financial statements as of December 31, 2015, 2014 and 2013 and January 1, 2013, and for the years ended December 31, 2015, 2014 and 2013, issued on September 10, 2016).
F-160
Table of Contents
Distribuidora de Electricidad de Oriente, S. A.—DEORSA
Notes to the condensed interim financial statements
As of June 30 2016 and December 31, 2015 and for the six and three-month period ended June 30,
2016 and 2015 (unaudited)
(Stated in Thousands of U.S. Dollars, except otherwise indicated)
8. Trade receivables
As of June 30, 2016 and December 31, 2015, the balance for trade receivables is detailed as follows:
2016 | 2015 | |||||||
Commercial, industrial, residential zones, public lighting, rates and tariffsa/ | 58,004 | 53,278 | ||||||
Energy consumed not billedd/ | 9,905 | 10,582 | ||||||
Instituto Nacional de Electrificación -INDEc/ | 6,700 | 5,836 | ||||||
Clients tolls | 247 | 267 | ||||||
Other clients | 51 | 50 | ||||||
|
|
|
| |||||
| 74,907 | 70,013 | |||||||
|
|
|
| |||||
Long-term accounts receivable with payment agreementa/ | (3,693 | ) | (3,883 | ) | ||||
Long-term accounts receivable from municipalitiesb/ | (2,573 | ) | (2,378 | ) | ||||
|
|
|
| |||||
| (6,266 | ) | (6,261 | ) | |||||
|
|
|
| |||||
| 68,641 | 63,752 | |||||||
Less | ||||||||
Collection by offsetting a/ | (14,124 | ) | (13,663 | ) | ||||
Allowance for uncollectible accounts b/ | (19,638 | ) | (17,195 | ) | ||||
|
|
|
| |||||
Short-term trade receivable | 34,879 | 32,894 | ||||||
|
|
|
| |||||
| a/ | Collection by means of offsetting corresponds to the balances payable to the municipalities for the municipal tariff of public lighting that the Company charges to the users in the name of the municipalities. The Company includes this balance as part of the trade accounts receivable based on the right acquired through the contracts with municipalities to collect the public lighting tariff and offset it with the balances receivable from the electric energy billing to the same municipalities. |
| b/ | Uncollectible Accounts-The movement of the allowance for uncollectible accounts during the six-month periods ended on June 30, 2016 and 2015, are shown as follows: |
2016 | 2015 | |||||||
Balance at the beginning of the year | 17,195 | 13,112 | ||||||
Impairment loss for the period | 2,527 | 2,220 | ||||||
Application of provisions and other movements | (85 | ) | (29 | ) | ||||
Translation differences | 1 | (39 | ) | |||||
|
|
|
| |||||
| 19,638 | 15,264 | |||||||
|
|
|
| |||||
The Company records an allowance for uncollectible accounts over all those balances aged beyond 180 days less the collection by means of offsetting and the accounts receivable to municipalities, Governmental entities and certain communities due to term-payment agreements.
The impairment loss for the three-month periods ended June 30, 2016 and 2015 amounted to US$1,213 and US$517, respectively.
| c/ | Account receivable from INDE for the billing of the adjustment of Solidaridad INDE to the users who are beneficiaries under the Social Tariff Act, according to the deed of INDE a-38-2013-2.A. The amount to be billed by the Company is determined by the resolutions monthly issued by the National Commission of Electric Energy – CNEE. The amount is due within 30 days after the issuance of the invoice. |
| d/ | It corresponds to the estimated amount of services accrued, but not billed, from the sale of electric energy and toll at June 30, 2016 and December 31, 2015, net from the estimate of technical and not technical loss. This value is billed in full in the next billing cycle. |
F-161
Table of Contents
Distribuidora de Electricidad de Oriente, S. A.—DEORSA
Notes to the condensed interim financial statements
As of June 30 2016 and December 31, 2015 and for the six and three-month period ended June 30,
2016 and 2015 (unaudited)
(Stated in Thousands of U.S. Dollars, except otherwise indicated)
9. Related parties
Accounts receivable from and payable to related parties as of June 30, 2016 and December 31, 2015 are made up of the following balances:
2016 | 2015 | |||||||
Accounts receivable | ||||||||
Distribuidora de Electricidad de Occidente, S. A.a/ | 15,546 | 50 | ||||||
Comercializadora Guatemalteca Mayorista de Electricidad, S.A. | 57 | — | ||||||
Redes Eléctricas de Centroamérica, S. A. | 792 | 792 | ||||||
|
|
|
| |||||
| 16,395 | 842 | |||||||
|
|
|
| |||||
| a/ | Account receivable from Distribuidora de Electricidad de Occidente, S. A. represents cash advances made during the six-month ended June 30, 2016 documented by a promissory note that do not accrue interest and is renewed monthly. |
The amounts outstanding are unsecured and will be settled in cash. No guarantees have been given or received. No expense has been recognized in the current or prior years for bad or doubtful debt in respect of the amounts owed by related parties.
2016 | 2015 | |||||||
Accounts payable | ||||||||
Distribuidora de Electricidad de Occidente, S. A. | 19 | 123 | ||||||
Kallpa Generación, S.A. | 8 | — | ||||||
Comercializadora Guatemalteca Mayorista de Electricidad, S.A. | 26 | 58 | ||||||
ICPOWER CHILE INVERSIONES LTDA | 110 | — | ||||||
|
|
|
| |||||
| 163 | 181 | |||||||
|
|
|
| |||||
F-162
Table of Contents
Distribuidora de Electricidad de Oriente, S. A.—DEORSA
Notes to the condensed interim financial statements
As of June 30 2016 and December 31, 2015 and for the six and three-month period ended June 30,
2016 and 2015 (unaudited)
(Stated in Thousands of U.S. Dollars, except otherwise indicated)
The main transactions between related companies are as follows:
2016 | 2015 | |||||||
Loans to related parties | ||||||||
Distribuidora de Electricidad de Occidente, S.A. | 15,577 | 4,853 | ||||||
|
|
|
| |||||
Toll billing | ||||||||
Comercializadora Guatemalteca Mayorista de Electricidad, S.A. | 330 | 445 | ||||||
|
|
|
| |||||
Purchase of materials | ||||||||
Distribuidora de Electricidad de Occidente, S.A. | 149 | 185 | ||||||
|
|
|
| |||||
Sale of materials | ||||||||
Distribuidora de Electricidad de Occidente, S.A. | 84 | 239 | ||||||
|
|
|
| |||||
Toll services | ||||||||
Redes Eléctricas de Centroamérica, S. A. RECSA Toll of secondary system in distribution lines | 178 | 94 | ||||||
|
|
|
| |||||
Invoicing of work performed | ||||||||
Distribuidora de Electricidad de Occidente, S.A. | — | 614 | ||||||
|
|
|
| |||||
Operating fee | ||||||||
Arthasan, S.A.b/ | 1,302 | 875 | ||||||
|
|
|
| |||||
Energy supplied to substations | ||||||||
Redes Eléctricas de Centroamérica, S. A. RECSA | 5 | 8 | ||||||
|
|
|
| |||||
Leasing of vehicles | ||||||||
Comercializadora Guatemalteca Mayorista de Electricidad, S.A. | 55 | 55 | ||||||
|
|
|
| |||||
Energy sales to spot market | ||||||||
Distribuidora de Electricidad de Occidente, S.A. | 49 | — | ||||||
|
|
|
| |||||
Comercializadora Guatemalteca Mayorista de Electricidad, S.A. | 7 | — | ||||||
|
|
|
| |||||
Purchase energy sales to spot market | ||||||||
Distribuidora de Electricidad de Occidente, .S.A. | 342 | — | ||||||
|
|
|
| |||||
Technical assistance | ||||||||
IC Power Chile Inversiones Ltda.c/ | 265 | — | ||||||
|
|
|
| |||||
Reimbursable expenses | ||||||||
IC Power Chile Inversiones Ltda. | 87 | — | ||||||
|
|
|
| |||||
Kallpa Generación, S. A. | 57 | — | ||||||
|
|
|
| |||||
| b/ | DEORSA executive officers did not receive compensation directly from the Company until January 22, 2016, since each of them had been an executive officer of Arthasan, S. A. and had received compensation directly from Arthasan, S. A. Since that date, Company´s executive officers have received compensation directly from DEORSA by approximately US$374. |
The Company has recorded expenses for an amount of $1,302 related with the final payment of the contract with Arthasan that was terminated on January 21, 2016. This amount was not contractually determined, but agreed by the parties
| c/ | Technical advice of networks and electrical substations, of purchasing of electrical power and other operational and commercial matters. |
F-163
Table of Contents
Distribuidora de Electricidad de Oriente, S. A.—DEORSA
Notes to the condensed interim financial statements
As of June 30 2016 and December 31, 2015 and for the six and three-month period ended June 30,
2016 and 2015 (unaudited)
(Stated in Thousands of U.S. Dollars, except otherwise indicated)
10. Property, plant and equipment—net
During the six-month period ended June 30, 2016, the Company acquired assets at a cost of 2,568, mainly for the construction of distribution lines and devices for measurement and control.
The detail and movements as of June 30, 2016 and December 31, 2015 and for the six-month periods ended June 30, 2016 and 2015 of the items of the property, plant and equipment and their corresponding accumulated depreciation is as follows:
Movements occurred during the six-month period ended June 30, 2016 and 2015:
Description | Land and | Technical | Others | Assets under | Inventory of | Total | ||||||||||||||||||
Cost | ||||||||||||||||||||||||
Balance at the beginning of 2016 | 1,925 | 353,723 | 8,774 | 2,748 | 3,261 | 370,431 | ||||||||||||||||||
Additions | — | — | — | 4,949 | 620 | 5,569 | ||||||||||||||||||
Disposals | — | — | (10 | ) | — | — | (10 | ) | ||||||||||||||||
Transfers | 14 | 489 | 72 | (575 | ) | — | — | |||||||||||||||||
Translation differences | (2 | ) | (228 | ) | (6 | ) | 20 | — | (216 | ) | ||||||||||||||
|
|
|
|
|
|
|
|
|
|
|
| |||||||||||||
Total cost at June 30, 2016 | 1,937 | 353,984 | 8,830 | 7,142 | 3,881 | 375,774 | ||||||||||||||||||
|
|
|
|
|
|
|
|
|
|
|
| |||||||||||||
Accumulated depreciation | — | — | — | — | — | — | ||||||||||||||||||
Balance at the beginning of 2016 | (902 | ) | (149,352 | ) | (6,487 | ) | — | (401 | ) | (157,142 | ) | |||||||||||||
Additions | (37 | ) | (4,552 | ) | (282 | ) | — | — | (4,871 | )(1) | ||||||||||||||
Disposals | — | — | 10 | — | — | 10 | ||||||||||||||||||
Translation differences | — | 74 | 6 | — | — | 80 | ||||||||||||||||||
|
|
|
|
|
|
|
|
|
|
|
| |||||||||||||
Total accumulated depreciation | (939 | ) | (153,830 | ) | (6,753 | ) | — | (401 | ) | (161,923 | ) | |||||||||||||
|
|
|
|
|
|
|
|
|
|
|
| |||||||||||||
Carrying value at June 30, 2016 | 998 | 200,154 | 2,077 | 7,142 | 3,480 | 213,851 | ||||||||||||||||||
|
|
|
|
|
|
|
|
|
|
|
| |||||||||||||
Carrying value at December 31, 2015 | 1,022 | 204,371 | 2,287 | 2,748 | 2,860 | 213,288 | ||||||||||||||||||
|
|
|
|
|
|
|
|
|
|
|
| |||||||||||||
| (1) | Includes US$554 for the 21-day period from January 1, 2016 to January 21, 2016 and US$4,317 for the 161-day period from January 22, 2016 to March 31, 2016. |
F-164
Table of Contents
Distribuidora de Electricidad de Oriente, S. A.—DEORSA
Notes to the condensed interim financial statements
As of June 30 2016 and December 31, 2015 and for the six and three-month period ended June 30,
2016 and 2015 (unaudited)
(Stated in Thousands of U.S. Dollars, except otherwise indicated)
Description | Land and | Technical | Others | Assets under | Inventory of | Total | ||||||||||||||||||
Cost | ||||||||||||||||||||||||
Balance at the beginning of 2015 | 1,892 | 349,384 | 7,961 | 9,665 | 4,140 | 373,042 | ||||||||||||||||||
Additions | — | — | — | 6,334 | (189 | ) | 6,145 | |||||||||||||||||
Disposals | (480 | ) | — | — | — | (480 | ) | |||||||||||||||||
Transfers | 507 | 242 | (749 | ) | — | — | ||||||||||||||||||
Translation differences | (7 | ) | (1,272 | ) | (28 | ) | (12 | ) | (16 | ) | (1,335 | ) | ||||||||||||
|
|
|
|
|
|
|
|
|
|
|
| |||||||||||||
Total cost at June 30, 2015 | 1,885 | 348,139 | 8,175 | 15,238 | 3,935 | 377,372 | ||||||||||||||||||
Accumulated depreciation | — | — | — | — | ||||||||||||||||||||
Balance at the beginning of 2015 | (835 | ) | (153,944 | ) | (5,797 | ) | — | — | (160,576 | ) | ||||||||||||||
Additions | (34 | ) | (4,852 | ) | (359 | ) | — | — | (5,245 | ) | ||||||||||||||
Disposals | 213 | — | — | — | 213 | |||||||||||||||||||
Translation differences | 3 | 542 | 17 | — | — | 562 | ||||||||||||||||||
|
|
|
|
|
|
|
|
|
|
|
| |||||||||||||
Total accumulated depreciation | (866 | ) | (158,041 | ) | (6,139 | ) | — | — | (165,046 | ) | ||||||||||||||
|
|
|
|
|
|
|
|
|
|
|
| |||||||||||||
Carrying value at June 30, 2015 | 1,019 | 190,098 | 2,036 | 15,238 | 3,935 | 212,326 | ||||||||||||||||||
|
|
|
|
|
|
|
|
|
|
|
| |||||||||||||
11. Cash and cash equivalents
The balances of the cash and cash equivalents as of June 30, 2016 and December 31, 2015 were as follows:
2016 | 2015 | |||||||
Balances in local Banks | 4,627 | 35,488 | ||||||
Cash | 611 | 561 | ||||||
|
|
|
| |||||
| 5,238 | 36,049 | |||||||
|
|
|
| |||||
The decrease in cash when compared the balances at December 31, 2015 and June 30, 2016 amounts to US$30,811. This decrease is mainly related to dividends paid for US$16,016 and a cash transfers to related parties for US$15,546.
12. Debt with financial entities.
The balances of the debt with financial entities as of June 30, 2016 and December 31, 2015 were as follows:
2016 | 2015 | |||||||
Banco Agromercantil de Guatemala, S. A. | 104,152 | 111,566 | ||||||
Less- | ||||||||
Short-term portion | (14,783 | ) | (14,786 | ) | ||||
|
|
|
| |||||
Long-term debt with financial entities | 89,369 | 96,780 | ||||||
|
|
|
| |||||
F-165
Table of Contents
Distribuidora de Electricidad de Oriente, S. A.—DEORSA
Notes to the condensed interim financial statements
As of June 30 2016 and December 31, 2015 and for the six and three-month period ended June 30,
2016 and 2015 (unaudited)
(Stated in Thousands of U.S. Dollars, except otherwise indicated)
The movement during the six-month periods ended June 30, is presented as follows:
2016 | 2015 | |||||||
Initial balance | 111,566 | 103,354 | ||||||
Exchange difference | 53 | (124 | ) | |||||
Loans obtained | 1,013 | 40,586 | ||||||
Payments made | (8,408 | ) | (24,443 | ) | ||||
Translation effect | (72 | ) | �� | (377 | ) | |||
|
|
|
| |||||
| 104,152 | 118,996 | |||||||
|
|
|
| |||||
Obligations
There were no significant changes in the obligations of financial information, social and environmental requirements, property maintenance, insurance maintenance, interest rate protection, and other obligations for the loan as of June 30, 2016 with respect to those described in Note 24 of the financial statements as of December 31, 2015, 2014 and 2013 and January 1, 2013 and for the years ended December 31, 2015, 2014 and 2013 issued on September 10, 2016.
According to the loan contract, the calculation of the ratios described in Note 24 of the financial statements as of December 31, 2015, 2014 and 2013 and January 1, 2013 and for the years ended December 31, 2015, 2014 and 2013 issued on September 10, 2016, is carried out over a combined basis, which includes the figures of Distribuidora de Electricidad de Occidente, S.A. (related party) and Distribuidora de Electricidad de Oriente, S.A. During the six-month period ended on June 30, 2016 and December 31, 2015 there was no infringement on the related financial agreements.
During the three months period ended June 30, 2016, there was a decrease in financial expenses, when compared to the first quarter, because the Company had a gain on foreign exchange difference of US$721 due to the foreign exchange effect when bank loans were translated into the functional currency.
13. Contingencies
There were no significant developments in the contingencies for legal proceedings as of June 30, 2016 with respect to those described in Note 30 of the financial statements as of December 31, 2015, 2014 and 2013 and January 1, 2013 and for the years ended December 31, 2015, 2014 and 2013, issued on September 10 , 2016. See note 15 for the subsequent event.
14. Commitments
There were no significant changes in the commitments as of June 30, 2016 with respect to those described in Note 33 of the financial statements as of December 31, 2015, 2014 and 2013 and January 1, 2013 and for the years ended December 31, 2015, 2014 and 2013 issued on September 10, 2016.
Financial instruments
The Company manages its capital structure to ensure the continuity as going concern, while it maximizes the return to its shareholders through the optimization of the debt and equity balances. The Company’s overall strategy remains unchanged from December 31, 2015.
F-166
Table of Contents
Distribuidora de Electricidad de Oriente, S. A.—DEORSA
Notes to the condensed interim financial statements
As of June 30 2016 and December 31, 2015 and for the six and three-month period ended June 30,
2016 and 2015 (unaudited)
(Stated in Thousands of U.S. Dollars, except otherwise indicated)
The working capital structure of the Company is constituted by indebtedness as a financial cost (loans), offset by cash and cash equivalents, and restricted cash, and equity comprising issued capital, reserves, retained earnings, attributed to the shareholders.
Management of financial risk
The Company is exposed continuously to credit, liquidity, and market risks originated by exchange rate, interest rate, and price variations. These risks are managed through specific policies and procedures established by the Company’s financial management. There have been no changes in the risk management or risk management policies applied by the Company since December 31, 2015.
Financial instruments that are not measured at fair value
The carrying amounts of financial assets and liabilities related to cash and cash equivalents, restricted cash, accounts receivables from related parties, other receivables, trade receivables, creditors, trade and other accounts payable, accounts payable to related parties, other liabilities and debt with financial entities included in the condensed interim statement of financial position as of June 30, 2016 and December 31, 2015, approximate to their fair values. Debt with financial entities are subsequently measured at amortized cost considering the effective interest rate method, which approximate to its fair value since the debt is agreed at variable interest rates which are reviewed periodically. The other financial assets and financial liabilities measured at amortized cost, approximate their fair value due to their short-term maturity or because they are agreed at interest rates similar to market interest rate.
Fair value measurements recognized in the statement of financial position
The following information provides an analysis of financial instruments that are measured subsequent to initial recognition at fair value, grouped into a three-level fair value hierarchy as mandated by IFRS 13, as follows:
| • | Level 1 fair value measurements are those derived from inputs from quoted market prices (unadjusted) in active markets for identical assets or liabilities. |
| • | Level 2 fair value measurements are those derived from inputs other than quoted prices included within |
| • | Level 1, that are observable for the asset or liability, either directly (i.e., as prices) or indirectly (i.e., derived from prices). |
| • | Level 3 fair value measurements are those derived from unobservable inputs for the assets or liabilities. |
The methodology used to determine the fair value of the interest rate swap is a standard valuation technique of discounted expected cash flows estimated with forward rate curve and is categorized as Level 2.
Between December 31, 2015 and June 30, 2016, there have been no significant changes in business or economic circumstances affecting the fair value of the Company’s financial assets and liabilities (either measured at fair value or amortized cost).
In addition, no transfer has occurred among the different hierarchies used to determine the fair value of the Company’s financial instruments.
F-167
Table of Contents
Distribuidora de Electricidad de Oriente, S. A.—DEORSA
Notes to the condensed interim financial statements
As of June 30 2016 and December 31, 2015 and for the six and three-month period ended June 30,
2016 and 2015 (unaudited)
(Stated in Thousands of U.S. Dollars, except otherwise indicated)
As of June 30, 2016 and December 31, 2015, financial assets and liabilities of the Company are made up as follows:
June 30, | December 31, | |||||||
2016 | 2015 | |||||||
Financial assets: | ||||||||
Measured at amortized cost | ||||||||
Trade receivables | 41,145 | 39,156 | ||||||
Other receivables | 3,040 | 3,871 | ||||||
Restricted cash | 1,848 | 1,848 | ||||||
Cash and cash equivalents | 5,238 | 36,049 | ||||||
|
|
|
| |||||
| 51,271 | 80,924 | |||||||
|
|
|
| |||||
Financial liabilities: | ||||||||
Measured at amortized cost | ||||||||
Debt with financial entities | 104,152 | 111,566 | ||||||
Other liabilities | 30,103 | 27,156 | ||||||
Trade and other accounts payable | 33,175 | 36,367 | ||||||
Creditors | 24 | 20 | ||||||
|
|
|
| |||||
| 167,454 | 175,109 | |||||||
|
|
|
| |||||
Liquidity risk
The Company practices a careful liquidity risk management and, therefore, keeps cash and other instruments liquid, as well as available funds. However, as of June 30, 2016, the condensed financial statements reflect a negative working capital of 25,595, thus the Management will be focused on the remaining months of 2016 on two objectives to revert that situation: a) improving the collection ratio for the accounts receivable and b) reducing the energy loss ratio.
To comply with those objectives, the Management has planned to perform the following:
| a) | Follow up the creation of dialogue and negotiation tables with community leaders and municipal authorities to improve collection timing, prevent non-technical losses; |
| b) | Reduce technical and non-technical losses; |
| c) | Improve debt ratio management and obtain longer-term loans; |
The management of the Company considers that the liquidity risk exposure is low since the Company has been generating cash flow from its operating activities and has access to loans and financial resources, as explained in Note 24 of the financial statements as of December 31, 2015, 2014 and 2013 and January 1, 2013, and for the years ended December 31, 2015, 2014 and 2013,, issued on September 10, 2016. Additionally, DEORSA´s management do not anticipate making significant payments during 2016 related to Deposits Received from Consumers (see Note 3.n of the financial statements as of December 31, 2015, 2014 and 2013 and January 1, 2013, and for the years ended December 31, 2015, 2014 and 2013, issued on September 10, 2016).
F-168
Table of Contents
Distribuidora de Electricidad de Oriente, S. A.—DEORSA
Notes to the condensed interim financial statements
As of June 30 2016 and December 31, 2015 and for the six and three-month period ended June 30,
2016 and 2015 (unaudited)
(Stated in Thousands of U.S. Dollars, except otherwise indicated)
15. Subsequent events
The Company has evaluated subsequent events as at June 30, 2016 to assess the need for potential recognition or disclosure in these financial statements. Such events were assessed until October 6, 2016, the date these financial statements were available to be issued. Based on this evaluation, it was determined that there were no subsequent events requiring recognition or disclosure in the financial statements, except for the following matters:
| a. | On July 26, 2016 CNEE published resolutions CNEE-203-2016 and CNEE-204-2016 which approved the new non-social and social tariffs, respectively. Under such resolutions, the electricity adjustment surcharge (see note 1.a of the financial statements as of December 31, 2015, 2014 and 2013 and January 1, 2013, and for the years ended December 31, 2015, 2014 and 2013,, issued on September 10, 2016) was determined by CNEE in order to be considered as tariff adjustments for the quarter period from August 1 to October 31, 2016 of the non-social and social tariffs the amounts of US$1,503 and US$1,912, respectively. In addition the CNEE also indicated that the remaining accumulated surcharge from prior periods for non-social and social users tariffs, in the amounts of US$15,530 and US$5,534 respectively, will be considered as tariff adjustments for the following quarter, including an annual simple interest rate of 7% on such amounts. |
| b. | On July 26, 2016 DEORSA become aware of legal proceeding initiated by the Guatemalan Tax Administration (“SAT”) for payment of purported back income taxes for approximately US$6,384 (Q.48,521) for the years 2011 and 2012. Such amount is subject to interest charges and penalties. SAT alleges that the deductions made by the Company of the interest expenses and amortization of goodwill from the taxable income were improper. The transaction dates back to 2011, when the Company’s former controlling shareholder (ASROED S. A.) acquired the shares of DEORSA and was subsequently merged with the Company in 2011. The SAT may further seek purported back income taxes for the years 2013, 2014 and 2015. The Company estimates that such back income taxes could sum up to the amount of approximately US$10,222 (Q.77,692). |
At a hearing on August 9 2016, the Company reached an understanding with SAT where it will conditionally pay within the next 60 days the purported back income taxes for the years 2011 and 2012 comprising the principal, interest and penalties claimed by the SAT. In order to release the bank accounts’ seizure imposed by the tribunal, to reduce any resulting penalties by the SAT and to prevent further legal actions from the SAT for the purported back income taxes for the years 2013, 2014 and 2015, the Company paid on August 9, 2016 the amount of US$6,747 (Q.51,275) comprising principal, interest and penalties for the years 2014 and 2015, on August 10, 2016 the amount of US$6,384 (Q.48,521) related to income taxes for the years 2011 and 2012 and on August 19, 2016 the amount of US$4,922 (Q.37,405) comprising of principal, interest and penalties for the year 2013. An approximately payment up to US$8,368 (Q.63,596) subject to recalculation as of the date of payment, related to penalties and interests for year 2011 and 2012 will be made during 60 days beginning August 10, 2016. Furthermore, the Company has notified the SAT that while it is making all such payments it is reserving all its legal rights to seek restitution by contesting legally the merits of the SAT’s claim. DEORSA’s management and its legal advisors consider that the Company has all legal rights and, hence, that it will initiate the necessary legal procedures to pursue the collection of the amounts paid in connection with such claim.
Since the inception of the transactions in 2011 and up to date, the opinion of DEORSA’s management and its legal and tax advisors is that the transactions that generated the interest expenses and the amortization of goodwill deductions gave rise to legitimate tax deductions. This position was confirmed in February 2015 by a
F-169
Table of Contents
Distribuidora de Electricidad de Oriente, S. A.—DEORSA
Notes to the condensed interim financial statements
As of June 30 2016 and December 31, 2015 and for the six and three-month period ended June 30,
2016 and 2015 (unaudited)
(Stated in Thousands of U.S. Dollars, except otherwise indicated)
binding ruling issued by the SAT. Hence, DEORSA’s management considers, based on the opinion of its tax and legal advisors, there is a probability greater than 50% in the recoverability of these payments as a result of the final outcome of this claim and of the other recourses to be initiated by the Company. These payments will be treated as an income tax payments in excess and presented in the third quarter financial statements as account receivable.
On August 2016, the Company signed an addendum to the existing long term syndicated loan. Such addendum renewed Tranche H of the long term syndicated loan in the amount of US$11,200 and Q.37,200, at an US Libor rate for three months plus a spread of 4.75%, with a floor interest rate of 6% for the dollar portion and Active Weighted Average rate less 6.10% for the portion in Quetzales. The term of the Tranche is up to month, year, with a grace period until May 2018 and equal quarterly principal payments thereafter.
16. Approval of condensed interim financial statements
The condensed interim financial statements as of June 30, 2016 were approved by the Company’s Management Committee on October 6, 2016.
* * * * * *
F-170
Table of Contents
Distribuidora de Electricidad de
Occidente, S.A.—DEOCSA
Condensed Interim Financial Statements as of June 30,
2016 and December 31, 2015 and for the six
and three-month periods ended
June 30, 2016 and 2015 (unaudited)
Table of Contents
Distribuidora de Electricidad de Occidente, S.A.—DEOCSA
Condensed Interim Financial Statements as of June 30, 2016 and December 31, 2015 and for the six and three-month periods ended June 30, 2016 and 2015 (unaudited)
Content | Pages | |
Condensed interim statements of profit or loss and other comprehensive income | F-173 | |
| F-174 | ||
Condensed interim statements of changes in shareholders’ equity | F-176 | |
| F-177 | ||
| F-179 | ||
Table of Contents
Distribuidora de Electricidad de Occidente, S.A.—DEOCSA
Condensed Interim Statements of Profit or Loss and Other Comprehensive Income
For the six and three-month periods ended June 30, 2016 and 2015, and for the 21-day period from January 1,
2016 to January 21, 2016 and the 161-day period from January 22, 2016 to June 30, 2016 (unaudited)
(Stated in Thousands of U.S. Dollars, except otherwise indicated)
Notes | Six 2016 | Six 2015 | Three | Three | 21 days | 161 days to June 30, 2016 | ||||||||||||||||||||||
Revenue | ||||||||||||||||||||||||||||
Energy sales | 5 | 151,996 | 159,994 | 75,516 | 75,892 | 19,448 | 132,548 | |||||||||||||||||||||
Services rendered | 2,360 | 1,719 | 1,404 | 1,115 | 322 | 2,038 | ||||||||||||||||||||||
Other revenue | 4,028 | 4,200 | 1,778 | 2,951 | 298 | (1) | 3,730 | (1) | ||||||||||||||||||||
|
|
|
|
|
|
|
|
|
|
|
| |||||||||||||||||
Total revenue | 158,384 | 165,913 | 78,698 | 79,958 | 20,068 | 138,316 | ||||||||||||||||||||||
Cost of sales | ||||||||||||||||||||||||||||
Energy purchases | 6 | (103,077 | ) | (98,845 | ) | (50,442 | ) | (49,111 | ) | (12,000 | ) | (91,077 | ) | |||||||||||||||
Other costs of sales | (18,507 | ) | (17,977 | ) | (8,639 | ) | (9,043 | ) | (2,814 | )(2) | (15,693 | )(2) | ||||||||||||||||
|
|
|
|
|
|
|
|
|
|
|
| |||||||||||||||||
Total costs of sales | (121,584 | ) | (116,822 | ) | (59,081 | ) | (58,154 | ) | (14,814 | ) | (106,770 | ) | ||||||||||||||||
Gross profit | 36,800 | 49,091 | 19,617 | 21,804 | 5,254 | 31,546 | ||||||||||||||||||||||
General, selling and administrative expense | (20,208 | ) | (17,873 | ) | (11,214 | ) | (8,722 | ) | (3,379 | ) | (16,829 | ) | ||||||||||||||||
Financial income | 1,015 | 1,097 | 455 | 642 | 129 | 886 | ||||||||||||||||||||||
Financial expenses | (7,906 | ) | (8,869 | ) | (2,459 | ) | (4,659 | ) | (877 | ) | (7,029 | ) | ||||||||||||||||
|
|
|
|
|
|
|
|
|
|
|
| |||||||||||||||||
Profit before income tax | 9,701 | 23,446 | 6,399 | 9,065 | 1,127 | 8,574 | ||||||||||||||||||||||
Income tax | 7 | (2,975 | ) | (6,125 | ) | (1,938 | ) | (2,368 | ) | (336 | ) | (2,639 | ) | |||||||||||||||
|
|
|
|
|
|
|
|
|
|
|
| |||||||||||||||||
Profit for the period | 6,726 | 17,321 | 4,461 | 6,697 | 791 | 5,935 | ||||||||||||||||||||||
Other comprehensive loss (income) net of income tax | ||||||||||||||||||||||||||||
Items that will not be reclassified subsequently to profit or loss: | ||||||||||||||||||||||||||||
Translation differences | (100 | ) | (408 | ) | 906 | 249 | 31 | (131 | ) | |||||||||||||||||||
Remeasurement of defined benefit obligation | (154 | ) | — | (154 | ) | — | — | (154 | ) | |||||||||||||||||||
Items that would be reclassified subsequently to profit or loss: | ||||||||||||||||||||||||||||
Cash flow hedge | 168 | 86 | 8 | 981 | 22 | 146 | ||||||||||||||||||||||
|
|
|
|
|
|
|
|
|
|
|
| |||||||||||||||||
Other comprehensive (loss) income of the period, net of income tax | (86 | ) | (322 | ) | 760 | 1,230 | 53 | (139 | ) | |||||||||||||||||||
|
|
|
|
|
|
|
|
|
|
|
| |||||||||||||||||
Total comprehensive income for the period | 6,640 | 16,999 | 5,221 | 7,927 | 844 | 5,796 | ||||||||||||||||||||||
|
|
|
|
|
|
|
|
|
|
|
| |||||||||||||||||
| (1) | Include revenues recognized from government grants of US$181 and US$1,418 for the 21-day period from January 1, 2016 to January 21, 2016 and for the 161-day period from January 22, 2016 to June 30, 2016, respectively. |
| (2) | Includes amortization of intangible assets of US$77 and US$605 for the 21-day period from January 1, 2016 to January 21, 2016 and for the 161-day period from January 22, 2016 to June 30, 2016, respectively. |
The accompanying notes are part of these condensed interim financial statements.
F-173
Table of Contents
Distribuidora de Electricidad de Occidente, S.A.—DEOCSA
Condensed interim statements of financial position
As of June 30, 2016 and as of December 31, 2015 (unaudited)
(Stated in Thousands of U.S. Dollars, except otherwise indicated)
Notes | 2016 | 2015 | ||||||||||
Assets | ||||||||||||
Non-current assets: | ||||||||||||
Property, plant and equipment | 10 | 280,646 | 280,611 | |||||||||
Intangible assets | 76,773 | 77,063 | ||||||||||
Long-term trade receivables | 8 | 18,870 | 17,783 | |||||||||
Other receivables | 3,398 | 3,494 | ||||||||||
|
|
|
| |||||||||
Total non-current assets | 379,687 | 378,951 | ||||||||||
|
|
|
| |||||||||
Current assets: | ||||||||||||
Other assets | 193 | 32 | ||||||||||
Inventory | 574 | 487 | ||||||||||
Trade receivables | 8 | 58,455 | 59,405 | |||||||||
Other receivables | 1,252 | 3,586 | ||||||||||
Taxes receivables | 729 | 109 | ||||||||||
Accounts receivable from related parties | 9 | 54 | 131 | |||||||||
Restricted cash | 2,857 | 2,875 | ||||||||||
Cash and cash equivalents | 3,830 | 5,203 | ||||||||||
|
|
|
| |||||||||
Total current assets | 67,944 | 71,828 | ||||||||||
|
|
|
| |||||||||
Total assets | 447,631 | 450,779 | ||||||||||
|
|
|
| |||||||||
The accompanying notes are part of these condensed interim financial statements.
F-174
Table of Contents
Distribuidora de Electricidad de Occidente, S.A.—DEOCSA
Condensed interim statements of financial position
As of June 30, 2016 and as of December 31, 2015 (unaudited)
(Stated in Thousands of U.S. Dollars, except otherwise indicated)
Notes | 2016 | 2015 | ||||||||||
Shareholders’ equity and liabilities | ||||||||||||
Shareholders’ equity: | ||||||||||||
Capital stock | 63,200 | 63,200 | ||||||||||
Legal reserve | 10,763 | 9,322 | ||||||||||
Accumulated other comprehensive loss—cash flows hedge | — | (168 | ) | |||||||||
Accumulated other comprehensive loss—remeasurement of defined benefit obligation | (1,514 | ) | (1,360 | ) | ||||||||
Accumulated other comprehensive loss—Translation differences | (1,552 | ) | (1,454 | ) | ||||||||
Retained earnings | 20,500 | 28,061 | ||||||||||
|
|
|
| |||||||||
Total shareholders’ equity | 91,397 | 97,601 | ||||||||||
|
|
|
| |||||||||
Non-current liabilities: | ||||||||||||
Debt with financial entities—long term | 11 | 137,356 | 148,882 | |||||||||
Deferred revenues | 71,499 | 73,154 | ||||||||||
Provisions | 7,556 | 7,243 | ||||||||||
Deferred income tax, net | 5,441 | 5,604 | ||||||||||
Other long-term liabilities | 2,873 | 2,702 | ||||||||||
|
|
|
| |||||||||
Total non-current liabilities | 224,725 | 237,585 | ||||||||||
|
|
|
| |||||||||
Current liabilities: | ||||||||||||
Debt with financial entities—short term | 11 | 22,998 | 23,002 | |||||||||
Other financial obligations—short term | — | 364 | ||||||||||
Accounts payables to related parties | 9 | 15,737 | 116 | |||||||||
Trade and other accounts payable | 45,972 | 49,835 | ||||||||||
Creditors | 15 | 12 | ||||||||||
Tax payables | 5,501 | 4,968 | ||||||||||
Other liabilities | 39,444 | 35,917 | ||||||||||
Employee benefits payable | 1,842 | 1,379 | ||||||||||
|
|
|
| |||||||||
Total current liabilities | 131,509 | 115,593 | ||||||||||
|
|
|
| |||||||||
Total liabilities | 356,234 | 353,178 | ||||||||||
|
|
|
| |||||||||
Total liabilities and shareholders’ equity | 447,631 | 450,779 | ||||||||||
|
|
|
| |||||||||
The accompanying notes are part of these condensed interim financial statements.
F-175
Table of Contents
Distribuidora de Electricidad de Occidente, S.A.—DEOCSA
Condensed interim statements of changes in shareholder’s equity
For the six month periods ended June 30, 2016 and 2015 (unaudited)
(Stated in Thousands of U.S. Dollars, except otherwise indicated)
Accumulated other comprehensive | ||||||||||||||||||||||||||||
Capital Stock | Legal | Retained Earnings | Cash Flows Hedge | Remeasurement of defined benefit | Translation | Total | ||||||||||||||||||||||
Balances as of January 1, 2015 | 63,200 | 10,078 | 31,279 | (524 | ) | (806 | ) | (964 | ) | 102,263 | ||||||||||||||||||
Movements for the six-month period ended June 30, 2015 | ||||||||||||||||||||||||||||
Cash dividends declared | — | — | (25,023 | ) | — | — | — | (25,023 | ) | |||||||||||||||||||
Transfer to legal reserve | — | (756 | ) | 756 | — | — | — | — | ||||||||||||||||||||
Loss from cash flows hedge, net of income tax | — | — | — | 89 | — | — | 89 | |||||||||||||||||||||
Translations differences | — | — | — | — | — | (408 | ) | (408 | ) | |||||||||||||||||||
Profit for the period | — | — | 17,321 | — | — | — | 17,321 | |||||||||||||||||||||
|
|
|
|
|
|
|
|
|
|
|
|
|
| |||||||||||||||
Balances as of June 30, 2015, | 63,200 | 9,322 | 24,333 | (435 | ) | (806 | ) | (1,372 | ) | 94,242 | ||||||||||||||||||
|
|
|
|
|
|
|
|
|
|
|
|
|
| |||||||||||||||
Balances as of January 1, 2016 | 63,200 | 9,322 | 28,061 | (168 | ) | (1,360 | ) | (1,454 | ) | 97,601 | ||||||||||||||||||
Movements for the six-month period ended June 30, 2016 | ||||||||||||||||||||||||||||
Transfer to legal reserve | — | 1,441 | (1,441 | ) | — | — | — | |||||||||||||||||||||
Cash dividends declared | — | — | (12,846 | ) | — | — | — | (12,846 | ) | |||||||||||||||||||
Remeasurement of defined benefit obligation, net of income tax | — | — | — | — | (154 | ) | — | (154 | ) | |||||||||||||||||||
Loss from cash flows hedge, net of income tax | — | — | — | 168 | — | — | 168 | |||||||||||||||||||||
Translations differences | — | — | — | — | — | (98 | ) | (98 | ) | |||||||||||||||||||
Profit of the period | — | — | 6,726 | — | — | — | 6,726 | |||||||||||||||||||||
|
|
|
|
|
|
|
|
|
|
|
|
|
| |||||||||||||||
Balances as of June 30, 2016 | 63,200 | 10,763 | 20,500 | — | (1,514 | ) | (1,552 | ) | 91,397 | |||||||||||||||||||
|
|
|
|
|
|
|
|
|
|
|
|
|
| |||||||||||||||
The accompanying notes are part of these condensed interim financial statements.
F-176
Table of Contents
Distribuidora de Electricidad de Occidente, S.A.—DEOCSA
Condensed interim statements of cash flows
For the six month periods ended June 30, 2016 and 2015 (unaudited)
| Six month period ended | ||||||||
June, 2016 | June, 2015 | |||||||
Cash flows from operating activities: | ||||||||
Profit for the period | 6,726 | 17,321 | ||||||
Adjustments from: | ||||||||
Depreciation and amortization | 6,962 | 7,283 | ||||||
Accrued revenue—government grants | (1,599 | ) | (1,712 | ) | ||||
Impairment losses recognized on receivables from doubtful accounts | 9,819 | 8,434 | ||||||
Gain on disposal of property, plant and equipment | 13 | — | ||||||
Provision for contingencies | (119 | ) | — | |||||
Interest from deposits received from consumers | 2,202 | 1,896 | ||||||
Effective cash flows hedge | (111 | ) | (159 | ) | ||||
Finance costs recognized in profit or loss | 5,414 | 5,142 | ||||||
Exchange differences | 94 | (244 | ) | |||||
Income tax expense | 2,975 | 6,125 | ||||||
Changes in working capital: | ||||||||
Inventory | (665 | ) | (1,308 | ) | ||||
Other assets | (163 | ) | (857 | ) | ||||
Trade receivables | (10,056 | ) | (7,511 | ) | ||||
Other receivables | 2,426 | (272 | ) | |||||
Taxes receivables | — | 327 | ||||||
Related parties | 183 | 856 | ||||||
Severance pay compensation | (101 | ) | (227 | ) | ||||
Provisions for contingencies | 332 | (193 | ) | |||||
Tax payables | (72 | ) | 226 | |||||
Other liabilities | 1,314 | 531 | ||||||
Trade and other accounts payable | (3,831 | ) | (3,868 | ) | ||||
Creditors | 2 | (552 | ) | |||||
Employee benefits payable | 464 | 167 | ||||||
|
|
|
| |||||
Cash from operating activities | 22,209 | 31,405 | ||||||
Income tax paid | (3,156 | ) | (12,191 | ) | ||||
Payment of interest | (5,414 | ) | (5,142 | ) | ||||
|
|
|
| |||||
Net cash flows generated from operating activities | 13,639 | 14,072 | ||||||
(Continues)
F-177
Table of Contents
Distribuidora de Electricidad de Occidente, S.A.—DEOCSA
Condensed interim statements of cash flows
For the six month periods ended June 30, 2016 and 2015 (unaudited)
| Six month period ended | ||||||||
| June, 2016 | June, 2015 | |||||||
Cash flows from investing activities: | ||||||||
Payments for property, plant and equipment | (5,973 | ) | (5,550 | ) | ||||
Payments for intangible assets | (443 | ) | (211 | ) | ||||
Proceeds from disposal of property, plant and equipment | 37 | — | ||||||
|
|
|
| |||||
Net cash flow used in investing activities | (6,379 | ) | (5,761 | ) | ||||
Cash flows from financing activities: | ||||||||
Funds received from government grants | — | 174 | ||||||
Proceeds (payments) of loans from related parties | 15,516 | (4,853 | ) | |||||
Restricted cash | 18 | — | ||||||
Long-term creditors | 174 | (8 | ) | |||||
Loans obtained from a bank | 7,094 | 58,808 | ||||||
Payment of bank loans | (18,549 | ) | (33,517 | ) | ||||
Payment of dividends | (12,846 | ) | (25,023 | ) | ||||
|
|
|
| |||||
Net cash flow used in financing activities | (8,593 | ) | (4,419 | ) | ||||
|
|
|
| |||||
Net (decrease) increase in cash equivalents | (1,333 | ) | 3,892 | |||||
Cash and cash equivalents at the beginning of the period | 5,203 | 5,622 | ||||||
Effects of exchange rate changes on cash and cash changes on cash and cash equivalents | (40 | ) | 66 | |||||
|
|
|
| |||||
Cash and cash equivalents at the end of period. | 3,830 | 9,580 | ||||||
|
|
|
| |||||
(Conclude)
The accompanying notes are part of these condensed interim financial statements.
F-178
Table of Contents
Distribuidora de Electricidad de Occidente, S.A.—DEOCSA
Notes to the condensed interim financial statements
As of June 30, 2016 and December 31, 2015 and for the six and three-month periods ended
June 30, 2016 and 2015 (unaudited)
(Stated in Thousands of U.S. Dollar, except otherwise indicated)
1. Operations of the Company and basis of preparation of the condensed interim financial statements
a. Operations of the Company
Distribuidora de Electricidad de Occidente, Sociedad Anónima—DEOCSA (hereinafter “DEOCSA” or the “Company”) a majority-owned subsidiary of DEOCSA B.V. was incorporated on October 28, 1998 in the Republic of Guatemala in accordance with the commercial laws of the country and was authorized to operate for an indefinite term. It is located in the City of Guatemala and its address is Diagonal 6, 10-50, zone 10.
The Company’s main activity consists of the distribution of electricity to final consumers in the western departments of the Republic of Guatemala, such as: Quetzaltenango, San Marcos, Totonicapán, Huehuetenango, Chimaltenango, Sololá, Suchitepéquez, Retalhuleu and Quiché.
Under Agreement No. 401-98 of the Ministry of Energy and Mining dated December 14, 1998 the Empresa de Distribución de Energía Eléctrica del INDE (the Electric Energy Distribution Company of INDE)—Western Region—EDEEROC, was authorized to transfer to the Company for a fifty-year period the service of final distribution of electricity in the abovementioned departments (the “Concession”).
All the revenues and the non-current assets of the Company are generated and are located, respectively, in Guatemala.
On January 22, 2016, I.C. Power Ltd. through IC Power Distribution Holding Pte. Limited, a wholly-owned subsidiary of Kenon Holdings Ltd (“Kenon”), acquired 100% of the shares of DEOCSA BV, owner of 90.83% of the Company’s capital stock. As a result, I.C. Power Ltd. took the effective control for directing the financial and operating policies of the Company. On March 17, 2016, as part of the reorganization process carried out by Kenon in order to list IC Power Pte. Ltd. in the US stock exchange, Kenon transferred all of the shares of I.C. Power Ltd. to I.C. Power Pte. Ltd. (“ICPS”), a wholly owned subsidiary of Kenon incorporated in Singapore.
b. Basis of Preparation of the Condensed Interim Financial Statements
The unaudited condensed interim financial statements have been prepared in accordance with the International Accounting Standard No. 34 Interim Financial Information. Selected explanatory notes are included to explain the events and transactions that are significant for the understanding of the changes in the financial position and the results of the Company for the six-month period ended June 30, 2016 and 2015. These unaudited condensed interim financial statements do not include all of the information required by the complete annual financial statements prepared in accordance with the International Financial Reporting Standards.
These unaudited condensed interim financial statements should be read in conjunction with the Company’s financial statements as of December 31, 2015, 2014 and 2013 and January 1, 2013 and for the years ended December 31, 2015, 2014 and 2013 issued on September 10, 2016.
The financial information as of December 31, 2015 presented in these unaudited condensed interim financial statements is derived from our financial statements as of December 31, 2015, 2014 and 2013 and January 1, 2013 and for the years ended December 31, 2015, 2014 and 2013 issued on September 10, 2016.
F-179
Table of Contents
Distribuidora de Electricidad de Occidente, S.A.—DEOCSA
Notes to the condensed interim financial statements
As of June 30, 2016 and December 31, 2015 and for the six and three-month periods ended
June 30, 2016 and 2015 (unaudited)
(Stated in Thousands of U.S. Dollar, except otherwise indicated)
In the opinion of management, these unaudited condensed interim financial statements reflect all normal recurring adjustments, which are necessary for a fair representation of financial results for the interim periods presented.
As described above, since January 22, 2016, I.C. Power Ltd. took effective control for directing the financial and operating policies of the Company and on March 17, 2016, Kenon transferred all of the shares of DEOCSA BV of I.C. Power Ltd. to I.C. Power Pte. Ltd. The Company has prepared these condensed financial statements for consolidation purposes of I.C. Power Pte. Ltd. and its consolidated subsidiary Inkia Energy Ltd., and it has included as additional information the results of operations for the 21-day period from January 1, 2016 to January 21, 2016 and for the 161-day period from January 22, 2016 to June 30, 2016
The results of operations for six and three-month periods ended June 30, 2016 and 2015 or for the 21-day period from January 1, 2016 to January 21, 2016 and for the 161-day period from January 22, 2016 to June 30, 2016 are not necessarily indicative of the results for the full year. The Company believes that the disclosures are adequate to make the information presented not misleading.
2. Application of new and revised International Financial Reporting Standards
2.1 Adoption of new and revised standards
The Company has adopted all of the new and revised standards and interpretations issued by the IASB that are relevant to its operations and that are mandatorily effective at June 30, 2016 as described in note 2.1 to the Company’s financial statements as of December 31, 2015, 2014 and 2013 and January 1, 2013 and for the years ended December 31, 2015, 2014 and 2013 issued on September 10, 2016. The new and revised standards and interpretations adopted did not have impact on these condensed interim financial statements.
2.2 New accounting pronouncements
During the six-month period ended June 30 2016, there were no new accounting pronouncements applicable to the Company, besides the new and revised IFRSs that have been issued but are not yet mandatorily effective as described in note 2.1 to the financial statements as of December 31, 2015, 2014 and 2013 and for the years ended December 31, 2015, 2014 and 2013 issued on September 10, 2016. The management of the Company foresee that the application of these new or revised standards will not have a material impact over these condensed interim financial statements except for IFRS 15 and IFRS 16 that the Company is evaluating and cannot, at this time, estimate the potential impact on its future financial condition, results of operations and cash flows.
3. Significant accounting policies
The accounting policies applied by the Company in these condensed interim financial statements are consistent with those followed in the preparation of the annual financial statements as of December 31, 2015, 2014 and 2013 and January 1,2013 and for the years ended December 31, 2015, 2014 and 2013 issued on September 10, 2016, except for the adoption of new standards and interpretations effective as of January 1st, 2016. The Company has not early adopted any other standard, interpretation or amendment that has been issued but is not yet effective.
The preparation of interim financial statements requires management to make judgements, estimates and assumptions that affect the application of accounting policies and the reported amounts of assets and liabilities, income and expenses. Actual results may differ from these estimates.
F-180
Table of Contents
Distribuidora de Electricidad de Occidente, S.A.—DEOCSA
Notes to the condensed interim financial statements
As of June 30, 2016 and December 31, 2015 and for the six and three-month periods ended
June 30, 2016 and 2015 (unaudited)
(Stated in Thousands of U.S. Dollar, except otherwise indicated)
In preparing these condensed interim financial statements, the significant judgements made by management in applying the Company’s accounting policies and the key sources of estimation uncertainty were the same as those that applied to the financial statements as of December 31, 2015, 2014 and 2013 and January 1, 2013 and for the years ended December 31, 2015, 2014 and 2013 issued on September 10, 2016.
4. Monetary unit and exchange rate
The legal currency of Guatemala is the quetzal, represented by the symbol “Q” in the condensed interim financial statements.
As of June 30 2016 and December 31, 2015, the reference exchange rate published by the Central Bank of Guatemala was Q.7.64 and Q.7.63, respectively.
There are no exchange restrictions in Guatemala for the repatriation of capital, payment to creditors or for any other purpose; foreign currency may be freely negotiated for any amount in banks of the banking system or in authorized foreign currency exchange offices, in accordance with the current law in effect, per Decree number 94 -2000 Law of Free Negotiation of Currencies.
5. Energy sales
Revenues from electric energy sales obtained during the six-month and three-month periods ended June 30, 2016 and 2015, respectively, is presented as follows:
Six month period | Three month period | |||||||||||||||
2016 | 2015 | 2016 | 2015 | |||||||||||||
Simple LV | 114,029 | 118,599 | 56,908 | 56,065 | ||||||||||||
Public Lighting | 17,769 | 17,480 | 8,967 | 8,387 | ||||||||||||
Non-regulated tariff | 5,278 | 8,679 | 2,190 | 4,215 | ||||||||||||
LV on demand OP | 7,509 | 8,024 | 3,691 | 3,777 | ||||||||||||
LV on demand P | 4,300 | 4,131 | 2,128 | 1,969 | ||||||||||||
MV on demand OP | 793 | 891 | 348 | 280 | ||||||||||||
Non-regulated special tariff | 1,279 | 1,318 | 808 | 635 | ||||||||||||
MV on demand | 1,039 | 872 | 476 | 564 | ||||||||||||
|
|
|
|
|
|
|
| |||||||||
| 151,996 | 159,994 | 75,516 | 75,892 | |||||||||||||
|
|
|
|
|
|
|
| |||||||||
The abbreviations indicated above correspond to:
LV: Low voltage; MV: medium voltage; OP: Off-peak; P: peak
Revenues associated with Low Voltage and Non regulated tariff decreased in the first semester of 2016, primarily due to lower average base rate approved by the National Commission of Electric Energy (CNEE in Spanish) of (6.3%) partially offset by higher energy supplied of 1.8%.
F-181
Table of Contents
Distribuidora de Electricidad de Occidente, S.A.—DEOCSA
Notes to the condensed interim financial statements
As of June 30, 2016 and December 31, 2015 and for the six and three-month periods ended
June 30, 2016 and 2015 (unaudited)
(Stated in Thousands of U.S. Dollar, except otherwise indicated)
6. Energy purchases
During the six-month and three-month periods ended June 30, 2016 and 2015, respectively, electric energy purchases were as follows:
Six month period | Three month period | |||||||||||||||
2016 | 2015 | 2016 | 2015 | |||||||||||||
Contracts with suppliers | 101,384 | 72,377 | 49,843 | 36,051 | ||||||||||||
In the spot market | 1,693 | 26,468 | 599 | 13,060 | ||||||||||||
|
|
|
|
|
|
|
| |||||||||
| 103,077 | 98,845 | 50,442 | 49,111 | |||||||||||||
|
|
|
|
|
|
|
| |||||||||
The Company manages an average of 60 days of credit with its suppliers from the receipt date of the invoice. Suppliers do not charge interest on the late payment of outstanding invoices.
During this semester of 2016, energy purchases increased by US$4,232 compared to the corresponding period in 2015. The increase was primarily due to a 5.1% increase in the volume of kWhs purchased, partially offset by lower average purchase price because of the entry of new power purchase contracts.
The variance between energy purchase on contracts with suppliers and energy purchase in the energy market spot is due to at the end of the first semester of 2015, started the purchase contract with the supplier Jaguar. The price of the energy in this contract is lower than in the energy market and credit conditions are better.
7. Income tax
Income tax expense is provided on an interim basis based on management’s estimate of the annual effective income tax rate and includes the tax effects of certain discrete items, such as changes in tax laws or tax rates or other unusual or nonrecurring tax adjustments in the interim period in which they occur. Management regularly monitors the assumptions used in estimating its annual effective tax rate and adjusts estimates accordingly. If actual results differ from management’s estimates, reported income tax expense in future periods could be materially affected.
For the six and three-month periods ended June 30, 2016 and 2015, the income tax expense was US$2,975, US$6,125 and US$1,938, US$2,368, respectively. The related effective tax rates were 31%, 26% and 30%, 26%, respectively. The higher effective income tax rate for the Company during the six and three- month period ended June 30, 2016 is mainly explained by a higher impact of the interest from deposits received from consumers, which are non-deductible for income tax purposes, over the projected profit before tax estimated by the Company as of by December 31, 2016, with respect to the projected profit before tax estimated by the Company by the previous comparative period.
For the six-month period ended June 30, 2015, the higher income tax paid, shown in the statement of cash flows, is caused by payments for correction of tax returns of 2011, 2012, 2013 and 2014 that were accrued as of December 31, 2014 (Note 14 of the financial statements as of December 31, 2015, 2014 and 2013 and January 1, 2013 and for the years ended December 31, 2015, 2014 and 2013, issued on September 10, 2016).
F-182
Table of Contents
Distribuidora de Electricidad de Occidente, S.A.—DEOCSA
Notes to the condensed interim financial statements
As of June 30, 2016 and December 31, 2015 and for the six and three-month periods ended
June 30, 2016 and 2015 (unaudited)
(Stated in Thousands of U.S. Dollar, except otherwise indicated)
8. Trade receivables
As of June 30, 2016 and December 31, 2015, the balance for trade receivables is detailed as follows:
2016 | 2015 | |||||||
Commercial, industrial, residential zones, public lighting, rates and tariffsa/ | 172,046 | 159,387 | ||||||
Instituto Nacional de Electrificación—INDEc/ | 10,789 | 10,606 | ||||||
Energy consumed not billedd/ | 12,672 | 14,573 | ||||||
Client tolls | 124 | 62 | ||||||
Other clients | 76 | 75 | ||||||
|
|
|
| |||||
| 195,707 | 184,703 | |||||||
|
|
|
| |||||
Long term accounts receivable with payment agreementa/ | (5,839 | ) | (6,472 | ) | ||||
Long term accounts receivable from municipalitiesb/ | (13,031 | ) | (11,311 | ) | ||||
|
|
|
| |||||
| (18,870 | ) | (17,783 | ) | |||||
|
|
|
| |||||
| 176,837 | 166,920 | |||||||
Less | ||||||||
Collection by offsettinga/ | (32,494 | ) | (30,761 | ) | ||||
Allowance for uncollectible accountsb/ | (85,888 | ) | (76,754 | ) | ||||
|
|
|
| |||||
Short term trade receivable | 58,455 | 59,405 | ||||||
|
|
|
| |||||
| a/ | Collection by means of offsetting corresponds to the balances payable to the municipalities for the municipal tariff of public lighting that the Company charges to the users in the name of the municipalities. The Company includes this balance as part of the trade accounts receivable based on the right acquired through the contracts with municipalities to collect the public lighting tariff and offset it with the balances receivable from the electric energy billing to the same municipalities. |
| b/ | Uncollectible Accounts—The movement of the allowance for uncollectible accounts during the six- month periods ended on June 30, 2016 and 2015 are shown as follows: |
2016 | 2015 | |||||||
Balance at the beginning of the year | 76,754 | 60,404 | ||||||
Impairment loss for the period | 9,819 | 8,434 | ||||||
Application of provisions | (680 | ) | (880 | ) | ||||
Translation differences | (5 | ) | (189 | ) | ||||
|
|
|
| |||||
| 85,888 | 67,769 | |||||||
|
|
|
| |||||
The Company records an allowance for uncollectible accounts over all those balances aged beyond 180 days less the collection by means of offsetting and the accounts receivable to municipalities, Governmental entities and certain communities due to term-payment agreements.
The impairment loss for the three-month periods ended June 30, 2016 and 2015 amounted to US$5,443 and US$3,356, respectively.
| c/ | Account receivable from INDE for the billing of the adjustment of “Solidaridad INDE” to the users who are beneficiaries under the Social Tariff Act, according to the deed of INDE a-38-2013-2.A. The amount to be billed by the Company is determined by the resolutions monthly issued by the National Commission of Electric Energy—CNEE. The amount is due within 30 days after the issuance of the invoice |
| d/ | It corresponds to the estimated amount of services accrued, but not billed, from the sale of electric energy and toll at June 30, 2016 and December 31, 2015, net from the estimate of technical and not technical loss. This value is billed in full in the next billing cycle. |
F-183
Table of Contents
Distribuidora de Electricidad de Occidente, S.A.—DEOCSA
Notes to the condensed interim financial statements
As of June 30, 2016 and December 31, 2015 and for the six and three-month periods ended
June 30, 2016 and 2015 (unaudited)
(Stated in Thousands of U.S. Dollar, except otherwise indicated)
9. Related parties
Accounts receivable from and payable to related parties as of June 30, 2016 and December 31, 2015 are made up of the following balances:
2016 | 2015 | |||||||
Accounts receivable: | ||||||||
Distribuidora de Electricidad de Oriente, S.A. | 19 | 123 | ||||||
Redes Eléctricas de Centroamérica, S.A. RECSA | 15 | — | ||||||
Comercializadora Guatemalteca Mayorista de Electricidad, S.A. | 20 | 8 | ||||||
|
|
|
| |||||
| 54 | 131 | |||||||
|
|
|
| |||||
Accounts payable: | ||||||||
Distribuidora de Electricidad de Oriente, S.A. /a | 15,546 | 50 | ||||||
Puerto Quetzal Power LLC | 53 | — | ||||||
IC Power Chile | 107 | — | ||||||
Comercializadora Guatemalteca Mayorista, S.A. | 31 | 66 | ||||||
|
|
|
| |||||
| 15,737 | 116 | |||||||
|
|
|
| |||||
| a/ | Accounts payable to Distribuidora de Electricidad de Oriente, S.A. represents cash advances received during the six-month period ended June 30, 2016 documented by a promissory note that do not accrue interest and is renewed monthly. |
The amounts outstanding are unsecured and will be settled in cash. No guarantees have been given or received. No expense has been recognized in the current or prior years for bad or doubtful debt in respect of the amounts owed by related parties.
F-184
Table of Contents
Distribuidora de Electricidad de Occidente, S.A.—DEOCSA
Notes to the condensed interim financial statements
As of June 30, 2016 and December 31, 2015 and for the six and three-month periods ended
June 30, 2016 and 2015 (unaudited)
(Stated in Thousands of U.S. Dollar, except otherwise indicated)
The main transactions between related companies are as follows:
2016 | 2015 | |||||||
Loans from related parties | ||||||||
Distribuidora de Electricidad de Oriente, S.A. a/ | 15,577 | 4,853 | ||||||
|
|
|
| |||||
Toll billing | ||||||||
Comercializadora Guatemalteca Mayorista de Electricidad, S.A. | 63 | 2 | ||||||
|
|
|
| |||||
Purchases of materials | ||||||||
Distribuidora de Electricidad de Oriente, S.A. | 84 | 239 | ||||||
|
|
|
| |||||
Sales of materials | ||||||||
Distribuidora de Electricidad de Oriente, S.A. | 149 | 185 | ||||||
|
|
|
| |||||
Comercializadora Guatemalteca Mayorista de Electricidad, S.A. | — | 2 | ||||||
|
|
|
| |||||
Redes Eléctricas de Centroamérica, S.A. | 14 | — | ||||||
|
|
|
| |||||
Toll service | ||||||||
Redes Eléctricas de Centroamérica, S.A.—Toll of secondary system in distribution | 192 | 128 | ||||||
|
|
|
| |||||
Operation Fee | ||||||||
Arthasan, S.A.b/ | 891 | 1,625 | ||||||
|
|
|
| |||||
Purchase Energy | ||||||||
| Puerto Quetzal Power LLCC | 53 | — | ||||||
|
|
|
| |||||
Energy supplied to Substations | ||||||||
Redes Eléctricas de Centroamérica, S.A. RECSA | 5 | 7 | ||||||
|
|
|
| |||||
Billing of performed works | ||||||||
Distribuidora de Electricidad de Oriente, S.A. | — | 614 | ||||||
|
|
|
| |||||
Leasing of vehicles | ||||||||
Comercializadora Guatemalteca Mayorista de Electricidad, S.A. | 65 | 65 | ||||||
|
|
|
| |||||
Technical Assistance | ||||||||
IC Power Chilec/ | 265 | — | ||||||
|
|
|
| |||||
Reimbursable Expenses | ||||||||
IC Power Chile | 70 | — | ||||||
|
|
|
| |||||
Energy sales to spot market | ||||||||
Distribuidora de Electricidad de Oriente, S.A. | 342 | — | ||||||
|
|
|
| |||||
Comercializadora Guatemalteca Mayorista de Electricidad, S.A. | 36 | — | ||||||
|
|
|
| |||||
Purchase Energy sales to spot market | ||||||||
Distribuidora de Electricidad de Oriente, S.A. | 49 | — | ||||||
|
|
|
| |||||
| b/ | DEOCSA executive officers did not receive compensation directly from the Company until January, 22 2016, since each of them had been an executive officer of Arthasan, S.A. and had received compensation directly from Arthasan, S.A. Since that date, Company’s executive officers have received compensation directly from DEOCSA by approximately US$403. |
The Company has recorded expenses for an amount of $891 related with the final payment of the contract with Arthasan that was terminated on January 21, 2016. This amount was not contractually determined, but agreed by the parties.
| c/ | Technical advice of networks and electrical substations, of purchasing of electrical power and other operational and commercial matters. |
10. Property, plant and equipment
During the six-month period ended June 30, 2016, the Company acquired assets at a cost of US$6,547 mainly for the construction of distribution lines and devices for measurement and control.
F-185
Table of Contents
Distribuidora de Electricidad de Occidente, S.A.—DEOCSA
Notes to the condensed interim financial statements
As of June 30, 2016 and December 31, 2015 and for the six and three-month periods ended
June 30, 2016 and 2015 (unaudited)
(Stated in Thousands of U.S. Dollar, except otherwise indicated)
The detail and movements as of June 30, 2016 and December 31, 2015 and for the six-month periods ended June 30, 2016 and 2015 of the items of the property, plant and equipment and their corresponding accumulated depreciation is as follows:
Movements occurred during the six-month period ended June 30, 2016 and 2015:
Description | Land and construction | Technical | Other installations | Assets under | Inventory of | Total | ||||||||||||||||||
2016 | ||||||||||||||||||||||||
Cost: | ||||||||||||||||||||||||
Balance at January 1, 2016 | 2,423 | 486,332 | 10,252 | 3,860 | 4,507 | 507,374 | ||||||||||||||||||
Translation differences | (2 | ) | (313 | ) | (6 | ) | 23 | — | (298 | ) | ||||||||||||||
Additions | — | — | — | 5,973 | 574 | 6,547 | ||||||||||||||||||
Disposals | — | — | (37 | ) | — | — | (37 | ) | ||||||||||||||||
Transfers | 9 | 724 | 144 | (877 | ) | — | — | |||||||||||||||||
|
|
|
|
|
|
|
|
|
|
|
| |||||||||||||
Total cost at June 30, 2016 | 2,430 | 486,743 | 10,353 | 8,979 | 5,081 | 513,586 | ||||||||||||||||||
Accumulated depreciation: | ||||||||||||||||||||||||
Balance at January 1, 2016 | (1,297 | ) | (217,230 | ) | (7,936 | ) | — | (300 | ) | (226,763 | ) | |||||||||||||
Additions | (46 | ) | (5,995 | ) | (276 | ) | — | — | (6,317 | )(1) | ||||||||||||||
Disposals | — | — | 24 | — | — | 24 | ||||||||||||||||||
Translation differences | 1 | 111 | 4 | — | — | 116 | ||||||||||||||||||
|
|
|
|
|
|
|
|
|
|
|
| |||||||||||||
Total accumulated Depreciation at June 30, 2016 | (1,342 | ) | (223,114 | ) | (8,184 | ) | — | (300 | ) | (232,940 | ) | |||||||||||||
|
|
|
|
|
|
|
|
|
|
|
| |||||||||||||
Carrying value at June 30, 2016 | 1,088 | 263,629 | 2,169 | 8,979 | 4,781 | 280,646 | ||||||||||||||||||
|
|
|
|
|
|
|
|
|
|
|
| |||||||||||||
| (1) | Includes US$714 for the 21-day period from January 1, 2016 to January 21, 2016 and US$5,603 for the 161-day period from January 22, 2016 to June 30, 2016. |
F-186
Table of Contents
Distribuidora de Electricidad de Occidente, S.A.—DEOCSA
Notes to the condensed interim financial statements
As of June 30, 2016 and December 31, 2015 and for the six and three-month periods ended
June 30, 2016 and 2015 (unaudited)
(Stated in Thousands of U.S. Dollar, except otherwise indicated)
Description | Land and | Technical | Other | Assets under | Inventory of | Total | ||||||||||||||||||
2015 | ||||||||||||||||||||||||
Cost | ||||||||||||||||||||||||
Balance at January 1, 2015 | 2,335 | 497,078 | 9,487 | 3,210 | 4,324 | 516,434 | ||||||||||||||||||
Additions | — | — | — | 5,550 | 1,176 | 6,726 | ||||||||||||||||||
Disposals | — | (626 | ) | — | — | — | (626 | ) | ||||||||||||||||
Transfers | 13 | 243 | 248 | (504 | ) | — | — | |||||||||||||||||
Translation difference | (8 | ) | (1,812 | ) | (34 | ) | 9 | (11 | ) | (1,856 | ) | |||||||||||||
|
|
|
|
|
|
|
|
|
|
|
| |||||||||||||
Total cost at June 30, 2015 | 2,340 | 494,883 | 9,701 | 8,265 | 5,489 | 520,678 | ||||||||||||||||||
Accumulated depreciation | ||||||||||||||||||||||||
Balance at January 1, 2015 | (1,216 | ) | (223,482 | ) | (7,359 | ) | — | — | (232,057 | ) | ||||||||||||||
Additions | (41 | ) | (5,897 | ) | (372 | ) | — | — | (6,310 | ) | ||||||||||||||
Disposals | — | 273 | — | — | — | 273 | ||||||||||||||||||
Translation differences | 4 | 791 | 25 | — | — | 820 | ||||||||||||||||||
|
|
|
|
|
|
|
|
|
|
|
| |||||||||||||
Total accumulated Depreciation | (1,253 | ) | (228,315 | ) | (7,706 | ) | — | — | (237,274 | ) | ||||||||||||||
|
|
|
|
|
|
|
|
|
|
|
| |||||||||||||
Carrying value at June 30, 2015 | 1,087 | 266,568 | 1995 | 8,265 | 5,489 | 283,404 | ||||||||||||||||||
|
|
|
|
|
|
|
|
|
|
|
| |||||||||||||
Carrying value at December 31, 2015 | 1,126 | 269,102 | 2,316 | 3,860 | 4,207 | 280,611 | ||||||||||||||||||
|
|
|
|
|
|
|
|
|
|
|
| |||||||||||||
11. Debt with financial entities
The balances of the debt with financial entities as of June 30, 2016 and December 31, 2015 were as follows:
2016 | 2015 | |||||||
Banco Agromercantil de Guatemala, S.A. | 160,354 | 171,884 | ||||||
Less- | ||||||||
Short term portion | (22,998 | ) | (23,002 | ) | ||||
|
|
|
| |||||
Long term debt with financial entities | 137,356 | 148,882 | ||||||
|
|
|
| |||||
F-187
Table of Contents
Distribuidora de Electricidad de Occidente, S.A.—DEOCSA
Notes to the condensed interim financial statements
As of June 30, 2016 and December 31, 2015 and for the six and three-month periods ended
June 30, 2016 and 2015 (unaudited)
(Stated in Thousands of U.S. Dollar, except otherwise indicated)
The movement during the six-month periods ended June 30, 2016 and 2015 is presented as follows:
2016 | 2015 | |||||||
Initial balance | 171,884 | 158,865 | ||||||
Exchange difference | 36 | (165 | ) | |||||
Loans obtained | 7,094 | 58,808 | ||||||
Payments made | (18,549 | ) | (33,517 | ) | ||||
Translation effect | (111 | ) | (553 | ) | ||||
|
|
|
| |||||
| 160,354 | 183,438 | |||||||
|
|
|
| |||||
Obligations
There were no significant changes in the obligations of financial information, social and environmental requirements, property maintenance, insurance maintenance, interest rate protection, and other obligations for the loan as of June 30, 2016 with respect to those described in Note 24 of the financial statements as of December 31, 2015, 2014 and 2013 and January 1, 2013 and for the years ended December 31, 2015, 2014 and 2013 issued on September 10, 2016.
According to the loan contract, the calculation of the ratios described in Note 24 of the financial statements as of December 31, 2015, 2014 and 2013 and January 1, 2013 and for the years ended December 31, 2015, 2014 and 2013 issued on September 10, 2016, is carried out over a combined basis, which includes the figures of Distribuidora de Electricidad de Occidente, S.A. and Distribuidora de Electricidad de Oriente, S.A. (related party). During the six-month period ended on June 30, 2016 and the year ended December 31, 2015 there was no infringement on the related financial agreements.
During the three months period ended June 30, 2016, there was a decrease in financial expenses, when compared to the first quarter, because the Company had a gain on foreign exchange difference of US$ 1,216 due to the foreign exchange effect when bank loans were translated into the functional currency.
12. Contingencies
There were no significant developments in the contingencies for legal proceedings as of June 30, 2016 with respect to those described in Note 30 of the financial statements as of December 31, 2015, 2014 and 2013 and January 1, 2013 and for the years ended December 31, 2015, 2014 and 2013 issued on September 10, 2016 . See note 15 for the subsequent event.
13. Commitments
There were no significant changes in the commitments as of June 30, 2016 with respect to those described in Note 33 of the financial statements as of December 31, 2015, 2014 and 2013 and January 1, 2013 and for the years ended December 31, 2015, 2014 and 2013 issued on September 10, 2016 .
14. Financial instruments
The Company manages its capital structure to ensure the continuity as going concern, while it maximizes the return to its shareholders through the optimization of the debt and equity balances. The Company’s overall strategy remains unchanged from December 31, 2015.
F-188
Table of Contents
Distribuidora de Electricidad de Occidente, S.A.—DEOCSA
Notes to the condensed interim financial statements
As of June 30, 2016 and December 31, 2015 and for the six and three-month periods ended
June 30, 2016 and 2015 (unaudited)
(Stated in Thousands of U.S. Dollar, except otherwise indicated)
The working capital structure of the Company is constituted by indebtedness as a financial cost (loans), offset by cash and cash equivalents, and restricted cash, and equity comprising issued capital, reserves, retained earnings, attributed to the shareholders.
Management of Financial Risk
The Company is exposed continuously to credit, liquidity, and market risks originated by exchange rate, interest rate, and price variations. These risks are managed through specific policies and procedures established by the Company’s financial management. There have been no changes in the risk management or risk management policies applied by the Company since December 31, 2015.
Financial instruments that are not measured at fair value
The carrying amounts of financial assets and liabilities related to cash and cash equivalents, restricted cash, accounts receivables from related parties, other receivables, trade receivables, creditors, trade and other accounts payable, accounts payable to related parties, other liabilities and debt with financial entities included in the condensed interim statement of financial position as of June 30, 2016 and December 31, 2015, approximate to their fair values. Debt with financial entities are subsequently measured at amortized cost considering the effective interest rate method, which approximate to its fair value since the debt is agreed at variable interest rates which are reviewed periodically. The other financial assets and financial liabilities measured at amortized cost, approximate their fair value due to their short-term maturity or because they are agreed at interest rates similar to market interest rate
Fair value measurements recognized in the statement of financial position
The following provides an analysis of financial instruments that are measured subsequent to initial recognition at fair value, grouped into a three-level fair value hierarchy as mandated by IFRS 13, as follows:
| • | Level 1 fair value measurements are those derived from inputs from quoted market prices (unadjusted) in active markets for identical assets or liabilities. |
| • | Level 2 fair value measurements are those derived from inputs other than quoted prices included within Level 1, that are observable for the asset or liability, either directly (i.e., as prices) or indirectly (i.e., derived from prices). |
| • | Level 3 fair value measurements are those derived from unobservable inputs for the assets or liabilities. |
The methodology used to determine the fair value of the interest rate swap is a standard valuation technique of discounted expected cash flows estimated with forward rate curve and is categorized as Level 2.
Between December 31, 2015 and June 30, 2016, there have been no significant changes in business or economic circumstances affecting the fair value of the Company’s financial assets and liabilities (either measured at fair value or amortized cost).
In addition, no transfer has occurred among the different hierarchies used to determine the fair value of the Company’s financial instruments.
F-189
Table of Contents
Distribuidora de Electricidad de Occidente, S.A.—DEOCSA
Notes to the condensed interim financial statements
As of June 30, 2016 and December 31, 2015 and for the six and three-month periods ended
June 30, 2016 and 2015 (unaudited)
(Stated in Thousands of U.S. Dollar, except otherwise indicated)
As of June 30, 2016 and December 31, 2015, financial assets and liabilities of the Company are made up as follows:
June 30, | December 31, | |||||||
Financial assets: | ||||||||
Measured at amortized cost: | ||||||||
Trade receivables | 77,325 | 77,188 | ||||||
Other receivables | 4,650 | 7,080 | ||||||
Restricted cash | 2,857 | 2,875 | ||||||
Cash and cash equivalents | 3,830 | 5,203 | ||||||
|
|
|
| |||||
| 88,662 | 92,346 | |||||||
|
|
|
| |||||
Financial liabilities: | ||||||||
Measured at amortized cost: | ||||||||
Debt with financial entities | 160,354 | 171,884 | ||||||
Other liabilities | 42,317 | 38,619 | ||||||
Trade and other accounts payable | 45,972 | 49,835 | ||||||
Creditors | 15 | 12 | ||||||
|
|
|
| |||||
| 248,658 | 260,350 | |||||||
|
|
|
| |||||
Liquidity Risk
The Company practices a careful liquidity risk management and, therefore, keeps cash and other instruments liquid, as well as available funds. However, as of June 30, 2016, the condensed financial statements reflect a negative working capital of (63,564), thus the Management will be focused on the remaining months of 2016 on two objectives to revert that situation: a) improving the collection ratio for the accounts receivable and b) reducing the energy loss ratio.
To comply with those objectives, the Management has planned to perform the following:
| a) | Follow up the creation of dialogue and negotiation tables with community leaders and municipal authorities to improve collection timing, prevent non-technical losses; |
| b) | Reduce technical and non-technical losses; |
| c) | Improve debt ratio management and obtain longer-term loans; |
The management of the Company considers that the liquidity risk exposure is low since the Company has been generating cash flow from its operating activities and has access to loans and financial resources, as explained in Note 24 of the financial statements as of December 31, 2015, 2014 and 2013 and January 1, 2013 and for the years ended December 31, 2015, 2014 and 2013, issued on September 10, 2016. Additionally, DEOCSA´s management do not anticipate making significant payments during 2016 related to Deposits Received from Consumers (see Note 3 of the financial statements as of December 31, 2015, 2014 and 2013 and January 1, 2013 and for the years ended December 31, 2015, 2014 and 2013, issued on September 10, 2016).
15. Subsequent events
The Company has evaluated subsequent events as at June 30, 2016 to assess the need for potential recognition or disclosure in these financial statements. Such events were assessed until October 6, 2016, the date
F-190
Table of Contents
Distribuidora de Electricidad de Occidente, S.A.—DEOCSA
Notes to the condensed interim financial statements
As of June 30, 2016 and December 31, 2015 and for the six and three-month periods ended
June 30, 2016 and 2015 (unaudited)
(Stated in Thousands of U.S. Dollar, except otherwise indicated)
these financial statements were available to be issued. Based on this evaluation, it was determined that there were no subsequent events requiring recognition or disclosure in the financial statements, except for the following matters:
| a. | On July 26, 2016, CNEE published resolutions CNEE-201-2016 and CNEE-202-2016 which approved the new non-social and social tariffs, respectively. Under such resolutions, the electricity adjustment surcharge (see note 1.a of the financial statements as of December 31, 2015, 2014 and 2013 and January 1, 2013 and for the years ended December 31, 2015, 2014 and 2013 issued on September 10, 2016) was determined by the CNEE in order to be considered as tariff adjustments for the quarter period from August 1 to October 31, 2016 of the non-social and social tariffs the amounts of US$1,759 and US$4,111, respectively. In addition, the CNEE also indicated that the remaining accumulated surcharge from prior periods for non-social and social users tariffs, in the amounts of US$7,755 and US$6,441, respectively, will be considered as tariff adjustments for the following quarters, including an annual simple interest rate of 7% on such amounts. |
| b. | On July 26, 2016, DEOCSA become aware of a legal proceeding initiated by the Guatemalan Tax Administration (“SAT”) for payment of purported back income taxes for approximately US$10,787 (Q. 81,978) for the years 2011 and 2012. Such amount is subject to interest charges and penalties. SAT alleges that the deductions made by the Company of the interest expenses and amortization of goodwill from the taxable income were improper. The transaction dates back to 2011, when the Company’s former controlling shareholder (ASCOED S. A.) acquired the shares of DEOCSA and was subsequently merged with the Company in 2011. The SAT may further seek purported back income taxes for the years 2013, 2014 and 2015. The Company estimates that such back income taxes could sum up to the amount of approximately $17,184 (Q.130,596). |
At a hearing on August 9, 2016, the Company reached an understanding with SAT where it will conditionally pay within the next 60 days the purported back income taxes for the years 2011 and 2012 comprising the principal, interest and penalties claimed by the SAT. In order to release the bank accounts’ seizure imposed by the tribunal, to reduce any resulting penalties by the SAT, and to prevent further legal actions from the SAT for the purported back income taxes for the years 2013, 2014 and 2015, the Company paid on August 9, 2016 the amount of US$11,346 (Q.86,230) comprising principal, interest and penalties for the years 2014 and 2015, on August 10, 2016 the amount of US$10,787 (Q.81,978) related to income taxes for the years 2011 and 2012, and on August 19, 2016 the amount of US$8,267 (Q.62,831) comprising of principal, interest and penalties for the year 2013. An approximately payment up to US$14,372 (Q.109,227) subject to recalculation as of the date of payment, related to penalties and interests for year 2011 and 2012 will be made during 60 days beginning August 10, 2016. Furthermore, the Company has notified the SAT that is making all such payments it is reserving all legal rights to seek restitution by contesting legally the merits of the SAT claim. DEOCSA´s management and its legal advisors consider that the Company has all legal rights and hence, that it will initiate the necessary legal procedures to pursue the collection of the amounts paid in connection with such claim.
Since the inception of the transactions in 2011 and up to date, the opinion of DEOCSA’s management and its legal and tax advisors is that the transactions that generated the interest expenses and the amortization of goodwill deductions are legitimate tax deductions. This position
F-191
Table of Contents
Distribuidora de Electricidad de Occidente, S.A.—DEOCSA
Notes to the condensed interim financial statements
As of June 30, 2016 and December 31, 2015 and for the six and three-month periods ended
June 30, 2016 and 2015 (unaudited)
(Stated in Thousands of U.S. Dollar, except otherwise indicated)
was confirmed in February 2015 by a binding ruling issued by the SAT. Hence, DEOCSA’s management considers, based on the opinion of its tax and legal advisors, there is a probability greater than 50% in the recoverability of these payments as a result of the final outcome of this claim and of the other recourses to be initiated by the Company. These payments will be treated as an income tax payments in excess and presented in the third quarter financial statements as account receivable.
| c. | On August 2016, the Company signed an addendum to the existing long term syndicated loan. Such addendum renewed Tranche H of the long term syndicated loan in the amount of US$16,800 and Q.55,800, at an US Libor rate for three months plus a spread of 4.75%, with a floor interest rate of 6% for the dollar portion and Active Weighted Average rate less 6.10% for the portion in Quetzales. The term of the Tranche is up to February, 2025, with a grace period until May 2018 and equal quarterly principal payments thereafter. |
16. Approval of condensed interim financial statements
The condensed interim financial statements as of June 30, 2016 were approved by the Company’s Management Committee on October 6, 2016.
* * * * * *
F-192
Table of Contents
Comercializadora Guatemalteca
Mayorista de Electricidad, S.A.—GUATEMEL
Condensed Interim Financial Statements as of
June 30, 2016 and December 31, 2015 and
for the six and three-month periods ended
June 30, 2016 (unaudited)
Table of Contents
Comercializadora Guatemalteca Mayorista de Electricidad, S.A.—GUATEMEL
Condensed Interim Financial Statements as of June 30, 2016 and December 31, 2015 and for the six and
three-month periods ended June 30, 2016 (unaudited)
Content | Pages | |
Condensed interim statements of profit or loss and other comprehensive income | F-195 | |
| F-196 | ||
Condensed interim statements of changes in shareholders’ equity | F-198 | |
| F-199 | ||
| F-200 | ||
Table of Contents
Comercializadora Guatemalteca Mayorista de Electricidad, S.A.—GUATEMEL
Condensed Interim Statements of profit or loss and other comprehensive income
For the six and three-month periods ended June 30, 2016 and 2015 and the 21-day period from January 1,
2016 to January 21, 2016 and the 161-day period from January 22, 2016 to June 30, 2016 (unaudited)
(Stated in U.S. Dollars, except otherwise indicated)
Notes | Six months ended | Six months ended June 30, 2015 | Three- months ended June 30, 2016 | Three- months ended June 30, 2015 | 21-day period from | 161-day period from January 22, June 30, 2016 (1) | ||||||||||||||||||||||
Energy sales | 5 | 3,115,986 | 4,247,902 | 1,754,872 | 2,166,506 | 325,126 | 2,790,860 | |||||||||||||||||||||
Energy purchases | 6 | (3,018,377 | ) | (3,960,087 | ) | (1,632,295 | ) | (1,951,665 | ) | (298,808 | ) | (2,719,569 | ) | |||||||||||||||
Other costs of sales | (33,893 | ) | (27,211 | ) | (17,717 | ) | (12,004 | ) | (4,657 | ) | (29,236 | ) | ||||||||||||||||
|
|
|
|
|
|
|
|
|
|
|
| |||||||||||||||||
Gross profit | 63,716 | 260,604 | 104,860 | 202,837 | 21,661 | 42,055 | ||||||||||||||||||||||
General, selling and administrative expenses | (265,924 | ) | (192,492 | ) | (126,642 | ) | (74,957 | ) | (80,838 | ) | (185,086 | )(2) | ||||||||||||||||
Financial income | 25,162 | 19,002 | 11,973 | 9,260 | 355 | 24,807 | ||||||||||||||||||||||
Financial expenses | (19,172 | ) | (14,163 | ) | (12,735 | ) | (4,878 | ) | (1,269 | ) | (17,903 | ) | ||||||||||||||||
Other income | 9 | 128,189 | 128,532 | 64,542 | 93,513 | 21,580 | 106,609 | |||||||||||||||||||||
|
|
|
|
|
|
|
|
|
|
|
| |||||||||||||||||
(Loss) income before income tax | (68,029 | ) | 201,483 | 41,998 | 225,775 | (38,511 | ) | (29,518 | ) | |||||||||||||||||||
Income tax | 7 | 15,182 | (38,837 | ) | (9,373 | ) | (43,520 | ) | 8,594 | 6,588 | ||||||||||||||||||
|
|
|
|
|
|
|
|
|
|
|
| |||||||||||||||||
Net (loss) profit for the period | (52,847 | ) | 162,646 | 32,625 | 182,255 | (29,917 | ) | (22,930 | ) | |||||||||||||||||||
Other comprehensive loss (income): | ||||||||||||||||||||||||||||
Items that will not be reclassified subsequently to profit or loss: | ||||||||||||||||||||||||||||
Translation differences | (3,180 | ) | (16,342 | ) | 41,977 | 13,023 | (723 | ) | (2,455 | ) | ||||||||||||||||||
|
|
|
|
|
|
|
|
|
|
|
| |||||||||||||||||
Total comprehensive (Loss) Income for the period | (56,027 | ) | 146,304 | 74,602 | 195,278 | (30,640 | ) | (25,385 | ) | |||||||||||||||||||
|
|
|
|
|
|
|
|
|
|
|
| |||||||||||||||||
| (1) | Includes depreciation of US$2,556 for the 21-day period from January 1, 2016 to January 21, 2016 and US$19,986 for the 161-day period from January 22, 2016 to June 30, 2016. |
The accompanying notes are part of these condensed interim financial statements.
F-195
Table of Contents
Comercializadora Guatemalteca Mayorista de Electricidad, S.A.—GUATEMEL
Condensed Interim Statements of Financial Position
As of June 30, 2016 and as of December 31, 2015 (unaudited)
(Stated in U.S. Dollars, except otherwise indicated)
Notes | 2016 | 2015 | ||||||||||
Assets | ||||||||||||
Non-current assets: | ||||||||||||
Property, plant and equipment | 381,751 | 404,808 | ||||||||||
Accounts receivable from related parties | 9 | 1,143,641 | 1,144,387 | |||||||||
Non-current tax assets | 1,840,996 | 1,842,197 | ||||||||||
|
|
|
| |||||||||
Total non-current assets | 3,366,388 | 3,391,392 | ||||||||||
|
|
|
| |||||||||
Current assets: | ||||||||||||
Other assets | 53,125 | 75,391 | ||||||||||
Trade receivables | 8 | 710,417 | 633,087 | |||||||||
Accounts receivables from related parties | 9 | 56,531 | 124,099 | |||||||||
Current tax receivables | 61,370 | 58,147 | ||||||||||
Other receivables | 10 | — | 209,302 | |||||||||
Cash and cash equivalents | 1,293,750 | 1,248,762 | ||||||||||
|
|
|
| |||||||||
Total current assets | 2,175,193 | 2,348,788 | ||||||||||
|
|
|
| |||||||||
Total assets | 5,541,581 | 5,740,180 | ||||||||||
|
|
|
| |||||||||
|
(Continues |
) | ||||||||||
The accompanying notes are part of these condensed interim financial statements.
F-196
Table of Contents
Comercializadora Guatemalteca Mayorista de Electricidad, S.A.—GUATEMEL
Condensed Interim Statements of Financial Position
As of June 30, 2016 and as of December 31, 2015 (unaudited)
(Stated in U.S. Dollars, except otherwise indicated)
Notes | 2016 | 2015 | ||||||||||
Shareholders’ equity and liabilities | ||||||||||||
Shareholders’ equity: | ||||||||||||
Capital stock | 31,345 | 31,345 | ||||||||||
Legal reserve | 352,180 | 352,180 | ||||||||||
Accumulated other comprehensive income—Translation differences | 122,631 | 125,811 | ||||||||||
Retained earnings | 3,900,561 | 3,953,408 | ||||||||||
|
|
|
| |||||||||
Total stockholders’ equity | 4,406,717 | 4,462,744 | ||||||||||
|
|
|
| |||||||||
Non-current: | ||||||||||||
Long term financial leases | 11 | 58,025 | 127,738 | |||||||||
Other liabilities | 15,641 | 34,434 | ||||||||||
Provisions | 2,420 | 2,423 | ||||||||||
|
|
|
| |||||||||
Total non-current liabilities | 76,086 | 164,595 | ||||||||||
|
|
|
| |||||||||
Current liabilities | ||||||||||||
Short term financial leases | 11 | 139,259 | 139,350 | |||||||||
Other liabilities | 37,540 | 37,564 | ||||||||||
Trade and other accounts payable | 311,043 | 754,662 | ||||||||||
Deposits received from customer | 21,213 | 84,033 | ||||||||||
Current tax liabilities | 3,812 | 54,088 | ||||||||||
Creditors for services received | 13,026 | 13,035 | ||||||||||
Accounts payable to related parties | 9 | 507,215 | 7,553 | |||||||||
Other payable | 1,890 | 2,416 | ||||||||||
Labor-related payables | 23,780 | 20,140 | ||||||||||
|
|
|
| |||||||||
Total current liabilities | 1,058,778 | 1,112,841 | ||||||||||
|
|
|
| |||||||||
Total liabilities | 1,134,864 | 1,277,436 | ||||||||||
|
|
|
| |||||||||
Total liabilities and shareholders’ equity | 5,541,581 | 5,740,180 | ||||||||||
|
|
|
| |||||||||
The accompanying notes are part of these condensed interim financial statements.
F-197
Table of Contents
Comercializadora Guatemalteca Mayorista de Electricidad, S.A.—GUATEMEL
Condensed Interim Statements of Changes in Shareholder’s Equity
For the six-month periods ended June 30, 2016 and 2015 (unaudited)
(Stated in U.S. Dollars, except otherwise indicated)
Capital stock | Legal reserve | Accumulated other translation | Retained | Total | ||||||||||||||||
Balances as of January 1, 2015 | 31,345 | 352,180 | 148,176 | 4,139,261 | 4,670,962 | |||||||||||||||
Movements for the six-month period ended June 30, 2015 | ||||||||||||||||||||
Translation differences | (16,342 | ) | (16,342 | ) | ||||||||||||||||
Net profit for the period | 162,646 | 162,646 | ||||||||||||||||||
|
|
|
|
|
|
|
|
|
| |||||||||||
Balances as of June 30, 2015 | 31,345 | 352,180 | 131,834 | 4,301,907 | 4,817,266 | |||||||||||||||
|
|
|
|
|
|
|
|
|
| |||||||||||
Balances as of January 1, 2016 | 31,345 | 352,180 | 125,811 | 3,953,408 | 4,462,744 | |||||||||||||||
Movements for the six-month period ended June 30, 2016 | ||||||||||||||||||||
Translation differences | (3,180 | ) | (3,180 | ) | ||||||||||||||||
Net loss for the period | (52,847 | ) | (52,847 | ) | ||||||||||||||||
|
|
|
|
|
|
|
|
|
| |||||||||||
Balances as of June 30, 2016 | 31,345 | 352,180 | 122,631 | 3,900,561 | 4,406,717 | |||||||||||||||
|
|
|
|
|
|
|
|
|
| |||||||||||
See accompanying notes to the condensed interim financial statements.
F-198
Table of Contents
Comercializadora Guatemalteca Mayorista de Electricidad, S.A.—GUATEMEL
Condensed Interim Statements of Cash Flows
For the six-month periods ended June 30, 2016 and 2015 (unaudited)
(Stated in U.S. Dollars, except otherwise indicated)
June 2016 | June 2015 | |||||||
Cash flow from operating activities: | ||||||||
Net (Loss) Profit for the period | (52,847 | ) | 162,646 | |||||
Adjustments for: | ||||||||
Depreciation | 22,678 | 24,435 | ||||||
Interest for financing | 11,559 | 11,695 | ||||||
Income Tax | (15,182 | ) | 38,837 | |||||
Changes in working capital: | ||||||||
Trade receivables | (77,744 | ) | 108,118 | |||||
Accounts receivable from related parties | 67,487 | (240,827 | ) | |||||
Taxes receivable and other | 27,443 | (21,655 | ) | |||||
Other assets | 22,218 | 22,809 | ||||||
Other receivables | 209,165 | — | ||||||
Trade and other payables | (443,127 | ) | (233,732 | ) | ||||
Account payables to related parties | 499,666 | 244 | ||||||
Taxes payable | (20,697 | ) | (3,412 | ) | ||||
Other payables | 3,127 | 6,339 | ||||||
Provisions | — | (2,753 | ) | |||||
Customer deposits | (62,765 | ) | 1,350 | |||||
|
|
|
| |||||
Cash generated from (used in) operating activities | 190,981 | (125,906 | ) | |||||
Income tax paid | (45,067 | ) | — | |||||
Payment of interest | (11,559 | ) | (11,695 | ) | ||||
|
|
|
| |||||
Net cash generated from (used in) operating activities | 134,355 | (137,601 | ) | |||||
|
|
|
| |||||
Cash flow from financing activities: | ||||||||
Payments of finance leases | (88,400 | ) | (88,548 | ) | ||||
|
|
|
| |||||
Net cash used in financing activities | (88,400 | ) | (88,548 | ) | ||||
|
|
|
| |||||
Net increase (decrease) in cash and cash equivalents | 45,955 | (226,149 | ) | |||||
Effects of exchange rate changes on cash and cash equivalents | (967 | ) | (2,954 | ) | ||||
Cash and cash equivalents at the beginning of the period | 1,248,762 | 1,066,811 | ||||||
|
|
|
| |||||
Cash and cash and equivalents at the end of the period | 1,293,750 | 837,708 | ||||||
|
|
|
| |||||
The accompanying notes are part of these condensed interim financial statements.
F-199
Table of Contents
Comercializadora Guatemalteca Mayorista de Electricidad, S.A.—GUATEMEL
Notes to the condensed interim financial statements
As of June 30, 2016 and for the six-month periods ended
June 30, 2016 and 2015 (unaudited)
(Stated in U.S. Dollars, except otherwise indicated)
1. Operations of the company and basis of preparation of the condensed interim financial statements
a. Operations of the Company
Comercializadora Guatemalteca Mayorista de Electricidad, S.A.—GUATEMEL (hereinafter “GUATEMEL” or the “Company”), a wholly-owned subsidiary of Guatemel B.V., is a corporation incorporated in the Republic of Guatemala according to the commercial statute of the country and was authorized to operate for an indefinite time. The Company was finally registered in the Commercial Register (Registro Mercantil) on June 10, 2014. The Company’s address of its principal offices is Diagonal 6 10-52, zona 10, Edificio Interamericas.
The main activity of the Company is to commercialize electric power and energy to companies under the category of large electricity consumers, dedicated to any productive activity in the country.
All the revenues and the non-current assets of the Company are generated and are located, respectively, in Guatemala.
On January 22, 2016, I.C. Power Ltd., through IC Power Distribution Holding Pte. Limited, a wholly-owned subsidiary of Kenon Holdings Ltd (“Kenon”), acquired 100% of the shares of GUATEMEL BV, owner of 100% of the Company’s capital stock. As a result, I.C. Power Ltd. took the effective control to manage the financial and operating policies of the Company.
On March 17, 2016, as part of the reorganization process carried out by Kenon in order to list I.C. Power Pte. Ltd. in the US stock exchange, Kenon transferred all of the shares of I.C. Power Ltd. to I.C. Power Pte. Ltd. (“ICPS”), a wholly owned subsidiary of Kenon incorporated in Singapore.
b. Basis of Preparation of the Condensed Interim Financial Statements
The unaudited condensed interim financial statements have been prepared in accordance with the International Accounting Standard No. 34 Interim Financial Information. Selected explanatory notes are included to explain the events and transactions that are significant for the understanding of the changes in the financial position and the results of the Company, for the six-month period ended June 30, 2016. These unaudited condensed interim financial statements do not include all of the information required by the complete annual financial statements prepared in accordance with the International Financial Reporting Standards.
These unaudited condensed interim financial statements should be read in conjunction with the Company’s financial statements as of December 31, 2015, 2014 and 2013 and for the years ended December 31, 2015, 2014 and 2013, issued on September 10, 2016.
The financial information as of December 31, 2015 presented in these unaudited condensed interim financial statements is derived from our restated financial statements as of December 31, 2015, 2014 and 2013 and for the year then ended, issued on September 10, 2016.
In the opinion of the management, these unaudited condensed interim financial statements reflect all normal recurring adjustments, which are necessary for a fair representation of financial results for the interim periods presented.
F-200
Table of Contents
Comercializadora Guatemalteca Mayorista de Electricidad, S.A.—GUATEMEL
Notes to the condensed interim financial statements
As of June 30, 2016 and for the six-month periods ended
June 30, 2016 and 2015 (unaudited)
(Stated in U.S. Dollars, except otherwise indicated)
As described above, since January 22, 2016, I.C. Power Ltd. took effective control for directing the financial and operations policies of the Company and on March 17, 2016, Kenon transferred all of the shares of GUATEMEL BV of I.C. Power Ltd. to I.C. Power Pte. Ltd. The Company has prepared these condensed interim financial statements for consolidation of I.C. Power Pte. Ltd., and its consolidated subsidiary Inkia Energy Ltd, and it has included as additional information the results of operations for the 21-day period from January 1, 2016 to January 21, 2016 and the 161-day period from January 22, 2016 to June 30, 2016.
The results of operations for the six-month periods ended June 30, 2016 and 2015 or for the 21-day period from January 1, 2016 to January 21, 2016 and for the 161-day from January 1, to June 30, 2016 are not necessarily indicative of the results for the full year. The Company believes that the disclosures are adequate to make the information presented not misleading.
2. Application of new and revised international financial reporting standards
2.1 Adoption of new and revised standards
The Company has adopted all of the new and revised standards and interpretations issued by the IASB that are relevant to its operations and that are mandatorily effective at June 30, 2016 as described in note 2.1 to the Company’s financial statements as of December 31, 2015, 2014 and 2013 and for the years ended December 31, 2015, 2014 and 2013, issued on September 10, 2016. The new and revised standards and interpretations adopted did not have impact on these condensed interim financial statements.
2.2 New accounting pronouncements
During the six-month period ended June 30, 2016, there were no new accounting pronouncements applicable to the Company, besides the new and revised IFRSs that have been issued but are not yet mandatorily effective as described in note 2.1 to the financial statements as of December 31, 2015, 2014 and 2013 and for the years ended December 31, 2015, 2014 and 2013, issued on September 10, 2016. The management of the Company foresee that the application of these new or revised standards will not have a material impact over these condensed interim financial statements, except for IFRS 15 and IFRS 16 that the Company is currently evaluating its effects, if any, and cannot, at this time, estimate the potential impact on its future financial condition, results of operations and cash flows.
3. Significant accounting policies
The accounting policies applied by the Company in these condensed interim financial statements are consistent with those followed in the preparation of the annual financial statements as of December 31, 2015, 2014 and 2013 and for the years ended December 31, 2015, 2014 and 2013, issued on September 10, 2016, except for the adoption of new standards and interpretations effective as of 1 January 2016. The Company has not early adopted any other standard, interpretation or amendment that has been issued but is not yet effective.
The preparation of interim financial statements requires management to make judgements, estimates and assumptions that affect the application of accounting policies and the reported amounts of assets and liabilities, income and expenses. Actual results may differ from these estimates.
In preparing these condensed interim financial statements, the significant judgements made by management in applying the Company’s accounting policies and the key sources of estimation uncertainty were the same as those that applied to the financial statements as of December 31, 2015, 2014 and 2013 and for the years ended December 31, 2015, 2014 and 2013 and for the years ended December 31, 2015, 2014 and 2013, issued on September 10, 2016
F-201
Table of Contents
Comercializadora Guatemalteca Mayorista de Electricidad, S.A.—GUATEMEL
Notes to the condensed interim financial statements
As of June 30, 2016 and for the six-month periods ended
June 30, 2016 and 2015 (unaudited)
(Stated in U.S. Dollars, except otherwise indicated)
4. Monetary unit and exchange rate
The legal currency of Guatemala is the quetzal, represented by the symbol “Q” in the condensed interim financial statements.
As of June 30, 2016 and December 31, 2015, the reference exchange rate published by the Central Bank of Guatemala was Q.7.64 and Q. 7.63, respectively.
There are no exchange restrictions in Guatemala for the repatriation of capital, payment to creditors or for any other purpose; foreign currency may be freely negotiated for any amount in banks of the banking system or in authorized foreign currency exchange offices, in accordance with the current law in effect, per Decree number 94 -2000 Law of Free Negotiation of Currencies.
5. Energy sales
During the six months ended June 30, 2016 and 2015, energy sales were US$3,115,986 and US$ 4,247,902, respectively. Revenues decreased by US$1,131,916 during the first half of 2016 compared to the same period in 2015, mainly due to an average decrease of 24% in tariffs for customers based on the excess energy supplied by the market and also due to an average decrease of 4% in KWHS sold to customers, this was caused by the loss of sixteen clients during this period, being the consumption of them in the first half 2.8 GWh, effect that was partially offset by the addition of five new customers in the current period.
During the last three months as of June 30, 2016 and 2015, energy sales were US$1,754,872 and US$2,166,506, respectively. Revenues decreased US$411,635 during the second quarter of 2016 when compared to the corresponding period in 2015, mainly due to the loss of clients and tariffs decrease in 2016 as stated in the above paragraph.
6. Energy purchases
During the six and three-month periods ended June 30, 2016 and 2015 net electric energy purchases were as follows:
Six-month periods ended June 30 | Three-month periods ended June 30 | |||||||||||||||
2016 | 2015 | 2016 | 2015 | |||||||||||||
Contracts with suppliers | 2,178,571 | 2,385,799 | 1,139,262 | 1,236,376 | ||||||||||||
In the electricity spot market | 839,806 | 1,574,288 | 493,033 | 715,289 | ||||||||||||
|
|
|
|
|
|
|
| |||||||||
| 3,018,377 | 3,960,087 | 1,632,295 | 1,951,665 | |||||||||||||
|
|
|
|
|
|
|
| |||||||||
The Company manages an average of 60 days of credit with its suppliers from the receipt date of the invoice. Suppliers do not charge interest on the late payment of outstanding invoices.
In the first semester of 2016, energy purchases decreased by US$941,710 compared to the corresponding period in 2015. The decrease was primarily due to an overall 17% decrease in the electricity market price due to an overload offer of energy available in the industry market, in conjunction with a decrease of 4% in overall volume purchases, primarily based on the loss of 16 clients partially offset by the addition of five new customers during this semester. Moreover, at a detailed level, as a result of the decrease in the energy sales during that period, the Company decreased in US$734,482 the purchase for KWHs through the spot market based on the fact that most of the purchases were performed through contract with suppliers.
F-202
Table of Contents
Comercializadora Guatemalteca Mayorista de Electricidad, S.A.—GUATEMEL
Notes to the condensed interim financial statements
As of June 30, 2016 and for the six-month periods ended
June 30, 2016 and 2015 (unaudited)
(Stated in U.S. Dollars, except otherwise indicated)
7. Income tax
Income tax expense is provided on an interim basis based on management’s estimate of the annual effective income tax rate and includes the tax effects of certain discrete items, such as changes in tax laws or tax rates or other unusual or nonrecurring tax adjustments in the interim period in which they occur. Management regularly monitors the assumptions used in estimating its annual effective tax rate and adjusts estimates accordingly. If actual results differ from management’s estimates, reported income tax expense in future periods could be materially affected.
As presented on the condensed interim statements of profit or loss and other comprehensive income for the six-month period ended June 30, 2016, the Company shows a loss before tax of US$68,029. According to IAS 34 b.16, and based on the tax rate that would be applicable to expected total annual earnings, that is the estimated average annual effective income tax rate applied to the pre-tax income or loss for each interim period (22.32%), the Company has recognized a tax benefit of US$15,182 for the six-month period ended June 30, 2016 and for the three-month period the Company recognized an income tax of US$9,373 due to the profit before tax of US$41,998.
8. Trade receivables
As of June 30, 2016 and December 31, 2015, the balance for trade receivables is detailed as follows:
2016 | 2015 | |||||||
Clients—Energy customers a/ | 710,417 | 633,087 | ||||||
|
|
|
| |||||
| a/ | The aging of trade account balances is the following: |
2016 | 2015 | |||||||
Current | 48,661 | 90,634 | ||||||
Past Due: | ||||||||
From 31 to 60 days | 900 | 30,164 | ||||||
From 61 to 120 days | 8,605 | 3,100 | ||||||
More than 121 days | 63,405 | 57,394 | ||||||
|
|
|
| |||||
Total portfolio | 121,571 | 181,292 | ||||||
Energy consumption not billed b/ | 611,056 | 474,019 | ||||||
|
|
|
| |||||
| 732,627 | 655,311 | |||||||
Less | ||||||||
Allowance for uncollectable accounts c/ | (22,210 | ) | (22,224 | ) | ||||
|
|
|
| |||||
Total clients | 710,417 | 633,087 | ||||||
|
|
|
| |||||
| b/ | Corresponds to the estimated amount for services rendered not billed for sale of electricity as of June 30, 2016 and December 31, 2015. The corresponding invoices are issued and due in the following month. |
| c/ | Uncollectible Accounts—The movement of the allowance for uncollectible accounts during the six-month periods ended on June 30, 2016 and 2015, are shown as follows: |
2016 | 2015 | |||||||
Balance at the beginning of the year | 22,224 | 22,329 | ||||||
Translation differences | (14 | ) | (105 | ) | ||||
|
|
|
| |||||
Balance at the end of period | 22,210 | 22,224 | ||||||
|
|
|
| |||||
F-203
Table of Contents
Comercializadora Guatemalteca Mayorista de Electricidad, S.A.—GUATEMEL
Notes to the condensed interim financial statements
As of June 30, 2016 and for the six-month periods ended
June 30, 2016 and 2015 (unaudited)
(Stated in U.S. Dollars, except otherwise indicated)
9. Related parties
Accounts receivable from and payable to related parties as of June 30, 2016 and December 31, 2015 are made up of the following balances:
2016 | 2015 | |||||||
Accounts receivable—short term: | ||||||||
Distribuidora de Electricidad de Occidente, S.A.—DEOCSA | 30,621 | 65,658 | ||||||
Distribuidora de Electricidad de Oriente, S.A.—DEORSA | 25,910 | 58,441 | ||||||
|
|
|
| |||||
| 56,531 | 124,099 | |||||||
|
|
|
| |||||
Accounts receivable—long term: | ||||||||
Redes Eléctricas de Centroamérica, S.A. (RECSA)a/ | 1,143,641 | 1,144,387 | ||||||
|
|
|
| |||||
Accounts payable: | ||||||||
Poliwatt Limitada. b/ | 429,761 | — | ||||||
Distribuidora de Electricidad de Occidente, S.A.—DEOCSA | 20,005 | 7,553 | ||||||
Distribuidora de Electricidad de Oriente, S.A.—DEORSA | 57,449 | — | ||||||
|
|
|
| |||||
| 507,215 | 7,553 | |||||||
|
|
|
| |||||
| a/ | As of June 30, 2016 and December 31, 2015, the payable account corresponds to a non-interest bearing loan provided to RECSA through a promissory note and with a maturity date on December 31, 2017. As of June 30, 2016 and December 31, 2015, the Company recorded this note at its discounted amount of US$1,143,641 and US$1,144,387, respectively. |
| b/ | As described in Note 1, On January 22, 2016, I.C. Power Ltd, acquired all the shares of GUATEMEL B.V., owner of 100% of the Company’s capital stock. From that date, all the transactions performed with the company Poliwatt Limitada are considered related party transactions; the Company recorded purchases for US$897,858 during 2015 that were not considered as a related party transaction. As of June 30, 2016, the balance of accounts payable to Poliwatt Limitada is US$376,281. As of December 31, 2015, the accounts payable to Poliwatt Limitada for US$42,738 are presented as “Trade and other accounts payable”. |
F-204
Table of Contents
Comercializadora Guatemalteca Mayorista de Electricidad, S.A.—GUATEMEL
Notes to the condensed interim financial statements
As of June 30, 2016 and for the six-month periods ended
June 30, 2016 and 2015 (unaudited)
(Stated in U.S. Dollars, except otherwise indicated)
The main transactions between related companies are as follows:
2016 | 2015 | |||||||
Charges received from toll services | ||||||||
Distribuidora de Electricidad de Oriente, S.A.—DEORSA | 330,178 | 445,485 | ||||||
Redes Eléctricas de Centroamérica, S.A. | 473 | 30,659 | ||||||
Distribuidora de Electricidad de Occidente, S.A.—DEOCSA | 63,395 | 2,407 | ||||||
|
|
|
| |||||
| 394,046 | 478,551 | |||||||
|
|
|
| |||||
Loans provided | ||||||||
Generación Limpia Guatemala, S.A. | — | 104,925 | ||||||
|
|
|
| |||||
Purchase of materials | ||||||||
Distribuidora de Electricidad de Occidente, S.A.—DEOCSA | — | 2,029 | ||||||
|
|
|
| |||||
Purchase of energy | ||||||||
Poliwatt Limitada | 532,438 | — | ||||||
|
|
|
| |||||
Energy sales | ||||||||
Distribuidora de Electricidad de Oriente, S. A.—DEORSA | 6,711 | — | ||||||
Distribuidora de Electricidad de Occidente, S. A.—DEOCSA | 36,257 | — | ||||||
|
|
|
| |||||
| 42,968 | — | |||||||
|
|
|
| |||||
Other income—vehicles leasing | ||||||||
Distribuidora de Electricidad de Occidente, S.A.—DEOCSA | 65,284 | 65,456 | ||||||
Distribuidora de Electricidad de Oriente, S.A.—DEORSA | 55,240 | 55,386 | ||||||
|
|
|
| |||||
| 120,524 | 120,842 | |||||||
|
|
|
| |||||
The remuneration of members of key management personnel during the six and three-month periods were approximately US$57,414 and US$35,414, respectively. The remuneration of key executives is determined by the CEO based on fixed contracts, and does not depend upon financial performance.
10. Other receivables
As of December 18, 2015, Generación Limpia Guatemala, S.A., (related party on that date) signed an assignment of rights agreement on behalf of the Company. As a result of this agreement, the Company had full power to demand and collect US$209,302 that a third party owed to Generación Limpia Guatemala, S.A. as part of the commercial relations. This amount was collected during the beginning of the six-month period ended June 30, 2016.
11. Finance lease payables
The balances of the financial lease payables with financial entities as of June 30, 2016 and December 31, 2015 were as follows:
2016 | 2015 | |||||||
Non-current finance lease | 58,025 | 127,738 | ||||||
Current finance lease | 139,259 | 139,350 | ||||||
|
|
|
| |||||
| 197,284 | 267,088 | |||||||
|
|
|
| |||||
F-205
Table of Contents
Comercializadora Guatemalteca Mayorista de Electricidad, S.A.—GUATEMEL
Notes to the condensed interim financial statements
As of June 30, 2016 and for the six-month periods ended
June 30, 2016 and 2015 (unaudited)
(Stated in U.S. Dollars, except otherwise indicated)
During the six-month period ended June 30, 2016 there were no changes in the terms of the lease agreements.
12. Financial instruments
The Company manages its capital structure to ensure the continuity as going concern, while it maximizes the return to its shareholders through the optimization of the debt and equity balances. The Company’s overall strategy remains unchanged from December 31, 2015.
The working capital structure of the Company is constituted by indebtedness with financial entities (leasing), offset by Cash and cash equivalents, and equity comprising issued capital, reserves, retained earnings, attributed to the shareholders.
Management of Financial Risk
The Company is exposed continuously to credit, liquidity, and market risks originated by exchange rate, interest rate, and price variations. These risks are managed through specific policies and procedures established by the Company’s financial management. There have been no changes in the risk management or risk management policies applied by the Company since December 31, 2015.
Financial instruments that are not measured at fair value
The carrying amounts of financial assets and liabilities related to cash and cash equivalents, accounts receivables from related parties, other receivables, trade receivables, creditors, trade and other accounts payable, accounts payable to related parties, other liabilities and debt with financial entities included in the condensed interim statement of financial position as of June 30, 2016 and December 31, 2015, approximate to their fair values. The other financial assets and financial liabilities measured at amortized cost, approximate their fair value due to their short-term maturity or because they are agreed at interest rates similar to market interest rate.
Fair value measurements recognized in the statement of financial position
The following information provides an analysis of financial instruments that are measured subsequent to initial recognition at fair value, grouped into a three-level fair value hierarchy as mandated by IFRS 13, as follows:
| • | Level 1 fair value measurements are those derived from inputs from quoted market prices (unadjusted) in active markets for identical assets or liabilities. |
| • | Level 2 fair value measurements are those derived from inputs other than quoted prices included within Level 1, that are observable for the asset or liability, either directly (i.e., as prices) or indirectly (i.e., derived from prices). |
| • | Level 3 fair value measurements are those derived from unobservable inputs for the assets or liabilities. |
Between December 31, 2015 and June 30, 2016, there have been no significant changes in business or economic circumstances affecting the fair value of the Company’s financial assets and liabilities (either measured at fair value or amortized cost).
F-206
Table of Contents
Comercializadora Guatemalteca Mayorista de Electricidad, S.A.—GUATEMEL
Notes to the condensed interim financial statements
As of June 30, 2016 and for the six-month periods ended
June 30, 2016 and 2015 (unaudited)
(Stated in U.S. Dollars, except otherwise indicated)
In addition, no transfer of financial instruments has occurred among the different hierarchies used to determine the fair value of the Company’s financial instruments.
As of June 30, 2016 and December 31, 2015, financial assets and liabilities of the Company are made up as follows:
30/06/2016 | 31/12/2015 | |||||||
FINANCIAL ASSETS: | ||||||||
Measured at amortized cost | ||||||||
Cash and cash equivalents | 1,293,750 | 1,248,762 | ||||||
Trade receivables | 710,417 | 633,087 | ||||||
Other receivables | — | 209,302 | ||||||
Other assets | 53,125 | 75,391 | ||||||
|
|
|
| |||||
| 2,057,292 | 2,166,542 | |||||||
|
|
|
| |||||
FINANCIAL LIABILITIES: | ||||||||
Measured at amortized cost | ||||||||
Other liabilities | 53,182 | 71,998 | ||||||
Trade and other accounts payable | 311,043 | 754,662 | ||||||
Creditors for service received | 13,026 | 13,035 | ||||||
Other payable | 1,890 | 2,417 | ||||||
Customer deposits | 21,213 | 84,033 | ||||||
Finance lease payable | 197,284 | 267,088 | ||||||
|
|
|
| |||||
| 597,638 | 1,193,233 | |||||||
|
|
|
| |||||
13. Subsequent events
The Company has evaluated subsequent events as at June 30, 2016 to assess the need for potential recognition or disclosure in these financial statements. Such events were assessed until October 7, 2016, the date these financial statements were available to be issued. Based on this evaluation, it was determined that there were no subsequent events requiring recognition or disclosure in the interim condensed financial statements.
14. Approval of condensed interim financial statements
The condensed interim financial statements as of June 30, 2016 were approved by the Company’s Management Committee on October 7, 2016.
* * * * * *
F-207
Table of Contents
Redes Eléctricas de Centroamérica, S.A.—RECSA
Condensed Interim Financial Statements as of June 30, 2016 and December 31, 2015 and for the six and
three-month periods ended June 30, 2016 and 2015 (unaudited)
Table of Contents
Redes Eléctricas de Centroamérica, S.A.—RECSA
Condensed Interim Financial Statements as of June 30, 2016 and December 31, 2015
Content | Pages | |
Condensed interim statements of profit and loss and other comprehensive income | F-210 | |
| F-211 | ||
Condensed interim statements of changes in shareholder’s equity | F-213 | |
| F-214 | ||
| F-215 | ||
Table of Contents
Redes Eléctricas de Centroamérica, S.A.—RECSA
Condensed interim statements of profit or loss and other comprehensive income
for the six and three-month periods ended June 30, 2016 and 2015 and the 21-day period from January 1,
2016 to January 21, 2016 and the 161-day period from January 22, 2016 to June 30, 2016 (unaudited)
(Stated in US of Dollars, except otherwise indicated)
Notes | Six- month June 30, | Six- month June 30, | Three- month June 30, | Three- ended June 30, | 21-day | 161-day from | ||||||||||||||||||||||
Revenue: | ||||||||||||||||||||||||||||
Toll services | 5 | 921,453 | 863,471 | 458,252 | 531,560 | 105,796 | 815,657 | |||||||||||||||||||||
Cost of services | 6 | (348,300 | ) | (297,351 | ) | (189,003 | ) | (200,042 | ) | (49,707 | ) | (298,593 | ) | |||||||||||||||
|
|
|
|
|
|
|
|
|
|
|
| |||||||||||||||||
Gross profit | 573,153 | 566,120 | 269,249 | 331,518 | 56,089 | 517,064 | ||||||||||||||||||||||
General, selling and administrative expenses | (159,851 | ) | (113,508 | ) | (99,878 | ) | (53,277 | ) | (15,133 | ) | (144,718 | ) | ||||||||||||||||
Financial income | 8,458 | 7,044 | 4,686 | 3,887 | 5 | 8,453 | ||||||||||||||||||||||
Finance expenses | (161,696 | ) | (148,546 | ) | (81,453 | ) | (90,235 | ) | (6,101 | ) | (155,595 | ) | ||||||||||||||||
|
|
|
|
|
|
|
|
|
|
|
| |||||||||||||||||
Profit before income taxes | 260,064 | 311,110 | 92,604 | 191,893 | 34,860 | 225,204 | ||||||||||||||||||||||
Income tax | 7 | (68,026 | ) | (57,521 | ) | (25,071 | ) | (35,715 | ) | (9,946 | ) | (58,080 | ) | |||||||||||||||
|
|
|
|
|
|
|
|
|
|
|
| |||||||||||||||||
Profit for the period | 192,038 | 253,589 | 67,533 | 156,178 | 24,914 | 167,124 | ||||||||||||||||||||||
Other comprehensive income / (loss): | ||||||||||||||||||||||||||||
Items that will not be reclassified subsequently to profit or loss: | ||||||||||||||||||||||||||||
Remeasurement of defined benefit obligation | 700 | — | 700 | — | — | 700 | ||||||||||||||||||||||
Translation differences | (3,499 | ) | (21,397 | ) | 67,165 | 17,530 | (1,036 | ) | (2,463 | ) | ||||||||||||||||||
|
|
|
|
|
|
|
|
|
|
|
| |||||||||||||||||
Total comprehensive income for the period | 189,239 | 232,192 | 135,398 | 173,708 | 23,878 | 165,361 | ||||||||||||||||||||||
|
|
|
|
|
|
|
|
|
|
|
| |||||||||||||||||
The accompanying notes are part of these condensed interim financial statements.
F-210
Table of Contents
Redes Eléctricas de Centroamérica, S.A.—RECSA
Condensed interim statements of financial position
As of June 30, 2016 and as of December 31, 2015 (unaudited)
(Stated in US of Dollars, except otherwise indicated)
Notes | June 30, 2016 | December 31, | ||||||||||
Assets | ||||||||||||
Non-current assets | ||||||||||||
Property, plant and equipment, net | 9 | 11,531,467 | 11,773,274 | |||||||||
Non-current tax assets | 663,434 | 663,867 | ||||||||||
|
|
|
| |||||||||
Total non-current assets | 12,194,901 | 12,437,141 | ||||||||||
|
|
|
| |||||||||
Current assets: | ||||||||||||
Current tax assets | 101,851 | 170,327 | ||||||||||
Trade receivables | 314,412 | 318,294 | ||||||||||
Prepaid insurance | 39,122 | 16,624 | ||||||||||
Cash and cash equivalents | 11 | 1,217,774 | 650,964 | |||||||||
|
|
|
| |||||||||
Total current assets | 1,673,159 | 1,156,209 | ||||||||||
|
|
|
| |||||||||
Total assets | 13,868,060 | 13,593,350 | ||||||||||
|
|
|
| |||||||||
The accompanying notes are part of these condensed interim financial statements.
F-211
Table of Contents
Redes Eléctricas de Centroamérica, S.A.—RECSA
Condensed interim statements of financial position
As of June 30, 2016 and as of December 31, 2015 (unaudited)
(Stated in US of Dollars, except otherwise indicated)
Notes | June 30, 2016 | December 31, | ||||||||||
Shareholders’ equity and liabilities | ||||||||||||
Shareholders’ equity: | ||||||||||||
Capital stock | 3,031,287 | 3,031,287 | ||||||||||
Additional paid-in capital | 165,318 | 165,318 | ||||||||||
Legal reserve | 178,576 | 178,576 | ||||||||||
Retained earnings | 3,586,934 | 3,394,896 | ||||||||||
Accumulated other comprehensive income—remeasurement of defined benefit obligation | 30,678 | 29,978 | ||||||||||
Accumulated other comprehensive income—translation differences | 65,784 | 69,283 | ||||||||||
|
|
|
| |||||||||
Total shareholders’ equity | 7,058,577 | 6,869,338 | ||||||||||
|
|
|
| |||||||||
Non-current liabilities: | ||||||||||||
Debt with financial entities | 10 | 3,666,193 | 3,668,585 | |||||||||
Accounts payable to related parties | 8 | 1,143,641 | 1,144,387 | |||||||||
Provisions | 143,252 | 134,044 | ||||||||||
|
|
|
| |||||||||
Total non-current liabilities | 4,953,086 | 4,947,016 | ||||||||||
Current liabilities: | ||||||||||||
Debt with financial entities | 10 | 916,548 | 917,146 | |||||||||
Taxes payables | 11,988 | 1,460 | ||||||||||
Accounts payable to related parties | 8 | 807,469 | 792,506 | |||||||||
Trade accounts payable | 106,269 | 53,995 | ||||||||||
Other payable | 14,123 | 11,889 | ||||||||||
|
|
|
| |||||||||
Total current liabilities | 1,856,397 | 1,776,996 | ||||||||||
|
|
|
| |||||||||
Total liabilities | 6,809,483 | 6,724,012 | ||||||||||
|
|
|
| |||||||||
Total liabilities and shareholders’ equity | 13,868,060 | 13,593,350 | ||||||||||
|
|
|
| |||||||||
The accompanying notes are part of these condensed interim financial statements.
F-212
Table of Contents
Redes Eléctricas de Centroamérica, S.A.—RECSA
Condensed interim statements of changes in shareholder’s equity
For the six-month periods ended June 30, 2016 and 2015 (unaudited)
(Stated in US of Dollars, except otherwise indicated)
Accumulated other | ||||||||||||||||||||||||||||
Capital stock | Additional paid-in capital | Legal reserve | Retained | Remeasurement of defined | Translation | Total | ||||||||||||||||||||||
Balances as of January 1, 2015 | 3,031,287 | — | 150,690 | 2,865,064 | 25,195 | 95,851 | 6,168,087 | |||||||||||||||||||||
Movements for the six-month periods ended June 30, 2015 | ||||||||||||||||||||||||||||
Profit for the period | — | — | — | 253,589 | — | — | 253,589 | |||||||||||||||||||||
Translation differences | — | — | — | — | — | (21,397 | ) | (21,397 | ) | |||||||||||||||||||
|
|
|
|
|
|
|
|
|
|
|
|
|
| |||||||||||||||
Balances as of June 30, 2015 | 3,031,287 | — | 150,690 | 3,118,653 | 25,195 | 74,454 | 6,400,279 | |||||||||||||||||||||
Balances as of January 1, 2016 | 3,031,287 | 165,318 | 178,576 | 3,394,896 | 29,978 | 69,283 | 6,869,338 | |||||||||||||||||||||
Movements for the six-month periods ended June 30, 2016 | ||||||||||||||||||||||||||||
Profit for the period | — | — | — | 192,038 | — | — | 192,038 | |||||||||||||||||||||
Other comprehensive income— remeasurement of defined benefit obligation | — | — | — | — | 700 | — | 700 | |||||||||||||||||||||
Translation differences | — | — | — | — | — | (3,499 | ) | (3,499 | ) | |||||||||||||||||||
|
|
|
|
|
|
|
|
|
|
|
|
|
| |||||||||||||||
Balances as of June 30, 2016 | 3,031,287 | 165,318 | 178,576 | 3,586,934 | 30,678 | 65,784 | 7,058,577 | |||||||||||||||||||||
|
|
|
|
|
|
|
|
|
|
|
|
|
| |||||||||||||||
The accompanying notes are part of these condensed interim financial statements.
F-213
Table of Contents
Redes Eléctricas de Centroamérica, S.A.—RECSA
Condensed interim statements of cash flows
For the six-month periods ended June 30, 2016 and 2015 (unaudited)
(Stated in US of Dollars, except otherwise indicated)
| Six-month period ended June 30, 2016 | Six-month period ended June 30, 2015 | |||||||
Cash flows from operating activities: | ||||||||
Profit for the period | 192,038 | 253,589 | ||||||
Adjustments for: | ||||||||
Depreciation | 232,947 | 233,430 | ||||||
Provision on severance compensation | 9,247 | 4,997 | ||||||
Finance cost recognized in profit or loss | 159,148 | 158,690 | ||||||
Income tax expense | 68,026 | 57,521 | ||||||
Changes in working capital: | ||||||||
Tax assets | 68,366 | 64,342 | ||||||
Trade receivables | 3,674 | (109,763 | ) | |||||
Prepaid insurance | (22,510 | ) | (25,533 | ) | ||||
Taxes payable | 12,501 | 11,704 | ||||||
Accounts payable—related parties | 15,480 | — | ||||||
Trade accounts payable | 52,309 | (27,909 | ) | |||||
Other payable | 2,244 | 2,378 | ||||||
|
|
|
| |||||
Cash generated from operating activities | 793,470 | 623,446 | ||||||
Income tax paid | (69,998 | ) | (64,364 | ) | ||||
Payment of interests | (159,148 | ) | (158,690 | ) | ||||
|
|
|
| |||||
Net cash generated from operating activities | 564,324 | 400,392 | ||||||
|
|
|
| |||||
Net increase in cash and cash equivalents | 564,324 | 400,392 | ||||||
Effect of exchange rate changes on cash and cash equivalents | 2,486 | (168 | ) | |||||
Cash and cash equivalents at the beginning of the period | 650,964 | 603,853 | ||||||
|
|
|
| |||||
Cash and cash equivalents at the end of the period | 1,217,774 | 1,004,077 | ||||||
|
|
|
| |||||
The accompanying notes are part of these condensed interim financial statements.
F-214
Table of Contents
Redes Eléctricas de Centroamérica, S.A.—RECSA
Notes to the condensed interim financial statements
As of June 30, 2016 and December 31, 2015 and for the six and three-month periods ended June 30,
2016 and 2015 (unaudited)
(Stated in U.S. Dollars, except otherwise indicated)
1. Operations of the company and basis of preparation of the condensed interim financial statements
a. Operations of the Company
Redes Eléctricas de Centroamérica, S.A. (hereinafter “RECSA” or the “Company”) is a corporation that was incorporated in the Republic of Guatemala in accordance with the commercial laws of the country and was authorized to operate for an indefinite period of time. The Company was registered in the Commercial Register (Registro Mercantil) on March 8, 2006. The address of the Company’s principal office is Diagonal 6 10-52, zona 10, Edificio Interamericas.
The Company’s main activity consists of the electricity transmission and transformation. The Company’s non-current assets are located in Guatemala and all revenues are generated in Guatemala.
On December 5, 2006, the Ministry of Energy and Mining through ministerial agreement number 202-2006 authorized the Company to use state property, such as public roads, to install the infrastructure necessary to transmit electricity to all the territory of the Republic of Guatemala (transmission network), during a period of fifty years. As a result, the Company has the rights and should comply with the obligations contained in the General Law of Electricity and related regulations, as well as other laws that apply. The Ministry of Energy and Mining does not control any significant residual interest in the transmission network at the end of the term of the authorization and the Company has the possibility of renewing the authorized period. The Company has the right to enter and leave the transmission and transformation activity, keeping the transmission network and the disposal rights over all the assets installed into the transmission network.
On January 22, 2016, I.C. Power Ltd. through IC Power Distribution Holding Pte. Limited, a wholly-owned subsidiary of Kenon Holdings Ltd (“Kenon”), acquired the 100% of the shares of RECSA BV, owner of 100% of the Company’s capital stock. As a result, I.C. Power Ltd. took the effective control for directing the financial and operating policies of the Company. On March 17, 2016, as part of the reorganization process carried out by Kenon in order to list I.C. Power Pte. Ltd. in the US stock exchange, Kenon transferred all of the shares of I.C. Power Ltd. to I.C. Power Pte. Ltd. (“ICPS”), a wholly owned subsidiary of Kenon incorporated in Singapore
b. Basis of Preparation of the Condensed Interim Financial Statements
The unaudited condensed interim financial statements have been prepared in accordance with International Accounting Standard No.34 Interim Financial Information. Selected explanatory notes are included to explain the events and transactions that are significant for the understanding of the changes in the financial position and the results of the Company for the six-month period ended June 30, 2016. These unaudited condensed interim financial statements do not include all of the information required by the complete set of annual financial statements prepared in accordance with the International Financial Reporting Standards.
These unaudited condensed interim financial statements should be read in conjunction with the Company’s financial statements as of December 31, 2015, 2014 and 2013 and for the years ended December 31, 2015, 2014 and 2013 issued on September 10, 2016.
The financial information as of December 31, 2015 presented in these unaudited condensed interim financial statements is derived from our financial statements as of December 31, 2015, 2014 and 2013 and for the years ended December 31, 2015, 2014 and 2013 issued on September 10, 2016.
F-215
Table of Contents
Redes Eléctricas de Centroamérica, S.A.—RECSA
Notes to the condensed interim financial statements
As of June 30, 2016 and December 31, 2015 and for the six and three-month periods ended June 30,
2016 and 2015 (unaudited)
(Stated in U.S. Dollars, except otherwise indicated)
In the opinion of management, these unaudited condensed interim financial statements reflect all normal recurring adjustments, which are necessary for a fair representation of financial results for the interim periods presented.
As described above, since January 22, 2016, I.C. Power Ltd. took effective control for directing the financial and operating policies of the Company and on March 17, 2016, Kenon transferred all of the shares of RECSA BV of I.C. Power Pte. Ltd. to I.C. Power Pte. Ltd. The Company has prepared these condensed interim financial statements for consolidation purposes of I.C. Power Pte. Ltd. and its consolidated subsidiary Inkia Energy Ltd., and it has included as additional information the results of operations for the 21-day period from January 1, 2016 to January 21, 2016, and the 161-day period from January 22, 2016 to June 30, 2016
The results of operations for six and three-month periods ended June 30, 2016 and 2015 and for the 21-day period from January 1, 2016 to January 21, 2016, and for the 161-day period from January 22, 2016 to June 30, 2016 are not necessarily indicative of the results for the full years. The Company believes that the disclosures are adequate to make the information presented not misleading.
2. Application of new and revised international financial reporting standards
2.1 Adoption of new and revised standards
The Company has adopted all of the new and revised standards and interpretations issued by the IASB that are relevant to its operations and that are mandatorily effective at June 30, 2016 as described in note 2.1 to the Company’s financial statements as of December 31, 2015, 2014 and 2013 and for the years ended December 31, 2015, 2014 and 2013 issued on September 10, 2016. The new and revised standards and interpretations adopted did not have impact on these condensed interim financial statements.
2.2 New accounting pronouncements
During the six and three-month period ended June 30, 2016, there were no new accounting pronouncements applicable to the Company, in addition to the new and revised IFRSs that have been issued but are not yet mandatorily effective as described in note 2.1 to the financial statements as of December 31, 2015, 2014 and 2013 and for the years ended December 31, 2015, 2014 and 2013 issued on September 10, 2016. The management of the Company foresee that the application of these new or revised standards will not have a material impact over these condensed interim financial statements except for IFRS 15 and IFRS 16 that the Company is currently evaluating its effects if any, and cannot, at this time, estimate the potential impact on its future financial condition, results of operations and cash flows.
3. Significant accounting policies
The accounting policies applied by the Company in these condensed interim financial statements are consistent with those followed in the preparation of the annual financial statements as of December 31, 2015, 2014 and 2013 and for the years ended December 31, 2015, 2014 and 2013 issued on September 10, 2016, except for the adoption of new standards and interpretations effective as of 1 January 2016. The Company has not early adopted any other standard, interpretation or amendment that has been issued but is not yet effective.
The preparation of interim financial statements requires management to make judgements, estimates and assumptions that affect the application of accounting policies and the reported amounts of assets and liabilities, income and expenses. Actual results may differ from these estimates.
F-216
Table of Contents
Redes Eléctricas de Centroamérica, S.A.—RECSA
Notes to the condensed interim financial statements
As of June 30, 2016 and December 31, 2015 and for the six and three-month periods ended June 30,
2016 and 2015 (unaudited)
(Stated in U.S. Dollars, except otherwise indicated)
In preparing these condensed interim financial statements, the significant judgements made by management in applying the Company’s accounting policies and the key sources of estimation uncertainty were the same as those that applied to the financial statements as of December 31, 2015, 2014 and 2013 and for the years ended December 31, 2015, 2014 and 2013 issued on September 10, 2016.
4. Monetary unit and exchange rate
The legal currency of Guatemala is the quetzal, represented by the symbol “Q” in the condensed interim financial statements.
As of June 30, 2016 and December 31, 2015, the reference exchange rate published by the Central Bank of Guatemala was Q.7.64 and Q. 7.63, respectively.
There are no exchange restrictions in Guatemala for the repatriation of capital, payment to creditors or for any other purpose; foreign currency may be freely negotiated for any amount in banks of the banking system or in authorized foreign currency exchange offices, in accordance with the current law in effect, per Decree number 94 -2000 Law of Free Negotiation of Currencies.
5. Toll services
During the six and three-month periods ended June 30, 2016 and 2015, the revenue for toll services was US$921,453, US$863,471, and US$458,252 and US$531,560, respectively. Revenues increased US$57,982 during the first semester 2016 when compared to the corresponding period in 2015. The increase is primarily due to toll services revenues derived from the new sub-stations that started billing in May 2015.
6. Cost of services
During the six and three-month periods ended June 30, 2016 and 2015, respectively, the cost of services is comprised as follows:
Six-month period | Three-month period | |||||||||||||||
2016 | 2015 | 2016 | 2015 | |||||||||||||
Depreciations | 232,947 | 233,430 | 116,474 | 155,576 | ||||||||||||
Installations maintenance | 102,429 | 53,909 | 67,395 | 40,247 | ||||||||||||
Building maintenance | 332 | 332 | — | — | ||||||||||||
Other | 12,592 | 9,680 | 5,134 | 4,219 | ||||||||||||
|
|
|
|
|
|
|
| |||||||||
| 348,300 | 297,351 | 189,003 | 200,042 | |||||||||||||
|
|
|
|
|
|
|
| |||||||||
The increase in the cost of services is related primarily to the increase in maintenance cost in 2016 derived from the new sub stations, that as them were new in 2015 maintenance requirement was lower in 2015.
7. Income tax
Income tax expense is provided on an interim basis based on management’s estimate of the annual effective income tax rate and includes the tax effects of certain discrete items, such as changes in tax laws or tax rates or other unusual or nonrecurring tax adjustments in the interim period in which they occur. Management regularly monitors the assumptions used in estimating its annual effective tax rate and adjusts estimates accordingly. If actual results differ from management’s estimates, reported income tax expense in future periods could be materially affected.
F-217
Table of Contents
Redes Eléctricas de Centroamérica, S.A.—RECSA
Notes to the condensed interim financial statements
As of June 30, 2016 and December 31, 2015 and for the six and three-month periods ended June 30,
2016 and 2015 (unaudited)
(Stated in U.S. Dollars, except otherwise indicated)
For the six and three-month periods ended June 30, 2016 and 2015, income tax expense was US$68,026, US$57,521, and US$25,071 and US$35,715, respectively. As described in the Note 8 of the financial statements as of December, 31 2015, 2014 and 2013 and for the years ended December 31, 2015, 2014 and 2013 issued on September 10, 2016 since January 1, 2013, new rules for income tax are in effect and are included on Book 1 of The Law of Fiscal Actualization, Decree 10-2012. This new rules have two regimes to pay the tax, and are in effect from the year 2013:
| a) | Regime on Earnings from Profit Activities which consists on applying a rate of 25% since 2015 on the taxable income determined from the accounting profit. Tax is paid through quarterly payments with final income tax determined at year-end. |
| b) | Simplified Optional Regime on Income from Profit Activities consisting on applying the rate of 7% to the total amount of taxable income (revenue toll services), paying this tax through definitive withholding or else, through payment in agencies authorized by the tax authorities. The tax rate for the first US$3,916 (equivalent to 30,000 Quetzales) of monthly taxable income is 5% while the tax rate for taxable income in excess of such amount is 7%. |
For the six month periods ended June, 30 2016 and 2015, the Company has chosen the Simplified Optional Regime on Income from Profit Activities.
8. Related parties
Payable accounts—The balance of payable accounts to related parties as of June 30, 2016 and December 31, 2015 are detailed as follows:
2016 | 2015 | |||||||
Short term payable accounts | ||||||||
Distribuidora de Electricidad de Occidente, S.A. a/ | 15,479 | — | ||||||
Distribuidora de Electricidad de Oriente, S.A.a/ | 791,990 | 792,506 | ||||||
|
|
|
| |||||
| 807,469 | 792,506 | |||||||
Long term payable loans | ||||||||
Comercializadora Guatemalteca Mayorista de Electricidad (“GUATEMEL”), S.A. b/ | 1,143,641 | 1,144,387 | ||||||
|
|
|
| |||||
| 1,951,110 | 1,936,893 | |||||||
|
|
|
| |||||
| a/ | As of June 30, 2016 and December 31, 2015, corresponds to the payable account for the received billing of toll services rendered. |
| b/ | As of June 30, 2016 and December 31, 2015, the payable account corresponds to a non-interest-bearing loan received through a promissory note. On December 31, 2015, the Company received an extension to the due date previously agreed with GUATEMEL and, as such, the note’s new maturity date will be on December 31, 2017. As of June 30, 2016 and December 31, 2015, the Company recorded this note at its discounted amount of US$1,143,641 and US$1,144,387, respectively. |
The amounts outstanding are unsecured and will be settled in cash. No guarantees have been given or received.
F-218
Table of Contents
Redes Eléctricas de Centroamérica, S.A.—RECSA
Notes to the condensed interim financial statements
As of June 30, 2016 and December 31, 2015 and for the six and three-month periods ended June 30,
2016 and 2015 (unaudited)
(Stated in U.S. Dollars, except otherwise indicated)
Main transactions held with related parties during the six-month period ended June 30, are as follows:
2016 | 2015 | |||||||
Toll service rendered | ||||||||
Distribuidora de Electricidad de Occidente, S.A.—DEOCSA | 192,448 | 127,720 | ||||||
Distribuidora de Electricidad de Oriente, S.A.—DEORSA | 178,197 | 94,126 | ||||||
Comercializadora Guatemalteca Mayorista de Electricidad, S.A. d/ | 473 | 30,659 | ||||||
|
|
|
| |||||
| 371,118 | 252,505 | |||||||
|
|
|
| |||||
Operating Fee | ||||||||
Arthasan, S.A. c/ | — | 2,500 | ||||||
|
|
|
| |||||
Energy supplies for substations | ||||||||
Distribuidora de Electricidad de Occidente, S.A.—DEOCSA | 5,196 | 7,081 | ||||||
Distribuidora de Electricidad de Oriente, S.A.—DEORSA | 5,422 | 7,652 | ||||||
|
|
|
| |||||
| 10,618 | 14,733 | |||||||
Purchase of materials | ||||||||
|
|
|
| |||||
Distribuidora de Electricidad de Occidente, S.A. | 13,751 | — | ||||||
|
|
|
| |||||
| c/ | As of June 30, 2016, there is no remaining balance with Arthasan, S.A. RECSA ‘s executive officers did not receive compensation directly from the Company until January, 22 2016, since each of them had been an executive officer of Arthasan, S.A. and had received compensation directly from Arthasan, S.A. until that date. Company’s executive officers have received compensation directly from RECSA by approximately US$ 31,000 in the six month and US$ 13,600 three month period ended June 30, 2016, respectively |
| d/ | The decrease in the toll service rendered to GUATEMEL is due to a decrease in use of RECSA lines for power distribution due to lower consumption by GUATEMEL´s customer. |
9. Property, plant and equipment—net
The composition and movement for the six month periods ended June 30, 2016 and 2015 of the items that make up the cost of the property, plant and equipment and their corresponding accumulated depreciation is as follows:
Movements occurred during the six month period ended June 30, 2016 and 2015:
Land | Technical | Equipment, | Total | |||||||||||||
Acquisition cost: | ||||||||||||||||
Balance as of January 1, 2016 | 259,013 | 13,952,353 | 17,969 | 14,229,335 | ||||||||||||
Translation differences | (169 | ) | (9,097 | ) | (12 | ) | (9,278 | ) | ||||||||
|
|
|
|
|
|
|
| |||||||||
Total cost | 258,844 | 13,943,256 | 17,957 | 14,220,057 | ||||||||||||
|
|
|
|
|
|
|
| |||||||||
Accumulated depreciation: | ||||||||||||||||
Balance as of January 1, 2016 | — | (2,442,051 | ) | (14,010 | ) | (2,456,061 | ) | |||||||||
Additions | — | (232,395 | ) | (552 | ) | (232,947 | )(1) | |||||||||
Translation differences | — | 411 | 7 | 418 | ||||||||||||
|
|
|
|
|
|
|
| |||||||||
Total accumulated depreciation | — | (2,674,035 | ) | (14,555 | ) | (2,688,590 | ) | |||||||||
|
|
|
|
|
|
|
| |||||||||
Carrying value at June 30, 2016 | 258,844 | 11,269,221 | 3,402 | 11,531,467 | ||||||||||||
|
|
|
|
|
|
|
| |||||||||
Carrying value at December 31, 2015 | 259,013 | 11,510,302 | 3,959 | 11,773,274 | ||||||||||||
|
|
|
|
|
|
|
| |||||||||
| (1) | Includes US$26,421 and US$206,526 for the 21-day period from January 1, 2016 to January 21, 2016 and for the 161-day period from January 22, 2016 to June 30, 2016, respectively. |
F-219
Table of Contents
Redes Eléctricas de Centroamérica, S.A.—RECSA
Notes to the condensed interim financial statements
As of June 30, 2016 and December 31, 2015 and for the six and three-month periods ended June 30,
2016 and 2015 (unaudited)
(Stated in U.S. Dollars, except otherwise indicated)
| Land | Technical facilities | Equipment, furniture and tools | Assets under construction | Total | ||||||||||||||||
Acquisition cost: | ||||||||||||||||||||
Balance as of January 1, 2015 | 214,438 | 9,387,785 | 16,737 | 4,675,778 | 14,294,738 | |||||||||||||||
Transfers | 45,411 | 4,591,758 | — | (4,637,169 | ) | — | ||||||||||||||
Translation differences | (836 | ) | (27,190 | ) | (78 | ) | (38,609 | ) | (66,713 | ) | ||||||||||
|
|
|
|
|
|
|
|
|
| |||||||||||
Total cost | 259,013 | 13,952,353 | 16,659 | — | 14,228,025 | |||||||||||||||
|
|
|
|
|
|
|
|
|
| |||||||||||
Accumulated Depreciation: | ||||||||||||||||||||
Balance as of January 1, 2015 | — | (1,983,852 | ) | (13,092 | ) | — | (1,996,944 | ) | ||||||||||||
Additions | — | (232,886 | ) | (422 | ) | — | (233,308 | ) | ||||||||||||
Translation differences | — | 8,415 | 12,421 | — | 20,836 | |||||||||||||||
|
|
|
|
|
|
|
|
|
| |||||||||||
Total accumulated depreciation | — | (2,208,323 | ) | (1,093 | ) | — | (2,221,416 | ) | ||||||||||||
|
|
|
|
|
|
|
|
|
| |||||||||||
Carrying value at June 30, 2015 | 259,013 | 11,744,030 | 15,566 | — | 12,018,609 | |||||||||||||||
|
|
|
|
|
|
|
|
|
| |||||||||||
10. Debt with financial entities
The balances of the debt with financial entities as of June 30, 2016 and December 31, 2015 were as follows:
2016 | 2015 | |||||||
Banco G&T Continental, S.A.: | ||||||||
Loan with a 7 years term and eight biannual payments of USD 458,000, beginning on May 2016, and a last one for USD 917,000 in November 2020, at a variable annual interest rate yield of 7%. | 4,582,741 | 4,585,731 | ||||||
Less: | ||||||||
Current portion | (916,548 | ) | (917,146 | ) | ||||
|
|
|
| |||||
Total Non-current debt with financial entities | 3,666,193 | 3,668,585 | ||||||
|
|
|
| |||||
On May 2016, Management has renegotiated the extension of the payment date of the biannual payment of US$458,000 originally due on May 2016 to November 2020; the other terms of the agreement remained the same
11. Cash and cash equivalent
As of June 30, 2016 and December 31, 2015, the balance for cash and cash equivalents is detailed as follows:
2016 | 2015 | |||||||
Cash on hand | 170 | 170 | ||||||
Cash in local banks | 1,217,604 | 650,794 | ||||||
|
|
|
| |||||
| 1,217,774 | 650,964 | |||||||
|
|
|
| |||||
F-220
Table of Contents
Redes Eléctricas de Centroamérica, S.A.—RECSA
Notes to the condensed interim financial statements
As of June 30, 2016 and December 31, 2015 and for the six and three-month periods ended June 30,
2016 and 2015 (unaudited)
(Stated in U.S. Dollars, except otherwise indicated)
The increase in cash and cash equivalents of US$620,422 is related mainly to the positive cash flows from operating activities generated during the six month period ended June 30, 2016.
12. Tax assets
As of June 30, 2016 and December 31, 2015, the balance for tax assets is detailed as follows:
2016 | 2015 | |||||||
Value Added Tax (VAT) | 519,618 | 608,427 | ||||||
Credit withholdings VAT | 245,667 | 225,767 | ||||||
|
|
|
| |||||
| 765,285 | 834,194 | |||||||
Current tax assets | 101,851 | 170,327 | ||||||
|
|
|
| |||||
Non-current tax assets | 663,434 | 663,867 | ||||||
|
|
|
| |||||
13. Contingencies
There were no significant developments in the contingencies for legal proceedings as of June 30, 2016 with respect to those described in Note 20 of the financial statements as of December 31, 2015, 2014 and 2013 and for the years ended December 31, 2015, 2014 and 2013 issued on September 10, 2016.
14. Financial instruments
The Company manages its capital structure to ensure the continuity as going concern, while it maximizes the return to its shareholders through the optimization of the debt and equity balances. The Company’s overall strategy remains unchanged from December 31, 2015.
The working capital of the Company is constituted by indebtedness (loans), offset by cash and cash equivalents, and equity comprising issued capital, reserves, retained earnings, attributed to the shareholders.
Management of Financial Risk
The Company is exposed continuously to credit, liquidity, and market risks arising from exchange rate, interest rate, and price variations. These risks are managed through specific policies and procedures established by the Company’s financial management. There have been no changes in the risk management or risk management policies applied by the Company since December 31, 2015.
Financial instruments that are not measured at fair value
The carrying amounts of financial assets and liabilities related to cash and cash equivalents, trade receivables, trade accounts payable, and accounts payable to related parties, included in the condensed interim statement of financial position as of June 30, 2016 and December 31, 2015 approximate to their fair values. The other financial assets and financial liabilities measured at amortized cost, approximate their fair value due to their short-term maturity or because they are agreed at interest rates similar to market interest rate; the fair value of the long-term loan is determined discounting its cash flows at a market value interest rate.
F-221
Table of Contents
Redes Eléctricas de Centroamérica, S.A.—RECSA
Notes to the condensed interim financial statements
As of June 30, 2016 and December 31, 2015 and for the six and three-month periods ended June 30,
2016 and 2015 (unaudited)
(Stated in U.S. Dollars, except otherwise indicated)
As of June 30, 2016 and December 31, 2015, financial assets and liabilities of the Company are made up as follows:
June 30, | December 31, | |||||||
Financial assets: | ||||||||
Measured at amortized cost | ||||||||
Trade receivables | 314,412 | 318,294 | ||||||
Cash and cash equivalents | 1,217,774 | 650,964 | ||||||
|
|
|
| |||||
| 1,532,186 | 969,258 | |||||||
|
|
|
| |||||
June 30, | December | |||||||
Financial liabilities: | ||||||||
Measured at amortized cost | ||||||||
Debt with financial entities | 4,582,741 | 4,585,731 | ||||||
Trade accounts payable | 106,269 | 53,995 | ||||||
Long term payable loan | 1,143,641 | 1,144,387 | ||||||
|
|
|
| |||||
| 5,832,651 | 5,784,113 | |||||||
|
|
|
| |||||
The loan payable to Guatemel was discounted using an interest rate similar to market; the FV hierachy level is 3.
Liquidity risk
The Company practices a careful liquidity risk management and, therefore, keeps cash and other instruments liquid, as well as available funds. However, as of June 30, 2016, the condensed financial statements reflect a negative working capital of US$183,238. On May 2016, Management has renegotiated the extension of the payment date of the biannual payment of US$458,000 originally due on May 2016 to November 2020; the other terms of the agreement remained the same.
15. Subsequent events
The Company has evaluated subsequent events as at June 30, 2016 to assess the need for potential recognition or disclosure in these financial statements. Such events were assessed until October 7, 2016, the date these financial statements were available to be issued. Based on this evaluation, it was determined that there were no subsequent events requiring recognition or disclosure in the financial statements.
16. Approval of condensed interim financial statements
The condensed interim financial statements as of June 30, 2016 were approved by the Company´s Management Committee on October 7, 2016.
* * * * * *
F-222
Table of Contents
Distribuidora de Electricidad de
Oriente, S. A. - DEORSA
Restated Financial Statements as of December 31, 2015,
2014 and 2013 and January 1, 2013, and for the years
ended December 31, 2015, 2014 and 2013 together with
the Independent Auditors’ Report
Table of Contents
DISTRIBUIDORA DE ELECTRICIDAD DE ORIENTE, S. A.—DEORSA
CONTENT
Page | ||||
| F-225 | ||||
RESTATED FINANCIAL STATEMENTS AS OF DECEMBER 31, 2015, 2014 AND 2013 AND JANUARY 1, 2013, AND FOR THE YEARS ENDED DECEMBER 31, 2015, 2014 AND 2013 | ||||
| F-227 | ||||
| F-228 | ||||
| F-230 | ||||
| F-231 | ||||
| F-233 | ||||
Table of Contents

Deloitte Guatemala, S.A.
Europlaza World Business Center
5a. Avenida 5-55, Zona 14
Torre IV, Nivel 8
01014
Guatemala
Tel.: (502) 2384 6500
Fax: (502) 2384 6555
www.deloitte.com/gt
To the Management Committee and the Shareholders of Distribuidora de Electricidad de Oriente, S. A.
We have audited the accompanying financial statements of Distribuidora de Electricidad de Oriente, S. A. (the “Company”), which comprise the restated statements of financial position as of December 31, 2015, 2014, 2013 and January 1, 2013, and the related restated statements of profit or loss and other comprehensive income, changes in shareholders’ equity and cash flows for the years ended December 31, 2015, 2014 and 2013, and the related notes to the financial statements.
Management’s Responsibility for the Financial Statements
Management is responsible for the preparation and fair presentation of these financial statements in accordance with International Financial Reporting Standards as issued by the International Accounting Standards Board; this includes the design, implementation, and maintenance of internal control relevant to the preparation and fair presentation of financial statements that are free from material misstatement, whether due to fraud or error.
Auditors’ Responsibility
Our responsibility is to express an opinion on these financial statements based on our audits. We conducted our audits in accordance with auditing standards generally accepted in the United States of America. Those standards require that we plan and perform the audit to obtain reasonable assurance about whether the financial statements are free from material misstatement.
An audit involves performing procedures to obtain audit evidence about the amounts and disclosures in the financial statements. The procedures selected depend on the auditor’s judgment, including the assessment of the risks of material misstatement of the financial statements, whether due to fraud or error. In making those risk assessments, the auditor considers internal control relevant to the Company’s preparation and fair presentation of the financial statements in order to design audit procedures that are appropriate in the circumstances, but not for the purpose of expressing an opinion on the effectiveness of the Company’s internal control. Accordingly, we express no such opinion. An audit also includes evaluating the appropriateness of accounting policies used and the reasonableness of significant accounting estimates made by management, as well as evaluating the overall presentation of the financial statements.
We believe that the audit evidence we have obtained is sufficient and appropriate to provide a basis for our audit opinion.
Opinion
In our opinion, the financial statements referred to above present fairly, in all material respects, the financial position of Distribuidora de Electricidad de Oriente, S. A. as of December 31, 2015, 2014 and 2013 and January 1, 2013, and the results of its operations and its cash flows for the years ended December 31, 2015, 2014 and 2013, in accordance with International Financial Reporting Standards, as issued by the International Accounting Standards Board.
Table of Contents
Emphasis of matter
As discussed in Note 1.b, the financial statements for the years ended December 31, 2015, 2014 and 2013 have been restated for the correction of errors. These restatements have also resulted in the presentation of the restated statement of financial position as of January 1, 2013. In addition, the Company also expanded certain disclosures from those previously presented. Our opinion is not modified with respect to these matters.
As discussed in Note 35 to the accompanying financial statements, a legal proceeding was initiated against the Company by the Guatemalan Tax Administration. Our opinion is not qualified in respect of this matter.
Guatemala, C.A.,
September 10, 2016
Deloitte Guatemala, S. A.
/s/ Sergio Patzán
Sergio Patzán
Partner
Chartered Accountant CPA-2200
F-226
Table of Contents
DISTRIBUIDORA DE ELECTRICIDAD DE ORIENTE, S. A.—DEORSA
STATEMENTS OF PROFIT OR LOSS AND OTHER COMPREHENSIVE INCOME
FOR THE YEARS ENDED DECEMBER 31, 2015, 2014 AND 2013
(Stated in thousands of US dollars, except otherwise indicated)
| 2015 | 2014 | 2013 | ||||||||||||||
Notes | (Restated) | (Restated) | (Restated) | |||||||||||||
REVENUE: | ||||||||||||||||
Energy sales | 5 | US$ | 238,648 | US$ | 249,007 | US$ | 239,480 | |||||||||
Services rendered | 6 | 4,720 | 3,945 | 5,046 | ||||||||||||
Other revenues | 7 | 4,557 | 5,665 | 3,603 | ||||||||||||
|
|
|
|
|
| |||||||||||
Total revenue | 247,925 | 258,617 | 248,129 | |||||||||||||
COSTS OF SALES: | ||||||||||||||||
Energy purchases | 8 | (156,320 | ) | (169,087 | ) | (171,207 | ) | |||||||||
Other costs of sales | 9 | (33,312 | ) | (31,693 | ) | (30,722 | ) | |||||||||
|
|
|
|
|
| |||||||||||
Total costs of sales | (189,632 | ) | (200,780 | ) | (201,929 | ) | ||||||||||
Gross profit | 58,293 | 57,837 | 46,200 | |||||||||||||
General, selling and administrative expenses | 11 | (22,813 | ) | (16,461 | ) | (16,374 | ) | |||||||||
Financial income | 10 | 1,927 | 3,168 | 1,780 | ||||||||||||
Financial expenses | 12 | (11,857 | ) | (10,201 | ) | (9,639 | ) | |||||||||
Other income | 13 | 4,040 | 793 | 284 | ||||||||||||
|
|
|
|
|
| |||||||||||
Profit before income tax | 29,590 | 35,136 | 22,251 | |||||||||||||
Income taxes | 14 | (7,070 | ) | (20,680 | ) | (6,315 | ) | |||||||||
|
|
|
|
|
| |||||||||||
PROFIT FOR THE YEAR | 22,520 | 14,456 | 15,936 | |||||||||||||
OTHER COMPREHENSIVE INCOME (LOSS), NET OF INCOME TAX | ||||||||||||||||
Items that will not be reclassified subsequently to profit or loss: | ||||||||||||||||
Translation differences | (454 | ) | 2,500 | 374 | ||||||||||||
Remeasurement of defined benefit obligation | 27 | (505 | ) | (598 | ) | (177 | ) | |||||||||
Items that would be reclassified subsequently to profit or loss: | ||||||||||||||||
Cash flow hedge | 25 | 215 | 207 | (524 | ) | |||||||||||
|
|
|
|
|
| |||||||||||
OTHER COMPREHENSIVE INCOME (LOSS) FOR THE YEAR, NET OF INCOME TAX | ( 744 | ) | 2,109 | (327 | ) | |||||||||||
|
|
|
|
|
| |||||||||||
TOTAL COMPREHENSIVE INCOME FOR THE YEAR | US$ | 21,776 | US$ | 16,565 | US$ | 15,609 | ||||||||||
|
|
|
|
|
| |||||||||||
The accompanying notes are part of these financial statements.
F-227
Table of Contents
DISTRIBUIDORA DE ELECTRICIDAD DE ORIENTE, S. A.—DEORSA
STATEMENTS OF FINANCIAL POSITION
AS OF DECEMBER 31, 2015, 2014 AND 2013 AND JANUARY 1, 2013
(Stated in thousands of US dollars, except otherwise indicated)
Notes | 31/12/2015 | 31/12/2014 | 31/12/2013 | 01/01/2013 | ||||||||||||||||
ASSETS | ||||||||||||||||||||
NON-CURRENT ASSETS: | ||||||||||||||||||||
Property, plant and equipment | 16 | US$ | 213,288 | US$ | 212,465 | US$ | 203,133 | US$ | 200,492 | |||||||||||
Intangible assets | 17 | 48,115 | 48,728 | 47,206 | 46,625 | |||||||||||||||
Deferred income tax | 14 | — | — | 3,052 | 3,654 | |||||||||||||||
Long-term trade receivables | 15 | 6,261 | 3,279 | 1,464 | 1,378 | |||||||||||||||
Other receivables | 18 | 2,268 | 1,762 | 1,594 | 1,383 | |||||||||||||||
|
|
|
|
|
|
|
| |||||||||||||
Total non-current assets | 269,932 | 266,234 | 256,449 | 253,532 | ||||||||||||||||
|
|
|
|
|
|
|
| |||||||||||||
CURRENT ASSETS: | ||||||||||||||||||||
Other assets | 31 | 19 | 18 | 207 | ||||||||||||||||
Inventory | 19 | 853 | 1,335 | 2,921 | 753 | |||||||||||||||
Trade receivables | 15 | 32,894 | 41,211 | 34,809 | 31,188 | |||||||||||||||
Other receivables | 18 | 1,603 | 300 | 939 | 824 | |||||||||||||||
Taxes receivables | 20 | 92 | 613 | 594 | 500 | |||||||||||||||
Account receivables from related parties | 21 | 842 | 10,805 | 100 | 2,489 | |||||||||||||||
Restricted cash | 3r | 1,848 | 1,543 | 1,527 | 1,354 | |||||||||||||||
Cash and cash equivalents | 22 | 36,049 | 24,479 | 39,882 | 47,143 | |||||||||||||||
|
|
|
|
|
|
|
| |||||||||||||
Total current assets | 74,212 | 80,305 | 80,790 | 84,458 | ||||||||||||||||
|
|
|
|
|
|
|
| |||||||||||||
Total assets | US$ | 344,144 | US$ | 346,539 | US$ | 337,239 | US$ | 337,990 | ||||||||||||
|
|
|
|
|
|
|
| |||||||||||||
The accompanying notes are part of these financial statements.
F-228
Table of Contents
DISTRIBUIDORA DE ELECTRICIDAD DE ORIENTE, S. A.—DEORSA
STATEMENTS OF FINANCIAL POSITION
AS OF DECEMBER 31, 2015, 2014 AND 2013 AND JANUARY 1, 2013
(Stated in thousands of US dollars, except otherwise indicated)
Notes | 31/12/2015 | 31/12/2014 | 31/12/2013 | 01/01/2013 | ||||||||||||||||
SHAREHOLDERS’ EQUITY AND LIABILITIES: | ||||||||||||||||||||
Shareholders’ equity: | ||||||||||||||||||||
Capital stock | 23 | US$ | 44,018 | US$ | 44,018 | US$ | 44,018 | US$ | 44,018 | |||||||||||
Legal reserve | 6,951 | 6,834 | 6,481 | 6,007 | ||||||||||||||||
Accumulated other comprehensive loss—cash flows hedge | (102 | ) | (317 | ) | (524 | ) | — | |||||||||||||
Accumulated other comprehensive loss—remeasurement of defined benefit obligation | (1,499 | ) | (994 | ) | (396 | ) | (219 | ) | ||||||||||||
Accumulated other comprehensive loss—translation differences | (3,213 | ) | (2,759 | ) | (5,259 | ) | (5,633 | ) | ||||||||||||
Retained earnings | 31,202 | 42,848 | 28,745 | 13,283 | ||||||||||||||||
|
|
|
|
|
|
|
| |||||||||||||
Total shareholders’ equity | 77,357 | 89,630 | 73,065 | 57,456 | ||||||||||||||||
|
|
|
|
|
|
|
| |||||||||||||
NON CURRENT LIABILITIES: | ||||||||||||||||||||
Debt with financial entities—long term | 24 | 96,780 | 81,546 | 95,412 | 109,808 | |||||||||||||||
Other financial obligations—long term | 25 | — | 181 | 220 | — | |||||||||||||||
Deferred revenues | 26 | 71,982 | 71,591 | 62,878 | 61,183 | |||||||||||||||
Provisions | 27 | 7,421 | 11,497 | 11,975 | 11,870 | |||||||||||||||
Deferred income tax, net | 14 | 6,462 | 6,320 | — | — | |||||||||||||||
Other long-term liabilities | 2,089 | 808 | 291 | 791 | ||||||||||||||||
|
|
|
|
|
|
|
| |||||||||||||
Total non-current liabilities | 184,734 | 171,943 | 170,776 | 183,652 | ||||||||||||||||
|
|
|
|
|
|
|
| |||||||||||||
CURRENT LIABILITIES: | ||||||||||||||||||||
Debt with financial entities—short term | 24 | 14,786 | 21,807 | 27,559 | 26,712 | |||||||||||||||
Other financial obligations—short term | 25 | 219 | 430 | 574 | — | |||||||||||||||
Accounts payables to related parties | 21 | 181 | — | — | 1,894 | |||||||||||||||
Trade and other accounts payable | 29 | 36,367 | 30,247 | 43,698 | 50,737 | |||||||||||||||
Creditors | 20 | 631 | 521 | 405 | ||||||||||||||||
Taxes payables | 20 | 4,044 | 9,724 | 1,973 | 1,250 | |||||||||||||||
Other liabilities | 28 | 25,067 | 20,924 | 18,345 | 15,110 | |||||||||||||||
Employee benefits payable | 1,369 | 1,203 | 728 | 774 | ||||||||||||||||
|
|
|
|
|
|
|
| |||||||||||||
Total current liabilities | 82,053 | 84,966 | 93,398 | 96,882 | ||||||||||||||||
|
|
|
|
|
|
|
| |||||||||||||
Total liabilities | 266,787 | 256,909 | 264,174 | 280,534 | ||||||||||||||||
|
|
|
|
|
|
|
| |||||||||||||
Total liabilities and shareholders’ equity | US$ | 344,144 | US$ | 346,539 | US$ | 337,239 | US$ | 337,990 | ||||||||||||
|
|
|
|
|
|
|
| |||||||||||||
The accompanying notes are part of these financial statements.
F-229
Table of Contents
DISTRIBUIDORA DE ELECTRICIDAD DE ORIENTE, S. A.—DEORSA
STATEMENTS OF CHANGES IN SHAREHOLDERS’ EQUITY
FOR THE YEARS ENDED DECEMBER 31, 2015, 2014 AND 2013 (RESTATED) AND JANUARY 1, 2013 (RESTATED)
(Stated in thousands of US dollars, except otherwise indicated)
Accumulated Other Comprehensive Income (Loss) | ||||||||||||||||||||||||||||||||
Capital | Legal | Retained | Cash | Remeasurement | Translation | Accumulated Other Comprehensive | Total | |||||||||||||||||||||||||
Balances as of January 1, 2013 as reported | 44,018 | 6,007 | 15,025 | — | — | — | (219 | ) | 64,831 | |||||||||||||||||||||||
Restatement adjustments (Note 1b) | — | — | (1,742 | ) | — | (219 | ) | — | 219 | (1,742 | ) | |||||||||||||||||||||
Translation differences | — | — | — | — | — | (5,633 | ) | — | (5,633 | ) | ||||||||||||||||||||||
|
|
|
|
|
|
|
|
|
|
|
|
|
|
|
| |||||||||||||||||
Balances as of January 1, 2013, as restated | 44,018 | 6,007 | 13,283 | — | (219 | ) | (5,633 | ) | — | 57,456 | ||||||||||||||||||||||
Movements of year 2013 | ||||||||||||||||||||||||||||||||
Transfer to legal reserve | — | 474 | (474 | ) | — | — | — | — | — | |||||||||||||||||||||||
Remeasurement of defined benefit obligation, net of income tax, as restated | — | — | — | — | (177 | ) | — | — | (177 | ) | ||||||||||||||||||||||
Loss from cash flows hedge, net income tax, as restated | — | — | — | (524 | ) | — | — | — | (524 | ) | ||||||||||||||||||||||
Translation differences | — | — | — | — | — | 374 | — | 374 | ||||||||||||||||||||||||
Profit of the year, as restated | — | — | 15,936 | — | — | — | — | 15,936 | ||||||||||||||||||||||||
|
|
|
|
|
|
|
|
|
|
|
|
|
|
|
| |||||||||||||||||
Balance as of December 31, 2013, as restated | 44,018 | 6,481 | 28,745 | (524 | ) | (396 | ) | (5,259 | ) | — | 73,065 | |||||||||||||||||||||
Movements of year 2014 | ||||||||||||||||||||||||||||||||
Transfer to legal reserve | — | 353 | (353 | ) | — | — | — | — | — | |||||||||||||||||||||||
Remeasurement of defined benefit obligation, net of income tax, as restated | — | — | — | — | (598 | ) | — | — | (598 | ) | ||||||||||||||||||||||
Gain from cash flows hedge, net income tax, as restated | — | — | — | 207 | — | — | — | 207 | ||||||||||||||||||||||||
Profit for the year, as restated | — | — | 14,456 | — | — | — | — | 14,456 | ||||||||||||||||||||||||
Translation differences | — | — | — | — | — | 2,500 | — | 2,500 | ||||||||||||||||||||||||
|
|
|
|
|
|
|
|
|
|
|
|
|
|
|
| |||||||||||||||||
Balances as of December 31, 2014, as restated | 44,018 | 6,834 | 42,848 | (317 | ) | (994 | ) | (2,759 | ) | — | 89,630 | |||||||||||||||||||||
Movements of year 2015 | ||||||||||||||||||||||||||||||||
Transfer to legal reserve | — | 117 | (117 | ) | — | — | — | — | — | |||||||||||||||||||||||
Dividends declared | — | — | (34,049 | ) | — | — | — | — | (34,049 | ) | ||||||||||||||||||||||
Remeasurement of defined benefit obligation, net of income tax | — | — | — | — | (505 | ) | — | — | (505 | ) | ||||||||||||||||||||||
Gain from cash flows hedge, net income tax | — | — | — | 215 | — | — | — | 215 | ||||||||||||||||||||||||
Profit of the year | — | — | 22,520 | — | — | — | — | 22,520 | ||||||||||||||||||||||||
Translation differences | — | — | — | — | — | (454 | ) | — | (454 | ) | ||||||||||||||||||||||
|
|
|
|
|
|
|
|
|
|
|
|
|
|
|
| |||||||||||||||||
Balances as of December 31, 2015 | 44,018 | 6,951 | 31,202 | (102 | ) | (1,499 | ) | (3,213 | ) | — | 77,357 | |||||||||||||||||||||
|
|
|
|
|
|
|
|
|
|
|
|
|
|
|
| |||||||||||||||||
The accompanying notes are part of these financial statements.
F-230
Table of Contents
DISTRIBUIDORA DE ELECTRICIDAD DE ORIENTE, S. A.—DEORSA
FOR THE YEARS ENDED AT DECEMBER 31, 2015, 2014 AND 2013
(Stated in thousands of US dollars, except otherwise indicated)
2015 | 2014 | 2013 | ||||||||||
CASH FLOWS FROM OPERATING ACTIVITIES: | ||||||||||||
Profit for the year | US$ | 22,520 | US$ | 14,456 | US$ | 15,936 | ||||||
Adjustments from: | ||||||||||||
Depreciation and amortization | 13,377 | 13,185 | 13,171 | |||||||||
Accrued revenue—government grants | (3,289 | ) | (3,711 | ) | (3,750 | ) | ||||||
Impairment losses recognized on receivables from doubtful accounts | 5,687 | 2,756 | 4,377 | |||||||||
Provision for contingencies | (3,906 | ) | (448 | ) | 999 | |||||||
Interest from deposits received from customers | 2,585 | 2,187 | 1,750 | |||||||||
Effective cash flows hedge | (102 | ) | 72 | 80 | ||||||||
Finance costs recognized in profit or loss | 8,248 | 7,078 | 7,875 | |||||||||
Gain on disposal of property, plant and equipment | 6 | 5 | — | |||||||||
Exchange difference | (35 | ) | (2,265 | ) | (659 | ) | ||||||
Income taxes | 7,070 | 20,680 | 6,315 | |||||||||
Provision for obsolete inventories | 789 | — | — | |||||||||
Changes in working capital: | ||||||||||||
Inventory | 544 | 1,706 | (1,462 | ) | ||||||||
Other assets | 88 | — | 190 | |||||||||
Trade receivables | 51 | (9,855 | ) | (7,841 | ) | |||||||
Other receivables | 95 | 553 | (309 | ) | ||||||||
Current tax assets | 518 | — | (90 | ) | ||||||||
Related parties | 181 | — | (1,909 | ) | ||||||||
Severance pay compensation | (419 | ) | (708 | ) | (414 | ) | ||||||
Provisions for contingencies | (361 | ) | (514 | ) | (815 | ) | ||||||
Current tax liabilities | (148 | ) | 1,744 | 195 | ||||||||
Other liabilities | 459 | (1,356 | ) | 337 | ||||||||
Trade and other accounts payable | 5,816 | (14,858 | ) | (7,433 | ) | |||||||
Creditors | (608 | ) | 93 | 113 | ||||||||
Employee benefits payable | 172 | 452 | (53 | ) | ||||||||
|
|
|
|
|
| |||||||
Cash from operating activities | 59,338 | 31,252 | 26,603 | |||||||||
Income tax paid | (12,272 | ) | (5,518 | ) | (5,022 | ) | ||||||
Payment of interest | (8,248 | ) | (7,078 | ) | (7,875 | ) | ||||||
|
|
|
|
|
| |||||||
Net cash flows generated from operating activities | 38,818 | 18,656 | 13,706 | |||||||||
|
|
|
|
|
| |||||||
F-231
Table of Contents
DISTRIBUIDORA DE ELECTRICIDAD DE ORIENTE, S. A.—DEORSA
STATEMENTS OF CASH FLOWS
FOR THE YEARS ENDED AT DECEMBER 31, 2015, 2014 AND 2013
(Stated in thousands of US dollars, except otherwise indicated)
2015 | 2014 | 2013 | ||||||||||
CASH FLOWS FROM INVESTING ACTIVITIES: | ||||||||||||
Payments for property, plant and equipment | US$ | (15,015 | ) | US$ | (15,024 | ) | US$ | (14,155 | ) | |||
Payments for intangible assets | (644 | ) | (931 | ) | (1,012 | ) | ||||||
Proceeds from disposal of property, plant and equipment | 8 | 10 | — | |||||||||
|
|
|
|
|
| |||||||
Net cash flows used in investing activities | (15,651 | ) | (15,945 | ) | (15,167 | ) | ||||||
|
|
|
|
|
| |||||||
CASH FLOWS FROM FINANCING ACTIVITIES: | ||||||||||||
Funds received from government grants | 2,461 | 10,467 | 4,978 | |||||||||
Accounts receivable/payable to related parties | 9,912 | (10,702 | ) | 2,408 | ||||||||
Long-term creditors | 1,845 | 1,624 | 521 | |||||||||
Restricted cash | (313 | ) | 34 | (163 | ) | |||||||
Loans obtained from Banks | 40,544 | 45,735 | 15,923 | |||||||||
Payment of dividends | (34,153 | ) | — | — | ||||||||
Payment of bank loans | (31,815 | ) | (67,005 | ) | (29,872 | ) | ||||||
|
|
|
|
|
| |||||||
Net cash flows used in financing activities | (11,519 | ) | (19,847 | ) | (6,205 | ) | ||||||
|
|
|
|
|
| |||||||
NET INCREASE (DECREASE) IN CASH AND CASH EQUIVALENTS | 11,648 | (17,136 | ) | (7,666 | ) | |||||||
Effects of exchange rate changes on cash and cash equivalents | (78 | ) | 1,733 | 405 | ||||||||
CASH AND CASH EQUIVALENTS AT THE BEGINNING OF THE YEAR | 24,479 | 39,882 | 47,143 | |||||||||
|
|
|
|
|
| |||||||
CASH AND CASH EQUIVALENTS AT YEAR- END | US$ | 36,049 | US$ | 24,479 | US$ | 39,882 | ||||||
|
|
|
|
|
| |||||||
The accompanying notes are part of these financial statements.
F-232
Table of Contents
DISTRIBUIDORA DE ELECTRICIDAD DE ORIENTE, S. A.—DEORSA
NOTES TO THE FINANCIAL STATEMENTS
AS OF DECEMBER 31, 2015, 2014 AND 2013 AND JANUARY 1,
2013 (RESTATED), AND FOR THE YEARS ENDED DECEMBER 31,
2015, 2014 AND 2013 (RESTATED)
(Stated in thousands of US Dollars, except otherwise indicated)
| 1. | OPERATIONS OF THE COMPANY AND BASIS OF PREPARATION OF THE FINANCIAL STATEMENTS |
| a. | Operations of the Company |
Distribuidora de Electricidad de Oriente, Sociedad Anónima—DEORSA (“the Company” or DEORSA) (a majority-owned subsidiary of DEORSA B.V.) was incorporated on October 18, 1998 in the Republic of Guatemala to operate for an indefinite period. It is located in the City of Guatemala and its address is Diagonal 6, 10-50, Zona 10.
The Company’s main activity consists in the distribution of electric energy to final consumers of the eastern departments of the Republic of Guatemala, such as: El Progreso, Santa Rosa, Jalapa, Jutiapa, Chiquimula, Zacapa, Izabal, Baja Verapaz, Alta Verapaz and El Petén.
All the revenues and non-current assets of the Company are generated and are located, respectively, in Guatemala.
The Company classifies its distribution services as residential, commercial, industrial, municipal and governmental. In order to carry out its activity, the Company buys energy from theInstituto Nacional de Electrificación—INDE(National Institute of Electrification), Jaguar Energy, Hidro Xacbal, S.A., Renace, S.A. and Duke Energy Guatemala y Compañía, S.C.A.
Under Agreement No. 381-98 of the Ministry of Energy and Mining dated November 23, 1998 theEmpresa de Distribución de Energía Eléctrica del INDE(the Electric Energy Distribution Company of INDE)—Eastern Region—EDEEROR, was authorized to transfer to the Company for a fifty-year period the service of final distribution of electricity in the abovementioned departments (the “Concession”).
The authorization granted for the Concession can either be terminated (i) by finalization of the original term or (ii) by the regulatory authorities due to non-compliance of the obligations assumed in the Concession, in accordance with the procedures set in the Title III, Chapter III of the General Electricity Law. Once the authorization is terminated, rights and goods relating to the Concession will be auctioned publicly as an economic unit, within one hundred and eighty (180) days. The former concessionaire can participate of the auction process except in the event the authorization had been terminated for poor quality of the service. From the value obtained in the auction process, the Ministry of Energy and Mining will deduct the expenses incurred and debts that the former concessionaire may have and the remaining amount will be transferred to the former concessionaire.
Under the General Electricity Law and the regulations of the National Commission of Electric Energy (CNEE in Spanish), the tariffs that the Company charges to its regulated customers are subject to the approval of the CNEE. DEORSA charges distribution tariffs for all electricity delivered through its distribution system, whether to its customers or customers of wholesale electricity brokers. There are seven different tariffs that are applicable to DEORSA’s customers.
The DEORSA´s tariffs are comprised of (1) an electricity charge designed to reimburse the distribution company for the cost of electricity and capacity that it purchases and transmission tolls, and (2) a Value
F-233
Table of Contents
DISTRIBUIDORA DE ELECTRICIDAD DE ORIENTE, S. A.—DEORSA
NOTES TO THE FINANCIAL STATEMENTS
AS OF DECEMBER 31, 2015, 2014 AND 2013 AND JANUARY 1,
2013 (RESTATED), AND FOR THE YEARS ENDED DECEMBER 31,
2015, 2014 AND 2013 (RESTATED)
(Stated in thousands of US Dollars, except otherwise indicated)
| 1. | OPERATIONS OF THE COMPANY AND BASIS OF PREPARATION OF THE FINANCIAL STATEMENTS (cont’d) |
Added Distribution (VAD) charge designed to permit DEORSA to cover its operating expenses, complete its capital expenditure plans and recover its cost of capital. The electricity charge consists of a base tariff and an electricity adjustment surcharge. Under the General Electricity Law and the regulations of the CNEE, the base tariff is adjusted annually each May 1 to reflect anticipated changes in the cost of electricity to be purchased by DEORSA during the following year. The electricity adjustment surcharge is adjusted quarterly by the CNEE to reflect variations in the actual cost of electricity purchased by DEORSA from the projected cost. Any resulting variation in each quarter is considered by the CNEE in the determination of the applicable tariffs for the next quarter or even in subsequent periods, in the latter case if such differences were to be considered significant by the CNEE and agreement with Distributor were obtained. The authorization given by the government to increase or decrease prices in the future is merely a pricing mechanism that regulates prices for the following periods, and does not give rise to an asset or liability and additional or less revenue in the current period. The recovery of the operating loss or the payment of the operating income is included in the calculation of the price the regulated entity may charge to its customers and should be recognized only when such revenues are received or receivable. It is appropriate to recognize an asset for the recovery of actual costs incurred or a liability for the refund of amounts over billed whenever the right or obligation exists independently of the delivery of future services. It is difficult to determine whether the rights and obligations exist separately, particularly when there is no history of recovery or refund other than through invoices for future service. The results of this tariff adjustment process is reflected by the CNEE through quarterly resolutions and communicated to the Company for its application in subsequent periods (Note 35).
The “VAD” component of the distribution tariff is revised every five years with semi-annual adjustments for inflation and local currency exchange rates against the US dollar. The VAD charges are set by a panel of three regulators who are appointed based on certain technical and professional criteria. The VAD charge was last set in January 2014 and will expire in January 2019.
Until December 15, 1998, INDE was the majority shareholder of the Company and on that date, it sold its shares toCompañía Distribuidora Eléctrica del Caribe, S.A.—DECSA or Caribbean Electric Distributor Company, a subsidiary of Unión Fenosa Internacional—UFI or—the “Operator” (an international operator that was the owner of 99.99% of the paid-in capital of such subsidiary). As part of the obligations acquired by the Operator, there is the implementation through the Company of the rural electrification projects, included in the “Agreement of Management Trust—INDE—Western and Eastern Rural Works” and the “Agreement of Construction of Electric Energy Transmission Works” signed between the Company and INDE (Note 31).
In October 2004, the Company was a subsidiary owned by Distribuidora Eléctrica del Caribe, S.A. in 92.84% and from that month it became part of Unión Fenosa Internacional -UFI (the “Operator”) in the same percentage. As a consequence, Unión Fenosa Internacional—UFI became the parent company.
During the first quarter of 2009, Gas Natural SDG, S.A reached a total share participation of 95.2% of the capital of Unión Fenosa, S.A.
F-234
Table of Contents
DISTRIBUIDORA DE ELECTRICIDAD DE ORIENTE, S. A.—DEORSA
NOTES TO THE FINANCIAL STATEMENTS
AS OF DECEMBER 31, 2015, 2014 AND 2013 AND JANUARY 1,
2013 (RESTATED), AND FOR THE YEARS ENDED DECEMBER 31,
2015, 2014 AND 2013 (RESTATED)
(Stated in thousands of US Dollars, except otherwise indicated)
| 1. | OPERATIONS OF THE COMPANY AND BASIS OF PREPARATION OF THE FINANCIAL STATEMENTS (cont’d) |
As a consequence of this process and from April 23, 2009, Gas Natural SDG, S.A. took over the management of the financial and exploitation policies.
On May 19, 2011 the Company was acquired in its majority by DEORSA B.V., a company owned byFondo de Inversiones Actis(Actis Investing Fund) (parent and ultimate holding company) through ASROED, S.A. in 92.70%.
On June 17, 2011 the General Shareholders’ Meeting of DEORSA agreed to merge DEORSA with ASROED, S.A. through the acquisition of the latter and the acceptance of the inherent rights and obligations from DEORSA. The merger took effect on November 3, 2011.
As a result of the acquisition, the Company ceased as being part of the group Gas Natural Fenosa and the operations kept with the companies of such group stopped having effect in 2011.
As further described in Note 35, on January 22, 2016, I.C. Power Ltd., a subsidiary of Kenon Holdings Ltd (“Kenon”), acquired all of the shares of DEORSA BV, owner of 92.70% of the Company’s capital stock.
| b. | Basis of Preparation of the Financial Statements |
These financial statements were prepared by the Company for its filing by IC Power Ltd., the Company’s current indirect controlling shareholder (Note 35), in a Registration Statement to be filed with the U.S. Securities and Exchange Commission.
These financial statements were prepared originally in Quetzal, the Company’s functional currency, and were translated into U.S. dollars, the presentation currency.
The Company’s financial statements as of and for the years ended December 31, 2015, 2014 and 2013 and January 1, 2013 have been restated as explained below.
Restatement of the Financial Statements
Subsequent to the issuance of the financial statements of DEORSA as of December 31, 2015 and 2014 and for the years then ended, and as of December 31, 2014 and 2013 and for the years then ended, the Company restated such financial statements for the correction of errors as stated below:
| a.1 | According to the electricity tariff scheme agreed with the CNEE, which stipulates tariff revisions based on actual distribution costs on a quarterly basis, the Company is entitled to charge its customers based on the agreed-upon tariffs when actual distribution costs for the quarter is different (see Note 1.a). Consequently, up to the year ended December 31, 2014, the Company recognized as a regulatory asset or liability the difference between the revenues actually billed to |
F-235
Table of Contents
DISTRIBUIDORA DE ELECTRICIDAD DE ORIENTE, S. A.—DEORSA
NOTES TO THE FINANCIAL STATEMENTS
AS OF DECEMBER 31, 2015, 2014 AND 2013 AND JANUARY 1,
2013 (RESTATED), AND FOR THE YEARS ENDED DECEMBER 31,
2015, 2014 AND 2013 (RESTATED)
(Stated in thousands of US Dollars, except otherwise indicated)
| 1. | OPERATIONS OF THE COMPANY AND BASIS OF PREPARATION OF THE FINANCIAL STATEMENTS (cont’d) |
| customers at the agreed-upon tariffs in a stated quarter and the revenues that would have been recognized had actual distribution costs have been passed-through to clients in such stated quarter. As of December 31, 2014, 2013 and January 1, 2013, as a result of the difference mentioned above, the Company had recognized as a regulatory liability amounts of US$ 22,007, US$ 17,600 and US$ 5,775, respectively. During 2015, the Company concluded that no regulatory assets or regulatory liabilities are to be recognized since they did not meet the definition of an asset or a liability, as the recognition of an asset or liability will depend on the existence of actual future sales to customers. As a result, the Company revised its accounting and reversed the previously recognized regulatory liabilities as of those dates as well as the corresponding adjustment to deferred income tax. |
| a.2 | The Company, at each reporting date, records an estimated accrued revenue for unbilled sales of energy and tolls (Note 3.h). This estimate considers the consumption of kilowatt/hour between the date of the last reading cycle and the end of each reporting period using the current approved rates and a factor for technical losses. During 2015, the Company identified and corrected an error in the calculation of the estimate, which generated an overstatement in energy sales for the year ended December 31, 2014 and 2013 and the corresponding overstatement in trade receivables as of December 31, 2014, 2013 and January 1, 2013 of US$ 2,034, US$ 1,878 and US$ 2,292, respectively. As a result, the Company reversed the excess revenue and trade receivables recognized as well as corresponding adjustment to the deferred income tax as of December 31, 2014 and 2013 and January 1, 2013 and for the years then ended. |
| a.3 | As of December 31, 2014, 2013 and January 1, 2013, the Company had separately presented the deferred tax assets and deferred tax liabilities in the statement of financial position. During 2015, the Company revised this presentation and concluded that it should offset the deferred tax assets and deferred tax liabilities as the entity has a legally enforceable right to set off current tax assets against current tax liabilities; and income taxes were levied by the same taxation authority. As a result, the Company presented the net deferred income tax liabilities as a single line item in the statement of financial position as of December 31, 2014, 2013 and January 1, 2013. |
| a.4 | As of December 31, 2014, 2013 and January 1, 2013, the Company jointly presented the items comprising other comprehensive income in the statement of profit or loss and other comprehensive income and the statements of changes in Shareholders´ equity. During 2015, the Company revised this presentation and concluded that it should present separately the items comprising other comprehensive income according to the different nature of each item. As a result, the Company restated this presentation and disclosed separately the items comprising other comprehensive income in the statement of profit or loss and other comprehensive income and the statements of changes in Shareholders´ equity as of December 31, 2014, 2013 and January 1, 2013. |
| a.5 | During 2014 and 2013, energy levies were presented as “General, selling and administrative expenses”. During 2015, the Company has revised this presentation and concluded that, based on |
F-236
Table of Contents
DISTRIBUIDORA DE ELECTRICIDAD DE ORIENTE, S. A.—DEORSA
NOTES TO THE FINANCIAL STATEMENTS
AS OF DECEMBER 31, 2015, 2014 AND 2013 AND JANUARY 1,
2013 (RESTATED), AND FOR THE YEARS ENDED DECEMBER 31,
2015, 2014 AND 2013 (RESTATED)
(Stated in thousands of US Dollars, except otherwise indicated)
| 1. | OPERATIONS OF THE COMPANY AND BASIS OF PREPARATION OF THE FINANCIAL STATEMENTS (cont’d) |
| their nature, it corresponded to be presented as “Other costs of sales”. As a result, the Company has reclassified such costs and presented them as “Other costs of sales” in the statement of profit or loss and other comprehensive income. |
| a.6 | As of December 31, 2015, 2014, 2013 and January 1, 2013, the Company presented the deposits received from customers and their corresponding accumulated interest as other long term liabilities. During 2015, the Company revised the presentation and concluded that it should be presented as a current liability since the Company do not have legal rights to defer this payment for at least twelve months after the balance sheet date. |
| a.7 | The Company, at each reporting date, records the deferred income tax related to the Goodwill (Note 3.e) as the Goodwill is amortized for tax purposes (deductible amount). The Company identified and corrected an error in the calculation of the deductible amount used to determine the deferred income tax related to the Goodwill for 2014. This calculation error generated an understatement of the deferred income tax liability as of December 31, 2015 and 2014 and the corresponding understatement in deferred income tax expense for the year 2014 of US$ 1,375. As a result, the Company recalculated and corrected the corresponding deferred income tax as of those dates and the impact in profit or loss for 2014. |
| a.8 | During the years ended December 31, 2015 and 2014 , recoveries of provisions for contingencies were presented as “Other revenues” and as part of the “Other cost of sales” during 2013. The Company has revised this presentation and concluded that, based on their nature, it corresponded to be presented as “Other income”. As a result, the Company has reclassified such recoveries and presented them as “Other income” in the statement of profit or loss and other comprehensive income for all the years presented. |
| a.9 | During the years ended December 31, 2015, 2014 and 2013, sundry services related mainly to the expenses for the collection of accounts receivable from third parties, commissions on collection were presented as “Other costs of sales”. The Company has revised this presentation and concluded that, based on their nature, it corresponded to be presented as “General, selling and administrative expenses”. As a result, the Company has reclassified such costs and presented them as “General, selling and administrative expenses” in the statement of profit or loss and other comprehensive income for all the years presented. |
| a.10 | The Company identified a calculation error in the amount of goodwill recorded in 2011 (see Note 3.e) and determined that there was an overstatement in goodwill and in the deferred income tax related to such goodwill. Consequently, the Company adjusted such items in each of the periods presented. |
F-237
Table of Contents
DISTRIBUIDORA DE ELECTRICIDAD DE ORIENTE, S. A.—DEORSA
NOTES TO THE FINANCIAL STATEMENTS
AS OF DECEMBER 31, 2015, 2014 AND 2013 AND JANUARY 1,
2013 (RESTATED), AND FOR THE YEARS ENDED DECEMBER 31,
2015, 2014 AND 2013 (RESTATED)
(Stated in thousands of US Dollars, except otherwise indicated)
| 1. | OPERATIONS OF THE COMPANY AND BASIS OF PREPARATION OF THE FINANCIAL STATEMENTS (cont’d) |
Accordingly, the financial statements as of December 31, 2015, 2014 and 2013 and for the years then ended were restated for the correction of the above-mentioned errors. The Company also restated the balances as of January 1, 2013, as applicable.
The accumulated effect of the matters described above upon the financial statements is shown as follows:
31-12-2015 | Ref. | Amounts | Correction of Errors - Debits (Credits) | Restated Amounts | ||||||||||||
NON-CURRENT ASSETS | ||||||||||||||||
Intangible assets | a.10 | US$ | 55,319 | US$ | (7,204 | ) | US$ | 48,115 | ||||||||
SHAREHOLDERS’ EQUITY | ||||||||||||||||
Retained earnings | a.7, a.10 | US$ | (37,586 | ) | US$ | 6,384 | US$ | (31,202 | ) | |||||||
ACCUMULATED OTHER COMPREHENSIVE INCOME | ||||||||||||||||
Accumulated other comprehensive income—translation differences | a.7, a.10 | US$ | 2,801 | US$ | 412 | US$ | 3,213 | |||||||||
NON-CURRENT LIABILITIES | ||||||||||||||||
Other long-term liabilities | a.6 | US$ | (25,311 | ) | US$ | 23,211 | US$ | (2,089 | ) | |||||||
Deferred income tax, net | a.7, a.10 | US$ | (6,870 | ) | US$ | 408 | US$ | (6,462 | ) | |||||||
CURRENT LIABILITIES | ||||||||||||||||
Other liabilities | a.6 | US$ | (1,845 | ) | US$ | (23,211 | ) | US$ | (25,067 | ) | ||||||
STATEMENT OF PROFIT OR LOSS AND OTHER COMPREHENSIVE INCOME | ||||||||||||||||
Other revenue | a.8 | US$ | (8,597 | ) | US$ | 4,040 | US$ | (4,557 | ) | |||||||
Other costs of sales | a.9 | US$ | 36,557 | US$ | (3,245 | ) | US$ | 33,312 | ||||||||
General, selling and administrative expense | a.8 | US$ | 19,568 | US$ | 3,245 | US$ | 22,813 | |||||||||
Other income | a.9 | US$ | — | US$ | (4,040 | ) | US$ | (4,040 | ) | |||||||
OTHER COMPREHENSIVE INCOME (LOSS), NET OF INCOME TAX | ||||||||||||||||
Translation differences | a.10 | US$ | 480 | US$ | (26 | ) | US$ | 454 | ||||||||
F-238
Table of Contents
DISTRIBUIDORA DE ELECTRICIDAD DE ORIENTE, S. A.—DEORSA
NOTES TO THE FINANCIAL STATEMENTS
AS OF DECEMBER 31, 2015, 2014 AND 2013 AND JANUARY 1,
2013 (RESTATED), AND FOR THE YEARS ENDED DECEMBER 31,
2015, 2014 AND 2013 (RESTATED)
(Stated in thousands of US Dollars, except otherwise indicated)
| 1. | OPERATIONS OF THE COMPANY AND BASIS OF PREPARATION OF THE FINANCIAL STATEMENTS (cont’d) |
31-12-2014 | Ref. | Amounts | Correction of Errors - | Restated | ||||||||||||
NON-CURRENT ASSETS | ||||||||||||||||
Deferred Income Tax | a1, a2, a3 | US$ | 9,814 | US$ | (9,814 | ) | US$ | — | ||||||||
Intangible assets | a.10 | US$ | 55,966 | US$ | (7,238 | ) | US$ | 48,728 | ||||||||
CURRENT ASSETS | ||||||||||||||||
Trade receivable | a.2 | US$ | 43,245 | US$ | (2,034 | ) | US$ | 41,211 | ||||||||
SHAREHOLDERS’ EQUITY | ||||||||||||||||
Retained earnings | a1, a2, a.7 | US$ | (34,276 | ) | US$ | (8,572 | ) | US$ | (42,848 | ) | ||||||
ACCUMULATED OTHER COMPREHENSIVE INCOME | ||||||||||||||||
Accumulated other comprehensive income | a.4 | US$ | 1,311 | US$ | (1,311 | ) | US$ | — | ||||||||
Accumulated other comprehensive income | ||||||||||||||||
Cash flows hedge | a.4 | US$ | — | US$ | 317 | US$ | 317 | |||||||||
31-12-2014 | Ref. | Amounts | Correction | Restated | ||||||||||||
Accumulated other comprehensive income—Remeasurement of defined benefit obligation | a.4 | US$ | — | US$ | 994 | US$ | 994 | |||||||||
Accumulated other comprehensive income—translation differences | a.6, a.10 | US$ | 2,324 | US$ | 435 | US$ | 2,759 | |||||||||
NON-CURRENT LIABILITIES | ||||||||||||||||
Deferred Income Tax | a.1, a.7, a.10 | US$ | (11,536 | ) | US$ | 5,216 | US$ | (6,320 | ) | |||||||
Other long-term liabilities | a.6 | US$ | (20,339 | ) | US$ | 19,531 | US$ | (808 | ) | |||||||
CURRENT LIABILITIES | ||||||||||||||||
Regulatory liabilities | a.1 | US$ | (22,007 | ) | US$ | 22,007 | US$ | — | ||||||||
Other liabilities | a.6 | US$ | (1,393 | ) | US$ | (19,531 | ) | US$ | (20,924 | ) | ||||||
STATEMENT OF PROFIT OR LOSS AND OTHER COMPREHENSIVE INCOME | ||||||||||||||||
Energy sales | a.2 | US$ | (245,330 | ) | US$ | (3,677 | ) | US$ | (249,007 | ) | ||||||
Other revenue | a.6 | US$ | (6,458 | ) | US$ | 793 | US$ | (5,665 | ) | |||||||
Other cost of sales | a.5, a.9 | US$ | 32,245 | US$ | (552 | ) | US$ | 31,693 | ||||||||
General, selling and administrative expense | a.5, a.9 | US$ | 15,909 | US$ | 552 | US$ | 16,461 | |||||||||
Other income | a.8 | US$ | — | US$ | (793 | ) | US$ | (793 | ) | |||||||
Income Tax | a1, a2, a.7, a.8 | US$ | 18,606 | US$ | 2,074 | US$ | 20,680 | |||||||||
OTHER COMPREHENSIVE INCOME (LOSS), NET OF INCOME TAX | ||||||||||||||||
Translation differences | a.10 | US$ | 2,775 | US$ | (275 | ) | US$ | 2,500 | ||||||||
F-239
Table of Contents
DISTRIBUIDORA DE ELECTRICIDAD DE ORIENTE, S. A.—DEORSA
NOTES TO THE FINANCIAL STATEMENTS
AS OF DECEMBER 31, 2015, 2014 AND 2013 AND JANUARY 1,
2013 (RESTATED), AND FOR THE YEARS ENDED DECEMBER 31,
2015, 2014 AND 2013 (RESTATED)
(Stated in thousands of US Dollars, except otherwise indicated)
| 1. | OPERATIONS OF THE COMPANY AND BASIS OF PREPARATION OF THE FINANCIAL STATEMENTS (cont’d) |
31-12-2013 | Amounts | Correction | Restated | |||||||||||||
NON-CURRENT ASSETS | ||||||||||||||||
Intangible assets | a.10 | US$ | 54,218 | US$ | (7,012 | ) | US$ | 47,206 | ||||||||
Deferred Income Tax | a1, a2, a3, a.10 | US$ | 8,389 | US$ | (5,337 | ) | US$ | 3,052 | ||||||||
CURRENT ASSETS | ||||||||||||||||
Trade receivable | a.2 | US$ | 36,687 | US$ | (1,878 | ) | US$ | 34,809 | ||||||||
SHAREHOLDERS’ EQUITY | ||||||||||||||||
Retained earnings | a1, a2, a.10 | US$ | (22,228 | ) | US$ | (6,517 | ) | US$ | (28,745 | ) | ||||||
ACCUMULATED OTHER COMPREHENSIVE INCOME | ||||||||||||||||
Accumulated other comprehensive income | a.4 | US$ | 920 | US$ | (920 | ) | US$ | — | ||||||||
Accumulated other comprehensive income—Cash flows Hedge | a.4 | US$ | — | US$ | 524 | US$ | 524 | |||||||||
Accumulated other comprehensive income—Remeasurement of defined benefit obligation | a.4 | US$ | — | US$ | 396 | US$ | 396 | |||||||||
Accumulated other comprehensive loss—translation differences | a.10 | US$ | 5,114 | US$ | 145 | US$ | 5,259 | |||||||||
NON-CURRENT LIABILITIES | ||||||||||||||||
Deferred income Tax, net | a1, a2, a3 | US$ | (3,034 | ) | US$ | 3,034 | US$ | — | ||||||||
Other liabilities | a.6 | US$ | (15,973 | ) | US$ | 15,682 | US$ | (291 | ) | |||||||
CURRENT LIABILITIES | ||||||||||||||||
Regulatory liabilities | a.1 | US$ | (17,600 | ) | US$ | 17,600 | US$ | — | ||||||||
Other liabilities | a.6 | US$ | (2,663 | ) | US$ | (15,682 | ) | US$ | (18,345 | ) | ||||||
STATEMENT OF PROFIT OR LOSS AND OTHER COMPREHENSIVE INCOME | ||||||||||||||||
Energy sales | a.2 | US$ | (228,431 | ) | US$ | (11,049 | ) | US$ | (239,480 | ) | ||||||
Other cost of sales | a.5, a.8, a.9 | US$ | 31,960 | US$ | (1,238 | ) | US$ | 30,722 | ||||||||
General, selling and administrative expense | a.5, a.9 | US$ | 14,852 | US$ | 1,522 | US$ | 16,374 | |||||||||
Other income | a.8 | US$ | — | US$ | (284 | ) | US$ | (284 | ) | |||||||
Income Tax | a1, a2 | US$ | (3,556 | ) | US$ | (2,758 | ) | US$ | (6,315 | ) | ||||||
OTHER COMPREHENSIVE INCOME (LOSS), NET OF INCOME TAX | ||||||||||||||||
Translation differences | a.10 | US$ | (519 | ) | US$ | 145 | US$ | (374 | ) | |||||||
NON-CURRENT ASSETS | ||||||||||||||||
Intangible assets | a.10 | US$ | 53,583 | US$ | (6,958 | ) | US$ | 46,625 | ||||||||
Deferred Income Tax | a1, a2, a3, a.10 | US$ | 4,077 | US$ | (423 | ) | US$ | 3,654 | ||||||||
F-240
Table of Contents
DISTRIBUIDORA DE ELECTRICIDAD DE ORIENTE, S. A.—DEORSA
NOTES TO THE FINANCIAL STATEMENTS
AS OF DECEMBER 31, 2015, 2014 AND 2013 AND JANUARY 1,
2013 (RESTATED), AND FOR THE YEARS ENDED DECEMBER 31,
2015, 2014 AND 2013 (RESTATED)
(Stated in thousands of US Dollars, except otherwise indicated)
| 1. | OPERATIONS OF THE COMPANY AND BASIS OF PREPARATION OF THE FINANCIAL STATEMENTS (cont’d) |
01-01-2013 | Ref. | Amounts | Correction | Restated | ||||||||||||
CURRENT ASSETS | ||||||||||||||||
Trade receivable | a.2 | US$ | 32,348 | US$ | (1,160 | ) | US$ | 31,188 | ||||||||
SHAREHOLDERS’ EQUITY | ||||||||||||||||
Retained earnings | a1, a2, a.10 | US$ | (15,025 | ) | US$ | 1,742 | US$ | (13,283 | ) | |||||||
ACCUMULATED OTHER COMPREHENSIVE INCOME | ||||||||||||||||
Accumulated Other comprehensive income | a.4 | US$ | 219 | US$ | (219 | ) | US$ | — | ||||||||
Accumulated Other comprehensive income Remeasurement of defined benefit obligation | a.4 | US$ | — | US$ | 219 | US$ | 219 | |||||||||
NON-CURRENT LIABILITIES | ||||||||||||||||
Deferred Income Tax | a.1 | US$ | (986 | ) | US$ | 986 | US$ | — | ||||||||
Other long-term liabilities | a.6 | US$ | (13,593 | ) | US$ | 12,802 | US$ | (791 | ) | |||||||
CURRENT LIABILITIES | ||||||||||||||||
Regulatory liabilities | a.1 | US$ | (5,773 | ) | US$ | 5,773 | US$ | — | ||||||||
Other liabilities | US$ | (2,308 | ) | US$ | (12,802 | ) | US$ | (15,110 | ) | |||||||
The changes did not have impact on the Company´s net operating, investing and financing cash flows.
In addition, during the preparation of these financial statements, for the purpose described in Note 1.b, the Company expanded certain disclosures from those previously presented.
| 2. | APPLICATION OF NEW AND REVISED INTERNATIONAL FINANCIAL REPORTING STANDARDS (IFRS) |
| 2.1. | New and amendments to IFRSs that are mandatorily effective for the current year |
In the current year, the Company has applied a number of amendments to IFRSs issued by the International Accounting Standards Board (IASB) that are mandatorily effective for the accounting period that begins on or after 1 January 2015:
| Amendments | to IAS 19 Defined Benefit plans: Employees’ Contributions |
Amends IAS 19 Employee Benefits to clarify the requirements that relate to how contributions from employees or third parties that are linked to service should be attributed to periods of service. In addition, it permits a practical expedient if the amount of the contributions is independent of the number of years of service, in that contributions, can, but are not required, to be recognized as a reduction in the service cost in the period in which the related service is rendered.
F-241
Table of Contents
DISTRIBUIDORA DE ELECTRICIDAD DE ORIENTE, S. A.—DEORSA
NOTES TO THE FINANCIAL STATEMENTS
AS OF DECEMBER 31, 2015, 2014 AND 2013 AND JANUARY 1,
2013 (RESTATED), AND FOR THE YEARS ENDED DECEMBER 31,
2015, 2014 AND 2013 (RESTATED)
(Stated in thousands of US Dollars, except otherwise indicated)
| 2. | APPLICATION OF NEW AND REVISED INTERNATIONAL FINANCIAL REPORTING STANDARDS (IFRS) (cont’d) |
The application to these amendments have not had any material impact on the disclosures or the amounts recognized in the Company’s financial statements.
| Annual | Improvements to the IFRS Terms 2010-2012 and 2011-2013 |
The Company has applied the amendments to IFRSs included in the Annual Improvements to IFRSs 2010-2012 Cycle and 2011 2013 Cycle for the first time in the current year. One of the annual improvements requires that the entities disclose judgments made in the application of the aggregation criteria established in paragraph 12 of the IFRS 8 Operation Segments.
The application of these amendments have not had an impact on the disclosures or amounts recognized in the Company’s financial statements since the Company does not report through operation segments. The application of the other amendments has had no impact on the disclosures or amounts recognized in the Company’s financial statements.
| 2.2. | New and revised IFRS issued but not yet effective |
The Company has not applied the following new and revised IFRSs that have been issued but are not yet effective:
IFRS 9 | Financial Instruments3 | |
IFRS 15 | Revenue from Contracts with Customers3 | |
IFRS 16 | Leasing4 | |
Amendments to IFRS 11 | Accounting for Acquisitions of Interests in Joint Operations1 | |
Amendments to IAS 1 | Disclosure Initiative1 | |
Amendments to IAS 16 and IAS 38 | Clarification of Acceptable Methods of Depreciation and Amortisation1 | |
Amendments to IAS 16 and IAS 41 | Agriculture: Bearer Plants1 | |
Amendments to IFRS 10 and IAS 28 | Sale or Contribution of Assets between an Investor and its Associate or Joint Venture5 | |
Amendments to IFRS 10, IFRS 12 and IAS 28 | Investment Entities: Applying the Consolidation Exception1 | |
Amendments to IFRSs | Annual Improvements to IFRSs 2012- 2014 Cycle1 | |
Amendments to IAS 7 | Statement of Cash Flows2 | |
Amendments to IAS 12 | Related to the Recognition of Deferred Tax Assets for Unrealized Losses2 |
| 1 | Effective for annual periods beginning on or after January 1, 2016, with earlier application permitted. |
F-242
Table of Contents
DISTRIBUIDORA DE ELECTRICIDAD DE ORIENTE, S. A.—DEORSA
NOTES TO THE FINANCIAL STATEMENTS
AS OF DECEMBER 31, 2015, 2014 AND 2013 AND JANUARY 1,
2013 (RESTATED), AND FOR THE YEARS ENDED DECEMBER 31,
2015, 2014 AND 2013 (RESTATED)
(Stated in thousands of US Dollars, except otherwise indicated)
| 2. | APPLICATION OF NEW AND REVISED INTERNATIONAL FINANCIAL REPORTING STANDARDS (IFRS) (cont’d) |
| 2 | Effective for annual periods beginning on or after January 1, 2017, with earlier application permitted. |
| 3 | Effective for annual periods beginning on or after January 1, 2018, with earlier application permitted. |
| 4 | Effective for annual periods beginning on or after January 1, 2019, with earlier application permitted. |
| 5 | Indefinitely deferred the effective date. |
IFRS 9 Financial Instruments
IFRS 9, issued in November 2009, incorporated new requirements for the classification and measurement of financial assets. IFRS 9 was subsequently modified in October 2010 in order to include the requirements for the classification and measurement of financial liabilities and for derecognition; in November 2013 it included the new requirements for the general hedge accounting. In July 2014, another revised version of the IFRS 9 was issued, mainly to include: a) requirements of impairment for financial assets and b) limited amendments to the requirements of classification and measurement by introducing a measurement category to “fair value through other comprehensive income” (FVTOCI) for certain simple debt instruments.
Key requirements of IFRS 9:
| • | IFRS 9 requires that all the recognized financial assets that are within the scope of the IAS 39Financial Instruments: Recognition and Measurementare measured subsequently under the amortized cost method or the fair value method. Specifically, debt investments that are held within a business model whose objective is to collect the contractual cash flows, and that have contractual cash flows that are solely payments of principal and interest on the principal outstanding are generally measured at amortized cost at the end of subsequent accounting periods. Debt instruments that are held within a business model whose objective is achieved both by collecting contractual cash flows and selling financial assets, and that have contractual terms that give rise on specified dates to cash flows that are solely payments of principal and interest on the principal amount outstanding, are generally measured at FVTOCI. All other debt investments and equity investments are measured at their fair value at the end of subsequent accounting periods. In addition, under IFRS 9, entities may make an irrevocable election to present subsequent changes in the fair value of an equity investment (that is not held for trading) in other comprehensive income, with only dividend income generally recognized in profit or loss. |
| • | With respect to the measurement of the financial liabilities that are designated as fair value through profit or loss, the IFRS 9 requires that the change amount at fair value of the financial liability attributable to the changes in the credit risk of such liability is recognized in other comprehensive income, unless that the recognition of the effects of the changes in the liability credit risk in other |
F-243
Table of Contents
DISTRIBUIDORA DE ELECTRICIDAD DE ORIENTE, S. A.—DEORSA
NOTES TO THE FINANCIAL STATEMENTS
AS OF DECEMBER 31, 2015, 2014 AND 2013 AND JANUARY 1,
2013 (RESTATED), AND FOR THE YEARS ENDED DECEMBER 31,
2015, 2014 AND 2013 (RESTATED)
(Stated in thousands of US Dollars, except otherwise indicated)
| 2. | APPLICATION OF NEW AND REVISED INTERNATIONAL FINANCIAL REPORTING STANDARDS (IFRS) (cont’d) |
| comprehensive income creates or increases the accounting mismatch in profit or loss. Changes in fair value attributable to a financial liability’s credit risk are not subsequently reclassified to profit or loss. Under IAS 39, the entire amount of the change in the fair value of the financial liability designated as fair value through profit or loss is presented in profit or loss |
| • | With respect to the financial assets impairment, the IFRS 9 requires a model of impairment on expected credit loss, opposed to the expected credit loss model incurred, in conformity with IAS 39. The expected credit loss model requires that an entity records the expected credit losses and their changes in these expected credit losses at each reporting date in order to reflect the changes in the credit risk from the initial recognition. |
| • | The new general requirements for the hedge accounting retain the three types of mechanisms of hedge accounting that are currently available in IAS 39. In conformity with IFRS 9, the types of suitable transactions for the hedge accounting are much more flexible, specifically, by enlarging the types of instruments that are classified as hedge instruments and the types of risk components of non-financial items suitable to the hedge accounting. In addition, the effectiveness test has been overhauled and replaced with the principle of an ‘economic relationship’. Retrospective assessment of hedge effectiveness is also no longer required. Enhanced disclosure requirements about an entity’s risk management activities have also been introduced. |
The management of the Company foresee that the application of this new standard will not have a material impact over the Company’s financial statements.
IFRS 15 Revenue from Contracts with Customers
In May 2014, IFRS 15 was issued which establishes an extensive and detailed model that will be used by the entities in the accounting for revenue from contracts with clients. The IFRS 15 will supersed the current guideline of revenue recognition, including IAS 18 Revenue, IAS 11 Construction Contracts and the related interpretations when it becomes effective.
The essential principle of IAS 15 is that a company should recognize revenue to represent the transfer of goods and services promised to the clients in an amount that reflects the consideration that the company expects to receive in exchange of the goods or services. Specifically, the standard adds a model of five steps to revenue recognition:
Step 1: Identify the contract with the clients.
Step 2: Identify the performance obligations in the contract.
Step 3: Determine the transaction price.
Step 4: Distribute the transaction price to the performance obligations in the contract.
Step 5: Recognize revenue when (or as) the entity satisfies the performance obligation.
F-244
Table of Contents
DISTRIBUIDORA DE ELECTRICIDAD DE ORIENTE, S. A.—DEORSA
NOTES TO THE FINANCIAL STATEMENTS
AS OF DECEMBER 31, 2015, 2014 AND 2013 AND JANUARY 1,
2013 (RESTATED), AND FOR THE YEARS ENDED DECEMBER 31,
2015, 2014 AND 2013 (RESTATED)
(Stated in thousands of US Dollars, except otherwise indicated)
| 2. | APPLICATION OF NEW AND REVISED INTERNATIONAL FINANCIAL REPORTING STANDARDS (IFRS) (cont’d) |
Under IFRS 15, a Company records income when (or as) a performance obligation is satisfied, i.e., when the “control” of the goods and services based on a particular performance obligation is transferred to the client. Many other prescriptive guidelines have been added within the IFRS 15 to confront specific situations. Additionally, IFRS 15 requires extensive disclosures.
On April 12, 2016, the IASB amends IFRS 15 Revenue from Contracts with Customers to clarify three aspects of the standard (identifying performance obligations, principal versus agent considerations, and licensing) and to provide some transition relief for modified contracts and completed contracts.
The Company is evaluating this standard and cannot, at this time, estimate the potential impact on its future financial condition, results of operations and cash flows.
IFRS 16—Leasing
On January 13, 2016, the IASB issued IFRS 16, which brings most leases on the balance sheet for lessees under a single model, eliminating the distinction between operating and finance leases. For lessors, however, the accounting remains largely unchanged and the distinction between operating and finance leases is retained. IFRS 16 supersedes IAS 17 and related interpretations.
Under IFRS 16, a lessee recognizes a right-of-use asset and a lease liability. The right-of-use asset is treated similarly to other nonfinancial assets and depreciated accordingly, and the liability accrues interest. The lease liability is initially measured at the present value of the lease payments payable over the lease term, discounted at the rate implicit in the lease if this rate can be readily determined. If the rate cannot be readily determined, the lessee’s incremental borrowing rate should be used.
Like IAS 17, IFRS 16 requires lessors to classify leases as operating or finance leases. A lease is classified as a finance lease if it transfers substantially all the risks and rewards of ownership of an underlying asset. Otherwise, the lease is classified as an operating lease. For finance leases, a lessor recognizes finance income over the lease term on the basis of a pattern reflecting a constant periodic rate of return on the net investment. For operating leases, a lessor recognizes lease payments as income on a straight-line basis or, if more representative of the pattern in which benefit from use of the underlying asset is diminished, another systematic basis.
IFRS 16 is effective for annual reporting periods beginning on or after January 1, 2019. Earlier application is permitted if an entity has also applied IFRS 15 (on revenue from contracts with customers).
The Company’s management estimate that the application of the IFRS 16 in the future might have a material impact on the amounts reported and the disclosures of the Company’s financial statements. However, it is not practicable to provide a reasonable estimate of the effect of this standard until the Company performs a detailed review.
F-245
Table of Contents
DISTRIBUIDORA DE ELECTRICIDAD DE ORIENTE, S. A.—DEORSA
NOTES TO THE FINANCIAL STATEMENTS
AS OF DECEMBER 31, 2015, 2014 AND 2013 AND JANUARY 1,
2013 (RESTATED), AND FOR THE YEARS ENDED DECEMBER 31,
2015, 2014 AND 2013 (RESTATED)
(Stated in thousands of US Dollars, except otherwise indicated)
| 2. | APPLICATION OF NEW AND REVISED INTERNATIONAL FINANCIAL REPORTING STANDARDS (IFRS) (cont’d) |
Amendments to the IAS 1 Disclosure Initiative
Amendments to IAS 1 provide guidelines as to how to apply the materiality concept in the accounting practice.
Amendments to IAS 1 take effect for the annual period beginning on January 1, 2016. The Company’s management does not foresee that the application of these amendments to IAS 1 will have a material impact on the Company’s financial statements.
Amendments to IAS 16 and IAS 38 Clarification of Acceptable Methods of Depreciation and Amortization
Amendments of IAS 16 prohibit that the entities use a depreciation method based on the revenue for items of property, plant, and equipment. Amendments to IAS 38 introduce a rebuttable assumptions that states that revenue is not an appropriate principle for the amortization of an intangible asset. This assumption may be rebutted only in the two following circumstances:
| • | when the intangible asset is stated as a revenue measure, or |
| • | when it can be demonstrated that revenue and the consumption of economic benefits of the intangible asset are closely related. |
Amendments are applied prospectively for annual periods beginning on January 1, 2016 or after. Currently, the Company uses the straight-line method of depreciation and amortization for property, plant, equipment, and intangible assets, respectively. The management considers that this is the most appropriate method to reflect the consumption of economic benefits inherent to the respective assets; that is the reason why the Company’s management does not consider applicable these amendments to IAS 16 and IAS 38 for the Company’s financial statements.
Amendments to IAS 7—Statements of cash flows
On January 29, 2016, the IASB published amendments to IAS 7 as part of its disclosure initiative (i.e., projects to improve the effectiveness of financial reporting disclosures). The objective of the amendments is to clarify IAS 7 to improve information provided to financial statement users about an entity’s financing activities.
The amendments require that an entity disclose, to the extent necessary to meet the disclosure objective, the following changes in liabilities arising from financing activities:
| • | changes from financing cash flows; |
| • | changes arising from obtaining or losing control of subsidiaries or other businesses; |
F-246
Table of Contents
DISTRIBUIDORA DE ELECTRICIDAD DE ORIENTE, S. A.—DEORSA
NOTES TO THE FINANCIAL STATEMENTS
AS OF DECEMBER 31, 2015, 2014 AND 2013 AND JANUARY 1,
2013 (RESTATED), AND FOR THE YEARS ENDED DECEMBER 31,
2015, 2014 AND 2013 (RESTATED)
(Stated in thousands of US Dollars, except otherwise indicated)
| 2. | APPLICATION OF NEW AND REVISED INTERNATIONAL FINANCIAL REPORTING STANDARDS (IFRS) (cont’d) |
| • | the effect of changes in foreign exchange rates; |
| • | changes in fair values; and |
| • | other changes. |
The IASB defines liabilities arising from financing activities as liabilities “for which cash flows were, or future cash flows will be, classified in the statement of cash flows as cash flows from financing activities.” The amendments indicate that the new disclosure requirements also apply to changes in financial assets that meet this definition. The amendments state that one way to meet the new disclosure requirements is to provide “a reconciliation between the opening and closing balances in the statement of financial position for liabilities arising from financing activities.”
The amendments are effective for annual periods beginning on or after January 1, 2017. Earlier application is permitted. The Company’s management foresees that the application of this amendment might have an impact on the Company’s financial statements if this type of transactions arises in the future.
Amendments to IAS 12 Related to the Recognition of Deferred Tax Assets for Unrealized Losses
On January 19, 2016, the IASB published final amendments to IAS 12. The amendments clarify the following:
| • | Unrealized losses on debt instruments measured at fair value and measured at cost for tax purposes “give rise to a deductible temporary difference [regardless] of whether the debt instrument’s holder expects to recover the carrying amount of the debt instrument by sale or by use.” |
| • | “The carrying amount of an asset does not limit the estimation of probable future taxable profit.” |
| • | Estimates of future taxable profit exclude “tax deductions resulting from the reversal of deductible temporary differences.” |
| • | An entity assesses a deferred tax asset in combination with other deferred tax assets. When tax law restricts the utilization of tax losses, an entity assesses a deferred tax asset in combination with other deferred tax assets of the same type. |
The amendments are effective for annual periods beginning on or after January 1, 2017; earlier application is permitted. The management of the Company do not anticipate that the application of these amendments will have a material effect on the Company’s financial statements.
F-247
Table of Contents
DISTRIBUIDORA DE ELECTRICIDAD DE ORIENTE, S. A.—DEORSA
NOTES TO THE FINANCIAL STATEMENTS
AS OF DECEMBER 31, 2015, 2014 AND 2013 AND JANUARY 1,
2013 (RESTATED), AND FOR THE YEARS ENDED DECEMBER 31,
2015, 2014 AND 2013 (RESTATED)
(Stated in thousands of US Dollars, except otherwise indicated)
| 2. | APPLICATION OF NEW AND REVISED INTERNATIONAL FINANCIAL REPORTING STANDARDS (IFRS) (cont’d) |
Annual Improvements to IFRS Term 2012-2014
The annual improvements of the IFRS’s of term 2012-2014 include a number of amendments to several IFRS’s which are summarized as follows:
Amendments to IFRS 5 show a specific orientation in IFRS 5, that is when the entity reclassifies an asset (or disposal group) held for sale to held for its distribution to owners (or vice versa).
Amendments to IFRS 7 provide an additional guideline to clarify whether a contract of services rendering corresponds to the continuous sharing participation in the transfer of an asset transferred for information disclosure effects of such asset.
Amendments to IAS 19 clarify that the rate used in order to discount the obligations from post-employment benefits must be determined in relation with the market yields on high quality corporate bonds at the end of the reporting period.
The management of the Company do not anticipate that the application of these amendments will have a material effect on the Company’s financial statements.
| 3. | SIGNIFICANT ACCOUNTING POLICIES |
The significant accounting policies used in the preparation of the financial statements are described as follows:
| a. | Statement of Compliance and Basis of Preparation—This financial statements were prepared according to the International Financial Reporting Standards (IFRS) as issued by the International Accounting Standards Board (IASB) in force at December 31, 2015, which include the International Financial Reporting Standards (IFRS), the International Accounting Standards (IAS), and the Interpretations issued by the International Financial Reporting Standards Committee (IFRIC), or by the former Standards Interpretation Committee (SIC) adopted by the IASB. The financial statements have been prepared on the historical cost basis except for certain financial instruments that are measured at fair values at the end of each reporting period, as explained in the accounting policies below. The historical cost is based generally in the fair value of the consideration given in exchange of goods and services. |
Fair value is the price that would be received to sell an asset or paid to transfer a liability in an orderly transaction between market participants at the measurement date, regardless of whether that price is directly observable or estimated using another valuation technique. In estimating the fair value of an asset or a liability, the Company takes into account the characteristics of the asset or liability if market participants would take those characteristics into account when pricing the asset or liability at the measurement date. Fair value for measurement and/or disclosure purposes in these consolidated
F-248
Table of Contents
DISTRIBUIDORA DE ELECTRICIDAD DE ORIENTE, S. A.—DEORSA
NOTES TO THE FINANCIAL STATEMENTS
AS OF DECEMBER 31, 2015, 2014 AND 2013 AND JANUARY 1,
2013 (RESTATED), AND FOR THE YEARS ENDED DECEMBER 31,
2015, 2014 AND 2013 (RESTATED)
(Stated in thousands of US Dollars, except otherwise indicated)
| 3. | SIGNIFICANT ACCOUNTING POLICIES (cont’d) |
financial statements is determined on such a basis, except for leasing transactions that are within the scope of IAS 17, and measurements that have some similarities to fair value but are not fair value, such as net realizable value in IAS 2 or value in use in IAS 36.
In addition, for financial reporting purposes, fair value measurements are categorized into Level 1, 2 or 3 based on the degree to which the inputs to the fair value measurements are observable and the significance of the inputs to the fair value measurement in its entirety, which are described as follows:
Level 1: The inputs are quoted prices (not adjusted) in active markets for assets or liabilities identical to those that the Company may access at the date of measurement.
Level 2: The inputs are different from the quoted prices included in Level 1, which are observable for the asset or liability, either directly or indirectly.
Level 3: The inputs are not observable for the asset or liability.
| b. | Functional and Presentation Currency |
The Company’s functional currency is the Quetzal (Q.), which is the currency of the primary economic environment in which the Company operates. The Quetzal is the monetary unit of Guatemala. The presentation currency for these financial statements is the United States Dollar (US$).
When preparing the Company’s financial statements, the transactions in currencies other than the functional currency (foreign currencies) are recognized using the exchange rates prevailing at the dates of the transactions. At the end of each reporting period, monetary items denominated in foreign currency are translated at the exchange rates prevailing at that date. Non-monetary items carried at fair value, denominated in foreign currency, are translated at the exchange rate in force at the date in which the fair value was determined. Non-monetary items calculated in terms of historical cost, in foreign currency, are not translated.
Exchange differences on monetary items are recognized in the profit or loss of the period in which they occur, except for the following cases:
| • | Exchange differences from loans in foreign currency related to assets in construction for productive use in the future, which is included in the cost of such assets for being considered as an adjustment to the costs from interests on such loans in foreign currency; and |
| • | Exchange differences on transactions entered into in order to hedge certain foreign currency risks (see 3.o below for hedging accounting policies). |
F-249
Table of Contents
DISTRIBUIDORA DE ELECTRICIDAD DE ORIENTE, S. A.—DEORSA
NOTES TO THE FINANCIAL STATEMENTS
AS OF DECEMBER 31, 2015, 2014 AND 2013 AND JANUARY 1,
2013 (RESTATED), AND FOR THE YEARS ENDED DECEMBER 31,
2015, 2014 AND 2013 (RESTATED)
(Stated in thousands of US Dollars, except otherwise indicated)
| 3. | SIGNIFICANT ACCOUNTING POLICIES (cont’d) |
The Company has presented its financial statements in US$ therefore, the financial statements prepared in the Company’s functional currency were translated into the presentation currency, as per the following procedures:
| • | Assets and liabilities of each of the statements of financial position presented are converted using the exchange rate at the statement of financial position closing date; |
| • | Items in the statement of profit or loss and other comprehensive income are converted using the exchange rate at the time the transactions were generated (or, for practical reasons, and provided the exchange rate has not changed significantly, using each month’s average exchange rate); |
All conversion differences resulting from the foregoing are recognized under “Other Comprehensive Income” and accumulated in equity.
| c. | Use of Estimates—The accounting policies that the Company follows require that the Management carries out certain estimates and use certain assumptions in order to determine the carrying amounts of assets and liabilities that are not readily apparent from other sources included in the financial statements and carry out the corresponding disclosures.Even if they differ in their actual result, Management considers that the estimates and assumptions used were adequate in the circumstances. The estimates and associated assumptions are based on historical experience and other factors that are considered to be relevant. Actual results may differ from these estimates. |
The estimates and underlying assumptions are reviewed on an ongoing basis. Revisions to accounting estimates are recognized in the period in which the estimate is revised. If the revision affects only that period, or in the period of the revision and future periods if the revision affects both current and future periods.
Critical Accounting Estimates and Assumptions
The Company prepares estimates and assumptions with regard to the future. Actual results may differ from these estimates.
The following are the key assumptions concerning the future, and other key sources of estimation uncertainty at the end of the reporting period that may have a significant risk of causing a material adjustment to the carrying amounts of assets and liabilities within the next financial year.
| • | Energy Purchase Provision |
The Company records on a monthly basis the provision of energy purchased not yet billed by estimating the energy received since the last measurement from the supplier. This provision consists in estimating the energy received since the last invoice from the supplier in the frontier spots and valuing it at the prices that the different energy suppliers define in the contract of energy purchase with the Company.
F-250
Table of Contents
DISTRIBUIDORA DE ELECTRICIDAD DE ORIENTE, S. A.—DEORSA
NOTES TO THE FINANCIAL STATEMENTS
AS OF DECEMBER 31, 2015, 2014 AND 2013 AND JANUARY 1,
2013 (RESTATED), AND FOR THE YEARS ENDED DECEMBER 31,
2015, 2014 AND 2013 (RESTATED)
(Stated in thousands of US Dollars, except otherwise indicated)
| 3. | SIGNIFICANT ACCOUNTING POLICIES (cont’d) |
| • | Energy Supplied Pending Invoicing |
In each monthly close period, the Company records in the account “Energy consumed, not billed” the amount of the accrued revenue not invoiced on the sale of electric energy. This provision consists in estimating the energy delivered since the last measurement date of the consumers and the accounting close period at the tariffs approved by the CNEE for each category of customer.
| • | Useful Lives of Property, Plant and Equipment |
The Company reviews the estimated useful life of property, plant and equipment at the end of each annual period. Estimated useful lives are detailed in note 3d.
| • | Application of IFRIC 12 “Service Concession Arrangements” |
Interpretation No. 12 “Service Concession Arrangements” (IFRIC 12) establishes some accounting guidelines for private entities that provide public services under a service concession agreement or similar arrangement. IFRIC 12 is applicable to license holders depending, among other things, on the extent to which the grantor controls or regulates the services and any significant residual interest in the assets at the end of the term of the arrangement.
Considering that IFRIC 12 establishes general guidelines and principles, judgment is required to determine whether it is applicable due to the specific nature of each service concession or license and the complexity inherent in the different concepts included in its interpretation.
The Company has examined the characteristics, conditions and terms currently in effect under its electric energy distribution License and the guidelines established by IFRIC 12. On the basis of such analysis, the Company concluded that its license is outside the scope of IFRIC 12, primarily because the grantor does not control any significant residual interest in the infrastructure at the end of the term of the arrangement as explained in note 1.a and the possibility of renewal.
F-251
Table of Contents
DISTRIBUIDORA DE ELECTRICIDAD DE ORIENTE, S. A.—DEORSA
NOTES TO THE FINANCIAL STATEMENTS
AS OF DECEMBER 31, 2015, 2014 AND 2013 AND JANUARY 1,
2013 (RESTATED), AND FOR THE YEARS ENDED DECEMBER 31,
2015, 2014 AND 2013 (RESTATED)
(Stated in thousands of US Dollars, except otherwise indicated)
| 3. | SIGNIFICANT ACCOUNTING POLICIES (cont’d) |
The Company accounts for the assets acquired or constructed in connection with the concession in accordance with IAS 16 Property, plant and equipment.
| d. | Property, Plant and Equipment—Technical facilities are recorded at cost less the subsequent accumulated depreciation and any recognized impairment loss. |
Properties in the course of construction for production, supply or administrative purposes are carried at cost, less any recognized impairment loss. Cost includes professional fees and, for qualifying assets, borrowing costs capitalized in accordance with the Company’s accounting policy. Such properties are classified to the appropriate categories of property, plant and equipment when completed and ready for intended use. Depreciation of these assets, on the same basis as other property assets, commences when the assets are ready for their intended use.
Tooling, furniture, and other equipment are stated at cost less accumulated depreciation and accumulated impairment losses.
Property, plant and equipment assets that require a process of construction are recorded at cost, which corresponds mainly to the following concepts:
| 1. | Feasibility studies: The Company has the policy of contracting an entity to carry out engineering feasibility surveys for projects of its own. Invoicing that complies with the recognition criteria is recorded as part of the property, plant and equipment. |
| 2. | Contractor costs: Work force for construction and start-up of the property, plant and equipment is in charge of independent contractors. Invoicing that complies with the recognition criteria is recorded as part of the property, plant and equipment in progress. |
| 3. | Materials: All important materials used in the construction and that comply with the recognition criteria (for example: posts, transformers, cables, among others). |
| 4. | Direct costs subject to capitalization: The cost of the property, plant and equipment includes the cost of employee benefits arising directly from the construction of distribution and transmissions assets. |
Indirect capitalizations are originated by the following concept:
| • | Works for Property, Plant and Equipment: They correspond to personnel expenses related to the construction of property, plant and equipment. The Company allocates to property, plant and equipment personnel expenses according to the effective time dedicated by each worker to the process of construction of the property, plant and equipment. |
F-252
Table of Contents
DISTRIBUIDORA DE ELECTRICIDAD DE ORIENTE, S. A.—DEORSA
NOTES TO THE FINANCIAL STATEMENTS
AS OF DECEMBER 31, 2015, 2014 AND 2013 AND JANUARY 1,
2013 (RESTATED), AND FOR THE YEARS ENDED DECEMBER 31,
2015, 2014 AND 2013 (RESTATED)
(Stated in thousands of US Dollars, except otherwise indicated)
| 3. | SIGNIFICANT ACCOUNTING POLICIES (cont’d) |
During 2015, 2014 and 2013, the Company capitalized to property, plant and equipment for the concept of personnel expenses the amount of US$ 1,439, US$ 1,331 and US$ 1,493, respectively.
| 5. | Cost of expansion or improvements: Improvements that extend substantially the useful life of the property, plant and equipment are recorded increasing its value, while maintenance, repairs and minor improvements are recorded in profit or loss of the period when incurred. |
| 6. | Replacements or refurbishments: Replacements or refurbishments of complete elements are recognized as an addition to the item and the corresponding derecognition of the item replaced. |
Depreciation is recognized in profit or loss.
Freehold land is not depreciated.
Depreciation is recognized so as to write off the cost of assets (other than freehold land and properties under construction) less their residual values.
The property, plant and equipment is depreciated under the straight-line method considering the estimated useful lives set out as follows:
Stage of Electrical Grid | Item | Estimated | ||
Substations | Power transformers | 30-40 | ||
Electromechanical equipment | 30-40 | |||
Telecontrol stations | 30 | |||
Battery systems | 30 | |||
Panel of control’s cabinet | 10-30 | |||
Civil works, optical fiber and accessories | 30 | |||
Modem | 10 | |||
Medium voltage | Devices and equipment | 30-40 | ||
Lines | 30-40 | |||
Transf. MV/LV | Medium voltage (MV) | 30-35 | ||
Low voltage (LV) | 30-40 | |||
Meters and connections | Connections | 15-25 | ||
| Electromechanic meters | 10-15 | |||
| Electric meters | 15 | |||
Equipment and tools | 5 | |||
Furniture and other property, plant and equipment | 5 |
The estimated useful life, residual value and depreciation method are reviewed at the end of each period which is reported, being the effect of any change in the estimate registered regarding the prospective basis.
F-253
Table of Contents
DISTRIBUIDORA DE ELECTRICIDAD DE ORIENTE, S. A.—DEORSA
NOTES TO THE FINANCIAL STATEMENTS
AS OF DECEMBER 31, 2015, 2014 AND 2013 AND JANUARY 1,
2013 (RESTATED), AND FOR THE YEARS ENDED DECEMBER 31,
2015, 2014 AND 2013 (RESTATED)
(Stated in thousands of US Dollars, except otherwise indicated)
| 3. | SIGNIFICANT ACCOUNTING POLICIES (cont’d) |
An item of property, plant and equipment is derecognized upon disposal or when no future economic benefits are expected to arise from the continued use of the asset. Any gain or loss arising on the disposal or retirement of an item of property, plant and equipment is determined as the difference between the sales proceeds and the carrying amount of the asset and is recognized in profit or loss.
| e. | Intangible Assets—The Company records as intangible assets the following concepts: |
| • | Goodwill |
Goodwill resulting from the acquisition of a subsidiary corresponds to the excess of the consideration transferred (including the value of any non-controlling participation in the acquiree, and the fair value of the acquirer’s previously held equity interest in the acquiree (if any)), over the identifiable net fair value of the assets, liabilities, contingent considerations of the subsidiary or the entity jointly controlled, recognized at the acquisition date. Goodwill is initially recognized as an asset at cost and, subsequently, presented at cost less any accumulated impairment loss, if any.
The Company recognized goodwill that arose from the reverse merger with ASROED, S. A. (former Company’s parent) in 2011. In such merger the Company absorbed ASROED, S.A. and hence, it was the survival entity. This transaction was recognized as a reorganization of group entities under which the book values of ASROED, S.A.’s assets and liabilities were included in the Company’s accounting records. Goodwill, for impairment assessment purposes, is allocated to the only cash generating unit that the Company has.
A cash-generating unit to which goodwill has been allocated is tested for impairment on an annual basis, or on a shorter period if there is evidence of impairment in any of the cash generating units. If the recoverable amount of the cash-generating unit is less than its carrying amount, the impairment loss is allocated first to reduce the carrying amount of any goodwill allocated to the unit and then to the other assets of the unit pro rata based on the carrying amount of each asset in the unit. Any impairment loss for goodwill is recognized directly to profit or loss of the period; these losses could not be reversed in the subsequent period. On disposal of the relevant cash-generating unit, the attributable amount of goodwill is included in the determination of the profit or loss on disposal.
| • | Costs of Licenses |
Intangible assets with finite useful lives that are acquired separately are carried at cost less accumulated amortization and accumulated impairment losses. The estimated useful life and amortization method are reviewed at the end of each reporting period, with the effect of any changes in estimate being accounted for on a prospective basis. Intangible assets with indefinite useful lives that are acquired separately are carried at cost less accumulated impairment losses.
An internally-generated intangible asset arising from development (or from the development phase of an internal project) is recognized if, and only if, all of the following have been demonstrated:
| • | the technical feasibility of completing the intangible asset so that it will be available for use or sale; |
F-254
Table of Contents
DISTRIBUIDORA DE ELECTRICIDAD DE ORIENTE, S. A.—DEORSA
NOTES TO THE FINANCIAL STATEMENTS
AS OF DECEMBER 31, 2015, 2014 AND 2013 AND JANUARY 1,
2013 (RESTATED), AND FOR THE YEARS ENDED DECEMBER 31,
2015, 2014 AND 2013 (RESTATED)
(Stated in thousands of US Dollars, except otherwise indicated)
| 3. | SIGNIFICANT ACCOUNTING POLICIES (cont’d) |
| • | the intention to complete the intangible asset and use or sell it; |
| • | the ability to use or sell the intangible asset; |
| • | how the intangible asset will generate probable future economic benefits; |
| • | the availability of adequate technical, financial and other resources to complete the development and to use or sell the intangible asset; and |
| • | the ability to measure reliably the expenditure attributable to the intangible asset during its development. |
The amount initially recognized for internally-generated intangible assets is the sum of the expenditure incurred from the date when the intangible asset first meets the recognition criteria listed above. Where no internally-generated intangible asset can be recognized, development expenditure is recognized in profit or loss in the period in which it is incurred. Subsequent to initial recognition, internally-generated intangible assets are reported at cost less accumulated amortization and accumulated impairment losses, on the same basis as intangible assets that are acquired separately.
The Company records in this account the purchase of licenses and the costs of software classifying them as intangible assets which are amortized during their estimated useful life of five years.
| • | Derecognition of Intangible Assets |
An intangible asset is derecognized on disposal, or when no future economic benefits are expected from use or disposal. Gains or losses arising from derecognition of an intangible asset, measured as the difference between the net disposal proceeds and the carrying amount of the asset, is recognized in profit or loss when the asset is derecognized.
| f. | Impairment of Tangible and Intangible Assets Including Goodwill—The Company reviews at the end of each reporting period the carrying amounts of its tangible and intangible assets to determine if there is evidence that such assets may have suffered an impairment loss. If there is any evidence, the recoverable amount of the asset is calculated with the purpose of determining the extent of the impairment loss (if any). When it is not possible to estimate the recoverable value of an individual asset, the Company estimates the recoverable value of the cash generating unit to which the asset belongs. When a consistent and fair distribution basis is identified, the common assets are also distributed to the individual cash generating unit or, if not possible, to the smallest group of the cash generating units for which a consistent and fair distribution basis is identified. |
Intangible assets with an indefinite useful life (including goodwill) are revised on an annual basis for such purposes, as well as when there is evidence that the related asset might have suffered any value loss.
F-255
Table of Contents
DISTRIBUIDORA DE ELECTRICIDAD DE ORIENTE, S. A.—DEORSA
NOTES TO THE FINANCIAL STATEMENTS
AS OF DECEMBER 31, 2015, 2014 AND 2013 AND JANUARY 1,
2013 (RESTATED), AND FOR THE YEARS ENDED DECEMBER 31,
2015, 2014 AND 2013 (RESTATED)
(Stated in thousands of US Dollars, except otherwise indicated)
| 3. | SIGNIFICANT ACCOUNTING POLICIES (cont’d) |
The recoverable value is the higher value between the fair value less the cost of selling it and the value in use. The value in use is determined based on future estimated cash flows discounted at its present value, using a discount rate before tax that reflects the current market valuations with regard to the time value of money and the specific risks of the asset for which the estimates of future cash flows have not been adjusted.
If the recoverable amount of an asset (or a cash generating unit) is estimated to be less than its carrying amount, the book value of the asset (cash generating unit) would be reduced to its recoverable amount. An impairment loss is recognized as an expense, unless the corresponding asset would be kept at revaluation value, in which case such losses would be recognized as a reduction of the revaluation surplus.
When an impairment loss subsequently reverses, the carrying amount of the asset (or a cash-generating unit) is increased to the revised estimate of its recoverable amount, but so that the increased carrying amount does not exceed the carrying amount that would have been determined had no impairment loss been recognized for the asset (or cash-generating unit) in prior years. A reversal of an impairment loss is recognized immediately in profit or loss.
| g. | Inventory—Stock of materials, accessories, and other electric supplies are valued at the weighted average cost and do not exceed their net realizable value. |
Inventories are valued at the lower value between the cost and the net realizable value. The net realizable value is the selling price in the normal course of the business, less the costs to sell the inventory.
| h. | Revenue Recognition from the Activity of Electric Energy Distribution and Other Income from Exploitation—Revenue is measured at the fair value of the consideration received or receivable. Revenue is reduced for estimated customer returns, rebates and other similar allowances. Income is recognized when it is probable that the economic benefits associated to the transaction flow to the Company and the amount of revenue can be reliably measured. |
Sale of Energy
Revenue from the distribution of electric energy is recognized according to the energy delivered, through invoicing and the estimate of sales from the energy supplied which has not been billed yet at the reporting date.
Revenue from Services Rendered
Revenue from toll services is recognized in the accounting periods in which the services are rendered.
Revenue for connection fees is recognized by reference to the stage of completion of the contract determined by reference to the stage of completion of the installation, determined as the proportion of the total time expected to install that has elapsed at the end of the reporting period.
F-256
Table of Contents
DISTRIBUIDORA DE ELECTRICIDAD DE ORIENTE, S. A.—DEORSA
NOTES TO THE FINANCIAL STATEMENTS
AS OF DECEMBER 31, 2015, 2014 AND 2013 AND JANUARY 1,
2013 (RESTATED), AND FOR THE YEARS ENDED DECEMBER 31,
2015, 2014 AND 2013 (RESTATED)
(Stated in thousands of US Dollars, except otherwise indicated)
| 3. | SIGNIFICANT ACCOUNTING POLICIES (cont’d) |
Interest Income
Interest income from a financial asset is recognized when it is probable that the Company receives economic benefits associated to the transaction and the amount of the income can be reliably measured. Interest income is accrued on a time basis with reference to the outstanding capital and the effective interest rate applicable, which is the discount rate that equals exactly the cash flows receivable or payable estimated throughout the expected life of the financial instrument with the net book value of the financial asset at the initial recognition.
| i. | Legal Reserve—In conformity with the Commerce Code of Guatemala, all mercantile Companies must allocate on an annual basis five per cent of their net taxable profit to constitute the legal reserve, which cannot be distributed as dividends until the Company is liquidated. However, this reserve can be capitalized when it becomes equivalent to, or represents more than 15 per cent of, the capital stock at the end of the previous period, notwithstanding continuing to reserve such five per cent annually. |
| j. | Government Grants—Trust Fund of Rural Electrification Program— |
Government grants related to distribution projects of the Rural Electrification Program (PER, in Spanish) (see Notes 26 and 31) are not recognized until there is reasonable assurance that the Company will comply with the conditions attaching to them and that the grants will be received.
Government grants are recognized in profit or loss on a systematic basis over the periods in which the Company recognizes as expenses the related costs for which the grants are intended to compensate. Specifically, government grants whose primary condition is that the Company should purchase, construct or otherwise acquire non-current assets are recognized as deferred revenue in the statement of financial position and transferred to profit or loss on a systematic and rational basis over the useful lives of the related assets.
The works constructed by the Company with funds coming from grants (Note 31) are recorded at the value of the grant received and any difference between this value and the actual construction cost is recognized in profit or loss of the year in which the asset is released.
| k. | Advanced Payments of Debtors for third-party Construction Works—In the account “Advanced payments of debtors for third-party works” included in “Other liabilities”, the Company records as a liability the funds received from the “Trust Fund of Electric Energy” for projects of rural electric energy transmission in the departments of the Eastern region of the country, which are reduced as the corresponding invoices are issued. The Company reduces such liability according to the progress of the works. |
| l. | Provisions for contingencies—The Company recognizes a provision only when it has a present obligation (legal or constructive) as a result of a past event, it is probable that the Company will be required to cancel the obligation and a reliable estimate of the obligation amount can be made. |
F-257
Table of Contents
DISTRIBUIDORA DE ELECTRICIDAD DE ORIENTE, S. A.—DEORSA
NOTES TO THE FINANCIAL STATEMENTS
AS OF DECEMBER 31, 2015, 2014 AND 2013 AND JANUARY 1,
2013 (RESTATED), AND FOR THE YEARS ENDED DECEMBER 31,
2015, 2014 AND 2013 (RESTATED)
(Stated in thousands of US Dollars, except otherwise indicated)
| 3. | SIGNIFICANT ACCOUNTING POLICIES (cont’d) |
Provisions are revised at the statement of financial position date.
The amount recognized as a provision is the best estimate of the consideration required to settle the present obligation at the end of the reporting period, taking into account the risks and uncertainties surrounding the obligation (Note 27). When a provision is measured using the cash flows estimated to settle the present obligation, its carrying amount is the present value of those cash flows (when the effect of the time value of money is material).
When some or all of the economic benefits required to settle a provision are expected to be recovered from a third party, a receivable is recognized as an asset if it is virtually certain that reimbursement will be received and the amount of the receivable can be measured reliably.
| m. | Provision for Severance Compensation—In conformity with the Labor Code of the Republic of Guatemala, the Company is obligated to pay severance compensation to employees dismissed under certain circumstances, like reorganizations, at an amount equal to one-month salary plus the twelfth part of their Christmas bonus and mid-year bonus for each year of service rendered. The Company charges to profit or loss the severance payments when the employees are actually dismissed, except for the case of former employees of INDE, which are under a specific collective agreement, where the Company has to pay the severance compensation irrespective of the circumstances that trigger the termination of their labor relationship with the Company (i.e. dismissal, resignation, death, etc.). The severance amount for these employees is calculated over the abovementioned basis plus an additional half monthly salary per each year of service. |
As of December 31, 2015, 2014 and 2013, the Company carried out an actuarial study to determine the maximum obligation for the referred severance obligation. The Company has classified this obligation as a defined benefit retirement plan. For those plans, the cost of providing benefits is determined using the projected unit credit method, with actuarial valuations being carried out at the end of each annual reporting period. Remeasurement, comprising actuarial gains and losses and the effect of the changes to the asset ceiling (if applicable), is reflected immediately in the statement of financial position with a charge or credit recognized in other comprehensive income in the period in which they occur. Remeasurement recognized in other comprehensive income is reflected immediately in retained earnings and will not be reclassified to profit or loss.
At December 31, 2015, 2014 and 2013 this obligation amounts to US$ 2,112, US$ 1,865 and US$ 1,703, respectively. The abovementioned maximum obligation represents the present value of the future benefits that the employees will receive (Note 27b).
| n. | Deposits Received from Consumers—In conformity with the Regulation of the General Electricity Act, Decree No. 93-96 of November 15, 1996, which was amended by the Governmental Agreement No.68-2007, interests have to be accrued on cash deposits received from the consumers at the monthly weighted average interest rate published by the Central Bank with an annual capitalization. |
F-258
Table of Contents
DISTRIBUIDORA DE ELECTRICIDAD DE ORIENTE, S. A.—DEORSA
NOTES TO THE FINANCIAL STATEMENTS
AS OF DECEMBER 31, 2015, 2014 AND 2013 AND JANUARY 1,
2013 (RESTATED), AND FOR THE YEARS ENDED DECEMBER 31,
2015, 2014 AND 2013 (RESTATED)
(Stated in thousands of US Dollars, except otherwise indicated)
| 3. | SIGNIFICANT ACCOUNTING POLICIES (cont’d) |
Deposits received and interests accrued are recorded as other liability accounts “Principal from deposits received from consumers” and “Interests from deposits received from consumers”, respectively.
Deposits received from consumers, plus interest accrued and less any outstanding debt for past services, are refundable to the users when they cease using the electric energy service rendered by the Company. The Company has classified these deposits as current liabilities based on the facts that the Company do not have legal rights to defer this payment in a period that exceed a year. However, the Company do not anticipate making significant payments in the next year.
During years ended at December 31, 2015, 2014 and 2013 deposits repaid to consumers amounted to US$ 203, US$ 231 and US$ 192, respectively; and the interests paid amounted to US$ 40, US$ 51, and US$ 7 respectively.
| ñ. | Contributions to Pension Funds—Since March 2, 1990 a pension fund was created for employees of INDE and for those of the companies in which it is the founder partner. The Company was established by INDE and despite the sale of its shares, as indicated in Note 1, transferred employees remain covered under the pension fund. The Company and such employees contribute on a monthly basis with 8.59 per cent and 5.53 per cent on paid salaries. |
A part of the contributions that correspond to the Company is recognized as expense at payment.
Based on the Regulation of the Pension Fund for the Personnel of the National Institute of Electrification—FOPINDE, in Spanish, the fund is the sole responsibility of INDE and any insufficiency will be covered by the latter. Consequently, the Company does not have the obligation to record a provision for pension fund.
During the years ended on December 31, 2015, 2014 and 2013, the amount of the contributions carried out by the Company to FOPINDE amounts to US$ 188, US$ 185 and US$ 187, respectively.
| o. | Financial Instruments—Financial assets and liabilities are recognized when the Company becomes part of the contract provisions of the instrument. |
The financial assets and liabilities are measured initially at fair value. The costs of the transaction which are attributable directly to the acquisition or issuance of financial assets and liabilities (different from the financial assets and liabilities measured at fair value through profit or loss) are added or deducted from the fair value of the financial assets or liabilities, if appropriate, at their initial recognition. The costs of the transaction attributable directly to the acquisition of financial assets or liabilities measured at fair value through profit or loss are recognized immediately in profit or losses.
Financial Assets
Financial assets are classified within the following categories: financial assets “at fair value through profit or loss’ (FVTPL)”, “held-to-maturity’ investments”, “financial assets available for sale”, and
F-259
Table of Contents
DISTRIBUIDORA DE ELECTRICIDAD DE ORIENTE, S. A.—DEORSA
NOTES TO THE FINANCIAL STATEMENTS
AS OF DECEMBER 31, 2015, 2014 AND 2013 AND JANUARY 1,
2013 (RESTATED), AND FOR THE YEARS ENDED DECEMBER 31,
2015, 2014 AND 2013 (RESTATED)
(Stated in thousands of US Dollars, except otherwise indicated)
| 3. | SIGNIFICANT ACCOUNTING POLICIES (cont’d) |
“loans and receivables”. Classification depends on the nature and purpose of the financial assets and is determined at the initial recognition. All regular purchases or sales of financial assets are recognized and derecognized on a trade date basis. Regular purchases or sales are those purchases or sales of financial assets that require the delivery of the assets within the time frame established by a market regulation or agreement.
At December 31, 2015, 2014 and 2013 and throughout the years then ended, the Company did not carry out financial assets different from the category of “loans and receivables”, which are measured at the amortized cost at an effective interest rate.
Effective Interest Rate Method
The effective interest rate method is a calculation method of the amortized cost of a financial instrument and the allocation of the financial income throughout the relevant period. The effective interest rate is the rate that exactly discounts estimated future cash receipts or paid (including commission, basic points of interests paid or received, transaction costs and other premiums or discounts included in the calculation of the effective interest rate) throughout the expected life of the financial instrument or, when appropriate, in a shorter period, with the net carrying amount at the initial recognition.
Income is recognized on the basis of the effective interest rate for debt instruments different from the financial assets classified at fair value through profit or loss.
Loans and Receivables
Loans and receivables are non-derivative financial assets with fixed or determinable payments that are not quoted in an active market. Loans and receivable (including trade receivables, other receivables, cash and cash equivalents, among others) are measured at the amortized cost using effective interest method, less any impairment. The income from interest is recognized by applying the effective interest rate, except for short term receivable accounts when the effect of discounting is immaterial.
The tariffs that the Company collects from its consumers are regulated by the General Electricity Act, Decree 93-96. Based on this Act, the National Electric Energy Commission issued the following resolutions: a) CNEE 21-2009—new tariffs in force from February 1, 2009 until January 31, 2014; b) CNEE 22-2009—social tariff for the electric energy supply to users with electric consumption up to 300 kilowatt/hour according to the new tariff in force from February 1, 2009 until January 31, 2014; c) CNEE 48 -2014—new tariffs in force from February 1, 2014 until January 31, 2019 and d) CNNE49-2014—Social tariff—for the electric energy supply to users with electric consumption up to 300 kilowatt/hour according to the new tariffs in force from February 1, 2014 until January 31, 2019.
According to the General Electricity Act, the Company adjusts on a quarterly basis such tariffs based on the variations in the price of kilowatt/hour, the purchase of power and electric energy, tolls, and other related costs with the distribution of electric energy for each quarter, quantifying the difference between recoveries on the approved base tariff and the actual costs incurred by the Company.
F-260
Table of Contents
DISTRIBUIDORA DE ELECTRICIDAD DE ORIENTE, S. A.—DEORSA
NOTES TO THE FINANCIAL STATEMENTS
AS OF DECEMBER 31, 2015, 2014 AND 2013 AND JANUARY 1,
2013 (RESTATED), AND FOR THE YEARS ENDED DECEMBER 31,
2015, 2014 AND 2013 (RESTATED)
(Stated in thousands of US Dollars, except otherwise indicated)
| 3. | SIGNIFICANT ACCOUNTING POLICIES (cont’d) |
Likewise, there is an adjustment made quarterly to the Distribution Added Value (VAD, in Spanish), through which the Company calculates the effect that the variation on the exchange rate, duties on the electrical grid supplies (poles, fittings, electric equipment, and transformers) and the Index of Consumer Prices in the City of Guatemala over the Distribution Added Value.
Impairment of Financial Assets
The financial assets other than those measured at fair value through profit or loss are assessed for indicators of impairment at the end of each reporting period. A financial asset is considered to be impaired when there is objective evidence that as a consequence of one or more events occurred after the initial recognition of the financial asset, the estimated future cash flows of the financial asset have been affected.
For certain categories of financial assets, such as trade receivables, assets are assessed for impairment on a collective basis even if they were assessed not to be impaired individually. Within the objective evidence in case of an impaired receivables portfolio, it could be included the past experience of the Company regarding the collection of payments, an increase of the number of late payments in the portfolio that exceeds the average credit period of 180 days, as well as the observable changes in the local and national economic conditions that relate with default on receivables.
For the financial assets carried at the amortized cost, the amount from impairment loss is the difference between the carrying amount and the present value of the estimated future cash flow of the asset, discounted at the original effective interest rate of the financial asset. The carrying amount of the financial asset is reduced by the impairment loss directly for all the financial assets, except for the trade receivables, where the carrying amount is reduced through an allowance account. When it is considered that a commercial account receivable is uncollectible, it is thus written off against the allowance account. The subsequent recovery of the amounts previously written off, turns into credits against the allowance account. Changes in the carrying amount of the provision are recognized in the profit or loss.
Derecognition of Financial Assets
The Company derecognizes financial asset when the contractual rights on the cash flows of the financial asset expire, or when it transfers the financial asset and substantially all the risks and rewards of ownership of the asset to another party. If the Company does not transfer, nor retains substantially all the risks and rewards inherent to the ownership and continues to control the transferred asset, the Company will recognizes its participation in the asset and the related obligation for the amount payable. If the Company retains substantially all the risks and advantages inherent to the ownership of a transferred financial asset, the Company continues to recognize the financial asset and also recognizes a collateralized borrowing for the proceeds received.
On derecognition of a financial asset in its entirety, the difference between the carrying amount of the asset and the sum of the consideration received and to be received, as well as the accumulated income that had been recognized in other comprehensive income and accumulated in equity is recognized in profit or loss.
F-261
Table of Contents
DISTRIBUIDORA DE ELECTRICIDAD DE ORIENTE, S. A.—DEORSA
NOTES TO THE FINANCIAL STATEMENTS
AS OF DECEMBER 31, 2015, 2014 AND 2013 AND JANUARY 1,
2013 (RESTATED), AND FOR THE YEARS ENDED DECEMBER 31,
2015, 2014 AND 2013 (RESTATED)
(Stated in thousands of US Dollars, except otherwise indicated)
| 3. | SIGNIFICANT ACCOUNTING POLICIES (cont’d) |
In case of a partial derecognition in the accounts of a financial asset (i.e., when the Company retains the option to reacquire part of the transferred asset), the Company distributes the previous carrying amount of the financial asset between the part still recognized under a continuous participation and the part that is no more recognized on the basis of the fair value related to such parts at the date of the transfer. The difference between the carrying amount allocated to the part that will not be recognized anymore and the sum of the consideration received from the part that will no more be recognized and any accumulated profit or loss allocated that would have been recognized in other comprehensive income is recognized in profit or loss. The accumulated profit or loss that would have been recognized in other comprehensive income is distributed between the part that remains being recognized and the part that will not be recognized anymore based on the fair values related to both parts.
Financial Liabilities and Equity Instruments
Classification as Debt or Equity
Debt and equity instruments are classified as financial liabilities or as equity in conformity with the substance of the contractual agreement and the definitions of financial liability and equity instrument.
Financial Liabilities
Financial liabilities are classified at fair value through profit or loss or “other financial liabilities”.
Financial Liabilities at Fair Value Through Profit or Loss
A financial liability is classified at fair value through profit or loss when (i) there is a contingent consideration that could be paid as part of the businesses combination in which IFRS 3 is applied, (ii) held for trading, or (iii) it is designated as at FVTPL.
A financial liability is classified as held for trading if:
| • | It has been acquired mainly for short-term repurchase purposes, or |
| • | At the moment of the initial recognition, it forms part of a financial instrument portfolio managed by the Company and there is evidence of a current and recent pattern of benefits at short term, or |
| • | It is a derivative that has not been assigned, effective as hedge instrument or financial guarantee. |
A financial liability (not a financial liability held for trading) or contingent consideration that could be paid by the acquirer as part of a business combination, can be assigned as a liability at fair value through profit or loss at its initial recognition if:
| • | Such assignment eliminates or reduces significantly a measurement or recognition inconsistency that might arise; or |
F-262
Table of Contents
DISTRIBUIDORA DE ELECTRICIDAD DE ORIENTE, S. A.—DEORSA
NOTES TO THE FINANCIAL STATEMENTS
AS OF DECEMBER 31, 2015, 2014 AND 2013 AND JANUARY 1,
2013 (RESTATED), AND FOR THE YEARS ENDED DECEMBER 31,
2015, 2014 AND 2013 (RESTATED)
(Stated in thousands of US Dollars, except otherwise indicated)
| 3. | SIGNIFICANT ACCOUNTING POLICIES (cont’d) |
| • | The financial liability forms part of a group of financial assets or liabilities or both, which is managed and its performance is assessed on the fair value basis, in conformity with the documented risk management of the Company or its investing strategy, and information on the Company is provided internally on such basis, or |
| • | It forms part of a contract that contains one or more embedded derivatives, and IAS 39 allows that the combined contract is assigned at fair value through profit or loss. |
Financial liabilities at fair value through profit or loss are recorded at fair value, recognizing any profit or loss arisen from the new measurement in profit or losses. Net profit or loss recognized in profit or losses incorporates paid interests on the financial liability and is included in the item “Financial expenses”.
Other Financial Liabilities
Other financial liabilities (including loans and commercial accounts payable and others) are measured subsequently at the amortized cost using the effective interest rate method. The effective interest rate method is a calculation method of the amortized cost of a financial liability and of the allocation of a financial expense throughout the relevant period. The effective interest rate is the rate that exactly discounts estimated future cash receipts or paid (including the fees and points paid or received that form part of the effective interest rate, the transaction costs, and other premiums or discounts) estimated throughout the expected life of the financial liability (or, when appropriate), in a shorter period with the net carrying amount at its initial recognition.
Derecognition of a Financial Liability
The Company derecognizes a financial liability if solely the Company’s obligations have expired or have been cancelled. The difference between the book value of the derecognized financial liability and the consideration paid and payable are recognized in income.
Derivative Financial Instruments
The Company enters into a variety of derivative financial instruments to manage its exposure to interest rate and foreign exchange rate risks, including interest rate swaps. Further details of derivative financial instruments are disclosed in Note 34. Derivatives are initially recognized at fair value at the date the derivative contracts are entered into and are subsequently remeasured to their fair value at the end of each reporting period. The resulting gain or loss is recognized in profit or loss immediately unless the derivative is designated and effective as a hedging instrument, in which event the timing of the recognition in profit or loss depends on the nature of the hedge relationship.
F-263
Table of Contents
DISTRIBUIDORA DE ELECTRICIDAD DE ORIENTE, S. A.—DEORSA
NOTES TO THE FINANCIAL STATEMENTS
AS OF DECEMBER 31, 2015, 2014 AND 2013 AND JANUARY 1,
2013 (RESTATED), AND FOR THE YEARS ENDED DECEMBER 31,
2015, 2014 AND 2013 (RESTATED)
(Stated in thousands of US Dollars, except otherwise indicated)
| 3. | SIGNIFICANT ACCOUNTING POLICIES (cont’d) |
Hedge Accounting
The Company designates certain hedging instruments, which include derivatives, embedded derivatives and non-derivatives in respect of foreign currency and interest rate risk, as either fair value hedges or cash flow hedges.
At the inception of the hedge relationship, the entity documents the relationship between the hedging instrument and the hedged item, along with its risk management objectives and its strategy for undertaking various hedge transactions. Furthermore, at the inception of the hedge and on an ongoing basis, the Company documents whether the hedging instrument is highly effective in offsetting changes in fair values or cash flows of the hedged item attributable to the hedged risk.
Fair Value Hedges
Changes in the fair value of derivatives that are designated and qualify as fair value hedges are recognized in profit or loss immediately, together with any changes in the fair value of the hedged asset or liability that are attributable to the hedged risk. The change in the fair value of the hedging instrument and the change in the hedged item attributable to the hedged risk are recognized in profit or loss in the line item relating to the hedged item. Hedge accounting is discontinued when the Company revokes the hedging relationship, when the hedging instrument expires or is sold, terminated, or exercised, or when it no longer qualifies for hedge accounting. The fair value adjustment to the carrying amount of the hedged item arising from the hedged risk is amortized to profit or loss from that date.
Cash Flow Hedges
The effective portion of changes in the fair value of derivatives that are designated and qualify as cash flow hedges is recognized in other comprehensive income and accumulated under the heading of cash flow hedging reserve. The gain or loss relating to the ineffective portion is recognized immediately in profit or loss, and is included in the ‘other income’ line item.
Amounts previously recognized in other comprehensive income and accumulated in equity are reclassified to profit or loss in the periods when the hedged item affects profit or loss, in the same line as the recognized hedged item. However, when the hedged forecast transaction results in the recognition of a non-financial asset or a non-financial liability, the gains and losses previously recognized in other comprehensive income and accumulated in equity are transferred from equity and included in the initial measurement of the cost of the non-financial asset or non-financial liability.
Hedge accounting is discontinued when the Company revokes the hedging relationship, when the hedging instrument expires or is sold, terminated, or exercised, or when it no longer qualifies for hedge accounting. Any gain or loss recognized in other comprehensive income and accumulated in equity at that time remains in equity and is recognized when the forecast transaction is ultimately recognized in profit or loss. When a forecast transaction is no longer expected to occur, the gain or loss accumulated in equity is recognized immediately in profit or loss.
F-264
Table of Contents
DISTRIBUIDORA DE ELECTRICIDAD DE ORIENTE, S. A.—DEORSA
NOTES TO THE FINANCIAL STATEMENTS
AS OF DECEMBER 31, 2015, 2014 AND 2013 AND JANUARY 1,
2013 (RESTATED), AND FOR THE YEARS ENDED DECEMBER 31,
2015, 2014 AND 2013 (RESTATED)
(Stated in thousands of US Dollars, except otherwise indicated)
| 3. | SIGNIFICANT ACCOUNTING POLICIES (cont’d) |
| p. | Income Tax—The expense from Income Tax represents the sum of the current income tax and the deferred income tax. |
| • | Current Tax:Current tax payable is based on the taxable profit for the year. The taxable profit differs from the profit reported in the statement of profit or loss and other comprehensive income, due to the income or expenses items taxable or deductible in other years and items that are never taxable or deductible. Current tax liability is calculated using the fiscal rates that have been enacted or substantively enacted at the end of the reporting period. |
| • | Deferred Taxes:Deferred tax is recognized on the temporary differences between the book value of the assets and liabilities included in the financial statements and the related tax basis used to determine the taxable profit. Liability from deferred tax is generally recognized for all temporary taxable fiscal differences. An asset from deferred taxes will be recognized due to all temporary deductible differences to the extent that it is probable that taxable profits will be available against which those deductible temporary differences can be utilized. Such deferred tax assets and liabilities are not recognized if the temporary difference arises from the initial recognition (other than in a business combination) of assets and liabilities in a transaction that affects neither the taxable profit nor the accounting profit. In addition, deferred tax liabilities are not recognized if the temporary difference arises from the initial recognition of goodwill. |
The carrying amount of deferred tax assets is reviewed at the end of each reporting period and reduced to the extent that it is no longer probable that sufficient taxable profits will be available to allow all or part of the asset to be recovered.
Assets and liabilities from deferred taxes are measured using the fiscal rates expected to be applicable in the period in which the asset is realized or the liability is cancelled, based on the rates (and tax laws) that at the end of the reporting period had been enacted or substantively enacted the process of approval. Measurement of the liabilities from deferred taxes and assets from deferred taxes will reflect the fiscal consequences which would be derived from the way in which the entity expects, at the end of the reporting period, to recover or liquidate the carrying amount of its assets and liabilities.
Current and deferred taxes are recognized in profit or loss and are included in the income of the period or in other comprehensive income, as corresponds.
| q. | Cash and Cash Equivalents—Cash includes balances in cash and banks. Balances in banks are available on demand and there is no restriction that limits their use. |
| r. | Restricted Cash—The balance corresponds to the funds deposited for the payment reserve for the amortization of the loan in Banco Agromercantil de Guatemala, S.A. in United States Dollars and Quetzals that accrue an annual interest rate of 1.5% and 0.8%, respectively. The funds must be used only to service debt and interest. As of December 31, 2015, 2014 and 2013 the restricted fund amount was US$ 1,848, US$ 1,543 and US$ 1,527 respectively. |
F-265
Table of Contents
DISTRIBUIDORA DE ELECTRICIDAD DE ORIENTE, S. A.—DEORSA
NOTES TO THE FINANCIAL STATEMENTS
AS OF DECEMBER 31, 2015, 2014 AND 2013 AND JANUARY 1,
2013 (RESTATED), AND FOR THE YEARS ENDED DECEMBER 31,
2015, 2014 AND 2013 (RESTATED)
(Stated in thousands of US Dollars, except otherwise indicated)
| 3. | SIGNIFICANT ACCOUNTING POLICIES (cont’d) |
| s. | Leases—Leases are classified as finance leases whenever the terms of the lease transfer substantially all the risks and rewards of ownership to the lessee. All other leases are classified as operating leases. |
The Company only act as lessee. Payments for operating leasing are recognized as an expense using the straight-line method, during the term related to the leasing, unless another systematic basis of distribution becomes more representative to suitably reflect the temporary pattern of the leasing benefits for the user. Contingent rentals are recognized as expenses in the periods in which they are incurred.
| t. | Energy purchases—Costs from energy purchases either acquired in the spot market or from contracts with suppliers are recorded on an accrual basis according to the energy actually delivered. Purchases of electric energy, including those which have not yet been billed as of the reporting date, are recorded based on estimates of the energy supplied at the prices prevailing in the spot market or agreed-upon in the respective purchase agreements, as the case may be. |
| 4. | MONETARY UNIT AND EXCHANGE RATE |
The legal currency of Guatemala is the Quetzal, represented by the “Q” symbol in the financial statements.
The Bank of Guatemala, entity authorized by the Monetary Board to implement its monetary, exchange and credit policies, publishes periodically the reference exchange rate to be used in the banking system. According to Resolution JM 31-2009 dated March 18, 2009, the method to determine the exchange rate consists on using the weighted average exchange rate of the total sum of the purchase and sale of foreign currency carried out daily by the institutions that constitute the institutional foreign currency market. As of December 31, 2015, 2014 and 2013, the reference exchange rate published by the Bank of Guatemala was Q. 7.63, Q. 7.60 and Q. 7.84, respectively for US$ 1.
There are no exchange restrictions in Guatemala for the capital repatriation, payment of debts or any other purpose; foreign currency can be freely negotiated in any amount in the banks of the system or in the authorized exchange offices, in conformity with the statutory regulation in force, according to Decree No. 94-2000 Free Foreign Currency Negotiation Act.
| 5. | ENERGY SALES |
Income from electric energy sales obtained during years ended December 31, 2015, 2014 and 2013 are shown as follows:
2015 | 2014 | 2013 | ||||||||||
Simple LV | US$ | 172,625 | US$ | 172,810 | US$ | 166,248 | ||||||
Public Lighting | 24,444 | 27,871 | 29,745 | |||||||||
LV on demand OP | 16,588 | 21,123 | 26,028 | |||||||||
Non-regulated tariff | 9,378 | 13,707 | 10,532 | |||||||||
LV on demand P | 11,112 | 9,721 | 4,247 | |||||||||
MV on demand OP | 1,870 | 2,260 | 2,314 | |||||||||
MV on demand | 314 | 234 | 366 | |||||||||
Non-regulated special tariff | 2,317 | 1,281 | — | |||||||||
|
|
|
|
|
| |||||||
| US$ | 238,648 | US$ | 249,007 | US$ | 239,480 | |||||||
|
|
|
|
|
| |||||||
F-266
Table of Contents
DISTRIBUIDORA DE ELECTRICIDAD DE ORIENTE, S. A.—DEORSA
NOTES TO THE FINANCIAL STATEMENTS
AS OF DECEMBER 31, 2015, 2014 AND 2013 AND JANUARY 1,
2013 (RESTATED), AND FOR THE YEARS ENDED DECEMBER 31,
2015, 2014 AND 2013 (RESTATED)
(Stated in thousands of US Dollars, except otherwise indicated)
| 5. | ENERGY SALES (cont’d) |
The above initials correspond to: LV: low voltage; MV: medium voltage; OP: off-peak; P: peak.
| 6. | SERVICES RENDERED |
During years ended December 31, 2015, 2014 and 2013, the Company carried out some works that generated income as follows:
2015 | 2014 | 2013 | ||||||||||
Connection of electrical gridsa/ | US$ | 1,810 | US$ | 1,360 | US$ | 2,852 | ||||||
Tollsb/ | 2,910 | 2,585 | 2,194 | |||||||||
|
|
|
|
|
| |||||||
| US$ | 4,720 | US$ | 3,945 | US$ | 5,046 | |||||||
|
|
|
|
|
| |||||||
| a/ | It corresponds to income from the electrical grid re-connection quota that is collected to the users that have been disconnected from the supply of electricity. |
| b/ | It corresponds to the collection performed to generators or retailers for the use of transmission sites and main and secondary transformation. |
| 7. | OTHER REVENUES |
During the years ended December 31, 2015, 2014 and 2013, the Company recognized the following other revenues as follows:
2015 | 2014 | 2013 | ||||||||||
Accrued revenues – government grantsa/ | US$ | 3,289 | US$ | 3,711 | US$ | 3,750 | ||||||
Leasingb/ | 346 | 362 | 350 | |||||||||
Compensation received third-partyc/ | 111 | 111 | 12 | |||||||||
Ancillary services renderingd/ | 6 | 74 | (521 | ) | ||||||||
Others | 805 | 1,407 | 12 | |||||||||
|
|
|
|
|
| |||||||
| US$4,557 | US$5,665 | US$3,603 | ||||||||||
|
|
|
|
|
| |||||||
| a/ | Accrued revenue related to government grants to distribution projects of the Rural Electrification Program (Programa de Electrificación Rural—“PER”, in Spanish) during years ended at December 31, 2015, 2014 and 2013 (Note 26). |
| b/ | Income from rental of poles already installed within the energy supply grid for placement of advertising blankets and panels, as well as for using such infrastructure for cable lying to other companies. |
| c/ | Income from review and determination of frauds in the electrical energy consumption from the users. |
| d/ | Materials for installation works to users out of the 200-meter range and for entering within setbacks and works of the telephone companies. |
F-267
Table of Contents
DISTRIBUIDORA DE ELECTRICIDAD DE ORIENTE, S. A.—DEORSA
NOTES TO THE FINANCIAL STATEMENTS
AS OF DECEMBER 31, 2015, 2014 AND 2013 AND JANUARY 1,
2013 (RESTATED), AND FOR THE YEARS ENDED DECEMBER 31,
2015, 2014 AND 2013 (RESTATED)
(Stated in thousands of US Dollars, except otherwise indicated)
| 8. | ENERGY PURCHASE |
During years ended December 31, 2015, 2014 and 2013, electric energy purchases were as follows:
2015 | 2014 | 2013 | ||||||||||
Contracts with suppliers | US$ | 122,510 | US$ | 97,805 | US$ | 99,293 | ||||||
In the spot market | 33,810 | 71,282 | 71,914 | |||||||||
|
|
|
|
|
| |||||||
| US$ | 156,320 | US$ | 169,087 | US$ | 171,207 | |||||||
|
|
|
|
|
| |||||||
The Company manages an average of 60 days of credit with its suppliers from the receipt date of the invoice. Suppliers do not charge interests on the late payment of outstanding invoices.
| 9. | OTHER COSTS OF SALES |
Other cost of sales for the years ended December 31, 2015, 2014 and 2013 are shown as follows:
2015 | 2014 | 2013 | ||||||||||
Depreciation and amortization | US$ | 13,377 | US$ | 13,185 | US$ | 13,171 | ||||||
Personnel expensesb/ | 6,592 | 6,161 | 5,504 | |||||||||
Sundry servicesa/ | 4,582 | 4,691 | 4,687 | |||||||||
Maintenance expenses | 3,638 | 3,467 | 3,085 | |||||||||
Fees | 1,633 | 1,619 | 1,365 | |||||||||
Professional services | 1,070 | 1,019 | 798 | |||||||||
Provision for obsolete inventories | 789 | — | — | |||||||||
Maintenance material | 475 | 334 | 70 | |||||||||
Other ancillary expenses | 304 | 393 | 1,317 | |||||||||
Advertising, marketing, and public relations | 274 | 142 | 174 | |||||||||
Fuel | 252 | 361 | 456 | |||||||||
Travel expenses | 131 | 90 | 69 | |||||||||
Sundry expenses | 81 | 132 | — | |||||||||
Leasing and royalty expenses | 77 | 84 | 11 | |||||||||
Banking expenses | 22 | 9 | 2 | |||||||||
Supplies | 9 | 6 | 13 | |||||||||
Guarantee expenses works/transportation | 6 | — | — | |||||||||
|
|
|
|
|
| |||||||
| US$ | 33,312 | US$ | 31,693 | US$ | 30,722 | |||||||
|
|
|
|
|
| |||||||
| a/ | It corresponds mainly to residential operations, and readers and delivery contractors. |
F-268
Table of Contents
DISTRIBUIDORA DE ELECTRICIDAD DE ORIENTE, S. A.—DEORSA
NOTES TO THE FINANCIAL STATEMENTS
AS OF DECEMBER 31, 2015, 2014 AND 2013 AND JANUARY 1,
2013 (RESTATED), AND FOR THE YEARS ENDED DECEMBER 31,
2015, 2014 AND 2013 (RESTATED)
(Stated in thousands of US Dollars, except otherwise indicated)
| 9. | OTHER COSTS OF SALES (cont’d) |
| b/ | Personnel expenses for the years ended December 31, 2015, 2014 and 2013 are shown below as follows: |
2015 | 2014 | 2013 | ||||||||||
Monetary considerations | US$ | 7,156 | US$ | 6,736 | US$ | 5,795 | ||||||
Social security | 621 | 576 | 520 | |||||||||
Post-employment benefits | 246 | 180 | 282 | |||||||||
Social benefits | 8 | — | — | |||||||||
Capitalization to property, plant and equipment1/ | (1,439 | ) | (1,331 | ) | (1,093 | ) | ||||||
|
|
|
|
|
| |||||||
| US$ | 6,592 | US$ | 6,161 | US$ | 5,504 | |||||||
|
|
|
|
|
| |||||||
| 1/ | It corresponds to the amount of expenses for “Works for Property, Plant and Equipment”, which were capitalized in distribution and transmission works (Note 3d). |
| 10. | FINANCIAL INCOME |
Figures forming part of the financial income accounts for the years ended December 31, 2015, 2014 and 2013 are shown below:
2015 | 2014 | 2013 | ||||||||||
Interests income on bank accounts | US$ | 1,169 | US$ | 387 | US$ | 754 | ||||||
Compensatory interests | 758 | 630 | 495 | |||||||||
Gain on exchange difference, net | — | 2,151 | 531 | |||||||||
|
|
|
|
|
| |||||||
| US$ | 1,927 | US$ | 3,168 | US$ | 1,780 | |||||||
|
|
|
|
|
| |||||||
F-269
Table of Contents
DISTRIBUIDORA DE ELECTRICIDAD DE ORIENTE, S. A.—DEORSA
NOTES TO THE FINANCIAL STATEMENTS
AS OF DECEMBER 31, 2015, 2014 AND 2013 AND JANUARY 1,
2013 (RESTATED), AND FOR THE YEARS ENDED DECEMBER 31,
2015, 2014 AND 2013 (RESTATED)
(Stated in thousands of US Dollars, except otherwise indicated)
| 11. | GENERAL, SELLING AND ADMINISTRATIVE EXPENSES |
General, selling and administrative expenses for the years ended December 31, 2015, 2014 and 2013 are set out below:
2015 | 2014 | 2013 | ||||||||||
Sundry servicesb/ | US$ | 6,247 | US$ | 4,324 | US$ | 3,827 | ||||||
Impairment losses recognized on accounts receivable—insolvency | 5,000 | 2,694 | 4,240 | |||||||||
Personnel expensesa/ | 4,131 | 3,320 | 2,760 | |||||||||
Professional services | 1,896 | 1,530 | 1,245 | |||||||||
Maintenance | 1,328 | 1,234 | 968 | |||||||||
Fees | 791 | 54 | 237 | |||||||||
Advertising, marketing, and public relations | 670 | 852 | 969 | |||||||||
Loss from accounts insolvency—discounts | 627 | — | — | |||||||||
Supplies | 571 | �� | 687 | 578 | ||||||||
Leasing and royalties | 451 | 382 | 503 | |||||||||
Travel expenses | 446 | 270 | 177 | |||||||||
Sundry expenses | 331 | 816 | 543 | |||||||||
Insurance premiums | 223 | 204 | 229 | |||||||||
Maintenance material | 69 | 62 | 67 | |||||||||
Banking expenses | 32 | 32 | 31 | |||||||||
|
|
|
|
|
| |||||||
| US$ | 22,813 | US$ | 16,461 | US$ | 16,374 | |||||||
|
|
|
|
|
| |||||||
| a/ | Expenses related to the years ended December 31, 2015, 2014 and 2013 are shown as follows: |
2015 | 2014 | 2013 | ||||||||||
Employee remuneration | US$ | 3,373 | US$ | 2,656 | US$ | 2,073 | ||||||
Social benefits | 432 | 405 | 386 | |||||||||
Social security | 284 | 238 | 202 | |||||||||
Post-employment benefits | 42 | 21 | 99 | |||||||||
|
|
|
|
|
| |||||||
| US$4,131 | US$3,320 | US$ | 2,760 | |||||||||
|
|
|
|
|
| |||||||
| b/ | It corresponds mainly to the management, administration and supervision for the businesses of the Company, as well as expenses related to the security service of the commercial offices, expenses for the collection of accounts receivable from third parties and commissions on collection. |
F-270
Table of Contents
DISTRIBUIDORA DE ELECTRICIDAD DE ORIENTE, S. A.—DEORSA
NOTES TO THE FINANCIAL STATEMENTS
AS OF DECEMBER 31, 2015, 2014 AND 2013 AND JANUARY 1,
2013 (RESTATED), AND FOR THE YEARS ENDED DECEMBER 31,
2015, 2014 AND 2013 (RESTATED)
(Stated in thousands of US Dollars, except otherwise indicated)
| 12. | FINANCIAL EXPENSES |
Figures making up the financial expenses accounts for the years ended December 31, 2015, 2014 and 2013 are set out as follows:
2015 | 2014 | 2013 | ||||||||||
Interest expenses on financial debt | US$ | 8,248 | US$ | 7,078 | US$ | 7,875 | ||||||
Interest on customers deposits | 2,366 | 2,187 | 1,750 | |||||||||
Loss on exchange difference, net | 166 | — | — | |||||||||
Other financial expenses | 1,077 | 936 | 14 | |||||||||
|
|
|
|
|
| |||||||
| US$ | 11,857 | US$ | 10,201 | US$ | 9,639 | |||||||
|
|
|
|
|
| |||||||
| 13. | OTHER INCOME |
During years ended December 31, 2015, 2014 and 2013, the Company recognized the following other income as follows:
2015 | 2014 | 2013 | ||||||||||
Reversal of provision for legal disputesa/ | US$ | 4,040 | US$ | 793 | US$ | 284 | ||||||
|
|
|
|
|
| |||||||
| a/ | During 2015, the reversal corresponds mainly to a civil petition for damages and several injuries for an amount of US$ 2,509 in which the Company obtained a favorable first instance sentence, as such Company’s management and its legal advisors considers as possible an unfavorable outcome and a legal proceeding for an amount of US$ 1,247 for which the Company obtained debt relief agreement. During 2014, the reversal corresponds mainly to the reversal of sanctions with the CNEE that have legally expired and during 2013, the reversal corresponds to tax contingencies that Company’s management and its legal advisors considers that the probability to get an unfavorable outcome change to possible during this year, as such derecognized the related provisions. |
| 14. | INCOME TAX |
Income tax of the year is made up as follows:
Tax on profit recognized in profit or loss and in the other comprehensive income of the year:
2015 | 2014 | 2013 | ||||||||||
Income tax—current | US$ | 6,802 | US$ | 11,355 | US$ | 5,539 | ||||||
Income tax—deferred | 268 | 9,325 | 776 | |||||||||
|
|
|
|
|
| |||||||
Income tax charged to profit or loss | 7,070 | 20,680 | 6,315 | |||||||||
Income tax charged to other comprehensive income | (97 | ) | (130 | ) | (253 | ) | ||||||
|
|
|
|
|
| |||||||
| US$ | 6,973 | US$ | 20,550 | US$ | 6,062 | |||||||
|
|
|
|
|
| |||||||
F-271
Table of Contents
DISTRIBUIDORA DE ELECTRICIDAD DE ORIENTE, S. A.—DEORSA
NOTES TO THE FINANCIAL STATEMENTS
AS OF DECEMBER 31, 2015, 2014 AND 2013 AND JANUARY 1,
2013 (RESTATED), AND FOR THE YEARS ENDED DECEMBER 31,
2015, 2014 AND 2013 (RESTATED)
(Stated in thousands of US Dollars, except otherwise indicated)
| 14. | INCOME TAX (cont’d) |
Income tax legislation currently in force in 2015, 2014 and 2013—Since January 1, 2013 new rules for income tax are in effect and are included on Book I of The Law of Fiscal Actualization, Decree 10-2012. These new regulations consider two regimes to pay tax since 2013:
| a) | Regime on Earnings from Profit Activities which consists on applying a rate of 25% in 2015 (28% in 2014 and 31% in 2013) on the taxable income determined from the accounting profit. Tax is paid through quarterly advance payments with the remaining balance at year-end. |
| b) | Simplified Optional Regime on Income from Profit Activities consisting on applying the rate of 7% to the total amount of taxable revenues, paying this tax through definitive withholding or else, through payment in agencies authorized by the tax authorities. The first US$ 3,916 of monthly taxable revenues are taxed at a 5% rate. |
For the years ended December 31, 2015, 2014 and 2013, the Company has chosen the Regime on Earnings from Profit Activities.
New regulations to income tax establish a tax of 5% on the dividend and profit distributions for both residents and non-residents.
In addition, a new Regime on Capital Income, Capital Gains and Losses, sets out a rate of 10% for capital income related to movable property and real estate, as well as net capital income.
For the years ended December 31, 2015, 2014 and 2013, the reconciliation of the income tax expense calculated at the statutory income tax rate and the income taxes recorded in the statement of profit or loss and other comprehensive income is as follows:
2015 | 2014 | 2013 | ||||||||||
Profit before Income Tax | US$ | 29,590 | US$ | 35,136 | US$ | 22,251 | ||||||
|
|
|
|
|
| |||||||
Income tax expense at the statutory income tax rate (25% for 2015, 28% for 2014 and 31% for 2013) | 7,398 | 9,838 | 6,898 | |||||||||
Income tax on capital gains 10% | 173 | 95 | — | |||||||||
Exempt income | (870 | ) | (655 | ) | (1,341 | ) | ||||||
Effect from non-deductible expensesa/ | 987 | 8,506 | 980 | |||||||||
Effect from income/expenses that are not deductible/taxable in determining taxable profitb/ |
| (565 | ) |
| 270 |
|
| (222 | ) | |||
Effect from adjustments of previous periodsc/ | (53 | ) | 2,626 | — | ||||||||
|
|
|
|
|
| |||||||
Income tax expense charged to profit or loss | US$ | 7,070 | US$ | 20,680 | US$ | 6,315 | ||||||
|
|
|
|
|
| |||||||
F-272
Table of Contents
DISTRIBUIDORA DE ELECTRICIDAD DE ORIENTE, S. A.—DEORSA
NOTES TO THE FINANCIAL STATEMENTS
AS OF DECEMBER 31, 2015, 2014 AND 2013 AND JANUARY 1,
2013 (RESTATED), AND FOR THE YEARS ENDED DECEMBER 31,
2015, 2014 AND 2013 (RESTATED)
(Stated in thousands of US Dollars, except otherwise indicated)
| 14. | INCOME TAX (cont’d) |
| a/ | For the years ended December 31, 2015, 2014 and 2013, non-deductible expenses recognized during the year to determine the taxable income, according to their nature, are set out as follows: |
2015 | 2014 | 2013 | ||||||||||
Goodwill1/ | US$ | — | US$ | 28,761 | US$ | — | ||||||
Accelerated depreciation of property, plant and equipment | 1,641 | 273 | — | |||||||||
Cost of works PER transportation | 525 | — | — | |||||||||
Provision for obsolete inventory | 1,189 | — | — | |||||||||
Travel allowances | 355 | 378 | 367 | |||||||||
Tax surcharges | 150 | 382 | 176 | |||||||||
Deposits received from consumers | — | — | 1,750 | |||||||||
Others | 87 | 584 | 869 | |||||||||
|
|
|
|
|
| |||||||
| US$ | 3,947 | US$ | 30,378 | US$ | 3,162 | |||||||
|
|
|
|
|
| |||||||
| 1/ | During 2015 the Tax Administration adjusted the tax deductible amount recognized as Goodwill. Consequently, the non-deductible expense in 2014 relates to the amortization of goodwill that was deducted in 2011, 2012, 2013 and 2014 for an amount that exceeded the limit of deductible expenses in determining the income tax. |
| b/ | The effect from income/expenses that are not deductible/taxable in determining taxable profit as of December 31, 2015, 2014 and 2013 are detailed below: |
2015 | 2014 | 2013 | ||||||||||
Depreciation and amortization | US$ | (6,379 | ) | US$ | (797 | ) | US$ | (1,899 | ) | |||
Impairment losses recognized on receivables from doubtful accounts | 5,687 | (472 | ) | 1,160 | ||||||||
Others | 127 | 1,539 | 517 | |||||||||
|
|
|
|
|
| |||||||
Total | US$ | (565 | ) | US$ | 270 | US$ | (222 | ) | ||||
|
|
|
|
|
| |||||||
| c/ | Since March 2014, the Company held a conciliation process with the Tax Administration Superintendency (SAT, in Spanish) over the deduction amount from the Goodwill amortization for the years ended December 31, 2011, 2012 and 2013. |
Based on the opinion of its legal and tax advisors, during January 2015, Management decided to address some inquiries to SAT. As a result of SAT’s responses to such inquiries, the Company rectified voluntarily the Income Tax returns of 2011, 2012, and 2013. In February 2015, the Company paid additional income taxes of US$2,626.
2015 | 2014 | 2013 | ||||||||||
Current tax of the year | US$ | 6,802 | US$ | 11,356 | US$ | 5,539 | ||||||
(+) Adjustments of previous years | 53 | — | — | |||||||||
(-) Income Tax payments from capital income | (174 | ) | (95 | ) | (4,769 | ) | ||||||
(-) Fiscal creditsa/ | (5,079 | ) | (4,735 | ) | — | |||||||
(+) Translation effect | 5 | 117 | — | |||||||||
|
|
|
|
|
| |||||||
Tax payable (Note 20) | US$ | 1,607 | US$ | 6,643 | US$ | 770 | ||||||
|
|
|
|
|
| |||||||
F-273
Table of Contents
DISTRIBUIDORA DE ELECTRICIDAD DE ORIENTE, S. A.—DEORSA
NOTES TO THE FINANCIAL STATEMENTS
AS OF DECEMBER 31, 2015, 2014 AND 2013 AND JANUARY 1,
2013 (RESTATED), AND FOR THE YEARS ENDED DECEMBER 31,
2015, 2014 AND 2013 (RESTATED)
(Stated in thousands of US Dollars, except otherwise indicated)
| 14. | INCOME TAX (cont’d) |
| a/ | Fiscal credits applied correspond to quarterly Income Tax payments in conformity with the provisions of the Law and are applied to the determined tax in the annual liquidation. |
Other Important Changes Contained in the Regulations of the Income Tax in force since January 2013 are:
The special regulations about the pricing of transactions among related parties (transfer pricing regulation) originally came into effect on January 1, 2013. The transfer pricing regulations oblige all the taxpayers having transactions with related parties, non-resident in Guatemala, that impact the taxable base, to determine the prices of these transactions according to the Principle of Free Competition and that they document it in a Survey of Transfer Pricing. However, Section 27 of Decree 19-2013, published on December 20, 2013, suspended the application and validity of the transfer pricing regulations and established that the same are taking effect again and applied on January 1, 2015.
The management of the Company determined that it does not have transactions with related foreign companies subject to the transfer pricing regulation.
Solidarity Tax (ISO, in Spanish):
On December 22, 2008, Decree No. 73-2008 was published “Solidarity Tax Act”—ISO, in Spanish. This tax affects companies having their own equity, carrying out mercantile or farming activities and obtaining a gross margin greater than 4% of their gross income. The taxable period is on quarterly basis and is calculated and paid per calendar quarter.
The tax base for this tax is the greater between:
| a) | One-fourth of the amount of net asset; or |
| b) | One-fourth of gross income. |
In the case of tax payers whose net asset are greater than four (4) times their gross income, the applicable tax base shall be the one established in letter b) above; and the applicable tax rate is 1%.
ISO and Income Tax can be credited between them as follows:
| a. | ISO, paid during the four calendar quarters of the year can be credited to the payment of Income Tax until completed, during the next three calendar years, either paid in monthly or quarterly payments, or liquidated annually, as the case may be. |
| b. | Quarterly payments of Income Tax can be credited to the ISO payment during the same calendar year. Companies choosing this credit method could change only with the Tax Authorities’ approval. |
F-274
Table of Contents
DISTRIBUIDORA DE ELECTRICIDAD DE ORIENTE, S. A.—DEORSA
NOTES TO THE FINANCIAL STATEMENTS
AS OF DECEMBER 31, 2015, 2014 AND 2013 AND JANUARY 1,
2013 (RESTATED), AND FOR THE YEARS ENDED DECEMBER 31,
2015, 2014 AND 2013 (RESTATED)
(Stated in thousands of US Dollars, except otherwise indicated)
| 14. | INCOME TAX (cont’d) |
ISO remainder that cannot be credited must be considered as a deductible expense for Income Tax purposes from the period of annual definitive liquidation in which the abovementioned three years are concluded.
ISO credit method authorized by the Company is option b). Consequently, the taxable period is on quarterly basis and is calculated and paid per calendar quarter, when the ISO tax is greater than Income tax. This tax is complementary of Income tax and any credit generated during the year (when the ISO tax is greater than the Income tax) can be utilized for future income tax payments within the three following years.
Deferred Income Tax
The income tax rate used to calculated the deferred income tax for the years ended December 31, 2015 and 2014 is 25% and 26.5% for the year ended December 31, 2013 respectively, which corresponds to the rate that will be in force in the years in which temporary items are expected to be reversed.
The movement of the deferred Income Tax is as follows:
2015 | 2014 | 2013 | ||||||||||
Deferred tax assets: | ||||||||||||
Initial balance | US$ | 9,449 | US$ | 18,724 | US$ | 21,269 | ||||||
Impairment losses recognized on receivables from doubtful accounts | 2,023 | 792 | 1,086 | |||||||||
Other financial obligations | (73 | ) | (64 | ) | 189 | |||||||
Goodwill | — | (9,515 | ) | (3,828 | ) | |||||||
Provisions for contingencies | (950 | ) | (148 | ) | 262 | |||||||
Government grants | 372 | (340 | ) | (254 | ) | |||||||
|
|
|
|
|
| |||||||
Balance at year-end | US$ | 10,821 | US$ | 9,449 | US$ | 18,724 | ||||||
|
|
|
|
|
| |||||||
Deferred tax liabilities: | ||||||||||||
Initial balance | (15,769 | ) | (15,672 | ) | (17,615 | ) | ||||||
Property, plant and equipment | 505 | (12 | ) | 1,943 | ||||||||
Goodwill | (2,019 | ) | (85 | ) | — | |||||||
|
|
|
|
|
| |||||||
Balance at year-end | (17,283 | ) | (15,769 | ) | (15,672 | ) | ||||||
|
|
|
|
|
| |||||||
Deferred income tax liability—net | US$ | (6,462 | ) | US$ | (6,320 | ) | US$ | 3,052 | ||||
|
|
|
|
|
| |||||||
F-275
Table of Contents
DISTRIBUIDORA DE ELECTRICIDAD DE ORIENTE, S. A.—DEORSA
NOTES TO THE FINANCIAL STATEMENTS
AS OF DECEMBER 31, 2015, 2014 AND 2013 AND JANUARY 1,
2013 (RESTATED), AND FOR THE YEARS ENDED DECEMBER 31,
2015, 2014 AND 2013 (RESTATED)
(Stated in thousands of US Dollars, except otherwise indicated)
| 14. | INCOME TAX (cont’d) |
As of December 31, 2015 deferred tax assets and liabilities are composed as follows:
2015 | Initial | Debits/ | Debits / | Translation | Final Balance | |||||||||||||||
Temporary differences: | ||||||||||||||||||||
Provision for impairment losses on receivables | US$ | 1,954 | US$ | 2,026 | US$ | — | US$ | (3 | ) | US$ | 3,977 | |||||||||
Provision for contingencies | 2,729 | (1,102 | ) | 168 | (16 | ) | 1,779 | |||||||||||||
Other financial obligations | 125 | — | (71 | ) | (2 | ) | 52 | |||||||||||||
Government grants | 4,641 | 393 | — | (21 | ) | 5,013 | ||||||||||||||
Goodwill | (85 | ) | (2,014 | ) | — | (5 | ) | (2,104 | ) | |||||||||||
Property, plant and equipment | (15,684 | ) | 429 | — | 76 | (15,179 | ) | |||||||||||||
|
|
|
|
|
|
|
|
|
| |||||||||||
Deferred income tax liability, net | US$ | (6,320 | ) | US$ | (268 | ) | US$ | 97 | US$ | 29 | US$ | (6,462 | ) | |||||||
|
|
|
|
|
|
|
|
|
| |||||||||||
As of December 31, 2014, deferred income tax assets and liabilities are composed as follows:
2014 | Initial | (Charges) | (Charges) | Translation | Final Balance | |||||||||||||||
Temporary differences: | ||||||||||||||||||||
Provision for impairment losses on receivables | US$ | 1,162 | US$ | 740 | US$ | — | US$ | 52 | US$ | 1,954 | ||||||||||
Provision for contingencies | 2,877 | (435 | ) | 199 | 88 | 2,729 | ||||||||||||||
Other financial obligations | 189 | — | (69 | ) | 5 | 125 | ||||||||||||||
Government grants | 4,981 | (491 | ) | — | 151 | 4,641 | ||||||||||||||
Goodwill | 9,515 | (9,623 | ) | — | 23 | (85 | ) | |||||||||||||
Property, plant and equipment | (15,672 | ) | 484 | — | (496 | ) | (15,684 | ) | ||||||||||||
|
|
|
|
|
|
|
|
|
| |||||||||||
Deferred income tax liability, net | US$ | 3,052 | US$ | (9,325 | ) | US$ | 130 | US$ | (177 | ) | US$ | (6,320 | ) | |||||||
|
|
|
|
|
|
|
|
|
| |||||||||||
F-276
Table of Contents
DISTRIBUIDORA DE ELECTRICIDAD DE ORIENTE, S. A.—DEORSA
NOTES TO THE FINANCIAL STATEMENTS
AS OF DECEMBER 31, 2015, 2014 AND 2013 AND JANUARY 1,
2013 (RESTATED), AND FOR THE YEARS ENDED DECEMBER 31,
2015, 2014 AND 2013 (RESTATED)
(Stated in thousands of US Dollars, except otherwise indicated)
| 14. | INCOME TAX (cont’d) |
As of December 31, 2013, deferred tax assets and liabilities are composed as follows:
2013 | Initial | (Charges) | (Charges) | Translation | Final Balance | |||||||||||||||
Temporary differences: | ||||||||||||||||||||
Provision for impairment losses on receivables | US$ | 76 | US$ | 1,083 | US$ | — | US$ | 3 | US$ | 1,162 | ||||||||||
Provision for contingencies | 2,615 | 177 | 64 | 21 | 2,877 | |||||||||||||||
Other financial obligations | — | — | 189 | — | 189 | |||||||||||||||
Government grants | 5,235 | (294 | ) | — | 40 | 4,981 | ||||||||||||||
Goodwill | 13,343 | (3,817 | ) | — | (11 | ) | 9,515 | |||||||||||||
Property, plant and equipment | (17,615 | ) | 2,075 | — | (132 | ) | (15,672 | ) | ||||||||||||
|
|
|
|
|
|
|
|
|
| |||||||||||
Deferred income tax liability, net | US$ | 3,654 | US$ | (776 | ) | US$ | 253 | US$ | (79 | ) | US$ | 3,052 | ||||||||
|
|
|
|
|
|
|
|
|
| |||||||||||
As of December 31, 2015, 2014 and 2013, the Company maintains US$3,011, US$2,383 and US$1,889 on unrecognized deferred tax assets related to deductible temporary differences in connection with accumulated interests from deposits received from consumers (Note 28), since it is not possible to determine with reasonable certainty the payment dates of these obligations and to establish the possibility of future taxable profit against which these credits can be utilized at those dates.
| 15. | TRADE RECEIVABLES |
As of December 31, 2015, 2014 and 2013 the balance of trade receivables is composed as described below:
2015 | 2014 | 2013 | ||||||||||
Commercial, industrial, residential zones, public lighting, rates and tariffsa/ | US$ | 53,278 | US$ | 50,302 | US$ | 42,405 | ||||||
Energy consumed not billedc/ | 10,582 | 11,836 | 4,786 | |||||||||
Instituto Nacional de Electrificación -INDEd/ | 5,838 | 7,503 | 11,563 | |||||||||
Clients tolls | 267 | 198 | 226 | |||||||||
Other clients | 48 | 47 | 42 | |||||||||
|
|
|
|
|
| |||||||
| 70,013 | 69,886 | 59,022 | ||||||||||
Long-term accounts receivable with payment agreements | (3,883 | ) | (2,740 | ) | (1,207 | ) | ||||||
Long-term accounts receivable from municipalitiesb/ | (2,378 | ) | (539 | ) | (257 | ) | ||||||
|
|
|
|
|
| |||||||
| (6,261 | ) | (3,279 | ) | (1,464 | ) | |||||||
|
|
|
|
|
| |||||||
| 63,752 | 66,607 | 57,558 | ||||||||||
Less | ||||||||||||
Collection by offsettingf/ | (13,663 | ) | (12,284 | ) | (11,775 | ) | ||||||
Allowance for uncollectible accountse/ | (17,195 | ) | (13,112 | ) | (10,974 | ) | ||||||
|
|
|
|
|
| |||||||
Short-term trade receivables | US$ | 32,894 | US$ | 41,211 | US$ | 34,809 | ||||||
|
|
|
|
|
| |||||||
F-277
Table of Contents
DISTRIBUIDORA DE ELECTRICIDAD DE ORIENTE, S. A.—DEORSA
NOTES TO THE FINANCIAL STATEMENTS
AS OF DECEMBER 31, 2015, 2014 AND 2013 AND JANUARY 1,
2013 (RESTATED), AND FOR THE YEARS ENDED DECEMBER 31,
2015, 2014 AND 2013 (RESTATED)
(Stated in thousands of US Dollars, except otherwise indicated)
| 15. | TRADE RECEIVABLES (cont’d) |
| a/ | Age of the trade receivables portfolio per days at December 31, 2015, 2014 and 2013 is shown as follows: |
Aging 2015 | 0-30 | 31-60 | 61-90 | 91-120 | 121-150 | 151-180 | 181-360 | (+)360 | Grand | |||||||||||||||||||||||||
Normal supply clients | $ | 11,524 | $ | 2,715 | $ | 647 | $ | 843 | $ | 799 | $ | 736 | $ | 4,168 | $ | 12,609 | $34,041 | |||||||||||||||||
Active without charges | — | — | — | — | — | — | 2 | 35 | 37 | |||||||||||||||||||||||||
Repeated Auto Reclosing (ARR, in Spanish) | 37 | 37 | 41 | 40 | 37 | 36 | 265 | 1,037 | 1,530 | |||||||||||||||||||||||||
Forced power cut | 1 | 4 | 3 | 4 | 4 | 15 | 89 | 3,315 | 3,435 | |||||||||||||||||||||||||
Shut down non-payment | — | — | — | — | — | 3 | — | 2,515 | 2,518 | |||||||||||||||||||||||||
Voluntary power cut | 0 | 0 | 0 | 0 | 0 | — | 1 | 151 | 152 | |||||||||||||||||||||||||
Interrupted supply non-payment | 315 | 315 | 323 | 252 | 242 | 224 | 1,449 | 4,930 | 8,050 | |||||||||||||||||||||||||
Eventual supply | — | — | — | — | — | — | — | 5 | 5 | |||||||||||||||||||||||||
Administrative suspension | 71 | 89 | 94 | 116 | 111 | 106 | 630 | 2,208 | 3,425 | |||||||||||||||||||||||||
Administrative suspension outstanding invoice | 14 | 16 | 14 | 8 | 1 | 1 | 7 | 24 | 85 | |||||||||||||||||||||||||
|
|
|
|
|
|
|
|
|
|
|
|
|
|
|
|
| ||||||||||||||||||
Grand total | $ | 11,962 | $ | 3,176 | $ | 1,122 | $ | 1,263 | $ | 1,194 | $ | 1,121 | $ | 6,611 | $ | 26,829 | $53,278 | |||||||||||||||||
|
|
|
|
|
|
|
|
|
|
|
|
|
|
|
|
| ||||||||||||||||||
Aging 2014 | 0-30 | 31-60 | 61-90 | 91-120 | 121-150 | 151-180 | 181-360 | (+)360 | Grand | |||||||||||||||||||||||||
Normal supply clients | $ | 12,890 | $ | 3,446 | $ | 904 | $ | 1,048 | $ | 921 | $ | 840 | $ | 4,500 | $ | 8,141 | $32,690 | |||||||||||||||||
Active without charges | — | — | — | — | — | — | 1 | 26 | 27 | |||||||||||||||||||||||||
Repeated Auto Reclosing (ARR, in Spanish) | 49 | 33 | 22 | 26 | 25 | 22 | 149 | 625 | 951 | |||||||||||||||||||||||||
Forced shut down | — | 1 | 2 | 4 | 4 | 8 | 37 | 3,216 | 3,272 | |||||||||||||||||||||||||
Power cut non- | — | 1 | 1 | 2 | 4 | 15 | 300 | 4,129 | 4,452 | |||||||||||||||||||||||||
Power cut non-payment outstanding | — | — | — | — | — | — | 1 | 5 | 6 | |||||||||||||||||||||||||
Voluntary power cut | — | — | — | — | — | — | 2 | 153 | 155 | |||||||||||||||||||||||||
Interrupted supply | 333 | 343 | 361 | 283 | 270 | 251 | 1,323 | 3,191 | 6,355 | |||||||||||||||||||||||||
Eventual supply | — | — | — | — | — | — | 5 | 5 | ||||||||||||||||||||||||||
Administrative | 41 | 73 | 106 | 175 | 166 | 129 | 537 | 1,148 | 2,375 | |||||||||||||||||||||||||
Administrative suspension | 2 | 3 | 3 | 1 | 1 | — | 1 | 3 | 14 | |||||||||||||||||||||||||
|
|
|
|
|
|
|
|
|
|
|
|
|
|
|
|
| ||||||||||||||||||
Grand total | $ | 13,315 | $ | 3,900 | $ | 1,399 | $ | 1,539 | $ | 1,391 | $ | 1,265 | $ | 6,851 | $ | 20,642 | $50,302 | |||||||||||||||||
|
|
|
|
|
|
|
|
|
|
|
|
|
|
|
|
| ||||||||||||||||||
F-278
Table of Contents
DISTRIBUIDORA DE ELECTRICIDAD DE ORIENTE, S. A.—DEORSA
NOTES TO THE FINANCIAL STATEMENTS
AS OF DECEMBER 31, 2015, 2014 AND 2013 AND JANUARY 1,
2013 (RESTATED), AND FOR THE YEARS ENDED DECEMBER 31,
2015, 2014 AND 2013 (RESTATED)
(Stated in thousands of US Dollars, except otherwise indicated)
| 15. | TRADE RECEIVABLES (cont’d) |
Aging 2013 | 0-30 | 31-60 | 61-90 | 91-120 | 121-150 | 151-180 | 181-360 | (+)360 | Grand | |||||||||||||||||||||||||
Normal supply clients | $ | 14,556 | $ | 3,500 | $ | 981 | $ | 1,123 | $ | 638 | $ | 716 | $ | 2,997 | $ | 3,222 | $27,733 | |||||||||||||||||
Active without charges | — | — | — | — | — | — | 5 | 13 | 18 | |||||||||||||||||||||||||
Repeated Auto Reclosing (ARR, in Spanish) | 94 | 75 | 77 | 77 | 75 | 87 | 386 | 1,361 | 2,232 | |||||||||||||||||||||||||
Forced shut down | — | — | 1 | 4 | 1 | 5 | 46 | 2,874 | 2,931 | |||||||||||||||||||||||||
Power cut non- | — | 1 | 3 | 9 | 29 | 59 | 543 | 3,281 | 3,925 | |||||||||||||||||||||||||
Power cut non-payment outstanding | — | — | — | — | — | 2 | — | 3 | 5 | |||||||||||||||||||||||||
Voluntary power cut | 13 | 1 | 1 | — | — | — | 2 | 145 | 162 | |||||||||||||||||||||||||
Interrupted supply | 339 | 374 | 390 | 278 | 242 | 218 | 914 | 1,750 | 4,505 | |||||||||||||||||||||||||
Eventual supply | — | — | — | — | — | — | — | 5 | 5 | |||||||||||||||||||||||||
Administrative | — | — | — | — | — | — | — | 23 | 23 | |||||||||||||||||||||||||
Administrative suspension | 19 | 38 | 67 | 78 | 86 | 59 | 197 | 322 | 866 | |||||||||||||||||||||||||
|
|
|
|
|
|
|
|
|
|
|
|
|
|
|
|
| ||||||||||||||||||
Grand total | $ | 15,021 | $ | 3,989 | $ | 1,520 | $ | 1,569 | $ | 1,071 | $ | 1,146 | $ | 5,090 | $ | 12,999 | $42,405 | |||||||||||||||||
|
|
|
|
|
|
|
|
|
|
|
|
|
|
|
|
| ||||||||||||||||||
The period of the average credit on the energy sale is thirty days. There is no charge of late interests on the trade accounts receivable for the first thirty days after invoice is issued. Subsequently to that date, late interests approved every quarter by CNEE are charged. In 2015, 2014 and 2013, the late interest applied fluctuated between 1% and 1.05% monthly on the outstanding balance.
Age of the trade receivable portfolio per days to December 31, 2015, 2014 and 2013 is shown as follows:
As at December 31 2015 | As at December 31 2014 | As at December 31 2013 | ||||||||||||||||||||||
Gross | Impairment | Gross | Impairment | Gross | Impairment | |||||||||||||||||||
Not past due | 11,962 | — | 13,315 | — | 15,023 | — | ||||||||||||||||||
Past due to 1 month | 3,176 | 3,900 | 3,988 | |||||||||||||||||||||
Past due to 2 months | 1,122 | — | 1,399 | — | 1,520 | — | ||||||||||||||||||
Past due 3 to 6 months | 3,578 | — | 4,195 | — | 3,788 | — | ||||||||||||||||||
Past due more than six months | 33,440 | (1) | (17,195 | ) | 27,493 | (1) | (13,112 | ) | 18,086 | (1) | (10,974 | ) | ||||||||||||
|
|
|
|
|
|
|
|
|
|
|
| |||||||||||||
| 53,278 | (17,195 | ) | 50,302 | (13,112 | ) | 42,405 | (10,974 | ) | ||||||||||||||||
|
|
|
|
|
|
|
|
|
|
|
| |||||||||||||
| (1) | Includes account receivables for collection by means of offsetting of US$ 7,079, US$ 7,124 and US$ 4,675 as of December 31, 2015, 2014 and 2013 respectively and accounts receivable to municipalities, Governmental entities and certain communities due to term-payment agreements of US$ of US$ 9,167, US$ 7,264 and US$ 2,635 as of December 31, 2015, 2014 and 2013 respectively, of which the Company has not recognized an allowance for uncollectible accounts since those are considered recoverable. |
F-279
Table of Contents
DISTRIBUIDORA DE ELECTRICIDAD DE ORIENTE, S. A.—DEORSA
NOTES TO THE FINANCIAL STATEMENTS
AS OF DECEMBER 31, 2015, 2014 AND 2013 AND JANUARY 1,
2013 (RESTATED), AND FOR THE YEARS ENDED DECEMBER 31,
2015, 2014 AND 2013 (RESTATED)
(Stated in thousands of US Dollars, except otherwise indicated)
| 15. | TRADE RECEIVABLES (cont’d) |
| b/ | Trade accounts receivable include past-due balances from the municipalities out of which the Company has not recognized a provision for uncollectible accounts since those have not had significant changes on the credit quality and are considered recoverable. Amounts are shown as follows: |
2015 | 2014 | 2013 | ||||||||||
Not past due | US$ | 1,139 | US$ | 1,849 | US$ | 1,293 | ||||||
Past due to 60 days | 650 | 1,012 | 624 | |||||||||
Past due to 90 days | 115 | 193 | 130 | |||||||||
Past due to 120 days | 325 | 411 | 496 | |||||||||
Past due to 150 days | 302 | 350 | 50 | |||||||||
Past due to 180 days | 258 | 266 | 204 | |||||||||
Past due to 360 days | 1,146 | 1,062 | 569 | |||||||||
Past due more than 360 days | 2,378 | 539 | 257 | |||||||||
|
|
|
|
|
| |||||||
| 6,313 | 5,682 | 3,623 | ||||||||||
(-) Long-term trade receivable | (2,378 | ) | (539 | ) | (257 | ) | ||||||
|
|
|
|
|
| |||||||
Short-term trade receivable | US$ | 3,935 | US$ | 5,143 | US$ | 3,366 | ||||||
|
|
|
|
|
| |||||||
| c/ | It corresponds to the estimated amount of services accrued, but not billed, from the sale of electric energy and toll at December 31, 2015, 2014 and 2013, net from the estimate of technical loss. This value is billed in full in the next billing cycle. |
| d/ | Account receivable from INDE for the billing of the adjustment ofSolidaridadINDE to the users benefited by the Social Tariff Act, according to the deed of INDE a-38-2013-2. A. The amount to be billed by the Company is determined by the resolutions monthly issued by the CNEE. The recovery of the amount is carried out in 30 days subsequent to issuing the invoice. |
| e/ | Uncollectible Accounts—The movement of the allowance for uncollectible accounts during years ended at December 31, 2015, 2014 and 2013, are shown as follows: |
2015 | 2014 | 2013 | ||||||||||
Balance at the beginning of the year | US$ | 13,112 | US$ | 10,974 | US$ | 8,481 | ||||||
Expense of the period | 5,687 | 2,756 | 4,377 | |||||||||
Application of provisions and other movements | (1,555 | ) | (1,003 | ) | (1,908 | ) | ||||||
Translation difference | (49 | ) | 385 | 24 | ||||||||
|
|
|
|
|
| |||||||
| US$ | 17,195 | US$ | 13,112 | US$ | 10,974 | |||||||
|
|
|
|
|
| |||||||
The Company records an allowance for uncollectible accounts over all those balances aged beyond 180 days less the collection by means of offsetting and the accounts receivable to municipalities, Governmental entities and certain communities due to term-payment agreements.
F-280
Table of Contents
DISTRIBUIDORA DE ELECTRICIDAD DE ORIENTE, S. A.—DEORSA
NOTES TO THE FINANCIAL STATEMENTS
AS OF DECEMBER 31, 2015, 2014 AND 2013 AND JANUARY 1,
2013 (RESTATED), AND FOR THE YEARS ENDED DECEMBER 31,
2015, 2014 AND 2013 (RESTATED)
(Stated in thousands of US Dollars, except otherwise indicated)
| 15. | TRADE RECEIVABLES (cont’d) |
| f/ | Collection by means of offsetting corresponds to the balances payable to the municipalities for the municipal tariff of public lighting that the Company charges to the users in the name of the municipalities. The Company includes this balance as part of the trade accounts receivable based on the right acquired through the contracts with municipalities to collect the public lighting tariff and offset it with the balances receivable from the electric energy billing to the same municipalities. |
Additional information on accounts receivable from customers under Separate Management
As of December 31, 2015, 2014 and 2013 the Company records as part of its accounts receivable US$ 15,259, US$ 13,259 and US$ 6,412 respectively, corresponding to customers separately identified from the remaining receivables for collection purposes.
In 2014 and 2013 updating of the record of separate management was carried out with the purpose of focusing the resources on recover the groups of clients with an impact on the debt management for the Company.
In 2015 the same methodology used in 2014 and 2013 is maintained. Based on such updating, the separate management is shown by age as follows:
At December 31, 2015
Township | Receivables 0-60 days | Receivables 61-180 days | Receivables | Total | ||||||||||||
Alta Verapaz | US$ | 505 | US$ | 825 | US$ | 5,014 | US$ | 6,344 | ||||||||
Baja Verapaz | 75 | 131 | 538 | 744 | ||||||||||||
El Progreso | 6 | 4 | 22 | 32 | ||||||||||||
Guatemala | — | — | 340 | 340 | ||||||||||||
Izabal | 84 | 148 | 837 | 1,069 | ||||||||||||
Township | Receivables Due 0-60 days | Receivables 61-180 days | Receivables | Total | ||||||||||||
Jalapa | 150 | 271 | 844 | 1,265 | ||||||||||||
Jutiapa | 124 | 240 | 809 | 1,173 | ||||||||||||
Petén | 74 | 116 | 461 | 651 | ||||||||||||
Quiché | 13 | 17 | 45 | 75 | ||||||||||||
Santa Rosa | 20 | 35 | 153 | 208 | ||||||||||||
Zacapa | 214 | 426 | 2,718 | 3,358 | ||||||||||||
|
|
|
|
|
|
|
| |||||||||
Total | US$ | 1,265 | US$ | 2,213 | US$ | 11,781 | US$ | 15,259 | ||||||||
|
|
|
|
|
|
|
| |||||||||
F-281
Table of Contents
DISTRIBUIDORA DE ELECTRICIDAD DE ORIENTE, S. A.—DEORSA
NOTES TO THE FINANCIAL STATEMENTS
AS OF DECEMBER 31, 2015, 2014 AND 2013 AND JANUARY 1,
2013 (RESTATED), AND FOR THE YEARS ENDED DECEMBER 31,
2015, 2014 AND 2013 (RESTATED)
(Stated in thousands of US Dollars, except otherwise indicated)
| 15. | TRADE RECEIVABLES (cont’d) |
At December 31, 2014
Township | Receivables 0-60 days | Receivables 61-180 days | Receivables | Total | ||||||||||||
Alta Verapaz | US$ | 406 | US$ | 679 | US$ | 3,272 | US$ | 4,357 | ||||||||
Zacapa | 648 | 611 | 2,331 | 3,590 | ||||||||||||
Petén | 167 | 168 | 1,609 | 1,944 | ||||||||||||
El Progreso | 109 | 159 | 380 | 648 | ||||||||||||
Jalapa | 137 | 196 | 344 | 677 | ||||||||||||
Jutiapa | 95 | 183 | 301 | 579 | ||||||||||||
Baja Verapaz | 128 | 150 | 297 | 575 | ||||||||||||
Izabal | 74 | 120 | 331 | 525 | ||||||||||||
Santa Rosa | 19 | 32 | 80 | 131 | ||||||||||||
Quiché | 11 | 8 | 22 | 41 | ||||||||||||
|
|
|
|
|
|
|
| |||||||||
Total | US$ | 1,794 | US$ | 2,306 | US$ | 8,967 | US$ | 13,067 | ||||||||
|
|
|
|
|
|
|
| |||||||||
At December 31, 2013
Township | Receivables 0-60 days | Receivables | Receivables | Total | ||||||||||||
Zacapa | US$ | 751 | US$ | 1,103 | US$ | 2,491 | US$ | 4,345 | ||||||||
Alta Verapaz | 83 | 146 | 884 | 1,113 | ||||||||||||
El Progreso | 185 | 237 | 506 | 928 | ||||||||||||
Baja Verapaz | 3 | 3 | 20 | 26 | ||||||||||||
|
|
|
|
|
|
|
| |||||||||
Total | US$ | 1,022 | US$ | 1,489 | US$ | 3,901 | US$ | 6,412 | ||||||||
|
|
|
|
|
|
|
| |||||||||
The following discloses the process that the Company has implemented to collect its account receivables from its customers.
In 2013, the Company implemented a program to improve the collection of its accounts receivables. The program consists of four specific strategies to improve collections from customers separately identified from the remaining receivables for collection purposes.
| 1. | Debt management—early settlement; |
| 2. | Assurance of field activities; |
| 3. | Management of amounts due from customers outstanding for more than 180 days; and |
F-282
Table of Contents
DISTRIBUIDORA DE ELECTRICIDAD DE ORIENTE, S. A.—DEORSA
NOTES TO THE FINANCIAL STATEMENTS
AS OF DECEMBER 31, 2015, 2014 AND 2013 AND JANUARY 1,
2013 (RESTATED), AND FOR THE YEARS ENDED DECEMBER 31,
2015, 2014 AND 2013 (RESTATED)
(Stated in thousands of US Dollars, except otherwise indicated)
| 15. | TRADE RECEIVABLES (cont’d) |
| 4. | Local community management and development. |
This program did not consider the active participation of the local representatives and the municipal government; that is the reason why since 2014 an additional strategy from the four detailed above was included to the program in order to promote dialogue and negotiation processes with local representatives, governmental entities and other energy distributors, which allowed to create collection management groups at a municipal level.
The new methodology, which incorporates local representatives, promotes sustainable receivable recovery processes and the reincorporation of Company´s customers to the commercial cycle.
This new strategy starts with dialogue and negotiation roundtables with community leaders with the main purpose of reincorporate the clients to the commercial cycle of the Company. In these roundtables, benefits and commitments that are within the negotiation framework are considered.
Each of the processes described above is documented through a written agreement with the objective of the regularization of the provision of the electric energy service and as part of the formality of the commitments assumed by each of the parties involved.
This new strategy added to the 2013 program has allowed new dialogue and negotiation opportunities as well as the reincorporation of 26,684 thousand clients in 2014, a quantity higher than the five thousand clients recovered in 2013. At the end of December 2015 there were 15 active projects in DEORSA and they have achieved to reincorporate 12,401 clients as of that date.
To enhance the recovery of the amounts due from clients, in June 2015 the negotiation phase of the program for the Central-Eastern (CE) and Northern-Eastern (NE) regions began with the purpose of meeting expected recovery amounts and ensure the reincorporation of the clients to the commercial cycle. This phase considered the deployment of own personnel of the different internal departments (technical, marketing and community relations) centralized in the headquarters to the five regions. In October 2015 the second phase of the program, this means the collection phase, in the CE and NE regions was initiated.
After the completion of the negotiation phase and with the local market enable to operate again the collection strategies for 2013 were implemented.
Debt Management—Early Settlement
This strategy focuses on improving collections to avoid amounts due from customers outstanding for more than 180 days from becoming impaired. Actions taken include the following:
| 1. | Customer data update; |
| 2. | Management of collection through telephone calls and text messages; |
| 3. | Loyalty campaigns; |
F-283
Table of Contents
DISTRIBUIDORA DE ELECTRICIDAD DE ORIENTE, S. A.—DEORSA
NOTES TO THE FINANCIAL STATEMENTS
AS OF DECEMBER 31, 2015, 2014 AND 2013 AND JANUARY 1,
2013 (RESTATED), AND FOR THE YEARS ENDED DECEMBER 31,
2015, 2014 AND 2013 (RESTATED)
(Stated in thousands of US Dollars, except otherwise indicated)
| 15. | TRADE RECEIVABLES (cont’d) |
| 4. | Local communication; and |
| 5. | Increase of collection channels |
Assurance of Field activities
The main objectives of this strategy is the prevention of conflicts originated by errors or failure in the field activities and to ensure the performance of scheduled power cut-offs related to lack of payment as a receivable recovery mechanism. The strategy of assurance of the field activities has been performed from two different approaches. The first approach includes continuous improvement of the commercial business cycle by ensuring that the monthly reading is performed to each of the Company´s clients and that their billing corresponds to the consumption made by the client. The second approach corresponds to strengthen of the monitoring and evaluation of the quality of the activities performed by the contractors of the Company.
Ensure the implementation of power cuts related to lack of payment as a mechanism to achieve receivable recovery is expected to reduce the amounts due from customers outstanding for more than 180 days. Within the activities are:
| 1. | Client consumption reading traceability; |
| 2. | Auditing the cut-offs performed; and |
| 3. | Creation of cut-off brigades. |
Debt recovery through management of amounts due from customers outstanding for more than 180 days and local community management and development
This strategy is focused towards improving the effectiveness of the receivables recovery activities. Within the activities are:
| 1. | Development of action plans designed for comprehensive management of local communities with high level of outstanding past-due receivables; |
| 2. | Traceability of receivable recovery activities in the field; |
| 3. | Strengthening of monitoring activities; and |
| 4. | Mobile offices. |
During 2014 coordination among different internal units of the Company was strengthened through the creation of an internal operating committee for the Eastern area; including the different business units which active participation in the receivable recovery processes was required. In this Committee there
F-284
Table of Contents
DISTRIBUIDORA DE ELECTRICIDAD DE ORIENTE, S. A.—DEORSA
NOTES TO THE FINANCIAL STATEMENTS
AS OF DECEMBER 31, 2015, 2014 AND 2013 AND JANUARY 1,
2013 (RESTATED), AND FOR THE YEARS ENDED DECEMBER 31,
2015, 2014 AND 2013 (RESTATED)
(Stated in thousands of US Dollars, except otherwise indicated)
| 15. | TRADE RECEIVABLES (cont’d) |
were representatives of Finance, Communications, Marketing, Community relations, Legal and Regional departments. This committee enable a fast implementation of the processes design to enhance the strategies described above and the implementation of the written Agreements signed with the involved communities. In 2015, this committee was dissolved and the strategy did not continue.
| 16. | PROPERTY, PLANT AND EQUIPMENT—NET |
Composition and movement at December 31, 2015, 2014 and 2013 of the items making up the cost of the property, plant and equipment and their corresponding accumulated depreciation is as follows:
2015 | 2014 | 2013 | ||||||||||
Land and constructions | US$ | 1,022 | US$ | 1,057 | US$ | 1,040 | ||||||
Technical installations | 204,371 | 195,440 | 188,003 | |||||||||
Other installations, machinery, tools, furniture and equipment | 2,287 | 2,163 | 2,077 | |||||||||
Assets under constructions | 2,748 | 9,665 | 7,977 | |||||||||
Inventory of materials | 2,860 | 4,140 | 4,036 | |||||||||
|
|
|
|
|
| |||||||
| US$ | 213,288 | US$ | 212,465 | US$ | 203,133 | |||||||
|
|
|
|
|
| |||||||
Movements Occurred During 2015
Description | Land and | Technical b/ | Others c/ | Assets under | Inventory of | Total | ||||||||||||||||||
Acquisition cost | ||||||||||||||||||||||||
Balance at the beginning of 2015 | US$ | 1,892 | US$ | 349,384 | US$ | 7,961 | US$ | 9,665 | US$ | 4,140 | US$ | 373,042 | ||||||||||||
Additions | — | — | — | 15,015 | — | 15,015 | ||||||||||||||||||
Disposals | — | (15,016 | ) | (8 | ) | — | (857 | ) | (15,881 | ) | ||||||||||||||
Transfers | 41 | 20,968 | 857 | (21,866 | ) | — | — | |||||||||||||||||
Translation differences | (8 | ) | (1,613 | ) | (36 | ) | (66 | ) | (22 | ) | (1,745 | ) | ||||||||||||
|
|
|
|
|
|
|
|
|
|
|
| |||||||||||||
Total cost | 1,925 | 353,723 | 8,774 | 2,748 | 3,261 | 370,431 | ||||||||||||||||||
Accumulated depreciation | ||||||||||||||||||||||||
Balance at the beginning of 2015 | (835 | ) | (153,944 | ) | (5,798 | ) | — | — | (160,577 | ) | ||||||||||||||
Additions | (71 | ) | (9,302 | ) | (723 | ) | (400 | ) | (10,496 | ) | ||||||||||||||
Disposals | — | 13,163 | 8 | — | — | 13,171 | ||||||||||||||||||
Translation differences | 3 | 731 | 26 | — | (1 | ) | 759 | |||||||||||||||||
|
|
|
|
|
|
|
|
|
|
|
| |||||||||||||
Total accumulated depreciation | (903 | ) | (149,352 | ) | (6,487 | ) | — | (401 | ) | (157,143 | ) | |||||||||||||
|
|
|
|
|
|
|
|
|
|
|
| |||||||||||||
Carrying value at December 31, 2015 | US$ | 1,022 | US$ | 204,371 | US$ | 2,287 | US$ | 2,748 | US$ | 2,860 | US$ | 213,288 | ||||||||||||
|
|
|
|
|
|
|
|
|
|
|
| |||||||||||||
F-285
Table of Contents
DISTRIBUIDORA DE ELECTRICIDAD DE ORIENTE, S. A.—DEORSA
NOTES TO THE FINANCIAL STATEMENTS
AS OF DECEMBER 31, 2015, 2014 AND 2013 AND JANUARY 1,
2013 (RESTATED), AND FOR THE YEARS ENDED DECEMBER 31,
2015, 2014 AND 2013 (RESTATED)
(Stated in thousands of US Dollars, except otherwise indicated)
| 16. | PROPERTY, PLANT AND EQUIPMENT—NET (cont’d) |
Constructions performed by the Company during year 2015 are detailed per type of asset as follows:
Own Funds | Funds from | Total | ||||||||||
Administrative buildings—in progress | US$ | 1 | US$ | — | US$ | 1 | ||||||
Industrial buildings—in progress | 21 | 21 | ||||||||||
Substation of transportation—in progress | 25 | — | 25 | |||||||||
Distribution lines—in progress | 4,168 | 5,693 | 9,861 | |||||||||
Substation of distribution—in progress | 107 | — | 107 | |||||||||
Transformation centers—in progress | 1,356 | — | 1,356 | |||||||||
Measuring instruments—in progress | 3,026 | — | 3,026 | |||||||||
TPIS pending distribution | (85 | ) | — | (85 | ) | |||||||
Administrative vehicles—in progress | 59 | — | 59 | |||||||||
Tools—in progress | 13 | — | 13 | |||||||||
Furniture—in progress | 25 | — | 25 | |||||||||
Office equipment—in progress | 48 | — | 48 | |||||||||
Information process equipment—in progress | 359 | — | 359 | |||||||||
Other property, plant and equipment—in progress | 199 | — | 199 | |||||||||
|
|
|
|
|
| |||||||
| US$ | 9,322 | US$ | 5,693 | US$ | 15,015 | |||||||
|
|
|
|
|
| |||||||
F-286
Table of Contents
DISTRIBUIDORA DE ELECTRICIDAD DE ORIENTE, S. A.—DEORSA
NOTES TO THE FINANCIAL STATEMENTS
AS OF DECEMBER 31, 2015, 2014 AND 2013 AND JANUARY 1,
2013 (RESTATED), AND FOR THE YEARS ENDED DECEMBER 31,
2015, 2014 AND 2013 (RESTATED)
(Stated in thousands of US Dollars, except otherwise indicated)
| 16. | PROPERTY, PLANT AND EQUIPMENT—NET (cont’d) |
Movements Occurred During 2014
Description | Land an | Technical b/ | Other c/ | Asset under | Inventory of | Total | ||||||||||||||||||
Acquisition cost | ||||||||||||||||||||||||
Balance at the beginning of 2014 | US$ | 1,772 | US$ | 326,869 | US$ | 7,067 | US$ | 7,977 | US$ | 4,036 | US$ | 347,721 | ||||||||||||
Additions | — | — | — | 15,024 | — | 15,024 | ||||||||||||||||||
Disposals | — | (1,118 | ) | (10 | ) | — | (25 | ) | (1,153 | ) | ||||||||||||||
Transfer | 61 | 12,893 | 663 | (13,617 | ) | — | — | |||||||||||||||||
Translation differences | 59 | 10,740 | 241 | 281 | 129 | 11,450 | ||||||||||||||||||
|
|
|
|
|
|
|
|
|
|
|
| |||||||||||||
Total cost | 1,892 | 349,384 | 7,961 | 9,665 | 4,140 | 373,042 | ||||||||||||||||||
Accumulated depreciation | ||||||||||||||||||||||||
Balance at the beginning of 2014 | (733 | ) | (138,866 | ) | (4,990 | ) | — | — | (144,589 | ) | ||||||||||||||
Additions | (78 | ) | (10,901 | ) | (642 | ) | — | — | (11,621 | ) | ||||||||||||||
Disposals | — | 484 | 7 | — | — | 491 | ||||||||||||||||||
Translation differences | (24 | ) | (4,661 | ) | (173 | ) | — | — | (4,858 | ) | ||||||||||||||
|
|
|
|
|
|
|
|
|
|
|
| |||||||||||||
Total accumulated depreciation | (835 | ) | (153,944 | ) | (5,798 | ) | — | — | (160,577 | ) | ||||||||||||||
|
|
|
|
|
|
|
|
|
|
|
| |||||||||||||
Carrying value at December 31, 2014 | US$ | 1,057 | US$ | 195,440 | US$ | 2,163 | US$ | 9,665 | US$ | 4,140 | US$ | 212,465 | ||||||||||||
|
|
|
|
|
|
|
|
|
|
|
| |||||||||||||
F-287
Table of Contents
DISTRIBUIDORA DE ELECTRICIDAD DE ORIENTE, S. A.—DEORSA
NOTES TO THE FINANCIAL STATEMENTS
AS OF DECEMBER 31, 2015, 2014 AND 2013 AND JANUARY 1,
2013 (RESTATED), AND FOR THE YEARS ENDED DECEMBER 31,
2015, 2014 AND 2013 (RESTATED)
(Stated in thousands of US Dollars, except otherwise indicated)
| 16. | PROPERTY, PLANT AND EQUIPMENT—NET (cont’d) |
Constructions performed by the Company during 2014 are detailed per type of asset as follows:
Own Funds | Funds from Government Grants | Total | ||||||||||
Administrative buildings—in progress | US$ | 33 | US$ | — | US$ | 33 | ||||||
Substation of transportation—in progress | 21 | — | 21 | |||||||||
Distribution lines—in progress | 3,579 | 6,425 | 10,004 | |||||||||
Substation of distribution—in progress | 59 | — | 59 | |||||||||
Transformation centers—in progress | 1,378 | — | 1,378 | |||||||||
Measuring instruments—in progress | 2,573 | — | 2,573 | |||||||||
Other electrical installations—in progress | 36 | 36 | ||||||||||
TPIS pending distribution | 144 | 73 | 217 | |||||||||
Administrative vehicles—in progress | 83 | — | 83 | |||||||||
Office equipment—in progress | 12 | — | 12 | |||||||||
Information process equipment —in Progress | 483 | — | 483 | |||||||||
Other property, plant and equipment—in progress | 125 | — | 125 | |||||||||
|
|
|
|
|
| |||||||
| US$ | 8,526 | US$ | 6,498 | US$ | 15,024 | |||||||
|
|
|
|
|
| |||||||
F-288
Table of Contents
DISTRIBUIDORA DE ELECTRICIDAD DE ORIENTE, S. A.—DEORSA
NOTES TO THE FINANCIAL STATEMENTS
AS OF DECEMBER 31, 2015, 2014 AND 2013 AND JANUARY 1,
2013 (RESTATED), AND FOR THE YEARS ENDED DECEMBER 31,
2015, 2014 AND 2013 (RESTATED)
(Stated in thousands of US Dollars, except otherwise indicated)
| 16. | PROPERTY, PLANT AND EQUIPMENT—NET (cont’d) |
Movements Occurred During 2013
Description | Land an a/ | Technical Installations b/ | Other c/ | Asset under d/ | Inventory of | Total | ||||||||||||||||||
Acquisition cost | ||||||||||||||||||||||||
Balance at the beginning of 2013 | US$ | 1,253 | US$ | 316,478 | US$ | 6,262 | US$ | 2,966 | US$ | 4,699 | US$ | 331,658 | ||||||||||||
Addition | — | — | — | 14,155 | — | 14,155 | ||||||||||||||||||
Transfer | 508 | 7,914 | 756 | (9,178 | ) | — | — | |||||||||||||||||
Translation differences | 11 | 2,477 | 50 | 34 | (663 | ) | 1,909 | |||||||||||||||||
|
|
|
|
|
|
|
|
|
|
|
| |||||||||||||
Total cost | 1,772 | 326,869 | 7,068 | 7,977 | 4,036 | 347,722 | ||||||||||||||||||
Accumulated depreciation | ||||||||||||||||||||||||
Balance at the beginning of 2013 | (663 | ) | (126,081 | ) | (4,422 | ) | — | — | (131,166 | ) | ||||||||||||||
Additions | (64 | ) | (11,779 | ) | (533 | ) | — | — | (12,376 | ) | ||||||||||||||
Translation differences | (5 | ) | (1,006 | ) | (36 | ) | — | — | (1,047 | ) | ||||||||||||||
|
|
|
|
|
|
|
|
|
|
|
| |||||||||||||
Total accumulated depreciation | (732 | ) | (138,866 | ) | (4,991 | ) | — | — | (144,589 | ) | ||||||||||||||
|
|
|
|
|
|
|
|
|
|
|
| |||||||||||||
Carrying value at December 31, 2013 | US$ | 1,040 | US$ | 188,003 | US$ | 2,077 | US$ | 7,977 | US$ | 4,036 | US$ | 203,133 | ||||||||||||
|
|
|
|
|
|
|
|
|
|
|
| |||||||||||||
F-289
Table of Contents
DISTRIBUIDORA DE ELECTRICIDAD DE ORIENTE, S. A.—DEORSA
NOTES TO THE FINANCIAL STATEMENTS
AS OF DECEMBER 31, 2015, 2014 AND 2013 AND JANUARY 1,
2013 (RESTATED), AND FOR THE YEARS ENDED DECEMBER 31,
2015, 2014 AND 2013 (RESTATED)
(Stated in thousands of US Dollars, except otherwise indicated)
| 16. | PROPERTY, PLANT AND EQUIPMENT—NET (cont’d) |
Constructions performed by the Company during year 2013 are detailed per type of asset as follows:
Own Funds | Funds from | Total | ||||||||||
Administrative buildings—in progress | US$ | 677 | US$ | — | US$ | 677 | ||||||
Commercial buildings in progress | 45 | — | 45 | |||||||||
Transportation substation—in progress | 17 | — | 17 | |||||||||
Distribution lines—in progress | 3,753 | 4,776 | 8,529 | |||||||||
Distribution substation—in progress | 50 | — | 50 | |||||||||
Transformation stations—in progress | 1,262 | — | 1,262 | |||||||||
Measurement tools—in progress | 2,635 | — | 2,635 | |||||||||
Telecommunications technical installations—in progress | 31 | 31 | ||||||||||
Administrative vehicles—in progress | 97 | — | 97 | |||||||||
Information process equipment—in Progress | 638 | — | 638 | |||||||||
Other property, plant and equipment—in progress | 174 | — | 174 | |||||||||
|
|
|
|
|
| |||||||
| US$ | 9,379 | US$ | 4,776 | US$ | 14,155 | |||||||
|
|
|
|
|
| |||||||
| a/ | As of December 31, 2015, 2014 and 2013, classification of land and constructions is as follows: |
2015 | 2014 | 2013 | ||||||||||
Land | US$ | 77 | US$ | 77 | US$ | 75 | ||||||
Industrial buildings | 302 | 282 | 216 | |||||||||
Administrative buildings | 360 | 362 | 351 | |||||||||
Commercial buildings | 656 | 659 | 639 | |||||||||
Improvement to leased administrative property | 525 | 507 | 487 | |||||||||
Improvement to leased commercial property | 5 | 5 | 4 | |||||||||
|
|
|
|
|
| |||||||
| US$ | 1,925 | US$ | 1,892 | US$ | 1,772 | |||||||
|
|
|
|
|
| |||||||
F-290
Table of Contents
DISTRIBUIDORA DE ELECTRICIDAD DE ORIENTE, S. A.—DEORSA
NOTES TO THE FINANCIAL STATEMENTS
AS OF DECEMBER 31, 2015, 2014 AND 2013 AND JANUARY 1,
2013 (RESTATED), AND FOR THE YEARS ENDED DECEMBER 31,
2015, 2014 AND 2013 (RESTATED)
(Stated in thousands of US Dollars, except otherwise indicated)
| 16. | PROPERTY, PLANT AND EQUIPMENT—NET (cont’d) |
| b/ | As of December 31, 2015, 2014 and 2013, classification per origin of technical installations is as follows: |
Year 2015
Description | Own Funds | Funds from | UA(*) | Total | ||||||||||||
Distribution | ||||||||||||||||
Distribution lines | US$ | 146,879 | US$ | 99,675 | US$ | — | US$ | 246,554 | ||||||||
Measuring instruments | 39,713 | 9,961 | — | 49,674 | ||||||||||||
Transmission centers | 32,646 | 18,489 | — | 51,135 | ||||||||||||
Substations of distribution | 4,733 | — | — | 4,733 | ||||||||||||
Telecommunications | ||||||||||||||||
Technical installations of telecommunications | 1,565 | — | 62 | 1,627 | ||||||||||||
|
|
|
|
|
|
|
| |||||||||
| US$ | 225,536 | US$ | 128,125 | US$ | 62 | US$ | 353,723 | |||||||||
|
|
|
|
|
|
|
| |||||||||
Year 2014
Description | Own Funds | Funds from | UA(*) | Total | ||||||||||||
Distribution | ||||||||||||||||
Distribution lines | US$ | 144,552 | US$ | 88,003 | US$ | — | US$ | 232,555 | ||||||||
Measuring instruments | 47,860 | 13,574 | — | 61,434 | ||||||||||||
Transmission centers | 31,272 | 17,806 | — | 49,078 | ||||||||||||
Substations of distribution | 4,683 | — | — | 4,683 | ||||||||||||
Telecommunications | ||||||||||||||||
Technical installations of telecommunications | 1,572 | — | 62 | 1,634 | ||||||||||||
|
|
|
|
|
|
|
| |||||||||
| US$ | 229,939 | US$ | 119,383 | US$ | 62 | US$ | 349,384 | |||||||||
|
|
|
|
|
|
|
| |||||||||
F-291
Table of Contents
DISTRIBUIDORA DE ELECTRICIDAD DE ORIENTE, S. A.—DEORSA
NOTES TO THE FINANCIAL STATEMENTS
AS OF DECEMBER 31, 2015, 2014 AND 2013 AND JANUARY 1,
2013 (RESTATED), AND FOR THE YEARS ENDED DECEMBER 31,
2015, 2014 AND 2013 (RESTATED)
(Stated in thousands of US Dollars, except otherwise indicated)
| 16. | PROPERTY, PLANT AND EQUIPMENT—NET (cont’d) |
Year 2013
Description | Own Funds | Funds from | UA(*) | Total | ||||||||||||
Distribution | ||||||||||||||||
Distribution lines | US$ | 136,390 | US$ | 81,455 | US$ | — | US$ | 217,845 | ||||||||
Measuring instruments | 44,147 | 17,344 | — | 61,491 | ||||||||||||
Transmission centers | 28,400 | 13,150 | — | 41,550 | ||||||||||||
Substations of distribution | 4,400 | — | — | 4,400 | ||||||||||||
Telecommunications | ||||||||||||||||
Technical installations of telecommunications | 1,523 | — | 60 | 1,583 | ||||||||||||
|
|
|
|
|
|
|
| |||||||||
| US$ | 214,860 | US$ | 111,949 | US$ | 60 | US$ | 326,869 | |||||||||
|
|
|
|
|
|
|
| |||||||||
| (*) | UA: “Units Assets” are the assets that the Company obtains with INDE’s funds. |
| c/ | At December 31, 2015, 2014 and 2013, classification per origin of other installations, machinery, tools, furniture and other fixed assets is as follows: |
Year 2015
Own Funds | UA(*) | Total | ||||||||||
Tools, furniture and equipment | US$ | 1,958 | US$ | 689 | US$ | 2,647 | ||||||
Information process equipment | 4,122 | 71 | 4,193 | |||||||||
Transportation elements | 1,340 | — | 1,340 | |||||||||
Other property, plant and equipment | 76 | 518 | 594 | |||||||||
|
|
|
|
|
| |||||||
| US$ | 7,496 | US$ | 1,278 | US$ | 8,774 | |||||||
|
|
|
|
|
| |||||||
Year 2014
Own Funds | UA(*) | Total | ||||||||||
Tools, furniture and equipment | US$ | 1,843 | US$ | 692 | US$ | 2,535 | ||||||
Information process equipment | 3,476 | 72 | 3,548 | |||||||||
Transportation elements | 1,295 | — | 1,295 | |||||||||
Other property, plant and equipment | 63 | 520 | 583 | |||||||||
|
|
|
|
|
| |||||||
| US$ | 6,677 | US$ | 1,284 | US$ | 7,961 | |||||||
|
|
|
|
|
| |||||||
F-292
Table of Contents
DISTRIBUIDORA DE ELECTRICIDAD DE ORIENTE, S. A.—DEORSA
NOTES TO THE FINANCIAL STATEMENTS
AS OF DECEMBER 31, 2015, 2014 AND 2013 AND JANUARY 1,
2013 (RESTATED), AND FOR THE YEARS ENDED DECEMBER 31,
2015, 2014 AND 2013 (RESTATED)
(Stated in thousands of US Dollars, except otherwise indicated)
| 16. | PROPERTY, PLANT AND EQUIPMENT—NET (cont’d) |
Year 2013
Own Funds | UA(*) | Total | ||||||||||
Tools, furniture and equipment | US$ | 1,598 | US$ | 670 | US$ | 2,268 | ||||||
Information process equipment | 3,004 | 69 | 3,073 | |||||||||
Transportation elements | 1,161 | — | 1,161 | |||||||||
Other property, plant and equipment | 61 | 504 | 565 | |||||||||
|
|
|
|
|
| |||||||
| US$ | 5,824 | US$ | 1,243 | US$ | 7,067 | |||||||
|
|
|
|
|
| |||||||
| (*) | UA: “Units Assets” are the assets that the Company obtains with INDE’s funds. |
| d/ | As of December 31, 2015, 2014 and 2013, classification per origin of assets under construction is as follows: |
Year 2015
Description | Works with Own Funds | Distribution | Total | |||||||||
Land and constructions | US$ | 1 | US$ | — | US$ | 1 | ||||||
Transportation | ||||||||||||
Substations | 25 | — | 25 | |||||||||
Distribution | ||||||||||||
Distribution lines | 1,459 | 56 | 1,515 | |||||||||
Measuring instruments | 589 | — | 589 | |||||||||
Transformation centers | 102 | — | 102 | |||||||||
Substation of distribution | 95 | — | 95 | |||||||||
TPI pending distribution | 134 | — | 134 | |||||||||
Other property, plant and equipment in progress | 287 | — | 287 | |||||||||
|
|
|
|
|
| |||||||
| US$ | 2,692 | US$ | 56 | US$ | 2,748 | |||||||
|
|
|
|
|
| |||||||
F-293
Table of Contents
DISTRIBUIDORA DE ELECTRICIDAD DE ORIENTE, S. A.—DEORSA
NOTES TO THE FINANCIAL STATEMENTS
AS OF DECEMBER 31, 2015, 2014 AND 2013 AND JANUARY 1,
2013 (RESTATED), AND FOR THE YEARS ENDED DECEMBER 31,
2015, 2014 AND 2013 (RESTATED)
(Stated in thousands of US Dollars, except otherwise indicated)
| 16. | PROPERTY, PLANT AND EQUIPMENT—NET (cont’d) |
Year 2014
Description | Works with | Distribution | UA(*) | Total | ||||||||||||
Land and constructions | US$ | 28 | US$ | — | US$ | — | US$ | 28 | ||||||||
Transportation | ||||||||||||||||
Substations | 60 | — | — | 60 | ||||||||||||
Distribution | — | |||||||||||||||
Distribution lines | 514 | 7,449 | — | 7,963 | ||||||||||||
Measuring instruments | 615 | — | — | 615 | ||||||||||||
Transformation centers | 343 | — | — | 343 | ||||||||||||
TPI pending distribution | 147 | 57 | 17 | 221 | ||||||||||||
Other property, plant and equipment in progress | 435 | — | — | 435 | ||||||||||||
|
|
|
|
|
|
|
| |||||||||
| US$ | 2,142 | US$ | 7,506 | US$ | 17 | US$ | 9,665 | |||||||||
|
|
|
|
|
|
|
| |||||||||
Year 2013
Description | Works with | Distribution | UA(*) | Total | ||||||||||||
Land and constructions | US$ | 57 | US$ | — | US$ | — | US$ | 57 | ||||||||
Transportation | ||||||||||||||||
Substations | 26 | — | — | 26 | ||||||||||||
Distribution | — | |||||||||||||||
Distribution lines | 931 | 5,028 | — | 5,959 | ||||||||||||
Measuring instruments | 238 | — | — | 238 | ||||||||||||
Transformation centers | 1,265 | — | — | 1,265 | ||||||||||||
Substations of distribution | 51 | — | — | 51 | ||||||||||||
Other property, plant and equipment in progress | 381 | — | — | 381 | ||||||||||||
|
|
|
|
|
|
|
| |||||||||
| US$ | 2,949 | US$ | 5,028 | US$ | — | US$ | 7,977 | |||||||||
|
|
|
|
|
|
|
| |||||||||
| (*) | UA: “Units Assets” are the assets that the Company obtains with INDE’s funds |
Depreciation expense charged to profit or loss at December 31, 2015, 2014 and 2013 is as follows:
2015 | 2014 | 2013 | ||||||||||
Property, plant and equipment constructed with own funds | US$ | 7,202 | US$ | 7,916 | US$ | 8,627 | ||||||
Property, plant and equipment constructed with funds coming from government grants | 3,294 | 3,705 | 3,750 | |||||||||
|
|
|
|
|
| |||||||
| US$ | 10,496 | US$ | 11,621 | US$ | 12,377 | |||||||
|
|
|
|
|
| |||||||
F-294
Table of Contents
DISTRIBUIDORA DE ELECTRICIDAD DE ORIENTE, S. A.—DEORSA
NOTES TO THE FINANCIAL STATEMENTS
AS OF DECEMBER 31, 2015, 2014 AND 2013 AND JANUARY 1,
2013 (RESTATED), AND FOR THE YEARS ENDED DECEMBER 31,
2015, 2014 AND 2013 (RESTATED)
(Stated in thousands of US Dollars, except otherwise indicated)
| 17. | INTANGIBLE ASSETS |
As of December 31, 2015, 2014 and 2013, this item is made up as set out below:
Year 2015
Description | Goodwill | Software | Costs of | Costs of | Total | |||||||||||||||
Cost | ||||||||||||||||||||
Balance at beginning of 2015 | US$ | 45,521 | US$ | 12,043 | US$ | 624 | US$ | 1 | US$ | 58,189 | ||||||||||
Additions | — | 644 | — | — | 644 | |||||||||||||||
Translation differences | (213 | ) | (54 | ) | (2 | ) | — | (269 | ) | |||||||||||
|
|
|
|
|
|
|
|
|
| |||||||||||
Total cost | 45,308 | 12,633 | 622 | 1 | 58,564 | |||||||||||||||
Accumulated amortization | ||||||||||||||||||||
Balance at beginning of 2015 | — | (8,837 | ) | (624 | ) | — | (9,461 | ) | ||||||||||||
Additions | — | (1,029 | ) | — | — | (1,029 | ) | |||||||||||||
Translation differences | — | 39 | 2 | — | 41 | |||||||||||||||
|
|
|
|
|
|
|
|
|
| |||||||||||
Total accumulated amortization | — | (9,827 | ) | (622 | ) | — | (10,449 | ) | ||||||||||||
|
|
|
|
|
|
|
|
|
| |||||||||||
Book value at December 31, 2015 | US$ | 45,308 | US$ | 2,806 | US$ | — | US$ | 1 | US$ | 48,115 | ||||||||||
|
|
|
|
|
|
|
|
|
| |||||||||||
Year 2014
Description | Goodwill | Software | Costs of | Costs of | Total | |||||||||||||||
Cost | ||||||||||||||||||||
Balance at beginning of 2014 | US$ | 44,101 | US$ | 10,749 | US$ | 605 | US$ | — | US$ | 55,455 | ||||||||||
Additions | — | — | — | 931 | 931 | |||||||||||||||
Transfers | — | 931 | — | (931 | ) | — | ||||||||||||||
Translations differences | 1,420 | 363 | 19 | 1 | 1803 | |||||||||||||||
|
|
|
|
|
|
|
|
|
| |||||||||||
Total cost | 45,521 | 12,043 | 624 | 1 | 58,189 | |||||||||||||||
Accumulated amortization | ||||||||||||||||||||
Balance at beginning of 2014 | — | (7,644 | ) | (605 | ) | — | (8,249 | ) | ||||||||||||
Additions | — | (929 | ) | — | — | (929 | ) | |||||||||||||
Translations differences | — | (264 | ) | (19 | ) | (283 | ) | |||||||||||||
|
|
|
|
|
|
|
|
|
| |||||||||||
Total accumulated amortization | — | (8,837 | ) | (624 | ) | — | (9,461 | ) | ||||||||||||
|
|
|
|
|
|
|
|
|
| |||||||||||
Book value at December 31, 2014 | US$ | 45,521 | US$ | 3,206 | US$ | — | US$ | 1 | US$ | 48,728 | ||||||||||
|
|
|
|
|
|
|
|
|
| |||||||||||
F-295
Table of Contents
DISTRIBUIDORA DE ELECTRICIDAD DE ORIENTE, S. A.—DEORSA
NOTES TO THE FINANCIAL STATEMENTS
AS OF DECEMBER 31, 2015, 2014 AND 2013 AND JANUARY 1,
2013 (RESTATED), AND FOR THE YEARS ENDED DECEMBER 31,
2015, 2014 AND 2013 (RESTATED)
(Stated in thousands of US Dollars, except otherwise indicated)
| 17. | INTANGIBLE ASSETS (cont’d) |
Year 2013
Description | Goodwill | Software | Costs of | Costs of | Total | |||||||||||||||
Cost | ||||||||||||||||||||
Balance at beginning of 2013 | US$ | 43,761 | US$ | 9,660 | US$ | 600 | US$ | — | US$ | 54,021 | ||||||||||
Additions | — | — | — | 1,012 | 1,012 | |||||||||||||||
Transfers | — | 1,012 | — | (1,012 | ) | — | ||||||||||||||
Translations differences | 340 | 77 | 5 | — | 422 | |||||||||||||||
|
|
|
|
|
|
|
|
|
| |||||||||||
Total cost | 44,101 | 10,749 | 605 | — | 55,455 | |||||||||||||||
Accumulated amortization | ||||||||||||||||||||
Balance at beginning of 2013 | — | (6,814 | ) | (582 | ) | — | (7,396 | ) | ||||||||||||
Additions | — | (776 | ) | (19 | ) | — | (795 | ) | ||||||||||||
Translations differences | — | (54 | ) | (4 | ) | (58 | ) | |||||||||||||
|
|
|
|
|
|
|
|
|
| |||||||||||
Total accumulated amortization | — | (7,644 | ) | (605 | ) | — | (8,249 | ) | ||||||||||||
|
|
|
|
|
|
|
|
|
| |||||||||||
Book value at December 31, 2013 | US$ | 44,101 | US$ | 3,105 | US$ | — | US$ | — | US$ | 47,206 | ||||||||||
|
|
|
|
|
|
|
|
|
| |||||||||||
During years ended at December 31, 2015, 2014 and 2013, expense from amortization was US$ 1,029, US$ 929 and US$ 795, respectively.
| 18. | OTHER RECEIVABLES |
At December 31, 2015, 2014 and 2013, other receivables is composed as follows:
2015 | 2014 | 2013 | ||||||||||
Other receivables—Long-term | ||||||||||||
Judicial bondsa/ | US$ | 227 | US$ | 1,189 | US$ | 1,152 | ||||||
Other accounts receivableb/ | 2,041 | 573 | 442 | |||||||||
|
|
|
|
|
| |||||||
| US$ | 2,268 | US$ | 1,762 | US$ | 1,594 | |||||||
|
|
|
|
|
| |||||||
Other receivables—Short-term | ||||||||||||
Advance salaries | US$ | 128 | US$ | 156 | US$ | 153 | ||||||
INDE—Trust fund transportation works | 26 | 30 | 11 | |||||||||
Other accounts receivable c/ | 1,449 | 114 | 775 | |||||||||
|
|
|
|
|
| |||||||
| US$ | 1,603 | US$ | 300 | US$ | 939 | |||||||
|
|
|
|
|
| |||||||
| a/ | Deposits carried out to the Judicial Department and the Regional Operator Entity. |
| b/ | Account receivable from INDE in the amount of US$ 1,563 corresponding to the PER grant works of distribution performed and not reimbursed by the trust at the liquidation date. Additionally, |
F-296
Table of Contents
DISTRIBUIDORA DE ELECTRICIDAD DE ORIENTE, S. A.—DEORSA
NOTES TO THE FINANCIAL STATEMENTS
AS OF DECEMBER 31, 2015, 2014 AND 2013 AND JANUARY 1,
2013 (RESTATED), AND FOR THE YEARS ENDED DECEMBER 31,
2015, 2014 AND 2013 (RESTATED)
(Stated in thousands of US Dollars, except otherwise indicated)
| 18. | OTHER RECEIVABLES (cont’d) |
| US$ 280 are included that corresponds to expenses from a tariff survey pending application and accounts receivable to Norcontrol, S. A. in the amount of US$ 198 from severance compensation paid by the Company on their behalf (Note 29c). |
| c/ | As of December 31, 2015 account receivable to Jaguar Energy due to an adjustment to the energy curve and losses related to the power guaranteed in 110 MW in accordance with the contract provisions (Note 32). |
| 19. | INVENTORY |
Stock of materials at December 31, 2015, 2014 and 2013 is as follows:
2015 | 2014 | 2013 | ||||||||||
Sundry material | US$ | 1,734 | US$ | 1,425 | US$ | 3,008 | ||||||
Less: | ||||||||||||
Provision for obsolete materials | (881 | ) | (90 | ) | (87 | ) | ||||||
|
|
|
|
|
| |||||||
| US$ | 853 | US$ | 1,335 | US$ | 2,921 | |||||||
|
|
|
|
|
| |||||||
| 20. | TAXES ASSETS AND LIABILITIES |
At December 31, 2015, 2014 and 2013, taxes assets and liabilities is composed as follows:
2015 | 2014 | 2013 | ||||||||||
Taxes receivable | ||||||||||||
Solidarity Tax—ISO, in Spanish | US$ | — | US$ | 520 | US$ | 504 | ||||||
Others | 92 | 93 | 90 | |||||||||
|
|
|
|
|
| |||||||
| US$ | 92 | US$ | 613 | US$ | 594 | |||||||
|
|
|
|
|
| |||||||
2015 | 2014 | 2013 | ||||||||||
Taxes payable | ||||||||||||
Income Tax payable (Note 14) | US$ | 1,607 | US$ | 6,643 | US$ | 772 | ||||||
Property tax (municipal levy) | 1,253 | 1,568 | 237 | |||||||||
Value Added Tax—VAT | 823 | 878 | 653 | |||||||||
Value Added Tax withholdings—VAT | 232 | 142 | 172 | |||||||||
Income Tax withholdings payable | 116 | 103 | 136 | |||||||||
Others | 13 | 390 | 3 | |||||||||
|
|
|
|
|
| |||||||
| US$ | 4,044 | US$ | 9,724 | US$ | 1,973 | |||||||
|
|
|
|
|
| |||||||
F-297
Table of Contents
DISTRIBUIDORA DE ELECTRICIDAD DE ORIENTE, S. A.—DEORSA
NOTES TO THE FINANCIAL STATEMENTS
AS OF DECEMBER 31, 2015, 2014 AND 2013 AND JANUARY 1,
2013 (RESTATED), AND FOR THE YEARS ENDED DECEMBER 31,
2015, 2014 AND 2013 (RESTATED)
(Stated in thousands of US Dollars, except otherwise indicated)
| 21. | RELATED PARTIES |
Accounts receivable and payable to related parties at December 31, 2015, 2014 and 2013 are composed by the following balances:
2015 | 2014 | 2013 | ||||||||||
Accounts receivable | ||||||||||||
Redes Eléctricas de Centroamérica, S. A.a/ | US$ | 792 | US$ | 1,756 | US$ | — | ||||||
Distribuidora de Electricidad de Occidente, S. A.b/ | 50 | 9,049 | 14 | |||||||||
DEORSA BV | — | — | 86 | |||||||||
|
|
|
|
|
| |||||||
| US$ | 842 | US$ | 10,805 | US$ | 100 | |||||||
|
|
|
|
|
| |||||||
2015 | 2014 | 2013 | ||||||||||
Accounts payable | ||||||||||||
Distribuidora de Electricidad de Occidente, S. A. | US$ | 124 | US$ | — | US$ | — | ||||||
Comercializadora Guatemalteca Mayorista de Electricidad, S.A. | 57 | — | — | |||||||||
|
|
|
|
|
| |||||||
| US$ | 181 | US$ | — | US$ | — | |||||||
|
|
|
|
|
| |||||||
| a/ | As of December 31, 2015 and 2014, it corresponds to the debt of RECSA for billing of works performed on their behalf. |
| b/ | Account receivable from Distribuidora de Electricidad de Occidente, S. A. corresponding to cash transfers delivered which are supported by a promissory note that does not accrue interests and is renewed monthly. This amount was collected during 2015. |
The amounts outstanding are unsecured and will be settled in cash. No guarantees have been given or received. No expense has been recognized in the current or prior years for bad or doubtful debts in respect of the amounts owed by related parties.
F-298
Table of Contents
DISTRIBUIDORA DE ELECTRICIDAD DE ORIENTE, S. A.—DEORSA
NOTES TO THE FINANCIAL STATEMENTS
AS OF DECEMBER 31, 2015, 2014 AND 2013 AND JANUARY 1,
2013 (RESTATED), AND FOR THE YEARS ENDED DECEMBER 31,
2015, 2014 AND 2013 (RESTATED)
(Stated in thousands of US Dollars, except otherwise indicated)
| 21. | RELATED PARTIES (cont’d) |
Main transactions among related parties are as follows:
2015 | 2014 | 2013 | ||||||||||
Loans to related parties | ||||||||||||
Distribuidora de Electricidad de Occidente, S.A. | US$ | 61 | US$ | 8,907 | US$ | 20,645 | ||||||
|
|
|
|
|
| |||||||
Toll billing | ||||||||||||
Comercializadora Guatemalteca Mayorista de Electricidad, S.A. | US$ | 927 | US$ | 1,518 | US$ | 2,098 | ||||||
|
|
|
|
|
| |||||||
Purchase of materials | ||||||||||||
Distribuidora de Electricidad de Occidente, S.A. | US$ | 459 | US$ | 527 | US$ | 1,154 | ||||||
|
|
|
|
|
| |||||||
Sale of materials | ||||||||||||
Distribuidora de Electricidad de Occidente, S.A. | US$ | 400 | US$ | 500 | US$ | 754 | ||||||
|
|
|
|
|
| |||||||
Redes Eléctricas de Centroamérica, S. A. | US$ | — | US$ | — | US$ | 2 | ||||||
|
|
|
|
|
| |||||||
Toll services | ||||||||||||
Redes Eléctricas de Centroamérica, S. A. RECSA Toll of secondary system in distribution lines | US$ | 398 | US$ | 76 | US$ | 40 | ||||||
|
|
|
|
|
| |||||||
Billing of performed works | ||||||||||||
Redes Eléctricas de Centroamérica, S. A. RECSA | US$ | — | US$ | 2,449 | US$ | 1,052 | ||||||
|
|
|
|
|
| |||||||
Distribuidora de Electricidad de Occidente, S.A. | US$ | 733 | US$ | — | US$ | — | ||||||
|
|
|
|
|
| |||||||
Operating fee | ||||||||||||
Arthasan, S.A.a/ | US$ | 2,600 | US$ | 1,762 | US$ | 1,888 | ||||||
|
|
|
|
|
| |||||||
Energy supplied to substations | ||||||||||||
Redes Eléctricas de Centroamérica, S. A. RECSA | US$ | 16 | US$ | 34 | US$ | 1 | ||||||
|
|
|
|
|
| |||||||
Leasing of vehicles | ||||||||||||
Comercializadora Guatemalteca Mayorista de Electricidad, S.A. | US$ | 153 | US$ | — | US$ | — | ||||||
|
|
|
|
|
| |||||||
Purchase of vehicles to: | ||||||||||||
Comercializadora Guatemalteca Mayorista de Electricidad, S.A. | US$ | 10 | US$ | — | US$ | — | ||||||
|
|
|
|
|
| |||||||
| a/ | Contract of management and administration services and supervision services for the businesses of the Company. In January 2016 this contract was rescinded (Note 35). |
DEORSA’s executive officers do not receive compensation directly from DEORSA; each is also an executive officer of Arthasan, S. A. and receives compensation directly from Arthasan, S. A. The aggregate annual compensation expenses related to DEORSA executive officers during 2015, 2014 and 2013 were US$ 2,600, US$ 1,762 and US$ 1,888, respectively.
F-299
Table of Contents
DISTRIBUIDORA DE ELECTRICIDAD DE ORIENTE, S. A.—DEORSA
NOTES TO THE FINANCIAL STATEMENTS
AS OF DECEMBER 31, 2015, 2014 AND 2013 AND JANUARY 1,
2013 (RESTATED), AND FOR THE YEARS ENDED DECEMBER 31,
2015, 2014 AND 2013 (RESTATED)
(Stated in thousands of US Dollars, except otherwise indicated)
| 22. | CASH AND CASH EQUIVALENTS |
At December 31, 2015, 2014 and 2013 cash and cash equivalents’ balance is composed as follows:
2015 | 2014 | 2013 | ||||||||||
Balances in local banks | US$ | 35,488 | US$ | 23,691 | US$ | 39,275 | ||||||
Cash | 561 | 788 | 607 | |||||||||
|
|
|
|
|
| |||||||
| US$36,049 | US$ | 24,479 | US$39,882 | |||||||||
|
|
|
|
|
| |||||||
| 23. | CAPITAL STOCK |
At the date of its incorporation, the authorized capital of the Company was US$ 14,373,838 (Q. 95,000,000) represented by common shares with a face value of US$ 0.13 (Q. 1) each, out of which 21,350 shares were subscribed and paid. At the extraordinary general shareholders’ meeting held on December 4, 1998 it was agreed that the Company’s authorized capital was increased in US$ 27,068,565 (Q. 180,000,000), consequently, its authorized capital amounted up to US$ 41,442,402 (Q. 275,000,000).
According to Deed AG-003-007 dated October 24, 2009, the general shareholders’ meeting approved the reduction of the share capital subscribed and paid through the decrease of the face value of the entity’s shares. The new face value per share turned into US$ 0.07 (Q. 0.50) instead of US$ 0.13 (Q. 1). Based on the reduction of the face value, the authorized capital was modified in US$ 41,442,402 (Q. 275,000,000), represented by 550,000,000 common, nominal or bearer shares.
At the General Shareholders’ Meeting held on June 17, 2011, it was agreed to increase the entity’s authorized capital in US$ 3,882,142 (Q. 30,033,496) and the same was formalized through public deed no. 7 dated October 3, 2011. As a result, the subscribed and paid capital increased in US$ 44,017,692 (Q. 305,033,496), divided into and represented by 610,066,991 common shares with a value of US$ 0.07 (Q. 0.50) each.
Distribution of shares at December 31, 2015, 2014 and 2013 in proportion to the shareholders is as follows:
Shareholders of DEORSA | Sharing | Amounts | Number of | |||||||||
Deorsa B.V. | 92.70 | % | US$ | 40,804,401 | 565,560,823 | |||||||
Remaining shareholders | 7.30 | % | 3,213,292 | 44,506,165 | ||||||||
|
|
|
|
|
| |||||||
| 100 | % | US$ | 44,017,692 | 610,066,991 | ||||||||
|
|
|
|
|
| |||||||
The shares of the Company are in collateral and fiduciary guarantee of the loan with Banco Agromercantil de Guatemala, S.A. (Note 24).
F-300
Table of Contents
DISTRIBUIDORA DE ELECTRICIDAD DE ORIENTE, S. A.—DEORSA
NOTES TO THE FINANCIAL STATEMENTS
AS OF DECEMBER 31, 2015, 2014 AND 2013 AND JANUARY 1,
2013 (RESTATED), AND FOR THE YEARS ENDED DECEMBER 31,
2015, 2014 AND 2013 (RESTATED)
(Stated in thousands of US Dollars, except otherwise indicated)
| 23. | CAPITAL STOCK (cont’d) |
Through the annual ordinary general shareholders’ meeting held on April 27, 2015 the distribution of dividends was agreed, which was approved in deed no. AG001-2015. The dividends declared to their distribution to the shareholders were in the amount of US$ 34,049.
| 24. | DEBT WITH FINANCIAL ENTITIES |
Debt balances with credit entities at December 31, 2015, 2014 and 2013 were as follows:
2015 | 2014 | 2013 | ||||||||||
Banco Agromercantil de Guatemala, S. A.a/ | US$ | 111,566 | US$ | 103,353 | US$ | 122,971 | ||||||
Less-Short-term portion b/ | (14,786 | ) | (21,807 | ) | (27,559 | ) | ||||||
|
|
|
|
|
| |||||||
Long-term debt with financial entities | US$ | 96,780 | US$ | 81,546 | US$ | 95,412 | ||||||
|
|
|
|
|
| |||||||
| a/ | Syndicated loan in the amount of US$ 90,453 (original amount) and of US$ 41,093 (original amount) with pledged collateral on Company own shares and fiduciary guarantee formalized on May 18, 2011 at a 10-year term. The interest of the portion in dollars will be established at the fixed rate of 6.00% for the first two years (from May 19, 2011 until May 18, 2013) and at a US LIBOR rate for three more months plus a spread of 4.70% for the following operating years (since May 19, 2013 onwards). The portion in quetzals accrues an annual variable interest rate calculated by the Active Weighted Average Rate less 5.6%. The loan matures on May 19, 2021. |
In April 2015 an additional provision was carried out regarding the syndicated long-term debt in the amount of US$ 21,000 (original amount) and of US$ 9,139 (original amount) with pledged collateral and fiduciary guarantee formalized on April 28, 2015 at a 10-year term and quarterly amortizations since May 19, 2018 for the portion in dollars and quetzals. The interest of the portion in dollars will be at a US LIBOR rate for three more months plus an annual spread of 4.70%, establishing a floor rate of 5.90% for the first year (April 28, 2015 to April 28, 2016) and a US rate LIBOR 3 months plus a margin of 4.75% per annum, establishing a floor rate of 6.0% for the remaining nine years of the loan. The portion in quetzals accrues an annual variable interest rate calculated by the Active Weighted Average Rate less 6.10%. The loan matures on February 19, 2025.
F-301
Table of Contents
DISTRIBUIDORA DE ELECTRICIDAD DE ORIENTE, S. A.—DEORSA
NOTES TO THE FINANCIAL STATEMENTS
AS OF DECEMBER 31, 2015, 2014 AND 2013 AND JANUARY 1,
2013 (RESTATED), AND FOR THE YEARS ENDED DECEMBER 31,
2015, 2014 AND 2013 (RESTATED)
(Stated in thousands of US Dollars, except otherwise indicated)
| 24. | DEBT WITH FINANCIAL ENTITIES (cont’d) |
This loan includes the participation of several banks, being appointed Banco Agromercantil de Guatemala, S.A. as the manager of the Guarantee and Administration trust of the syndicated loan; the following banks are also participating with the following contribution in thousands of Dollars:
2015 | 2014 | 2013 | ||||||||||
Bancolombia Panamá, S.A. | US$ | 28,308 | US$ | 35,782 | US$ | 42,887 | ||||||
Banco Industrial, S.A. | 29,777 | 24,985 | 28,440 | |||||||||
Banco G&T Continental, S.A. | 18,474 | 18,407 | 22,505 | |||||||||
Banco Agromercantil de Guatemala, S.A. | 17,021 | 8,471 | 11,178 | |||||||||
Mercom Bank Limited | 5,392 | 4,008 | 4,624 | |||||||||
Banco Reformador, S.A. | 5,029 | 4,401 | 4,967 | |||||||||
GTC Bank Inc. | 3,250 | 2,787 | 3,216 | |||||||||
Westrust Bank (International) Limited. | 2,359 | 2,787 | 3,216 | |||||||||
Banco Internacional S. A. | 1,956 | 1,725 | 1,938 | |||||||||
|
|
|
|
|
| |||||||
Total bank loans | US$ | 111,566 | US$ | 103,353 | US$ | 122,971 | ||||||
|
|
|
|
|
| |||||||
| b/ | At December 31, 2014 and 2013 within the short-term portion information related to the revolving credit line is included. |
OBLIGATIONS:
Financial Information:
| a) | Without exceeding 120 days after the fiscal year-end, individual and combined financial statements audited for Distribuidora de Electricidad de Oriente, S.A. and Distribuidora de Electricidad de Occidente, S.A. (related party) with a report and the independent auditor’s report. |
| b) | Without exceeding 60 days after each quarterly period, internal financial statements—individual and combined in a comparative manner regarding the previous fiscal quarter—for Distribuidora de Electricidad de Oriente, S.A. and Distribuidora de Electricidad de Occidente, S.A. (related party). |
| c) | Without exceeding 15 days before fiscal year-end, an annual business and budget plan, including forecasts prepared by the management. |
F-302
Table of Contents
DISTRIBUIDORA DE ELECTRICIDAD DE ORIENTE, S. A.—DEORSA
NOTES TO THE FINANCIAL STATEMENTS
AS OF DECEMBER 31, 2015, 2014 AND 2013 AND JANUARY 1,
2013 (RESTATED), AND FOR THE YEARS ENDED DECEMBER 31,
2015, 2014 AND 2013 (RESTATED)
(Stated in thousands of US Dollars, except otherwise indicated)
| 24. | DEBT WITH FINANCIAL ENTITIES (cont’d) |
Social and Environmental Requirements
| a) | Notify any action or process against, or non-compliance issues with, the Environmental Law or Permits that could reasonably have an adverse material effect. |
Notices:
| a) | Notify within the five working days subsequent to receiving any correspondence from any governmental authority related with the investigation or possible investigation or other survey carried out by such office on any tax matter. |
| b) | Notify within the next sixty days subsequent to receiving any correspondence regarding a formal notice of evaluation or claim of a tax obligation or a court order. |
| c) | Notify within the next five working days subsequent to the occurrence of any matter resulting or that could reasonably result in an adverse material effect, of any material change in the accounting policies or reporting practices, of the use or disposal of any property or asset for which a mandatory advanced payment would have to be executed in conformity with Section 2.03 (b)(i) of the bank loan contract, or of the sale of capital shares or other capital interests for which the debtor would have to perform a mandatory advanced payment. |
Property Maintenance:
| a) | Maintain, preserve and take care of material property and necessary equipment for the optimum performance of the business, except for the normal wear. |
Insurance Maintenance:
| a) | Maintain valid insurance policies with respect to property and businesses; protect them against losses or damages as other similar companies do. |
Interest Rate Protection:
| a) | Sign in relation with the loans with a LIBOR rate, no more than two years after signing the loan contract (May 19, 2011), interest rate hedging contracts of at least 90% of the debt amount in the first five years of the credit. At December 31, 2015, 2014 and 2013, the Company has a financial instrument of interest rate hedging—swap with Bancolombia Panamá, S.A. (Note 25). |
F-303
Table of Contents
DISTRIBUIDORA DE ELECTRICIDAD DE ORIENTE, S. A.—DEORSA
NOTES TO THE FINANCIAL STATEMENTS
AS OF DECEMBER 31, 2015, 2014 AND 2013 AND JANUARY 1,
2013 (RESTATED), AND FOR THE YEARS ENDED DECEMBER 31,
2015, 2014 AND 2013 (RESTATED)
(Stated in thousands of US Dollars, except otherwise indicated)
| 24. | DEBT WITH FINANCIAL ENTITIES (cont’d) |
OTHER OBLIGATIONS:
Levies:
| a) | Do not sign contracts that establish rights, rights of access, restrictions, and other similar levies or burdens that affect the assets of the Company. |
Indebtedness:
| a) | Do not borrow amounts in addition to that set out in the original loan contract. |
Financial Agreements:
During the validity of the loan, the Company has to comply with:
| a) | Combined cash flow hedging of Distribuidora de Electricidad de Oriente, S.A. and Distribuidora de Electricidad de Occidente, S.A. (related party): greater than or equal 1.30:1.00, which results from the sum of EBITDA, working capital, taxes, and cash, everything within the financial debt. |
| b) | Combined leverage ratio of Distribuidora de Electricidad de Oriente, S.A. and Distribuidora de Electricidad de Occidente, S.A. (related party): Must be measured and not be greater than the ratio established as follows: |
Measurement Date | Maximum Ratio of | |||
December 31, 2014 | 4.5:1.0 | |||
December 31, 2015 | 4.2:1.0 | |||
December 31, 2016 | 3.5:1.0 | |||
December 31, 2017 | 3.5:1.0 | |||
December 31, 2018 | 3.5:1.0 | |||
December 31, 2019 | 3.5:1.0 | |||
December 31, 2020 | 3.5:1.0 | |||
The maximum combined leverage ratio of Distribuidora de Electricidad de Oriente, S.A. and Distribuidora de Electricidad de Occidente, S.A. (related party) is the result of the sum of the financial debt less cash divided into EBITDA.
According to the loan contract, the calculation of the abovementioned ratios is carried out over a combined basis, which includes the figures of Distribuidora de Electricidad de Oriente, S.A. and Distribuidora de Electricidad de Occidente, S.A. (related party). During 2015, 2014 and 2013 there was no infringement on said financial agreements.
F-304
Table of Contents
DISTRIBUIDORA DE ELECTRICIDAD DE ORIENTE, S. A.—DEORSA
NOTES TO THE FINANCIAL STATEMENTS
AS OF DECEMBER 31, 2015, 2014 AND 2013 AND JANUARY 1,
2013 (RESTATED), AND FOR THE YEARS ENDED DECEMBER 31,
2015, 2014 AND 2013 (RESTATED)
(Stated in thousands of US Dollars, except otherwise indicated)
| 24. | DEBT WITH FINANCIAL ENTITIES (cont’d) |
Capital Expenses:
Capital expenses in the normal course of the business that do not exceed, in the aggregate for the Borrower during every fiscal year, an amount equivalent to 15% from the amount established in the annual business and budget plan submitted according to Section 6.01 (c) of the Borrower regarding investment intended for said economic year, and such amount of capital invested in excess of the allowed amount that can be accepted for most of the Lenders.
The loan agreement sets out in clause 7.06 that the payment of dividends will be considered as Restrained Payments (that could not be executed) if the Company might be in any of the following situations:
| a) | In a non-compliance situation (from the engagement of the loan contract). |
| b) | If the Company is obliged to deposit certain amount of money in the Tax Contingency Account. |
| c) | Whether the amount in the Legal Dispute Contingencies Account were less than the amount in the Legal Dispute Contingencies Assessment. |
| d) | Only in relation with the Restrained Payments made during the fiscal year ended at December 31, 2015. Such Restrained Payments must not surpass the sum of the net benefits of the Borrower in the fiscal year ended at December 2014, plus the retained earnings of that same fiscal year. |
| e) | Only with respect to the Restrained Payments made during the fiscal year ended at December 31, 2016. Such Restrained Payments must not surpass the sum of the net benefits of the fiscal year ended at December 31, 2015, in addition to the accumulated earnings during that same year. The change in the nature of the business or the participation in any business line substantially different from business lines carried out on May 19, 2011 or any business substantially related or additional to the same. |
| 25. | OTHER FINANCIAL OBLIGATIONS |
As of December 31, 2015, 2014 and 2013, balances of the other financial obligations were as follows:
2015 | 2014 | 2013 | ||||||||||
Current | US$ | 219 | US$ | 430 | US$ | 574 | ||||||
Non-current | — | 181 | 220 | |||||||||
|
|
|
|
|
| |||||||
Interest rate hedging—swap | US$ | 219 | US$ | 611 | US$ | 794 | ||||||
|
|
|
|
|
| |||||||
Derived from one of the clauses of the debt with financial entities described in note 24, the Company is obliged to engage an interest rate hedging as an interest rate protection. To comply with such clause, a swap agreement was signed with Bancolombia, S. A.
F-305
Table of Contents
DISTRIBUIDORA DE ELECTRICIDAD DE ORIENTE, S. A.—DEORSA
NOTES TO THE FINANCIAL STATEMENTS
AS OF DECEMBER 31, 2015, 2014 AND 2013 AND JANUARY 1,
2013 (RESTATED), AND FOR THE YEARS ENDED DECEMBER 31,
2015, 2014 AND 2013 (RESTATED)
(Stated in thousands of US Dollars, except otherwise indicated)
| 25. | OTHER FINANCIAL OBLIGATIONS (cont’d) |
The purpose of the cash flow hedge is to protect the future cash flows that might be susceptible of significant variations as a result of the variations that might achieve the LIBOR interest rate. The interest rate swap is recorded at their fair value at the end of the reporting period; the fair value is determined by discounting the future cash flows for the fixed leg as for the floating leg and according to the terms and conditions of the swap agreement using the curves at the end of the reporting period and disclosed in note 34.
The change effect in the fair value of the swap agreement was a loss (gain) recognized in other comprehensive income of 2015, 2014 and 2013 by US$ 287, US$ 276 and US$ (712) , respectively, less the deferred Income Tax of US$ 72, US$ 69 and US$ 188, respectively. The following table describe the main details of the swap agreement signed with Bancolombia S. A.:
TRANSACTION TYPE | INTEREST RATE HEDGING | |
Currency for payment | US$ | |
Notional amount | 2,310 US$ | |
TERMS | ||
Transaction date | May 18 2012 | |
Effective date | May 20 2013 | |
Termination date | May 19 2016 | |
FIXED AMOUNTS | ||
Fixed rate payer | Distribuidora de Electricidad de Oriente, S.A. | |
Payment dates | August 19, November, February and May of each year beginning on August 19, 2013 until and including the termination date. | |
Fixed rate | 5.95% | |
FLOATING AMOUNTS | ||
Floating amount payer | Bancolombia Panamá, S.A. | |
Payment dates | August 19, November, February and May of each year beginning on August 19, 2013 until and including the termination date. | |
Floating rate for initial calculation | Two days before the effective date from London banks | |
Floating rate option | US$ LIBOR-BBA | |
Defined maturity | 3 months | |
Spread | 4.70% | |
Determined floating rate | Two days before the readjustment date from London banks. | |
Readjustment dates | First day of each calculation period. | |
F-306
Table of Contents
DISTRIBUIDORA DE ELECTRICIDAD DE ORIENTE, S. A.—DEORSA
NOTES TO THE FINANCIAL STATEMENTS
AS OF DECEMBER 31, 2015, 2014 AND 2013 AND JANUARY 1,
2013 (RESTATED), AND FOR THE YEARS ENDED DECEMBER 31,
2015, 2014 AND 2013 (RESTATED)
(Stated in thousands of US Dollars, except otherwise indicated)
| 26. | DEFERRED REVENUES |
As of December 31, 2015, 2014 and 2013, the Company had received accumulated government grants in the amount of US$126,144, US$122,693 and US$108,725, respectively. The balance of deferred revenues as of those dates is US$71,982, US$71,591 and US$62,878 respectively, net of accumulated revenue recognized in profit or loss of US$(54,162), US$(51,102) and US$(45,847) respectively. Balances and movements of the deferred revenues are shown as follows:
2015 | 2014 | 2013 | ||||||||||
Balance at the beginning of the year | US$122,120 | US$ | 112,226 | US$ | 103,747 | |||||||
Government grants received during the year (Note 31) | 4,012 | 10,280 | 4,967 | |||||||||
Translation differences | 12 | 187 | 11 | |||||||||
|
|
|
|
|
| |||||||
Total deferred revenues at year end | 126,144 | 122,693 | 108,725 | |||||||||
|
|
|
|
|
| |||||||
Less—Accumulated accrued revenues | ||||||||||||
Balance at the beginning of the year | (50,863 | ) | (47,324 | ) | (42,089 | ) | ||||||
Accrued revenues for the year (Note 7) | (3,289 | ) | (3,711 | ) | (3,750 | ) | ||||||
Translation differences | (10 | ) | (67 | ) | (8 | ) | ||||||
|
|
|
|
|
| |||||||
Accumulated accrued revenues at year-end | (54,162 | ) | (51,102 | ) | (45,847 | ) | ||||||
|
|
|
|
|
| |||||||
Deferred revenues, net | US$ | 71,982 | US$ | 71,591 | US$ | 62,878 | ||||||
|
|
|
|
|
| |||||||
| 27. | PROVISIONS |
At December 31, 2015, 2014 and 2013 balances of the provision were as follows:
2015 | 2014 | 2013 | ||||||||||
Provision for contingenciesa/ | US$ | 5,309 | US$ | 9,632 | US$ | 10,272 | ||||||
Provision for severance compensationb/ | 2,112 | 1,865 | 1,703 | |||||||||
|
|
|
|
|
| |||||||
| US$ | 7,421 | US$ | 11,497 | US$ | 11,975 | |||||||
|
|
|
|
|
| |||||||
| a/ | Provisions recorded by the Company at December 31, 2015, 2014 and 2013 correspond mainly to penalties imposed by the National Electric Energy Commission, as well as unfavorable judgments in litigations (Note 30). |
F-307
Table of Contents
DISTRIBUIDORA DE ELECTRICIDAD DE ORIENTE, S. A.—DEORSA
NOTES TO THE FINANCIAL STATEMENTS
AS OF DECEMBER 31, 2015, 2014 AND 2013 AND JANUARY 1,
2013 (RESTATED), AND FOR THE YEARS ENDED DECEMBER 31,
2015, 2014 AND 2013 (RESTATED)
(Stated in thousands of US Dollars, except otherwise indicated)
| 27. | PROVISIONS (cont’d) |
The movement of the account for 2015, 2014 and 2013 is shown as follows:
2015 | 2014 | 2013 | ||||||||||
Balance at January 1st | US$ | 9,632 | US$ | 10,272 | US$ | 10,087 | ||||||
Payments | (459 | ) | (514 | ) | (815 | ) | ||||||
Reversal of provision (Note 13) | (4,040 | ) | (793 | ) | (284 | ) | ||||||
Provisions | 232 | 345 | 1,282 | |||||||||
Translations differences | (56 | ) | 322 | 2 | ||||||||
|
|
|
|
|
| |||||||
Balance at December 31st | US$ | 5,309 | US$ | 9,632 | US$ | 10,272 | ||||||
|
|
|
|
|
| |||||||
| b/ | As indicated in Note 3m, the Company pays universal severance pay compensation on the described basis, plus the half part of an additional salary only for employees adhered to the collective agreement (former INDE’s employees). |
The movement of the account is shown as follows:
2015 | 2014 | 2013 | ||||||||||
Balance at January 1st | US$ | 1,865 | US$ | 1,703 | US$ | 1,875 | ||||||
Payments | (418 | ) | (705 | ) | (414 | ) | ||||||
Actuarial calculation | 673 | 797 | 241 | |||||||||
Translations differences | (8 | ) | 70 | 1 | ||||||||
|
|
|
|
|
| |||||||
Balance at December 31st | US$ | 2,112 | US$ | 1,865 | US$ | 1,703 | ||||||
|
|
|
|
|
| |||||||
The following assumptions were used to assess the liabilities of the benefits covered by the plan:
Valuation date | December 31, 2015 | |
Discount rate | 8.19% for obligations | |
Salaries increase | 5.00%, annual | |
Inflation | Not reflected specifically in the calculation, besides the salaries increase | |
Mortality | CSG-1960 | |
Disability | No considerations | |
Leave rate | Calculated according to the experience shown by the Company—1.62% | |
Dismissal rate | Percentage corresponding to dismissals without justified cause (94.8%) | |
Expenses | Not considered | |
Retirement age | 65 years old for all employees | |
Form of payment | Unique payment in case of leave either by dismissal or death |
F-308
Table of Contents
DISTRIBUIDORA DE ELECTRICIDAD DE ORIENTE, S. A.—DEORSA
NOTES TO THE FINANCIAL STATEMENTS
AS OF DECEMBER 31, 2015, 2014 AND 2013 AND JANUARY 1,
2013 (RESTATED), AND FOR THE YEARS ENDED DECEMBER 31,
2015, 2014 AND 2013 (RESTATED)
(Stated in thousands of US Dollars, except otherwise indicated)
| 28. | OTHER LIABILITIES |
At December 31, 2015, 2014 and 2013, others liabilities are made up as follows:
2015 | 2014 | 2013 | ||||||||||
Accumulated interests from deposits received from consumers | US$ | 12,043 | US$ | 9,532 | US$ | 7,127 | ||||||
Principal from deposits received from consumers | 11,179 | 9,999 | 8,555 | |||||||||
Others | 1,845 | 1,393 | 2,663 | |||||||||
|
|
|
|
|
| |||||||
| US$ | 25,067 | US$ | 20,924 | US$ | 18,345 | |||||||
|
|
|
|
|
| |||||||
| 29. | TRADE AND OTHER ACCOUNTS PAYABLES |
At December 31, 2015, 2014 and 2013, trade and other accounts payables with suppliers are as follows:
2015 | 2014 | 2013 | ||||||||||
Energy suppliers | US$ | 27,083 | US$ | 20,304 | US$ | 28,779 | ||||||
Services suppliers | 9,034 | 9,083 | 14,857 | |||||||||
Others | 250 | 860 | 62 | |||||||||
|
|
|
|
|
| |||||||
| US$ | 36,367 | US$ | 30,247 | US$ | 43,698 | |||||||
|
|
|
|
|
| |||||||
| 30. | CONTINGENCIES |
The Company is subject to certain contingent liabilities with respect to existing or potential claims, lawsuits and other proceedings. The Company accrues liabilities when it considers probable that future disbursements will be incurred and such amounts can be reasonably estimated. The related reserve is based on developments to date and historical information related to actions filed against the Company. As of December 31, 2015, 2014 and 2013 the Company had established reserves for contingencies of US$ 5,309, US$ 9,632 and US$ 10,272, respectively, to cover legal actions against the Company in which its Management has assessed the likelihood of a final adverse outcome as probable. A description of the main contingent liabilities is detailed below and in Note 35.
| 1. | Regulatory and Legal Proceedings |
As of December 31, 2015, 2014 and 2013, the Company has legal processes originated from carrying on its investing plans and its own line of business (Note 27), which include the following:
| 1. | Sanction processes initiated by the National Energy Electric Commission (CNEE) in an aggregate amount as of December 31, 2015, 2014 and 2013, up to US$ 3,835, US$ 4,007 and US$ 3,883, respectively. Based on the current legal framework, the Company is required to pay the CNEE penalties for non-compliance of the article 134 of the General Electricity Law and its Regulations. A provision as of December 31, 2105, 2014 and 2013 amounting US$ 2,573, US$ 3,998 and |
F-309
Table of Contents
DISTRIBUIDORA DE ELECTRICIDAD DE ORIENTE, S. A.—DEORSA
NOTES TO THE FINANCIAL STATEMENTS
AS OF DECEMBER 31, 2015, 2014 AND 2013 AND JANUARY 1,
2013 (RESTATED), AND FOR THE YEARS ENDED DECEMBER 31,
2015, 2014 AND 2013 (RESTATED)
(Stated in thousands of US Dollars, except otherwise indicated)
| 30. | CONTINGENCIES (cont’d) |
| US$ 3,874, respectively, was recorded related to sanctions in the Administrative Contentious and Revoke instance that based on the Company’s management and its legal department’s considerations, an adverse outcome from these claims are probable. |
| 2. | Sanction processes initiated by the National Energy Electric Commission in an aggregate amount up to US$ 5,536, US$ 5,228 and US$ 5,848, for 2015, 2014 and 2013 respectively. The CNEE establishes minimum levels of quality for electricity services. In addition, the CNEE imposes certain obligations on distribution companies related to required quality levels, and establishes fines for failure to comply with such quality levels and other obligations that should be compensated to users. Sanctions included herein relates to failure of quality parameters of the supplied electricity (tension, frequency and disturbances), and minimum standards for customer service. There is a provision recorded that amounts up to US$ 1,860, US$ 1,869 and US$ 2,728, respectively, that supports the processes with probable adverse outcome according to Company´s management and its legal advisors. |
| 3. | Civil petitions submitted by third parties for damages and several injuries to the Company in the amounts of US$ 11,204, US$ 16,451 and US$ 2,718. For this purpose there is a provision recorded amounting up to US$ 229, US$ 2,805 and US$ 2,718 for 2015, 2014 and 2013 that supports the processes with a probable unfavorable outcome. |
| 4. | Administrative Contentious Processes: the Company deals with Administrative Contentious Processes, most against resolutions issued by the CNEE amounting US$ 746, US$ 788 and US$ 294 because of failures in quality service. There is a provision recorded amounting up to US$ 286, US$ 304 and US$ 294 that supports the processes with a probable unfavorable outcome. |
| 2. | Fiscal |
As of December 31, 2015, 2014 and 2013, the Company has claims from the Tax Administration Superintendence (SAT, in Spanish) of additional taxes and fines related to tax obligations regarding Income Tax. The amount of the adjustments on omitted taxes corresponding to probable contingencies amounts up to US$ 453, US$ 658 and US$ 637, respectively. For this purpose, there is provision recorded amounting up to US$ 453, US$ 658 and US$ 637, respectively, that supports the processes which are probable to obtain an unfavorable sentence (Note 27).
| 3. | Other—Appluss Norcontrol, S.L.U. |
Sanction processes initiated by the National Electric Energy Commission—CNEE amounting up to US$ 498 have imposed to Distribuidora de Electricidad de Oriente, S. A., and sanctions on supposed non-compliance with measurement and quality control standards of the technical product.
These sanctions were imposed to the Company, however, they are attributable to Norcontrol Guatemala, S.A, (Contractor) which is the entity engaged to carry out the works of measurement and quality control
F-310
Table of Contents
DISTRIBUIDORA DE ELECTRICIDAD DE ORIENTE, S. A.—DEORSA
NOTES TO THE FINANCIAL STATEMENTS
AS OF DECEMBER 31, 2015, 2014 AND 2013 AND JANUARY 1,
2013 (RESTATED), AND FOR THE YEARS ENDED DECEMBER 31,
2015, 2014 AND 2013 (RESTATED)
(Stated in thousands of US Dollars, except otherwise indicated)
| 30. | CONTINGENCIES (cont’d) |
of the technical product. As of December 31, 2015, 2014 and 2013 and based on the legal advisors’ opinion, the status is still pending sentence, submission of evidence or litigation.
Additionally, on July 27, 2007 the Company held an agreement with the company Applus Norcontrol, S.L.U., where the latter acts as the guarantor of the obligations of its subsidiary Norcontrol Guatemala, S.A. and as a result, promissory notes were issued that are still valid and guarantee the amount of the possible fines on the sanctions to be submitted by the Regulatory Entity to the Company and will be used to pay any fines, when the respective legal resources are exhausted. As a consequence, no provision has been recognized regarding these processes.
| 4. | Arbitration in Equality INDE |
As of December 31, 2015 there is a process of arbitration in equality encouraged by the Company due to the termination of the Trust Fund Contract and the Work Construction Contract of the Rural Electrification Project (PER, in Spanish). In this process, the Company requires to the National Electrification Institute (INDE, in Spanish) the payment of services provided for the construction of works in an amount of US$ 2,690, as well as the reception of the construction works.
On the other hand, INDE submitted a claim indicating that the infringement of the contract concerns the Company and requires the payment and the refund of advances amounting up to US$ 5,248. Likewise, it requires that pertaining access rights are constituted and that a payment on damages, due to the alleged failure in the constitution of access rights for the construction of transmission lines, is performed.
According to the estimate of the management and based on the respective legal analysis, the net probable compensation claim payment to INDE for the construction of transmission works that finally were not performed is up to US$ 906 and the probable amount of recovery of work on distribution already done is US$ 1,563 as of December 31, 2015, respectively, since the Company has the supporting documentation to demonstrate the dynamic actions in the construction of access rights, as well as the documentation in cases of force majeure. The probable amount of net payment on transmission work not performed and collection for refunds of distribution work performed is recorded in the financial statements at December 31, 2015 and 2014 in an amount of US$ 906 and US$ 1,563 respectively (Notes 28 and 18).
F-311
Table of Contents
DISTRIBUIDORA DE ELECTRICIDAD DE ORIENTE, S. A.—DEORSA
NOTES TO THE FINANCIAL STATEMENTS
AS OF DECEMBER 31, 2015, 2014 AND 2013 AND JANUARY 1,
2013 (RESTATED), AND FOR THE YEARS ENDED DECEMBER 31,
2015, 2014 AND 2013 (RESTATED)
(Stated in thousands of US Dollars, except otherwise indicated)
| 30. | CONTINGENCIES (cont’d) |
As of December 31, 2015, 2014 and 2013 the Company is subject to certain legal actions that the Company’s Management and its legal counsel consider to be possible that a future disbursement will be incurred for an aggregate amount up to US$ 22,625, US$ 24,054 and US$ 14,699 respectively. No loss amount has been accrued for such possible legal actions, the most significant of which (individually or in the aggregate) are described below:
| 1. | Compensations for Technical Service Quality |
Based on the current legal framework, the Company is obliged to compensate its customers for failures in technical service quality. The CNEE establishes parameters for continuity (number and length of interruptions) and establishes fines for failure to comply with such parameters. As of December 31, 2015, 2014 and 2013 sanction processes initiated by the National Energy Electric Commission related to this fines in an aggregate amount up to US$ 11,884, US$ 11,940 and US$ 11,570, respectively. The recognition of this compensations to customers in accordance with the regulations issued by the CNEE depends on the following future events:
| 1. | To continue providing the service |
| 2. | The volume of future customer consumption under a regulated rate |
| 3. | The actual claim from customer before the CNEE to require the compensation, and |
| 4. | The compensation mechanism is not applicable for the majority of the customers of the Company |
Although the Company believes, based on the described above, has meritorious defenses, no assurance can be provided as to what the ultimate outcome of this matter will be. In the opinion of the Company’s management and its legal advisors, an adverse outcome from this claim is not probable. Consequently, no amount has been accrued at December 31, 2015, 2014 and 2013.
| 31. | TRUST FUND OF ELECTRIC ENERGY DISTRIBUTION |
DEORSA and Distribuidora de Electricidad de Occidente, S. A. or DEOCSA (a related company) held, through public deed No. 54 of May 4, 1999, the “Management Trust Fund Contract—INDE—of Rural Works in Western and Eastern Regions”, with an initial trust equity of US$ 333,569.
For the construction of the works of distribution assets and transmission assets, DEORSA, DEOCSA and INDE entered into the “Management Trust Fund Contract—INDE—of Rural Works in Western and Eastern Regions”. Relevant aspects of such contract are described as follows:
Transmission assets constructed by DEORSA and DEOCSA will become property of INDE when completed, while the distribution assets will form part of the property, plant and equipment of DEORSA and DEOCSA.
At December 31, 2015, 2014 and 2013, DEORSA completed the construction of the distribution assets under the “Project of Rural Electrification INDE (PER, in Spanish)” for total costs of US$ 128,125,
F-312
Table of Contents
DISTRIBUIDORA DE ELECTRICIDAD DE ORIENTE, S. A.—DEORSA
NOTES TO THE FINANCIAL STATEMENTS
AS OF DECEMBER 31, 2015, 2014 AND 2013 AND JANUARY 1,
2013 (RESTATED), AND FOR THE YEARS ENDED DECEMBER 31,
2015, 2014 AND 2013 (RESTATED)
(Stated in thousands of US Dollars, except otherwise indicated)
| 31. | TRUST FUND OF ELECTRIC ENERGY DISTRIBUTION (cont’d) |
US$ 119,383 and US$ 111,949, respectively (Note 16b). At these dates, the Company had supply energy to 120 (thousand) and 106 (thousand) users, respectively, according to the executive report of the benefited users.
Projects of Electric Energy Transmission
DEORSA and DEOCSA signed, through public deed No. 52 of May 4, 1999, the “Contract of Electric Energy Transmission Works Construction”, with an initial trust equity of US$ 150,974, which is part of the trust equity of the “Management Trust Fund Contract—INDE—Rural Works in Western and Eastern Regions”.
Trustor:
Instituto Nacional de Electrificación—INDE
Trustees:
Distribuidora de Electricidad de Occidente, S.A.—DEOCSA
Distribuidora de Electricidad de Oriente, S.A.—DEORSA
Instituto Nacional de Electrificación—INDE—If there were a remainder at the end of the trust in cases specifically anticipated in the contract.
Fiduciary:
Banco Agromercantil de Guatemala, S.A.
Since the incorporation of the trust, the responsibility of a fiduciary is to manage the portion of the trust equity received from the special appointed representative and transfer to DEOCSA and DEORSA the cash required to perform the distribution projects and electric energy transmission included in the annual budget of the “Project of Rural Electrification INDE (PER, in Spanish)”, as follows: a) The fiduciary will deliver, during the first week of each year and as an advance, 20% of the total amount of the budgeted works to be concluded the same year, and b) the payment of the balance will be carried out in accordance with the certification issued every two months. For such management, the fiduciary charges an annual percentage.
Special Appointed Representative:
The Bank of New York
Since the incorporation of the trust, INDE transferred to this foreign bank, in Dollars of the United States of America, the product on the sale of the shares of DEOCSA and DEORSA and in order to complete the trust equity, the product of the shares promised for sale will be contributed. Likewise, INDE will contribute with additional funds required according to the contribution schedule. The special appointed representative is in charge of the main account of the trust and will transfer to the fiduciary the necessary amounts to cover the trustee’s requirements.
F-313
Table of Contents
DISTRIBUIDORA DE ELECTRICIDAD DE ORIENTE, S. A.—DEORSA
NOTES TO THE FINANCIAL STATEMENTS
AS OF DECEMBER 31, 2015, 2014 AND 2013 AND JANUARY 1,
2013 (RESTATED), AND FOR THE YEARS ENDED DECEMBER 31,
2015, 2014 AND 2013 (RESTATED)
(Stated in thousands of US Dollars, except otherwise indicated)
| 31. | TRUST FUND OF ELECTRIC ENERGY DISTRIBUTION (cont’d) |
Term:
From 42 up to 60 months, renewable.
Functions of the Trust:
“Management Trust Fund Contract—INDE—of Rural Works in Western and Eastern Regions”
Introduction of rural electric energy in 2,633 communities specified in the document “Project of Rural Electrification INDE (PER, in Spanish)” achieving no less than 280 (thousand) new users.
“Construction Contract for Transmission Projects”
Within the obligations included in said contract, the creation of a performance bond, through which both DEOCSA and DEORSA will have to constitute a performance bond in favor of INDE, is established. Likewise, it is necessary to create a quality bond equivalent to 20% of the total amount of this contract and must be extendable by a bonding company authorized for this type of operations in Guatemala, of renowned economic capacity and solvency, and previously accepted by INDE.
Additionally, at December 31, 2015, 2014 and 2013, there are bonds for compliance with Environmental Requirements amounting up to US$ 121, US$ 105 and US$ 90 respectively; required to construct transmission works and to constitute bonds before the Departmental Government. Those bonds are of commercial promotion and amount up to US$ 21, US$ 4 and US$ 43 respectively.
“Liquidation of the Distribution and Transmission Works Trust Fund”
During the second semester of 2014, actions were undertaken to obtain financing for the extension of the PER program in its Phase II in the amount of US$ 55 million, including an extension of the trust for five more years. However, the current political and institutional environment in the country affected directly the extension of the PER Trust and its approval from the Congress of the Republic of Guatemala. This aspect blocked the implementation of a programed phase of the project liquidation so on July 14, 2015, termination date of the Trust Fund Contract, said Trust concluded without a previous liquidation term, with works in progress and without the final reception from the Technical Committee.
According to the contract conditions, once the term of the Trust Fund is concluded, if there is disagreement in the reception and/or liquidation of the works among parties, it is necessary to initiate different negotiation mechanisms established in the contract; as of July 14, 2015, a Process of “Amicable Settlement” was initiated, but resolution agreements were not achieved. Due to this issue, an “Arbitration in Equality” process was undertaken as established in the contract for the liquidation of Works pending Reception from INDE.
F-314
Table of Contents
DISTRIBUIDORA DE ELECTRICIDAD DE ORIENTE, S. A.—DEORSA
NOTES TO THE FINANCIAL STATEMENTS
AS OF DECEMBER 31, 2015, 2014 AND 2013 AND JANUARY 1,
2013 (RESTATED), AND FOR THE YEARS ENDED DECEMBER 31,
2015, 2014 AND 2013 (RESTATED)
(Stated in thousands of US Dollars, except otherwise indicated)
| 31. | TRUST FUND OF ELECTRIC ENERGY DISTRIBUTION (cont’d) |
As of today, the Arbitration in Equality is still in process (Note 30).
| 32. | CONTRACTS OF OPERATING LEASING |
Operating leases are related to:
| a. | Vehicles owned by a related company having a leasing period of non-extendable 34 months since February 2015. The Company does not have the option of purchasing the leased vehicles at the expiry date of the leasing periods (Note 33). |
Payments recognized as expenses of the period amounted up to US$ 154.
| b. | Real estate owned by third parties is where commercial premises are located; the leasing period is of five years, extendable. The Company does not have the option of purchasing the leased property at the expiry date of the leasing periods (Note 33). |
Payments recognized as expenses of the period amounted up to US$ 140.
| 33. | COMMITMENTS |
Energy Purchase Agreements
The Company, during its normal course of business, celebrate power purchase agreements to supply the electricity to be delivered to its customers. As such, the Company has entered into several power purchase agreements for a certain quantity of energy at agreed prices for the next years, as described below. These agreements will not give rise to any material obligation to purchase that energy in each year. The Company pays an electricity charge for electricity actually consumed.
Agreements signed with effects in the years presented:
| 1) | DUKE ENERGY: Energy purchase contract from May 1, 2015 to April 30, 2017 through three central plants: a) Central 1 (Arizona): Contract for 2.421 MW with an energy purchase price depending of bunker of US$ 89.00/MWh. b) Central 2 (Las Palmas I): Contract supporting power without associated energy with a total of 29.780 MW with a purchase price of US$ 7.50/kW per month for one-year period as of May 1, 2015. c) Central 3 (Las Palmas II Carbón): Energy purchase contract for two years from May 1, 2015 with an engagement of 8.475 MW at an average energy price depending of coal of US$ 66.59/MWh. |
| 2) | GENERADORA DEL ESTE: Contract of power without associated energy from May 1, 2015 to April 30, 2017, which has two centrals: Central 1 for 6.877 MW at a price of US$ 5.80/kW per month and Central 2 for 2.179 MW at a price of US$ 6.15/kW per month. |
F-315
Table of Contents
DISTRIBUIDORA DE ELECTRICIDAD DE ORIENTE, S. A.—DEORSA
NOTES TO THE FINANCIAL STATEMENTS
AS OF DECEMBER 31, 2015, 2014 AND 2013 AND JANUARY 1,
2013 (RESTATED), AND FOR THE YEARS ENDED DECEMBER 31,
2015, 2014 AND 2013 (RESTATED)
(Stated in thousands of US Dollars, except otherwise indicated)
| 33. | COMMITMENTS (con’d) |
| 3) | BIOMASS ENERGY: Two contracts for the Block 6 of Ingenio Magdalena: a) Energy purchase contract with a guaranteed curve of 15 years since May 1, 2015 to guarantee 1.642 MW at an average price of US$ 22.29/MWh., and b) Contract of Differences with a load curve where 2.960 MW are engaged at an energy price of US$ 5.50/MWh. |
| 4) | INDE: Two contracts: a) Contract of power and associated energy for two years since May 1, 2015 with a power engagement of 36.321 MW at a price of US$ 86.41/MWh, and b) Contract of power and associated energy for 15 years since May 1, 2015 with a power engagement of 18.750 MW at an energy price of US$ 81/MWh. |
| 5) | EÓLICO SAN ANTONIO EL SITIO: Energy contract generated for 15 years since May 1, 2015 with an engagement of 20.00 MW at a price of US$ 132.48/MWh. |
| 6) | RENACE: Two long-term contracts as follows: a) RENACE II FASE 1: Contract of power and associated energy for 15 years since May 1, 2015 with an engagement of 16.65 MW at a price of US$ 44.38/MWh., and b) RENACE I: Contract of power and associated energy for 15 years since May 1, 2015 with an engagement of 3.70 MW at a price of US$ 78.56/MWh. |
| 7) | HIDRO XACBAL: Contract of power and associated energy for 15 years since May 1, 2015 with an engagement of 15.00 MW at a price of US$ 99.00/MWh. |
| 8) | GENOSA: Energy purchase contract for 15 years since May 1, 2015 with an engagement of 3.70 MW at an average price of US$ 107.62/MWh. |
| 9) | HIDROELÉCTRICA EL CÓBANO: Contract of power and associated energy for 15 years since May 1, 2015 with an engagement of 2.090 MW at a price of US$ 95.00/MWh. |
| 10) | JAGUAR ENERGY: On May 30, 2008, according to public deed No. 37, the Company entered into with Jaguar Energy a contract of power supply with electric energy, destined to the users of the distribution service not subject to the social tariff. Based on that contract, Jaguar Energy is obliged to the Company with 90.000 MW. |
On May 16, 2013, such contract suffered an amendment according to public deed No. 43 where the date of the beginning of commercial operations changed to May 1, 2015.
While this date was agreed, Jaguar Energy paid penalties to the Company for each day of delay (1095 days) since the plant operation was not functioning. These penalties were equivalent to the costs incurred by the Company for energy purchase with the most expensive or equivalent technologies, in order to satisfy the demand of the users and rectify the contract commitment.
On the other hand, the Company confirmed the agreement through the resolution of controversies by direct means in order to maintain valid the contract with the coal plant of Jaguar Energy with the purpose of fulfilling the needs of its clients since July 10, 2015 at the term established in the contract (180 months).
F-316
Table of Contents
DISTRIBUIDORA DE ELECTRICIDAD DE ORIENTE, S. A.—DEORSA
NOTES TO THE FINANCIAL STATEMENTS
AS OF DECEMBER 31, 2015, 2014 AND 2013 AND JANUARY 1,
2013 (RESTATED), AND FOR THE YEARS ENDED DECEMBER 31,
2015, 2014 AND 2013 (RESTATED)
(Stated in thousands of US Dollars, except otherwise indicated)
| 33. | COMMITMENTS (con’d) |
Likewise, in case of non-compliance in the supply of electric energy from Jaguar Energy, the Company has pre-operating guarantees equivalent to US$ 18,000, according to the clauses established for this event.
During 2015 Jaguar Energy began operations and is distributing energy to the Company, as provided under the purchase agreement.
| 11) | OXEC I (GENASA): Power contract and associated energy for 15 years since November 1, 2015 with an engagement of 6.00 MW at a price of US$ 87.81/MWh. |
Agreements signed with effects in future years:
| 12) | RENACE: a) RENACE II PHASE 2: Power contract and associated energy for 12 years from May 1, 2018 with an engagement of 7.40 MW at a price of 54.34/MWh. b) RENACE IV: Power contract and associated energy for 15 years from May 1, 2018 with an engagement of 5.53 MW at a price of US$ 71.36/MWh. |
| 13) | RAAXHA: Contract of energy generated for 15 years from May 1, 2016 with an engagement of 5.00 MW at a price of US$ 113.85/MWh. |
| 14) | ENERGÍA DEL CARIBE: Energy purchase contract for 15 years from May 1, 2016 with a power engagement of 22.20 MW at an average price of US$ 50.22/MWh. |
| 15) | ELGUA: Contract of power and associated energy for 15 years from May 1, 2017 with an engagement of 7.77 MW at a price of US$ 42.99/MWh. |
| 16) | ADMIN. OPERATIVA: Energy purchase contract for 15 years from May 1, 2018 with an engagement of 6.53 MW at a price of US$ 68.15/MWh. |
| 17) | INDE: Long-term power and associated energy contract for 15 years from May 1, 2017 with an engagement of 10.37 MW at a price of US$ 81.95/MWh. |
Purchase of Materials
During the normal course of the operations, the Company issues materials purchase orders. The Company’s policy is to recognize liabilities in favor of the suppliers at reception of material. The amount of purchase commitments is determined based on the purchase orders issued. At December 31, 2015, 2014 and 2013 there are purchase commitments amounting up to US$ 7,668, US$ 3,727 and US$ 3,602 respectively, and the same are irrevocable.
F-317
Table of Contents
DISTRIBUIDORA DE ELECTRICIDAD DE ORIENTE, S. A.—DEORSA
NOTES TO THE FINANCIAL STATEMENTS
AS OF DECEMBER 31, 2015, 2014 AND 2013 AND JANUARY 1,
2013 (RESTATED), AND FOR THE YEARS ENDED DECEMBER 31,
2015, 2014 AND 2013 (RESTATED)
(Stated in thousands of US Dollars, except otherwise indicated)
| 33. | COMMITMENTS (con’d) |
Leasing
| a. | The Company keeps property leasing contracts on a renewal basis at its commercial premises. The future projections of minimum payments for those extended operating leasing contracts are as follows: |
2015 | 2014 | 2013 | ||||||||||
Within a year | US$ | 517 | US$ | 555 | US$ | 474 | ||||||
|
|
|
|
|
| |||||||
From year 2 to year 5 | US$ | 3,279 | US$ | 3,917 | US$ | 2,309 | ||||||
|
|
|
|
|
| |||||||
| b. | The Company keeps a vehicle leasing contract for 34 months, not extendable, since February 2015. The future projections of minimum payments for those extended operating leasing contracts are as follows: |
2015 | 2014 | 2013 | ||||||||||
Within a year | US$ | 139 | US$ | — | US$ | — | ||||||
|
|
|
|
|
| |||||||
From year 2 to year 5 | US$ | 127 | US$ | — | US$ | — | ||||||
|
|
|
|
|
| |||||||
Services of Operation and Maintenance
The future projections of the minimum payments for those non-rescindable service contracts of operation and maintenance are shown as follows:
2015 | 2014 | 2013 | ||||||||||
Within a year | US$ | 9,756 | US$ | 19,345 | US$ | 16,559 | ||||||
|
|
|
|
|
| |||||||
From year 2 to year 5 | US$ | 16 | US$ | 1,778 | US$ | 638 | ||||||
|
|
|
|
|
| |||||||
| 34. | FINANCIAL INSTRUMENTS |
The Company manages its capital structure to ensure the continuity as going concern, while it maximizes the return to its shareholders through the optimization of the debt and equity balances. The Company’s overall strategy remains unchanged from 2013.
The working capital structure of the Company is constituted by indebtedness as a financial cost (loans), offset by cash and cash equivalents and restricted cash, and equity comprising issued capital, reserves, retained earnings as detailed in note 23, attributed to the shareholders.
F-318
Table of Contents
DISTRIBUIDORA DE ELECTRICIDAD DE ORIENTE, S. A.—DEORSA
NOTES TO THE FINANCIAL STATEMENTS
AS OF DECEMBER 31, 2015, 2014 AND 2013 AND JANUARY 1,
2013 (RESTATED), AND FOR THE YEARS ENDED DECEMBER 31,
2015, 2014 AND 2013 (RESTATED)
(Stated in thousands of US Dollars, except otherwise indicated)
| 34. | FINANCIAL INSTRUMENTS (cont’d) |
Net Debt Ratio
The financial management of the Company reviews the capital structure over an annual basis. As part of this review, it considers the capital cost and the risk associated to each type of capital. As of December 31, the net debt ratio is composed as follows:
2015 | 2014 | 2013 | ||||||||||
Debt (loans) | US$ | 111,566 | US$ | 103,353 | US$ | 122,971 | ||||||
Cash and cash equivalents | (36,049 | ) | (24,479 | ) | (39,882 | ) | ||||||
Restricted cash | (1,848 | ) | (1,543 | ) | (1,527 | ) | ||||||
|
|
|
|
|
| |||||||
Total net debt | US$ | 73,669 | US$ | 77,331 | US$ | 81,562 | ||||||
|
|
|
|
|
| |||||||
2015 | 2014 | 2013 | ||||||||||
Equity | US$ | 84,153 | US$ | 96,459 | US$ | 78,219 | ||||||
|
|
|
|
|
| |||||||
Net debt ratio | 88 | % | 80 | % | 104 | % | ||||||
|
|
|
|
|
| |||||||
Classification of Financial Instruments
As of December 31, financial assets and liabilities of the Company are made up as follows:
2015 | 2014 | 2013 | ||||||||||
FINANCIAL ASSETS: | ||||||||||||
Measured at amortized cost | ||||||||||||
Trade receivables | US$ | 39,155 | US$ | 44,490 | US$ | 36,273 | ||||||
Other receivables | 3,871 | 2,062 | 2,533 | |||||||||
Account receivables from related parties | 842 | 10,805 | 100 | |||||||||
Cash and cash equivalents | 36,049 | 24,479 | 39,882 | |||||||||
Restricted cash | 1,848 | 1,543 | 1,527 | |||||||||
|
|
|
|
|
| |||||||
| US$ | 81,765 | US$ | 83,379 | US$ | 80,315 | |||||||
|
|
|
|
|
| |||||||
FINANCIAL LIABILITIES: | ||||||||||||
Measured at amortized cost | ||||||||||||
Debt with financial entities | US$ | 111,566 | US$ | 103,353 | US$ | 122,971 | ||||||
Other liabilities | 25,311 | 20,339 | 15,973 | |||||||||
Account payable to related parties | 181 | — | — | |||||||||
Trade and other accounts payable | 36,367 | 30,247 | 43,698 | |||||||||
Creditors | 20 | 631 | 521 | |||||||||
Measured at fair value | ||||||||||||
Other financial obligations | 219 | 611 | 794 | |||||||||
|
|
|
|
|
| |||||||
| US$ | 173,664 | US$ | 155,181 | US$ | 183,957 | |||||||
|
|
|
|
|
| |||||||
F-319
Table of Contents
DISTRIBUIDORA DE ELECTRICIDAD DE ORIENTE, S. A.—DEORSA
NOTES TO THE FINANCIAL STATEMENTS
AS OF DECEMBER 31, 2015, 2014 AND 2013 AND JANUARY 1,
2013 (RESTATED), AND FOR THE YEARS ENDED DECEMBER 31,
2015, 2014 AND 2013 (RESTATED)
(Stated in thousands of US Dollars, except otherwise indicated)
| 34. | FINANCIAL INSTRUMENTS (cont’d) |
At the date of the financial statements, there are no significant concentrations of credit risk in relation with these items. The abovementioned value represents the maximum exposure to credit risk for such financial assets and liabilities.
Management of Financial Risk
The Company is exposed continuously to credit, liquidity, and market risks originated by exchange rate, interest rate, and price variations. These risks are managed through specific policies and procedures established by the Company’s financial management.
The financial management monitors constantly those risks through periodic reports that allow evaluating the exposure levels affecting the Company and issues periodic management reports for the consideration of the Company’s general management.
Credit Risk
Credit risk refers to the risk that a counterparty will default on its contractual obligations resulting in financial loss to the Company. Credit risk is managed by the Company. Credit risk arises from cash and deposits in banks and financial institutions and trade receivables. Credit risks or third party non-compliance risk are controlled through the implementation of service cut-off controls and service monitoring procedure.
The impact of the credit risk exposure is represented by the balances of the trade receivable, net of any provision for covering possible losses. The Company does not have a significant exposure since the balances of its trade receivable are not concentrated on few clients; at December 31, 2015, 2014 and 2013 clients were scattered in 630, 603 and 577 (thousand) users, respectively, out of which none represents more than 10% of the portfolio.
The credit risk on liquid funds and derivative financial instruments is limited because the counterparties are banks with high credit-ratings assigned by international credit-rating agencies.
Liquidity Risk
The Company practices a careful liquidity risk management and, therefore, keeps cash and other instruments liquid, as well as available funds. However, as to December 31, 2015, the financial statements reflect a negative working capital of US$ 7,841, thus the Management will be focused on 2016 on two objectives to revert that situation: a) improving the collection ratio for the accounts receivable and b) reducing the energy loss ratio.
To comply with those objectives, the Management has planned to perform the following:
| a) | Follow up the creation of dialogue and negotiation tables with community leaders and municipal authorities to improve collection timing, prevent non-technical losses; |
F-320
Table of Contents
DISTRIBUIDORA DE ELECTRICIDAD DE ORIENTE, S. A.—DEORSA
NOTES TO THE FINANCIAL STATEMENTS
AS OF DECEMBER 31, 2015, 2014 AND 2013 AND JANUARY 1,
2013 (RESTATED), AND FOR THE YEARS ENDED DECEMBER 31,
2015, 2014 AND 2013 (RESTATED)
(Stated in thousands of US Dollars, except otherwise indicated)
| 34. | FINANCIAL INSTRUMENTS (cont’d) |
| b) | Reduce technical and non-technical losses; |
| c) | Improve debt ratio management and obtain longer-term loans; |
The management of the Company considers that the liquidity risk exposure is low since the Company has been generating cash flow from its operating activities, supported on strong profits, has access to loans and financial resources, as explained in Note 24.
At December 31, 2015, 2014 and 2013 the contract maturity of the non-derivative financial liabilities of the Company is as follows:
Average | Less than 1 | More than 1 Year | Total | Carrying | ||||||||||||||||
2015 | ||||||||||||||||||||
Loan secured with pledged collateral and fiduciary guarantee | 6 | % | US$ | 21,533 | US$ | 117,314 | US$ | 138,847 | US$ | 111,566 | ||||||||||
Trade and other accounts payable | 0 | % | 36,367 | — | 36,367 | 36,367 | ||||||||||||||
Creditors | 0 | % | 20 | — | 20 | 20 | ||||||||||||||
|
|
|
|
|
|
|
| |||||||||||||
| US$ | 57,920 | US$ | 117,314 | US$ | 175,234 | US$ | 147,953 | |||||||||||||
|
|
|
|
|
|
|
| |||||||||||||
Average | Less than 1 | More than | Total | Carrying | ||||||||||||||||
2014 | ||||||||||||||||||||
Loan secured with pledged collateral and fiduciary guarantee | 6 | % | US$ | 28,998 | US$ | 108,723 | US$ | 137,721 | US$ | 103,353 | ||||||||||
Trade and other accounts payable | 0 | % | 30,247 | — | 30,247 | 30,247 | ||||||||||||||
Creditors | 0 | % | 631 | — | 631 | 631 | ||||||||||||||
|
|
|
|
|
|
|
| |||||||||||||
| US$ | 59,876 | US$ | 108,723 | US$ | 168,599 | US$ | 134,231 | |||||||||||||
|
|
|
|
|
|
|
| |||||||||||||
Average | Less than 1 | More than 1 Year | Total | Carrying | ||||||||||||||||
2013 | ||||||||||||||||||||
Loan secured with pledged collateral and fiduciary guarantee | 6 | % | US$ | 34,189 | US$ | 129,577 | US$ | 163,766 | US$ | 122,971 | ||||||||||
Trade and other accounts payable | 0 | % | 43,698 | — | 43,698 | 43,698 | ||||||||||||||
Creditors | 0 | % | 521 | — | 521 | 521 | ||||||||||||||
|
|
|
|
|
|
|
| |||||||||||||
| US$ | 78,408 | US$ | 129,577 | US$ | 207,985 | US$ | 167,190 | |||||||||||||
|
|
|
|
|
|
|
| |||||||||||||
F-321
Table of Contents
DISTRIBUIDORA DE ELECTRICIDAD DE ORIENTE, S. A.—DEORSA
NOTES TO THE FINANCIAL STATEMENTS
AS OF DECEMBER 31, 2015, 2014 AND 2013 AND JANUARY 1,
2013 (RESTATED), AND FOR THE YEARS ENDED DECEMBER 31,
2015, 2014 AND 2013 (RESTATED)
(Stated in thousands of US Dollars, except otherwise indicated)
| 34. | FINANCIAL INSTRUMENTS (cont’d) |
Cash Flows
There is a low exposure as to whether the cash flows associated with the financial assets and liabilities could fluctuate in their amount, except for the risk exposure of cash flows that might derive from the fluctuation of the exchange rate of the dollar with respect to the quetzal, that might require additional cash flows to cancel the loans and accounts payable in foreign currency or that might implicate a reduction in the assets in foreign currency.
Market Risk
Fluctuation on exchange rates and market prices:
Exposure to which DEORSA is exposed from the fluctuation in exchange rates and fuel market prices stays covered through the transfer of additional costs to the electric energy tariff.
Exchange Rate Risk
Monetary assets and liabilities include balances in Dollars of the United States of America, which are subject to the fluctuation risk in the exchange rate of the US dollar with regard to the Quetzal for the transactions performed of the Company. During 2015, 2014 and 2013, there were no significant fluctuations of the US dollar regarding the Quetzal that might be considered significant.
Percentage Rate Devaluation of the Quetzal in Relation with the US Dollar
Currency | 2015 | 2014 | 2013 | |||||||||
Quetzals | (1 | )% | (3 | )% | (1 | )% | ||||||
The Company does not have the practice of acquiring derivative financials to protect itself from loss risks to which it is exposed because of the fluctuations in the exchange rate of the currency in which its transactions are carried out abroad.
F-322
Table of Contents
DISTRIBUIDORA DE ELECTRICIDAD DE ORIENTE, S. A.—DEORSA
NOTES TO THE FINANCIAL STATEMENTS
AS OF DECEMBER 31, 2015, 2014 AND 2013 AND JANUARY 1,
2013 (RESTATED), AND FOR THE YEARS ENDED DECEMBER 31,
2015, 2014 AND 2013 (RESTATED)
(Stated in thousands of US Dollars, except otherwise indicated)
| 34. | FINANCIAL INSTRUMENTS (cont’d) |
As of December 31, 2015, 2014 and 2013 the amount of assets and liabilities in foreign currency that might be exposed to exchange rate fluctuations is as follows:
2015 | In thousands | |||
Assets: | ||||
Local banks in foreign currency | 4,676 | |||
Restricted cash | 1,271 | |||
|
| |||
| 5,947 | ||||
Liabilities: | ||||
Debt with financial entities | (76,991 | ) | ||
Trade account payables | (8,419 | ) | ||
Advances to foreign suppliers | 407 | |||
|
| |||
| (85,003 | ) | |||
|
| |||
Net liability position of foreign currency | (79,056 | ) | ||
|
| |||
2014 | In thousands of US Dollars | |||
Assets: | ||||
Local banks in foreign currency | 3,311 | |||
Restricted cash | 1,059 | |||
Advances to suppliers | 4,384 | |||
|
| |||
| 8,754 | ||||
Liabilities: | ||||
Debt with financial entities | (73,158 | ) | ||
Trade account payables | (2,486 | ) | ||
|
| |||
| (75,644 | ) | |||
|
| |||
Net liability position of foreign currency | (66,890 | ) | ||
|
| |||
2013 | In thousands | |||
Assets: | ||||
Local banks in foreign currency | 33,799 | |||
Restricted cash | 1,059 | |||
|
| |||
| 34,858 | ||||
Liabilities: | ||||
Debt with financial entities | (89,221 | ) | ||
Trade account payables | (27,175 | ) | ||
|
| |||
| (116,396 | ) | |||
|
| |||
Net liability position of foreign currency | (81,538 | ) | ||
|
| |||
F-323
Table of Contents
DISTRIBUIDORA DE ELECTRICIDAD DE ORIENTE, S. A.—DEORSA
NOTES TO THE FINANCIAL STATEMENTS
AS OF DECEMBER 31, 2015, 2014 AND 2013 AND JANUARY 1,
2013 (RESTATED), AND FOR THE YEARS ENDED DECEMBER 31,
2015, 2014 AND 2013 (RESTATED)
(Stated in thousands of US Dollars, except otherwise indicated)
| 34. | FINANCIAL INSTRUMENTS (cont’d) |
Sensitivity Analysis
A strengthening or weakening at the rate of 2% of the dollar exchange rate against the Quetzal would have increased (decreased) profit or loss for the year and the shareholders’ equity by the amounts shown below. This analysis assumes that all other variables, in particular interest rates, remain constant. The analysis is performed on the same basis for 2014 and 2013.
As at December 31 | ||||||||||||||||
Profit or loss | Shareholders’ Equity | |||||||||||||||
2% increase | 2% decrease | 2% increase | 2% decrease | |||||||||||||
US$ thousands | ||||||||||||||||
As at December 31, 2015 | US$ | 1,582 | US$ | (1,582 | ) | US$ | 3,043 | US$ | (3,167 | ) | ||||||
As at December 31, 2014 | US$ | 1,338 | US$ | (1,338 | ) | US$ | 3,240 | US$ | (3,372 | ) | ||||||
As at December 31, 2013 | US$ | 1,631 | US$ | (1,631 | ) | US$ | 6,713 | US$ | (6,898 | ) | ||||||
Interest Rates Risk
The interest rate risk is managed by the Company’s management through a hedging instrument to fix it, specifically in credits negotiated in dollars at a LIBOR rate up to three months in dollars. The Company’s exposures to interest rates on financial liabilities are detailed in the liquidity risk management section of this note. The risk is managed by the Company by the use of interest rate swap contracts and forward interest rate contracts. Hedging activities are evaluated regularly to align with interest rate views and defined risk appetite, ensuring the most cost-effective hedging strategies are applied.
Cash flow sensitivity analysis for variable rate instruments
The sensitivity analyses below have been determined based on the exposure to interest rates for both derivatives and non-derivative instruments at the end of the reporting period. For floating rate liabilities, the analysis is prepared assuming the amount of the liability outstanding at the end of the reporting period was outstanding for the whole year. A 50 basis point increase or decrease is used when reporting interest rate risk internally to key management personnel and represents management’s assessment of the reasonably possible change in interest rates.
This analysis assumes that all other variables, in particular foreign currency rates, remain constant. The analysis is performed on the same basis for 2014 and 2013.
As at December 31, 2015 | ||||||||
Impact on income or loss | ||||||||
0.5% decrease | 0.5% increase | |||||||
in interest rates | in interest rates | |||||||
US$ thousands | ||||||||
Non-derivative instruments | US$ | (172 | ) | US$ | 172 | |||
|
|
|
| |||||
F-324
Table of Contents
DISTRIBUIDORA DE ELECTRICIDAD DE ORIENTE, S. A.—DEORSA
NOTES TO THE FINANCIAL STATEMENTS
AS OF DECEMBER 31, 2015, 2014 AND 2013 AND JANUARY 1,
2013 (RESTATED), AND FOR THE YEARS ENDED DECEMBER 31,
2015, 2014 AND 2013 (RESTATED)
(Stated in thousands of US Dollars, except otherwise indicated)
| 34. | FINANCIAL INSTRUMENTS (cont’d) |
As at December 31, 2014 | ||||||||
Impact on income or loss | ||||||||
0.5% decrease | 0.5% increase | |||||||
in interest rates | in interest rates | |||||||
US$ thousands | ||||||||
Non-derivative instruments | US$ | (165 | ) | US$ | 165 | |||
|
|
|
| |||||
As at December 31, 2013 | ||||||||
Impact on income or loss | ||||||||
0.5% decrease | 0.5% increase | |||||||
in interest rates | in interest rates | |||||||
US$ thousands | ||||||||
Non-derivative instruments | US$ | (187 | ) | US$ | 187 | |||
|
|
|
| |||||
Interest Rate Swap Contracts
Under interest rate swap contracts, the Company agrees to exchange the difference between fixed and floating rate interest amounts calculated on agreed notional principal amounts. Such contracts enable the Company to mitigate the cash flow exposures on the issued variable rate debt. The fair value of interest rate swaps at the end of the reporting period is determined by discounting the future cash flows using the curves at the end of the reporting period and the credit risk inherent in the contract, and is disclosed below. The average interest rate is based on the outstanding balances at the end of the reporting period.
The following tables detail the amount of notional capital over which the swap is established, as well as the remaining terms of the hedging contracts of the pending interest rates at the end of the reporting period.
Cash Flow Hedge
Contracts at variable receive rate | Fixed Average Interest Rate Agreed | Notional Value of Capital | Assets (Liabilities) at Fair Value | |||||||||||||||||||||||||||||||||
31/12/15 | 31/12/14 | 31/12/13 | 31/12/15 | 31/12/14 | 31/12/13 | 31/12/15 | 31/12/14 | 31/12/13 | ||||||||||||||||||||||||||||
% | % | % | US$ | US$ | US$ | US$ | US$ | US$ | ||||||||||||||||||||||||||||
1 year | 5.95 | 5.95 | 5.95 | 2,310 | 9,150 | 9,158 | (219 | ) | (430 | ) | (574 | ) | ||||||||||||||||||||||||
2 years | 5.95 | 5.95 | 5.95 | — | 2,288 | 11,448 | — | (181 | ) | (220 | ) | |||||||||||||||||||||||||
Over 2 years | 5.95 | 5.95 | 5.95 | — | — | 48,081 | — | — | — | |||||||||||||||||||||||||||
|
|
|
|
|
|
|
|
|
|
|
| |||||||||||||||||||||||||
| 2,310 | 11,438 | 68,687 | (219 | ) | (611 | ) | (794 | ) | ||||||||||||||||||||||||||||
|
|
|
|
|
|
|
|
|
|
|
| |||||||||||||||||||||||||
Interest rate hedging is settle on a quarterly basis. The variable rate over the hedging interest rate is the LIBOR rate in dollars for a three-month period. The Company will pay such difference between the floating interest rate and the fixed rate over a net basis.
F-325
Table of Contents
DISTRIBUIDORA DE ELECTRICIDAD DE ORIENTE, S. A.—DEORSA
NOTES TO THE FINANCIAL STATEMENTS
AS OF DECEMBER 31, 2015, 2014 AND 2013 AND JANUARY 1,
2013 (RESTATED), AND FOR THE YEARS ENDED DECEMBER 31,
2015, 2014 AND 2013 (RESTATED)
(Stated in thousands of US Dollars, except otherwise indicated)
| 34. | FINANCIAL INSTRUMENTS (cont’d) |
All the interest rate swap contracts exchanging variable interest rate for fixed interest rate are designated as cash flow hedge with the purpose of reducing the Company’s cash flow exposure that results from variable interest rates over loans. Interest rate swaps and interest payments over the loan occur simultaneously and the accumulated amount in equity is reclassified to the profit or loss over the period in which the variable interest rate payments on the debt affect profit or loss.
Fair Value of Financial Instruments
This note provides information about how the Company determines fair values of financial assets and financial liabilities.
Fair value of the Company’s financial assets and financial liabilities that are measured at fair value on a recurring basis
Some of the Company’s financial assets and financial liabilities are measured at fair value at the end of each reporting period.
The following table shows the valuation techniques used in measuring Level 2 fair values as at December 31, 2015, 2014 and 2013, as well as the significant unobservable inputs used.
Type | Fair value as at | Valuation technique | Significant | Inter- | ||||||||
12/31/15 | 12/31/14 | 12/31/13 | ||||||||||
Interest rate Swaps | Assets (Liabilities):
(219) | Assets (Liabilities):
(611) | Assets (Liabilities):
(794) | The methodology used to determine the fair value of the swap is a standard valuation technique of rate curve. | Not applicable | Not applicable | ||||||
There were no transfers between Level 1 and 2 in each of the three years presented.
Fair value of financial assets and financial liabilities that are not measured at fair value (but fair value disclosures are required)
The Company’s management considers that the carrying amount of the long term debt with financial entities approximate their fair value, since the debt is agreed at variable market interest rates which are
F-326
Table of Contents
DISTRIBUIDORA DE ELECTRICIDAD DE ORIENTE, S. A.—DEORSA
NOTES TO THE FINANCIAL STATEMENTS
AS OF DECEMBER 31, 2015, 2014 AND 2013 AND JANUARY 1,
2013 (RESTATED), AND FOR THE YEARS ENDED DECEMBER 31,
2015, 2014 AND 2013 (RESTATED)
(Stated in thousands of US Dollars, except otherwise indicated)
| 34. | FINANCIAL INSTRUMENTS (cont’d) |
reviewed periodically. Also, Company’s management considers that the carrying amount of the other financial assets and financial liabilities measured at amortized cost, approximate their fair value due to their short-term maturity or because they are agreed at interest rates similar to market interest rate.
| 35. | SUBSEQUENT EVENTS |
The Company has evaluated subsequent events as at December 31, 2015 to assess the need for potential recognition or disclosure in these financial statements. Such events were assessed until September 10, 2016, the date these financial statements were available to be issued. Based on this evaluation, it was determined that there were no subsequent events requiring recognition or disclosure in the financial statements, except for the following matters:
| • | On January 22, 2016, I.C. Power Ltd through IC Power Distribution Holding Pte. Limited, a wholly-owned subsidiary of Kenon Holdings Ltd (“Kenon”), acquired 100% of the shares of DEORSA BV, owner of 92.70% of the Company’s capital stock. As a result, I.C. Power Ltd. took the effective control to manage the financial and operating policies of the Company. |
| • | On March 17, 2016, as part of the reorganization process carried out by Kenon in order to list I.C. Power Pte. Ltd (“ICPS”) in the US stock exchange, Kenon transferred all of the shares of I.C. Power Ltd. to I.C. Power Pte. Ltd. (“ICPS”), a wholly owned subsidiary of Kenon incorporated in Singapore. |
| • | On January 22, 2016 the contract held with Arthasan, S.A. was cancelled. Such entity rendered management, administration and supervision services for the businesses of the Company. Since January 23, 2016, the abovementioned activities were carried out directly by the Company. |
| • | On January 29, 2016, the CNEE published resolutions CNEE-37-2016 and CNEE-38-2016 which approved the new non-social and social tariffs, respectively. Under such resolutions, the electricity adjustment surcharge (see note 1.a) was determined by the CNEE in order to be considered as tariff adjustments for the quarter period from February 1 to April 30, 2016 of the non-social and social tariffs in the amounts of US$ 6,850 and US$ 3,494, respectively; likewise, the CNEE also indicated that the remaining accumulated surcharge from prior periods for non-social and social users, in the amounts of US$ 10,560 and US$ 1,561 respectively, will be considered as tariff adjustments for the following quarter, including an annual simple interest rate of 7% on such amounts. |
| • | On April 25, 2016, the CNEE published resolutions CNEE-102-2016 and CNEE-103-2016 which approved the new non-social and social tariffs, respectively. Under such resolutions, the electricity adjustment surcharge (see note 1.a) was determined by the CNEE in order to be considered as tariff adjustments for the quarter period from May 1 to July 31, 2016 of the non-social and social tariffs in the amounts of US$ 1,506 and US$ 2,463, respectively; likewise, the CNEE also indicated that the remaining accumulated surcharge from prior periods for non-social and social users, in the amounts of US$ 14,217 and US$ 3,604 respectively, will be considered as tariff adjustments for the following quarter, including an annual simple interest rate of 7% on such amounts. |
F-327
Table of Contents
DISTRIBUIDORA DE ELECTRICIDAD DE ORIENTE, S. A.—DEORSA
NOTES TO THE FINANCIAL STATEMENTS
AS OF DECEMBER 31, 2015, 2014 AND 2013 AND JANUARY 1,
2013 (RESTATED), AND FOR THE YEARS ENDED DECEMBER 31,
2015, 2014 AND 2013 (RESTATED)
(Stated in thousands of US Dollars, except otherwise indicated)
| 35. | SUBSEQUENT EVENTS (cont’d) |
| • | On July 26, 2016 CNEE published the resolutions CNEE-203-2016 and CNEE-204-2016 which approved the new non-social and social tariffs, respectively. Under such resolutions, the electricity adjustment surcharge (see note 1.a) was determined by the CNEE in order to be considered as tariff adjustments for the quarter period from May 1 to July 31, 2016 of the non-social and social tariffs the amounts of US$ 1,503 and US$ 1,912, respectively, likewise, the CNEE also indicated that the remaining accumulated surcharge from prior periods for non-social and social users, in the amounts of US$. 15,530 and US$. 5,534 respectively, will be considered as tariff adjustments for the following quarter, including an annual simple interest rate of 7% on such amounts. |
| • | At the Ordinary General Shareholders’ Meeting held on April 6, 2016 a distribution of dividends to the Company’s shareholders was approved in deed no. CA-4-2016. The dividends declared to their distribution to the shareholders were in the amount of US$ 15,986 (Q. 122,013), which represents US$ 0.03 (Q. 0.20) per share, and their payment was made on April 30, 2016. |
| • | On July 26, 2016, DEORSA become aware of a legal proceeding initiated by the Guatemalan Tax Administration (“SAT”) for payment of purported back income taxes for approximately US$ 6,384 (Q. 48,521) for the years 2011 and 2012. Such amount is subject to interest charges and penalties. The SAT alleges that the deduction by the Company of the interest expenses and amortization of goodwill from the taxable income were improper. The transaction dates back to 2011, when the Company’s prior controlling shareholder (ASROED S. A.) acquired the shares of DEORSA and was subsequently merged with the Company in 2011. The SAT may further seek purported back taxes for the years 2013, 2014 and 2015. The Company estimates that such back taxes of approximately US$ 10,222 (Q. 77,692). |
At a hearing on August 9, 2016, the Company reached an understanding with the tax authorities where it will conditionally pay within the next 60 days the 2011 and 2012 principal, interest and penalties claimed by the SAT. In order to release the bank accounts’ seizure imposed by the tribunal, to reduce any resulting penalties by the SAT, and to prevent further legal actions from the SAT for the purported back taxes for the years 2013, 2014 and 2015, the Company paid on August 9, 2016 US$ 6,747 (Q. 51,275) including taxes, penalties and interests for the years 2014 and 2015, on August 10, 2016 US$ 6,384 (Q. 48,521) related to taxes for years 2011 and 2012 and on August 19, 2016 US$ 4,922 (Q. 37,405) including taxes, penalties and interests for the year 2013. An approximately payment of US$ 8,368 (Q. 63,596) subject to recalculation as of the date of payment, related to penalties and interests for year 2011 and 2012 will be made during 60 days beginning August 10, 2016. Furthermore, the Company has notified the SAT that is making all such payments reserving all legal rights to seek restitution of such payments by contesting legally the merits of the SAT claim. DEORSA’s management and its legal advisors consider that the Company has all legal rights and hence, that it will initiate the necessary legal procedures to pursue the collection of the amounts paid in connection with such claim.
Since the inception of the transactions in 2011 and up to date, the opinion of DEORSA’s management and its legal and tax advisors is that the transactions that generated the interest
F-328
Table of Contents
DISTRIBUIDORA DE ELECTRICIDAD DE ORIENTE, S. A.—DEORSA
NOTES TO THE FINANCIAL STATEMENTS
AS OF DECEMBER 31, 2015, 2014 AND 2013 AND JANUARY 1,
2013 (RESTATED), AND FOR THE YEARS ENDED DECEMBER 31,
2015, 2014 AND 2013 (RESTATED)
(Stated in thousands of US Dollars, except otherwise indicated)
| 35. | SUBSEQUENT EVENTS (cont’d) |
expenses and the amortization of goodwill deductions are legitimate tax deductions. This position was confirmed in February 2015 by a binding ruling issued by the SAT. Hence, DEORSA’s management considers, based on the opinion of its tax and legal advisors, there is a probability greater than 50% in the recoverability of these payments as a result of the final outcome of this claim and of the other recourses to be initiated by the Company. These payments will be treated as an income tax payments in excess and presented in the third quarter financial statements as account receivable.
| • | On August 2016, the Company signed an addendum to the existing long term syndicated loan. Such addendum renewed Tranche H of the long term syndicated loan in the amount of US$ 11,200 and Q. 37,200, at an US Libor rate for three months plus a spread of 4.75%, with a floor interest rate of 6% for the dollar portion and Active Weighted Average rate less 6.10% for the portion in Quetzales. The term of the Tranche is up to February, 2025, with a grace period until May 2018 and equal quarterly principal payments thereafter. |
| 36. | APPROVAL OF THE FINANCIAL STATEMENTS |
These financial statements prepared in U.S. dollars as presentation currency, were approved by the Company’s Management Committee on September 10, 2016.
* * * * * *
F-329
Table of Contents
Distribuidora de Electricidad de
Occidente, S. A.—DEOCSA
Restated Financial Statements as of December 31, 2015,
2014 and 2013 and January 1, 2013, and for the years
ended December 31, 2015, 2014 and 2013 together with
the Independent Auditors’ Report
Table of Contents
DISTRIBUIDORA DE ELECTRICIDAD DE OCCIDENTE, S. A.—DEOCSA
Page | ||||
| F-332 | ||||
RESTATED FINANCIAL STATEMENTS AS OF DECEMBER 31, 2015, 2014 AND 2013 AND JANUARY 1, 2013, AND FOR THE YEARS ENDED DECEMBER 31, 2015, 2014 AND 2013 | ||||
| F-334 | ||||
| F-335 | ||||
| F-337 | ||||
| F-339 | ||||
| F-341 | ||||
Table of Contents
Deloitte Guatemala, S.A.
Europlaza World Business Center
5a. Avenida 5-55, Zona 14
Torre IV, Nivel 8
01014
Guatemala
Tel.: (502) 2384 6500
Fax: (502) 2384 6555
www.deloitte.com/gt
To the Management Committee and the Shareholders of
Distribuidora de Electricidad de Occidente, S. A.
We have audited the accompanying financial statements of Distribuidora de Electricidad de Occidente, S. A. (the “Company”), which comprise the restated statements of financial position as of December 31, 2015, 2014, 2013 and January 1, 2013, and the related restated statements of profit or loss and other comprehensive income, changes in shareholders’ equity and cash flows for the years ended December 31, 2015, 2014 and 2013 and the related notes to the financial statements.
Management’s Responsibility for the Financial Statements
Management is responsible for the preparation and fair presentation of these financial statements in accordance International Financial Reporting Standards as issued by the International Accounting Standards Board; this includes the design, implementation, and maintenance of internal control relevant to the preparation and fair presentation of financial statements that are free from material misstatement, whether due to fraud or error.
Auditors’ Responsibility
Our responsibility is to express an opinion on these financial statements based on our audits. We conducted our audits in accordance with auditing standards generally accepted in the United States of America. Those standards require that we plan and perform the audit to obtain reasonable assurance about whether the financial statements are free from material misstatement.
An audit involves performing procedures to obtain audit evidence about the amounts and disclosures in the financial statements. The procedures selected depend on the auditor’s judgment, including the assessment of the risks of material misstatement of the financial statements, whether due to fraud or error. In making those risk assessments, the auditor considers internal control relevant to the Company’s preparation and fair presentation of the financial statements in order to design audit procedures that are appropriate in the circumstances, but not for the purpose of expressing an opinion on the effectiveness of the Company’s internal control. Accordingly, we express no such opinion. An audit also includes evaluating the appropriateness of accounting policies used and the reasonableness of significant accounting estimates made by management, as well as evaluating the overall presentation of the financial statements.
We believe that the audit evidence we have obtained is sufficient and appropriate to provide a basis for our audit opinion.
Opinion
In our opinion, the financial statements referred to above present fairly, in all material respects, the financial position of Distribuidora de Electricidad de Occidente, S. A. as of December 31, 2015, 2014, 2013 and January 1,
Table of Contents
2013, and the results of its operations and its cash flows for the years ended December 31, 2015, 2014 and 2013, in accordance with International Financial Reporting Standards as issued by the International Accounting Standards Board.
Emphasis of matter
As discussed in Note 1.b, the financial statements as of December 31, 2015, 2014, 2013 and for the years ended December 31, 2015, 2014 and 2013 have been restated for the correction of errors. These restatements have also resulted in the presentation of the restated statement of financial position as of January 1, 2013. In addition, the Company also expanded certain disclosures from those previously presented. Our opinion is not modified with respect to these matters.
As discussed in Note 35 to the accompanying financial statements, a legal proceeding was initiated against the Company by the Guatemalan Tax Administration. Our opinion is not qualified in respect of this matter.
Guatemala, C.A.,
September 10, 2016
Deloitte Guatemala, S. A.
/s/ Sergio Patzán
Sergio Patzán
Partner
Chartered Accountant CPA-2200
F-333
Table of Contents
DISTRIBUIDORA DE ELECTRICIDAD DE OCCIDENTE, S. A.—DEOCSA
STATEMENTS OF PROFIT OR LOSS AND OTHER COMPREHENSIVE INCOME
FOR THE YEARS ENDED DECEMBER 31, 2015, 2014 AND 2013
(Stated in thousands of US dollars, except otherwise indicated)
Notes | 2015 (Restated) | 2014 (Restated) | 2013 (Restated) | |||||||||||
REVENUE: | ||||||||||||||
Energy sales | 5 | US$ | 317,967 | US$ | 321,000 | US$ | 304,770 | |||||||
Services rendered | 6 | 3,547 | 2,659 | 3,456 | ||||||||||
Other revenues | 7 | 3,128 | 5,921 | 5,938 | ||||||||||
|
|
|
|
|
| |||||||||
Total revenue | 324,642 | 329,580 | 314,164 | |||||||||||
COSTS OF SALES: | ||||||||||||||
Energy purchases | 8 | (205,058 | ) | (221,134 | ) | (217,475 | ) | |||||||
Other costs of sales | 9 | (37,516 | ) | (36,324 | ) | (34,592 | ) | |||||||
|
|
|
|
|
| |||||||||
Total costs of sales | (242,574 | ) | (257,458 | ) | (252,067 | ) | ||||||||
Gross profit | 82,068 | 72,122 | 62,097 | |||||||||||
General, selling and administrative expenses | 11 | (39,282 | ) | (33,077 | ) | (25,181 | ) | |||||||
Financial income | 10 | 2,046 | 6,143 | 2,849 | ||||||||||
Financial expenses | 12 | (16,980 | ) | (14,998 | ) | (14,756 | ) | |||||||
Other income | 13 | 242 | 1,135 | 297 | ||||||||||
|
|
|
|
|
| |||||||||
Profit before income tax | 28,094 | 31,325 | 25,306 | |||||||||||
Income taxes | 14 | (7,041 | ) | (27,998 | ) | (7,838 | ) | |||||||
|
|
|
|
|
| |||||||||
PROFIT FOR THE YEAR | 21,053 | 3,327 | 17,468 | |||||||||||
OTHER COMPREHENSIVE INCOME (LOSS), NET OF INCOME TAX | ||||||||||||||
Items that will not be reclassified subsequently to profit or loss: | ||||||||||||||
Translation differences | (490 | ) | 3,148 | 646 | ||||||||||
Remeasurement of defined benefit obligation | 27 | (554 | ) | (569 | ) | 212 | ||||||||
Items that would be reclassified subsequently to profit or loss: | ||||||||||||||
Cash flow hedge | 25 | 356 | 345 | (869 | ) | |||||||||
|
|
|
|
|
| |||||||||
OTHER COMPREHENSIVE INCOME (LOSS) FOR THE YEAR, NET OF INCOME TAX | (688 | ) | 2,924 | (11 | ) | |||||||||
|
|
|
|
|
| |||||||||
TOTAL COMPREHENSIVE INCOME FOR THE YEAR | US$ | 20,365 | US$ | 6,251 | US$ | 17,457 | ||||||||
|
|
|
|
|
| |||||||||
The accompanying notes are part of these financial statements.
F-334
Table of Contents
DISTRIBUIDORA DE ELECTRICIDAD DE OCCIDENTE, S. A.—DEOCSA
STATEMENTS OF FINANCIAL POSITION
AS OF DECEMBER 31, 2015, 2014 AND 2013 AND JANUARY 1, 2013
(Stated in thousands of US dollars, except otherwise indicated)
Notes | 31/12/2015 | 31/12/2014 | 31/12/2013 | 01/01/2013 | ||||||||||||||
ASSETS | ||||||||||||||||||
NON CURRENT ASSETS: | ||||||||||||||||||
Property, plant and equipment | 16 | US$ | 280,611 | US$ | 284,377 | US$ | 277,751 | US$ | 276,532 | |||||||||
Intangible assets | 17 | 77,063 | 78,010 | 75,782 | 75,154 | |||||||||||||
Deferred income tax | 14 | — | — | 6,687 | 7,867 | |||||||||||||
Long-term trade receivables | 15 | 17,783 | 13,394 | 7,255 | 5,846 | |||||||||||||
Other receivables | 18 | 3,494 | 3,385 | 3,102 | 2,743 | |||||||||||||
|
|
|
|
|
|
|
| |||||||||||
Total non-current assets | 378,951 | 379,166 | 370,577 | 368,142 | ||||||||||||||
|
|
|
|
|
|
|
| |||||||||||
CURRENT ASSETS: | ||||||||||||||||||
Other assets | 32 | 32 | 20 | 204 | ||||||||||||||
Inventory | 19 | 487 | 505 | 394 | 537 | |||||||||||||
Trade receivables | 15 | 59,405 | 64,531 | 59,653 | 52,126 | |||||||||||||
Other receivables | 18 | 3,586 | 344 | 1,238 | 1,114 | |||||||||||||
Taxes receivables | 20 | 109 | 765 | 741 | 1,851 | |||||||||||||
Account receivables from related parties | 21 | 131 | 8 | 172 | 3,010 | |||||||||||||
Restricted cash | 3r | 2,875 | 2,399 | 2,379 | 2,110 | |||||||||||||
Cash and cash equivalents | 22 | 5,203 | 5,622 | 19,816 | 39,176 | |||||||||||||
|
|
|
|
|
|
|
| |||||||||||
Total current assets | 71,828 | 74,206 | 84,413 | 100,128 | ||||||||||||||
|
|
|
|
|
|
|
| |||||||||||
Total assets | US$ | 450,779 | US$ | 453,372 | US$ | 454,990 | US$ | 468,270 | ||||||||||
|
|
|
|
|
|
|
| |||||||||||
The accompanying notes are part of these financial statements.
F-335
Table of Contents
DISTRIBUIDORA DE ELECTRICIDAD DE OCCIDENTE, S. A.—DEOCSA
STATEMENTS OF FINANCIAL POSITION
AS OF DECEMBER 31, 2015, 2014 AND 2013 AND JANUARY 1, 2013
(Stated in thousands of US dollars, except otherwise indicated)
Notes | 31/12/2015 | 31/12/2014 | 31/12/2013 | 01/01/2013 | ||||||||||||||
SHAREHOLDERS’ EQUITY AND LIABILITIES: | ||||||||||||||||||
SHAREHOLDERS’ EQUITY: | ||||||||||||||||||
Capital stock | 23 | US$ | 63,200 | US$ | 63,200 | US$ | 63,200 | US$ | 63,200 | |||||||||
Legal reserve | 9,322 | 10,078 | 9,508 | 9,122 | ||||||||||||||
Accumulated other comprehensive loss—cash flows hedge | (168 | ) | (524 | ) | (869 | ) | — | |||||||||||
Accumulated other comprehensive loss—remeasurement of defined benefit obligation | (1,360 | ) | (806 | ) | (237 | ) | (451 | ) | ||||||||||
Accumulated other comprehensive loss—translation differences | (1,454 | ) | (964 | ) | (4,112 | ) | (4,758 | ) | ||||||||||
Retained earnings | 28,061 | 31,279 | 28,522 | 11,440 | ||||||||||||||
|
|
|
|
|
|
|
| |||||||||||
Total shareholders’ equity | 97,601 | 102,263 | 96,012 | 78,553 | ||||||||||||||
|
|
|
|
|
|
|
| |||||||||||
NON-CURRENT LIABILITIES: | ||||||||||||||||||
Debt with financial entities—long term | 24 | 148,882 | 126,834 | 148,616 | 171,100 | |||||||||||||
Other financial obligations—long term | 25 | — | 300 | 364 | — | |||||||||||||
Deferred revenues | 26 | 73,154 | 76,674 | 76,788 | 76,382 | |||||||||||||
Provisions | 27 | 7,243 | 7,296 | 8,313 | 9,183 | |||||||||||||
Deferred income tax, net | 14 | 5,604 | 7,624 | — | — | |||||||||||||
Other long-term liabilities | 2,702 | 1,622 | 538 | 1,599 | ||||||||||||||
|
|
|
|
|
|
|
| |||||||||||
Total non-current liabilities | 237,585 | 220,350 | 234,619 | 258,264 | ||||||||||||||
|
|
|
|
|
|
|
| |||||||||||
CURRENT LIABILITIES: | ||||||||||||||||||
Debt with financial entities—short term | 24 | 23,002 | 32,031 | 39,943 | 38,634 | |||||||||||||
Other financial obligations—short term | 25 | 364 | 714 | 953 | — | |||||||||||||
Accounts payables to related parties | 21 | 116 | 9,049 | 14 | 2,840 | |||||||||||||
Trade and other accounts payable | 29 | 49,835 | 41,599 | 52,063 | 64,343 | |||||||||||||
Creditors | 12 | 561 | 1,090 | 1,069 | ||||||||||||||
Tax payable | 20 | 4,968 | 13,424 | 2,586 | 1,756 | |||||||||||||
Other liabilities | 28 | 35,917 | 32,112 | 26,898 | 21,938 | |||||||||||||
Employee benefits payable | 1,379 | 1,269 | 813 | 872 | ||||||||||||||
|
|
|
|
|
|
|
| |||||||||||
Total current liabilities | 115,593 | 130,759 | 124,360 | 131,452 | ||||||||||||||
|
|
|
|
|
|
|
| |||||||||||
Total liabilities | 353,178 | 351,109 | 358,979 | 389,716 | ||||||||||||||
|
|
|
|
|
|
|
| |||||||||||
Total liabilities and shareholders’ equity | US$ | 450,779 | US$ | 453,372 | US$ | 454,990 | US$ | 468,270 | ||||||||||
|
|
|
|
|
|
|
| |||||||||||
The accompanying notes are part of these financial statements.
F-336
Table of Contents
DISTRIBUIDORA DE ELECTRICIDAD DE OCCIDENTE, S. A.—DEOCSA
STATEMENTS OF CHANGES IN SHAREHOLDERS’ EQUITY
FOR THE YEARS ENDED DECEMBER 31, 2015, 2014 AND 2013 (RESTATED) AND JANUARY 1, 2013 (RESTATED)
(Stated in thousands of US dollars, except otherwise indicated)
Accumulated Other Comprehensive Income (Loss) | ||||||||||||||||||||||||||||||||
Capital | Legal | Retained | Cash | Remeasure- | Translation | Accumulated | Total | |||||||||||||||||||||||||
Balances as of January 1, 2013 as reported | US$ | 63,200 | US$ | 9,122 | US$ | 10,983 | US$ | — | $ | — | US$ | — | US$ | (451 | ) | US$ | 82,854 | |||||||||||||||
Restatement adjustments (Note 1b) | — | — | 457 | — | (451 | ) | — | 451 | 457 | |||||||||||||||||||||||
Translation differences | — | — | — | — | — | (4,758 | ) | — | (4,758 | ) | ||||||||||||||||||||||
|
|
|
|
|
|
|
|
|
|
|
|
|
|
|
| |||||||||||||||||
Balance as of January 1, 2013, as restated | 63,200 | 9,122 | 11,440 | — | (451 | ) | (4,758 | ) | — | 78,553 | ||||||||||||||||||||||
Movement for the year 2013 | ||||||||||||||||||||||||||||||||
Transfer to legal reserve | — | 386 | (386 | ) | — | — | — | — | — | |||||||||||||||||||||||
Remeasurement of defined benefit obligation, net of income tax, as restated. | — | — | — | — | 214 | — | 214 | |||||||||||||||||||||||||
Loss from cash flow hedge, net of income tax, as restated | — | — | — | (869 | ) | — | — | (869 | ) | |||||||||||||||||||||||
Translation differences | — | — | — | — | — | 646 | — | 646 | ||||||||||||||||||||||||
Profit for the year, as restated | — | — | 17,468 | — | — | — | 17,468 | |||||||||||||||||||||||||
|
|
|
|
|
|
|
|
|
|
|
|
|
|
|
| |||||||||||||||||
Balances as of December 31,2013, as restated | 63,200 | 9,508 | 28,522 | (869 | ) | (237 | ) | (4,112 | ) | 96,012 | ||||||||||||||||||||||
Movement for the year 2014 | ||||||||||||||||||||||||||||||||
Transfer to legal reserve | — | 570 | (570 | ) | — | — | — | — | — | |||||||||||||||||||||||
Remeasurement of defined benefit obligation, net of income tax, as restated | — | — | — | — | (569 | ) | — | — | (569 | ) | ||||||||||||||||||||||
Gain from cash flows hedge, net income tax, as restated | — | — | — | 345 | — | — | — | 345 | ||||||||||||||||||||||||
Profit for the year, as restated | — | — | 3,327 | — | — | — | — | 3,327 | ||||||||||||||||||||||||
Translation differences | — | — | — | — | — | 3,148 | — | 3,148 | ||||||||||||||||||||||||
|
|
|
|
|
|
|
|
|
|
|
|
|
|
|
| |||||||||||||||||
Balances as of December 31, 2014, as restated | US$ | 63,200 | US$ | 10,078 | US$ | 31,279 | US$ | (524 | ) | US$ | (806 | ) | US$ | (964 | ) | US$ | — | US$ | 102,263 | |||||||||||||
F-337
Table of Contents
DISTRIBUIDORA DE ELECTRICIDAD DE OCCIDENTE, S. A.—DEOCSA
STATEMENTS OF CHANGES IN SHAREHOLDERS’ EQUITY (cont’d)
FOR THE YEARS ENDED DECEMBER 31, 2015, 2014 AND 2013 (RESTATED) AND JANUARY 1, 2013 (RESTATED)
(Stated in thousands of US dollars, except otherwise indicated)
Accumulated Other Comprehensive Income (Loss) | ||||||||||||||||||||||||||||||||
Capital | Legal | Retained | Cash | Remeasure- | Translation | Accumulated | Total | |||||||||||||||||||||||||
Movement for the year 2015 | ||||||||||||||||||||||||||||||||
Transfer from legal reserve | — | (756 | ) | 756 | — | — | — | — | — | |||||||||||||||||||||||
Cash dividends declared | — | — | (25,027 | ) | — | — | — | — | (25,027 | ) | ||||||||||||||||||||||
Remeasurement of defined benefit obligation, net of income tax | — | — | — | — | (554 | ) | — | — | (554 | ) | ||||||||||||||||||||||
Gain from cash flows hedge, net income tax | — | — | — | 356 | — | — | — | 356 | ||||||||||||||||||||||||
Profit for the year, as restated | — | — | 21,053 | — | — | — | — | 21,053 | ||||||||||||||||||||||||
Translation differences | — | — | — | — | — | (490 | ) | — | (490 | ) | ||||||||||||||||||||||
|
|
|
|
|
|
|
|
|
|
|
|
|
|
|
| |||||||||||||||||
Balances as of December 31, 2015, as restated | US$ | 63,200 | US$ | 9,322 | US$ | 28,061 | US$ | (168 | ) | US$ | (1,360 | ) | US$ | (1,454 | ) | US$ | — | US$ | 97,601 | |||||||||||||
|
|
|
|
|
|
|
|
|
|
|
|
|
|
|
| |||||||||||||||||
The accompanying notes are part of these financial statements.
F-338
Table of Contents
DISTRIBUIDORA DE ELECTRICIDAD DE OCCIDENTE, S. A.—DEOCSA
FOR THE YEARS ENDED AT DECEMBER 31, 2015, 2014 AND 2013
(Stated in thousands of US dollars, except otherwise indicated)
2015 | 2014 | 2013 | ||||||||||
CASH FLOWS FROM OPERATING ACTIVITIES: | ||||||||||||
Profit for the year | US$ | 21,053 | US$ | 3,327 | US$ | 17,468 | ||||||
Adjustments from: | ||||||||||||
Depreciation and amortization | 15,699 | 15,125 | 16,109 | |||||||||
Accrued revenue—government grants | (3,327 | ) | (3,607 | ) | (3,760 | ) | ||||||
Impairment losses recognized on receivables from doubtful accounts | 19,112 | 15,271 | 10,287 | |||||||||
Provision for contingencies | (50 | ) | (941 | ) | 97 | |||||||
Loss (Gain) on disposal of property, plant and equipment | 108 | 15 | (17 | ) | ||||||||
Interest from deposits received from consumers | 3,793 | 3,291 | 2,685 | |||||||||
Effective cash flows hedge | (169 | ) | 119 | 158 | ||||||||
Finance costs recognized in profit or loss | 12,489 | 10,797 | 12,059 | |||||||||
Exchange differences | (21 | ) | (3,776 | ) | (1,079 | ) | ||||||
Income tax expense | 7,041 | 27,998 | 7,838 | |||||||||
Provision for obsolete inventories | 634 | — | — | |||||||||
Changes in working capital: | ||||||||||||
Inventory | (825 | ) | (377 | ) | (92 | ) | ||||||
Other assets | 113 | (12 | ) | 186 | ||||||||
Trade receivables | (17,957 | ) | (24,411 | ) | (18,796 | ) | ||||||
Other receivables | (2,164 | ) | 751 | (453 | ) | |||||||
Current tax assets | 652 | — | (106 | ) | ||||||||
Related parties | (124 | ) | 170 | 2,862 | ||||||||
Severance pay compensation | (462 | ) | (513 | ) | (50 | ) | ||||||
Provisions for contingencies | (248 | ) | (586 | ) | (700 | ) | ||||||
Current tax liabilities | (1,154 | ) | 2,120 | 102 | ||||||||
Other liabilities | (1,178 | ) | 89 | 1,047 | ||||||||
Trade and other accounts payable | 7,113 | (12,140 | ) | (12,779 | ) | |||||||
Creditors | (546 | ) | (563 | ) | 11 | |||||||
Employee benefits payable | 118 | 431 | (70 | ) | ||||||||
|
|
|
|
|
| |||||||
Cash from operating activities | 59,700 | 32,578 | 33,007 | |||||||||
Income tax paid | (16,170 | ) | (5,176 | ) | (4,448 | ) | ||||||
Payment of interest | (12,489 | ) | (10,797 | ) | (12,059 | ) | ||||||
|
|
|
|
|
| |||||||
Net cash flows generated from operating activities | 31,041 | 16,605 | 16,500 | |||||||||
|
|
|
|
|
| |||||||
F-339
Table of Contents
DISTRIBUIDORA DE ELECTRICIDAD DE OCCIDENTE, S. A.—DEOCSA
STATEMENTS OF CASH FLOWS (cont’d)
FOR THE YEARS ENDED AT DECEMBER 31, 2015, 2014 AND 2013
(Stated in thousands of US$ dollars, except otherwise indicated)
2015 | 2014 | 2013 | ||||||||||
CASH FLOWS FROM INVESTING ACTIVITIES: | ||||||||||||
Payments for property, plant and equipment | US$ | (11,843 | ) | US$ | (11,468 | ) | US$ | (13,970 | ) | |||
Payments for intangible assets | (670 | ) | (939 | ) | (1,032 | ) | ||||||
Proceeds from disposal of property, plant and equipment | 171 | 32 | 33 | |||||||||
|
|
|
|
|
| |||||||
Net cash flows used in investing activities | (12,342 | ) | (12,375 | ) | (14,969 | ) | ||||||
|
|
|
|
|
| |||||||
CASH FLOWS FROM FINANCING ACTIVITIES: | ||||||||||||
Funds received from government grants | 174 | 1,084 | 3,581 | |||||||||
Loans obtained from banks | 58,808 | 47,754 | 22,151 | |||||||||
Restricted cash | (487 | ) | 57 | (253 | ) | |||||||
Accounts receivable/payable to related parties | (8,891 | ) | 9,035 | (2,848 | ) | |||||||
Long-term creditors | 1,577 | 1,975 | (20 | ) | ||||||||
Payment of dividends | (25,104 | ) | — | — | ||||||||
Payment of bank loans | (45,026 | ) | (79,675 | ) | (43,874 | ) | ||||||
|
|
|
|
|
| |||||||
Net cash flows used in financing activities | (18,949 | ) | (19,770 | ) | (21,263 | ) | ||||||
|
|
|
|
|
| |||||||
NET DECREASE IN CASH AND CASH EQUIVALENTS | (250 | ) | (15,540 | ) | (19,732 | ) | ||||||
Effects of exchange rate changes on cash and cash equivalents | (169 | ) | 1,346 | 372 | ||||||||
CASH AND CASH EQUIVALENTS AT THE BEGINNING OF THE YEAR | 5,622 | 19,816 | 39,176 | |||||||||
|
|
|
|
|
| |||||||
CASH AND CASH EQUIVALENTS AT YEAR-END | US$ | 5,203 | US$ | 5,622 | US$ | 19,816 | ||||||
|
|
|
|
|
| |||||||
The accompanying notes are part of these financial statements.
F-340
Table of Contents
DISTRIBUIDORA DE ELECTRICIDAD DE OCCIDENTE, S. A.—DEOCSA
NOTES TO THE FINANCIAL STATEMENTS
AS OF DECEMBER 31, 2015, 2014 AND 2013 AND JANUARY 1, 2013 (RESTATED),
AND FOR THE YEARS ENDED DECEMBER 31, 2015, 2014 AND 2013 (RESTATED)
(Stated in thousands of US Dollars, except otherwise indicated)
| 1. | OPERATIONS OF THE COMPANY AND BASIS OF PREPARATION OF THE FINANCIAL STATEMENTS |
| a. | Operations of the Company |
Distribuidora de Electricidad de Occidente, Sociedad Anónima—DEOCSA (“the Company” or “DEOCSA”) (majority-owned subsidiary of DEOCSA B.V.) was incorporated on October 28, 1998 in the Republic of Guatemala to operate for an indefinite period. It is located in the City of Guatemala and its address is Diagonal 6, 10-50, Zona 10.
The Company’s main activity consists in the distribution of electric energy to final consumers in the departments of Quetzaltenango, San Marcos, Totonicapán, Huehuetenango, Chimaltenango, Sololá, Suchitepéquez, Retalhuleu and Quiché.
All the revenues and non-current assets of the Company are generated and are located, respectively, in Guatemala.
The Company classifies its distribution services as residential, commercial, industrial, municipal and governmental. In order to carry out its activity, the Company buys energy from Jaguar Energy,Instituto Nacional de Electrificación—INDE (National Institute of Electrification), Hidro Xacbal, S. A., Renace, Biomass Energy and Duke Energy Guatemala and Compañía, S.C.A.
Under Agreement No. 401-98 of the Ministry of Energy and Mining dated December 14, 1998 the Empresa de Distribución de Energía Eléctrica del INDE (the Electric Energy Distribution Company of INDE)—Western Region—EDEEROC, was authorized to transfer to the Company for a fifty-year period the service of final distribution of electricity in the abovementioned departments (the “Concession”).
The authorization granted for the Concession can either be terminated (i) by finalization of the original term or (ii) by the regulatory authorities due to non-compliance of the obligations assumed in the Concession, in accordance with the procedures set in the Title III, Chapter III of the General Electricity Law. Once the authorization is terminated, rights and goods relating to the Concession will be auctioned publicly as an economic unit, within one hundred and eighty (180) days. The former concessionaire can participate of the auction process except in the event the authorization had been terminated for poor quality of the service. From the value obtained in the auction process, the Ministry of Energy and Mining will deduct the expenses incurred and debts that the former concessionaire may have and the remaining amount will be transferred to the former concessionaire. Under the General Electricity Law and the regulations of the National Commission of Electric Energy (CNEE in Spanish), the tariffs that the Company charges to its regulated customers are subject to the approval of the CNEE. DEOCSA charges distribution tariffs for all electricity delivered through its distribution system, whether to its customers or customers of wholesale electricity brokers. There are seven different tariffs that are applicable to DEOCSA’s customers.
The DEOCSA´s tariffs are comprised of (1) an electricity charge designed to reimburse the distribution company for the cost of electricity and capacity that it purchases and transmission tolls, and (2) a Value
F-341
Table of Contents
DISTRIBUIDORA DE ELECTRICIDAD DE OCCIDENTE, S. A.—DEOCSA
NOTES TO THE FINANCIAL STATEMENTS
AS OF DECEMBER 31, 2015, 2014 AND 2013 AND JANUARY 1, 2013 (RESTATED),
AND FOR THE YEARS ENDED DECEMBER 31, 2015, 2014 AND 2013 (RESTATED)
(Stated in thousands of US Dollars, except otherwise indicated)
| 1. | OPERATIONS OF THE COMPANY AND BASIS OF PREPARATION OF THE FINANCIAL STATEMENTS (cont’d) |
Added Distribution (VAD) charge designed to permit DEOCSA to cover its operating expenses, complete its capital expenditure plans and recover its cost of capital. The electricity charge consists of a base tariff and an electricity adjustment surcharge. Under the General Electricity Law and the regulations of the CNEE, the base tariff is adjusted annually each May 1 to reflect anticipated changes in the cost of electricity to be purchased by DEORSA during the following year. The electricity adjustment surcharge is adjusted quarterly by the CNEE to reflect variations in the actual cost of electricity purchased by DEOCSA from the projected cost. Any resulting variation in each quarter is considered by the CNEE in the determination of the applicable tariffs for the next quarter or even in subsequent periods, in the latter case if such differences were to be considered significant by the CNEE and agreement with Distributor were obtained. The authorization given by the government to increase or decrease prices in the future is merely a pricing mechanism that regulates prices for the following periods, and does not give rise to an asset or liability and additional or less revenue in the current period. The recovery of the operating loss or the payment of the operating income is included in the calculation of the price the regulated entity may charge to its customers and should be recognized only when such revenues are received or receivable. It is appropriate to recognize an asset for the recovery of actual costs incurred or a liability for the refund of amounts over billed whenever the right or obligation exists independently of the delivery of future services. It is difficult to determine whether the rights and obligations exist separately, particularly when there is no history of recovery or refund other than through invoices for future service. The results of this tariff adjustment process is reflected by the CNEE through quarterly resolutions and communicated to the Company for its application in subsequent periods (Note 35).
The “VAD” component of the distribution tariff is revised every five years with semi-annual adjustments for inflation and local currency exchange rates against the US dollar. The VAD charges are set by a panel of three regulators who are appointed based on certain technical and professional criteria. The VAD charge was last set in January 2014 and will expire in January 2019.
Until December 15, 1998, INDE was the majority shareholder of the Company and on that date, it sold its shares to Compañía Distribuidora Eléctrica del Caribe, S.A.—DECSA or Caribbean Electric Distributor Company, a subsidiary of Unión Fenosa Internacional—UFI or the “Operator” (an international operator that was the owner of 99.99% of the paid-in capital of such subsidiary). As part of the obligations acquired by the Operator, there is the implementation through the Company of the rural electrification projects, included in the “Agreement of Management Trust—INDE—Western and Eastern Rural Works” and the “Agreement of Construction of Electric Energy Transmission Works” signed between the Company and INDE (Note 31).
In October 2004, the Company was a subsidiary owned by Distribuidora Eléctrica del Caribe, S. A. in 90.83% and from that month it became part of Unión Fenosa Internacional-UFI (the “Operator”) in the same percentage. As a consequence, Unión Fenosa Internacional-UFI became the parent company.
During the first quarter of 2009, Gas Natural SDG, S. A. reached a total share participation of 95.2% of the capital of Unión Fenosa, S. A.
F-342
Table of Contents
DISTRIBUIDORA DE ELECTRICIDAD DE OCCIDENTE, S. A.—DEOCSA
NOTES TO THE FINANCIAL STATEMENTS
AS OF DECEMBER 31, 2015, 2014 AND 2013 AND JANUARY 1, 2013 (RESTATED),
AND FOR THE YEARS ENDED DECEMBER 31, 2015, 2014 AND 2013 (RESTATED)
(Stated in thousands of US Dollars, except otherwise indicated)
| 1. | OPERATIONS OF THE COMPANY AND BASIS OF PREPARATION OF THE FINANCIAL STATEMENTS (cont’d) |
As a consequence of this process and from April 23, 2009 Gas Natural, SDG, S. A. took over the management of the financial and exploitation policies.
On May 19, 2011, the Company was acquired in its majority by DEOCSA B.V., a company owned byFondo de Inversiones Actis(Actis Investing Fund) (parent and ultimate holding company), through ASCOED, S.A. in 90.70%.
On June 17, 2011 the General Shareholders’ Meeting of DEOCSA agreed to merge DEOCSA with ASCOED, S.A., through the acquisition of the latter and the acceptance of the inherent rights and obligations from DEOCSA. The merger took effect on November 2, 2011.
As a result of the acquisition, the Company ceased as being part of the group Gas Natural Fenosa and the operations kept with the companies of such group stopped having effect in 2011.
As further described in Note 35, on January 22, 2016, I.C. Power Ltd., a subsidiary of Kenon Holdings Ltd (“Kenon”), acquired all of the shares of DEOCSA BV, owner of 90.70% of the Company’s capital stock.
| b. | Basis of Preparation of the Financial Statements |
These financial statements were prepared by the Company for its filing by IC Power Ltd., the Company’s current indirect controlling shareholder (Note 35), in a Registration Statement to be filed with the U.S. Securities and Exchange Commission.
These financial statements were prepared originally in Quetzal, the Company’s functional currency, and were translated into U. S. dollars, the presentation currency.
The Company’s financial statements as of and for the years ended December 31, 2015, 2014 and 2013 and January 1, 2013 have been restated as explained below.
Restatement of the Financial Statements
Subsequent to the issuance of the financial statements of DEOCSA as of December 31, 2015 and 2014 and for the years then ended, and as of December 31, 2014 and 2013 and for the years then ended, the Company restated such financial statements for the correction of errors as stated below:
| a.1 | According to the electricity tariff scheme agreed with the CNEE, which stipulates tariff revisions based on actual distribution costs on a quarterly basis, the Company is entitled to charge its customers based on the agreed-upon tariffs when actual distribution costs for the quarter is different (see Note 1.a). Consequently, up to the year ended December 31, 2014, the Company recognized as a regulatory asset or liability the difference between the revenues actually billed to customers at the agreed- upon tariffs in a stated quarter and the revenues that would have been |
F-343
Table of Contents
DISTRIBUIDORA DE ELECTRICIDAD DE OCCIDENTE, S. A.—DEOCSA
NOTES TO THE FINANCIAL STATEMENTS
AS OF DECEMBER 31, 2015, 2014 AND 2013 AND JANUARY 1, 2013 (RESTATED),
AND FOR THE YEARS ENDED DECEMBER 31, 2015, 2014 AND 2013 (RESTATED)
(Stated in thousands of US Dollars, except otherwise indicated)
| 1. | OPERATIONS OF THE COMPANY AND BASIS OF PREPARATION OF THE FINANCIAL STATEMENTS (cont’d) |
| recognized had actual distribution costs have been passed-through to clients in such stated quarter. As of December 31, 2014, 2013 and January 1, 2013, as a result of the difference mentioned above, the Company had recognized as a regulatory liability an amounts of US$ 14,012, US$ 10,595 and US$ 2,576, respectively. During 2015, the Company concluded that no regulatory assets or regulatory liabilities are to be recognized since they did not meet the definition of an asset or a liability, as the recognition of an asset or a liability will depend on the existence of actual future sales to customers. As a result, the Company revised its accounting and reversed the previously recognized regulatory liabilities as of those dates as well as the corresponding adjustment to the deferred income tax. |
| a.2 | The Company, at each reporting date, records an estimated accrued revenue for unbilled sales of energy and tolls (Note 3.h). This estimate considers the consumption of kilowatt/hour between the date of the last reading cycle and the end of each reporting period using the current approved rates and a factor for technical losses. During 2015, the Company identified and corrected an error in the calculation of the estimate, which generated an overstatement in energy sales for the year ended December 31, 2014 and 2013, and the corresponding overstatement in trade receivables as of December 31, 2014, 2013 and January 1, 2013 of US$ 3,188, US$ 2,591 and US $ 1,957 respectively. As a result, the Company reversed the excess revenue and trade receivables recognized as well as corresponding adjustment to the deferred income tax as of December 31, 2014, 2013 and January 1, 2013 and for the years then ended. |
| a.3 | As of December 31, 2014, 2013 and January 1, 2013, the Company had separately presented the deferred tax assets and deferred tax liabilities in the statement of financial position. During 2015, the Company revised this presentation and concluded that it should offset the deferred tax assets and deferred tax liabilities as the entity has a legally enforceable right to set off current tax assets against current tax liabilities; and income taxes were levied by the same taxation authority. As a result, the Company presented the net deferred income tax liabilities as a single line item in the statement of financial position as of December 31, 2014, 2013 and January 1, 2013. |
| a.4 | As of December 31, 2014, 2013 and January 1, 2013, the Company jointly presented the items comprising other comprehensive income in the statement of profit or loss and other comprehensive income and the statements of changes in Shareholders´ equity. During 2015, the Company revised this presentation and concluded that it should present separately the items comprising other comprehensive income according to the different nature of each item. As a result, the Company restated this presentation and disclosed separately the items comprising other comprehensive income in the statement of profit or loss and other comprehensive income and the statements of changes in Shareholders´ equity as of December 31, 2014, 2013 and January 1, 2013. |
| a.5 | During 2014 and 2013, energy levies were presented as “General, selling and administrative expenses”. During 2015, the Company has revised this presentation and concluded that, based on |
F-344
Table of Contents
DISTRIBUIDORA DE ELECTRICIDAD DE OCCIDENTE, S. A.—DEOCSA
NOTES TO THE FINANCIAL STATEMENTS
AS OF DECEMBER 31, 2015, 2014 AND 2013 AND JANUARY 1, 2013 (RESTATED),
AND FOR THE YEARS ENDED DECEMBER 31, 2015, 2014 AND 2013 (RESTATED)
(Stated in thousands of US Dollars, except otherwise indicated)
| 1. | OPERATIONS OF THE COMPANY AND BASIS OF PREPARATION OF THE FINANCIAL STATEMENTS (cont’d) |
| their nature, it corresponded to be presented as “Other costs of sales”. As a result, the Company has reclassified such costs and presented them as “Other costs of sales” in the statement of profit or loss and other comprehensive income. |
| a.6 | As of December 31, 2015, 2014, 2013 and January 1, 2013, the Company presented the deposits received from customers and their corresponding accumulated interest as other long term liabilities. During 2015, the Company revised the presentation and concluded that it should be presented as a current liability since the Company do not have legal rights to defer this payment for at least twelve months after the balance sheet date. |
| a.7 | The Company, at each reporting date, records the deferred income tax related to the Goodwill (Note 3.e) as the Goodwill is amortized for tax purposes (deductible amount). The Company identified and corrected an error in the calculation of the deductible amount used to determine the deferred income tax related to the Goodwill for 2014. This calculation error generated an understatement of the deferred income tax liability as of December 31, 2015 and 2014 and the corresponding understatement in deferred income tax expense for the year 2014 of US$ 2,396. As a result, the Company recalculated and corrected the corresponding deferred income tax as of those dates and the impact in profit or loss for 2014. |
| a.8 | During the years ended December 31, 2015 and 2014 , recoveries of provisions for contingencies were presented as “Other revenues” and as part of the “Other cost of sales” during 2013. The Company has revised this presentation and concluded that, based on their nature, it corresponded to be presented as “Other income”. As a result, the Company has reclassified such recoveries and presented them as “Other income” in the statement of profit or loss and other comprehensive income for all the years presented. |
| a.9 | During the years ended December 31, 2015, 2014 and 2013, sundry services related mainly to the expenses for the collection of accounts receivable from third parties, commissions on collection were presented as “Other costs of sales”. The Company has revised this presentation and concluded that, based on their nature, it corresponded to be presented as “General, selling and administrative expenses”. As a result, the Company has reclassified such costs and presented them as “General, selling and administrative expenses” in the statement of profit or loss and other comprehensive income for all the years presented. |
Accordingly, the financial statements as of December 31, 2015, 2014 and 2013 and for the years then ended were restated for the correction of the above-mentioned errors. The Company also restated the balances as of January 1, 2013, as applicable.
F-345
Table of Contents
DISTRIBUIDORA DE ELECTRICIDAD DE OCCIDENTE, S. A.—DEOCSA
NOTES TO THE FINANCIAL STATEMENTS
AS OF DECEMBER 31, 2015, 2014 AND 2013 AND JANUARY 1, 2013 (RESTATED),
AND FOR THE YEARS ENDED DECEMBER 31, 2015, 2014 AND 2013 (RESTATED)
(Stated in thousands of US Dollars, except otherwise indicated)
| 1. | OPERATIONS OF THE COMPANY AND BASIS OF PREPARATION OF THE FINANCIAL STATEMENTS (cont’d) |
The accumulated effect of the matters described above upon the financial statements is shown as follows:
31-12-2015 | Ref. | Amounts | Correction of | Restated | ||||||||||||
SHAREHOLDERS’ EQUITY | ||||||||||||||||
Retained earnings | a.7 | US$ | (30,457 | ) | US$ | 2,396 | US$ | (28,061 | ) | |||||||
ACCUMULATED OTHER COMPREHENSIVE INCOME | ||||||||||||||||
Accumulated other comprehensive loss—Translation differences | a.7 | US$ | 1,422 | US$ | 32 | US$ | 1,454 | |||||||||
NON-CURRENT LIABILITIES | ||||||||||||||||
Other long-term liabilities | a.6 | US$ | (37,350 | ) | US$ | 34,648 | US$ | (2,702 | ) | |||||||
Deferred income tax, net | a.7 | US$ | (3,176 | ) | US$ | (2,428 | ) | US$ | (5,604 | ) | ||||||
CURRENT LIABILITIES | ||||||||||||||||
Other liabilities | a.6 | US$ | (1,269 | ) | US$ | (34,648 | ) | US$ | (35,917 | ) | ||||||
STATEMENT OF PROFIT OR LOSS AND OTHER COMPREHENSIVE INCOME | ||||||||||||||||
Other revenue | a.8 | US$ | (3,370 | ) | US$ | 242 | US$ | (3,128 | ) | |||||||
Other costs of sales | a.9 | US$ | 41,326 | US$ | (3,810 | ) | US$ | 37,516 | ||||||||
General, selling and administrative expense | a.9 | US$ | 35,472 | US$ | 3,810 | US$ | 39,282 | |||||||||
Other income | a.8 | US$ | — | US$ | (242 | ) | US$ | (242 | ) | |||||||
31-12-2014 | Ref. | Amounts | Correction of | Restated | ||||||||||||
NON-CURRENT ASSETS | ||||||||||||||||
Deferred income tax | a1, a2, a3 | US$ | 17,981 | US$ | (17,981 | ) | US$ | — | ||||||||
CURRENT ASSETS | ||||||||||||||||
Trade receivable | a.2 | US$ | 67,719 | US$ | (3,188 | ) | US$ | 64,531 | ||||||||
SHAREHOLDERS’ EQUITY | ||||||||||||||||
Retained earnings | a1, a2 | US$ | (25,562 | ) | US$ | (5,717 | ) | US$ | (31,279 | ) | ||||||
ACCUMULATED OTHER COMPREHENSIVE INCOME | ||||||||||||||||
Accumulated other comprehensive Income | a.4 | US$ | 1,330 | US$ | (1,330 | ) | US$ | — | ||||||||
Accumulated other comprehensive income cash flows hedge | a.4 | US$ | — | US$ | 524 | US$ | 524 | |||||||||
Accumulated other comprehensive income— remeasurement of defined benefit obligation | a.4 | US$ | — | US$ | 806 | US$ | 806 | |||||||||
Accumulated other comprehensive loss—Translation difference | a.1, a.9 | US$ | 920 | US$ | 44 | US$ | 964 | |||||||||
F-346
Table of Contents
DISTRIBUIDORA DE ELECTRICIDAD DE OCCIDENTE, S. A.—DEOCSA
NOTES TO THE FINANCIAL STATEMENTS
AS OF DECEMBER 31, 2015, 2014 AND 2013 AND JANUARY 1, 2013 (RESTATED),
AND FOR THE YEARS ENDED DECEMBER 31, 2015, 2014 AND 2013 (RESTATED)
(Stated in thousands of US Dollars, except otherwise indicated)
| 1. | OPERATIONS OF THE COMPANY AND BASIS OF PREPARATION OF THE FINANCIAL STATEMENTS (cont’d) |
31-12-2014 | Ref. | Amounts | Correction of | Restated | ||||||||||
NON-CURRENT LIABILITIES | ||||||||||||||
Deferred income tax, net | a.1, a.6 | US$ | (20,454 | ) | US$ | 12,830 | US$ | (7,624 | ) | |||||
Other long-term liabilities | a.6 | US$ | (31,274 | ) | US$ | 29,652 | US$ | (1,622 | ) | |||||
CURRENT LIABILITIES | ||||||||||||||
Regulatory liabilities | a.1 | US$ | (14,012 | ) | US$ | 14,012 | US$ | — | ||||||
Other Liabilities | a.6 | US$ | (2,460 | ) | US$ | (29,652 | ) | US$ | (32,112 | ) | ||||
STATEMENT OF PROFIT OR LOSS AND OTHER COMPREHENSIVE INCOME | ||||||||||||||
Energy sales | a.2 | US$ | (318,483 | ) | US$ | (2,517 | ) | US$ | (321,000 | ) | ||||
Other revenue | a.8 | US$ | (7,056 | ) | US$ | 1,135 | US$ | (5,921 | ) | |||||
Other cost of sales | a.5, a9 | US$ | 38,047 | US$ | (1,723 | ) | US$ | 36,324 | ||||||
General, selling and administrative expense | a.5, a9 | US$ | 31,354 | US$ | 1,723 | US$ | 33,077 | |||||||
Other income | a.8 | US$ | — | US$ | (1,135 | ) | US$ | (1,135 | ) | |||||
Income Tax | a1, a2, a.7 | US$ | 25,090 | US$ | 2,908 | US$ | 27,998 | |||||||
31-12-2013 | Amounts | Correction of | Restated | |||||||||||||
NON-CURRENT ASSETS | ||||||||||||||||
Deferred Income Tax, net | a1, a2, a3 | US$ | 14,102 | US$ | (7,415 | ) | US$ | 6,687 | ||||||||
CURRENT ASSETS | ||||||||||||||||
Trade receivable | a.2 | US$ | 62,244 | US$ | (2,591 | ) | US$ | 59,653 | ||||||||
SHAREHOLDERS’ EQUITY | ||||||||||||||||
Retained earnings | a1, a2 | US$ | (22,639 | ) | US$ | (5,883 | ) | US$ | (28,522 | ) | ||||||
ACCUMULATED OTHER COMPREHENSIVE INCOME | ||||||||||||||||
Accumulated other comprehensive Income | a.4 | US$ | 1,106 | US$ | (1,106 | ) | US$ | — | ||||||||
Accumulated other comprehensive income—cash flows hedge | a.4 | US$ | — | US$ | 869 | US$ | 869 | |||||||||
Accumulated other comprehensive income—remeasurement of defined benefit obligation | a.4 | US$ | — | US$ | 237 | US$ | 237 | |||||||||
NON-CURRENT LIABILITIES | ||||||||||||||||
Deferred income Tax | a1, a2, | US$ | (5,294 | ) | US$ | 5,294 | US$ | — | ||||||||
Other long-term liabilities | a.6 | US$ | (25,139 | ) | US$ | 24,601 | US$ | (538 | ) | |||||||
CURRENT LIABILITIES | ||||||||||||||||
Regulatory liabilities | a.1 | US$ | (10,595 | ) | US$ | 10,595 | US$ | — | ||||||||
Other Liabilities | a.6 | US$ | (2,297 | ) | US$ | (24,601 | ) | US$ | (26,898 | ) | ||||||
F-347
Table of Contents
DISTRIBUIDORA DE ELECTRICIDAD DE OCCIDENTE, S. A.—DEOCSA
NOTES TO THE FINANCIAL STATEMENTS
AS OF DECEMBER 31, 2015, 2014 AND 2013 AND JANUARY 1, 2013 (RESTATED),
AND FOR THE YEARS ENDED DECEMBER 31, 2015, 2014 AND 2013 (RESTATED)
(Stated in thousands of US Dollars, except otherwise indicated)
| 1. | OPERATIONS OF THE COMPANY AND BASIS OF PREPARATION OF THE FINANCIAL STATEMENTS (cont’d) |
31-12-2013 | Amounts | Correction of | Restated | |||||||||||
STATEMENTS OF PROFIT OR LOSS AND OTHER COMPREHENSIVE INCOME | ||||||||||||||
Energy sales | a1, a2 | US$ | (297,807 | ) | US$ | (6,963 | ) | US$ | (304,770 | ) | ||||
Other costs of sales | a.5 a.8, a.9 | US$ | 36,872 | US$ | (2,280 | ) | US$ | 34,592 | ||||||
General, selling and administrative expenses | a.5, a.9 | US$ | 22,604 | US$ | 2,577 | US$ | 25,181 | |||||||
Other Income | a.8 | US$ | — | US$ | (297 | ) | US$ | (297 | ) | |||||
Income tax | a1, a2 | US$ | 6,290 | US$ | 1,548 | US$ | 7,838 | |||||||
01-01-2013 |
| Amounts | Correction of | Restated | ||||||||||||
NON CURRENT ASSET | ||||||||||||||||
Deferred income tax | a.1, a.2, a.3 | US$ | 9,851 | US$ | (1,984 | ) | US$ | 7,867 | ||||||||
CURRENT ASSET | ||||||||||||||||
Trade receivables | a.2 | US$ | 54,083 | US$ | (1,957 | ) | US$ | 52,126 | ||||||||
SHAREHOLDERS’ EQUITY | ||||||||||||||||
Retained earnings | a.1, a.2 | US$ | (10,983 | ) | US$ | (457 | ) | US$ | (11,440 | ) | ||||||
ACCUMULATED OTHER COMPREHENSIVE INCOME | ||||||||||||||||
Accumulated other comprehensive Income | a.4 | US$ | 451 | US$ | (451 | ) | US$ | — | ||||||||
Accumulated other comprehensive income— remeasurement of defined benefit obligation | a.4 | US$ | — | US$ | 451 | US$ | 451 | |||||||||
NON CURRENT LIABILITIES | ||||||||||||||||
Deferred income tax, net | US$ | 1,420 | US$ | (1,420 | ) | US$ | — | |||||||||
Other long-term Liabilities | a.6 | US$ | (22,295 | ) | US$ | 20,696 | US$ | (1,599 | ) | |||||||
CURRENT LIABILITIES | ||||||||||||||||
Regulatory liabilities | a.1 | US$ | 2,975 | US$ | (2,975 | ) | US$ | — | ||||||||
Other Liabilities | a.6 | US$ | (1,241 | ) | US$ | (20,697 | ) | US$ | (21,938 | ) | ||||||
The changes did not have impact on the Company´s net operating, investing and financing cash flows for the years 2015, 2014 and 2013.
In addition, during the preparation of these financial statements, for the purpose described in Note 1.b, the Company expanded certain disclosures from those previously presented.
F-348
Table of Contents
DISTRIBUIDORA DE ELECTRICIDAD DE OCCIDENTE, S. A.—DEOCSA
NOTES TO THE FINANCIAL STATEMENTS
AS OF DECEMBER 31, 2015, 2014 AND 2013 AND JANUARY 1, 2013 (RESTATED),
AND FOR THE YEARS ENDED DECEMBER 31, 2015, 2014 AND 2013 (RESTATED)
(Stated in thousands of US Dollars, except otherwise indicated)
| 2. | APPLICATION OF NEW AND REVISED INTERNATIONAL FINANCIAL REPORTING STANDARDS (IFRS) |
| 2.1. | New and amendments to IFRSs that are mandatorily effective for the current year |
In the current year, the Company has applied a number of amendments to IFRSs issued by the International Accounting Standards Board (IASB) that are mandatorily effective for the accounting period that begins on or after 1 January 2015:
Amendments to IAS 19 Defined Benefit plans: Employees’ Contributions
Amends IAS 19 Employee Benefits to clarify the requirements that relate to how contributions from employees or third parties that are linked to service should be attributed to periods of service. In addition, it permits a practical expedient if the amount of the contributions is independent of the number of years of service, in that contributions, can, but are not required, to be recognized as a reduction in the service cost in the period in which the related service is rendered.
The application to these amendments have not had any material impact on the disclosures or the amounts recognized in the Company’s financial statements.
Annual Improvements to the IFRS Terms 2010-2012 and 2011-2013
The Company has applied the amendments to IFRSs included in the Annual Improvements to IFRSs 2010-2012 Cycle and 2011 2013 Cycle for the first time in the current year. One of the annual improvements requires that the entities disclose judgments made in the application of the aggregation criteria established in paragraph 12 of the IFRS 8 Operation Segments.
The application of these amendments have not had an impact on the disclosures or amounts recognized in the Company’s financial statements since the Company does not report through operation segments. The application of the other amendments has had no impact on the disclosures or amounts recognized in the Company’s financial statements.
F-349
Table of Contents
DISTRIBUIDORA DE ELECTRICIDAD DE OCCIDENTE, S. A.—DEOCSA
NOTES TO THE FINANCIAL STATEMENTS
AS OF DECEMBER 31, 2015, 2014 AND 2013 AND JANUARY 1, 2013 (RESTATED),
AND FOR THE YEARS ENDED DECEMBER 31, 2015, 2014 AND 2013 (RESTATED)
(Stated in thousands of US Dollars, except otherwise indicated)
| 2. | APPLICATION OF NEW AND REVISED INTERNATIONAL FINANCIAL REPORTING STANDARDS (IFRS) (cont’d) |
| 2.2. | New and revised IFRS issued but not yet effective |
The Company has not applied the following new and revised IFRSs that have been issued but are not yet effective:
IFRS 9 | Financial Instruments3 | |
IFRS 1 | Revenue from Contracts with Customers3 | |
IFRS 16 | Leasing4 | |
Amendments to IFRS 11 | Accounting for Acquisitions of Interests in | |
Joint Operations1 | ||
Amendments to IAS 1 | Disclosure Initiative1 | |
Amendments to IAS 16 and IAS 38 | Clarification of Acceptable Methods of | |
Depreciation and Amortisation1 | ||
Amendments to IAS 16 and IAS 41 | Agriculture: Bearer Plants1 | |
Amendments to IFRS 10 and IAS 28 | Sale or Contribution of Assets between an | |
Investor and its Associate or Joint Venture5 | ||
Amendments to IFRS 10, IFRS 12 IAS 28 | Investment Entities: Applying the and | |
Consolidation Exception1 | ||
Amendments to IFRSs | Annual Improvements to IFRSs 2012-2014 | |
Cycle1 | ||
Amendments to IAS 7 | Statement of Cash Flows2 | |
Amendments to IAS 12 | Related to the Recognition of Deferred Tax | |
Assets for Unrealized Losses2 |
| 1 | Effective for annual periods beginning on or after January 1, 2016, with earlier application permitted. |
| 2 | Effective for annual periods beginning on or after January 1, 2017, with earlier application permitted. |
| 3 | Effective for annual periods beginning on or after January 1, 2018, with earlier application permitted. |
| 4 | Effective for annual periods beginning on or after January 1, 2019, with earlier application permitted. |
| 5 | Indefinitely deferred the effective date. |
IFRS 9 Financial Instruments
IFRS 9, issued in November 2009, incorporated new requirements for the classification and measurement of financial assets. IFRS 9 was subsequently modified in October 2010 in order to include the requirements for the classification and measurement of financial liabilities and for derecognition; in November 2013 it included the new requirements for the general hedge accounting. In July 2014, another revised version of the IFRS 9 was issued, mainly to include: a) requirements of impairment for financial assets and b) limited amendments to the requirements of classification and measurement by introducing a measurement category to “fair value through other comprehensive income” (FVTOCI) for certain simple debt instruments.
F-350
Table of Contents
DISTRIBUIDORA DE ELECTRICIDAD DE OCCIDENTE, S. A.—DEOCSA
NOTES TO THE FINANCIAL STATEMENTS
AS OF DECEMBER 31, 2015, 2014 AND 2013 AND JANUARY 1, 2013 (RESTATED),
AND FOR THE YEARS ENDED DECEMBER 31, 2015, 2014 AND 2013 (RESTATED)
(Stated in thousands of US Dollars, except otherwise indicated)
| 2. | APPLICATION OF NEW AND REVISED INTERNATIONAL FINANCIAL REPORTING STANDARDS (IFRS) (cont’d) |
Key requirements of IFRS 9:
| • | IFRS 9 requires that all the recognized financial assets that are within the scope of the IAS 39Financial Instruments: Recognition and Measurementare measured subsequently under the amortized cost method or the fair value method. Specifically, debt investments that are held within a business model whose objective is to collect the contractual cash flows, and that have contractual cash flows that are solely payments of principal and interest on the principal outstanding are generally measured at amortized cost at the end of subsequent accounting periods. Debt instruments that are held within a business model whose objective is achieved both by collecting contractual cash flows and selling financial assets, and that have contractual terms that give rise on specified dates to cash flows that are solely payments of principal and interest on the principal amount outstanding, are generally measured at FVTOCI. All other debt investments and equity investments are measured at their fair value at the end of subsequent accounting periods. In addition, under IFRS 9, entities may make an irrevocable election to present subsequent changes in the fair value of an equity investment (that is not held for trading) in other comprehensive income, with only dividend income generally recognized in profit or loss. |
| • | With respect to the measurement of the financial liabilities that are designated as fair value through profit or loss, the IFRS 9 requires that the change amount at fair value of the financial liability attributable to the changes in the credit risk of such liability is recognized in other comprehensive income, unless that the recognition of the effects of the changes in the liability credit risk in other comprehensive income creates or increases the accounting mismatch in profit or loss. Changes in fair value attributable to a financial liability’s credit risk are not subsequently reclassified to profit or loss. Under IAS 39, the entire amount of the change in the fair value of the financial liability designated as fair value through profit or loss is presented in profit or loss |
| • | With respect to the financial assets impairment, the IFRS 9 requires a model of impairment on expected credit loss, opposed to the expected credit loss model incurred, in conformity with IAS 39. The expected credit loss model requires that an entity records the expected credit losses and their changes in these expected credit losses at each reporting date in order to reflect the changes in the credit risk from the initial recognition. |
| • | The new general requirements for the hedge accounting retain the three types of mechanisms of hedge accounting that are currently available in IAS 39. In conformity with IFRS 9, the types of suitable transactions for the hedge accounting are much more flexible, specifically, by enlarging the types of instruments that are classified as hedge instruments and the types of risk components of non-financial items suitable to the hedge accounting. In addition, the effectiveness test has been overhauled and replaced with the principle of an ‘economic relationship’. Retrospective assessment of hedge effectiveness is also no longer required. Enhanced disclosure requirements about an entity’s risk management activities have also been introduced. |
The management of the Company foresee that the application of this new standard will not have a material impact over the Company’s financial statements.
F-351
Table of Contents
DISTRIBUIDORA DE ELECTRICIDAD DE OCCIDENTE, S. A.—DEOCSA
NOTES TO THE FINANCIAL STATEMENTS
AS OF DECEMBER 31, 2015, 2014 AND 2013 AND JANUARY 1, 2013 (RESTATED),
AND FOR THE YEARS ENDED DECEMBER 31, 2015, 2014 AND 2013 (RESTATED)
(Stated in thousands of US Dollars, except otherwise indicated)
| 2. | APPLICATION OF NEW AND REVISED INTERNATIONAL FINANCIAL REPORTING STANDARDS (IFRS) (cont’d) |
IFRS 15 Revenue from Contracts with Customers
In May 2014, IFRS 15 was issued which establishes an extensive and detailed model that will be used by the entities in the accounting for revenue from contracts with clients. The IFRS 15 will supersed the current guideline of revenue recognition, including IAS 18 Revenue, IAS 11 Construction Contracts and the related interpretations when it becomes effective.
The essential principle of IAS 15 is that a company should recognize revenue to represent the transfer of goods and services promised to the clients in an amount that reflects the consideration that the company expects to receive in exchange of the goods or services. Specifically, the standard adds a model of five steps to revenue recognition:
Step 1: Identify the contract with the clients.
Step 2: Identify the performance obligations in the contract.
Step 3: Determine the transaction price.
Step 4: Distribute the transaction price to the performance obligations in the contract.
Step 5: Recognize revenue when (or as) the entity satisfies the performance obligation.
Under IFRS 15, a Company records income when (or as) a performance obligation is satisfied, i.e., when the “control” of the goods and services based on a particular performance obligation is transferred to the client. Many other prescriptive guidelines have been added within the IFRS 15 to confront specific situations. Additionally, IFRS 15 requires extensive disclosures.
On April 12, 2016, the IASB amends IFRS 15 Revenue from Contracts with Customers to clarify three aspects of the standard (identifying performance obligations, principal versus agent considerations, and licensing) and to provide some transition relief for modified contracts and completed contracts.
The Company is evaluating this standard and cannot, at this time, estimate the potential impact on its future financial condition, results of operations and cash flows.
IFRS 16—Leasing
On January 13, 2016, the IASB issued IFRS 16, which brings most leases on the balance sheet for lessees under a single model, eliminating the distinction between operating and finance leases. For lessors, however, the accounting remains largely unchanged and the distinction between operating and finance leases is retained. IFRS 16 supersedes IAS 17 and related interpretations.
Under IFRS 16, a lessee recognizes a right-of-use asset and a lease liability. The right-of-use asset is treated similarly to other nonfinancial assets and depreciated accordingly, and the liability accrues interest. The lease liability is initially measured at the present value of the lease payments payable over the lease term, discounted at the rate implicit in the lease if this rate can be readily determined. If the rate cannot be readily determined, the lessee’s incremental borrowing rate should be used.
F-352
Table of Contents
DISTRIBUIDORA DE ELECTRICIDAD DE OCCIDENTE, S. A.—DEOCSA
NOTES TO THE FINANCIAL STATEMENTS
AS OF DECEMBER 31, 2015, 2014 AND 2013 AND JANUARY 1, 2013 (RESTATED),
AND FOR THE YEARS ENDED DECEMBER 31, 2015, 2014 AND 2013 (RESTATED)
(Stated in thousands of US Dollars, except otherwise indicated)
| 2. | APPLICATION OF NEW AND REVISED INTERNATIONAL FINANCIAL REPORTING STANDARDS (IFRS) (cont’d) |
Like IAS 17, IFRS 16 requires lessors to classify leases as operating or finance leases. A lease is classified as a finance lease if it transfers substantially all the risks and rewards of ownership of an underlying asset. Otherwise, the lease is classified as an operating lease. For finance leases, a lessor recognizes finance income over the lease term on the basis of a pattern reflecting a constant periodic rate of return on the net investment. For operating leases, a lessor recognizes lease payments as income on a straight-line basis or, if more representative of the pattern in which benefit from use of the underlying asset is diminished, another systematic basis.
IFRS 16 is effective for annual reporting periods beginning on or after January 1, 2019. Earlier application is permitted if an entity has also applied IFRS 15 (on revenue from contracts with customers).
The Company’s management estimate that the application of the IFRS 16 in the future might have a material impact on the amounts reported and the disclosures of the Company’s financial statements. However, it is not practicable to provide a reasonable estimate of the effect of this standard until the Company performs a detailed review.
Amendments to the IAS 1 Disclosure Initiative
Amendments to IAS 1 provide guidelines as to how to apply the materiality concept in the accounting practice.
Amendments to IAS 1 take effect for the annual period beginning on January 1, 2016. The Company’s management does not foresee that the application of these amendments to IAS 1 will have a material impact on the Company’s financial statements.
Amendments to IAS 16 and IAS 38 Clarification of Acceptable Methods of Depreciation and Amortization
Amendments of IAS 16 prohibit that the entities use a depreciation method based on the revenue for items of property, plant, and equipment. Amendments to IAS 38 introduce a rebuttable assumptions that states that revenue is not an appropriate principle for the amortization of an intangible asset. This assumption may be rebutted only in the two following circumstances:
| • | when the intangible asset is stated as a revenue measure, or |
| • | when it can be demonstrated that revenue and the consumption of economic benefits of the intangible asset are closely related. |
Amendments are applied prospectively for annual periods beginning on January 1, 2016 or after. Currently, the Company uses the straight-line method of depreciation and amortization for property, plant, equipment, and intangible assets, respectively. The management considers that this is the most
F-353
Table of Contents
DISTRIBUIDORA DE ELECTRICIDAD DE OCCIDENTE, S. A.—DEOCSA
NOTES TO THE FINANCIAL STATEMENTS
AS OF DECEMBER 31, 2015, 2014 AND 2013 AND JANUARY 1, 2013 (RESTATED),
AND FOR THE YEARS ENDED DECEMBER 31, 2015, 2014 AND 2013 (RESTATED)
(Stated in thousands of US Dollars, except otherwise indicated)
| 2. | APPLICATION OF NEW AND REVISED INTERNATIONAL FINANCIAL REPORTING STANDARDS (IFRS) (cont’d) |
appropriate method to reflect the consumption of economic benefits inherent to the respective assets; that is the reason why the Company’s management does not consider applicable these amendments to IAS 16 and IAS 38 for the Company’s financial statements.
Amendments to IAS 7—Statements of cash flows
On January 29, 2016, the IASB published amendments to IAS 7 as part of its disclosure initiative (i.e., projects to improve the effectiveness of financial reporting disclosures). The objective of the amendments is to clarify IAS 7 to improve information provided to financial statement users about an entity’s financing activities.
The amendments require that an entity disclose, to the extent necessary to meet the disclosure objective, the following changes in liabilities arising from financing activities:
| • | changes from financing cash flows; |
| • | changes arising from obtaining or losing control of subsidiaries or other businesses; |
| • | the effect of changes in foreign exchange rates; |
| • | changes in fair values; and |
| • | other changes. |
The IASB defines liabilities arising from financing activities as liabilities “for which cash flows were, or future cash flows will be, classified in the statement of cash flows as cash flows from financing activities.” The amendments indicate that the new disclosure requirements also apply to changes in financial assets that meet this definition. The amendments state that one way to meet the new disclosure requirements is to provide “a reconciliation between the opening and closing balances in the statement of financial position for liabilities arising from financing activities.”
The amendments are effective for annual periods beginning on or after January 1, 2017. Earlier application is permitted. The Company’s management foresees that the application of this amendment might have an impact on the Company’s financial statements if this type of transactions arises in the future.
Amendments to IAS 12 Related to the Recognition of Deferred Tax Assets for Unrealized Losses
On January 19, 2016, the IASB published final amendments to IAS 12. The amendments clarify the following:
| • | Unrealized losses on debt instruments measured at fair value and measured at cost for tax purposes “give rise to a deductible temporary difference [regardless] of whether the debt instrument’s holder expects to recover the carrying amount of the debt instrument by sale or by use.” |
F-354
Table of Contents
DISTRIBUIDORA DE ELECTRICIDAD DE OCCIDENTE, S. A.—DEOCSA
NOTES TO THE FINANCIAL STATEMENTS
AS OF DECEMBER 31, 2015, 2014 AND 2013 AND JANUARY 1, 2013 (RESTATED),
AND FOR THE YEARS ENDED DECEMBER 31, 2015, 2014 AND 2013 (RESTATED)
(Stated in thousands of US Dollars, except otherwise indicated)
| 2. | APPLICATION OF NEW AND REVISED INTERNATIONAL FINANCIAL REPORTING STANDARDS (IFRS) (cont’d) |
| • | “The carrying amount of an asset does not limit the estimation of probable future taxable profit.” |
| • | Estimates of future taxable profit exclude “tax deductions resulting from the reversal of deductible temporary differences.” |
| • | An entity assesses a deferred tax asset in combination with other deferred tax assets. When tax law restricts the utilization of tax losses, an entity assesses a deferred tax asset in combination with other deferred tax assets of the same type. |
The amendments are effective for annual periods beginning on or after January 1, 2017; earlier application is permitted. The management of the Company do not anticipate that the application of these amendments will have a material effect on the Company’s financial statements.
Annual Improvements to IFRS Term 2012-2014
The annual improvements of the IFRS’s of term 2012-2014 include a number of amendments to several IFRS’s which are summarized as follows:
Amendments to IFRS 5 show a specific orientation in IFRS 5, that is when the entity reclassifies an asset (or disposal group) held for sale to held for its distribution to owners (or vice versa).
Amendments to IFRS 7 provide an additional guideline to clarify whether a contract of services rendering corresponds to the continuous sharing participation in the transfer of an asset transferred for information disclosure effects of such asset.
Amendments to IAS 19 clarify that the rate used in order to discount the obligations from post-employment benefits must be determined in relation with the market yields on high quality corporate bonds at the end of the reporting period.
The management of the Company do not anticipate that the application of these amendments will have a material effect on the Company’s financial statements.
| 3. | SIGNIFICANT ACCOUNTING POLICIES |
The significant accounting policies used in the preparation of the financial statements are described as follows:
| a. | Statement of Compliance and Basis of Preparation—This financial statements were prepared according to the International Financial Reporting Standards (IFRS) as issued by the International Accounting Standards Board (IASB) in force at December 31, 2015, which include the International Financial Reporting Standards (IFRS), the International Accounting Standards (IAS),and the Interpretations issued by the International Financial Reporting Standards Committee (IFRIC), or by the former Standards Interpretation Committee (SIC) adopted by the IASB. The financial statements have |
F-355
Table of Contents
DISTRIBUIDORA DE ELECTRICIDAD DE OCCIDENTE, S. A.—DEOCSA
NOTES TO THE FINANCIAL STATEMENTS
AS OF DECEMBER 31, 2015, 2014 AND 2013 AND JANUARY 1, 2013 (RESTATED),
AND FOR THE YEARS ENDED DECEMBER 31, 2015, 2014 AND 2013 (RESTATED)
(Stated in thousands of US Dollars, except otherwise indicated)
| 3. | SIGNIFICANT ACCOUNTING POLICIES (cont’d) |
| been prepared on the historical cost basis except for certain financial instruments that are measured at fair values at the end of each reporting period, as explained in the accounting policies below. The historical cost is based generally in the fair value of the consideration given in exchange of goods and services. |
Fair value is the price that would be received to sell an asset or paid to transfer a liability in an orderly transaction between market participants at the measurement date, regardless of whether that price is directly observable or estimated using another valuation technique. In estimating the fair value of an asset or a liability, the Company takes into account the characteristics of the asset or liability if market participants would take those characteristics into account when pricing the asset or liability at the measurement date. Fair value for measurement and/or disclosure purposes in these consolidated financial statements is determined on such a basis, except for leasing transactions that are within the scope of IAS 17, and measurements that have some similarities to fair value but are not fair value, such as net realizable value in IAS 2 or value in use in IAS 36.
In addition, for financial reporting purposes, fair value measurements are categorized into Level 1, 2 or 3 based on the degree to which the inputs to the fair value measurements are observable and the significance of the inputs to the fair value measurement in its entirety, which are described as follows:
Level 1: The inputs are quoted prices (not adjusted) in active markets for assets or liabilities identical to those that the Company may access at the date of measurement.
Level 2: The inputs are different from the quoted prices included in Level 1, which are observable for the asset or liability, either directly or indirectly.
Level 3: The inputs are not observable for the asset or liability.
| b. | Functional and Presentation Currency |
The Company’s functional currency is the Quetzal (Q.), which is the currency of the primary economic environment in which the Company operates. The Quetzal is the monetary unit of Guatemala. The presentation currency for these financial statements is the United States Dollar (US$).
When preparing the Company’s financial statements, the transactions in currencies other than the functional currency (foreign currencies) are recognized using the exchange rates prevailing at the dates of the transactions. At the end of each reporting period, monetary items denominated in foreign currency are translated at the exchange rates prevailing at that date. Non-monetary items carried at fair value, denominated in foreign currency, are translated at the exchange rate in force at the date in which the fair value was determined. Non-monetary items calculated in terms of historical cost, in foreign currency, are not translated.
Exchange differences on monetary items are recognized in the profit or loss of the period in which they occur, except for the following cases:
| • | Exchange differences from loans in foreign currency related to assets in construction for productive use in the future, which is included in the cost of such assets for being considered as an adjustment to the costs from interests on such loans in foreign currency; and |
F-356
Table of Contents
DISTRIBUIDORA DE ELECTRICIDAD DE OCCIDENTE, S. A.—DEOCSA
NOTES TO THE FINANCIAL STATEMENTS
AS OF DECEMBER 31, 2015, 2014 AND 2013 AND JANUARY 1, 2013 (RESTATED),
AND FOR THE YEARS ENDED DECEMBER 31, 2015, 2014 AND 2013 (RESTATED)
(Stated in thousands of US Dollars, except otherwise indicated)
| 3. | SIGNIFICANT ACCOUNTING POLICIES (cont’d) |
| • | Exchange differences on transactions entered into in order to hedge certain foreign currency risks (see 3.o below for hedging accounting policies). |
The Company has presented its financial statements in US$ therefore, the financial statements prepared in the Company’s functional currency were translated into the presentation currency, as per the following procedures:
| • | Assets and liabilities of each of the statements of financial position presented are converted using the exchange rate at the statement of financial position closing date; |
| • | Items in the statement of profit or loss and other comprehensive income are converted using the exchange rate at the time the transactions were generated (or, for practical reasons, and provided the exchange rate has not changed significantly, using each month’s average exchange rate); |
All conversion differences resulting from the foregoing are recognized under “Other Comprehensive Income” and accumulated in equity.
| c. | Use of Estimates—The accounting policies that the Company follows require that the Management carries out certain estimates and use certain assumptions in order to determine the carrying amounts of assets and liabilities that are not readily apparent from other sources included in the financial statements and carry out the corresponding disclosures. Even if they differ in their actual result, Management considers that the estimates and assumptions used were adequate in the circumstances. The estimates and associated assumptions are based on historical experience and other factors that are considered to be relevant. Actual results may differ from these estimates. |
The estimates and underlying assumptions are reviewed on an ongoing basis. Revisions to accounting estimates are recognized in the period in which the estimate is revised. If the revision affects only that period, or in the period of the revision and future periods if the revision affects both current and future periods.
Critical Accounting Estimates and Assumptions
The Company prepares estimates and assumptions with regard to the future. Actual results may differ from these estimates.
The following are the key assumptions concerning the future, and other key sources of estimation uncertainty at the end of the reporting period that may have a significant risk of causing a material adjustment to the carrying amounts of assets and liabilities within the next financial year:
| • | Energy Purchase Provision |
The Company records on a monthly basis the provision of energy purchased not yet billed by estimating the energy received since the last measurement from the supplier. This provision consists in estimating the energy received since the last invoice from the supplier in the frontier spots and valuing it at the prices that the different energy suppliers define in the contract of energy purchase with the Company.
F-357
Table of Contents
DISTRIBUIDORA DE ELECTRICIDAD DE OCCIDENTE, S. A.—DEOCSA
NOTES TO THE FINANCIAL STATEMENTS
AS OF DECEMBER 31, 2015, 2014 AND 2013 AND JANUARY 1, 2013 (RESTATED),
AND FOR THE YEARS ENDED DECEMBER 31, 2015, 2014 AND 2013 (RESTATED)
(Stated in thousands of US Dollars, except otherwise indicated)
| 3. | SIGNIFICANT ACCOUNTING POLICIES (cont’d) |
| • | Energy Supplied Pending Invoicing |
In each monthly close period, the Company records in the account “Energy consumed, not billed” the amount of the accrued revenue not invoiced on the sale of electric energy. This provision consists in estimating the energy delivered since the last measurement date of the consumers and the accounting close period at the tariffs approved by the CNEE for each category of customer.
| • | Useful Lives of Property, Plant, and Equipment |
The Company reviews the estimated useful life of property, plant and equipment at the end of each annual period. Estimated useful lives are detailed in note 3d.
| • | Application of IFRIC 12 “Service Concession Arrangements” |
Interpretation No. 12 “Service Concession Arrangements” (IFRIC 12) establishes some accounting guidelines for private entities that provide public services under a service concession agreement or similar arrangement. IFRIC 12 is applicable to license holders depending, among other things, on the extent to which the grantor controls or regulates the services and any significant residual interest in the assets at the end of the term of the arrangement.
Considering that IFRIC 12 establishes general guidelines and principles, judgment is required to determine whether it is applicable due to the specific nature of each service concession or license and the complexity inherent in the different concepts included in its interpretation.
The Company has examined the characteristics, conditions and terms currently in effect under its electric energy distribution License and the guidelines established by IFRIC 12. On the basis of such analysis, the Company concluded that its license is outside the scope of IFRIC 12, primarily because the grantor does not control any significant residual interest in the infrastructure at the end of the term of the arrangement as explained in note 1.a and the possibility of renewal.
The Company accounts for the assets acquired or constructed in connection with the concession in accordance with IAS 16 Property, plant and equipment.
| d. | Property, Plant and Equipment—Technical facilities are recorded at cost less the subsequent accumulated depreciation and any recognized impairment loss. |
Properties in the course of construction for production, supply or administrative purposes are carried at cost, less any recognized impairment loss. Cost includes professional fees and, for qualifying assets, borrowing costs capitalized in accordance with the Company’s accounting policy. Such properties are classified to the appropriate categories of property, plant and equipment when completed and ready for intended use. Depreciation of these assets, on the same basis as other property assets, commences when the assets are ready for their intended use.
Tooling, furniture, and other equipment are stated at cost less accumulated depreciation and accumulated impairment losses.
F-358
Table of Contents
DISTRIBUIDORA DE ELECTRICIDAD DE OCCIDENTE, S. A.—DEOCSA
NOTES TO THE FINANCIAL STATEMENTS
AS OF DECEMBER 31, 2015, 2014 AND 2013 AND JANUARY 1, 2013 (RESTATED),
AND FOR THE YEARS ENDED DECEMBER 31, 2015, 2014 AND 2013 (RESTATED)
(Stated in thousands of US Dollars, except otherwise indicated)
| 3. | SIGNIFICANT ACCOUNTING POLICIES (cont’d) |
Property, plant, and equipment assets that require a process of construction are recorded at cost, which corresponds mainly to the following concepts:
| 1. | Feasibility studies:The Company has the policy of contracting an entity to carry out engineering feasibility surveys for projects of its own. Invoicing that complies with the recognition criteria is recorded as part of the property, plant and equipment. |
| 2. | Contractor costs:Work force for construction and start-up of the property, plant and equipment is in charge of independent contractors. Invoicing that complies with the recognition criteria is recorded as part of the property, plant and equipment in progress. |
| 3. | Materials: All important materials used in the construction and that comply with the recognition criteria (for example: posts, transformers, cables, among others). |
| 4. | Direct costs subject tocapitalization: The cost of the property, plant and equipment includes the cost of employee benefits arising directly from the construction of distribution and transmissions assets. |
Indirect capitalizations are originated by the following concept:
| • | Works for Property, Plant and Equipment: They correspond to personnel expenses related to the construction of property, plant and equipment. The Company allocates to property, plant and equipment personnel expenses according to the effective time dedicated by each worker to the process of construction of the property, plant and equipment. |
During 2015, 2014 and 2013, the Company capitalized to property, plant and equipment for the concept of personnel expenses the amount of US$ 1,691, US$ 1,575 and US$ 1,293, respectively.
| 5. | Cost of expansion or improvements: Improvements that extend substantially the useful life of the property, plant and equipment are recorded increasing its value, while maintenance, repairs and minor improvements are recorded in profit or loss of the period when incurred. |
| 6. | Replacements or refurbishments: Replacements or refurbishments of complete elements are recognized as an addition to the item and the corresponding derecognition of the item replaced. |
Depreciation is recognized in profit or loss.
Freehold land is not depreciated.
Depreciation is recognized so as to write off the cost of assets (other than freehold land and properties under construction) less their residual values.
F-359
Table of Contents
DISTRIBUIDORA DE ELECTRICIDAD DE OCCIDENTE, S. A.—DEOCSA
NOTES TO THE FINANCIAL STATEMENTS
AS OF DECEMBER 31, 2015, 2014 AND 2013 AND JANUARY 1, 2013 (RESTATED),
AND FOR THE YEARS ENDED DECEMBER 31, 2015, 2014 AND 2013 (RESTATED)
(Stated in thousands of US Dollars, except otherwise indicated)
| 3. | SIGNIFICANT ACCOUNTING POLICIES (cont’d) |
The property, plant, and equipment is depreciated under the straight-line method considering the estimated useful lives set out as follows:
Stage of Electrical Grid | Item | Estimated | ||
Substations | Power transformers | 30-40 | ||
Electromechanical equipment | 30-40 | |||
Telecontrol stations | 30 | |||
Battery systems | 30 | |||
Panel of control’s cabinet | 10-30 | |||
Civil works, optical fiber & | ||||
accessories | 30 | |||
Modem | 10 | |||
Medium voltage | Devices and equipment | 30-40 | ||
Lines | 30-40 | |||
Transf. MV/LV | Medium voltage (MV) | 30-35 | ||
Low voltage (LV) | 30-40 | |||
Meters and connections | Connections | 15-25 | ||
Electromechanic meters | 10-15 | |||
Electric meters | 15 | |||
Equipment and tools | 5 | |||
Furniture and other property, plant and equipment | 5 |
The estimated useful life, residual value and depreciation method are reviewed at the end of each period which is reported, being the effect of any change in the estimate registered regarding the prospective basis.
An item of property, plant and equipment is derecognized upon disposal or when no future economic benefits are expected to arise from the continued use of the asset. Any gain or loss arising on the disposal or retirement of an item of property, plant and equipment is determined as the difference between the sales proceeds and the carrying amount of the asset and is recognized in profit or loss.
| e. | Intangible Assets—The Company records as intangible assets the following concepts: |
| • | Goodwill |
Goodwill resulting from the acquisition of a subsidiary corresponds to the excess of the consideration transferred (including the value of any non-controlling participation in the acquiree, and the fair value of the acquirer’s previously held equity interest in the acquiree (if any)), over the identifiable net fair value of the assets, liabilities, contingent considerations of the subsidiary or the entity jointly controlled, recognized at the acquisition date. Goodwill is initially recognized as an asset at cost and, subsequently, presented at cost less any accumulated impairment loss, if any.
F-360
Table of Contents
DISTRIBUIDORA DE ELECTRICIDAD DE OCCIDENTE, S. A.—DEOCSA
NOTES TO THE FINANCIAL STATEMENTS
AS OF DECEMBER 31, 2015, 2014 AND 2013 AND JANUARY 1, 2013 (RESTATED),
AND FOR THE YEARS ENDED DECEMBER 31, 2015, 2014 AND 2013 (RESTATED)
(Stated in thousands of US Dollars, except otherwise indicated)
| 3. | SIGNIFICANT ACCOUNTING POLICIES (cont’d) |
The Company recognized goodwill that arose from the reverse merger with ASCOED, S.A. (former Company’s parent) in 2011. In such merger the Company absorbed ASCOED, S.A. and hence, it was the survival entity. This transaction was recognized as a reorganization of group entities under which the book values of ASCOED, S.A.’s assets and liabilities were included in the Company’s accounting records. Goodwill, for impairment assessment purposes, is allocated to the only cash generating unit that the Company has.
A cash-generating unit to which goodwill has been allocated is tested for impairment on an annual basis, or on a shorter period if there is evidence of impairment in any of the cash generating units. If the recoverable amount of the cash-generating unit is less than its carrying amount, the impairment loss is allocated first to reduce the carrying amount of any goodwill allocated to the unit and then to the other assets of the unit pro rata based on the carrying amount of each asset in the unit. Any impairment loss for goodwill is recognized directly to profit or loss of the period; these losses could not be reversed in the subsequent period. On disposal of the relevant cash-generating unit, the attributable amount of goodwill is included in the determination of the profit or loss on disposal.
| • | Costs of Licenses |
Intangible assets with finite useful lives that are acquired separately are carried at cost less accumulated amortization and accumulated impairment losses. The estimated useful life and amortization method are reviewed at the end of each reporting period, with the effect of any changes in estimate being accounted for on a prospective basis. Intangible assets with indefinite useful lives that are acquired separately are carried at cost less accumulated impairment losses.
An internally-generated intangible asset arising from development (or from the development phase of an internal project) is recognized if, and only if, all of the following have been demonstrated:
| • | the technical feasibility of completing the intangible asset so that it will be available for use or sale; |
| • | the intention to complete the intangible asset and use or sell it; |
| • | the ability to use or sell the intangible asset; |
| • | how the intangible asset will generate probable future economic benefits; |
| • | the availability of adequate technical, financial and other resources to complete the development and to use or sell the intangible asset; and |
| • | the ability to measure reliably the expenditure attributable to the intangible asset during its development. |
F-361
Table of Contents
DISTRIBUIDORA DE ELECTRICIDAD DE OCCIDENTE, S. A.—DEOCSA
NOTES TO THE FINANCIAL STATEMENTS
AS OF DECEMBER 31, 2015, 2014 AND 2013 AND JANUARY 1, 2013 (RESTATED),
AND FOR THE YEARS ENDED DECEMBER 31, 2015, 2014 AND 2013 (RESTATED)
(Stated in thousands of US Dollars, except otherwise indicated)
| 3. | SIGNIFICANT ACCOUNTING POLICIES (cont’d) |
The amount initially recognized for internally-generated intangible assets is the sum of the expenditure incurred from the date when the intangible asset first meets the recognition criteria listed above. Where no internally-generated intangible asset can be recognized, development expenditure is recognized in profit or loss in the period in which it is incurred. Subsequent to initial recognition, internally-generated intangible assets are reported at cost less accumulated amortization and accumulated impairment losses, on the same basis as intangible assets that are acquired separately.
The Company records in this account the purchase of licenses and the costs of software classifying them as intangible assets which are amortized during their estimated useful life of five years.
| • | Derecognition of Intangible Assets |
An intangible asset is derecognized on disposal, or when no future economic benefits are expected from use or disposal. Gains or losses arising from derecognition of an intangible asset, measured as the difference between the net disposal proceeds and the carrying amount of the asset, is recognized in profit or loss when the asset is derecognized.
| f. | Impairment of Tangible and Intangible Assets Including Goodwill—The Company reviews at the end of each reporting period the carrying amounts of its tangible and intangible assets to determine if there is evidence that such assets may have suffered an impairment loss. If there is any evidence, the recoverable amount of the asset is calculated with the purpose of determining the extent of the impairment loss (if any). When it is not possible to estimate the recoverable value of an individual asset, the Company estimates the recoverable value of the cash-generating unit to which the asset belongs. When a consistent and fair distribution basis is identified, the common assets are also distributed to the individual cash generating unit or, if not possible, to the smallest group of the cash generating units for which a consistent and fair distribution basis is identified. |
Intangible assets with an indefinite useful life (including goodwill) are revised on an annual basis for such purposes, as well as when there is evidence that the related asset might have suffered any value loss.
The recoverable value is the higher value between the fair value less the cost of selling it and the value in use. The value in use is determined based on future estimated cash flows discounted at its present value, using a discount rate before tax that reflects the current market valuations with regard to the time value of money and the specific risks of the asset for which the estimates of future cash flows have not been adjusted.
If the recoverable amount of an asset (or a cash generating unit) is estimated to be less than its carrying amount, the book value of the asset (cash generating unit) would be reduced to its recoverable amount. An impairment loss is recognized as an expense, unless the corresponding asset would be kept at revaluation value, in which case such losses would be recognized as a reduction of the revaluation surplus.
F-362
Table of Contents
DISTRIBUIDORA DE ELECTRICIDAD DE OCCIDENTE, S. A.—DEOCSA
NOTES TO THE FINANCIAL STATEMENTS
AS OF DECEMBER 31, 2015, 2014 AND 2013 AND JANUARY 1, 2013 (RESTATED),
AND FOR THE YEARS ENDED DECEMBER 31, 2015, 2014 AND 2013 (RESTATED)
(Stated in thousands of US Dollars, except otherwise indicated)
| 3. | SIGNIFICANT ACCOUNTING POLICIES (cont’d) |
When an impairment loss subsequently reverses, the carrying amount of the asset (or a cash-generating unit) is increased to the revised estimate of its recoverable amount, but so that the increased carrying amount does not exceed the carrying amount that would have been determined had no impairment loss been recognized for the asset (or cash-generating unit) in prior years. A reversal of an impairment loss is recognized immediately in profit or loss.
| g. | Inventory—Stock of materials, accessories, and other electric supplies are valued at the weighted average cost and do not exceed their net realizable value. |
Inventories are valued at the lower value between the cost and the net realizable value. The net realizable value is the selling price in the normal course of the business, less the costs to sell the inventory.
| h. | Revenue Recognition from the Activity of Electric Energy Distribution and Other Income from Exploitation—Revenue is measured at the fair value of the consideration received or receivable. Revenue is reduced for estimated customer returns, rebates and other similar allowances. Income is recognized when it is probable that the economic benefits associated to the transaction flow to the Company and the amount of revenue can be reliably measured. |
Sale of Energy
Revenue from the distribution of electric energy is recognized according to the energy delivered, through invoicing and the estimate of sales from the energy supplied which has not been billed yet at the reporting date.
Revenue from Services Rendered
Revenue from toll services is recognized in the accounting periods in which the services are rendered.
Revenue for connection fees is recognized by reference to the stage of completion of the contract determined by reference to the stage of completion of the installation, determined as the proportion of the total time expected to install that has elapsed at the end of the reporting period.
Interest Income
Interest income from a financial asset is recognized when it is probable that the Company receives economic benefits associated to the transaction and the amount of the income can be reliably measured. Interest income is accrued on a time basis with reference to the outstanding capital and the effective interest rate applicable, which is the discount rate that equals exactly the cash flows receivable or payable estimated throughout the expected life of the financial instrument with the net book value of the financial asset at the initial recognition.
| i. | Legal Reserve—In conformity with the Commerce Code of Guatemala, all mercantile Companies must allocate on an annual basis five per cent of their net taxable profit to constitute the legal reserve, which |
F-363
Table of Contents
DISTRIBUIDORA DE ELECTRICIDAD DE OCCIDENTE, S. A.—DEOCSA
NOTES TO THE FINANCIAL STATEMENTS
AS OF DECEMBER 31, 2015, 2014 AND 2013 AND JANUARY 1, 2013 (RESTATED),
AND FOR THE YEARS ENDED DECEMBER 31, 2015, 2014 AND 2013 (RESTATED)
(Stated in thousands of US Dollars, except otherwise indicated)
| 3. | SIGNIFICANT ACCOUNTING POLICIES (cont’d) |
| cannot be distributed as dividends until the Company is liquidated. However, this reserve can be capitalized when it becomes equivalent to, or represents more than 15 per cent of, the capital stock at the end of the previous period notwithstanding continuing to reserve such five per cent annually. |
| j. | Government Grants—Trust Fund of Rural Electrification Program— |
Government grants related to distribution projects of the Rural Electrification Program (PER, in Spanish) (see Notes 26 and 31) are not recognized until there is reasonable assurance that the Company will comply with the conditions attaching to them and that the grants will be received.
Government grants are recognized in profit or loss on a systematic basis over the periods in which the Company recognizes as expenses the related costs for which the grants are intended to compensate. Specifically, government grants whose primary condition is that the Company should purchase, construct or otherwise acquire non-current assets are recognized as deferred revenue in the statement of financial position and transferred to profit or loss on a systematic and rational basis over the useful lives of the related assets.
The works constructed by the Company with funds coming from grants (Note 31) are recorded at the value of the grant received and any difference between this value and the actual construction cost is recognized in profit or loss of the year in which the asset is released.
| k. | Advanced Payments of Debtors for third-party Construction Works—In the account “Advanced payments of debtors for third-party works” included in “Other liabilities”, the Company records as a liability the funds received from the “Trust Fund of Electric Energy” for projects of rural electric energy transmission in the departments of the Eastern region of the country, which are reduced as the corresponding invoices are issued. The Company reduces such liability according to the progress of the works. |
| l. | Provisions for Contingencies—The Company recognizes a provision only when it has a present obligation (legal or constructive) as a result of a past event, it is probable that the Company will be required to cancel the obligation and a reliable estimate of the obligation amount can be made. |
Provisions are revised at the statement of financial position date.
The amount recognized as a provision is the best estimate of the consideration required to settle the present obligation at the end of the reporting period, taking into account the risks and uncertainties surrounding the obligation (Note 27). When a provision is measured using the cash flows estimated to settle the present obligation, its carrying amount is the present value of those cash flows (when the effect of the time value of money is material).
When some or all of the economic benefits required to settle a provision are expected to be recovered from a third party, a receivable is recognized as an asset if it is virtually certain that reimbursement will be received and the amount of the receivable can be measured reliably.
F-364
Table of Contents
DISTRIBUIDORA DE ELECTRICIDAD DE OCCIDENTE, S. A.—DEOCSA
NOTES TO THE FINANCIAL STATEMENTS
AS OF DECEMBER 31, 2015, 2014 AND 2013 AND JANUARY 1, 2013 (RESTATED),
AND FOR THE YEARS ENDED DECEMBER 31, 2015, 2014 AND 2013 (RESTATED)
(Stated in thousands of US Dollars, except otherwise indicated)
| 3. | SIGNIFICANT ACCOUNTING POLICIES (cont’d) |
| m. | Provision for Severance Compensation—In conformity with the Labor Code of the Republic of Guatemala, the Company is obligated to pay severance compensation to employees dismissed under certain circumstances, like reorganizations, at an amount equal to one-month salary plus the twelfth part of their Christmas bonus and mid-year bonus for each year of service rendered. The Company charges to profit or loss the severance payments when the employees are actually dismissed, except for the case of former employees of INDE, which are under a specific collective agreement, where the Company has to pay the severance compensation irrespective of the circumstances that trigger the termination of their labor relationship with the Company (i.e. dismissal, resignation, death, etc.). The severance amount for these employees is calculated over the abovementioned basis plus an additional half monthly salary per each year of service. |
As of December 31, 2015, 2014 and 2013, the Company carried out an actuarial study to determine the maximum obligation for the referred severance obligation. The Company has classified this obligation as defined benefit retirement plan. For those plans, the cost of providing benefits is determined using the projected unit credit method, with actuarial valuations being carried out at the end of each annual reporting period. Remeasurement, comprising actuarial gains and losses and the effect of the changes to the asset ceiling (if applicable), is reflected immediately in the statement of financial position with a charge or credit recognized in other comprehensive income in the period in which they occur. Remeasurement recognized in other comprehensive income is reflected immediately in retained earnings and will not be reclassified to profit or loss.
At December 31, 2015, 2014 and 2013, this obligation amounts to US$ 2,549, US$ 2,280, and US$ 1,957 respectively. The abovementioned maximum obligation represents the present value of the future benefits that the employees will receive (Note 27b).
| n. | Deposits Received from Consumers—In conformity with the Regulation of the General Electricity Act, Decree No. 93-96 of November 15, 1996, which was amended by the Governmental Agreement No. 68-2007, interests have to be accrued on cash deposits received from the consumers at the monthly weighted average interest rate published by the Central Bank with an annual capitalization. |
Deposits received and interests accrued are recorded as other liability accounts “Principal from deposits received from consumers” and “Interests from deposits received from consumers”, respectively.
Deposits received from consumers, plus interest accrued and less any outstanding debt for past services, are refundable to the users when they cease using the electric energy service rendered by the Company. The Company has classified these deposits as current liabilities based on the facts that the Company do not have legal rights to defer this payment in a period that exceed a year. However, the Company do not anticipate making significant payments in the next year.
During years ended on December 31, 2015, 2014 and 2013, deposits repaid to consumers amounted to US$ 99, US$ 257 and US$ 161, respectively; and the interests paid amounted to US$ 33, US$ 68 and US$ 54 respectively.
F-365
Table of Contents
DISTRIBUIDORA DE ELECTRICIDAD DE OCCIDENTE, S. A.—DEOCSA
NOTES TO THE FINANCIAL STATEMENTS
AS OF DECEMBER 31, 2015, 2014 AND 2013 AND JANUARY 1, 2013 (RESTATED),
AND FOR THE YEARS ENDED DECEMBER 31, 2015, 2014 AND 2013 (RESTATED)
(Stated in thousands of US Dollars, except otherwise indicated)
| 3. | SIGNIFICANT ACCOUNTING POLICIES (cont’d) |
| ñ. | Contributions to Pension Funds—Since March 2, 1990 a pension fund was created for employees of INDE and for those of the companies in which it is the founder partner. The Company was established by INDE and despite the sale of its shares, as indicated in Note 1, transferred employees remain covered under the pension fund. The Company and such employees contribute on a monthly basis with 8.59 per cent and 5.53 per cent on paid salaries. |
A part of the contributions that correspond to the Company is recognized as expense at payment.
Based on the Regulation of the Pension Fund for the Personnel of the National Institute of Electrification—FOPINDE, in Spanish, the fund is the sole responsibility of INDE and any insufficiency will be covered by the latter. Consequently, the Company does not have the obligation to record a provision for pension fund.
During the years ended at December 31, 2015, 2014 and 2013, the amount of the contributions carried out by the Company to FOPINDE amounts to US$ 219, US$ 213 and US$ 209 respectively.
| o. | Financial Instruments—Financial assets and liabilities are recognized when the Company becomes part of the contract provisions of the instrument. |
The financial assets and liabilities are measured initially at fair value. The costs of the transaction which are attributable directly to the acquisition or issuance of financial assets and liabilities (different from the financial assets and liabilities measured at fair value through profit or loss) are added or deducted from the fair value of the financial assets or liabilities, if appropriate, at their initial recognition. The costs of the transaction attributable directly to the acquisition of financial assets or liabilities measured at fair value through profit or loss are recognized immediately in profit or losses.
Financial Assets
Financial assets are classified within the following categories: financial assets “at fair value through profit or loss’ (FVTPL)”, “held-to-maturity’ investments”, “financial assets available for sale”, and “loans and receivables”. Classification depends on the nature and purpose of the financial assets and is determined at the initial recognition. All regular purchases or sales of financial assets are recognized and derecognized on a trade date basis. Regular purchases or sales are those purchases or sales of financial assets that require the delivery of the assets within the time frame established by a market regulation or agreement.
At December 31, 2015, 2014 and 2013 and throughout the years then ended, the Company did not carry out financial assets different from the category of “loans and receivables”, which are measured at the amortized cost at an effective interest rate.
Effective Interest Rate Method
The effective interest rate method is a calculation method of the amortized cost of a financial instrument and the allocation of the financial income throughout the relevant period. The effective interest rate is
F-366
Table of Contents
DISTRIBUIDORA DE ELECTRICIDAD DE OCCIDENTE, S. A.—DEOCSA
NOTES TO THE FINANCIAL STATEMENTS
AS OF DECEMBER 31, 2015, 2014 AND 2013 AND JANUARY 1, 2013 (RESTATED),
AND FOR THE YEARS ENDED DECEMBER 31, 2015, 2014 AND 2013 (RESTATED)
(Stated in thousands of US Dollars, except otherwise indicated)
| 3. | SIGNIFICANT ACCOUNTING POLICIES (cont’d) |
the rate that exactly discounts estimated future cash receipts or paid (including commission, basic points of interests paid or received, transaction costs and other premiums or discounts included in the calculation of the effective interest rate) throughout the expected life of the financial instrument or, when appropriate, in a shorter period, with the net carrying amount at the initial recognition.
Income is recognized on the basis of the effective interest rate for debt instruments different from the financial assets classified at fair value through profit or loss.
Loans and Receivables
Loans and receivables are non-derivative financial assets with fixed or determinable payments that are not quoted in an active market. Loans and receivable (including trade receivables, other receivables, cash and cash equivalents, among others) are measured at the amortized cost using effective interest method, less any impairment. The income from interest is recognized by applying the effective interest rate, except for short term receivable accounts when the effect of discounting is immaterial.
The tariffs that the Company collects from its consumers are regulated by the General Electricity Act, Decree 93-96. Based on this Act, the National Electric Energy Commission issued the following resolutions: a) CNEE 23-2009—new tariffs in force from February 1, 2009 until January 31, 2014; b) CNEE 24-2009—social tariff for the electric energy supply to users with electric consumption up to 300 kilowatt/hour according to the new tariff in force from February 1, 2009 until January 31, 2014; c) CNEE 43-2014—new tariffs in force from February 1, 2014 until January 31, 2019 and d) CNNE 44-2014—Social tariff—for the electric energy supply to users with electric consumption up to 300 kilowatt/hour according to the new tariffs in force from February 1, 2014 until January 31, 2019.
According to the General Electricity Act, the Company adjusts on a quarterly basis such tariffs based on the variations in the price of kilowatt/hour, the purchase of power and electric energy, tolls, and other related costs with the distribution of electric energy for each quarter, quantifying the difference between recoveries on the approved base tariff and the actual costs incurred by the Company.
Likewise, there is an adjustment made quarterly to the Distribution Added Value (VAD, in Spanish), through which the Company calculates the effect that the variation on the exchange rate, duties on the electrical grid supplies (poles, fittings, electric equipment, and transformers) and the Index of Consumer Prices in the City of Guatemala over the Distribution Added Value.
Impairment of Financial Assets
The financial assets other than those measured at fair value through profit or loss are assessed for indicators of impairment at the end of each reporting period. A financial asset is considered to be impaired when there is objective evidence that as a consequence of one or more events occurred after the initial recognition of the financial asset, the estimated future cash flows of the financial asset have been affected.
F-367
Table of Contents
DISTRIBUIDORA DE ELECTRICIDAD DE OCCIDENTE, S. A.—DEOCSA
NOTES TO THE FINANCIAL STATEMENTS
AS OF DECEMBER 31, 2015, 2014 AND 2013 AND JANUARY 1, 2013 (RESTATED),
AND FOR THE YEARS ENDED DECEMBER 31, 2015, 2014 AND 2013 (RESTATED)
(Stated in thousands of US Dollars, except otherwise indicated)
| 3. | SIGNIFICANT ACCOUNTING POLICIES (cont’d) |
For certain categories of financial assets, such as trade receivables, assets are assessed for impairment on a collective basis even if they were assessed not to be impaired individually. Within the objective evidence in case of an impaired receivables portfolio, it could be included the past experience of the Company regarding the collection of payments, an increase of the number of late payments in the portfolio that exceeds the average credit period of 180 days, as well as the observable changes in the local and national economic conditions that relate with default on receivables.
For the financial assets carried at the amortized cost, the amount from impairment loss is the difference between the carrying amount and the present value of the estimated future cash flow of the asset, discounted at the original effective interest rate of the financial asset.
The carrying amount of the financial asset is reduced by the impairment loss directly for all the financial assets, except for the trade receivables, where the carrying amount is reduced through an allowance account. When it is considered that a commercial account receivable is uncollectible, it is thus written off against the allowance account. The subsequent recovery of the amounts, previously written off, turns into credits against the allowance account. Changes in the carrying amount of the provision are recognized in the profit or loss.
Derecognition of Financial Assets
The Company derecognizes financial asset when the contractual rights on the cash flows of the financial asset expire, or when it transfers the financial asset and substantially all the risks and rewards of ownership of the asset to another party. If the Company does not transfer, nor retains substantially all the risks and rewards inherent to the ownership and continues to control the transferred asset, the Company will recognizes its participation in the asset and the related obligation for the amount payable. If the Company retains substantially all the risks and advantages inherent to the ownership of a transferred financial asset, the Company continues to recognize the financial asset and also recognizes a collateralized borrowing for the proceeds received.
On derecognition of a financial asset in its entirety, the difference between the carrying amount of the asset and the sum of the consideration received and to be received, as well as the accumulated income that had been recognized in other comprehensive income and accumulated in equity is recognized in profit or loss.
In case of a partial derecognition in the accounts of a financial asset (i.e., when the Company retains the option to reacquire part of the transferred asset), the Company distributes the previous carrying amount of the financial asset between the part still recognized under a continuous participation and the part that is no more recognized on the basis of the fair value related to such parts at the date of the transfer. The difference between the carrying amount allocated to the part that will not be recognized anymore and the sum of the consideration received from the part that will no more be recognized and any accumulated profit or loss allocated that would have been recognized in other comprehensive income is recognized in profit or loss. The accumulated profit or loss that would have been recognized in other comprehensive income is distributed between the part that remains being recognized and the part that will not be recognized anymore based on the fair values related to both parts.
F-368
Table of Contents
DISTRIBUIDORA DE ELECTRICIDAD DE OCCIDENTE, S. A.—DEOCSA
NOTES TO THE FINANCIAL STATEMENTS
AS OF DECEMBER 31, 2015, 2014 AND 2013 AND JANUARY 1, 2013 (RESTATED),
AND FOR THE YEARS ENDED DECEMBER 31, 2015, 2014 AND 2013 (RESTATED)
(Stated in thousands of US Dollars, except otherwise indicated)
| 3. | SIGNIFICANT ACCOUNTING POLICIES (cont’d) |
Financial Liabilities and Equity Instruments
Classification as Debt or Equity
Debt and equity instruments are classified as financial liabilities or as equity in conformity with the substance of the contractual agreement and the definitions of financial liability and equity instrument.
Financial Liabilities
Financial liabilities are classified at fair value through profit or loss or “other financial liabilities”.
Financial Liabilities at Fair Value Through Profit or Loss
A financial liability is classified at fair value through profit or loss when (i) there is a contingent consideration that could be paid as part of the businesses combination in which IFRS 3 is applied, (ii) held for trading, or (iii) it is designated as at FVTPL.
A financial liability is classified as held for trading if:
| • | It has been acquired mainly for short-term repurchase purposes, or |
| • | At the moment of the initial recognition, it forms part of a financial instrument portfolio managed by the Company and there is evidence of a current and recent pattern of benefits at short term, or |
| • | It is a derivative that has not been assigned, effective as hedge instrument or financial guarantee. |
A financial liability (not a financial liability held for trading) or contingent consideration that could be paid by the acquirer as part of a business combination, can be assigned as a liability at fair value through profit or loss at its initial recognition if:
| • | Such assignment eliminates or reduces significantly a measurement or recognition inconsistency that might arise; or |
| • | The financial liability forms part of a group of financial assets or liabilities or both, which is managed and its performance is assessed on the fair value basis, in conformity with the documented risk management of the Company or its investing strategy, and information on the Company is provided internally on such basis, or |
| • | It forms part of a contract that contains one or more embedded derivatives, and IAS 39 allows that the combined contract is assigned at fair value through profit or loss. Financial liabilities at fair value through profit or loss are recorded at fair value, recognizing any profit or loss arisen from the new measurement in profit or losses. Net profit or loss recognized in profit or losses incorporates paid interests on the financial liability and is included in the item “Financial expenses”. |
F-369
Table of Contents
DISTRIBUIDORA DE ELECTRICIDAD DE OCCIDENTE, S. A.—DEOCSA
NOTES TO THE FINANCIAL STATEMENTS
AS OF DECEMBER 31, 2015, 2014 AND 2013 AND JANUARY 1, 2013 (RESTATED),
AND FOR THE YEARS ENDED DECEMBER 31, 2015, 2014 AND 2013 (RESTATED)
(Stated in thousands of US Dollars, except otherwise indicated)
| 3. | SIGNIFICANT ACCOUNTING POLICIES (cont’d) |
Other Financial Liabilities
Other financial liabilities (including loans and commercial accounts payable and others) are measured subsequently at the amortized cost using the effective interest rate method.
The effective interest rate method is a calculation method of the amortized cost of a financial liability and of the allocation of a financial expense throughout the relevant period. The effective interest rate is the rate that exactly discounts estimated future cash receipts or paid (including the fees and points paid or received that form part of the effective interest rate, the transaction costs, and other premiums or discounts) estimated throughout the expected life of the financial liability (or, when appropriate), in a shorter period with the net carrying amount at its initial recognition.
Derecognition of a Financial Liability
The Company derecognizes a financial liability if solely the Company’s obligations have expired or have been cancelled. The difference between the book value of the derecognized financial liability and the consideration paid and payable are recognized in income.
Derivative Financial Instruments
The Company enters into a variety of derivative financial instruments to manage its exposure to interest rate and foreign exchange rate risks, including interest rate swaps. Further details of derivative financial instruments are disclosed in Note 34.
Derivatives are initially recognized at fair value at the date the derivative contracts are entered into and are subsequently remeasured to their fair value at the end of each reporting period. The resulting gain or loss is recognized in profit or loss immediately unless the derivative is designated and effective as a hedging instrument, in which event the timing of the recognition in profit or loss depends on the nature of the hedge relationship.
Hedge Accounting
The Company designates certain hedging instruments, which include derivatives, embedded derivatives and non-derivatives in respect of foreign currency and interest rate risk, as either fair value hedges or cash flow hedges.
At the inception of the hedge relationship, the entity documents the relationship between the hedging instrument and the hedged item, along with its risk management objectives and its strategy for undertaking various hedge transactions. Furthermore, at the inception of the hedge and on an ongoing basis, the Company documents whether the hedging instrument is highly effective in offsetting changes in fair values or cash flows of the hedged item attributable to the hedged risk.
Fair Value Hedges
Changes in the fair value of derivatives that are designated and qualify as fair value hedges are recognized in profit or loss immediately, together with any changes in the fair value of the hedged asset
F-370
Table of Contents
DISTRIBUIDORA DE ELECTRICIDAD DE OCCIDENTE, S. A.—DEOCSA
NOTES TO THE FINANCIAL STATEMENTS
AS OF DECEMBER 31, 2015, 2014 AND 2013 AND JANUARY 1, 2013 (RESTATED),
AND FOR THE YEARS ENDED DECEMBER 31, 2015, 2014 AND 2013 (RESTATED)
(Stated in thousands of US Dollars, except otherwise indicated)
| 3. | SIGNIFICANT ACCOUNTING POLICIES (cont’d) |
or liability that are attributable to the hedged risk. The change in the fair value of the hedging instrument and the change in the hedged item attributable to the hedged risk are recognized in profit or loss in the line item relating to the hedged item. Hedge accounting is discontinued when the Company revokes the hedging relationship, when the hedging instrument expires or is sold, terminated, or exercised, or when it no longer qualifies for hedge accounting. The fair value adjustment to the carrying amount of the hedged item arising from the hedged risk is amortized to profit or loss from that date.
Cash Flow Hedges
The effective portion of changes in the fair value of derivatives that are designated and qualify as cash flow hedges is recognized in other comprehensive income and accumulated under the heading of cash flow hedging reserve. The gain or loss relating to the ineffective portion is recognized immediately in profit or loss, and is included in the ‘other income’ line item.
Amounts previously recognized in other comprehensive income and accumulated in equity are reclassified to profit or loss in the periods when the hedged item affects profit or loss, in the same line as the recognized hedged item. However, when the hedged forecast transaction results in the recognition of a non-financial asset or a non-financial liability, the gains and losses previously recognized in other comprehensive income and accumulated in equity are transferred from equity and included in the initial measurement of the cost of the non-financial asset or non-financial liability.
Hedge accounting is discontinued when the Company revokes the hedging relationship, when the hedging instrument expires or is sold, terminated, or exercised, or when it no longer qualifies for hedge accounting. Any gain or loss recognized in other comprehensive income and accumulated in equity at that time remains in equity and is recognized when the forecast transaction is ultimately recognized in profit or loss. When a forecast transaction is no longer expected to occur, the gain or loss accumulated in equity is recognized immediately in profit or loss.
| p. | Income Tax—The expense from Income Tax represents the sum of the current income tax and the deferred income tax. |
| • | Current Tax: Current tax payable is based on the taxable profit for the year. The taxable profit differs from the profit reported in the statement of profit or loss and other comprehensive income, due to the income or expenses items taxable or deductible in other years and items that are never taxable or deductible. Current tax liability is calculated using the fiscal rates that have been enacted or substantively enacted at the end of the reporting period. |
| • | Deferred Taxes: Deferred tax is recognized on the temporary differences between the book value of the assets and liabilities included in the financial statements and the related tax basis used to determine the taxable profit. Liability from deferred tax is generally recognized for all temporary taxable fiscal differences. An asset from deferred taxes will be recognized due to all temporary deductible differences to the extent that it is probable that taxable profits will be available against which those deductible temporary differences can be utilized. Such deferred tax assets and liabilities are not recognized if the temporary difference arises from the initial recognition (other |
F-371
Table of Contents
DISTRIBUIDORA DE ELECTRICIDAD DE OCCIDENTE, S. A.—DEOCSA
NOTES TO THE FINANCIAL STATEMENTS
AS OF DECEMBER 31, 2015, 2014 AND 2013 AND JANUARY 1, 2013 (RESTATED),
AND FOR THE YEARS ENDED DECEMBER 31, 2015, 2014 AND 2013 (RESTATED)
(Stated in thousands of US Dollars, except otherwise indicated)
| 3. | SIGNIFICANT ACCOUNTING POLICIES (cont’d) |
than in a business combination) of assets and liabilities in a transaction that affects neither the taxable profit nor the accounting profit. In addition, deferred tax liabilities are not recognized if the temporary difference arises from the initial recognition of goodwill. |
The carrying amount of deferred tax assets is reviewed at the end of each reporting period and reduced to the extent that it is no longer probable that sufficient taxable profits will be available to allow all or part of the asset to be recovered.
Assets and liabilities from deferred taxes are measured using the fiscal rates expected to be applicable in the period in which the asset is realized or the liability is cancelled, based on the rates (and tax laws) that at the end of the reporting period had been enacted or substantively enacted the process of approval. Measurement of the liabilities from deferred taxes and assets from deferred taxes will reflect the fiscal consequences which would be derived from the way in which the entity expects, at the end of the reporting period, to recover or liquidate the carrying amount of its assets and liabilities.
Current and deferred taxes are recognized in profit or loss and are included in the income of the period or in other comprehensive income, as corresponds.
| q. | Cash and Cash Equivalents—Cash includes balances in cash and banks. Balances in banks are available on demand and there is no restriction that limits their use. |
| r. | Restricted Cash—The balance corresponds to the funds deposited for the payment reserve for the amortization of the loan in Banco Agromercantil de Guatemala, S.A. in United States Dollars and Quetzals that accrue an annual interest rate of 3.5% and 1.5%, respectively. The funds must be used only to service debt and interest. As of December 31, 2015, 2014 and 2013, the restricted fund amount was US$ 2,875, US$. 2,399 and US$. 2,379 respectively. |
| s. | Leases—Leases are classified as finance leases whenever the terms of the lease transfer substantially all the risks and rewards of ownership to the lessee. All other leases are classified as operating leases. |
The Company only act as lessee. Payments for operating leasing are recognized as an expense using the straight-line method, during the term related to the leasing, unless another systematic basis of distribution becomes more representative to suitably reflect the temporary pattern of the leasing benefits for the user. Contingent rentals are recognized as expenses in the periods in which they are incurred.
| t. | Energy purchases—Costs from energy purchases either acquired in the spot market or from contracts with suppliers are recorded on an accrual basis according to the energy actually delivered. Purchases of electric energy, including those which have not yet been billed as of the reporting date, are recorded based on estimates of the energy supplied at the prices prevailing in the spot market or agreed-upon in the respective purchase agreements, as the case may be. |
| 4. | MONETARY UNIT AND EXCHANGE RATE |
The legal currency of Guatemala is the Quetzal, represented by the “Q” symbol in the financial statements.
The Bank of Guatemala, entity authorized by the Monetary Board to implement its monetary, exchange and credit policies, publishes periodically the reference exchange rate to be used in the banking system.
F-372
Table of Contents
DISTRIBUIDORA DE ELECTRICIDAD DE OCCIDENTE, S. A.—DEOCSA
NOTES TO THE FINANCIAL STATEMENTS
AS OF DECEMBER 31, 2015, 2014 AND 2013 AND JANUARY 1, 2013 (RESTATED),
AND FOR THE YEARS ENDED DECEMBER 31, 2015, 2014 AND 2013 (RESTATED)
(Stated in thousands of US Dollars, except otherwise indicated)
| 4. | MONETARY UNIT AND EXCHANGE RATE (con’d) |
According to Resolution JM 31-2009 dated March 18, 2009, the method to determine the exchange rate consists on using the weighted average exchange rate of the total sum of the purchase and sale of foreign currency carried out daily by the institutions that constitute the institutional foreign currency market. As of December 31, 2015, 2014, and 2013 the reference exchange rate published by the Bank of Guatemala was Q. 7.63, Q. 7.60 and Q. 7.84, respectively for US$ 1.
There are no exchange restrictions in Guatemala for the capital repatriation, payment of debts or any other purpose; foreign currency can be freely negotiated in any amount in the banks of the system or in the authorized exchange offices, in conformity with the statutory regulation in force, according to Decree No. 94-2000 Free Foreign Currency Negotiation Act.
| 5. | ENERGY SALES |
Income from electric energy sales obtained during years ended December 31, 2015, 2014 and 2013 are shown as follows:
2015 | 2014 | 2013 | ||||||||||
Simple LV | US$ | 235,646 | US$ | 238,544 | US$ | 216,384 | ||||||
Public Lighting | 35,568 | 33,469 | 39,534 | |||||||||
Non-regulated tariff | 16,609 | 17,567 | 22,735 | |||||||||
LV on demand OP | 15,742 | 17,935 | 20,792 | |||||||||
LV on demand P | 8,431 | 6,269 | 3,317 | |||||||||
MV on demand OP | 1,747 | 2,446 | 1,276 | |||||||||
Non-regulated special tariff | 2,563 | 4,621 | 616 | |||||||||
MV on demand | 1,661 | 149 | 116 | |||||||||
|
|
|
|
|
| |||||||
| US$ | 317,967 | US$ | 321,000 | US$ | 304,770 | |||||||
|
|
|
|
|
| |||||||
The above initials correspond to: LV: low voltage; MV: medium voltage; OP: off peak; P: peak.
| 6. | SERVICES RENDERED |
During years ended December 31, 2015, 2014 and 2013, the Company carried out some works that generated income as follows:
2015 | 2014 | 2013 | ||||||||||
Connection of electrical gridsa/ | US$ | 2,711 | US$ | 1,948 | US$ | 2,784 | ||||||
Tollsb/ | 836 | 711 | 672 | |||||||||
|
|
|
|
|
| |||||||
| US$ | 3,547 | US$ | 2,659 | US$ | 3,456 | |||||||
|
|
|
|
|
| |||||||
| a/ | It corresponds to income from the electrical grid re-connection quota that is collected to the users that have been disconnected from the supply of electricity. |
| b/ | It corresponds to the collection performed to generators or retailers for the use of transmission sites and main and secondary transformation. |
F-373
Table of Contents
DISTRIBUIDORA DE ELECTRICIDAD DE OCCIDENTE, S. A.—DEOCSA
NOTES TO THE FINANCIAL STATEMENTS
AS OF DECEMBER 31, 2015, 2014 AND 2013 AND JANUARY 1, 2013 (RESTATED),
AND FOR THE YEARS ENDED DECEMBER 31, 2015, 2014 AND 2013 (RESTATED)
(Stated in thousands of US Dollars, except otherwise indicated)
| 7. | OTHER REVENUES |
During the years ended December 31, 2015, 2014 and 2013, the Company recognized the following other revenues as follows:
2015 | 2014 | 2013 | ||||||||||
Accrued revenues—government grantsa/ | US$ | 3,327 | US$ | 3,607 | US$ | 3,760 | ||||||
Leasingb/ | 615 | 641 | 628 | |||||||||
Compensation received third-partyc/ | 265 | 262 | 277 | |||||||||
Ancillary services renderingd/ | 47 | 281 | 545 | |||||||||
Others | (1,126 | ) | 1,130 | 728 | ||||||||
|
|
|
|
|
| |||||||
| US$ | 3,128 | US$ | 5,921 | US$ | 5,938 | |||||||
|
|
|
|
|
| |||||||
| a/ | Accrued revenue related to government grants to distribution projects of the Rural Electrification Program (Programa de Electrificación Rural—“PER”, in Spanish) during years ended at December 31, 2015, 2014 and 2013. (Note 26). |
| b/ | Income from rental of poles already installed within the energy supply grid for placement of advertising blankets and panels, as well as for using such infrastructure for cable lying to other companies. |
| c/ | Income from review and determination of frauds in the electrical energy consumption from the users. |
| d/ | Materials for installation works to users out of the 200-meter range and for entering within setbacks and works of the telephone companies. |
| 8. | ENERGY PURCHASE |
During years ended December 31, 2015, 2014 and 2013, electric energy purchases were as follows:
2015 | 2014 | 2013 | ||||||||||
Contracts with suppliers | US$ | 182,493 | US$ | 158,297 | US$ | 217,475 | ||||||
In the spot market | 22,565 | 62,837 | — | |||||||||
|
|
|
|
|
| |||||||
| US$ | 205,058 | US$ | 221,134 | US$ | 217,475 | |||||||
|
|
|
|
|
| |||||||
The Company manages an average of 60 days of credit with its suppliers from the receipt date of the invoice. Suppliers do not charge interests on the late payment of outstanding invoices.
F-374
Table of Contents
DISTRIBUIDORA DE ELECTRICIDAD DE OCCIDENTE, S. A.—DEOCSA
NOTES TO THE FINANCIAL STATEMENTS
AS OF DECEMBER 31, 2015, 2014 AND 2013 AND JANUARY 1, 2013 (RESTATED),
AND FOR THE YEARS ENDED DECEMBER 31, 2015, 2014 AND 2013 (RESTATED)
(Stated in thousands of US Dollars, except otherwise indicated)
| 9. | OTHER COSTS OF SALES |
Other cost of sales for the years ended December 31, 2015, 2014 and 2013 are shown as follows:
2015 | 2014 | 2013 | ||||||||||
Depreciation and amortization | US$ | 15,699 | US$ | 15,125 | US$ | 16,109 | ||||||
Personnel expensesb/ | 6,513 | 6,062 | 5,188 | |||||||||
Sundry servicesa/ | 6,322 | 6,631 | 6,294 | |||||||||
Maintenance expenses | 3,093 | 3,556 | 2,730 | |||||||||
Fees | 2,043 | 2,006 | 1,933 | |||||||||
Professional services | 1,497 | 1,301 | 1,145 | |||||||||
Maintenance material | 654 | 419 | 99 | |||||||||
Provision for obsolete inventories | 634 | — | — | |||||||||
Other ancillary expenses | 284 | 255 | 462 | |||||||||
Fuel | 247 | 377 | 301 | |||||||||
Advertising, marketing, and public relations | 215 | 175 | 174 | |||||||||
Travel expenses | 133 | 122 | 73 | |||||||||
Sundry expenses | 112 | 170 | 39 | |||||||||
Banking expenses | 52 | 11 | 16 | |||||||||
Supplies | 16 | 14 | 21 | |||||||||
Guarantee expenses works/transportation | 2 | 100 | 8 | |||||||||
|
|
|
|
|
| |||||||
| US$ | 37,516 | US$ | 36,324 | US$ | 34,592 | |||||||
|
|
|
|
|
| |||||||
| a/ | It corresponds mainly to residential operations, and readers and delivery contractors. |
| b/ | Personnel expenses for the years ended December 31, 2015, 2014 and 2013 are shown below as follows: |
2015 | 2014 | 2013 | ||||||||||
Monetary considerations | US$ | 7,161 | US$ | 6,834 | US$ | 5,772 | ||||||
Social security | 609 | 584 | 522 | |||||||||
Post-employment benefits | 419 | 219 | 187 | |||||||||
Social benefits | 15 | — | — | |||||||||
Capitalization to property, plant and equipment1/ | (1,691 | ) | (1,575 | ) | (1,293 | ) | ||||||
|
|
|
|
|
| |||||||
| US$ | 6,513 | US$ | 6,062 | US$ | 5,188 | |||||||
|
|
|
|
|
| |||||||
| 1/ | It corresponds to the amount of expenses for “Works for Property, Plant and Equipment”, which were capitalized in distribution and transmission works (Note 3d). |
F-375
Table of Contents
DISTRIBUIDORA DE ELECTRICIDAD DE OCCIDENTE, S. A.—DEOCSA
NOTES TO THE FINANCIAL STATEMENTS
AS OF DECEMBER 31, 2015, 2014 AND 2013 AND JANUARY 1, 2013 (RESTATED),
AND FOR THE YEARS ENDED DECEMBER 31, 2015, 2014 AND 2013 (RESTATED)
(Stated in thousands of US Dollars, except otherwise indicated)
| 10. | FINANCIAL INCOME |
Figures forming part of the financial income accounts for the years ended December 31, 2015, 2014 and 2013 are shown below:
2015 | 2014 | 2013 | ||||||||||
Compensatory interest | US$ | 1,469 | US$ | 1,484 | US$ | 1,249 | ||||||
Interest income on bank accounts | 577 | 421 | 642 | |||||||||
Gain on exchange difference, net | — | 4,238 | 958 | |||||||||
|
|
|
|
|
| |||||||
| US$ | 2,046 | US$ | 6,143 | US$ | 2,849 | |||||||
|
|
|
|
|
| |||||||
| 11. | GENERAL, SELLING AND ADMINISTRATIVE EXPENSES |
General, selling and administrative expenses for the years ended December 31, 2015, 2014 and 2013, are set out below:
2015 | 2014 | 2013 | ||||||||||
Impairment losses recognized on receivable from doubtful accounts | US$ | 18,157 | US$ | 15,161 | US$ | 10,287 | ||||||
Sundry servicesa/ | 8,314 | 7,595 | 6,240 | |||||||||
Personnel expensesb/ | 4,445 | 3,794 | 2,908 | |||||||||
Professional services | 2,083 | 1,535 | 1,187 | |||||||||
Maintenance | 1,229 | 1,195 | 698 | |||||||||
Fees | 1,036 | 441 | 245 | |||||||||
Loss from accounts insolvency—discounts | 837 | — | — | |||||||||
Supplies | 731 | 953 | 851 | |||||||||
Leasing and royalties | 615 | 468 | 501 | |||||||||
Advertising, marketing and public relations | 609 | 857 | 1,035 | |||||||||
Travel expenses | 475 | 292 | 224 | |||||||||
Sundry expenses | 388 | 471 | 667 | |||||||||
Insurance premiums | 248 | 214 | 234 | |||||||||
Maintenance materials | 84 | 70 | 72 | |||||||||
Banking expenses | 31 | 31 | 32 | |||||||||
|
|
|
|
|
| |||||||
| US$ | 39,282 | US$ | 33,077 | US$ | 25,181 | |||||||
|
|
|
|
|
| |||||||
| a/ | It corresponds mainly to the management, administration, and supervision for the businesses of the Company, as well as expenses related to the security service of the commercial offices, expenses for the collection of accounts receivable from third parties and commissions on collection. |
F-376
Table of Contents
DISTRIBUIDORA DE ELECTRICIDAD DE OCCIDENTE, S. A.—DEOCSA
NOTES TO THE FINANCIAL STATEMENTS
AS OF DECEMBER 31, 2015, 2014 AND 2013 AND JANUARY 1, 2013 (RESTATED),
AND FOR THE YEARS ENDED DECEMBER 31, 2015, 2014 AND 2013 (RESTATED)
(Stated in thousands of US Dollars, except otherwise indicated)
| 11. | GENERAL, SELLING AND ADMINISTRATIVE EXPENSES (cont’d) |
| b/ | Expenses related to the years ended December 31, 2015, 2014 and 2013 are shown as follows: |
2015 | 2014 | 2013 | ||||||||||
Employee remuneration | US$ | 3,576 | US$ | 2,924 | US$ | 2,203 | ||||||
Social benefits | 497 | 444 | 445 | |||||||||
Social security | 310 | 263 | 217 | |||||||||
Post-employment benefits | 62 | 163 | 43 | |||||||||
|
|
|
|
|
| |||||||
| US$ | 4,445 | US$ | 3,794 | US$ | 2,908 | |||||||
|
|
|
|
|
| |||||||
| 12. | FINANCIAL EXPENSES |
Figures making up the financial expenses accounts for the years ended December 31, 2015, 2014 and 2013 are set out as follows:
2015 | 2014 | 2013 | ||||||||||
Interest expenses on financial debt | US$ | 12,489 | US$ | 10,797 | US$ | 12,059 | ||||||
Interest on customers deposits | 3,793 | 3,291 | 2,685 | |||||||||
Loss on exchange difference, net | 273 | — | — | |||||||||
Other financial expenses | 425 | 910 | 12 | |||||||||
|
|
|
|
|
| |||||||
| US$ | 16,980 | US$ | 14,998 | US$ | 14,756 | |||||||
|
|
|
|
|
| |||||||
| 13. | OTHER INCOME |
During years ended December 31, 2015, 2014 and 2013 the Company recognized the following other income as follows:
2015 | 2014 | 2013 | ||||||||||
Reversal of provision for legal disputes a/ | US$ | 242 | US$ | 1,135 | US$ | 297 | ||||||
|
|
|
|
|
| |||||||
| a/ | During 2015 the reversal relates to fiscal contingencies to that have legally expired and during 2014, the reversal corresponds mainly to the reversal of other civil claims that have legally expired. During 2013 the reversal corresponds to tax contingencies that the Company’s management and its legal advisors considers that the probability to get an unfavorable outcome change to possible during that year, as such derecognized the related provisions. |
F-377
Table of Contents
DISTRIBUIDORA DE ELECTRICIDAD DE OCCIDENTE, S. A.—DEOCSA
NOTES TO THE FINANCIAL STATEMENTS
AS OF DECEMBER 31, 2015, 2014 AND 2013 AND JANUARY 1, 2013 (RESTATED),
AND FOR THE YEARS ENDED DECEMBER 31, 2015, 2014 AND 2013 (RESTATED)
(Stated in thousands of US Dollars, except otherwise indicated)
| 14. | INCOME TAX |
Income tax of the year is made up as follows:
Tax on profit recognized in profit or loss and in the other comprehensive income of the year:
2015 | 2014 | 2013 | ||||||||||
Income tax—current | US$ | 8,953 | US$ | 13,657 | US$ | 6,363 | ||||||
Income tax—deferred | (1,912 | ) | 14,341 | 1,475 | ||||||||
|
|
|
|
|
| |||||||
Income tax charged to profit or loss | 7,041 | 27,998 | 7,838 | |||||||||
Income tax charged to other comprehensive income | (66 | ) | (75 | ) | (236 | ) | ||||||
|
|
|
|
|
| |||||||
| US$ | 6,975 | US$ | 27,923 | US$ | 7,602 | |||||||
|
|
|
|
|
| |||||||
Income tax legislation currently in force in 2015, 2014 and 2013—Since January 1, 2013 new regulations of the income tax are in effect and are included on Book I of the Fiscal Updating Act, Decree 10-2012 came into effect. These new regulations consider two regimes to pay tax since 2013:
| a) | Regime on Earnings from Profit Activities which consists on applying a rate of 25% in 2015 (28% in 2014 and 31% in 2013) on the taxable income determined from the accounting profit. Tax is paid through quarterly advance payments with the remaining balance at year-end. |
| b) | Simplified Optional Regime on Income from Profit Activities consisting on applying the rate of 7% to the total amount of taxable revenues, paying this tax through definitive withholding or else, through payment in agencies authorized by the tax authorities. The first US$ 3,916 of monthly taxable revenues are taxed at a 5% rate. |
For the years ended December 31, 2015, 2014 and 2013, the Company has chosen the Regime on Earnings from Profit Activities.
New regulations to income tax establish a tax of 5% on the dividend and profit distributions for both residents and non-residents.
In addition, a new Regime on Capital Income, Capital Gains and Losses, which sets out a rate of 10% for capital income related to movable property and real estate, as well as net capital income.
F-378
Table of Contents
DISTRIBUIDORA DE ELECTRICIDAD DE OCCIDENTE, S. A.—DEOCSA
NOTES TO THE FINANCIAL STATEMENTS
AS OF DECEMBER 31, 2015, 2014 AND 2013 AND JANUARY 1, 2013 (RESTATED),
AND FOR THE YEARS ENDED DECEMBER 31, 2015, 2014 AND 2013 (RESTATED)
(Stated in thousands of US Dollars, except otherwise indicated)
| 14. | INCOME TAX (cont’d) |
For the years ended December 31, 2015, 2014 and 2013, the reconciliation of the income tax expense calculated at the statutory income tax rate and the income tax recorded in the statement of profit or loss and other comprehensive income is as follows:
2015 | 2014 | 2013 | ||||||||||
Profit before Income Tax | US$ | 28,094 | US$ | 31,325 | US$ | 25,306 | ||||||
|
|
|
|
|
| |||||||
Income tax expense at the statutory income tax rate (25% for 2015, 28% for 2014 and 31% for 2013) | 7,024 | 8,771 | 7,845 | |||||||||
Income tax on capital gains 10% | 190 | 164 | — | |||||||||
Exempt income | (1,415 | ) | (1,482 | ) | (1,457 | ) | ||||||
Effect from non-deductible expensesa/ | 1,160 | 14,496 | 607 | |||||||||
Effect from income/expenses that are not deductible/taxable in determining taxable profitb/ | 62 | 1,515 | 843 | |||||||||
Effect from adjustments of previous periodsc/ | 20 | 4,534 | — | |||||||||
|
|
|
|
|
| |||||||
Income tax expense charged to profit or loss | US$ | 7,041 | US$ | 27,998 | US$ | 7,838 | ||||||
|
|
|
|
|
| |||||||
| a/ | For the years ended December 31, 2015, 2014 and 2013, non-deductible expenses recognized during the year to determine the taxable income, according to their nature, are set out as follows: |
2015 | 2014 | 2013 | ||||||||||
Goodwill1/ | US$ | — | US$ | 50,376 | US$ | — | ||||||
Accelerated depreciation of property, plant and equipment | 1,523 | 233 | — | |||||||||
Cost of works PER transportation | 1,423 | — | — | |||||||||
Provision for obsolete inventory | 933 | — | — | |||||||||
Travel allowances | 367 | 360 | 370 | |||||||||
Tax surcharges | 229 | 652 | 250 | |||||||||
Deposits received from customers | 1,218 | |||||||||||
Others | 163 | 149 | 121 | |||||||||
|
|
|
|
|
| |||||||
| US$ | 4,638 | US$ | 51,770 | US$ | 1,959 | |||||||
|
|
|
|
|
| |||||||
| 1/ | During 2015 the Tax Administration adjusted the tax deductible amount recognized as Goodwill. Consequently, the non-deductible expense in 2014 relates to the amortization of goodwill that was deducted in 2011, 2012, 2013 and 2014 for an amount that exceeded the limit of deductible expenses in determining the income tax. |
F-379
Table of Contents
DISTRIBUIDORA DE ELECTRICIDAD DE OCCIDENTE, S. A.—DEOCSA
NOTES TO THE FINANCIAL STATEMENTS
AS OF DECEMBER 31, 2015, 2014 AND 2013 AND JANUARY 1, 2013 (RESTATED),
AND FOR THE YEARS ENDED DECEMBER 31, 2015, 2014 AND 2013 (RESTATED)
(Stated in thousands of US Dollars, except otherwise indicated)
| 14. | INCOME TAX (cont’d) |
| b/ | The effect from income/expenses that are not deductible/taxable in determining taxable profit as of December 31, 2015, 2014 and 2013 are detailed below: |
2015 | 2014 | 2013 | ||||||||||
Impairment losses recognized on receivables from doubtful accounts | US$ | (978 | ) | US$ | (3,968 | ) | US$ | (2,819 | ) | |||
Depreciation and amortization | 759 | 3,149 | 3,781 | |||||||||
Others | 281 | 2,334 | (119 | ) | ||||||||
|
|
|
|
|
| |||||||
Total | US$ | 62 | US$ | 1,515 | US$ | 843 | ||||||
|
|
|
|
|
| |||||||
| c/ | Since March 2014, the Company held a conciliation process with the Tax Administration Superintendency (SAT, in Spanish) over the deduction amount from the Goodwill amortization for the years ended December 31, 2011, 2012 and 2013. |
Based on the opinion of its legal and tax advisors, during January 2015 Management decided to address some inquiries to SAT. As a result of SAT’s responses to such inquiries, the Company rectified voluntarily the Income Tax returns of 2011, 2012, and 2013. In February 2015, the Company paid additional income taxes of US$ 4,534.
2015 | 2014 | 2013 | ||||||||||
Current tax of the year | US$ | (8,953 | ) | US$ | (13,657 | ) | US$ | (6,363 | ) | |||
(-) Adjustments of previous years | 20 | — | — | |||||||||
(-) Income Tax payments from capital income | 187 | 164 | — | |||||||||
(-) Fiscal creditsa/ | 6,196 | 4,478 | 5,676 | |||||||||
(+) Translation effect | (7 | ) | (164 | ) | — | |||||||
|
|
|
|
|
| |||||||
Tax payable (Note 20) | US$ | (2,557 | ) | US$ | (9,179 | ) | US$ | ( 687 | ) | |||
|
|
|
|
|
| |||||||
| a/ | Fiscal credits applied correspond to quarterly Income Tax payments in conformity with the provisions of the Law and are applied to the determined tax in the annual liquidation. |
Other Important Changes Contained in the Regulations of the Income Tax in force since January 2013 are:
The special regulations about the pricing of transactions among related parties (transfer pricing regulation) originally came into effect on January 1, 2013. The transfer pricing regulations oblige all the taxpayers having transactions with related parties, non-resident in Guatemala, that impact the taxable base, to determine the prices of these transactions according to the Principle of Free Competition and that they document it in a Survey of Transfer Pricing. However, Section 27 of Decree 19-2013, published on December 20, 2013, suspended the application and validity of the transfer pricing regulations and established that the same are taking effect again and applied on January 1, 2015.
The management of the Company determined that it does not have transactions with related foreign companies subject to the transfer pricing regulation.
F-380
Table of Contents
DISTRIBUIDORA DE ELECTRICIDAD DE OCCIDENTE, S. A.—DEOCSA
NOTES TO THE FINANCIAL STATEMENTS
AS OF DECEMBER 31, 2015, 2014 AND 2013 AND JANUARY 1, 2013 (RESTATED),
AND FOR THE YEARS ENDED DECEMBER 31, 2015, 2014 AND 2013 (RESTATED)
(Stated in thousands of US Dollars, except otherwise indicated)
| 14. | INCOME TAX (cont’d) |
Solidarity Tax (ISO, in Spanish):
On December 22, 2008, Decree No. 73-2008 was published “Solidarity Tax Act” – ISO, in Spanish. This tax affects companies having their own equity, carrying out mercantile or farming activities and obtaining a gross margin greater than 4% of their gross income. The taxable period is on quarterly basis and is calculated and paid per calendar quarter.
The tax base for this tax is the greater between:
| a) | One-fourth of the amount of net asset; or |
| b) | One-fourth of gross income. |
In the case of tax payers whose net asset are greater than four (4) times their gross income, the applicable tax base shall be the one established in letter b) above; and the applicable tax rate is 1%.
ISO and Income Tax can be credited between them as follows:
| a. | ISO, paid during the four calendar quarters of the year can be credited to the payment of Income Tax until completed, during the next three calendar years, either paid in monthly or quarterly payments, or liquidated annually, as the case may be. |
| b. | Quarterly payments of Income Tax can be credited to the ISO payment during the same calendar year. Companies choosing this credit method could change only with the Tax Authorities’ approval. |
ISO remainder that cannot be credited must be considered as a deductible expense for Income Tax purposes from the period of annual definitive liquidation in which the abovementioned three years are concluded.
ISO credit method authorized by the Company is option b). Consequently, the taxable period is on quarterly basis and is calculated and paid per calendar quarter, when the ISO tax is greater than Income tax. This tax is complementary of Income tax and any credit generated during the year (when the ISO tax is greater than the Income tax) can be utilized for future income tax payments within the three following years.
Deferred Income Tax
The income tax rate used to calculated the deferred income tax for the years ended December 31, 2015 and 2014 is 25% and 26.5% for the year ended December 31, 2013, which corresponds to the rate that will be in force in the years in which temporary items are expected to be reversed.
F-381
Table of Contents
DISTRIBUIDORA DE ELECTRICIDAD DE OCCIDENTE, S. A.—DEOCSA
NOTES TO THE FINANCIAL STATEMENTS
AS OF DECEMBER 31, 2015, 2014 AND 2013 AND JANUARY 1, 2013 (RESTATED),
AND FOR THE YEARS ENDED DECEMBER 31, 2015, 2014 AND 2013 (RESTATED)
(Stated in thousands of US Dollars, except otherwise indicated)
| 14. | INCOME TAX (cont’d) |
The movement of the deferred Income Tax is as follows:
2015 | 2014 | 2013 | ||||||||||
Deferred tax assets: | ||||||||||||
Initial balance | US$ | 22,581 | US$ | 36,382 | US$ | 39,038 | ||||||
Impairment losses recognized on receivables from doubtful accounts | 5,014 | 3,519 | 2,488 | |||||||||
Rate deviations | 15 | — | — | |||||||||
Other financial obligations | (120 | ) | (107 | ) | 314 | |||||||
Provisions for contingencies | (145 | ) | (123 | ) | (107 | ) | ||||||
Goodwill | (1,307 | ) | (16,827 | ) | (5,590 | |||||||
Government grants | — | (263 | ) | 239 | ||||||||
|
|
|
|
|
| |||||||
Balance at year-end | US$26,038 | US$22,581 | US$ | 36,382 | ||||||||
Deferred tax liabilities: | ||||||||||||
Initial balance | US$ | (30,205 | ) | US$ | (29,695 | ) | US$ | (31,171 | ) | |||
Goodwill | (2,211 | ) | — | — | ||||||||
Property, plant and equipment | 774 | (510 | ) | 1,476 | ||||||||
|
|
|
|
|
| |||||||
Balance at year-end | US$ | (31,642 | ) | US$ | (30,205 | ) | (29,695 | ) | ||||
|
|
|
|
|
| |||||||
Deferred income tax liability—net | US$ | (5,604 | ) | US$ | (7,624 | ) | US$ | 6,687 | ||||
|
|
|
|
|
| |||||||
As of December 31, 2015 the deferred tax assets and liabilities are composed as follows:
2015 | Initial | Debits/ | Debits/ | Translation | Final Balance | |||||||||||||||
Temporary differences: | ||||||||||||||||||||
Provision for impairment losses on receivables | US$ | 13,024 | US$ | 5,059 | US$ | — | US$ | (45 | ) | US$ | 18,038 | |||||||||
Provision for contingencies | 2,039 | (320 | ) | 185 | (10 | ) | 1,894 | |||||||||||||
Rate deviations | — | 15 | — | — | 15 | |||||||||||||||
Other financial obligations | 207 | — | (119 | ) | (1 | ) | 87 | |||||||||||||
Government grants | 6,004 | 28 | — | (28 | ) | 6,004 | ||||||||||||||
Goodwill | 1,307 | (3,502 | ) | — | (16 | ) | (2,211 | ) | ||||||||||||
Property, plant and equipment | (30,205 | ) | 632 | — | 142 | (29,431 | ) | |||||||||||||
|
|
|
|
|
|
|
|
|
| |||||||||||
Deferred income tax liability, net | US$ | (7,624 | ) | US$ | 1,912 | US$ | 66 | US$ | 42 | US$ | (5,604 | ) | ||||||||
|
|
|
|
|
|
|
|
|
| |||||||||||
F-382
Table of Contents
DISTRIBUIDORA DE ELECTRICIDAD DE OCCIDENTE, S. A.—DEOCSA
NOTES TO THE FINANCIAL STATEMENTS
AS OF DECEMBER 31, 2015, 2014 AND 2013 AND JANUARY 1, 2013 (RESTATED),
AND FOR THE YEARS ENDED DECEMBER 31, 2015, 2014 AND 2013 (RESTATED)
(Stated in thousands of US Dollars, except otherwise indicated)
| 14. | INCOME TAX (cont’d) |
As of December 31, 2014, deferred tax assets and liabilities are composed as follows:
2014 | Initial Balance | Charges/ | Charges/ | Translation | Final Balance | |||||||||||||||
Temporary differences: | ||||||||||||||||||||
Provision for impairment losses on receivables | US$ | 9,505 | US$ | 3,155 | US$ | — | US$ | 364 | US$ | 13,024 | ||||||||||
Provision for contingencies | 2,162 | (379 | ) | 190 | 66 | 2,039 | ||||||||||||||
Other financial obligations | 314 | — | (115 | ) | 8 | 207 | ||||||||||||||
Government grants | 6,267 | (456 | ) | — | 193 | 6,004 | ||||||||||||||
Goodwill | 18,134 | (17,100 | ) | — | 273 | 1,307 | ||||||||||||||
Property, plant and equipment | (29,695 | ) | 439 | — | (949 | ) | (30,205 | ) | ||||||||||||
|
|
|
|
|
|
|
|
|
| |||||||||||
Deferred income tax liability, net | US$ | 6,687 | US$ | (14,341 | ) | US$ | 75 | US$ | (45 | ) | US$ | (7,624 | ) | |||||||
|
|
|
|
|
|
|
|
|
| |||||||||||
As of December 31, 2013, deferred tax assets and liabilities are composed as follows:
2013 | Initial | Charges/ | Charges/ | Translation | Final Balance | |||||||||||||||
Temporary differences: | ||||||||||||||||||||
Provision for impairment losses on receivables | US$ | 7,017 | US$ | 2,414 | US$ | — | US$ | 74 | US$ | 9,505 | ||||||||||
Provision for contingencies | 2,269 | (48 | ) | (76 | ) | 17 | 2,162 | |||||||||||||
Other financial obligations | — | — | 312 | 2 | 314 | |||||||||||||||
Government grants | 6,028 | 183 | — | 56 | 6,267 | |||||||||||||||
Goodwill | 23,724 | (5,729 | ) | — | 139 | 18,134 | ||||||||||||||
Property, plant and equipment | (31,171 | ) | 1,705 | — | (229 | ) | (29,695 | ) | ||||||||||||
|
|
|
|
|
|
|
|
|
| |||||||||||
Deferred income tax asset, net | US$ | 7,867 | US$ | (1,475 | ) | US$ | 236 | US$ | 59 | US$ | 6,687 | |||||||||
|
|
|
|
|
|
|
|
|
| |||||||||||
As of December 31, 2015, 2014 and 2013 the Company maintains US$ 5,008, US$ 4,084 and US$ 3,161 on unrecognized deferred tax assets related to deductible temporary differences in connection with accumulated interests from deposits received from consumers (Note 28), since it is not possible to determine with reasonable certainty the payment dates of these obligations and to establish the possibility of future taxable profit against which these credits can be utilized at those dates.
F-383
Table of Contents
DISTRIBUIDORA DE ELECTRICIDAD DE OCCIDENTE, S. A.—DEOCSA
NOTES TO THE FINANCIAL STATEMENTS
AS OF DECEMBER 31, 2015, 2014 AND 2013 AND JANUARY 1, 2013 (RESTATED),
AND FOR THE YEARS ENDED DECEMBER 31, 2015, 2014 AND 2013 (RESTATED)
(Stated in thousands of US Dollars, except otherwise indicated)
| 15. | TRADE RECEIVABLES |
As of December 31, 2015, 2014 and 2013, the balance of trade receivable is composed as described below:
2015 | 2014 | 2013 | ||||||||||
Commercial, industrial, residential zones, public lighting, rates and tariffs a/ | US$ | 159,387 | US$ | 135,862 | US$ | 109,599 | ||||||
Instituto Nacional de Electrificación—INDEc/ | 10,606 | 14,007 | 13,633 | |||||||||
Energy consumed not billedd/ | 14,573 | 14,946 | 12,470 | |||||||||
Client tolls | 62 | 63 | 60 | |||||||||
Other clients | 75 | 73 | 62 | |||||||||
|
|
|
|
|
| |||||||
| 184,703 | 164,951 | 135,824 | ||||||||||
Long term accounts receivable with payment agreements | (6,472 | ) | (5,414 | ) | (1,791 | ) | ||||||
Long term accounts receivable from municipalitiesb/ | (11,311 | ) | (7,980 | ) | (5,464 | ) | ||||||
|
|
|
|
|
| |||||||
| (17,783 | ) | (13,394 | ) | (7,255 | ) | |||||||
|
|
|
|
|
| |||||||
| 166,920 | 151,557 | 128,569 | ||||||||||
Less | ||||||||||||
Collection by offsettingf/ | (30,761 | ) | (26,622 | ) | (23,435 | ) | ||||||
Allowance for uncollectible accountse/ | (76,754 | ) | (60,404 | ) | (45,481 | ) | ||||||
|
|
|
|
|
| |||||||
Short term trade receivable | US$ | 59,405 | US$ | 64,531 | US$ | 59,653 | ||||||
|
|
|
|
|
| |||||||
| a/ | Age of the trade receivable portfolio per days at December 31, 2015, 2014 and 2013 is shown as follows: |
Aging 2015 | 0-30 | 31-60 | 61-90 | 91-120 | 121-150 | 151-180 | 181-360 | (+) 360 | Grand Total | |||||||||||||||||||||||||||
Normal supply clients | US$ | 16,297 | US$ | 6,017 | US$ | 2,177 | US$ | 3,138 | US$ | 2,886 | US$ | 2,817 | US$ | 15,005 | US$ | 79,106 | US$ | 127,443 | ||||||||||||||||||
Active without charges | — | — | — | — | — | — | — | 21 | 21 | |||||||||||||||||||||||||||
Repeated Auto Reclosing (ARR, in Spanish) | 60 | 61 | 58 | 59 | 59 | 59 | 387 | 3,262 | 4,005 | |||||||||||||||||||||||||||
Forced power cut | — | — | 1 | — | — | 1 | 4 | 435 | 441 | |||||||||||||||||||||||||||
Shut down non- payment | — | — | — | — | — | — | — | 3,810 | 3,810 | |||||||||||||||||||||||||||
Voluntary power cut | 1 | 1 | — | — | — | — | 3 | 5 | 10 | |||||||||||||||||||||||||||
Interrupted supply non- payment | 455 | 470 | 448 | 415 | 398 | 417 | 2,633 | 15,443 | 20,679 | |||||||||||||||||||||||||||
Eventual supply | — | — | — | — | — | — | — | 2 | 2 | |||||||||||||||||||||||||||
Administrative suspension outstanding invoice | 13 | 15 | 25 | 7 | 1 | 1 | 7 | 23 | 92 | |||||||||||||||||||||||||||
Administrative suspension | 43 | 60 | 72 | 100 | 83 | 98 | 437 | 1,991 | 2,884 | |||||||||||||||||||||||||||
|
|
|
|
|
|
|
|
|
|
|
|
|
|
|
|
|
| |||||||||||||||||||
Grand total | US$ | 16,869 | US$ | 6,624 | US$ | 2,781 | US$ | 3,719 | US$ | 3,427 | US$ | 3,393 | US$ | 18,476 | US$ | 104,098 | US$ | 159,387 | ||||||||||||||||||
|
|
|
|
|
|
|
|
|
|
|
|
|
|
|
|
|
| |||||||||||||||||||
F-384
Table of Contents
DISTRIBUIDORA DE ELECTRICIDAD DE OCCIDENTE, S. A.—DEOCSA
NOTES TO THE FINANCIAL STATEMENTS
AS OF DECEMBER 31, 2015, 2014 AND 2013 AND JANUARY 1, 2013 (RESTATED),
AND FOR THE YEARS ENDED DECEMBER 31, 2015, 2014 AND 2013 (RESTATED)
(Stated in thousands of US Dollars, except otherwise indicated)
| 15. | TRADE RECEIVABLES (cont’d) |
Aging 2014 | 0-30 | 31-60 | 61-90 | 91-120 | 121-150 | 151-180 | 181-360 | (+) 360 | Grand total | |||||||||||||||||||||||||||
Normal supply clients | US$ | 2 | US$ | — | US$ | — | US$ | 1 | US$ | — | US$ | — | US$ | — | US$ | 5 | US$ | 8 | ||||||||||||||||||
Active without charges | — | — | — | — | — | — | 2 | 15 | 17 | |||||||||||||||||||||||||||
Repeated Auto Reclosing (ARR, in Spanish) | 71 | 76 | 73 | 70 | 71 | 72 | 441 | 2,777 | 3,651 | |||||||||||||||||||||||||||
Forced power cut | — | — | — | — | 1 | 1 | 7 | 540 | 549 | |||||||||||||||||||||||||||
Shut down non-payment | — | — | 1 | 3 | 5 | 10 | 357 | 5,174 | 5,550 | |||||||||||||||||||||||||||
Voluntary power cut | — | — | — | 1 | 1 | — | 1 | 2 | 5 | |||||||||||||||||||||||||||
Interrupted supply non- payment | 16,456 | 5,755 | 2,298 | 3,299 | 2,749 | 2,641 | 13,532 | 57,380 | 104,110 | |||||||||||||||||||||||||||
Eventual supply | 470 | 515 | 527 | 480 | 463 | 424 | 2,387 | 12,403 | 17,669 | |||||||||||||||||||||||||||
Administrative suspension outstanding invoice | — | — | — | — | — | — | — | 2 | 2 | |||||||||||||||||||||||||||
Administrative suspension | 9 | 11 | 18 | 5 | 2 | 8 | 15 | 54 | 122 | |||||||||||||||||||||||||||
Active without charges | 67 | 104 | 134 | 196 | 212 | 168 | 714 | 2,584 | 4,179 | |||||||||||||||||||||||||||
|
|
|
|
|
|
|
|
|
|
|
|
|
|
|
|
|
| |||||||||||||||||||
Grand total | US$ | 17,075 | US$ | 6,461 | US$ | 3,051 | US$ | 4,055 | US$ | 3,504 | US$ | 3,324 | US$ | 17,456 | US$ | 80,936 | US$ | 135,862 | ||||||||||||||||||
|
|
|
|
|
|
|
|
|
|
|
|
|
|
|
|
|
| |||||||||||||||||||
Aging 2013 | 0-30 | 31-60 | 61-90 | 91-120 | 121-150 | 151-180 | 181-360 | (+) 360 | Grand total | |||||||||||||||||||||||||||
Normal supply clients | US$ | 18,244 | US$ | 5,544 | US$ | 1,967 | US$ | 3,129 | US$ | 1,825 | US$ | 2,335 | US$ | 11,158 | US$ | 40,325 | US$ | 84,527 | ||||||||||||||||||
Active without charges | — | — | — | — | — | — | 6 | 16 | 22 | |||||||||||||||||||||||||||
Repeated Auto Reclosing (ARR, in Spanish) | 120 | 103 | 109 | 106 | 117 | 127 | 567 | 2,951 | 4,200 | |||||||||||||||||||||||||||
Forced power cut | — | — | — | — | — | 4 | 40 | 497 | 541 | |||||||||||||||||||||||||||
Shut down non-payment | — | 2 | 1 | 7 | 24 | 41 | 501 | 3,591 | 4,167 | |||||||||||||||||||||||||||
Power cut non-payment outstanding | 1 | 0 | 0 | 0 | 1 | 1 | 11 | 25 | 39 | |||||||||||||||||||||||||||
Voluntary power cut | — | — | — | — | — | — | 2 | 3 | 5 | |||||||||||||||||||||||||||
Interrupted supply non- payment | 586 | 583 | 633 | 467 | 506 | 512 | 2,119 | 9,105 | 14,511 | |||||||||||||||||||||||||||
Eventual supply | — | — | — | — | — | — | — | 2 | 2 | |||||||||||||||||||||||||||
Administrative suspension outstanding invoice | — | — | — | — | — | — | — | 9 | 9 | |||||||||||||||||||||||||||
Administrative suspension | 22 | 43 | 71 | 99 | 125 | 91 | 273 | 852 | 1,576 | |||||||||||||||||||||||||||
|
|
|
|
|
|
|
|
|
|
|
|
|
|
|
|
|
| |||||||||||||||||||
Grand total | US$ | 18,973 | US$ | 6,275 | US$ | 2,781 | US$ | 3,808 | US$ | 2,598 | US$ | 3,111 | US$ | 14,677 | US$ | 57,376 | US$ | 109,599 | ||||||||||||||||||
|
|
|
|
|
|
|
|
|
|
|
|
|
|
|
|
|
| |||||||||||||||||||
The period of the average credit on the energy sale is thirty days. There is no charge of late interests on the trade accounts receivable for the first thirty days after invoice is issued. Subsequently to that date, late interests approved every quarter by CNEE are charged. In 2015, 2014 and 2013 the late interest applied fluctuated between 1% and 1.05% monthly on the outstanding balance.
F-385
Table of Contents
DISTRIBUIDORA DE ELECTRICIDAD DE OCCIDENTE, S. A.—DEOCSA
NOTES TO THE FINANCIAL STATEMENTS
AS OF DECEMBER 31, 2015, 2014 AND 2013 AND JANUARY 1, 2013 (RESTATED),
AND FOR THE YEARS ENDED DECEMBER 31, 2015, 2014 AND 2013 (RESTATED)
(Stated in thousands of US Dollars, except otherwise indicated)
| 15. | TRADE RECEIVABLES (cont’d) |
Age of the trade receivable portfolio per days to December 31, 2015, 2014 and 2013 is shown as follows:
As at | Impairment | As at | Impairment | As at | Impairment | |||||||||||||||||||
Not past due | 16,869 | — | 17,075 | — | 18,973 | |||||||||||||||||||
Past due to 1 month | 6,624 | 6,461 | 6,275 | |||||||||||||||||||||
Past due to 2 months | 2,781 | — | 3,051 | — | 2,782 | |||||||||||||||||||
Past due 3 to 6 months | 10,539 | — | 10,883 | — | 9,519 | |||||||||||||||||||
Past due more than six months | 122,574 | (1) | (76,754 | ) | 98,392 | (1) | (60,404 | ) | 72,050 | (1) | (45,481 | ) | ||||||||||||
|
|
|
|
|
|
|
|
|
|
|
| |||||||||||||
| 159,387 | (76,754 | ) | 135,862 | (60,404 | ) | 109,599 | (45,481 | ) | ||||||||||||||||
|
|
|
|
|
|
|
|
|
|
|
| |||||||||||||
| (1) | Includes account receivables for collection by means of offsetting of US$ 22,222, US$ 19,558 and US$ 14,590 as of December 31, 2015, 2014 and 2013, respectively and accounts receivable to municipalities, Governmental entities and certain communities due to term-payment agreements of US$ 23,597, US$ 18,414 and US$ 10,820 as of December 31, 2015, 2014 and 2013, respectively, of which the Company has not recognized an allowance for uncollectible accounts since those are considered recoverable. |
| b/ | Trade accounts receivable include past-due balances from the municipalities out of which the Company has not recognized a provision for uncollectible accounts since those have not had significant changes on the credit quality and are considered recoverable. Amounts are shown as follows: |
2015 | 2014 | 2013 | ||||||||||
Not past due | US$ | 2,658 | US$ | 2,519 | US$ | 2,440 | ||||||
Past due to 60 days | 2,008 | 1,650 | 1,599 | |||||||||
Past due to 90 days | 197 | 265 | 257 | |||||||||
Past due to 120 days | 1,254 | 1,394 | 1,351 | |||||||||
Past due to 150 days | 1,060 | 954 | 924 | |||||||||
Past due to 180 days | 996 | 832 | 806 | |||||||||
Past due to 360 days | 4,107 | 3,525 | 3,415 | |||||||||
Past due more than 360 days | 11,311 | 7,980 | 5,464 | |||||||||
|
|
|
|
|
| |||||||
| 23,591 | 19,119 | 16,256 | ||||||||||
(-) Long term trade receivable | (11,311 | ) | (7,980 | ) | (5,464 | ) | ||||||
|
|
|
|
|
| |||||||
Short term trade receivable | US$ | 12,280 | US$ | 11,139 | US$ | 10,792 | ||||||
|
|
|
|
|
| |||||||
| c/ | Account receivable from INDE for the billing of the adjustment of Solidaridad INDE to the users benefited by the Social Tariff Act, according to the deed of INDE a-38-2013- 2.A. The amount to be billed by the Company is determined by the resolutions monthly issued by the CNEE. The recovery of the amount is carried out in 30 days subsequent to issuing the invoice. |
F-386
Table of Contents
DISTRIBUIDORA DE ELECTRICIDAD DE OCCIDENTE, S. A.—DEOCSA
NOTES TO THE FINANCIAL STATEMENTS
AS OF DECEMBER 31, 2015, 2014 AND 2013 AND JANUARY 1, 2013 (RESTATED),
AND FOR THE YEARS ENDED DECEMBER 31, 2015, 2014 AND 2013 (RESTATED)
(Stated in thousands of US Dollars, except otherwise indicated)
| 15. | TRADE RECEIVABLES (cont’d) |
| d/ | It corresponds to the estimated amount of services accrued, but not billed, from the sale of electric energy and toll at December 31, 2015, 2014, and 2013 net from the estimate of technical loss. This value is billed in full in the next billing cycle. |
| e/ | Uncollectible Accounts—The movement of the allowance for uncollectible accounts during years ended December 31, 2015, 2014 and 2013 are shown as follows: |
2015 | 2014 | 2013 | ||||||||||
Balance at the beginning of the year | US$ | 60,404 | US$ | 45,481 | US$ | 35,286 | ||||||
Expense of the period | 19,122 | 15,271 | 10,640 | |||||||||
Application of provisions and other movements | (2,533 | ) | (2,052 | ) | (741 | ) | ||||||
Translation differences | (239 | ) | 1,704 | 296 | ||||||||
|
|
|
|
|
| |||||||
| US$ | 76,754 | US$ | 60,404 | US$ | 45,481 | |||||||
|
|
|
|
|
| |||||||
The Company records an allowance for uncollectible accounts over all those balances aged beyond 180 days less the collection by means of offsetting and the accounts receivable to municipalities, Governmental entities, and certain communities due to term-payment agreements.
| f/ | Collection by means of offsetting corresponds to the balances payable to the municipalities for the municipal tariff of public lighting that the Company charges to the users in the name of the municipalities. The Company includes this balance as part of the trade accounts receivable based on the right acquired through the contracts with municipalities to collect the public lighting tariff and offset it with the balances receivable from the electric energy billing to the same municipalities. |
Additional information on accounts receivable from customers under Separate Management
As of December 31, 2015, 2014 and 2013, the Company records as part of its accounts receivable US$ 89,582, US$ 73,819 and US$ 50,749, respectively; corresponding to customers separately identified from the remaining receivables for collection purposes.
In 2014 and 2013 updating of the record of separate management was carried out with the purpose of focusing on resources to recover the groups of clients with an impact on the debt management for the Company.
F-387
Table of Contents
DISTRIBUIDORA DE ELECTRICIDAD DE OCCIDENTE, S. A.—DEOCSA
NOTES TO THE FINANCIAL STATEMENTS
AS OF DECEMBER 31, 2015, 2014 AND 2013 AND JANUARY 1, 2013 (RESTATED),
AND FOR THE YEARS ENDED DECEMBER 31, 2015, 2014 AND 2013 (RESTATED)
(Stated in thousands of US Dollars, except otherwise indicated)
| 15. | TRADE RECEIVABLES (cont’d) |
In 2015 and 2014 the same methodology used in 2014 and 2013 is maintained. Based on such updating, the separate management is shown by age as follows:
At December 31, 2015:
Township | Receivables 0-60 days | Receivables | Receivables | Total | ||||||||||||
San Marcos | US$ | 2,491 | US$ | 4,304 | US$ | 45,995 | US$ | 52,790 | ||||||||
Huehuetenango | 1,410 | 2,385 | 14,009 | 17,804 | ||||||||||||
Retalhuleu | 254 | 490 | 4,366 | 5,110 | ||||||||||||
Quetzaltenango | 226 | 461 | 4,211 | 4,898 | ||||||||||||
Suchitepéquez | 243 | 433 | 3,736 | 4,412 | ||||||||||||
Quiché | 200 | 282 | 1,372 | 1,854 | ||||||||||||
Escuintla | 102 | 137 | 853 | 1,092 | ||||||||||||
Sololá | 73 | 149 | 808 | 1,030 | ||||||||||||
Totonicapán | 54 | 93 | 445 | 592 | ||||||||||||
|
|
|
|
|
|
|
| |||||||||
Total | US$ | 5,053 | US$ | 8,734 | US$ | 75,795 | US$ | 89,582 | ||||||||
|
|
|
|
|
|
|
| |||||||||
At December 31, 2014:
Township | Receivables 0-60 days | Receivables | Receivables | Total | ||||||||||||
San Marcos | US$ | 2,626 | US$ | 4,517 | US$ | 37,621 | US$ | 44,764 | ||||||||
Huehuetenango | 1,397 | 2,252 | 10,928 | 14,577 | ||||||||||||
Retalhuleu | 400 | 501 | 2,894 | 3,795 | ||||||||||||
Quetzaltenango | 220 | 444 | 3,076 | 3,740 | ||||||||||||
Suchitepéquez | 223 | 409 | 2,656 | 3,288 | ||||||||||||
Escuintla | 169 | 237 | 728 | 1,134 | ||||||||||||
Quiché | 241 | 245 | 778 | 1,264 | ||||||||||||
Sololá | 80 | 129 | 555 | 764 | ||||||||||||
Totonicapán | 76 | 90 | 327 | 493 | ||||||||||||
|
|
|
|
|
|
|
| |||||||||
Total | US$ | 5,432 | US$ | 8,824 | US$ | 59,563 | US$ | 73,819 | ||||||||
|
|
|
|
|
|
|
| |||||||||
F-388
Table of Contents
DISTRIBUIDORA DE ELECTRICIDAD DE OCCIDENTE, S. A.—DEOCSA
NOTES TO THE FINANCIAL STATEMENTS
AS OF DECEMBER 31, 2015, 2014 AND 2013 AND JANUARY 1, 2013 (RESTATED),
AND FOR THE YEARS ENDED DECEMBER 31, 2015, 2014 AND 2013 (RESTATED)
(Stated in thousands of US Dollars, except otherwise indicated)
| 15. | TRADE RECEIVABLES (cont’d) |
At December 31, 2013:
Township | Receivables 0-60 days | Receivables | Receivables | Total | ||||||||||||
San Marcos | US$ | 2,642 | US$ | 4,043 | US$ | 30,921 | US$ | 37,606 | ||||||||
Huehuetenango | 607 | 703 | 4,292 | 5,602 | ||||||||||||
Retalhuleu | 330 | 436 | 1,914 | 2,680 | ||||||||||||
Quetzaltenango | 110 | 235 | 1,716 | 2,061 | ||||||||||||
Suchitepéquez | 193 | 329 | 1,692 | 2,214 | ||||||||||||
Quiché | 130 | 90 | 320 | 540 | ||||||||||||
Totonicapán | 7 | 4 | 21 | 32 | ||||||||||||
Sololá | 7 | 1 | 4 | 12 | ||||||||||||
Chimaltenango | 1 | 1 | . | 2 | ||||||||||||
|
|
|
|
|
|
|
| |||||||||
Total | US$ | 4,027 | US$ | 5,842 | US$ | 40,880 | US$ | 50,749 | ||||||||
|
|
|
|
|
|
|
| |||||||||
The following discloses the process that the Company has implemented to collect its account receivables from its customers.
In 2013, the Company implemented a program to improve the collection of its accounts receivables. The program consists of four specific strategies to improve collections from customers separately identified from the remaining receivables for collection purposes:
| 1. | Debt management—early settlement; |
| 2. | Assurance of field activities; |
| 3. | Management of amounts due from customers outstanding for more than 180 days; and |
| 4. | Local community management and development. |
This program did not consider the active participation of the local representatives and the municipal government; that is the reason why since 2014 an additional strategy from the four detailed above was included to the program in order to promote dialogue and negotiation processes with local representatives, governmental entities and other energy distributors, which allowed to create collection management groups at a municipal level.
The new methodology, which incorporates local representatives, promotes sustainable receivable recovery processes and the reincorporation of Company´s customers to the commercial cycle. This new strategy starts with dialogue and negotiation roundtables with community leaders with the main purpose of reincorporate the clients to the commercial cycle of the Company.
In these roundtables, benefits and commitments that are within the negotiation framework are considered.
F-389
Table of Contents
DISTRIBUIDORA DE ELECTRICIDAD DE OCCIDENTE, S. A.—DEOCSA
NOTES TO THE FINANCIAL STATEMENTS
AS OF DECEMBER 31, 2015, 2014 AND 2013 AND JANUARY 1, 2013 (RESTATED),
AND FOR THE YEARS ENDED DECEMBER 31, 2015, 2014 AND 2013 (RESTATED)
(Stated in thousands of US Dollars, except otherwise indicated)
| 15. | TRADE RECEIVABLES (cont’d) |
Each of the processes described above is documented through a written agreement with the objective of the regularization of the provision of the electric energy service and as part of the formality of the commitments assumed by each of the parties involved.
This new strategy added to the 2013 program has allowed new dialogue and negotiation opportunities as well as the reincorporation of 45,685 thousand clients in 2014, a quantity higher than the 15 thousand clients recovered in 2013. At the end of September 2015, there were 18 active projects in DEOCSA and they have achieved to reincorporate 33,354 clients as of that date.
To enhance the recovery of amounts due from clients, in June 2015 the negotiation phase of the program for the Northern-Western (NW), Central-Western (CW) and Southern-Western (SW) regions began with the purpose of meeting the expected recovery amount and ensure the reincorporation of the clients to the commercial cycle. This phase considered the deployment of own personnel of the different internal departments (technical, marketing and community relations) centralized in the headquarters to the five regions. In October 2015 the second phase of the program, this means the collection phase, in the NW, CW, and SW regions was initiated.
After the completion of the negotiation phase and with the local market enable to operate again, the collection strategies for 2013 were implemented.
Debt Management—Early Settlement
This strategy focuses on improving collections to avoid amounts due from customers outstanding for more than 180 days from becoming impaired. Actions taken include the following:
| 1. | Customer data update; |
| 2. | Management of collection through telephone calls and text messages; |
| 3. | Loyalty campaigns; |
| 4. | Local communication; and |
| 5. | Increase of collection channels |
Assurance of Field activities
The main objectives of this strategy is the prevention of conflicts originated by errors or failure in the field activities and to ensure the performance of scheduled power cut-offs related to lack of payment as a receivable recovery mechanism. The strategy of assurance of the field activities has been performed from two different approaches. The first approach includes continuous improvement of the commercial business cycle by ensuring that the monthly reading is performed to each of the Company´s clients and that their billing corresponds to the consumption made by the client. The second approach corresponds to strengthen the monitoring and evaluation of the quality of the activities performed by the contractors of the Company.
F-390
Table of Contents
DISTRIBUIDORA DE ELECTRICIDAD DE OCCIDENTE, S. A.—DEOCSA
NOTES TO THE FINANCIAL STATEMENTS
AS OF DECEMBER 31, 2015, 2014 AND 2013 AND JANUARY 1, 2013 (RESTATED),
AND FOR THE YEARS ENDED DECEMBER 31, 2015, 2014 AND 2013 (RESTATED)
(Stated in thousands of US Dollars, except otherwise indicated)
| 15. | TRADE RECEIVABLES (cont’d) |
Ensure the implementation of power cuts related to lack of payment as a mechanism to achieve receivable recovery is expected to reduce the amounts due from customers outstanding for more than 180 days. Within the activities are:
| 1. | Client consumption reading traceability; |
| 2. | Auditing the cut-offs performed; and |
| 3. | Creation of cut-off brigades |
Debt recovery through management of amounts due from customers outstanding for more than 180 days and local community management and development.
This strategy is focused towards improving the effectiveness of the receivables recovery activities. Within the activities are:
| i. | Development of action plans designed for comprehensive management of local communities with high levels of outstanding past-due receivables; |
| ii. | Traceability of receivable recovery activities in the field; |
| iii. | Strengthening of monitoring activities; and |
| iv. | Mobile offices. |
During 2014 coordination among different internal units of the Company was strengthened through the creation of an internal operating committee for the western area, including the different business units which active participation in the receivable recovery processes was required. In this committee there were representatives of Finance, Communication, Marketing, Community Relations, Legal and Regional Departments. This committee enable a fast implementation of the processes design to enhance the strategies described above and the implementation of the written Agreements signed with the involved communities. In 2015, this committee was dissolved and the strategy did not continue.
| 16. | PROPERTY, PLANT AND EQUIPMENT—NET |
Composition and movement at December 31, 2015, 2014 and 2013, of the items making up the cost of the property, plant, and equipment and their corresponding accumulated depreciation is as follows:
2015 | 2014 | 2013 | ||||||||||
Land and constructions | US$ | 1,126 | US$ | 1,119 | US$ | 1,166 | ||||||
Technical installations | 269,102 | 273,596 | 265,720 | |||||||||
Other installations, machinery, tools, furniture and equipment | 2,316 | 2,128 | 2,069 | |||||||||
Assets under constructions | 3,860 | 3,210 | 4,878 | |||||||||
Inventory of materials | 4,207 | 4,324 | 3,918 | |||||||||
|
|
|
|
|
| |||||||
| US$ | 280,611 | US$ | 284,377 | US$ | 277,751 | |||||||
|
|
|
|
|
| |||||||
F-391
Table of Contents
DISTRIBUIDORA DE ELECTRICIDAD DE OCCIDENTE, S. A.—DEOCSA
NOTES TO THE FINANCIAL STATEMENTS
AS OF DECEMBER 31, 2015, 2014 AND 2013 AND JANUARY 1, 2013 (RESTATED),
AND FOR THE YEARS ENDED DECEMBER 31, 2015, 2014 AND 2013 (RESTATED)
(Stated in thousands of US Dollars, except otherwise indicated)
| 16. | PROPERTY, PLANT AND EQUIPMENT—NET (cont’d) |
Movements Occurred During 2015
Description | Land and | Technical b/ | Other | Assets under | Inventory of | Total | ||||||||||||||||||
Acquisition cost | ||||||||||||||||||||||||
Balance at the beginning of 2015 | US$ | 2,335 | US$ | 497,078 | US$ | 9,487 | US$ | 3,210 | US$ | 4,324 | US$ | 516,434 | ||||||||||||
Translation differences | (11 | ) | (2,345 | ) | (42 | ) | (13 | ) | (20 | ) | (2,431 | ) | ||||||||||||
Additions | — | — | — | 11,843 | 203 | 12,046 | ||||||||||||||||||
Disposals | — | (18,537 | ) | (138 | ) | — | — | (18,675 | ) | |||||||||||||||
Transfers | 99 | 10,137 | 944 | (11,180 | ) | — | — | |||||||||||||||||
|
|
|
|
|
|
|
|
|
|
|
| |||||||||||||
Total cost | 2,423 | 486,333 | 10,251 | 3,860 | 4,507 | 507,374 | ||||||||||||||||||
Accumulated depreciation | ||||||||||||||||||||||||
Balance at the beginning of 2015 | (1,216 | ) | (223,482 | ) | (7,359 | ) | — | — | (232,057 | ) | ||||||||||||||
Additions | (87 | ) | (11,774 | ) | (748 | ) | — | (300 | ) | (12,909 | ) | |||||||||||||
Disposals | — | 16,969 | 138 | — | — | 17,107 | ||||||||||||||||||
Translation differences | 6 | 1,056 | 34 | — | — | 1,096 | ||||||||||||||||||
|
|
|
|
|
|
|
|
|
|
|
| |||||||||||||
Total accumulated depreciation | (1,297 | ) | (217,231 | ) | (7,935 | ) | — | (300 | ) | (226,763 | ) | |||||||||||||
|
|
|
|
|
|
|
|
|
|
|
| |||||||||||||
Carrying value at December 31, 2015 | US$ | 1,126 | US$ | 269,102 | US$ | 2,316 | US$ | 3,860 | US$ | 4,207 | US$ | 280,611 | ||||||||||||
|
|
|
|
|
|
|
|
|
|
|
| |||||||||||||
F-392
Table of Contents
DISTRIBUIDORA DE ELECTRICIDAD DE OCCIDENTE, S. A.—DEOCSA
NOTES TO THE FINANCIAL STATEMENTS
AS OF DECEMBER 31, 2015, 2014 AND 2013 AND JANUARY 1, 2013 (RESTATED),
AND FOR THE YEARS ENDED DECEMBER 31, 2015, 2014 AND 2013 (RESTATED)
(Stated in thousands of US Dollars, except otherwise indicated)
| 16. | PROPERTY, PLANT AND EQUIPMENT—NET (cont’d) |
Constructions performed by the Company during year 2015 are detailed per type of asset as follows:
Own Funds | Funds from | Total | ||||||||||
Administrative buildings—in progress | US$ | 254 | US$ | — | US$ | 254 | ||||||
Transportation substation—in progress | 25 | — | 25 | |||||||||
Distribution lines—in progress | 5,419 | 214 | 5,633 | |||||||||
Distribution substation—in progress | 178 | — | 178 | |||||||||
Transformation stations—in progress | 1,664 | — | 1,664 | |||||||||
Measurement tools—in progress | 3,385 | — | 3,385 | |||||||||
TPIS pending distribution—in progress | (116 | ) | — | (116 | ) | |||||||
Administrative vehicles—in progress | 74 | — | 74 | |||||||||
Industrial vehicles—in progress | 8 | — | 8 | |||||||||
Tools—in progress | 14 | — | 14 | |||||||||
Furniture—in progress | 66 | — | 66 | |||||||||
Office equipment—in progress | 79 | — | 79 | |||||||||
Information process equipment—in progress | 358 | — | 358 | |||||||||
Other property, plant and equipment—in progress | 221 | — | 221 | |||||||||
|
|
|
|
|
| |||||||
| US$ | 11,629 | US$ | 214 | US$ | 11,843 | |||||||
|
|
|
|
|
| |||||||
Movements Occurred During 2014
Description | Land and | Technical b/ | Other Furniture and | Assets under | Inventory | Total | ||||||||||||||||||
Balance at the beginning of 2014 | US$ | 2,251 | US$ | 470,649 | US$ | 8,560 | US$ | 4,878 | US$ | 3,918 | US$ | 490,256 | ||||||||||||
Additions | — | — | — | 11,468 | 274 | 11,742 | ||||||||||||||||||
Disposals | — | (1,505 | ) | (32 | ) | — | — | (1,537 | ) | |||||||||||||||
Translation differences | 73 | 15,357 | 287 | 124 | 132 | 15,973 | ||||||||||||||||||
Transfers | 11 | 12,577 | 672 | (13,260 | ) | — | — | |||||||||||||||||
|
|
|
|
|
|
|
|
|
|
|
| |||||||||||||
Total cost | 2,335 | 497,078 | 9,487 | 3,210 | 4,324 | 516,434 | ||||||||||||||||||
Accumulated depreciation | ||||||||||||||||||||||||
Balance at the beginning of 2014 | (1,086 | ) | (204,929 | ) | (6,491 | ) | — | — | (212,506 | ) | ||||||||||||||
Additions | (93 | ) | (12,385 | ) | (669 | ) | — | — | (13,147 | ) | ||||||||||||||
Disposals | — | 644 | 22 | — | — | 666 | ||||||||||||||||||
Translation differences | (37 | ) | (6,812 | ) | (221 | ) | — | — | (7,070 | ) | ||||||||||||||
|
|
|
|
|
|
|
|
|
|
|
| |||||||||||||
Total accumulated depreciation | (1,216 | ) | (223,482 | ) | (7,359 | ) | — | — | (232,057 | ) | ||||||||||||||
|
|
|
|
|
|
|
|
|
|
|
| |||||||||||||
Carrying value at December 31, 2014 | US$ | 1,119 | US$ | 273,596 | US$ | 2,128 | US$ | 3,210 | US$ | 4,324 | US$ | 284,377 | ||||||||||||
|
|
|
|
|
|
|
|
|
|
|
| |||||||||||||
F-393
Table of Contents
DISTRIBUIDORA DE ELECTRICIDAD DE OCCIDENTE, S. A.—DEOCSA
NOTES TO THE FINANCIAL STATEMENTS
AS OF DECEMBER 31, 2015, 2014 AND 2013 AND JANUARY 1, 2013 (RESTATED),
AND FOR THE YEARS ENDED DECEMBER 31, 2015, 2014 AND 2013 (RESTATED)
(Stated in thousands of US Dollars, except otherwise indicated)
| 16. | PROPERTY, PLANT AND EQUIPMENT—NET (cont’d) |
Constructions performed by the Company during 2014 are detailed per type of asset as follows:
Own Funds | Funds from | Total | ||||||||||
Administrative buildings—in progress | US$ | 49 | US$ | — | US$ | 49 | ||||||
Substations of distribution—in progress | 22 | — | 22 | |||||||||
Distribution lines—in progress | 4,965 | 640 | 5,605 | |||||||||
Substation of distribution—in progress | 59 | — | 59 | |||||||||
Transformation centers—in progress | 1,776 | — | 1,776 | |||||||||
Measuring instruments—in progress | 2,972 | — | 2,972 | |||||||||
Other electrical installations—in progress | 10 | — | 10 | |||||||||
TPIS pending distribution | 186 | 100 | 286 | |||||||||
Administrative vehicles—in progress | 22 | — | 22 | |||||||||
Office equipment—in progress | 499 | — | 499 | |||||||||
Information process equipment—in progress | 168 | — | 168 | |||||||||
| — | — | — | ||||||||||
|
|
|
|
|
| |||||||
| US$ | 10,728 | US$ | 740 | US$ | 11,468 | |||||||
|
|
|
|
|
| |||||||
Movements Occurred During 2013
Description | Land and | Technical b/ | Other Installations and | Assets under | Inventory | Total | ||||||||||||||||||
Balance at the beginning of 2013 | US$ | 1,701 | US$ | 455,851 | US$ | 7,876 | US$ | 3,306 | US$ | 3,650 | US$ | 472,384 | ||||||||||||
Additions | — | — | — | 13,970 | 239 | 14,209 | ||||||||||||||||||
Disposals | — | — | (39 | ) | — | — | (39 | ) | ||||||||||||||||
Translation differences | 14 | 3,567 | 62 | 30 | 29 | 3,702 | ||||||||||||||||||
Transfers | 536 | 11,231 | 661 | (12,428 | ) | — | — | |||||||||||||||||
|
|
|
|
|
|
|
|
|
|
|
| |||||||||||||
Total cost | 2,251 | 470,649 | 8,560 | 4,878 | 3,918 | 490,256 | ||||||||||||||||||
Accumulated depreciation | ||||||||||||||||||||||||
Balance at the beginning of 2013 | (897 | ) | (189,072 | ) | (5,883 | ) | — | — | (195,852 | ) | ||||||||||||||
Additions | (181 | ) | (14,356 | ) | (584 | ) | — | — | (15,121 | ) | ||||||||||||||
Disposals | — | — | 23 | — | — | 23 | ||||||||||||||||||
Translation differences | (7 | ) | (1,501 | ) | (47 | ) | — | — | (1,555 | ) | ||||||||||||||
|
|
|
|
|
|
|
|
|
|
|
| |||||||||||||
Total accumulated depreciation | (1,085 | ) | (204,929 | ) | (6,491 | ) | — | — | (212,505 | ) | ||||||||||||||
|
|
|
|
|
|
|
|
|
|
|
| |||||||||||||
Carrying value at December 31, 2013 | US$ | 1,166 | US$ | 265,720 | US$ | 2,069 | US$ | 4,878 | US$ | 3,918 | US$ | 277,751 | ||||||||||||
|
|
|
|
|
|
|
|
|
|
|
| |||||||||||||
F-394
Table of Contents
DISTRIBUIDORA DE ELECTRICIDAD DE OCCIDENTE, S. A.—DEOCSA
NOTES TO THE FINANCIAL STATEMENTS
AS OF DECEMBER 31, 2015, 2014 AND 2013 AND JANUARY 1, 2013 (RESTATED),
AND FOR THE YEARS ENDED DECEMBER 31, 2015, 2014 AND 2013 (RESTATED)
(Stated in thousands of US Dollars, except otherwise indicated)
| 16. | PROPERTY, PLANT AND EQUIPMENT—NET (cont’d) |
Own Funds | Funds from | Total | ||||||||||
Administrative buildings—in progress | US$ | 675 | US$ | — | US$ | 675 | ||||||
Current commercial buildings | 66 | — | 66 | |||||||||
Distribution lines—in progress | 5,549 | 2,260 | 7,809 | |||||||||
Substation of distribution—in progress | 13 | — | 13 | |||||||||
Transformation station—in progress | 1,405 | — | 1,405 | |||||||||
Measuring tools—in progress | 3,104 | — | 3,104 | |||||||||
TPIS pending distribution | 31 | — | 31 | |||||||||
Administrative vehicles—in progress | 206 | — | 206 | |||||||||
Information process equipment—in | 523 | — | 523 | |||||||||
Other property—in progress | 138 | — | 138 | |||||||||
|
|
|
|
|
| |||||||
| US$ | 11,710 | US$ | 2,260 | US$ | 13,970 | |||||||
|
|
|
|
|
| |||||||
| a/ | As December of 31, 2015, 2014 and 2013, classification of land and constructions is as follows: |
Description | 2015 | 2014 | 2013 | |||||||||
Land | US$ | 154 | US$ | 155 | US$ | 150 | ||||||
Industrial buildings | 116 | 110 | 106 | |||||||||
Administrative buildings | 494 | 497 | 471 | |||||||||
Commercial buildings | 1,028 | 1,027 | 995 | |||||||||
Improvement to leased administrative property | 548 | 491 | 476 | |||||||||
Improvement to leased commercial property | 83 | 55 | 53 | |||||||||
|
|
|
|
|
| |||||||
| US$ | 2,423 | US$ | 2,335 | US$ | 2,251 | |||||||
|
|
|
|
|
| |||||||
| b/ | As of December 31, 2015, 2014 and 2013 classification per origin of technical installations is as follows: |
Year 2015
Description | Own Funds | Funds from | UA (*) | Total | ||||||||||||
Distribution | ||||||||||||||||
Distribution lines | US$ | 226,691 | US$ | 100,703 | US$ | — | US$ | 327,394 | ||||||||
Measuring instruments | 71,147 | 12,604 | — | 83,751 | ||||||||||||
Transmission centers | 48,284 | 19,033 | — | 67,317 | ||||||||||||
Substations of distribution | 5,347 | — | — | 5,347 | ||||||||||||
Telecommunications | ||||||||||||||||
Technical installations of telecommunications | 2,470 | — | 54 | 2,524 | ||||||||||||
|
|
|
|
|
|
|
| |||||||||
| US$ | 353,939 | US$ | 132,340 | US$ | 54 | US$ | 486,333 | |||||||||
|
|
|
|
|
|
|
| |||||||||
F-395
Table of Contents
DISTRIBUIDORA DE ELECTRICIDAD DE OCCIDENTE, S. A.—DEOCSA
NOTES TO THE FINANCIAL STATEMENTS
AS OF DECEMBER 31, 2015, 2014 AND 2013 AND JANUARY 1, 2013 (RESTATED),
AND FOR THE YEARS ENDED DECEMBER 31, 2015, 2014 AND 2013 (RESTATED)
(Stated in thousands of US Dollars, except otherwise indicated)
| 16. | PROPERTY, PLANT AND EQUIPMENT—NET (cont’d) |
Year 2014
Description | Own Funds | Funds from | UA (*) | Total | ||||||||||||
Distribution | ||||||||||||||||
Distribution lines | US$ | 223,858 | US$ | 100,492 | US$ | — | US$ | 324,350 | ||||||||
Measuring instruments | 83,227 | 15,782 | — | 99,009 | ||||||||||||
Transmission centers | 46,640 | 19,236 | — | 65,876 | ||||||||||||
Substations of distribution | 5,308 | — | — | 5,308 | ||||||||||||
Telecommunications | ||||||||||||||||
Technical installations of telecommunications | 2,480 | — | 55 | 2,535 | ||||||||||||
|
|
|
|
|
|
|
| |||||||||
| US$ | 361,513 | US$ | 135,510 | US$ | 55 | US$ | 497,078 | |||||||||
|
|
|
|
|
|
|
| |||||||||
Year 2013
Description | Own Funds | Funds from | UA (*) | Total | ||||||||||||
Distribution | ||||||||||||||||
Distribution lines | US$ | 210,886 | US$ | 96,495 | US$ | — | US$ | 307,381 | ||||||||
Measuring instruments | 77,632 | 15,290 | — | 92,922 | ||||||||||||
Transmission centers | 43,675 | 19,085 | — | 62,760 | ||||||||||||
Substations of distribution | 5,130 | — | — | 5,130 | ||||||||||||
Telecommunications | ||||||||||||||||
Technical installations of telecommunications | 2,403 | — | 53 | 2,456 | ||||||||||||
|
|
|
|
|
|
|
| |||||||||
| US$ | 339,726 | US$ | 130,870 | US$ | 53 | US$ | 470,649 | |||||||||
|
|
|
|
|
|
|
| |||||||||
| (*) | UA: “Units Assets” are the assets that the Company obtains with INDE’s funds. |
| c/ | At December 31, 2015, 2014 and 2013, classification per origin of other installations, machinery, tools, furniture, and other fixed assets is as follows: |
Year 2015
Own Funds | UA (*) | Total | ||||||||||
Tools, furniture and equipment | US$ | 2,297 | US$ | 314 | US$ | 2,611 | ||||||
Information process equipment | 5,127 | 165 | 5,292 | |||||||||
Transportation elements | 1,510 | — | 1,510 | |||||||||
Other property, plant and equipment | 632 | 206 | 838 | |||||||||
|
|
|
|
|
| |||||||
| US$ | 9,566 | US$ | 685 | US$ | 10,251 | |||||||
|
|
|
|
|
| |||||||
F-396
Table of Contents
DISTRIBUIDORA DE ELECTRICIDAD DE OCCIDENTE, S. A.—DEOCSA
NOTES TO THE FINANCIAL STATEMENTS
AS OF DECEMBER 31, 2015, 2014 AND 2013 AND JANUARY 1, 2013 (RESTATED),
AND FOR THE YEARS ENDED DECEMBER 31, 2015, 2014 AND 2013 (RESTATED)
(Stated in thousands of US Dollars, except otherwise indicated)
| 16. | PROPERTY, PLANT AND EQUIPMENT—NET (cont’d) |
Year 2014
Own Funds | UA (*) | Total | ||||||||||
Tools, furniture and equipment | US$ | 2,147 | US$ | 315 | US$ | 2,462 | ||||||
Information process equipment | 4,475 | 165 | 4,640 | |||||||||
Transportation elements | 1,574 | — | 1,574 | |||||||||
Other property, plant and equipment | 604 | 207 | 811 | |||||||||
|
|
|
|
|
| |||||||
| US$ | 8,800 | US$ | 687 | US$ | 9,487 | |||||||
|
|
|
|
|
| |||||||
Year 2013
Ows Funds | UA (*) | Total | ||||||||||
Tools, furniture and equipment | US$ | 1,894 | US$ | 305 | US$ | 2,199 | ||||||
Information process equipment | 3,968 | 160 | 4,128 | |||||||||
Transport elements | 1,447 | — | 1,447 | |||||||||
Other property, plant and equipment | 585 | 201 | 786 | |||||||||
|
|
|
|
|
| |||||||
| US$ | 7,894 | US$ | 666 | US$ | 8,560 | |||||||
|
|
|
|
|
| |||||||
| (*) | UA: “Units Assets” are the assets that the Company obtains with INDE’s funds. |
| d/ | At December 31 2015, 2014 and 2013, classification per origin of assets under construction is as follows: |
Year 2015
Works with Own Funds | Distribution Works PER | Total | ||||||||||
Land and constructions | US$ | 189 | US$ | — | US$ | 189 | ||||||
Distribution | ||||||||||||
Distribution lines | 2,929 | (783 | ) | 2,146 | ||||||||
Measuring instruments | 678 | — | 678 | |||||||||
Transformation centers | 136 | — | 136 | |||||||||
Substations of distribution | 166 | — | 166 | |||||||||
TPI pending distribution | 173 | — | 173 | |||||||||
Other property, plant and equipment in progress | 372 | — | 372 | |||||||||
|
|
|
|
|
| |||||||
| US$ | 4,643 | US$ | (783 | ) | US$ | 3,860 | ||||||
|
|
|
|
|
| |||||||
F-397
Table of Contents
DISTRIBUIDORA DE ELECTRICIDAD DE OCCIDENTE, S. A.—DEOCSA
NOTES TO THE FINANCIAL STATEMENTS
AS OF DECEMBER 31, 2015, 2014 AND 2013 AND JANUARY 1, 2013 (RESTATED),
AND FOR THE YEARS ENDED DECEMBER 31, 2015, 2014 AND 2013 (RESTATED)
(Stated in thousands of US Dollars, except otherwise indicated)
| 16. | PROPERTY, PLANT AND EQUIPMENT—NET (cont’d) |
Year 2014
Works with Own Funds | Distribution Works PER | UA (*) | Total | |||||||||||||
Land and constructions | US$ | 39 | US$ | — | US$ | — | US$ | 39 | ||||||||
Distribution | ||||||||||||||||
Distributions lines | 1,505 | (237 | ) | — | 1,268 | |||||||||||
Measuring instruments | 394 | — | — | 394 | ||||||||||||
Transformation centers | 665 | — | — | 665 | ||||||||||||
Substations of distribution | 60 | — | — | 60 | ||||||||||||
TPI pending distributions | 189 | 82 | 20 | 291 | ||||||||||||
Other property, plant and equipment in progress | 493 | — | — | 493 | ||||||||||||
|
|
|
|
|
|
|
| |||||||||
| US$ | 3,345 | US$ | (155 | ) | US$ | 20 | US$ | 3,210 | ||||||||
|
|
|
|
|
|
|
| |||||||||
Year 2013
Works with Own Funds | Funds from Government Grants | UA (*) | Total | |||||||||||||
Transport | ||||||||||||||||
Substations | US$ | 10 | US$ | — | US$ | — | US$ | 10 | ||||||||
Distribution | ||||||||||||||||
Distributions lines | 1,902 | 684 | — | 2,586 | ||||||||||||
Measuring instruments | 448 | — | — | 448 | ||||||||||||
Transformation centers | 1,408 | — | — | 1,408 | ||||||||||||
Substations of distribution | 13 | — | — | 13 | ||||||||||||
Other property, plant and equipment in progress | 413 | — | — | 413 | ||||||||||||
|
|
|
|
|
|
|
| |||||||||
| US$ | 4,194 | US$ | 684 | US$ | — | US$ | 4,878 | |||||||||
|
|
|
|
|
|
|
| |||||||||
| (*) | UA: “Units Assets” are the assets that the Company obtains with INDE’s funds. |
Depreciation expense charged to profit or loss at December 31, 2015, 2014 and 2013 is as follows:
2015 | 2014 | 2013 | ||||||||||
Property, plant and equipment constructed with own funds | US$ | 9,583 | US$ | 9,541 | US$ | 11,362 | ||||||
Property, plant and equipment constructed with funds coming from government grants | 3,326 | 3,606 | 3,759 | |||||||||
|
|
|
|
|
| |||||||
| US$ | 12,909 | US$ | 13,147 | US$ | 15,121 | |||||||
|
|
|
|
|
| |||||||
F-398
Table of Contents
DISTRIBUIDORA DE ELECTRICIDAD DE OCCIDENTE, S. A.—DEOCSA
NOTES TO THE FINANCIAL STATEMENTS
AS OF DECEMBER 31, 2015, 2014 AND 2013 AND JANUARY 1, 2013 (RESTATED),
AND FOR THE YEARS ENDED DECEMBER 31, 2015, 2014 AND 2013 (RESTATED)
(Stated in thousands of US Dollars, except otherwise indicated)
| 17. | INTANGIBLE ASSETS |
At December 31, 2015, 2014 and 2013, this item is made up as set out below:
Year 2015
Goodwill | Software Applications | Costs of Implementation of Software Applications | Costs of Development and Licenses in Progress | Total | ||||||||||||||||
Cost | ||||||||||||||||||||
Balance at the beginning of the year 2015 | US$ | 74,276 | US$ | 17,700 | US$ | 396 | US$ | 5 | US$ | 92,377 | ||||||||||
Additions | — | 668 | — | 3 | 671 | |||||||||||||||
Translation differences | (347 | ) | (81 | ) | (2 | ) | — | (430 | ) | |||||||||||
|
|
|
|
|
|
|
|
|
| |||||||||||
Total cost | 73,929 | 18,287 | 394 | 8 | 92,618 | |||||||||||||||
Accumulated amortization | ||||||||||||||||||||
Balance beginning 2015 | — | (13,971 | ) | (396 | ) | — | (14,367 | ) | ||||||||||||
Additions | — | (1,251 | ) | — | — | (1,251 | ) | |||||||||||||
Translation differences | — | 61 | 2 | — | 63 | |||||||||||||||
|
|
|
|
|
|
|
|
|
| |||||||||||
Total accumulated amortization | — | (15,161 | ) | (394 | ) | — | (15,555 | ) | ||||||||||||
|
|
|
|
|
|
|
|
|
| |||||||||||
Book value at December 31, 2015 | US$ | 73,929 | US$ | 3,126 | US$ | — | US$ | 8 | US$ | 77,063 | ||||||||||
|
|
|
|
|
|
|
|
|
| |||||||||||
Year 2014
Goodwill | Software Applications | Costs of Implementation of Software Applications | Costs of Development and Licenses in Progress | Total | ||||||||||||||||
Cost | ||||||||||||||||||||
Balance at the beginning of the year 2014 | US$ | 71,959 | US$ | 16,226 | US$ | 383 | US$ | — | US$ | 88,568 | ||||||||||
Additions | — | — | — | 940 | 940 | |||||||||||||||
Transfer | — | 935 | — | (935 | ) | — | ||||||||||||||
Translation differences | 2,317 | 539 | 12 | — | 2,868 | |||||||||||||||
|
|
|
|
|
|
|
|
|
| |||||||||||
Total cost | 74,276 | 17,700 | 395 | 5 | 92,376 | |||||||||||||||
|
|
|
|
|
|
|
|
|
| |||||||||||
Accumulated amortization | ||||||||||||||||||||
Balance beginning 2014 | — | (12,403 | ) | (383 | ) | — | (12,786 | ) | ||||||||||||
Additions | — | (1,148 | ) | — | — | (1,148 | ) | |||||||||||||
Translation differences | — | (420 | ) | (12 | ) | — | (432 | ) | ||||||||||||
|
|
|
|
|
|
|
|
|
| |||||||||||
Total accumulated amortization | — | (13,971 | ) | (395 | ) | — | (14,366 | ) | ||||||||||||
|
|
|
|
|
|
|
|
|
| |||||||||||
Book value at December 31, 2015 | US$ | 74,276 | US$ | 3,729 | US$ | — | US$ | 5 | US$ | 78,010 | ||||||||||
|
|
|
|
|
|
|
|
|
| |||||||||||
F-399
Table of Contents
DISTRIBUIDORA DE ELECTRICIDAD DE OCCIDENTE, S. A.—DEOCSA
NOTES TO THE FINANCIAL STATEMENTS
AS OF DECEMBER 31, 2015, 2014 AND 2013 AND JANUARY 1, 2013 (RESTATED),
AND FOR THE YEARS ENDED DECEMBER 31, 2015, 2014 AND 2013 (RESTATED)
(Stated in thousands of US Dollars, except otherwise indicated)
| 17. | INTANGIBLE ASSETS (cont’d) |
Year 2013
Goodwill | Software Applications | Costs of Implementation of Software Applications | Costs of Development and Licenses in Progress | Total | ||||||||||||||||
Cost | ||||||||||||||||||||
Balance at the beginning of the year 2013 | US$ | 71,404 | US$ | 15,074 | US$ | 381 | US$ | — | US$ | 86,859 | ||||||||||
Additions | — | — | — | 1,032 | 1,032 | |||||||||||||||
Transfer | — | 1,032 | — | (1,032 | ) | — | ||||||||||||||
Translation differences | 555 | 120 | 3 | — | 678 | |||||||||||||||
|
|
|
|
|
|
|
|
|
| |||||||||||
Total cost | 71,959 | 16,226 | 384 | — | 88,569 | |||||||||||||||
|
|
|
|
|
|
|
|
|
| |||||||||||
Accumulated amortization | ||||||||||||||||||||
Balance beginning 2013 | — | (11,325 | ) | (380 | ) | — | (11,705 | ) | ||||||||||||
Additions | — | (988 | ) | — | — | (988 | ) | |||||||||||||
Translation differences | — | (90 | ) | (4 | ) | — | (94 | ) | ||||||||||||
|
|
|
|
|
|
|
|
|
| |||||||||||
Total accumulated amortization | — | (12,403 | ) | (384 | ) | — | (12,787 | ) | ||||||||||||
|
|
|
|
|
|
|
|
|
| |||||||||||
Book value at December 31, 2013 | US$ | 71,959 | US$ | 3,823 | US$ | — | US$ | — | US$ | 75,782 | ||||||||||
|
|
|
|
|
|
|
|
|
| |||||||||||
During years ended at December 31, 2015, 2014 and 2013, expense from amortization was US$ 1,251, US$ 1,148 and US$ 988, respectively.
| 18. | OTHER RECEIVABLES |
At December 31, 2015, 2014 and 2013, other receivables is composed as follows:
2015 | 2014 | 2013 | ||||||||||
Other receivables—long-term | ||||||||||||
Judicial bondsa/ | US$ | 2,695 | US$ | 2,658 | US$ | 2,431 | ||||||
Other accounts receivableb/ | 799 | 727 | 671 | |||||||||
|
|
|
|
|
| |||||||
| US$ | 3,494 | US$ | 3,385 | US$ | 3,102 | |||||||
|
|
|
|
|
| |||||||
Other receivables—short-term | ||||||||||||
Advance salaries | US$ | 168 | US$ | 221 | US$ | 161 | ||||||
INDE—Trust fund transportation | 13 | 18 | — | |||||||||
Other accounts receivablec/ | 3,405 | 105 | 1,077 | |||||||||
|
|
|
|
|
| |||||||
| US$ | 3,586 | US$ | 344 | US$ | 1,238 | |||||||
|
|
|
|
|
| |||||||
| a/ | Deposits carried out to the Judicial Department and the Regional Operator Entity. |
| b/ | Among other receivable accounts it is included the balance for tariff survey expenses pending to be applied in the amount for US$. 336. Additionally, US$. 469 are included that corresponds to accounts receivable from Norcontrol, S. A., from severance compensation paid by the Company on their behalf (Note 30c). |
F-400
Table of Contents
DISTRIBUIDORA DE ELECTRICIDAD DE OCCIDENTE, S. A.—DEOCSA
NOTES TO THE FINANCIAL STATEMENTS
AS OF DECEMBER 31, 2015, 2014 AND 2013 AND JANUARY 1, 2013 (RESTATED),
AND FOR THE YEARS ENDED DECEMBER 31, 2015, 2014 AND 2013 (RESTATED)
(Stated in thousands of US Dollars, except otherwise indicated)
| 18. | OTHER RECEIVABLES (cont’d) |
| c/ | As of December 31, 2015 Account receivable to Jaguar Energy due to an adjustment to the energy curve and losses related to the power guaranteed in 110 MW in accordance with the contract provisions (Note 33). |
| 19. | INVENTORY |
Stock of materials at December 31, 2015, 2014 and 2013 is as follows:
2015 | 2014 | 2013 | ||||||||||
Sundry materials | US$ | 1,159 | US$ | 541 | US$ | 429 | ||||||
Less: | ||||||||||||
Provision for obsolete materials | US$ | (672 | ) | US$ | (36 | ) | US$ | (35 | ) | |||
|
|
|
|
|
| |||||||
| US$ | 487 | US$ | 505 | US$ | 394 | |||||||
|
|
|
|
|
| |||||||
| 20. | TAX ASSETS AND LIABILITIES |
At December 31, 2015, 2014 and 2013, taxes assets and liabilities is composed as follows:
2015 | 2014 | 2013 | ||||||||||
Taxes receivable | ||||||||||||
Solidarity Tax—ISO, in Spanish | US$ | — | US$ | 655 | US$ | 635 | ||||||
Others | 109 | 110 | 106 | |||||||||
|
|
|
|
|
| |||||||
| US$ | 109 | US$ | 765 | US$ | 741 | |||||||
|
|
|
|
|
| |||||||
Taxes payables | ||||||||||||
Income tax payable (Note 14) | US$2,557 | US$ | 9,179 | US$ | 687 | |||||||
Property tax (municipal levy) | 1,111 | 1,992 | 461 | |||||||||
Value Added Tax—VAT | 918 | 1,322 | 1,143 | |||||||||
Value Added Tax withholdings— VAT | 280 | 144 | 153 | |||||||||
Income Tax withholdings payable | 97 | 123 | 137 | |||||||||
Others | 5 | 664 | 5 | |||||||||
|
|
|
|
|
| |||||||
| US$ | 4,968 | US$ | 13,424 | US$ | 2,586 | |||||||
|
|
|
|
|
| |||||||
F-401
Table of Contents
DISTRIBUIDORA DE ELECTRICIDAD DE OCCIDENTE, S. A.—DEOCSA
NOTES TO THE FINANCIAL STATEMENTS
AS OF DECEMBER 31, 2015, 2014 AND 2013 AND JANUARY 1, 2013 (RESTATED),
AND FOR THE YEARS ENDED DECEMBER 31, 2015, 2014 AND 2013 (RESTATED)
(Stated in thousands of US Dollars, except otherwise indicated)
| 21. | RELATED PARTIES |
Accounts receivable and payable to related parties at December 31, 2015, 2014 and 2013, are composed by the following balances:
2015 | 2014 | 2013 | ||||||||||
Accounts receivable | ||||||||||||
Distribuidora de Electricidad de Oriente, S.A. | US$ | 124 | US$ | — | US$ | — | ||||||
DEOCSA BV | — | — | 172 | |||||||||
Comercializadora Guatemalteca Mayorista de Electricidad, S.A. | 7 | 8 | — | |||||||||
|
|
|
|
|
| |||||||
| US$ | 131 | US$ | 8 | US$ | 172 | |||||||
|
|
|
|
|
| |||||||
Accounts payable | ||||||||||||
Distribuidora de Electricidad de Oriente, S.A. a/ | US$ | 50 | US$ | 9,049 | US$ | 14 | ||||||
Comercializadora Guatemalteca Mayorista, S.A. | 66 | — | — | |||||||||
|
|
|
|
|
| |||||||
| US$ | 116 | US$ | 9,049 | US$ | 14 | |||||||
|
|
|
|
|
| |||||||
| a/ | Account receivable from Distribuidora de Electricidad de Oriente, S. A. corresponding to purchase of materials and cash transfers delivered which are supported by a promissory note that does not accrue interests and is not renewed monthly. This amount was collected during 2015. |
The amounts outstanding are unsecured and will be settled in cash. No guarantees have been given or received. No expense has been recognized in the current or prior years for bad or doubtful debts in respect of the amounts owed by related parties.
F-402
Table of Contents
DISTRIBUIDORA DE ELECTRICIDAD DE OCCIDENTE, S. A.—DEOCSA
NOTES TO THE FINANCIAL STATEMENTS
AS OF DECEMBER 31, 2015, 2014 AND 2013 AND JANUARY 1, 2013 (RESTATED),
AND FOR THE YEARS ENDED DECEMBER 31, 2015, 2014 AND 2013 (RESTATED)
(Stated in thousands of US Dollars, except otherwise indicated)
| 21. | RELATED PARTIES (cont’d) |
Main transaction among related parties are as follows:
2015 | 2014 | 2013 | ||||||||||
Loans from related parties | ||||||||||||
Distribuidora de Electricidad de Oriente, S. A. | US$ | 61 | US$ | 8,907 | US$ | 20,645 | ||||||
|
|
|
|
|
| |||||||
Purchase of materials | ||||||||||||
Distribuidora de Electricidad de Oriente, S. A. | US$ | 400 | US$ | 500 | US$ | 754 | ||||||
|
|
|
|
|
| |||||||
Sale of materials | ||||||||||||
Distribuidora de Electricidad de Oriente, S. A. | US$ | 459 | US$ | 527 | US$ | 1,154 | ||||||
|
|
|
|
|
| |||||||
Comercializadora Guatemalteca Mayorista de Electricidad, S.A. | US$ | — | US$ | 7 | US$ | 16 | ||||||
|
|
|
|
|
| |||||||
Toll service | ||||||||||||
Redes Eléctricas de Centroamérica, S. A.—Toll of secondary system in distribution lines | US$ | 384 | US$ | 203 | US$ | 114 | ||||||
|
|
|
|
|
| |||||||
Comercializadora Guatemalteca Mayorista de Electricidad, S.A. | US$ | 44 | US$ | — | US$ | — | ||||||
|
|
|
|
|
| |||||||
Operation Fee | ||||||||||||
Arthasan, S.A.a/ | US$ | 3,900 | US$ | 3,274 | US$ | 3,087 | ||||||
|
|
|
|
|
| |||||||
Energy supplied to Substations | ||||||||||||
Redes Eléctricas de Centroamérica, S.A. RECSA | US$ | 25 | US$ | 17 | US$ | 29 | ||||||
|
|
|
|
|
| |||||||
Leasing of vehicles | ||||||||||||
Comercializadora Guatemalteca Mayorista de Electricidad, S.A. | US$ | 180 | US$ | — | US$ | — | ||||||
|
|
|
|
|
| |||||||
Purchase of vehicles from: | ||||||||||||
Comercializadora Guatemalteca Mayorista de Electricidad, S.A. | US$ | 10 | US$ | — | US$ | — | ||||||
|
|
|
|
|
| |||||||
Billing of performed works: | ||||||||||||
Distribuidora de Electricidad de Oriente, S.A. | US$ | 733 | US$ | — | US$ | — | ||||||
|
|
|
|
|
| |||||||
| a/ | Contract of management and administration services and supervision services for the businesses of the Company. In January 2016 this contract was rescinded (Note 35). |
DEOCSA´s executive officers do not receive compensation directly from DEOCSA; each is also an executive officer of Arthasan, S. A. and receives compensation directly from Arthasan, S. A. The aggregate annual compensation expenses related to DEOCSA executive officers during 2015, 2014 and 2013 were US$ 3,900, US$ 3,274 and US$ 3,087, respectively.
F-403
Table of Contents
DISTRIBUIDORA DE ELECTRICIDAD DE OCCIDENTE, S. A.—DEOCSA
NOTES TO THE FINANCIAL STATEMENTS
AS OF DECEMBER 31, 2015, 2014 AND 2013 AND JANUARY 1, 2013 (RESTATED),
AND FOR THE YEARS ENDED DECEMBER 31, 2015, 2014 AND 2013 (RESTATED)
(Stated in thousands of US Dollars, except otherwise indicated)
| 22. | CASH AND CASH EQUIVALENTS |
At December 31, 2015, 2014 and 2013, cash and cash equivalents’ balance is composed as follows:
2015 | 2014 | 2013 | ||||||||||
Balances in local banks | US$ | 5,203 | US$ | 5,532 | US$ | 19,816 | ||||||
Cash | — | 90 | — | |||||||||
|
|
|
|
|
| |||||||
| US$ | 5,203 | US$ | 5,622 | US$ | 19,816 | |||||||
|
|
|
|
|
| |||||||
| 23. | CAPITAL STOCK |
At the date of its incorporation, the authorized capital of the Company was US $. 12,860,802 (Q. 85,000,000) represented by common shares with a face value of US $. 0.15 (Q. 1) each, out of which 21,350 shares were subscribed and paid. At the extraordinary general shareholders’ meeting held on December 4, 1998 it was agreed that the Company’s authorized capital was increased in US$. 17,293,805 (Q. 115,000,000), consequently, its authorized capital amounted up to US$. 30,154,607 (Q. 200,000,000).
According to Deed AG-003-007 dated October 24, 2007, the general shareholders’ meeting approved the reduction of the share capital subscribed and paid through the decrease of the face value of the entity’s shares. The new face value per share turned into US $.0.04 (Q. 0.34), instead of US $. 0.15 (Q. 1). Based on the reduction of the face value, the authorized capital was modified in US$. 29,569,509 (Q. 195,500,000), represented by 575,000,000 common, nominal or bearer shares.
At the General Shareholders’ Meeting held on June 17, 2011, it was agreed to increase the entity’s authorized capital in US $. 34,646,589 (Q. 268,037,098), and the same was formalized through public deed no. 7 dated October 3, 2011. As a result, the subscribed and paid capital increased in US$. 63,200,147 (Q. 463,537,098), divided into and represented by 1,363,344,407 common shares with a value of US$. 0.04 (Q. 0.34) cents each.
Distribution of shares at December 31, 2015, 2014 and 2013 in proportion to the shareholders is as follows:
Shareholders of DEOCSA | Sharing Participation | Amounts | Number of Shares | |||||||||
DEOCSA B.V. | 90.70 | % | US$ | 57,322,533 | 1,236,572,046 | |||||||
Estrella Cooperatief B.A. | 0.00 | % | 0.37 | 8 | ||||||||
Remaining shareholders | 9.30 | % | 5,877,614 | 126,772,353 | ||||||||
|
|
|
|
|
| |||||||
| 100.00 | % | US$ | 63,200,149 | 1,363,344,407 | ||||||||
|
|
|
|
|
| |||||||
The shares of the Company are in collateral and fiduciary guarantee of the loan withBanco Agromercantil de Guatemala, S. A. (Note 24).
Through the annual ordinary general shareholders’ meeting held on April 27, 2015 the distribution of dividends was agreed, which was approved in deed no. AG001-2015. The dividends declared to their distribution to the shareholders were in the amount of US$ 25,027.
F-404
Table of Contents
DISTRIBUIDORA DE ELECTRICIDAD DE OCCIDENTE, S. A.—DEOCSA
NOTES TO THE FINANCIAL STATEMENTS
AS OF DECEMBER 31, 2015, 2014 AND 2013 AND JANUARY 1, 2013 (RESTATED),
AND FOR THE YEARS ENDED DECEMBER 31, 2015, 2014 AND 2013 (RESTATED)
(Stated in thousands of US Dollars, except otherwise indicated)
| 24. | DEBT WITH FINANCIAL ENTITIES |
Debt balances with credit entities at December 31, 2015, 2014 and 2013, were as follows:
2015 | 2014 | 2013 | ||||||||||
Banco Agromercantil de Guatemala, S. A.a/ | US$ | 171,884 | US$ | 158,865 | US$ | 188,559 | ||||||
Less- Short term portionb/ | (23,002 | ) | (32,031 | ) | (39,943 | ) | ||||||
|
|
|
|
|
| |||||||
Long term debt with financial entities | US$ | 148,882 | US$ | 126,834 | US$ | 148,616 | ||||||
|
|
|
|
|
| |||||||
| a/ | Syndicated loan in the amount of US$ 150,146 (original amount) and of US$ 54,500 (original amount) with pledged collateral on Company own shares and fiduciary guarantee formalized on May 19, 2011 at a 10-year term. The interest of the portion in dollars will be established at the fixed rate of 6.00% for the first two years (from May 19, 2011 until May 18, 2013) and at a US LIBOR rate for three more months plus a spread of 4.70% for the following operating years (since May 19, 2013 onwards). The portion in quetzals accrues an annual variable interest rate calculated by the Active Weighted Average Rate less 5.6%. The loan matures on May 19, 2021. |
In April 2015 an additional provision was carried out regarding the syndicated long-term debt in the amount of US$ 31,500 (original amount) and of Q. 104,625 (original amount) with pledged collateral and fiduciary guarantee formalized on April 28, 2015 at a 10-year term and quarterly amortizations since May 19, 2018 for the portion in dollars and quetzals. The interest of the portion in dollars will be at a US LIBOR rate for three more months plus an annual spread of 4.70%, establishing a floor rate of 5.90% for the first year (April 28, 2015 to April 28, 2016) and a US rate LIBOR for 3 months plus a margin of 4.75% per annum, establishing a floor rate of 6.0% for the remaining nine years of the loan. The portion in quetzals accrues an annual variable interest rate calculated by the Active Weighted Average Rate less 6.10%. The loan matures on February 19, 2025
This loan includes the participation of several banks, being appointed Banco Agromercantil de Guatemala, S.A. as the manager of the Guarantee and Administration trust of the syndicated loan; the following banks are also participating with the following contribution in thousands of Dollars
2015 | 2014 | 2013 | ||||||||||
Bancolombia Panamá, S. A. | US$ | 45,972 | US$ | 57,320 | US$ | 68,369 | ||||||
Banco Industrial, S. A. | 45,591 | 38,563 | 43,979 | |||||||||
Banco G&T Continental, S. A. | 27,619 | 26,993 | 32,934 | |||||||||
Banco Agromercantil Guatemala, S. A. | 26,125 | 12,904 | 16,859 | |||||||||
Banco Reformador, S. A. | 7,336 | 6,354 | 7,185 | |||||||||
Mercom Bank Limited | 7,491 | 5,306 | 6,122 | |||||||||
Westrust Bank (International) Limited. | 3,831 | 4,527 | 5,222 | |||||||||
GTC Bank Inc. | 5,168 | 4,527 | 5,222 | |||||||||
Banco Internacional, S. A. | 2,751 | 2,371 | 2,667 | |||||||||
|
|
|
|
|
| |||||||
Total bank loans | US$ | 171,884 | US$ | 158,865 | US$ | 188,559 | ||||||
|
|
|
|
|
| |||||||
F-405
Table of Contents
DISTRIBUIDORA DE ELECTRICIDAD DE OCCIDENTE, S. A.—DEOCSA
NOTES TO THE FINANCIAL STATEMENTS
AS OF DECEMBER 31, 2015, 2014 AND 2013 AND JANUARY 1, 2013 (RESTATED),
AND FOR THE YEARS ENDED DECEMBER 31, 2015, 2014 AND 2013 (RESTATED)
(Stated in thousands of US Dollars, except otherwise indicated)
| 24. | DEBT WITH FINANCIAL ENTITIES (cont’d) |
| b/ | At December 31, 2014 and 2013 within the short term portion information related to the revolving credit line is included. |
OBLIGATIONS:
Financial Information:
| a) | Without exceeding 120 days after the fiscal year-end, individual and combined financial statements audited for Distribuidora de Electricidad de Occidente, S.A. and Distribuidora de Electricidad de Oriente, S.A. (related party) with a report and the independent auditor’s report. |
| b) | Without exceeding 60 days after each quarterly period, internal financial statements—individual and combined in a comparative manner regarding the previous fiscal quarter—for Distribuidora de Electricidad de Occidente, S.A. and Distribuidora de Electricidad de Oriente, S.A. (related party). |
| c) | Without exceeding 15 days before fiscal year-end, an annual business and budget plan, including forecasts prepared by the management. |
Social and Environmental Requirements
| a) | Notify any action or process against, or non-compliance issues with, the Environmental Law or Permits that could reasonably have an adverse material effect. |
Notices:
| a) | Notify within the five working days subsequent to receiving any correspondence from any governmental authority related with the investigation or possible investigation or other survey carried out by such office on any tax matter. |
| b) | Notify within the next sixty days subsequent to receiving any correspondence regarding a formal notice of evaluation or claim of a tax obligation or a court order. |
| c) | Notify within the next five working days subsequent to the occurrence of any matter resulting or that could reasonably result in an adverse material effect, of any material change in the accounting policies or reporting practices, of the use or disposal of any property or asset for which a mandatory advanced payment would have to be executed in conformity with Section 2.03 (b)(i) of the bank loan contract, or of the sale of capital shares or other capital interests for which the debtor would have to perform a mandatory advanced payment. |
Property Maintenance:
| a) | Maintain, preserve and take care of material property and necessary equipment for the optimum performance of the business, except for the normal wear. |
F-406
Table of Contents
DISTRIBUIDORA DE ELECTRICIDAD DE OCCIDENTE, S. A.—DEOCSA
NOTES TO THE FINANCIAL STATEMENTS
AS OF DECEMBER 31, 2015, 2014 AND 2013 AND JANUARY 1, 2013 (RESTATED),
AND FOR THE YEARS ENDED DECEMBER 31, 2015, 2014 AND 2013 (RESTATED)
(Stated in thousands of US Dollars, except otherwise indicated)
| 24. | DEBT WITH FINANCIAL ENTITIES (cont’d) |
Insurance Maintenance:
| a) | Maintain valid insurance policies with respect to property and businesses; protect them against losses or damages as other similar companies do. |
Interest Rate Protection:
| a) | Sign in relation with the loans with a LIBOR rate, no more than two years after signing the loan contract (May 19, 2011), interest rate hedging contracts of at least 90% of the debt amount in the first five years of the credit. At December 31, 2015 and 2014, the Company has a financial instrument of interest rate hedging—swap with Bancolombia Panamá, S. A. (Note 25). |
OTHER OBLIGATIONS:
Levies:
| a) | Do not sign contracts that establish rights, rights of access, restrictions, and other similar levies or burdens that affect the assets of the Company. |
Indebtedness:
| a) | Do not borrow amounts in addition to that set out in the original loan contract. |
Financial Agreements:
During the validity of the loan, the Company has to comply with:
| a) | Combined cash flow hedging of Distribuidora de Electricidad de Occidente, S. A. and Distribuidora de Electricidad de Oriente, S. A. (related party): greater than or equal 1.30:1.00, which results from the sum of EBITDA, working capital, taxes, and cash, everything within the financial debt. |
| b) | Combined leverage ratio of Distribuidora de Electricidad de Occidente, S. A. and Distribuidora de Electricidad de Oriente, S. A. (related party): Must be measured and not be greater than the ratio established as follows: |
Measurement Date | Maximum Ratio | |||
December 31, 2014 | 3.5:1.0 | |||
December 31, 2015 | 4.2:1.0 | |||
December 31, 2016 | 3.5:1.0 | |||
December 31, 2017 | 3.5:1.0 | |||
December 31, 2018 | 3.5:1.0 | |||
December 31, 2019 | 3.5:1.0 | |||
December 31, 2020 | 3.5:1.0 | |||
F-407
Table of Contents
DISTRIBUIDORA DE ELECTRICIDAD DE OCCIDENTE, S. A.—DEOCSA
NOTES TO THE FINANCIAL STATEMENTS
AS OF DECEMBER 31, 2015, 2014 AND 2013 AND JANUARY 1, 2013 (RESTATED),
AND FOR THE YEARS ENDED DECEMBER 31, 2015, 2014 AND 2013 (RESTATED)
(Stated in thousands of US Dollars, except otherwise indicated)
| 24. | DEBT WITH FINANCIAL ENTITIES (cont’d) |
The maximum combined leverage ratio of Distribuidora de Electricidad de Occidente, S.A. and Distribuidora de Electricidad de Oriente, S.A. (related party) is the result of the sum of the financial debt less cash divided into EBITDA.
According to the loan contract, the calculation of the abovementioned ratios is carried out over a combined basis, which includes the figures of Distribuidora de Electricidad de Occidente, S.A. and Distribuidora de Electricidad de Oriente, S.A. (related party). During 2015, 2014 and 2013 there was no infringement on said financial agreements.
Capital Expenses:
Capital expenses in the normal course of the business that do not exceed, in the aggregate for the Borrower during every fiscal year, an amount equivalent to 15% from the amount established in the annual business and budget plan submitted according to Section 6.01 (c) of the Borrower regarding investment intended for said economic year, and such amount of capital invested in excess of the allowed amount that can be accepted for most of the Lenders.
The loan agreement sets out in clause 7.06 that the payment of dividends will be considered as Restrained Payments (that could not be executed) if the Company might be in any of the following situations:
| a) | In a non-compliance situation (from the engagement of the loan contract). |
| b) | If the Company is obliged to deposit certain amount of money in the Tax Contingency Account. |
| c) | Whether the amount in the Legal Dispute Contingencies Account were less than the amount in the Legal Dispute Contingencies Assessment. |
| d) | Only in relation with the Restrained Payments made during the fiscal year ended at December 31, 2015. Such Restrained Payments must not surpass the sum of the net benefits of the Borrower in the fiscal year ended at December 2014, plus the retained earnings of that same fiscal year. |
| e) | Only with respect to the Restrained Payments made during the fiscal year ended at December 31, 2016. Such Restrained Payments must not surpass the sum of the net benefits of the fiscal year ended at December 31, 2015, in addition to the accumulated earnings during that same year. The change in the nature of the business or the participation in any business line substantially different from business lines carried out on May 19, 2011 or any business substantially related or additional to the same. |
F-408
Table of Contents
DISTRIBUIDORA DE ELECTRICIDAD DE OCCIDENTE, S. A.—DEOCSA
NOTES TO THE FINANCIAL STATEMENTS
AS OF DECEMBER 31, 2015, 2014 AND 2013 AND JANUARY 1, 2013 (RESTATED),
AND FOR THE YEARS ENDED DECEMBER 31, 2015, 2014 AND 2013 (RESTATED)
(Stated in thousands of US Dollars, except otherwise indicated)
| 25. | OTHER FINANCIAL OBLIGATIONS |
As of December 31, 2015, 2014 and 2013, balances of the other financial obligations were as follows:
2015 | 2014 | 2013 | ||||||||||
Current | US$ | 364 | US$ | 714 | US$ | 953 | ||||||
Non-current | — | 300 | 364 | |||||||||
|
|
|
|
|
| |||||||
Interest rate hedging—swap | US$ | 364 | US$ | 1,014 | US$ | 1,317 | ||||||
|
|
|
|
|
| |||||||
Derived from one of the clauses of the debt with financial entities described in note 24, the Company is obliged to engage an interest rate hedging as an interest rate protection. To comply with such clause, a swap agreement was signed withBancolombia, S. A.
The purpose of the cash flow hedge is to protect the future cash flows that might be susceptible of significant variations as a result of the variations that might achieve the LIBOR interest rate. The interest rate swap is recorded at their fair value at the end of the reporting period; the fair value is determined by discounting the future cash flows for the fixed leg as for the floating leg and according to the terms and conditions of the swap agreement using the curves at the end of the reporting period and disclosed in note 34.
The change effect in the fair value of the swap agreement was a loss (gain) recognized in other comprehensive income of 2015,2014 and 2013 by US$ 475 ,and US$ 460 and US$ (1,182), respectively, less the deferred Income Tax of US$ 119, US$ 115 and US$ 313 respectively.
F-409
Table of Contents
DISTRIBUIDORA DE ELECTRICIDAD DE OCCIDENTE, S. A.—DEOCSA
NOTES TO THE FINANCIAL STATEMENTS
AS OF DECEMBER 31, 2015, 2014 AND 2013 AND JANUARY 1, 2013 (RESTATED),
AND FOR THE YEARS ENDED DECEMBER 31, 2015, 2014 AND 2013 (RESTATED)
(Stated in thousands of US Dollars, except otherwise indicated)
| 25. | OTHER FINANCIAL OBLIGATIONS (cont’d) |
The following table describe the main details of the swap agreement signed with Bancolombia S.A.:
TRANSACTION TYPE | INTEREST RATE HEDGING | |
Payment currency | US$ | |
Notional amount | 3,834 US$ | |
| TERMS | ||
Transaction date | 18 de mayo 2012 | |
Effective date | 20 de mayo 2013 | |
Termination date | 19 de mayo 2016 | |
| FIXED AMOUNTS | ||
Fixed rate payer | Distribuidora de Electricidad de Occidente, S.A. August, November, February and May 19 of each year starting on August 19, 2013 until and including the termination date | |
Fixed rate | 5.95% | |
FLOATING AMOUNTS | ||
Floating amount payer | Bancolombia Panamá, S.A. | |
Payment dates | August, November, February and May 19 of each year starting with August 19, 2013 until and including the termination date | |
Floating rate for initial calculation | Determined two days, from London banks, before the effective date | |
Floating rate option | US$ LIBOR-BBA | |
Defined maturity | 3 months | |
Spread | 4.70% | |
Determined floating rate | Two banking days from London prior to the date of | |
readjustment | ||
Readjustment dates | First day of each calculation term |
F-410
Table of Contents
DISTRIBUIDORA DE ELECTRICIDAD DE OCCIDENTE, S. A.—DEOCSA
NOTES TO THE FINANCIAL STATEMENTS
AS OF DECEMBER 31, 2015, 2014 AND 2013 AND JANUARY 1, 2013 (RESTATED),
AND FOR THE YEARS ENDED DECEMBER 31, 2015, 2014 AND 2013 (RESTATED)
(Stated in thousands of US Dollars, except otherwise indicated)
| 26. | DEFERRED REVENUES |
As of December 31, 2015, 2014 and 2013, the Company had received accumulated government grants in the amount of US$ 130,741, US$ 129,228 and US$ 128,164, respectively. The balance of deferred revenues as of those dates is US$ 73,154 and US$ 76,673, respectively, net of accumulated revenue recognized in profit or loss of US$ 57,985 and US$ 54,905, respectively. Balances and movements of the deferred revenues are shown as follows:
2015 | 2014 | 2013 | ||||||||||
Balance at the beginning of the year | US$ | 131,579 | US$ | 126,425 | US$ | 121,896 | ||||||
Government grants received during the year (Note 31) | 174 | 1,064 | 3,573 | |||||||||
Translation differences | (614 | ) | 4,090 | 955 | ||||||||
|
|
|
|
|
| |||||||
Total deferred revenues at year-end | 131,139 | 131,579 | 126,424 | |||||||||
|
|
|
|
|
| |||||||
Less—Accumulated accrued revenues | ||||||||||||
Balance at the beginning of the year | (54,905 | ) | (49,635 | ) | (45,514 | ) | ||||||
Accrued revenues for the year (Note 7) | (3,327 | ) | (3,607 | ) | (3,760 | ) | ||||||
Translation differences | 247 | (1,663 | ) | (362 | ) | |||||||
|
|
|
|
|
| |||||||
Accumulated accrued revenues at year-end | (57,985 | ) | (54,905 | ) | (49,636 | ) | ||||||
|
|
|
|
|
| |||||||
Deferred revenues, net | US$ | 73,154 | US$ | 76,674 | US$ | 76,788 | ||||||
|
|
|
|
|
| |||||||
| 27. | PROVISIONS |
At December 31, 2015, 2014 and 2013, the balances of the provisions were as follows:
2015 | 2014 | 2013 | ||||||||||
Provisions for contingenciesa/ | US$4,694 | US$5,016 | US$6,356 | |||||||||
Provisions for severance compensationb/ | 2,549 | 2,280 | 1,957 | |||||||||
|
|
|
|
|
| |||||||
| US$ | 7,243 | US$ | 7,296 | US$ | 8,313 | |||||||
|
|
|
|
|
| |||||||
| a/ | Provisions recorded by the Company at December 31, 2015, 2014 and 2013 correspond mainly to penalties imposed by the National Electric Energy Commission, as well as unfavorable judgments in litigations (Note 30). |
F-411
Table of Contents
DISTRIBUIDORA DE ELECTRICIDAD DE OCCIDENTE, S. A.—DEOCSA
NOTES TO THE FINANCIAL STATEMENTS
AS OF DECEMBER 31, 2015, 2014 AND 2013 AND JANUARY 1, 2013 (RESTATED),
AND FOR THE YEARS ENDED DECEMBER 31, 2015, 2014 AND 2013 (RESTATED)
(Stated in thousands of US Dollars, except otherwise indicated)
| 27. | PROVISIONS (cont’d) |
The movement of the account for 2015 and 2014 is shown as follows:
2015 | 2014 | 2013 | ||||||||||
Balance at January 1st | US$ | 5,016 | US$ | 6,560 | US$ | 6,904 | ||||||
Payments | (262 | ) | (576 | ) | (700 | ) | ||||||
Reversal of provision (note 13) | (242 | ) | (1,135 | ) | (297 | ) | ||||||
Provision | 212 | 194 | 394 | |||||||||
Translation differences | (30 | ) | (27 | ) | 55 | |||||||
|
|
|
|
|
| |||||||
Balance at December 31 | US$ | 4,694 | US$ | 5,016 | US$ | 6,356 | ||||||
|
|
|
|
|
| |||||||
| b/ | As indicated in Note 3m, the Company pays universal severance pay compensation on the described basis, plus the half part of an additional salary only for employees adhered to the collective agreement (former INDE’s employees). |
The movement of the account is shown as follows:
2015 | 2014 | 2013 | ||||||||||
Balance at January 1st | US$ | 2,280 | US$ | 1,957 | US$ | 2,279 | ||||||
Payments | (460 | ) | (504 | ) | (50 | ) | ||||||
Actuarial calculation | 739 | 759 | (289 | ) | ||||||||
Translation differences | (10 | ) | 68 | 17 | ||||||||
|
|
|
|
|
| |||||||
Balance at December 31st | US$ | 2,549 | US$ | 2,280 | US$ | 1,957 | ||||||
|
|
|
|
|
| |||||||
The following assumptions were used to assess the liabilities of the benefits covered by the plan:
Valuation date | December 31, 2015 | |
Discount rate | 8.19% for the obligations | |
Salaries increase | 5.00% annual | |
| Inflation | Not reflected specifically in the calculation, besides the salaries increase | |
Mortality | CSG-1960 | |
Disability | No considerations | |
Leave rate | Calculated according to the experience shown by the Company—1.62%. | |
Dismissal rate | Percentage corresponding to dismissals without justified cause | |
| (94.8%) | ||
Expenses | Not considered | |
Retirement age | 65 years old for all employees | |
Form of payment | Unique payment in case of leave either by dismissal or death |
F-412
Table of Contents
DISTRIBUIDORA DE ELECTRICIDAD DE OCCIDENTE, S. A.—DEOCSA
NOTES TO THE FINANCIAL STATEMENTS
AS OF DECEMBER 31, 2015, 2014 AND 2013 AND JANUARY 1, 2013 (RESTATED),
AND FOR THE YEARS ENDED DECEMBER 31, 2015, 2014 AND 2013 (RESTATED)
(Stated in thousands of US Dollars, except otherwise indicated)
| 28. | OTHER LIABILITIES |
At December 31, 2015, 2014 and 2013, others liabilities are made up as follows:
2015 | 2014 | 2013 | ||||||||||
Accumulated interests from deposits received from consumers | US$ | 20,032 | US$ | 16,334 | US$ | 12,646 | ||||||
Principal from deposits received from consumers | 14,616 | 13,318 | 11,955 | |||||||||
Others | 1,269 | 2,460 | 2,297 | |||||||||
|
|
|
|
|
| |||||||
| US$ | 35,917 | US$ | 32,112 | US$ | 26,898 | |||||||
|
|
|
|
|
| |||||||
| 29. | TRADE AND OTHER ACCOUNTS PAYABLES |
At December 31, 2015, 2014 and 2013 trade and other accounts payables with suppliers are as follows:
2015 | 2014 | 2013 | ||||||||||
Energy suppliers | US$ | 38,252 | US$ | 31,364 | US$ | 40,570 | ||||||
Services suppliers | 10,910 | 9,426 | 10,974 | |||||||||
Others | 673 | 809 | 519 | |||||||||
|
|
|
|
|
| |||||||
| US$ | 49,835 | US$ | 41,599 | US$ | 52,063 | |||||||
|
|
|
|
|
| |||||||
| 30. | CONTINGENCIES |
The Company is subject to certain contingent liabilities with respect to existing or potential claims, lawsuits and other proceedings. The Company accrues liabilities when it considers probable that future disbursements will be incurred and such amounts can be reasonably estimated. The related reserve is based on developments to date and historical information related to actions filed against the Company. As of December 31, 2015, 2014 and 2013 the Company had established reserves for contingencies of US$ 4,694, US$ 5,016 and US$ 6,356 respectively, to cover legal actions against the Company in which its Management has assessed the likelihood of a final adverse outcome as probable. A description of the main contingent liabilities is detailed below and in Note 35.
| a) | Regulatory and Legal Proceedings |
As of December 31, 2015, 2014 and 2013, the Company has legal processes originated from carrying on its investing plans and its own line of business (Note 27), which include the following:
| 1. | Sanction processes initiated by the National Energy Electric Commission (CNEE) in an aggregate amount as of December 31, 2015, 2014 and 2013 up to US$ 1,744 and US$ 1,888 and US$ 2,011 respectively. Based on the current legal framework, the Company is required to pay the CNEE penalties for non-compliance of the article 134 of the General Electricity Law and its Regulations. A provision as of December 31, 2015, 2014 and 2013 amounting US$ 1,739, US$ 1,882 and US$ 1,829, respectively, was recorded related to sanctions in the Administrative Contentious and |
F-413
Table of Contents
DISTRIBUIDORA DE ELECTRICIDAD DE OCCIDENTE, S. A.—DEOCSA
NOTES TO THE FINANCIAL STATEMENTS
AS OF DECEMBER 31, 2015, 2014 AND 2013 AND JANUARY 1, 2013 (RESTATED),
AND FOR THE YEARS ENDED DECEMBER 31, 2015, 2014 AND 2013 (RESTATED)
(Stated in thousands of US Dollars, except otherwise indicated)
| 30. | CONTINGENCIES (cont’d) |
| Revoke instance that based on the Company’s management and its legal department’s considerations, an adverse outcome from these claims are probable. |
| 2. | Sanction processes initiated by the National Energy Electric Commission in an aggregate amount up to US$ 2,995, US$ 3,008 and US$ 4,036, for 2015, 2014 and 2013 respectively. The CNEE establishes minimum levels of quality for electricity services. In addition, the CNEE imposes certain obligations on distribution companies related to required quality levels, and establishes fines for failure to comply with such quality levels and other obligations that should be compensated to users. Sanctions included herein relates to failure of quality parameters of the supplied electricity (tension, frequency and disturbances), and minimum standards for customer service. There is a provision recorded that amounts up to US$ 2,456, US$ 2,467 and US$ 3,620, respectively, that supports the processes with probable adverse outcome according to Company´s management and its legal advisors. |
| 3. | Civil petitions submitted by third parties for damages and several injuries to the Company in the amounts of US$ 5,871, US$ 7,743 and US$ 6,670. There is no provision for each of the three years as in the opinion of the Company’s management and its legal advisors, is not probable to obtain an unfavorable ruling against the Company. |
| 4. | Administrative Contentious Processes: the Company deals with Administrative Contentious Processes, most against resolutions issued by the CNEE amounting US$ 666, US$ 754 and US$ 394 because of failures in quality service. There is a provision recorded amounting up to US$ 383, US$ 384 and US$ 394 in 2015, 2014 and 2013 respectively that supports the processes with a probable unfavorable outcome. |
| b) | Fiscal |
As of December 31, 2015, 2014 and 2013, the Company has claims from the Tax Administration Superintendence (SAT, in Spanish) of additional taxes and fines related to tax obligations regarding Income Tax. The amount of the adjustments on omitted taxes corresponding to probable contingencies amounts up to US$ 29, US$ 274 and US$ 265, respectively. For this purpose, there is a provision recorded amounting up to US$ 29, US$ 274 and US$ 265, respectively that supports the processes which are probable to obtain an unfavorable sentence (Note 27).
| c) | Other Applus Norcontrol, S.L.U. |
Sanction processes initiated by the National Electric Energy Commission—CNEE amounting up to US$ 1,218 have imposed to Distribuidora de Electricidad Occidente, S.A. sanctions on supposed non-compliance with measurement and quality control standards of the technical product.
These sanctions were imposed to the Company, however, they are attributable to Norcontrol Guatemala, S. A, (Contractor) which is the entity engaged to carry out the works of measurement and quality control of the technical product. As of December 31, 2015, 2014 and 2013, and based on the legal advisors’ opinion, the status is still pending sentence, submission of evidence or litigation.
F-414
Table of Contents
DISTRIBUIDORA DE ELECTRICIDAD DE OCCIDENTE, S. A.—DEOCSA
NOTES TO THE FINANCIAL STATEMENTS
AS OF DECEMBER 31, 2015, 2014 AND 2013 AND JANUARY 1, 2013 (RESTATED),
AND FOR THE YEARS ENDED DECEMBER 31, 2015, 2014 AND 2013 (RESTATED)
(Stated in thousands of US Dollars, except otherwise indicated)
| 30. | CONTINGENCIES (cont’d) |
Additionally, on July 27, 2007 the Company held an agreement with the company Applus Norcontrol, S.L.U., where the latter acts as the guarantor of the obligations of its subsidiary Norcontrol Guatemala, S.A. and as a result, promissory notes were issued that are still valid and guarantee the amount of the possible fines on the sanctions to be submitted by the Regulatory Entity to the Company and will be used to pay any fines, when the respective legal resources are exhausted. As a consequence, no provision has been recognized regarding these processes.
| d) | Arbitration in Equality INDE |
As of December 31, 2015 there is a process of arbitration in equality encouraged by the Company due to the termination of the Trust Fund Contract and the Work Construction Contract of the Rural Electrification Project (PER, in Spanish). In this process, the Company requires to the National Electrification Institute (INDE, in Spanish) the payment of services provided for the construction of works in an amount of US$ 1,075, as well as the reception of the construction works.
On the other hand, INDE submitted a claim indicating that the infringement of the contract concerns the Company and requires the payment and the refund of advances amounting up to US$ 6,128. Likewise, it requires that pertaining access rights are constituted and that a payment on damages, due to the alleged failure in the constitution of access rights for the construction of transmission lines, is performed.
According to the estimate of the management and based on the respective legal analysis, the probable compensation claim payment to INDE is up to US$ 1,186 since the Company has the supporting documentation to demonstrate the dynamic actions in the construction of access rights, as well as the documentation in cases of force majeure. The probable amount of payment is recorded in the financial statements at December 31, 2015 (Note 28).
As of December 31, 2015, 2014 and 2013 the Company is subject to certain legal actions that the Company’s Management and its legal counsel consider to be possible that a future disbursement will be incurred for an aggregate amount up to US$ 13,217 and US$ 18,820 and US$ 10,531 respectively. No loss amount has been accrued for such possible legal actions, the most significant of which (individually or in the aggregate) are described below.
| 1. | Compensations for Technical Service Quality |
Based on the current legal framework, the Company is obliged to compensate its customers for failures in technical service quality. The CNEE establishes parameters for continuity (number and length of interruptions) and establishes fines for failure to comply with such parameters. As of December 31, 2015, 2014 and 2013 sanction processes initiated by the National Energy Electric Commission related to this fines in an aggregate amount up to US$ 10,562, US$ 10,430 and US$ 10,110, respectively. The recognition of this compensations to customers in accordance with the regulations issued by the CNEE depends on the following future events:
| 1. | To continue providing the service |
| 2. | The volume of future customer consumption under a regulated rate |
F-415
Table of Contents
DISTRIBUIDORA DE ELECTRICIDAD DE OCCIDENTE, S. A.—DEOCSA
NOTES TO THE FINANCIAL STATEMENTS
AS OF DECEMBER 31, 2015, 2014 AND 2013 AND JANUARY 1, 2013 (RESTATED),
AND FOR THE YEARS ENDED DECEMBER 31, 2015, 2014 AND 2013 (RESTATED)
(Stated in thousands of US Dollars, except otherwise indicated)
| 30. | CONTINGENCIES (cont’d) |
| 3. | The actual claim from customer before the CNEE to require the compensation, and |
| 4. | The compensation mechanism is not applicable for the majority of the customers of the Company |
Although the Company believes, based on the described above, has meritorious defenses, no assurance can be provided as to what the ultimate outcome of this matter will be. In the opinion of the Company’s management and its legal advisors, an adverse outcome from this claim is not probable. Consequently, no amount has been accrued at December 31, 2015, 2014 and 2013.
| 31. | TRUST FUND OF ELECTRIC ENERGY DISTRIBUTION |
DEOCSA and Distribuidora de Electricidad de Oriente, S. A. or DEORSA (a related company) held, through public deed No. 54 of May 4, 1999, the “Management Trust Fund Contract—INDE—of Rural Works in Western and Eastern Regions”, with an initial trust equity of US$ 333,569.
For the constructions of the works of distribution assets and transmission assets, DEOCSA, DEORSA and INDE entered into the “Management Trust Fund Contract—INDE—of Rural Works in Western and Eastern Regions”. Relevant aspects of such contract are described as follows:
Transmission assets constructed by DEOCSA and DEORSA will become property of INDE when completed, while the distribution assets will form part of the property, plant and equipment of DEORSA and DEOCSA.
At December 31, 2015, 2014 and 2013 DEOCSA completed the constructions of distribution assets under the “Project of Rural Electrification INDE (PER, in Spanish)” for total cost of US$ 132,340, US$ 135,510 and US$ 130,870, respectively (Note 16b). At these dates, the Company had supply energy to 125 (thousand), 120 (thousand) and 577 (thousand) users, respectively, according to the executive report of the benefited users.
Projects of Electric Energy Transmission
DEOCSA and DEORSA signed, through public deed No. 52 of May 4, 1999, the “Contract of Electric Energy Transmission Works Construction”, with an initial trust equity of US$ 150,974, which is part of the trust equity of the “Management Trust Fund Contract—INDE—Rural Works in Western and Eastern Regions”.
Trustor:
Instituto Nacional de Electrificación—INDE
Trustees:
Distribuidora de Electricidad de Occidente, S. A.—DEOCSA
Distribuidora de Electricidad de Oriente, S. A.—DEORSA
F-416
Table of Contents
DISTRIBUIDORA DE ELECTRICIDAD DE OCCIDENTE, S. A.—DEOCSA
NOTES TO THE FINANCIAL STATEMENTS
AS OF DECEMBER 31, 2015, 2014 AND 2013 AND JANUARY 1, 2013 (RESTATED),
AND FOR THE YEARS ENDED DECEMBER 31, 2015, 2014 AND 2013 (RESTATED)
(Stated in thousands of US Dollars, except otherwise indicated)
| 31. | TRUST FUND OF ELECTRIC ENERGY DISTRIBUTION (cont’d) |
Instituto Nacional de Electrificación—INDE—If there were a remainder at the end of the trust in cases specifically anticipated in the contract.
Fiduciary:
Banco Agromercantil de Guatemala, S. A.
Since the incorporation of the trust, the responsibility of a fiduciary is to manage the portion of the trust equity received from the special appointed representative and transfer to DEOCSA and DEORSA the cash required to perform the distribution projects and electric energy transmission included in the annual budget of the “Project of Rural Electrification INDE (PER, in Spanish)”, as follows: a) The fiduciary will deliver, during the first week of each year and as an advance, 20% of the total amount of the budgeted works to be concluded the same year, and b) the payment of the balance will be carried out in accordance with the certification issued every two months. For such management, the fiduciary charges an annual percentage.
Special Appointed Representative:
The Bank of New York
Since the incorporation of the trust, INDE transferred to this foreign bank, in Dollars of the United States of America, the product on the sale of the shares of DEOCSA and DEORSA and in order to complete the trust equity, the product of the shares promised for sale will be contributed. Likewise, INDE will contribute with additional funds required according to the contribution schedule. The special appointed representative is in charge of the main account of the trust and will transfer to the fiduciary the necessary amounts to cover the trustee’s requirements.
Term:
From 42 up to 60 months, renewable
Functions of the Trust:
“Management Trust Fund Contract—INDE—of Rural Works in Western and Eastern Regions”
Introduction of rural electric energy in 2,633 communities specified in the document “Project of Rural Electrification INDE (PER, in Spanish)” achieving no less than 280 (thousand) new users.
“Construction Contract for Transmission Projects”
Within the obligations included in said contract, the creation of a performance bond, through which both DEOCSA and DEORSA will have to constitute a performance bond in favor of INDE, is established.
F-417
Table of Contents
DISTRIBUIDORA DE ELECTRICIDAD DE OCCIDENTE, S. A.—DEOCSA
NOTES TO THE FINANCIAL STATEMENTS
AS OF DECEMBER 31, 2015, 2014 AND 2013 AND JANUARY 1, 2013 (RESTATED),
AND FOR THE YEARS ENDED DECEMBER 31, 2015, 2014 AND 2013 (RESTATED)
(Stated in thousands of US Dollars, except otherwise indicated)
| 31. | TRUST FUND OF ELECTRIC ENERGY DISTRIBUTION (cont’d) |
Likewise, it is necessary to create a quality bond equivalent to 20% of the total amount of this contract and must be extendable by a bonding company authorized for this type of operations in Guatemala, of renowned economic capacity and solvency, and previously accepted by INDE.
Additionally, at December 31, 2015 and 2014, there are bonds for compliance with Environmental Requirements amounting up to US$. 15 and US$. 18, respectively, required to construct transmission works and to constitute bonds before the Departmental Government. Those bonds are of commercial promotion and amount up to US$. 21 and US$. 4, respectively.
“Liquidation of the Distribution and Transmission Works Trust Fund”
During the second semester of 2014, actions were undertaken to obtain financing for the extension of the PER program in its Phase II in the amount of US$ 55 million, including an extension of the trust for five more years. However, the current political and institutional environment in the country affected directly the extension of the PER Trust and its approval from the Congress of the Republic of Guatemala. This aspect blocked the implementation of a programed phase of the project liquidation so on July 14, 2015, termination date of the Trust Fund Contract, said Trust concluded without a previous liquidation term, with works in progress and without the final reception from the Technical Committee.
According to the contract conditions, once the term of the Trust Fund is concluded, if there is disagreement in the reception and/or liquidation of the works among parties, it is necessary to initiate different negotiation mechanisms established in the contract; as of July 14, 2015, a Process of “Amicable Settlement” was initiated, but resolution agreements were not achieved. Due to this issue, an “Arbitration in Equality” process was undertaken as established in the contract for the liquidation of Works pending Reception from INDE.
As of today, the Arbitration Equality is still in process (Note 30).
| 32. | CONTRACTS OF OPERATING LEASING |
Operating leases are related to:
| a. | Vehicles owned by a related company having a leasing period of non-extendable 34 months since February 2015. The Company does not have the option of purchasing the leased vehicles at the expiry date of the leasing periods (Note 33). |
| Payments recognized as expenses of the period amounted up to US$ 177 |
| b. | Real estate owned by third parties is where commercial premises are located; the leasing period is of five years, extendable. The Company does not have the option of purchasing the leased property at the expiry date of the leasing periods (Note 33). |
Payments recognized as expenses of the period amounted up to US$ 285.
F-418
Table of Contents
DISTRIBUIDORA DE ELECTRICIDAD DE OCCIDENTE, S. A.—DEOCSA
NOTES TO THE FINANCIAL STATEMENTS
AS OF DECEMBER 31, 2015, 2014 AND 2013 AND JANUARY 1, 2013 (RESTATED),
AND FOR THE YEARS ENDED DECEMBER 31, 2015, 2014 AND 2013 (RESTATED)
(Stated in thousands of US Dollars, except otherwise indicated)
| 33. | COMMITMENTS |
Energy Purchase Agreements
The Company, during its normal course of business, celebrate power purchase agreements to supply the electricity to be delivered to its customers. As such, the Company has entered into several power purchase agreements for a certain quantity of energy at agreed prices for the next years, as described below. These agreements will not give rise to any material obligation to purchase that energy in each year. The Company pays an electricity charge for electricity actually consumed.
Agreements signed with effects in the years presented:
| 1) | DUKE ENERGY: Energy purchase contract from May 1, 2015 to April 30, 2017 through three central plants: a) Central 1 (Arizona): Contract for 2.579 MW, with an energy purchase price depending of bunker of US$ 89.00/MWh. Likewise, the central supports energy for a year as of May 1st, 2015 to April 30, 2016 for 8.952 MWh, at an average price of US$ 90/MWh, and a contract supporting power without associated energy for 11.198 MW, at a price of US$ 7.50/kW per month, for one-year term as of May 1st., 2015; Central 2 (Las Palmas I): Contract supporting power without associated energy with a total of US$ 7.50/kW per month, for one-year term as of May 1st, 2015; and Central 3 (Las Palmas II Carbón): Energy purchase contract for two years from May 1, 2015 with an engagement of 9.025 MW at an average energy price depending of coal of US$ 66.9/MWh. |
| 2) | GENERADORA DEL ESTE: Contract of power without associated energy from May 1, 2015 to April 30, 2017, which has two centrals: Central 1: 7.323 MW a price of US$ 5.80/ kW per month and Central 2: for 2.321 MWV at a price of US$ 6.15/kW per month. |
| 3) | INGENIO MAGDALENA: Energy purchase contract from May 1st. 2015 to April 30, 2016, which has the Central 1 (Magdalena Block 3) with an engagement of 4.203 MW at a biomass dependent energy price of US$ 44.99/MWh from November 2015 to April 2015 and Central 2 with an engagement of 10.82 MW at an energy price of US$ 55.00/MWh. |
| 4) | BIOMASS ENERGY: Three contracts for Block 6 of Ingenio Magdalena: a) Energy purchase contract from May 1., 2015 to April 30, 2016, which holds Central 1 with an engagement of 2.922 MW at an energy price of US$ 55.00/MWh, b) Energy purchase contract with a guaranteed curve of 15 years since May 1, 2015 to guarantee 1.642 MW at an average price of US$ 22.29/MWh., and c) Contract of Differences with a load curve where 5.040 MW are engaged at an energy price of US$ 5.50 /MWh. |
| 5) | INDE: Three contracts: a) Contract of power and associated energy for two years since May 1, 2015 with a power engagement of 38.68 MW at a price of US$ 86.41/MWh, b) Contract of power and associated energy for 15 years since May 1, 2015 with a power engagement of 18.750 MW at a price of US$ 81/MWh and c) Contract of power without associated energy of 1.300 MW at a price of US$ 7.00/kW per month for two-year period from May 1, 2015. |
F-419
Table of Contents
DISTRIBUIDORA DE ELECTRICIDAD DE OCCIDENTE, S. A.—DEOCSA
NOTES TO THE FINANCIAL STATEMENTS
AS OF DECEMBER 31, 2015, 2014 AND 2013 AND JANUARY 1, 2013 (RESTATED),
AND FOR THE YEARS ENDED DECEMBER 31, 2015, 2014 AND 2013 (RESTATED)
(Stated in thousands of US Dollars, except otherwise indicated)
| 33. | COMMITMENTS (cont’d) |
| 6) | EÓLICO SAN ANTONIO EL SITIO: Energy contract generated for 15 years from May 1, 2015 with an engagement of 30.00 MW at a price of US$ 132.48/MWh. |
| 7) | RENACE: Two long-term contracts as follows: a) RENACE II FASE 1: Contract of power and associated energy for 15 years since May 1, 2015 with an engagement of 28.35 MW at a price of US$ 44.38/MWh, and b) RENACE I: Contract of power and associated energy for 15 years from May 1, 2015 with an engagement of 6.30 MW at a price of US$ 78.56/MWh |
| 8) | HIDRO XACBAL: Contract of power and associated energy for 15 years from May 1, 2015 with an engagement of 15.00 MW at a price of US$ 99.00/MWh. |
| 9) | HIDROELÉCTRICA EL CÓBANO: Contract of power and associated energy for 15 years from May 1, 2015 with an engagement of 2.090 MW at a price of US$ 95.00/MWh. |
| 10) | INGENIO SANTA ANA: Two Agreements: a) Energy purchase contract depending on coal with an engagement of 20.670 MW at one-year period from May 1, 2015 at an average price of US$ 46/MWh, b) Contract of power without energy associated with a guarantee of 13,174 MW at a price of US$ 7.25/kW per month at one-year period since May 1, 2015. |
| 11) | JAGUAR ENERGY: On May 30, 2008, according to public deed No. 28, the Company entered into with Jaguar Energy a contract of power supply with purchase of electric energy, destined to the users of the distribution service not subject to the social tariff. Based on that contract, Jaguar Energy is obliged to the Company with 110.000 MW. |
On May 16, 2013, such contract suffered an amendment according to public deed No. 34, where the date of the beginning of commercial operations changed to May 1, 2015.
While this date was agreed, Jaguar Energy paid penalties to the Company for each day of delay (1095 days) since the plant operation was not functioning. These penalties were equivalent to the costs incurred by the Company for energy purchase with the most expensive or equivalent technologies, in order to satisfy the demand of the users and rectify the contract commitment.
On the other hand, the Company confirmed the agreement through the resolution of controversies by direct means in order to maintain valid the contract with the coal plant of Jaguar Energy with the purpose of fulfilling the needs of its clients since July 10, 2015 at the term established in the contract (180 months).
Likewise, in case of non-compliance in the supply of electric energy from Jaguar Energy, the Company has pre-operating guarantees equivalent to US$ 22,000 thousand, according to the clauses established for this event.
During 2015 Jaguar Energy began operations and is distributing energy to the Company, as provided under the purchase agreement.
| 12) | OXEC I (GENASA): Power contract and associated energy for 15 years from November 1, 2015 with an engagement of 6.00 MW at a price of US$ 87.81/MWh. |
F-420
Table of Contents
DISTRIBUIDORA DE ELECTRICIDAD DE OCCIDENTE, S. A.—DEOCSA
NOTES TO THE FINANCIAL STATEMENTS
AS OF DECEMBER 31, 2015, 2014 AND 2013 AND JANUARY 1, 2013 (RESTATED),
AND FOR THE YEARS ENDED DECEMBER 31, 2015, 2014 AND 2013 (RESTATED)
(Stated in thousands of US Dollars, except otherwise indicated)
| 33. | COMMITMENTS (cont’d) |
| 13) | GENOSA: Energy purchase Contract for 15 years as of May 1, 2015 with an engagement of 6.30 MW at an average price of US$ 107.62/MWh. |
Agreements signed with effects in future years:
| 14) | ENERGÍA DEL CARIBE: Energy purchase contract for 15 years from May 1, 2016 with a power engagement of 37.80 MW at an average price of 50.22 US$/MWh |
| 15) | SAN MATEO: Power contract and associated energy for 15 years from May 1, 2016 with an engagement of 5.83 MW at a price of US$ 81.75/MWh. |
| 16) | ELGUA: Power contract and associated energy for 15 years from May 1, 2017 with an engagement of 13.23 MW at a price of US$ 42.99/MWh. |
| 17) | INDE: Long-term power and associated energy contract for 15 years from May 1, 2017 with an engagement of 10.37 MW at a price of US$ 81.95/MWh. |
| 18) | RENACE: Two Agreements: a) a) RENACE II STAGE 2: Power contract and associated energy for 12 years from May 1, 2018 with a commitment of 12.60 MW at a price of US$ 54.34/MWh. b) RENACE IV: Power contract and associated energy for 15 years from May 1, 2018 with an engagement of 5.53 MW at a price of US$ 71.36/MWh. |
| 19) | OPERATIVE ADMINISTRATION: Energy purchase contract for 15 years from May 1, 2018 with an engagement of 6.53 MW at a price of US$ 68.15/MWh. |
Purchase of Materials
During the normal course of the operations, the Company issues materials purchase orders. The Company’s policy is to recognize liabilities in favor of the suppliers at reception of material. The amount of purchase commitments is determined based on the purchase orders issued. At December 31, 2015, 2014 and 2013 there are purchase commitments amounting up to US$ 8,145, US$ 4,136 and US$ 6,862, respectively, and the same are irrevocable.
Leasing
| a. | The Company keeps property leasing contracts on a renewal basis at its commercial premises. The future projections of minimum payments for those extended operating leasing contracts are as follows: |
2015 | 2014 | 2013 | ||||||||||
Within a year | US$ | 564 | US$ | 555 | US$ | 474 | ||||||
|
|
|
|
|
| |||||||
From year 2 to year 5 | US$ | 3,991 | US$ | 3,919 | US$ | 2,304 | ||||||
|
|
|
|
|
| |||||||
F-421
Table of Contents
DISTRIBUIDORA DE ELECTRICIDAD DE OCCIDENTE, S. A.—DEOCSA
NOTES TO THE FINANCIAL STATEMENTS
AS OF DECEMBER 31, 2015, 2014 AND 2013 AND JANUARY 1, 2013 (RESTATED),
AND FOR THE YEARS ENDED DECEMBER 31, 2015, 2014 AND 2013 (RESTATED)
(Stated in thousands of US Dollars, except otherwise indicated)
| 33. | COMMITMENTS (cont’d) |
| b. | The Company keeps a vehicle leasing contract for 34 months, not extendable, since February 2015. The future projections of minimum payments for those extended operating leasing contracts are as follows: |
2015 | 2014 | 2013 | ||||||||||
Within a year | US$ | 164 | US$ | — | US$ | — | ||||||
|
|
|
|
|
| |||||||
From year 2 to year 5 | US$ | 17 | US$ | — | US$ | — | ||||||
|
|
|
|
|
| |||||||
Services of Operation and Maintenance
The future projections of the minimum payments for those non-rescindable service contracts of operation and maintenance are shown as follows:
2015 | 2014 | 2013 | ||||||||||
Within a year | US$ | 10,148 | US$ | 15,527 | US$ | 12,749 | ||||||
|
|
|
|
|
| |||||||
From year 2 to year 5 | US$ | 17 | US$ | 1,515 | US$ | 545 | ||||||
|
|
|
|
|
| |||||||
| 34. | FINANCIAL INSTRUMENTS |
The Company manages its capital structure to ensure the continuity as going concern, while it maximizes the return to its shareholders through the optimization of the debt and equity balances. The Company’s overall strategy remains unchanged from 2013.
The working capital structure of the Company is constituted by indebtedness as a financial cost (loans), offset by cash and cash equivalents and restricted cash, and equity comprising issued capital, reserves, retained earnings as detailed in note 23, attributed to the shareholders.
Net Debt Ratio
The financial management of the Company reviews the capital structure over an annual basis. As part of this review, it considers the capital cost and the risk associated to each type of capital.
As of December 31, the net debt ratio is composed as follows:
2015 | 2014 | 2013 | ||||||||||
Debt (loans) | US$ | 171,884 | US$ | 158,865 | US$ | 188,559 | ||||||
Cash and cash equivalents | (5,203 | ) | (5,622 | ) | (19,816 | ) | ||||||
Restricted cash | (2,875 | ) | (2,399 | ) | (2,379 | ) | ||||||
|
|
|
|
|
| |||||||
Total net debt | US$ | 163,806 | US$ | 150,844 | US$ | 166,363 | ||||||
|
|
|
|
|
| |||||||
Equity | US$ | 100,029 | US$ | 104,703 | US$ | 96,012 | ||||||
|
|
|
|
|
| |||||||
Net debt ratio | 164 | % | 144 | % | 173 | % | ||||||
|
|
|
|
|
| |||||||
F-422
Table of Contents
DISTRIBUIDORA DE ELECTRICIDAD DE OCCIDENTE, S. A.—DEOCSA
NOTES TO THE FINANCIAL STATEMENTS
AS OF DECEMBER 31, 2015, 2014 AND 2013 AND JANUARY 1, 2013 (RESTATED),
AND FOR THE YEARS ENDED DECEMBER 31, 2015, 2014 AND 2013 (RESTATED)
(Stated in thousands of US Dollars, except otherwise indicated)
| 34. | FINANCIAL INSTRUMENTS (cont’d) |
Classification of Financial Instruments
At December 31, the financial assets and liabilities of the Company are made up as follows:
2015 | 2014 | 2013 | ||||||||||
FINANCIAL ASSETS: | ||||||||||||
Measured at amortized cost | ||||||||||||
Trade receivables | US$ | 77,188 | US$ | 77,925 | US$ | 66,908 | ||||||
Other receivables | 7,080 | 3,729 | 4,340 | |||||||||
Accounts receivables from related parties | 131 | 8 | 172 | |||||||||
Cash and cash equivalents | 5,203 | 5,622 | 19,816 | |||||||||
Restricted cash | 2,875 | 2,399 | 2,379 | |||||||||
|
|
|
|
|
| |||||||
| US$ | 92,477 | US$ | 89,683 | US$ | 93,615 | |||||||
|
|
|
|
|
| |||||||
FINANCIAL LIABILITIES: | ||||||||||||
Measured at amortized cost | ||||||||||||
Debt with financial entities | US$ | 171,884 | US$ | 158,865 | US$ | 188,559 | ||||||
Other liabilities | 38,619 | 33,734 | 27,436 | |||||||||
Accounts payables to related parties | 116 | 9,049 | 14 | |||||||||
Trade and other accounts payable | 49,835 | 41,599 | 52,063 | |||||||||
Creditors | 12 | 561 | 1,089 | |||||||||
Measured at fair value | ||||||||||||
Other financial obligations | 364 | 1,014 | 1,318 | |||||||||
|
|
|
|
|
| |||||||
| US$ | 260,830 | US$ | 244,822 | US$ | 270,479 | |||||||
|
|
|
|
|
| |||||||
At the date of the financial statements, there are no significant concentrations of credit risk in relation with these items. The abovementioned value represents the maximum exposure to credit risk for such financial assets and liabilities.
Management of Financial Risk
The Company is exposed continuously to credit, liquidity, and market risks originated by exchange rate, interest rate, and price variations. These risks are managed through specific policies and procedures established by the Company’s financial management.
The financial management monitors constantly those risks through periodic reports that allow evaluating the exposure levels affecting the Company and issues periodic management reports for the consideration of the Company’s general management.
Credit Risk
Credit risk refers to the risk that a counterparty will default on its contractual obligations resulting in financial loss to the Company. Credit risk is managed by the Company. Credit risk arises from cash and
F-423
Table of Contents
DISTRIBUIDORA DE ELECTRICIDAD DE OCCIDENTE, S. A.—DEOCSA
NOTES TO THE FINANCIAL STATEMENTS
AS OF DECEMBER 31, 2015, 2014 AND 2013 AND JANUARY 1, 2013 (RESTATED),
AND FOR THE YEARS ENDED DECEMBER 31, 2015, 2014 AND 2013 (RESTATED)
(Stated in thousands of US Dollars, except otherwise indicated)
| 34. | FINANCIAL INSTRUMENTS (cont’d) |
deposits in banks and financial institutions and trade receivables. Credit risks or third party non-compliance risk are controlled through the implementation of service cut-off controls and service monitoring procedure.
The impact of the credit risk exposure is represented by the balances of the trade receivable, net of any provision for covering possible losses. The Company does not have a significant exposure since the balances of its trade receivable are not concentrated on few clients; at December 31, 2015,2014 and 2013, clients were scattered in 1,005 (thousands) , 977 (thousands) and 958 (thousands) users, respectively, out of which none represents more than 10% of the portfolio.
The credit risk on liquid funds and derivative financial instruments is limited because the counterparties are banks with high credit-ratings assigned by international credit-rating agencies.
Liquidity Risk
The Company practices a careful liquidity risk management and, therefore, keeps cash and other instruments liquid, as well as available funds. However, as to December 31, 2015, the financial statements reflect a negative working capital of US$ 43,765 thousands, thus the Management will be focused on 2016 on two objectives to revert that situation: a) improving the collection ratio for the accounts receivable and b) reducing the energy loss ratio.
To comply with those objectives, the Management has planned to perform the following:
| a) | Follow up the creation of dialogue and negotiation tables with community leaders and municipal authorities to improve collection timing, prevent non-technical losses; |
| b) | Reduce technical and non-technical losses; |
| c) | Improve debt ratio management and obtain longer-term loans; |
The management of the Company considers that the liquidity risk exposure is low since the Company has been generating cash flow from its operating activities, supported on strong profits, has access to loans and financial resources, as explained in Note 24.
At December 31, 2015, 2014 and 2013, the contract maturity of the non-derivative financial liabilities of the Company is as follows:
Average | Less than 1 | More than 1 | Total | Carrying | ||||||||||||||||
2015 | ||||||||||||||||||||
Loan secured with pledged collateral and fiduciary guarantee | 6 | % | US$ | 33,283 | US$ | 179,997 | US$ | 213,280 | US$ | 171,884 | ||||||||||
Trade and other accounts payable | 0 | % | 49,835 | — | 49,835 | 49,835 | ||||||||||||||
Creditors | 0 | % | 12 | — | 12 | 12 | ||||||||||||||
|
|
|
|
|
|
|
| |||||||||||||
| US$ | 83,130 | US$ | 179,997 | US$ | 263,127 | US$ | 221,731 | |||||||||||||
|
|
|
|
|
|
|
| |||||||||||||
F-424
Table of Contents
DISTRIBUIDORA DE ELECTRICIDAD DE OCCIDENTE, S. A.—DEOCSA
NOTES TO THE FINANCIAL STATEMENTS
AS OF DECEMBER 31, 2015, 2014 AND 2013 AND JANUARY 1, 2013 (RESTATED),
AND FOR THE YEARS ENDED DECEMBER 31, 2015, 2014 AND 2013 (RESTATED)
(Stated in thousands of US Dollars, except otherwise indicated)
| 34. | FINANCIAL INSTRUMENTS (cont’d) |
Average | Less than 1 | More than 1 | Total | Carrying | ||||||||||||||||
2014 | ||||||||||||||||||||
Loan secured with pledged collateral and fiduciary guarantee | 6 | % | US$ | 43,013 | US$ | 168,082 | US$ | 211,095 | US$ | 158,865 | ||||||||||
Trade and other accounts payable | 0 | % | 41,599 | — | 41,599 | 41,599 | ||||||||||||||
Creditors | 0 | % | 561 | — | 561 | 561 | ||||||||||||||
|
|
|
|
|
|
|
| |||||||||||||
| US$ | 85,173 | US$ | 168,082 | US$ | 253,255 | US$ | 201,024 | |||||||||||||
|
|
|
|
|
|
|
| |||||||||||||
Average | Less than 1 | More than 1 | Total | Carrying | ||||||||||||||||
2013 | ||||||||||||||||||||
Loan secured with pledged collateral and fiduciary guarantee | 6 | % | US$ | 41,213 | US$ | 208,991 | US$ | 250,204 | US$ | 153,910 | ||||||||||
Trade and other accounts payable | 0 | % | 52,063 | — | 52,063 | 52,063 | ||||||||||||||
Creditors | 0 | % | 1,090 | — | 1,090 | 1,090 | ||||||||||||||
|
|
|
|
|
|
|
| |||||||||||||
| US$ | 94,366 | US$ | 208,991 | US$ | 303,357 | US$ | 207,062 | |||||||||||||
|
|
|
|
|
|
|
| |||||||||||||
Cash Flows:
There is a low exposure as to whether the cash flows associated with the financial assets and liabilities could fluctuate in their amount, except for the risk exposure of cash flows that might derive from the fluctuation of the exchange rate of the dollar with respect to the quetzal, that might require additional cash flows to cancel the loans and accounts payable in foreign currency or that might implicate a reduction in the assets in foreign currency.
Market Risk
Fluctuation on exchange rates and market prices
Exposure to which DEOCSA is exposed from the fluctuation in exchange rates and fuel market prices stays covered through the transfer of additional costs to the electric energy tariff.
Exchange Rate Risk
Monetary assets and liabilities include balances in Dollars of the United States of America, which are subject to the fluctuation risk in the exchange rate of the US dollar with regard to the Quetzal for the transactions performed of the Company. During 2015, 2014 and 2013, there were no significant fluctuations of the US dollar regarding the Quetzal that might be considered significant.
F-425
Table of Contents
DISTRIBUIDORA DE ELECTRICIDAD DE OCCIDENTE, S. A.—DEOCSA
NOTES TO THE FINANCIAL STATEMENTS
AS OF DECEMBER 31, 2015, 2014 AND 2013 AND JANUARY 1, 2013 (RESTATED),
AND FOR THE YEARS ENDED DECEMBER 31, 2015, 2014 AND 2013 (RESTATED)
(Stated in thousands of US Dollars, except otherwise indicated)
| 34. | FINANCIAL INSTRUMENTS (cont’d) |
Percentage Rate Devaluation of the Quetzal in Relation with the US Dollar
Currency | 2015 | 2014 | 2013 | |||||||||
Quetzals | (1 | )% | (3 | )% | (1 | )% | ||||||
The Company does not have the practice of acquiring derivative financials to protect itself from loss risks to which it is exposed because of the fluctuations in the exchange rate of the currency in which its transactions are carried out abroad.
As of December 31, 2015, 2014 and 2013 the amount of assets and liabilities in foreign currency that might be exposed to exchange rate fluctuations is as follows:
In thousands | ||||
2015 | ||||
Assets: | ||||
Local banks in foreign currency | 738 | |||
Restricted cash | 2,110 | |||
|
| |||
| 2,848 | ||||
Liabilities: | ||||
Debt with financial entities | (124,441 | ) | ||
Trade account payables | (12,086 | ) | ||
Advances to foreign suppliers | 613 | |||
|
| |||
| (135,914 | ) | |||
|
| |||
Net liability position of foreign currency | (133,066 | ) | ||
|
| |||
2014 | ||||
Asset: | ||||
Local Banks in foreign currency | 3,334 | |||
Restricted cash | 1,758 | |||
|
| |||
| 5,092 | ||||
Liability: | ||||
Debt with financial entities | (118,817 | ) | ||
Trade account payables | (4,841 | ) | ||
Advances to foreign suppliers | 4,946 | |||
|
| |||
| (118,712 | ) | |||
|
| |||
Net liability position of foreign currency | (113,620 | ) | ||
|
| |||
F-426
Table of Contents
DISTRIBUIDORA DE ELECTRICIDAD DE OCCIDENTE, S. A.—DEOCSA
NOTES TO THE FINANCIAL STATEMENTS
AS OF DECEMBER 31, 2015, 2014 AND 2013 AND JANUARY 1, 2013 (RESTATED),
AND FOR THE YEARS ENDED DECEMBER 31, 2015, 2014 AND 2013 (RESTATED)
(Stated in thousands of US Dollars, except otherwise indicated)
| 34. | FINANCIAL INSTRUMENTS (cont’d) |
In thousands | ||||
2013 | ||||
Asset: | ||||
Local Banks in foreign currency | 13,374 | |||
Restricted cash | 1,758 | |||
|
| |||
| 15,132 | ||||
Liability: | ||||
Debt with financial entities | (143,798 | ) | ||
Trade account payables | (3,241 | ) | ||
|
| |||
| (147,039 | ) | |||
|
| |||
Net liability position of foreign currency | (131,907 | ) | ||
|
| |||
Sensitivity Analysis
A strengthening or weakening at the rate of 2% of the dollar exchange rate against the Quetzal would have increased (decreased) the profit or loss for the year and the shareholders’ equity by the amounts shown below. This analysis assumes that all other variables, in particular interest rates, remain constant. The analysis is performed on the same basis for 2014 and 2013.
As at December 31 | ||||||||||||||||
Profit or loss | Shareholders’ Equity | |||||||||||||||
2% increase | 2% decrease | 2% increase | 2% decrease | |||||||||||||
US$ thousands | ||||||||||||||||
As at December 31, 2015 | 2,661 | (2,661 | ) | 4,346 | (4,523 | ) | ||||||||||
As at December 31, 2014 | 2,272 | (2,272 | ) | 4,282 | (4,459 | ) | ||||||||||
As at December 31, 2013 | 2,638 | (2,638 | ) | 4,702 | (4,391 | ) | ||||||||||
Interest Rates Risk
The interest rate risk is managed by the Company’s management through a hedging instrument to fix it, specifically in credits negotiated in dollars at a LIBOR rate up to three months in dollars. The Company’s exposures to interest rates on financial liabilities are detailed in the liquidity risk management section of this note. The risk is managed by the Company by the use of interest rate swap contracts and forward interest rate contracts. Hedging activities are evaluated regularly to align with interest rate views and defined risk appetite, ensuring the most cost-effective hedging strategies are applied.
Cash flow sensitivity analysis for variable rate instruments
The sensitivity analyses below have been determined based on the exposure to interest rates for both derivatives and non-derivative instruments at the end of the reporting period. For floating rate liabilities, the analysis is prepared assuming the amount of the liability outstanding at the end of the reporting
F-427
Table of Contents
DISTRIBUIDORA DE ELECTRICIDAD DE OCCIDENTE, S. A.—DEOCSA
NOTES TO THE FINANCIAL STATEMENTS
AS OF DECEMBER 31, 2015, 2014 AND 2013 AND JANUARY 1, 2013 (RESTATED),
AND FOR THE YEARS ENDED DECEMBER 31, 2015, 2014 AND 2013 (RESTATED)
(Stated in thousands of US Dollars, except otherwise indicated)
| 34. | FINANCIAL INSTRUMENTS (cont’d) |
period was outstanding for the whole year. A 50 basis point increase or decrease is used when reporting interest rate risk internally to key management personnel and represents management’s assessment of the reasonably possible change in interest rates.
This analysis assumes that all other variables, in particular foreign currency rates, remain constant. The analysis is performed on the same basis for 2014 and 2013.
As at December 31, 2015 | ||||||||
Impact on income or loss | ||||||||
0.5% decrease | 0.5% increase | |||||||
in interest rates | in interest rates | |||||||
US$ thousands | ||||||||
Non-derivative instruments | US$ | (234 | ) | US$ | 234 | |||
|
|
|
| |||||
As at December 31, 2014 | ||||||||
Impact on income or loss | ||||||||
0.5% decrease | 0.5% increase | |||||||
in interest rate | in interest rate | |||||||
US$ thousands | ||||||||
Non-derivative instruments | US$ | (219 | ) | US$ | 219 | |||
|
|
|
| |||||
As at December 31, 2013 | ||||||||
Impact on income or loss | ||||||||
0.5% decrease | 0.5% increase | |||||||
in interest rate | in interest rate | |||||||
US$ thousands | ||||||||
Non-derivative instruments | US$ | (248 | ) | US$ | 248 | |||
|
|
|
| |||||
Interest Rate Swap Contracts
Under interest rate swap contracts, the Company agrees to exchange the difference between fixed and floating rate interest amounts calculated on agreed notional principal amounts. Such contracts enable the Company to mitigate the cash flow exposures on the issued variable rate debt. The fair value of interest rate swaps at the end of the reporting period is determined by discounting the future cash flows using the curves at the end of the reporting period and the credit risk inherent in the contract, and is disclosed below. The average interest rate is based on the outstanding balances at the end of the reporting period.
F-428
Table of Contents
DISTRIBUIDORA DE ELECTRICIDAD DE OCCIDENTE, S. A.—DEOCSA
NOTES TO THE FINANCIAL STATEMENTS
AS OF DECEMBER 31, 2015, 2014 AND 2013 AND JANUARY 1, 2013 (RESTATED),
AND FOR THE YEARS ENDED DECEMBER 31, 2015, 2014 AND 2013 (RESTATED)
(Stated in thousands of US Dollars, except otherwise indicated)
| 34. | FINANCIAL INSTRUMENTS (cont’d) |
The following tables detail the amount of notional capital over which the swap is established, as well as the remaining terms of the hedging contracts of the pending interest rates at the end of the reporting period.
Contracts at variable receive rate and | Fixed Average Interest Rate | Notional Value of Capital | Assets (Liabilities) at Fair Value | |||||||||||||||||||||||||||||||||
31/12/15 | 31/12/14 | 31/12/13 | 31/12/15 | 31/12/14 | 31/12/13 | 31/12/15 | 31/12/14 | 31/12/13 | ||||||||||||||||||||||||||||
% | % | % | US$ | US$ | US$ | US$ | US$ | US$ | ||||||||||||||||||||||||||||
1 year | 5.95 | 5.95 | 5.95 | 3,834 | 15,189 | 15,202 | (364 | ) | (714 | ) | (953 | ) | ||||||||||||||||||||||||
2 year | 5.95 | 5.95 | 5.95 | — | 3,797 | 19,003 | — | (300 | ) | (364 | ) | |||||||||||||||||||||||||
Over 2 years | 5.95 | 5.95 | 5.95 | — | — | 79,812 | — | — | — | |||||||||||||||||||||||||||
|
|
|
|
|
|
|
|
|
|
|
| |||||||||||||||||||||||||
| 3,834 | 18,986 | 114,017 | (364) | (1,014) | (1,317) | |||||||||||||||||||||||||||||||
|
|
|
|
|
|
|
|
|
|
|
| |||||||||||||||||||||||||
Interest rate hedging is settle on a quarterly basis. The variable rate over the hedging interest rate is the LIBOR rate in dollars for a three-month period. The Company will pay such difference between the floating interest rate and the fixed rate over a net basis.
All the interest rate swap contracts exchanging variable interest rate for fixed interest rate are designated as cash flow hedge with the purpose of reducing the Company’s cash flow exposure that results from variable interest rates over loans. Interest rate swaps and interest payments over the loan occur simultaneously and the accumulated amount in equity is reclassified to the profit or loss over the period in which the variable interest rate payments on the debt affect profit or loss.
Fair Value of Financial Instruments
This note provides information about how the Company determines fair values of financial assets and financial liabilities.
Fair value of the Company’s financial assets and financial liabilities that are measured at fair value on a recurring basis
Some of the Company’s financial assets and financial liabilities are measured at fair value at the end of each reporting period.
F-429
Table of Contents
DISTRIBUIDORA DE ELECTRICIDAD DE OCCIDENTE, S. A.—DEOCSA
NOTES TO THE FINANCIAL STATEMENTS
AS OF DECEMBER 31, 2015, 2014 AND 2013 AND JANUARY 1, 2013 (RESTATED),
AND FOR THE YEARS ENDED DECEMBER 31, 2015, 2014 AND 2013 (RESTATED)
(Stated in thousands of US Dollars, except otherwise indicated)
| 34. | FINANCIAL INSTRUMENTS (cont’d) |
The following table shows the valuation techniques used in measuring Level 2 fair values as at December 31, 2015, 2014 and 2013, as well as the significant unobservable inputs used.
Type | Fair value as at | Valuation technique | Significant | Inter- | ||||||||
12/31/15 | 12/31/14 | 12/31/13 | ||||||||||
Interest rate Swaps | Assets: (Liabilities)
(364) | Assets: (Liabilities)
(1,014) | Assets: (Liabilities)
(1,317) | The methodology used to determine the fair value of the swap is a standard valuation technique of discounted expected cash flows estimated with a forward rate curve. | Not applicable | Not applicable | ||||||
There were no transfers between Level 1 and 2 in each of the three years presented.
Fair value of financial assets and financial liabilities that are not measured at fair value (but fair value disclosures are required)
The Company’s management considers that the carrying amount of the long term debt with financial entities approximate their fair value, since the debt is agreed at variable market interest rates which are reviewed periodically. Also, Company’s management considers that the carrying amount of the other financial assets and financial liabilities measured at amortized cost, approximate their fair value due to their short-term maturity or because they are agreed at interest rates similar to market interest rate.
| 35. | SUBSEQUENT EVENTS |
The Company has evaluated subsequent events as at December 31, 2015 to assess the need for potential recognition or disclosure in these financial statements. Such events were assessed until September 10, 2016, the date these financial statements were available to be issued. Based on this evaluation, it was determined that there were no subsequent events requiring recognition or disclosure in the financial statements except for the following matters:
| • | On January 22, 2016, I.C. Power Ltd through IC Power Distribution Holding Pte. Limited, a wholly-owned subsidiary of Kenon Holdings Ltd (“Kenon”), acquired 100% of the shares of DEOCSA BV, owner of 90.62% of the Company’s capital stock. As a result, I.C. Power Ltd. took the effective control to manage the financial and operating policies of the Company. |
| • | On March 17, 2016, as part of the reorganization process carried out by Kenon in order to list I.C. Power Pte. Ltd. in the US stock exchange, Kenon transferred all of the shares of I.C. Power Ltd. to I.C. Power Pte. Ltd. (“ICPS”), a wholly owned subsidiary of Kenon incorporated in Singapore. |
F-430
Table of Contents
DISTRIBUIDORA DE ELECTRICIDAD DE OCCIDENTE, S. A.—DEOCSA
NOTES TO THE FINANCIAL STATEMENTS
AS OF DECEMBER 31, 2015, 2014 AND 2013 AND JANUARY 1, 2013 (RESTATED),
AND FOR THE YEARS ENDED DECEMBER 31, 2015, 2014 AND 2013 (RESTATED)
(Stated in thousands of US Dollars, except otherwise indicated)
| 35. | SUBSEQUENT EVENTS (cont’d) |
| • | On January 22, 2016 the contract held with Arthasan, S.A. was cancelled. Such entity rendered management, administration and supervision services for the businesses of the Company. Since January 23, 2016, the abovementioned activities were carried out directly by the Company. |
| • | On January 29, 2016 CNEE published the resolutions CNEE-35-2016 and CNEE-36-2016 which approved the new non-social and social tariffs, respectively. Under such resolutions, the electricity adjustment surcharge (see note 1.a) was determined by the CNEE in order to be considered as tariff adjustments for the quarter period from February 1 to April 30, 2016 of the non-social and social tariffs the amounts of US$ 7,135 and US$ 5,373, respectively, likewise, the CNEE also indicated that the remaining accumulated surcharge from prior periods for non-social and social users, in the amounts of US$. 3,044 and US$. 2,281 respectively, will be considered as tariff adjustments for the following quarter, including an annual simple interest rate of 7% on such amounts. |
| • | On April 25, 2016 CNEE published the resolutions CNEE-100-2016 and CNEE-36-2016 which approved the new non-social and social tariffs, respectively. Under such resolutions, the electricity adjustment surcharge (see note 1.a) was determined by the CNEE in order to be considered as tariff adjustments for the quarter period from May 1 to July 31, 2016 of the non-social and social tariffs the amounts of US$ 2,028 and US$ 4,917, respectively, likewise, the CNEE also indicated that the remaining accumulated surcharge from prior periods for non-social and social users, in the amounts of US$. 5,689 and US$. 3,889 respectively, will be considered as tariff adjustments for the following quarter, including an annual simple interest rate of 7% on such amounts. |
| • | On July 26, 2016 CNEE published the resolutions CNEE-201-2016 and CNEE-202-2016 which approved the new non-social and social tariffs, respectively. Under such resolutions, the electricity adjustment surcharge (see note 1.a) was determined by the CNEE in order to be considered as tariff adjustments for the quarter period from August 1 to October 31, 2016 of the non-social and social tariffs the amounts of US$ 1,759 and US$ 4,111, respectively, likewise, the CNEE also indicated that the remaining accumulated surcharge from prior periods for non-social and social users, in the amounts of US$ 7,755 and US$. 6,441 respectively, will be considered as tariff adjustments for the following quarter, including an annual simple interest rate of 7% on such amounts |
| • | At the Ordinary General Shareholders’ Meeting held on April 6, 2016 a distribution of dividends to the company’s shareholders was approved in deed no. CA-4-2016. The dividends declared to their distribution to the shareholders were in the amount of US$ 12,504 (Q. 95,434), which represents US$ 0.01 (Q. 0.07) per share, and their payment was made on April 30, 2016. |
| • | On July 26, 2016, DEOCSA become aware of a legal proceeding initiated by the Guatemalan Tax Administration (“SAT”) for payment of purported back income taxes for approximately US$ 10,787 (Q. 81,978) for the years 2011 and 2012. Such amount is subject to interest charges and penalties. The SAT alleges that the deduction by the Company of the interest expenses and amortization of goodwill from the taxable income were improper. The transaction dates back to 2011, when the Company’s prior controlling shareholder (ASCOED S. A.) acquired the shares of |
F-431
Table of Contents
DISTRIBUIDORA DE ELECTRICIDAD DE OCCIDENTE, S. A.—DEOCSA
NOTES TO THE FINANCIAL STATEMENTS
AS OF DECEMBER 31, 2015, 2014 AND 2013 AND JANUARY 1, 2013 (RESTATED),
AND FOR THE YEARS ENDED DECEMBER 31, 2015, 2014 AND 2013 (RESTATED)
(Stated in thousands of US Dollars, except otherwise indicated)
| 35. | SUBSEQUENT EVENTS (cont’d) |
DEOCSA and was subsequently merged with the Company in 2011. The SAT may further seek purported back taxes for the years 2013, 2014 and 2015. The Company estimates that such back taxes of approximately US$ 17,184 (Q. 130,596). |
At a hearing on August 9, 2016, the Company reached an understanding with the tax authorities where it will conditionally pay within the next 60 days the 2011 and 2012 principal, interest and penalties claimed by the SAT. In order to release the bank accounts’ seizure imposed by the tribunal, to reduce any resulting penalties by the SAT, and to prevent further legal actions from the SAT for the purported back taxes for the years 2013, 2014 and 2015, the Company paid on August 9, 2016 US$ 11,346 (Q. 86,230) including taxes, penalties and interests for the years 2014 and 2015, on August 10, 2016 US$ 10,787 (Q. 81,978) related to taxes for years 2011 and 2012 and on August 19, 2016 US$ 8,267 (Q. 62,831) including taxes, penalties and interests for the year 2013. An approximately payment of US$ 14,372 (Q. 109,227) subject to recalculation as of the date of payment, related to penalties and interests for year 2011 and 2012 will be made during 60 days beginning August 10, 2016. Furthermore, the Company has notified the SAT that is making all such payments reserving all legal rights to seek restitution of such payments by contesting legally the merits of the SAT claim. DEOCSA’s management and its legal advisors consider that the Company has all legal rights and hence, that it will initiate the necessary legal procedures to pursue the collection of the amounts paid in connection with such claim.
Since the inception of the transactions in 2011 and up to date, the opinion of DEOCSA’s management and its legal and tax advisors is that the transactions that generated the interest expenses and the amortization of goodwill deductions are legitimate tax deductions. This position was confirmed in February 2015 by a binding ruling issued by the SAT. Hence, DEOCSA’s management considers, based on the opinion of its tax and legal advisors, there is a probability greater than 50% in the recoverability of these payments as a result of the final outcome of this claim and of the other recourses to be initiated by the Company. These payments will be treated as an income tax payments in excess and presented in the third quarter financial statements as account receivable.
| • | On August 2016, the Company signed an addendum to the existing long term syndicated loan. Such addendum renewed Tranche H of the long term syndicated loan in the amount of US$ 16,800 and Q. 55,800, at an US Libor rate for three months plus a spread of 4.75%, with a floor interest rate of 6% for the dollar portion and Active Weighted Average rate less 6.10% for the portion in Quetzales. The term of the Tranche is up to February, 2025, with a grace period until May 2018 and equal quarterly principal payments thereafter. |
| 36. | APPROVAL OF THE FINANCIAL STATEMENTS |
These financial statements prepared in U.S. dollars as presentation currency, were approved by the Company’s Management Committee on September 10, 2016.
* * * * * *
F-432
Table of Contents
Comercializadora Guatemalteca
Mayorista De Electricidad, S. A.—GUATEMEL
Restated Financial Statements as of December 31,
2015, 2014 and 2013, and for the years ended
December 31, 2015, 2014 and 2013 together with the
Independent Auditors’ Report
Table of Contents
COMERCIALIZADORA GUATEMALTECA MAYORISTA DE ELECTRICIDAD, S. A.—GUATEMEL
CONTENT
| ||||
| Page | ||||
| F-435 | ||||
RESTATED FINANCIAL STATEMENTS AS OF DECEMBER 31, 2015, 2014 AND 2013, AND FOR THE YEARS ENDED DECEMBER 31, 2015, 2014 AND 2013 | ||||
| F-437 | ||||
| F-438 | ||||
| F-440 | ||||
| F-441 | ||||
| F-443 | ||||
Table of Contents
| Deloitte Guatemala, S.A. Europlaza World Business Center 5a. Avenida 5-55, Zona 14 Torre IV, Nivel 8 01014 Guatemala
Tel: (502) 2384 6500 Fax: (502) 2384 6555 www.deloitte.com/gt |
To the Management Committee and the Shareholders of
Comercializadora Guatemalteca Mayorista de Electricidad, S. A.
We have audited the accompanying financial statements of Comercializadora Guatemalteca Mayorista de Electricidad, S. A. (the “Company”), which comprise the restated statements of financial position as of December 31, 2015, 2014 and 2013, and the related restated statements of profit or loss and other comprehensive income, changes in shareholders’ equity and cash flows for the years then ended, and the related notes to the financial statements.
Management’s Responsibility for the Financial Statements
Management is responsible for the preparation and fair presentation of these financial statements in accordance with International Financial Reporting Standards as issued by the International Accounting Standards Board; this includes the design, implementation, and maintenance of internal control relevant to the preparation and fair presentation of financial statements that are free from material misstatement, whether due to fraud or error.
Auditors’ Responsibility
Our responsibility is to express an opinion on these financial statements based on our audits. We conducted our audits in accordance with auditing standards generally accepted in the United States of America. Those standards require that we plan and perform the audit to obtain reasonable assurance about whether the financial statements are free from material misstatement.
An audit involves performing procedures to obtain audit evidence about the amounts and disclosures in the financial statements. The procedures selected depend on the auditor’s judgment, including the assessment of the risks of material misstatement of the financial statements, whether due to fraud or error. In making those risk assessments, the auditor considers internal control relevant to the Company’s preparation and fair presentation of the financial statements in order to design audit procedures that are appropriate in the circumstances, but not for the purpose of expressing an opinion on the effectiveness of the Company’s internal control. Accordingly, we express no such opinion. An audit also includes evaluating the appropriateness of accounting policies used and the reasonableness of significant accounting estimates made by management, as well as evaluating the overall presentation of the financial statements.
We believe that the audit evidence we have obtained is sufficient and appropriate to provide a basis for our audit opinion.
Opinion
In our opinion, the financial statements referred to above present fairly, in all material respects, the financial position of Comercializadora Guatemalteca Mayorista de Electricidad, S. A. as of December 31, 2015, 2014 and 2013, and the results of its operations and its cash flows for the years then ended, in accordance with International Financial Reporting Standards as issued by the International Accounting Standards Board.
Table of Contents
Emphasis of matter
As discussed in Note l.b, the financial statements as of and for the years ended December 31, 2015, 2014 and 2013 have been restated for the correction of errors. In addition, the Company also expanded certain disclosures from those previously presented. Our opinion is not modified with respect to these matters.
Guatemala, C.A.,
September 10, 2016
Deloitte Guatemala, S. A.
/s/ Sergio Patzán
Sergio Patzán
Partner
Chartered Accountant CPA-2200
F-436
Table of Contents
COMERCIALIZADORA GUATEMALTECA MAYORISTA DE ELECTRICIDAD, S. A.—GUATEMEL
STATEMENTS OF PROFIT OR LOSS AND OTHER COMPREHENSIVE INCOME
FOR THE YEARS ENDED DECEMBER 31, 2015, 2014 AND 2013
(Stated in US dollars, except otherwise indicated)
Notes | 2015 (Restated) (Note 1b) | 2014 (Restated) (Note 1b) | 2013 (Restated) (Note 1b) | |||||||||||||
Energy sales | US$ | 7,950,034 | US$ | 14,737,716 | US$ | 20,652,797 | ||||||||||
Energy purchases | 5 | (7,445,008 | ) | (12,883,582 | ) | (18,259,604 | ) | |||||||||
Other costs of sales | 6 | (51,685 | ) | (198,527 | ) | (72,836 | ) | |||||||||
|
|
|
|
|
| |||||||||||
Gross profit | 453,341 | 1,655,607 | 2,320,357 | |||||||||||||
General, selling and administrative expenses | 9 | (435,200 | ) | (2,054,648 | ) | (2,528,983 | ) | |||||||||
Financial income | 8 | 43,912 | 46,954 | 60,065 | ||||||||||||
Financial expenses | (25,950 | ) | (48,128 | ) | (112,516 | ) | ||||||||||
Other income | 7 | 381,613 | 10,008 | 38,239 | ||||||||||||
|
|
|
|
|
| |||||||||||
Income (Loss) before income tax | 417,716 | (390,207 | ) | (222,838 | ) | |||||||||||
|
|
|
|
|
| |||||||||||
Income tax | 10 | (80,517 | ) | (16,348 | ) | (551,240 | ) | |||||||||
NET PROFIT (LOSS) FOR THE YEAR | 337,199 | (406,555 | ) | (774,078 | ) | |||||||||||
OTHER COMPREHENSIVE INCOME (LOSS) | ||||||||||||||||
Items that will not be reclassified subsequently to profit or loss: Translation differences | (22,365 | ) | 151,234 | 49,530 | ||||||||||||
|
|
|
|
|
| |||||||||||
TOTAL COMPREHENSIVE INCOME (LOSS) FOR THE YEAR | US$ | 314,834 | US$ | (255,321 | ) | US$ | (724,548 | ) | ||||||||
|
|
|
|
|
| |||||||||||
The accompanying notes are part of these financial statements.
F-437
Table of Contents
COMERCIALIZADORA GUATEMALTECA MAYORISTA DE
ELECTRICIDAD, S. A.—GUATEMEL
STATEMENTS OF FINANCIAL POSITION
AS OF DECEMBER 31, 2015, 2014 AND 2013
(Stated in US dollars, except otherwise indicated)
Notes | 31/12/2015 (Note 1b) | 31/12/2014 (Note 1b) | 31/12/2013 (Note 1b) | |||||||||||||
NON-CURRENT ASSETS: | ||||||||||||||||
Property, plant and equipment | 16 | US$ | 404,808 | US$ | 461,558 | US$ | 13,152 | |||||||||
Non-current tax assets | 14 | 1,842,197 | 1,877,889 | 1,714,547 | ||||||||||||
Accounts receivable from related parties | 13 | 1,144,387 | — | — | ||||||||||||
|
|
|
|
|
| |||||||||||
Total non-current assets | 3,391,392 | 2,339,447 | 1,727,699 | |||||||||||||
|
|
|
|
|
| |||||||||||
CURRENT ASSETS: | ||||||||||||||||
Other assets | 75,391 | 118,575 | 2,455 | |||||||||||||
Trade receivables | 12 | 633,087 | 1,083,985 | 1,745,373 | ||||||||||||
Accounts receivables from related parties | 13 | 124,099 | 1,744,167 | 1,453,828 | ||||||||||||
Current tax assets | 14 | 58,147 | 58,420 | 4,144 | ||||||||||||
Other receivables | 15 | 209,302 | — | — | ||||||||||||
Cash and cash equivalents | 11 | 1,248,762 | 1,066,811 | 1,984,335 | ||||||||||||
|
|
|
|
|
| |||||||||||
Total current assets | 2,348,788 | 4,071,958 | 5,190,135 | |||||||||||||
|
|
|
|
|
| |||||||||||
Total assets | US$ | 5,740,180 | US$ | 6,411,405 | US$ | 6,917,834 | ||||||||||
|
|
|
|
|
| |||||||||||
F-438
Table of Contents
COMERCIALIZADORA GUATEMALTECA MAYORISTA DE
ELECTRICIDAD, S. A.—GUATEMEL
STATEMENTS OF FINANCIAL POSITION (cont’d)
AS OF DECEMBER 31, 2015, 2014 AND 2013
(Stated in US dollars, except otherwise indicated)
Notes | 31/12/2015 (Note 1b) | 31/12/2014 (Note 1b) | 31/12/2013 (Note 1b) | |||||||||||||
SHAREHOLDERS’ EQUITY AND LIABILITIES: | ||||||||||||||||
SHAREHOLDERS’ EQUITY: | ||||||||||||||||
Capital stock | 20 | US$ | 31,345 | US$ | 31,345 | US$ | 31,345 | |||||||||
Legal reserve | 21 | 352,180 | 352,180 | 352,180 | ||||||||||||
Accumulated other comprehensive income (loss)—Translation differences | 125,811 | 148,176 | (3,058 | ) | ||||||||||||
Retained earnings | 3,953,408 | 4,139,261 | 4,545,816 | |||||||||||||
|
|
|
|
|
| |||||||||||
Total stockholders’ equity | 4,462,744 | 4,670,962 | 4,926,283 | |||||||||||||
|
|
|
|
|
| |||||||||||
NON-CURRENT: | ||||||||||||||||
Finance lease payable | 17 | 127,738 | 280,007 | — | ||||||||||||
Other liabilities | 34,434 | 75,481 | — | |||||||||||||
Provisions | 2,423 | 5,197 | 5,034 | |||||||||||||
|
|
|
|
|
| |||||||||||
Total non-current liabilities | 164,595 | 360,685 | 5,034 | |||||||||||||
|
|
|
|
|
| |||||||||||
CURRENT LIABILITIES: | ||||||||||||||||
Short term finance lease payable | 17 | 139,350 | 128,336 | — | ||||||||||||
Other liabilities | 37,564 | 34,596 | — | |||||||||||||
Trade and other accounts payable | 18 | 754,662 | 1,051,488 | 1,658,078 | ||||||||||||
Deposits received from customers | 19 | 84,033 | 81,717 | 102,311 | ||||||||||||
Current tax liabilities | 14 | 54,088 | 25,223 | 195,688 | ||||||||||||
Creditors for services received | 13,035 | 13,096 | 12,612 | |||||||||||||
Accounts payable to related parties | 13 | 7,553 | 7,589 | — | ||||||||||||
Other payable | 2,416 | 6,670 | 755 | |||||||||||||
Labor related payables | 20,140 | 31,043 | 17,073 | |||||||||||||
|
|
|
|
|
| |||||||||||
Total current liabilities | 1,112,841 | 1,379,758 | 1,986,517 | |||||||||||||
|
|
|
|
|
| |||||||||||
Total liabilities | 1,277,436 | 1,740,443 | 1,991,551 | |||||||||||||
|
|
|
|
|
| |||||||||||
Total liabilities and shareholders’ equity | US$ | 5,740,180 | US$ | 6,411,405 | US$ | 6,917,834 | ||||||||||
|
|
|
|
|
| |||||||||||
| The accompanying notes are part of these financial statements. |
F-439
Table of Contents
COMERCIALIZADORA GUATEMALTECA MAYORISTA DE
ELECTRICIDAD, S. A.—GUATEMEL
STATEMENTS OF CHANGES IN SHAREHOLDERS’ EQUITY
FOR THE YEARS ENDED DECEMBER 31, 2015, 2014 AND 2013
(Stated in US dollars, unless otherwise indicated)
Capital | Legal Reserve | Accumulated | Retained | Total | ||||||||||||||||
Balances as of January 1, 2013 | US$ | 31,345 | US$ | 352,180 | US$ | (52,588 | ) | US$ | 6,643,298 | US$ | 6,974,235 | |||||||||
Other comprehensive income - Translation differences | — | — | 49,530 | — | 49,530 | |||||||||||||||
Net loss for the year, as restated | — | — | — | (774,078 | ) | (774,078 | ) | |||||||||||||
Equity transaction with related party, as restated (Note 1.b and Note 13.a) | (1,323,404 | ) | (1,323,404 | ) | ||||||||||||||||
|
|
|
|
|
|
|
|
|
| |||||||||||
Balances as of December 31, 2013 | US$ | 31,345 | US$ | 352,180 | US$ | (3,058 | ) | US$ | 4,545,816 | US$ | 4,926,283 | |||||||||
Other comprehensive income - Translation differences | — | — | 151,234 | — | 151,234 | |||||||||||||||
Net loss for the year | — | — | — | (406,555 | ) | (406,555 | ) | |||||||||||||
|
|
|
|
|
|
|
|
|
| |||||||||||
Balances as of December 31, 2014 | 31,345 | 352,180 | 148,176 | 4,139,261 | 4,670,962 | |||||||||||||||
Other comprehensive loss - Translation differences | — | — | (22,365 | ) | — | (22,365 | ) | |||||||||||||
Net profit for the year, as restated (Note 1.b) | — | — | — | 337,199 | 337,199 | |||||||||||||||
Equity transaction with related party, as restated (Note 1.b and Note 13.a) | (523,052 | ) | (523,052 | ) | ||||||||||||||||
|
|
|
|
|
|
|
|
|
| |||||||||||
Balances as of December 31, 2015 | US$ | 31,345 | US$ | 352,180 | US$ | 125,811 | US$ | 3,953,408 | US$ | 4,462,744 | ||||||||||
|
|
|
|
|
|
|
|
|
| |||||||||||
The accompanying notes are part of these financial statements.
F-440
Table of Contents
COMERCIALIZADORA GUATEMALTECA MAYORISTA DE ELECTRICIDAD, S. A.—GUATEMEL
FOR THE YEARS ENDED DECEMBER 31, 2015, 2014 AND 2013
(Stated in US dollars, unless otherwise indicated)
2015 (Restated) (Note 1b) | 2014 (Restated) (Note 1b) | 2013 (Restated) (Note 1b) | ||||||||||
CASH FLOW FROM OPERATING ACTIVITIES | ||||||||||||
Net profit (loss) for the year | US$ | 337,199 | US$ | (406,555 | ) | US$ | (774,078 | ) | ||||
Adjustments for: | ||||||||||||
Depreciation and amortization | 48,590 | 7,372 | 7,058 | |||||||||
Gain on disposal of property, plant and equipment | (4,610 | ) | — | — | ||||||||
Income taxes | 80,517 | 16,348 | 551,240 | |||||||||
Finance costs recognized in profit or loss | 23,261 | 1,908 | — | |||||||||
Changes in working capital: | ||||||||||||
Trade receivables | 445,839 | 717,591 | 461,529 | |||||||||
Accounts receivable from related parties | (266,408 | ) | (243,525 | ) | 618,514 | |||||||
Tax assets | (35,728 | ) | 330,167 | 114,888 | ||||||||
Other assets | 42,630 | (2,820 | ) | 1,006 | ||||||||
Trade and other accounts payable | (291,919 | ) | (659,982 | ) | (1,923,863 | ) | ||||||
Accounts payable to related parties | — | 7,589 | — | |||||||||
Tax liabilities | 55,912 | (339,041 | ) | 423,405 | ||||||||
Other payable | (14,981 | ) | 19,391 | (2,536 | ) | |||||||
Provisions for contingencies | (2,751 | ) | — | — | ||||||||
Deposits received from customers | 2,698 | (23,889 | ) | 25,833 | ||||||||
|
|
|
|
|
| |||||||
Cash generated from (used in) operating activities | 420,249 | (575,446 | ) | (497,004 | ) | |||||||
|
|
|
|
|
| |||||||
Income tax paid | (44,789 | ) | (346,515 | ) | (40,455 | ) | ||||||
Payment of interest | (23,261 | ) | (1,908 | ) | — | |||||||
|
|
|
|
|
| |||||||
Net cash generated from (used in) operating activities | 352,199 | (923,869 | ) | (537,459 | ) | |||||||
|
|
|
|
|
| |||||||
F-441
Table of Contents
COMERCIALIZADORA GUATEMALTECA MAYORISTA DE ELECTRICIDAD, S. A.—GUATEMEL
STATEMENT OF CASH FLOWS (cont’d)
FOR THE YEARS ENDED DECEMBER 31, 2015, 2014 AND 2013
(Stated in US dollars, unless otherwise indicated)
2015 (Restated) (Note 1b) | 2014 (Restated) (Note 1b) | 2013 (Restated) (Note 1b) | ||||||||||
CASH FLOW FROM INVESTMENT ACTIVITIES | ||||||||||||
Payments for property, plant and equipment | US$ | (10,450 | ) | US$ | (35,478 | ) | US$ | — | ||||
Proceeds from disposal of property, plant and equipment | 20,900 | — | — | |||||||||
|
|
|
|
|
| |||||||
Net cash generated from (used in) investment activities | 10,450 | (35,478 | ) | — | ||||||||
CASH FLOW FROM FINANCING ACTIVITIES | ||||||||||||
Payments of finance leases | (176,915 | ) | (14,812 | ) | — | |||||||
Equity transaction with related party | — | — | (1,323,404 | ) | ||||||||
|
|
|
|
|
| |||||||
Net cash used in financing activities | (176,915 | ) | (14,812 | ) | (1,323,404 | ) | ||||||
|
|
|
|
|
| |||||||
NET INCREASE (DECREASE) IN CASH AND CASH EQUIVALENTS | 185,734 | (974,159 | ) | (1,860,863 | ) | |||||||
Effect of exchange rate changes on cash and cash equivalents | (3,783 | ) | 56,635 | 25,039 | ||||||||
CASH AND CASH EQUIVALENTS AT THE BEGINNING OF THE YEAR | 1,066,811 | 1,984,335 | 3,820,159 | |||||||||
|
|
|
|
|
| |||||||
CASH AND CASH EQUIVALENTS AT THE END OF THE YEAR | US$ | 1,248,762 | US$ | 1,066,811 | US$ | 1,984,335 | ||||||
|
|
|
|
|
| |||||||
NON-CASH TRANSACTIONS | ||||||||||||
Finance leases agreements subscribed during the year | US$ | . — | US$. 420,010 | US$ | — | |||||||
|
|
|
|
|
| |||||||
The accompanying notes are part of these financial statements.
F-442
Table of Contents
COMERCIALIZADORA GUATEMALTECA MAYORISTA DE ELECTRICIDAD, S. A.—GUATEMEL
NOTES TO THE FINANCIAL STATEMENTS
AS OF DECEMBER 31, 2015, 2014 AND 2013, AND FOR THE YEARS ENDED
DECEMBER 31, 2015 AND 2014
(Stated in US dollars, except otherwise indicated)
| 1. | OPERATIONS OF THE COMPANY AND BASIS OF PREPARATION OF THE FINANCIAL STATEMENTS |
| a. | Operations of the Company |
Comercializadora Guatemalteca Mayorista de Electricidad, S.A.—(“the Company” or “GUATEMEL”) is a corporation incorporated in the Republic of Guatemala according to the commercial statute of the country and was authorized to operate for an indefinite time. The Company was finally registered in the Commercial Register (Registro Mercantil) on June 10, 2014. The Company’s address of its principal offices is Diagonal 6 10-52, zona 10, Edificio Interamericas in the City of Guatemala.
The Company’s main activity is to commercialize power and energy to companies under the category of large electricity consumers, dedicated to any productive activity in the country.
All the revenues and non-current assets of the Company are generated and are located, respectively, in Guatemala.
On August 16, 2004 the Ministry of Energy and Mines through resolution number 1442 registered the Company as an agent in the Wholesale Market under the title of Electricity Commercialization. As a result, the Company will enjoy the rights and must comply with the obligations set forth in the General Electricity Act and its bylaws, Administrador del Mercado Mayorista (Wholesale Market Administrator) by laws, as well as all the other applicable statute in force.
Originally Distribuidora Eléctrica del Caribe, Sociedad Anónima was the controlling shareholder of the entity; which in turn was a subsidiary of Unión Fenosa Internacional (a subsidiary of Unión Fenosa, S. A.), who held 99.99% of its capital stock.
During the first trimester of 2010, Gas Natural SDG, S. A. reached a total participation of 95.2 % of the capital of Unión Fenosa, S. A. consequently, as of April 23, 2010 Gas Natural, SDG, S. A. took effective control to direct the financial policies and the exploitation of the Company.
On May 19, 2011, the Company was acquired by GUATEMEL B.V., a Company wholly owned by Fondo de Inversiones Actis (ultimate controlling shareholder). As a result of the acquisition, the Company no longer belonged to the Gas Natural Fenosa group and the operations that it had with the companies of the Gas Natural Fenosa group were considered as made between non-related parties as from that date.
As further described in Note 25, on January 22, 2016, I.C. Power Ltd., a subsidiary of Kenon Holdings Ltd. (“Kenon”), acquired all of the shares of GUATEMEL B.V, owner of 100% of the Company’s capital stock.
| b. | Basis of Preparation of the Financial Statements |
These financial statements were prepared by the Company for its filing by IC Power Pte. Ltd., the Company’s current indirect controlling shareholder (Note 25), in a Registration Statement to be filed with the U.S. Securities and Exchange Commission.
F-443
Table of Contents
COMERCIALIZADORA GUATEMALTECA MAYORISTA DE ELECTRICIDAD, S. A.—GUATEMEL
NOTES TO THE FINANCIAL STATEMENTS
AS OF DECEMBER 31, 2015, 2014 AND 2013, AND FOR THE YEARS ENDED
DECEMBER 31, 2015 AND 2014
(Stated in US dollars, except otherwise indicated)
| 1. | OPERATIONS OF THE COMPANY AND BASIS OF PREPARATION OF THE FINANCIAL STATEMENTS (cont’d) |
This financial statements were prepared originally in Quetzal, the Company’s functional currency, and were translated into U. S. dollars, the presentation currency.
The Company’s financial statements as of and for the years ended December 31, 2015, 2014 and 2013 have been restated as explained below.
Restatement of the Financial Statements
Subsequent to the issuance of the financial statements of GUATEMEL as of December 31, 2015 and 2014 and for the years then ended, and as of December 31, 2014 and 2013 and for the years then ended, the Company restated such financial statements for the correction of errors as stated below:
| a.1 | Accounts receivable from related parties held with Redes Eléctricas de Centroamérica S.A. (“RECSA”), a related party, were previously presented as of December 31, 2014 and 2013 as non-current asset considering the estimated timing of recoverability of such account receivable at that time. However, according to the terms of the agreement it should have been classified as a current asset since it was collectable in a 30-day term. Consequently, as of December 31, 2014 and 2013 the Company has revised such classification and concluded that such balance should be presented under current assets in the Statement of financial position. |
In addition, on December 31, 2015 the Company signed a new agreement with RECSA extending the due date of the promissory note representing the account receivable to December 31, 2017. However, the Company originally had not recorded the effects of such new agreement. Consequently, as of December 31, 2015, the Company revised the valuation of such account receivable and recognized a charge directly to equity under “Equity Transaction with Related Party—Retained Earnings” representing the discount on the account receivable of US$ 165,318 and the related effect in the account receivable. See Note 13 for additional information on this accounting receivable and the new agreement with RECSA.
| a.2 | Certain tax assets related to VAT receivables were previously presented as current assets since the Company estimated its recoverability within a year. However, the Company has revised this classification on the basis of all the information available as of December 31, 2015, 2014 and 2013 and concluded that according its tax planning strategies the timing for the collectability of this VAT receivable should have been beyond twelve months. As a result, the Company has reclassified such balances and presented them under non-current assets in the Statement of financial position as of December 31, 2015, 2014 and 2013. |
| a.3 | The Company has previously considered certain amounts of additions to property, plant and equipment and other assets acquired through finance lease agreements as cash flows used in investment or operating activities, respectively, and cash flows generated by financing activities, as counterparty. The Company has revised the amount and its disclosure and concluded that these constituted non-cash transactions and hence, that only actual payments made have to be |
F-444
Table of Contents
COMERCIALIZADORA GUATEMALTECA MAYORISTA DE ELECTRICIDAD, S. A.—GUATEMEL
NOTES TO THE FINANCIAL STATEMENTS
AS OF DECEMBER 31, 2015, 2014 AND 2013, AND FOR THE YEARS ENDED
DECEMBER 31, 2015 AND 2014
(Stated in US dollars, except otherwise indicated)
| 1. | OPERATIONS OF THE COMPANY AND BASIS OF PREPARATION OF THE FINANCIAL STATEMENTS (cont’d) |
| considered as cash flow movements. As a result, the Company has adjusted the line items in the Statement of cash flows for the year December 31, 2014 “Changes in working capital—Other assets”, “Payments for property, plant and equipment” and the previously disclosed line item “Proceeds from finance leases”, which had modified the cash flow used in operating, investment and financing activities. |
| a.4 | Taxes related to stamp tax, vehicles circulation tax, ISO and other minor taxes were previously presented as other cost of sales. However, the Company has revised this classification on the basis of all the information available as of December 31, 2015, 2014 and 2013 and concluded that according to the nature of the expenses, they should be classified as general expense, since they are not related to the cost of commercialization of power and energy. As a result, the Company has reclassified such balances and presented them under taxes in the General, Selling and Administrative Expenses of the Statement of profit or loss and other comprehensive income for the years ended December 31, 2015, 2014 and 2013. |
| a.5 | Depreciation were previously presented as other cost of sales. However, the Company has revised this classification on the basis of all the information available as of December 31, 2015, 2014 and concluded that according to the nature of the expense, it should be classified as general expense, since it is not related to the cost of commercialization of power and energy. As a result, the Company has reclassified such balances and presented them under depreciation in the General, Selling and Administrative Expenses of the Statement of profit or loss and other comprehensive income for the years ended December 31, 2015 and 2014. |
| a.6 | As of December 31, 2015, 2014 and 2013, the Company presented the deposits received from customers and their corresponding accumulated interest as non-current liabilities. During 2015, the Company revised the presentation after it concluded that it should be presented as a current liability since the Company do not have legal rights to defer this payment for at least twelve months after the financial statement date. |
| a.7 | The Company has revised the classification of its financial leases and interest related to these obligations and noticed an error in the classification of the non-current and current financial leases and other liabilities. As a result, the Company has reclassified a portion of the non-current financial leases and interest as current financial leases and other liabilities, respectively, in order to present the balances in accordance with the terms of the lease contracts as of December 31, 2015. |
| a.8 | During 2013, as part of the payments made under the agreement with Arthasan S.A. (related party as of that date), the Company made a payment to other related company on behalf of that related company, that was previously considered as part of the services under such agreement with Arthasan S.A. and included it in “General, Selling and Administrative Expense”. However, as of the date of issuance of these financial statements, the Company re-assessed such payment and concluded that it was not related to the services under the agreement with Arthasan S.A., but it |
F-445
Table of Contents
COMERCIALIZADORA GUATEMALTECA MAYORISTA DE ELECTRICIDAD, S. A.—GUATEMEL
NOTES TO THE FINANCIAL STATEMENTS
AS OF DECEMBER 31, 2015, 2014 AND 2013, AND FOR THE YEARS ENDED
DECEMBER 31, 2015 AND 2014
(Stated in US dollars, except otherwise indicated)
| 1. | OPERATIONS OF THE COMPANY AND BASIS OF PREPARATION OF THE FINANCIAL STATEMENTS (cont’d) |
| was a cash transfer between entities under common control., As consequence, the Company charged that amount directly in equity as “Equity Transaction with Related Party—Retained Earnings.” |
| a.9 | On December 18, 2015, the Company signed a debt relief agreement with Generación Limpia Guatemala S.A. (related party as of that date) through which the Company wrote-off the account receivable and charged an impairment loss within “General, Selling and Administrative Expense”. The Company revised the presentation of this transaction and concluded that it should be presented within equity as it was a transaction between entities under common control. As a result, the Company charged the amount written-off account receivable directly in equity as “Equity Transaction with Related Party—Retained Earnings”. See Note 13 for additional information of this transaction. |
| a.10 | During the years ended December 31, 2015, 2014 and 2013, the Company did not present separately the adjustment for the income tax expense and the advance payments made related to income tax, including them within the changes in working capital as part of the operating activities in the Statement of Cash Flow. Consequently, the Company revised the presentation after it concluded that it should present separately these items in the corresponding Statement of Cash Flow for each year. As a result, the Company restated this presentation and disclosed separately the adjustment for income tax expense, included the advance income tax payments within the income tax paid with the corresponding change in tax assets and tax liabilities between the changes in working capital for the years ended December 31, 2015, 2014 and 2013. |
Accordingly, the financial statements as of December 31, 2015, 2014 and 2013 and for the years then ended were restated for the correction of the above-mentioned errors.
F-446
Table of Contents
COMERCIALIZADORA GUATEMALTECA MAYORISTA DE ELECTRICIDAD, S. A.—GUATEMEL
NOTES TO THE FINANCIAL STATEMENTS
AS OF DECEMBER 31, 2015, 2014 AND 2013, AND FOR THE YEARS ENDED
DECEMBER 31, 2015 AND 2014
(Stated in US dollars, except otherwise indicated)
| 1. | OPERATIONS OF THE COMPANY AND BASIS OF PREPARATION OF THE FINANCIAL STATEMENTS (cont’d) |
The accumulated effect of the matters described above upon the financial statements is shown as follows:
Statement of financial position:
31-12-2015 | Ref. | Amounts | Correction | Restated | ||||||||||||
NON-CURRENT ASSETS | ||||||||||||||||
Accounts receivable to related parties | a.1 | US$ | 1,309,705 | US$ | (165,318 | ) | US$ | 1,144,387 | ||||||||
SHAREHOLDERS’ EQUITY | ||||||||||||||||
Retain earnings | a.1, a.9 | US$ | (4,118,726 | ) | US$ | 165,318 | US$ | (3,953,408 | ) | |||||||
Equity transaction with related party | a.1, a.9 | — | US$ | 532,052 | US$ | 532,052 | ||||||||||
NON-CURRENT LIABILITIES | ||||||||||||||||
Finance lease payable | a.7 | US$ | (139,350 | ) | US$ | 11,612 | US$ | (127,738 | ) | |||||||
Other liabilities | a.7 | US$ | (37,564 | ) | US$ | 3,130 | US$ | (34,434 | ) | |||||||
Deposits received from customers | a.6 | US$ | (84,033 | ) | US$ | 84,033 | US$ | — | ||||||||
CURRENT LIABILITIES | ||||||||||||||||
Short term financial leases | a.7 | US$ | (127,738 | ) | US$ | (11,612 | ) | US$ | (139,350 | ) | ||||||
Other liabilities | a.7 | US$ | (34,434 | ) | US$ | (3,130 | ) | US$ | (37,564 | ) | ||||||
Deposits received from customers | a.6 | US$ | — | US$ | (84,033 | ) | US$ | (84,033 | ) | |||||||
Statement of profit or loss and other comprehensive income: | ||||||||||||||||
Other cost of sales | a.4, a.5 | US$ | 242,473 | US$ | (190,788 | ) | US$ | 51,685 | ||||||||
General, selling and administrative expenses | a.4, a.5, a.9 | US$ | 602,146 | US$ | (166,946 | ) | US$ | 435,200 | ||||||||
Statement of Cash Flow:
31-12-2015 | Ref. | Amount | Correction | Restated | ||||||||||||
CASH FLOWS FROM OPERATING ACTIVITIES: | ||||||||||||||||
Net profit (loss) for the year | a.9 | US$ | (20,535 | ) | US$ | 357,734 | US$ | 337,199 | ||||||||
Charge for debt relief agreement | a.9 | US$ | 357,734 | US$ | (357,734 | ) | US$ | — | ||||||||
Income tax expense | a.10 | US$ | — | US$ | 80,517 | US$ | 80,517 | |||||||||
Tax assets | a.10 | US$ | 145,312 | US$ | (181,040 | ) | US$ | (35,728 | ) | |||||||
Tax liabilities | a.10 | US$ | 28,983 | US$ | 26,929 | US$ | 55,912 | |||||||||
Income tax paid | a.10 | US$ | (118,383 | ) | US$ | 73,594 | US$ | (44,789 | ) | |||||||
F-447
Table of Contents
COMERCIALIZADORA GUATEMALTECA MAYORISTA DE ELECTRICIDAD, S. A.—GUATEMEL
NOTES TO THE FINANCIAL STATEMENTS
AS OF DECEMBER 31, 2015, 2014 AND 2013, AND FOR THE YEARS ENDED
DECEMBER 31, 2015 AND 2014
(Stated in US dollars, except otherwise indicated)
| 1. | OPERATIONS OF THE COMPANY AND BASIS OF PREPARATION OF THE FINANCIAL STATEMENTS (cont’d) |
Statement of financial position:
31-12-2014 | Ref. | Amounts | Correction Debits (Credits) | Restated | ||||||||||||
NON-CURRENT ASSETS | ||||||||||||||||
Accounts receivable from related parties | a.1 | US$ | 1,316,352 | US$ | (1,316,352 | ) | US$ | — | ||||||||
Non-current tax assets | a.2 | US$ | — | US$ | 1,877,889 | US$ | 1,877,889 | |||||||||
CURRENT ASSETS | ||||||||||||||||
Accounts receivable from related parties | a.1 | US$ | 427,815 | US$ | 1,316,352 | US$ | 1,744,167 | |||||||||
Current tax assets | a.2 | US$ | 1,936,309 | US$ | (1,877,889 | ) | US$ | 58,420 | ||||||||
NON-CURRENT LIABILITIES | ||||||||||||||||
Customer deposits | a.6 | US$ | (81,717 | ) | US$ | 81,717 | US$ | — | ||||||||
CURRENT LIABILITIES | ||||||||||||||||
Customer deposits | a.6 | US$ | — | US$ | (81,717 | ) | US$ | (81,717 | ) | |||||||
Statement of profit or loss and other comprehensive income:
31-12-2014 | Ref. | Amounts | Correction of Errors - Debits | Restated | ||||||||||||
Other cost of sales | a.4, a.5 | US$ | 248,416 | US$ | (49,889 | ) | US$ | 198,527 | ||||||||
General, selling and administrative expenses | a.4, a.5 | US$ | 2,004,759 | US$ | 49,889 | US$ | 2,054,648 | |||||||||
Statement of cash flows:
31-12-2014 | Ref. | Amounts | Correction of Errors - Debits | Restated | ||||||||||||
CASH FLOW FROM OPERATING ACTIVITIES | ||||||||||||||||
Income tax expense | a.10 | US$ | — | US$ | 16,348 | US$ | 16,348 | |||||||||
Tax assets | a.10 | US$ | 11,620 | US$ | 318,547 | US$ | 330,167 | |||||||||
Tax liabilities | a.10 | US$ | (14,926 | ) | US$ | (324,115 | ) | US$ | (339,041 | ) | ||||||
Income tax paid | a.10 | US$ | (352,381 | ) | US$ | 5,866 | US$ | (346,515 | ) | |||||||
Other assets | a.3 | US$ | (122,401 | ) | US$ | 119,581 | US$ | (2,820 | ) | |||||||
CASH FLOW FROM INVESTMENT ACTIVITIES | ||||||||||||||||
Payments for property, plant and equipment | a.3 | US$ | (447,351 | ) | US$ | 411,873 | US$ | (35,478 | ) | |||||||
CASH FLOW FROM FINANCING ACTIVITIES | ||||||||||||||||
Finance lease acquisition | a.3 | US$ | 518,420 | US$ | (518,420 | ) | US$ | — | ||||||||
Payments of finance leases | a.3 | US$ | — | US$ | (14,812 | ) | US$ | (14,812 | ) | |||||||
Effect of exchange rate changes on cash and cash equivalents | a.3 | US$ | 54,857 | US$ | 1,778 | US$ | 56,635 | |||||||||
NON-CASH TRANSACTIONS | ||||||||||||||||
Finance leases agreements subscribed during the year | a.3 | US$ | — | US$ | 420,010 | US$ | 420,010 | |||||||||
F-448
Table of Contents
COMERCIALIZADORA GUATEMALTECA MAYORISTA DE ELECTRICIDAD, S. A.—GUATEMEL
NOTES TO THE FINANCIAL STATEMENTS
AS OF DECEMBER 31, 2015, 2014 AND 2013, AND FOR THE YEARS ENDED
DECEMBER 31, 2015 AND 2014
(Stated in US dollars, except otherwise indicated)
| 1. | OPERATIONS OF THE COMPANY AND BASIS OF PREPARATION OF THE FINANCIAL STATEMENTS (cont’d) |
Statement of financial position:
31-12-2013 | Ref. | Amounts | Correction of Errors - Debits (Credits) | Restated | ||||||||||||
NON-CURRENT ASSETS | ||||||||||||||||
Non-current tax assets | a.2 | US$ | — | US$ | 1,714,547 | US$ | 1,714,547 | |||||||||
CURRENT ASSETS | ||||||||||||||||
Current tax assets | a.2 | US$ | 1,718,691 | US$ | (1,714,547 | ) | US$ | 4,144 | ||||||||
SHAREHOLDERS’ EQUITY | ||||||||||||||||
Equity transaction with related party | a.8 | US$ | — | US$ | 1,323,404 | US$ | 1,323,404 | |||||||||
NON-CURRENT LIABILITIES | ||||||||||||||||
Customer deposits | a.6 | US$ | (102,311 | ) | US$ | 102,311 | US$ | — | ||||||||
CURRENT LIABILITIES | ||||||||||||||||
Customer deposits | a.6 | US$ | — | US$ | (102,311 | ) | US$ | (102,311 | ) | |||||||
Statement of profit or loss and other comprehensive income:
31-12-2013 | Ref. | Amounts | Correction of Errors - Debits (Credits) | Restated | ||||||||||||
Other cost of sales | a.4 | US$ | 73,213 | US$ | (377 | ) | US$ | 72,836 | ||||||||
General, selling and administrative expenses | a.4, a.8 | US$ | 3,852,010 | US$ | (1,323,027 | ) | US$ | 2,528,983 | ||||||||
Statement of cash flows:
31-12-2013 | Ref. | Amounts | Correction of Errors - Debits (Credits) | Restated | ||||||||||||
CASH FLOW FROM OPERATING ACTIVITIES | ||||||||||||||||
Net loss for the year | a.8 | US$ | (2,097,482 | ) | US$ | 1,323,404 | US$ | (774,078 | ) | |||||||
Income tax expense | a.10 | US$ | 552,465 | US$ | (1,225 | ) | US$ | 551,240 | ||||||||
Tax assets | a.10 | US$ | 309,914 | US$ | (195,026 | ) | US$ | 114,888 | ||||||||
Tax liabilities | a.10 | US$ | 186,699 | US$ | 236,706 | US$ | 423,405 | |||||||||
Income tax paid | a.10 | US$ | — | US$ | (40,455 | ) | US$ | (40,455 | ) | |||||||
CASH FLOW FROM FINANCING ACTIVITIES | ||||||||||||||||
Equity transaction with related party | a.8 | US$ | — | US$ | (1,323,404 | ) | US$ | (1,323,404 | ) | |||||||
The changes did not have impact on the Company’s net loss for the year ended December 31, 2014 and the net operating, investing and financing cash flows for the years 2015 and 2013.
In addition, during the preparation of these financial statements, for the purpose described above, the Company expanded certain disclosures from those previously presented.
F-449
Table of Contents
COMERCIALIZADORA GUATEMALTECA MAYORISTA DE ELECTRICIDAD, S. A.—GUATEMEL
NOTES TO THE FINANCIAL STATEMENTS
AS OF DECEMBER 31, 2015, 2014 AND 2013, AND FOR THE YEARS ENDED
DECEMBER 31, 2015 AND 2014
(Stated in US dollars, except otherwise indicated)
| 2. | APPLICATION OF NEW AND REVISED INTERNATIONAL REPORTING STANDARDS (IFRS) |
| 2.1 | New and amendments to IFRSs that are mandatorily effective for the current year |
In the current year, the Company has applied a number of amendments to IFRSs issued by the International Accounting Standards Board (IASB) that are mandatorily effective for the accounting period that begins on or after 1 January 2015:
Amendments to IAS 19 Defined Benefit Plans: Employees’ Contributions
The application to these amendments has not had any material impact on the disclosures or the amounts recognized in the Company’s financial statements.
Annual Improvements to the IFRS Terms 2010-2012 and 2011-2013
The company has applied the amendments to IFRSs included in the Annual Improvements to IFRSs 2010-2012 Cycle and 2011 2013 Cycle for the first time in the current year. One of the annual improvements requires that the entities disclose judgments made in the application of the aggregation criteria established in paragraph 12 of the IFRS 8 Operation Segments.
The application of these amendments has not had an impact on the disclosures or amounts recognized in the Company’s financial statements since the Company does not report through operation segments. The application of the other amendments has had no impact on the disclosures or amounts recognized in the Company’s financial statements.
| 2.2 | New and revised IFRS issued but not yet effective |
The Company has not applied the following new and revised IFRSs that have been issued but are not yet effective:
| IFRS 9 | Financial Instruments3 | |
| IFRS 15 | Revenue from Contracts with Customers3 | |
| IFRS 16 | Leasing4 | |
| Amendments to IAS 1 | Disclosure Initiative1 | |
| Amendments to IAS 16 and IAS 38 | Clarification of Acceptable Methods of Depreciation and Amortisation1 | |
| Amendments to IAS 7 | Statement of Cash Flows2 | |
| Amendments to IAS 12 | Related to the Recognition of Deferred Tax Assets for Unrealized Losses2 | |
| Amendments to IFRSs | Annual Improvements to IFRSs 2012-2014 Cycle1 |
| 1 | Effective for annual periods beginning on or after January 1, 2016, with earlier application permitted. |
F-450
Table of Contents
COMERCIALIZADORA GUATEMALTECA MAYORISTA DE ELECTRICIDAD, S. A.—GUATEMEL
NOTES TO THE FINANCIAL STATEMENTS
AS OF DECEMBER 31, 2015, 2014 AND 2013, AND FOR THE YEARS ENDED
DECEMBER 31, 2015 AND 2014
(Stated in US dollars, except otherwise indicated)
| 2. | APPLICATION OF NEW AND REVISED INTERNATIONAL REPORTING STANDARDS (IFRS) (cont’d) |
| 2 | Effective for annual periods beginning on or after January 1, 2017, with earlier application permitted. |
| 3 | Effective for annual periods beginning on or after January 1, 2018, with earlier application permitted. |
| 4 | Effective for annual periods beginning on or after January 1, 2019, with earlier application permitted. |
IFRS 9 Financial Instruments
IFRS 9, issued on November 2009, incorporated new requirements for the classification and measurement of financial assets. IFRS 9 was subsequently modified in October 2010 in order to include the requirements for the classification and measurement of the financial liabilities and for derecognition; in November 2013 it included the new requirements for the general hedge accounting. In July 2014, another revised version of the IFRS 9 was issued, mainly to included: a) requirements of impairment for financial assets and; b) limited amendments to the requirements of classification and measurement by introducing a measurement category to “fair value through other comprehensive income” (FVTOCI) for certain simple debt instruments.
Key requirements of IFRS 9:
| • | IFRS 9 requires that all the recognized financial assets that are within the scope of the IAS 39 Financial Instruments: Recognition and Measurement are measured subsequently under the amortized cost method or the fair value method. Specifically, debt investments that are held within a business model whose objective is to collect the contractual cash flows, and that have contractual cash flows that are solely payments of principal and interest on the principal outstanding are generally measured at amortized cost at the end of subsequent accounting periods. Debt instruments that are held within a business model whose objective is achieved both by collecting contractual cash flows and selling financial assets, and that have contractual terms that give rise on specified dates to cash flows that are solely payments of principal and interest on the principal amount outstanding, are generally measured at FVTOCI. All other debt investments and equity investments are measured at their fair value at the end of subsequent accounting periods. In addition, under IFRS 9, entities may make an irrevocable election to present subsequent changes in the fair value of an equity investment (that is not held for trading) in other comprehensive income, with only dividend income generally recognized in profit or loss. |
| • | With respect to the measurement of the financial liabilities that are designated as fair value through profit or loss, the IFRS 9 requires that the change amount at fair value of the financial liability attributable to the changes in the credit risk of such liability is be recognized in other comprehensive income, unless that the recognition of the effects of the changes in the liability credit risk in other comprehensive income creates or increases the accounting mismatch in profit or loss. Changes in fair value attributable to a financial liability’s credit risk are not subsequently |
F-451
Table of Contents
COMERCIALIZADORA GUATEMALTECA MAYORISTA DE ELECTRICIDAD, S. A.—GUATEMEL
NOTES TO THE FINANCIAL STATEMENTS
AS OF DECEMBER 31, 2015, 2014 AND 2013, AND FOR THE YEARS ENDED
DECEMBER 31, 2015 AND 2014
(Stated in US dollars, except otherwise indicated)
| 2. | APPLICATION OF NEW AND REVISED INTERNATIONAL REPORTING STANDARDS (IFRS) (cont’d) |
reclassified to profit or loss. Under IAS 39, the entire amount of the change in the fair value of the financial liability designated as fair value through profit or loss is presented in profit or loss. |
| • | With respect to the financial assets impairment, the IFRS 9 requires a model of impairment on expected credit loss, opposed to the expected credit loss model incurred, in conformity with IAS 39. The expected credit loss model requires that an entity records the expected credit losses and their changes in these expected credit losses at each reporting date in order to reflect the changes in the credit risk from the initial recognition. |
| • | The new general requirements for the hedge accounting retain the three types of mechanisms of hedge accounting that are currently available in IAS 39. In conformity with IFRS 9, the types of suitable transactions for the hedge accounting are much more flexible, specifically, by enlarging the types of instruments that are classified as hedge instruments and the types of risk components of non-financial items suitable to hedge accounting. In addition, the effectiveness test has been overhauled and replaced with the principle of an ‘economic relationship’. Retrospective assessment of hedge effectiveness is also no longer required. Enhanced disclosure requirements about an entity’s risk management activities have also been introduced. |
The management of the Company foresee that the application of this new and revised IFRSs will not have a material impact over the Company’s financial statements.
IFRS 15 Revenue from Contracts with Customers
In May 2014, the IFRS 15 was issued which establishes an extensive and detailed model that will be used by the entities in the accounting for revenue from contracts with clients. The IFRS 15 will supersed the current guideline of revenue recognition, including the IAS 18 Revenue, IAS 11 Construction Contracts and the related interpretations when it becomes effective.
The essential principle of IAS 15 is that a company should recognize revenue to represent the transfer of goods and services promised to clients in an amount that reflects the consideration that the company expects to receive in exchange of the goods or services. Specifically, the standards adds a model of five steps to revenue recognition:
Step 1: Identify the contract with the clients.
Step 2: Identify the performance obligation in the contract.
Step 3: Determine the transaction price.
Step 4: Distribute the transaction price to the performance obligations in the contract.
Step 5: Recognize revenue when (or as) the entity satisfies the performance obligation.
Under IFRS 15, a Company records income when (or as) a performance obligation is satisfied, i.e., when the “control” of the goods and services based on a particular performance obligation is transferred to the client. Many other prescriptive guidelines have been added within the IFRS 15 to confront specific situations. Additionally, IFRS 15 requires extensive disclosures.
F-452
Table of Contents
COMERCIALIZADORA GUATEMALTECA MAYORISTA DE ELECTRICIDAD, S. A.—GUATEMEL
NOTES TO THE FINANCIAL STATEMENTS
AS OF DECEMBER 31, 2015, 2014 AND 2013, AND FOR THE YEARS ENDED
DECEMBER 31, 2015 AND 2014
(Stated in US dollars, except otherwise indicated)
| 2. | APPLICATION OF NEW AND REVISED INTERNATIONAL REPORTING STANDARDS (IFRS) (cont’d) |
On April 12, 2016, the IASB amends IFRS 15 Revenue from Contracts with Customers to clarify three aspects of the standard (identifying performance obligations, principal versus agent considerations, and licensing) and to provide some transition relief for modified contracts and completed contracts.
The Company is evaluating this standard and cannot, at this time, estimate the potential impact on its future financial condition, results of operations and cash flows.
IFRS 16—Leasing
On January 13, 2016, the IASB issued IFRS 16, which brings most leases on the balance sheet for lessees under a single model, eliminating the distinction between operating and finance leases. For lessors, however, the accounting remains largely unchanged and the distinction between operating and finance leases is retained. IFRS 16 supersedes IAS 17 and related interpretations.
Under IFRS 16, a lessee recognizes a right-of-use asset and a lease liability. The right-of-use asset is treated similarly to other nonfinancial assets and depreciated accordingly, and the liability accrues interest. The lease liability is initially measured at the present value of the lease payments payable over the lease term, discounted at the rate implicit in the lease if this rate can be readily determined. If the rate cannot be readily determined, the lessee’s incremental borrowing rate should be used.
Like IAS 17, IFRS 16 requires lessors to classify leases as operating or finance leases. A lease is classified as a finance lease if it transfers substantially all the risks and rewards of ownership of an underlying asset. Otherwise, the lease is classified as an operating lease. For finance leases, a lessor recognizes finance income over the lease term on the basis of a pattern reflecting a constant periodic rate of return on the net investment. For operating leases, a lessor recognizes lease payments as income on a straight-line basis or, if more representative of the pattern in which benefit from use of the underlying asset is diminished, another systematic basis.
IFRS 16 is effective for annual reporting periods beginning on or after January 1, 2019. Earlier application is permitted if an entity has also applied IFRS 15 (on revenue from contracts with customers).
The Company’s management is currently analyzing the effects that the application of the IFRS 16 may have in the future on the amounts reported and the disclosures of the Company’s financial statements.
Amendments to the IAS 1 Disclosure Initiative
Amendments to the IAS 1 provide guidelines as to how to apply the materiality concept in the accounting practice.
Amendments IAS 1 take effect for the annual period beginning on January 1, 2016. The Company’s management does not foresee that the application of these amendments to IAS 1 will have a material impact on the Company´s financial statements.
F-453
Table of Contents
COMERCIALIZADORA GUATEMALTECA MAYORISTA DE ELECTRICIDAD, S. A.—GUATEMEL
NOTES TO THE FINANCIAL STATEMENTS
AS OF DECEMBER 31, 2015, 2014 AND 2013, AND FOR THE YEARS ENDED
DECEMBER 31, 2015 AND 2014
(Stated in US dollars, except otherwise indicated)
| 2. | APPLICATION OF NEW AND REVISED INTERNATIONAL REPORTING STANDARDS (IFRS) (cont’d) |
Amendments to IAS 16 and IAS 38 Clarification of Acceptable Methods of Depreciation and Amortization
Amendments of IAS 16 prohibits the entities from use a depreciation method based on the revenue for the items of property, plant and equipment. Amendments to IAS 38 introduce a rebuttable assumptions that states that revenue is not an appropriate principle for the amortization of an intangible asset. This assumption may be rebutted only in the two following circumstances:
| • | When the intangible asset is stated as a revenue measure, or |
| • | When it can be demonstrated that revenue and the consumption of the economic benefits of the intangible asset are closely related. |
Amendments are applied prospectively for the annual periods beginning on January 1, 2016 or after. Currently, the Company uses the straight line method of depreciation and the amortization of property, plant, equipment and intangible assets, respectively. The management considers that this is the most appropriate method to reflect the consumption of economic benefits inherent to the respective assets; that is the reason why the Company´s management does not consider applicable these amendments to IAS 16 and IAS 38 for the Company´s financial statements.
Amendments to IAS 7—Statements of Cash Flows
On January 29, 2016, the IASB published amendments to IAS 7 as part of its disclosure initiative (i.e., projects to improve the effectiveness of financial reporting disclosures). The objective of the amendments is to clarify IAS 7 to improve information provided to financial statement users about an entity’s financing activities.
The amendments require that an entity disclose, to the extent necessary to meet the disclosure objective, the following changes in liabilities arising from financing activities:
| • | Changes from financing cash flows; |
| • | Changes arising from obtaining or losing control of subsidiaries or other businesses; |
| • | The effect of changes in foreign exchange rates; |
| • | Changes in fair values; and |
| • | Other changes. |
The IASB defines liabilities arising from financing activities as liabilities “for which cash flows were, or future cash flows will be, classified in the statement of cash flows as cash flows from financing
F-454
Table of Contents
COMERCIALIZADORA GUATEMALTECA MAYORISTA DE ELECTRICIDAD, S. A.—GUATEMEL
NOTES TO THE FINANCIAL STATEMENTS
AS OF DECEMBER 31, 2015, 2014 AND 2013, AND FOR THE YEARS ENDED
DECEMBER 31, 2015 AND 2014
(Stated in US dollars, except otherwise indicated)
| 2. | APPLICATION OF NEW AND REVISED INTERNATIONAL REPORTING STANDARDS (IFRS) (cont’d) |
activities.” The amendments indicate that the new disclosure requirements also apply to changes in financial assets that meet this definition. The amendments state that one way to meet the new disclosure requirements is to provide “a reconciliation between the opening and closing balances in the statement of financial position for liabilities arising from financing activities.”
The amendments are effective for annual periods beginning on or after January 1, 2017. Earlier application is permitted. The management of the Company do not anticipate that the application of these amendments will have a material effect on the Company’s financial statements.
Amendments to IAS 12 Related to the Recognition of Deferred Tax Assets for Unrealized Losses
On January 19, 2016, the IASB published final amendments to IAS 12. The amendments clarify the following:
| • | Unrealized losses on debt instruments measured at fair value and measured at cost for tax purposes “give rise to a deductible temporary difference [regardless] of whether the debt instrument’s holder expects to recover the carrying amount of the debt instrument by sale or by use.” |
| • | “The carrying amount of an asset does not limit the estimation of probable future taxable profit.” |
| • | Estimates of future taxable profit exclude “tax deductions resulting from the reversal of deductible temporary differences.” |
| • | An entity assesses a deferred tax asset in combination with other deferred tax assets. When tax law restricts the utilization of tax losses, an entity assesses a deferred tax asset in combination with other deferred tax assets of the same type. |
The amendments are effective for annual periods beginning on or after January 1, 2017; earlier application is permitted. The management of the Company do not anticipate that the application of these amendments will have a material effect on the Company’s financial statements.
Annual Improvements to IFRS Term 2012-2014
The annual improvements of the IFRS’s of term 2012-2014 include a number of amendments to several IFRS’s which are summarized as follows:
Amendments to IFRS 5 show a specific orientation in IFRS 5, that is when the entity reclassifies an asset (or disposal group) held for sale to held for its distribution to owners (or vice versa).
Amendments to IFRS 7 provide an additional guideline to clarify whether a contract of services rendering corresponds to the continuous sharing participation in the transfer of an asset transferred for information disclosure effects of such asset.
F-455
Table of Contents
COMERCIALIZADORA GUATEMALTECA MAYORISTA DE ELECTRICIDAD, S. A.—GUATEMEL
NOTES TO THE FINANCIAL STATEMENTS
AS OF DECEMBER 31, 2015, 2014 AND 2013, AND FOR THE YEARS ENDED
DECEMBER 31, 2015 AND 2014
(Stated in US dollars, except otherwise indicated)
| 2. | APPLICATION OF NEW AND REVISED INTERNATIONAL REPORTING STANDARDS (IFRS) (cont’d) |
Amendments to IAS 19 clarify that the rate used in order to discount the obligations from post-employment benefits must be determined in relation with the market yields on high quality corporate bonds at the end of the reporting period.
The management of the Company do not anticipate that the application of these amendments will have a material effect on the Company’s financial statements.
| 3. | SIGNIFICANT ACCOUNTING POLICIES |
The significant accounting policies used in the preparation of the financial statements are described as follows:
| a. | Statement of Compliance and Basis of Preparation—This financial statements were prepared according to the International Financial Reporting Standards (IFRS) as issued by the International Accounting Standards Board (IASB) in force at December 31, 2015, which include the International Financial Reporting Standards (IFRS), the International Accounting Standards (IAS), and the Interpretations issued by the International Financial Reporting Standards Committee (IFRIC), or by the former Standards Interpretation Committee (SIC) adopted by the IASB. The financial statements have been prepared on the historical cost basis except for certain financial instruments that are measured at fair values at the end of each reporting period, if any, as explained in the accounting policies below. The historical cost is based generally in the fair value of the consideration given in the exchange of goods and services. |
Fair value is the price that would be received when selling an asset, or paid when transferring a liability in an orderly transaction among market participants in a measurement date, without considering the fact that such price is directly observable or estimated through another valuation technique. When estimating the fair value of an asset or liability, the Company considers the characteristics of such asset or liability when establishing a price at the measurement date. Fair value for measurement and/or disclosure purposes in the financial statements are considered over that basis, except for leasing transactions (within the scope of the IAS 17) and the measurements that has some similarity to the fair value but that are not of fair value, such as the value in use under IAS 36.
In addition, for reporting purposes, the fair value measurements are classified in three levels: 1, 2 or 3, depending on the degree in which the inputs to the fair value measurement are observable and their significance at the value measurement in whole, as described below:
| • | Level 1: The inputs are related to quoted prices (not adjusted) in active markets for assets or liabilities identical to those that the Company may access at the date of measurement. |
| • | Level 2: The inputs are different from the quoted prices included in Level 1, which are observable for the asset or liability, either directly or indirectly. |
| • | Level 3: The inputs are not observable for the asset or liability. |
F-456
Table of Contents
COMERCIALIZADORA GUATEMALTECA MAYORISTA DE ELECTRICIDAD, S. A.—GUATEMEL
NOTES TO THE FINANCIAL STATEMENTS
AS OF DECEMBER 31, 2015, 2014 AND 2013, AND FOR THE YEARS ENDED
DECEMBER 31, 2015 AND 2014
(Stated in US dollars, except otherwise indicated)
| 3. | SIGNIFICANT ACCOUNTING POLICIES (cont’d) |
| b. | Functional and Presentation Currency |
The Company’s functional currency is the Quetzal (Q.) which is the currency of the primary economic environment in which the Company operates. The Quetzal is the unitary currency in Guatemala. The presentation currency for these financial statements is the United States Dollar (US$).
When preparing the Company’s financial statements, the transactions in currencies other than the functional currency (foreign currencies) are recognized using the exchange rates prevailing at the dates of the transactions. At the end of each reporting period, monetary items denominated in a foreign currency are translated at the exchange rates prevailing at that date. Non-monetary items carried at fair value, denominated in foreign currency, are translated at the exchange rate in force at the date in which the fair value was determined. Non-monetary items calculated in terms of the historic cost, in foreign currency, are not translated.
Exchange differences on monetary items are recognized in the profit or loss of the period in which they occur.
The Company has presented its financial statements in US$. Therefore, the financial statements prepared in the Company’s functional currency were converted into the presentation currency, as per the following procedures:
| • | Assets and liabilities of each of the statements of financial position presented are converted using the exchange rate at the statement of financial position closing date; |
| • | Items in the statement of profit or loss and other comprehensive income are converted using the exchange rate at the time the transactions were generated (or, for practical reasons, and provided the exchange rate has not changed significantly, using each month’s average exchange rate); |
All conversion differences resulting from the foregoing are recognized under “Other Comprehensive Income” and accumulated in equity.
| c. | Use of Estimates—The accounting policies that the Company follows require that the Management carries out certain estimates and use certain assumptions in order to determine the carrying amounts of assets and liabilities that are not readily apparent from other sources included in the financial statements and carry out the corresponding disclosures. Even if they differ in their actual result, Management considers that the estimates and assumptions used were adequate in the circumstances. The estimates and associated assumptions are based on historical experience and other factors that are considered to be relevant. Actual results may differ from these estimates. |
The estimates and underlying assumptions are reviewed on an ongoing basis. Revisions to accounting estimates are recognized in the period in which the estimate is revised. If the revision affects only that period, or in the period of the revision and future periods if the revision affects both current and future periods.
F-457
Table of Contents
COMERCIALIZADORA GUATEMALTECA MAYORISTA DE ELECTRICIDAD, S. A.—GUATEMEL
NOTES TO THE FINANCIAL STATEMENTS
AS OF DECEMBER 31, 2015, 2014 AND 2013, AND FOR THE YEARS ENDED
DECEMBER 31, 2015 AND 2014
(Stated in US dollars, except otherwise indicated)
| 3. | SIGNIFICANT ACCOUNTING POLICIES (cont’d) |
Critical Accounting Estimates and Assumptions
The Company prepares estimates and assumptions with regard to the future. Actual results may differ from these estimates.
The following are the key assumptions concerning the future, and other key sources of estimation uncertainty at the end of the reporting period that may have a significant risk of causing a material adjustment to the carrying amounts of assets and liabilities:
| • | Energy Purchase Provision |
The Company records on a monthly basis the provision of energy purchased not yet billed by estimating the energy received since the last measurement from the supplier. This provision consists in estimating the energy received since the last invoice from the supplier in the frontier spots and valuing it at the prices that the different energy suppliers define in the contract of energy purchase with the Company.
| • | Energy Supplied Pending Invoicing |
The Company records in the account “Clients- Energy consumed, not billed” the amount of the accrued revenue not billed to clients from the provision of electric energy. This provision consists in estimating the energy actually delivered since the last measurement date to the end of the year, valued at the applicable tariffs.
| • | Useful Life of Property, Plant and Equipment |
The Company reviews the estimated useful life of property, plant and equipment at the end of each annual period. Estimated useful lives are detailed in note 3d.
| d. | Property, Plant and Equipment—The furniture and vehicles are recorded at the cost less the subsequent accumulated depreciation and any recognized impairment loss. |
Depreciation of these assets commences when the assets are ready for their intended use.
Depreciation is recognized in profit or loss. Depreciation is recognized so as to write off the cost of assets less their residual values.
The property, plant and equipment is depreciated under the straight-line method considering the estimated useful lives set out as follows:
Percentage | Estimated | |||||||
Furniture and other equipment | 10 | % | 10 | |||||
Vehicles under financial lease | 10 | % | 10 | |||||
F-458
Table of Contents
COMERCIALIZADORA GUATEMALTECA MAYORISTA DE ELECTRICIDAD, S. A.—GUATEMEL
NOTES TO THE FINANCIAL STATEMENTS
AS OF DECEMBER 31, 2015, 2014 AND 2013, AND FOR THE YEARS ENDED
DECEMBER 31, 2015 AND 2014
(Stated in US dollars, except otherwise indicated)
| 3. | SIGNIFICANT ACCOUNTING POLICIES (cont’d) |
The estimated useful life, the residual value and depreciation method are revised at the end of each reporting period, being the effect of any change in the estimate recognized on a prospective basis.
The assets kept under financial lease are depreciated for the term of their estimated useful life and is equal to the assets owned. However, when there is no certainty that the property will be obtained at the end of the lease term, the assets are depreciated over a shorter term between the lease and the useful life.
An item of property, plant and equipment is derecognized upon disposal or when no future economic benefits are expected to arise from the continued use of the asset. Any gain or loss arising on the disposal or retirement of an item of property, plant and equipment is determined as the difference between the sales proceeds and the carrying amount of the asset and is recognized in profit or loss.
| e. | Impairment of Tangible Assets—The Company reviews at the end of each reporting period the carrying amounts of its tangible assets to determine if there is evidence that such assets may have suffered an impairment loss. If there is any evidence, the recoverable amount of the asset is calculated with the purpose of determining the extent of the impairment loss (if any). When it is not possible to estimate the recoverable value of an individual asset, the Company estimates the recoverable value of the cash generating unit to which the asset belongs. Where a consistent and fair distribution basis is identified, the common assets are also distributed to the individual units generating cash or, if not possible, to the smallest group of the cash generating units for which a consistent and fair distribution basis is identified. |
The recoverable value is the higher value between the fair value less the cost of selling it and the value in use. The value in use is determined based on future estimated cash flows discounted at its present value, using a discount rate before tax that reflects the current market valuations with regard to the time value of money and the specific risks of the asset for which the estimates of future cash flows have not been adjusted.
If the recoverable amount of an asset (or a cash generating unit) is estimated to be less than its carrying amount, the book value of the asset (cash generating unit) would be reduced to its recoverable amount. An impairment loss is recognized as an expense.
When an impairment loss subsequently reverses, the carrying amount of the asset (or a cash-generating unit) is increased to the revised estimate of its recoverable amount, but so that the increased carrying amount does not exceed the carrying amount that would have been determined had no impairment loss been recognized for the asset (or cash-generating unit) in prior years. A reversal of an impairment loss is recognized immediately in profit or loss.
| f. | Leases—Leases are classified as finance leases whenever the terms of the lease transfer substantially all the risks and rewards of ownership to the lessee. All other leases are classified as operating leases. |
F-459
Table of Contents
COMERCIALIZADORA GUATEMALTECA MAYORISTA DE ELECTRICIDAD, S. A.—GUATEMEL
NOTES TO THE FINANCIAL STATEMENTS
AS OF DECEMBER 31, 2015, 2014 AND 2013, AND FOR THE YEARS ENDED
DECEMBER 31, 2015 AND 2014
(Stated in US dollars, except otherwise indicated)
| 3. | SIGNIFICANT ACCOUNTING POLICIES (cont’d) |
The Company as Lessor
Amounts due from lessees under finance leases are recognized as receivables at the amount of the Company’s net investment in the leases. The income from rent under operating leases is recognized using a straight line method during the corresponding term of the lease. Initial direct costs incurred in negotiating and arranging an operating lease are added to the carrying amount of the leased asset and recognized on a straight-line basis over the lease term.
The Company as Lessee
The assets kept under financial lease are recognized as assets of the Company at their fair value at the inception of the lease or, if lower, at the present value of the minimum lease payments. The corresponding liability to the lessor is included in the statement of financial position as an obligation under financial lease.
Payments for lease are distributed between the financial expenses and the reduction of the obligations under lease in order to reach a constant interest rate over the remaining balance of the liability. The financial expenses are directly charged as results. Contingent rentals are recognized as expenses in the periods in which they are incurred.
The payments of the operating leasing are recognized as an expense using the straight-line method, during the term related to the leasing, unless another systematic basis of distribution becomes more representative to suitably reflect the temporary pattern of the leasing benefits for the user. Contingent rentals are recognized as expenses in the periods in which they are incurred.
| g. | Revenue Recognition from the Activity of Electricity Commercialization—Revenue is measured at the fair value of the consideration received or receivable. Revenue is recognized when it is probable that the economic benefits associated to the transaction flow to the Company and the amount of the revenue can be reliably measured. Its main activity is the sale of electricity. |
Sale of Energy
The revenue for selling power is recorded through the earnings method, through invoicing and the sales estimates for the energy delivered to their clients on the date reported. On the following month these estimates are invoiced and collected from the corresponding clients according to the Economic Transactions or the Wholesale Market Administrator.
| h. | Legal Reserve—In conformity with the Commerce Code of Guatemala, all mercantile Companies must allocate on an annual basis five per cent of their net profits to constitute the legal reserve, which cannot be distributed as dividends until the Company is liquidated. However, this reserve can be capitalized when it becomes equivalent to, or represents more than 15 per cent of, the paid-in capital at the close of the previous period, notwithstanding continuing to reserve such 5% annually. |
F-460
Table of Contents
COMERCIALIZADORA GUATEMALTECA MAYORISTA DE ELECTRICIDAD, S. A.—GUATEMEL
NOTES TO THE FINANCIAL STATEMENTS
AS OF DECEMBER 31, 2015, 2014 AND 2013, AND FOR THE YEARS ENDED
DECEMBER 31, 2015 AND 2014
(Stated in US dollars, except otherwise indicated)
| 3. | SIGNIFICANT ACCOUNTING POLICIES (cont’d) |
| i. | Provision for Severance Compensation—In conformity with the Labor Code of the Republic of Guatemala, the Company is obligated to pay severance compensation to employees dismissed under certain circumstances, like reorganization, based on one-month salary plus the twelfth part of theirChristmas bonus and mid-year bonus for each year of service rendered. The policy of the Company is to pay this consideration as ordered by statute. The Company charges to profit or loss the severance payments when the employees are actually dismissed. |
The Company has no benefit plans defined for the retirement of the employees and no other post-retirement benefits.
| j. | Deposits Received from Customers—These are the cash funds received from the clients to whom the Company provides electricity. These advances are defined in an agreement between the Company and the clients, with the purpose to pay future possible lacks of payments and/or expenses for disassembly of the connections when ending the commercial relationship with the clients. Since the commercial relationship between the Company and its clients is ruled by joint agreements between the parts, such deposits are not subject to the regulations of the National Electricity Committee -CNEE. |
Deposits received from consumers, plus interest accrued and less any outstanding debt for past services, are refundable to the users when they cease using the electric energy service rendered by the Company.
Deposits received and interests accrued are recorded Deposits received from customers as “Principal from deposits received from consumers” and “Interests from deposits received from consumers”, respectively.
Deposits received from consumers, plus interest accrued and less any outstanding debt for past services, are refundable to the users when they cease using the electric energy service rendered by the Company. The Company has classified these deposits as current liabilities based on the facts that the Company do not have legal rights to defer this payment in a period that exceed a year. However, the Company do not anticipate making significant payments in the next year.
During the years ended on December 31, 2015, 2014 and 2013, no payment of interests took place.
| k. | Financial Instruments—Financial assets and liabilities are recognized when the Company becomes part of the contract provisions of the instrument. |
The financial assets and liabilities are measured initially at fair value. The costs of the transaction which are attributable directly to the acquisition or issuance of financial assets and liabilities (different from the financial assets and liabilities measured at a fair value through profit or loss) are added or deducted from the fair value of the financial assets or liabilities, if appropriate, at their initial recognition. The costs of the transaction attributable directly to the acquisition of financial assets and liabilities measured at a fair value through profit or loss are recognized immediately in profit or losses.
F-461
Table of Contents
COMERCIALIZADORA GUATEMALTECA MAYORISTA DE ELECTRICIDAD, S. A.—GUATEMEL
NOTES TO THE FINANCIAL STATEMENTS
AS OF DECEMBER 31, 2015, 2014 AND 2013, AND FOR THE YEARS ENDED
DECEMBER 31, 2015 AND 2014
(Stated in US dollars, except otherwise indicated)
| 3. | SIGNIFICANT ACCOUNTING POLICIES (cont’d) |
Financial Assets
Financial assets are classified within the following categories: financial assets “at fair value through profit or loss’ (FVTPL)”, “held-to-maturity’ investments” “financial assets available for sale”, and “loans and receivable”. Classification depends on the nature and purpose of the financial assets and is determined at the initial recognition. All regular purchases or sales of financial assets are recognized and derecognized on a trade date basis. Regular purchases or sales are those purchases or sales of financial assets that require the delivery of assets within the time frame established by a market regulation or agreement.
Effective Interest Rate Method
The effective interest rate method is a calculation method of the amortized cost of a financial instrument and the allocation of the financial income throughout the relevant period. The effective interest rate is the rate that exactly discounts estimated future cash receipts or paid (including commissions, basic points of interests paid or received, transaction costs and other premiums or discounts included in the calculation of the effective interest rate) throughout the expected life of the financial instrument or, when appropriate, in a shorter period, with the net carrying amount at the initial recognition.
Income is recognized on the basis of the effective interest rate for debt instruments different from the financial assets classified at a fair value through profit or loss.
Income from Interest
Income from interests of a financial asset is recognized when it is probable that the Company receives the economic benefits associated to the transaction and the amount of the income from ordinary activities can be reliably measured. Income from interests are accrued on a time basis with reference to the outstanding capital and the effective interest rate applicable, which is the discount rate that equals exactly the cash flow receivable or payable estimated throughout the expected life of the financial instrument with the net book value of the financial asset at the initial recognition.
Loans and Receivables
Loans and receivables are non-derivative financial assets with fixed or determinable payments that are not quoted in an active market. Loans and receivable (including trade receivables, other receivables, among others) are measured at an amortized cost using the effective interest method in force, less any impairment. The income from interest is recognized by applying the effective interest rate, except for short term receivable accounts when the effect of discounting is immaterial.
The interest income is recognized when applying the interest rate in force, except for the short term accounts receivable, if no discount is made it will not be of importance.
F-462
Table of Contents
COMERCIALIZADORA GUATEMALTECA MAYORISTA DE ELECTRICIDAD, S. A.—GUATEMEL
NOTES TO THE FINANCIAL STATEMENTS
AS OF DECEMBER 31, 2015, 2014 AND 2013, AND FOR THE YEARS ENDED
DECEMBER 31, 2015 AND 2014
(Stated in US dollars, except otherwise indicated)
| 3. | SIGNIFICANT ACCOUNTING POLICIES (cont’d) |
Impairment of Financial Assets
The financial assets other than those measured at a fair value through profit or loss are assessed for indicators of impairment at the end of each reporting period. A financial asset considered to be impaired when there is objective evidence that as a consequence of one or more events occurred after the initial recognition of the financial asset, the estimated future cash flows of the financial assets have been affected.
For certain categories of financial assets, such as trade receivable, asset are assessed for impairment on a collective basis even if they were assessed not to be impaired individually. Within the objective evidence in case of an impaired receivables portfolio, it could be included the past experience of the Company regarding the collection of payments, an increase of the number of late payments in the portfolio that exceed the average credit period of 60 days, as well as the observable changes in the local and national economic conditions that relate with default on receivables.
For the financial assets carried at the amortized cost, the amount from impairment loss is the difference between the carrying amount and the present value of the estimated future cash flow of the asset, discounted at the original effective interest rate of the financial asset.
The carrying amount of the financial asset is reduced by the impairment loss directly for all the financial assets except for the trade receivable, where the carrying amount is reduced through an allowance account. When it is considered that a commercial account receivable is uncollectable, it is thus written off against the allowance account. The subsequent recovery of the amounts previously written off, turns into credits against the allowance account. Changes in the carrying amount of the allowance account are recognized in the profit or loss.
Derecognition of Financial Assets
The Company derecognizes financial asset when the contractual rights on the cash flow of the financial asset expire, or when it transfers the financial asset and substantially all the risks and rewards of ownership of the asset to another party. If the Company does not transfer nor retains substantially all the risks and rewards inherent to the ownership and continues to control the transferred asset, the Company will recognize its participation in the asset and the relevant obligation for the amounts payable. If the Company retains substantially all the risks and advantages inherent to the ownership of a transferred financial asset, the Company will recognize the financial asset and also will recognize a collateral loan for the proceeds received.
On derecognition of a financial asset in its entirety, the difference between the carrying amount of the asset and the sum of the received consideration and to be received, as well as the accumulated gain or loss that had been recognized in other comprehensive income and accumulated in equity is recognized in profit or loss.
F-463
Table of Contents
COMERCIALIZADORA GUATEMALTECA MAYORISTA DE ELECTRICIDAD, S. A.—GUATEMEL
NOTES TO THE FINANCIAL STATEMENTS
AS OF DECEMBER 31, 2015, 2014 AND 2013, AND FOR THE YEARS ENDED
DECEMBER 31, 2015 AND 2014
(Stated in US dollars, except otherwise indicated)
| 3. | SIGNIFICANT ACCOUNTING POLICIES (cont’d) |
On derecognition of a financial assets other than in its entirety (e.g., when the Company retains the option to reacquire part of a transferred asset), the Company allocates the previous carrying amount of the financial asset between the part still recognized under continuous involvement and the part that it no longer recognizes on the basis of the relative fair value of those parts at the date of the transfer. The difference between the carrying amount allocated to the part that will not be recognized anymore and the sum of the consideration received from the part that will no more be recognized and any accumulated profit or loss allocated that would have been recognized in other comprehensive income is recognized in profit or loss. The accumulated profit or loss that would had been recognized in other comprehensive income is distributed between the part that remains being recognized and the part that will not be recognized anymore based on the fair values related to both parts.
Financial Liabilities and Equity Instruments
Classification as Debt or Equity
Debt and equity instruments are classified as financial liabilities or as equity in conformity with the substance of the contractual agreement and the definitions of financial liability and equity instrument.
Financial Liabilities
Financial liabilities (including loans and commercial accounts payable and others) are measured subsequently at the amortized cost using the effective interest rate method.
The effective interest rate method is a calculation method of the amortized cost of a financial liability and of the allocation of a financial expense throughout the relevant period. The effective interest rate is the rate that exactly discounts estimated future cash receipts or paid (including the fees and points paid or received that form part of the effective interest rate, the transaction cost and other premiums or discounts) estimated throughout the expected life of the financial liability (or, when appropriate), in a shorter period with the net carrying amount at its initial recognition.
Derecognition of a Financial Liability
The Company derecognizes a financial liability if solely the Company’s obligations have expire or have been cancelled. The difference between the book valued of the derecognized financial liability and the consideration paid and payable are recognized in income.
| l. | Income Tax—The expense for the Income tax of the fiscal year is calculated in relation to the economic result before taxes, increased or reduced, as corresponds, by non-deductible expenses, income exemptions and non-taxable items. As of December 31, 2015, 2014 and 2013 there were no temporary differences that generate a deferred income tax. |
| m. | Cash and Cash Equivalents—Includes balances in cash and banks. Balances in banks are available on demand and there is no restriction that limits their use. |
F-464
Table of Contents
COMERCIALIZADORA GUATEMALTECA MAYORISTA DE ELECTRICIDAD, S. A.—GUATEMEL
NOTES TO THE FINANCIAL STATEMENTS
AS OF DECEMBER 31, 2015, 2014 AND 2013, AND FOR THE YEARS ENDED
DECEMBER 31, 2015 AND 2014
(Stated in US dollars, except otherwise indicated)
| 4. | MONETARY UNIT AND EXCHANGE RATE |
The currency in Guatemala is the Quetzal, represented by the symbol “Q” in the financial statements.
The Bank of Guatemala, entity authorized by the Monetary Board to implement its monetary, exchange and credit policies, publishes periodically the reference exchange rate to be used in the banking system. According to Resolution JM 31-2010 dated March 18, 2010, the method to determine the exchange rate consists on using the weighted average exchange rate of the total sum of the purchase and sale of foreign currency carried out daily by the institutions that constitute the institutional foreign currency market. As of December 31, 2015, 2014 and 2013 the reference exchange rate published by the Bank of Guatemala was Q. 7.63, Q. 7.60 and Q. 7.84 respectively, per US$ 1.
There are no exchange restrictions in Guatemala for the capital repatriation, payment of debts or any other purpose; foreign currency can be freely negotiated in any amount in the banks of the system or in authorized exchange offices, in conformity with the statutory regulation in force, according to Decree 94-2000 Free Foreign Currency Negotiation Act.
| 5. | ENERGY PURCHASES |
The energy purchases during the years ended December 31, 2015, 2014 and 2013 were performed to the following suppliers:
2015 | 2014 | 2013 | ||||||||||
Contracts with suppliers | US$ | 4,741,556 | US$ | 7,265,134 | US$ | 8,551,709 | ||||||
In the electricity spot market | 2,703,452 | 5,618,448 | 9,707,895 | |||||||||
|
|
|
|
|
| |||||||
| US$ | 7,445,008 | US$ | 12,883,582 | US$ | 18,259,604 | |||||||
|
|
|
|
|
| |||||||
| 6. | OTHER COST OF SALES |
The other cost of sales for the years ended on December 31, 2015, 2014 and 2013 are shown as follows:
2015 | 2014 | 2013 | ||||||||||
Other taxes | US$ | 50,240 | US$ | 194,593 | US$ | 65,778 | ||||||
Depreciations and amortizations | 1,445 | 3,934 | 7,058 | |||||||||
|
|
|
|
|
| |||||||
| US$ | 51,685 | US$ | 198,527 | US$ | 72,836 | |||||||
|
|
|
|
|
| |||||||
F-465
Table of Contents
COMERCIALIZADORA GUATEMALTECA MAYORISTA DE ELECTRICIDAD, S. A.—GUATEMEL
NOTES TO THE FINANCIAL STATEMENTS
AS OF DECEMBER 31, 2015, 2014 AND 2013, AND FOR THE YEARS ENDED
DECEMBER 31, 2015 AND 2014
(Stated in US dollars, except otherwise indicated)
| 7. | OTHER INCOME |
The items comprising the other income for the years ended December 31, 2015, 2014 and 2013, are detailed as follows:
2015 | 2014 | 2013 | ||||||||||
Leasing of vehicles a/ | US$ | 332,333 | US$ | — | US$ | — | ||||||
Profit in sale of fixed assets | 4,610 | — | 38,239 | |||||||||
Non-commercial bills | — | 8,983 | — | |||||||||
Other income | 44,670 | 1,025 | — | |||||||||
|
|
|
|
|
| |||||||
| US$ | 381,613 | US$ | 10,008 | US$ | 38,239 | |||||||
|
|
|
|
|
| |||||||
| a/ | The income belongs to the leasing of vehicles to Distribuidora de Electricidad de Occidente, S. A. and Distribuidora de Electricidad de Oriente, S. A. (Notes 13 and 22). |
| 8. | FINANCIAL INCOME |
Financial income for the years ended December 31, 2015, 2014 and 2013 are shown as follows:
2015 | 2014 | 2013 | ||||||||||
Interest income | US$40,250 | US$46,954 | US$60,065 | |||||||||
Exchange differences | 3,662 | — | — | |||||||||
|
|
|
|
|
| |||||||
| US$ | 43,912 | US$ | 46,954 | US$ | 60,065 | |||||||
|
|
|
|
|
| |||||||
| 9. | GENERAL, SELLING AND ADMINISTRATIVE EXPENSES |
Selling, general and administrative expenses for the years ended on December 31, 2015, 2014 and 2013 are shown as follows:
2015 | 2014 | 2013 | ||||||||||
Employee expenses a/ | US$ | 161,299 | US$ | 98,536 | US$ | 84,173 | ||||||
Other taxes | 143,642 | 46,451 | 377 | |||||||||
Depreciations and amortizations | 47,145 | 3,438 | — | |||||||||
Repairment and maintenance of vehicles | 31,394 | — | 959 | |||||||||
Fees | 15,643 | 11,531 | 14,139 | |||||||||
Leasing | 4,489 | 12,562 | 6,845 | |||||||||
Trip expenses | 4,723 | 567 | 673 | |||||||||
Supplies | 2,110 | 225 | 1,252 | |||||||||
Operation fees b/ | — | 1,857,638 | 2,402,941 | |||||||||
Other expenses | 24,755 | 23,700 | 17,624 | |||||||||
|
|
|
|
|
| |||||||
| US$ | 435,200 | US$ | 2,054,648 | US$ | 2,528,983 | |||||||
|
|
|
|
|
| |||||||
F-466
Table of Contents
COMERCIALIZADORA GUATEMALTECA MAYORISTA DE ELECTRICIDAD, S. A.—GUATEMEL
NOTES TO THE FINANCIAL STATEMENTS
AS OF DECEMBER 31, 2015, 2014 AND 2013, AND FOR THE YEARS ENDED
DECEMBER 31, 2015 AND 2014
(Stated in US dollars, except otherwise indicated)
| 9. | GENERAL, SELLING AND ADMINISTRATIVE EXPENSES (cont’d) |
| a/ | The personnel expenses for the years ended on December 31, 2015, 2014 and 2013 are shown as follows: |
2015 | 2014 | 2013 | ||||||||||
Wages and related expenses | US$ | 147,146 | US$ | 90,782 | US$ | 76,906 | ||||||
Social security | 14,153 | 7,754 | 7,267 | |||||||||
|
|
|
|
|
| |||||||
| US$ | 161,299 | US$ | 98,536 | US$ | 84,173 | |||||||
|
|
|
|
|
| |||||||
| b/ | Service Agreement with Arthasan, S.A., (related party) for management and administration services for the business of the Company. In 2015 this contract was in force; however, there were no expenses accrued related to it because there was no actual service received by GUATEMEL during 2015. As such, in January 2016 the contract was cancelled (Note 25). |
| 10. | INCOME TAX |
Income tax of the year is made up as follows:
Tax on profit recognized in profit or loss of the year:
2015 | 2014 | 2013 | ||||||||||
Current Income Tax | US$ | 80,517 | US$ | 16,348 | US$ | 551,240 | ||||||
|
|
|
|
|
| |||||||
Income tax legislation currently in force in 2015, 2014 and 2013—Since January 1, 2013, new rules for income tax are in effect and are included on Book 1 of The Law of Fiscal Actualization, Decree 10-2012. This new rules take into account two regimes to pay the tax, and are in effect from the year ended December 31, 2013:
| a) | Regime on Earnings from Profit Activities which consists on applying a rate of 25% in 2015 (28% in 2014, 31% in 2013) on the taxable income determined from the accounting profit. Tax is paid through quarterly advance payments with final determination at year-end. |
| b) | Simplified Optional Regime on Income from Profit Activities consisting on applying the rate of 7% to the total amount of taxable income. The first US$ 3,931 (equivalent to 30,000 Quetzales) of the monthly taxable income pay a 5% tax while the taxable income in excess of such amount should pay at the 7% rate. |
For the years ended December 31, 2015, 2014 and 2013, the Company has chosen the Regime on Earnings from Profit Activities.
New regulations to income tax establish a tax of 5% on the dividend and profit distributions for both residents and non-residents.
In addition, a new Regime on Capital Gains and Losses, which sets out a rate of 10% for capital gains related to capital or property investments, as well as net capital gains.
F-467
Table of Contents
COMERCIALIZADORA GUATEMALTECA MAYORISTA DE ELECTRICIDAD, S. A.—GUATEMEL
NOTES TO THE FINANCIAL STATEMENTS
AS OF DECEMBER 31, 2015, 2014 AND 2013, AND FOR THE YEARS ENDED
DECEMBER 31, 2015 AND 2014
(Stated in US dollars, except otherwise indicated)
| 10. | INCOME TAX (cont’d) |
As of December 31, 2015, 2014 and 2013, the reconciliation of the income tax expense calculated at the statutory income tax rate and the income taxes recorded in the statement of profit or loss is as follows:
2015 | 2014 | 2013 | ||||||||||
Income (Loss) before Income Tax | US$ | 417,716 | US$ | (390,207 | ) | US$ | (222,838 | ) | ||||
|
|
|
|
|
| |||||||
Plus | ||||||||||||
Non-deductible expenses a/ | 1,624 | 500,766 | 2,056,699 | |||||||||
Less | ||||||||||||
Gain on sale of property, plant and equipment | (4,610 | ) | — | — | ||||||||
Other effects from income not subject to income tax | (12,262 | ) | — | — | ||||||||
Non-taxable banking interest | (40,250 | ) | (52,171 | ) | (66,739 | ) | ||||||
|
|
|
|
|
| |||||||
Taxable income | 362,218 | 58,388 | 1,767,122 | |||||||||
Tax rate | 25 | % | 28 | % | 31 | % | ||||||
|
|
|
|
|
| |||||||
Income tax charge at the statutory tax rate (25% for 2015 and 28% for 2014 and 31% for 2013) | 90,554 | 16,348 | 547,808 | |||||||||
Income tax on capital gains | 461 | — | — | |||||||||
Difference between income tax estimate and actual income tax of the previous year | (10,498 | ) | — | 3,432 | ||||||||
|
|
|
|
|
| |||||||
Income Tax expense as charged to profit or loss | US$ | 80,517 | US$ | 16,348 | US$ | 551,240 | ||||||
|
|
|
|
|
| |||||||
| a/ | As of December 31, 2015, 2014 and 2013, the non-deductible expenses recognized during the year in order to determine the taxable income, given its nature it is integrated as follows: |
2015 | 2014 | 2013 | ||||||||||
Non-deductible expenses from transactions with related parties | US$ | — | US$ | 371,436 | US$ | 1,991,819 | ||||||
Exchange differences | — | — | 64,880 | |||||||||
Others expenses (i) | 1,624 | — | — | |||||||||
Other expenses not-related to taxable income | — | 84,491 | — | |||||||||
Value Added Tax recognized in expense | — | 44,839 | — | |||||||||
|
|
|
|
|
| |||||||
| US$ | 1,624 | US$ | 500,766 | US$ | 2,056,699 | |||||||
|
|
|
|
|
| |||||||
Other Important Changes Contained in the Regulations of the Income Tax in Effect from January 2013 are:
The special regulations of value among related parties originally came into effect since January 1, 2013. This regulations oblige all the taxpayers having transactions with related parties, non-resident in Guatemala, that impact the taxable base, to determine the prices of these transactions according to the Principle of Free Competition and that they document it in a Survey of Transfer Pricing. However, Section 27 of Decree 19-2013, published on December 20, 2013, suspended the application and validity of these regulations and established that the same are taking effect again and applied on January 1, 2015.
F-468
Table of Contents
COMERCIALIZADORA GUATEMALTECA MAYORISTA DE ELECTRICIDAD, S. A.—GUATEMEL
NOTES TO THE FINANCIAL STATEMENTS
AS OF DECEMBER 31, 2015, 2014 AND 2013, AND FOR THE YEARS ENDED
DECEMBER 31, 2015 AND 2014
(Stated in US dollars, except otherwise indicated)
| 10. | INCOME TAX (cont’d) |
GUATEMEL determined that it does not have transactions with related foreign companies subject to the regulation of transfer pricing.
Solidarity Tax (ISO, in Spanish):
On December 22, 2008, Decree No. 73-2008 was published “Solidarity Tax Act”—ISO, in Spanish. This tax affects companies having their own equity carrying out mercantile or farming activities and obtaining a gross margin greater than 4% of their gross income. The taxable period is on quarterly basis and is calculated and paid per calendar quarter. This tax is complementary of Income tax and any credit generated during the year (when the ISO tax is greater than the Income tax) can be utilized for future income tax payments within the three following years. The tax base for this tax is the greater between:
| a) | One-fourth of the amount of net asset; or |
| b) | One-fourth of gross income. |
In the case of tax payers whose net assets are greater than four (4) times their gross income, the applicable tax base shall be the one established in letter b) above; and the applicable tax rate is 1%.
ISO and Income Tax can be credited between them as follows:
| a. | ISO, paid during the four calendar quarters of the year can be credited to the payment of Income Tax until its exhaustion, during the next three calendar years, either paid in monthly or quarterly payments, or liquidated annually, as the case may be. |
| b. | Quarterly payments of Income Tax can be credited to the ISO payment during the same calendar year. Companies choosing this credit method could change only with the Tax Authorities’ approval. |
ISO remainder that cannot be credited must be considered as deductible expense for Income Tax purposes from the period of annual definitive liquidation in which the abovementioned three years are concluded.
ISO credit method authorized by the Tax Authorities is option b).
| 11. | CASH AND CASH EQUIVALENTS |
As of December 31, 2015, 2014 and 2013 cash and cash equivalents is composed as follows:
2015 | 2014 | 2013 | ||||||||||
Banks in local currency | US$ | 1,082,307 | US$ | 975,197 | US$ | 1,483,609 | ||||||
Banks in foreign currency | 166,389 | 91,548 | 500,662 | |||||||||
Cash on hand | 66 | 66 | 64 | |||||||||
|
|
|
|
|
| |||||||
| US$ | 1,248,762 | US$ | 1,066,811 | US$ | 1,984,335 | |||||||
|
|
|
|
|
| |||||||
F-469
Table of Contents
COMERCIALIZADORA GUATEMALTECA MAYORISTA DE ELECTRICIDAD, S. A.—GUATEMEL
NOTES TO THE FINANCIAL STATEMENTS
AS OF DECEMBER 31, 2015, 2014 AND 2013, AND FOR THE YEARS ENDED
DECEMBER 31, 2015 AND 2014
(Stated in US dollars, except otherwise indicated)
| 12. | TRADE RECEIVABLES |
As of December 31, 2015, 2014 and 2013, the balance of trade receivables is comprised as follows:
2015 | 2014 | 2013 | ||||||||||
Clients—Energy usersa/ | US$ | 633,087 | US$ | 1,083,985 | US$ | 1,745,373 | ||||||
|
|
|
|
|
| |||||||
| a/ | The aging of trade account balances is the following: |
2015 | 2014 | 2013 | ||||||||||
Current | US$ | 90,634 | US$ | 256,177 | US$ | 138,406 | ||||||
Past due: | ||||||||||||
From 31 to 60 days | 30,164 | 37,061 | 31,598 | |||||||||
From 61 to 120 days | 3,100 | 10,501 | 1,492 | |||||||||
More than 121 daysb/ | 57,394 | 26,353 | 73,667 | |||||||||
|
|
|
|
|
| |||||||
Total | 181,292 | 330,092 | 245,163 | |||||||||
Energy consumption not billedc/ | 474,019 | 776,222 | 1,521,843 | |||||||||
|
|
|
|
|
| |||||||
| 655,311 | 1,106,314 | 1,767,006 | ||||||||||
Less: | ||||||||||||
Allowance for uncollectable accountsd/ | (22,224 | ) | (22,329 | ) | (21,633 | ) | ||||||
|
|
|
|
|
| |||||||
Total clients | US$ | 633,087 | US$ | 1,083,985 | US$ | 1,745,373 | ||||||
|
|
|
|
|
| |||||||
The average credit period is 30 days.
| b/ | The Company has recorded an allowance for uncollectable accounts, over a balance from a client that is no longer on business. |
| c/ | Corresponds to the estimated amount for services rendered not billed for sale of electricity as of December 31, 2015, 2014 and 2013. The corresponding invoices are issued and due in the following month. |
| d/ | The movement of the allowance for uncollectable accounts as of December 31, 2015, 2014 and 2013 is shown as follows: |
2015 | 2014 | 2013 | ||||||||||
Balance at the beginning of the year | US$ | 22,329 | US$ | 21,632 | US$ | 21,465 | ||||||
Translation differences | (105 | ) | 697 | 168 | ||||||||
|
|
|
|
|
| |||||||
Balance at the end of the year | US$ | 22,224 | US$ | 22,329 | US$ | 21,633 | ||||||
|
|
|
|
|
| |||||||
| 13. | RELATED PARTIES |
Comercializadora Guatemalteca Mayorista de Electricidad. S. A. is a member of a group of related parties with which it holds transactions, mainly for the payment of toll and the collection of the value added service for energy commercialization.
F-470
Table of Contents
COMERCIALIZADORA GUATEMALTECA MAYORISTA DE ELECTRICIDAD, S. A.—GUATEMEL
NOTES TO THE FINANCIAL STATEMENTS
AS OF DECEMBER 31, 2015, 2014 AND 2013, AND FOR THE YEARS ENDED
DECEMBER 31, 2015 AND 2014
(Stated in US dollars, except otherwise indicated)
| 13. | RELATED PARTIES (cont’d) |
Accounts Receivable and Payable—The balances for accounts receivable and payable to related parties as of December 31, 2015, 2014 and 2013 are detailed as follows:
2015 | 2014 | 2013 | ||||||||||
Accounts receivable—short term | ||||||||||||
Distribuidora de Electricidad de Occidente, S.A. | US$ | 65,658 | US$ | — | US$ | — | ||||||
Distribuidora de Electricidad de Oriente, S.A. | 58,441 | — | — | |||||||||
Redes Eléctricas de Centroamérica, S. A. (RECSA)a/ | — | 1,316,352 | 1,275,288 | |||||||||
Generación Limpia Guatemala, S. A.b/ | — | 427,815 | 178,540 | |||||||||
|
|
|
|
|
| |||||||
| US$ | 124,099 | US$ | 1,744,167 | US$ | 1,453,828 | |||||||
|
|
|
|
|
| |||||||
Accounts receivable—long term | ||||||||||||
Redes Eléctricas de Centroamérica, S.A. (RECSA)a/ | US$ | 1,144,387 | US$ | — | US$ | — | ||||||
|
|
|
|
|
| |||||||
Accounts payable | ||||||||||||
Distribuidora de Electricidad de Occidente, S.A.c/ | US$ | 7,553 | US$ | 7,589 | US$ | — | ||||||
|
|
|
|
|
| |||||||
| a/ | As of December 31, 2014 and 2013, the account receivable represents a loan provided to RECSA through a promissory note for US$ 1,316,352 and US$ 1,275,288, respectively, that did not earn interest and was renewed each month for a 30-day term. On December 31, 2015, the Company gave an extension to the due date previously agreed with RECSA and, as such, the note’s new maturity date will be on December 31, 2017. As of December 31, 2015, the Company recorded this note at its discounted amount of US$ 1,144,387. As such, the Company recognized the effect of the refinancing with a charge recorded directly to equity for US$ 165,318. |
| b/ | To settle this account receivable held as of December 31, 2014 and 2013, on December 18, 2015, Comercializadora Guatemalteca Mayorista de Electricidad, S.A., signed a debt relief agreement with Generación Limpia Guatemala, S.A. (related company as of that date) through which the Company recognized a charge of US$ 357,734 (recognized directly to equity in the current year as an equity transaction), which represents the amount of the balance as of December 31, 2014 (US$ 427,815) plus US$ 208,996 of a loan provided to Generación Limpia Guatemala, S.A., less a collection of receivables assignment agreement on behalf of the Company for US$. 209,302 (Note 15) and cash received for US$ 47,345. |
| c/ | Balances to be paid for the purchase of materials to Distribuidora de Electricidad de Occidente, S.A. |
The amounts outstanding are unsecured and will be settled in cash. No guarantees have been given or received.
F-471
Table of Contents
COMERCIALIZADORA GUATEMALTECA MAYORISTA DE ELECTRICIDAD, S. A.—GUATEMEL
NOTES TO THE FINANCIAL STATEMENTS
AS OF DECEMBER 31, 2015, 2014 AND 2013, AND FOR THE YEARS ENDED
DECEMBER 31, 2015 AND 2014
(Stated in US dollars, except otherwise indicated)
| 13. | RELATED PARTIES (cont’d) |
The financial statements include the following transactions with related parties:
2015 | 2014 | 2013 | ||||||||||
Charges received from toll servicesa/ | ||||||||||||
Distribuidora de Electricidad de Oriente, S.A. | US$ | 926,713 | US$ | 1,518,316 | US$ | 2,097,475 | ||||||
Redes Eléctricas de Centroamérica, S.A. | 124,682 | 41,385 | 10,983 | |||||||||
Distribuidora de Electricidad de Occidente, S.A. | 44,111 | — | — | |||||||||
|
|
|
|
|
| |||||||
| US$ | 1,095,506 | US$ | 1,559,701 | US$ | 2,108,458 | |||||||
|
|
|
|
|
| |||||||
Loans provided | ||||||||||||
Generación Limpia Guatemala, S.A. | US$ | 208,996 | US$ | 239,174 | US$ | 433,598 | ||||||
|
|
|
|
|
| |||||||
Purchase of materials | ||||||||||||
Distribuidora de Electricidad de Occidente, S.A. | US$ | — | US$ | 7,453 | US$ | — | ||||||
|
|
|
|
|
| |||||||
Operation Fee | ||||||||||||
Arthasan, S.A.b/ | US$ | — | US$ | 1,857,638 | US$ | 2,402,941 | ||||||
|
|
|
|
|
| |||||||
Vehicles leasing: | ||||||||||||
Distribuidora de Electricidad de Occidente, S.A. | US$ | 180,014 | US$ | — | US$ | — | ||||||
Distribuidora de Electricidad de Oriente, S.A. | 152,319 | — | — | |||||||||
|
|
|
|
|
| |||||||
| US$ | 332,333 | US$ | — | US$ | — | |||||||
|
|
|
|
|
| |||||||
Vehicles sales: | ||||||||||||
Distribuidora de Electricidad de Occidente, S.A. | US$ | 10,450 | US$ | — | US$ | — | ||||||
Distribuidora de Electricidad de Oriente, S.A. | 10,450 | — | — | |||||||||
|
|
|
|
|
| |||||||
| US$ | 20,900 | US$ | — | US$ | — | |||||||
|
|
|
|
|
| |||||||
Discount on accounts receivable charged directly to equity | ||||||||||||
Redes Eléctricas de Centroamérica, S.A. | US$ | 165,318 | US$ | — | US$ | — | ||||||
|
|
|
|
|
| |||||||
Write-off of receivables charged directly to equity | ||||||||||||
Generación Limpia Guatemala S.A. | US$ | 357,734 | US$ | — | US$ | — | ||||||
|
|
|
|
|
| |||||||
Cash transfers charged directly to equity | ||||||||||||
Arthasan S.A. | US$ | — | US$ | — | US$ | 1,323,404 | ||||||
|
|
|
|
|
| |||||||
Energy sales headquarters | ||||||||||||
Distribuidora de Electricidad de Occidente, S.A. | US$ | — | US$ | — | US$ | 142,121 | ||||||
|
|
|
|
|
| |||||||
| a/ | Corresponds to the payment for using the distribution and transmission network of related companies to carry the energy to the facilities of the Companies’ clients. The price is determined through the Economic Transactions Report and settled through the Economic Transaction Report and settled through the Wholesale Market Administrator. |
| b/ | Management and direction service agreement for the business of the Company. In 2015 this agreement was in force; however, there were no expenses accrued related to it because there was no actual service received by GUATEMEL during 2015. In January 2016, the contract was cancelled (Note 25). |
F-472
Table of Contents
COMERCIALIZADORA GUATEMALTECA MAYORISTA DE ELECTRICIDAD, S. A.—GUATEMEL
NOTES TO THE FINANCIAL STATEMENTS
AS OF DECEMBER 31, 2015, 2014 AND 2013, AND FOR THE YEARS ENDED
DECEMBER 31, 2015 AND 2014
(Stated in US dollars, except otherwise indicated)
| 13. | RELATED PARTIES (cont’d) |
In addition, during 2014 and 2013, GUATEMEL executive officers did not receive compensation directly from GUATEMEL; each was also an executive officer of Arthasan, S. A. and received compensation directly from Arthasan, S. A. The aggregate annual compensation expenses related to GUATEMEL executive officers during 2014 and 2013 were US$ 1,857,638 and US$ 2,402,941, respectively. Since January 2015 the above mentioned activities were carried out directly by the Company’s key management.
The remuneration of members of key management personnel during the year was as follows:
2015 | 2014 | 2013 | ||||||||||
Short-term benefits | US$ | 135,015 | US$ | 68,289 | US$ | 84,375 | ||||||
|
|
|
|
|
| |||||||
The remuneration of key executives is determined by the CEO based on fixed contracts, and does not depend upon financial performance.
| 14. | TAX ASSETS AND LIABILITIES |
As of December 31, 2015, 2014 and 2013, tax assets and liabilities is composed as follows:
2015 | 2014 | 2013 | ||||||||||
Tax assets | ||||||||||||
Credit withholdings VAT | US$ | 933,467 | US$ | 937,844 | US$ | 908,587 | ||||||
Value Added Tax receivable | 741,684 | 766,150 | 752,592 | |||||||||
Solidarity Tax—ISO | 54,830 | 55,087 | 53,368 | |||||||||
Advance payments of Income Tax | 167,046 | 173,895 | — | |||||||||
Others | 3,317 | 3,333 | 4,144 | |||||||||
|
|
|
|
|
| |||||||
Total | US$ | 1,900,344 | US$ | 1,936,309 | US$ | 1,718,691 | ||||||
Less | ||||||||||||
Current tax assets | US$ | (58,147 | ) | US$ | (58,420 | ) | US$ | (4,144 | ) | |||
|
|
|
|
|
| |||||||
Non-current tax assets | US$ | 1,842,197 | US$ | 1,877,889 | US$ | 1,714,547 | ||||||
|
|
|
|
|
| |||||||
Tax liabilities | ||||||||||||
Income Tax liability | US$ | 45,525 | US$ | 16,646 | US$ | 172,918 | ||||||
Value Added Tax withholdings —VAT | 6,990 | 6,229 | 17,856 | |||||||||
Income Tax withholdings payable | 1,573 | 2,348 | 4,914 | |||||||||
|
|
|
|
|
| |||||||
| US$ | 54,088 | US$ | 25,223 | US$ | 195,688 | |||||||
|
|
|
|
|
| |||||||
| 15. | OTHER RECEIVABLES |
As of December 18, 2015 Generación Limpia Guatemala, S.A., (related party on that date) signed an assignment of rights agreement on behalf of the Company. As a result of such agreement, the Company
F-473
Table of Contents
COMERCIALIZADORA GUATEMALTECA MAYORISTA DE ELECTRICIDAD, S. A.—GUATEMEL
NOTES TO THE FINANCIAL STATEMENTS
AS OF DECEMBER 31, 2015, 2014 AND 2013, AND FOR THE YEARS ENDED
DECEMBER 31, 2015 AND 2014
(Stated in US dollars, except otherwise indicated)
| 15. | OTHER RECEIVABLES (cont’d) |
has full power to demand and collect US$209,302 that a third party owed to Generación Limpia Guatemala, S.A. as part of the commercial relations. This amount was fully recovered on February 2016.
| 16. | PROPERTY, PLANT AND EQUIPMENT |
The composition and movement up to December 31, 2015, 2014 and 2013 of the items comprising the cost of the property, plant and equipment and its corresponding accumulated depreciation is as follows:
2015 | 2014 | 2013 | ||||||||||
Technical facilities | US$ | 559 | US$ | 843 | US$ | 1,089 | ||||||
Furniture and other equipment | 36,971 | 44,205 | 12,063 | |||||||||
Vehicles under financial lease | 367,278 | 416,510 | — | |||||||||
|
|
|
|
|
| |||||||
| US$ | 404,808 | US$ | 461,558 | US$ | 13,152 | |||||||
|
|
|
|
|
| |||||||
Movements during the year ended on December 31, 2015.
Year 2015 | Leasehold | Technical | Furniture | Vehicles | Total | |||||||||||||||
Description | ||||||||||||||||||||
Balance at beginning year 2015 | US$ | 4,452 | US$ | 2,764 | US$ | 81,019 | US$ | 420,010 | US$ | 508,245 | ||||||||||
Additions | — | — | 10,450 | — | 10,450 | |||||||||||||||
Disposals | — | — | (31,379 | ) | — | (31,379 | ) | |||||||||||||
Translation differences | (21 | ) | (13 | ) | (442 | ) | (1,960 | ) | (2,436 | ) | ||||||||||
|
|
|
|
|
|
|
|
|
| |||||||||||
Total cost | US$ | 4,431 | US$ | 2,751 | US$ | 59,648 | US$ | 418,050 | US$ | 484,880 | ||||||||||
|
|
|
|
|
|
|
|
|
| |||||||||||
Accumulate depreciation Balance at beginning of year 2015 | US$ | (4,452 | ) | US$ | (1,921 | ) | US$ | (36,814 | ) | US$ | (3,500 | ) | US$ | (46,687 | ) | |||||
Additions | — | (279 | ) | (1,166 | ) | (47,145 | ) | (48,590 | ) | |||||||||||
Disposals | — | — | 15,089 | — | 15,089 | |||||||||||||||
Translation differences | 21 | 8 | 214 | (127 | ) | 116 | ||||||||||||||
|
|
|
|
|
|
|
|
|
| |||||||||||
Total accumulated depreciation | US$ | (4,431 | ) | US$ | (2,192 | ) | US$ | (22,677 | ) | US$ | (50,772 | ) | US$ | (80,072 | ) | |||||
|
|
|
|
|
|
|
|
|
| |||||||||||
Carrying value at December 31, 2015 | US$ | — | US$ | 559 | US$ | 36,971 | US$ | 367,278 | US$ | 404,808 | ||||||||||
|
|
|
|
|
|
|
|
|
| |||||||||||
F-474
Table of Contents
COMERCIALIZADORA GUATEMALTECA MAYORISTA DE ELECTRICIDAD, S. A.—GUATEMEL
NOTES TO THE FINANCIAL STATEMENTS
AS OF DECEMBER 31, 2015, 2014 AND 2013, AND FOR THE YEARS ENDED
DECEMBER 31, 2015 AND 2014
(Stated in US dollars, except otherwise indicated)
| 16. | PROPERTY, PLANT AND EQUIPMENT (cont’d) |
Movements during the year that ended December 31, 2014:
Year 2014 | Leasehold | Technical | Furniture and | Vehicles | Total | |||||||||||||||
Description | ||||||||||||||||||||
Balance at beginning year 2014 | US$ | 4,313 | US$ | 2,678 | US$ | 44,120 | US$ | — | US$ | 51,111 | ||||||||||
Additions | — | — | 34,844 | 412,506 | 447,350 | |||||||||||||||
Disposals | — | — | — | — | — | |||||||||||||||
Translation differences | 139 | 86 | 2,055 | 7,504 | 9,784 | |||||||||||||||
|
|
|
|
|
|
|
|
|
| |||||||||||
Total cost | US$ | 4,452 | US$ | 2,764 | US$ | 81,019 | US$ | 420,010 | US$ | 508,245 | ||||||||||
|
|
|
|
|
|
|
|
|
| |||||||||||
Accumulate depreciation Balance at beginning of year 2014 | US$ | (4,313 | ) | US$ | (1,589 | ) | US$ | (32,057 | ) | US$ | — | US$ | (37,959 | ) | ||||||
Additions | — | (276 | ) | (3,658 | ) | (3,438 | ) | (7,372 | ) | |||||||||||
Disposals | — | — | — | — | — | |||||||||||||||
Translation differences | (139 | ) | (56 | ) | (1,099 | ) | (62 | ) | (1,356 | ) | ||||||||||
|
|
|
|
|
|
|
|
|
| |||||||||||
Total accumulated depreciation | US$ | (4,452 | ) | US$ | (1,921 | ) | US$ | (36,814 | ) | US$ | (3,500 | ) | US$ | (46,687 | ) | |||||
|
|
|
|
|
|
|
|
|
| |||||||||||
Carrying value at December 31, 2015 | US$ | — | US$ | 843 | US$ | 44,205 | US$ | 416,510 | US$ | 461,558 | ||||||||||
|
|
|
|
|
|
|
|
|
| |||||||||||
Year 2013 | Leasehold | Technical | Furniture and | Vehicles | Total | |||||||||||||||
Description | ||||||||||||||||||||
Balance at beginning year 2013 | US$ | 4,280 | US$ | 2,657 | US$ | 43,780 | US$ | — | US$ | 50,717 | ||||||||||
Additions | — | — | — | — | — | |||||||||||||||
Disposals | — | — | — | — | — | |||||||||||||||
Translation differences | 33 | 21 | 340 | — | 394 | |||||||||||||||
|
|
|
|
|
|
|
|
|
| |||||||||||
Total cost | US$ | 4,313 | US$ | 2,678 | US$ | 44,120 | US$ | — | US$ | 51,111 | ||||||||||
|
|
|
|
|
|
|
|
|
| |||||||||||
Accumulated depreciation Balance at beginning of year 2013 | US$ | (4,280 | ) | US$ | (1,307 | ) | US$ | (28,475 | ) | US$ | — | US$ | (34,062 | ) | ||||||
Additions | — | (272 | ) | (3,353 | ) | — | (3,625 | ) | ||||||||||||
Translation differences | (33 | ) | (10 | ) | (229 | ) | — | (272 | ) | |||||||||||
|
|
|
|
|
|
|
|
|
| |||||||||||
Total accumulated depreciation | US$ | (4,313 | ) | US$ | (1,589 | ) | US$ | (32,057 | ) | US$ | — | US$ | (37,959 | ) | ||||||
|
|
|
|
|
|
|
|
|
| |||||||||||
Carrying value at December 31, 2013 | US$ | — | US$ | 1,089 | US$ | 12,063 | US$ | — | US$ | 13,152 | ||||||||||
|
|
|
|
|
|
|
|
|
| |||||||||||
F-475
Table of Contents
COMERCIALIZADORA GUATEMALTECA MAYORISTA DE ELECTRICIDAD, S. A.—GUATEMEL
NOTES TO THE FINANCIAL STATEMENTS
AS OF DECEMBER 31, 2015, 2014 AND 2013, AND FOR THE YEARS ENDED
DECEMBER 31, 2015 AND 2014
(Stated in US dollars, except otherwise indicated)
| 16. | PROPERTY, PLANT AND EQUIPMENT (cont’d) |
| a/ | As of December 31, 2015, 2014 and 2013 the classification of furniture and other equipment is the following: |
2015 | 2014 | 2013 | ||||||||||
Tooling, furniture and equipment | US$ | 9,376 | US$ | 9,421 | US$ | 9,126 | ||||||
Information processing equipment | 14,959 | 15,029 | 14,560 | |||||||||
Transportation elements | 35,313 | 56,569 | 20,434 | |||||||||
|
|
|
|
|
| |||||||
| US$ | 59,648 | US$ | 81,019 | US$ | 44,120 | |||||||
|
|
|
|
|
| |||||||
| 17. | FINANCE LEASE PAYABLES |
As of December 31, 2015, 2014 and 2013, they are integrated as follows:
2015 | 2014 | 2013 | ||||||||||
Non-current finance lease | US$ | 127,738 | US$ | 280,007 | US$ | — | ||||||
Current finance lease | 139,350 | 128,336 | — | |||||||||
|
|
|
|
|
| |||||||
| US$ | 267,088 | US$ | 408,343 | US$ | — | |||||||
|
|
|
|
|
| |||||||
The Company carries out finance lease agreements for vehicles. The average term for the finance lease signed is 3 years.
Payable for finance lease
Minimum Lease Payments | Present Value of the Minimum | |||||||||||||||
2015 | 2014 | 2015 | 2014 | |||||||||||||
Within a year or less | US$ | 176,914 | US$ | 162,932 | US$ | 139,350 | US$ | 128,336 | ||||||||
Between one and three years | 162,172 | 355,488 | 127,738 | 280,007 | ||||||||||||
|
|
|
|
|
|
|
| |||||||||
| 339,086 | 518,420 | 267,088 | 408,343 | |||||||||||||
Minimum Lease Payments | Present Value of the Minimum Lease Payments | |||||||||||||||
2015 | 2014 | 2015 | 2014 | |||||||||||||
Less: Financial expenses | ||||||||||||||||
Interests payable | (44,469 | ) | (67,989 | ) | — | — | ||||||||||
Insurance payable | (27,529 | ) | (42,088 | ) | — | — | ||||||||||
|
|
|
|
|
|
|
| |||||||||
| (71,998 | ) | (110,077 | ) | — | — | |||||||||||
|
|
|
|
|
|
|
| |||||||||
Present value of the minimum lease payments | US$ | 267,088 | US$ | 408,343 | US$ | 267,088 | US$ | 408,343 | ||||||||
|
|
|
|
|
|
|
| |||||||||
The inherent interest rate for the finance lease for leasing is of a monthly 11.27% variable at the date of the agreement or the totality of the lease.
F-476
Table of Contents
COMERCIALIZADORA GUATEMALTECA MAYORISTA DE ELECTRICIDAD, S. A.—GUATEMEL
NOTES TO THE FINANCIAL STATEMENTS
AS OF DECEMBER 31, 2015, 2014 AND 2013, AND FOR THE YEARS ENDED
DECEMBER 31, 2015 AND 2014
(Stated in US dollars, except otherwise indicated)
| 17. | FINANCE LEASE PAYABLES (cont’d) |
The finance lease payable at the end of each year are not past due.
| 18. | TRADE AND OTHER PAYABLE |
The balance as of December 31, 2015, 2014 and 2013 is composed of as described below:
2015 | 2014 | 2013 | ||||||||||
Energy suppliers | US$ | 409,197 | US$ | 790,743 | US$ | 1,277,717 | ||||||
Service suppliers | 345,465 | 260,745 | 380,361 | |||||||||
|
|
|
|
|
| |||||||
| US$ | 754,662 | US$ | 1,051,488 | US$ | 1,658,078 | |||||||
|
|
|
|
|
| |||||||
The Company has an average of 60 day credit term with its suppliers. No interest is charged by the suppliers for delay in the payment.
| 19. | DEPOSITS RECEIVED FROM CUSTOMERS |
As of December 31, 2015, 2014 and 2013 deposits received from customers and its accumulated interests are shown as follows:
2015 | 2014 | 2013 | ||||||||||
Principal from deposits received from consumers | US$ | 53,954 | US$ | 54,207 | US$ | 77,328 | ||||||
Interests from deposits received from consumers | 30,079 | 27,510 | 24,983 | |||||||||
|
|
|
|
|
| |||||||
| US$ | 84,033 | US$ | 81,717 | US$ | 102,311 | |||||||
|
|
|
|
|
| |||||||
| 20. | CAPITAL STOCK |
As of December 31, 2015, 2014 and 2013 the authorized capital of the Company was US$ 31,345 (Q. 250,000), represented by 2,500 common shares, with a nominal value of US$ 12.54 (Q. 100) each, out of which 100% is subscribed and paid.
| 21. | LEGAL RESERVE |
In conformity with the Commerce Code of Guatemala, all mercantile Companies must separate on an annual basis at least 5% of their net profit to constitute the legal reserve, which cannot be distributed as dividends until the Company is liquidated. However, this reserve can be capitalized when it becomes equivalent to, or represent more than 15 percent of the paid-in capital at the close of the previous period, notwithstanding continuing to reserve such 5% reserve. The legal reserve as of December 2015, 2014 and 2013 amounts to US$ 352,180.
F-477
Table of Contents
COMERCIALIZADORA GUATEMALTECA MAYORISTA DE ELECTRICIDAD, S. A.—GUATEMEL
NOTES TO THE FINANCIAL STATEMENTS
AS OF DECEMBER 31, 2015, 2014 AND 2013, AND FOR THE YEARS ENDED
DECEMBER 31, 2015 AND 2014
(Stated in US dollars, except otherwise indicated)
| 22. | OPERATING LEASE RECEIVABLES |
The operating leases with Distribuidora de Electricidad de Occidente, S.A. and Distribuidora de Electricidad de Oriente, S.A. (related parties) are related with vehicles property of the Company under the non-extendable 34 month lease terms as from February 2015. The operating lease agreements set forth a fixed income during a term, and the lessee has no vehicle purchase option at the end of the lease term.
The income resulting from renting the vehicles, as well as the depreciation expenses are indicated in the notes 6 and 7, respectively.
The future projections of minimum receivables for those extended operating leasing contracts are as follows:
2015 | 2014 | 2013 | ||||||||||
Within a year | US$ | 303 | US$ | — | US$ | — | ||||||
|
|
|
|
|
| |||||||
From year 2 to year 5 | US$ | 144 | US$ | — | US$ | — | ||||||
|
|
|
|
|
| |||||||
| 23. | POWER PURCHASE AGREEMENTS |
The Company, during its normal course of business, celebrates power purchase agreements to supply the electricity to be delivered to its customers. As such, the Company has entered into several power purchase agreements for a certain quantity of energy at agreed prices for the next years, as described below. These agreements will not give rise to an actual obligation to purchase that energy in each year; hence, the Company pays for the electricity actually consumed.
The following terms are used in this note with the meanings specified:
Power backup warranty: It refers to the fact that the supplier guarantees with its power offer the power demand that GUATEMEL clients require.
Power purchase agreement: It refers to the power purchase agreement of the cheapest energy price between the spot price and the formula of the agreement.
Renewable Distributed Generator (GDR): It refers to the power plant of less than 5MW and whose generation technology is renewable.
Firm efficient offer: It is the power amount that the generator has available to support the firm demand.
Generated energy agreement in the Forward Market (MAT): It is where a private agreement is available with a generator always related to the purchase of energy and power. This type of agreement is used to compromise all energy generated by the generator.
Sugar harvest (Zafra): Season of the year where the sugar mills are producing cane and its pulp is used for the energy generation. This period of time is from November to April.
F-478
Table of Contents
COMERCIALIZADORA GUATEMALTECA MAYORISTA DE ELECTRICIDAD, S. A.—GUATEMEL
NOTES TO THE FINANCIAL STATEMENTS
AS OF DECEMBER 31, 2015, 2014 AND 2013, AND FOR THE YEARS ENDED
DECEMBER 31, 2015 AND 2014
(Stated in US dollars, except otherwise indicated)
| 23. | POWER PURCHASE AGREEMENTS (cont’d) |
Non sugar harvest (No Zafra): This season is from May to October.
Generating branch: It refers to the ability of contracting this supplier solely for power purposes. It is referred to as power guarantee contract.
Poliwatt Limitada
In the case of this power generator there is an electricity power backup warranty (until 04/30/16) for 10.0 MW at 9.75 US$/kW-month through a power purchase agreement.
Generadora de Norte, Limitada (Genor)
In the case of this power generator there is an electricity power backup warranty (until 04/30/17) for 0.816 MW approximately at 8.85 US$/kW-month with an energy purchase agreement. For the seasonal year 2015-2016 the power was increased to 1.816 MW from May to October 2015 and as from November 2015 it was reduced to 0.816 MW.
Hidrosacpur, S.A.
This agreement corresponds to a Renewable Distributed Generator (GDR) that is represented by GUATEMEL until April 2016. This GDR has a Firm Efficient Offer of 3,577.88 kW, which is used by GUATEMEL to cover the firm demand (power without energy agreement), with a price for power of 7.00 US$/kW-month and a generated energy agreement in the Forward Market (MAT).
InBio
This agreement belongs to a Renewable Distributed Generator (GDR) that agreed with GUATEMEL the sale of power of approximately 927 kW, with a power price of 7.00 US$/kW-month, for a 5 year term and that began in May 2015.
Pantaleón
In the case of this power generator there is agreement for 2,000 kW per seasonal year 2015-2016 (the agreement is done in such a manner that additional power may be requested from the power generator and should be provided in case they have the capacity) with a power price of 7.50 US$/kW-month. The use of energy is divided in two modalities:
| • | Zafra: fixed price of 67.5 US$/MWh for all the energy associated to the power |
| • | No Zafra: Energy purchase agreement with an energy Price according to the agreement |
Electro Generación Temporal
In the case of the Generating Branch a power back-up agreement was signed for the power required to adjust to the demand curve of GUATEMEL. A continuous purchase has taken of 35 kW during the months of November and December 2015, and January 2016 with a power price off 7.50 US$/kW-month. The agreement ends on April 2016 although there is no minimum purchase obligation.
F-479
Table of Contents
COMERCIALIZADORA GUATEMALTECA MAYORISTA DE ELECTRICIDAD, S. A.—GUATEMEL
NOTES TO THE FINANCIAL STATEMENTS
AS OF DECEMBER 31, 2015, 2014 AND 2013, AND FOR THE YEARS ENDED
DECEMBER 31, 2015 AND 2014
(Stated in US dollars, except otherwise indicated)
| 24. | FINANCIAL INSTRUMENTS |
The Company manages its capital structure to ensure the continuity as going concern, while it maximizes the return to its shareholders through the optimization of the debt and equity balances. The Company’s overall strategy remains unchanged from 2014.
The main business of the Company is exposed to a variety of risks, which are presented as follows:
Classification of Financial Instruments
As of December 31, financial assets and liabilities of the Company are made up as follows:
2015 | 2014 | 2013 | ||||||||||
FINANCIAL ASSETS: | ||||||||||||
Measured at amortized cost | ||||||||||||
Trade receivables | US$ | 633,087 | US$ | 1,083,985 | US$ | 1,745,373 | ||||||
Other receivables | 209,302 | — | — | |||||||||
Account receivables from related parties | 1,268,486 | 1,744,167 | 1,453,828 | |||||||||
Cash and cash equivalents | 1,248,762 | 1,066,811 | 1,984,335 | |||||||||
Other assets | 75,391 | 118,575 | 2,455 | |||||||||
|
|
|
|
|
| |||||||
| US$ | 3,435,028 | US$ | 4,013,538 | US$ | 5,185,991 | |||||||
|
|
|
|
|
| |||||||
2015 | 2014 | 2013 | ||||||||||
FINANCIAL LIABILITIES: | ||||||||||||
Measured at amortized cost | ||||||||||||
Trade and other accounts payable | US$ | 754,662 | US$ | 1,051,488 | US$ | 1,658,078 | ||||||
Other liabilities | 71,998 | 110,077 | — | |||||||||
Creditors for services received | 13,035 | 13,096 | 12,612 | |||||||||
Deposits received from customers | 84,033 | 81,717 | 102,311 | |||||||||
Account payables to related parties | 7,553 | 7,589 | — | |||||||||
Other payable | 2,416 | 6,670 | 755 | |||||||||
Finance lease payable | 267,088 | 408,343 | — | |||||||||
|
|
|
|
|
| |||||||
| US$ | 1,200,785 | US$ | 1,678,980 | US$ | 1,773,756 | |||||||
|
|
|
|
|
| |||||||
At the date of the financial statements, there are no significant concentrations of credit risk in relation to these items. The abovementioned value represents the maximum exposure to credit risk for such financial assets and liabilities.
Management of Financial Risk
The Company is exposed continuously to credit, liquidity and market risks originated by exchange rate, interest rate, and prices variations. These risks are managed through specific policies and procedures established by the Company financial management.
F-480
Table of Contents
COMERCIALIZADORA GUATEMALTECA MAYORISTA DE ELECTRICIDAD, S. A.—GUATEMEL
NOTES TO THE FINANCIAL STATEMENTS
AS OF DECEMBER 31, 2015, 2014 AND 2013, AND FOR THE YEARS ENDED
DECEMBER 31, 2015 AND 2014
(Stated in US dollars, except otherwise indicated)
| 24. | FINANCIAL INSTRUMENTS (cont’d) |
The financial management monitors constantly those risks through periodic reports that allow evaluating the exposure levels affecting the Company and issues periodic management reports for the consideration of the Company’s general management.
Credit Risk
Credit risk refers to the risk that a counterparty will default on its contractual obligations resulting in financial loss to the Company. Credit risk is managed by the Company. The extension of the credit risk vulnerability is represented by the balance of the trade receivable.
The credit risk or the incompliance of third parties risk are controlled through the implementation of controls to cut the service and monitoring process.
The credit risk related to trade receivables is in the receivable accounts to related parties, over which, Management considers there is no risk of collection.
The credit risk on liquid funds is limited because the counterparties are banks with high credit-ratings assigned by international credit-rating agencies.
Liquidity Risk
The Company practices a careful liquidity risk management and, therefore, keeps cash and other instruments liquid, as well as available funds.
The management of the Company considers that liquidity risk exposure is low, either because of clients cannot comply with their obligations with the Company within the normal terms established, or because the Company has inconveniences to obtain funds to comply with commitments related to financial assets and liabilities.
Cash Flows:
There is a low exposure as to whether the cash flows associated with the financial assets and liabilities could fluctuate in their amount, except for the risk exposure of cash flows that might derive from the fluctuation of the exchange rate of the dollar with respect to the Quetzal, that might require additional cash flows to cancel the loans and accounts payable in foreign currency or that might implicate a reduction in the assets in foreign currency.
Fair Value of Financial Instruments
The Company does not have any financial assets or financial liabilities measured at fair value on a recurring basis.
F-481
Table of Contents
COMERCIALIZADORA GUATEMALTECA MAYORISTA DE ELECTRICIDAD, S. A.—GUATEMEL
NOTES TO THE FINANCIAL STATEMENTS
AS OF DECEMBER 31, 2015, 2014 AND 2013, AND FOR THE YEARS ENDED
DECEMBER 31, 2015 AND 2014
(Stated in US dollars, except otherwise indicated)
| 24. | FINANCIAL INSTRUMENTS (cont’d) |
Fair value of financial assets and financial liabilities that are not measured at fair value (but fair value disclosures are required)
The Company’s management considers that the carrying amount of the financial assets and financial liabilities approximate their fair value.
Market Risk
Fluctuation on exchange rate and market prices:
The Company does not have a practice to acquire derivatives financial instruments to protect itself from the risk of loss due to the fluctuation on the currency exchange rate on which performs its transactions abroad.
Exchange Rate Risk
Monetary assets and liabilities include balances in Dollars of the United States of America, which are subject to the fluctuation risk in the exchange rate of the US dollar with regard to the local currency for the transactions performed of the Company. During 2015, 2014 and 2013, there were no fluctuation of the US dollar regarding local currency that might be considered important, as shown as follows:
Percentage Rate Devaluation of the Quetzal in Relation with the US Dollar
Currency | 2015 | 2014 | 2013 | |||||||||
Quetzal | (1 | )% | (3 | )% | (1 | )% | ||||||
As of December 31, 2015, 2014 and 2013, the amount of assets and liabilities in foreign currency that might be exposed to exchange rate fluctuation is as follows:
US$ | ||||
2015 | ||||
Asset | ||||
Cash and cash equivalents | 141,502 | |||
Trade receivables | 5,699 | |||
|
| |||
Total assets | 147,201 | |||
|
| |||
Liability | ||||
Trade and other accounts payables | (134,231 | ) | ||
|
| |||
Total liability | (134,231 | ) | ||
|
| |||
Net position in foreign currency | 12,970 | |||
|
| |||
F-482
Table of Contents
COMERCIALIZADORA GUATEMALTECA MAYORISTA DE ELECTRICIDAD, S. A.—GUATEMEL
NOTES TO THE FINANCIAL STATEMENTS
AS OF DECEMBER 31, 2015, 2014 AND 2013, AND FOR THE YEARS ENDED
DECEMBER 31, 2015 AND 2014
(Stated in US dollars, except otherwise indicated)
| 24. | FINANCIAL INSTRUMENTS (cont’d) |
US$ | ||||
2014 | ||||
Asset | ||||
Cash and cash equivalents | 59,580 | |||
Trade receivables | 22,067 | |||
|
| |||
Total assets | 81,647 | |||
|
| |||
Liability | ||||
Trade and other accounts payables | (315,635 | ) | ||
|
| |||
Total liability | (315,635 | ) | ||
|
| |||
Net position in foreign currency | (233,988 | ) | ||
|
| |||
US$ | ||||
2013 | ||||
Asset | ||||
Cash and cash equivalents | 480,115 | |||
Trade receivables | 12,157 | |||
|
| |||
Total assets | 492,272 | |||
|
| |||
Liability | ||||
Trade and other accounts payables | (539,254 | ) | ||
|
| |||
Total liability | (539,254 | ) | ||
|
| |||
Net position in foreign currency | (46,982 | ) | ||
|
| |||
Sensitivity analysis
A strengthening or weakening at the rate of 2% of the dollar exchange rate against the Quetzal would have increased (decreased) the income or loss by the amounts shown below. This analysis assumes that all other variables, in particular interest rates, remain constant. The analysis is performed on the same basis for 2014 and 2013.
As at December 31 | ||||||||||||||||
Profit or loss | Shareholders’ Equity | |||||||||||||||
2% | 2% | 2% | 2% | |||||||||||||
US$ | ||||||||||||||||
As of December 31, 2015 | 259 | (259 | ) | 90,613 | (94,312 | ) | ||||||||||
As of December 31, 2014 | 4,680 | (4,680 | ) | 96,606 | (100,553 | ) | ||||||||||
As of December 31, 2013 | 940 | (940 | ) | 96,594 | (100,536 | ) | ||||||||||
F-483
Table of Contents
COMERCIALIZADORA GUATEMALTECA MAYORISTA DE ELECTRICIDAD, S. A.—GUATEMEL
NOTES TO THE FINANCIAL STATEMENTS
AS OF DECEMBER 31, 2015, 2014 AND 2013, AND FOR THE YEARS ENDED
DECEMBER 31, 2015 AND 2014
(Stated in US dollars, except otherwise indicated)
| 25. | SUBSEQUENT EVENTS |
The Company has evaluated subsequent events as at December 31, 2015 to assess the need for potential recognition or disclosure in the accompanying financial statements. Such events were assessed until September 10, 2016, the date these financial statements were available to be issued. Based on this evaluation it was determined that there were no subsequent events requiring recognition or disclosure in the financial statements except for the following matters:
| • | On January 22, 2016, I.C. Power Ltd., through IC Power Distribution Holding Pte. Limited, a wholly-owned subsidiary of Kenon Holdings Ltd (“Kenon”), acquired the 100% of the shares of GUATEMEL B.V., owner of 100% of the Company’s capital stock. As a result, I.C. Power Ltd. took the effective control to manage the financial and operating policies of the Company. |
| • | On March 17, 2016, as part of the reorganization process carried out by Kenon in order to list the I.C. Power Pte. Ltd. in the US stock exchange, Kenon transferred all of the shares of I.C. Power Ltd. to I.C. Power Pte. Ltd. (“ICPS”), a wholly owned subsidiary of Kenon incorporated in Singapore. |
| • | On January 22, 2016 the contract held with Arthasan, S. A. was cancelled. Such entity rendered management and administration services for the business of the Company up to December 31, 2014. Since January 2015 the above mentioned activities were carried out directly by the Company’s key management. |
| 26. | APPROVAL OF THE FINANCIAL STATEMENTS |
These financial statements prepared in U.S. dollars as presentation currency, were approved by the Company’s Management Committee on September 10, 2016
* * * * * *
F-484
Table of Contents
Redes Eléctricas de
Centroamérica, S. A.—RECSA
Restated Financial Statements as of December 31, 2015,
2014, and 2013 and for the years ended December 31,
2015, 2014 and 2013 together with the Independent
Auditors’ Report
Table of Contents
REDES ELÉCTRICAS DE CENTROAMÉRICA, S. A.—RECSA
Page | ||||
| F-487 | ||||
RESTATED FINANCIAL STATEMENTS AS OF DECEMBER 31, 2015, 2014 AND 2013, AND FOR THE YEARS ENDED DECEMBER 31, 2015 , 2014 AND 2013 | ||||
| F-489 | ||||
| F-490 | ||||
| F-491 | ||||
| F-492 | ||||
| F-493 | ||||
Table of Contents
Deloitte Guatemala, S.A.
Europlaza World Business Center
5a. Avenida 5-55, Zona 14
Torre IV, Nivel 8
01014
Guatemala
Tel: (502) 2384 6500
Fax: (502) 2384 6555
www.deloitte.com/gt
To the Management Committee and the Shareholders of
Redes Etéctricas de Centroamérica, S. A.
We have audited the accompanying financial statements of Redes Eléctricas de Centroamérica, S. A. (the “Company”), which comprise the restated statements of financial position as of December 31, 2015, 2014 and 2013, and the related restated statements of profit or loss and other comprehensive income, changes in shareholders’ equity and cash flows for the years ended on December 31, 2015, 2014 and 2013, and the related notes to the financial statements.
Management’s Responsibility for the Financial Statements
Management is responsible for the preparation and fair presentation of these financial statements in accordance with International Financial Reporting Standards as issued by the International Accounting Standards Board; this includes the design, implementation, and maintenance of internal control relevant to the preparation and fair presentation of financial statements that are free from material misstatement, whether due to fraud or error.
Auditors’ Responsibility
Our responsibility is to express an opinion on these financial statements based on our audits. We conducted our audits in accordance with auditing standards generally accepted in the United States of America. Those standards require that we plan and perform the audit to obtain reasonable assurance about whether the financial statements are free from material misstatement.
An audit involves performing procedures to obtain audit evidence about the amounts and disclosures in the financial statements. The procedures selected depend on the auditor’s judgment, including the assessment of the risks of material misstatement of the financial statements, whether due to fraud or error. In making those risk assessments, the auditor considers internal control relevant to the Company’s preparation and fair presentation of the financial statements in order to design audit procedures that are appropriate in the circumstances, but not for the purpose of expressing an opinion on the effectiveness of the Company’s internal control. Accordingly, we express no such opinion. An audit also includes evaluating the appropriateness of accounting policies used and the reasonableness of significant accounting estimates made by management, as well as evaluating the overall presentation of the financial statements.
We believe that the audit evidence we have obtained is sufficient and appropriate to provide a basis for our audit opinion.
Opinion
In our opinion, the financial statements referred to above present fairly, in all material respects, the financial position of Redes Eléctricas de Centroamérica, S. A. as of December 31, 2015, 2014 and 2013, and the results of its operations and its cash flows for the years then ended, in accordance with International Financial Reporting Standards as issued by the International Accounting Standards Board.
Table of Contents
Emphasis of matter
As discussed in Note 1.b, the financial statements as of December 31, 2015, 2014 and 2013 and for the years ended December 31, 2015 and 2014 have been restated for the correction of errors. In addition, the Company also expanded certain disclosures from those previously presented. Our opinion is not modified with respect to these matters.
Guatemala, C.A.,
September 10, 2016
Deloitte Guatemala, S. A.
/s/ Sergio Patzán
Sergio Patzán
Partner
Chartered Accountant CPA-2200
F-488
Table of Contents
REDES ELÉCTRICAS DE CENTROAMÉRICA, S. A.—RECSA
STATEMENT OF PROFIT OR LOSS AND OTHER COMPREHENSIVE INCOME
FOR THE YEARS ENDED DECEMBER 31, 2015, 2014 AND 2013
(Stated in US dollars, except otherwise indicated)
Notes | 2015 (Restated Note 1b) | 2014 (Restated Note 1b) | 2013 | |||||||||||||
REVENUE: | ||||||||||||||||
Toll Services | US$ | 1,969,705 | US$ | 1,277,938 | US$ | 1,268,305 | ||||||||||
COST OF SERVICES | 5 | (733,772 | ) | (549,834 | ) | (451,281 | ) | |||||||||
Gross profit | 1,235,933 | 728,104 | 817,024 | |||||||||||||
General, selling and administrative expenses | 6 | (237,839 | ) | (214,454 | ) | (194,794 | ) | |||||||||
Financial income | 16,644 | 11,665 | 25,291 | |||||||||||||
Finance expenses | 7 | (329,253 | ) | (326,278 | ) | (216,678 | ) | |||||||||
Profit before income taxes | 685,485 | 199,037 | 430,843 | |||||||||||||
Income taxes | 8 | (127,767 | ) | (91,065 | ) | (75,677 | ) | |||||||||
|
|
|
|
|
| |||||||||||
PROFIT FOR THE YEAR | 557,718 | 107,972 | 355,166 | |||||||||||||
OTHER COMPREHENSIVE INCOME (LOSS) | ||||||||||||||||
Items that will not be reclassified subsequently to profit or loss: | ||||||||||||||||
- Remeasurement of defined benefit obligation | 16 | 4,783 | 25,195 | — | ||||||||||||
- Translation differences | (26,568 | ) | 190,614 | 43,107 | ||||||||||||
|
|
|
|
|
| |||||||||||
OTHER COMPREHENSIVE INCOME (LOSS) FOR THE YEAR | (21,785 | ) | 215,809 | 43,107 | ||||||||||||
|
|
|
|
|
| |||||||||||
TOTAL COMPREHENSIVE INCOME FOR THE YEAR | US$ | 535,933 | US$ | 323,781 | US$ | 398,273 | ||||||||||
|
|
|
|
|
| |||||||||||
The accompanying notes are part of these financial statements.
F-489
Table of Contents
REDES ELÉCTRICAS DE CENTROAMÉRICA, S. A.—RECSA
STATEMENTS OF FINANCIAL POSITION
AS OF DECEMBER 31, 2015, 2014 AND 2013
(Stated in US dollars, except otherwise indicated)
Notes | 2015 (Restated) (Note 1b) | 2014 (Restated) (Note 1b) | 2013 (Restated) (Note 1b) | |||||||||||||
ASSETS | ||||||||||||||||
NON-CURRENT ASSETS: | ||||||||||||||||
Property, plant and equipment, net | 9 | US$ | 11,773,274 | US$ | 12,297,794 | US$ | 10,078,767 | |||||||||
Non-current tax assets | 10 | 663,867 | 805,694 | 682,236 | ||||||||||||
|
|
|
|
|
| |||||||||||
Total non-current assets | 12,437,141 | 13,103,488 | 10,761,003 | |||||||||||||
|
|
|
|
|
| |||||||||||
CURRENT ASSETS: | ||||||||||||||||
Current tax assets | 10 | 170,327 | 178,124 | 98,150 | ||||||||||||
Trade receivables | 11 | 318,294 | 210,654 | 211,016 | ||||||||||||
Prepaid insurance | 16,624 | 17,258 | 12,879 | |||||||||||||
Cash and cash equivalents | 12 | 650,964 | 603,853 | 711,186 | ||||||||||||
|
|
|
|
|
| |||||||||||
Total current assets | 1,156,209 | 1,009,889 | 1,033,231 | |||||||||||||
|
|
|
|
|
| |||||||||||
Total assets | US$ | 13,593,350 | US$ | 14,113,377 | US$ | 11,794,234 | ||||||||||
|
|
|
|
|
| |||||||||||
SHAREHOLDERS’ EQUITY AND LIABILITIES | ||||||||||||||||
SHAREHOLDERS’ EQUITY: | ||||||||||||||||
Capital stock | 13 | US$ | 3,031,287 | US$ | 3,031,287 | US$ | 3,031,287 | |||||||||
Additional paid-in capital | 165,318 | — | — | |||||||||||||
Legal reserve | 14 | 178,576 | 150,690 | 145,291 | ||||||||||||
Retained earnings | 3,394,896 | 2,865,064 | 2,762,491 | |||||||||||||
Accumulated other comprehensive income—remeasurement of defined benefit obligation | 29,978 | 25,195 | — | |||||||||||||
Accumulated other comprehensive income (loss)—translation differences | 69,283 | 95,851 | (94,763 | ) | ||||||||||||
|
|
|
|
|
| |||||||||||
Total shareholders’ equity | 6,869,338 | 6,168,087 | 5,844,306 | |||||||||||||
|
|
|
|
|
| |||||||||||
NON-CURRENT LIABILITIES: | ||||||||||||||||
Debt with financial entities | 15 | 3,668,585 | 4,607,233 | 4,463,506 | ||||||||||||
Accounts payable to related parties | 17 | 1,144,387 | — | — | ||||||||||||
Provisions | 16 | 134,044 | 129,421 | 143,217 | ||||||||||||
Deferred income tax | 8 | — | 1,796 | — | ||||||||||||
|
|
|
|
|
| |||||||||||
Total non-current liabilities | 4,947,016 | 4,738,450 | 4,606,723 | |||||||||||||
CURRENT LIABILITIES: | ||||||||||||||||
Debt with financial entities | 15 | 917,146 | — | — | ||||||||||||
Tax payable | 10 | 1,460 | 1,687 | 892 | ||||||||||||
Accounts payable to related parties | 17 | 792,506 | 3,072,408 | 1,275,287 | ||||||||||||
Trade accounts payable | 18 | 53,995 | 118,617 | 56,649 | ||||||||||||
Other payable | 11,889 | 14,128 | 10,377 | |||||||||||||
|
|
|
|
|
| |||||||||||
Total current liabilities | 1,776,996 | 3,206,840 | 1,343,205 | |||||||||||||
|
|
|
|
|
| |||||||||||
Total liabilities | 6,724,012 | 7,945,290 | 5,949,928 | |||||||||||||
|
|
|
|
|
| |||||||||||
Total liabilities and shareholders’ equity | US$ | 13,593,350 | US$ | 14,113,377 | US$ | 11,794,234 | ||||||||||
|
|
|
|
|
| |||||||||||
The accompanying notes are part of these financial statements.
F-490
Table of Contents
REDES ELÉCTRICAS DE CENTROAMÉRICA, S. A.—RECSA
STATEMENT OF CHANGES IN SHAREHOLDERS’ EQUITY
FOR THE YEARS ENDED DECEMBER 31, 2015, 2014 AND 2013
(Stated in US Dollars, except otherwise indicated)
|
|
|
| Accumulated Other Comprehensive Income | ||||||||||||||||||||||||
Capital Stock | Additional paid- | Legal | Retained | Remeasurement | Translation | Total | ||||||||||||||||||||||
Balance as of January 1, 2013 | US$ | 3,031,287 | US$ | — | US$ | 127,493 | US$ | 2,425,123 | US$ | — | US$ | (137,870 | ) | US$ | 5,446,033 | |||||||||||||
Movements of the year 2013 | ||||||||||||||||||||||||||||
Transfer to legal reserve, as restated (Note 1.b) | — | — | 17,798 | (17,798 | ) | — | — | — | ||||||||||||||||||||
Translation differences | — | — | — | — | — | 43,107 | 43,107 | |||||||||||||||||||||
Profit for the year | — | — | — | 355,166 | — | — | 355,166 | |||||||||||||||||||||
|
|
|
|
|
|
|
|
|
|
|
|
|
| |||||||||||||||
Balance as of December 31, 2013, as restated (Note 1.b) | 3,031,287 | — | 145,291 | 2,762,491 | (94,763 | ) | 5,844,306 | |||||||||||||||||||||
Movements of the year 2014 | ||||||||||||||||||||||||||||
Transfer to legal reserve, as restated (note 1.b) | — | — | 5,399 | (5,399 | ) | — | — | — | ||||||||||||||||||||
Remeasurement of defined benefit obligation, net of income tax | — | — | — | — | 25,195 | — | 25,195 | |||||||||||||||||||||
Translation differences, as restated (Note 1.b) | — | — | — | — | — | 190,614 | 190,614 | |||||||||||||||||||||
Profit for the year | — | — | — | 107,972 | — | — | 107,972 | |||||||||||||||||||||
|
|
|
|
|
|
|
|
|
|
|
|
|
| |||||||||||||||
Balance as of December 31, 2014 | 3,031,287 | — | 150,690 | 2,865,064 | 25,195 | 95,851 | 6,168,087 | |||||||||||||||||||||
Movements of the year 2015 | ||||||||||||||||||||||||||||
Transfer to legal reserve, as restated (Note 1.b) | — | — | 27,886 | (27,886 | ) | — | — | — | ||||||||||||||||||||
Remeasurement of defined benefit obligation, net of income tax | — | — | — | — | 4,783 | — | 4,783 | |||||||||||||||||||||
Translation differences | — | — | — | — | — | (26,568 | ) | (26,568 | ) | |||||||||||||||||||
Profit for the year | — | — | — | 557,718 | — | — | 557,718 | |||||||||||||||||||||
Equity transaction with related party, as restated (Note 1.b, and 17) | — | 165,318 | — | — | — | — | 165,318 | |||||||||||||||||||||
|
|
|
|
|
|
|
|
|
|
|
|
|
| |||||||||||||||
Balance as of December 31, 2015 | US$ | 3,031,287 | US$165,318 | US$ | 178,576 | US$ | 3,394,896 | US$ | 29,978 | US$ | 69,283 | US$ | 6,869,338 | |||||||||||||||
|
|
|
|
|
|
|
|
|
|
|
|
|
| |||||||||||||||
The accompanying notes are part of these financial statements.
F-491
Table of Contents
REDES ELÉCTRICAS DE CENTROAMÉRICA, S. A.—RECSA
FOR THE YEARS ENDED DECEMBER 31, 2015, 2014 AND 2013
(Stated in US dollars, except otherwise indicated)
2015 (Restated) | 2014 (Restated) (Note 1b) | 2013 (Restated) (Note 1b) | ||||||||||
CASH FLOWS FROM OPERATING ACTIVITIES: | ||||||||||||
Profit for the year | US$ | 557,718 | US$ | 107,972 | US$ | 355,166 | ||||||
Adjustments for: | ||||||||||||
Depreciation | 467,012 | 310,144 | 305,270 | |||||||||
Provision on severance compensation | 9,995 | 9,608 | 9,073 | |||||||||
Income taxes | 127,767 | 91,065 | 75,677 | |||||||||
Finance cost recognized in profit or loss | 320,025 | 316,744 | 216,678 | |||||||||
Changes in working capital: | ||||||||||||
Other payable | (2,176 | ) | 2,497 | 1,664 | ||||||||
Tax assets | 145,032 | (178,302 | ) | (15,973 | ) | |||||||
Trade accounts payable | (64,069 | ) | 60,143 | 9,467 | ||||||||
Accounts payable to related parties | (955,353 | ) | 1,756,056 | (455,523 | ) | |||||||
Provisions | — | (2,538 | ) | — | ||||||||
Tax payable | (573 | ) | 311 | (6,845 | ) | |||||||
Prepaid insurance | 554 | (3,963 | ) | 670 | ||||||||
Trade receivables | (108,623 | ) | 7,156 | 950 | ||||||||
|
|
|
|
|
| |||||||
Cash flows from operating activities | 497,309 | 2,476,893 | 496,274 | |||||||||
Income tax paid | (129,549 | ) | (89,301 | ) | (75,677 | ) | ||||||
Payments of interest | (320,025 | ) | (316,744 | ) | (216,678 | ) | ||||||
|
|
|
|
|
| |||||||
Net cash flows generated from operating activities | 47,735 | 2,070,848 | 203,919 | |||||||||
|
|
|
|
|
| |||||||
CASH FLOWS FROM INVESTING ACTIVITIES | ||||||||||||
Payments for property, plant and equipment | (1,306 | ) | (2,170,780 | ) | (944,094 | ) | ||||||
|
|
|
|
|
| |||||||
Net cash used in investing activities | (1,306 | ) | (2,170,780 | ) | (944,094 | ) | ||||||
|
|
|
|
|
| |||||||
CASH FLOWS FROM FINANCING ACTIVITIES: | ||||||||||||
Loans obtained from banks | — | — | 4,463,506 | |||||||||
Payment of bank loans | — | — | (3,251,983 | ) | ||||||||
|
|
|
|
|
| |||||||
Net cash flows generated from financing activities | — | — | 1,211,523 | |||||||||
|
|
|
|
|
| |||||||
NET INCREASE (DECREASE) IN CASH AND CASH EQUIVALENTS | 46,429 | (99,932 | ) | 471,348 | ||||||||
Effects of exchange rate changes on cash and cash equivalents | 682 | (7,401 | ) | 1,389 | ||||||||
CASH AND CASH EQUIVALENTS AT THE BEGINNING OF THE YEAR | 603,853 | 711,186 | 238,449 | |||||||||
|
|
|
|
|
| |||||||
CASH AND CASH EQUIVALENTS AT YEAR-END | US$ | 650,964 | US$ | 603,853 | US$ | 711,186 | ||||||
|
|
|
|
|
| |||||||
The accompanying notes are part of these financial statements.
F-492
Table of Contents
REDES ELÉCTRICAS DE CENTROAMÉRICA, S. A.—RECSA
NOTES TO THE FINANCIAL STATEMENTS AS OF DECEMBER 31, 2015, 2014 AND 2013,
AND FOR THE YEARS ENDED DECEMBER 31, 2015, 2014 AND 2013
(Stated in US Dollars, except otherwise indicated)
| 1. | OPERATIONS OF THE COMPANY AND PURPOSE OF PREPARATION OF THE FINANCIAL STATEMENTS |
| a. | Operations of the Company—Redes Eléctricas de Centroamérica, S.A. (the Company or “RECSA”) is a corporation that was incorporated in the Republic of Guatemala in accordance with the commercial laws of the country and was authorized to operate for an indefinitely period of time. The Company was registered in the Commercial Register (Registro Mercantil) on March 8, 2006. The Company’s address of its principal offices is Diagonal 6 10-52, zona 10, Edificio Interamericas. |
The main activity of the Company is the electricity transmission and transformation. The Company’s non-current assets are located in Guatemala and all revenues are generated in Guatemala.
On December 5, 2006, the Ministry of Energy and Mining through ministerial agreement number 202-2006 authorized the Company to use state property, such as public roads to install the infrastructure necessary to transmit electricity on all the territory of the Republic of Guatemala, during a period of fifty years. As a result, the Company has the rights and should comply with the obligations contained in the General Law of Electricity and its ruling, as well as other laws that apply. The grantor does not control any significant residual interest in the infrastructure at the end of the term of the authorization and the Company has the possibility of renewing the authorized period. The Company has the right to enter and leave the transmission and transformation activity, keeping the property and the disposal rights over all the assets installed into the transmission network.
During the first quarter of the year 2010, Gas Natural SDG, S.A. reached a total participation of 95.2% of the capital of Unión Fenosa, S. A. Consequently, from April 23, 2010, Gas Natural SDG, S.A. took effective control to manage the financial politics and of exploitation of the Company.
On May 19, 2011, RECSA B.V, a company property of Fondo de Inversiones Actis (its parent and ultimate holding company), acquired the Company. As a result from the acquisition, the Company ceased to be a subsidiary of the Gas Natural Fenosa group and the transactions that the companies had with Gas Natural Fenosa group ceased to have effect on the year 2011.
As further described in note 19, on January 22, 2016, I.C. Power Ltd., a subsidiary of Kenon Holdings Ltd (“Kenon”) acquired all of the shares of RECSA B.V., owner of 100% of the Company’s capital stock.
| b. | Purpose of Preparation of the Financial Statements—These financial statements were prepared by the Company for its filing by IC Power Pte. Ltd., the Company’s current indirect controlling shareholder (see note 21), in a Registration Statement to be filed with the U.S. Securities and Exchange Commission. |
These financial statements were prepared originally in Quetzal, the Company’s functional currency, and were translated into U. S. dollars, the presentation currency.
F-493
Table of Contents
REDES ELÉCTRICAS DE CENTROAMÉRICA, S. A.—RECSA
NOTES TO THE FINANCIAL STATEMENTS AS OF DECEMBER 31, 2015, 2014 AND 2013,
AND FOR THE YEARS ENDED DECEMBER 31, 2015, 2014 AND 2013
(Stated in US Dollars, except otherwise indicated)
| 1. | OPERATIONS OF THE COMPANY AND PURPOSE OF PREPARATION OF THE FINANCIAL STATEMENTS (cont’d) |
The Company’s financial statements as of and for the years ended December 31, 2015, 2014 and 2013 has been restated as explained below.
Restatement of the Financial Statements
Subsequent to the issuance of the financial statements of RECSA as of December 31, 2015 and 2014 and for the years then ended, and as of December 31, 2014 and 2013 and for the years then ended, the Company restated such financial statements for the correction of an error as stated below:
| a.1 | On December 31, 2015, the Company signed a new agreement with Comercializadora Guatemalteca Mayorista de Electricidad, S.A. (GUATEMEL) extending the due date of a promissory note to December 31, 2017. However, the Company originally had not recorded the effects of such term extension. |
Consequently, as of December 31, 2015 the Company revised the valuation of such payable and recognized a charge directly to equity under “Additional paid in capital” and the related effect in the loan payable.
| a.2 | As of December 31, 2015, 2014 and 2013, the Company originally had not recognized the effect of the transfer from retained earnings to legal reserve corresponding to the result of each of those years. Consequently, the Company revised the accounting and increased the legal reserve with a decrease in retained earnings in each year. |
| a.3 | During the years ended December 31, 2015, 2014 and 2013, the Company did not present separately the adjustment for the income tax expense and the withholding payments made related to income tax, including them between the changes in working capital as part of the operating activities in the Statement of Cash Flow. Consequently, the Company revised the presentation and concluded that it should present separately these items in the corresponding Statement of Cash Flow for each year. As a result, the Company restated this presentation and disclosed separately the adjustment for income tax expense, included the withholding payments within the income tax paid with the corresponding change in tax payables between the changes in working capital for the years ended December 31, 2015, 2014 and 2013. |
| a.4 | As of December 31, 2015, 2014 and 2013, certain tax assets related to VAT receivables were previously presented as current assets since the Company estimated its recoverability within a year. However, the Company has revised this classification based on all the information available as of December 31, 2015, 2014 and 2013 and concluded that according to its tax planning strategies the timing for the collectability of this receivable should have been beyond twelve months. As a result, the Company has reclassified such balances and presented them under non-current assets in the Statement of financial position as of December 31, 2015, 2014 and 2013. |
Accordingly, the Financial Statements as of December 31, 2015 have been restated for the correction of the above-mentioned errors.
F-494
Table of Contents
REDES ELÉCTRICAS DE CENTROAMÉRICA, S. A.—RECSA
NOTES TO THE FINANCIAL STATEMENTS AS OF DECEMBER 31, 2015, 2014 AND 2013,
AND FOR THE YEARS ENDED DECEMBER 31, 2015, 2014 AND 2013
(Stated in US Dollars, except otherwise indicated)
| 1. | OPERATIONS OF THE COMPANY AND PURPOSE OF PREPARATION OF THE FINANCIAL STATEMENTS (cont’d) |
The accumulated effect of the matters described above on the financial statements are shown as follows:
Statement of financial position:
31-12-2015 | Ref. | Amount | Correction of Errors - | Restated Amount | ||||||||||||
NON-CURRENT ASSETS | ||||||||||||||||
Non-current tax assets | a.4 | US$ | 529,980 | US$ | 133,887 | US$ | 663,867 | |||||||||
CURRENT ASSETS | ||||||||||||||||
Current tax assets | a.4 | US$ | 304,214 | US$ | (133,887 | ) | US$ | 170,327 | ||||||||
SHAREHOLDERS’ EQUITY | ||||||||||||||||
Additional paid-in capital | a.1 | US$ | — | US$ | (165,318 | ) | US$ | (165,318 | ) | |||||||
Legal reserve | a.2 | US$ | (144,585 | ) | US$ | (33,991 | ) | US$ | (178,576 | ) | ||||||
Retained earnings | a.1, a.2 | US$ | (3,428,887 | ) | US$ | 33,991 | US$ | (3,394,896 | ) | |||||||
NON-CURRENT LIABILITIES | ||||||||||||||||
Accounts payable to related parties | a.1 | US$ | (1,309,705 | ) | US$ | 165,318 | US$ | (1,144,387 | ) | |||||||
Statement of cash flow: | ||||||||||||||||
CASH FLOWS FROM OPERATING ACTIVITIES: | ||||||||||||||||
Income tax expense | a.3 | US$ | — | US$ | 127,767 | US$ | 127,767 | |||||||||
Tax payable | a.3 | US$ | 11,271 | US$ | (11,844 | ) | US$ | (573 | ) | |||||||
Income tax paid | a.3 | US$ | (13,278 | ) | US$ | (116,271 | ) | US$ | (129,549 | ) | ||||||
Effects of exchange rate changes on cash and cash equivalents | a.3 | US$ | 334 | US$ | 348 | US$ | 682 | |||||||||
Statement of financial position:
31-12-2014 | Ref. | Amount | Correction of Errors - | Restated Amount | ||||||||||||
NON-CURRENT ASSETS: | ||||||||||||||||
Non-current tax assets | a.4 | US$ | — | US$ | 805,694 | US$ | 805,694 | |||||||||
CURRENT ASSETS: | ||||||||||||||||
Current tax assets | a.4 | US$ | 983,818 | US$ | (805,694 | ) | US$ | 178,124 | ||||||||
SHAREHOLDERS’ EQUITY | ||||||||||||||||
Legal Reserve | a.2 | US$ | (144,585 | ) | US$ | (6,105 | ) | US$ | (150,690 | ) | ||||||
Retained earnings
| a.3 | US$ | (2,871,169 | ) | US$ | 6,105 | US$ | (2,865,064 | ) | |||||||
F-495
Table of Contents
REDES ELÉCTRICAS DE CENTROAMÉRICA, S. A.—RECSA
NOTES TO THE FINANCIAL STATEMENTS AS OF DECEMBER 31, 2015, 2014 AND 2013,
AND FOR THE YEARS ENDED DECEMBER 31, 2015, 2014 AND 2013
(Stated in US Dollars, except otherwise indicated)
| 1. | OPERATIONS OF THE COMPANY AND PURPOSE OF PREPARATION OF THE FINANCIAL STATEMENTS (cont’d) |
Statement of cash flow:
31-12-2014 | Ref. | Amount | Correction of Errors - | Restated Amount | ||||||||||||
CASH FLOWS FROM OPERATING ACTIVITIES: | ||||||||||||||||
Income tax expense | a.3 | US$ | — | US$ | 91,065 | US$ | 91,065 | |||||||||
Tax payable | a.3 | US$ | 17,383 | US$ | (17,072 | ) | US$ | 311 | ||||||||
Income tax paid | a.3 | US$ | (13,901 | ) | US$ | (75,400 | ) | US$ | (89,301 | ) | ||||||
Effects of exchange rate changes on cash and cash equivalents | a.3 | US$ | (8,808 | ) | US$ | 1,407 | US$ | (7,401 | ) | |||||||
Statement of financial position:
|
| |||||||||||||||
31-12-2013 | Ref. | Amount | Correction of Errors - Debits | Restated Amount | ||||||||||||
NON-CURRENT ASSETS: | ||||||||||||||||
Non-current tax assets | a.4 | US$ | — | US$ | 682,236 | US$ | 682,236 | |||||||||
CURRENT ASSETS: | ||||||||||||||||
Current tax assets | a.4 | US$ | 780,386 | US$ | (682,236 | ) | US$ | 98,150 | ||||||||
SHAREHOLDERS’ EQUITY | ||||||||||||||||
Legal reserve | a.2 | US$ | (118,730 | ) | US$ | (26,561 | ) | US$ | (145,291 | ) | ||||||
Retained earnings | a.3 | US$ | (2,789,052 | ) | US$ | 26,561 | US$ | (2,762,491 | ) | |||||||
Statement of cash flow:
|
| |||||||||||||||
31-12-2013 | Ref. | Amount | Correction of Errors - (Credits) | Restated Amount | ||||||||||||
CASH FLOWS FROM OPERATING ACTIVITIES: | ||||||||||||||||
Income tax expense | a.3 | US$ | — | US$ | 75,677 | US$ | 75,677 | |||||||||
Tax payable | a.3 | US$ | (5,480 | ) | US$ | (1,365 | ) | US$ | (6,845 | ) | ||||||
Income tax paid | a.3 | US$ | (1,200 | ) | US$ | (74,477 | ) | US$ | (75,677 | ) | ||||||
Effects of exchange rate changes on cash and cash equivalents | a.3 | US$ | 1,224 | US$ | 165 | US$ | 1,389 | |||||||||
The changes described for 2015, 2014 and 2013 above did not have an impact on the Company´s net profit for the year and Operating, Investing and Financing Cash flows.
In addition, during the preparation of these financial statements, for the purpose described above, the Company expanded certain disclosures from those previously presented.
F-496
Table of Contents
REDES ELÉCTRICAS DE CENTROAMÉRICA, S. A.—RECSA
NOTES TO THE FINANCIAL STATEMENTS AS OF DECEMBER 31, 2015, 2014 AND 2013,
AND FOR THE YEARS ENDED DECEMBER 31, 2015, 2014 AND 2013
(Stated in US Dollars, except otherwise indicated)
| 2. | APPLICATION OF NEW AND REVISED INTERNATIONAL FINANCIAL STANDARDS (IFRS) |
| 2.1. | New and amendments to IFRSs that are mandatorily effective for the current year |
In the current year, the Company has applied a number of amendments to IFRSs issued by the International Accounting Standards Board (IASB) that are mandatorily effective for an accounting period that begins on or after 1 January 2015:
Amendments to IAS 19 Defined Benefit plans: Employees’ Contributions
The application to these amendments has not had any material impact on the disclosures or the mounts recognized in the Company’s financial statements.
Annual Improvements to the IFRS Terms 2010-2012 and 2011-2013
The company has applied the amendments to IFRSs included in the Annual Improvements to IFRSs 2010-2012 Cycle and 2011-2013 Cycle for the first time in the current year. One of the annual improvements requires that the entities disclose judgments made in the application of the aggregation criteria established in paragraph 12 of the IFRS 8 Operation Segments.
The application of these amendments has not had an impact on the disclosures or amounts recognized in the Company’s financial statements since the Company does not report through operating segments. The application of the other amendments has had no impact on the disclosures or amounts recognized in the Company’s financial statements.
| 2.2. | New and revised IFRS issued but not yet effective |
The Company has not applied the following new and revised IFRSs that have been issued but are not yet effective:
IFRS 9 | Financial Instruments3 | |
IFRS 15 | Revenue from Contracts with Customers3 | |
IFRS 16 | Leasing4 | |
Amendments to IAS 1 | Disclosure Initiative1 | |
Amendments to IAS 16 and IAS 38 | Clarification of Acceptable Methods of Depreciation and Amortisation1 | |
Amendments to IAS 7 | Statement of Cash Flows2 | |
Amendments to IAS 12 | Related to the Recognition of Deferred Tax Assets for Unrealized Losses2 | |
Amendments to IFRSs | Annual Improvements to IFRSs 2012-2014 Cycle1 |
| 1 | Effective for annual periods beginning on or after January 1, 2016, with earlier application permitted. |
| 2 | Effective for annual periods beginning on or after January 1, 2017, with earlier application permitted. |
F-497
Table of Contents
REDES ELÉCTRICAS DE CENTROAMÉRICA, S. A.—RECSA
NOTES TO THE FINANCIAL STATEMENTS AS OF DECEMBER 31, 2015, 2014 AND 2013,
AND FOR THE YEARS ENDED DECEMBER 31, 2015, 2014 AND 2013
(Stated in US Dollars, except otherwise indicated)
| 2. | APPLICATION OF NEW AND REVISED INTERNATIONAL FINANCIAL STANDARDS (IFRS) (cont’d) |
| 3 | Effective for annual periods beginning on or after January 1, 2018, with earlier application permitted. |
| 4 | Effective for annual periods beginning on or after January 1, 2019, with earlier application permitted. |
IFRS 9 Financial Instruments
IFRS 9, issued on November 2009 included new requirements for the classification and measurement of financial assets. IFRS 9 was later modified on October 2010 to include the requirements for the classification and measurements of financial liabilities and for derecognition, and on November 2013, included the new requirements for general hedge accounting. On July 2014, another revised version was issued of IFRS 9 mainly to include: a) impairment requirements for financial assets and b) limited amendments to the requirements of classification and measurement by introducing a new category of measurement a “fair value through other comprehensive income” (FVTOCI) for some simple debts instruments.
Key Requirements for IFRS 9:
| • | IFRS 9 requires that all recognized financial assets that are within the reach of the scope of the IAS 39Financial instruments:Recognition and measurement,are measured subsequently under the amortized cost method or the fair value method. Specifically, debt investments that are held within a business model whose objective is to collect the contractual cash flows, and that have contractual cash flows that are solely payments of principal and interest on the principal outstanding are generally measured at amortized cost at the end of subsequent accounting periods. Debt instruments that are held within a business model whose objective is achieved both by collecting contractual cash flows and selling financial assets, and that have contractual terms that give rise on specified dates to cash flows that are solely payments of principal and interest on the principal amount outstanding, are generally measured at FVTOCI. All other debt investments and equity investments are measured at their fair value at the end of subsequent accounting periods. In addition, under IFRS 9, entities may make an irrevocable election to present subsequent changes in the fair value of an equity investment (that is not held for trading) in other comprehensive income, with only dividend income generally recognized in profit or loss. |
| • | With respect to the measurement of the financial liabilities that are designated as fair value through profit or loss, the IFRS 9 requires that the change amount at fair value of the financial liability attributable to the changes in the credit risk of such liability is recognized in other comprehensive income, unless the recognition of the effects of the changes in the liability credit risk in other comprehensive income creates or increase the accounting mismatch in profits or loss. Changes in fair value attributable to a financial liability’s credit risk are not subsequently reclassified to profit or loss. Under IAS 39, the entire amount of the change in the fair value of the financial liability designated as fair value through profit or loss is presented in profit or loss. |
| • | With respect to the financial assets impairment, the IFRS 9 requires a model of impairment on expected credit loss, opposed to the expected credit loss model, in conformity with IAS 39. The |
F-498
Table of Contents
REDES ELÉCTRICAS DE CENTROAMÉRICA, S. A.—RECSA
NOTES TO THE FINANCIAL STATEMENTS AS OF DECEMBER 31, 2015, 2014 AND 2013,
AND FOR THE YEARS ENDED DECEMBER 31, 2015, 2014 AND 2013
(Stated in US Dollars, except otherwise indicated)
| 2. | APPLICATION OF NEW AND REVISED INTERNATIONAL FINANCIAL STANDARDS (IFRS) (cont’d) |
| expected credit loss model requires that an entity record the expected credit loss and their changes in these expected credit losses at each reporting date in order to reflect the changes in the credit risk from the initial recognition. |
| • | The new general requirements for the hedge accounting retain the three types of accounting mechanisms of hedge accounting that are currently available in IAS 39. In conformity with IFRS 9, the type’s suitable transactions for the hedge accounting are much more flexible, specifically, by enlarging the type of instruments that are classified as hedge instruments and the types of risk components of non-financial items suitable to the hedge accounting. In addition, the effectiveness test has been overhauled and replaced with the principle of an ‘economic relationship’. Retrospective assessment of hedge effectiveness is also no longer required. Enhanced disclosure requirements about an entity’s risk management activities have also been introduced. |
The management of the Company foresee that the application of these new and revised IFRSs will not have a material impact over the Company’s financial statements.
IFRS 15 Revenue from Contracts with Customers
In May 2014, the IFRS 15 was issued which establishes and extensive and detailed model that will be used by the entities in the accounting for revenue from contracts with clients. The IFRS 15 will supersed the current revenue recognition guidance, including the IAS 18 Revenue, IAS 11 Construction Contracts and the related interpretations when it becomes effective.
The essential principle of IAS 15 is that a company should recognize revenue to represent the transfer of goods or services promised to the clients in an amount that reflects the consideration that the company expects to receive in exchange of goods or services. Specifically, the standard adds a model of five steps to revenue recognition:
Step 1: Identify the contract with the clients.
Step 2: Identify the performance obligations on the contract.
Step 3: Determine the transaction price.
Step 4: Distribute the transaction price to the performance obligations in the contract.
Step 5: Recognize revenue when (or as) the entity satisfies the performance obligation.
Under IFRS 15, a company recognizes income when (or as) a performance obligation is satisfied, i.e., when the “control” of the goods and services based on a particular performance obligation is transferred to the client. Many other prescriptive guidelines have been added within the IFRS 15 to confront specific situations. Additionally, IFRS 15 requires extensive disclosures.
The Company’s management estimates that the application of the IFRS 15 in the future may have a material impact on the amounts reported and the disclosures of the Company’s financial statements. However, it is not practicable to provide a reasonable estimate of the effect of this standard until the Company performs detailed review.
F-499
Table of Contents
REDES ELÉCTRICAS DE CENTROAMÉRICA, S. A.—RECSA
NOTES TO THE FINANCIAL STATEMENTS AS OF DECEMBER 31, 2015, 2014 AND 2013,
AND FOR THE YEARS ENDED DECEMBER 31, 2015, 2014 AND 2013
(Stated in US Dollars, except otherwise indicated)
| 2. | APPLICATION OF NEW AND REVISED INTERNATIONAL FINANCIAL STANDARDS (IFRS) (cont’d) |
IFRS 16—Leasing
On January 13, 2016, the IASB issued IFRS 16, which brings most leases on the balance sheet for lessees under a single model, eliminating the distinction between operating and finance leases. For lessors, however, the accounting remains largely unchanged and the distinction between operating and finance leases is retained. IFRS 16 supersedes IAS 17 and related interpretations.
Under IFRS 16, a lessee recognizes a right-of-use asset and a lease liability. The right-of-use asset is treated similarly to other nonfinancial assets and depreciated accordingly, and the liability accrues interest. The lease liability is initially measured at the present value of the lease payments payable over the lease term, discounted at the rate implicit in the lease if this rate can be readily determined. If the rate cannot be readily determined, the lessee’s incremental borrowing rate should be used.
Like IAS 17, IFRS 16 requires lessors to classify leases as operating or finance leases. A lease is classified as a finance lease if it transfers substantially all the risks and rewards of ownership of an underlying asset. Otherwise, the lease is classified as an operating lease. For finance leases, a lessor recognizes finance income over the lease term on the basis of a pattern reflecting a constant periodic rate of return on the net investment. For operating leases, a lessor recognizes lease payments as income on a straight-line basis or, if more representative of the pattern in which benefit from use of the underlying asset is diminished, another systematic basis.
IFRS 16 is effective for annual reporting periods beginning on or after January 1, 2019. Earlier application is permitted if an entity has also applied IFRS 15 (on revenue from contracts with customers).
The Company’s management is currently analyzing the effects that the application of the IFRS 16 may have in the future on the amounts reported and the disclosures of the Company’s financial statements.
Amendments to the IAS 1 Disclosure Initiative
Amendments to IAS 1 provide guidelines as to how to apply the materiality concept in accounting practice.
Amendments to IAS 1 take effect for the annual period that beginning on January 1, 2016. The Company’s management does not foresee that the application of these amendments to IAS 1 will have a material impact on the Company’s financial statements.
Amendments to IAS 16 and IAS 38 Clarification of the Acceptable methods of Depreciation and Amortization
Amendments of IAS 16 prohibits that the entities use a depreciation method based on the revenue for property, plant and equipment. Amendments to IAS 38 introduce a rebuttable assumption that states that
F-500
Table of Contents
REDES ELÉCTRICAS DE CENTROAMÉRICA, S. A.—RECSA
NOTES TO THE FINANCIAL STATEMENTS AS OF DECEMBER 31, 2015, 2014 AND 2013,
AND FOR THE YEARS ENDED DECEMBER 31, 2015, 2014 AND 2013
(Stated in US Dollars, except otherwise indicated)
| 2. | APPLICATION OF NEW AND REVISED INTERNATIONAL FINANCIAL STANDARDS (IFRS) (cont’d) |
revenue is not an appropriate principle for the amortization of an intangible asset. This assumption may be rebutted only in the two following circumstances:
| • | when the intangible asset is stated as a revenue measure, or |
| • | when it can be demonstrated that revenue and the consumption of the economic benefits of the intangible asset are closely related. |
Amendments are applied prospectively for annual periods beginning on January 1, 2016 or after. Currently, the Company uses the straight-line method of depreciation and the amortization of the property, plant, equipment and intangible assets, respectively. The management considers that this is the most appropriate method to reflect the consumption of economic benefits inherent to the respective assets; that is why, the Company’s management does not foresee that the application of these amendments to IAS 16 and IAS 38 will have any impact over the Company’s financial statements.
Amendments to IAS 7—Statements of cash flows
On January 29, 2016, the IASB published amendments to IAS 7 as part of its disclosure initiative (i.e., projects to improve the effectiveness of financial reporting disclosures). The objective of the amendments is to clarify IAS 7 to improve information provided to financial statement users about an entity’s financing activities.
The amendments require that an entity disclose, to the extent necessary to meet the disclosure objective, the following changes in liabilities arising from financing activities:
| • | changes from financing cash flows; |
| • | changes arising from obtaining or losing control of subsidiaries or other businesses; |
| • | the effect of changes in foreign exchange rates; |
| • | changes in fair values; and |
| • | other changes. |
The IASB defines liabilities arising from financing activities as liabilities “for which cash flows were, or future cash flows will be, classified in the statement of cash flows as cash flows from financing activities.” The amendments indicate that the new disclosure requirements also apply to changes in financial assets that meet this definition. The amendments state that one way to meet the new disclosure requirements is to provide “a reconciliation between the opening and closing balances in the statement of financial position for liabilities arising from financing activities.”
The amendments are effective for annual periods beginning on or after January 1, 2017. Earlier application is permitted. The Company’s management foresees that the application of this amendment might have an impact on the Company´s financial statements if this type of transactions arises in the future.
F-501
Table of Contents
REDES ELÉCTRICAS DE CENTROAMÉRICA, S. A.—RECSA
NOTES TO THE FINANCIAL STATEMENTS AS OF DECEMBER 31, 2015, 2014 AND 2013,
AND FOR THE YEARS ENDED DECEMBER 31, 2015, 2014 AND 2013
(Stated in US Dollars, except otherwise indicated)
| 2. | APPLICATION OF NEW AND REVISED INTERNATIONAL FINANCIAL STANDARDS (IFRS) (cont’d) |
Amendments to IAS 12 Related to the Recognition of Deferred Tax Assets for Unrealized Losses
On January 19, 2016, the IASB published final amendments to IAS 12. The amendments clarify the following:
| • | Unrealized losses on debt instruments measured at fair value and measured at cost for tax purposes “give rise to a deductible temporary difference [regardless] of whether the debt instrument’s holder expects to recover the carrying amount of the debt instrument by sale or by use.” |
| • | “The carrying amount of an asset does not limit the estimation of probable future taxable profit.” |
| • | Estimates of future taxable profit exclude “tax deductions resulting from the reversal of deductible temporary differences.” |
| • | An entity assesses a deferred tax asset in combination with other deferred tax assets. When tax law restricts the utilization of tax losses, an entity assesses a deferred tax asset in combination with other deferred tax assets of the same type. |
The amendments are effective for annual periods beginning on or after January 1, 2017; earlier application is permitted. The management of the Company do not anticipate that the application of these amendments will have a material effect on the Company’s financial statements.
Annual Improvements to IFRS Term 2012-2014
The annual improvements of the IFRS’s of term 2012-2014 include a number of amendments to several IFRS’s which are summarized as follows:
Amendments to IFRS 5 show a specific orientation in IFRS 5, that is when the entity reclassifies an asset (or disposal group) held for sale to held for its distribution to owners (or vice versa).
Amendments to IFRS 7 provide an additional guideline to clarify whether a contract of services rendering corresponds to the continuous sharing participation in the transfer of an asset transferred for information disclosure effects of such asset.
Amendments to IAS 19 clarify that the rate used in order to discount the obligations from post-employment benefits must be determined in relation with the market yields on high quality corporate bonds at the end of the reporting period.
The management of the Company do not anticipate that the application of these amendments and improvements will have a material effect on the Company’s financial statements.
F-502
Table of Contents
REDES ELÉCTRICAS DE CENTROAMÉRICA, S. A.—RECSA
NOTES TO THE FINANCIAL STATEMENTS AS OF DECEMBER 31, 2015, 2014 AND 2013,
AND FOR THE YEARS ENDED DECEMBER 31, 2015, 2014 AND 2013
(Stated in US Dollars, except otherwise indicated)
| 3. | SIGNIFICANT ACCOUNTING POLICIES |
The significant accounting policies used in the preparation of the financial statements are described as follows:
| a. | Statement of Compliance and Basis of Preparation—These financial statements were prepared according to the International Financial Reporting Standards (IFRS) as issued by the International Accounting Standards Board (IASB) in force at December 31, 2015, which include the International Financial Reporting Standards (IFRS), the International Accounting Standards (IAS), and the interpretations issued by the International Financial Reporting Standards Committee (IFRIC), or by the former Standard Interpretation Committee (SIC) adopted by the IASB. The financial statements have been prepared on the historical cost basis except for certain financial instruments that are measured at fair values at the end of each reporting period, if any, as explained in the accounting policies below. The historical cost is based generally in the fair value of the consideration given in exchange of goods and services. |
Fair value is the price that would be received when selling an asset, or paid to transfer a liability in an orderly transaction among the market participants in a measurement date, without considering the fact that such price is directly observable or estimated through another valuation technique. When estimating the fair value of an asset or liability, the Company considers the characteristics of such asset or liability in case that the market participants will take these characteristics into consideration when establishing a price at the measurement date. Fair value for measurement and/or disclosure purposes in the financial statements are considered over that basis, except leasing transactions (within the scope of the IAS 17) and the measurements that has some similarity to the fair value but are not the fair value, such as the value in use under IAS 36.
In addition, for reporting purposes, the fair value measurements are categorized in three levels: 1, 2 or 3, based on the degree to which the inputs to the fair value measurements are observable and the significance of the inputs to the fair value measurement in its entirety, which are described as follows:
| • | Level 1: The inputs are related to quoted prices (not adjusted) in active markets for assets or liabilities identical to those that the Company may access at the date of measurement; |
| • | Level 2: The inputs are different from the quoted prices included in Level 1, which are observable for the asset or liability, either directly or indirectly; and |
| • | Level 3: The inputs are not observable for the asset or liability. |
| b. | Functional and Presentation Currency |
The Company’s functional currency is the Quetzales (Q.), which is the currency of the primary economic environment in which the Company operates. The Quetzal is the legal monetary unit of Guatemala. The presentation currency for these financial statements is the United States Dollar (US$).
When preparing the Company´s financial statements, the transactions in currencies other than the functional currency (foreign currencies) are recognized using the exchange rates prevailing at the dates of the transactions. At the end of each reporting period, monetary items denominated in foreign currency
F-503
Table of Contents
REDES ELÉCTRICAS DE CENTROAMÉRICA, S. A.—RECSA
NOTES TO THE FINANCIAL STATEMENTS AS OF DECEMBER 31, 2015, 2014 AND 2013,
AND FOR THE YEARS ENDED DECEMBER 31, 2015, 2014 AND 2013
(Stated in US Dollars, except otherwise indicated)
| 3. | SIGNIFICANT ACCOUNTING POLICIES (cont’d) |
are retranslated at the exchange rates prevailing at that date. Non-monetary items carried at fair value, denominated in foreign currency, are retranslated at the exchange rate effective prevailing on the date that it was determined fair value. Non-monetary items that are measured in terms of historic cost, in foreign currency, are not translated.
Exchange differences on monetary items are recognized in the profit or loss of the period in which they occur.
The Company has presented its financial statements in US$. Therefore, the financial statements prepared in the Company’s functional currency were converted into the presentation currency, as per the following procedures:
| • | Assets and liabilities of each of the statements of financial position presented are converted using the exchange rate at the statement of financial position closing date; |
| • | Items in the statement of profit or loss and other comprehensive income are converted using the exchange rate at the time the transactions were generated (or, for practical reasons, and provided the exchange rate has not changed significantly, using each month’s average exchange rate); |
All conversion differences resulting from the foregoing are recognized under “Other Comprehensive Income” and accumulated in equity.
| c. | Use of Estimates—The accounting policies that the Company follows require that the Management carries out certain estimates and uses certain assumptions in order to determine the carrying amounts of assets and liabilities that are not readily apparent from other sources included in the financial statements and carry out the corresponding disclosures. Even if they differ in their actual result, the Management considers that estimates and assumptions used were adequate under the circumstances. The estimates and associated assumptions are based on historical experience and other factors that are considered to be relevant. Actual results may differ from these estimates. |
The estimates and underlying assumptions are reviewed on an ongoing basis. Revisions to accounting estimates are recognized in the period in which the estimate is revised. If the revision affects only that period, or in the period of the revision and future periods if the revision affects both current and future periods.
Critical Accounting Estimates and Assumptions
The Company prepares estimates and assumptions with regards to the future. Actual results may differ from these estimates.
The following are the key assumptions concerning the future, and other key sources of estimation uncertainty at the end of the reporting period that may have a significant risk of causing a material adjustment to the carrying amounts of assets and liabilities.
| • | Toll Delivered not Billed |
The Company records the unbilled revenue obtained for the toll services of electric energy based on estimates carried on considering the actual services provided to each year-end. This provision consists in estimating the toll delivered since the last measurement date and the accounting close period at the tariffs approved by the CNEE.
F-504
Table of Contents
REDES ELÉCTRICAS DE CENTROAMÉRICA, S. A.—RECSA
NOTES TO THE FINANCIAL STATEMENTS AS OF DECEMBER 31, 2015, 2014 AND 2013,
AND FOR THE YEARS ENDED DECEMBER 31, 2015, 2014 AND 2013
(Stated in US Dollars, except otherwise indicated)
| 3. | SIGNIFICANT ACCOUNTING POLICIES (cont’d) |
| • | Useful Lives of Property, Plant and Equipment |
The Company reviews the estimated useful life of property, plant and equipment at the end of each annual period. The estimated useful lives represent a critical accounting estimate and are detailed on note 3d.
| d. | Property, Plant and Equipment—The technical facilities are recorded at cost less the subsequent accumulated depreciation and any recognized impairment loss. |
Assets in the course of construction for production, supply or administrative purposes are carried at cost, less any recognized impairment loss. Cost includes professional fees and, for qualifying assets, borrowing costs capitalized in accordance with the Company’s accounting policy. Such assets are classified to the appropriate categories of property, plant and equipment when completed and ready for intended use. Depreciation of these assets, on the same basis as other property assets, commences when the assets are ready for their intended use.
Tooling, furniture and other equipment are stated at cost less accumulated depreciation and accumulated impairment losses.
Property, plant and equipment assets that require a process of construction are recorded at cost, which correspond mainly to the following concepts:
| 1. | Cost of expansion or improvement: The improvements that substantially extent the useful life of the property, plant and equipment are recorded increasing its value, while maintenance, repairs and minor improvements are recorded in profit or loss of the period when incurred. |
| 2. | Replacement or refurbishments: The replacement or refurbishments of complete items are recognized as an addition to the item and the corresponding derecognition of the item replaced. |
Depreciation is recognized in profit or loss.
Freehold land is not depreciated.
Depreciation is recognized so as to write off the cost of assets (other than freehold land and properties under construction) less their residual values.
F-505
Table of Contents
REDES ELÉCTRICAS DE CENTROAMÉRICA, S. A.—RECSA
NOTES TO THE FINANCIAL STATEMENTS AS OF DECEMBER 31, 2015, 2014 AND 2013,
AND FOR THE YEARS ENDED DECEMBER 31, 2015, 2014 AND 2013
(Stated in US Dollars, except otherwise indicated)
| 3. | SIGNIFICANT ACCOUNTING POLICIES (cont’d) |
The property, plant and equipment is depreciated under the straight-line method considering the estimated useful lives set out as follows:
Percentage | Estimated | |||||||
Technical facilities | 3.33 | % | 30 | |||||
Equipment, furniture and tools | 20 | % | 5 | |||||
The estimated useful life, the residual value and the depreciation method are reviewed at the end of each reporting period, being the effect of any change in the estimate recognized on a prospective basis.
An item of property, plant and equipment is derecognized upon disposal or when no future economic benefits are expected to arise from the continued use of the asset. Any gain or loss arising on the disposal or retirement of an item of property, plant and equipment is determined as the difference between the sales proceeds and the carrying amount of the asset and is recognized in profit or loss.
| e. | Impairment of Tangible Assets—The Company reviews at the end of each reporting period the carrying amounts of its tangible assets, to determine if there is evidence that such assets may have suffered an impairment loss. If there is any evidence, the recoverable amount of the asset is calculated with the purpose of determining the extent of the impairment loss (if any). When it is not possible to estimate the recoverable value of an individual asset, the Company estimates the recoverable value of the cash-generating unit to which the asset belongs. Where a consistent and fair distribution basis is identified, the common assets are also distributed to the individual cash-generating unit, or to the smaller group of cash-generating units for which a consistent and fair distribution basis is identified. |
The recoverable value is the higher value between the fair value less the cost of selling it and the value in use. The value in use is determined based on the future estimated cash flows discounted at its present value, using a discount rate before tax that reflects the current market valuations with regard to the time value of money and the specific risks of the asset for which the estimates of future cash flows have not been adjusted.
If the recoverable amount of an asset (or cash-generating unit) were estimated to be less than its carrying amount, the carrying amount of the asset (cash-generating unit) would be reduced to its recoverable value. An impairment loss is recognized as an expense.
When an impairment loss subsequently reverses, the carrying amount of the asset (or a cash-generating unit) is increased to the revised estimate of its recoverable amount, but so that the increased carrying amount does not exceed the carrying amount that would have been determined had no impairment loss been recognized for the asset (or cash-generating unit) in prior years. A reversal of an impairment loss is recognized immediately in profit or loss.
| f. | Revenue Recognition—Toll Services—Revenue is measured at the fair value of the consideration received or receivable. Revenue is reduced for estimated allowances. Revenue is recognized when it is probable that the economic benefits related with the transaction flow into the Company and the amount of revenue can be measured reliably. Its main activity is the transmission and transformation of electricity (toll). |
F-506
Table of Contents
REDES ELÉCTRICAS DE CENTROAMÉRICA, S. A.—RECSA
NOTES TO THE FINANCIAL STATEMENTS AS OF DECEMBER 31, 2015, 2014 AND 2013,
AND FOR THE YEARS ENDED DECEMBER 31, 2015, 2014 AND 2013
(Stated in US Dollars, except otherwise indicated)
| 3. | SIGNIFICANT ACCOUNTING POLICIES (cont’d) |
Toll Service
Revenue from toll services is recognized in the accounting periods in which the services are rendered.
Additionally, revenues are recognized from service rendered but unbilled at the closing date of each financial year through an estimation made by management.
These estimates are billed on the following month to its recognition, based on the Report of Economic transactions from the distributors market.
| g. | Legal Reserve—In accordance with the Commerce Code of Guatemala, all mercantile companies must separate on an annual basis five per cent of their net taxable profit to constitute the legal reserve, which cannot be distributed as dividends until the Company is liquidated. However, this reserve can be capitalized when it becomes equivalent to, or represents more than 15 per cent of the paid-in capital at the end of the previous period, notwithstanding continuing to reserve such five (5%) percent annually. |
| h. | Provisions for Contingencies—The Company recognizes a provision only when it has a present obligation (legal or constructive) as a result of a past event, it is probable that the Company will be required to cancel the obligation and a reliable estimate of the obligation amount can be made. |
Provisions are revised at the balance sheet date.
The amount recognized as a provision is the best estimate of the consideration required to settle the present obligation at the end of the reporting period, taking into account the risks and uncertainties surrounding the obligation (Note 16). When a provision is measured using the cash flows estimated to settle the present obligation, its carrying amount is the present value of those cash flows (when the effect of the time value of money is material).
When some or all of the economic benefits required to settle a provision are expected to be recovered from a third party, a receivable is recognized as an asset if it is virtually certain that reimbursement will be received and the amount of the receivable can be measured reliably.
| i. | Provision for Severance Compensation—In conformity with the Labor Code of the Republic of Guatemala, the Company is obligated to pay severance compensation to employees dismissed under certain circumstances, like reorganizations, at an amount equal to one month salary plus the twelfth part of the Christmas bonus and mid-year bonus for each year of service rendered. The Company charges to profit or loss the severance payments when the employees are actually dismissed except for the case of former employees of the National Institute of Electrification (“INDE” in Spanish), which are under a specific collective agreement, where the Company has to pay the severance compensation irrespective of the circumstances that trigger the termination of their labor relationship with the Company (i.e. dismissal, resignation, death, etc.). The severance amount for these employees is calculated over the abovementioned basis plus an additional half monthly salary per each year of service. To cover such obligation, the Company records a monthly provision of 14.69 % over the total amount of the salaries of such employees. |
F-507
Table of Contents
REDES ELÉCTRICAS DE CENTROAMÉRICA, S. A.—RECSA
NOTES TO THE FINANCIAL STATEMENTS AS OF DECEMBER 31, 2015, 2014 AND 2013,
AND FOR THE YEARS ENDED DECEMBER 31, 2015, 2014 AND 2013
(Stated in US Dollars, except otherwise indicated)
| 3. | SIGNIFICANT ACCOUNTING POLICIES (cont’d) |
As of December 31 2015, 2014 and 2013, the Company carried out an actuarial calculation to determine the maximum obligation for the referred severance obligation. The Company has classified this obligation as a defined benefit retirement plan. For those plans, the cost of providing benefits is determined using the projected unit credit method, with actuarial valuations being carried out at the end of each annual reporting period. Remeasurement, comprising actuarial gains and losses and the effect of the changes to the asset ceiling (if applicable), is reflected immediately in the statement of financial position with a charge or credit recognized in other comprehensive income in the period in which they occur. Remeasurement recognized in other comprehensive income is reflected immediately in retained earnings and will not be reclassified to profit or loss.
At December 31, 2015, 2014 and 2013, the obligation amounts to US$ 35,324, US$ 30,238 and US$ 44,670 respectively. The abovementioned maximum obligation represents the present value of the future benefits that the employees will receive (Note 16).
| j. | Financial Instruments—Financial assets and liabilities are recognized when the Company becomes part of the contractual provisions of the instrument. |
The financial assets and liabilities are measured initially at fair value. The costs of the transaction which are attributable directly to the acquisition or issuing of the financial assets or liabilities (different from financial assets and liabilities measured at fair value through profit or loss) are added or deducted from the fair value of the financial assets or liabilities, if appropriate, at their initial recognition. The costs of transaction attributable directly to the acquisition of financial assets or liabilities measured at fair value through profit or loss are recognized immediately in profit or loss.
Financial Assets
Financial assets are classified within the following categories, if any: financial assets “at fair value through profit or loss’ (FVTPL)”, “held-to-maturity’ investments”, “financial assets available for sale”, and “loans and receivable”. Classification depends on the nature and purpose of the financial assets and is determined at the initial recognition. All regular purchases and sales of financial assets are recognized and derecognized on a trade date basis. Regular purchases or sales are those purchases or sales of financial assets that require the delivery of the asset within a time frame established by a market regulation or agreement.
Effective Interest Rate Method
The effective interest rate method is a calculation method of the amortized cost of a financial instrument and of allocating interest income over the relevant period. The effective interest rate is the rate that exactly discounts estimated future cash receipts or paid (including commission, basic points of interests paid or received, transaction costs and other premium or discount included in the calculation of the effective interest rate) throughout the expected life of the financial instrument or, when appropriate, in a shorter period, to the net carrying amount at the initial recognition.
Income is recognized on the basis of the effective interest rate for debt instruments different from the financial assets classified at fair value through profit or loss.
F-508
Table of Contents
REDES ELÉCTRICAS DE CENTROAMÉRICA, S. A.—RECSA
NOTES TO THE FINANCIAL STATEMENTS AS OF DECEMBER 31, 2015, 2014 AND 2013,
AND FOR THE YEARS ENDED DECEMBER 31, 2015, 2014 AND 2013
(Stated in US Dollars, except otherwise indicated)
| 3. | SIGNIFICANT ACCOUNTING POLICIES (cont’d) |
Loans and receivables
Loans and receivable are non-derivative financial assets with fixed or determinable payments that are not quoted in an active market. Loans and receivable (including trade receivables, other receivables, among others) are measured at the amortized cost using effective interest method, less any impairment. The income from interest is recognized by applying the effective interest rate, except for short term receivable accounts when the effect of discounting is immaterial.
Impairment of Financial Assets
The financial assets other than those measured at fair value through profit or loss are assessed for indicators of impairment at the end of each reporting period. A financial asset is considered to be impaired when there is objective evidence that as a consequence of one or more events occurred after the initial recognition of the financial asset the estimated future cash flow of the financial asset have been affected.
For certain categories of financial assets, such as trade receivables, assets are assessed for impairment on a collective basis even if they were assessed not to be impaired individually. Within the objective evidence in case of an impaired receivable portfolio, it could be included the past experience of the Company regarding the collection of payments, an increase of the number of late payments in the portfolio that exceeds the average credit period of 30 days, as well as the observable changes in the local and national economic conditions that relate with default on receivables.
For the financial assets carried at the amortized cost, the amount from impairment loss is the difference between the carrying amount and the present value of the estimated future cash flow of the asset, discounted at the original effective interest rate of the financial asset.
The carrying amount of the financial asset is reduced by the impairment loss directly for all financial assets, except for the trade receivables, where the carrying amount is reduced through an allowance account. When it is considered that a commercial account receivable is uncollectable, it is thus written off against the allowance account. The subsequent recovery of the amounts previously written off, turns into credit against the allowance account. Changes in the carrying amount of the provision account are recognized in the profit or loss.
Derecognition of Financial Assets
The Company derecognizes financial asset when the contractual rights on the cash flow of the financial asset expire, or when it transfers the financial asset and substantially all the risks and rewards of ownership of the asset to another party. If the Company does not transfer, nor retains substantially all the risks and rewards inherent to the ownership and continues to control of the transferred asset, the Company will recognize its participation in the asset and the related liability for the amounts payable. If the Company retains substantially all the risks and advantages inherent to the ownership of a transferred financial asset, the Company will recognize the financial asset and also will recognize a collateral loan for the proceeds received.
F-509
Table of Contents
REDES ELÉCTRICAS DE CENTROAMÉRICA, S. A.—RECSA
NOTES TO THE FINANCIAL STATEMENTS AS OF DECEMBER 31, 2015, 2014 AND 2013,
AND FOR THE YEARS ENDED DECEMBER 31, 2015, 2014 AND 2013
(Stated in US Dollars, except otherwise indicated)
| 3. | SIGNIFICANT ACCOUNTING POLICIES (cont’d) |
On derecognition of a financial asset in its entirety, the difference between the carrying amount of the asset and the sum of the received consideration received and to be received, as well as the accumulated gain or loss that had been recognized in other comprehensive income and accumulated in equity is recognized in profit or loss.
On derecognition of a financial asset other than in its entirety (e.g., when the Company retains the option to reacquire part of the transferred asset), the Company allocates the previous carrying amount of the financial asset between the part still recognized under a continuous involvement and the part that it no longer recognizes on the basis of the relative fair value of those parts at the date of the transfer. The difference between the carrying amount allocated to the part that will not be recognized anymore and the sum of the consideration received from the part that will not more be recognized and any accumulated profit or loss allocated that would have been recognized in other comprehensive income is recognized in profit or loss. The accumulated profit or loss that would have been recognized in other comprehensive income is distributed between the part that remains being recognized and the part that will not be recognized anymore based on the fair values of both parts.
Financial Liabilities and Equity Instruments Classification as debt or equity
Debt and equity instruments are classified as financial liabilities or as equity in conformity with the substance of the contractual agreement and the definitions of the financial liability and equity instrument.
Financial Liabilities
Financial liabilities (including loans and commercial payable accounts and others) are measured subsequently at the amortized cost using the effective interest rate method.
The effective interest rate method is a calculation method of the amortized cost of a financial liability and of the allocation of a financial expense throughout the relevant period. The effective interest rate is the rate that exactly discounts estimated future cash receipts or paid (including the fees and points paid or received that form part of the effective interest rate, the transaction costs or other premiums or discounts) estimated throughout the expected life of the financial liability (or, when appropriate), in a shorter period with the net carrying amount at its initial recognition.
Derecognition of a Financial Liability
The Company derecognizes a financial liability if solely the Company’s obligations have expired or have been cancelled. The difference between the book value of the derecognized financial liability and the consideration paid and payable are recognized in income.
| k. | Income Tax—Income tax expense represents the sum of the income tax currently payable and deferred tax. The expenditure due to income tax of the fiscal year consist of applying the rate of 5% to the first US$ 3,916 (equivalent to 30,000 Quetzales) of monthly taxable income while the taxable income in excess of such amount pay at the 7% rate. As of December 31, 2015, 2014 and 2013 there were no significant temporary differences that generate deferred income tax. |
F-510
Table of Contents
REDES ELÉCTRICAS DE CENTROAMÉRICA, S. A.—RECSA
NOTES TO THE FINANCIAL STATEMENTS AS OF DECEMBER 31, 2015, 2014 AND 2013,
AND FOR THE YEARS ENDED DECEMBER 31, 2015, 2014 AND 2013
(Stated in US Dollars, except otherwise indicated)
| 3. | SIGNIFICANT ACCOUNTING POLICIES (cont’d) |
| l. | Cash and Cash Equivalents—Includes balance in cash and banks. Balances in banks are available on demand, and there is no restriction to their use. |
| 4. | MONETARY UNIT AND EXCHANGE RATE |
The currency of Guatemala is the Quetzal, represented by the “Q” symbol in the financial statements.
The Bank of Guatemala, entity authorized by the Monetary Board to implement its monetary, exchange and credit policies, publishes periodically the reference exchange rate to be used in the banking system. According to Resolution JM 31-2009 dated March 18, 2009, the method to determine the exchange rate consists on using the weighted average exchange rate of the total sum of the purchase and sale of foreign currency carried out daily by the institutions that constitute the institutional foreign currency market. As of December 31, 2015, 2014 and 2013, the reference exchange rate published by the Bank of Guatemala was Q. 7.63, Q. 7.60 and 7.84, respectively for US$ 1.
There are no exchange restrictions in Guatemala for the capital repatriation, payment of debts or any other purpose; foreign currency can be freely negotiated in any amount in the banks of the system or in the authorized exchange offices, in conformity with the statutory regulation in force, according to Decree No. 94-2000 Free Foreign Currency Negotiation Act.
| 5. | COST OF SERVICES |
For the years ended December 31, 2015, 2014 and 2013, it was comprised as follows:
2015 | 2014 | 2013 | ||||||||||
Depreciations | US$ | 467,012 | US$ | 310,144 | US$ | 305,270 | ||||||
Installations maintenance | 240,320 | 222,192 | �� | 132,862 | ||||||||
Building maintenance | 5,811 | 2,235 | 2,123 | |||||||||
Other | 20,629 | 15,263 | 11,026 | |||||||||
|
|
|
|
|
| |||||||
| US$ | 733,772 | US$ | 549,834 | US$ | 451,281 | |||||||
|
|
|
|
|
| |||||||
| 6. | GENERAL, SELLING AND ADMINISTRATIVE EXPENSES |
The amounts that include the administrative expenses for the years ended December 31, 2015, 2014 and 2013 are set out below:
2015 | 2014 | 2013 | ||||||||||
Salaries and wagesa/ | US$ | 104,382 | US$ | 103,148 | US$ | 93,635 | ||||||
Insurance premiums | 54,997 | 46,614 | 37,176 | |||||||||
Connection costs | 38,092 | 26,805 | 29,328 | |||||||||
Electricity supply | 28,217 | 20,132 | 14,010 | |||||||||
Other | 12,151 | 17,755 | 20,645 | |||||||||
|
|
|
|
|
| |||||||
| US$ | 237,839 | US$ | 214,454 | US$ | 194,794 | |||||||
|
|
|
|
|
| |||||||
F-511
Table of Contents
REDES ELÉCTRICAS DE CENTROAMÉRICA, S. A.—RECSA
NOTES TO THE FINANCIAL STATEMENTS AS OF DECEMBER 31, 2015, 2014 AND 2013,
AND FOR THE YEARS ENDED DECEMBER 31, 2015, 2014 AND 2013
(Stated in US Dollars, except otherwise indicated)
| 6. | GENERAL, SELLING AND ADMINISTRATIVE EXPENSES (cont’d) |
| a/ | The expenditures of personnel for the years ended December 31, 2015, 2014 and 2013 are as follows: |
2015 | 2014 | 2013 | ||||||||||
Wages and related expenses | US$ | 95,761 | US$ | 94,861 | US$ | 85,827 | ||||||
Social security | 8,621 | 8,287 | 7,808 | |||||||||
|
|
|
|
|
| |||||||
| US$ | 104,382 | US$ | 103,148 | US$ | 93,635 | |||||||
|
|
|
|
|
| |||||||
| 7. | FINANCE EXPENSES |
The amounts that include the financial expenses for the years ended December 31, 2015, 2014 and 2013 are as follows:
2015 | 2014 | 2013 | ||||||||||
Interest expense | US$ | 320,025 | US$ | 316,744 | US$ | 216,678 | ||||||
Exchange differences | 9,228 | 9,534 | — | |||||||||
|
|
|
|
|
| |||||||
| US$ | 329,253 | US$ | 326,278 | US$ | 216,678 | |||||||
|
|
|
|
|
| |||||||
| 8. | INCOME TAX |
The income tax of the year is made up as follows:
Tax on profit recognized in profit or loss of the year:
2015 | 2014 | 2013 | ||||||||||
Current income tax | US$ | 129,549 | US$ | 89,301 | US$ | 75,677 | ||||||
Deferred income tax | (1,782 | ) | 1,764 | — | ||||||||
|
|
|
|
|
| |||||||
| US$ | 127,767 | US$ | 91,065 | US$ | 75,677 | |||||||
|
|
|
|
|
| |||||||
Income tax legislation currently in force in 2015, 2014 and 2013—Since January 1, 2013, new rules for income tax are in effect and are included on Book 1 of The Law of Fiscal Actualization, Decree 10-2012. This new rules take into account two regimes to pay the tax, and are in effect from the year ended December 31, 2013:
| a) | Regime on Earnings from Profit Activities which consists on applying a rate of 25% in 2015 (28% in 2014) on the taxable income determined from the accounting profit. Tax is paid through quarterly overdue payments with final determination at year-end. |
| b) | Simplified Optional Regime on Income from Profit Activities consisting on applying the rate of 7% to the total amount of taxable income, paying this tax through definitive withholding or else, through payment in agencies authorized by the tax authorities. The first US$ 3,916 (equivalent to 30,000 Quetzales) of monthly taxable income pay 5% tax while the taxable income in excess of such amount should pay at the 7% rate. |
F-512
Table of Contents
REDES ELÉCTRICAS DE CENTROAMÉRICA, S. A.—RECSA
NOTES TO THE FINANCIAL STATEMENTS AS OF DECEMBER 31, 2015, 2014 AND 2013,
AND FOR THE YEARS ENDED DECEMBER 31, 2015, 2014 AND 2013
(Stated in US Dollars, except otherwise indicated)
| 8. | INCOME TAX (cont’d) |
For the years ended December 31, 2015, 2014 and 2013 the Company has chosen the Simplified Optional Regime on Income from Profit activities.
New regulations to income tax establish a tax of 5% on the dividend and profit distributions for both residents and non-residents.
In addition, a new Regime on Capital Income, Capital Gains and Losses, which sets out a rate of 10% for capital income related to movable property and real estate, as well as net capital income.
As of December 31, 2015, 2014 and 2013, the reconciliation of the income tax expense calculated at the statutory income tax rate and the income taxes recorded in the statement of profit or loss and other comprehensive income is as follows:
2015 | 2014 | 2013 | ||||||||||
Current tax - | ||||||||||||
Toll services | US$ | 1,969,705 | US$ | 1,277,938 | US$ | 1,268,305 | ||||||
Expenses for provisions not-deductible for income tax under the selected regime by the Companya/ | (108,251 | ) | 7,028 | 608 | ||||||||
Other income | — | 325 | — | |||||||||
Income that is affected by 5% | (47,024 | ) | (46,542 | ) | (45,809 | ) | ||||||
|
|
|
|
|
| |||||||
Taxable income | 1,814,431 | 1,238,749 | 1,223,104 | |||||||||
Tax rate | 7 | % | 7 | % | 6 | % | ||||||
|
|
|
|
|
| |||||||
Income tax at the 7% tax rate | 127,011 | 86,712 | 73,386 | |||||||||
Income tax from capital gains | 187 | 262 | — | |||||||||
Income tax on income affected at the 5% tax rate | 2,351 | 2,327 | 2,291 | |||||||||
|
|
|
|
|
| |||||||
Income tax of the year | 129,549 | 89,301 | 75,677 | |||||||||
|
|
|
|
|
| |||||||
Payments made | ||||||||||||
Income tax capital gains | (187 | ) | (262 | ) | — | |||||||
Less—monthly income tax payments | (13,238 | ) | (13,652 | ) | (1,198 | ) | ||||||
Withholdings | (116,124 | ) | (75,387 | ) | (74,479 | ) | ||||||
|
|
|
|
|
| |||||||
Difference in payments | US$ | — | US$ | — | US$ | — | ||||||
|
|
|
|
|
| |||||||
| a/ | Corresponds to income provisions recorded at the closing of the period and that according with the adopted income tax regime by the Company, are not affected to pay income tax. |
Other important changes contained in the Regulations of the income tax in force since January 2013 are:
The special regulations about the pricing of transactions among related parties (transfer pricing regulation) originally came into effect on January 1, 2013. The transfer pricing regulations oblige all the taxpayers having transactions with related parties, non-resident in Guatemala, that impact the taxable
F-513
Table of Contents
REDES ELÉCTRICAS DE CENTROAMÉRICA, S. A.—RECSA
NOTES TO THE FINANCIAL STATEMENTS AS OF DECEMBER 31, 2015, 2014 AND 2013,
AND FOR THE YEARS ENDED DECEMBER 31, 2015, 2014 AND 2013
(Stated in US Dollars, except otherwise indicated)
| 8. | INCOME TAX (cont’d) |
base, to determine the prices of these transactions according to the Principle of Free Competition and that they document it in a Survey of Transfer Pricing. However, Section 27 of Decree 19-2013, published on December 20, 2013, suspended the application and validity of the transfer pricing regulation and established that the same are taking effect again and applied on January 1, 2015.
The management of the Company determined that it does not have transactions with related foreign companies subject to the transfer pricing regulation.
| 9. | PROPERTY, PLANT AND EQUIPMENT—NET |
Composition and movements at December 31, 2015, 2014 and 2013, and for the years then ended, of the items making up the cost of property, plant and equipment and their corresponding accumulated depreciation is as follows:
2015 | 2014 | 2013 | ||||||||||
Land | US$ | 259,013 | US$ | 214,438 | US$ | 207,748 | ||||||
Technical facilities | 11,510,302 | 7,403,932 | 7,478,069 | |||||||||
Equipment, furniture and tools | 3,959 | 3,646 | 4,357 | |||||||||
Assets under construction | 4,675,778 | 2,388,593 | ||||||||||
|
|
|
|
|
| |||||||
| US$ | 11,773,274 | US$ | 12,297,794 | US$ | 10,078,767 | |||||||
|
|
|
|
|
| |||||||
F-514
Table of Contents
REDES ELÉCTRICAS DE CENTROAMÉRICA, S. A.—RECSA
NOTES TO THE FINANCIAL STATEMENTS AS OF DECEMBER 31, 2015, 2014 AND 2013,
AND FOR THE YEARS ENDED DECEMBER 31, 2015, 2014 AND 2013
(Stated in US Dollars, except otherwise indicated)
| 9. | PROPERTY, PLANT AND EQUIPMENT—NET (cont’d) |
Movements for the year ended December 31, 2015:
Description | Land | Technical | Equipment, | Assets under c/ | Total | |||||||||||||||
Cost | ||||||||||||||||||||
Balance as of January 1, 2015 | US$ | 214,438 | US$ | 9,387,785 | US$ | 16,737 | US$ | 4,675,778 | US$ | 14,294,738 | ||||||||||
Additions | — | — | — | 1,306 | 1,306 | |||||||||||||||
Translation differences | (862 | ) | (29,805 | ) | (74 | ) | (35,968 | ) | (66,709 | ) | ||||||||||
Transfers | 45,437 | 4,594,373 | 1,306 | (4,641,116 | ) | — | ||||||||||||||
|
|
|
|
|
|
|
|
|
| |||||||||||
Cost as of December 31, 2015 | 259,013 | 13,952,353 | 17,969 | — | 14,229,335 | |||||||||||||||
Accumulated Depreciation | ||||||||||||||||||||
Balance as of January 1, 2015 | — | (1,983,853 | ) | (13,091 | ) | — | (1,996,944 | ) | ||||||||||||
Additions | (466,036 | ) | (976 | ) | (467,012 | ) | ||||||||||||||
Translation differences | — | 7,838 | 57 | — | 7,895 | |||||||||||||||
|
|
|
|
|
|
|
|
|
| |||||||||||
Total Accumulated Depreciation | — | (2,442,051 | ) | (14,010 | ) | — | (2,456,061 | ) | ||||||||||||
|
|
|
|
|
|
|
|
|
| |||||||||||
Balances as of December 31, 2015 | US$ | 259,013 | US$ | 11,510,302 | US$ | 3,959 | US$ | — | US$ | 11,773,274 | ||||||||||
|
|
|
|
|
|
|
|
|
| |||||||||||
F-515
Table of Contents
REDES ELÉCTRICAS DE CENTROAMÉRICA, S. A.—RECSA
NOTES TO THE FINANCIAL STATEMENTS AS OF DECEMBER 31, 2015, 2014 AND 2013,
AND FOR THE YEARS ENDED DECEMBER 31, 2015, 2014 AND 2013
(Stated in US Dollars, except otherwise indicated)
| 9. | PROPERTY, PLANT AND EQUIPMENT—NET (cont’d) |
Movements for the year ended December 31, 2014:
Description | Land | Technical | Equipment, | Assets under c/ | Total | |||||||||||||||
Cost | ||||||||||||||||||||
Balances as of January 1, 2014 | US$ | 207,748 | US$ | 9,094,923 | US$ | 16,215 | US$ | 2,388,593 | US$ | 11,707,479 | ||||||||||
Additions | — | — | — | 2,170,783 | 2,170,783 | |||||||||||||||
Translation differences | 6,690 | 292,862 | 522 | 116,402 | 416,476 | |||||||||||||||
|
|
|
|
|
|
|
|
|
| |||||||||||
Cost as of December 31, 2014 | 214,438 | 9,387,785 | 16,737 | 4,675,778 | 14,294,738 | |||||||||||||||
Accumulated depreciation | ||||||||||||||||||||
Balances as of January 1, 2014 | — | (1,616,854 | ) | (11,858 | ) | — | (1,628,712 | ) | ||||||||||||
Translation differences | — | (57,691 | ) | (396 | ) | — | (58,087 | ) | ||||||||||||
Additions | — | (309,308 | ) | (837 | ) | — | (310,145 | ) | ||||||||||||
|
|
|
|
|
|
|
|
|
| |||||||||||
Total Accumulated depreciation | — | (1,983,853 | ) | (13,091 | ) | — | (1,996,944 | ) | ||||||||||||
Balances as of December 31, 2014 | US$ | 214,438 | US$ | 7,403,932 | US$ | 3,646 | US$ | 4,675,778 | US$ | 12,297,794 | ||||||||||
|
|
|
|
|
|
|
|
|
| |||||||||||
Movements for the year ended December 31, 2013:
Description | Land | Technical Facilities a/ | Equipment, furniture and toolsb/ | Assets under construction c/ | Total | |||||||||||||||
Cost | ||||||||||||||||||||
Balances as of January 1, 2013 | US$ | 206,146 | US$ | 9,024,797 | US$ | 16,090 | US$ | 1,431,280 | US$ | 10,678,313 | ||||||||||
Additions | — | — | — | 944,094 | 944,094 | |||||||||||||||
Translation differences | 1,602 | 70,126 | 125 | 13,219 | 85,072 | |||||||||||||||
|
|
|
|
|
|
|
|
|
| |||||||||||
Cost as of December 31, 2013 | 207,748 | 9,094,923 | 16,215 | 2,388,593 | 11,707,479 | |||||||||||||||
Accumulated depreciation | ||||||||||||||||||||
Balances as of January 1, 2013 | — | (1,301,630 | ) | (10,934 | ) | — | (1,312,564 | ) | ||||||||||||
Translation differences | — | (10,791 | ) | (87 | ) | — | (10,878 | ) | ||||||||||||
Additions | — | (304,433 | ) | (837 | ) | — | (305,570 | ) | ||||||||||||
|
|
|
|
|
|
|
|
|
| |||||||||||
Total Accumulated depreciation | — | (1,616,854 | ) | (11,858 | ) | — | (1,628,712 | ) | ||||||||||||
|
|
|
|
|
|
|
|
|
| |||||||||||
Balances as of December 31, 2013 | US$ | 207,748 | US$ | 7,478,069 | US$ | 4,357 | US$ | 2,388,593 | US$ | 10,078,767 | ||||||||||
|
|
|
|
|
|
|
|
|
| |||||||||||
F-516
Table of Contents
REDES ELÉCTRICAS DE CENTROAMÉRICA, S. A.—RECSA
NOTES TO THE FINANCIAL STATEMENTS AS OF DECEMBER 31, 2015, 2014 AND 2013,
AND FOR THE YEARS ENDED DECEMBER 31, 2015, 2014 AND 2013
(Stated in US Dollars, except otherwise indicated)
| 9. | PROPERTY, PLANT AND EQUIPMENT—NET (cont’d) |
Breakdown by line item of the cost of Property, Plant and Equipment:
2015 | 2014 | 2013 | ||||||||||
a/ Technical facilities | ||||||||||||
Transport | ||||||||||||
Transport lines | US$ | 3,333,854 | US$ | 1,320,827 | US$ | 1,279,622 | ||||||
Sub-stations | 6,695,204 | 4,136,714 | 4,007,665 | |||||||||
Distribution | ||||||||||||
Sub-stations of distribution | 3,910,242 | 3,928,577 | 3,806,021 | |||||||||
Measurement devices | 11,394 | — | — | |||||||||
Telecommunications | ||||||||||||
Technical facilities of telecommunications | 1,659 | 1,667 | 1,615 | |||||||||
|
|
|
|
|
| |||||||
Total | US$ | 13,952,353 | US$ | 9,387,785 | US$ | 9,094,923 | ||||||
|
|
|
|
|
| |||||||
b/ Equipment, furniture and tools | ||||||||||||
Tools, furniture and equipment | US$ | 11,314 | US$ | 11,367 | US$ | 11,013 | ||||||
Process information equipment | 6,655 | 5,370 | 5,202 | |||||||||
|
|
|
|
|
| |||||||
Total | US$ | 17,969 | US$ | 16,737 | US$ | 16,215 | ||||||
|
|
|
|
|
| |||||||
c/ Assets under construction | ||||||||||||
Transport | ||||||||||||
Transport lines | US$ | — | US$ | 2,647,120 | US$ | 1,458,656 | ||||||
Sub-stations | — | 2,028,658 | 929,937 | |||||||||
|
|
|
|
|
| |||||||
Total | US$ | — | US$ | 4,675,778 | US$ | 2,388,593 | ||||||
|
|
|
|
|
| |||||||
| 10. | TAX ASSETS AND LIABILITIES |
At December 31, 2015, 2014 and 2013, tax assets and liabilities are composed as follows:
2015 | 2014 | 2013 | ||||||||||
Tax assets | ||||||||||||
Value Added Tax (VAT) | US$ | 608,427 | US$ | 789,404 | US$ | 616,596 | ||||||
Credit withholdings VAT | 225,767 | 194,414 | 163,790 | |||||||||
|
|
|
|
|
| |||||||
Total | US$ | 834,194 | US$ | 983,818 | US$ | 780,386 | ||||||
Current tax assets | US$ | 170,327 | US$ | 178,124 | US$ | 98,150 | ||||||
Non-current tax assets | US$ | 663,867 | US$ | 805,694 | US$ | 682,236 | ||||||
Tax liabilities | ||||||||||||
Income tax payable | US$ | 1,086 | US$ | 1,118 | US$ | 892 | ||||||
Other taxes | 374 | 569 | — | |||||||||
|
|
|
|
|
| |||||||
| US$ | 1,460 | US$ | 1,687 | US$ | 892 | |||||||
|
|
|
|
|
| |||||||
F-517
Table of Contents
REDES ELÉCTRICAS DE CENTROAMÉRICA, S. A.—RECSA
NOTES TO THE FINANCIAL STATEMENTS AS OF DECEMBER 31, 2015, 2014 AND 2013,
AND FOR THE YEARS ENDED DECEMBER 31, 2015, 2014 AND 2013
(Stated in US Dollars, except otherwise indicated)
| 11. | TRADE RECEIVABLES |
At December 31, 2015, 2014 and 2013 the balance of trade receivables is composed as described below:
2015 | 2014 | 2013 | ||||||||||
Clients—tolls receivable | US$ | 318,294 | US$ | 210,654 | US$ | 211,016 | ||||||
|
|
|
|
|
| |||||||
The balances at December 31, 2015, 2014 and 2013 correspond to current receivables, which were not past due by the end of each fiscal year. The average credit period on tolls services is 30 days.
| 12. | CASH AND CASH EQUIVALENTS |
At December 31, 2015, 2014 and 2013 cash and cash equivalents is composed as follows:
2015 | 2014 | 2013 | ||||||||||
Cash | US$ | 170 | US$ | 131 | US$ | 127 | ||||||
Balances in local banks | 650,794 | 603,722 | 711,059 | |||||||||
|
|
|
|
|
| |||||||
| US$ | 650,964 | US$ | 603,853 | US$ | 711,186 | |||||||
|
|
|
|
|
| |||||||
| 13. | CAPITAL STOCK |
As of December 31, 2015, 2014 and 2013 the authorized capital of the Company was US$ 3,272,298 (25,000,000 Quetzales) represented by 250,000 shares with face value of US$ 13 (100 Quetzales) each, and on that dates there were 231,587 shares paid-in and subscribed that are equivalent to US$ 3,031,287.
| 14. | LEGAL RESERVE |
According with the Code of Commerce of the Republic of Guatemala, all mercantile society must separate at least annually the 5 percent of its net profits to create the legal reserve, and this cannot be distributed until the total liquidation of the society. However, this reserve may be capitalized when is greater than the 15 percent of the paid capital at the end of the previous period, notwithstanding continuing to reserve the five percent (5%), that was mentioned. The legal reserve as of December 31 2015 amounted to US$ 178,576, as of December 31, 2014 to US$ 150,690 and as of December 31, 2013 to US$ 145,291.
F-518
Table of Contents
REDES ELÉCTRICAS DE CENTROAMÉRICA, S. A.—RECSA
NOTES TO THE FINANCIAL STATEMENTS AS OF DECEMBER 31, 2015, 2014 AND 2013,
AND FOR THE YEARS ENDED DECEMBER 31, 2015, 2014 AND 2013
(Stated in US Dollars, except otherwise indicated)
| 15. | DEBT WITH FINANCIAL ENTITIES |
Debt with local financial entities for the years ending on December 31, 2015, 2014 and 2013 were as follows:
2015 | 2014 | 2013 | ||||||||||
Banco G&T Continental, S. A. | ||||||||||||
Loan with financial guarantee, yield a variable interest Annual rate of 7% annual. Term of 7 years and biannual payments of capital, with 24 months grace period for capital amortization. Due on November 30, 2020. | US$ | 4,585,731 | US$ | 4,607,233 | US$ | 4,463,506 | ||||||
Less | ||||||||||||
Short term portion | 917,146 | — | — | |||||||||
|
|
|
|
|
| |||||||
Total Long term loans | US$ | 3,668,585 | US$ | 4,607,233 | US$ | 4,463,506 | ||||||
|
|
|
|
|
| |||||||
| 16. | PROVISIONS |
As of December 31 2015, 2014 and 2013 the balances for provisions were the following:
2015 | 2014 | 2013 | ||||||||||
Provision for contingenciesa/ | US$ | 98,720 | US$ | 99,183 | US$ | 98,547 | ||||||
Provision for severance compensationb/ | 35,324 | 30,238 | 44,670 | |||||||||
|
|
|
|
|
| |||||||
| US$ | 134,044 | US$ | 129,421 | US$ | 143,217 | |||||||
|
|
|
|
|
| |||||||
| a/ | Provisions recorded by the Company as of December 31 2015, 2014 and 2013 correspond mainly to penalties imposed by the National Electric Energy Commission, as well as unfavorable judgments in the trials against it (Note 20). |
Account movement for the years 2015, 2014 and 2013 is as follows:
2015 | 2014 | 2013 | ||||||||||
Initial balance | US$ | 99,183 | US$ | 98,548 | US$ | 97,787 | ||||||
Payments | — | (2,493 | ) | — | ||||||||
Translation differences | (463 | ) | 3,128 | 760 | ||||||||
|
|
|
|
|
| |||||||
Final balance | US$ | 98,720 | US$ | 99,183 | US$ | 98,547 | ||||||
|
|
|
|
|
| |||||||
| b/ | As stated on Note 3i, the Company has the policy to pay universal severance over the base described in such note, plus the half of an additional salary, only for the employees included in the under collective agreement (former employee of INDE). |
F-519
Table of Contents
REDES ELÉCTRICAS DE CENTROAMÉRICA, S. A.—RECSA
NOTES TO THE FINANCIAL STATEMENTS AS OF DECEMBER 31, 2015, 2014 AND 2013,
AND FOR THE YEARS ENDED DECEMBER 31, 2015, 2014 AND 2013
(Stated in US Dollars, except otherwise indicated)
| 16. | PROVISIONS (cont’d) |
The movement of the account for the years 2015, 2014 and 2013 is as follows:
2015 | 2014 | 2013 | ||||||||||
Balance at January 1st | US$ | 30,238 | US$ | 44,670 | US$ | 35,322 | ||||||
Charges to provision | 9,995 | 9,609 | 9,073 | |||||||||
Actuarial gain | (4,783 | ) | (25,195 | ) | — | |||||||
Translation differences | (126 | ) | 1,154 | 275 | ||||||||
|
|
|
|
|
| |||||||
Final balance | US$ | 35,324 | US$ | 30,238 | US$ | 44,670 | ||||||
|
|
|
|
|
| |||||||
The following assumptions were used to recognize the liabilities of the benefits covered by the plans:
| Valuation date | December 31, 2015 | |
| Discount rate | 8.19% for the obligations Salaries increase | |
| Salaries increase | 5.00% annual | |
| Inflation | Not reflected specifically in the calculation, only the salary increase. | |
| Mortality | CSG-1960 | |
| Disability | No considerations | |
Leave rate | Calculated according with experience shown by the Company 1,62% | |
Dismissal rate | Correspond to the percentage of dismissal without just cause (94.8%) | |
Expenditures | Not considered | |
Age of retirement | 65 years old for all employees | |
Form of payment | Unique payment in case of leave either by dismissal or death |
| 17. | ACCOUNTS PAYABLE TO RELATED PARTIES |
Payable accounts—The balance of payable accounts to related parties as of December 31, 2015, 2014 and 2013 are detailed as follows:
2015 | 2014 | 2013 | ||||||||||
Short term payable loans | ||||||||||||
Comercializadora Guatemalteca Mayorista de Electricidad, S.A.a/ | US$ | — | US$ | 1,316,352 | US$ | 1,275,287 | ||||||
Short term payable accounts | ||||||||||||
Distribuidora de Electricidad de Oriente, S.A.b/ | 792,506 | 1,756,056 | — | |||||||||
|
|
|
|
|
| |||||||
| US$ | 792,506 | US$ | 3,072,408 | US$ | 1,275,287 | |||||||
Long term payable loans | ||||||||||||
Comercializadora Guatemalteca Mayorista de Electricidad, S.A.a/ | US$ | 1,144,387 | US$ | — | US$ | — | ||||||
|
|
|
|
|
| |||||||
| US$ | 1,936,893 | US$ | 3,072,408 | US$ | 1,275,287 | |||||||
|
|
|
|
|
| |||||||
| a/ | As of December 31, 2014 and as of December 31,2013 the payable account represents a loan received from GUATEMEL through a promissory note for US$ 1,316,352 and US$ 1,275,287 respectively, that did not |
F-520
Table of Contents
REDES ELÉCTRICAS DE CENTROAMÉRICA, S. A.—RECSA
NOTES TO THE FINANCIAL STATEMENTS AS OF DECEMBER 31, 2015, 2014 AND 2013,
AND FOR THE YEARS ENDED DECEMBER 31, 2015, 2014 AND 2013
(Stated in US Dollars, except otherwise indicated)
| 17. | ACCOUNTS PAYABLE TO RELATED PARTIES (cont’d) |
| earn interest and was renewable each month for a 30- day term. On December 31, 2015, the Company received an extension to the due date previously agreed with GUATEMEL and, as such, the note’s new maturity date will be on December 31, 2017. As of December 31, 2015, the Company recorded this note at its discounted amount of US$ 1,144,387. As such, the Company recognized the effect of the term extension directly to equity for US$ 165,318. |
| b/ | As of December 31, 2015 and 2014, corresponds to the payable account for the services rendered. There were no outstanding balance for service rendered during 2013. |
The amounts outstanding are unsecured and will be settled in cash. No guarantees have been given or received. No expense has been recognized in the current or prior years for bad or doubtful debts in respect of the amounts owed by related parties.
Main transactions held with related parties are as follows:
2015 | 2014 | 2013 | ||||||||||
Purchase of materials | ||||||||||||
Distribuidora de Electricidad de Occidente, S.A. | US$ | — | US$ | — | US$ | 15,668 | ||||||
Distribuidora de Electricidad de Oriente, S.A. | — | 24,616 | 2,326 | |||||||||
|
|
|
|
|
| |||||||
| US$ | — | US$ | 24,616 | US$ | 17,994 | |||||||
|
|
|
|
|
| |||||||
Toll service rendered | ||||||||||||
Distribuidora de Electricidad de Occidente, S.A. | US$ | 383,589 | US$ | 202,835 | US$ | 113,584 | ||||||
Distribuidora de Electricidad de Oriente, S.A. | 398,140 | 75,830 | 40,018 | |||||||||
Comercializadora Guatemalteca Mayorista de Electricidad, S.A. | 124,683 | 41,385 | 10,983 | |||||||||
|
|
|
|
|
| |||||||
| US$ | 906,412 | US$ | 320,050 | US$ | 164,585 | |||||||
|
|
|
|
|
| |||||||
Discount of accounts payable charged directly to equity | ||||||||||||
Comercializadora Guatemalteca Mayorista de Electricidad, S.A. | US$ | 165,318 | US$ | — | US$ | — | ||||||
|
|
|
|
|
| |||||||
Construction services received | ||||||||||||
Distribuidora de Electricidad de Oriente, S.A. | US$ | — | US$ | 2,404,874 | US$ | 1,051,684 | ||||||
|
|
|
|
|
| |||||||
Loans from related parties | ||||||||||||
Comercializadora Guatemalteca Mayorista de Electricidad, S.A. | US$ | — | US$ | — | US$ | 51,011 | ||||||
|
|
|
|
|
| |||||||
Operating Fee | ||||||||||||
Arthasan, S.A. | US$ | 4,981 | US$ | 5,084 | US$ | 4,450 | ||||||
|
|
|
|
|
| |||||||
Energy supplies for substations | ||||||||||||
Distribuidora de Electricidad de Occidente, S.A. | US$ | 25,043 | US$ | 17,214 | US$ | 29,037 | ||||||
Distribuidora de Electricidad de Oriente, S.A. | 16,320 | 34,344 | 560 | |||||||||
|
|
|
|
|
| |||||||
| US$ | 41,363 | US$ | 51,558 | US$ | 29,597 | |||||||
|
|
|
|
|
| |||||||
F-521
Table of Contents
REDES ELÉCTRICAS DE CENTROAMÉRICA, S. A.—RECSA
NOTES TO THE FINANCIAL STATEMENTS AS OF DECEMBER 31, 2015, 2014 AND 2013,
AND FOR THE YEARS ENDED DECEMBER 31, 2015, 2014 AND 2013
(Stated in US Dollars, except otherwise indicated)
| 17. | ACCOUNTS PAYABLE TO RELATED PARTIES (cont’d) |
RECSA’s executive officers do not receive compensation directly from RECSA; each is also an executive officer of Arthasan, S. A. and receives compensation directly from Arthasan, S.A. The aggregate annual compensation expenses related to RECSA executive officers during 2015, 2014 and 2013 were US$4,981, US$5,084 and US$4,450, respectively. (See Note 21).
| 18. | TRADE ACCOUNTS PAYABLE |
As of December 31 2015, 2014 and 2013, the payables with the suppliers are the following:
2015 | 2014 | 2013 | ||||||||||
Local suppliers | US$ | 50,679 | US$ | 109,362 | US$ | 56,649 | ||||||
Foreign suppliers | 3,316 | 9,255 | — | |||||||||
|
|
|
|
|
| |||||||
| US$ | 53,995 | US$ | 118,617 | US$ | 56,649 | |||||||
|
|
|
|
|
| |||||||
The credit period is 30 days. No interests are charged by the suppliers for delay in the payment of pending invoices.
| 19. | FINANCIAL INSTRUMENTS |
The Company manages its capital structure to make sure it continues as going concern, and it maximizes the return to its shareholders through the optimization of the debt and equity balances. The Company’s overall strategy remains unchanged from 2013.
The working capital structure of the Company is constituted by indebtness with financial cost (loans), offset by cash and cash equivalents balances and equity comprising issued capital, reserves, retained earnings as detailed in notes 13 and 14, attributed to the shareholders.
The main business of the Company is exposed to a variety of risks, which are presented as follows:
Net Debt Ratio
The financial management reviews the structure of capital biannually. As part of this review, it considers the cost of capital and the associated risk with every kind of capital.
As of December 31, the net debt ratio is as follows:
2015 | 2014 | 2013 | ||||||||||
Debt (loans) | US$ | 4,585,731 | US$ | 4,607,233 | US$ | 4,463,506 | ||||||
Cash and cash equivalents | (650,964 | ) | (603,853 | ) | (711,186 | ) | ||||||
|
|
|
|
|
| |||||||
Total net debt | US$ | 3,934,767 | US$ | 4,003,380 | US$ | 3,752,320 | ||||||
|
|
|
|
|
| |||||||
Equity | US$ | 6,869,338 | US$ | 6,168,086 | US$ | 5,844,306 | ||||||
|
|
|
|
|
| |||||||
Net debt ratio | 57 | % | 65 | % | 64 | % | ||||||
|
|
|
|
|
| |||||||
F-522
Table of Contents
REDES ELÉCTRICAS DE CENTROAMÉRICA, S. A.—RECSA
NOTES TO THE FINANCIAL STATEMENTS AS OF DECEMBER 31, 2015, 2014 AND 2013,
AND FOR THE YEARS ENDED DECEMBER 31, 2015, 2014 AND 2013
(Stated in US Dollars, except otherwise indicated)
| 19. | FINANCIAL INSTRUMENTS (cont’d) |
Classification of Financial Instruments
As of December 31, financial assets and liabilities of the Company are made up as follows:
2015 | 2014 | 2013 | ||||||||||
FINANCIAL ASSETS: | ||||||||||||
Measured at amortized cost | ||||||||||||
Trade receivables | US$ | 318,294 | US$ | 210,654 | US$ | 211,016 | ||||||
Cash and cash equivalents | 650,964 | 603,853 | 711,186 | |||||||||
|
|
|
|
|
| |||||||
| US$ | 969,258 | US$ | 814,507 | US$ | 922,202 | |||||||
|
|
|
|
|
| |||||||
2015 | 2014 | 2013 | ||||||||||
FINANCIAL LIABILITIES: | ||||||||||||
Measured at amortized cost | ||||||||||||
Debt with financial entities | US$ | 4,585,731 | US$ | 4,607,233 | US$ | 4,463,506 | ||||||
Accounts payable to related parties | 1,936,893 | 3,072,408 | 1,275,287 | |||||||||
Trade accounts payable | 53,995 | 118,617 | 56,649 | |||||||||
|
|
|
|
|
| |||||||
| US$ | 6,576,619 | US$ | 7,698,258 | US$ | 5,795,442 | |||||||
|
|
|
|
|
| |||||||
At the date of the financial statements, there are no significant concentrations of credit risk in relation with these items. The abovementioned value represents the maximum exposure to credit risk for such financial assets and liabilities.
Management of Financial Risk
The Company is exposed continuously to credit, liquidity and market risks, originated by exchange rate, interest rate, and price variations. These risks are managed through specific policies and procedures established by the Company’s financial management.
The financial management monitors constantly those risks through periodic reports, that allow evaluating the exposure levels affecting the Company, and issues periodic management reports for the consideration of the Company’s general management.
Credit Risk
Credit risk refers to the risk that a counterparty will default on its contractual obligations resulting in financial loss to the Company. Credit risk is managed by the Company. Credit risk arises from cash and deposits in banks and trade receivables.
The credit risk on liquid funds and derivative financial instruments is limited because the counterparties are banks with high credit-ratings assigned by international credit-rating agencies. The credit risk related to trade receivables is in the receivable accounts to related parties, over which, Management considers there is no risk of collection.
F-523
Table of Contents
REDES ELÉCTRICAS DE CENTROAMÉRICA, S. A.—RECSA
NOTES TO THE FINANCIAL STATEMENTS AS OF DECEMBER 31, 2015, 2014 AND 2013,
AND FOR THE YEARS ENDED DECEMBER 31, 2015, 2014 AND 2013
(Stated in US Dollars, except otherwise indicated)
| 19. | FINANCIAL INSTRUMENTS (cont’d) |
Liquidity Risk
The Company practices a careful liquidity risk management and, therefore, keeps cash and other liquid instruments, as well as available funds.
The management of the Company considers that the liquidity risk exposure is low, either because clients cannot comply with their obligations with the Company within the normal terms established, or because the Company has inconveniences to obtain funds to comply with commitments related to financial assets and liabilities. However, as of December 31, 2015, the financial statements reflect a negative working capital of US$ 486,900, thus the Company’s Management will be focused during 2016 on renegotiating the due dates of its short-term debt with financial institutions.
As of December 31, 2015, 2014 and 2013 the contract maturity of non-derivate financial liability of the Company is as follows:
Average | 3 Months - 1 Year | 1-5 Years | Total | Carrying | ||||||||||||||||
| 2015 | ||||||||||||||||||||
Debt with financial entities with financial guarantee | 7 | % | US$ | 1,236,213 | US$ | 4,365,554 | US$ | 5,601,767 | US$ | 4,585,731 | ||||||||||
Trade account payables | — | 53,995 | — | 53,995 | 53,995 | |||||||||||||||
|
|
|
|
|
|
|
| |||||||||||||
| US$ | 1,290,208 | US$ | 4,365,554 | US$ | 5,655,762 | US$ | 4,639,726 | |||||||||||||
| 2014 | ||||||||||||||||||||
Debt with financial entities with financial guarantee | 7 | % | US$ | — | US$ | 5,950,539 | US$ | 5,950,539 | US$ | 4,607,233 | ||||||||||
Trade account payables | — | 118,617 | — | 118,617 | 118,617 | |||||||||||||||
|
|
|
|
|
|
|
| |||||||||||||
| US$ | 118,617 | US$ | 5,950,539 | US$ | 6,069,156 | US$ | 4,725,850 | |||||||||||||
| 2013 | ||||||||||||||||||||
Loan with financial entities with financial guarantee | 7 | % | US$ | — | US$ | 6,077,350 | US$ | 6,077,350 | US$ | 4,463,506 | ||||||||||
Trade account payable | 56,649 | — | 56,649 | 56,649 | ||||||||||||||||
|
|
|
|
|
|
|
| |||||||||||||
| US$ | 56,649 | US$ | 6,077,350 | US$ | 6,133,999 | US$ | 4,520,155 | |||||||||||||
|
|
|
|
|
|
|
| |||||||||||||
Cash Flows:
There is a low exposure as to whether the cash flow associated with the financial assets and liabilities could fluctuate in their amount, except for the risk exposure of cash flow that might derive from the fluctuation of the exchange rate of the United States dollar with respect to the Quetzal, that might require additional cash flows to cancel loans and account payables in foreign currency or that might implicate a reduction in the assets in foreign currency.
F-524
Table of Contents
REDES ELÉCTRICAS DE CENTROAMÉRICA, S. A.—RECSA
NOTES TO THE FINANCIAL STATEMENTS AS OF DECEMBER 31, 2015, 2014 AND 2013,
AND FOR THE YEARS ENDED DECEMBER 31, 2015, 2014 AND 2013
(Stated in US Dollars, except otherwise indicated)
| 19. | FINANCIAL INSTRUMENTS (cont’d) |
Fair Value of Financial Instruments
The Company does not have any financial assets or financial liabilities measured at fair value on a recurring basis.
Fair value of financial assets and financial liabilities that are not measured at fair value (but fair value disclosures are required)
The Company’s management considers that the carrying amount of the long term debt with financial entities approximate their fair value, since the debt is agreed at variable market interest rates which are reviewed periodically. Also, Company’s management considers that the carrying amount of the other financial assets and financial liabilities measured at amortized cost, approximate their fair value due to their short-term maturity or because they are agreed at interest rates similar to market interest rate or valuated at their discounted amount with a market interest rate.
Market Risk:
Fluctuation on exchange rate and market prices:
The Company does not have a practice to acquire derivatives financial instruments to protect itself from the risk of loss due to the fluctuation on the currency exchange rate on which performs its transactions.
Exchange Rate Risk
Monetary assets and liabilities include balances in Dollars of the United States of America, which are subject to the fluctuation risk in the exchange rate of the dollar with regard to the Quetzal for the transactions performed of the Company. During 2015, 2014 and 2013, there were no significant fluctuations of the US$ dollar regarding the Quetzal that might be considered important:
Devaluation percentage of the Quetzal in relation with the US Dollar
Currency | 2015 | 2014 | 2013 | |||||||||
Quetzales | (1 | %) | (3 | %) | (1 | %) | ||||||
F-525
Table of Contents
REDES ELÉCTRICAS DE CENTROAMÉRICA, S. A.—RECSA
NOTES TO THE FINANCIAL STATEMENTS AS OF DECEMBER 31, 2015, 2014 AND 2013,
AND FOR THE YEARS ENDED DECEMBER 31, 2015, 2014 AND 2013
(Stated in US Dollars, except otherwise indicated)
| 19. | FINANCIAL INSTRUMENTS (cont’d) |
As of December 31, 2015, 2014 and 2013, the amount of the net assets and liabilities in foreign currency that might be exposed to exchange rate fluctuations is as follows:
2015 | US$ | |||
Assets | ||||
Local banks in foreign currencies | 547,866 | |||
|
| |||
Liabilities | ||||
Foreign suppliers | 3,304 | |||
|
| |||
Net asset position in foreign currency | 544,562 | |||
|
| |||
2014 | US$ | |||
Assets | ||||
Local banks in foreign currencies | 333,213 | |||
|
| |||
Liabilities | ||||
Foreign suppliers | 5,604 | |||
|
| |||
Net position in foreign currency | 327,609 | |||
|
| |||
2013 | US$ | |||
Assets | ||||
Local banks in foreign currencies | 15,501 | |||
|
| |||
Net position in foreign currency | 15,501 | |||
|
| |||
Sensitivity analysis
A strengthening or weakening at the rate of 2% of the dollar exchange rate against the Quetzal would have increased (decreased) the income or loss and the total shareholder’s equity by the amounts shown below. This analysis assumes that all other variables, in particular interest rates, remain constant. The analysis was performed on the same basis for 2014 and 2013.
As at December 31 | ||||||||||||||||
Profit or loss | Shareholders’ Equity | |||||||||||||||
2% increase | 2% increase | 2% decrease | 2% decrease | |||||||||||||
US$ | ||||||||||||||||
As of December 31, 2015 | US$ | (10,892 | ) | US$ | 10,892 | US$ | 120,699 | US$ | (125,626 | ) | ||||||
As of December 31, 2014 | US$ | (6,552 | ) | US$ | 6,552 | US$ | 114,412 | US$ | (119,077 | ) | ||||||
As of December 31, 2013 | US$ | (310 | ) | US$ | 310 | US$ | 114,290 | US$ | (118,956 | ) | ||||||
Risk of Interest Rates
The risk due to interest rate is managed by the Company management through a conservative debt policy that takes into account the balanced taking of debts at variable interest rates, for the most part. The Company’s exposures to interest rates on financial liabilities are detailed in the liquidity risk management section of this note.
The expenditures and flows of operating funds of the Company are influenced by the changes on the interest rates in the market. The Company holds liabilities that earn interests.
F-526
Table of Contents
REDES ELÉCTRICAS DE CENTROAMÉRICA, S. A.—RECSA
NOTES TO THE FINANCIAL STATEMENTS AS OF DECEMBER 31, 2015, 2014 AND 2013,
AND FOR THE YEARS ENDED DECEMBER 31, 2015, 2014 AND 2013
(Stated in US Dollars, except otherwise indicated)
| 19. | FINANCIAL INSTRUMENTS (cont’d) |
It is not a Company practice to acquire financial derivatives to protect itself from the risk of loss due to upward variations of the interest rates of bank loans.
In the opinion of the Management, it is not necessary to use coverage instruments that protect the Company from these fluctuations.
| 20. | CONTINGENCIES |
The Company is subject to certain contingent liabilities with respect to existing or potential claims, lawsuits and other proceedings. The Company accrues liabilities when it considers probable that future disbursements will be incurred and such amounts can be reasonably estimated. The related reserve is based on developments to date and historical information related to actions filed against the Company. As of December 31, 2015, 2014 and 2013 the Company had established reserves for contingencies of US$ 98,720, US$ 99,183 and US$ 96,088 respectively, to cover legal actions against the Company in which its Management has assessed the likelihood of a final adverse outcome as probable. The provisioned contingent liability correspond to sanctions determined by the National Commission of Electric Energy referred to supposed non-compliance on the methodology required for quality control measurement of technical services on transport of electric energy. The Company has recorded a provision that covers the total amount of this contingency for the years 2015, 2014 and 2013 (Note 16).
| 21. | SUBSEQUENT EVENTS |
The Company has evaluated subsequent events as at December 31, 2015 to assess the need for potential recognition or disclosure in the accompanying financial statements. Such events were assessed until September 10, 2016, the date these financial statements were available to be issued. Based on this evaluation it was determined that there were no subsequent events requiring recognition or disclosure in the financial statements except for the following matters:
| • | On January 22, 2016, I.C. Power Ltd through IC Power Distribution Holding Pte. Limited, a wholly-owned subsidiary of Kenon Holdings Ltd (“Kenon”), acquired 100% of the shares of RECSA BV, owner of 100% of the Company’s capital stock. As a result, I.C. Power Ltd. took the effective control to manage the financial and operating policies of the Company. |
| • | On March 17, 2016, as part of the reorganization process carried out by Kenon in order to list I.C. Power Pte. Ltd. in the US stock exchange, Kenon transferred all of the shares of I.C. Power Ltd. to I.C. Power Pte. Ltd. (“ICPS”), a wholly owned subsidiary of Kenon incorporated in Singapore. |
| • | On January 22 2016, the contract with the entity Arthasan S.A. was cancelled. Such entity rendered management and negotiation services for the Company businesses. Since January 23 2016, the above-mentioned activities were carried out directly performed by the Company. |
| 22. | APPROVAL OF THE FINANCIAL STATEMENTS |
These financial statements prepared in U.S. dollars as presentation currency, were approved by the Company’s Management Committee on September 10, 2016.
* * * * * *
F-527
Table of Contents
GENERANDES PERÚ S.A. AND SUBSIDIARIES
Unaudited Consolidated Financial Statements
December 31, 2014 and 2013
Table of Contents
GENERANDES PERÚ S.A. AND SUBSIDIARIES
Unaudited Consolidated Statements of Financial Position
As of December 31, 2014 and 2013
(Stated in thousands of nuevos soles)
Note | 2014 | 2013 | Note | 2014 | 2013 | |||||||||||||||||||||
Assets | Liabilities | |||||||||||||||||||||||||
Current assets | Current liabilities | |||||||||||||||||||||||||
Cash and cash equivalents | 6 | 238,427 | 172,907 | Trade accounts payable | 16 | 209,956 | 293,090 | |||||||||||||||||||
Trade accounts receivable | 7 | 177,078 | 155,090 | Other accounts payable to related parties | 8 | 30,686 | 4,489 | |||||||||||||||||||
Accounts receivable from related parties | 8 | 4,797 | 26,986 | Other accounts payable | 17 | 88,996 | 71,982 | |||||||||||||||||||
Other accounts receivable | 9 | 73,998 | 111,294 | Provisions | 18 | 13,212 | 18,537 | |||||||||||||||||||
Inventories | 10 | 71,126 | 67,844 | Financial liabilities | 15 y 19 | 119,832 | 165,515 | |||||||||||||||||||
Assets for derivative instruments | 19 | — | 646 | Income tax | — | 31,630 | ||||||||||||||||||||
|
|
|
| |||||||||||||||||||||||
Other non-financial assets | 11 | 24,222 | 22,266 | Total current liabilities | 462,682 | 585,243 | ||||||||||||||||||||
|
|
|
|
|
|
|
| |||||||||||||||||||
Total current assets | 589,648 | 557,033 | ||||||||||||||||||||||||
|
|
|
| |||||||||||||||||||||||
| Non-current liabilities | ||||||||||||||||||||||||||
Non-current assets | Financial liabilities | 19 | 693,379 | 638,999 | ||||||||||||||||||||||
Investments in Associates | 12 | 236,788 | 260,382 | Provisions | 18 | 15,899 | 15,126 | |||||||||||||||||||
Assets for derivative instruments | 19 | 80 | 36 | Liabilities for deferred income tax | 22 | 673,474 | 769,648 | |||||||||||||||||||
Property, plant, and equipment | 13 | 3,678,581 | 3,750,010 | Provision for employee benefits | 21 | 3,910 | 3,394 | |||||||||||||||||||
Intangible assets | 14 | 52,419 | 52,146 | |||||||||||||||||||||||
|
|
|
| |||||||||||||||||||||||
Deferred income tax asset | 22 | 4,546 | 29,165 | Total non-current liabilities | 1,386,662 | 1,427,167 | ||||||||||||||||||||
|
|
|
|
|
|
|
| |||||||||||||||||||
Total non-current assets | 3,972,414 | 4,091,739 | Total liabilities | 1,849,344 | 2,012,410 | |||||||||||||||||||||
|
|
|
|
|
|
|
| |||||||||||||||||||
| Equity | 24 | |||||||||||||||||||||||||
| Share capital | 853,429 | 853,429 | ||||||||||||||||||||||||
| Other capital reserves | 160,674 | 142,406 | ||||||||||||||||||||||||
| Other Reserves | 13,622 | 32,198 | ||||||||||||||||||||||||
Accumulated currency translation losses, net | (25,964 | ) | (21,375 | ) | ||||||||||||||||||||||
| Retained earnings | 430,762 | 386,592 | ||||||||||||||||||||||||
|
|
|
| |||||||||||||||||||||||
| 1,432,522 | 1,393,250 | |||||||||||||||||||||||||
| Non-controlling interests | 1,280,196 | 1,243,112 | ||||||||||||||||||||||||
|
|
|
| |||||||||||||||||||||||
| Total equity | 2,712,718 | 2,636,362 | ||||||||||||||||||||||||
|
|
|
|
|
|
|
| |||||||||||||||||||
Total assets | 4,562,062 | 4,648,772 | Total liabilities and equity | 4,562,062 | 4,648,772 | |||||||||||||||||||||
|
|
|
|
|
|
|
| |||||||||||||||||||
The accompanying notes on F-126 to F-195 are an integral part of these unaudited consolidated financial statements.
F-529
Table of Contents
GENERANDES PERÚ S.A. AND SUBSIDIARIES
Unaudited Consolidated Statements of Income
For the years ended December 31, 2014 and 2013
(Stated in thousands of nuevos soles)
Note | 2014 | 2013 | ||||||||
Sales revenue: | 25 | |||||||||
Energy | 1,142,463 | 975,499 | ||||||||
Power | 536,843 | 435,872 | ||||||||
Other operating income | 22,175 | 21,072 | ||||||||
|
|
|
| |||||||
| 1,701,481 | 1,432,443 | |||||||||
Generation costs | 26 | (1,008,450 | ) | (886,689 | ) | |||||
|
|
|
| |||||||
Gross profit | 693,031 | 545,754 | ||||||||
Administrative expenses | 27 | (53,482 | ) | (53,320 | ) | |||||
Other operating income | 30 | 63,950 | 119,212 | |||||||
|
|
|
| |||||||
Operating profit | 703,499 | 611,646 | ||||||||
|
|
|
| |||||||
Other income (costs): | ||||||||||
Interest in Associate | 27,707 | 54,728 | ||||||||
Finance income | 31 | 6,954 | 4,968 | |||||||
Finance costs | 31 | (39,112 | ) | (43,636 | ) | |||||
Loss on exchange difference | 5 | (4,023 | ) | (5,615 | ) | |||||
|
|
|
| |||||||
| (8,474 | ) | 10,445 | ||||||||
|
|
|
| |||||||
Profit before income taxes | 695,025 | 622,091 | ||||||||
Income tax expense | 22 y 32 | (138,192 | ) | (167,726 | ) | |||||
|
|
|
| |||||||
Profit for the year | 556,833 | 454,365 | ||||||||
|
|
|
| |||||||
Profit attributable to: | ||||||||||
Owners of Parent | 293,397 | 239,878 | ||||||||
Non-controlling interests | 263,436 | 214,487 | ||||||||
|
|
|
| |||||||
| 556,833 | 454,365 | |||||||||
|
|
|
| |||||||
Weighted average of shares outstanding for calculation of earnings per share | 33 | 853,429 | 853,429 | |||||||
|
|
|
| |||||||
Earning per basic and diluted shares | 33 | 0.344 | 0.281 | |||||||
|
|
|
| |||||||
The accompanying notes on F-126 to F-195 are an integral part of these unaudited consolidated financial statements.
F-530
Table of Contents
GENERANDES PERÚ S.A. AND SUBSIDIARIES
Unaudited Consolidated Statements of Comprehensive Income
For the years ended December 31, 2014 and 2013
(Stated in thousands of nuevos soles)
2014 | 2013 | |||||||
Profit for the year | 556,833 | 454,365 | ||||||
Variation for cash flow hedge—net exchange rate of tax effects | (36,584 | ) | (51,652 | ) | ||||
Variation for cash flow hedge—net interest rate of tax effects | 975 | 187 | ||||||
Exchange difference from conversion | (8,467 | ) | 1,559 | |||||
|
|
|
| |||||
Total comprehensive income for the year | 512,757 | 404,459 | ||||||
|
|
|
| |||||
The accompanying notes on F-126 to F-195 are an integral part of these unaudited consolidated financial statements.
F-531
Table of Contents
GENERANDES PERÚ S.A. AND SUBSIDIARIES
Unaudited Consolidated Statements of Changes in Equity
For the years ended December 31, 2014 and 2013
(Stated in thousands of nuevos soles)
Share | Other capital | Other | Accumulated | Retained | Non-controlling | Total | ||||||||||||||||||||||
Balances as of December 31, 2012 | 853,429 | 132,241 | 59,071 | (22,220 | ) | 339,378 | 1,217,138 | 2,579,037 | ||||||||||||||||||||
Profit for the year | — | — | — | — | 239,878 | 214,487 | 454,365 | |||||||||||||||||||||
Other comprehensive income (loss) | — | — | (26,874 | ) | 845 | — | (23,877 | ) | (49,906 | ) | ||||||||||||||||||
|
|
|
|
|
|
|
|
|
|
|
|
|
| |||||||||||||||
Total comprehensive income (loss) for the year | — | — | (26,874 | ) | 845 | 239,878 | 190,610 | 404,459 | ||||||||||||||||||||
Year 2012 dividend payment | — | — | — | — | (54,394 | ) | (49,980 | ) | (104,374 | ) | ||||||||||||||||||
Year 2013 dividend pre-payment (note 24(c)) | — | — | — | — | (128,109 | ) | (114,661 | ) | (242,770 | ) | ||||||||||||||||||
Approval of legal reserve | — | 10,166 | — | — | (10,161 | ) | 5 | 10 | ||||||||||||||||||||
|
|
|
|
|
|
|
|
|
|
|
|
|
| |||||||||||||||
Balances as of December 31, 2013 | 853,429 | 142,407 | 32,198 | (21,375 | ) | 386,592 | 1,243,112 | 2,636,362 | ||||||||||||||||||||
Profit for the year | — | — | — | — | 293,397 | 263,436 | 556,833 | |||||||||||||||||||||
Other comprehensive income (loss) | — | — | (18,576 | ) | (4,589 | ) | — | (20,911 | ) | (44,076 | ) | |||||||||||||||||
|
|
|
|
|
|
|
|
|
|
|
|
|
| |||||||||||||||
Total comprehensive income (loss) for the year | — | — | (18,576 | ) | (4,589 | ) | 293,397 | 242,525 | 512,757 | |||||||||||||||||||
Effect of the merger | — | — | — | — | 284 | — | 284 | |||||||||||||||||||||
Year 2013 dividend payment | — | — | — | — | (85,149 | ) | (76,172 | ) | (161,321 | ) | ||||||||||||||||||
Year 2014 dividend pre-payment (note 24(c)) | — | — | — | — | (146,100 | ) | (129,273 | ) | (275,373 | ) | ||||||||||||||||||
Approval of legal reserve | — | 18,267 | — | — | (18,262 | ) | 4 | 9 | ||||||||||||||||||||
|
|
|
|
|
|
|
|
|
|
|
|
|
| |||||||||||||||
Balances as of December 31, 2014 | 853,429 | 160,674 | 13,622 | (25,964 | ) | 430,762 | 1,280,196 | 2,712,718 | ||||||||||||||||||||
|
|
|
|
|
|
|
|
|
|
|
|
|
| |||||||||||||||
The accompanying notes on F-126 to F-195 are an integral part of these unaudited consolidated financial statements.
F-532
Table of Contents
GENERANDES PERÚ S.A. AND SUBSIDIARIES
Unaudited Consolidated Statements of Cash Flows
For the years ended December 31, 2014 and 2013
(Stated in thousands of nuevos soles)
2014 | 2013 | |||||||
Cash flows from operating activities: | ||||||||
Cash receipts from customers | 2,043,315 | 1,707,473 | ||||||
Cash payments to suppliers, related parties, employees and tax authority | (1,227,065 | ) | (989,093 | ) | ||||
Other cash payments related to operations, net | (232,419 | ) | (180,066 | ) | ||||
|
|
|
| |||||
Net cash from operating activities | 583,831 | 538,314 | ||||||
|
|
|
| |||||
Cash flow from investing activities | ||||||||
Acquisition of property, plant and equipment | (96,733 | ) | (54,922 | ) | ||||
Dividends received from associates | 65,615 | 23,955 | ||||||
|
|
|
| |||||
Net cash used in investing activities | (31,118 | ) | (30,967 | ) | ||||
|
|
|
| |||||
Cash flows from financing activities | ||||||||
Increase in financial obligations | 165,323 | 11,080 | ||||||
Dividends paid | (415,808 | ) | (346,724 | ) | ||||
Amortization or payment of financial liabilities | (201,836 | ) | (139,645 | ) | ||||
Interests and income | (35,395 | ) | (41,184 | ) | ||||
Other cash payments related to financing, net | (2,416 | ) | (2,977 | ) | ||||
|
|
|
| |||||
Net cash used in financing activities | (490,132 | ) | (519,450 | ) | ||||
|
|
|
| |||||
Effect of exchange rate changes on cash and cash equivalents | 2,939 | (3,097 | ) | |||||
|
|
|
| |||||
Increase (decrease) in net cash and cash equivalents | 65,520 | (15,200 | ) | |||||
Cash and cash equivalents at beginning of period | 172,907 | 188,107 | ||||||
|
|
|
| |||||
Cash and cash equivalents at beginning of period | 238,427 | 172,907 | ||||||
|
|
|
| |||||
The accompanying notes on F-126 to F-195 are an integral part of these unaudited consolidated financial statements.
F-533
Table of Contents
GENERANDES PERÚ S.A. AND SUBSIDIARIES
Notes to the Unaudited Consolidated Financial Statements
December 31, 2014 and 2013
(1) Reporting Entity
(a) Background
Generandes Perú S.A. (hereinafter “the Company”) is a stock corporation created in Peru initiating operations in December 1995. Its legal domicile is located at Avenida Víctor Andrés Belaúnde 147, Torre Real Cuatro, San Isidro, Lima, Peru.
The Company is a subsidiary of Endesa Chile S.A. which holds 60.998% of capital stock as of December 31, 2014 and 2013, a company which in turn is a subsidiary of Endesa S.A. from Spain, which is controlled by Enel, S.p.A. (hereinafter “Enel”) from Italy.
On October 21, 2014, at General Extraordinary Stockholders’ Meeting, Endesa S.A. approved to sell Enel Energy Europe the share of 60.62% in the capital stock of the Chilean Society Enersis, S.A. of which it was holder directly and indirectly.
As of December 31, 2014 and 2013, the Company has as subsidiaries Edegel S.A.A. with the 54.20% and through it, it holds shares of 43.36% in Chinango S.A.C, respectively (hereinafter the “Subsidiaries”).
As of December 31, 2014 and 2013, Chiango S.A.C is a subsidiary of Edegel S.A.A. which holds shares of 80% in the capital stock.
On September 3, 2014, Enersis S.A., finally acquired total shares that held with Southern Cone Power Perú S.A. equivalent to 39.002% of the Company’s shares. With it, the group is owner of 100.00% of the Company’s shares.
(b) Business Activity
The Company is involved in the generation of electrical energy, directly or through companies incorporated for that purpose and for acquiring, maintaining and selling investments in assets of other companies preferably engaged in electricity generation.
Edegel S.A.A.
Edegel S.A.A. is mainly engaged in the generation and commercialization of Electrical energy and power to private and public companies. Edegel S.A.A. has five hydroelectric power plants, three of them are located in the basins of the Santa Eulalia and Rimac rivers, approximately 50 km from Lima with effective power of 561.1 MW. It also has two thermoelectric plants, one with effective power of 412.5 MW, located in the Cercado de Lima and another with 485.0 MW located in Ventanilla. Total effective power amounts to 1,458.6 MW.
Chinango S.A.C.
Chinango S.A.C. is engaged in electricity generation, commercialization and transmission activities. For this purpose, it has two hydroelectric power plants (Yanango and Chimay), located in the department of Junín, with an effective generation capacity of 193.5 MW.
F-534
Table of Contents
GENERANDES PERÚ S.A. AND SUBSIDIARIES
Notes to the Unaudited Consolidated Financial Statements
As of December 31, 2014 and 2013, Chinango S.A.C. is a subsidiary of Edegel S.A.A., which holds 80% capital stock.
Main data of consolidated financial statements of Subsidiaries as of December 31, 2014 and 2013 and for the periods then ended are as follows:
In thousands of S/. | ||||||||
2014 | 2013 | |||||||
Cash and cash equivalents | 221,332 | 171,782 | ||||||
Other current assets | 351,203 | 384,108 | ||||||
Long-term assets | 3,967,868 | 4,062,574 | ||||||
|
|
|
| |||||
Total assets | 4,540,403 | 4,618,464 | ||||||
|
|
|
| |||||
Short-term financial obligations | 119,832 | 165,515 | ||||||
Other short-term liabilities | 327,336 | 419,669 | ||||||
Long-term financial obligations | 693,379 | 638,999 | ||||||
Deferred income tax, liability | 668,928 | 740,483 | ||||||
Other long-term liabilities | 19,809 | 18,520 | ||||||
|
|
|
| |||||
Total liabilities | 1,829,284 | 1,983,186 | ||||||
|
|
|
| |||||
Equity attributable to non-controlling interests | 2,639,981 | 2,568,481 | ||||||
|
|
|
| |||||
Total equity | 2,711,119 | 2,635,278 | ||||||
|
|
|
| |||||
In thousands of S/. | ||||||||
2014 | 2013 | |||||||
Operating income | 1,701,481 | 1,432,443 | ||||||
|
|
|
| |||||
Operating profit | 704,078 | 612,374 | ||||||
|
|
|
| |||||
Net profit attributable to controlling interests | 542,373 | 443,910 | ||||||
|
|
|
| |||||
(c) Approval of Consolidated Financial Statements
On March 2, 2015, the Company’s management approved and authorized the issuance of the consolidated financial statements as of December 31, 2014. On February 6, 2014, the Company’s management approved and authorized the issuance of the consolidated financial statements as of December 31, 2013.
(2) Operating Regulation and Legal Standards Affecting the Electric Sector
The Company and its Subsidiaries are within the scope of various rules governing their activities. Failure to comply with these rules may result in the imposition of sanctions on the Company and its Subsidiaries, affecting both financially and operationally. Management of the Company and its Subsidiaries monitor and evaluate the standard compliance and any complaints presented. As of December 31, 2014 and 2013, management considers that there are no situations that may need disclosures or provisions on the consolidated financial statements except for those indicated in note 36 of this report.
F-535
Table of Contents
GENERANDES PERÚ S.A. AND SUBSIDIARIES
Notes to the Unaudited Consolidated Financial Statements
Regulatory framework governing the activities of the Company and its Subsidiaries can be summarized as follows:
(a) Electricity Concessions Law
In conformity with the Electricity Concession Law, approved through Decree-Law 25844, the electricity sector is divided into three main subsectors, each one covering a different activity: generation, transmission and distribution of electricity. Under that law and law 28832,Law to Ensure the Efficient Development of the Electric Generation, the operations of Sistema Eléctrico Interconectado Nacional (National Electrical Interconnected System) shall be governed by provisions of Comité de Operación Económica del Sistema Interconectado Nacional (Economical Operation Committee of the National Interconnected System—COES-SINAC, in order to coordinate their operation at minimum cost, guaranteeing the supply of electric energy and the best exploitation of energy resources, as well as the planning of the transmission and management of short-term market. Also, COES-SINAC determines and values the transfers of power and energy between generators.
(b) Law to Guarantee the Efficient Development of Electricity Generation
In July 2006, Law 28832,Law to Ensure the Efficient Development of the Electric Generation, was enacted being some of its main objectives to ensure sufficient and efficient generation which will reduce the exposure of the Electrical system to the volatility of prices and the risks of rationing, as well as to adopt necessary measures to foster an effective competition in the generation market.
One of the main innovations introduced by the standard is a mechanism of bids that electricity distribution companies shall apply to enter into electricity supply contracts with generating companies to supply electricity public services and, optionally, in the case of free users. The purpose of such provision is to establish a mechanism to promote the development of investments in new generation capacity through long-term electricity supply contracts and firm prices with distributors.
(c) Supervising Body of Investment in Energy and Mines
Organismo Supervisor de la Inversión en Energía—OSINERGMIN- is the body regulating, supervising and inspecting the activities developed by the entities of the electricity, hydrocarbons and mining sub-sectors, safeguarding quality and efficiency of the service rendered to users, and monitoring compliance with obligations assumed by concessionaires as well as current legal provisions and technical norms, including those related to environment protection and preservation. Also, as part of its standard-setting role, OSINERGMIN may issue related rules and standards of general nature, applicable to entities and users of the sector.
In conformity with Supreme Decree 001-2010-MINAM, OSINERGMIN transferred the environmental supervising, inspecting and sanctioning functions related to hydrocarbons in general and electricity, to the Agency for Environmental Assessment and Inspection—OEFA-, an agency established by Legislative Decree 1013 which approved the Law for the Creation, Organization and Functions of the Ministry of the Environment.
(d) Environmental Protection Regulations
In conformity with Electricity Concessions Law and Law 28611, Environmental Act, the Government shall design and apply policies, norms, instruments, incentives and necessary penalties aimed at preserving appropriate environment and National Cultural Heritage, as well as ensuring the rational use of natural resources in the development of activities related to the generation, transmission and supply of electricity and hydrocarbon
F-536
Table of Contents
GENERANDES PERÚ S.A. AND SUBSIDIARIES
Notes to the Unaudited Consolidated Financial Statements
activities. In this sense, the Ministry of Energy and Mines has approved the Regulation of Environmental Protection in Electricity Activities (Supreme Decree N°29-94-EM) and the Regulation of Environmental Protection in Hydrocarbon Activities (Supreme Decree 015-2006-EM).
As of December 31, 2014 and 2013, the Company’s and its Subsidiaries’ Management estimates that, in the event of a contingency related to environmental management, it would not significantly affect the consolidated financial statements taken as a whole.
(e) Technical Quality Standards of Electricity Services
Supreme Decree N° 020-97-EM, approved the Technical Standard of Electricity Services Quality (NTCSE), which establishes the minimum quality levels of the electricity services, including street lighting and obligations of electrical sector companies, as well as clients operating within the framework of the Electricity Concession Law.
NTCSE provides for tolerances and quality indicator measurement procedures that shall be taken into account, requiring their compliance by Electrical companies and establishing the methods for calculation of compensations referred to violations of the indicators, being COES SINAC the body in charge of assigning responsibilities and calculating the compensation as mandated by the Law to Ensure the Efficient Development of The Electric generation.
Supreme Decree 057-2010-EM, dated September 11, 2010, which amended the NTCSE, established that if as a result of technical research and analysis conducted by the COES SINAC it is determined that the deficiency of quality is strictly due to a lack of capacity transmission system congestion, agents and COES are exempted from payment of compensation.
(f) Antimonopoly and Anti-oligopoly Law of the Electric Sector
In November 1997, theAnti-monopoly and Anti-oligopoly Law of the Electric Sector, Law 26876, was issued establishing a limit in the participation in electric power generation companies in order to avoid concentrations that would affect competition in the electricity market (vertical integrations over 5% or horizontal concentrations over 15%).
Resolution 012-99/INDECOPI/CLC establishes the conditions to preserve free competition and transparency in the sector that affect the Company and its Subsidiaries. The main aspect is that Edelnor S.A.A. (company related to Endesa Group and client of its Subsidiaries) must tender its purchases of electricity among all generators existing in the system as its contracts expire, and shall pass into public domain the procedures and results of each tender.
(g) System Guaranteeing the Supply of Electric Energy to SEIN
From year 2004, some contracts of energy supply to distributor companies expired without being renewed nor awarded to a new supplier; thus resulting in withdrawals of energy and power carried out by distributor companies to meet the regulated market, being assigned by COES to the SEIN generators based on various criteria over time.
This situation denominated in the sector as “withdrawals without contractual support” generated several distortions in the electricity market; as a result, the State tried several solutions through a number of legal provisions such as Urgency Decree 007-2004, Law 28447, Urgency Decree 007-2006, Urgency Decree 036-2006 and Law 29179, among other provisions of lower status.
F-537
Table of Contents
GENERANDES PERÚ S.A. AND SUBSIDIARIES
Notes to the Unaudited Consolidated Financial Statements
Meanwhile, as a result of the significant growth in the demand for electricity and natural gas, as from year 2006, several incidents related to the congestion of the electricity transmission system and the natural gas transportation systems were registered.
The restrictions on production and transportation of natural gas and electricity transmission are events that result in negative externalities, producing increased operating costs of the electricity system and distorting the marginal costs in the spot market.
In order to avoid distortions of marginal costs, a number of legal provisions were issued to reduce the effects of these events on the electricity market. Thus, the Twelfth Final Supplementary Provision of Law 28832, Emergency Decree 046-2007, Legislative Decree 1041 and its Regulations approved by Supreme Decree041-2008-EM and Emergency Decree 037-2008, as amended by Emergency Decree 049-2011, provided a number of compensation mechanisms for those variable costs that were not covered by the short-term marginal costs calculated by application of these provisions, depending on whether they are related to natural gas transmission or transportation. However, the criteria used for the allocation of such compensations considered a variety of factors, although they related to aspects of the same nature, which represented a number of risks that hinder the contracting of electricity.
Therefore, in order to avoid problems such as those above described and to establish a treatment regarding withdrawals without contractual support, Emergency Decree 049-2008 was issued establishing a uniform criterion for the treatment of marginal cost in the situations described, as well as a regulation for withdrawals without contractual support, thus annulling any provision establishing a different treatment which will be in force during the period comprised between January 1, 2009 and December 31, 2011.
Regarding withdrawals without contractual support, the Emergency Decree 049-2008 established that physical withdrawals of power and energy made by electricity distribution companies in SEIN for the Public Electricity Service, without respective contracts supply entered into with generating companies shall be allocated to generators valued at busbar prices proportionally to the net value of the annual efficient firm energy of each generator less its sale of power by contracts. In these cases, the costs incurred by generators to meet those withdrawals, presented due to higher marginal costs in relation to busbar prices are incorporated in the Tariff for connection to Main Transmission System and assumed by the demand; in turn, margins earned by generators from marginal costs lower than busbar prices passes to the demand, whereby the allocated energy without contractual support does not provide a trading margin,i.e. in net terms, generator sells and buys this energy at marginal costs without a contract.
With regard to Short-Term Marginal Costs of SEIN, Emergency Decree 049-2008 established that they are determined considering that there is no restriction of production or transportation of natural gas and electricity transmission. It was also decided that the Short-Term Marginal Costs could not exceed a limit value (S/.313.50/MWh in accordance with Ministerial Resolution 607-2008-MEME/DM). It also indicates that the difference between the variable operating costs incurred by plants operating with variable costs greater than Short-Term Marginal Costs shall be covered through an additional fee on the Tariff for connection to Main Transmission System and assumed by the Demand.
The validity of the Emergency Decree 049-2008 was extended twice; the first time it was extended until December 31, 2013 by Emergency Decree 079-2010 and the second time it was extended until December 31, 2016 by Law 30115 Law of Financial Equilibrium of the Public Sector Budget for the Fiscal Year 2014, published on December 2, 2013.
F-538
Table of Contents
GENERANDES PERÚ S.A. AND SUBSIDIARIES
Notes to the Unaudited Consolidated Financial Statements
(h) Short-Term Market Regulation
The Short-Term Market Regulation was published in June 2011 by means of Supreme Decree027-2011-EM establishing that this market should become effective on January 1, 2014; however since the MINEM is preparing a proposal for amending this regulation by means of Supreme Decree 032-2012-EM published on August 30, 2012, it was decided to postpone the beginning of the effective date of that market until January 2016, thus suspending all the actions conducted for the approval of the technical procedures of the COES necessary to make the operation effective.
Notwithstanding the foregoing, some of the aspects set by that regulation still in force are:
Agents envisaging to participate in the short-term market must integrate the COES. The Free Users must have equipment for independent, remote and automatic disconnection. Distributors must constitute guarantees and trusteeships and identify Free Users for whom they buy in that market and also be up to date with its payments resulting from operations. Large Users formed by the group of Free Users shall appoint a representative and enter into a joint and several liability agreements.
Short-term market participants allowed to buy are: i) generators, to meet their supply contracts (except for distributed generators and those using renewable resources), ii) distributors, to serve free Users, and iii) Large Users, to meet their own requirements.
In turn, short-term market participants allowed to sell are: i) Generators, up to the amount of capacity that they can generate with their own plants and/or capacity contracted with third parties, ii) Generators using renewable energy resources ruled by Legislative Decree 1002, up to the capacity limit that they can generate with its own power plants, and iii) the Co-generators and Generator-Distributors connected to the SEIN, up to the limit of their energy surpluses not contracted.
Participants buying in the short-term market shall not be exempted from charges for transmission, distribution and other services and / or regulated uses. COES may decide on power cut to Large Users and Free Users for non-compliance with obligations and/or payments, and holders of the connection systems are required to make such cuts. It also states that congestion pricing will be allocated to those affected by congestion.
Transfers shall be made based on actual marginal costs obtained from the real-time operation.
Operating costs for rigidities and complementary services not covered by actual marginal costs will be determined by COES and assumed by the members of the short-term market.
The guarantees given by the supplier shall be easily realizable and enforceable and shall cover all obligations of the Participants.
COES must also establish the criteria for the creation of trusts by purchasing participants, considering that trusts of Distributors shall guarantee the payment of their Free Users.
(i) Energy Security System on Hydrocarbons and Energy and Social Inclusion Fund
Law 29852, published on April 13, 2012 created: The Energy Security System on Hydrocarbons (SISE) and Energy and Social Inclusion Fund (FISE), whose regulation was established by Supreme Decree021-012-EM published on June 9, of the same year.
F-539
Table of Contents
GENERANDES PERÚ S.A. AND SUBSIDIARIES
Notes to the Unaudited Consolidated Financial Statements
SISE should be composed of a network of pipelines and storage facilities considered as strategic by the Government for ensuring the nationwide fuel supply, which will be paid by a charge to pipeline transportation of liquid products derived from hydrocarbons and natural gas liquids. FISE shall be used to widespread the use of natural gas for residences and vehicles in vulnerable sectors and to compensate the development of new energy supplies in energy frontier, and for social compensation and promotion of access to LPG in vulnerable urban and rural communities. This fund is funded by free electricity users, through a surcharge on pipeline transportation of liquid products derived from liquid hydrocarbons and natural gas liquids, and through a surcharge on the monthly billing of users of the service of natural gas transport through pipelines.
(j) Temporary Measures Associated with Remuneration for Power
By Supreme Decree 032-2012 -EM, published on August 30, 2012, the Ministry of Energy and Mines established transitory provisions related to the remuneration for Firm Power from thermoelectric units.
It was established that a natural gas power plant guarantees the transportation of natural gas when the contracted firm capacity allows operating at effective power during peak hours. This modification allows the thermoelectric units with firm transportation capacity of gas power to operate effectively during peak hours (even though they do not have the carrying capacity that allows them to operate 24 hours a day at effective power) to participate with such power and its variable cost of natural gas in preparing the ranking of variable costs used to determine the power units that pay for power by participating in the coverage of high demand and reservation of system.
This provision is temporary and will be in force while the gas transport concessionaire, Transportadora del Gas del Perú S.A. (TGP), does not have the carrying capacity set forth in the Addendum to the BOOT contract (Build , Operate, Own, Transfer) signed with the Peruvian State.
(k) Exchange of Information in Real Time for SEIN Operation
On November 27, 2012, the Ministry of Energy and Mines issued Resolution 243-2012-EM/DGE approving the adoption of a newTechnical Standard for the Exchange of Information in Real Time for the SEIN operation, which replaced the previously existing rule, approved by Directorial Resolution 055-2007-EM/DGE dated December 3, 2007.
The approved standard adopted a new stratification of information of signals and states of the power system submitted in real time to the System Coordinator, based on the voltage level criterion, to weigh the information that is most relevant for the coordination of SEIN operation in real time.
Concerning the requirements of availability of signals rates, the application phases were redefined. A first stage was approved with a minimum availability of 75%, which will be valid until May 27, 2014, a second stage with a minimum availability of 90% for a period of 1 year from the completion of the first stage; and a third stage, called the “target stage” with an availability of 96% in some cases and 98% in the case of signals considered as high priority, which correspond to premises with voltage levels greater than or equal to 100 kV and power plants greater than or equal to 50 MW.
Ministry of Energy and Mines through Directorial Resolution 444-2013-EM-DGE, published on October 31, 2013 modified Directorial Resolution 243-2012-EM-DGE, establishing that the COES must retransmit in real-time to OSINERGMIN and the General Electricity Agency of the Ministry of Energy and Mines, the information exchanged through the communication network between the control centers of the members of SEIN and the control center of COES.
F-540
Table of Contents
GENERANDES PERÚ S.A. AND SUBSIDIARIES
Notes to the Unaudited Consolidated Financial Statements
(l) Mass Use of Natural Gas
On December 22, 2012, Law 29969 Law dictating regulations to promote the mass use of natural gas was published. This Law established that OSINERGMIN shall transfer S/. 200 million to FISE; it empowered state electricity distribution companies to implement programs for mass use of natural gas, including the distribution of natural gas in their concession areas. The Ministry of Energy and Mines, in a maximum period of 3 years after the start of the distribution of gas, shall begin the process of promoting private investment for awarding the gas distribution concession. Local and regional governments were also authorized to transfer the resources arising from royalties to the state electricity distribution companies.
Modification was also made on the Law Creating the SISE and FISE, which established that the charge levied by the carrier of natural gas from the electricity generator, must be compensated by the demand through an additional charge included in the toll of the main transmission Electrical system. It also said that the mass use of natural gas for residences and vehicles shall mainly focus on poor population and regions that do not have royalties.
Supreme Decree 014-2013 -EM, published on May 25, modified the regulations on Law for Promotion of Natural Gas Industry (Law 27133) approved by Supreme Decree 040-99 -EM. This supreme decree modified several articles of said regulations. It also proposes the development of pipeline branches along the main transport network whose construction, operation and maintenance will be provided by the Transport Concessionaire in order to promote the mass use of natural gas delivering this hydrocarbon to new areas of natural gas distribution (cities surrounding the path of the Main Network).
Since the current regulations on Law for Promotion of Natural Gas do not require the transport concessionaire to invest in such infrastructure, it is necessary to enter into an Addendum between the Government (grantor) and the Transport Concessionaires including a Main Network scheme, to include in their transport systems the indicated branches, called Main Referrals.
The annuity of the Operation and Maintenance of the said branches shall be determined according to the efficient costs as determined by OSINERGMIN taking into account the economic and financial information of the concessionaire, using in the same way the discount rate of the concession agreement.
Yearly income to be received by the holder of the Main Bypass will consist of: 1) contributions from Independent Consumers served by the main take-off pipelines (whose tariff will be calculated with the maximum carrying capacity of the take-off pipeline), and 2) the contributions of the National User/Consumer of the Main Network who pays regulated tariffs affected by a Tariff Application Factor (FAT) as defined by OSINERGMIN, which may not exceed of 1.2.
(m) Energy Security and Development of the Southern Petrochemical Complex
On December 22, 2012, Law 29970 Law that Strengthens the Energy Security and Promotes the Development of the Southern Petrochemical Complex was published. This Law declared of national interest the implementation of measures for strengthening the energy security, obtaining and transporting ethane in the south of the country, and the construction of regional pipelines in the regions of Huancavelica, Junín and Ayacucho, from the existing pipeline. Also by means of this Law, complementary provisions were enacted to streamline and simplify the administrative procedures related to obtaining permits and authorizations.
F-541
Table of Contents
GENERANDES PERÚ S.A. AND SUBSIDIARIES
Notes to the Unaudited Consolidated Financial Statements
Regarding the strengthening of energy security:
| (i) | The companies responsible for implementing the projects of natural gas and natural gas liquids supply would be benefited from the Guaranteed Income mechanism provided that there is an improvement in the energy security of the electricity sector, being necessary to grant such projects through concession agreements arising from investment promotion processes. |
| (ii) | A number of necessary projects were established to increase energy security, provided they operate together and in parallel with the transport system of gas and/or liquids currently existing in Camisea, among which we can mention: |
| • | A gas pipeline and liquids pipeline from Camisea to Chiquintirca Compression Station, except for the section that under contractual obligation corresponds to the existing concessionaire. |
| • | A gas pipeline and/or liquids pipeline from the existing system to Anta, Cusco which shall be able to supply natural gas to the future Quillabamba Power Plant and to the south coast of Peru. |
| • | A regasification plant and premises for import of liquefied natural gas located in Pampa Melchorita. |
| (iii) | The portion non recovered with the tariff income of the concessionaire may be covered as per the mentioned Guaranteed Income mechanism or as established by Law 29852 Energy Security System on Hydrocarbons and Energy and Social Inclusion Fund as the Ministry of Energy and Mines may establish. |
| (iv) | ELECTROPERÚ will participate in the development of the Southern Petrochemical Complex project by supplying natural gas and contracting gas carrying capacity from Anta to the south coast of Peru for the operations of said Energy Complex and the Petrochemical Complex in southern Peru. |
| (v) | Users will assume as an additional charge in the toll of the main transmission system: i) compensations related to natural gas costs that foster the installation of power generation in the north and south of Peru, and ii) the contracting of gas firm transport not covered by existing generators, in order to make feasible the development of the South Nodal Energy. |
Regarding the development of the Petrochemical Complex the following is established:
| • | Ethane can be obtained through: i) negotiation with Contractors of blocks exploiting or that will exploit natural gas; or ii) the extraction of ethane from natural gas purchased by customers. |
| • | PETROPERU will participate in the development of the Petrochemical Complex and its participation will be established by the Ministry of Energy and Mines. |
| • | The Ministry of Energy and Mines will make a capital increase in Petroperu for up to US$ 400 million which has a temporary character for up to a maximum of 15 years. |
Through Supreme Decree 038-2013-EM, published on October 17, 2013, the Ministry of Energy and Mines approved a regulation that promotes the growth of electricity generation within the framework of Law 29970; among other considerations, it was established that the Ministry of Energy and Mines, by means of Ministerial Resolution, will approve, every two years, at the request of COES and view of OSINERGMIN, the requirement of capacity, location and terms of commercial operation that shall be bid, necessary to strengthen the energy security.
F-542
Table of Contents
GENERANDES PERÚ S.A. AND SUBSIDIARIES
Notes to the Unaudited Consolidated Financial Statements
Also, by means of Supreme Decree 005-2014-EM published on February 7, 2014, the Ministry of Energy and Mines approved the regulation of Law 29970 referred to the promotion of an Integrated Transport System of Hydrocarbons, which comprises the transport systems of natural gas and natural gas liquids within the security area and the transport system of natural gas through the Peruvian southern gas pipeline.
The above mentioned security area corresponds to the region comprised between Malvinas, Chiquintirca (at 207 km of Camisea over the current pipeline route) in Ayacucho and Anta (approximately at 170 km to the south of the current pipeline, where Electroperú will establish its future thermal power station Quillabamba) in Cusco; in this area, the State guarantees reliability and availability of the supply of hydrocarbons.
Among other measures, by means of this Decree, it is possible to define a Charge for Strengthening of Energy Security (CASE) which will be collected from consumers through a Main Transmission System Toll, having as purpose to complete the missing amount so that the concessionaire of such Integrated System of Natural Gas Transport earns the corresponding Annual Guaranteed Income as a result of the award process of the concession; the administration of such charge will be under the responsibility of OSINERGMIN. The term to initiate pre-payments of Guaranteed Income of Integrated Systems will be defined by the Ministry of Energy and Mines and it shall not exceed 6 months from the signing date of the Concession Agreement.
Also, by means of Supreme Decree 014-2014-EM published on May 6, 2014, additional provisions were established in order to apply Law 29970; among them, we find those related to prepayments of Guaranteed Income of the Concessionaire of the Security System for Transport of natural gas and natural gas liquids and Southern Andes pipeline, collection of CASE and SISE charges and those regulated fees of natural gas on behalf of prepayments, as well as the trust created to manage such collection.
(n) Mechanism for Natural Gas Disruption Emergency Response
By means of Supreme Decree 050-2012-EM, published on December 31, 2012, a mechanism was established for dealing with emergencies that endanger the continuity of natural gas supply which will be activated in emergency situations that are beyond the control of the producer and/or concessionaire of transport and/or distribution and that may fully or partially affect the natural gas and/or liquids of natural gas activities.
| • | It is established that in such situations the available natural gas will be used solely for the domestic market, following an order of priority, being the electric generators ranked in fourth place of priority, after regulated residential and commercial customers and transport users. |
| • | An automatic statement of Exceptional Situation is established in the SEIN. |
| • | Payment of compensation for deficiencies in product quality and power supply is exempted. |
| • | Permission is granted to those who are required to maintain stocks of liquid fuels, for using them. |
(o) The Energy Policy and Plan for Universal Access to Energy
In order to have a reliable, efficient, and self-sufficient energy supply, with reasonable prices, minimal environmental impact, and little exposure to increased volatility in prices for fossil fuels, the Peruvian government considered it necessary to establish a state policy in the energy field so that the energy requirement that accompanies all economic growth can be guaranteed in the medium- and long-term.
F-543
Table of Contents
GENERANDES PERÚ S.A. AND SUBSIDIARIES
Notes to the Unaudited Consolidated Financial Statements
Accordingly, Supreme Decree 064-2010-EM, published on November 24, 2010, approved thePeru’s National energy policy for the period 2010-2040which sets 9 energy policy objectives and their respective guidelines, which consist of:
| (i) | Diversification of the energy matrix with emphasis on renewable sources and energy efficiency. This policy establishes the need to promote projects and investments to diversify energy matrix through renewable conventional and non- conventional sources, hydrocarbons, geothermal and nuclear sources; it also establishes the promotion of the use of distributed generation and prioritize the construction of hydroelectric plants. |
| (ii) | Competitive energy supply. It establishes the need to have the necessary infrastructure throughout the electricity and hydrocarbons supply chain to ensure energy supply; it also establishes a regulatory framework that promotes competition, minimizes the market concentration and promotes pricing transparency, and regulates access and rates when it is not possible to establish competition mechanisms. Other guidelines of this objective are to develop mechanisms to limit the impact of volatility of world market prices, and to promote private investment; the State performing its subsidiary role. |
| (iii) | The universal access to energy supply; this objective seeks to achieve total coverage of electricity and hydrocarbons supply, temporarily subsidizing it for low-income populations. Also it establishes that local communities shall be involved in rural electrification projects, fostering the productive use of energy in remote, rural and marginal urban areas. Transport systems necessary for the service to reach all locations should also be prioritized. |
| (iv) | The efficiency in the production and consumption of energy; to achieve this goal it is necessary to encourage the efficient use of energy to obtain measurable results, being necessary to involve energy companies and users in energy efficiency programs through promoters and incentive mechanisms. It also addresses the need to use smart technology systems to ensure appropriate management of the supply and demand of energy and the creation of the energy- efficiency center to be a decentralized organization that promotes the efficient use of energy. |
| (v) | Self-sufficiency in energy production; it proposes the promotion of the production of electricity based on available energy resources in the regions and fostering exploration and exploitation of these resources. It also shall promote investments to implement, upgrade and expand the country’s refineries in order to meet domestic demand. On the other hand, it also considers maintaining supply procurement processes to achieve beforehand the adequacy of power generation. It also establishes the rational use of energy resources to ensure their availability. |
| (vi) | The energy sector development with minimal environmental impact; this objective foster the development and use of clean energy and technology with low emissions of pollutants as well as the establishment of mitigating mechanisms for emissions from energy activities. It aims at promoting energy projects that can get the benefits from the sale of certified emission reductions for the carbon market; it seeks to achieve a harmony between the state, communities and businesses. |
| (vii) | The development of industry and use of natural gas; it proposes to promote the substitution ofoil-derived fuels for the use of natural gas and liquefied petroleum gas–LPG–in the industry and transportation, mass use of natural gas through decentralized distribution systems. It also considers |
F-544
Table of Contents
GENERANDES PERÚ S.A. AND SUBSIDIARIES
Notes to the Unaudited Consolidated Financial Statements
| fostering the development of the petrochemical industry and promoting the development of a polyduct network and strengthening the system of hydrocarbons transport and storage according to the country’s growth. |
| (viii) | Institutional strengthening and transparency in the sector; it establishes the need to act and promote transparency in the activities of the sector and to ensure legal stability that allows to boost energy development in the long term. It also considers the promotion of research, development and technological innovation in the energy sector, among other points. |
| (ix) | Regional energy integration with a long-term vision; establishes the need to continuously identify the benefits of energy integration, entering into agreements leading gradually to market integration. |
Through Ministerial Resolution 203-2013-MEM/DM, published on May 28, 2013, the Ministry of Energy and Mines approved thePlan for Universal Access to Energy 2013-2022. It identifies two key priorities in the global energy sector:
| (i) | Universal access to energy, which defines 100% access to basic human needs by year 2030 and is based on two objectives: |
| • | 100% access to basic human needs by year 2030, 100% access to electricity: lighting, communication, and community services. |
| • | 100% access to technologies and fuels for cooking and heating: improved stoves, natural gas, LPG, and biogas. |
| (ii) | Improving energy efficiency. |
Access to energy is considered one of the pillars in the fight against poverty.
The objective of this plan is to promote, from the energy field, an efficient, environment-sustainable and fairly economic development, implementing projects that allow universal access to electricity supply, prioritizing the use of available power sources, with the objective to generate more and better quality of life for low-income populations.
Resources to implement the Plan for Universal Access to Energy will be: The Social Inclusion Energy Fund transfers to the public sector, external funding sources, contributions, allowances, grants, resources through agreements, and resources considered in the National Plan of Rural Electrification 2013-2022.
(p) Regulatory Contribution
As a consequence of the transfer of the environmental supervising, inspecting and sanctioning functions of OSINERGMIN to the Agency for Environmental Assessment and Inspection—OEFA—through Supreme Decree 127-2013-PCM and 129-2013-PCM, published on December 19, 2013, new regulatory contributions from energy entities and companies (Electricity and hydrocarbons) to OSINERGMIN and OEFA were established. These contributions are obtained as a result of applying the percentages established to the monthly billing, corresponding to transactions with third parties directly related to the controlled, regulated and monitored activity, deducting the sales tax and Municipal Promotion Tax.
F-545
Table of Contents
GENERANDES PERÚ S.A. AND SUBSIDIARIES
Notes to the Unaudited Consolidated Financial Statements
(3) Basis for the Preparation of Consolidated Financial Statements
(a) Statement of Compliance
The consolidated financial statements as of December 31, 2014 and 2013 have been prepared in accordance with International Financial Reporting Standards (IFRSs) issued by the International Accounting Standards Board (IASB), in force as of that date.
(b) Information Responsibility
The information contained in these consolidated financial statements is the responsibility of the Company’s Management which expressly states that all the principles and criteria included in the IFRSs issued by the IASB have been applied.
(c) Basis of Measurement
The consolidated financial statements have been prepared on the historical cost basis, except for the derivative financial instruments which are measured at fair value.
(d) Functional and Presentation Currency
The consolidated financial statements are presented in nuevos soles (S/.) which is the Company’s and its Subsidiaries’ functional and presentation currency.
(e) Use of Estimates and Judgments
The preparation of the consolidated financial statements in conformity with IFRS requires the Company and Subsidiaries’ management to make judgments, estimates and assumptions that affect the application of accounting policies and the reported amounts of assets and liabilities, income and expense. Actual results may differ from these estimates.
Estimates and underlying assumptions are reviewed on an ongoing basis. Revisions to accounting estimates are recognized in the period in which the estimates are revised and in any future periods affected.
Resulting accounting estimates, very rarely will be the same as the respective actual results. However, in management’s opinion, actual results will not vary significantly from estimates and assumptions applied by the Company and its Subsidiaries. The main accounting estimates made by management are the following:
| • | Useful life of property, plant and equipment, and intangible assets (see notes 4i and 4m). |
| • | Impairment of property, plant and equipment (see note 4k). |
| • | The assumptions used to calculate the actuarial liabilities and obligations to employees, such as discount rates, mortality tables, salary increases, and others (see note 21). |
| • | The assumptions used to calculate the fair value of financial instruments (see notes 4d, 4e and 4f). |
F-546
Table of Contents
GENERANDES PERÚ S.A. AND SUBSIDIARIES
Notes to the Unaudited Consolidated Financial Statements
| • | Energy supplied to customers and not invoiced at the closing of each period. |
| • | Certain assumptions inherent in the electricity system affecting transactions with other companies, such as production, customer billings, energy consumption, etc. that allow for estimating electricity system settlements that must occur on the corresponding final settlement dates, but that are pending as of the date of issuance of the consolidated financial statements and could affect the balances of assets, liabilities, income and expenses recorded in the statements. |
| • | Likelihood of occurrence and the amount of liabilities of uncertain amount or contingent (see note 36). |
| • | Future disbursements for the closure of facilities and restoration of land (see note 4l). |
| • | Current and deferred taxes. |
Management has exercised its critical judgment when applying accounting policies for the preparation of the accompanying consolidated financial statements, as explained in the corresponding accounting policies.
(f) Consolidated Financial Statements
These consolidated financial statements comprise the separate financial statements of Generandes Perú S.A. and the financial statements of its subsidiaries Edegel S.A.A. and Chinango S.A.C. as mentioned in note 1.
(i) Subsidiaries
The subsidiaries are all entities over which the Company has authority to govern their operating and financial policies generally for being holder of more than half of voting shares. Subsidiaries are consolidated from the date on which their control is transferred to the Company. They are not consolidated from the date on which control ceases.
The Company uses the purchase method to record the acquisition of its subsidiary. The cost of acquisition is measured as the fair value of delivered assets, equity instruments issued, and liabilities incurred or assumed at the date of the exchange, plus costs directly attributable to the acquisition. Identifiable assets acquired and liabilities assumed in a business combination are initially measured at fair value at the acquisition date. The excess of the cost of acquisition over the fair value of the Company’s interest in identifiable net assets acquired is recorded as goodwill in the assets.
If the cost is lower than the subsidiary’s fair value of net assets (badwill), the difference is recognized directly in the consolidated statement of income.
Transactions, balances and unrealized gains among the companies that the Company controls are eliminated. Also, unrealized losses are eliminated unless the transaction provides evidence of impairment in the value of the transferred assets.
(ii) Non-controlling Interest
Interests from third parties that are not part of the Company, if applicable, are shown as non-controlling interests under the equity in the consolidated statement of financial position and in the consolidated statement of comprehensive income.
F-547
Table of Contents
GENERANDES PERÚ S.A. AND SUBSIDIARIES
Notes to the Unaudited Consolidated Financial Statements
(4) Significant Accounting Policies
Main accounting principles applied in the preparation of consolidated financial statements are detailed below. The accounting policies set out below have been applied consistently to all periods presented, unless otherwise indicated.
(a) Cash and Cash Equivalents
Cash and cash equivalents comprise cash on hand, demand deposits in banks, and, other short-term highly liquid investments with original maturities of three months or shorter, with no significant risk of changes in its fair value.
(b) Trade Accounts Receivable and Estimate of Doubtful Accounts
Trade accounts receivable arises from sale of energy and power, which are billed in the month following dispatch of energy, recording dispatch of energy, and the estimated amount of unbilled energy provided in the month.
The balances of trade accounts receivable are initially recorded at their face value, net of the corresponding estimate of doubtful accounts.
Estimate for doubtful accounts is computed based on the evaluation made by management concerning credit risk of each client. If, based on the evaluation, management determines that a client shows a high credit risk, then management determines the amount of that should be estimated as doubtful account and charges it to profit and loss of the period when the need of recording such provision is determined.
Management considers that the procedure used allows estimating and recording the necessary provisions to appropriately cover the risk of loss in trade accounts receivable. Uncollectible accounts are written-off when identified.
(c) Inventories and Estimate of Inventory Obsolescence
Inventories are valued at the lower of cost or net realizable value. Cost is determined using the weighted average method, except for inventories in transit in which cases the specific cost method is used. The net realizable value is the estimated selling price estimated in the ordinary course of business, less the estimated costs of completion and the estimated costs necessary to make the sale.
The estimate of inventory obsolescence is determined based on periodic technical studies on inventory obsolescence prepared by Management. This estimate is charged to the results of the fiscal period in which such deductions occur.
(d) Non-derivative Financial Instruments
Non-derivative financial instrument is any contract that gives rise to both a financial asset in one entity and a financial liability, or equity instrument in another. In the case of the Company and its Subsidiaries, non-derivative financial instruments correspond to primary instruments such as accounts receivable and accounts payable.
F-548
Table of Contents
GENERANDES PERÚ S.A. AND SUBSIDIARIES
Notes to the Unaudited Consolidated Financial Statements
Non-derivative financial instruments are classified as asset, liability, or equity according to the substance of the contract that gave rise to the financial instrument.
The interest, dividends, gains, and losses generated by a financial instrument, and classified as liability, are recorded as income or expense in the statement of income. The payment to holders of financial instruments classified as equity is recorded directly against stockholders’ equity. The financial instruments are compensated when the Company and its Subsidiaries have the legal right to compensate them, and management has the intention of paying them on a net basis or negotiating the asset, and paying the liability simultaneously.
Non-derivative financial instruments shall be recognized in the financial statements at fair value. Fair value is the price that would be received to sell an asset or paid to transfer a liability in an orderly transaction between market participants at the measurement date.
In management’s opinion, the carrying amount of non-derivative financial instruments as of December 31, 2013 and 2012 are substantially similar to their fair values due to their short periods of realization and/or maturity or are subject to variable and fixed interest rate similar to those used in the market.
(e) Hedging of Non-Derivative Instruments
If there is a high level of correlation between revenues and exchange rate variations in U.S. dollars, the Company will be subject to an exchange rate risk for future cash flows. IAS 39 allows hedging these revenues through financing in this currency. Exchange differences of this debt, concerning cash flow hedging operations, are recorded, net of its tax effect, in a hedging account, and are recorded in the income statement in the term when hedged cash flows will be realized. This term has been estimated in ten years.
(f) Derivative Financial Instruments and Hedge Accounting
Derivative instruments are recorded in conformity with IAS 39Financial Instruments: Recognition and Measurement.
Financial derivative contracts for which the Company and its Subsidiaries have established a cash flow hedging relationship are recorded as assets or liabilities in the statement of financial position and presented at their fair value.
When a derivative is designated as a cash flow hedging instrument, the effective portion of changes in the fair value of the derivative is recognized in other comprehensive income and accumulated in the hedging reserve.
Any ineffective portion of changes in the fair value of the derivative is recognized immediately in profit or loss.
(g) Financial Assets
The Company and its Subsidiaries classify its financial assets in the following categories: i) financial assets at fair value through profit or loss, ii) loans and accounts receivable, iii) held-to-maturity financial assets, and iv) available-for-sale financial assets. The classification depends on the purpose for which investments were acquired. Management determines the classification of their financial assets as of the date of their initial recognition and reassesses this classification as of every closing date.
F-549
Table of Contents
GENERANDES PERÚ S.A. AND SUBSIDIARIES
Notes to the Unaudited Consolidated Financial Statements
Financial Assets at Fair Value through Profit or Loss
A financial asset is classified in this category if it was mainly acquired in order to be sold in the short-term or if it is so designated by Management. Derivative financial instruments are also classified as marketable unless they are designated as hedges. Assets under this category are classified as current assets if they are held as marketable or they are expected to be realized within 12 months as from the date of the consolidated statement of financial position. As of December 31, 2014 and 2013, the Company and its Subsidiaries did not hold any financial asset under this category.
Loans and Accounts Receivable
Loans and accounts receivable are non-derivative financial assets with fixed or determinable payments that are not quoted in an active market. They arise when the Company and its Subsidiaries provide with money, goods or services directly to a debtor, with no intention to trading the account receivable. They are included in current assets, except for maturities exceeding 12 months after the date of the statement of financial position. The latter are classified as non-current assets. Loans and accounts receivable are included in trade accounts receivable and other accounts receivable in the consolidated statement of financial position (note 7, 8 and 9).
Loans and accounts receivable are initially recognized on the date when they are originated.
The Company derecognizes a financial asset when the contractual rights to the cash flows from the asset expire, or it transfers the rights to receive the contractual cash flows in a transaction in which substantially all of the risks and rewards of ownership of the financial asset are transferred, or it neither transfers nor retains substantially all of the risks and rewards of ownership and does not retain control over the transferred asset. Any interest in such derecognized financial assets that is created or retained by the Company is recognized as a separate asset or liability.
These assets are initially recognized at fair value plus any directly attributable transaction costs. Subsequent to initial recognition, they are measured at amortized cost using the effective interest method.
These assets are evaluated at each reporting date to determine whether there is objective evidence of impairment.
Held-to-Maturity Financial Assets
Held-to-maturity investments are non-derivative financial assets with fixed or determinable payments and fixed maturities acquired with the Company’s Management intention and ability to hold them to maturity. As of December 31, 2014 and 2013, the Company and its Subsidiaries did not hold any financial asset under this category.
Available-for-sale financial assets
Available-for-sale financial assets are non-derivative financial assets designated in this category or that do not classify in any of the other categories. These assets are shown as non-current assets unless Management has express intention to sell the investment within 12 months as of the date of the statement of financial position. As of December 31, 2014 and 2013, the Company and its Subsidiaries did not hold any financial asset under this category.
F-550
Table of Contents
GENERANDES PERÚ S.A. AND SUBSIDIARIES
Notes to the Unaudited Consolidated Financial Statements
The Company and its Subsidiaries evaluate at each date of the consolidated statement of financial position whether there is objective evidence of the impairment of a financial asset or group of financial assets.
(h) Investments in Associate
Associates are those entities in which the Company and its Subsidiaries have significant influence, but not control; as in the case of the investment that the subsidiary Edegel S.A.A. has in Endesa Brasil S.A. which is part of Enel Group.
Edegel S.A.A. records its investment in Endesa Brasil S.A. under the equity method, recognizing, in the consolidated financial statements, changes in the results and the equity of the associate, on a proportion basis to the Subsidiary’s interest.
Also, because the functional currency of the associate is different from the subsidiary Edegel S.A.A.’s, the effect of translating the balances into Peruvian nuevos soles as presentation currency shall be recognized,i.e., balances of the statement of financial position are translated at the closing exchange rates of each year and the results at average exchange rate; recording any difference under ‘other reserves’ in the equity. Dividends received from the associate are recorded as a decrease in the investment value.
(i) Property, Plant, and Equipment
Properties, plant and equipment are recorded at cost, less accumulated depreciation and accumulated impairment losses. Also, this item includes the net cost of leased goods and spare parts acquired for major inspections of power plants. When the assets are sold or disposed, their cost and accumulated depreciation are eliminated, and any gain or loss resulting from their disposal is included in the consolidated statement of income.
The initial cost of property, plant, and equipment comprises their purchase price, including non-reimbursable customs fees and purchase taxes as well as any other directly attributable cost of bringing the asset to its working condition and for its intended use, and the estimate of the initial decommissioning costs. Costs incurred after fixed assets starts operating are recognized as assets provided that: (i) it is probable that future economic benefits embodied within the asset will flow to the Company, and (ii) the cost of the asset can be measured reliably. Routine repairs and maintenance of property, plant and equipment are charged to the statement of income in the period in which they are incurred.
Assets under construction are capitalized as a separate component. By the end, the cost of these assets are transferred to a definitive category: Works-in-progress are not depreciated.
Land is not depreciated. Depreciation is calculated using the straight-line method based on the estimated useful life of the asset that are:
Years | ||||
Buildings and other constructions | 45 | |||
Plant and equipment | 18 | |||
Furniture and fixtures | 9 | |||
Various equipment | 7 | |||
Vehicles | 5 | |||
F-551
Table of Contents
GENERANDES PERÚ S.A. AND SUBSIDIARIES
Notes to the Unaudited Consolidated Financial Statements
Residual value, useful life and depreciation methods are periodically reviewed and adjusted by management according to the forecasted economic benefits to be provided by the components of property, plant, and equipment.
(j) Finance Lease
The Company and its Subsidiaries recognize finance lease recording assets and liabilities, in the consolidated statement of financial position, at an amount equal to the fair value of the leased assets. Initial direct costs are considered as part of the asset. Finance lease payments should be apportioned between the finance charge and the reduction of the liability. The finance charge is apportioned over the lease term.
Finance lease generates asset depreciation expenses and debt financing costs in each accounting period. The depreciation policy for assets held under finance leases is consistent with that for other assets of property, plant and equipment of the Company and its Subsidiaries.
(k) Impairment Loss
Throughout the year, and especially at year-end close, the Company and its Subsidiary review whether there is any indication of impairment. If any such indication exists, then the asset’s recoverable amount is estimated to determine the impaired amount. In the cases of identifiable assets that do not generate cash flows independently, estimation is made on the recoverability of the cash-generating unit to which the asset belongs, understanding as such the smallest identifiable group of assets that generates independent cash inflows.
Regardless of the preceding paragraph, in the case of cash-generating units to which acquired goodwill or intangible assets have been allocated with an indefinite useful life, the recoverability analysis is performed systematically at the closing of each period.
The recoverable amount of an asset is the greater of its market value less costs to sell and value in use, this being understood as the present value of estimated future cash flows. For the calculation of the salvage value of property, plant and equipment, of acquired goodwill, of intangible assets, the value in use is the criteria used by the Company and its Subsidiaries in all the cases.
To estimate the value in use, the Company and its Subsidiary prepare future cash flow projections based on most recent budget available. These budgets include the best estimates of Management on revenues and costs of the cash-generating units based on industry projections, past experience and future expectations.
These projections cover the next five years, estimating cash flows for the following years by applying growth rates of 3.44% which does not exceed the average long-term growth rate for the sector and for the country.
These flows are discounted to calculate their present value at a rate that reflects the capital cost of the business and the geographical area in which it operates. For its calculation, it takes into account the current cost of money and the risk premiums generally used by analysts for the business and geographic area. The discount rate applied at 2014 year-end was 7.5%.
The assumptions used to determine the value in use as of December 31, 2014 do not present major changes compared to those as of December 31, 2013.
When there is an indication that the impairment loss no longer exists or has decreased, the reversal of losses is recorded in the consolidated statement of income.
F-552
Table of Contents
GENERANDES PERÚ S.A. AND SUBSIDIARIES
Notes to the Unaudited Consolidated Financial Statements
(l) Provision for Decommissioning of Power Plants
Liabilities for decommissioning are recognized when the Company and its Subsidiaries are required to dismantle and remove facilities to restore the site where the plants are located, and when a reliable estimate can be made of the amount of the obligation. Removal costs are recorded at the present value of estimated future expenditure determined in accordance with local requirements and conditions, which are periodically reviewed, including the discount rate used to calculate the present value. Initially, the amount of fixed assets is recognized by an amount equivalent to the provision. Subsequently, this amount will be depreciated as well as the items of fixed assets. Any change in the present value of the estimated expenditure is reflected as an adjustment to the provision and value of the corresponding asset. The changes over time in the provision are recorded as finance cost in profit or loss of the period.
(m) Intangible Assets
Intangible assets are initially recorded at cost. Assets can be recognized as intangible if their cost can be reliably measured and it is probable that future economic benefits embodied within the asset will flow to the Company and its Subsidiaries. After initial recognition, intangible assets are accounted for at cost less accumulated amortization and any accumulated impairment losses.
Useful life and amortization method are periodically reviewed by the Company’s management according to the forecast economic benefits to be provided by the components of intangible asset items.
Amortization is calculated using the straight-line method based on the estimated useful life of the asset.
Years | ||||
Concessions and rights | 21 - 30 | |||
Software | 3 - 10 | |||
(n) Financial Liabilities
Financial liabilities are initially recognized at their fair value, net of incurred transaction costs. These liabilities are subsequently recorded at their amortized cost, and any resulting difference between the funds received (net of transaction costs) and the redemption value is recognized in the consolidated statement of income over the obligation using the effective interest method.
Financial liabilities are classified as current liability unless the Company and its Subsidiaries have the unconditional right to differ settlement of the liability for at least twelve months after the consolidated statement of financial position.
(o) Bonds
The obligation to issue bonds is recorded at its par value. Commissions and interests are recorded in the results of the fiscal period, when accrued.
(p) Income tax
Current income tax—
Current tax comprises the expected tax payable or receivable on the taxable income or loss for the year and any adjustment to the tax payable or receivable in respect of previous years. It is measured using tax rates that have been approved as of the date of the consolidated statement of financial position (note 34).
F-553
Table of Contents
GENERANDES PERÚ S.A. AND SUBSIDIARIES
Notes to the Unaudited Consolidated Financial Statements
Deferred income tax—
Deferred tax is recognized in respect of temporary differences between the carrying amounts of assets and liabilities for financial reporting purposes and the amounts used for taxation purposes.
Deferred income tax asset and liability are recognized without considering the estimated time when the temporary differences will disappear. Income tax asset is only recognized so far as it is probable that there will be future tax benefits, so that the asset can be used.
Deferred tax is measured at the tax rates that are expected to the applied to temporary differences when they reverse, using tax rates enacted or substantively enacted at the reporting date.
(q) Workers’ Profit Sharing
Workers’ profit sharing is determined using the same criteria used to determine the current income tax. Workers’ profit sharing rate applicable to the subsidiary Edegel S.A.A is 5%.
(r) Provisions
Provisions are recognized when the Company and its subsidiaries have a present obligation (legal or constructive), as a result of past events, and when it is probable that an outflow of resources will be required to settle the obligation, and it is possible to reliably estimate its amount. When the Company expects a provision or part of it is refundable, the reimbursement is recognized only if it is assured that it will be obtained.
Provisions are reviewed and adjusted in each period to reflect the best estimates as of the date of the statement of financial position.
When the effect of the time value of money is material, the value of the provision is the present value of the expenditure required to settle the provision.
(s) Contingent Liabilities and Assets
Contingent liabilities are not recognized in the financial statements. They are disclosed in notes to financial statements unless the possibility of an outflow of economic resources is remote. In this case, they are not disclosed in the notes.
Contingent assets are not recognized in financial statements, and they are only disclosed in notes when an inflow of economic benefits is probable.
(t) Revenue, Cost and Expense Recognition
Revenue from rendering of services and interest are recognized to the extent that it is probable that future economic benefits will flow to the Company.
Revenues from sales of energy and power delivered but not invoiced are recognized as revenue in the month in which the service is provided based on estimates made by management and are billed in the month following the release of energy.
F-554
Table of Contents
GENERANDES PERÚ S.A. AND SUBSIDIARIES
Notes to the Unaudited Consolidated Financial Statements
The following criteria shall be met in order to recognize revenues:
Sale of energy and power fees
Sales of energy are computed based on cyclical readings and are completely recognized in the period when service is rendered. Revenues from the sale of energy delivered but not invoiced between the last cyclical reading and the end of each month is computed based on estimates of energy consumed by users of the service during the deferred period.
Interest income
Interest is recognized on a time proportion basis to reflect the effective yield of assets.
Acquisition costs of fuel, energy and tolls are recognized when accrued.
Expenses are recognized on an accrual basis and are recorded in the periods to which they relate.
(u) Costs of Financial Liabilities
Costs of financial liabilities are recorded as expense when accrued. Costs are capitalized if directly attributable to the acquisition or construction of a qualifying asset. Capitalization of costs of financial liabilities begins when activities to prepare the asset are being carried out and expenses and costs for the loans are being incurred. Capitalization of interest is made until assets are ready for their intended use. If the resulting value of asset exceeds its recoverable amount, it shall be recorded as an impairment loss.
Costs of financial liabilities comprise interest expense and other costs incurred related to borrowings, exchange differences arising from borrowings in foreign currency used to finance projects, since they correspond to an adjustment of interest costs.
(v) Earnings per Share
Basic and diluted earnings per share are determined by dividing the net earnings attributable to majority stockholders by the weighted-average number of outstanding subscribed and paid-in ordinary shares as of the date of the consolidated statement of financial position (note 33).
Diluted earnings per share correspond to the basic earnings per share, adjusted for the dilutive effects of shares coming from the conversion of bonds or convertible shares, among others. As of December 2014, and 2013, the Company and its Subsidiaries do not have financial instruments with dilutive effects; therefore, basic and diluted earnings per share are the same.
(w) Foreign Currency Transactions and Balances
Foreign currency transactions are those transactions carried out in a currency other than the functional currency. Foreign currency transactions are translated into functional currency at exchange rates ruling at the dates of the transactions.
The Company and its Subsidiaries have established a hedging policy for the portion of revenues that are directly linked to the performance of the U.S. dollar, by obtaining funding in this currency. Exchange differences on this debt, as being hedging cash flows, are recognized net of tax effect, in a reserve account in equity and recorded in the statement of income in the period in which hedged cash flows will be realized. This period has been estimated at ten years.
F-555
Table of Contents
GENERANDES PERÚ S.A. AND SUBSIDIARIES
Notes to the Unaudited Consolidated Financial Statements
(x) Classification of Balances as Current and Non-Current
The statement of financial position presents balances classified according to their maturity,i.e., as current in the case of those balances with maturities of twelve months or less, and non-current in the case of those balances with maturities of more than twelve months.
For obligations with maturities of less than twelve months, but whose long-term refinancing is assured at the Company’s and its Subsidiary’s discretion through unconditionally available long-term loan agreements, those could be classified as long-term liabilities.
(y) Fair value
The Company determines the fair value of financial instruments using valuation techniques. Fair values are categorized into different levels in a fair value hierarchy as follows:
Level 1: | Quoted prices (unadjusted) in active markets for identical assets or liabilities. | |
Level 2: | inputs other than quoted prices included in Level 1 that are observable for the asset or liability, either directly or indirectly. | |
Level 3: | inputs for the asset or liability that are not based on observable market data. | |
(z) New Accounting Pronouncements Not Yet Adopted
The following standards and interpretations have been published for application to periods beginning after this financial statement presentation date.
| • | Amendments to IAS 16 and IAS 38Clarification of Acceptable Methods of Depreciation and Amortization.This amendment introduces various restrictions to the use of revenue as a basis of depreciation and amortization. This amendment becomes obligatory for the Company on January 1, 2016, with early adoption permitted. |
| • | Amendments to IAS 19 Employee Benefits - Employee Contributions aims at simplifying accounting of contributions that are independent of the years of service of the employee. Amendment is obligatory for annual periods beginning on or after July 1, 2014. The Company has not opted for early adoption. |
| • | IFRS 9Financial Instruments, replaces guidelines to IAS 39Financial Instruments:Recognition and Measurement IFRS 9 includes guidelines reviewed for the classification and measurement of financial instruments, including a new model of expected credit losses to calculate the impairment of financial assets and the new general requirements for hedge accounting. It also maintains the guidelines related to the recognition and derecognition of financial instruments of IAS 39. The Company will assess the full impact of IFRS 9 and plans to adopt IFRS 9 by the accounting period beginning on January 1, 2018, with early adoption permitted. |
| • | IFRS 15Revenue from Contracts with Customers, establishes a comprehensive framework for determiningwhento recognize revenue andhow muchrevenue to recognize. It replaces the current guidelines for the recognition of revenues including IAS 18Revenue, IAS 11Construction Contractsand IFRIC 13Customer Loyalty Programme.The amendment becomes mandatory for the Company since the accounting period beginning on or after January 1, 2017, with early adoption permitted. |
F-556
Table of Contents
GENERANDES PERÚ S.A. AND SUBSIDIARIES
Notes to the Unaudited Consolidated Financial Statements
| • | Amendments to IFRS 11Accounting for Acquisitions of Interests in Joint Operationsstates that the acquirer of an interest in a joint operation in which the activity constitutes a business, as defined in IFRS 3Business Combinations, is required to apply all of the principles on business combinations accounting in IFRS 3. Amendment is obligatory for annual periods beginning on or after January 1, 2016. Early adoption is permitted. |
| • | IFRS 14Regulatory Deferral Accounts specifies financial information requirements for regulatory deferral account balances that arise when an entity provides goods or services to clients at a price or rate subject to regulation. The amendment becomes mandatory for the Company since the accounting period beginning on or after January 1, 2016, with early adoption permitted. |
The Company’s and its subsidiaries’ management is evaluating the impact, if any, of the adoption of these amendments and new International Financial Reporting Standards (IFRS) issued but not yet effective as of the date of the consolidated financial statements.
(5) Financial Risk Management
The Company’s and its Subsidiary’s activities are exposed to a variety of financial risks whose potential effects are permanently evaluated by the Company’s management in order to minimize exposures. Financial risks are market risks (including the currency risk, price risk, and interest rate risk), credit risk, liquidity risk, and capital management.
Risk management is conducted by the Management. It identifies, evaluates and decides, if appropriate, on the contracting of financial risk hedging based on the Board of Directors’ guidelines.
(a) Currency risk
The Company’s and its subsidiaries’ activities expose it to exchange rate fluctuation risk concerning the Nuevo Sol with respect to U.S. dollars.
Balances in thousands of U.S. dollars (US$) of asset and liability items as of December 31, 2014 and 2013 are summarized as follows:
In thousands of US$ | ||||||||
2014 | 2013 | |||||||
Assets | ||||||||
Cash and cash equivalents | 34,973 | 22,552 | ||||||
Trade accounts receivable, net | 10,071 | 2,357 | ||||||
Other accounts receivable, net | 1,085 | 652 | ||||||
Accounts receivable from related parties | — | 9,370 | ||||||
|
|
|
| |||||
Cash and cash equivalents | 46,129 | 34,931 | ||||||
|
|
|
| |||||
Liabilities | ||||||||
Trade accounts payable | 1,910 | 14,644 | ||||||
Financial liabilities, including current portion | 254,084 | 241,077 | ||||||
|
|
|
| |||||
| 255,994 | 255,721 | |||||||
|
|
|
| |||||
Liability position, net | 209,865 | 220,790 | ||||||
|
|
|
| |||||
These balances as of December 31, 2014, have been stated in Nuevos Soles at the closing Exchange rate of S/. 2.989 (S/. 2.796 as of December 31, 2013).
F-557
Table of Contents
GENERANDES PERÚ S.A. AND SUBSIDIARIES
Notes to the Unaudited Consolidated Financial Statements
Risk hedge policies of exchange rate is prepared based on projected cash flows and considers maintaining a balance between flows indexed to US$ and level of assets and liabilities in such currency. The objective is to minimize the flow exposure to the risk of variations in the exchange rate.
(b) Interest Rate Risk
Since the Company and its Subsidiaries do not have significant interest-bearing assets; their income and operating cash flows are substantially independent from changes in the market interest rates. The Company’s and its Subsidiary’s exposure to this risk is basically generated by their financial obligations.
If, as of December 31, 2014, interest rates over indebtedness in U.S dollars had been 0.5% higher/lower (in absolute terms) and all the other variables had remained constant, the results for the year after taxes would have been:
Period | Increase/decrease | Effects on gain in thousands of S/. | ||||||
2014 | +0.5 | % | 598 | |||||
2014 | -0.5 | % | (598 | ) | ||||
2013 | +0.5 | % | 480 | |||||
2013 | -0.5 | % | (480 | ) | ||||
Funding variable rates might expose the Company and its Subsidiary to the cash flow interest rate risk. The Company and its Subsidiary minimize this risk contracting financial liabilities mainly at fixed interest rates in the medium- and long-term.
The portion of financial obligations at fixed rate or hedged as of December 31, 2014 is 49% (67% as of December 31, 2013), and the Company and its Subsidiaries consider that it will not affect the risk of interest rate fluctuations, since they are within the appropriate range over which the debt structure at fixed and variable rates are managed.
Fixed-rate debts might expose the Company and its Subsidiary to interest rate risk on fair value of liabilities. The Company’s management considers that this risk is not significant because interest rates applied to its financing contracts do not differ significantly from market interest rates which are available to the Company and its Subsidiary for similar financial instruments.
Management considers that future fluctuations in the interest rates will not significantly affect the results of the future operations.
(c) Credit risks
The Company’s and its Subsidiary’s financial assets potentially exposed to credit risk concentrations are mainly bank deposits and accounts receivable presented in the consolidated statement of financial position.
The Company and its Subsidiary only invest their cash surplus in financial institutions with local investment grade rating.
On the other hand, the credit risk relating to accounts receivable from trading activity, is historically fairly low given the short term for collection from customers, which avoid individual accumulations of significant amounts.
F-558
Table of Contents
GENERANDES PERÚ S.A. AND SUBSIDIARIES
Notes to the Unaudited Consolidated Financial Statements
The Company’s and its Subsidiary’s Management periodically evaluates the credit risk of its client portfolio, based on a methodology designed by its parent company, which takes into account factors such as liquidity, indebtedness, profitability, age of business, payment behavior, criminal records, among others.
(d) Liquidity risks
Liquidity is controlled by the balancing of the maturities of assets and liabilities, keeping a proper number of financing sources, and obtaining credit lines that enable the normal development of its activities. The Company and its Subsidiary have an appropriate level of resources and keep financing lines with banking entities.
Management permanently monitors its liquidity reserves, based on cash flow projections.
The table below analyzes the financial liabilities of the Company and its Subsidiary as of the date of the consolidated statement of financial position, classified according to the contractually established maturities:
In thousands of S/. | ||||||||||||||||||||||||
2014 | Less than | 1 to 2 | 2 to 3 | 3 to 5 | 5 to 10 | Over 10 | ||||||||||||||||||
Financial liabilities: | ||||||||||||||||||||||||
Bonds | 24,718 | 59,780 | — | 79,298 | 54,890 | 29,890 | ||||||||||||||||||
Bank loans | 53,494 | 190,322 | 87,949 | 81,346 | — | — | ||||||||||||||||||
Finance lease | 41,620 | 41,469 | 68,435 | — | — | — | ||||||||||||||||||
Trade accounts payable | 209,956 | — | — | — | — | — | ||||||||||||||||||
Other accounts payable to related parties | 30,686 | — | — | — | — | — | ||||||||||||||||||
Other accounts payable | 88,996 | — | — | — | — | — | ||||||||||||||||||
|
|
|
|
|
|
|
|
|
|
|
| |||||||||||||
| 449,470 | 291,571 | 156,384 | 160,644 | 54,890 | 29,890 | |||||||||||||||||||
|
|
|
|
|
|
|
|
|
|
|
| |||||||||||||
In thousands of S/. | ||||||||||||||||||||||||
2013 | Less than | 1 to 2 | 2 to 3 | 3 to 5 | 5 to 10 | Over 10 | ||||||||||||||||||
Financial liabilities: | ||||||||||||||||||||||||
Bonds | 107,938 | 17,762 | 55,900 | 27,950 | 100,774 | 27,950 | ||||||||||||||||||
Bank loans | 29,095 | 44,692 | 72,642 | 147,716 | — | — | ||||||||||||||||||
Finance lease | 28,482 | 38,777 | 38,777 | 66,059 | — | — | ||||||||||||||||||
Trade accounts payable | 293,090 | — | — | — | — | — | ||||||||||||||||||
Other accounts payable to related parties | 4,489 | — | — | — | — | — | ||||||||||||||||||
Other accounts payable | 71,982 | — | — | — | — | — | ||||||||||||||||||
|
|
|
|
|
|
|
|
|
|
|
| |||||||||||||
| 535,076 | 101,231 | 167,319 | 241,725 | 100,774 | 27,950 | |||||||||||||||||||
|
|
|
|
|
|
|
|
|
|
|
| |||||||||||||
Management monitors the risk associated with each of the above mentioned categories, which includes maintaining good relationships with financial institutions in order to assure sufficient credit lines at all times, as well as covering its working capital with cash flows coming from operating activities.
As of December 31, 2014, the Company and its Subsidiaries present liquidity of S/. 238,427 (S/. 172,907 thousand as of December 31, 2013) in cash and other equivalent means and S/. 439,118 thousand in available credit lines (S/. 392,623 thousand as of December 31, 2013).
F-559
Table of Contents
GENERANDES PERÚ S.A. AND SUBSIDIARIES
Notes to the Unaudited Consolidated Financial Statements
Therefore, in management’s opinion, there is no significant liquidity risk as of December 31, 2014 and 2013.
(e) Fair Value Estimate
Management estimates that the carrying amounts of financial instruments current as of December 31, 2014 and 2013 do not differ significantly from their fair values due to their short-term maturity; therefore, disclosure of such information is not relevant for an appropriate interpretation of the Company’s financial position and its Subsidiary as of those dates, and in the case of the non-current financial obligations, because it accrues interest at market rates.
To calculate the fair value of different derivative instruments, the Company and its Subsidiaries use for their valuation the discounted expected cash flows and generally accepted valuation models based on both cash and future market conditions at the closing date of the period.
(e.1) The detail of financial instruments, assets, classified by nature and category as of December 31, 2014 and 2013 is as follows:
In thousands of S/. | ||||||||||||||||||||||||
Held-for-trading | Financial assets at fair value through | Held-to-maturity | Loans and | Available-for-sale | Hedging | |||||||||||||||||||
Year 2014 | ||||||||||||||||||||||||
Derivative Instruments | — | — | — | — | — | — | ||||||||||||||||||
Other financial assets | — | — | — | 255,873 | — | — | ||||||||||||||||||
|
|
|
|
|
|
|
|
|
|
|
| |||||||||||||
Total current | — | — | — | 255,873 | — | — | ||||||||||||||||||
|
|
|
|
|
|
|
|
|
|
|
| |||||||||||||
Derivative Instruments | — | — | — | — | — | 80 | ||||||||||||||||||
Other financial assets | — | — | — | — | — | — | ||||||||||||||||||
|
|
|
|
|
|
|
|
|
|
|
| |||||||||||||
Total non-current | — | — | — | — | — | 80 | ||||||||||||||||||
|
|
|
|
|
|
|
|
|
|
|
| |||||||||||||
Total | — | — | — | 255,873 | — | 80 | ||||||||||||||||||
|
|
|
|
|
|
|
|
|
|
|
| |||||||||||||
Year 2013 | ||||||||||||||||||||||||
Derivative Instruments | — | — | — | — | — | 646 | ||||||||||||||||||
Other financial assets | — | — | — | 293,370 | — | — | ||||||||||||||||||
|
|
|
|
|
|
|
|
|
|
|
| |||||||||||||
Total current | — | — | — | 293,370 | — | 646 | ||||||||||||||||||
|
|
|
|
|
|
|
|
|
|
|
| |||||||||||||
Derivative instruments | — | — | — | — | — | 36 | ||||||||||||||||||
|
|
|
|
|
|
|
|
|
|
|
| |||||||||||||
Total non-current | — | — | — | — | — | 36 | ||||||||||||||||||
|
|
|
|
|
|
|
|
|
|
|
| |||||||||||||
Total | — | — | — | 293,370 | — | 682 | ||||||||||||||||||
|
|
|
|
|
|
|
|
|
|
|
| |||||||||||||
F-560
Table of Contents
GENERANDES PERÚ S.A. AND SUBSIDIARIES
Notes to the Unaudited Consolidated Financial Statements
(e.2) The detail of financial instruments, assets, classified by nature and category as of December 31, 2014 and 2013 is as follows:
In thousands of S/. | ||||||||||||||||
Held-to maturity | Financial liabilities at | Loans and accounts | Hedging | |||||||||||||
Year 2014 | ||||||||||||||||
Loans accruing interest | — | — | 119,759 | — | ||||||||||||
Derivative instruments | — | — | — | 73 | ||||||||||||
Other financial liabilities | — | — | 329,638 | — | ||||||||||||
|
|
|
|
|
|
|
| |||||||||
Total current | — | — | 449,397 | 73 | ||||||||||||
Loans accruing interest | — | — | 690,508 | — | ||||||||||||
Derivative instruments | — | — | — | 2,871 | ||||||||||||
Other financial liabilities | — | — | — | — | ||||||||||||
|
|
|
|
|
|
|
| |||||||||
Total non-current | — | — | 690,508 | 2,871 | ||||||||||||
|
|
|
|
|
|
|
| |||||||||
Total | — | — | 1,139,905 | 2,944 | ||||||||||||
|
|
|
|
|
|
|
| |||||||||
Year 2013 | ||||||||||||||||
Loans accruing interest | — | — | 165,417 | — | ||||||||||||
Derivative instruments | — | — | — | 98 | ||||||||||||
Other financial liabilities | — | — | 369,502 | — | ||||||||||||
|
|
|
|
|
|
|
| |||||||||
Total current | — | — | 534,919 | 98 | ||||||||||||
|
|
|
|
|
|
|
| |||||||||
Loans accruing interest | — | — | 634,248 | — | ||||||||||||
Derivative instruments | — | — | — | 4,751 | ||||||||||||
Other financial liabilities | — | — | — | — | ||||||||||||
|
|
|
|
|
|
|
| |||||||||
Total non-current | — | — | 634,248 | 4,751 | ||||||||||||
|
|
|
|
|
|
|
| |||||||||
Total | — | — | 1,169,167 | 4,849 | ||||||||||||
|
|
|
|
|
|
|
| |||||||||
(6) Cash and Cash Equivalents
This caption comprises the following:
In thousands of S/. | ||||||||
2014 | 2013 | |||||||
Cash | 52 | 40 | ||||||
Checking accounts (a) | 127,305 | 68,833 | ||||||
Time deposits (b) | 111,070 | 104,034 | ||||||
|
|
|
| |||||
| 238,427 | 172,907 | |||||||
|
|
|
| |||||
| (a) | The Company and its Subsidiaries have checking accounts in local and foreign currency in different local banks, their funds are freely available, and bear interest at market rates. |
F-561
Table of Contents
GENERANDES PERÚ S.A. AND SUBSIDIARIES
Notes to the Unaudited Consolidated Financial Statements
| (b) | As of December 31, 2014 and 2013, the Company and its Subsidiaries held time deposits in the following financial institutions: |
In thousands of S/. | ||||||||
2014 | 2013 | |||||||
Banco BBVA Continental | 41,200 | 40,800 | ||||||
Banco Interbank | 25,300 | 26,500 | ||||||
Banco de Crédito del Perú | 44,570 | 36,734 | ||||||
|
|
|
| |||||
| 111,070 | 104,034 | |||||||
|
|
|
| |||||
As of December 31, 2014 time deposits have original maturities between 2 and 28 days and as of December 31, 2013 between 2 and 25 days.
(7) Trade Accounts Receivable
This item comprises the following:
In thousands of S/. | ||||||||
2014 | 2013 | |||||||
Related parties (note 8) | 31,729 | 37,725 | ||||||
|
|
|
| |||||
Third parties | ||||||||
Free clients | 94,586 | 52,540 | ||||||
Distributing client companies | 44,322 | 47,035 | ||||||
COES clients | 6,441 | 17,790 | ||||||
|
|
|
| |||||
| 145,349 | 117,365 | |||||||
|
|
|
| |||||
| 177,078 | 155,090 | |||||||
|
|
|
| |||||
| (d) | Accounts receivable are mainly stated in nuevos soles, have current maturity, and do not accrue interest. Balance of accounts receivable as of December 31, 2014 and 2013, corresponds to 73 and 69 customers, respectively. As of December 31, 2014 and 2013, the Company and its Subsidiaries did not hold past due trade accounts receivable. |
| (e) | Balance of trade accounts receivable as of December 31, 2014 and 2013, includes an amount of S/. 6,642 thousand (S/. 11,887 thousand as of December 31, 2013) which corresponds to withdrawals of energy and power without contractual support made by distribution companies between years 2006 to 2007, which were assigned to subsidiary Edegel S.A.A. by Comité de Operación Económica del Sistema Interconectado Nacional COES-SINAC (Economical Operation Committee of the National Interconnected System—. Those withdrawals are valued at bus-bar tariffs and their invoicing is pending. In the opinion of management, those accounts receivable will be fully recovered. |
F-562
Table of Contents
GENERANDES PERÚ S.A. AND SUBSIDIARIES
Notes to the Unaudited Consolidated Financial Statements
(8) Related Party Transactions
Detail of movement of accounts receivable from related parties is as follows:
In thousands of S/. | ||||||||||||||||
Balance as of | Additions | Disposals | Balance as of | |||||||||||||
Trade, (note 7) | ||||||||||||||||
Edelnor S.A.A. | 37,725 | 439,317 | (445,337 | ) | 31,705 | |||||||||||
Empresa Electrica de Piura S.A. | — | 393 | (369 | ) | 24 | |||||||||||
|
|
|
|
|
|
|
| |||||||||
| 37,725 | 439,710 | (445,706 | ) | 31,729 | ||||||||||||
|
|
|
|
|
|
|
| |||||||||
Various | ||||||||||||||||
Empresa Electrica de Piura S.A. | 743 | 1,580 | (761 | ) | 1,562 | |||||||||||
Edelnor S.A.A. | 55 | 3,217 | (53 | ) | 3,219 | |||||||||||
Enel Trade S.p.A. | — | 16 | — | 16 | ||||||||||||
Endesa Brasil (b) | 26,188 | 42,834 | (69,022 | ) | — | |||||||||||
|
|
|
|
|
|
|
| |||||||||
| 26,986 | 47,647 | (69,836 | ) | 4,797 | ||||||||||||
|
|
|
|
|
|
|
| |||||||||
| 64,711 | 487,357 | (515,542 | ) | 36,526 | ||||||||||||
|
|
|
|
|
|
|
| |||||||||
Detail of movement of accounts payable to related parties is as follows:
In thousands of S/. | ||||||||||||||||
Balance as of | Additions | Disposals | Balance as of | |||||||||||||
Trade | ||||||||||||||||
Edelnor S.A.A. | 83 | 814 | (722 | ) | 176 | |||||||||||
Empresa Eléctrica de Piura S.A. | 831 | 16,752 | (16,621 | ) | 962 | |||||||||||
Enel Energy | 242 | 221 | (96 | ) | 367 | |||||||||||
Endesa Chile | 3,281 | 11,293 | (3,282 | ) | 11,292 | |||||||||||
|
|
|
|
|
|
|
| |||||||||
| 4,437 | 29,080 | (20,721 | ) | 12,797 | ||||||||||||
|
|
|
|
|
|
|
| |||||||||
Various | ||||||||||||||||
Enersis | — | 15,467 | — | 15,467 | ||||||||||||
Edelnor S.A.A. | — | 2,787 | (427 | ) | 2,360 | |||||||||||
Empresa Electrica de Piura S.A. | 52 | 57 | (46 | ) | 62 | |||||||||||
Endesa Chile (c) | — | 125,861 | (125,861 | ) | — | |||||||||||
|
|
|
|
|
|
|
| |||||||||
| 51 | 144,172 | (126,334 | ) | 17,889 | ||||||||||||
|
|
|
|
|
|
|
| |||||||||
| 4,489 | 173,252 | (147,055 | ) | 30,686 | ||||||||||||
|
|
|
|
|
|
|
| |||||||||
| (a) | Accounts receivable and payable to related parties do not accrue interest and do not have specific maturity or guarantees, except for those trade accounts receivable corresponding to sale of energy and power which have a 10-day maturity in average. |
| (b) | They correspond to dividends declared and paid by the Company and its subsidiary Edegel S.A.A. |
F-563
Table of Contents
GENERANDES PERÚ S.A. AND SUBSIDIARIES
Notes to the Unaudited Consolidated Financial Statements
| (c) | The following table summarizes the related party transactions which had an impact on the profit or loss of the period: |
In thousands of S/. | ||||||||||||||||
2014 | 2013 | |||||||||||||||
Revenue | Expenses | Revenue | Expenses | |||||||||||||
Sale of energy, power and toll (note 25) | 377,233 | — | 457,249 | — | ||||||||||||
Purchase of energy, power, toll and other (note 26) | — | 14,805 | — | 5,403 | ||||||||||||
Administrative services to related parties (notes 30 and 27) | 4,107 | 2,412 | 3,021 | 1,442 | ||||||||||||
Other services (notes 25, 26 & 27) | 76 | 189 | 135 | 780 | ||||||||||||
|
|
|
|
|
|
|
| |||||||||
| 381,416 | 17,406 | 460,405 | 7,625 | |||||||||||||
|
|
|
|
|
|
|
| |||||||||
There are no balances receivable and payable between the Company and its Subsidiaries, its Directors and Management.
| (d) | Remunerations accrued by Directors and key Management Personnel amount to: |
In thousands of S/. | ||||||||
2014 | 2013 | |||||||
Directors | 474 | 505 | ||||||
Managers | 6,028 | 7,067 | ||||||
|
|
|
| |||||
| 6,502 | 7,572 | |||||||
|
|
|
| |||||
(9) Other Accounts Receivable
This caption comprises the following:
In thousands of S/. | ||||||||
2014 | 2013 | |||||||
Reimbursement for property damage and lost profits (a) | 56,500 | 104,718 | ||||||
Services of drinking water and sewage system of Lima | 3,609 | 3,608 | ||||||
Third-party claims | 863 | 823 | ||||||
Loans to personnel | 2,135 | 1,379 | ||||||
Electrical plant services | 7,799 | — | ||||||
Various accounts receivable | 7,262 | 4,936 | ||||||
|
|
|
| |||||
| 78,168 | 115,464 | |||||||
Less, estimate for doubtful accounts (b) | (4,170 | ) | (4,170 | ) | ||||
|
|
|
| |||||
Total net | 73,998 | 111,294 | ||||||
|
|
|
| |||||
| (a) | As of December 31, 2014 and 2013, it corresponds mainly to the estimate of the indemnification of the insurance company according to the policy coverage subscribed for loss occurred at subsidiary Edegel in Unit TG7 and subsidiary Chinango in Unite G1 of the Chimay plant (notes 13 (g) and 30). In April and August 2014, subsidiary Edegel collected from the insurance company the amount of S/. 86,681 thousand, while in December 2014, subsidiary Chinango collected from the insurance company the amount of S/. 10,462 thousand. |
| (b) | In opinion of the Company and its subsidiaries’ Management, the balance of the estimate for doubtful accounts appropriately covers the credit risk of other doubtful accounts receivable as of December 31, 2014, and 2013. |
F-564
Table of Contents
GENERANDES PERÚ S.A. AND SUBSIDIARIES
Notes to the Unaudited Consolidated Financial Statements
(10) Inventories
This caption comprises the following:
In thousands of S/. | ||||||||
2014 | 2013 | |||||||
Maintenance materials | 52,487 | 49,984 | ||||||
Oil | 17,850 | 17,788 | ||||||
Materials in transit | 789 | 72 | ||||||
|
|
|
| |||||
| 71,126 | 67,844 | |||||||
|
|
|
| |||||
| (a) | During 2014, inventories decreased by S/. 8,185 thousand at their net realizable value (by S/. 7,739 thousand in 2013). |
(11) Other Non-Financial Assets
This caption comprises the following:
In thousands of S/. | ||||||||
2014 | 2013 | |||||||
Prepaid insurances | 21,240 | 20,083 | ||||||
Other | 1,104 | 889 | ||||||
Advances | 121 | 1,294 | ||||||
Income tax assets | 1,757 | — | ||||||
|
|
|
| |||||
| 24,222 | 22,266 | |||||||
|
|
|
| |||||
(12) Investments
It comprises investment in Associate:
Effective shareholding | In thousands of S/. | |||||||||||||||
2014 | 2013 | 2014 | 2013 | |||||||||||||
Endesa Brasil S.A. | 3.997 | 3.997 | 236,788 | 260,382 | ||||||||||||
|
|
|
|
|
|
|
| |||||||||
| (a) | It corresponds to 6,957,053 common shares of Endesa Brasil S.A., a company incorporated in Brazil where subsidiary Edegel S.A.A. holds an effective shareholding of 3.9966% in capital stock as of December 31, 2014 and 2013. |
| (b) | The movement of this item for the periods ended December 31, 2014 and 2013 was as follows: |
In thousands of S/. | ||||||||
2014 | 2013 | |||||||
Opening balance | 260,382 | 259,771 | ||||||
Interest in the profit of the Associate | 27,707 | 54,728 | ||||||
Dividends declared | (42,834 | ) | (55,675 | ) | ||||
Translation difference (c) | (8,467 | ) | (1,080 | ) | ||||
Other movements in the Associate | — | 2,638 | ||||||
|
|
|
| |||||
Final balance | 236,788 | 260,382 | ||||||
|
|
|
| |||||
| (c) | They correspond to the equity share value resulting from the translation of the financial statements of Endesa Brasil S.A., from ‘real’ (functional currency) to nuevos soles for reporting purposes and inclusion in the consolidated financial statements. |
F-565
Table of Contents
GENERANDES PERÚ S.A. AND SUBSIDIARIES
Notes to the Unaudited Consolidated Financial Statements
(13) Property, Plant and Equipment
| (a) | This caption comprises the following: |
In thousands of S/. | ||||||||||||||||||||||||||||||||||||
Description | Land | Build. & | Plant and | Vehicles | Furniture | Various | Work-in- | 12.31.2014 | 12.31.2013 | |||||||||||||||||||||||||||
Cost | ||||||||||||||||||||||||||||||||||||
Opening balances | 23,632 | 3,146,392 | 2,898,610 | 2,792 | 4,874 | 26,307 | 305,418 | 6,408,025 | 6,352,957 | |||||||||||||||||||||||||||
Additions | — | — | — | — | 3 | 274 | 142,689 | 142,966 | 199,965 | |||||||||||||||||||||||||||
Sales and/or disposals (g) | — | — | (16,926 | ) | (289 | ) | — | (97 | ) | — | (17,312 | ) | (144,897 | ) | ||||||||||||||||||||||
Transfers | — | 8,267 | 228,965 | — | 30 | 266 | (237,528 | ) | — | — | ||||||||||||||||||||||||||
|
|
|
|
|
|
|
|
|
|
|
|
|
|
|
|
|
| |||||||||||||||||||
Final balances | 23,632 | 3,154,659 | 3,110,649 | 2,503 | 4,907 | 26,750 | 210,579 | 6,533,679 | 6,408,025 | |||||||||||||||||||||||||||
|
|
|
|
|
|
|
|
|
|
|
|
|
|
|
|
|
| |||||||||||||||||||
Accumulated depreciation | ||||||||||||||||||||||||||||||||||||
Opening balances | — | 957,388 | 1,681,898 | 2,711 | 4,275 | 21,433 | — | 2,667,705 | 2,567,434 | |||||||||||||||||||||||||||
Additions (note 29) | — | 60,289 | 145,763 | 45 | 153 | 1,672 | — | 207,922 | 206,795 | |||||||||||||||||||||||||||
Sales and/or disposals (g) | — | — | (12,931 | ) | (289 | ) | — | (78 | ) | — | (13,298 | ) | (106,524 | ) | ||||||||||||||||||||||
|
|
|
|
|
|
|
|
|
|
|
|
|
|
|
|
|
| |||||||||||||||||||
Final balances | — | 1,017,677 | 1,814,730 | 2,467 | 4,428 | 23,027 | — | 2,862,329 | 2,667,705 | |||||||||||||||||||||||||||
|
|
|
|
|
|
|
|
|
|
|
|
|
|
|
|
|
| |||||||||||||||||||
Provision for decommissioning of power plants | ||||||||||||||||||||||||||||||||||||
Opening balances | — | — | 10,756 | — | — | — | — | 10,756 | 11,251 | |||||||||||||||||||||||||||
Depreciation (note 29) | — | — | (496 | ) | — | — | — | — | (496 | ) | (495 | ) | ||||||||||||||||||||||||
|
|
|
|
|
|
|
|
|
|
|
|
|
|
|
|
|
| |||||||||||||||||||
Final balances | — | — | 10,260 | — | — | — | — | 10,260 | 10,756 | |||||||||||||||||||||||||||
|
|
|
|
|
|
|
|
|
|
|
|
|
|
|
|
|
| |||||||||||||||||||
Provision for impairment of plant and equipment | ||||||||||||||||||||||||||||||||||||
Opening balances | — | — | 1,066 | — | — | — | — | 1,066 | 1,066 | |||||||||||||||||||||||||||
Additions | — | — | 5,917 | — | — | — | — | 5,917 | 36,006 | |||||||||||||||||||||||||||
Disposals (g) | — | — | (3,954 | ) | — | — | — | — | (3,954 | ) | (36,006 | ) | ||||||||||||||||||||||||
|
|
|
|
|
|
|
|
|
|
|
|
|
|
|
|
|
| |||||||||||||||||||
Final balances | — | — | 3,029 | — | — | — | — | 3,029 | 1,066 | |||||||||||||||||||||||||||
|
|
|
|
|
|
|
|
|
|
|
|
|
|
|
|
|
| |||||||||||||||||||
Net cost | 23,632 | 2,136,982 | 1,303,150 | 36 | 479 | 3,723 | 210,579 | 3,678,581 | 3,750,010 | |||||||||||||||||||||||||||
|
|
|
|
|
|
|
|
|
|
|
|
|
|
|
|
|
| |||||||||||||||||||
F-566
Table of Contents
GENERANDES PERÚ S.A. AND SUBSIDIARIES
Notes to the Unaudited Consolidated Financial Statements
In thousands of S/. | ||||||||||||||||||||||||||||||||||||
Description | Land | Build. & | Plant and | Vehicles | Furniture | Various | Work-in- | 12.31.2013 | 12.31.2012 | |||||||||||||||||||||||||||
Cost | ||||||||||||||||||||||||||||||||||||
Opening balances | 23,632 | 3,142,228 | 2,948,478 | 3,230 | 4,851 | 26,120 | 204,418 | 6,352,957 | 6,235,283 | |||||||||||||||||||||||||||
Additions | — | — | 1,973 | — | — | 168 | 197,824 | 199,965 | 119,547 | |||||||||||||||||||||||||||
Sales and/or disposals (g) | — | (73 | ) | (143,151 | ) | (438 | ) | (40 | ) | (74 | ) | (1,121 | ) | (144,897 | ) | (1,873 | ) | |||||||||||||||||||
Transfers | — | 4,237 | 91,310 | — | 63 | 93 | (95,703 | ) | — | — | ||||||||||||||||||||||||||
|
|
|
|
|
|
|
|
|
|
|
|
|
|
|
|
|
| |||||||||||||||||||
Final balances | 23,632 | 3,146,392 | 2,898,610 | 2,792 | 4,874 | 26,307 | 305,418 | 6,408,025 | 6,352,957 | |||||||||||||||||||||||||||
|
|
|
|
|
|
|
|
|
|
|
|
|
|
|
|
|
| |||||||||||||||||||
Accumulated depreciation | ||||||||||||||||||||||||||||||||||||
Opening balances | — | 897,629 | 1,643,009 | 2,966 | 4,114 | 19,716 | — | 2,567,434 | 2,358,546 | |||||||||||||||||||||||||||
Additions (note 29) | — | 59,779 | 144,927 | 105 | 201 | 1,783 | — | 206,795 | 209,382 | |||||||||||||||||||||||||||
Sales and/or disposals (g) | — | (20 | ) | (106,038 | ) | (360 | ) | (40 | ) | (66 | ) | — | (106,524 | ) | (494 | ) | ||||||||||||||||||||
|
|
|
|
|
|
|
|
|
|
|
|
|
|
|
|
|
| |||||||||||||||||||
Final balances | — | 957,388 | 1,681,898 | 2,711 | 4,275 | 21,433 | — | 2,667,705 | 2,567,434 | |||||||||||||||||||||||||||
|
|
|
|
|
|
|
|
|
|
|
|
|
|
|
|
|
| |||||||||||||||||||
Provision for decommissioning of power plants | ||||||||||||||||||||||||||||||||||||
Opening balances | — | — | 11,251 | — | — | — | — | 11,251 | 5,734 | |||||||||||||||||||||||||||
Additions | — | — | — | — | — | — | — | — | 5,814 | |||||||||||||||||||||||||||
Depreciation (note 29) | — | — | (495 | ) | — | — | — | — | (495 | ) | (297 | ) | ||||||||||||||||||||||||
|
|
|
|
|
|
|
|
|
|
|
|
|
|
|
|
|
| |||||||||||||||||||
Final balances | — | — | 10,756 | — | — | — | — | 10,756 | 11,251 | |||||||||||||||||||||||||||
|
|
|
|
|
|
|
|
|
|
|
|
|
|
|
|
|
| |||||||||||||||||||
Provision for impairment of plant and equipment | ||||||||||||||||||||||||||||||||||||
Opening balances | — | — | 1,066 | — | — | — | — | 1,066 | 1,066 | |||||||||||||||||||||||||||
Additions | — | — | 36,006 | — | — | — | — | 36,006 | — | |||||||||||||||||||||||||||
Disposals (g) | — | — | (36,006 | ) | — | — | — | — | (36,006 | ) | — | |||||||||||||||||||||||||
|
|
|
|
|
|
|
|
|
|
|
|
|
|
|
|
|
| |||||||||||||||||||
Final balances | — | — | 1,066 | — | — | — | — | 1,066 | 1,066 | |||||||||||||||||||||||||||
|
|
|
|
|
|
|
|
|
|
|
|
|
|
|
|
|
| |||||||||||||||||||
Net cost | 23,632 | 2,189,004 | 1,226,402 | 81 | 599 | 4,874 | 305,418 | 3,750,010 | 3,795,708 | |||||||||||||||||||||||||||
|
|
|
|
|
|
|
|
|
|
|
|
|
|
|
|
|
| |||||||||||||||||||
| (d) | Property, plant and equipment includes interest and other capitalized finance costs related to construction of works-in-progress, as per the indicated criteria (notes 4u). |
| (e) | For periods ended December 31, 2014 and 2013, no interest were capitalized. |
| (f) | As of December 31, 2014, property, plant and equipment includes spares parts for S/. 87,568 thousand (S/. 116,623 thousand as of December 31, 2013) to be exclusively used in generating units. |
| (g) | The item includes assets for the extension of the Santa Rosa Thermal Plant (Santa Rosa II) that were acquired by subsidiary Edegel S.A.A. through finance lease contracts (note 19(e)) and became operative in September 2009. As of December 31, 2014, the net carrying amount of assets acquired for the construction, installation, implementation and commissioning of such generating unit amounts to S/. 185,588 thousand (S/. 201,021 thousand, as of December 31, 2013) from which S/. 32,523 thousand, correspond to buildings and other constructions (S/. 34,172 thousand as of December 31, 2013) and S/. 153,065 thousand to plant and equipment (S/. 166,849 thousand as of December 31, 2013). |
| (h) | The Company and its Subsidiaries transferred a trust equity, the legal ownership of plant and equipment of the Combined Cycle with the intention that it serves as guarantee of payment of obligations assumed by the financing of the conversion of the Thermoelectric Plant from Ventanilla to Combined Cycle. The trust agreement is terminated as of December 31, 2013. |
| (i) | In May 2013, a loss occurred in the Thermal Plant Santa Rosa that affected certain items of assets belonging to Unit TG7, supporting unit. Due to this loss, the Subsidiary recorded an estimate of impairment of plant and equipment amounting to S/. 36,006 thousand (note 26), that corresponded to the decrease in the carrying amount at the recoverable value of Unit TG7. The estimate of impairment was applied to items of assets belonging to Unit TG7 affected by the loss. As of December 31, 2013, subsidiary Edegel S.A.A. began to remove the items affected by the loss. |
F-567
Table of Contents
GENERANDES PERÚ S.A. AND SUBSIDIARIES
Notes to the Unaudited Consolidated Financial Statements
| As of December 31, 2014, the Company and its Subsidiaries has estimated the net outstanding reimbursement of the advances received from the insurance company for material damages in S/. 27,931 thousand and for loss of income in S/. 24,813 thousand (notes 9 and 30). |
| In December 2013, there was a claim in the Subsidiary at the Chimay plant which affected certain elements of the assets belonging to the Unit G1. Due to this claim, the Subsidiary derecognized those elements for S/. 3,954 thousand. |
| As of December 31, 2014, subsidiary Chinango S.A.C. has estimated the outstanding reimbursement net of the advances received from the insurance company for material damages in S/. 3,756 thousand (note 9). |
| In May 2014, a loss occurred in the Chimay plant of its subsidiary Chinango that affected certain items of the assets belonging to Unit G2, an estimate of impairment of plant and equipment amounting to S/. 1,963 thousand that corresponded to the decrease in the carrying amount at the recoverable value of Unit G2. The estimate of impairment was applied to items of assets belonging to Unit G2 affected by the loss. |
| (j) | The Company and its Subsidiaries have insured their main assets, according to policies established by management. In that sense, as of December 31, 2014 and 2013, the Company and its Subsidiary have insured property, plant and equipment for up to an amount of US$ 1,876,208 thousand. It is the management’s opinion that its insurance policies are consistent with the industry practice, and that the risk of possible losses for claims considered in the insurance policies is reasonable, taking into consideration the Company’s and its Subsidiaries’ type of assets. |
(14) Intangible Assets
This caption comprises the following:
In thousands of S/. | ||||||||||||||||||||
Description | Concessions | Software | Other | 12.31.2014 | 12.31.2013 | |||||||||||||||
Cost | ||||||||||||||||||||
Opening balances (a) | 52,780 | 14,189 | 224 | 67,193 | 64,527 | |||||||||||||||
Additions | — | 2,409 | — | 2,409 | 2,666 | |||||||||||||||
|
|
|
|
|
|
|
|
|
| |||||||||||
Final balances | 52,780 | 16,598 | 224 | 69,602 | 67,193 | |||||||||||||||
Accumulated amortization | ||||||||||||||||||||
Opening balances | 5,055 | 9,978 | 14 | 15,047 | 12,716 | |||||||||||||||
Additions (note 29) | 1,653 | 472 | 11 | 2,136 | 2,331 | |||||||||||||||
|
|
|
|
|
|
|
|
|
| |||||||||||
Final balances | 6,708 | 10,450 | 25 | 17,183 | 15,047 | |||||||||||||||
|
|
|
|
|
|
|
|
|
| |||||||||||
Net cost | 46,072 | 6,148 | 199 | 52,419 | 52,146 | |||||||||||||||
|
|
|
|
|
|
|
|
|
| |||||||||||
In thousands of S/. | ||||||||||||||||||||
Description | Concessions | Software | Others | 12.31.2013 | 12.31.2012 | |||||||||||||||
Cost | ||||||||||||||||||||
Opening balances (a) | 52,462 | 11,841 | 224 | 64,527 | 14,251 | |||||||||||||||
Additions | 318 | 2,348 | — | 2,666 | 50,276 | |||||||||||||||
|
|
|
|
|
|
|
|
|
| |||||||||||
Final balances | 52,780 | 14,189 | 224 | 67,193 | 64,527 | |||||||||||||||
Accumulated amortization | ||||||||||||||||||||
Opening balances | 3,410 | 9,297 | 9 | 12,716 | 11,876 | |||||||||||||||
Additions (note 29) | 1,640 | 680 | 11 | 2,331 | 840 | |||||||||||||||
|
|
|
|
|
|
|
|
|
| |||||||||||
Final balances | 5,050 | 9,977 | 20 | 15,047 | 12,716 | |||||||||||||||
|
|
|
|
|
|
|
|
|
| |||||||||||
Net cost | 47,730 | 4,212 | 204 | 52,146 | 51,811 | |||||||||||||||
|
|
|
|
|
|
|
|
|
| |||||||||||
| (a) | The concessions and rights include the Huascacocha project which allows subsidiary Edegel S.A.A. having a higher water flow for the development of power generation activities. |
F-568
Table of Contents
GENERANDES PERÚ S.A. AND SUBSIDIARIES
Notes to the Unaudited Consolidated Financial Statements
(15) Financial Liabilities
This caption comprises the following:
In thousands of S/. | ||||||||
2014 | 2013 | |||||||
Bank loan | ||||||||
Principal | — | 11,180 | ||||||
Interest | — | 3 | ||||||
|
|
|
| |||||
| — | 11,183 | |||||||
|
|
|
| |||||
Current portion of long-term financial liabilities (note 19) | ||||||||
Principal | 113,291 | 146,204 | ||||||
Interest | 6,541 | 8,128 | ||||||
|
|
|
| |||||
| 119,832 | 165,515 | |||||||
|
|
|
| |||||
(16) Trade Accounts Payable
This caption comprises the following:
In thousands of S/. | ||||||||
2014 | 2013 | |||||||
Supply, gas transport and distribution | 26,606 | 26,402 | ||||||
Maintenance agreement with Siemens S.A. (a) | 36,216 | 62,637 | ||||||
Purchase of energy, power and toll (a) | 39,884 | 18,168 | ||||||
Providers of work-in-progress (b) | 85,559 | 151,866 | ||||||
Others | 21,691 | 34,017 | ||||||
|
|
|
| |||||
| 209,956 | 293,090 | |||||||
|
|
|
| |||||
| (a) | They correspond to goods and services delivered by Siemens Westinghouse Power Corporation and Siemens Westinghouse Service Company Ltd. by virtue of the long-term service agreements “LTSA” for acquisition of replacement parts and rendering of scheduled maintenance services (minor and major) for turbines of Ventanilla and Santa Rosa thermal plants. As established in the agreement (note 35e), such amounts shall be paid based on the hours of operation of thermal plants. |
| (b) | As of December 31, 2013, they include works-in-progress related to the replacement of items affected by the loss occurred in Unit TG7 (note 13 (g)) for an amount of S/. 72,416 thousand. As of December 31, 2014, there is no balance for this concept. |
(17) Other Accounts Payable
This caption comprises the following:
In thousands of S/. | ||||||||
2014 | 2013 | |||||||
Sales tax payable | 17,105 | 4,429 | ||||||
Taxes payable | 3,434 | 3,506 | ||||||
Remunerations payable | 5,655 | 5,136 | ||||||
Workers’ profit sharing | 14,340 | 13,407 | ||||||
Insurances payable | 25,537 | 28,124 | ||||||
Contributions to regulating entities | 6,548 | 6,294 | ||||||
Social inclusion energy fund | 9,433 | 5,082 | ||||||
Various | 6,944 | 6,004 | ||||||
|
|
|
| |||||
| 88,996 | 71,982 | |||||||
|
|
|
| |||||
F-569
Table of Contents
GENERANDES PERÚ S.A. AND SUBSIDIARIES
Notes to the Unaudited Consolidated Financial Statements
(18) Provisions
This caption comprises the following:
In thousands of S/. | ||||||||||||||||||||
Decommissioning | Tax | Technical | Other | Total | ||||||||||||||||
Balance at 1 January 2013 | 13,383 | 14,566 | 4,253 | 873 | 33,075 | |||||||||||||||
Provisions made during the year | 299 | 560 | — | — | 859 | |||||||||||||||
Provisions used during the year | — | — | — | (26 | ) | (26 | ) | |||||||||||||
Provisions reversed during the year | — | — | — | (245 | ) | (245 | ) | |||||||||||||
|
|
|
|
|
|
|
|
|
| |||||||||||
Balance at 31 December 2013 | 13,682 | 15,126 | 4,253 | 602 | 33,663 | |||||||||||||||
|
|
|
|
|
|
|
|
|
| |||||||||||
For maturity term: | ||||||||||||||||||||
Current portion | 13,682 | — | 4,253 | 602 | 18,537 | |||||||||||||||
Non-current portion | — | 15,126 | — | — | 15,126 | |||||||||||||||
|
|
|
|
|
|
|
|
|
| |||||||||||
Balance at 31 December 2013 | 13,682 | 15,126 | 4,253 | 602 | 33,663 | |||||||||||||||
Balance at 1 January 2014 | 13,682 | 15,126 | 4,253 | 602 | 33,663 | |||||||||||||||
Provisions made during the year | 311 | 773 | — | — | 1,084 | |||||||||||||||
Provisions used during the year | — | — | — | — | — | |||||||||||||||
Provisions reversed during the year | (5,569 | ) | — | — | (67 | ) | (5,636 | ) | ||||||||||||
|
|
|
|
|
|
|
|
|
| |||||||||||
Balance at 31 December 2014 | 8,424 | 15,899 | 4,253 | 535 | 29,111 | |||||||||||||||
|
|
|
|
|
|
|
|
|
| |||||||||||
For maturity term: | ||||||||||||||||||||
Current portion | 8,424 | — | 4,253 | 535 | 13,212 | |||||||||||||||
Non-current portion | — | 15,899 | — | — | 15,899 | |||||||||||||||
|
|
|
|
|
|
|
|
|
| |||||||||||
Balance at 31 December 2014 | 8,424 | 15,899 | 4,253 | 535 | 29,111 | |||||||||||||||
|
|
|
|
|
|
|
|
|
| |||||||||||
F-570
Table of Contents
GENERANDES PERÚ S.A. AND SUBSIDIARIES
Notes to the Unaudited Consolidated Financial Statements
(19) Financial Liabilities
| (a) | This caption comprises the following: |
Annual interest (%) | In thousands of S/. | |||||||||||||||||||||||||||||||||||||||||||
Creditor | See | Origin currency | Payment of interest | Amortization of capital | Maturity date | Current portion (*) | Long-term portion | Total current debt as of | ||||||||||||||||||||||||||||||||||||
12.31.2014 | 12.31.2013 | 12.31.2014 | 12.31.2013 | 12.31.2014 | 12.31.2013 | |||||||||||||||||||||||||||||||||||||||
Corporate bonds | ||||||||||||||||||||||||||||||||||||||||||||
- First Chinango Program | (b) | S/. | See (b) | See (b) | See (b) | See (b) | — | 25,706 | — | — | — | 25,706 | ||||||||||||||||||||||||||||||||
- Third Edegel Program | (b) | US$ & S/. | See (b) | See (b) | See (b) | See (b) | 22,069 | 79,756 | 104,298 | 118,536 | 126,367 | 198,292 | ||||||||||||||||||||||||||||||||
- Fourth Edegel Program | (b) | US$ | See (b) | See (b) | See (b) | See (b) | 2,649 | 2,477 | 119,560 | 111,800 | 122,209 | 114,277 | ||||||||||||||||||||||||||||||||
|
|
|
|
|
|
|
|
|
|
|
| |||||||||||||||||||||||||||||||||
| 24,718 | 107,939 | 223,858 | 230,336 | 248,576 | 338,275 | |||||||||||||||||||||||||||||||||||||||
Bank loans | ||||||||||||||||||||||||||||||||||||||||||||
- Scotiabank Perú | (f) | US$ | Libor + 3.70 | Quarterly | Quarterly | Feb. 2018 | 4,064 | 3,815 | 82,467 | 80,580 | 86,531 | 84,395 | ||||||||||||||||||||||||||||||||
- Bank of Nova Scotia | (d) | US$ | Libor + 0.73 | Quarterly | At maturity | Mar. 2016 | 58 | 7,094 | 107,604 | 20,962 | 107,662 | 28,056 | ||||||||||||||||||||||||||||||||
- Bank of Nova Scotia | (h) | US$ | Libor + 2.75 | Quarterly | Quarterly | Nov. 2017 | 7,554 | — | 14,944 | — | 22,498 | — | ||||||||||||||||||||||||||||||||
- Bank of Nova Scotia | (i) | US$ | 3.400 | Quarterly | Quarterly | Jan. 2019 | 5,192 | — | 16,361 | — | 21,553 | — | ||||||||||||||||||||||||||||||||
- Banco Continental | (e) | US$ | LIBOR + 3.13 | Quarterly | Quarterly | Sept. 2017 | 36,615 | 6,988 | 138,241 | 163,508 | 174,856 | 170,496 | ||||||||||||||||||||||||||||||||
|
|
|
|
|
|
|
|
|
|
|
| |||||||||||||||||||||||||||||||||
| 53,483 | 17,897 | 359,617 | 265,050 | 413,100 | 282,947 | |||||||||||||||||||||||||||||||||||||||
Finance Lease | ||||||||||||||||||||||||||||||||||||||||||||
- Scotiabank Perú | (f) | US$ | LIBOR + +1.75 | Quarterly | Quarterly | Mar. 2017 | 41,559 | 28,398 | 107,032 | 138,862 | 148,591 | 167,260 | ||||||||||||||||||||||||||||||||
|
|
|
|
|
|
|
|
|
|
|
| |||||||||||||||||||||||||||||||||
| 41,559 | 28,398 | 107,032 | 138,862 | 148,591 | 167,260 | |||||||||||||||||||||||||||||||||||||||
Derivative instruments | (note 20) | (note 20) | Quarterly | (note 20) | 72 | 98 | 2,872 | 4,751 | 2,944 | 4,849 | ||||||||||||||||||||||||||||||||||
|
|
|
|
|
|
|
|
|
|
|
| |||||||||||||||||||||||||||||||||
| 119,832 | 154,332 | 693,379 | 638,999 | 813,211 | 793,331 | |||||||||||||||||||||||||||||||||||||||
|
|
|
|
|
|
|
|
|
|
|
| |||||||||||||||||||||||||||||||||
| (*) | The current portion of long-term liabilities includes debt interest accrued and unpaid as of the date of the consolidated statement of financial position. |
F-571
Table of Contents
GENERANDES PERÚ S.A. AND SUBSIDIARIES
Notes to the Unaudited Consolidated Financial Statements
| (b) | Composition of bond debts is presented as follows: |
Annual (%) | Payment of interest | In thousands of S/. | ||||||||||||||||||||||||||||||||||||||||||||||
Description | Origin currency | Issued amount | Date of issuance | Capital maturity | Current portion (*) | Non-current portion | Total current debt as of | |||||||||||||||||||||||||||||||||||||||||
12.31.2014 | 12.31.2013 | 12.31.2014 | 12.31.2013 | 12.31.2014 | 12.31.2013 | |||||||||||||||||||||||||||||||||||||||||||
First Chinango Bond Program | ||||||||||||||||||||||||||||||||||||||||||||||||
- 13th Issuance, Series B | S/. | 25,000,000 | Jan. 2007 | 6.156 | Half-year | Jan. 2014 | — | 25,706 | — | — | — | 25,706 | ||||||||||||||||||||||||||||||||||||
|
|
|
|
|
|
|
|
|
|
|
| |||||||||||||||||||||||||||||||||||||
| 25,706 | — | — | — | 25,706 | ||||||||||||||||||||||||||||||||||||||||||||
Third Edegel Bond Program | ||||||||||||||||||||||||||||||||||||||||||||||||
- 1st Issuance, Series A | S/. | 25,000,000 | Jun. 2007 | 6.313 | Half-year | Jun. 2022 | 40 | 39 | 25,000 | 25,000 | 25,040 | 25,039 | ||||||||||||||||||||||||||||||||||||
- 3rd Issuance, Series A | S/. | 25,000,000 | Jul. 2007 | 6.281 | Half-year | Jul. 2019 | 772 | 772 | 25,000 | 25,000 | 25,772 | 25,772 | ||||||||||||||||||||||||||||||||||||
- 4th Issuance, Series A | S/. | 20,000,000 | Aug. 2007 | 6.750 | Half-year | Aug. 2014 | — | 20,450 | — | — | — | 20,450 | ||||||||||||||||||||||||||||||||||||
- 8th Issuance, Series A | US$ | 10,000,000 | Jan. 2008 | 6.344 | Half-year | Jan. 2028 | 816 | 763 | 29,890 | 27,950 | 30,706 | 28,713 | ||||||||||||||||||||||||||||||||||||
- 9th Issuance, Series A | S/. | 28,300,000 | Mar. 2008 | 6.594 | Half-year | Mar. 2014 | — | 28,886 | — | — | — | 28,886 | ||||||||||||||||||||||||||||||||||||
- 10th Issuance, Series A | US$ | 9,720,000 | Nov. 2008 | 9.000 | Half-year | Nov. 2014 | — | 27,494 | — | — | — | 27,494 | ||||||||||||||||||||||||||||||||||||
- 11th Issuance, Series A | US$ | 8,166,000 | Jan. 2009 | 7.781 | Half-year | Jan. 2019 | 844 | 789 | 24,408 | 22,824 | 25,252 | 23,613 | ||||||||||||||||||||||||||||||||||||
- 12th Issuance, Series A | US$ | 6,355,000 | Jan. 2009 | 7.125 | Half-year | Jan. 2015 | 19,597 | 563 | — | 17,762 | 19,597 | 18,325 | ||||||||||||||||||||||||||||||||||||
|
|
|
|
|
|
|
|
|
|
|
| |||||||||||||||||||||||||||||||||||||
| 22,069 | 79,756 | 104,298 | 118,536 | 126,367 | 198,292 | |||||||||||||||||||||||||||||||||||||||||||
Fourth Edegel Bond Program | ||||||||||||||||||||||||||||||||||||||||||||||||
- 1st Issuance, Series A | US$ | 10,000,000 | Jul. 2009 | 6.625 | Half-year | Jul. 2016 | 908 | 849 | 29,890 | 27,950 | 30,798 | 28,799 | ||||||||||||||||||||||||||||||||||||
- 2nd Issuance, Series A | US$ | 10,000,000 | Sept. 2009 | 6.000 | Half-year | Sept. 2016 | 493 | 461 | 29,890 | 27,950 | 30,383 | 28,411 | ||||||||||||||||||||||||||||||||||||
- 4th Issuance, Series A | US$ | 10,000,000 | Jan. 2010 | 6.469 | Half-year | Jan. 2018 | 816 | 763 | 29,890 | 27,950 | 30,706 | 28,713 | ||||||||||||||||||||||||||||||||||||
- 5th Issuance, Series A | US$ | 10,000,000 | Sept. 2010 | 5.781 | Half-year | Sept. 2020 | 432 | 404 | 29,890 | 27,950 | 30,322 | 28,354 | ||||||||||||||||||||||||||||||||||||
|
|
|
|
|
|
|
|
|
|
|
| |||||||||||||||||||||||||||||||||||||
| 2,649 | 2,477 | 119,560 | 111,800 | 122,209 | 114,277 | |||||||||||||||||||||||||||||||||||||||||||
|
|
|
|
|
|
|
|
|
|
|
| |||||||||||||||||||||||||||||||||||||
| 24,718 | 107,939 | 223,858 | 230,336 | 248,576 | 338,275 | |||||||||||||||||||||||||||||||||||||||||||
|
|
|
|
|
|
|
|
|
|
|
| |||||||||||||||||||||||||||||||||||||
| (*) | The current portion of debt for bonds includes interest accrued and unpaid as of the date of the consolidated statement of financial position. |
F-572
Table of Contents
GENERANDES PERÚ S.A. AND SUBSIDIARIES
Notes to the Unaudited Consolidated Financial Statements
| (c) | As of December 31, 2014 and 2013, the main obligations that shall be complied by the Subsidiaries related to bond programs are as follows: |
Third, Fourth, Fifth Edegel Bond Programs
During the term of the bond issued within the Framework of the Third and Fourth Bond Program, subsidiary Edegel S.A.A. shall maintain a debt ratio not greater than 1.5 times. This debt ratio is calculated as the ratio of the consolidated financial debt (net of cash for up to US$ 50,000 thousand) to the equity.
In the opinion of management, this obligation does not limit or affect the operations of the Subsidiary and are being met satisfactorily.
On September 23, 2013, subsidiary Edegel S.A.A. registered its Fifth Corporate Bond Program in the Public Registry of Stock Market for an amount of US$ 350,000 thousand and for which no financial indicators have been established.
First Chinango Bond Program
The debt related to the First Chinango Bond Program was part of the net assets that subsidiary Edegel S.A.A. transferred to subsidiary Chinango S.A.C. under the simple reorganization carried out on May 31, 2009. The transfer of the Chinango S.A.C.’s bonds was approved at General Bondholders’ Meeting held in May 2009. The transferred bonds have a joint collateral of subsidiary Edegel S.A.A.
As of December 31, 2014 and 2013, the main restriction applicable to subsidiary Chinango S.A.C. during the term of the bonds issued within the First Bond Program, consisted of maintaining a debt ratio not greater than 1.5 times. This ratio was calculated as the debt-to-equity ratio of subsidiary Chinango S.A.C. In order to make such calculation, no liability for deferred income tax is considered.
In January 2014, the 13th issuance of Series B of the First Chinango Bond Program was paid off.
Compliance with the obligations over the term of the bond was supervised by the Company’s and its Subsidiaries’ management and in its opinion, such obligations have been complied as of December 31, 2014 and 2013.
| (d) | On September 11, 2014, subsidiary Edegel S.A.A. signed with Bank of Nova Scotia a financing contract amounting to US$ 36,000 thousand for a 1.5-year term. Funds were used to pay off financial obligations and working capital. |
| (e) | On September 30, 2010, subsidiary Edegel S.A.A. signed with BBVA Banco Continental a financing contract amounting to US$ 61,000 thousand for a 7-year term. The funds were used to pay three promissory notes with Banco Continental for a total amount of S/. 74,000 thousand and to offset the C.O.F installment with maturity in year 2012. |
| (f) | On March 25, 2008, subsidiary Edegel S.A.A. signed with Scotiabank Perú S.A.A. a finance lease contract for an amount of US$ 90,000 thousand for the construction of an open-cycle plant, for a 9-year term, in Santa Rosa Thermal Plant (TG8 Unit) and associated systems. The final amount disbursed under this contract amounted to US$ 84,330 thousand. |
F-573
Table of Contents
GENERANDES PERÚ S.A. AND SUBSIDIARIES
Notes to the Unaudited Consolidated Financial Statements
| (g) | In February 2011, subsidiary Chinango signed with Scotiabank Perú S.A.A. a financing contract amounting to US$ 31,000 thousand for a seven-year term. Funds were used to pay two (2) short-term promissory notes with Banco de Crédito for a total of US$ 21,000 thousand and a promissory note with Banco Continental for S/. 29,400 thousand maturing in year 2012. |
| (h) | In November 2014, subsidiary Chinango S.A.C. signed with Bank of Nova Scotia a financing contract amounting to US$ 10,000 thousand for a 5-year term. The funds were used to pay off part of a bond of First Chinango Bond Program maturing in year 2012. |
| (i) | In January 2014, subsidiary Chinango S.A.C. signed with Bank of Nova Scotia a financing contract amounting to US$ 8,000 thousand for a 5-year term. The funds were used to pay off part of a bond of the 13th issuance, Series B of the First Chinango Bond Program maturing in year 2014. |
| (j) | The main obligations that subsidiary Edegel S.A.A. shall comply under the long- term bank contracts consist of: (i) maintaining a debt ratio not greater than 1.5 measured as the ratio of the consolidated financial debt, and (ii) maintaining a financial debt ratio over EBITDA of at the most 4 times. |
| Compliance with these obligations is supervised by the Company’s and its Subsidiaries’ management of and in its opinion, such obligations have been complied as of December 31, 2014 and 2013. |
F-574
Table of Contents
GENERANDES PERÚ S.A. AND SUBSIDIARIES
Notes to the Unaudited Consolidated Financial Statements
(20) Hedging Derivative Instruments
| (a) | The structure of the derivative instruments as of December 31, 2014 and 2013 is as follows: |
In thousands of S/. | ||||||||||||||||||||||||||||||||||||
Counterpart | Face value US$(000) | Maturity | Protected debt | Protected item | Fixed rate and value | Recorded asset | Recorded liability | Realized gain/loss | ||||||||||||||||||||||||||||
2014 | 2013 | 2014 | 2013 | 2014 | 2013 | |||||||||||||||||||||||||||||||
Interest rate swap: | ||||||||||||||||||||||||||||||||||||
- Citibank N.A. | 3,600 | Mar. 2013 | BCP—Medium term | 3M LIBOR | 3.29% | — | — | — | — | — | 52 | |||||||||||||||||||||||||
- Scotiabank Perú | 21,267 | Mar. 2017 | Scotiabank | |||||||||||||||||||||||||||||||||
| finance leases | 3M LIBOR | 2.73% | — | — | 1,614 | 2,646 | 1,425 | 1,585 | ||||||||||||||||||||||||||||
- Scotiabank Perú | 22,678 | Mar. 2017 | Scotiabank | |||||||||||||||||||||||||||||||||
| finance leases | 3M LIBOR | 2.28% | — | — | 1,319 | 2,189 | 1,248 | 1,383 | ||||||||||||||||||||||||||||
- Banco de Crédito del Perú | 8,750 | Nov. 2017 | Nova Scotia US$ 10 MM | 3M LIBOR | 0.62% | 80 | 36 | 11 | 14 | 99 | 86 | |||||||||||||||||||||||||
|
|
|
|
|
|
|
|
|
|
|
| |||||||||||||||||||||||||
| 80 | 36 | 2,944 | 4,849 | 2,772 | 3,106 | |||||||||||||||||||||||||||||||
Currency Swap: | ||||||||||||||||||||||||||||||||||||
- Banco Continental | 8,778 | Jan. 2014 | First Chinango Bond Program | US$ 8,78 | ||||||||||||||||||||||||||||||||
| - 13th Issuance, Series B | Exchange rate | (MM) | — | 646 | — | — | (451 | ) | (521 | ) | ||||||||||||||||||||||||||
|
|
|
|
|
|
|
|
|
|
|
| |||||||||||||||||||||||||
| 80 | 682 | 2,944 | 4,849 | 2,321 | 2,585 | |||||||||||||||||||||||||||||||
|
|
|
|
|
|
|
|
|
|
|
| |||||||||||||||||||||||||
F-575
Table of Contents
GENERANDES PERÚ S.A. AND SUBSIDIARIES
Notes to the Unaudited Consolidated Financial Statements
In thousands of S/. | ||||||||||||||||
12.31.2014 | 12.31.2013 | |||||||||||||||
Assets | Liabilities | Assets | Liabilities | |||||||||||||
Per maturity | ||||||||||||||||
Current | — | 73 | 646 | 98 | ||||||||||||
Non-current | 80 | 2,871 | 36 | 4,751 | ||||||||||||
|
|
|
|
|
|
|
| |||||||||
| 80 | 2,944 | 682 | 4,849 | |||||||||||||
|
|
|
|
|
|
|
| |||||||||
The fair value of hedge instruments is presented on the asset or liability, as applicable. Variations in the fair value of these instruments, net of its taxable effect, are recorded with a charge (credit) to the equity item ‘other equity reserves’.
Interest Rate Swap
The Subsidiaries pay and receive quarterly (at each payment date of protected debt interest) the difference between the LIBOR rate of the market applicable to the loan in such period and the fixed rate agreed on the hedging contracts. The flows effectively received and paid by the Subsidiaries are recognized as gain or loss for the period.
The Subsidiaries evaluate hedge effectiveness of each hedging derivative financial instrument at contracting date and have proven their effectiveness as of December 31, 2014 and 2013.
Currency Swap
These derivative financial instruments were hired by the Subsidiary Chinango S.A.C. in order to maintain an appropriate balance between expected cash flows in U.S. dollars (or indexed in dollars) and its financial obligations stated in that currency.
Through these instruments denominated ‘Cross Currency Interest Rate Swap’ (CCIRS), subsidiary Chinango S.A.C. has exchanged its obligations in soles for obligations in dollars. In this sense, at each due date of the interest period of hedged debts, subsidiary Chinango S.A.C. pays to the counterpart of the CCIRS the interest on the obligation in dollars at a rate agreed in the CCIRS contract and receives, in turn, the amount in nuevos soles necessary to meet the payment of the interest on the hedged debt in nuevos soles at a rate agreed with the corresponding the creditor.
In January 2014, subsidiary Chinango S.A.C. considered the currency swap as paid off.
The Subsidiaries evaluated hedge effectiveness of each hedging derivative financial instrument at contracting date and have proven their effectiveness during the term of the instruments.
F-576
Table of Contents
GENERANDES PERÚ S.A. AND SUBSIDIARIES
Notes to the Unaudited Consolidated Financial Statements
| (b) | Financial derivatives contracted by the Subsidiaries as of December 31, 2014 and 2013, their fair value and maturity breakdown, of the face or contractual values is detailed as follows: |
In thousands of S/. | ||||||||||||||||||||||||||||
December 31, 2014 | ||||||||||||||||||||||||||||
Face value | ||||||||||||||||||||||||||||
Fair | Before 1 | 1-2 years | 2-3 years | 3-4 | 4-5 | Total | ||||||||||||||||||||||
Cash flow hedge | ||||||||||||||||||||||||||||
- Interest rate swap | (2,852 | ) | (22,997 | ) | (22,997 | ) | (40,702 | ) | — | — | (86,696 | ) | ||||||||||||||||
|
|
|
|
|
|
|
|
|
|
|
|
|
| |||||||||||||||
In thousands of S/. | ||||||||||||||||||||||||||||
December 31, 2013 | ||||||||||||||||||||||||||||
Face value | ||||||||||||||||||||||||||||
Fair | Before 1 | 1-2 years | 2-3 years | 3-4 years | 4-5 | Total | ||||||||||||||||||||||
Cash flow hedge | ||||||||||||||||||||||||||||
- Interest rate swap | (4,813 | ) | (13,804 | ) | (21,504 | ) | (21,504 | ) | (38,061 | ) | — | (94,873 | ) | |||||||||||||||
|
|
|
|
|
|
|
|
|
|
|
|
|
| |||||||||||||||
- Currency Swap | 646 | 24,535 | — | — | — | — | 24,535 | |||||||||||||||||||||
|
|
|
|
|
|
|
|
|
|
|
|
|
| |||||||||||||||
| (c) | As of December 31, 2014 and 2013, the payment schedule of the non-current portion of long-term financial liabilities is as follows: |
In thousands of S/. | ||||||||
2014 | 2013 | |||||||
Year 2015 | — | 101,231 | ||||||
Year 2016 | 291,570 | 167,318 | ||||||
Year 2017 or more | 401,809 | 370,450 | ||||||
|
|
|
| |||||
| 693,379 | 638,999 | |||||||
|
|
|
| |||||
| (d) | Hedging Debt: |
As of December 31, 2014, from the debt in U.S. dollars of the Subsidiaries, the amount of S/. 759,457 thousand is related to the future cash flow hedge for the income from the Subsidiaries’ activities that are related to the U.S. dollar (note 4 (w)). As of December 31, 2013, it amounted to S/. 674,052 thousand.
The exchange difference generated for this debt is presented in the Statement of Changes in Equity in ‘other equity reserves’. The movement as of December 31, 2014 and 2013, net of its taxable effect, has been as follows:
In thousands of S/. | ||||||||
2014 | 2013 | |||||||
Balance in net variation reserves for cash flow hedges at the beginning of the period | 37,919 | 89,571 | ||||||
Exchange differences recorded in equity | (28,347 | ) | (40,982 | ) | ||||
Allocation of exchange differences to profit or loss | (8,235 | ) | (10,670 | ) | ||||
|
|
|
| |||||
| 1,337 | 37,919 | |||||||
|
|
|
| |||||
F-577
Table of Contents
GENERANDES PERÚ S.A. AND SUBSIDIARIES
Notes to the Unaudited Consolidated Financial Statements
(21) Provision for Employee Benefits
The movement of this provision was as follows:
In thousands of S/. | ||||||||
2014 | 2013 | |||||||
Opening balance | 3,394 | 3,586 | ||||||
Increase of the provision recorded against profit or loss | 923 | 262 | ||||||
Payments | (407 | ) | (454 | ) | ||||
|
|
|
| |||||
| 3,910 | 3,394 | |||||||
|
|
|
| |||||
Subsidiary Edegel S.A.A. holds a covenant to grant employees an extraordinary bonus for severance payment, once the employee accumulates a period equivalent to five years of effective work.
(22) Deferred Income Tax
| (a) | This caption comprises the following: |
In thousands of S/. | ||||||||||||||||||||
Balance as of | Charge | Charge | Effect of | Balance as of | ||||||||||||||||
Deferred assets: | ||||||||||||||||||||
Provision for impairment of property, plant, and equipment | (320 | ) | — | — | 43 | (277 | ) | |||||||||||||
Provision for impairment of inventory | (2,500 | ) | (134 | ) | — | 351 | (2,283 | ) | ||||||||||||
Provision for technical quality standard | (436 | ) | — | — | 58 | (378 | ) | |||||||||||||
Reimbursement for material damage | (20,243 | ) | 20,243 | — | — | — | ||||||||||||||
Other provisions | (5,666 | ) | 3,143 | 648 | 267 | (1,608 | ) | |||||||||||||
|
|
|
|
|
|
|
|
|
| |||||||||||
| (29,165 | ) | 23,252 | 648 | 719 | (4,546 | ) | ||||||||||||||
|
|
|
|
|
|
|
|
|
| |||||||||||
Deferred liabilities: | ||||||||||||||||||||
Difference in base of cost of property, plant and equipment | 393,400 | 25,167 | — | (55,194 | ) | 363,373 | ||||||||||||||
Depreciation rate difference of property, plant, and equipment | 287,665 | 6,100 | — | (37,130 | ) | 256,635 | ||||||||||||||
Investments in Associate | 36,247 | (4,720 | ) | — | (1,742 | ) | 29,785 | |||||||||||||
Indirect costs and capitalized finance costs during the construction, net | 19,428 | (2,678 | ) | — | (1,767 | ) | 14,983 | |||||||||||||
Difference in depreciation rates of finance lease assets | 32,771 | (22,156 | ) | — | (997 | ) | 9,618 | |||||||||||||
Others | 137 | (1,014 | ) | (110 | ) | 67 | (920 | ) | ||||||||||||
|
|
|
|
|
|
|
|
|
| |||||||||||
| 769,648 | (211 | ) | (110 | ) | (96,763 | ) | 673,474 | |||||||||||||
|
|
|
|
|
|
|
|
|
| |||||||||||
| 740,483 | 23,951 | 538 | (96,044 | ) | 668,928 | |||||||||||||||
|
|
|
|
|
|
|
|
|
| |||||||||||
F-578
Table of Contents
GENERANDES PERÚ S.A. AND SUBSIDIARIES
Notes to the Unaudited Consolidated Financial Statements
In thousands of S/. | ||||||||||||||||
Balance as of | Charge | Charge | Balance as of | |||||||||||||
Deferred assets: | ||||||||||||||||
Impairment of property, plant, and equipment | (320 | ) | — | — | (320 | ) | ||||||||||
Inventory obsolescence | (2,500 | ) | — | — | (2,500 | ) | ||||||||||
Provision for technical quality standard | (436 | ) | — | — | (436 | ) | ||||||||||
Reimbursement for material damage | — | (20,243 | ) | — | (20,243 | ) | ||||||||||
Other provisions | (6,550 | ) | 109 | 775 | (5,666 | ) | ||||||||||
|
|
|
|
|
|
|
| |||||||||
| (9,806 | ) | (20,134 | ) | 775 | (29,165 | ) | ||||||||||
|
|
|
|
|
|
|
| |||||||||
Deferred liabilities: | ||||||||||||||||
Difference in basis of cost of property, plant and equipment | 397,834 | (4,434 | ) | — | 393,400 | |||||||||||
Difference in depreciation rates of property, plant and equipment | 292,103 | (4,438 | ) | — | 287,665 | |||||||||||
Indirect cost and capitalized finance costs during the construction, net | 21,961 | (2,533 | ) | — | 19,428 | |||||||||||
Investment in Associate | 36,532 | (285 | ) | — | 36,247 | |||||||||||
Difference in depreciation rates of finance lease assets | 39,905 | (7,134 | ) | — | 32,771 | |||||||||||
Others | 826 | (6 | ) | (695 | ) | 137 | ||||||||||
|
|
|
|
|
|
|
| |||||||||
| 789,161 | (18,818 | ) | (695 | ) | 769,648 | |||||||||||
|
|
|
|
|
|
|
| |||||||||
| 779,355 | (38,952 | ) | 80 | 740,483 | ||||||||||||
|
|
|
|
|
|
|
| |||||||||
Due to the reduction of income tax, there has been a decrease in the period of S/. 94,900 thousand and S/. 870 thousand in deferred liabilities and assets, respectively, generating a gain of S/. 94,113 thousand, recorded in income tax in the consolidated statement of income (notes 34 and 36).
| (b) | The composition of the deferred income tax in profit or loss was as follows: |
In thousands of S/. | ||||||||
2014 | 2013 | |||||||
For temporary differences on income determination | (72,093 | ) | (38,952 | ) | ||||
For accrual of equity reserves | 15,294 | 22,136 | ||||||
|
|
|
| |||||
Total income | (56,799 | ) | (16,816 | ) | ||||
|
|
|
| |||||
(23) Capital Management
The Company’s and its Subsidiaries’ objective in managing capital is to safeguard the capacity to continue as a going concern and provide the expected return to stockholders and respective benefits to stakeholders, as well as maintaining an optimum structure to reduce capital cost.
The Company and its Subsidiaries may adjust the amount of dividends paid to stockholders, issue new shares or sell assets in order to reduce debt to maintain or adjust the capital structure.
F-579
Table of Contents
GENERANDES PERÚ S.A. AND SUBSIDIARIES
Notes to the Unaudited Consolidated Financial Statements
The calculation of the debt-to-equity ratio as of December 31, 2014 and 2013 was as follows:
In thousands of S/. | ||||||||
2014 | 2013 | |||||||
Financial liabilities | 813,211 | 804,514 | ||||||
Trade accounts payable | 209,956 | 293,090 | ||||||
Accounts payable to related parties | 30,686 | 4,489 | ||||||
Other accounts payable | 88,996 | 103,612 | ||||||
Less: cash and cash equivalents | (238,427 | ) | (172,907 | ) | ||||
|
|
|
| |||||
Net debt | 904,422 | 1,032,798 | ||||||
Total equity | 2,712,718 | 2,636,362 | ||||||
|
|
|
| |||||
Gearing ratio (times) | 0.33 | 0.39 | ||||||
|
|
|
| |||||
(24) Equity
(a) Share Capital
As of December 31, 2014 and 2013, the share capital of the Company is represented by 853,429,020 common shares fully subscribed and paid-in with a par value of S/. 1.00 per share.
As of December 31, 2014 and 2013, the shareholding structure of the Company was as follows:
Stockholders | Class of | Number of | % | |||||||||
Endesa Chile S.A. | A | 520,578,464 | 61.00 | |||||||||
Enersis S.A. | B | 332,850,556 | 39.00 | |||||||||
|
|
|
| |||||||||
| 853,429,020 | 100.00 | |||||||||||
|
|
|
| |||||||||
Both types of shares have the same rights and obligations.
(b) Other Capital Reserves
According to current legal rules, it is required to allocate not less than 10% of its net profit to a legal reserve. This allocation is required until such reserve equals 20% of capital stock. The legal reserve may be used to compensate losses or may be capitalized, being compulsory to refund it in both cases.
General Stockholders’ Meeting, dated March 20, 2014 and March 22, 2013, approved to allocate 10% of the profits available for periods 2013 and 2012, amounting to S/. 18,262 thousand and S/. 10,161 thousand, respectively, to increase the legal reserve.
(c) Dividends Paid
The Company has as policy of dividend and advances payments to distribute total funds received from Subsidiaries for these items, deducting the amount corresponding to operating expenses of the period. In that sense, during 2014, and 2013, the following dividends were declared:
| • | At Board of Directors’ Meeting, held on October 16, 2014, an agreement was reached to pay dividends on account of profit or loss of the period 2014 for S/. 40,310 thousand. |
F-580
Table of Contents
GENERANDES PERÚ S.A. AND SUBSIDIARIES
Notes to the Unaudited Consolidated Financial Statements
| • | At Board of Directors’ Meeting, held on July 17, 2014, an agreement was reached to pay dividends on account of profit or loss of the period 2014 for S/. 105,790 thousand. |
| • | At General Stockholders’ Meeting, held on March 20, 2014, an agreement was reached to distribute dividends amounting to S/. 85,149 thousand. |
| • | At Board of Directors’ Meeting, held on October 17, 2013, an agreement was reached to pay dividends on account of profit or loss of the period 2013 for S/. 38,080 thousand. |
| • | At Board of Directors’ Meeting, held on July 18, 2013, an agreement was reached to pay dividends on account of profit or loss of the period 2013 for S/. 90,029 thousand. |
| • | At General Stockholders’ Meeting, held on March 22, 2013, an agreement was reached to distribute dividends amounting to S/. 54,394 thousand. |
Dividends paid to individuals and non-domiciled legal entities in Peru are subject to a withdrawal of 4.1%.
(25) Sales Income
This caption comprises the following:
In thousands of S/. | ||||||||
2014 | 2013 | |||||||
Energy | ||||||||
Third parties | 899,214 | 658,762 | ||||||
Related parties | 253,249 | 316,737 | ||||||
|
|
|
| |||||
| 1,142,463 | 975,499 | |||||||
|
|
|
| |||||
Power and toll | ||||||||
Third parties | 412,859 | 295,360 | ||||||
Related parties | 123,984 | 140,512 | ||||||
|
|
|
| |||||
| 536,843 | 435,872 | |||||||
|
|
|
| |||||
Other operating income | 11,381 | 15,243 | ||||||
|
|
|
| |||||
| 11,381 | 15,243 | |||||||
|
|
|
| |||||
Total | 1,690,687 | 1,426,614 | ||||||
|
|
|
| |||||
Compensations | ||||||||
Third parties | 10,554 | 5,694 | ||||||
Related parties | 240 | 135 | ||||||
|
|
|
| |||||
| 10,794 | 5,829 | |||||||
|
|
|
| |||||
Total | 1,701,481 | 1,432,443 | ||||||
|
|
|
| |||||
F-581
Table of Contents
GENERANDES PERÚ S.A. AND SUBSIDIARIES
Notes to the Unaudited Consolidated Financial Statements
(26) Generation Costs
This caption comprises the following:
In thousands of S/. | ||||||||
2014 | 2013 | |||||||
Natural gas supply, transport and distribution | 327,796 | 276,158 | ||||||
Depreciation and amortization (note 29) | 208,221 | 206,962 | ||||||
Impairment of plant and equipment | 5,917 | 36,006 | ||||||
Purchase of energy, power and toll (a) | 215,463 | 131,945 | ||||||
Third-party services (b) | 57,405 | 57,025 | ||||||
Water royalties and electricity taxes | 22,781 | 21,618 | ||||||
Personnel expenses (note 28) | 38,679 | 39,040 | ||||||
Consumption of various supplies | 14,288 | 14,087 | ||||||
Various charges for operations | 58,208 | 46,582 | ||||||
Compensation for additional generation and others | 55,505 | 45,192 | ||||||
Consumption of oil | 82 | 8,602 | ||||||
Taxes and other | 4,105 | 3,472 | ||||||
|
|
|
| |||||
| 1,008,450 | 886,689 | |||||||
|
|
|
| |||||
| (a) | It includes purchases to related parties (note 8 (d)). |
| (b) | It includes services rendered by related parties for S/. 704 thousand (S/. 521 thousand during 2013). |
(27) Administrative Expenses
This caption comprises the following:
In thousands of S/. | ||||||||
2014 | 2013 | |||||||
Personnel expenses (note 28) | 32,645 | 31,094 | ||||||
Third-party services (a) | 14,622 | 14,084 | ||||||
Taxes (b) | 491 | 1,863 | ||||||
Various charges for operations—tax sanctions | 3,391 | 3,620 | ||||||
Depreciation and amortization (note 29) | 2,333 | 2,659 | ||||||
|
|
|
| |||||
| 53,482 | 52,320 | |||||||
|
|
|
| |||||
| (a) | It includes services rendered by related parties for S/. 2,770 thousand (for S/. 1,701 thousand during 2013). |
| (b) | It includes the reversal of a provision for tax contingency in favor of subsidiary Edegel S.A.A. for S/. 5,569 thousand of which S/. 1,274 thousand correspond to taxes and the amount of S/. 4,295 thousand correspond to interest. |
F-582
Table of Contents
GENERANDES PERÚ S.A. AND SUBSIDIARIES
Notes to the Unaudited Consolidated Financial Statements
(28) Personnel Expenses
This caption comprises the following:
In thousands of S/. | ||||||||
2014 | 2013 | |||||||
Remunerations | 30,720 | 29,691 | ||||||
Workers’ profit sharing | 29,389 | 28,674 | ||||||
Social contributions | 3,234 | 3,781 | ||||||
Vacations | 2,790 | 3,569 | ||||||
Others | 5,191 | 4,419 | ||||||
|
|
|
| |||||
| 71,324 | 70,134 | |||||||
|
|
|
| |||||
Personnel expenses are distributed as follows:
In thousands of S/. | ||||||||
2014 | 2013 | |||||||
Generation costs (note 26) | 38,679 | 39,040 | ||||||
Administrative expenses (note 27) | 32,645 | 31,094 | ||||||
|
|
|
| |||||
| 71,324 | 70,134 | |||||||
|
|
|
| |||||
(29) Depreciation and Amortization
This caption comprises the following:
In thousands of S/. | ||||||||
2014 | 2013 | |||||||
Depreciation of property, plant, and equipment | ||||||||
Generation costs (note 26) | 206,539 | 205,298 | ||||||
Administrative expenses (note 27) | 1,879 | 1,992 | ||||||
|
|
|
| |||||
| 208,418 | 207,290 | |||||||
Amortization of intangible assets | ||||||||
Generation costs (note 26) | 1,682 | 1,664 | ||||||
Administrative expenses (note 27) | 454 | 667 | ||||||
|
|
|
| |||||
| 2,136 | 2,331 | |||||||
|
|
|
| |||||
| 210,554 | 209,621 | |||||||
|
|
|
| |||||
F-583
Table of Contents
GENERANDES PERÚ S.A. AND SUBSIDIARIES
Notes to the Unaudited Consolidated Financial Statements
(30) Other Operating Income
This caption comprises the following:
In thousands of S/. | ||||||||
2014 | 2013 | |||||||
Administrative services to related parties | 4,107 | 3,021 | ||||||
Proceeds from property, plant, and equipment | 301 | 196 | ||||||
Operating and maintenance services | — | 1,601 | ||||||
Transfer of natural gas transport capacity | 2,894 | 3,299 | ||||||
Compensation for use hydraulic system | 7,799 | — | ||||||
Service of network movements | — | 3,683 | ||||||
Reimbursement for property damage and lost profits (notes 9 and 13 (g)) | 43,718 | 104,718 | ||||||
Other income | 5,131 | 2,694 | ||||||
|
|
|
| |||||
| 63,950 | 119,212 | |||||||
|
|
|
| |||||
(31) Finance Income and Costs
Finance income comprises:
In thousands of S/. | ||||||||
2014 | 2013 | |||||||
Recovery of interest for contingencies | 4,295 | — | ||||||
Interest on bank deposits | 2,380 | 4,853 | ||||||
Others | 279 | 115 | ||||||
|
|
|
| |||||
| 6,954 | 4,968 | |||||||
|
|
|
| |||||
Finance costs comprise:
In thousands of S/. | ||||||||
2014 | 2013 | |||||||
Interest on bonds | 18,593 | 24,746 | ||||||
Interest on bank loans | 11,084 | 9,971 | ||||||
Interest on leasing | 3,191 | 3,670 | ||||||
Loss on derivative financial instruments (note 20) | 2,321 | 2,585 | ||||||
Update of contingency (note 36) | 311 | 299 | ||||||
Others | 3,612 | 2,365 | ||||||
|
|
|
| |||||
| 39,112 | 43,636 | |||||||
|
|
|
| |||||
(32) Income Tax
Below there is the income tax expense shown in the consolidated statement of comprehensive income as of December 31, 2014 and 2013:
In thousands of S/. | ||||||||
2014 | 2013 | |||||||
Current | 194,991 | 184,542 | ||||||
Deferred | (56,799 | ) | (16,816 | ) | ||||
|
|
|
| |||||
| 138,192 | 167,726 | |||||||
|
|
|
| |||||
F-584
Table of Contents
GENERANDES PERÚ S.A. AND SUBSIDIARIES
Notes to the Unaudited Consolidated Financial Statements
Reconciliation of effective rates of Income Tax to the tax rate is as follows:
2014 | 2013 | |||||||||||||||
In | % | In | % | |||||||||||||
Profit before income tax | 695,590 | 100.00 | 622,811 | 100.00 | ||||||||||||
Theoretical income tax expense calculated as per legal rate of 30% | 208,677 | 30.00 | 186,843 | 30.00 | ||||||||||||
Tax effect of non-taxable expenses and non-deductible income: | ||||||||||||||||
Income and expenses included in previous year tax returns | 3,564 | 0.51 | 1,938 | 0.31 | ||||||||||||
Financial update of contingency | (916 | ) | (0.13 | ) | 398 | 0.06 | ||||||||||
Other deductible, net | (1,351 | ) | (0.19 | ) | (1,395 | ) | (0.22 | ) | ||||||||
Effect of change in deferred tax rate (note 22(a)) | (94,030 | ) | (13.52 | ) | — | — | ||||||||||
Reimbursement for material damage | 22,248 | 2.98 | (20,058 | ) | (3.22 | ) | ||||||||||
|
|
|
|
|
|
|
| |||||||||
Income tax expense recorded | 138,192 | 19.87 | 167,726 | 26.93 | ||||||||||||
|
|
|
|
|
|
|
| |||||||||
(33) Basic Earnings per Share
Calculation of basic and diluted earnings per share attributable to controlling interests as of December 31, 2014 and 2013 is presented as follows:
In thousands of S/. | ||||||||
2014 | 2013 | |||||||
Profit | 293,399 | 239,878 | ||||||
Number of shares (in thousands) | 853,429 | 853,429 | ||||||
|
|
|
| |||||
Basic and diluted earnings per share | 0.344 | 0.281 | ||||||
|
|
|
| |||||
(34) Tax Matters
| (a) | The income tax returns for fiscal years 2011 through 2014 and sales tax returns for years 2011 through 2014 of subsidiary Edegel S.A.A. are open for review by the Peruvian tax authorities. Due to the possible varied interpretations of the current legal regulations by the tax authority, to date it is not possible to determine, whether future tax assessments will result or not in liabilities for subsidiary Edegel S.A.A.; therefore, any major tax or surcharge that might arise from eventual tax audits would be applied to the results of the period in which it is determined. However, it is the opinion of the Company’s management and its legal advisors that, any possible additional settlement of taxes would not be significant for the consolidated financial statements as of December 31, 2014 and 2013. |
| Tax Authorities have reviewed the Income Tax returns of periods 2010 and 2011 issuing the corresponding tax determination and fine resolutions which were appealed by subsidiary Chinango S.A.C. Currently, SUNAT is reviewing the tax obligation from the Income Tax for period 2012. |
Due to the possible varied interpretations of the current legal regulations by the tax authorities, it is not possible to determine, to date, whether a future tax audit will result or not in liabilities for the Company and its Subsidiaries; therefore, any major tax or surcharge that might arise from eventual tax assessments would be applied to the results of the period in which it is determined. However, it |
F-585
Table of Contents
GENERANDES PERÚ S.A. AND SUBSIDIARIES
Notes to the Unaudited Consolidated Financial Statements
| is the opinion of the Company’s and its Subsidiaries’ management and its legal advisors that, any possible additional settlement of taxes would not be significant for the financial statements as of December 31, 2014 and 2013. |
| The income tax is determined according to current tax regulations in Peru. |
| The Company and its Subsidiary calculated the income tax for the years 2014 and 2013 with a rate of 30%, which was in force as of December 31, 2014 and 2013, respectively. |
| On December 31, 2014, Law 30296Law for Promotion of Economy Reactivation, was published establishing a progressive reduction in the rates of income tax. Thus, this law has established the following rates: 28% for 2015 and 2016, 27% for 2017 and 2018 and 26% for 2019 onwards. This reduction will be offset with the increase in the rates applicable to dividends whose taxation rate until December 31, 2014 was 4.1%. The new rates are 6.8% for 2015 and 2016, 8% for 2017 and 2018, and 9.3% for 2019 onwards, except for dividend distribution in favor of other legal entities domiciled in Peru in which case the exemption is maintained. |
| Accordingly, the Company and its Subsidiary have reestimated the deferred income tax considering the period of reversal of the temporary differences, according to the new rates of income tax above described. As a result, this has generated a decrease in the deferred liability net of income tax of S/. 94,030 thousand, amount that was credited to profit or loss and equity of year 2014 for S/. 94,382 and S/. 89, respectively. |
| (b) | For income tax purposes, the market value of the transactions between related parties shall be determined based on transfer pricing standards. These standards define, among others, coverage, relationship criteria, as well as comparability analysis, methodology, adjustments and information. The standards establish that under certain conditions, companies are required to have a Technical Study Report supporting the calculation of transfer pricing with related parties. Likewise, this obligation is required for all transactions made from, to or through territories with low or null taxation. |
| The Company and its Subsidiaries’ management considers that for income tax purposes, pricing regarding transactions such as those aforementioned has been made in accordance with tax legislation; consequently, no significant liabilities will arise as of December 31, 2014 and 2013. |
| (c) | In 2005, a temporary tax on net assets was established, of which the taxable base is the prior period adjusted net asset value, less depreciations, amortizations, legal cash reserve, and specific provisions for credit risk. The tax rate is 0.4% for years 2014 and 2013 and is applied to the amount of net assets exceeding S/. 1 million. It may be paid in cash or in nine consecutive monthly installments. The paid amount can be used as a credit against payments on account of Income Tax General Regime for taxable periods from March to December of the fiscal period for which the tax was paid until maturity date of each of the payments on account, and as a credit for regularization payments of income tax of corresponding taxable period. |
| (d) | Likewise, technical assistance provided by entities not domiciled in the country is subject to a 15% income tax withholding, regardless of the place where the service is rendered and provided that income tax law requirements are met. |
| (e) | Tax on Financial Transactions (ITF) for fiscal period 2014 was fixed at the rate of 0.005%. This tax is applied on charges and debits in bank accounts or movements of funds made through the financial system, unless the account is tax-exempt. |
F-586
Table of Contents
GENERANDES PERÚ S.A. AND SUBSIDIARIES
Notes to the Unaudited Consolidated Financial Statements
(35) Commitments
The Subsidiaries have the following commitments as of December 31, 2014:
(a) Electricity supply contracts
Contracts with Regulated Clients:
N° | Client | Starting | Ending | Energy Supply Contracted | ||||
| 1 | Edelnor S.A.A. (LP) | 1/1/2014 | 12/31/2021 | Up to 30.8 MW | ||||
| 2 | Edelnor S.A.A. (LP) | 1/1/2014 | 12/31/2023 | Up to 28.2 MW | ||||
| 3 | Edelnor S.A.A. (LP) | 1/1/2014 | 12/31/2023 | Up to 28.2 MW | ||||
| 4 | Edelnor S.A.A. (LP) | 1/1/2014 | 12/31/2025 | Up to 0.9 MW | ||||
| 5 | Edelnor S.A.A. (LP) | 1/1/2014 | 12/31/2025 | Up to 28.7 MW | ||||
| 6 | Edelnor S.A.A. (LP) | 1/1/2014 | 12/31/2025 | Up to 166.7 MW | ||||
| 7 | Edelnor S.A.A. (LP) | 1/1/2014 | 12/31/2021 | Up to 6.3 MW | ||||
| 8 | Edelnor S.A.A. (LP) | 1/1/2014 | 12/31/2023 | Up to 5.8 MW | ||||
| 9 | Edelnor S.A.A. (LP) | 1/1/2014 | 12/31/2023 | Up to 5.8 MW | ||||
| 10 | Edelnor S.A.A. (LP) | 1/1/2014 | 12/31/2025 | Up to 5.5 MW | ||||
| 11 | Edelnor S.A.A. (LP) | 1/1/2014 | 12/31/2025 | Up to 34.1 MW | ||||
| 12 | Luz del Sur S.A.A. (LP) | 1/1/2014 | 12/31/2021 | Up to 24.8 MW | ||||
| 13 | Luz del Sur S.A.A. (LP) | 1/1/2014 | 12/31/2023 | Up to 23.9 MW | ||||
| 14 | Luz del Sur S.A.A. (LP) | 1/1/2014 | 12/31/2023 | Up to 23.9 MW | ||||
| 15 | Luz del Sur S.A.A. (LP) | 1/1/2014 | 12/31/2025 | Up to 0.7 MW | ||||
| 16 | Luz del Sur S.A.A. (LP) | 1/1/2014 | 12/31/2025 | Up to 23.1 MW | ||||
| 17 | Luz del Sur S.A.A. (LP) | 1/1/2014 | 12/31/2025 | Up to 134.1 MW | ||||
| 18 | Luz del Sur S.A.A. (LP) | 1/1/2014 | 12/31/2021 | Up to 5.1 MW | ||||
| 19 | Luz del Sur S.A.A. (LP) | 1/1/2014 | 12/31/2023 | Up to 4.9 MW | ||||
| 20 | Luz del Sur S.A.A. (LP) | 1/1/2014 | 12/31/2023 | Up to 4.9 MW | ||||
| 21 | Luz del Sur S.A.A. (LP) | 1/1/2014 | 12/31/2025 | Up to 4.4 MW | ||||
| 22 | Luz del Sur S.A.A. (LP) | 1/1/2014 | 12/31/2025 | Up to 27.5 MW | ||||
| 23 | Electrosur S.A. (LP) | 1/1/2014 | 12/31/2021 | Up to 1.7 MW | ||||
| 24 | Electrosur S.A. (LP) | 1/1/2014 | 12/31/2023 | Up to 3.2 MW | ||||
| 25 | Electrosur S.A. (LP) | 1/1/2014 | 12/31/2023 | Up to 3.2 MW | ||||
| 26 | Electrosur S.A. (LP) | 1/1/2014 | 12/31/2025 | Up to 0.1 MW | ||||
| 27 | Electrosur S.A. (LP) | 1/1/2014 | 12/31/2025 | Up to 3.4 MW | ||||
| 28 | Electrosur S.A. (LP) | 1/1/2014 | 12/31/2025 | Up to 19.8 MW | ||||
| 29 | Electrosur S.A. (LP) | 1/1/2014 | 12/31/2021 | Up to 0.3 MW | ||||
| 30 | Electrosur S.A. (LP) | 1/1/2014 | 12/31/2023 | Up to 0.7 MW | ||||
| 31 | Electrosur S.A. (LP) | 1/1/2014 | 12/31/2023 | Up to 0.7 MW | ||||
| 32 | Electrosur S.A. (LP) | 1/1/2014 | 12/31/2025 | Up to 0.7 MW | ||||
| 33 | Electrosur S.A. (LP) | 1/1/2014 | 12/31/2025 | Up to 7.1 MW | ||||
| 34 | Edecañete S.A.A (LP) | 1/1/2014 | 12/31/2021 | Up to 0.74 MW | ||||
| 35 | Edecañete S.A.A (LP) | 1/1/2014 | 12/31/2021 | Up to 0.2 MW | ||||
| 36 | Electrosureste S.A. (LP) | 1/1/2014 | 12/31/2021 | Up to 2.5 MW | ||||
| 37 | Electrosureste S.A. (LP) | 1/1/2014 | 12/31/2023 | Up to 4.4 MW | ||||
| 38 | Electrosureste S.A. (LP) | 1/1/2014 | 12/31/2023 | Up to 4.4 MW |
F-587
Table of Contents
GENERANDES PERÚ S.A. AND SUBSIDIARIES
Notes to the Unaudited Consolidated Financial Statements
N° | Client | Starting | Ending | Energy Supply Contracted | ||||
| 39 | Electrosureste S.A. (LP) | 1/1/2014 | 12/31/2025 | Up to 0.1 MW | ||||
| 40 | Electrosureste S.A. (LP) | 1/1/2014 | 12/31/2025 | Up to 4.5 MW | ||||
| 41 | Electrosureste S.A. (LP) | 1/1/2014 | 12/31/2025 | Up to 26.0 MW | ||||
| 42 | Electrosureste S.A. (LP) | 1/1/2014 | 12/31/2021 | Up to 0.5 MW | ||||
| 43 | Electrosureste S.A. (LP) | 1/1/2014 | 12/31/2023 | Up to 0.9 MW | ||||
| 44 | Electrosureste S.A. (LP) | 1/1/2014 | 12/31/2023 | Up to 0.9 MW | ||||
| 45 | Electrosureste S.A. (LP) | 1/1/2014 | 12/31/2025 | Up to 0.9 MW | ||||
| 46 | Electrosureste S.A. (LP) | 1/1/2014 | 12/31/2025 | Up to 5.3 MW | ||||
| 47 | Electropuno S.A. (LP) | 1/1/2014 | 12/31/2021 | Up to 2.7 MW | ||||
| 48 | Electropuno S.A. (LP) | 1/1/2014 | 12/31/2023 | Up to 2.9 MW | ||||
| 49 | Electropuno S.A. (LP) | 1/1/2014 | 12/31/2023 | Up to 2.9 MW | ||||
| 50 | Electropuno S.A. (LP) | 1/1/2014 | 12/31/2025 | Up to 0.1 MW | ||||
| 51 | Electropuno S.A. (LP) | 1/1/2014 | 12/31/2025 | Up to 3.0 MW | ||||
| 52 | Electropuno S.A. (LP) | 1/1/2014 | 12/31/2025 | Up to 17.4 MW | ||||
| 56 | Electropuno S.A. (LP) | 1/1/2014 | 12/31/2021 | Up to 0.6 MW | ||||
| 57 | Electropuno S.A. (LP) | 1/1/2014 | 12/31/2023 | Up to 0.6 MW | ||||
| 58 | Electropuno S.A. (LP) | 1/1/2014 | 12/31/2023 | Up to 0.6 MW | ||||
| 59 | Electropuno S.A. (LP) | 1/1/2014 | 12/31/2025 | Up to 0.6 MW | ||||
| 60 | Electropuno S.A. (LP) | 1/1/2014 | 12/31/2025 | Up to 3.6 MW | ||||
| 61 | Seal S.A. (LP) | 1/1/2014 | 12/31/2021 | Up to 4.5 MW | ||||
| 62 | Seal S.A. (LP) | 1/1/2014 | 12/31/2023 | Up to 5.3 MW | ||||
| 63 | Seal S.A. (LP) | 1/1/2014 | 12/31/2023 | Up to 5.3 MW | ||||
| 64 | Seal S.A. (LP) | 1/1/2014 | 12/31/2025 | Up to 0.2 MW | ||||
| 65 | Seal S.A. (LP) | 1/1/2014 | 12/31/2025 | Up to 4.9 MW | ||||
| 66 | Seal S.A. (LP) | 1/1/2014 | 12/31/2025 | Up to 28.6 MW | ||||
| 67 | Seal S.A. (LP) | 1/1/2014 | 12/31/2021 | Up to 0.9 MW | ||||
| 68 | Seal S.A. (LP) | 1/1/2014 | 12/31/2023 | Up to 1.0 MW | ||||
| 69 | Seal S.A. (LP) | 1/1/2014 | 12/31/2023 | Up to 1.0 MW | ||||
| 70 | Seal S.A. (LP) | 1/1/2014 | 12/31/2025 | Up to 0.9 MW | ||||
| 71 | Seal S.A. (LP) | 1/1/2014 | 12/31/2025 | Up to 5.9 MW | ||||
| 72 | Hidrandina S.A. | 9/1/2012 | 12/31/2015 | Up to 33.2 MW in 2012 | ||||
| Up to 20.9 MW in 2013 | ||||||||
| Up to 110.3 MW in 2014 | ||||||||
| Up to 48.2 MW in 2015 | ||||||||
| 73 | Electrocentro S.A. | 9/1/2012 | 12/31/2015 | Up to 10.0 MW in 2012 | ||||
| Up to 12.5 MW in 2013 | ||||||||
| Up to 54.0 MW in 2014 | ||||||||
| Up to 14.6 MW in 2015 | ||||||||
| 74 | Electronoroeste S.A. | 6/1/2014 | 12/31/2014 | Up to 39.0 MW | ||||
| 75 | Edelnor S.A.A. (LP) | 1/1/2016 | 12/31/2027 | 67.8 MW | ||||
| 76 | Electronoroeste S.A. | 1/1/2014 | 12/31/2014 | Up to 22.9 MW | ||||
| 77 | Electronorte S.A. | 1/1/2014 | 12/31/2014 | Up to 19.2 MW | ||||
| 78 | Electrocentro S.A. | 1/1/2014 | 7/31/2014 | Up to 8.5 MW | ||||
| 79 | Electronoroeste S.A. | 1/1/2014 | 12/31/2014 | Up to 22.9 MW | ||||
| 80 | Electronorte S.A. | 1/1/2014 | 12/31/2014 | Up to 19.2 MW |
F-588
Table of Contents
GENERANDES PERÚ S.A. AND SUBSIDIARIES
Notes to the Unaudited Consolidated Financial Statements
Contracts with Free Users:
Client | Starting | Ending | Energy Supply Contracted | |||||||
Empresa Siderúrgica del Perú S.A. | 5/8/1997 | 12/31/2017 | 55 MW in HFP, 13 MW in HP since February 2009 | |||||||
Votorantim Metais—Cajamarquilla S.A. | 2/1/2001 | 2/28/2017 | 60 MW in HP, 125 MW in HFP | |||||||
Votorantim Metais—Cajamarquilla S.A. | 9/1/2009 | 8/31/2019 | 10 MW in HP and 57 MW in HFP | |||||||
Compañía Minera Antamina S.A. | 5/27/1999 | 12/31/2014 | Up to a maximum of 121.5 MW until the | |||||||
| termination of the contract | ||||||||||
Industrias Electroquímicas S.A. | 10/1/2005 | 12/31/2014 | 2.7 MW | |||||||
Tejidos San Jacinto S.A. | 5/1/2011 | 4/30/2016 | 7.5 MW | |||||||
Compañía Textil Credisa Trutex S.A.A. | 8/1/2010 | 12/31/2015 | 12.0 MW | |||||||
Moly-Cop Adesur S.A. | 4/1/2010 | 3/31/2020 | Up to 2.0 MW in HP and 16.0 MW in HFP in | |||||||
| Lima | ||||||||||
| Up to 0.2 MW in HP and 11.0 MW in HFP in | ||||||||||
| Arequipa | ||||||||||
Compañía Minera Antamina S.A. | 7/1/2011 | 12/31/2014 | 30 MW | |||||||
Minera Chinalco Perú S.A. | 10/1/2011 | 9/30/2026 | Up to 166 MW | |||||||
Compañía Minera Casapalca S.A. | 3/1/2012 | 12/31/2017 | 14 MW in HP and 57 HFP | |||||||
Shougang Hierro Perú S.A.A. | 5/1/2014 | 12/31/2020 | Up to 70 MW during period 2014-2017 | |||||||
| 100 MW in 2018-2019 | ||||||||||
| 110 MW in 2020. | ||||||||||
Praxair Perú S.R.L. | 9/7/2012 | 12/31/2019 | 2.8 MW | |||||||
Administradora Jockey Plaza Shopping Center S.A. | 11/1/2012 | 10/31/2015 | Up to 14.5 MW | |||||||
La Arena S.A. | 1/1/2014 | 12/31/2028 | Up to 30.0 MW | |||||||
Hudbay Peru S.A.C | 5/1/2014 | 12/31/2025 | Up to 90.0 MW | |||||||
Jinzhao Mining Perú S.A. | 6/1/2016 | 1/15/2026 | Up to 30.0 MW | |||||||
Banco Interbank | 9/1/2014 | 8/31/2016 | 1.6 MW | |||||||
(b) Natural Gas Supply Contract from Camisea Deposits
By means of the assignment of contractual position agreement, Electroperú S.A. transferred to Empresa de Generación Eléctrica Ventanilla S.A.-ETEVENSA (“Etevensa”), effective from August 1, 2003, its contractual position in the Contract for Supply of Natural Gas (hereinafter the Contract) entered into between companies that are part of the Contractor in charge of the exploitation of hydrocarbons in Camisea deposits (hereinafter the Contractor). Under the takeover of Etevensa by subsidiary Edegel S.A.A. from June 1, 2006, subsidiary Edegel S.A.A. acquired the rights and obligations of Etevensa in the Contract.
The Contract binds upon subsidiary Edegel S.A.A. to exclusively acquire gas from the Contractor until the maximum daily amount established in 3.901MM mcd for power plants of Ventanilla and Santa Rosa. Likewise, subsidiary Edegel S.A.A. binds upon to pay a minimum of 100% of the daily contractual quantity (2.50MM mcd from August 21, 2013; this quantity decreased to in 2.30MMmcd).
The purchase price is fixed at the point of receipt (Las Malvinas- Camisea) and is expressed in US$/MMBTU (dollars per million BTU). Effectiveness of this contract is 15 years from August 20, 2004.
F-589
Table of Contents
GENERANDES PERÚ S.A. AND SUBSIDIARIES
Notes to the Unaudited Consolidated Financial Statements
The cost of natural gas supply as of December 31, 2014 amounted to S/. 156,498 thousand (S/. 140,595 thousand as of December 31, 2013).
(c) Natural Gas Transport Contracts
On May 2, 2005, subsidiary Edegel S.A.A. and Transportadora de Gas del Perú S.A. (hereinafter TGP) entered into a Contract for Interruptible Natural Gas Transport Service with the intention that TGP renders services from the point of receipt located in Las Malvinas (Camisea) to the point of delivery in the City Gate of Lurin. This contract will be effective until January 1, 2034.
The maximum daily interruptible quantity (MIQ) that TGP is obliged to transport is the following:
Period | MIQ (m3 td/day) | |||
- From July 31, 2007 to July 31, 2008 | 4,200,000 | |||
- From August 1, 2008 to July 31, 2009 | 2,700,000 | |||
- From August 1, 2009 to December 14, 2009 | 2,000,000 | |||
- From December 15, 2009 to August 13, 2010 | 1,482,178 | |||
- From August 14, 2010 to December 31, 2019 | 992,624 | |||
- From January 1, 2020 to December 31, 2025 | 1,000,000 | |||
- From January 1, 2026 to January 1, 2034 | 3,100,000 | |||
On the other hand, on December 10, 2007, the Subsidiary Edegel S.A.A. signed the Firm Transportation Service Contract with TGP with the intention that it renders such service from August 1, 2008 to December 31, 2025.
The daily reserved capacity (DRC) amounts to the following values:
Period | MIQ (m3 td/day) | |||
- From August 1, 2008 to July 31, 2009 | 1,500,000 | |||
- From August 1, 2009 to December 14, 2009 | 2,200,000 | |||
- From December 15, 2009 to August 13, 2010 | 2,717,822 | |||
- From August 14, 2010 to August 1, 2019 | 3,207,376 | |||
- From August 2, 2019 to January 1, 2020 | 2,589,554 | |||
- From January 2, 2020 to December 31, 2025 | 2,100,000 | |||
The consideration of the service to which the above mentioned interruptible and firm contracts refer is calculated based on tariffs regulated by the Supervisory Entity for Investment in Energy and Mining (OSINERGMIN) applied on gas volumes effectively transported in the case of the interruptible service contract and the reserved volume in the case of the firm service contract.
Cost for these services as of December 31, 2014 amounted to S/. 124,596 thousand (S/. 115,796 thousand as of December 31, 2013) and is recorded in ‘generation costs’.
(d) Natural Gas Supply Contract
On August 27, 2004, ETEVENSA, currently the subsidiary Edegel S.A.A., and Gas Natural de Lima y Callao S.R.L. (hereinafter GNLC) entered into the Contract for Interruptible Natural Gas Transport Service through the Main Distribution Network from the point of receipt located in the City Gate of Lurin to the point of delivery in the Ventanilla Thermoelectric Plant. This Contract has a term of effectiveness of 15 years from the date of signing.
F-590
Table of Contents
GENERANDES PERÚ S.A. AND SUBSIDIARIES
Notes to the Unaudited Consolidated Financial Statements
The maximum daily interruptible capacity (MIQ) of gas that GNLC is obliged to transport is:
Period | MIQ (m3 td/day) | |||
- From the signing date to September 21, 2008 | 2,200,000 | |||
- From September 22, 2008 to July 31, 2009 | 700,000 | |||
- From August 1, 2009 to August 22, 2019 | 100,000 | |||
Likewise, on May 20, 2005, GNLC and subsidiary Edegel S.A.A. signed on other Contract for Interruptible Natural Gas Transport Service through the Main Distribution Network from the point of receipt located in the City Gate of Lurin to the point of delivery in the Santa Rosa Thermoelectric Plant (Santa Rosa Interruptible Service Contract). This contract will be effective until December 31, 2019.
The maximum daily interruptible capacity (MIC) of gas that GNLC is obliged to transport is:
Period | MIQ (m3 td/day) | |||
- From August 22, 2008 to December 15, 2009 | 2,000,000 | |||
- From December 15, 2009 to February 28, 2010 | 1,382,178 | |||
- From March 1, 2010 to December 31, 2019 | 900,000 | |||
On September 22, 2008 and within the Eleventh Public Offering for Contracting of Firm Service and called for the Contracting of the Interruptible Service of Natural Gas Transport through the Main Distribution Network, GNLC and Subsidiary Edegel S.A.A. signed the following Firm Service Contracts for the Santa Rosa and Ventanilla plants.
The daily reserved capacity (DRC) of gas that GNLC is obliged to transport is:
Period | MIQ (m3 td/day) | |||
Point of Delivery: Ventanilla. | ||||
- From September 22, 2008 to July 31, 2009 | 1,500,000 | |||
- From August 1, 2009 to December 31, 2025 | 2,100,000 | |||
Period | MIQ (m3 td/day) | |||
Point of Delivery: Santa Rosa. | ||||
- From December 15, 2009 to February 28, 2010 | 617,822 | |||
- From March 1, 2010 to December 31, 2019 | 1,100,000 | |||
The consideration of the service to which the above mentioned contracts refer is calculated based on tariffs regulated by the Supervisory Entity for Investment in Energy and Mining (OSINERGMIN) applied on gas volumes effectively transported in the case of the interruptible service contract and the reserved volume in the case of the firm service contract.
The cost of these services as of December 31, 2014 amounted to S/.46,701 thousand (S/. 19,767 thousand as of December 31, 2013) and is included in ‘generation costs’.
F-591
Table of Contents
GENERANDES PERÚ S.A. AND SUBSIDIARIES
Notes to the Unaudited Consolidated Financial Statements
(e) Long-term Contracts for the acquisition of replacement parts and rendering of maintenance services for Thermal Plants
On May 28, 2004, Empresa de Generación Termoeléctrica Ventanilla S.A.—ETEVENSA (“Etevensa”) signed a long-term service agreement (LTSA) with Siemens Westinghouse Power Corporation (currently Siemens Energy Inc.) and Siemens Westinghouse Service Company LTD (its rights and obligations have been assigned to Siemens S.A.C.) for the acquisition of replacement parts and spare parts, as well as for rendering scheduled maintenance services (major and minor) for the two turbines of the Thermoelectric Power Plant in Ventanilla. The LTSA referred to the Siemens turbine of Santa Rosa began operations on the date of signing and will be in force until: (a) each turbine of the Thermoelectric Power Plant of Ventanilla accumulates 108,333 HES; or b) 18 years are reached from the date of beginning of commercial operations of the natural gas plant, whichever occurs first.
Likewise, on June 15, 2005, subsidiary Edegel S.A.A signed a similar contract with the same companies for the acquisition of replacement parts and spare parts, as well as for rendering scheduled maintenance services (minor and major) for the Westinghouse turbine located in the Thermoelectric Power Plant of Santa Rosa. The LTSA referred to the Westinghouse turbine of Santa Rosa began operations on June 1, 2005 and will be in force until: (a) the turbine Westinghouse of the Santa Rosa Thermoelectric Power Plant accumulates 96,000 HES; or (b) 18 years are reached since June 1, 2005; or, (c) two high inspections and two hot gas path inspections are carried out as defined in the contract, whichever occurs first. Due to the claim occurred in May 2013 (note 13(g)) affecting this turbine, the Contract is still suspended as of September 30, 2014.
On the other hand, on March 27, 2009, Siemens Power Generation, Inc. (currently Siemens Energy Inc.) and Siemens Power Generation Service Company, Ltd. (its rights and obligations are currently assigned to Siemens S.A.C.) entered into with Subsidiary Edegel S.A.A. other LTSA for the acquisition of spare parts and replacement parts, as well as for rendering scheduled maintenance services (minor and major) for the Siemens turbine installed in the Thermoelectric Power Plant of Santa Rosa. The LTSA referred to the Siemens turbine of Santa Rosa began operations on the date of signing and will be in force until: (a) the Siemens turbine of the Santa Rosa Thermoelectric Power Plant accumulates 100,000 HES; or (b) 18 years are reached since the date of signing; or, (c) two high inspections and two hot gas path inspections are carried out as defined in the contract, whichever occurs first.
The contracts establish various forms of payment such as an initial payment for spare parts and equipment specified in the pertinent agreements, monthly payments based on an accumulation schedule of equivalent service hours for each turbine, monthly fixed payments for turbines, payment as per schedule specified for minor and major scheduled maintenance services, as per the accumulation of equivalent service hours and monthly payment for maintenance services of the control system of gas turbines of each contract.
(f) Fuel Supply Contract for Thermal Plants
On September 7, 2009, subsidiary Edegel S.A.A. entered into with Petróleos del Perú—Petroperú S.A. (Petroperú) a supply contract of Biodiesel B2 GE or other similar fuel destined to Thermal Plants effective for one renewable year. By means of communications between the parties, effectiveness was extended for three years and was formalized through an addendum dated December 13, 2010, including the automatic renewal if no prior notice is given.
According to the signed contract, Petroperú assumes the commitment to deliver a monthly volume of 20,000 barrels (free volume) or any other volume higher than the latter of “firm” nature that subsidiary Edegel
F-592
Table of Contents
GENERANDES PERÚ S.A. AND SUBSIDIARIES
Notes to the Unaudited Consolidated Financial Statements
S.A.A. has requested with prior notice of 60 days. If Subsidiary Edegel S.A.A. does not comply with the purchase of “firm” requested volume, it will be subject to the payment of a penalty in favor of PetroPerú to indemnify its financing and storage costs.
(36) Contingencies
As of December 31, 2014, the Company and its Subsidiaries have a pending solution of court and arbitration proceedings, as well as administrative and tax procedures related to the developed activities. In management and its internal and external legal advisors’ opinion, the Company has recorded the liabilities considered as appropriate based on the information available as of December 31, 2014 and 2013, and those will not result in liabilities additional to those already recorded by the Company and its Subsidiaries (note 18).
The main contingencies are:
(a) Income Tax Assessments for periods 2000 and 2001
As a result of the tax inspection of the income tax of periods 2000 and 2001, in December 2005, subsidiary Edegel S.A.A. was notified through Tax Assessment and Fine Resolutions amounting to S/. 75,892 thousand (including fines and interest calculated as of that date) for alleged omissions in the income tax payment of period 2000. Likewise, on that date subsidiary Edegel S.A.A. was notified through different tax assessment resolutions amounting to approximately S/. 6,842 thousand, corresponding to default interest related to payments on account of Income Tax of period 2001.
In January 2006, Subsidiary Edegel S.A.A. filed a partial appeal against such resolutions paying off the tax obligation related to not claim items. In September 2008, SUNAT notified subsidiary Edegel S.A.A. through an Intendency Resolution which declared the claim partially grounded.
In October 2008, subsidiary Edegel S.A.A. filed an appeal against such Intendency Resolution before the Tax Court. The main objections of SUNAT that have been subject to appeal are the following:
| (i) | S/. 44,025 thousand for the taxable base for depreciation of revalued fixed assets in period 1996. |
| (ii) | S/. 12,574 thousand for the taxable base for finance costs related to loans that the Tax Authority assumes that were used for the purchase of shares of own issuance; therefore, they do not comply with the principle of causality. |
| (iii) | S/. 5,673 thousand for the taxable base for negative Inflation Exposure Results of period 2001. |
In July 2012, under criteria established by the Tax Court in Resolution 01516-4-2012 issued in relation to 1999 Income Tax, subsidiary Edegel S.A.A. paid to SUNAT the amount of S/. 18,786 thousand, corresponding to the debt related to the objection (i) above, recalculated and updated at that date (including tax, penalties and interest). The payment did not involve the abandonment of the objection, which is still in force.
In August 2014, there was an oral hearing before the Tax Court and the argument brief was filed. In December 2014, the Tax Court issued Resolution 15281-8-2014, by which it resolved the described above appeal.
As of December 31, 2014, the Tax Court Resolution is pending notification and updated challenged contingency amounts to S/. 105,931 thousand (including taxes, fines and interest, calculated as of that date, as well as workers’ profit sharing).
F-593
Table of Contents
GENERANDES PERÚ S.A. AND SUBSIDIARIES
Notes to the Unaudited Consolidated Financial Statements
In opinion of subsidiary Edegel S.A.A. and its legal advisors, there is a high probability of success concerning unpaid challenged items, except for the portion that already has a provision amounting to S/. 2,601 thousand (note 18).
(b) Income Tax Assessments for periods 2002 and 2003
In July 2007, subsidiary Edegel S.A.A. was notified by SUNAT through various Tax Assessment and Fine Resolutions amounting to S/. 10,224 thousand (including taxes, fines, as well as interest calculated as of that date) for the income tax of periods 2002 and 2003.
In August 2007, Edegel S.A.A. filed a partial appeal against cnacelling the tax obligation related to not claimed items. In October 2008, Edegel S.A.A. was notified through SUNAT resolution which declared claim was partially grounded and established to continue with the collection of the amended debt amounting to S/. 3,154 thousand.
In December 2008, Edegel S.A.A. filed a partial appeal against the mentioned Intendency Resolution. The appeal was mainly related to the objection for exchange difference and interest arising from credits acquired to refinance the debt that was subject to objections in periods 2000 and 2001 because they were allegedly related to the purchase of shares of own issuance.
In August 2014, there was an oral hearing before the Tax Court and the argument brief was filed.
As of December 31, 2014, the appeal is pending resolution and updated challenged contingency amounts to S/. 6,025 thousand (including taxes, fines and interest, calculated as of that date, as well as workers’ profit sharing).
In opinion of Edegel S.A.A.’s management and its legal advisors the appeal has probabilities to success.
(c) Income Tax Assessment for period 2006
In April 2011, subisidiary Edegel S.A.A. was notified, through Tax Assessment and Fine Resolutions, of the income tax determination and payments on account of period 2006 and the alleged omission of the infringement of article 178.1 of the Tax Code (declare false figures or data that may influence in the determination of the tax obligation).
SUNAT determined a lower balance in favor of period 2006 for income tax, as well as higher payments on account for the months of January and February 2006.
In May 2011, subsidiary Edegel S.A.A. filed an appeal only in relation to the income tax and related fines. The part that was not objected—payments on account of January and February 2006- was canceled on that date.
In March 2012, subsidiary Edegel S.A.A. was notified through Intendency Resolution where SUNAT declared the claim groundless. In that month, subsidiary Edegel S.A.A. appealed such resolution.
As of December 31, 2014, the appeal is pending resolution and updated challenged contingency amounts to S/. 11,674 thousand (including taxes, fines and interest, calculated as of that date, as well as workers’ profit sharing).
F-594
Table of Contents
GENERANDES PERÚ S.A. AND SUBSIDIARIES
Notes to the Unaudited Consolidated Financial Statements
In opinion of subsidiary Edegel S.A.A.’s management and its legal advisors, the appeal has probabilities to succeed.
(d) Income Tax Assessment for period 2007
In May 2013, subisidiary Edegel S.A.A. was notified through Tax Assessment and Fine Resolutions related to income tax determination and payments on account of period 2007 and the alleged omission of the infringement of article 178.1 of the Tax Code (declare figures or false data that have influence in the determination of the tax obligation).
SUNAT determined a lower balance in favor of period 2007 for income tax, as well as higher payments on account and their respective fines as a result of the higher income tax determined in 2006 and that has influence on the determination of the credit balance and payments on account of period 2007.
In June 2013, subsidiary Edegel S.A.A. filed an appeal against such resolutions which was declared groundless by SUNAT through Intendency Resolution notified in October 2013. In that month, subsidiary Edegel S.A.A. appealed such resolution.
As of December 31, 2014, the appeal is pending resolution and updated challenged contingency amounts to S/. 12,451 thousand (including interest for payments on accounts, fines and interest on the fine, computed as of that date).
In opinion of subsidiary Edegel S.A.A.’s management and its legal advisors the appeal has probabilities to succeed.
(e) Income Tax Assessment for period 2008
In April 2013, subsidiary Edegel S.A.A. was notified through Tax Assessment and Fine Resolutions related to income tax determination and payments on account of period 2008 and the alleged omission of the infringement of article 178.1 of the Tax Code (declare figures or false data that have influence in the determination of the tax obligation).
The Tax Authority determined a lower balance in favor of period 2008 for income tax, as well as higher payments on account and their respective fines as a result of the higher income tax determined in 2006 and 2007 and that have influence on the determination of the credit balance and payments on account of period 2008.
In December 2013, subsidiary Edegel S.A.A. filed an appeal against such resolutions which was declared groundless by SUNAT through Intendency Resolution notified in June 2014. In July 2014, subsidiary Edegel S.A.A. appealed such resolution.
As of December 31, 2014, the appeal is pending resolution and updated challenged contingency amounts to S/. 4,330 thousand (including interest of payments on account, fines and fine interest, calculated as of that date).
In opinion of subsidiary Edegel S.A.A.’s management and its legal advisors, the appeal has high probabilities to succeed.
F-595
Table of Contents
GENERANDES PERÚ S.A. AND SUBSIDIARIES
Notes to the Unaudited Consolidated Financial Statements
(f) Income Tax Assessment for period 2009
In September 2014, Subsidiary Edegel S.A.A. was notified, through Tax Assessment and Fine Resolutions related to income tax determination and payments on account of period 2009, of the alleged omission of the infringement of article 178.1 of the Tax Code (declare false figures or data that may influence in the determination of the tax obligation).
SUNAT determined (i) omitted income tax of S/. 17,273 thousand (including tax and interest tax) due to (a) objections to the taxable base of year 2009 and, (b) failure to recognize part of the carryforward credit balance determined by subsidiary Edegel S.A.A. in periods 2006 through 2008, (ii) a fine associated to income tax of S/. 781 thousand (including fines and interest), which is linked solely to the objections of period 2009, and (iii) interest on payments on account of S/. 2,484 thousand for the months of March and April 2009.
In October 2014, subsidiary Edegel S.A.A. filed a partial appeal. The part that will not be included in the objection corresponds to paragraph (a) of points (i) and (ii) above described. It was paid off in that month before the appeal was filed.
As of December 31, 2014, the updated contingency amounts to S/. 17,945 thousand (including tax and interest calculated as of that date) and the claim was resolved by SUNAT, and were found to be groundless. The resolution issued by such entity was notified to subsidiary Edegel S.A.A. in January 2015. Subsidiary Edegel S.A.A. filed an appeal against such resolution within the legal deadline.
In opinion of subsidiary Edegel S.A.A.’s management and its legal advisors, the appeal has high probabilities of success.
(g) Assessment for Sales Tax, Municipal Promotion Tax and Ad Valorem of years 2008 and 2009
In December 2013, SUNAT sent Division Resolutions putting under collection (i) US$ 1,644 thousand, for taxes (sales tax, Tax Municipal Promotion and Ad Valorem) which allegedly were not paid in various custom declarations, (ii) US$ 3,287 thousand for a fine equivalent to the double taxation that was allegedly not paid and, (iii) S/. 710 thousand, for a fine equivalent to 0.2 tax units in force in 2009, for an alleged incorrect statement of the value in Custom Declarations.
Such tax assessments are related to Custom Declarations issued for the execution of the Turnkey Contract for Santa Rosa Project, signed between Siemens Power Generation Inc. and subsidiary Edegel S.A.A. and subsequently by the lessor who joined as owner of the goods of such contracts, under the leasing contract signed with subsidiary Edegel S.A.A. for the execution of the project. SUNAT objections were as follows: (i) engineering services rendered abroad by Siemens Power Generation Inc. under the above mentioned contract, should take part of the custom value of imported products, and (ii) the amount of the bond for higher performance of Santa Rosa paid to Siemens Power Generation Inc. should have been added to such value.
In January 2014, it filed a claim against those values and in February 2014, it presented a list of evidence. In October 2014, SUNAT, through management resolution, resolved the claim before mentioned, as follows: (a) maintained the objection (i) above, and annulled the adjustment (ii) referred to in the preceding paragraph and, (b) ordered the issuance of new collection settlements. In that month, SUNAT informed the new Collection Settlements.
In November 2014, an appeal was filed against this management resolution and the new Collection Settlements. In December 2014, a list of evidence was presented.
F-596
Table of Contents
GENERANDES PERÚ S.A. AND SUBSIDIARIES
Notes to the Unaudited Consolidated Financial Statements
As of December 31, 2014, the appeal is pending resolution and challenged contingency amounts to S/. 20,066 thousand (including taxes, fines and interest calculated as of that date).
(h) Claims before ESSALUD (former IPSS)
| (i) | Process referred to alleged debts for non-compliance with the payment of contributions to health systems of Decree Law 22482, Decree Law pensions 19990, workplace accidents and occupational disease of Decree Law 18846 during the period from April 1994 and March 1996, for the amount of S/. 8,203 thousand (including interest calculated until June 1996). |
In January 2010, subsidiary Edegel S.A.A. was notified through Resolution which declared that the claim related to the payment of contributions to the health system, workplace accidents and occupational disease was groundless; thus, ordering the continuity of collections. Likewise, ESSALUD declared that the claim related to the pension system was inadmissible since it was within the scope of the National Pension Office (ONP). In January 2010, subsidiary Edegel S.A.A. filed an appeal for reconsideration against such Resolution
In December 2010, subsidiary Edegel S.A.A. was notified through Resolution where ESSALUD declared partially founded the appeal filed, ordering the Company to pay a debt amounting to S/. 1,834 thousand (including interest).
In December 2010, Subsidiary Edegel S.A.A. made the payment ordering such Resolution.
In January 2011, subsidiary Edegel S.A.A. filed to ESSALUD a written document communicating the payment of debt and requesting (i) Declaration of total and full payment of debts, (ii) lack of any other debt derived from the inspection process and, (iii) the final document of the file.
Subsidiary Edegel S.A.A. is waiting for the Resolution of ESSALUD that responds to the above mentioned written document.
| (ii) | Claim referred to payment orders through which it is intended to collect to subsidiary Edegel S.A.A. the alleged omission in the payment of contributions to ESSALUD, during the period comprised between April 1997 and December 1998. ESSALUD notified subsidiary Edegel S.A.A., through resolution that it declared the annulment of the payment orders, except for the one related to period June 1997 on which no opinion has been issued yet. |
As of December 31, 2014, the claim filed against the payment orders issued for the period June 1997, is still pending and the updated challenged contingency amounts to S/. 555 thousand.
The provision recorded by subsidiary Edegel S.A.A., for both processes, as of December 31, 2014 amounts to S/. 1,411 thousand (note 18).
(i) Property Tax Assessment of Periods 2000 through 2004
The District Municipality of San Ramon notified subsidiary Edegel S.A.A., through Tax Assessment Resolution and Fine Resolution requiring a payment of amount of S/. 3,388 thousand for Property Tax of periods 2000 through 2004 and S/. 26 thousand for fine, including default interest calculated as of 2005. The Municipality supports the tax assessment when including in the taxable base, movable property and investments in land of third parties.
F-597
Table of Contents
GENERANDES PERÚ S.A. AND SUBSIDIARIES
Notes to the Unaudited Consolidated Financial Statements
In June 2005, subsidiary Edegel S.A.A. filed an appeal against above mentioned resolutions based on the fact that the Property and Fine Tax corresponding to period 2000 are prescribed and that, concerning other periods, the taxable base assumed by the Municipality considers elements that are not adjusted to law provisions.
Other claims have been accumulated to this process, which were filed by subsidiary Edegel S.A.A. against Tax Assessment Resolutions for which the Municipality of San Ramón requested the payment of Work Compliance Rates and Planning Application, respectively, amounting to S/. 258 thousand each of them.
In June 2014, subsidiary Edegel S.A.A. was notified through Tax Court resolution 07326-7-2013, requiring the Municipality of San Ramón to convey the complete and original record of the appeal.
In opinion of subsidiary Edegel S.A.A.’s management and its legal advisors, there are high probabilities to obtain a favorable result concerning the tax assessment of period 2000 because the prescribed year. Likewise, there are also high probabilities of success concerning the contingency associated to the valuation of property made by the Municipality and its inclusion within the taxable base for the tax determination of periods 2001 to 2004. On the other hand, concerning the claim related to the inclusion of investments in land of third parties within the taxable base for the tax determination of periods 2001 to 2004, the contingency has been classified as probable, reason why the provision recorded by subsidiary Edegel S.A.A. as of December 31, 2014 amounts to S/. 3,688 thousand (note 18).
(j) Fine associated to the Real Estate Transfer Tax of year 2009 imposed by the District Municipality of San Ramon
In October 2010, the District Municipality of San Ramon notified subsidiary Chinango S.A.C. through the Fine Resolution 049-2010/MDSR for which the amount of S/. 977 thousand was subject to collection for allegedly having incurred in the infraction established in paragraph 1 of article 178° of the Tax Code.
In November 2010, subsidiary Chinango S.A.C. filed a claim against the above mentioned resolution, stating that it is no longer appropriate since there is no obligation of submitting a Real Estate Transfer Tax return.
In April 2011, subsidiary Chinango was notified through Management Resolution 113-2011-GR-MDSR through which the District Municipality of San Ramon declared inadmissible the dispute of tax assessment. Subsidiary Chinango S.A.C. filed an appeal against Management Resolution requesting the Municipality to resolve the claim, since it was submitted under legal established terms.
In July 2011, subsidiary Chinango S.A.C. was notified through Municipal Management Resolution090-2011-GEMU-MDSR that General Management Resolution 113-2011-GR-MDSR was declared invalid.
As of December 31, 2014, the claim filed by subsidiary Chinango S.A.C. is pending resolution and the related contingency amounts to S/. 1,787 thousand.
In the opinion of Company’s and its Subsidiaries’ management and legal advisors there are reasonable arguments to obtain a favorable result.
(k) Income Tax Assessment for period 2010
In January 2013, subsidiary Chinango S.A.C. was notified through Tax Assessment and Fine Resolutions about alleged omissions in the income tax determination of period 2010, and the alleged infringement committed concerning article 178.1 of the Tax Code, respectively.
F-598
Table of Contents
GENERANDES PERÚ S.A. AND SUBSIDIARIES
Notes to the Unaudited Consolidated Financial Statements
The debt subject to collection for income tax results from unknown finance costs from arising certain liabilities that were transferred by subsidiary Edegel S.A.A. to subsidiary Chinango S.A.C., in the simple reorganization carried out in May 2009.
In February 2013, subsidiary Chinango S.A.C. paid the debt for income tax amounting to S/. 1,440 thousand and related penalty and interest for S/. 767 thousand and filed the corresponding claim.
In September 2013, the subsidiary Chinango S.A.C. was notified with Intendency resolution that the claim was declared to be groundless, confirming the full payment of the debt subject to collection, through payment made in February.
In that month, subsidiary Chinango S.A.C. filed an appeal against that Intendency resolution, which, as of December 31, 2014, is pending before the Tax Court.
In the opinion of Company’s and its Subsidiaries’ management and legal advisors there are reasonable arguments to obtain a favorable result.
(l) Real Estate Transfer Tax Assessment of year 2009 imposed by the District Municipality of San Ramon
In April 2013, the District Municipality of San Ramon notified subsidiary Chinango S.A.C. through various Tax Assessment Resolutions about the collection of an alleged debt of real estate transfer tax levied on the transfer of certain assets within the simple reorganization carried out between the Company and the Subsidiary in May 2009.
In June 2013, subsidiary Chinango S.A.C. filed a claim against the above mentioned Resolutions which was resolved in October 2013 through Mayor’s Resolution which declared the invalidity of challenged Tax Assessment Resolutions and ordered the conduction of a new tax inspection.
Such tax inspection was carried out during October and November 2013, having that in this last month, the Municipality notified Subsidiary Chinango S.A.C. through a Tax Assessment Resolution about the collection of an alleged omitted tax amounting to S/. 1,689 thousand.
In December 2013, subsidiary Chinango S.A.C. filed a claim against the new Tax Assessment Resolution which was resolved in that same month through Mayor’s Resolution. This last Resolution declared groundless the claim. In January 2014, subsidiary Chinango S.A.C. filed an appeal against such Mayor’s Resolution.
As of December 31, 2014, the appeal is pending resolution and updated contingency amounts to S/. 2,901 thousand.
In the opinion of Company’s and its Subsidiaries’ management and legal advisors there are reasonable arguments to obtain a favorable result.
(m) Real Estate Transfer Tax Assessment of year 2009 imposed by the District Municipality of Monobamba
In May 2013, the District Municipality of Monobamba notified subsidiary Chinango S.A.C. through various Tax Assessment Resolutions about the collection of an alleged debt of real estate transfer tax levied on the transfer of certain assets in the simple reorganization carried out between subsidiary Edegel S.A.A. and subsidiary Chinango S.A.C. in May 2009.
F-599
Table of Contents
GENERANDES PERÚ S.A. AND SUBSIDIARIES
Notes to the Unaudited Consolidated Financial Statements
In June 2013, subsidiary Chinango S.A.C. filed a claim against the above mentioned Resolutions which was resolved in October 2013 through Mayor’s Resolution which declared the invalidity of challenged Tax Assessment Resolutions and ordered the conduction of a new tax inspection.
Such tax inspection was carried out during October and November 2013, having that in this last month, the Municipality notified subsidiary Chinango S.A.C. through a Tax Assessment Resolution about the collection of alleged omitted tax amounting to S/. 4,341 thousand.
In December 2013, subsidiary Chinango S.A.C. filed a claim against the new Tax Assessment Resolution which was resolved in that same month through Mayor’s Resolution. This last Resolution declared groundless the claim. In January 2014, subsidiary Chinango S.A.C. filed an appeal against such Mayor’s Resolution.
Updated contingency as of December 31, 2014, amounts to S/. 7,938 thousand.
In the opinion of subsidiary Chinango S.A.C.’s management and legal advisors there are reasonable arguments to obtain a favorable result.
(n) Real Estate Transfer Tax Assessment of year 2009 imposed by the District Municipality of Masma
In July 2013, the District Municipality of Masma notified subsidiary Chinango S.A.C. through various Tax Assessment Resolutions about the collection of an amount of S/. 1,585 thousand for alleged debt of real estate transfer tax levied on the transfer of certain assets within the simple reorganization carried out between subsidiary Edegel S.A.A. and subsidiary Chinango S.A.C. in May 2009.
In August 2013, subsidiary Chinango S.A.C. filed an appeal against the mentioned Tax Assessment Resolution.
In December 2013, subsidiary Chinango S.A.C. was notified with Official Letter issued by the Municipality through which such entity informs subsidiary Chinango S.A.C. that it will declare inadmissible the above mentioned appeal if there is no proof of payment of the tax debt accepted at the Municipal cash register since the payment on consignment (in The judiciary) is not valid. In January 2014, the Subsidiary responded to the Official Letter.
As of December 31, 2014, the appeal is pending resolution and updated contingency amounts to S/. 2,899 thousand.
In the opinion of Company’s and its Subsidiaries’ management and legal advisors, there are reasonable arguments to obtain a favorable result.
(o) Property Tax Assessment of year 2010 imposed by the District Municipality of San Ramon
In December 2013, the District Municipality of San Ramon notified subsidiary Chinango S.A.C. through a Tax Assessment Resolution about the collection of S/. 229 thousand for an alleged omitted payment of the Property Tax of year 2010.
In February 2014, subsidiary Chinango S.A.C. filed an appeal against the mentioned Tax Assessment Resolution and in March 2014, it presented an amended complaint.
F-600
Table of Contents
GENERANDES PERÚ S.A. AND SUBSIDIARIES
Notes to the Unaudited Consolidated Financial Statements
In September 2014, subsidiary Chinango S.A.C. was notified through (i) management resolution, that the Municipality decided to declare void the contested Resolution and to start a new assessment, and (ii) a Request that a new assessment would commence, requesting documentation and the conduction of an inspection. Subsidiary Chinango S.A.C. presented a list of evidence in response to that Request indicating that the new assessment should be null, since the assessment that gave rise to the process described in this section, has not been declared null.
As of December 31, 2014, subsidiary Chinango S.A.C. is awaiting the pronouncement of the Municipality; the updated contingency amounts to S/. 374 thousand.
In opinion of Management and its legal advisors there are reasonable arguments to obtain a favorable result.
(p) Income Tax Assessment for period 2011
In January 2014, subsidiary Chinango S.A.C. was notified through Tax Assessment and Fine Resolutions about the collection of alleged omissions in the income tax determination of period 2011 for interest on payments on account from January to December 2011, and the alleged infringement committed concerning article 178.1 of the Tax Code related to each of the items above mentioned.
The debt subject to collection related to income tax arising from unknown finance costs of certain liabilities that were transferred by subsidiary Edegel S.A.A. to subsidiary Chinango the S.A.C., during the simple reorganization carried out in May 2009.
In February 2014, subsidiary Chinango S.A.C. paid the debt for income tax and related interest amounting to S/. 1,162 thousand, and interest of payments on account for S/. 149 thousand and penalties and related interest for S/. 613 thousand and file the corresponding claim.
As of December 31, 2014, subsidiary Chinango S.A.C. was notified through Intendency Resolution where SAUNAT declared the claim groundless and confirmed and declared that the debt under collection was paid off, after payment made in February 2014.
In the opinion of Company’s and its Subsidiaries’ management and legal advisors, there are reasonable arguments to obtain a favorable result.
(q) Property Tax Assessment of years 2009 through 2014 imposed by the District Municipality of Centro Poblado San Juan de Uchubamba
In October 2014, the District Municipality of Centro Poblado San Juan de Uchubamba notified subsidiary Chinango S.A.C. through a Payment Order about the collection of the amount of S/. 902 thousand for an alleged omitted payment of the Property Tax of years 2009 through 2014.
In November 2014, subsidiary Chinango S.A.C. was notified about a collection resolution where a tax enforcement officer of said Municipality, announced the beginning of the debt coercive collection of the Payment Order above mentioned, giving a period of 7 working days to make payment.
F-601
Table of Contents
GENERANDES PERÚ S.A. AND SUBSIDIARIES
Notes to the Unaudited Consolidated Financial Statements
In the same month, subsidiary Chinango S.A.C. presented (i) an appeal against the Payment Order thus it did not make the payment, due to its manifest illegality, and (ii) a letter to the coercive executor requesting the suspension of the procedure for enforced collection because within the statutory period, the subsidiary appealed for respective claim.
In December 2014, subsidiary Chinango S.A.C. was notified with (i) mayor’s resolution through which the claim was declared inadmissible and (ii) a Coercive collection resolution requesting the Subsidiary to establish an address for the proceeding within a term of no longer than 3 business days. With regard to the Resolution (i) subsidiary Chinango S.A.C. will appeal within the legal term established and in relation to Resolution (ii), subsidiary Chinango S.A.C., in the same month submitted a brief indicating that there is no need to establish an address for the proceeding, so any notice related to the proceeding should be performed in the offices of the Subsidiary.
In the opinion of Company’s and its Subsidiaries’ management and legal advisors there are reasonable arguments to obtain a favorable result.
(r) Sales Tax Assessment for period 2000
On December 27, 2004, the Company was notified through tax assessment and fine resolutions resulting from the review of the determination of income tax and payments of sales tax of year 2000. The objection was the result of the lack of knowledge of a transaction conducted in 2000, whereby the Company outsourced from its stockholders of Cono Sur S.A. and Entergy Perú S.A. the technical assistance services to be provided to the Subsidiary for the development of the Yanango and Chimay projects.
The Company complained such Tax Assessment and Fine Resolutions, arguing that SUNAT evidence originally presented were insufficient. The Company presented additional evidence relating to the service provided. However, SUNAT maintained its position which was later appealed before Tax Court on December 5, 2008.
The contingency related to this tax assessments, updated as of December 31, 2014 amounts to S/. 81,789 thousand (including taxes, fines and interest calculated as of that date).
As of December 31, 2014, the appeal filed by the Company has pending resolution by the Tax Court.
In opinion of the Company’s management and its legal advisors, there are reasonable arguments to obtain a favorable result.
(37) Subsequent Events
In the opinion of management and after December 31, 2014 and until the date of this report, no events or significant events that require adjustments or disclosures to the consolidated financial statements as of December 31, 2014 have occurred.
F-602
Table of Contents
GENERANDES PERÚ S.A. AND SUBSIDIARIES
Consolidated Financial Statements
December 31, 2013, 2012 and 2011 and for
the years ended December 31, 2013 and 2012
(including Independent Auditors’ Report)
Table of Contents
 | KPMG en Perú Torre KPMG. Av. Javier Prado Oeste 203 San Isidro. Lima 27, Perú | Teléfono Fax Internet | 51 (1) 611 3000 51 (1) 421 6943 www.kpmg.com/pe |
The Stockholders and Board of Directors
Generandes Peru S.A.:
Report on the Financial Statements
We have audited the accompanying consolidated financial statements of Generandes Peru S.A. and its subsidiaries, which comprise the consolidated statements of financial position as of December 31, 2013, 2012 and 2011, and the related consolidated statements of income, comprehensive income, changes in equity and cash flows for the years ended December 31, 2013 and 2012, and the related notes to the consolidated financial statements.
Management’s Responsibility for the Financial Statements
Management is responsible for the preparation and fair presentation of these consolidated financial statements in accordance with International Financial Reporting Standards; this includes the design, implementation, and maintenance of internal control relevant to the preparation and fair presentation of consolidated financial statements that are free from material misstatement, whether due to fraud or error.
Auditors’ Responsibility
Our responsibility is to express an opinion on these consolidated financial statements based on our audits. We conducted our audits in accordance with auditing standards generally accepted in the United States of America. Those standards require that we plan and perform the audit to obtain reasonable assurance about whether the consolidated financial statements are free from material misstatement.
An audit involves performing procedures to obtain audit evidence about the amounts and disclosures in the consolidated financial statements. The procedures selected depend on the auditors’ judgment, including the assessment of the risks of material misstatement of the consolidated financial statements, whether due to fraud or error. In making those risk assessments, the auditor considers internal control relevant to the entity’s preparation and fair presentation of the consolidated financial statements in order to design audit procedures that are appropriate in the circumstances, but not for the purpose of expressing an opinion on the effectiveness of the entity’s internal control. Accordingly, we express no such opinion. An audit also includes evaluating the appropriateness of accounting policies used and the reasonableness of significant accounting estimates made by management, as well as evaluating the overall presentation of the consolidated financial statements.
We believe that the audit evidence we have obtained is sufficient and appropriate to provide a basis for our audit opinion.
Caipo y Asociados S. Civil de R.L. sociedad civil peruana de responsabilidad limitada y firma miembro de la red de firmas miembro independientes de KPMG afiliadas a KPMG International Cooperative (“KPMG International”), una entidad suiza. | Inscrita en la partida No 01681796 del Registro de Personas Juridicas de Lima. |
Table of Contents
Opinion
In our opinion, the consolidated financial statements referred to above present fairly in all material respects, the consolidated financial position of Generandes Peru S.A. and its subsidiaries as of December 31, 2013, 2012 and 2011, and the results of their operations and their cash flows for the years ended December 31, 2013 and 2012 in accordance with International Financial Reporting Standards as issued by the International Accounting Standards Board.
Lima, Peru,
July 4, 2014
 |
Juan Jose Cordova (Partner)
Peruvian Certified Public Accountant
Registration 01-18869
F-605
Table of Contents
GENERANDES PERÚ S.A. AND SUBSIDIARIES
Consolidated Statements of Financial Position
As of December 31, 2013, 2012 and 2011
(Stated in thousands of nuevos soles)
Note | 2013 | 2012 | 2011 | |||||||||||||
Assets | ||||||||||||||||
Current assets | ||||||||||||||||
Cash and cash equivalents | 6 | 172,907 | 188,107 | 170,027 | ||||||||||||
Trade accounts receivable | 7 | 155,090 | 144,957 | 135,589 | ||||||||||||
Accounts receivable from related parties | 8 | 26,986 | 58 | 1,109 | ||||||||||||
Other accounts receivable | 9 | 111,294 | 8,401 | 9,032 | ||||||||||||
Inventories | 10 | 67,844 | 68,731 | 65,622 | ||||||||||||
Derivative instruments | 20 | 646 | 277 | 252 | ||||||||||||
Other no financial assets | 11 | 22,266 | 16,664 | 9,706 | ||||||||||||
|
|
|
|
|
| |||||||||||
Total current assets | 557,033 | 427,195 | 391,337 | |||||||||||||
|
|
|
|
|
| |||||||||||
Non-current assets | ||||||||||||||||
Investments in associate | 12 | 260,382 | 259,771 | 275,271 | ||||||||||||
Derivative instruments | 20 | 36 | 2,794 | 1,125 | ||||||||||||
Property, plant, and equipment | 13 | 3,750,010 | 3,795,708 | 3,881,405 | ||||||||||||
Intangible assets | 14 | 52,146 | 51,811 | 2,375 | ||||||||||||
Deferred income tax asset | 21 | 29,165 | 9,806 | 8,077 | ||||||||||||
|
|
|
|
|
| |||||||||||
Total non-current assets | 4,091,739 | 4,119,890 | 4,168,253 | |||||||||||||
|
|
|
|
|
| |||||||||||
Total assets | 4,648,772 | 4,547,085 | 4,559,590 | |||||||||||||
|
|
|
|
|
| |||||||||||
Liabilities | ||||||||||||||||
Current liabilities | ||||||||||||||||
Trade accounts payable | 16 | 293,090 | 190,084 | 97,426 | ||||||||||||
Accounts payable to related parties | 8 | 4,489 | 4,872 | 73 | ||||||||||||
Other accounts payable | 17 | 71,982 | 61,942 | 54,536 | ||||||||||||
Provisions, current portion | 18 | 18,537 | 18,509 | 71,952 | ||||||||||||
Current portion of financial liabilities | 15 y 19 | 165,515 | 146,175 | 171,188 | ||||||||||||
Income tax payable | 31,630 | 8,754 | 63,958 | |||||||||||||
|
|
|
|
|
| |||||||||||
Total current liabilities | 585,243 | 430,336 | 459,133 | |||||||||||||
|
|
|
|
|
| |||||||||||
Non-current liabilities | ||||||||||||||||
Financial liabilities | 19 | 638,999 | 730,399 | 878,480 | ||||||||||||
Provisions | 18 | 15,126 | 14,566 | 8,657 | ||||||||||||
Deferred income tax liability | 21 | 769,648 | 789,161 | 777,329 | ||||||||||||
Employee benefits | 3,394 | 3,586 | — | |||||||||||||
|
|
|
|
|
| |||||||||||
Total non-current liabilities | 1,427,167 | 1,537,712 | 1,664,466 | |||||||||||||
|
|
|
|
|
| |||||||||||
Total liabilities | 2,012,410 | 1,968,048 | 2,123,599 | |||||||||||||
|
|
|
|
|
| |||||||||||
Equity | 22 | |||||||||||||||
Share capital | 853,429 | 853,429 | 853,429 | |||||||||||||
Other capital reserves | 142,406 | 132,240 | 126,042 | |||||||||||||
Other reserves | 32,198 | 59,072 | 49,919 | |||||||||||||
Accumulated currency translation losses, net | (21,375 | ) | (22,220 | ) | 14,919 | |||||||||||
Retained earnings | 386,592 | 339,378 | 245,301 | |||||||||||||
|
|
|
|
|
| |||||||||||
Equity attributable to controlling interest | 1,393,250 | 1,361,899 | 1,289,610 | |||||||||||||
Non-controlling interests | 1,243,112 | 1,217,138 | 1,146,381 | |||||||||||||
|
|
|
|
|
| |||||||||||
Total equity | 2,636,362 | 2,579,037 | 2,435,991 | |||||||||||||
|
|
|
|
|
| |||||||||||
Total liabilities and equity | 4,648,772 | 4,547,085 | 4,559,590 | |||||||||||||
|
|
|
|
|
| |||||||||||
The notes on pages F-204 to F-268 are an integral part of these consolidated financial statements.
F-606
Table of Contents
GENERANDES PERÚ S.A. AND SUBSIDIARIES
Consolidated Statements of Income
For the years ended December 31, 2013 and 2012
(Stated in thousands of nuevos soles)
Note | 2013 | 2012 | ||||||||||
Operating income: | 23 | |||||||||||
Energy | 975,499 | 1,053,535 | ||||||||||
Power | 435,872 | 440,643 | ||||||||||
Other operating income | 21,072 | 29,961 | ||||||||||
|
|
|
| |||||||||
| 1,432,443 | 1,524,139 | |||||||||||
Generation costs | 24 | (886,689 | ) | (929,599 | ) | |||||||
|
|
|
| |||||||||
Gross profit | 545,754 | 594,540 | ||||||||||
Administrative expenses | 25 | (53,320 | ) | (50,553 | ) | |||||||
Other | 28 | 119,212 | 12,590 | |||||||||
|
|
|
| |||||||||
Operating profit | 611,646 | 556,577 | ||||||||||
|
|
|
| |||||||||
Other income (costs): | ||||||||||||
Share of profit of associate carried under the equity method | 54,728 | 55,145 | ||||||||||
Finance income | 29 | 4,968 | 6,706 | |||||||||
Finance costs | 29 | (43,636 | ) | (54,769 | ) | |||||||
Exchange difference net | (5,615 | ) | (245 | ) | ||||||||
|
|
|
| |||||||||
| 10,445 | 6,837 | |||||||||||
|
|
|
| |||||||||
Earnings before income taxes | 622,091 | 563,414 | ||||||||||
Income tax expense | 21 y 30 | (167,726 | ) | (177,349 | ) | |||||||
|
|
|
| |||||||||
Profit for the year | 454,365 | 386,065 | ||||||||||
|
|
|
| |||||||||
Profit attributable to: | ||||||||||||
Controlling interests | 239,878 | 201,703 | ||||||||||
Non-controlling interests | 214,487 | 184,362 | ||||||||||
|
|
|
| |||||||||
| 454,365 | 386,065 | |||||||||||
|
|
|
| |||||||||
Weighted-average number of ordinary shares outstanding for calculation of earnings per share (thousands) | 31 | 853,429 | 853,429 | |||||||||
|
|
|
| |||||||||
Basic and diluted earnings per share (S/. per share) | 31 | 0.281 | 0.236 | |||||||||
|
|
|
| |||||||||
The notes on pages F-204 to F-268 are an integral part of these consolidated financial statements.
F-607
Table of Contents
GENERANDES PERÚ S.A. AND SUBSIDIARIES
Consolidated Statements of Comprehensive Income
For the years ended December 31, 2013, 2012
(Stated in thousands of nuevos soles)
2013 | 2012 | |||||||
Profit for the year | 454,365 | 386,065 | ||||||
Other comprehensive income (loss) items that are or may be reclassified to profit or loss | ||||||||
Net change in cash flow hedges—exchange rate | (51,652 | ) | 16,022 | |||||
Net change in cash flow hedges—interest rate | 187 | 1,873 | ||||||
Currency translation difference | 1,559 | (68,523 | ) | |||||
|
|
|
| |||||
Total comprehensive income for the year, net of tax | 404,459 | 335,437 | ||||||
|
|
|
| |||||
Attributable to: | ||||||||
Controlling interests | 213,849 | 173,717 | ||||||
Non-controlling interests | 190,610 | 161,720 | ||||||
|
|
|
| |||||
Total comprehensive income for the year | 404,459 | 335,437 | ||||||
|
|
|
| |||||
The notes on pages F-204 to F-268 are an integral part of these consolidated financial statements.
F-608
Table of Contents
GENERANDES PERÚ S.A. AND SUBSIDIARIES
Consolidated Statements of Changes in Equity
For the years ended December 31, 2013 and 2012
(Stated in thousands of nuevos soles)
Share Capital (note 22 (a)) | Other capital | Other reserves | Accumulated | Retained | Non-controlling | Total | ||||||||||||||||||||||
Balances as of December 31, 2011 | 853,429 | 126,042 | 49,919 | 14,919 | 245,301 | 1,146,381 | 2,435,991 | |||||||||||||||||||||
Profit for the year | — | — | — | — | 201,703 | 184,362 | 386,065 | |||||||||||||||||||||
Other comprehensive income (loss) for the year | 9,153 | (37,139 | ) | (22,642 | ) | (50,628 | ) | |||||||||||||||||||||
|
|
|
|
|
|
|
|
|
|
|
|
|
| |||||||||||||||
Total comprehensive income (loss) for the year | — | — | 9,153 | (37,139 | ) | 201,703 | 161,720 | 335,437 | ||||||||||||||||||||
2011 complementary dividend (note 22(c)) | — | — | — | — | (6,938 | ) | (6,536 | ) | (13,474 | ) | ||||||||||||||||||
2012 dividend advances (note 22(c)) | — | — | — | — | (94,490 | ) | (85,936 | ) | (180,426 | ) | ||||||||||||||||||
Approval of legal reserve (note 22(b)) | — | 6,198 | — | — | (6,198 | ) | — | — | ||||||||||||||||||||
Others | — | — | — | — | — | 1,509 | 1,509 | |||||||||||||||||||||
|
|
|
|
|
|
|
|
|
|
|
|
|
| |||||||||||||||
Balances as of December 31, 2012 | 853,429 | 132,240 | 59,072 | (22,220 | ) | 339,378 | 1,217,138 | 2,579,037 | ||||||||||||||||||||
Profit for the year | — | — | — | — | 239,878 | 214,487 | 454,365 | |||||||||||||||||||||
Other comprehensive income (loss) for the year | (26,874 | ) | 845 | (23,877 | ) | (49,606 | ) | |||||||||||||||||||||
|
|
|
|
|
|
|
|
|
|
|
|
|
| |||||||||||||||
Total comprehensive income (loss) for the year | — | — | (26,874 | ) | 845 | 239,878 | 190,610 | 404,459 | ||||||||||||||||||||
2012 complementary dividend (note 22(c)) | — | — | — | — | (54,394 | ) | (49,980 | ) | (104,374 | ) | ||||||||||||||||||
2013 dividend advances (note 22(c)) | — | — | — | — | (128,109 | ) | (114,661 | ) | (242,770 | ) | ||||||||||||||||||
Approval of legal reserve (note 22(b)) | — | 10,166 | — | — | (10,161 | ) | 5 | 10 | ||||||||||||||||||||
|
|
|
|
|
|
|
|
|
|
|
|
|
| |||||||||||||||
Balances as of December 31, 2013 | 853,429 | 142,406 | 32,198 | (21,375 | ) | 386,592 | 1,243,112 | 2,636,362 | ||||||||||||||||||||
|
|
|
|
|
|
|
|
|
|
|
|
|
| |||||||||||||||
The notes on pages F-204 to F-268 are an integral part of these consolidated financial statements.
F-609
Table of Contents
GENERANDES PERÚ S.A. AND SUBSIDIARIES
Consolidated Statements of Cash Flows
For the years ended December 31, 2013 and 2012
(Stated in thousands of nuevos soles)
2013 | 2012 | |||||||
Cash flows from operating activities: | ||||||||
Cash receipts from customers | 1,712,325 | 1,805,480 | ||||||
Cash payments to suppliers, related parties, workers and tax authority | (997,042 | ) | (1,122,646 | ) | ||||
Other cash payments related to operations activities, net | (180,066 | ) | (218,822 | ) | ||||
|
|
|
| |||||
Net cash from operating activities | 535,217 | 464,012 | ||||||
|
|
|
| |||||
Cash flows from investing activities: | ||||||||
Acquisition of property, plant, and equipment | (54,922 | ) | (68,062 | ) | ||||
Dividends from associate | 23,955 | 1,859 | ||||||
Sale of property, plant, and equipment | — | 2,810 | ||||||
|
|
|
| |||||
Net cash used in investing activities | (30,967 | ) | (63,393 | ) | ||||
|
|
|
| |||||
Cash flows from financing activities: | ||||||||
Increase in financial obligations | 11,080 | 25,790 | ||||||
Dividends paid | (346,724 | ) | (198,232 | ) | ||||
Repayments of financial obligations | (139,645 | ) | (160,468 | ) | ||||
Interest and returns | (41,184 | ) | (46,345 | ) | ||||
Other cash payments related to financing activities, net | (2,977 | ) | (3,284 | ) | ||||
|
|
|
| |||||
Net cash used in financing activities | (519,450 | ) | (382,539 | ) | ||||
|
|
|
| |||||
Net increase in cash and cash equivalents | (15,200 | ) | 18,080 | |||||
Cash and cash equivalents at beginning of year | 188,107 | 170,027 | ||||||
|
|
|
| |||||
Cash and cash equivalents at end of year | 172,907 | 188,107 | ||||||
|
|
|
| |||||
The notes on pages F-204 to F-268 are an integral part of these consolidated financial statements.
F-610
Table of Contents
GENERANDES PERÚ S.A. AND SUBSIDIARIES
Notes to the Consolidated Financial Statements
December 31, 2013, 2012 and 2011 and for each
of the years ended December 31, 2013 and 2012
(1) Reporting Entity
(a) Background
Generandes Perú S.A. (hereinafter “the Company”) is a corporation created in Peru initiating operations in December 1995. Its legal domicile is located at Avenida Víctor Andrés Belaúnde 147, Torre Real Cuatro, San Isidro, Lima, Peru.
The Company is a subsidiary of Endesa Chile S.A. which holds 60.998% of capital stock as of December 31, 2013, 2012 and 2011, a company which in turn is a subsidiary of Endesa S.A. from Spain, which is controlled by Enel, S.p.A. (hereinafter “Enel”) from Italy.
As of December 31, 2013, 2012 and 2011, the Company’s subsidiaries are Edegel S.A.A. and Chinango S.A.C. (hereinafter “the Subsidiaries”), with 54.20% and 43.36% interest, respectively.
(b) Business Activity
The Company is engaged in the electricity generation through its subsidiaries Edegel S.A.A. and Chinango S.A.C.
Edegel S.A.A.
Edegel S.A.A. is mainly engaged in the generation and commercialization of Electrical energy and power to private and public companies. Edegel S.A.A. has five hydroelectric power plants, three of them are located in the basins of the Santa Eulalia and Rimac rivers, approximately 50 km from Lima with effective power of 556.8 MW. It also has two thermoelectric plants, one with effective power of 304.9 MW, located in the Cercado de Lima and another with 485.0 MW located in Ventanilla. Total effective power amounts to 1,346.7 MW.
Chinango S.A.C.
Chinango S.A.C. is engaged in electricity generation, commercialization and transmission activities. For this purpose, it has two hydroelectric power plants (Yanango and Chimay), located in the department of Junín, with an effective generation capacity of 193.5 MW.
As of December 31, 2013, 2012 and 2011, Chinango S.A.C. is a subsidiary of Edegel S.A.A., which holds 80% capital stock.
F-611
Table of Contents
GENERANDES PERÚ S.A. AND SUBSIDIARIES
Notes to the Consolidated Financial Statements
Main data of financial information of the non controlling interest as of December 31, 2013, 2012 and 2011 and for the periods then ended are as follows:
In thousands of S/. | ||||||||||||
2013 | 2012 | 2011 | ||||||||||
Cash and cash equivalents | 80,980 | 88,199 | 66,321 | |||||||||
Current assets | 177,895 | 110,951 | 111,705 | |||||||||
Non current assets | 1,905,177 | 1,928,316 | 1,855,665 | |||||||||
|
|
|
|
|
| |||||||
Total assets | 2,164,052 | 2,127,466 | 2,033,691 | |||||||||
|
|
|
|
|
| |||||||
Current liabilities | 275,029 | 202,277 | 192,915 | |||||||||
Non current liabilities | 645,911 | 708,051 | 694,395 | |||||||||
|
|
|
|
|
| |||||||
Total liabilities | 920,940 | 910,328 | 887,310 | |||||||||
|
|
|
|
|
| |||||||
Equity attributable to non controlling interests | 1,243,112 | 1,217,138 | 1,146,381 | |||||||||
|
|
|
|
|
| |||||||
Operating income | 725,096 | 649,809 | 560,896 | |||||||||
Operating profit | 290,111 | 228,109 | 198,868 | |||||||||
|
|
|
|
|
| |||||||
Net profit attributable to non controlling interests | 214,487 | 184,362 | 145,278 | |||||||||
|
|
|
|
|
| |||||||
(c) Approval of Consolidated Financial Statements
On February 18, 2014, the Chief Financial Officer approved and authorized the issuance of the consolidated financial statements as of December 31, 2013. On February 28, 2013, the Chief Financial Officer approved and authorized the issuance of the consolidated financial statements as of December 31, 2012. On February 29, 2012, the Chief Financial Officer approved and authorized the issuance of the consolidated financial statements as of December 31, 2011.
(2) Operations Regulation and Legal Standards Affecting the Electric Sector Activities
The Company and its Subsidiaries are within the scope of various rules governing their activities. Failure to comply with these rules may result in the imposition of sanctions on the Company and its Subsidiaries, affecting both financially and operationally. Management of the Company and its Subsidiaries monitor and evaluate the standard compliance and any complaints presented. As of December 31, 2012 and 2013, management considers that there are no situations that may need the recording of provisions or disclosures on the consolidated financial statements except for those indicated in note 34 of this report.
Regulatory framework governing the activities of the Company and its Subsidiaries can be summarized as follows:
(a) Electricity Concessions Law
In conformity with the Electricity Concession Law, approved through Decree-Law 25844, the electricity sector is divided into three main subsectors, each one covering a different activity: generation, transmission and distribution of electricity. Under that law and law 28832,Law to Ensure the Efficient Development of the Electric Generation, the operations of Sistema Eléctrico Interconectado Nacional (National Electrical Interconnected System) shall be governed by provisions of Comité de Operación Económica del Sistema Interconectado Nacional (Economical Operation Committee of the National Interconnected System—COES-SINAC, in order to
F-612
Table of Contents
GENERANDES PERÚ S.A. AND SUBSIDIARIES
Notes to the Consolidated Financial Statements
coordinate their operation at minimum cost, guaranteeing the supply of electric energy and the best exploitation of energy resources, as well as the planning of the transmission and management of short-term market. Also, COES-SINAC determines and values the transfers of power and energy between generators.
(b) Law to Ensure the Efficient Development of the Electric Generation
In July 2006, Law 28832,Law to Ensure the Efficient Development of the Electric Generation, was enacted being some of its main objectives to ensure sufficient and efficient generation which will reduce the exposure of the Electrical system to the volatility of prices and the risks of rationing, as well as to adopt necessary measures to foster an effective competition in the generation market.
One of the main innovations introduced by the standard is a mechanism of bids that electricity distribution companies shall apply to enter into electricity supply contracts with generating companies to supply electricity public services and, optionally, in the case of free users. The purpose of such provision is to establish a mechanism to promote the development of investments in new generation capacity through long-term electricity supply contracts and firm prices with distributors.
(c) Supervising Body of Investment in Energy and Mines
Organismo Supervisor de la Inversión en Energía—OSINERGMIN- is the body regulating, supervising and inspecting the activities developed by the entities of the electricity, hydrocarbons and mining sub-sectors, safeguarding quality and efficiency of the service rendered to users, and monitoring compliance with obligations assumed by concessionaires as well as current legal provisions and technical norms, including those related to environment protection and preservation. Also, as part of its standard-setting role, OSINERGMIN may issue related rules and standards of general nature, applicable to entities and users of the sector.
In conformity with Supreme Decree 001-2010-MINAM, OSINERGMIN transferred the environmental supervising, inspecting and sanctioning functions related to hydrocarbons in general and electricity, to the Agency for Environmental Assessment and Inspection—OEFA-, an agency established by Legislative Decree 1013 which approved the Law for the Creation, Organization and Functions of the Ministry of the Environment.
(d) Environmental Protection Regulations
In conformity with Electricity Concessions Law and Law 28611, Environmental Act, the Government shall design and apply policies, norms, instruments, incentives and necessary penalties aimed at preserving appropriate environment and National Cultural Heritage, as well as ensuring the rational use of natural resources in the development of activities related to the generation, transmission and supply of electricity and hydrocarbon activities. In this regard, the Ministry of Energy and Mines approved the Environmental Protection Regulations on Electricity Operations (Supreme Decree 29-94-EM) and theEnvironmental Protection Regulations on Hydrocarbon Activities(Supreme Decree 015-2006-EM).
As of December 31, 2013, 2012 and 2011, the Company’s and its Subsidiaries’ management estimates that in the event of a contingency related to environmental management, it would not significantly affect the consolidated financial statements taken as a whole.
F-613
Table of Contents
GENERANDES PERÚ S.A. AND SUBSIDIARIES
Notes to the Consolidated Financial Statements
(e) Quality Technical Standard of Electricity Services
Supreme Decree 020-97-EM approved Norma Técnica de Calidad de los Servicios Eléctricos-NTCSE (Technical Standard of Electricity Services Quality) which establishes the minimum quality levels of the electricity services, including street lighting, and obligations from electricity sector entities and clients that operate under the Electricity Concessions Law.
NTCSE provides for tolerances and quality indicator measurement procedures that shall be taken into account, requiring their compliance by Electrical companies and establishing the methods for calculation of compensations referred to violations of the indicators, being COES SINAC the body in charge of assigning responsibilities and calculating the compensation as mandated by theLaw to Ensure the Efficient Development of The Electric generation.
Supreme Decree 057-2010-EM, dated September 11, 2010, which amended the NTCSE, established that if as a result of technical research and analysis conducted by the COES SINAC it is determined that the deficiency of quality is strictly due to a lack of capacity transmission system congestion, agents and COES are exempt from payment of compensation.
(f) Anti-monopoly and Anti-oligopoly Law of the Electric Sector
In November 1997, the Anti-monopoly and Anti-oligopoly Law of the Electric Sector, Law 26876, was issued establishing a limit in the participation in electric power generation companies in order to avoid concentrations that would affect competition (vertical integrations over 5% or horizontal concentrations over 15%).
Resolution 012-99/INDECOPI/CLC establishes the conditions to preserve free competition and transparency in the sector that affect the Company and its Subsidiaries. The main aspect is that Edelnor S.A.A. (company related to Endesa Group and client of its Subsidiaries) must tender its purchases of electricity among all generators existing in the system as its contracts expire, and shall pass into public domain the procedures and results of each tender.
(g) System Guaranteeing the Supply of Electric Energy to SEIN
From year 2004, some contracts of energy supply to distributor companies expired without being renewed nor awarded to a new supplier; thus resulting in withdrawals of energy and power carried out by distributor companies to meet the regulated market, being assigned by COES to the SEIN generators based on various criteria over time.
This situation, known in the industry as “withdrawals without contractual support,” created severe distortions in the electricity market, which is why the Government tried different solutions through a series of legal provisions, such as the Emergency Decree 007-2004, Law 28447, Emergency Decree 007-2006, Emergency Decree 036-2006, Law 29179, among other provisions of lower hierarchy.
Meanwhile, as a result of the significant growth in the demand for electricity and natural gas, as from year 2006, several incidents related to the congestion of the electricity transmission system and the natural gas transportation systems were registered.
F-614
Table of Contents
GENERANDES PERÚ S.A. AND SUBSIDIARIES
Notes to the Consolidated Financial Statements
The restrictions on production and transportation of natural gas and electricity transmission are events that result in negative externalities, producing increased operating costs of the electricity system and distorting the marginal costs in the spot market.
In order to avoid distortions of marginal costs, a number of legal provisions were issued to reduce the effects of these events on the electricity market. Thus, the Twelfth Final Supplementary Provision of Law 28832, Emergency Decree 046-2007, Legislative Decree 1041 and its Regulations approved by Supreme Decree 041-2008-EM and Emergency Decree 037-2008, as amended by Emergency Decree 049-2011, provided a series of compensation mechanisms for those variable costs that were not covered by the short-term marginal costs calculated by application of these provisions, depending on whether they are related to natural gas transmission or transportation. However, the criteria used for the allocation of such compensations considered a variety of factors, although they related to aspects of the same nature, which represented a number of risks that hinder the contracting of electricity.
Therefore, in order to avoid problems such as those above described and to establish a treatment regarding withdrawals without contractual support, Emergency Decree 049-2008 was issued establishing a uniform criterion for the treatment of marginal cost in the situations described, as well as a regulation for withdrawals without contractual support, thus annulling any provision establishing a different treatment. This emergency decree became effective for the period January 1, 2009 to December 31, 2011.
Regarding withdrawals without contractual support, the Emergency Decree 049-2008 established that physical withdrawals of power and energy made by electricity distribution companies in SEIN for the Public Electricity Service, without respective contracts supply entered into with generating companies shall be allocated to generators valued at busbar prices proportionally to the net value of the annual efficient firm energy of each generator less its sale of power by contracts. In these cases, the costs incurred by generators to meet those withdrawals, presented due to higher marginal costs in relation to busbar prices are incorporated in the Tariff for connection to Main Transmission System and assumed by the demand; in turn, margins earned by generators from marginal costs lower than busbar prices passes to the demand, whereby the allocated energy without contractual support does not provide a trading margin,i.e. in net terms, generator sells and buys this energy at marginal costs without a contract.
With regard to Short-Term Marginal Costs of SEIN, Emergency Decree 049-2008 established that they are determined considering that there is no restriction of production or transportation of natural gas and electricity transmission. It was also decided that the Short-Term Marginal Costs could not exceed a limit value (S/.313.50/MWh in accordance with Ministerial Resolution 607-2008-MEME/DM). It also indicates that the difference between the variable operating costs incurred by plants operating with variable costs greater than Short-Term Marginal Costs shall be covered through an additional fee on the Tariff for connection to Main Transmission System and assumed by the Demand.
The validity of the Emergency Decree 049-2008 was extended twice; the first time it was extended until December 31, 2013 by Emergency Decree 079-2010 and the second time it was extended until December 31, 2016 by Law 30115 Law of Financial Equilibrium of the Public Sector Budget for the Fiscal Year 2014, published on December 2, 2013.
F-615
Table of Contents
GENERANDES PERÚ S.A. AND SUBSIDIARIES
Notes to the Consolidated Financial Statements
(h) Short-Term Market Regulation
The Short-Term Market Regulation was published in June 2011 by means of Supreme Decree027-2011-EM establishing that this market should become effective on January 1, 2014; however since the MINEM is preparing a proposal for amending this regulation by means of Supreme Decree 032-2012-EM published on August 30, 2012, it was decided to postpone the beginning of the effective date of that market until January 2016, thus suspending all the actions conducted for the approval of the technical procedures of the COES necessary to make the operation effective.
Notwithstanding the foregoing, some of the aspects set by that regulation still in force are:
Agents envisaging to participate in the short-term market must integrate the COES. The Free Users must have equipment for independent, remote and automatic disconnection. Distributors must constitute guarantees and trusteeships and identify Free Users for whom they buy in that market and also be up to date with its payments resulting from operations. Large Users formed by the group of Free Users shall appoint a representative and enter into a joint and several liability agreements.
Short-term market participants allowed to buy are: i) generators, to meet their supply contracts (except for distributed generators and those using renewable resources), ii) distributors, to serve free Users, and iii) Large Users, to meet their own requirements.
In turn, short-term market participants allowed to sell are: i) Generators, up to the amount of capacity that they can generate with their own plants and/or capacity contracted with third parties, ii) Generators using renewable energy resources ruled by Legislative Decree 1002, up to the capacity limit that they can generate with its own power plants, and iii) the Co-generators and Generator-Distributors connected to the SEIN, up to the limit of their energy surpluses not contracted.
Participants buying in the short-term market shall not be exempted from charges for transmission, distribution and other services and / or regulated uses. COES may decide on power cut to Large Users and Free Users for non-compliance with obligations and/or payments, and holders of the connection systems are required to make such cuts. It also states that congestion pricing will be allocated to those affected by congestion.
Transfers shall be made based on actual marginal costs obtained from the real-time operation.
Operating costs for rigidities and complementary services not covered by actual marginal costs will be determined by COES and assumed by the members of the short-term market.
The guarantees given by the supplier shall be easily realizable and enforceable and shall cover all obligations of the Participants.
COES must also establish the criteria for the creation of trusts by participants that purchase, considering that trusts of Distributors shall guarantee the payment of their Free Users.
(i) Energy Security System on Hydrocarbons and Energy and Social Inclusion Fund
Law 29852, published on April 13, 2012 created the Energy Security System on Hydrocarbons (SISE) and Energy and Social Inclusion Fund (FISE), whose regulation was established by Supreme Decree021-012-EM published on June 9, of the same year.
F-616
Table of Contents
GENERANDES PERÚ S.A. AND SUBSIDIARIES
Notes to the Consolidated Financial Statements
SISE should be composed of a network of pipelines and storage facilities considered as strategic by the Government for ensuring the nationwide fuel supply, which will be paid by a charge to pipeline transportation of liquid products derived from hydrocarbons and natural gas. FISE shall be used to widespread the use of natural gas for residences and vehicles in vulnerable sectors and to compensate the development of new energy supplies in energy frontier, and for social compensation and promotion of access to LPG in vulnerable urban and rural communities. This fund is funded by free electricity users, through a surcharge on pipeline transportation of liquid products derived from liquid hydrocarbons and natural gas liquids, and through a surcharge on the monthly billing of users of the service of natural gas transport through pipelines.
(j) Temporary Measures Associated with Remuneration for Power
By Supreme Decree 032-2012 -EM, published on August 30, 2012, the Ministry of Energy and Mines established transitory provisions related to the remuneration for Firm Power from thermoelectric units.
It was established that a natural gas power plant guarantees the transportation of natural gas when the contracted firm capacity allows operating at effective power during peak hours. This modification allows the thermoelectric units with firm transportation capacity of gas power to operate effectively during peak hours (even though they do not have the carrying capacity that allows them to operate 24 hours a day at effective power) to participate with such power and its variable cost of natural gas in preparing the ranking of variable costs used to determine the power units that pay for power by participating in the coverage of high demand and reservation of system.
This provision is temporary and will be in force while the gas transport concessionaire, Transportadora del Gas del Perú S.A. (TGP), does not have the carrying capacity set forth in the Addendum to the BOOT contract (Build , Operate, Own, Transfer) signed with the Peruvian State.
(k) Exchange of Information in Real Time for SEIN Operation
On November 27, 2012, the Ministry of Energy and Mines issued Resolution 243-2012-EM/DGE approving the adoption of a new Technical Standard for the Exchange of Information in Real Time for the SEIN operation, which replaced the previously existing rule, approved by Directorial Resolution 055-2007-EM/DGE dated December 3, 2007.
The approved standard adopted a new stratification of information of signals and states of the power system submitted in real time to the System Coordinator, based on the voltage level criterion, to weigh the information that is most relevant for the coordination of SEIN operation in real time.
Concerning the requirements of availability of signals rates, the application phases were redefined. A first stage was approved with a minimum availability of 75%, which will be valid until May 27, 2014, a second stage with a minimum availability of 90% for a period of 1 year from the completion of the first stage; and a third stage, called the “target stage” with an availability of 96% in some cases and 98% in the case of signals considered as high priority, which correspond to premises with voltage levels greater than or equal to 100 kV and power plants greater than or equal to 50 MW.
Ministry of Energy and Mines through Directorial Resolution 444-2013-EM-DGE, published on October 31, 2013 modified Directorial Resolution 243-2012-EM-DGE, establishing that the COES must retransmit in real-time to OSINERGMIN and the General Electricity Agency of the Ministry of Energy and Mines, the information exchanged through the communication network between the control centers of the members of SEIN and the control center of COES.
F-617
Table of Contents
GENERANDES PERÚ S.A. AND SUBSIDIARIES
Notes to the Consolidated Financial Statements
(l) Mass Use of Natural Gas
On December 22, 2012, Law 29969Law dictating regulations to promote the mass use of natural gas was published. This Law established that OSINERGMIN shall transfer S/. 200 million to FISE; it empowered state electricity distribution companies to implement programs for mass use of natural gas, including the distribution of natural gas in their concession areas. The Ministry of Energy and Mines, in a maximum period of 3 years after the start of the distribution of gas, shall begin the process of promoting private investment for awarding the gas distribution concession. Local and regional governments were also authorized to transfer the resources arising from royalties to the state electricity distribution companies.
Modification was also made on the Law Creating the SISE and FISE, which established that the charge levied by the carrier of natural gas from the electricity generator, must be compensated by the demand through an additional charge included in the toll of the main transmission Electrical system. It also said that the mass use of natural gas for residences and vehicles shall mainly focus on poor population and regions that do not have royalties.
Supreme Decree 014-2013 -EM, published on May 25, modified the regulations on Law for Promotion of Natural Gas Industry (Law 27133) approved by Supreme Decree 040-99 -EM. This supreme decree modified several articles of said regulations. It also proposes the development of pipeline branches along the main transport network whose construction, operation and maintenance will be provided by the Transport Concessionaire in order to promote the mass use of natural gas delivering this hydrocarbon to new areas of natural gas distribution (cities surrounding the path of the Main Network).
Since the current regulations on Law for Promotion of Natural Gas do not require the transport concessionaire to invest in such infrastructure, it is necessary to enter into an Addendum between the Government (grantor) and the Transport Concessionaires including a Main Network scheme, to include in their transport systems the indicated branches, called Main Referrals.
The annuity of the Operation and Maintenance of the said branches shall be determined according to the efficient costs as determined by OSINERGMIN taking into account the economic and financial information of the concessionaire, using in the same way the discount rate of the concession agreement.
Yearly income to be received by the holder of the Main Bypass will consist of: 1) contributions from Independent Consumers served by the main take-off pipelines (whose tariff will be calculated with the maximum carrying capacity of the take-off pipeline), and 2) the contributions of the National User/Consumer of the Main Network who pays regulated tariffs affected by a Tariff Application Factor (FAT) as defined by OSINERGMIN, which may not exceed of 1.2.
(m) Energy Security and Development of the Southern Petrochemical Complex
On December 22, 2012, Law 29970 Law that Strengthens the Energy Security and Promotes the Development of the Southern Petrochemical Complex was published. This Law declared of national interest the implementation of measures for strengthening the energy security, obtaining and transporting ethane in the south of the country, and the construction of regional pipelines in the regions of Huancavelica, Junín and Ayacucho, from the existing pipeline. Also by means of this Law, complementary provisions were enacted to streamline and simplify the administrative procedures related to obtaining permits and authorizations.
F-618
Table of Contents
GENERANDES PERÚ S.A. AND SUBSIDIARIES
Notes to the Consolidated Financial Statements
Regarding the strengthening of energy security:
The companies responsible for implementing the projects of natural gas and natural gas liquids supply would be benefited from the Guaranteed Income mechanism provided that there is an improvement in the energy security of the electricity sector, being necessary to grant such projects through concession agreements arising from investment promotion processes.
A number of necessary projects were established to increase energy security, provided they operate together and in parallel with the transport system of gas and/or liquids currently existing in Camisea, among which we can mention:
| • | A gas pipeline and liquids pipeline from Camisea to Chiquintirca Compression Station, except for the section that under contractual obligation corresponds to the existing concessionaire. |
| • | A gas pipeline and/or liquids pipeline from the existing system to Anta, Cusco which shall be able to supply natural gas to the future Quillabamba Power Plant and to the south coast of Peru. |
| • | A regasification plant and premises for import of liquefied natural gas located in Pampa Melchorita. |
The portion non recovered with the tariff income of the concessionaire may be covered as per the mentioned Guaranteed Income mechanism or as established by Law 29852Energy Security System on Hydrocarbons and Energy and Social Inclusion Fund as the Ministry of Energy and Mines may establish.
ELECTROPERÚ will participate in the development of the Southern Petrochemical Complex project by supplying natural gas and contracting gas carrying capacity from Anta to the south coast of Peru for the operations of said Energy Complex and the Petrochemical Complex in southern Peru.
Users will assume as an additional charge in the toll of the main transmission system: i) compensations related to natural gas costs that foster the installation of power generation in the north and south of Peru, and ii) the contracting of gas firm transport not covered by existing generators, in order to make feasible the development of the South Nodal Energy.
Regarding the development of the Petrochemical Complex the following is established:
| • | Ethane can be obtained through: i) negotiation with Contractors of blocks exploiting or that will exploit natural gas; or ii) the extraction of ethane from natural gas purchased by customers. |
| • | PETROPERU will participate in the development of the Petrochemical Complex and its participation will be established by the Ministry of Energy and Mines. |
| • | The Ministry of Energy and Mines will make a capital increase in Petroperu for up to US$ 400 million which has a temporary character for up to a maximum of 15 years. |
Through Supreme Decree 038-2013-EM, published on October 17, 2013, the Ministry of Energy and Mines approved a regulation that promotes the growth of electricity generation within the framework of Law 29970; among other considerations, it was established that the Ministry of Energy and Mines, by means of Ministerial Resolution, will approve, every two years, at the request of COES and view of OSINERGMIN, the requirement of capacity, location and terms of commercial operation that shall be bid, necessary to strengthen the energy security.
F-619
Table of Contents
GENERANDES PERÚ S.A. AND SUBSIDIARIES
Notes to the Consolidated Financial Statements
(n) Mechanism for Natural Gas Disruption Emergency Response
By means of Supreme Decree 050-2012-EM, published on December 31, 2012, a mechanism was established for dealing with emergencies that endanger the continuity of natural gas supply which will be activated in emergency situations that are beyond the control of the producer and/or concessionaire of transport and/or distribution and that may fully or partially affect the natural gas and/or liquids of natural gas activities.
| • | It is established that in such situations the available natural gas will be used solely for the domestic market, following an order of priority, being the electric generators ranked in fourth place of priority, after regulated residential and commercial customers and transport users. |
| • | An automatic statement of Exceptional Situation is established in the SEIN. |
| • | Payment of compensation for deficiencies in product quality and power supply is exempted. |
| • | Permission is granted to those who are required to maintain stocks of liquid fuels, for using them. |
(o) The Energy Policy and Plan for Universal Access to Energy
In order to have a reliable, efficient, and self-sufficient energy supply, with reasonable prices, minimal environmental impact, and little exposure to increased volatility in prices for fossil fuels, the Peruvian government considered it necessary to establish a state policy in the energy field so that the energy requirement that accompanies all economic growth can be guaranteed in the medium- and long-term.
Accordingly, Supreme Decree 064-2010-EM, published on November 24, 2010, approved the Peru’s National energy policy for the period 2010-2040 which sets 9 energy policy objectives and their respective guidelines, which consist of:
| (i) | Diversification of the energy matrix with emphasis on renewable sources and energy efficiency. This policy establishes the need to promote projects and investments to diversify energy matrix through renewable conventional and non-conventional sources, hydrocarbons, geothermal and nuclear sources; it also establishes the promotion of the use of distributed generation and prioritize the construction of hydroelectric plants. |
| (ii) | Competitive energy supply. It establishes the need to have the necessary infrastructure throughout the electricity and hydrocarbons supply chain to ensure energy supply; it also establishes a regulatory framework that promotes competition, minimizes the market concentration and promotes pricing transparency, and regulates access and rates when it is not possible to establish competition mechanisms. Other guidelines of this objective are to develop mechanisms to limit the impact of volatility of world market prices, and to promote private investment; the State performing its subsidiary role. |
| (iii) | The universal access to energy supply; this objective seeks to achieve total coverage of electricity and hydrocarbons supply, temporarily subsidizing it for low-income populations. Also it establishes that local communities shall be involved in rural electrification projects, fostering the productive use of energy in remote, rural and marginal urban areas. Transport systems necessary for the service to reach all locations should also be prioritized. |
F-620
Table of Contents
GENERANDES PERÚ S.A. AND SUBSIDIARIES
Notes to the Consolidated Financial Statements
| (iv) | The efficiency in the production and consumption of energy; to achieve this goal it is necessary to encourage the efficient use of energy to obtain measurable results, being necessary to involve energy companies and users in energy efficiency programs through promoters and incentive mechanisms. It also addresses the need to use smart technology systems to ensure appropriate management of the supply and demand of energy and the creation of the energy-efficiency center to be a decentralized organization that promotes the efficient use of energy. |
| (v) | Self-sufficiency in energy production; it proposes the promotion of the production of electricity based on available energy resources in the regions and fostering exploration and exploitation of these resources. It also shall promote investments to implement, upgrade and expand the country’s refineries in order to meet domestic demand. On the other hand, it also considers maintaining supply procurement processes to achieve beforehand the adequacy of power generation. It also establishes the rational use of energy resources to ensure their availability. |
| (vi) | The energy sector development with minimal environmental impact; this objective foster the development and use of clean energy and technology with low emissions of pollutants as well as the establishment of mitigating mechanisms for emissions from energy activities. It aims at promoting energy projects that can get the benefits from the sale of certified emission reductions for the carbon market; it seeks to achieve a harmony between the state, communities and businesses. |
| (vii) | The development of industry and use of natural gas; it proposes to promote the substitution of oil-derived fuels for the use of natural gas and liquefied petroleum gas - LPG-in the industry and transportation, mass use of natural gas through decentralized distribution systems. It also considers fostering the development of the petrochemical industry and promoting the development of a polyduct network and strengthening the system of hydrocarbons transport and storage according to the country’s growth. |
| (viii) | Institutional strengthening and transparency in the sector; it establishes the need to act and promote transparency in the activities of the sector and to ensure legal stability that allows to boost energy development in the long term. It also considers the promotion of research, development and technological innovation in the energy sector, among other points. |
| (ix) | Regional energy integration with a long-term vision; establishes the need to continuously identify the benefits of energy integration, entering into agreements leading gradually to market integration. |
Through Ministerial Resolution 203-2013-MEM/DM, published on May 28, 2013, the Ministry of Energy and Mines approved the Plan for Universal Access to Energy 2013-2022. It identifies two key priorities in the global energy sector:
| (i) | Universal access to energy, which defines 100% access to basic human needs by year 2030 and is based on two objectives: |
| • | 100% access to basic human needs by year 2030, 100% access to electricity: lighting, communication, and community services. |
| • | 100% access to technologies and fuels for cooking and heating: improved stoves, natural gas, LPG, and biogas. |
F-621
Table of Contents
GENERANDES PERÚ S.A. AND SUBSIDIARIES
Notes to the Consolidated Financial Statements
| (ii) | Improving energy efficiency. |
Access to energy is considered one of the pillars in the fight against poverty.
The objective of this plan is to promote, from the energy field, an efficient, environment-sustainable and fairly economic development, implementing projects that allow universal access to electricity supply, prioritizing the use of available power sources, with the objective to generate more and better quality of life for low-income populations.
Resources to implement the Plan for Universal Access to Energy will be: The Social Inclusion Energy Fund transfers to the public sector, external funding sources, contributions, allowances, grants, resources through agreements, and resources considered in the National Plan of Rural Electrification 2013-2022.
(p) Regulatory Contribution
As a consequence of the transfer of the environmental supervising, inspecting and sanctioning functions of OSINERGMIN to the Agency for Environmental Assessment and Inspection –OEFA- through Supreme Decree 127-2013-PCM and 129-2013-PCM, published on December 19, 2013, new regulatory contributions from energy entities and companies (Electricity and hydrocarbons) to OSINERGMIN and OEFA were established.
These contributions are obtained as a result of applying the percentages established to the monthly billing, corresponding to transactions with third parties directly related to the controlled, regulated and monitored activity, deducting the sales tax and Municipal Promotion Tax.
(3) Basis for the Preparation of Consolidated Financial Statements
(a) Statement of Compliance
These consolidated financial statements have been prepared in accordance with International Financial Reporting Standards (IFRSs) issued by the International Accounting Standards Board (IASB).
(b) Information Responsibility
The information contained in these consolidated financial statements is the responsibility of the Company’s Management which expressly states that all the principles and criteria included in the IFRSs issued by the IASB have been applied.
(c) Basis of Measurement
The consolidated financial statements have been prepared on the historical cost basis, except for the derivative financial instruments which are measured at fair value.
(d) Functional and Presentation Currency
The consolidated financial statements are presented in nuevos soles (S/.) which is the Company’s and its Subsidiaries’ functional and presentation currency.
F-622
Table of Contents
GENERANDES PERÚ S.A. AND SUBSIDIARIES
Notes to the Consolidated Financial Statements
(e) Significant Accounting Estimates and Use of Judgments
The preparation of the consolidated financial statements in conformity with IFRS requires the Company’s and Subsidiaries’ management to make judgments, estimates and assumptions that affect the application of accounting policies and the reported amounts of assets and liabilities, income and expense. Actual results may differ from these estimates.
Estimates and underlying assumptions are reviewed on an ongoing basis. Revisions to accounting estimates are recognized in the period in which the estimates are revised and in any future periods affected.
Resulting accounting estimates, very rarely will be the same as the respective actual results. However, in management’s opinion, actual results will not vary significantly from estimates and assumptions applied by the Company and its Subsidiaries. The main accounting estimates made by management are the following:
| • | Useful life of property, plant and equipment, and intangible assets (see notes 4i and 4m). |
| • | Impairment of property, plant and equipment (see note 4k). |
| • | The assumptions used to calculate the actuarial liabilities and obligations to employees, such as discount rates, mortality tables, salary increases, and others. |
| • | The assumptions used to calculate the fair value of financial instruments (see notes 4d and 4e). |
| • | Energy supplied to customers whose meter readings are pending. |
| • | Certain assumptions inherent in the electricity system affecting transactions with other companies, such as production, customer billings, energy consumption, etc. that allow for estimating electricity system settlements that must occur on the corresponding final settlement dates, but that are pending as of the date of issuance of the consolidated financial statements and could affect the balances of assets, liabilities, income and expenses recorded in the statements. |
| • | Likelihood of occurrence and the amount of liabilities of uncertain amount or contingent (see note 34). |
| • | Future disbursements for the closure of facilities and restoration of land (see note 4l). |
Management has exercised its critical judgment when applying accounting policies for the preparation of these consolidated financial statements, as explained in the corresponding accounting policies.
(f) Consolidated Financial Statements
These consolidated financial statements comprise Generandes Perú S.A. and its subsidiaries Edegel S.A.A. and Chinango S.A.C. as mentioned in note 1.
(i) Subsidiaries
Subsidiaries are entities controlled by Generandes Perú S.A. The Company controls an entity when it is exposed to, or has rights to, variable returns from its involvement with the entity and has the ability to affect those returns through its power over the entity. The financial statements of subsidiaries are included in the consolidated financial statements from the date on which control commences until the date on which control ceases.
F-623
Table of Contents
GENERANDES PERÚ S.A. AND SUBSIDIARIES
Notes to the Consolidated Financial Statements
Transactions, balances and unrealized gains with the entities that the Company controls are eliminated. Also, unrealized losses are eliminated unless the transaction provides evidence of impairment in the value of the transferred assets.
(ii) Non-controlling Interests
Interests from third parties that are not part of the Company are shown as non-controlling interests under the equity in the consolidated statement of financial position and in the consolidated statement of income.
Non-controlling interests are measured at their proportionate share of the subsidiaries net assets.
(4) Significant Accounting Policies
Main accounting principles applied in the preparation of consolidated financial statements are detailed below. These principles and practices have been applied consistently to all years presented in these financial statements.
(a) Cash and Cash Equivalents
Cash and cash equivalents comprise cash on hand, demand deposits in banks, and other short-term highly liquid investments that are readily convertible to know amount of cash and which are subject to an insignificant risk of changes in value.
(b) Trade Accounts Receivable
Trade accounts receivable arises from sale of energy and power, which are billed in the month following dispatch of energy, recording dispatch of energy, and the estimated amount of unbilled energy provided in the month.
Trade accounts receivable are classified as Loans and Accounts receivable (see (g))
(c) Inventories
Inventories are valued at the lower of cost or net realizable value. Cost is determined using the weight average method, except for materials in transit which is determined by using the specific cost method. The net realizable value takes into consideration the periodic technical studies on inventory obsolescence prepared by Management.
The estimate of inventory obsolescence is determined based on periodic technical studies on inventory obsolescence prepared by Management. This estimate is charged to the results of the fiscal period in which such deductions occur.
(d) Non-Derivative Financial Instruments
Non-derivative financial instrument is any contract that gives rise to both a financial asset in one entity and a financial liability, or equity instrument in another. In the case of the Company and its Subsidiaries, non-derivative financial instruments correspond to primary instruments such as accounts receivable and accounts payable.
F-624
Table of Contents
GENERANDES PERÚ S.A. AND SUBSIDIARIES
Notes to the Consolidated Financial Statements
Non-derivative financial instruments are classified as asset, liability, or equity according to the contract that gave rise to the financial instrument.
The interest, dividends, gains, and losses generated by a financial instrument, and classified as liability, are recorded as income or expense in the statement of income. The payment to holders of financial instruments classified as equity is recorded directly against equity. The financial instruments are offsetted when the Company and its Subsidiaries have the legal right to offset them, and management has the intention of paying them on a net basis or negotiating the asset, and paying the liability simultaneously.
Non-derivative financial instruments are recognized in the financial statements at fair value. Fair value is the price that would be received to sell an asset or paid to transfer a liability in an orderly transaction between market participants at the measurement date.
In management’s opinion, the carrying amount of non-derivative financial instruments as of December 31, 2013, 2012 and 2011 are substantially similar to their fair values due to their short periods of realization and/or maturity or are subject to variable and fixed interest rate similar to those used in the market.
(e) Non Derivative Hedging Instruments
If there is a strong correlation between income and changes in the exchange rate of the US dollar, the Company will be subject to a currency risk for its future cash flows. IAS 39 allows the hedging of this income by obtaining funding in this currency. Exchange differences on this debt, being hedging cash flows, are recognized net of tax effect, in a reserve account in equity and recorded in the income statement in the period in which hedged cash flows will be realized. This period has been estimated at ten years.
(f) Derivative Financial Instruments and Hedge Accounting
Derivative instruments are recorded in conformity with IAS 39 Financial Instruments: Recognition and Measurement.
Financial derivative contracts for which the Company and its Subsidiaries have established a cash flow hedging relationship are recorded as assets or liabilities in the statement of financial position and presented at their fair value.
When a derivative is designated as a cash flow hedging instrument, the effective portion of changes in the fair value of the derivative is recognized in the separate statement of comprehensive income and is presented in hedge reserves’. Any ineffective portion of changes in the fair value of the derivative is recognized immediately in profit or loss.
(g) Financial Assets
The Company and its Subsidiaries classify their financial assets in the following categories: i) financial assets at fair value through profit or loss, ii) loans and accounts receivable, iii) held-to-maturity financial assets, and iv) available-for-sale financial assets. Management determines the classification of their financial assets as of the date of their initial recognition.
Financial Assets Valued at Fair Value through Profit or Loss
A financial asset is classified in this category if it was mainly acquired in order to be sold in the short-term or if it is so designated by Management. Derivative financial instruments are also classified as marketable unless they are designated as hedges. The Company and its Subsidiaries did not hold financial assets under this category.
F-625
Table of Contents
GENERANDES PERÚ S.A. AND SUBSIDIARIES
Notes to the Consolidated Financial Statements
Loans and Accounts Receivable
Loans and accounts receivable are non-derivative financial assets with fixed or determinable payments that are not quoted in an active market. They arise when the Company and its Subsidiaries provide with money, goods or services directly to a debtor, with no intention to trading the account receivable. Loans and accounts receivable are included in trade accounts receivable and other accounts receivable in the statement of financial position (notes 7, 8 and 9).
Loans and accounts receivable are initially recognized on the trade date.
The Company and its subsidiaries derecognizes a financial asset when the contractual rights to the cash flows from the asset expire, or it transfers the rights to receive the contractual cash flows in a transaction in which substantially all the risks and rewards of ownership of the financial asset are transferred, or it neither transfers nor retains substantially all of the risks and rewards of ownership and does not retain control over the transferred asset. Any interest in such derecognized financial assets that is created or retained by the Company and its subsidiaries is recognized as a separate asset or liability.
These assets are initially recognized at fair value plus any directly attributable transaction costs. Subsequent to initial recognition, they are measures at amortized cost using the effective interest method.
These assets are assessed at each reporting date to determine whether there is objective evidence of impairment.
The Management considers evidence of impairment at individual asset level.
Held-to-maturity financial assets
Held-to-maturity investments are non-derivative financial assets with fixed or determinable payments and fixed maturities acquired with the intention and ability to hold them to maturity. As of December 31, 2013, 2012 and 2011, the Company and its Subsidiaries do not hold financial assets under this category.
Available-for-sale financial assets
Available-for-sale financial assets are non-derivative financial assets designated in this category or that do not classify in any of the other categories. These assets are shown as non-current assets unless Management has expressed intention to sell the investment within 12 months after the date of the statement of financial position. As of December 31, 2013, 2012 and 2011, the Company and its Subsidiaries did not hold financial assets under this category.
(h) Investments in Associate
Associates are those entities in which the Company and its Subsidiaries have significant influence, but not control; as in the case of the investment that the Subsidiary Edegel S.A.A. has in Endesa Brasil S.A. which is part of the Endesa group.
Edegel S.A.A. records its investments in Endesa Brasil S.A. under the equity method, recognizing changes in the results and the equity of the associate, on a proportion basis.
F-626
Table of Contents
GENERANDES PERÚ S.A. AND SUBSIDIARIES
Notes to the Consolidated Financial Statements
Also, because the functional currency of the associate is different from Edegel S.A.A.’s, the effect of translating the balances into Peruvian nuevos soles as presentation currency is recognized,i.e., balances of the statement of financial position are translated at the closing exchange rates of each year and the results at average exchange rate; recording any difference under the ‘other reserves’ in the equity. Dividends received from the associate are recorded as a decrease in the investment value.
(i) Property, Plant, and Equipment
Property, plant and equipment are measured at cost, less accumulated depreciation and any accumulated impairment losses.
This caption also includes assets acquired under finance lease and spare parts to be used in major inspections of power plants. When the assets are sold or disposed of the cost and accumulated depreciation are eliminated, and any gain or loss resulting from their disposal is included in the consolidated statement of income.
The initial cost of property, plant, and equipment comprises their purchase price, including non-reimbursable customs fees and purchase taxes as well as any other directly attributable cost of bringing the asset to its working condition and for its intended use, and the estimate of the initial decommissioning costs. Cost incurred after fixed assets starts operating are recognized as assets provided that: (i) it is probable that future economic benefits embodied within the asset will flow to the Company, and (ii) the cost of the asset can be measured reliably. Routine repairs and maintenance of plant and equipment are charged to the statement of income in the period in which they are incurred.
Assets under construction are capitalized as a separate component. Upon completion, the cost of these assets is transferred to a definitive category. Work-in-progress is not depreciated.
Land is not depreciated. Depreciation is calculated to write off the cost of items of property, plant and equipment less their estimated residual values, using the straight-line method.
Years | ||||
Buildings and other constructions | 45 | |||
Plant and equipment | 18 | |||
Furniture and fixtures | 9 | |||
Various equipment | 7 | |||
Vehicles | 5 | |||
Residual value, useful life and depreciation methods are periodically reviewed and adjusted by management according to the forecasted economic benefits to be provided by the components of property, plant, and equipment.
(j) Finance Lease
Assets held by the Company and its subsidiaries under finance leases are measured initially at an amount equal to the lower of their fair value and the present value of the minimum lease payments
Finance lease generates asset depreciation expenses and debt financing costs in each accounting period. The depreciation policy for assets held under finance leases is consistent with that for other assets of property, plant and equipment of the Company and its Subsidiaries.
F-627
Table of Contents
GENERANDES PERÚ S.A. AND SUBSIDIARIES
Notes to the Consolidated Financial Statements
(k) Impairment of Long Lived Assets
Throughout the year, and especially at year-end close, the Company and its Subsidiaries review whether there is any indication of impairment. If any such indication exists, then the asset’s recoverable amount is estimated. In the cases of identifiable assets that do not generate cash flows independently, estimation is made on the recoverability of the cash-generating unit to which the asset belongs, understanding as such the smallest identifiable group of assets that generates independent cash inflows.
The recoverable amount of an asset is the greater of its fair value less costs to sell and value in use, this being understood as the present value of estimated future cash flows.
To estimate the value in use, the Company and its Subsidiaries prepare future cash flow projections based on most recent budget available. These budgets include the best estimates of Management on revenues and costs of the cash-generating units based on industry projections, past experience and future expectations.
These projections cover the next five years, estimating cash flows for the following years by applying growth rates of 3.6% which does not exceed the average long-term growth rate for the sector and for the country.
These flows are discounted to calculate their present value at a rate that reflects the capital cost of the business and the geographical area in which it operates. For its calculation, it takes into account the current cost of money and the risk premiums generally used by analysts for the business and geographic area. The discount rate applied at 2013 year-end was 8.0%.
The assumptions used to determine the value in use as of December 31, 2013 do not present major changes compared to those as of December 31, 2012 and December 31, 2011.
When there is an indication that the impairment loss no longer exists or has decreased, the reversal of losses is recorded in the statement of income.
(l) Provision for Decommissioning of Power Plants
Liabilities for decommissioning are recognized when the Company and its Subsidiaries are required to dismantle and remove facilities to restore the site where the plants are located, and when a reliable estimate can be made of the amount of the obligation. Removal costs are recorded at the present value of estimated future expenditure determined in accordance with local requirements and conditions, which are periodically reviewed, including the discount rate used to calculate the present value. Initially, the amount of fixed assets is recognized by an amount equivalent to the provision. Subsequently, this amount will be depreciated as well as the items of fixed assets. All changes in the liability, other than changes resulting from the unwinding of the discount, which are recorded in profit or loss, are added to or deducted from the cost of the related asset in the current period.
(m) Intangible Assets
Intangible assets are recognized initially at cost. An intangible asset is recognized if it is identifiable and the Company and its subsidiaries has the power to obtain the future economic benefits flowing from the underlying resource and to restrict the access of others to those benefits. After initial recognition, intangible assets are accounted for at cost less accumulated amortization and any accumulated impairment losses. These assets are amortized using the straight-line method based on their estimated useful life.
F-628
Table of Contents
GENERANDES PERÚ S.A. AND SUBSIDIARIES
Notes to the Consolidated Financial Statements
The Company’s main intangible assets comprise a right to use water from Lake Huascacocha, which is registered as concessions and rights.
Useful life and amortization method are periodically reviewed by management according to the estimated economic benefits to be provided by the components of intangible assets.
Amortization is calculated using the straight-line method based on the estimated useful lives of the asset
Years | ||
Concessions and rights | 25 - 30 | |
Software | 3 - 21 |
(n) Financial Liabilities
Financial liabilities are initially recognized at their fair value, net of incurred transaction costs. These liabilities are subsequently recorded at their amortized cost, and any resulting difference between the funds received (net of transaction costs) and the redemption value is recognized in the consolidated statement of income over the obligation using the effective interest method.
Financial liabilities are classified as current liability unless the Company and its Subsidiaries have the unconditional right to differ settlement of the liability for at least twelve months after the consolidated statement of financial position.
(o) Income tax
Income tax expense comprises current and deferred tax. It is recognized in profit or loss except to the items recognized directly in equity or in other comprehensive income.
Current tax –
Current tax comprises the expected tax payable or receivable on the taxable income or loss for the year and any adjustment to tax payable or receivable in respect of previous years. It is measured using tax rates enacted or substantively enacted at the reporting date.
Deferred tax –
Deferred tax is recognized in respect of temporary differences between the carrying amounts of assets and liabilities for financial reporting purposes and the amounts used for taxation purposes.
Deferred income tax asset and liability are recognized without considering the estimated time when the temporary differences will disappear. Income tax asset is only recognized so far as it is probable that there will be future tax benefits, so that the asset can be used.
Deferred tax is measured at the tax rates that are expected to be applied to temporary differences when they reverse, using tax rates enacted or substantively enacted at the reporting date.
Deferred tax assets and liabilities are offset if there is a legally enforceable right to offset current tax liabilities and assets, and they relate to taxes levied by the same tax authority on the same taxable entity, or on different tax entities, but they intend to settle current tax liabilities and assets on a net basis or their tax assets and liabilities will be realized simultaneously.
F-629
Table of Contents
GENERANDES PERÚ S.A. AND SUBSIDIARIES
Notes to the Consolidated Financial Statements
(p) Workers’ Profit Sharing
Workers’ profit sharing is determined using the same criteria used to determine the current income tax. Workers’ profit sharing rate applicable to the Subsidiary Edegel S.A.A is 5%.
(q) Provisions
Provisions are recognized when the Company and its Subsidiaries have a present obligation (legal or constructive), as a result of past events, and when it is probable that an outflow of resources will be required to settle the obligation, and it is possible to reliably estimate its amount. When the Company and Subsidiaries estimate that a provision, or a part of it, is reimbursable, the reimbursement is recognized only when such reimbursement is virtually certain.
Provisions are reviewed and adjusted in each period to reflect the best estimates at the reporting date of the statement of financial position.
When the effect of the time value of money is material, the value of the provision is the present value of the expenditure required to settle the obligation.
(r) Contingent Liabilities and Assets
Contingent liabilities are not recognized in the financial statements. They are disclosed in notes to financial statements unless the possibility of an outflow of economic resources is remote. In this case, they are not disclosed in the notes.
Contingent assets are not recognized in financial statements, and they are only disclosed in notes when an inflow of economic benefits is probable.
(s) Revenue, Cost and Expense Recognition
Revenue is recognized as far as it is probable that future economic benefits will flow to the Company and its Subsidiaries.
Sales of energy and power fees are computed based on cyclical readings and are completely recognized in the period when service is rendered. Revenues from the sale of energy delivered but not invoiced between the last cyclical reading and the end of each month is computed based on estimates of energy consumed by users of the service during the deferred period.
Acquisition costs of fuel, energy and tolls are recognized when accrued.
Expenses are recognized on an accrual basis and are recorded in the periods to which they relate.
(t) Finance Income
Interest income is recognized using the effective interest method.
(u) Finance Costs
Interest expense is recognized using the effective interest method. Other financial costs are recognized when incurred. Costs are capitalized if directly attributable to the acquisition or construction of a qualifying asset.
F-630
Table of Contents
GENERANDES PERÚ S.A. AND SUBSIDIARIES
Notes to the Consolidated Financial Statements
Capitalization of finance costs begins when activities to prepare the asset are being carried out and expenses and costs for the loans are being incurred. Capitalization of interest is made until assets are ready for their intended use. If the resulting value of asset exceeds its recoverable amount, it shall be recorded as an impairment loss.
Finance costs comprise interest expense and other costs incurred related to borrowings, translation effect arising from borrowings in foreign currency used to finance projects, since they correspond to an adjustment of interest costs.
(v) Net Earnings per Share
Basic and diluted earnings per share are determined by dividing the net earnings attributable to controlling interests by the weighted-average number of outstanding subscribed and paid-in ordinary shares during the period (note 31).
Diluted earnings per share correspond to the basic earnings per share, adjusted for the effects of all dilutive potential ordinary shares. As of December 31, 2013, 2012 and 2011, the Company and its Subsidiaries do not have financial instruments with dilutive effects; therefore, basic and diluted earnings per share are the same.
(w) Transactions and Balances denominated in Foreign Currency
Foreign currency denominated transactions are those transactions carried out in a currency other than the functional currency. Foreign currency transactions are translated into functional currency at exchange rates at the dates of the transactions.
The subsidiaries have established a hedging policy for the portion of revenues that are directly linked to the performance of the U.S. dollar, by obtaining funding in this currency. Translation effect on this debt, as being hedging cash flows, are recognized net of tax effect, in a reserve account in equity and recorded in the statement of income in the period in which hedged cash flows will be realized. This period has been estimated at ten years.
(x) Classification of Balances as Current and Non-Current
The statement of financial position presents balances classified according to their maturity,i.e., as current in the case of those balances with maturities of twelve months or less, and non-current in the case of those balances with maturities of more than twelve months.
For obligations with maturities of less than twelve months, but whose long-term refinancing is assured at the Company’s and its Subsidiaries’ discretion through unconditionally available long-term loan agreements, are classified as long-term liabilities.
(y) Fair Value Hierarchy
When measuring the fair value of an asset or a liability, the Company and its subsidiaries use market observable data as far as possible. Fair values are categorized into different levels in a fair value hierarchy based on the inputs used in the valuation techniques as follows:
Level 1: Quoted prices (unadjusted) in active markets for identical assets and liabilities
F-631
Table of Contents
GENERANDES PERÚ S.A. AND SUBSIDIARIES
Notes to the Consolidated Financial Statements
Level 2: Inputs other than quoted prices included within Level 1 that are observable for the asset or liability, either directly or indirectly.
Level 3: Inputs for the asset or liability that are not based on observable market data.
(z) Reclassifications
Certain figures of the 2012 and 2011 consolidated financial statements have been reclassified to make them comparable to those of 2013. The nature of the reclassifications, reclassified amounts and affected accounts are summarized as follows:
2012 | In thousands of S/. | |||
From Advances to Other Non-Financial Assets | 14,279 | |||
From Trade Accounts Payable to Other Accounts Payable | 2,719 | |||
From Other Accounts Payable to Income Tax | 8,754 | |||
2011 | In thousands of S/. | |||
From Advances to Other Non-Financial Assets | 9,061 | |||
From Other Account Receivable to Derivatives Instruments | 252 | |||
From Deferred Income Tax Asset to Deferred Income Tax Liability | 7,902 | |||
From Other Account Payable to Income Tax Payable | 63,958 | |||
(aa) New Standards and Interpretations Not Yet Adopted by The Company and Its Subsidiaries
The following standards, amendments to standards and interpretations are effective for annual periods beginning after 1 January 2014, and have not been applied in preparing these consolidated financial statements:
| • | Amendments to IAS 32Financial Instruments: Presentation, sets out the requirements for offsetting financial assets and liabilities to eliminate some inconsistencies in the application of current criteria for offsetting in IAS 32. Effective for annual periods beginning on or after January 1, 2014. |
| • | Amendment to IAS 36 Impairment of Assets, this amendment clarifies the scope of disclosures on recoverable value of deteriorated assets, limiting the information requirements to the recoverable amount which is based on the fair value less costs of disposal. Effective for annual periods beginning on or after January 1, 2014. |
| • | IFRS 9 Financial Instruments covers classification, measurement and recognition of financial assets and liabilities. IFRS 9 was issued in November 2009 and October 2010. It replaces parts of IAS 39 relating to classification and measurement of financial instruments. IFRS 9 requires that financial assets be classified into two measurement categories: those measured at fair value and those measured at amortized cost. This determination is made at initial recognition. The classification depends on the business model of the entity for the administration of financial instruments and the characteristics of the contractual cash flows of the instrument. With respect to financial liabilities, the standard retains most of the requirements of IAS 39. The main change concern the cases where the fair value option is taken for financial liabilities, the part that corresponds to the change in fair value arising from the credit risk of the entity will be recorded in other comprehensive income rather than in profit or loss, unless this creates an accounting discrepancy. Effective for annual periods beginning on or after January 1, 2018. |
F-632
Table of Contents
GENERANDES PERÚ S.A. AND SUBSIDIARIES
Notes to the Consolidated Financial Statements
| • | IFRIC 21 Levies, this interpretation of IAS 37 Provisions, Contingent Liabilities and Contingent Assets provides guidance on when to recognize a liability for a levy imposed by a government, other than income tax, in its financial statements. Effective for annual periods beginning on or after January 1, 2014. |
The Company’s management is evaluating the potential impact that IFRS 9 might have on the date of its effective application. Management estimates that the rest of standards, interpretations and amendments that are not yet effective might not have a significant effect on the consolidated financial statements.
(5) Financial Risk Management
The Company’s and its Subsidiaries’ activities are exposed to a variety of financial risks whose potential effects are permanently evaluated by the Company’s management in order to minimize exposures. Financial risks are market risks (including the currency risk, price risk, and interest rate risk), credit risk, liquidity risk.
Risk management is conducted by the Management. Management identifies, evaluates and decides, if appropriate, on the contracting of financial risk hedging based on the Board of Directors’ guidelines.
(a) Currency risk
The Company’s and its Subsidiaries’ are exposed mainly to exchange rate fluctuation risk concerning the Peruvian nuevo sol in respect to the U.S. dollar.
Balances in thousands of U.S. dollars (US$) of asset and liability items as of December 31, 2013, 2012 and 2011 are summarized as follows:
In thousands of S/. | ||||||||||||
2013 | 2012 | 2011 | ||||||||||
Assets | ||||||||||||
Cash and cash equivalents | 22,552 | 7,715 | 5,557 | |||||||||
Trade accounts receivable, net | 2,357 | 6,401 | 5,967 | |||||||||
Other accounts receivable, net | 652 | 614 | 1,706 | |||||||||
Accounts receivable from related parties | 9,370 | — | — | |||||||||
|
|
|
|
|
| |||||||
| 34,931 | 14,730 | 13,230 | ||||||||||
|
|
|
|
|
| |||||||
Liabilities | ||||||||||||
Trade accounts payable | 14,644 | 9,133 | 3,503 | |||||||||
Financial liabilities, including current portion | 241,077 | 254,681 | 302,102 | |||||||||
|
|
|
|
|
| |||||||
| 255,721 | 263,814 | 305,605 | ||||||||||
|
|
|
|
|
| |||||||
Net liability position | 220,790 | 249,084 | 292,375 | |||||||||
|
|
|
|
|
| |||||||
These balances as of December 31, 2013, have been stated in Peruvian nuevos soles at the following exchange rates established by the Superintendencia de Banca y Seguros (SBS): S/. 2.796 for liabilities and S/. 2.794 for assets (S/. 2.551 for liabilities and S/. 2.549 for assets as of December 31, 2012 and S/. 2.697 for liabilities and S/. 2.695 for assets as of December 31, 2011).
F-633
Table of Contents
GENERANDES PERÚ S.A. AND SUBSIDIARIES
Notes to the Consolidated Financial Statements
As shown in the table below, if the U.S. dollar had been revalued/devalued as of December 31, 2013; 2012 and 2011 compared to the Nuevo Sol and keeping its entire variable constant, pre-tax income would have decreased or increased as follows:
| In thousand of S/. | |||||||
Increase (decrease) | Effect on income before | |||||||
2013 | +10 | % | 61,740 | |||||
2013 | -10 | % | (61,740 | ) | ||||
2012 | +10 | % | 63,544 | |||||
2012 | -10 | % | (63,544 | ) | ||||
2011 | +10 | % | 74,588 | |||||
2011 | -10 | % | (74,588 | ) | ||||
Exchange rate risk hedge policies are prepared based on projected cash flows and considers maintaining a balance between flows indexed to US$ and level of assets and liabilities in such currency. The objective is to minimize the flow exposure to the risk of variations in the exchange rate. (note 4(e))
(b) Interest rate risk
Since the Company and its Subsidiaries do not have significant interest-bearing assets; their income and operating cash flows are substantially independent from changes in the market interest rates. The Company’s and its Subsidiaries’ exposure to this risk is basically generated by their financial obligations.
If, as of December 31, 2013; 2012 and 2011, interest rates over indebtedness in U.S dollars had been 0.5% higher/lower (in absolute terms) and all the other variables had remained constant, the results for the year before taxes would have been:
Period | Increase/decrease In interest rate | Effects in results before tax in thousand of US$ | ||||||
2013 | +0.5 | % | 3,732 | |||||
| -0.5 | % | (3,732 | ) | |||||
2012 | +0.5 | % | 3,053 | |||||
| -0.5 | % | (3,053 | ) | |||||
2011 | +0.5 | % | 4,006 | |||||
| -0.5 | % | (4,006 | ) | |||||
Funding variable rates might expose the Company and its Subsidiaries to the cash flow interest rate risk. The Company and its Subsidiaries minimize this risk contracting financial liabilities mainly at fixed interest rates in the medium- and long-term. Additionally, the Subsidiaries have contracted derivative financial instruments to cover the risk of fluctuations in the LIBOR rate associated to the loans contracted at variable rate (note 19(i)). Financial obligations at fixed or covered rate as of December 31, 2013 is 63% (67% as of December 31, 2012 and 66% as of December 31, 2011).
Fixed-rate debts might expose the Company and its Subsidiaries to interest rate risk on fair value of liabilities. The Company’s management considers that this risk is not significant because interest rates applied to its financing contracts do not differ significantly from market interest rates which are available to the Company and its Subsidiaries for similar financial instruments.
Management considers that future fluctuations in the interest rates will not significantly affect the results of the future operations.
F-634
Table of Contents
GENERANDES PERÚ S.A. AND SUBSIDIARIES
Notes to the Consolidated Financial Statements
(c) Credit risk
The Company’s and its Subsidiaries’ financial assets potentially exposed to credit risk concentrations are mainly deposits in banks and accounts receivable presented in the consolidated statement of financial position.
The Company and its Subsidiaries only invest their cash surplus in financial institutions with local investment grade rating.
Credit risk relating to accounts receivable from trading activity, is historically fairly low given the short term for collection from customers, which avoid individual accumulations of significant amounts.
The Company’s and its Subsidiaries’ Management periodically evaluates the credit risk of its client portfolio, based on a methodology designed by its parent company, which takes into account factors such as liquidity, indebtedness, profitability, age of business, payment behavior, criminal records, among others.
(d) Liquidity risk
Liquidity is controlled by balancing maturities of assets and liabilities, keeping a proper number of financing sources, and obtaining credit lines that enable the normal development of its activities. The Company and its Subsidiaries have an appropriate level of resources and keep credit lines with banking entities.
Management permanently monitors its liquidity reserves, based on cash flow projections.
The table below analyzes the financial liabilities of the Company and its Subsidiaries as of the date of the consolidated statement of financial position, classified according to the contractually established maturities:
In thousands of S/. | ||||||||||||||||||||||||
2013 | Less than 1 year | 1 to 2 years | 2 to 3 years | 3 to 5 years | 5 to 10 years | Over 10 years | ||||||||||||||||||
Financial liabilities: | ||||||||||||||||||||||||
Bonds | 107,938 | 17,762 | 55,900 | 27,950 | 100,774 | 27,950 | ||||||||||||||||||
Bank loans | 29,095 | 44,692 | 72,642 | 147,716 | — | — | ||||||||||||||||||
Finance lease | 28,482 | 38,777 | 38,777 | 66,059 | — | — | ||||||||||||||||||
Trade accounts payable | 293,090 | — | — | — | — | — | ||||||||||||||||||
Other accounts payable to related parties | 4,489 | — | — | — | — | — | ||||||||||||||||||
Other accounts payable | 71,982 | — | — | — | — | — | ||||||||||||||||||
|
|
|
|
|
|
|
|
|
|
|
| |||||||||||||
| 535,076 | 101,231 | 167,319 | 241,725 | 100,774 | 27,950 | |||||||||||||||||||
|
|
|
|
|
|
|
|
|
|
|
| |||||||||||||
In thousands of S/. | ||||||||||||||||||||||||
2012 | Less than | 1 to 2 | 2 to 3 | 3 to 5 | 5 to 10 | Over 10 | ||||||||||||||||||
Financial liabilities: | ||||||||||||||||||||||||
Bonds | 108,074 | 98,096 | 16,212 | 51,020 | 121,851 | 25,510 | ||||||||||||||||||
Bank loans | 12,075 | 15,952 | 40,790 | 75,840 | 125,281 | — | ||||||||||||||||||
Finance lease | 26,026 | 25,826 | 35,391 | 98,630 | — | — | ||||||||||||||||||
Trade accounts payable | 190,084 | — | — | — | — | — | ||||||||||||||||||
Other accounts payable to related parties | 4,872 | — | — | — | — | — | ||||||||||||||||||
Other accounts payable | 61,942 | — | — | — | — | — | ||||||||||||||||||
|
|
|
|
|
|
|
|
|
|
|
| |||||||||||||
| 403,073 | 139,874 | 92,393 | 225,490 | 247,132 | 25,510 | |||||||||||||||||||
|
|
|
|
|
|
|
|
|
|
|
| |||||||||||||
F-635
Table of Contents
GENERANDES PERÚ S.A. AND SUBSIDIARIES
Notes to the Consolidated Financial Statements
In thousands of S/. | ||||||||||||||||||||||||
2011 | Less than | 1 to 2 | 2 to 3 | 3 to 5 | 5 to 10 | Over 10 | ||||||||||||||||||
Financial liabilities: | ||||||||||||||||||||||||
Bonds | 62,652 | 100,000 | 99,515 | 71,079 | 100,964 | 51,970 | ||||||||||||||||||
Bank loans | 66,206 | 13,110 | 10,087 | 99,736 | 135,793 | — | ||||||||||||||||||
Finance lease | 42,330 | 27,304 | 27,304 | 74,835 | 66,783 | — | ||||||||||||||||||
Trade accounts payable | 97,426 | — | — | — | — | — | ||||||||||||||||||
Other accounts payable to related parties | 73 | — | — | — | — | — | ||||||||||||||||||
Other accounts payable | 54,536 | — | — | — | — | — | ||||||||||||||||||
|
|
|
|
|
|
|
|
|
|
|
| |||||||||||||
| 323,223 | 140,414 | 136,906 | 245,650 | 303,540 | 51,970 | |||||||||||||||||||
|
|
|
|
|
|
|
|
|
|
|
| |||||||||||||
Management monitors the risk associated with each of the above mentioned categories, which includes maintaining good relationships with financial institutions in order to assure sufficient credit lines at all times, as well as covering its working capital with cash flows coming from operating activities.
As of December 31, 2013, the Company and its Subsidiaries present liquidity of S/. 172,907 thousand (S/. 188,107 as of December 31, 2012 and S/. 170,027 as of December 31, 2011) in cash and other equivalent means and S/. 392,623 thousand in available credit lines (S/. 361,560 as of December 31, 2012 and S/. 309,000 as of December 31, 2011).
In management’s opinion, there is no significant liquidity risk as of December 31, 2013, 2012 and 2011.
(e) Fair Value Estimation
Management estimates that the carrying amounts of current financial instruments as of December 31, 2013, 2012 and 2011 do not differ significantly from their fair values due to their short-term maturity; therefore, disclosure of such information is not relevant for an appropriate interpretation of the Company’s financial position and its Subsidiary as of those dates, and in the case of the non-current financial obligations, because it accrues interest at market rates.
To calculate the fair value of different derivative instruments, the Company and its Subsidiaries use for their valuation the discounted expected cash flows and generally accepted valuation models based on both cash and future market conditions at the closing date of the period.
(6) Cash and Cash Equivalents
This caption comprises the following:
In thousands of S/. | ||||||||||||
2013 | 2012 | 2011 | ||||||||||
Cash | 40 | 45 | 52 | |||||||||
Checking accounts (a) | 68,833 | 56,262 | 21,375 | |||||||||
Time deposits (b) | 104,034 | 131,800 | 148,600 | |||||||||
|
|
|
|
|
| |||||||
| 172,907 | 188,107 | 170,027 | ||||||||||
|
|
|
|
|
| |||||||
| (a) | The Company and its Subsidiaries have checking accounts in local and foreign currency in different local banks; their funds are freely available, and bear interest at market rates. |
F-636
Table of Contents
GENERANDES PERÚ S.A. AND SUBSIDIARIES
Notes to the Consolidated Financial Statements
| (b) | As of December 31, 2013, 2012 and 2011, the Company and its Subsidiaries held time deposits in the following financial institutions: |
In thousands of S/. | ||||||||||||
2013 | 2012 | 2011 | ||||||||||
Banco BBVA Continental | 40,800 | 47,800 | 42,000 | |||||||||
Banco Scotiabank | — | 31,000 | 38,500 | |||||||||
Banco Interbank | 26,500 | 14,000 | 20,000 | |||||||||
Banco de Crédito del Perú | 36,734 | 39,000 | 48,100 | |||||||||
|
|
|
|
|
| |||||||
| 104,034 | 131,800 | 148,600 | ||||||||||
|
|
|
|
|
| |||||||
These time deposits have original maturities between 8 and 28 days.
(7) Trade Accounts Receivable
It comprises the following:
In thousands of S/. | ||||||||||||
2013 | 2012 | 2011 | ||||||||||
Related parties (note 8) | 37,725 | 49,106 | 53,427 | |||||||||
|
|
|
|
|
| |||||||
Third parties | ||||||||||||
Non-regulated clients | 52,540 | 39,786 | 45,724 | |||||||||
Clients from distribution firms (b) | 47,035 | 52,895 | 33,478 | |||||||||
COES clients | 17,790 | 3,170 | 2,960 | |||||||||
|
|
|
|
|
| |||||||
| 117,365 | 95,851 | 82,162 | ||||||||||
|
|
|
|
|
| |||||||
| 155,090 | 144,957 | 135,589 | ||||||||||
|
|
|
|
|
| |||||||
| (a) | Accounts receivable are mainly stated in nuevos soles, have current maturity, and do not bear interest. Balance of accounts receivable as of December 31, 2013, 2012 and 2011 corresponds to 69, 87 and 44 clients, respectively. As of December 31, 2013, 2012 and 2011, the Company and its Subsidiaries do not have past due trade accounts receivable. |
| (b) | The balance of trade accounts receivable as of December 31, 2013, 2012 and 2011 includes an amount of S/. 11,887 thousand that corresponds to energy and power withdrawals without the contractual support provided by distribution companies between 2006 and 2007 that were assigned to the Subsidiary Edegel S.A.A. by the Committee on Economic Operation of the National Interconnected System—COES SINAC. Such withdrawals are valued at busbar prices and have pending invoicing. In Management’s opinion, such accounts receivable shall be fully recovered. |
(8) Related Party Transactions
Activity of accounts receivable from related parties is as follows:
In thousands of S/. | ||||||||||||
| Balances as of 12.31.2013 | Balances as of 12.31.2012 | Balances as of 12.31.2011 | ||||||||||
Trade (note 7) Associates | 37,725 | 49,106 | 53,427 | |||||||||
|
|
|
|
|
| |||||||
| 37,725 | 49,106 | 53,427 | ||||||||||
|
|
|
|
|
| |||||||
Various Associates | 26,986 | 58 | 1,109 | |||||||||
|
|
|
|
|
| |||||||
| 26,986 | 58 | 1,109 | ||||||||||
|
|
|
|
|
| |||||||
| 64,711 | 49,164 | 54,536 | ||||||||||
|
|
|
|
|
| |||||||
F-637
Table of Contents
GENERANDES PERÚ S.A. AND SUBSIDIARIES
Notes to the Consolidated Financial Statements
Activity of accounts payable to related parties is as follows:
In thousands of S/. | ||||||||||||
Balances as of | Balances as of | Balances as of | ||||||||||
Trade (note 7) Associates | 4,437 | 4,872 | 73 | |||||||||
|
|
|
|
|
| |||||||
| 4,437 | 4,872 | 73 | ||||||||||
|
|
|
|
|
| |||||||
Various Associates | 52 | — | — | |||||||||
|
|
|
|
|
| |||||||
| 52 | — | — | ||||||||||
|
|
|
|
|
| |||||||
| 4,489 | 4,872 | 73 | ||||||||||
|
|
|
|
|
| |||||||
| (a) | Accounts receivable and payable to related entities do not bear interest and do not have maturity nor specific guarantees, except for trade accounts receivable that correspond to sale of energy and power. Its maturity term is, on average, 10 days. |
| (b) | They correspond to dividends declared by the Associate. |
| (c) | They correspond to dividends declared and paid by the Company. |
| (d) | Operations with related companies that had an impact on profit or loss of the period are shown below: |
In thousands of S/. | ||||||||||||||||||||||||
2013 | 2012 | 2011 | ||||||||||||||||||||||
Revenue | Expenses | Revenue | Expenses | Revenue | Expenses | |||||||||||||||||||
Sale of energy, power and transport (note 23) | 457,249 | — | 537,736 | — | 648,630 | — | ||||||||||||||||||
Purchase of energy, power and transport (note 24) | — | 5,404 | — | 13,639 | — | 14,729 | ||||||||||||||||||
Administrative services to related parties. (note 28 and 25) | 3,021 | 1,701 | 2,425 | 1,389 | 911 | — | ||||||||||||||||||
Other services (notes 23 and 24) | 135 | 521 | 74 | 388 | 343 | 549 | ||||||||||||||||||
|
|
|
|
|
|
|
|
|
|
|
| |||||||||||||
| 460,405 | 7,626 | 540,235 | 15,416 | 649,884 | 15,278 | |||||||||||||||||||
|
|
|
|
|
|
|
|
|
|
|
| |||||||||||||
| (e) | There are no balances receivable and payable between the Company and its Subsidiaries, its Directors and Management. |
| (f) | Remunerations accrued by Directors and key Management Personnel amount to: |
In thousands of S/. | ||||||||||||
2013 | 2012 | 2011 | ||||||||||
Directors | 505 | 534 | 422 | |||||||||
Managers | 7,067 | 6,242 | 6,284 | |||||||||
|
|
|
|
|
| |||||||
| 7,572 | 6,776 | 6,706 | ||||||||||
|
|
|
|
|
| |||||||
Directors and key Management Personnel only have the remuneration that it is mentioned above.
F-638
Table of Contents
GENERANDES PERÚ S.A. AND SUBSIDIARIES
Notes to the Consolidated Financial Statements
(9) Other Accounts Receivable
This caption comprises the following:
In thousands of S/. | ||||||||||||
2013 | 2012 | 2011 | ||||||||||
Reimbursement for property damage and lost profits (a) | 103,511 | — | — | |||||||||
Sedapal | 3,608 | 3,608 | 3,608 | |||||||||
Claims to third parties | 823 | 864 | 864 | |||||||||
Loans to personnel | 1,379 | 703 | 579 | |||||||||
Various | 6,143 | 7,396 | 7,908 | |||||||||
|
|
|
|
|
| |||||||
| 115,464 | 12,571 | 12,959 | ||||||||||
Less, estimate for doubtful accounts (b) | 4,170 | 4,170 | 3,927 | |||||||||
|
|
|
|
|
| |||||||
| 111,294 | 8,401 | 9,032 | ||||||||||
|
|
|
|
|
| |||||||
| (a) | Corresponds mainly to the estimate of the compensation of the Insurance Company according to the policy coverage subscribed by a loss occurred in Unit TG7. At the date of these financial statements, the insurance claim is collectable. (notes 13 (g) and 28). |
| (b) | In opinion of the Company and its Subsidiaries’ Management, the balance of the estimate for doubtful accounts appropriately covers the credit risk of other doubtful accounts receivable as of December 31, 2013, 2012 and 2011. |
(10) Inventories
This caption comprises the following:
In thousands of S/. | ||||||||||||
2013 | 2012 | 2011 | ||||||||||
Work and maintenance materials | 49,984 | 49,500 | 50,040 | |||||||||
Materials in transit | 17,788 | 19,104 | 14,316 | |||||||||
Oil | 72 | 127 | 1,266 | |||||||||
|
|
|
|
|
| |||||||
| 67,844 | 68,731 | 65,622 | ||||||||||
|
|
|
|
|
| |||||||
| (a) | During 2013 inventories of S/. 75,583 were written down to net realizable value (S/. 76,921 in 2012 and S/. 73,610 in 2011). |
(11) Other Non-Financial Assets
This caption comprises the following:
In thousands of S/. | ||||||||||||
2013 | 2012 | 2011 | ||||||||||
Prepaid insurance | 20,083 | 13,007 | 7,821 | |||||||||
Advances | 1,294 | 2,385 | 645 | |||||||||
Other | 889 | 1,272 | 1,240 | |||||||||
|
|
|
|
|
| |||||||
| 22,266 | 16,664 | 9,706 | ||||||||||
|
|
|
|
|
| |||||||
F-639
Table of Contents
GENERANDES PERÚ S.A. AND SUBSIDIARIES
Notes to the Consolidated Financial Statements
(12) Investments in Associate
It comprises the following:
Effective Shareholding | In thousands of S/. (b) | |||||||||||||||||||||||
2013 | 2012 | 2011 | 2013 | 2012 | 2011 | |||||||||||||||||||
Endesa Brasil S.A. | 3.9966 | 4.1845 | 4.1845 | 260,382 | 259,771 | 275,271 | ||||||||||||||||||
|
|
|
|
|
|
|
|
|
|
|
| |||||||||||||
| (a) | Corresponds to 6,957,053 common shares of Endesa Brasil S.A., a company incorporated in Brazil where the Subsidiary Edegel S.A.A. holds an effective shareholding of 3.9966% in capital stock as of December 31, 2013 (4.1845% as of December 31, 2012, of December 31, 2011 and of December 31, 2010). |
F-640
Table of Contents
GENERANDES PERÚ S.A. AND SUBSIDIARIES
Notes to the Consolidated Financial Statements
(13) Property, Plant, and Equipment
This caption comprises the following:
In thousands of S/. | ||||||||||||||||||||||||||||||||
Description | Land | Building and | Plant and | Vehicles | Furniture | Various | Works | 12.31.2013 | ||||||||||||||||||||||||
Cost | ||||||||||||||||||||||||||||||||
Opening balances | 23,632 | 3,142,228 | 2,948,478 | 3,230 | 4,851 | 26,120 | 204,418 | 6,352,957 | ||||||||||||||||||||||||
Additions | — | — | 1,973 | — | — | 168 | 197,824 | 199,965 | ||||||||||||||||||||||||
Sales and/or withdrawals | — | (73 | ) | (143,151 | ) | (438 | ) | (40 | ) | (74 | ) | (1,121 | ) | (144,897 | ) | |||||||||||||||||
Transfers | — | 4,237 | 91,310 | — | 63 | 93 | (95,703 | ) | — | |||||||||||||||||||||||
|
|
|
|
|
|
|
|
|
|
|
|
|
|
|
| |||||||||||||||||
Final balances | 23,632 | 3,146,392 | 2,898,610 | 2,792 | 4,874 | 26,307 | 305,418 | 6,408,025 | ||||||||||||||||||||||||
Accumulated depreciation | ||||||||||||||||||||||||||||||||
Opening balances | — | 897,629 | 1,643,009 | 2,966 | 4,114 | 19,716 | — | 2,567,434 | ||||||||||||||||||||||||
Additions (note 27) | — | 59,779 | 144,927 | 105 | 201 | 1,783 | — | 206,795 | ||||||||||||||||||||||||
Sales and/or withdrawals | — | (20 | ) | (106,038 | ) | (360 | ) | (40 | ) | (66 | ) | — | (106,524 | ) | ||||||||||||||||||
|
|
|
|
|
|
|
|
|
|
|
|
|
|
|
| |||||||||||||||||
Final balances | — | 957,388 | 1,681,898 | 2,711 | 4,275 | 21,433 | — | 2,667,705 | ||||||||||||||||||||||||
Provision for decommissioning of power plants | ||||||||||||||||||||||||||||||||
Opening balances | — | — | 11,251 | — | — | — | — | 11,251 | ||||||||||||||||||||||||
Depreciation (note 27) | — | — | 495 | — | — | — | — | 495 | ||||||||||||||||||||||||
|
|
|
|
|
|
|
|
|
|
|
|
|
|
|
| |||||||||||||||||
Final balances | — | — | 10,756 | — | — | — | — | 10,756 | ||||||||||||||||||||||||
Provision for impairment of plant and equipment | ||||||||||||||||||||||||||||||||
Opening balances | — | — | 1,066 | — | — | — | — | 1,066 | ||||||||||||||||||||||||
|
|
|
|
|
|
|
|
|
|
|
|
|
|
|
| |||||||||||||||||
Final balances | — | — | 1,066 | — | — | �� | — | 1,066 | ||||||||||||||||||||||||
|
|
|
|
|
|
|
|
|
|
|
|
|
|
|
| |||||||||||||||||
Net cost | 23,632 | 2,189,004 | 1,226,402 | 81 | 599 | 4,874 | 305,418 | 3,750,010 | ||||||||||||||||||||||||
|
|
|
|
|
|
|
|
|
|
|
|
|
|
|
| |||||||||||||||||
(TRANSLATION OF FINANCIAL STATEMENTS ORIGINALLY ISSUED IN SPANISH)
F-641
Table of Contents
GENERANDES PERÚ S.A. AND SUBSIDIARIES
Notes to the Consolidated Financial Statements
In thousands of S/. | ||||||||||||||||||||||||||||||||
Description | Land | Build. and | Plant and | Vehicles | Furniture | Various | Works | 12.31.2012 | ||||||||||||||||||||||||
Cost | ||||||||||||||||||||||||||||||||
Opening balances | 24,731 | 3,135,687 | 2,867,173 | 3,481 | 4,614 | 25,027 | 174,570 | 6,235,283 | ||||||||||||||||||||||||
Additions | — | — | — | — | — | 198 | 119,349 | 119,547 | ||||||||||||||||||||||||
Sales and/or withdrawals | (1,099 | ) | (389 | ) | — | (251 | ) | — | (90 | ) | (44 | ) | (1,873 | ) | ||||||||||||||||||
Transfers | — | 6,930 | 81,305 | — | 237 | 985 | (89,457 | ) | — | |||||||||||||||||||||||
|
|
|
|
|
|
|
|
|
|
|
|
|
|
|
| |||||||||||||||||
Final balances | 23,632 | 3,142,228 | 2,948,478 | 3,230 | 4,851 | 26,120 | 204,418 | 6,352,957 | ||||||||||||||||||||||||
Accumulated depreciation | ||||||||||||||||||||||||||||||||
Opening balances | — | 838,456 | 1,495,183 | 3,044 | 3,893 | 17,970 | — | 2,358,546 | ||||||||||||||||||||||||
Additions (note 27) | — | 59,416 | 147,826 | 173 | 206 | 1,761 | — | 209,382 | ||||||||||||||||||||||||
Sales and/or withdrawals | — | (243 | ) | — | (251 | ) | — | — | — | (494 | ) | |||||||||||||||||||||
Transfers | — | — | — | — | 15 | (15 | ) | — | — | |||||||||||||||||||||||
|
|
|
|
|
|
|
|
|
|
|
|
|
|
|
| |||||||||||||||||
Final balances | — | 897,629 | 1,643,009 | 2,966 | 4,114 | 19,716 | — | 2,567,434 | ||||||||||||||||||||||||
Provision for decommissioning of power plants | ||||||||||||||||||||||||||||||||
Opening balances | — | — | 5,734 | — | — | — | — | 5,734 | ||||||||||||||||||||||||
Additions | — | — | 5,814 | — | — | — | — | 5,814 | ||||||||||||||||||||||||
Depreciation (note 27) | — | — | (297 | ) | — | — | — | — | (297 | ) | ||||||||||||||||||||||
|
|
|
|
|
|
|
|
|
|
|
|
|
|
|
| |||||||||||||||||
Final balances | — | — | 11,251 | — | — | — | — | 11,251 | ||||||||||||||||||||||||
Provision for impairment of plant and equipment | ||||||||||||||||||||||||||||||||
Opening balances | — | — | 1,066 | — | — | — | — | 1,066 | ||||||||||||||||||||||||
|
|
|
|
|
|
|
|
|
|
|
|
|
|
|
| |||||||||||||||||
Final balances | — | — | 1,066 | — | — | — | — | 1,066 | ||||||||||||||||||||||||
|
|
|
|
|
|
|
|
|
|
|
|
|
|
|
| |||||||||||||||||
Net cost | 23,632 | 2,244,599 | 1,315,654 | 264 | 737 | 6,404 | 204,418 | 3,795,708 | ||||||||||||||||||||||||
|
|
|
|
|
|
|
|
|
|
|
|
|
|
|
| |||||||||||||||||
(TRANSLATION OF FINANCIAL STATEMENTS ORIGINALLY ISSUED IN SPANISH)
F-642
Table of Contents
GENERANDES PERÚ S.A. AND SUBSIDIARIES
Notes to the Consolidated Financial Statements
In thousands of S/. | ||||||||||||||||||||||||||||||||
Description | Land | Build. and | Plant and | Vehicles | Furniture | Various | Works | 12.31.2011 | ||||||||||||||||||||||||
Cost | ||||||||||||||||||||||||||||||||
Opening balances | 24,731 | 3,132,428 | 2,822,559 | 3,444 | 4,582 | 23,143 | 136,741 | 6,147,628 | ||||||||||||||||||||||||
Additions | — | — | — | 246 | — | 712 | 87,326 | 88,284 | ||||||||||||||||||||||||
Sales and/or withdrawals | — | — | (417 | ) | (209 | ) | — | (3 | ) | — | (629 | ) | ||||||||||||||||||||
Transfers | — | 3,259 | 45,031 | — | 32 | 1,175 | (49,497 | ) | — | |||||||||||||||||||||||
|
|
|
|
|
|
|
|
|
|
|
|
|
|
|
| |||||||||||||||||
Final balances | 24,731 | 3,135,687 | 2,867,173 | 3,481 | 4,614 | 25,027 | 174,570 | 6,235,283 | ||||||||||||||||||||||||
Accumulated depreciation | ||||||||||||||||||||||||||||||||
Opening balances | — | 779,239 | 1,349,286 | 3,013 | 3,698 | 16,447 | — | 2,151,683 | ||||||||||||||||||||||||
Additions (note 27) | — | 59,217 | 146,202 | 240 | 195 | 1,523 | — | 207,377 | ||||||||||||||||||||||||
Sales and/or withdrawals | — | — | (305 | ) | (209 | ) | — | — | — | (514 | ) | |||||||||||||||||||||
|
|
|
|
|
|
|
|
|
|
|
|
|
|
|
| |||||||||||||||||
Final balances | — | 838,456 | 1,495,183 | 3,044 | 3,893 | 17,970 | — | 2,358,546 | ||||||||||||||||||||||||
Provision for decommissioning of power plants | ||||||||||||||||||||||||||||||||
Opening balances | — | — | 6,318 | — | — | — | — | 6,318 | ||||||||||||||||||||||||
Depreciation (note 27) | — | — | (584 | ) | — | — | — | — | (584 | ) | ||||||||||||||||||||||
|
|
|
|
|
|
|
|
|
|
|
|
|
|
|
| |||||||||||||||||
Final balances | — | — | 5,734 | — | — | — | — | 5,734 | ||||||||||||||||||||||||
Provision for impairment of plant and equipment | — | — | — | — | — | — | — | — | ||||||||||||||||||||||||
Opening balances | — | — | 1,066 | — | — | — | — | 1,066 | ||||||||||||||||||||||||
|
|
|
|
|
|
|
|
|
|
|
|
|
|
|
| |||||||||||||||||
Final balances | — | — | 1,066 | — | — | — | — | 1,066 | ||||||||||||||||||||||||
|
|
|
|
|
|
|
|
|
|
|
|
|
|
|
| |||||||||||||||||
Net cost | 24,731 | 2,297,231 | 1,376,658 | 437 | 721 | 7,057 | 174,570 | 3,881,405 | ||||||||||||||||||||||||
|
|
|
|
|
|
|
|
|
|
|
|
|
|
|
| |||||||||||||||||
| (a) | Property, plant and equipment includes interest and other capitalized finance costs related to construction of works-in-progress, as per the indicated criteria (notes 4u). |
| (b) | During 2013, 2012 and 2011, no interests were capitalized. |
| (c) | As of December 31, 2013, property, plant and equipment includes spare parts for S/. 116,623 thousand (S/. 98,814 as of December 31, 2012 and S/. 86,428 as of December 31, 2011) to be exclusively used in generating units. |
| (d) | Property, plant and equipment includes assets of combined cycle of the thermoelectric plant Ventanilla that were acquired by the subsidiary Edegel S.A.A. through finance lease contracts. These contracts were fully canceled at the closing of the period 2012. |
| Likewise, PP&E includes assets for the extension of the thermoelectric plant Santa Rosa (Santa Rosa II) that were acquired by Edegel S.A.A. through finance lease agreement (note 19e) and came into force in September 2009. As of December 31, 2013, the net carrying amount of assets acquired for the construction, installation, implementation and commissioning of such generating unit amounts to S/. 201,021 (S/. 216,461 as of December 31, 2012 and S/. 231,902 as of December 31, 2011) from which S/. 34,172 correspond to buildings and other constructions (S/. 35,822 as of December 31, 2012 and S/. 37,471 as of December 31, 2011) and S/. 166,849 to plant and equipment (S/. 180,639 as of December 31, 2012 and S/. 194,431 as of December 31, 2011). |
| (e) | Edegel S.A.A. transferred to trust equity the legal ownership of plant and equipment of the combined cycle with the intention that it serves as guarantee of payment of obligations assumed by the financing of the conversion of the Thermoelectric Plant from Ventanilla to combined cycle. The trust agreement was terminated on December 31, 2013. |
| (f) | As of December 31, 2012, a change in the discount rate used to calculate the present value of the estimated disbursement of retirement costs resulted in an increase in the provision and at the fixed assets value amounting to S/. 5,814 thousand. |
| (g) | In May 2013, a loss occurred in the thermal plant Santa Rosa that affected certain items of assets belonging to Unit TG7, supporting unit. Due to this loss, Edegel S.A.A. recorded an estimated impairment amounting to S/. 36,006 thousand (note 24), that corresponded to the decrease in the carrying amount at the recoverable value of Unit TG7. The estimated impairment was applied to items of assets belonging to Unit TG7 affected by the loss. As of December 31, 2013, Edegel S.A.A. began to remove the items affected by the loss. |
(TRANSLATION OF FINANCIAL STATEMENTS ORIGINALLY ISSUED IN SPANISH)
F-643
Table of Contents
GENERANDES PERÚ S.A. AND SUBSIDIARIES
Notes to the Consolidated Financial Statements
| As of December 31, 2013, Edegel S.A.A. has estimated the indemnity of the insurance company for material damages in S/. 96,593 thousand and for loss of income in S/. 6,918 thousand (notes 9 and 28). |
| (h) | The subsidiaries hold insurances on their main assets according to the policies established by Management. In that sense, as of December 31, 2013, the Subsidiaries have insured property, plant and equipment up to an amount of US$ 1,876,208 thousand (US$ 1,844,161 as of December 31, 2012 and US$ 1,841,708 as of December 31, 2011). It is the management’s opinion that its insurance policies are consistent with the industry practice, and that the risk of possible losses for claims considered in the insurance policies is reasonable, taking into consideration the Subsidiaries’ type of assets. |
(14) Intangible Assets
This caption comprises the following:
In thousands of S/. | ||||||||||||||||
Description | Concessions | Software | Other | 12.31.2013 | ||||||||||||
Cost | ||||||||||||||||
Opening balances | 52,462 | 11,841 | 224 | 64,527 | ||||||||||||
Additions (a) | 318 | 2,348 | — | 2,666 | ||||||||||||
|
|
|
|
|
|
|
| |||||||||
Final balances | 52,780 | 14,189 | 224 | 67,193 | ||||||||||||
Accumulated amortization | ||||||||||||||||
Opening balances | 3,410 | 9,297 | 9 | 12,716 | ||||||||||||
Additions (note 27) | 1,640 | 680 | 11 | 2,331 | ||||||||||||
|
|
|
|
|
|
|
| |||||||||
Final balances | 5,050 | 9,977 | 20 | 15,047 | ||||||||||||
|
|
|
|
|
|
|
| |||||||||
Net cost | 47,730 | 4,212 | 204 | 52,146 | ||||||||||||
|
|
|
|
|
|
|
| |||||||||
In thousands of S/. | ||||||||||||||||
Description | Concessions | Software | Other | 12.31.2012 | ||||||||||||
Cost | ||||||||||||||||
Opening balances | 3,271 | 10,756 | 224 | 14,251 | ||||||||||||
Additions (a) | 49,191 | 1,085 | — | 50,276 | ||||||||||||
|
|
|
|
|
|
|
| |||||||||
Final balances | 52,462 | 11,841 | 224 | 64,527 | ||||||||||||
Accumulated amortization | ||||||||||||||||
Opening balances | 3,271 | 8,604 | 1 | 11,876 | ||||||||||||
Additions (note 27) | 139 | 693 | 8 | 840 | ||||||||||||
|
|
|
|
|
|
|
| |||||||||
Final balances | 3,410 | 9,297 | 9 | 12,716 | ||||||||||||
|
|
|
|
|
|
|
| |||||||||
Net cost | 49,052 | 2,544 | 215 | 51,811 | ||||||||||||
|
|
|
|
|
|
|
| |||||||||
| (a) | The concessions and rights include the Huascacocha project which allows the Company having a higher water flow for the development of power generation activities. The useful live is 30 years. |
F-644
Table of Contents
GENERANDES PERÚ S.A. AND SUBSIDIARIES
Notes to the Consolidated Financial Statements
In thousands of S/. | ||||||||||||||||
Description | Concessions | Software | Other | 12.31.2011 | ||||||||||||
Cost | ||||||||||||||||
Opening balances | 3,271 | 9,880 | — | 13,151 | ||||||||||||
Additions (a) | — | 876 | 224 | 1,100 | ||||||||||||
|
|
|
|
|
|
|
| |||||||||
Final balances | 3,271 | 10,756 | 224 | 14,251 | ||||||||||||
Accumulated amortization | ||||||||||||||||
Opening balances | 3,260 | 7,794 | — | 11,054 | ||||||||||||
Additions (note 27) | 11 | 810 | 1 | 822 | ||||||||||||
|
|
|
|
|
|
|
| |||||||||
Final balances | 3,271 | 8,604 | 1 | 11,876 | ||||||||||||
|
|
|
|
|
|
|
| |||||||||
Net cost | — | 2,152 | 223 | 2,375 | ||||||||||||
|
|
|
|
|
|
|
| |||||||||
(15) Short-Term Financial Liabilities:
This caption comprises the following:
In thousands of S/. | ||||||||||||
2013 | 2012 | 2011 | ||||||||||
Bank loan (a) | ||||||||||||
Principal | 11,180 | — | — | |||||||||
Interest | 3 | — | — | |||||||||
|
|
|
|
|
| |||||||
| 11,183 | — | — | ||||||||||
Current portion of long-term financial liabilities (note 19) | ||||||||||||
Principal | 146,204 | 137,382 | 161,670 | |||||||||
Interest | 8,128 | 8,793 | 9,518 | |||||||||
|
|
|
|
|
| |||||||
| 165,515 | 146,175 | 171,188 | ||||||||||
|
|
|
|
|
| |||||||
| (a) | Corresponds to a promissory note amounting to US$ 4,000 thousand signed by Chinango S.A.C with Scotiabank del Peru, obtained for financing working capital. The promissory note has current maturity and accrues interest at an interest rate of 0.78% as of December 31, 2013. |
(16) Trade Accounts Payable
This caption comprises the following:
In thousands of S/. | ||||||||||||
2013 | 2012 | 2011 | ||||||||||
Supply, gas transport and distribution | 26,402 | 20,950 | 22,836 | |||||||||
Maintenance agreement with Siemens S.A. (a) | 62,637 | 29,208 | 10,179 | |||||||||
Purchase of energy and transmission toll | 18,168 | 26,803 | 16,480 | |||||||||
Suppliers of work-in-progress (b) | 151,866 | 78,015 | 26,139 | |||||||||
Other | 34,017 | 35,108 | 21,792 | |||||||||
|
|
|
|
|
| |||||||
| 293,090 | 190,084 | 97,426 | ||||||||||
|
|
|
|
|
| |||||||
F-645
Table of Contents
GENERANDES PERÚ S.A. AND SUBSIDIARIES
Notes to the Consolidated Financial Statements
| (a) | Corresponds to goods and services delivered by Siemens Westinghouse Power Corporation and Siemens Westinghouse Service Company Ltd. by virtue of the long-term service agreements “LTSA” for acquisition of replacement parts and rendering of scheduled maintenance services (minor and major) for turbines of thermal plants of Ventanilla and Santa Rosa. As established in the contract (note 33e), such amounts shall be paid based on the hours of operation of thermal plants. |
| (b) | Includes works-in-progress related to the replacement of items affected by the loss occurred in Unit TG7 (note 13 (g)) for an amount of S/. 72,416 thousand. |
(17) Other Accounts Payable
This caption comprises the following:
In thousands of S/. | ||||||||||||
2013 | 2012 | 2011 | ||||||||||
Sales tax credit payable | 4,429 | 10,363 | 7,323 | |||||||||
Taxes payable | 3,506 | 3,725 | 3,904 | |||||||||
Remunerations payable | 5,136 | 3,429 | 4,526 | |||||||||
Workers’ Profit Sharing | 13,407 | 10,993 | 12,706 | |||||||||
Dividends payable to minority stockholder | — | — | 7,145 | |||||||||
Insurances payable | 28,124 | 15,071 | 6,242 | |||||||||
Various | 17,380 | 18,361 | 12,690 | |||||||||
|
|
|
|
|
| |||||||
| 71,982 | 61,942 | 54,536 | ||||||||||
|
|
|
|
|
| |||||||
(18) Provisions
This caption comprises the following:
In thousands of S/. | ||||||||||||
2013 | 2012 | 2011 | ||||||||||
Tax Contingencies (note 34) | 13,682 | 13,383 | 66,974 | |||||||||
Decommissioning of power plants | 15,126 | 14,566 | 8,657 | |||||||||
Technical Quality Standard | 4,253 | 4,253 | 4,253 | |||||||||
Other provisions | 602 | 873 | 725 | |||||||||
|
|
|
|
|
| |||||||
| 33,663 | 33,075 | 80,609 | ||||||||||
|
|
|
|
|
| |||||||
For maturity term: | ||||||||||||
Current portion | 18,537 | 18,509 | 71,952 | |||||||||
Non-current portion | 15,126 | 14,566 | 8,657 | |||||||||
|
|
|
|
|
| |||||||
| 33,663 | 33,075 | 80,609 | ||||||||||
|
|
|
|
|
| |||||||
F-646
Table of Contents
GENERANDES PERÚ S.A. AND SUBSIDIARIES
Notes to the Consolidated Financial Statements
(19) Financial Liabilities
(a) This caption comprises the following:
Creditor | See | Origin | Annual interest (%) | Payment interest | Capital | Maturity | In thousands of S/. | |||||||||||||||||||||||||||||||||||||||||||||||||||||
Current portion | Non-current portion | Total current debt as of | ||||||||||||||||||||||||||||||||||||||||||||||||||||||||||
12.31.2013 | 12.31.2012 | 12.31.2011 | 12.31.2013 | 12.31.2012 | 12.31.2011 | 12.31.2013 | 12.31.2012 | 12.31.2011 | ||||||||||||||||||||||||||||||||||||||||||||||||||||
Corporate bonds | ||||||||||||||||||||||||||||||||||||||||||||||||||||||||||||
- First Chinango Program | (b) | US$ and S/. | See (b) | See (b) | See (b) | See (b) | 25,706 | 26,020 | 55,341 | — | 25,000 | 50,000 | 25,706 | 51,020 | 105,341 | |||||||||||||||||||||||||||||||||||||||||||||
- Third Edegel Program | (b) | US$ and S/. | See (b) | See (b) | See (b) | See (b) | 79,756 | 79,793 | 4,921 | 118,536 | 185,649 | 265,648 | 198,292 | 265,442 | 270,569 | |||||||||||||||||||||||||||||||||||||||||||||
- Fourth Edegel Program | (b) | US$ | See (b) | See (b) | See (b) | See (b) | 2,477 | 2,261 | 2,390 | 111,800 | 102,040 | 107,880 | 114,277 | 104,301 | 110,270 | |||||||||||||||||||||||||||||||||||||||||||||
|
|
|
|
|
|
|
|
|
|
|
|
|
|
|
|
|
| |||||||||||||||||||||||||||||||||||||||||||
| 107,939 | 108,074 | 62,652 | 230,336 | 312,689 | 423,528 | 338,275 | 420,763 | 486,180 | ||||||||||||||||||||||||||||||||||||||||||||||||||||
Bank loans | ||||||||||||||||||||||||||||||||||||||||||||||||||||||||||||
- Banco Continental | S/ | 3.8 | Quarterly | Maturity | Dec. 2012 | — | — | 8,016 | — | — | — | — | — | 8,016 | ||||||||||||||||||||||||||||||||||||||||||||||
- Scotiabank Perú | (f) | US$ | LIBOR + 3.70 | Quarterly | Maturity | Feb 2018 | 3,815 | 2,707 | 370 | 80,580 | 76,708 | 83,607 | 84,395 | 79,415 | 83,977 | |||||||||||||||||||||||||||||||||||||||||||||
- COF Tramo B (Sindicado) | (d) | US$ | LIBOR + 2.5 |
| Per semester. |
| Quarterly | Dec. 2012 | — | — | 9,085 | — | — | — | — | — | 9,085 | |||||||||||||||||||||||||||||||||||||||||||
- Scotiabank Perú | US$ | LIBOR + 1.25 | | Per semester. | |
| Per semester. |
| Jun. 2012 | — | — | 9,711 | — | — | — | — | — | 9,711 | ||||||||||||||||||||||||||||||||||||||||||
- Bank of Nova Scotia | (g) | US$ | LIBOR + 2.50 | Quarterly | Quarterly | Nov. 2017 | 7,094 | 100 | — | 20,962 | 25,510 | — | 28,056 | 25,610 | — | |||||||||||||||||||||||||||||||||||||||||||||
- Banco de Crédito del Perú | US$ | LIBOR + 3.00 | Quarterly | Quarterly | Mar 2013 | — | 9,201 | 38,942 | — | — | 9,709 | — | 9,201 | 48,651 | ||||||||||||||||||||||||||||||||||||||||||||||
- Banco Continental | (d) | US$ | LIBOR + 3.13 | Quarterly | Quarterly | Sep.2017 | 6,988 | — | — | 163,508 | 155,611 | 164,517 | 170,496 | 155,611 | 164,517 | |||||||||||||||||||||||||||||||||||||||||||||
|
|
|
|
|
|
|
|
|
|
|
|
|
|
|
|
|
| |||||||||||||||||||||||||||||||||||||||||||
| 17,897 | 12,008 | 66,124 | 265,050 | 257,829 | 257,833 | 282,947 | 269,837 | 323,957 | ||||||||||||||||||||||||||||||||||||||||||||||||||||
Finance Lease | ||||||||||||||||||||||||||||||||||||||||||||||||||||||||||||
- COF Tramos A y C | (d) | |||||||||||||||||||||||||||||||||||||||||||||||||||||||||||
- Banco Continental | US$ | LIBOR + 2.5 | Quarterly | Quarterly | Dec. 2012 | — | — | 11,875 | — | — | — | — | — | 11,875 | ||||||||||||||||||||||||||||||||||||||||||||||
- Banco de Crédito del Perú | US$ | LIBOR + 2.5 | Quarterly | Quarterly | Dec. 2012 | — | — | 12,410 | — | — | — | — | — | 12,410 | ||||||||||||||||||||||||||||||||||||||||||||||
- Citibank del Perú | US$ | LIBOR + 2.5 | Quarterly | Quarterly | Dec. 2012 | — | — | 2,849 | — | — | — | — | — | 2,849 | ||||||||||||||||||||||||||||||||||||||||||||||
- Banco Internacional del Perú S.A. -Interbank | US$ | LIBOR + 2.5 | Quarterly | Quarterly | Dec. 2012 | — | — | 807 | — | — | — | — | — | 807 | ||||||||||||||||||||||||||||||||||||||||||||||
- Scotiabank Perú | (e) | US$ | LIBOR+1.75 | Quarterly | Quarterly | Mar 2017 | 28,398 | 25,938 | 14,301 | 138,862 | 152,566 | 188,602 | 167,260 | 178,504 | 202,903 | |||||||||||||||||||||||||||||||||||||||||||||
|
|
|
|
|
|
|
|
|
|
|
|
|
|
|
|
|
| |||||||||||||||||||||||||||||||||||||||||||
| 28,398 | 25,938 | 42,242 | 138,862 | 152,566 | 188,602 | 167,260 | 178,504 | 230,844 | ||||||||||||||||||||||||||||||||||||||||||||||||||||
Derivative instruments (nota 20 (a)) | US$ | Quarterly | 98 | 155 | 170 | 4,751 | 7,315 | 8,517 | 4,849 | 7,470 | 8,687 | |||||||||||||||||||||||||||||||||||||||||||||||||
|
|
|
|
|
|
|
|
|
|
|
|
|
|
|
|
|
| |||||||||||||||||||||||||||||||||||||||||||
| 154,332 | 146,175 | 171,188 | 638,999 | 730,399 | 878,480 | 793,331 | 876,574 | 1,049,668 | ||||||||||||||||||||||||||||||||||||||||||||||||||||
|
|
|
|
|
|
|
|
|
|
|
|
|
|
|
|
|
| |||||||||||||||||||||||||||||||||||||||||||
| (*) | The current portion of long-term liabilities includes debt interests accrued and unpaid as of the date of the statement of financial position. |
F-647
Table of Contents
GENERANDES PERÚ S.A. AND SUBSIDIARIES
Notes to the Consolidated Financial Statements
| (b) | Composition of debt bond is presented as follows: |
Creditor | Origin | Issued | Issuance | Annual | Payment of | Maturity | In thousands of S/. | |||||||||||||||||||||||||||||||||||||||||||||||||||||
Current portion | Non-current portion | Total debt in force as of | ||||||||||||||||||||||||||||||||||||||||||||||||||||||||||
12.31.2013 | 12.31.2012 | 12.31.2011 | 12.31.2013 | 12.31.2012 | 12.31.2011 | 12.31.2013 | 12.31.2012 | 12.31.2011 | ||||||||||||||||||||||||||||||||||||||||||||||||||||
First Chinango Bond Program | ||||||||||||||||||||||||||||||||||||||||||||||||||||||||||||
- 11th Issuance, Serial A | US$ | 20,000,000 | Nov. 2005 | 6.062 | Per semester. | Nov. 2012 | — | — | 54,322 | — | — | — | — | — | 54,322 | |||||||||||||||||||||||||||||||||||||||||||||
- 13th Issuance, Serial A | S/. | 25,000,000 | Oct. 2006 | 6.469 | Per semester. | Oct. 2013 | — | 25,314 | 314 | — | — | 25,000 | — | 25,314 | 25,314 | |||||||||||||||||||||||||||||||||||||||||||||
- 13th Issuance, Serial B | S/. | 25,000,000 | Jan. 2007 | 6.156 | Per semester. | Jan. 2014 | 25,706 | 706 | 705 | — | 25,000 | 25,000 | 25,706 | 25,706 | 25,705 | |||||||||||||||||||||||||||||||||||||||||||||
|
|
|
|
|
|
|
|
|
|
|
|
|
|
|
|
|
| |||||||||||||||||||||||||||||||||||||||||||
| 25,706 | 26,020 | 55,341 | — | 25,000 | 50,000 | 25,706 | 51,020 | 105,341 | ||||||||||||||||||||||||||||||||||||||||||||||||||||
Third Edegel Bond Program | ||||||||||||||||||||||||||||||||||||||||||||||||||||||||||||
- 1st Issuance, Serial A | S/. | 25,000,000 | Jun. 2007 | 6.313 | Per semester. | Jun. 2022 | 39 | 39 | 39 | 25,000 | 25,000 | 25,000 | 25,039 | 25,039 | 25,039 | |||||||||||||||||||||||||||||||||||||||||||||
- 3rd Issuance, Serial A | S/. | 25,000,000 | Jul. 2007 | 6.281 | Per semester. | Jul. 2019 | 772 | 772 | 772 | 25,000 | 25,000 | 25,000 | 25,772 | 25,772 | 25,772 | |||||||||||||||||||||||||||||||||||||||||||||
- 4th Issuance, Serial A | S/. | 20,000,000 | Aug 2007 | 6.75 | Per semester. | Aug. 2014 | 20,450 | 450 | 450 | — | 20,000 | 20,000 | 20,450 | 20,450 | 20,450 | |||||||||||||||||||||||||||||||||||||||||||||
- 5th Issuance, Serial A | S/. | 25,000,000 | Set. 2007 | 6.5 | Per semester. | Mar. 2013 | — | 25,461 | 461 | — | — | 25,000 | — | 25,461 | 25,461 | |||||||||||||||||||||||||||||||||||||||||||||
- 6th Issuance, Serial A | S/. | 25,000,000 | Nov. 2007 | 6.438 | Per semester. | may-13 | — | 25,174 | 174 | — | — | 25,000 | — | 25,174 | 25,174 | |||||||||||||||||||||||||||||||||||||||||||||
- 7th Issuance, Serial A | S/. | 25,000,000 | Dec. 2007 | 6.625 | Per semester. | Jun. 2013 | — | 25,083 | 83 | — | — | 25,000 | — | 25,083 | 25,083 | |||||||||||||||||||||||||||||||||||||||||||||
- 8th Issuance, Serial A | US$ | 10,000,000 | Jan. 2008 | 6.344 | Per semester. | Jan. 2028 | 763 | 697 | 737 | 27,950 | 25,510 | 26,970 | 28,713 | 26,207 | 27,707 | |||||||||||||||||||||||||||||||||||||||||||||
- 9th Issuance, Serial A | S/. | 28,300,000 | Mar. 2008 | 6.594 | Per semester. | Mar. 2014 | 28,886 | 586 | 586 | — | 28,300 | 28,300 | 28,886 | 28,886 | 28,886 | |||||||||||||||||||||||||||||||||||||||||||||
- 10th Issuance, Serial A | US$ | 9,720,000 | Nov. 2008 | 9 | Per semester. | Nov. 2014 | 27,494 | 298 | 315 | — | 24,796 | 26,215 | 27,494 | 25,094 | 26,530 | |||||||||||||||||||||||||||||||||||||||||||||
- 11th Issuance, Serial A | US$ | 8,166,000 | Jan. 2009 | 7.781 | Per semester. | Jan. 2019 | 789 | 720 | 761 | 22,824 | 20,831 | 22,024 | 23,613 | 21,551 | 22,785 | |||||||||||||||||||||||||||||||||||||||||||||
- 12th Issuance, Serial A | US$ | 6,355,000 | Jan. 2009 | 7.125 | Per semester. | Jan. 2015 | 563 | 513 | 543 | 17,762 | 16,212 | 17,139 | 18,325 | 16,725 | 17,682 | |||||||||||||||||||||||||||||||||||||||||||||
|
|
|
|
|
|
|
|
|
|
|
|
|
|
|
|
|
| |||||||||||||||||||||||||||||||||||||||||||
| 79,756 | 79,793 | 4,921 | 118,536 | 185,649 | 265,648 | 198,292 | 265,442 | 270,569 | ||||||||||||||||||||||||||||||||||||||||||||||||||||
F-648
Table of Contents
GENERANDES PERÚ S.A. AND SUBSIDIARIES
Notes to the Consolidated Financial Statements
Creditor | Origin | Issued | Issuance | Annual | Payment of | Maturity | In thousands of S/. | |||||||||||||||||||||||||||||||||||||||||||||||||||||
Current portion | Non-current portion | Total debt in force as of | ||||||||||||||||||||||||||||||||||||||||||||||||||||||||||
12.31.2013 | 12.31.2012 | 12.31.2011 | 12.31.2013 | 12.31.2012 | 12.31.2011 | 12.31.2013 | 12.31.2012 | 12.31.2011 | ||||||||||||||||||||||||||||||||||||||||||||||||||||
Fourth Edegel Bond Program | ||||||||||||||||||||||||||||||||||||||||||||||||||||||||||||
- 1st Issuance, Serial A | US$ | 10,000,000 | Jul. 2009 | 6.625 | Per semester. | Jul. 2016 | 849 | 774 | 819 | 27,950 | 25,510 | 26,970 | 28,799 | 26,284 | 27,789 | |||||||||||||||||||||||||||||||||||||||||||||
- 2nd issuance, Serial A | US$ | 10,000,000 | Set. 2009 | 6.000 | Per semester. | Set. 2016 | 461 | 421 | 445 | 27,950 | 25,510 | 26,970 | 28,411 | 25,931 | 27,415 | |||||||||||||||||||||||||||||||||||||||||||||
- 4th Issuance, Serial A | US$ | 10,000,000 | Jan 2010 | 6.469 | Per semester. | Jan 2018 | 763 | 697 | 736 | 27,950 | 25,510 | 26,970 | 28,713 | 26,207 | 27,706 | |||||||||||||||||||||||||||||||||||||||||||||
- 5th Issuance, Serial A | US$ | 10,000,000 | Set. 2010 | 5.781 | Per semester. | Sept. 2020 | 404 | 369 | 390 | 27,950 | 25,510 | 26,970 | 28,354 | 25,879 | 27,360 | |||||||||||||||||||||||||||||||||||||||||||||
|
|
|
|
|
|
|
|
|
|
|
|
|
|
|
|
|
| |||||||||||||||||||||||||||||||||||||||||||
| 2,477 | 2,261 | 2,390 | 111,800 | 102,040 | 107,880 | 114,277 | 104,301 | 110,270 | ||||||||||||||||||||||||||||||||||||||||||||||||||||
|
|
|
|
|
|
|
|
|
|
|
|
|
|
|
|
|
| |||||||||||||||||||||||||||||||||||||||||||
| 107,939 | 108,074 | 62,652 | 230,336 | 312,689 | 423,528 | 338,275 | 420,763 | 486,180 | ||||||||||||||||||||||||||||||||||||||||||||||||||||
|
|
|
|
|
|
|
|
|
|
|
|
|
|
|
|
|
| |||||||||||||||||||||||||||||||||||||||||||
| (*) | The current portion of debt for bonds includes interests accrued and unpaid as of the date of the statement of financial position. |
(c) As of December 31, 2013, the main obligations that shall be complied by Subsidiaries related to bond programs are as follows:
Third, Fourth and Fifth Edegel Bond Programs
During the term of the bond issued within the Framework of the Third and Fourth Bond Program, Edegel S.A.A. shall maintain a debt ratio not more than 1.5 times. This debt ratio is calculated as the ratio of the consolidated financial debt (net of cash for up to US$ 50,000 thousand) to the net equity.
On September 23, 2013, Edegel S.A.A. registered its Fifth Corporate Bond Program in the Public Registry of Stock Market for an amount of US$ 350,000 thousand and for which no financial indicators have been established.
First Chinango Bond Program
The main restriction applicable to Chinango S.A.C. during the term of the bonds issued within the First Bond Program, consists of maintaining a debt ratio not more than 1.5 times. This ratio is calculated as the debt-to-equity ratio. In order to make such calculation, no liability for deferred income tax is considered.
F-649
Table of Contents
GENERANDES PERÚ S.A. AND SUBSIDIARIES
Notes to the Consolidated Financial Statements
In Management’s opinion, these obligations do not limit nor affect the Company and Subsidiaries’ operations and are being satisfactorily complied.
(d) On September 30, 2010, Edegel S.A.A. signed with BBVA Banco Continental a financing contract amounting to US$ 61,000 thousand for a seven-year term. The funds were used to pay three promissory notes with Banco Continental for a total amount of S/. 74,000 thousand and to pay the C.O.F installment with maturity in year 2012.
(e) On March 25, 2008, Edegel S.A.A. signed with Scotiabank S.A.A. a finance lease agreement for an amount of US$ 90,000 thousand for the construction of an open-cycle plant in Santa Rosa Power Plant (TG8 Unit) and associated systems. The final amount disbursed under this contract amounted to US$ 84,330 thousand.
(f) In February 2011, Chinango S.A.C. signed with Scotiabank del Perú a financing contract amounting to US$ 31,000 thousand for a seven-year term. Funds were used to pay two (2) short-term promissory notes with Banco de Crédito for a total of US$ 21,000 thousand and a promissory note with Banco Continental for S/. 29,400 thousand with maturity in 2012.
(g) In November 2012, Chinango S.A.C. signed with Bank of Nova Scotia a financing contract amounting to US$ 10,000 thousand for a five-year term. Funds were used to pay the 11th issuance, Serial A of the First Chinango Bond Program.
(h) The main obligations that Edegel S.A.A. shall comply by virtue of long-term bank contracts consist of: (i) Maintaining a debt ratio no more than 1.5 times, measured as the debt to equity ratio and (ii) Maintaining a financial debt ratio over EBITDA at the most of four times. Compliance with these obligations is supervised by Management and in its opinion; such obligations have been complied as of December 31, 2013, 2012 and 2011.
(i) The debt-to-equity ratio as of December 31, 2013, 2012 and 2011 was as follows
2013 | 2012 | 2011 | ||||||||||
Debt-to-equity ratio | 0.39 | 0.37 | 0.31 | |||||||||
F-650
Table of Contents
GENERANDES PERÚ S.A. AND SUBSIDIARIES
Notes to the Consolidated Financial Statements
(20) Hedging Instruments
(a) Derivative Instrument:
The structure of the derivative instruments as of December 31, 2013, 2012 and 2011 is as follows:
Counterparty | Value | Maturity | Protected debt | Protected | Fixed rate and value | In thousands of S/. | ||||||||||||||||||||||||||||||||||||||||||||||||||
Recorded asset | Recorded liability | Loss (gain) performed | ||||||||||||||||||||||||||||||||||||||||||||||||||||||
2013 | 2012 | 2011 | 2013 | 2012 | 2011 | 2013 | 2012 | 2011 | ||||||||||||||||||||||||||||||||||||||||||||||||
Interest rate swaps: | ||||||||||||||||||||||||||||||||||||||||||||||||||||||||
- Banco de Crédito del Perú | 10,000 | Nov. 2017 | Bank of Nova Scotia | LIBOR 3M | 0.62 | % | 36 | — | — | 14 | 33 | — | 86 | — | — | |||||||||||||||||||||||||||||||||||||||||
- Citibank N.A. | 3,600 | Mar. 2013 | | BCP—Medium term basis | | LIBOR 3M | 3.29% | — | — | — | — | 68 | 975 | 52 | 888 | (1,714 | ) | |||||||||||||||||||||||||||||||||||||||
- Scotiabank Perú | 21,267 | Mar. 2017 | Finance | |||||||||||||||||||||||||||||||||||||||||||||||||||||
| Lease Scotiabank | LIBOR 3M | 2.73% | — | — | — | 2,646 | 3,991 | 4,336 | 1,585 | 1,565 | (1,866 | ) | ||||||||||||||||||||||||||||||||||||||||||||
- Scotiabank Perú | 22,678 | Mar. 2017 | Finance | |||||||||||||||||||||||||||||||||||||||||||||||||||||
| lease Scotiabank | LIBOR 3M | 2.28% | — | — | — | 2,189 | 3,378 | 3,376 | 1,383 | 1,341 | (1,253 | ) | ||||||||||||||||||||||||||||||||||||||||||||
Currency swap: | ||||||||||||||||||||||||||||||||||||||||||||||||||||||||
- Banco Continental S.A. | 10,000 |
| Ago. 2012 | | Bco. Continental s/. 29,4 MM | | | Exchange rate | | US$10MM | — | — | — | — | — | — | — | — | 2,194 | |||||||||||||||||||||||||||||||||||||
- Banco Continental | 8,778 | Jan 2014 | | First Chinango Bond | | — | ||||||||||||||||||||||||||||||||||||||||||||||||||
| Program | Exchange | US$ 8.78 | — | |||||||||||||||||||||||||||||||||||||||||||||||||||||
| | - 13th Issuance, Serial B | | Rate | (MM) | 646 | 3,071 | 1,377 | — | — | — | (521 | ) | (586 | ) | 541 | |||||||||||||||||||||||||||||||||||||||||
|
|
|
|
|
|
|
|
|
|
|
|
|
|
|
|
|
| |||||||||||||||||||||||||||||||||||||||
| 682 | 3,071 | 1,377 | 4,849 | 7,470 | 8,687 | 2,585 | 3,208 | (2,098 | ) | |||||||||||||||||||||||||||||||||||||||||||||||
|
|
|
|
|
|
|
|
|
|
|
|
|
|
|
|
|
| |||||||||||||||||||||||||||||||||||||||
F-651
Table of Contents
GENERANDES PERÚ S.A. AND SUBSIDIARIES
Notes to the Consolidated Financial Statements
In thousands of S/. | ||||||||||||||||||||||||
12.31.2013 | 12.31.2012 | 12.31.2011 | ||||||||||||||||||||||
Assets | Liabilities | Assets | Liabilities | Assets | Liabilities | |||||||||||||||||||
Maturity | ||||||||||||||||||||||||
Current | 646 | 98 | 277 | 155 | 252 | 170 | ||||||||||||||||||
Non-current | 36 | 4,751 | 2,794 | 7,315 | 1,125 | 8,517 | ||||||||||||||||||
|
|
|
|
|
|
|
|
|
|
|
| |||||||||||||
| 682 | 4,849 | 3,071 | 7,470 | 1,377 | 8,687 | |||||||||||||||||||
|
|
|
|
|
|
|
|
|
|
|
| |||||||||||||
The fair value of hedge instruments is presented as an asset or liability, as applicable. Variations in the fair value of these instruments, net of its taxable effect, are recorded with a charge (credit) to the item “Hedge Reserves”.
Interest Rate Swap
Due to the construction of an open-cycle plant in Santa Rosa Power Plant (TG8 Unit) and associated systems, on March 25, 2008, Edegel S.A.A. signed with Scotiabank S.A.A. a finance lease agreement for an amount of US$ 90,000 thousand that bears an interest rate of 90 day LIBOR plus 1.75% with final maturity in March 2017. In order to fix the interest rate of such debt; Edegel S.A.A. entered into two swap transactions for an amount of US$ 30,000 thousand each one. The fixed interest rate after the swap transactions are 2.73% and 2.28%, respectively.
In November 2012, Chinango S.A.C. signed with Bank of Nova Scotia a financing contract amounting to US$ 10,000 thousand for a five-year term. Funds were used to pay the 11th issuance, Serial A of the First Chinango Bond Program. In order to fix the interest rate, Chinango S.A.C. entered into a swap transaction with Banco de Crédito for an amount of US$ 10,000 thousand. The fixed interest rate after the swap transaction is 0.624%.
Currency Swap
These derivative instruments were hired by Chinango S.A.C. in order to maintain an appropriate balance between expected cash flows in U.S. dollars (or indexed in dollars) and its financial obligations stated in that currency.
Through these instruments denominated “Currency and Interest Rate Swaps”, Chinango S.A.C. has exchanged its obligations in soles for obligations in dollars. In this sense, at each due date of the interest period of hedged debts, Chinango S.A.C. pays to the counterpart of the CCIRS the interests on the obligation in dollars at a rate agreed in the CCIRS contract and receives, in turn, the amount in nuevos soles necessary to meet the payment of the interest on the hedged debt in nuevos soles at a rate agreed with the corresponding creditor.
The Subsidiaries evaluate effectiveness of each hedging of derivative instruments at contracting date and have proven their effectiveness as of December 31, 2013, 2012 and 2011.
F-652
Table of Contents
GENERANDES PERÚ S.A. AND SUBSIDIARIES
Notes to the Consolidated Financial Statements
Financial derivatives contracted by the Subsidiaries as of December 31, 2013, 2012 and 2011, their fair value and maturity breakdown, of the face or contractual values is detailed as follows:
In thousands of S/. | ||||||||||||||||||||||||||||
December 31, 2013 | ||||||||||||||||||||||||||||
Notional value | ||||||||||||||||||||||||||||
Fair | Before | 1-2 years | 2-3 years | 3-4 years | 4-5 | Total | ||||||||||||||||||||||
Cash flow hedge | ||||||||||||||||||||||||||||
- Interest rate swap | (4,813 | ) | (13,804 | ) | (21,504 | ) | (21,504 | ) | (38,061 | ) | — | (94,873 | ) | |||||||||||||||
|
|
|
|
|
|
|
|
|
|
|
|
|
| |||||||||||||||
- Currency Swap | 646 | 24,535 | — | — | — | — | 24,535 | |||||||||||||||||||||
|
|
|
|
|
|
|
|
|
|
|
|
|
| |||||||||||||||
In thousands of S/. | ||||||||||||||||||||||||||||
December 31, 2012 | ||||||||||||||||||||||||||||
Notional value | ||||||||||||||||||||||||||||
Fair | Before | 1-2 years | 2-3 years | 3-4 years | 4-5 years | Total | ||||||||||||||||||||||
Cash flow hedge | ||||||||||||||||||||||||||||
- Interest rate swap | (7,470 | ) | (28,160 | ) | (25,355 | ) | (32,383 | ) | (32,383 | ) | (47,494 | ) | (165,775 | ) | ||||||||||||||
|
|
|
|
|
|
|
|
|
|
|
|
|
| |||||||||||||||
- Currency Swap | 3,071 | — | 22,393 | — | — | — | 22,393 | |||||||||||||||||||||
|
|
|
|
|
|
|
|
|
|
|
|
|
| |||||||||||||||
In thousands of S/. | ||||||||||||||||||||||||||||||||
December 31, 2011 | ||||||||||||||||||||||||||||||||
Notional value | ||||||||||||||||||||||||||||||||
Fair | Before | 1-2 years | 2-3 years | 3-4 years | 4-5 years | Subsequent | Total | |||||||||||||||||||||||||
Cash flow hedge | ||||||||||||||||||||||||||||||||
- Interest rate swap | (8,687 | ) | (49,240 | ) | (29,772 | ) | (20,063 | ) | (27,493 | ) | (27,493 | ) | (43,469 | ) | (197,530 | ) | ||||||||||||||||
|
|
|
|
|
|
|
|
|
|
|
|
|
| |||||||||||||||||||
- Currency Swap | 1,377 | — | — | 23,675 | — | — | 23,675 | |||||||||||||||||||||||||
|
|
|
|
|
|
|
|
|
|
|
|
|
| |||||||||||||||||||
As of December 31, 2013 and 2012, the payment schedule of the non-current portion of long-term financial liabilities is as follows:
| In thousands of S/. | |||||||||||
2013 | 2012 | 2011 | ||||||||||
Year 2013 | — | — | 140,415 | |||||||||
Year 2014 | — | 139,840 | 136,906 | |||||||||
Year 2015 | 101,231 | 92,394 | 90,939 | |||||||||
Year 2016 | 167,319 | 152,656 | 154,709 | |||||||||
Year 2017 or more | 370,449 | 345,509 | 355,511 | |||||||||
|
|
|
|
|
| |||||||
| 638,999 | 730,399 | 878,480 | ||||||||||
|
|
|
|
|
| |||||||
(b) Non Derivative Instrument:
As of December 31, 2013, from the debt in U.S. dollars of Subsidiaries, the amount of S/. 673,812 thousand are related to the future cash flow hedge for the income of the Subsidiaries’ activities that are related to the U.S. dollar (note 4 (v)). As of December 31, 2012, such amount amounted to S/. 642,219 thousand.
F-653
Table of Contents
GENERANDES PERÚ S.A. AND SUBSIDIARIES
Notes to the Consolidated Financial Statements
As of December 31, 2011, from the debt in U.S. dollars of Subsidiaries, the amount of S/. 814,769 thousand are related to the future cash flow hedge for the income of the Subsidiaries’ activities that are related to the U.S. dollar (note 4 (v)). As of December 31, 2010, such amount amounted to S/. 857,324 thousand.
The exchange difference generated for this debt is presented in the Statement of Changes in Equity in the item “Hedge Reserves”. The activity during 2013, 2012 and 2011, net of its taxable effect has been as follows:
In thousands of S/. | ||||||||||||
2013 | 2012 | 2011 | ||||||||||
Balance in net variation reserves for cash flow hedges at the beginning of the period | 87,517 | 70,928 | 55,790 | |||||||||
Translation effect recorded in equity | (40,982 | ) | 28,303 | 24,325 | ||||||||
Allocation of translation effect transferred to profit or loss | (10,670 | ) | (11,714 | ) | (9,187 | ) | ||||||
|
|
|
|
|
| |||||||
| 35,865 | 87,517 | 70,928 | ||||||||||
|
|
|
|
|
| |||||||
(21) Deferred Income Tax
(a) This caption comprises the following:
In thousands of S/. | ||||||||||||||||
Balances as | (Charge) credit | Charge | Balances as | |||||||||||||
Deferred assets: | ||||||||||||||||
Impairment of property, plant, and equipment | (320 | ) | — | — | (320 | ) | ||||||||||
Inventory obsolescence | (2,500 | ) | — | — | (2,500 | ) | ||||||||||
Provision for Technical Quality Standard | (436 | ) | — | — | (436 | ) | ||||||||||
Reimbursement for material damage | — | (20,243 | ) | — | (20,243 | ) | ||||||||||
Other provisions | (6,550 | ) | 109 | 775 | (5,666 | ) | ||||||||||
|
|
|
|
|
|
|
| |||||||||
| (9,806 | ) | (20,134 | ) | 775 | (29,165 | ) | ||||||||||
|
|
|
|
|
|
|
| |||||||||
Deferred liabilities: | ||||||||||||||||
Basis difference of the cost of property, plant and equipment | 397,834 | (4,434 | ) | — | 393,400 | |||||||||||
Difference in depreciation rate of property, plant and equipment | 292,103 | (4,438 | ) | — | 287,665 | |||||||||||
Indirect costs and capitalized finance costs during the construction, net | 21,961 | (2,533 | ) | — | 19,428 | |||||||||||
Difference in depreciation rate of finance lease assets | 34,643 | (6,438 | ) | — | 28,205 | |||||||||||
Exchange difference on debt associated to the acquisition of property, plant and equipment | 5,262 | (696 | ) | — | 4,566 | |||||||||||
Investment in Subsidiary | 36,532 | (285 | ) | — | 36,247 | |||||||||||
Other | 826 | 6 | (695 | ) | 137 | |||||||||||
|
|
|
|
|
|
|
| |||||||||
| 789,161 | (18,818 | ) | (695 | ) | 769,648 | |||||||||||
|
|
|
|
|
|
|
| |||||||||
| 779,355 | (38,952 | ) | 80 | 740,483 | ||||||||||||
|
|
|
|
|
|
|
| |||||||||
F-654
Table of Contents
GENERANDES PERÚ S.A. AND SUBSIDIARIES
Notes to the Consolidated Financial Statements
In thousands of S/. | ||||||||||||||||
Balances as of | (Charge) credit | (Charge) credit | Balances as of | |||||||||||||
Deferred assets: | ||||||||||||||||
Impairment of property, plant, and equipment | (320 | ) | — | — | (320 | ) | ||||||||||
Inventory obsolescence | (2,440 | ) | (60 | ) | — | (2,500 | ) | |||||||||
Provision for Technical Quality Standard | (1,276 | ) | 840 | — | (436 | ) | ||||||||||
Other provisions | (4,041 | ) | (2,917 | ) | 408 | (6,550 | ) | |||||||||
|
|
|
|
|
|
|
| |||||||||
| (8,077 | ) | (2,137 | ) | 408 | (9,806 | ) | ||||||||||
|
|
|
|
|
|
|
| |||||||||
Deferred liabilities: | ||||||||||||||||
Basis difference of the cost of property, plant and equipment | 397,110 | 724 | — | 397,834 | ||||||||||||
Difference in depreciation rate of property, plant and equipment | 295,399 | (3,296 | ) | — | 292,103 | |||||||||||
Indirect costs and capitalized finance costs during the construction, net | 25,268 | (3,307 | ) | — | 21,961 | |||||||||||
Difference in depreciation rate of finance lease assets | 34,041 | 602 | — | 34,643 | ||||||||||||
Exchange difference on debt associated to the acquisition of property, plant and equipment | 4,513 | 749 | — | 5,262 | ||||||||||||
Investment in Subsidiary | 20,625 | 15,907 | — | 36,532 | ||||||||||||
Other | 373 | (38 | ) | 491 | 826 | |||||||||||
|
|
|
|
|
|
|
| |||||||||
| 777,329 | 11,341 | 491 | 789,161 | |||||||||||||
|
|
|
|
|
|
|
| |||||||||
| 769,252 | 9,204 | 899 | 779,355 | |||||||||||||
|
|
|
|
|
|
|
| |||||||||
(b) The composition of the deferred income tax in profit or loss was as follows:
In thousands of S/. | ||||||||
2013 | 2012 | |||||||
For temporary differences on income determination | (38,952 | ) | 9,204 | |||||
For accrual of equity reserves | 22,136 | (6,915 | ) | |||||
|
|
|
| |||||
| (16,816 | ) | 2,289 | ||||||
|
|
|
| |||||
(22) Equity
(a) Share capital
As of December 31, 2013, 2012 and 2011, the share capital of the Company is represented by 853,429,020 common shares fully subscribed and paid with a par value of S/.1.00 per share.
As of December 2013, 2012 and 2011, the shareholding structure of the Company was as follows:
Stockholders | Class of | Number of | % | |||||||||
Endesa Chile S.A. | A | 520,578,464 | 61.00 | |||||||||
Southern Cone power Perú S.A. | B | 332,850,556 | 39.00 | |||||||||
|
|
|
| |||||||||
| 853,429,020 | 100.00 | |||||||||||
|
|
|
| |||||||||
F-655
Table of Contents
GENERANDES PERÚ S.A. AND SUBSIDIARIES
Notes to the Consolidated Financial Statements
Both types of shares have the same rights and obligations with the sole exception that Class B shares of the Company are listed in the Lima Stock Exchange.
(b) Other Capital Reserve
According to legal standards in force, the Company is required to allocate a minimum of 10% of the net profit to a legal reserve until it equals 20% of its capital stock. The legal reserve may be used to compensate losses or may be capitalized, being compulsory to refund it in both cases.
General Stockholders’ Meeting dated March 22, 2013; March 31, 2012 and March 28, 2011, approved to allocate 10% of the profits available for periods 2012, 2011 and 2010, amounting to S/. 10,166, S/. 6,198 and S/. 11,596 thousand, respectively to increase the legal reserve.
(c) Dividends paid
The Company has as policy of dividend and advances payments to distribute total funds received from Subsidiaries for these items, deducting the amount corresponding to operating expenses of the period. In that sense, during 2013, 2012 and 2011, the following dividends were declared:
| • | At Board of Directors’ Meeting dated October 17, 2013, it was agreed to pay dividends on account of profit or loss of period 2013 for S/. 38,080 thousand equivalent to S/. 0.044620 cents per share. |
| • | At Board of Directors’ Meeting dated July 18, 2013, it was agreed to pay dividends on account of profit or loss of period 2013 for S/. 90,029 thousand equivalent to S/. 0.105491 cents per share. |
| • | At General Stockholders’ Meeting, held on March 22, 2013, an agreement was reached to distribute dividends amounting to S/. 54,394 thousand equivalent to S/. 0.063736 cents per share. |
| • | At Board of Directors’ Meeting dated October 18, 2012, it was agreed to pay dividends on account of profit or loss of period 2012 for S/. 27,690 thousand equivalent to S/. 0.032446 cents per share. |
| • | At Board of Directors’ Meeting dated July 19, 2012, it was agreed to pay dividends on account of profit or loss of period 2012 for S/. 66,800 thousand equivalent to S/. 0.078272 cents per share. |
| • | At General Stockholders’ Meeting, held on March 31, 2012, an agreement was reached to distribute dividends amounting to S/. 6,938 thousand equivalent to S/. 0.008129 cents per share. |
| • | At Board of Directors’ Meeting dated October 28, 2011, it was agreed to pay dividends on account of profit or loss of period 2011 for S/. 26,990 thousand equivalent to S/. 0.031625 cents per share. |
| • | At Board of Directors’ Meeting dated July 21, 2011, it was agreed to pay dividends on account of profit or loss of period 2011 for S/. 74,812 thousand equivalent to S/. 0.087660 cents per share. |
| • | At General Stockholders’ Meeting, held on March 28, 2011, an agreement was reached to distribute dividends amounting to S/. 23,811 thousand equivalent to S/. 0.0279 cents per share. |
Dividends paid to individuals and non-domiciled legal entities in Peru are subject to a withdrawal of 4.1%.
F-656
Table of Contents
GENERANDES PERÚ S.A. AND SUBSIDIARIES
Notes to the Consolidated Financial Statements
(23) Sales Income:
This caption comprises the following:
In thousands of S/. | ||||||||
2013 | 2012 | |||||||
Energy | ||||||||
Third parties | 658,762 | 680,575 | ||||||
Related parties | 316,737 | 372,960 | ||||||
|
|
|
| |||||
| 975,499 | 1,053,535 | |||||||
|
|
|
| |||||
Power and toll: | ||||||||
Third parties | 295,360 | 275,867 | ||||||
Related parties | 140,512 | 164,776 | ||||||
|
|
|
| |||||
| 435,872 | 440,643 | |||||||
Other operating income | 15,243 | 17,003 | ||||||
|
|
|
| |||||
Total energy, power and toll | 1,426,614 | 1,511,181 | ||||||
|
|
|
| |||||
Other: | ||||||||
Compensations with third parties | 5,694 | 12,958 | ||||||
Compensations with related parties | 135 | — | ||||||
|
|
|
| |||||
| 5,829 | 12,958 | |||||||
|
|
|
| |||||
Total income | 1,432,443 | 1,524,139 | ||||||
|
|
|
| |||||
(24) Generation Costs
This caption comprises the following:
In thousands of S/. | ||||||||
2013 | 2012 | |||||||
Natural gas supply, transport and distribution | 276,158 | 273,211 | ||||||
Depreciation and amortization (note 27) | 206,962 | 207,905 | ||||||
Impairment of machine and equipment | 36,006 | — | ||||||
Purchase of energy, power and toll (a) | 131,945 | 222,463 | ||||||
Services rendered by third parties (b) | 57,025 | 54,976 | ||||||
Water royalties and electricity taxes | 21,618 | 22,853 | ||||||
Personnel expenses (note 26) | 39,040 | 36,573 | ||||||
Consumption of various supplies | 14,087 | 13,592 | ||||||
Various charges for operations | 46,582 | 25,602 | ||||||
Compensation for additional generation | 41,671 | 39,549 | ||||||
Consumption of oil | 8,602 | 28,119 | ||||||
Taxes | 3,463 | 3,449 | ||||||
Other | 3,530 | 1,307 | ||||||
|
|
|
| |||||
| 886,689 | 929,599 | |||||||
|
|
|
| |||||
| (a) | It includes purchases to related entities (note 8 (d)). |
| (b) | It includes services rendered by related entities for S/. 521 thousand (S/. 388 during period 2012). |
F-657
Table of Contents
GENERANDES PERÚ S.A. AND SUBSIDIARIES
Notes to the Consolidated Financial Statements
(25) Administrative Expenses
This caption comprises the following:
In thousands of S/. | ||||||||
2013 | 2012 | |||||||
Personnel expenses (note 26) | 31,094 | 30,345 | ||||||
Services rendered by third parties (a) | 13,356 | 11,596 | ||||||
Taxes | 1,863 | 1,732 | ||||||
Various charges for operations | 3,046 | 2,788 | ||||||
Depreciation and amortization (note 27) | 2,659 | 2,614 | ||||||
Tax sanctions | 289 | — | ||||||
Other | 1,013 | 1,478 | ||||||
|
|
|
| |||||
| 53,320 | 50,553 | |||||||
|
|
|
| |||||
| (a) | It includes services rendered by related parties for S/. 1,701 thousand (S/. 1,389 during period 2012). |
(26) Personnel Expenses
This caption comprises the following:
In thousands of S/. | ||||||||
2013 | 2012 | |||||||
Remunerations | 29,691 | 31,478 | ||||||
Workers’ Profit Sharing | 28,674 | 26,107 | ||||||
Social contributions | 3,781 | 3,432 | ||||||
Vacations | 3,569 | 2,190 | ||||||
Others | 4,419 | 3,711 | ||||||
|
|
|
| |||||
| 70,134 | 66,918 | |||||||
|
|
|
| |||||
Personnel expenses are distributed as follows:
In thousands of S/. | ||||||||
2013 | 2012 | |||||||
Generation costs (note 24) | 39,040 | 36,573 | ||||||
Administrative expenses (note 25) | 31,094 | 30,345 | ||||||
|
|
|
| |||||
| 70,134 | 66,918 | |||||||
|
|
|
| |||||
F-658
Table of Contents
GENERANDES PERÚ S.A. AND SUBSIDIARIES
Notes to the Consolidated Financial Statements
(27) Depreciation and Amortization
This caption comprises the following:
In thousands of S/. | ||||||||
2013 | 2012 | |||||||
Depreciation of property, plant, and equipment (note 13) | ||||||||
Generation costs (note 24) | 205,298 | 207,753 | ||||||
Administrative expenses (note 25) | 1,992 | 1,926 | ||||||
|
|
|
| |||||
| 207,290 | 209,679 | |||||||
Amortization of intangible assets (note 14) | ||||||||
Generation costs (note 24) | 1,664 | 152 | ||||||
Administrative expenses (note 25) | 667 | 688 | ||||||
|
|
|
| |||||
| 2,331 | 840 | |||||||
|
|
|
| |||||
| 209,621 | 210,519 | |||||||
|
|
|
| |||||
(28) Other Operating Income
This caption comprises the following:
In thousands of S/. | ||||||||
2013 | 2012 | |||||||
Reimbursement for material damages and income loss (note 9 and 13 (g)) | 103,511 | — | ||||||
Administrative services to related parties | 3,021 | 2,425 | ||||||
Profit on sale of property, plant, and equipment | 196 | 3,052 | ||||||
Operating and maintenance services | 1,601 | — | ||||||
Transfer of natural gas transport capacity | 3,299 | 2,974 | ||||||
Service of network movements | 3,683 | 1,329 | ||||||
Other Income | 3,901 | 2,810 | ||||||
|
|
|
| |||||
| 119,212 | 12,590 | |||||||
|
|
|
| |||||
(29) Finance Income and Costs
This caption comprises the following:
In thousands of S/. | ||||||||
2013 | 2012 | |||||||
Interest on bank deposits | 4,853 | 6,634 | ||||||
Other | 115 | 72 | ||||||
|
|
|
| |||||
| 4,968 | 6,706 | |||||||
|
|
|
| |||||
F-659
Table of Contents
GENERANDES PERÚ S.A. AND SUBSIDIARIES
Notes to the Consolidated Financial Statements
Financial costs comprise:
In thousands of S/. | ||||||||
2013 | 2012 | |||||||
Unwinding of the discount of provisions (note 34) | 299 | 3,248 | ||||||
Interest on bonds | 24,746 | 30,662 | ||||||
Interest on bank loans | 9,971 | 11,122 | ||||||
Interest on leasing | 3,670 | 4,894 | ||||||
Loss for derivative instruments | 2,585 | 3,208 | ||||||
Other | 2,365 | 1,635 | ||||||
|
|
|
| |||||
| 43,636 | 54,769 | |||||||
|
|
|
| |||||
(30) Income tax
Below there is the income tax expense shown in the consolidated statement of income as of December 31, 2013, 2012 and 2011:
In thousands of S/. | ||||||||
2013 | 2012 | |||||||
Current | 184,542 | 175,060 | ||||||
Deferred | (16,816 | ) | 2,289 | |||||
|
|
|
| |||||
| 167,726 | 177,349 | |||||||
|
|
|
| |||||
Reconciliation of effective rates of Income Tax as of December 31, 2013 and 2012 to the tax rate is as follows:
2013 | 2012 | |||||||||||||||
En miles | % | En miles | % | |||||||||||||
Profit before income tax | 622,091 | 100.00 | 563,414 | 100.00 | ||||||||||||
Provision for income tax calculated as per tax rate | 186,627 | 30.00 | 169,024 | 30.00 | ||||||||||||
Tax effect on additions and deductions | 1,157 | 0.19 | 8,325 | 1.48 | ||||||||||||
Reimbursement for material damages | (20,058 | ) | (4.41 | ) | — | — | ||||||||||
|
|
|
|
|
|
|
| |||||||||
Gasto registrado por impuesto a las ganancias | 167,726 | 25.78 | 177,349 | 31.48 | ||||||||||||
|
|
|
|
|
|
|
| |||||||||
(31) Earnings per Share
Calculation of basic and diluted earnings attributable to controlling interests as of December 31, 2013, 2012 and 2011 is presented as follows:
In thousands of S/. | ||||||||
2013 | 2012 | |||||||
Profit | 239,878 | 201,703 | ||||||
Nº of shares (in thousands) | 853,429 | 853,429 | ||||||
Basic and diluted earnings per share | 0.281 | 0.236 | ||||||
F-660
Table of Contents
GENERANDES PERÚ S.A. AND SUBSIDIARIES
Notes to the Consolidated Financial Statements
(32) Tax Matters
| (a) | Company’s income and sales tax returns for years 2009 through 2013 are open to review by tax authorities. |
The income tax returns for fiscal years 2010 through 2013 of Edegel S.A.A. are open for review by the Peruvian tax authorities. The Tax Authority has reviewed periods until 2008, giving notice of the corresponding determination resolutions and fine for periods 2007 and 2008 to the Subsidiary. The Subsidiary has appealed the resolution corresponding to period 2007 and claiming for those corresponding to period 2008. Currently, the Tax Authority is reviewing the Income Tax and Sales Tax of period 2009.
Likewise, the Tax Authority has reviewed the Income Tax of periods 2010 and 2011 of Chinango S.A.C. issuing the corresponding determination and fine resolutions of period 2010 which are appealed by the Subsidiary. For 2011, the Subsidiary is waiting for the issuance of the corresponding resolutions. Tax obligations related to the income tax of periods 2009, 2012 and 2013 and sales tax corresponding to periods 2009 to 2013 have a pending tax inspection by the Tax Authority.
Any major expenses exceeding the provisions made to cover the tax obligations will be charged to the results of the period in which those expenses are finally settled. It is the opinion of the Company’s management and its Subsidiaries that, as a result of this review, no significant liabilities will affect the consolidated financial statements as of December 31, 2013, 2012 and 2011.
In accordance with current tax legislation, corporate income tax for the years 2013 and 2012 is calculated on the basis of the net taxable income at a rate of 30% over the net taxable profit (after deducting the expense for workers’ profit sharing calculated with a rate of 5%).
| (b) | For income tax purposes, the market value of the transactions between related parties shall be determined based on transfer pricing standards. These standards define, among others, coverage, relationship criteria, as well as comparability analysis, methodology, adjustments and information. The standards establish that under certain conditions, companies are required to have a Technical Study Report supporting the calculation of transfer pricing with related parties. Likewise, this obligation is required for all transactions made from, towards or through territories with low or null taxation. |
The Company’s management and its Subsidiaries consider that for income, sales, and excise tax purposes, pricing regarding transactions such as those aforementioned has been made in accordance with tax legislation; consequently, no significant liabilities will arise as of December 31, 2013, 2012 and 2011.
| (c) | The total or partial distribution of dividends, or other types of profit distributed by entities domiciled in Peru, is subject to a 4.1% income tax, except for the distribution of profits made in favor of another entity domiciled in the Peru. |
| (d) | In 2005, a temporary tax on net assets (ITAN, for its Spanish acronym) was established. The taxable base is the prior period adjusted net asset value less depreciations, amortizations, legal cash reserve, and specific provisions for credit risk. The tax rate is 0.4% for years 2013 and 2012 and is applied to the amount of net assets exceeding S/. 1 million. It may be paid in cash or in nine consecutive monthly installments. The paid amount can be used as a credit for partial payments of income tax general regime for the taxable periods from March to December of the fiscal period in which the tax was paid until maturity date of each of the partial payment, and against the payment for regularization of income tax of the corresponding taxable period. |
F-661
Table of Contents
GENERANDES PERÚ S.A. AND SUBSIDIARIES
Notes to the Consolidated Financial Statements
| (e) | Technical assistance provided by non-domiciled entities will be subject to a 15% withholding income tax, regardless of the place where the service is rendered, and subject to compliance with the Income Tax Law requirements. |
| (f) | Tax on Financial Transactions (ITF) for fiscal period 2013 was fixed at the rate of 0.005%. This tax is applied on charges and debits in bank accounts or movements of funds made through the financial system, unless the account is tax-exempt. |
(33) Commitments
The Subsidiaries have the following commitments as of December 31, 2013; these commitments are not for a fixed price.
(a) Electricity Supply Contracts
Contracts with Regulated Clients:
Client | Beginning | Ending | Energy Supply contracted | |||
Edelnor S.A.A. (LP) | 1/1/2014 | 12/31/2021 | Up to 30.8 MW | |||
Edelnor S.A.A. (LP) | 1/1/2014 | 12/31/2023 | Up to 28.2 MW | |||
Edelnor S.A.A. (LP) | 1/1/2014 | 12/31/2023 | Up to 28.2 MW | |||
Edelnor S.A.A. (LP) | 1/1/2014 | 12/31/2025 | Up to 0.9 MW | |||
Edelnor S.A.A. (LP) | 1/1/2014 | 12/31/2025 | Up to 28.7 MW | |||
Edelnor S.A.A. (LP) | 1/1/2014 | 12/31/2025 | Up to 166.7 MW | |||
Luz del Sur S.A.A. (LP) | 1/1/2014 | 12/31/2021 | Up to 24.8 MW | |||
Luz del Sur S.A.A. (LP) | 1/1/2014 | 12/31/2023 | Up to 23.9 MW | |||
Luz del Sur S.A.A. (LP) | 1/1/2014 | 12/31/2023 | Up to 23.9 MW | |||
Luz del Sur S.A.A. (LP) | 1/1/2014 | 12/31/2025 | Up to 0.7 MW | |||
Luz del Sur S.A.A. (LP) | 1/1/2014 | 12/31/2025 | Up to 23.1 MW | |||
Luz del Sur S.A.A. (LP) | 1/1/2014 | 12/31/2025 | Up to 134.1 MW | |||
Electrosur S.A. (LP) | 1/1/2014 | 12/31/2021 | Up to 1.7 MW | |||
Electrosur S.A. (LP) | 1/1/2014 | 12/31/2023 | Up to 3.2 MW | |||
Electrosur S.A. (LP) | 1/1/2014 | 12/31/2023 | Up to 3.2 MW | |||
Electrosur S.A. (LP) | 1/1/2014 | 12/31/2025 | Up to 0.1 MW | |||
Electrosur S.A. (LP) | 1/1/2014 | 12/31/2025 | Up to 3.4 MW | |||
Electrosur S.A. (LP) | 1/1/2014 | 12/31/2025 | Up to 19.8 MW | |||
Edecañete S.A.A (LP) | 1/1/2014 | 12/31/2021 | Up to 0.74 MW | |||
Electrosureste S.A. (LP) | 1/1/2014 | 12/31/2021 | Up to 2.5 MW | |||
Electrosureste S.A. (LP) | 1/1/2014 | 12/31/2023 | Up to 4.4 MW | |||
Electrosureste S.A. (LP) | 1/1/2014 | 12/31/2023 | Up to 4.4 MW | |||
Electrosureste S.A. (LP) | 1/1/2014 | 12/31/2025 | Up to 0.1 MW | |||
Electrosureste S.A. (LP) | 1/1/2014 | 12/31/2025 | Up to 4.5 MW | |||
Electrosureste S.A. (LP) | 1/1/2014 | 12/31/2025 | Up to 26.0 MW | |||
Electropuno S.A. (LP) | 1/1/2014 | 12/31/2021 | Up to 2.7 MW | |||
Electropuno S.A. (LP) | 1/1/2014 | 12/31/2023 | Up to 2.9 MW | |||
Electropuno S.A. (LP) | 1/1/2014 | 12/31/2023 | Up to 2.9 MW | |||
Electropuno S.A. (LP) | 1/1/2014 | 12/31/2025 | Up to 0.1 MW | |||
Electropuno S.A. (LP) | 1/1/2014 | 12/31/2025 | Up to 3.0 MW | |||
Electropuno S.A. (LP) | 1/1/2014 | 12/31/2025 | Up to 17.4 MW |
F-662
Table of Contents
GENERANDES PERÚ S.A. AND SUBSIDIARIES
Notes to the Consolidated Financial Statements
Client | Beginning | Ending | Energy Supply contracted | |||
Seal S.A. (LP) | 1/1/2014 | 12/31/2021 | Up to 4.5 MW | |||
Seal S.A. (LP) | 1/1/2014 | 12/31/2023 | Up to 5.3 MW | |||
Seal S.A. (LP) | 1/1/2014 | 12/31/2023 | Up to 5.3 MW | |||
Seal S.A. (LP) | 1/1/2014 | 12/31/2025 | Up to 0.2 MW | |||
Seal S.A. (LP) | 1/1/2014 | 12/31/2025 | Up to 4.9 MW | |||
Seal S.A. (LP) | 1/1/2014 | 12/31/2025 | Up to 28.6 MW | |||
Hidrandina S.A. | 9/1/2012 | 12/31/2015 | Up to 33.2 MW in 2012 | |||
| Up to 20.9 MW in 2013 | ||||||
| Up to 110.3 MW in 2014 | ||||||
| Up to 48.2 MW in 2015 | ||||||
Electrocentro S.A. | 9/1/2012 | 12/31/2015 | Up to 10.0 MW in 2012 | |||
| Up to 12.5 MW in 2013 | ||||||
| Up to 54.0 MW in 2014 | ||||||
| Up to 14.6 MW in 2015 | ||||||
Electronoroeste S.A. | 6/1/2014 | 12/31/2014 | Up to 39.0 MW | |||
Edelnor S.A.A. | 1/1/2016 | 12/31/2027 | 67.8 MW | |||
Edelnor S.A.A. (LP) | 1/1/2014 | 12/31/2021 | Up to 6.3 MW | |||
Edelnor S.A.A. (LP) | 1/1/2014 | 12/31/2023 | Up to 5.8 MW | |||
Edelnor S.A.A. (LP) | 1/1/2014 | 12/31/2023 | Up to 5.8 MW | |||
Edelnor S.A.A. (LP) | 1/1/2014 | 12/31/2025 | Up to 5.5 MW | |||
Edelnor S.A.A. (LP) | 1/1/2014 | 12/31/2025 | Up to 34.1MW | |||
Luz del Sur S.A.A. (LP) | 1/1/2014 | 12/31/2021 | Up to 5.1 MW | |||
Luz del Sur S.A.A. (LP) | 1/1/2014 | 12/31/2023 | Up to 4.9 MW | |||
Luz del Sur S.A.A. (LP) | 1/1/2014 | 12/31/2023 | Up to 4.9 MW | |||
Luz del Sur S.A.A. (LP) | 1/1/2014 | 12/31/2025 | Up to 4.4 MW | |||
Luz del Sur S.A.A. (LP) | 1/1/2014 | 12/31/2025 | Up to 27.5 MW | |||
Electrosur S.A. (LP) | 1/1/2014 | 12/31/2021 | Up to 0.3 MW | |||
Electrosur S.A. (LP) | 1/1/2014 | 12/31/2023 | Up to 0.7 MW | |||
Electrosur S.A. (LP) | 1/1/2014 | 12/31/2023 | Up to 0.7 MW | |||
Electrosur S.A. (LP) | 1/1/2014 | 12/31/2025 | Up to 0.7 MW | |||
Electrosur S.A. (LP) | 1/1/2014 | 12/31/2025 | Up to 7.1 MW | |||
Edecañete S.A.A (LP) | 1/1/2014 | 12/31/2021 | Up to 0.2 MW | |||
Electrosureste S.A. (LP) | 1/1/2014 | 12/31/2021 | Up to 0.5 MW | |||
Electrosureste S.A. (LP) | 1/1/2014 | 12/31/2023 | Up to 0.9 MW | |||
Electrosureste S.A. (LP) | 1/1/2014 | 12/31/2023 | Up to 0.9 MW | |||
Electrosureste S.A. (LP) | 1/1/2014 | 12/31/2025 | Up to 0.9 MW | |||
Electrosureste S.A. (LP) | 1/1/2014 | 12/31/2025 | Up to 5.3 MW | |||
Electropuno S.A. (LP) | 1/1/2014 | 12/31/2021 | Up to 0.6 MW | |||
Electropuno S.A. (LP) | 1/1/2014 | 12/31/2023 | Up to 0.6 MW | |||
Electropuno S.A. (LP) | 1/1/2014 | 12/31/2023 | Up to 0.6 MW | |||
Electropuno S.A. (LP) | 1/1/2014 | 12/31/2025 | Up to 0.6 MW | |||
Electropuno S.A. (LP) | 1/1/2014 | 12/31/2025 | Up to 3.6 MW | |||
Seal S.A. (LP) | 1/1/2014 | 12/31/2021 | Up to 0.9 MW | |||
Seal S.A. (LP) | 1/1/2014 | 12/31/2023 | Up to 1.0 MW | |||
Seal S.A. (LP) | 1/1/2014 | 12/31/2023 | Up to 1.0 MW | |||
Seal S.A. (LP) | 1/1/2014 | 12/31/2025 | Up to 0.9 MW | |||
Seal S.A. (LP) | 1/1/2014 | 12/31/2025 | Up to 5.9 MW |
F-663
Table of Contents
GENERANDES PERÚ S.A. AND SUBSIDIARIES
Notes to the Consolidated Financial Statements
Contracts with Free Market Clients:
Client | Beginning | Ending | Energy Supply Contracted | |||
Empresa Siderúrgica del Perú S.A. | 5/8/1997 | 12/31/2017 | 55 MW in HFP, 13 MW in HP since February 2009. | |||
Votorantim Metais - | 2/1/2001 | 2/28/2017 | 60 MW in HP, 125 MW in HFP. | |||
Votorantim Metais - | 9/1/2009 | 8/31/2019 | 10 MW in HP and 57 MW in HFP. | |||
Compañía Minera Antamina S.A. | 5/27/1999 | 12/31/2014 | Up to a maximum of 121.5 MW until the termination of the contract | |||
Industrias Electroquímicas S.A. | 10/1/2005 | 12/31/2014 | Up to 2.7 MW | |||
Tejidos San Jacinto S.A. | 5/1/2011 | 4/30/2016 | Up to 7.5 MW | |||
Compañía Textil Credisa | 8/1/2010 | 12/31/2015 | Up to 12.0 MW | |||
Moly-Cop Adesur S.A. | 4/1/2010 | 3/31/2020 | Up to 2.0 MW in HP and 16.0 | |||
| MW in HFP in Lima | ||||||
| Up to 0.2 MW in HP and 11.0 | ||||||
| MW in HFP in Arequipa | ||||||
Compañía Minera Antamina S.A. | 7/1/2011 | 12/31/2014 | Up to 30 MW | |||
Minera Chinalco Perú S.A. | 10/1/2011 | 9/30/2026 | Up to 166 MW | |||
Compañía Minera Casapalca S.A. | 3/1/2012 | 12/31/2017 | 14 MW in HP and HFP. | |||
Shougang Hierro Perú S.A.A. | 5/1/2014 | 12/31/2020 | Up to 70 MW during period 2014-2017 | |||
| 100 MW in 2018-2019 | ||||||
| 110 MW in 2020. | ||||||
Praxair Perú S.R.L. | 9/7/2012 | 12/31/2019 | 2.8 MW | |||
Shopping Center S.A. | 11/1/2012 | 10/31/2015 | Up to 14.5 MW | |||
La Arena S.A. | 1/1/2014 | 12/31/2028 | Up to 30.0 MW | |||
Hudbay Perú S.A.C. | 5/1/2014 | 12/31/2025 | Up to 90.0 MW | |||
Banco Interbank | 3/1/2003 | 4/30/2014 | Total agreed maximum demand of 2.5 MW |
(b) Natural Gas Supply Contract from Camisea Deposits
By means of the assignment of contractual position agreement, Electroperú S.A. transferred to Empresa de Generación Eléctrica Ventanilla S.A.-ETEVENSA (“Etevensa”), effective from August 1, 2003, its contractual position in the Contract for Natural Gas Supply (hereinafter the Contract) entered into between companies that are part of the Contractor in charge of the exploitation of hydrocarbons in Camisea deposits (hereinafter the Contractor). These companies expressed their total and absolute agreement with such assignment. Under the takeover of Etevensa by Edegel S.A.A. from June 1, 2006, Edegel S.A.A. acquired the rights and obligations of Etevensa in the Contract.
The Contract binds upon Edegel S.A.A. to exclusively acquire gas from the Contractor until the maximum daily amount established in 3.901MM mcd for power plants of Ventanilla and Santa Rosa. Likewise, the Contract binds upon Edegel S.A.A. to pay a minimum of 100% of the daily contractual quantity (2.50MM mcd from August 21, 2013; this quantity increased in 2.30MMmcd).
F-664
Table of Contents
GENERANDES PERÚ S.A. AND SUBSIDIARIES
Notes to the Consolidated Financial Statements
The purchase price is fixed at the point of receipt (Las Malvinas- Camisea) and is expressed in US$/MMBTU (dollars per million BTU). Effectiveness of this contract is 15 years from August 20, 2004.
The cost of natural gas supply as of December 31, 2013 amounted to S/. 140,595 thousand (S/. 141,216 as of December 31, 2012, S/. 149,310 as of December 31, 2011 and S/. 130, 360 as of December 31, 2010).
(c) Natural Gas Transport Contracts
On May 2, 2005, Edegel S.A.A. entered into with Transportadora de Gas del Perú S.A. (hereinafter TGP) a Contract for Interruptible Natural Gas Transport Service with the intention that TGP renders services from the point of receipt located in Las Malvinas (Camisea) to the point of delivery in the City Gate of Lurin. This contract will be effective until January 1, 2034.
The maximum daily interruptible quantity (MIQ) that TGP is obliged to transport is the following:
Period | MIQ | |||
- | ||||
- From August 14, 2010 to December 31, 2019 | 992,624 | |||
- From January 1, 2020 to December 31, 2025 | 1,000,000 | |||
- From January 1, 2026 to January 1, 2034 | 3,100,000 | |||
On the other hand, on December 10, 2007, Edegel S.A.A. has signed the Firm Transport Service Contract with TGP with the intention that it renders such service from August 1, 2008 to December 31, 2025.
The daily reserved capacity amounts to the following values:
Period | DRC (m3 td/day) | |||
- | ||||
- From August 14, 2010 to August 1, 2019 | 3,207,376 | |||
- From August 2, 2019 to January 1, 2020 | 2,589,554 | |||
- From January 2, 2020 to December 31, 2025 | 2,100,000 | |||
The consideration of the service to which the above mentioned interruptible and firm contracts refer is calculated based on tariffs regulated by the Supervisory Entity for Investment in Energy and Mining (OSINERGMIN) applied on gas volumes effectively transported in the case of the interruptible service contract and the reserved volume in the case of the firm service contract.
Cost for these services as of December 31, 2013 amounted to S/. 115,796 thousand (S/. 112,328 as of December 31, 2012, S/. 111,372 as of December 31, 2011 and S/. 102,184 as of December 31, 2010) and is recorded in the Cost of Generation item.
(d) Natural Gas Supply Contract
On August 27, 2004, ETEVENSA, currently Edegel S.A.A. entered into with Gas Natural de Lima y Callao S.R.L. (hereinafter GNLC) the Contract for Interruptible Natural Gas Transport Service through the Main Distribution Network from the point of receipt located in the City Gate of Lurin to the point of delivery in the Thermoelectric Plant of Ventanilla. This Contract has a term of effectiveness of 15 years from the date of signing.
F-665
Table of Contents
GENERANDES PERÚ S.A. AND SUBSIDIARIES
Notes to the Consolidated Financial Statements
The maximum daily interruptible capacity (MIC) of gas that GNLC is obliged to transport is:
Period | MIC | |||
- From August 1, 2009 to August 22, 2019 | 100,000 | |||
Likewise, on May 20, 2005, GNLC and Edegel S.A.A. signed other Contract for Interruptible Natural Gas Transport Service through the Main Distribution Network from the point of receipt located in the City Gate of Lurin to the point of delivery in the Thermoelectric Plant of Santa Rosa (Interruptible Service Contract Santa Rosa”). This contract will be effective until Tuesday, December 31, 2019.
The maximum daily interruptible capacity (MIC) of gas that GNLC is obliged to transport is:
Period | MIC (m3 td/day) | |||
- From March 1, 2010 to December 31, 2019 | 900,000 | |||
On September 22, 2008 and within the Eleventh Public Auction for Contracting of Firm Service and called for the Contracting of the Interruptible Service of Natural Gas Transport through the Main Distribution Network, GNLC and Edegel S.A.A. signed the following Firm Service Contracts for the plants of Santa Rosa and Ventanilla.
The daily reserved capacity of gas that GNLC is obliged to transport is:
Period | DRC (m3 td/day) | |||
Point of Delivery: Ventanilla. | ||||
- From August 1, 2009 to December 31, 2025 | 2,100,000 | |||
Point of Delivery: Santa Rosa. | ||||
- From March 1, 2010 to December 31, 2019 | 1,100,000 | |||
The consideration of services to which the above mentioned contracts refer is calculated based on tariffs regulated by the Supervisory Entity for Investment in Energy and Mining (OSINERGMIN) applied on gas volumes effectively transported in the case of the interruptible service contract and the reserved volume in the case of the firm service contract.
Cost for these services as of December 31, 2013 amounted to S/. 19,767 thousand (S/. 19,668 as of December 31, 2012, S/. 19,371 as of December 31, 2011 and S/. 19,027 as of December 31, 2010) and is recorded in the Cost of Generation item.
(e) Long-term Contracts for the acquisition of replacement parts and rendering of maintenance services for Thermal Plants
On May 28, 2004, Empresa de Generación Termoeléctrica Ventanilla S.A.—ETEVENSA (“Etevensa”) signed a long-term service agreement (LTSA) with Siemens Westinghouse Power Corporation (currently Siemens Energy Inc.) and Siemens Westinghouse Service Company LTD (its rights and obligations have been assigned to Siemens S.A.C.) for the acquisition of replacement parts and spare parts, as well as for rendering scheduled maintenance services (major and minor) for the two turbines of the Thermoelectric Power Plant in Ventanilla. The LTSA referred to the Ventanilla Plant became effective on the date of signing and will be in
F-666
Table of Contents
GENERANDES PERÚ S.A. AND SUBSIDIARIES
Notes to the Consolidated Financial Statements
force until: (a) each turbine of the Thermoelectric Power Plant of Ventanilla accumulates 108,333 HES; or (b) 18 years are reached from the date of beginning of the commercial operation of the natural gas plant, whichever occurs first.
Likewise, on June 15, 2005, Edegel S.A.A. signed a similar contract with the same companies for the acquisition of replacement parts and spare parts, as well as for rendering scheduled maintenance services (minor and major) for the turbine Westinghouse located in the Thermoelectric Power Plant of Santa Rosa. The LTSA referred to the turbine Westinghouse of Santa Rosa began operations on June 1, 2005 and will be in force until: (a) the turbine Westinghouse of the Thermoelectric Power Plant Santa Rosa accumulates 96,000 HES; or (b) 18 years are reached since June 1, 2005; or, (c) two high inspections and two hot gas path inspections are carried out as defined in the contract, whichever occurs first. Due to the claim occurred in May 2013 (note 13(g)) affecting this turbine, the Contract is still suspended as of December 31, 2013.
On the other hand, on March 27, 2009, Siemens Power Generation, Inc. (currently Siemens Energy Inc.) and Siemens Power Generation Service Company, Ltd. (its rights and obligations are currently assigned to Siemens S.A.C.) entered into with Edegel S.A.A. other LTSA for the acquisition of spare parts and replacement parts, as well as for rendering scheduled maintenance services (minor and major) for the Siemens turbine installed in the Thermoelectric Power Plant of Santa Rosa. The LTSA referred to the Siemens turbine of Santa Rosa began operations on the date of signing and will be in force until: (a) the turbine Siemens of the Thermoelectric Power Plant Santa Rosa accumulates 100,000 HES; or (b) 18 years are reached since the date of signing; or, (c) two high inspections and two hot gas path inspections are carried out as defined in the contract, whichever occurs first.
The contracts establish various forms of payment such as an initial payment for spare parts and equipments specified in the pertinent agreements, monthly payments based on an accumulation schedule of equivalent service hours for each turbine, monthly fixed payments for turbines, payment as per schedule specified for minor and major scheduled maintenance services, as per the accumulation of equivalent service hours and monthly payment for maintenance services of the control system of gas turbines of each contract.
(f) Fuel Supply Contract for Thermal Plants
On September 7, 009, Edegel S.A.A. entered into with Petróleos del Perú—Petroperú S.A. (Petroperú) a supply contract of Biodiesel B2 GE or other similar fuel destined to Thermal Plants effective for one renewable year. By means of communications between the parties, effectiveness was extended for three years and was formalized through an addendum dated December 13, 2010, including the automatic renewal if no prior notice is given.
According to the signed contract, Petroperu assumes the commitment to deliver a monthly volume of 20,000 barrels (free volume) or any other volume higher than the latter of “firm” nature that Edegel S.A.A. has requested with prior notice of 60 days. If Edegel S.A.A. does not comply with the purchase of “firm” requested volume, it will be subject to the payment of a penalty in favor of PETROPERU to indemnify its financing and storage costs.
According to medium-term operation contracts of COES (September 2010- August 2011), the operation of thermal units of Edegel S.A.A. with diesel was not necessary, except for specific cases (peak demand, failures in other system units, etc, for which no penalties were paid.
F-667
Table of Contents
GENERANDES PERÚ S.A. AND SUBSIDIARIES
Notes to the Consolidated Financial Statements
(g) Joint Collateral Agreements in favor of Chinango S.A.C.
In May 2009, Edegel S.A.A. granted an irrevocable joint collateral of automatic execution in favor of Bondholders of the First Bond Program Chinango (formerly called “Second Bond Program Edegel”) to guarantee the payment of obligations issued under this program that were transferred by Edegel S.A.A. to Chinango S.A.C. under the corporate reorganization held on May 31, 2009. The balance of such obligations as of the date of the Consolidated Statement of Financial Position amounts to S/. 25,075 thousand.
(34) Contingencies
As of December 31, 2013, the Company and its Subsidiaries have a pending solution of court and arbitration proceedings, as well as administrative and tax procedures related to the developed activities. In management and its internal and external legal advisors’ opinion, the Company has recorded the liabilities considered as appropriate based on the information available as of December 31, 2013, and those will not result in liabilities additional to those already recorded by the Company and its Subsidiaries (note 18).
The main contingencies are:
(a) Income Tax Assessments for periods 2000 and 2001
As a result of the tax inspection of the income tax of periods 2000 and 2001, on December 28, 2005, Edegel S.A.A. was notified through Tax Assessment and Fine Resolutions amounting to S/. 75,892 thousand (including fines and interests calculated as of that date) for alleged omissions in the income tax payment of period 2000. Likewise, on that date Edegel S.A.A. was notified through different tax assessment resolutions amounting to approximately S/. 6,842 thousand corresponding to default interests related to payment on account of Income Tax of period 2001.
In January 2006, the Subsidiary filed a partial appeal against such tax assessment and fine resolutions paying the tax corresponding to not claimed items. In September 2008, the Tax Authority notified the subsidiary through an Intendency Resolution through which the field claim was declared grounded.
In October 2008, the Subsidiary filed an appeal against such Intendency Resolution before the Tax Court. The main objections of the Tax Authority that have been subject to appeal are the following:
| (i) | S/. 44,025 thousand of objections of the taxable base for depreciation of revalued fixed assets in period 1996. |
| (ii) | S/. 12,574 thousand of objections of the taxable base for finance costs related to loans that the Tax Authority assumes that were used for the purchase of shares of own issuance; therefore, they do not comply with the principle of causality. |
| (iii) | S/. 5,673 thousand of objections of the taxable base for negative Inflation Exposure Results of period 2001. |
The challenged contingency updated as of December 31, 2013 amounts to S/. 98,957 thousand (including taxes, fines and interests calculated as of that date).
As of December 31, 2013, the appeal filed by the Subsidiary has pending resolution by the Tax Court.
F-668
Table of Contents
GENERANDES PERÚ S.A. AND SUBSIDIARIES
Notes to the Consolidated Financial Statements
In opinion of the Subsidiary’s Management and its Legal Advisors, there is a high probability of success concerning challenged items, except for the portion that already has a provision amounting to S/. 2,601 thousand as of December 31, 2013 (note 18).
(b) Income Tax Assessments for periods 2002 and 2003
In July 2007, Edegel S.A.A. was notified by the Tax Authority through various Tax Assessment and Fine Resolutions amounting to S/. 10,224 thousand (including taxes, fines, as well as interests calculated as of that date) for the income tax of periods 2002 and 2003.
The Subsidiary accepted some objections paying the corresponding debt and in August 2007 it claimed before the Tax Authority those amounts that were not accepted.
By means of Intendency Resolution 01501140007736 dated October 2008 the above mentioned claim was partially grounded and it was established to continue with the collection of the amended debt amounting to S/. 3,154 thousand.
In December 2008, the Subsidiary filed a partial appeal against the mentioned Intendency Resolution. The appeal was mainly related to the objection for exchange difference and interests arising from credits acquired to refinance the debt that was subject to objections in periods 2000 and 2001 because they were allegedly related to the purchase of shares of own issuance.
The contingency related to this tax assessments, updated as of December 31, 2013 amounted to S/. 5,627 thousand (including taxes, fines and interests calculated as of that date).
As of December 31, 2013, the appeal filed by the Subsidiary has pending resolution by the Tax Court.
In opinion of the Subsidiaries’ management and its legal advisors the appeal has probabilities to succeed.
(c) Income Tax Assessments for period 2006
In April 2011, Edegel S.A.A. was notified through Tax Assessment and Fine Resolutions related to alleged omissions in the income tax determination of period 2006 (annual and payments on account) and the alleged infringement committed of article 178.1 of the Tax Code (declare figures or false data that have influence in the determination of the tax obligation).
In May 2011, the Subsidiary filed a partial appeal against these resolutions. On the same date, a debt payment was made related to payments on account for January and February 2006.
On March 6, 2012, the Subsidiary was notified through Intendency Resolution 0150140010139 for which the Tax Authority declared the claim groundless. Such Resolution was appealed by the Subsidiary through appeal filed on March 27, 2012.
The contingency related to this tax assessments, updated as of December 31, 2013 amounted to S/. 29,523 thousand (including taxes, fines and interests calculated as of that date).
As of December 31, 2013, the appeal filed by the Subsidiary has pending resolution by the Tax Court.
F-669
Table of Contents
GENERANDES PERÚ S.A. AND SUBSIDIARIES
Notes to the Consolidated Financial Statements
In opinion of the Subsidiaries’ management and its legal advisors the appeal has probabilities to succeed.
(d) Income Tax Assessment for period 2007
In May 2013, Edegel S.A.A. was notified through Tax Assessment and Fine Resolutions related to income tax determination and payments on account of period 2007 and the alleged committed infringement of article 178.1 of the Tax Code (declare figures or false data that have influence in the determination of the tax obligation).
The Tax Authority determined a lower balance in favor of period 2007 for income tax, as well as higher payments on account and their respective fines as a result of the higher income tax determined in 2006 and that has influence on the determination of the credit balance and payments on account of period 2007.
On June 18, 2013, the Subsidiary filed an appeal against such resolutions which was declared groundless by the Tax Authority through Intendency Resolution 0150140010970 notified on October 10, 2013.
The contingency related to this tax assessments, updated as of December 31, 2013 amounted to S/. 11,588 thousand (including interests payable on account, fines and interests calculated as of that date).
In opinion of the Subsidiaries’ management and its legal advisors the appeal has probabilities to succeed.
(e) Income Tax Assessment for period 2008
In November 2013, Edegel S.A.A. was notified through Tax Assessment and Fine Resolutions related to income tax and payments on account of period 2008 and the alleged infringement committed of article 178.1 of the Tax Code (declare figures or false data that have influence in the determination of the tax obligation).
The Tax Authority determined a lower balance in favor of period 2008 for income tax, as well as higher payments on account and their respective fines as a result of the higher income tax determined in 2006 and 2007 and that have influence on the determination of the credit balance and payments on account of period 2008.
On December 16, 2013, the Subsidiary filed a claim against such resolutions.
The contingency related to this tax assessments updated as of December 31, 2013 amounts to S/. 4,223 thousand (including interests of payments on account, fines and fine interests, calculated as of that date).
As of December 31, 2013, the claim filed by the Subsidiary has pending resolution by the Tax Authority.
In opinion of the Subsidiaries’ management and its legal advisors the claim has probabilities to succeed.
(f) Assessment for Sales Tax, Municipal Promotion Tax and Ad Valorem of years 2008 and 2009.
In December 2013, Scotiabank Perú S.A.A. with which Edegel S.A.A. has signed a leasing contract referred to the project Santa Rosa was notified through Division Resolutions through which the Tax Authority put under collection (i) S/. 4,605 thousand, for taxes (sales tax, Tax Municipal Promotion and Ad Valorem) that were not paid in various custom declarations, (ii) S/.9,210 thousand for a fine equivalent to the double taxation that was allegedly not paid and, (iii) S/.710, for a fine equivalent to 0.2 tax units in force in 2009, for an alleged incorrect statement of the value in Custom Declarations.
F-670
Table of Contents
GENERANDES PERÚ S.A. AND SUBSIDIARIES
Notes to the Consolidated Financial Statements
Such Tax Assessments are related to Customs Declarations issued for the execution of the Turnkey Contract for the project Santa Rosa signed between Siemens Power Generation Inc. and the Subsidiary and subsequently by Scotiabank Perú S.A.A. which was joined as owner of goods to which such contract is subject. Tax Assessments from the Tax Authority are as follows: (i) engineering services rendered abroad by Siemens Power Generation Inc. under the above mentioned contract, should take part of the custom value of imported products, and (ii) the amount of the bond for higher performance of Santa Rosa paid to Siemens Power Generation Inc. should have been added to such value.
Scotiabank Perú S.A.A. shall file a claim no later than January 7, 2014.
The contingency related to this tax assessments updated as of December 31, 2013 amounts to S/. 19,047 thousand (including taxes, fines and interests calculated as of that date).
(g) Claims with ESSALUD (former IPSS)
| (i) | Process referred to alleged debts for non-compliance with the payment of contributions to health systems of Decree Law 22482, Decree Law pensions 19990, workplace accidents and occupational disease of Decree Law 18846 during the period from April 1994 and March 1996, for the amount of S/. 8,203 thousand (including interest calculated until June 1996). |
In January 2010, Edegel S.A.A. was notified through Resolution 802-14-0020026 dated December 28, 2009, which declared that the claim related to the payment of contributions to the health system, workplace accidents and occupational disease was groundless; thus, ordering continued collections. Likewise, ESSALUD declared that the claim related to the pension system was inadmissible since it was within the scope of the National Pension Office (ONP). On January 27, 2010, the Subsidiary filed an appeal for reconsideration against such Resolution.
In December 2010, the Subsidiary was notified through Resolution 806-15-000-1286, through which ESSALUD declared partially founded the appeal filed, ordering the Subsidiary the payment of a debt amounting to S/.1,834 thousand (including interests).
In December 2010, the Subsidiary made the payment ordering such Resolution.
In January 2011, the Subsidiary filed to ESSALUD a written document communicating the payment of debt and requesting (i) Declaration of total and full payment of debts, (ii) lack of any other debt derived from the inspection process and, (iii) the final document of the file.
The Subsidiary is waiting for the Resolution of ESSALUD that responds to the above mentioned written document.
| (ii) | Claim referred to payment orders through which it is intended to collect to Edegel S.A.A. the alleged omission in the payment of contributions to ESSALUD, during the period from April 1997 to December 1998. |
The total alleged debt that amounted to S/. 2,881 thousand as of April 2001, arises from: (a) ESSALUD has adopted, amounts exceeding those shown in the Tax Returns of Employees filed by the Subsidiary as taxable base for the calculation of contributions, and (b) in order to calculate contributions, ESSALUD has applied the rate of 9% for all the inspected period, without considering that, in application of legal provisions in force as of the date of the accrual of contributions, the applicable percentage was 1.8% from April 1997 to May 1997 and 6.75% from May 1997 to September 1997.
F-671
Table of Contents
GENERANDES PERÚ S.A. AND SUBSIDIARIES
Notes to the Consolidated Financial Statements
In opinion of the Subsidiary’s Management and its legal advisors, it is probable to obtain a favorable result concerning the taxable base that shall be used to calculate contributions since the amount declared by the Subsidiary conforms to remunerations effectively received by employees. On the other hand, concerning the applicable percentage, it shall be necessary to obtain a favorable result concerning periods between April and May 1997 and from September 1997 to December 1998, which will decrease the contingency in S/. 1,021 thousand plus interests.
The provision recorded by the Subsidiary, for both processes, as of December 31, 2013 amounts to S/. 6,888 thousand (note 18).
(h) Property Tax Assessment of Periods 2000 to 2004
The District Municipality of San Ramon notified the Subsidiary Edegel S.A.A. through Tax Assessment Resolution 02-2005-OR-MDSR and Fine Resolution 01-2005-OR-MDSR for which the amount of S/. 3,388 thousand was subject to collection for Property Tax of periods 2000 to 2004 and S/. 26 thousand for fine, including both default interest calculated as of January 14, 2005. The Municipality supports the tax assessment when including in the taxable base, movable property and investments in land of third parties.
In June 2005, the Subsidiary filed an appeal against above mentioned resolutions based on the fact that the Property and Fine Tax corresponding to period 2000 are prescribed and that, concerning other periods, the taxable base assumed by the Municipality considers elements that are not adjusted to law provisions.
To this process, claims filed by the Subsidiary concerning Tax Assessment Resolutions 003-2005-OR-MDSR and 004-2005-OR-MDSR for which the Municipality of San Ramón requested the payment of Work Compliance Rates and Planning Application, respectively, amounting to S/. 258 thousand, each of them.
To date, the District Municipality of San Ramon has not complied with filling the proceedings to the Tax Court so that the entity decides on the appeal filed by the Subsidiary. This arose, although the above mentioned Municipality obtains an unfavorable result in the legal proceedings initiated by them through which it was expected to declare invalidity of the Resolutions of the Tax Court which require filing the proceedings.
In opinion of the Subsidiary’s Management and its Legal Advisors, there are high probabilities to obtain a favorable result concerning the tax assessment of period 2000 for the prescribed year. Likewise, there are also high probabilities of success concerning the contingency associated to the valuation of property made by the Municipality and its inclusion within the taxable base for the tax determination of periods 2001 to 2004. On the other hand, concerning the claim related to the inclusion of investments in land of third parties within the taxable base for the tax determination of periods 2001 to 2004, the contingency has been classified as probable, reason why the provision recorded by the Subsidiary as of September 30, 2013 amounts to S/. 3,470 thousand (note 18).
(i) Fine associated to the Real Estate Transfer Tax of year 2009 imposed by the District Municipality of San Ramon
In October 2010, the District Municipality of San Ramon notified Chinango S.A.C. through the Fine Resolution 049-2010/MDSR for which the amount of S/. 977 thousand was subject to collection for allegedly having incurred in the infraction standardized in paragraph 1 of article 178° of the Tax Code (declare false figures or data that have influence in the determination of the tax obligation).
In November 2010, the Subsidiary filed a claim against the above mentioned resolution, stating that it is no longer appropriate since there is no obligation of submitting a Real Estate Transfer Tax return.
F-672
Table of Contents
GENERANDES PERÚ S.A. AND SUBSIDIARIES
Notes to the Consolidated Financial Statements
In April 2011, the Subsidiary was notified through Management Resolution 113-2011-GR-MDSR through which the District Municipality of San Ramon declared inadmissible the dispute of tax assessment. The Subsidiary filed an appeal against Management Resolution requesting the Municipality to resolve the claim, since it was submitted under legal established terms.
In July 2011, the Subsidiary was notified through Municipal Management Resolution 090-2011-GEMU-MDSR through which General Management Resolution 113-2011-GR-MDSR was declared invalid.
The contingency updated as of December 31, 2013 amounts to S/. 1,644 thousand.
As of December 31, 2013, the claim filed by the Subsidiary has pending resolution by the above mentioned Municipality.
In opinion of the Subsidiaries’ management and its legal advisors, there are reasonable arguments to obtain a favorable result.
(j) Real Estate Transfer Tax Assessment of year 2009 imposed by the District Municipality of San Ramon:
In April 2013, the District Municipality of San Ramon notified Chinango S.A.C. through various Tax Assessment Resolutions for which an alleged debt of real estate transfer tax was subject to collection. It taxed the transfer of certain assets in the simple reorganization carried out between Edegel S.A.A. and Chinango S.A.C. in May 2009.
In May 2013, Chinango S.A.C filed a claim against the above mentioned Resolutions which was resolved in September 2013 through Management Resolution which declared the invalidity of Tax Assessment Resolutions challenged and ordered the conduction of a new tax inspection.
Such tax inspection was carried out during September, October and November 2013, having that in this last month, the Municipality notified the Subsidiary through a Tax Assessment Resolution for which an alleged omitted tax amounting to S/. 1,689 thousand was subject under collection.
In December 2013, the Subsidiary filed a claim against the new Tax Assessment Resolution which was resolved in that same month through Management Resolution. This last Resolution declared groundless the claim. The Subsidiary filed an appeal against Management Resolution under the legal established term.
The contingency updated as of December 31, 2013 amounts to S/. 2,629 thousand.
In opinion of the Subsidiaries’ management and its legal advisors there are reasonable arguments to obtain a favorable result.
(k) Real Estate Transfer Tax Assessment of year 2009 imposed by the District Municipality of Monobamba:
In May 2013, the District Municipality of Monobamba notified Chinango S.A.C through various Tax Assessment Resolutions for which an alleged debt of real estate transfer tax was subject to collection. It taxed the transfer of certain assets in the simple reorganization carried out between Edegel S.A.A. and Chinango S.A.C. in May 2009.
F-673
Table of Contents
GENERANDES PERÚ S.A. AND SUBSIDIARIES
Notes to the Consolidated Financial Statements
In June 2013, Chinango S.A.C filed a claim against the above mentioned Resolutions which was resolved in September 2013 through Management Resolution which declared the invalidity of Tax Assessment Resolutions challenged and ordered the conduction of a new tax inspection.
Such tax inspection was carried out during September, October and November 2013, having that in this last month, the Municipality notified the Subsidiary through a Tax Assessment Resolution for which an alleged omitted tax amounting to S/. 4,341 thousand was subject under collection.
In December 2013, the Subsidiary filed a claim against the new Tax Assessment Resolution which was resolved in that same month through Management Resolution. This last Resolution declared groundless the claim. The Subsidiary filed an appeal against Major Resolution under the legal established term.
The contingency updated as of December 31, 2013 amounts to S/. 7, 650 thousand.
In opinion of the Subsidiaries’ management and its legal advisors there are reasonable arguments to obtain a favorable result.
(l) Real Estate Transfer Tax Assessment of year 2009 imposed by the District Municipality of Masma:
In July 2013, the District Municipality of Masma notified Chinango S.A.C through Tax Assessment Resolutions for which an amount of alleged debt of real estate transfer tax was subject to collection. It taxed the transfer of certain assets in the simple reorganization carried out between Edegel S.A.A. and Chinango S.A.C. in May 2009.
In August 2013, the Subsidiary filed an appeal against the mentioned Tax Assessment Resolution.
In December 2013, the Subsidiary was notified with Official Letter issued by the Municipality through which such entity informs the Subsidiary that will declare inadmissible the above mentioned appeal if no payment of tax debt is accepted in the Municipal savings bank since the payment on consignment (in The judiciary) is not valid. The Subsidiary will respond such Official Letter.
The contingency updated as of December 31, 2013 amounts to S/. 2,667 thousand.
In opinion of the Subsidiaries’ management and its legal advisors there are reasonable arguments to obtain a favorable result.
(m) Property Tax Assessment of year 2010 imposed by the District Municipality of San Ramon:
In December 2013, the District Municipality of San Ramon notified Chinango S.A.C. through a Tax Assessment Resolution for which the amount of S/. 229 thousand for an alleged omission in the payment of the Property Tax of year 2010 was subject to collection.
The Subsidiary filed an appeal against the Tax Assessment Resolution within the legal established term.
The contingency updated as of December 31, 2013 amounts to S/. 341 thousand.
In opinion of the Subsidiary’s management and its legal advisors there are reasonable arguments to obtain a favorable result.
F-674
Table of Contents
GENERANDES PERÚ S.A. AND SUBSIDIARIES
Notes to the Consolidated Financial Statements
(35) Subsequent Events
After December 31, 2013, the following events occurred:
On April 15, 2014, the Company received from the insurance company MAPFRE, the amount of US$ 13 million for the claim of the TG7 occurred in May 2013.
On April 29, 2014, Enersis S.A. entered into a purchase agreement for the acquisition of all the shares that Inkia Americas Holdings Limited indirectly holds in Generandes Perú S.A. (equivalent to 39.01% of such company), controlling entity of Edegel S.A.A. The above mentioned purchase agreement includes the price of US$ 413 million payable once the shares are transferred.
F-675
Table of Contents
Until , 2016 (the 25th day after the date of this prospectus), all dealers that buy, sell or trade in our ordinary shares, whether or not participating in this offering, may be required to deliver a prospectus. This is in addition to the dealer’s obligation to deliver a prospectus when acting as underwriter and with respect to their unsold allotment or subscription.
Ordinary Shares
PROSPECTUS
| BofA Merrill Lynch | Credit Suisse |
| Goldman, Sachs & Co. | UBS Investment Bank |
| HSBC | Scotiabank | Credicorp Capital | ||
The date of this prospectus is , 2016.
Table of Contents
PART II
INFORMATION NOT REQUIRED IN PROSPECTUS
Item 6. Indemnification of Directors and Officers
Our constitution provides that, subject to the provisions of the Singapore Companies Act, every director, secretary or other officer of our Company or our subsidiaries and affiliates shall be entitled to be indemnified by our Company against all costs, charges, losses, expenses and liabilities incurred by him in the execution and discharge of his duties (and where he serves at our request as a director, officer, employee or agent of any of our subsidiaries or affiliates) or in relation thereto and in particular and without prejudice to the generality of the foregoing, no director, secretary or other officer of our Company shall be liable for the acts, receipts, neglects or defaults of any other director or officer or for joining in any receipt or other act for conformity or for any loss or expense happening to our Company through the insufficiency or deficiency of title to any property acquired by order of the directors for or on behalf of our Company or for the insufficiency or deficiency of any security in or upon which any of the moneys of our Company shall be invested or for any loss or damage arising from the bankruptcy, insolvency or tortious act of any person with whom any moneys, securities or effects shall be deposited or left or for any other loss, damage or misfortune whatever which shall happen in the execution of the duties of his office or in relation thereto unless the same shall happen through his own negligence, default, breach of duty or breach of trust.
Section 172 of the Singapore Companies Act allows us to indemnify our officer against liability incurred by the officer to a person other than the company, except when the indemnity is against any liability of the director or officer (1) to pay a fine in criminal proceedings, (2) to pay a penalty in respect of non-compliance with any regulatory requirements, (3) any liability incurred in defending criminal proceedings in which he or she is convicted, (4) incurred in defending civil proceedings brought by the company or a related company in which judgment is given against him or her, or (5) incurred in connection with an application under Sections 76A(13) or 391 for a relief from liability in which the court refuses to grant him or her relief. We will also be allowed to provide funds to our director to meet expenditure incurred or to be incurred by him or her, or to enable him or her to avoid incurring expenditure in defending himself or herself in connection with any alleged negligence, default, breach of duty or breach of trust by him or her in relation to the company: (1) in any criminal or civil proceedings, (2) in any investigation by a regulatory authority, (3) against any action proposed to be taken by a regulatory authority, or (4) in connection with an application for relief.
We will enter into indemnification agreements with our officers and directors. These indemnification agreements will provide our officers and directors with indemnification to the maximum extent permitted by the Singapore Companies Act. We have also obtained a policy of directors’ and officers’ liability insurance that will insure directors and officers against the cost of defense, settlement or payment of a judgment under certain circumstances which are permitted under the Singapore Companies Act.
Item 7. Recent Sales of Unregistered Securities
On May 4, 2015, one ordinary share, representing our outstanding share capital, was issued to our sole shareholder, Kenon, in connection with our formation and in reliance upon the exclusion from registration provided by Regulation S under the Securities Act.
On March 17, 2016, 559,309 ordinary shares were issued to our sole shareholder, Kenon, in connection with the Reorganization, pursuant to which Kenon transferred all of its equity interests in its wholly-owned subsidiary ICP to us in exchange for our issuance of the 559,309 ordinary shares and our issuance of a $145 million note and a $75 million note, each payable to Kenon. The notes bear interest at a rate of LIBOR + 6% per annum from March 17, 2016, and will mature, unless otherwise prepaid, on December 31, 2018. In October 2016, we prepaid in full our $75 million note to Kenon. Among other things, we intend to use a portion of the net
II-1
Table of Contents
proceeds that we receive in this offering to prepay in full all obligations outstanding under our $145 million note payable to Kenon. The issuance and transfer of our ordinary shares to Kenon in connection with the Reorganization was made in reliance upon the exclusion from registration provided by Regulation S under the Securities Act.
Item 8. Exhibits and Financial Statement Schedules
(a) Exhibits.
Incorporated by reference to the Exhibit Index following page II-3 hereof.
(b) Financial Statement Schedules.
Pursuant to Staff Accounting Bulletin 80 (recodified with slight modifications in Staff Accounting Bulletin 103), we have furnished financial statements of DEORSA, DEOCSA, Guatemel and RECSA beginning on page F-149.
Pursuant to Rule 3-09 of Regulation S-X, we have furnished affiliate financial statements of Generandes beginning on page F-528.
Item 9. Undertakings
The undersigned hereby undertakes:
(a) The undersigned registrant hereby undertakes to provide to the underwriters at the closing specified in the underwriting agreement certificates in such denominations and registered in such names as required by the underwriters to permit prompt delivery to each purchaser.
(b) Insofar as indemnification for liabilities arising under the Securities Act of 1933 may be permitted to directors, officers and controlling persons of the registrant pursuant to the provisions referenced in this registration statement, or otherwise, the registrant has been advised that in the opinion of the Securities and Exchange Commission such indemnification is against public policy as expressed in the Act and is, therefore, unenforceable. In the event that a claim for indemnification against such liabilities (other than the payment by the registrant of expenses incurred or paid by a director, officer, or controlling person of the registrant in the successful defense of any action, suit or proceeding) is asserted by such director, officer or controlling person in connection with the securities being registered hereunder, the registrant will, unless in the opinion of its counsel the matter has been settled by controlling precedent, submit to a court of appropriate jurisdiction the question of whether such indemnification by it is against public policy as expressed in the Act and will be governed by the final adjudication of such issue.
(c) The undersigned registrant hereby undertakes that:
(1) For purposes of determining any liability under the Securities Act of 1933, the information omitted from the form of prospectus filed as part of this registration statement in reliance upon Rule 430A and contained in a form of prospectus filed by the registrant pursuant to Rule 424(b)(1) or (4) or 497(h) under the Securities Act shall be deemed to be part of this registration statement as of the time it was declared effective.
(2) For the purpose of determining any liability under the Securities Act of 1933, each post-effective amendment that contains a form of prospectus shall be deemed to be a new registration statement relating to the securities offered therein, and the offering of such securities at that time shall be deemed to be the initial bona fide offering thereof.
II-2
Table of Contents
(3) For the purpose of determining liability of the registrant under the Securities Act of 1933 to any purchaser in the initial distribution of the securities:
The undersigned registrant undertakes that in a primary offering of securities of the undersigned registrant pursuant to this registration statement, regardless of the underwriting method used to sell the securities to the purchaser, if the securities are offered or sold to such purchaser by means of any of the following communications, the undersigned registrant will be a seller to the purchaser and will be considered to offer or sell such securities to such purchaser:
(i) Any preliminary prospectus or prospectus of the undersigned registrant relating to the offering required to be filed pursuant to Rule 424;
(ii) Any free writing prospectus relating to the offering prepared by or on behalf of the undersigned registrant or used or referred to by the undersigned registrant;
(iii) The portion of any other free writing prospectus relating to the offering containing material information about the undersigned registrant or its securities provided by or on behalf of the undersigned registrant; and
(iv) Any other communication that is an offer in the offering made by the undersigned registrant to the purchaser.
II-3
Table of Contents
SIGNATURES
Pursuant to the requirements of the Securities Act of 1933, the registrant certifies that it has reasonable grounds to believe that it meets all of the requirements for filing on Form F-1 and has duly caused this registration statement to be signed on its behalf by the undersigned, thereunto duly authorized in Lima, Peru on October 28, 2016.
| IC Power Pte. Ltd. | ||||
| By: | /s/ Javier García-Burgos | |||
Name: Title: | Javier García-Burgos Chief Executive Officer | |||
Pursuant to the requirements of the Securities Act of 1933, this registration statement has been signed by the following persons in the capacities and on the dates indicated:
| Dated October 28, 2016 | By: | /s/ Javier García-Burgos | ||||
Name: | Javier García-Burgos | |||||
Title: | Chief Executive Officer | |||||
| Dated October 28, 2016 | By: | /s/ Alberto Triulzi | ||||
Name: | Alberto Triulzi | |||||
Title: | Chief Financial Officer and Principal Accounting Officer | |||||
| Dated October 28, 2016 | By: | /s/ * | ||||
Name: | Laurence N. Charney | |||||
Title: | Director | |||||
| Dated October 28, 2016 | By: | /s/ * | ||||
Name: | Yoav Doppelt | |||||
Title: | Director | |||||
| Dated October 28, 2016 | By: | /s/ * | ||||
Name: | Cyril Pierre-Jean Ducau | |||||
Title: | Director | |||||
| Dated October 28, 2016 | By: | /s/ * | ||||
Name: | Dr. Bill Foo | |||||
Title: | Director | |||||
| Dated October 28, 2016 | By: | /s/ * | ||||
Name: | Tzahi Goshen | |||||
Title: | Director | |||||
| Dated October 28, 2016 | By: | /s/ * | ||||
Name: | Aviad Kaufman | |||||
Title: | Director | |||||
| Dated October 28, 2016 | By: | /s/ * | ||||
Name: | Arunava Sen | |||||
Title: | Director | |||||
Table of Contents
| Dated October 28, 2016 | *By: | /s/ Javier García-Burgos | ||||
Name: | Javier García-Burgos | |||||
Title: | Attorney-in-fact | |||||
Authorized Representative in the United States | ||||
By: | /s/ Donald J. Puglisi | |||
| Name: | Donald J. Puglisi | |||
| Title: | Managing Director, Puglisi & Associates | |||
Dated October 28, 2016 | ||||
Table of Contents
EXHIBIT INDEX
Exhibit | Description of Document | |
| 1.1* | Form of Underwriting Agreement | |
| 3.1** | Form of Constitution | |
| 4.1* | Form of Specimen Share Certificate | |
| 4.2** | Form of Registration Rights Agreement | |
| 5.1** | Form of Opinion of Wong Partnership LLP, Singapore counsel of IC Power Pte. Ltd., as to the legality of the ordinary shares | |
| 10.1** | Indenture, dated as of April 4, 2011, between Inkia Energy Limited, as issuer, and Citibank, N.A. as trustee, relating to Inkia Energy Limited’s 8.375% Senior Notes due 2021 (Incorporated by reference to Exhibit 4.9 to Kenon Holding Ltd.’s Annual Report on Form 20-F, filed on March 31, 2015) | |
| 10.2** | Facility Agreement, dated as of January 2, 2011, among O.P.C. Rotem Ltd., as borrower, Bank Leumi Le-Israel B.M., as arranger and agent, Bank Leumi Le-Israel Trust Company Ltd., as security trustee, and the senior lenders named therein (Incorporated by reference to Exhibit 4.10 to Kenon Holding Ltd.’s Annual Report on Form 20-F, filed on March 31, 2015) | |
| 10.3** | Credit Agreement, dated as of August 17, 2012, among Cerro del Águila S.A., as borrower, Sumitomo Mitsui Banking Corporation, as administrative agent, and other parties party thereto (Incorporated by reference to Exhibit 4.11 to Kenon Holding Ltd.’s Annual Report on Form 20-F, filed on March 31, 2015) | |
| 10.4** | English translation of Natural Gas Supply Agreement, dated as of January 2, 2006, as amended, among Kallpa Generación S.A., Pluspetrol Peru Corporation S.A., Pluspetrol Camisea S.A., Hunt Oil Company of Peru L.L.C. Sucursal del Peru, SK Corporation Sucursal Peruana, Sonatrach Peru Corporation S.A.C., Tecpetrol del Peru S.A.C. and Repsol Exploración Peru Sucursal del Peru (Incorporated by reference to Exhibit 4.3 to Amendment No. 1 to Kenon Holdings Ltd.’s Draft Registration Statement on Form 20-F, filed on August 14, 2014) | |
| 10.5** | English translation of Natural Gas Transportation Agreement, dated as of December 10, 2007, as amended, between Kallpa Generación S.A. and Transportadora de Gas del Peru S.A. (Incorporated by reference to Exhibit 4.4 to Amendment No. 1 to Kenon Holdings Ltd.’s Draft Registration Statement on Form 20-F, filed on August 14, 2014) | |
| 10.6** | Turnkey Engineering, Procurement and Construction Contract, dated as of November 4, 2011, among Cerro del Águila S.A., Astaldi S.p.A. and GyM S.A, as amended (Incorporated by reference to Exhibit 4.5 to Kenon Holdings Ltd.’s Annual Report on Form 20-F, filed on April 22, 2016) | |
| 10.7** | English translation of Contract of Concession, dated as of October 23, 2010, as amended, between the Government of Peru and Kallpa Generación S.A., relating to the provision of electric energy services to the public (Incorporated by reference to Exhibit 4.6 to Amendment No. 1 to Kenon Holdings Ltd.’s Draft Registration Statement on Form 20-F, filed on August 14, 2014) | |
| 10.8**† | Gas Sale and Purchase Agreement, dated as of November 25, 2012, among Noble Energy Mediterranean Ltd., Delek Drilling Limited Partnership, Isramco Negev 2 Limited Partnership, Avner Oil Exploration Limited Partnership, Dor Gas Exploration Limited Partnership, and O.P.C. Rotem Ltd. | |
| 10.9** | $145,000,000 Loan Agreement, dated March 17, 2016, among IC Power Pte. Ltd. and Kenon Holdings Ltd. | |
| 10.10** | $75,000,000 Loan Agreement, dated March 17, 2016, among IC Power Pte. Ltd. and Kenon Holdings Ltd. | |
Table of Contents
Exhibit | Description of Document | |
| 10.11** | Stock Purchase Agreement, dated as of December 29, 2015, among IC Power Distribution Holdings PTE, Limited, as Purchaser, Inkia Energy, Limited, as Purchaser Guarantor, DEORSA-DEOCSA Holdings Limited, as Seller, and Estrella Cooperatief BA (Incorporated by reference to Exhibit 4.14 to Kenon Holdings Ltd.’s Annual Report on Form 20-F, filed on April 22, 2016) | |
| 21.1 | List of significant subsidiaries of IC Power Pte. Ltd. | |
| 23.1 | Consent of Somekh Chaikin, Independent Registered Public Accounting Firm, Independent Registered Public Accounting Firm of IC Power Pte. Ltd. | |
| 23.2 | Consent of Somekh Chaikin, Independent Registered Public Accounting Firm, Independent Registered Public Accounting Firm of I.C. Power Asia Development Ltd. (formerly known as I.C. Power Ltd.) | |
| 23.3 | Consent of Caipo y Asociados S. Civil de R.L., Independent Auditors of Generandes Perú S.A. | |
| 23.4 | Consent of Deloitte Guatemala, S.A., Independent Auditors of Distribuidora de Electricidad de Oriente, S.A. | |
| 23.5 | Consent of Deloitte Guatemala, S.A., Independent Auditors of Distribuidora de Electricidad de Occidente, S.A. | |
| 23.6 | Consent of Deloitte Guatemala, S.A., Independent Auditors of Comercializadora Guatemalteca Mayorista de Electricidad, S.A. | |
| 23.7 | Consent of Deloitte Guatemala, S.A., Independent Auditors of Redes Eléctricas de Centroamérica, S.A. | |
| 23.8* | Consent of Wong Partnership LLP (included in Exhibit 5.1) | |
| 24.1** | Powers of Attorney (included on the signature page in Part II of this registration statement) | |
| * | To be filed by amendment. |
| ** | Previously filed. |
| † | Portions of this exhibit have been omitted pursuant to a request for confidential treatment under Rule 406 under the Securities Act. Omitted information has been filed separately with the SEC. |