Exhibit 99.1
|
| |
| CIFC LLC | Investor Relations |
| 250 Park Avenue | Investor@CIFC.COM |
| New York, NY 10177 | (646) 367-6633 |
NASDAQ: CIFC
CIFC LLC Announces Fourth Quarter and Full Year of 2015 Results and a $0.34 Distribution
NEW YORK, March 21, 2016 - CIFC LLC (NASDAQ: CIFC) (“CIFC” or the “Company”) today announced its results for the fourth quarter and year ended December 31, 2015.
Highlights
| |
| • | The Company successfully completed its reorganization to a publicly traded limited liability company ("Reorganization Transaction"). |
| |
| • | Fee Earning Assets Under Management ("Fee Earning AUM" or "AUM") was $14.1 billion as of December 31, 2015 as compared to $14.2 billion as of September 30, 2015 and $13.7 billion as of December 31, 2014. |
| |
| ◦ | During the fourth quarter of 2015, the Company sponsored the issuance of one new CLO, was appointed the sub-adviser to two new loan funds (one each in Asia and Europe) and increased subscriptions to existing funds for an aggregate of $0.6 billion of new AUM. |
| |
| ◦ | During 2015, the Company sponsored the issuance of five new CLOs, launched four new funds and increased subscriptions to existing funds for an aggregate of $3.0 billion of new AUM. |
| |
| • | Management fees increased 10% quarter over quarter from $14.8 million to $16.3 million and 9% year over year from $57.3 million to $62.5 million. |
| |
| • | Economic Net Income ("ENI," a non-GAAP measure) for the quarter and full year was $4.3 million and $31.4 million, respectively, as compared to $3.3 million and $36.1 million for the same periods in the prior year. |
| |
| • | GAAP net income (loss) for the quarter and full year was $(7.7) million and $0.3 million, respectively, as compared to $0.8 million and $8.4 million for the same periods in the prior year. |
| |
| • | CIFC's board of directors declared an aggregate cash distribution of $0.34 per share; composed of a quarterly cash distribution of $0.10 per share and a special distribution of $0.24 per share issued in relation to the Reorganization Transaction. The distribution will be paid on April 15, 2016 to shareholders of record as of the close of business on April 1, 2016. |
Executive Overview
The past year proved to be the most challenging for the leveraged credit market since the end of the financial crisis. Commodity prices came under pressure over the summer and risk assets sold off starting in August. The U.S. High Yield Market was down 5% and the U.S. Corporate Loan market recorded its first negative total return since 2008.
Our balance sheet investments in CIFC-managed funds outperformed their respective benchmarks. Both the Senior Secured Corporate Loan Fund and the Tactical Income Fund produced positive returns vis-à-vis losses in both the CS Loan Index and the LSTA Loan Index. The pronounced weakness in the CLO market led to a decline in mark-to-market valuation of our balance sheet CLO investments. Consequently, net investment income dropped to $1.9 million compared with $14.1 million in 2014. Excluding investment income, we increased ENI EBITDA by $7.2 million or 26% year-over-year.
In 2015, we were successful in sponsoring 5 new CLOs for a combined AUM of $2.6 billion. Strong equity sponsorship allowed us to issue all 5 transactions on a non-risk retention compliant basis. We are well capitalized to issue risk retention compliant CLOs. We successfully completed a 10-year $40 million senior unsecured bond offering in the fourth quarter to further bolster our capacity to invest in risk retention compliant CLOs. We have $210.4 million of cash and investments on our balance sheet, most of which will be available for risk retention compliance over the next 3 years.
Our total return corporate credit loan business has outperformed the various leveraged loan indices (S&P LSTA, CS LL & JPM LL) since inception, for three consecutive years. We successfully launched three new funds; including our first white-labeled loan funds in Korea and Switzerland. The AUM of our credit fund platform now exceeds $1.0 billion. Our loan portfolios continue to perform well and defaults continue to be substantially lower compared to the loan indices. We have maintained our rigorous underwriting process and actively managed risk across well-diversified portfolios. We first started to cut our energy exposure in late August and early September of 2014 and continue to be defensively positioned. We remain underweight the sector with current exposure below 3%.
CLO issuance has been slow during the course of the first two months of 2016. Forecasts from various banks expect market conditions to improve in the second half of the year. We are well positioned to access the market once conditions become more compelling. Loan prepayment rates have slowed significantly. We expect loan prepayment rates to remain lower until CLO new issuance volumes return, increasing the duration of our existing CLO AUM. We are taking advantage of lower loan prices to build par in our 2.0 CLOs. We expect the current investment opportunity to drive improved returns and with that, potentially higher incentive fees on our existing CLOs in the future.
Selected Financial Metrics
(In thousands, except per share data) (unaudited)
|
| | | | | | | | | | | | | | |
| NON-GAAP FINANCIAL MEASURES (1) | 4Q'15 | 4Q'14 | % Change vs. 4Q'14 | FY'15 | FY'14 | % Change vs. YTD'15 |
| Senior Fees from CLOs | $ | 6,255 |
| $ | 5,755 |
| 9% | $ | 24,224 |
| $ | 21,709 |
| 12% |
| Subordinated Fees from CLOs | 8,983 |
| 8,356 |
| 8% | 34,359 |
| 32,900 |
| 4% |
| Management Fees from Non-CLO products | 1,025 |
| 725 |
| 41% | 3,933 |
| 2,705 |
| 45% |
| Total Management Fees | 16,263 |
| 14,836 |
| 10% | 62,516 |
| 57,314 |
| 9% |
| Incentive Fees | 10,906 |
| 3,406 |
| 220% | 22,073 |
| 17,358 |
| 27% |
| Net Investment Income | (10,043 | ) | (1,544 | ) | 550% | 1,866 |
| 14,139 |
| (87)% |
| Total ENI Revenues | 17,126 |
| 16,698 |
| 3% | 86,455 |
| 88,811 |
| (3)% |
| Employee compensation and benefits | 4,122 |
| 6,245 |
| (34)% | 26,902 |
| 27,308 |
| (1)% |
| Share-based compensation (2) | 1,573 |
| 1,059 |
| 49% | 5,348 |
| 2,579 |
| 107% |
| Other operating expenses | 5,598 |
| 5,566 |
| 1% | 19,040 |
| 18,593 |
| 2% |
| Corporate interest expense | 1,552 |
| 569 |
| 173% | 3,808 |
| 4,236 |
| (10)% |
| Total ENI Expenses | 12,845 |
| 13,439 |
| (4)% | 55,098 |
| 52,716 |
| 5% |
| ENI (1) | $ | 4,281 |
| $ | 3,259 |
| 31% | $ | 31,357 |
| $ | 36,095 |
| (13)% |
| ENI per share - basic | $ | 0.17 |
| $ | 0.13 |
| 31% | $ | 1.24 |
| $ | 1.58 |
| (22)% |
| ENI per share - diluted (3) (4) | $ | 0.16 |
| $ | 0.12 |
| 33% | $ | 1.19 |
| $ | 1.49 |
| (20)% |
|
| | | | | | | | | | | | | | |
| NON-GAAP FINANCIAL MEASURES (1) | 4Q'15 | 4Q'14 | % Change vs. 4Q'14 | FY'15 | FY'14 | % Change vs. YTD'15 |
| ENI EBITDA (5) | $ | 6,191 |
| $ | 4,130 |
| 50% | $ | 36,552 |
| $ | 41,603 |
| (12)% |
| ENI EBITDA Margin (6) | 36 | % | 25 | % | 11% | 42 | % | 47 | % | (5)% |
| ENI Margin (6) | 25 | % | 20 | % | 5% | 36 | % | 41 | % | (5)% |
|
| | | | | | | | | |
| NON-GAAP FINANCIAL MEASURE - AUM | 12/31/2015 | | 9/30/2015 | | % Change vs. 9/30/15 | | 12/31/2014 | | % Change vs. 12/31/15 |
| Fee Earning AUM from loan-based products (7) | $14,055,487 | | $14,216,216 | | (1)% | | $13,676,489 | | 3% |
|
| | | | | | | | | | | | | | |
| SELECTED GAAP RESULTS | 4Q'15 | 4Q'14 | % Change vs. 4Q'14 | FY'15 | FY'14 | % Change vs. YTD'15 |
| Total net revenues (8) | $ | 48,935 |
| $ | 141,037 |
| n/m | $ | 122,518 |
| $ | 522,910 |
| n/m |
| Total expenses (8) | $ | 27,041 |
| $ | 73,036 |
| n/m | $ | 91,525 |
| $ | 277,104 |
| n/m |
| Net income (loss) attributable to CIFC LLC | $ | (7,666 | ) | $ | 768 |
| (1,098)% | $ | 334 |
| $ | 8,381 |
| (96)% |
| Earnings (loss) per share - basic | $ | (0.30 | ) | $ | 0.03 |
| (1,100)% | $ | 0.01 |
| $ | 0.37 |
| (97)% |
| Earnings (loss) per share - diluted (3) | $ | (0.29 | ) | $ | 0.03 |
| (1,067)% | $ | 0.01 |
| $ | 0.35 |
| (97)% |
| Weighted average shares outstanding - basic | 25,308 |
| 25,150 |
| 1% | 25,315 |
| 22,909 |
| 11% |
| Weighted average shares outstanding - diluted | 26,152 |
| 26,633 |
| (2)% | 26,414 |
| 24,168 |
| 9% |
Explanatory Notes:
| |
| (1) | See Appendix for a detailed description of these non-GAAP measures and reconciliations from GAAP net income (loss) attributable to the Company to non-GAAP measures. |
| |
| (2) | Share-based compensation includes equity award amortization expense for both employees and directors of the Company. |
| |
| (3) | Convertible Notes outstanding were converted into the Company's common shares on July 12, 2014. For year ended December 31, 2014, the convertible notes were anti-dilutive and excluded from the numerator in the dilution calculation. |
| |
| (4) | GAAP weighted average shares outstanding was used as ENI weighted average shares outstanding. |
| |
| (5) | ENI EBITDA is ENI before corporate interest expense and depreciation of fixed assets. See Appendix. |
| |
| (6) | ENI EBITDA Margin is ENI EBITDA divided by Total ENI Revenue. ENI Margin is ENI divided by Total ENI Revenue. |
| |
| (7) | Amount excludes Fee Earning AUM attributable to non-core products of $592.8 million, $621.9 million and $687.6 million as of December 31, 2015, September 30, 2015 and December 31, 2014, respectively. Fee Earning AUM attributable to non-core products are expected to continue to decline as these funds run-off per their contractual terms. |
| |
| (8) | The Company early adopted the amendments of Accounting Standard Update "ASU" 2015-02, Consolidation (Topic 810) - Amendments to the Consolidation Analysis ("ASU 2015-02"). The adoption was applied on a modified retroactive basis, resulting in the deconsolidation of 30 CLOs and 1 credit fund as of January 1, 2015. As of December 31, 2015, we consolidated 2 CLOs and 2 credit funds. As of December 31, 2014, we consolidated 31 CLOs, 1 warehouse, and 2 credit funds. Year over year, our GAAP Consolidated Statements of Operations will not be comparative for certain line items (e.g. Total net revenues). |
Fourth Quarter Overview
CIFC reported ENI of $4.3 million for the fourth quarter of 2015, as compared to $3.3 million for the same quarter in the prior year. ENI increased quarter over quarter by $1.0 million or 31%. Quarter over quarter, management fees increased from continued AUM growth year over year and incentive fees increased as four CLOs were called during the fourth quarter of 2015. In addition, Employee Compensation and Benefits decreased as a result of reductions in incentive-based compensation quarter over quarter. Offsetting the increases in ENI were (i) decreases in net investment income primarily related to an increase of $11.1 million in unrealized losses as a result of significant declines in market value of loans and CLO securities compared to the prior year, (ii) increases in corporate interest related to the issuance of $40.0 million unsecured senior notes and (iii) increases in share based compensation related to amortization of equity awards granted since 2014.
CIFC reported GAAP net loss attributable to the Company of $7.7 million for the fourth quarter of 2015, as compared to net income of $0.8 million in the same period of the prior year. GAAP operating results decreased $8.4 million from the same period of the prior year primarily due to (i) a $10.8 million increase in income taxes primarily related to higher taxable income and the Reorganization Transaction, (ii) a $4.2 million increase in compensation expense related to incentive fee sharing arrangements with former employees for acquired CLOs from Columbus Nova Credit Investments Management, LLC ("CNCIM") and (iii) a $0.8 million increase in professional fees primarily related to the Reorganization Transaction. These decreases were offset by (i) a $1.0 million increase in ENI, as noted above (see Non-GAAP Financial Measures section for a reconciliation between GAAP and Non-GAAP ENI), (ii) a $5.5 million increase in incentive fees earned on certain Legacy CLOs with fee sharing agreements (GAAP represents fees gross of fee sharing) and (iii) decreases in amortization and impairment of intangible assets of $0.4 million related to impairments and write offs in previous years.
Fiscal Year Overview
CIFC reported ENI of $31.4 million for the year ended December 31, 2015, as compared to $36.1 million for the prior year. ENI decreased year over year by $4.7 million or 13%. Year over year ENI decreased primarily because, (i) net investment income decreased by $12.3 million to $1.9 million, primarily related to an increase of $13.5 million in unrealized losses resulting from significant declines in the market value of loans and CLO securities compared to the prior year and (ii) share based compensation increased due to amortization of equity awards granted since 2013. Offsetting these decreases in ENI were increases in management fees from continued AUM growth year over year in credit funds and incentive fees from CLOs called during 2015.
CIFC reported GAAP net income attributable to the Company of $0.3 million for year ended December 31, 2015, as compared to $8.4 million in prior year. GAAP operating results decreased by $8.0 million, or 96%. from the same period of the prior year primarily due to (i) a $4.7 million decrease in ENI, as noted above (see Non-GAAP Financial Measures section for a reconciliation between GAAP and Non-GAAP ENI), (ii) a $3.7 million increase in compensation expense related to incentive fee sharing arrangements with former employees for acquired CLOs from CNCIM, (iii) a $2.1 million increase in professional fees primarily related to the Reorganization Transaction and (iv) a $3.1 million increase in income taxes primarily related to higher taxable income and the Reorganization Transaction. These decreases were offset by (i) a $2.8 million increase in incentive fees earned on certain Legacy CLOs with fee sharing agreements (GAAP presents fees gross of fee sharing) and (ii) a $1.9 million reduction in intangible asset amortization compared to the prior year as certain CLO and CDO management contracts were written off in the prior year.
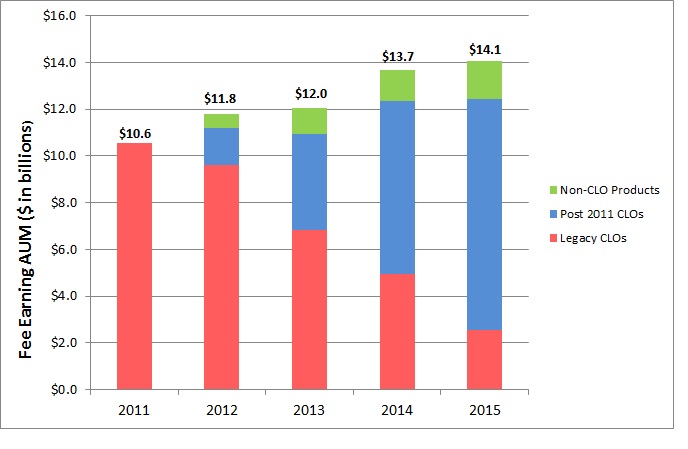
Fee Earning AUM
Fee Earning AUM or AUM refers to the assets managed by the Company on which we receive management fees and/or incentive based fees. Generally, with respect to CLOs, management fees are paid to the Company based on the aggregate collateral balance at par plus principal cash, and with respect to Non-CLO funds, the value of the assets in such funds.
The following table summarizes Fee Earning AUM for the Company's loan-based products:
|
| | | | | | | | | | | | | | | | | | | | | |
| | | December 31, 2015 | | September 30, 2015 | | December 31, 2014 |
| (in thousands, except # of Accounts) (1)(2) | | # of Accounts | | Fee Earning AUM | | # of Accounts | | Fee Earning AUM | | # of Accounts | | Fee Earning AUM |
| Post 2011 CLOs | | 18 |
| | $ | 9,860,519 |
| | 17 |
| | $ | 9,388,022 |
| | 13 |
| | $ | 7,402,986 |
|
| Legacy CLOs (3) | | 10 |
| | 2,559,066 |
| | 14 |
| | 3,253,869 |
| | 19 |
| | 4,960,877 |
|
| Total CLOs | | 28 |
| | 12,419,585 |
| | 31 |
| | 12,641,891 |
| | 32 |
| | 12,363,863 |
|
| Credit Funds (4) | | 12 |
| | 1,062,712 |
| | 10 |
| | 941,035 |
| | 8 |
| | 593,456 |
|
| Other Loan-Based Products (4) | | 2 |
| | 573,190 |
| | 2 |
| | 633,290 |
| | 2 |
| | 719,170 |
|
| Total Non-CLOs (4) | | 14 |
| | $ | 1,635,902 |
| | 12 |
| | $ | 1,574,325 |
| | 10 |
| | $ | 1,312,626 |
|
| AUM from loan-based products | | 42 |
| | $ | 14,055,487 |
| | 43 |
| | $ | 14,216,216 |
| | 42 |
| | $ | 13,676,489 |
|
Explanatory Notes:
| |
| (1) | Table excludes Fee Earning AUM attributable to non-core products of $592.8 million, $621.9 million and $687.6 million as of December 31, 2015, September 30, 2015 and December 31, 2014, respectively. Fee Earning AUM attributable to non-core products is expected to continue to decline as these funds run-off per their contractual terms. |
| |
| (2) | Fee Earning AUM is based on the latest available monthly report issued by the trustee or fund administrator prior to the end of the period, and may not tie back to the Consolidated GAAP financial statements. |
| |
| (3) | Legacy CLOs represent all managed CLOs issued prior to 2011, including CLOs acquired since 2011 but issued prior to 2011. |
| |
| (4) | Management fees for Non-CLO products vary by fund and may not be similar to a CLO. |
Since 2012, CIFC has raised $11.4 billion of new AUM through organic growth, which has more than offset the run-off from Legacy CLOs (including acquired CLOs). Our Legacy CLO AUM of $2.6 billion is less than a fifth of our total CLO AUM of $12.4 billion and we anticipate it will run off over the next three years.
Total loan-based Fee Earning AUM activity for the three months and year ended December 31, 2015 are as follows ($ in thousands):
|
| | | | | | | | |
| | | 4Q'15 | | FY'15 |
| Opening AUM Balance | | $ | 14,216,216 |
| | $ | 13,676,489 |
|
| CLO New Issuances | | 498,360 |
| | 2,599,709 |
|
| CLO Paydowns | | (726,219 | ) | | (2,521,645 | ) |
| Net Subscriptions to Credit Funds | | 126,814 |
| | 450,070 |
|
| Net Redemptions from Other Loan-Based Products | | (60,100 | ) | | (145,980 | ) |
| Other (1) | | 416 |
| | (3,156 | ) |
| Ending AUM Balance | | $ | 14,055,487 |
| | $ | 14,055,487 |
|
Explanatory Note:
| |
| (1) | Includes changes in collateral balances of CLOs between periods and market value or portfolio value changes in certain Non-CLO products. |
Balance Sheet Highlights
During the year ended December 31, 2015, we generated $32.6 million of adjusted cash flows from operations. We raised $40.0 million through debt issuance and invested $60.5 million. As of December 31, 2015, we held total cash and investments of $210.4 million comprised of total cash of $58.0 million and investments of $152.4 million with no debt maturing until October 2025. See balance sheet highlights below:
|
| | | | | | | | | | | | | | | | |
| ($ in thousands) | | As of December 31, 2015
| | As of December 31, 2014
|
| Cash and Cash Equivalents | | | | $ | 57,968 |
| | | | $ | 59,290 |
|
| | | | | | | | | |
| Investments | | | | | | | | |
| CIFC CLO Equity | | $ | 53,912 |
| | | | $ | 20,485 |
| | |
| Warehouses (1) | | — |
| | | | 21,134 |
| | |
| Fund Coinvestments | | 41,401 |
| | | | 42,338 |
| | |
| CLO Debt | | 32,140 |
| | | | 9,713 |
| | |
| Other (2) | | 24,946 |
| | | | 7,579 |
| | |
| Total Investments | | | | $ | 152,399 |
| | | | $ | 101,249 |
|
| Total Cash and Investments | | | | 210,367 |
| | | | 160,539 |
|
| | | | | | | | | |
| Long Term Debt | | | | | | | | |
| Junior Subordinated Notes due 2035 | | $ | 120,000 |
| | | | $ | 120,000 |
| | |
| Senior Notes due 2025 | | 40,000 |
| | | | — |
| | |
| Total Long Term Debt | | | | 160,000 |
| | | | 120,000 |
|
| Net Cash and Investments | | | | $ | 50,367 |
| | | | $ | 40,539 |
|
Explanatory Notes:
| |
| (1) | From time to time, the Company establishes “warehouses,” entities designed to accumulate assets in advance of sponsoring new CLOs or other funds managed by the Company. To establish a warehouse, the Company contributes equity capital to a newly formed entity which is typically levered (three to five times) and begins accumulating assets. When the related CLO or fund is sponsored, typically three to nine months later, the warehouse is “terminated,” with it concurrently repaying the related financing and returning to the Company its equity contribution. Gains or losses may be netted against the Company's equity contribution depending on whether warehouse assets are transferred at market value or cost. Starting in the fourth quarter of 2014, most warehouse investments that we manage have been made though the Warehouse Fund, a closed-end structured credit fund. |
| |
| (2) | Primarily includes investment in CIFC's Tactical Income Fund, which may be redeemed with 60 day's notice on the last day of each calendar quarter. |
Appendix
Non-GAAP Financial Measures
The Company discloses financial measures that are calculated and presented on a basis of methodology other than in accordance with generally accepted accounting principles of the United States of America (“Non-GAAP”) as follows:
ENI is a non-GAAP financial measure of profitability which management uses in addition to GAAP Net income (loss) attributable to CIFC LLC to measure the performance of our core business (excluding non-core products). We believe ENI reflects the nature and substance of the business, the economic results driven by management fee revenues from the management of client funds and earnings on our investments. ENI represents GAAP Net income (loss) attributable to CIFC LLC excluding (i) income taxes, (ii) merger and acquisition related items including fee-sharing arrangements, amortization and impairments of intangible assets and gain (loss) on contingent consideration for earn-outs, (iii) non-cash compensation related to profits interests granted by CIFC Parent Holdings LLC in June 2011, (iv) revenues attributable to non-core investment products, (v) advances for fund organizational expenses, and (vi) certain other items as detailed.
The Deconsolidated Non-GAAP Statements represent the Consolidated GAAP statements adjusted to eliminate the impact of the Consolidated Entities. On the Statement of Operations, the Company has reclassified the sum of Net results of Consolidated Entities, Net (income) loss attributable to noncontrolling interests in Consolidated Entities and Net gain (loss) on investments to the Deconsolidated Non-GAAP line items that represent its characteristics: management fees and incentive fees, and interest income. Management uses these Non-GAAP statements in addition to Consolidated GAAP Statements to measure the performance of its core asset management business.
ENI EBITDA is also a non-GAAP financial measure that management considers, in addition to GAAP Net income (loss) attributable to CIFC Corp., to evaluate the Company's core performance. ENI EBITDA represents ENI before corporate interest expense and depreciation of fixed assets, a non-cash item.
ENI and ENI EBITDA may not be comparable to similar measures presented by other companies, as they are non-GAAP financial measures that are not based on a comprehensive set of accounting rules or principles and therefore may be defined differently by other companies. In addition, ENI and ENI EBITDA should be considered as an addition to, not as a substitute for, or superior to, financial measures determined in accordance with GAAP.
A detailed calculation of ENI and ENI EBITDA and a reconciliation to the most comparable GAAP financial measure is included in the Appendix.
[Financial Tables to Follow in Appendix]
About CIFC
Founded in 2005, CIFC is a private debt manager specializing in secured U.S. corporate loan strategies. Headquartered in New York, CIFC is a SEC registered investment adviser and a publicly traded company (NASDAQ: CIFC). Serving institutional investors globally, CIFC is one of the largest managers of senior secured corporate credit. For more information, please visit CIFC’s website at www.cifc.com.
Forward-Looking Statements
This release may contain forward-looking statements within the meaning of Section 27A of the Securities Act of 1933 and Section 21E of the Securities Exchange Act of 1934 which reflect CIFC's current views with respect to, among other things, CIFC's operations and financial performance. You can identify these forward-looking statements by the use of words such as “outlook,” “believes,” “expects,” “potential,” “continues,” “may,” “will,” “should,” “seeks,” “approximately,” “predicts,” “intends,” “plans,” “estimates,” “anticipates” or the negative version of these words or other comparable words. Such forward-looking statements are subject to various risks and uncertainties. Accordingly, there are or will be important factors that could cause actual outcomes or results to differ materially from those indicated in these statements. CIFC believes these factors include but are not limited to those described under the section entitled “Risk Factors” in its Annual Report on Form 10-K for the fiscal year ended December 31, 2014, as such factors may be updated from time to time in its periodic filings with the Securities and Exchange Commission, which are accessible on the SEC's website at www.sec.gov. These factors should not be construed as exhaustive and should be read in conjunction with the other cautionary statements that are included in this release and in the filings. CIFC undertakes no obligation to publicly update or review any forward-looking statement, whether as a result of new information, future developments or otherwise.
Summary Reconciliation of GAAP Net income (loss) attributable to CIFC Corp. to Non-GAAP Measures (unaudited)
|
| | | | | | | | | | | | | | | | |
| (In thousands) (unaudited) | | 4Q'15 | | 4Q'14 | | FY'15 | | FY'14 |
| GAAP Net income (loss) attributable to CIFC Corp. | | $ | (7,666 | ) | | $ | 768 |
| | $ | 334 |
| | $ | 8,381 |
|
| Income tax expense (benefit) | | 11,798 |
| | 1,034 |
| | 25,239 |
| | 22,158 |
|
| Amortization and impairment of intangibles | | 1,784 |
| | 2,205 |
| | 8,218 |
| | 10,149 |
|
| Management fee sharing arrangements (1) | | (7,158 | ) | | (1,668 | ) | | (11,521 | ) | | (8,716 | ) |
| Net (gain)/loss on contingent liabilities and other | | 418 |
| | 757 |
| | 2,210 |
| | 2,932 |
|
| Employee compensation costs (2) | | 4,501 |
| | 318 |
| | 5,327 |
| | 1,610 |
|
| Management fees attributable to non-core funds | | (151 | ) | | (179 | ) | | (654 | ) | | (814 | ) |
| Other (3) | | 755 |
| | 24 |
| | 2,204 |
| | 395 |
|
| Total reconciling items | | 11,947 |
| | 2,491 |
| | 31,023 |
| | 27,714 |
|
| ENI | | $ | 4,281 |
| | $ | 3,259 |
| | $ | 31,357 |
| | $ | 36,095 |
|
| Add: Corporate interest expense | | 1,552 |
| | 569 |
| | 3,808 |
| | 4,236 |
|
| Add: Depreciation of fixed assets | | 358 |
| | 302 |
| | 1,387 |
| | 1,272 |
|
| ENI EBITDA | | $ | 6,191 |
| | $ | 4,130 |
| | $ | 36,552 |
| | $ | 41,603 |
|
Explanatory Notes:
| |
| (1) | The Company shares management fees on certain of the acquired CLOs it manages (shared with the party that sold the funds to CIFC, or an affiliate thereof). Management fees are presented on a gross basis for GAAP and on a net basis for ENI. |
| |
| (2) | Employee compensation and benefits has been adjusted for non-cash compensation related to profits interests granted to CIFC employees by CIFC Parent and sharing of incentive fees with certain former employees established in connection with the Company's acquisition of certain CLOs from CNCIM. |
| |
| (3) | In 2015, Other predominately includes professional fees related to the Reorganization Transaction. |
Reconciliation of GAAP to Non-GAAP Measures - Condensed Consolidated Statements of Operations (1)
|
| | | | | | | | | | | | | | | | | | | | | | | | |
| | | 4Q'15 | | 4Q'14 |
| (In thousands) (unaudited) | | Consolidated GAAP | | Consolidation Adjustments | | Deconsolidated Non-GAAP | | Consolidated GAAP | | Consolidation Adjustments | | Deconsolidated Non-GAAP |
| Revenues | | | | | | | | | | | | |
| Management and incentive fees | | $ | 30,612 |
| | $ | 3,865 |
| | $ | 34,477 |
| | $ | 840 |
| | $ | 19,249 |
| | $ | 20,089 |
|
Interest income/Net investment income
| | 388 |
| | $ | (10,429 | ) | | (10,041 | ) | | 488 |
| | (2,032 | ) | | (1,544 | ) |
| Subtotal revenues (2) | | 31,000 |
| | (6,564 | ) | | 24,436 |
| | 1,328 |
| | 17,217 |
| | 18,545 |
|
| Expenses | | | | | | | | | | | | |
| Employee compensation and benefits | | 8,480 |
| | — |
| | 8,480 |
| | 6,581 |
| | — |
| | 6,581 |
|
| Share-based compensation | | 1,716 |
| | — |
| | 1,716 |
| | 1,041 |
| | — |
| | 1,041 |
|
| Corporate interest expense | | 1,552 |
| | — |
| | 1,552 |
| | 569 |
| | — |
| | 569 |
|
| Operating expenses | | 8,137 |
| | — |
| | 8,137 |
| | 7,795 |
| | — |
| | 7,795 |
|
| Subtotal expenses (2) | | 19,885 |
| | — |
| | 19,885 |
| | 15,986 |
| | — |
| | 15,986 |
|
| Net other gain (loss) (2) | | (5,648 | ) | | 5,229 |
| | (419 | ) | | (1,225 | ) | | 468 |
| | (757 | ) |
| Net results of Consolidated Entities (2) | | (1,336 | ) | | $ | 1,336 |
| | — |
| | 100,955 |
| | (100,955 | ) | | — |
|
| Income (loss) before income taxes | | 4,131 |
| | 1 |
| | 4,132 |
| | 85,072 |
| | (83,270 | ) | | 1,802 |
|
| Income tax (expense) benefit | | (11,798 | ) | | — |
| | (11,798 | ) | | (1,034 | ) | | — |
| | (1,034 | ) |
| Net income (loss) | | (7,667 | ) | | 1 |
| | (7,666 | ) | | 84,038 |
| | (83,270 | ) | | 768 |
|
| Net (income) loss attributable to noncontrolling interests in Consolidated Entities | | 1 |
| | $ | (1 | ) | | — |
| | (83,270 | ) | | 83,270 |
| | — |
|
| Net income (loss) attributable to the Company (3) | | $ | (7,666 | ) | | $ | — |
| | $ | (7,666 | ) | | $ | 768 |
| | $ | — |
| | $ | 768 |
|
|
| | | | | | | | | | | | | | | | | | | | | | | | |
| | | FY'15 | | FY'14 |
| (In thousands) (unaudited) | | Consolidated GAAP | | Consolidation Adjustments | | Deconsolidated Non-GAAP | | Consolidated GAAP | | Consolidation Adjustments | | Deconsolidated Non-GAAP |
| Revenues | | | | | | | | | | | | |
| Management and incentive fees | | $ | 92,079 |
| | $ | 4,685 |
| | $ | 96,764 |
| | $ | 4,868 |
| | $ | 79,334 |
| | $ | 84,202 |
|
| Interest income/Net investment income | | 5,333 |
| | (3,467 | ) | | 1,866 |
| | 790 |
| | 13,349 |
| | 14,139 |
|
| Subtotal revenues (2) | | 97,412 |
| | 1,218 |
| | 98,630 |
| | 5,658 |
| | 92,683 |
| | 98,341 |
|
| Expenses | | | | | | | | | | | | |
| Employee compensation and benefits | | 32,027 |
| | — |
| | 32,027 |
| | 28,805 |
| | — |
| | 28,805 |
|
| Share-based compensation | | 5,550 |
| | — |
| | 5,550 |
| | 2,692 |
| | — |
| | 2,692 |
|
| Corporate interest expense | | 3,808 |
| | — |
| | 3,808 |
| | 4,236 |
| | — |
| | 4,236 |
|
| Operating expenses | | 29,462 |
| | — |
| | 29,462 |
| | 29,366 |
| | — |
| | 29,366 |
|
| Subtotal expenses (2) | | 70,847 |
| | — |
| | 70,847 |
| | 65,099 |
| | — |
| | 65,099 |
|
| Net other gain (loss) (2) | | (6,391 | ) | | 4,181 |
| | (2,210 | ) | | (229 | ) | | (2,474 | ) | | (2,703 | ) |
| Net results of Consolidated Entities (2) | | 6,030 |
| | (6,030 | ) | | — |
| | 69,505 |
| | (69,505 | ) | | — |
|
| Income (loss) before income taxes | | 26,204 |
| | (631 | ) | | 25,573 |
| | 9,835 |
| | 20,704 |
| | 30,539 |
|
| Income tax (expense) benefit | | (25,239 | ) | | — |
| | (25,239 | ) | | (22,158 | ) | | — |
| | (22,158 | ) |
| Net income (loss) | | 965 |
| | (631 | ) | | 334 |
| | (12,323 | ) | | 20,704 |
| | 8,381 |
|
| Net (income) loss attributable to noncontrolling interests in Consolidated Entities | | (631 | ) | | 631 |
| | — |
| | 20,704 |
| | (20,704 | ) | | — |
|
| Net income (loss) attributable to the Company (3) | | $ | 334 |
| | $ | — |
| | $ | 334 |
| | $ | 8,381 |
| | $ | — |
| | $ | 8,381 |
|
Explanatory Note:
| |
| (1) | The Company early adopted ASU 2015-02 which was applied on a modified retroactive basis (as of January 1, 2015). This resulted in the deconsolidation of 30 CLOs and 1 credit fund as of January 1, 2015. As of December 31, 2015 we consolidated 2 CLOs and 2 credit funds. As of December 31, 2014 we consolidated 31 CLOs, 1 warehouse, and 2 credit funds. Year over year, our GAAP Consolidated Statements of Operations will not be comparative for certain line items. |
| |
| (2) | Net Results of Consolidated Entities is condensed herein and presented in detail in the GAAP Consolidated Statements of Operations within revenues, expenses and other gain (loss). |
| |
| (3) | On December 31, 2015, the Company completed the reorganization to become a publicly traded limited liability company. For the year ended December 31, 2015, total Net income (loss) was attributable to CIFC Corp. and effective December 31, 2015, Net income (loss) is attributable to CIFC LLC. |