BayFirst Financial Corp. (NASDAQ:BAFN) 2022 – Second Quarter Results (Unaudited)
Cautionary Statement Concerning Forward-Looking Information BAFN Q2 2022 In addition to the historical information contained herein, this presentation includes "forward-looking statements" within the meaning of such term in the Private Securities Litigation Reform Act of 1995. These statements are subject to many risks and uncertainties, including, but not limited to, the effects of the COVID-19 pandemic, global military hostilities, or climate change, including their effects on the economic environment, our customers and our operations, as well as any changes to federal, state or local government laws, regulations or orders in connection with them; the ability of the Company to implement its strategy and expand its banking operations; changes in interest rates and other general economic, business and political conditions, including changes in the financial markets; changes in business plans as circumstances warrant; risks related to mergers and acquisitions; changes in benchmark interest rates used to price loans and deposits, changes in tax laws, regulations and guidance; and other risks detailed from time to time in filings made by the Company with the SEC, including, but not limited to those “Risk Factors” described in our most recent Form 10-K and Form 10-Q. Readers should note that the forward-looking statements included herein are not a guarantee of future events, and that actual events may differ materially from those made in or suggested by the forward-looking statements. Forward-looking statements generally can be identified by the use of forward-looking terminology such as "will," "propose," "may," "plan," "seek," "expect," "intend," "estimate," "anticipate," "believe," "continue," or similar terminology. Any forward-looking statements presented herein are made only as of the date of this document, and we do not undertake any obligation to update or revise any forward-looking statements to reflect changes in assumptions, the occurrence of unanticipated events, or otherwise. 2
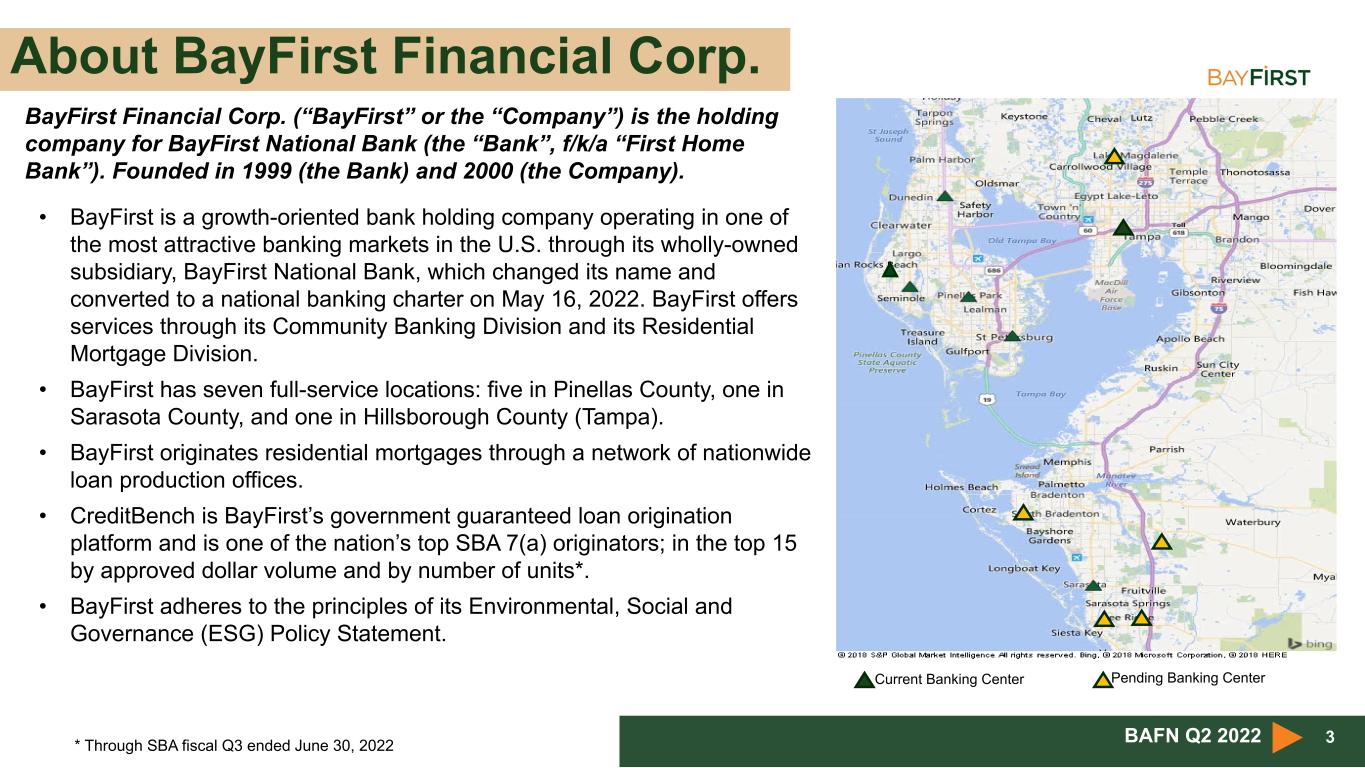
About BayFirst Financial Corp. 3BAFN Q2 2022 BayFirst Financial Corp. (“BayFirst” or the “Company”) is the holding company for BayFirst National Bank (the “Bank”, f/k/a “First Home Bank”). Founded in 1999 (the Bank) and 2000 (the Company). Current Banking Center Pending Banking Center • BayFirst is a growth-oriented bank holding company operating in one of the most attractive banking markets in the U.S. through its wholly-owned subsidiary, BayFirst National Bank, which changed its name and converted to a national banking charter on May 16, 2022. BayFirst offers services through its Community Banking Division and its Residential Mortgage Division. • BayFirst has seven full-service locations: five in Pinellas County, one in Sarasota County, and one in Hillsborough County (Tampa). • BayFirst originates residential mortgages through a network of nationwide loan production offices. • CreditBench is BayFirst’s government guaranteed loan origination platform and is one of the nation’s top SBA 7(a) originators; in the top 15 by approved dollar volume and by number of units*. • BayFirst adheres to the principles of its Environmental, Social and Governance (ESG) Policy Statement. * Through SBA fiscal Q3 ended June 30, 2022
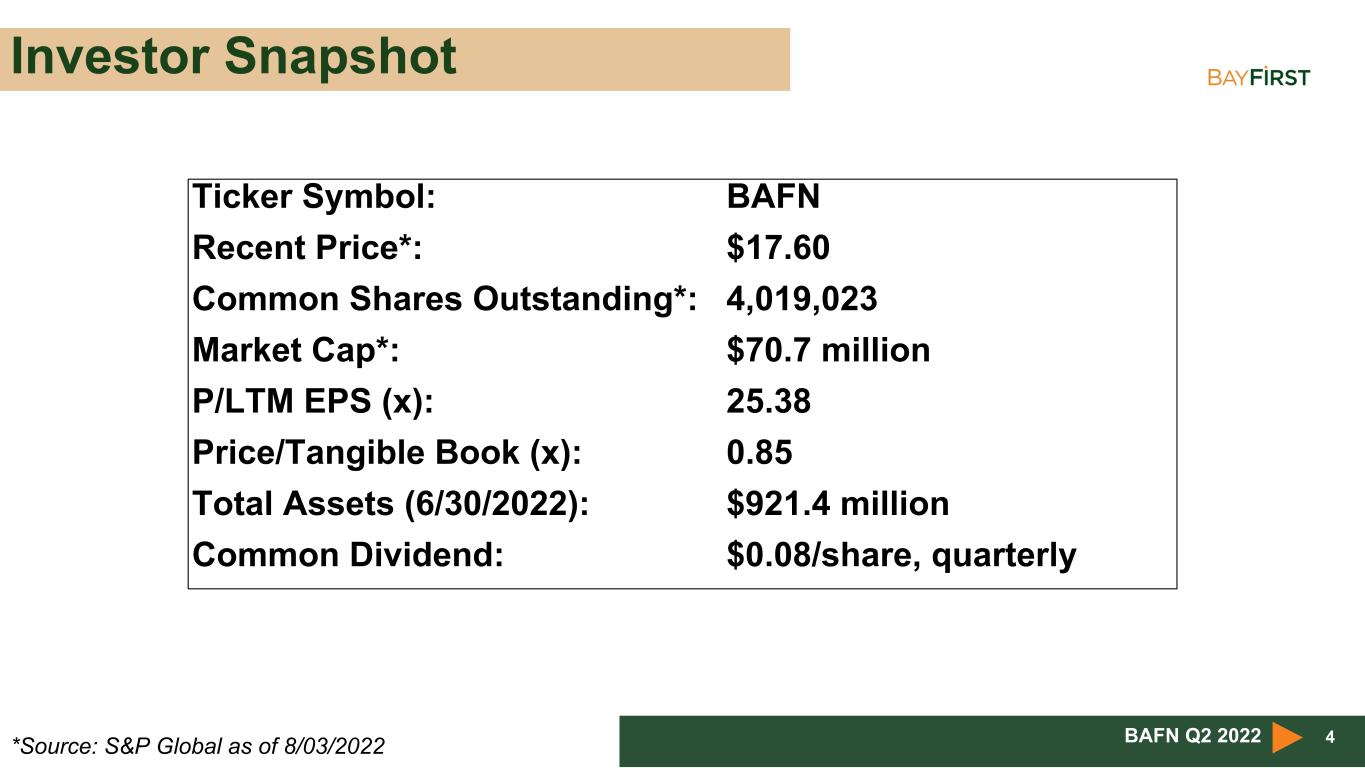
Investor Snapshot 4BAFN Q2 2022 Ticker Symbol: BAFN Recent Price*: $17.60 Common Shares Outstanding*: 4,019,023 Market Cap*: $70.7 million P/LTM EPS (x): 25.38 Price/Tangible Book (x): 0.85 Total Assets (6/30/2022): $921.4 million Common Dividend: $0.08/share, quarterly *Source: S&P Global as of 8/03/2022
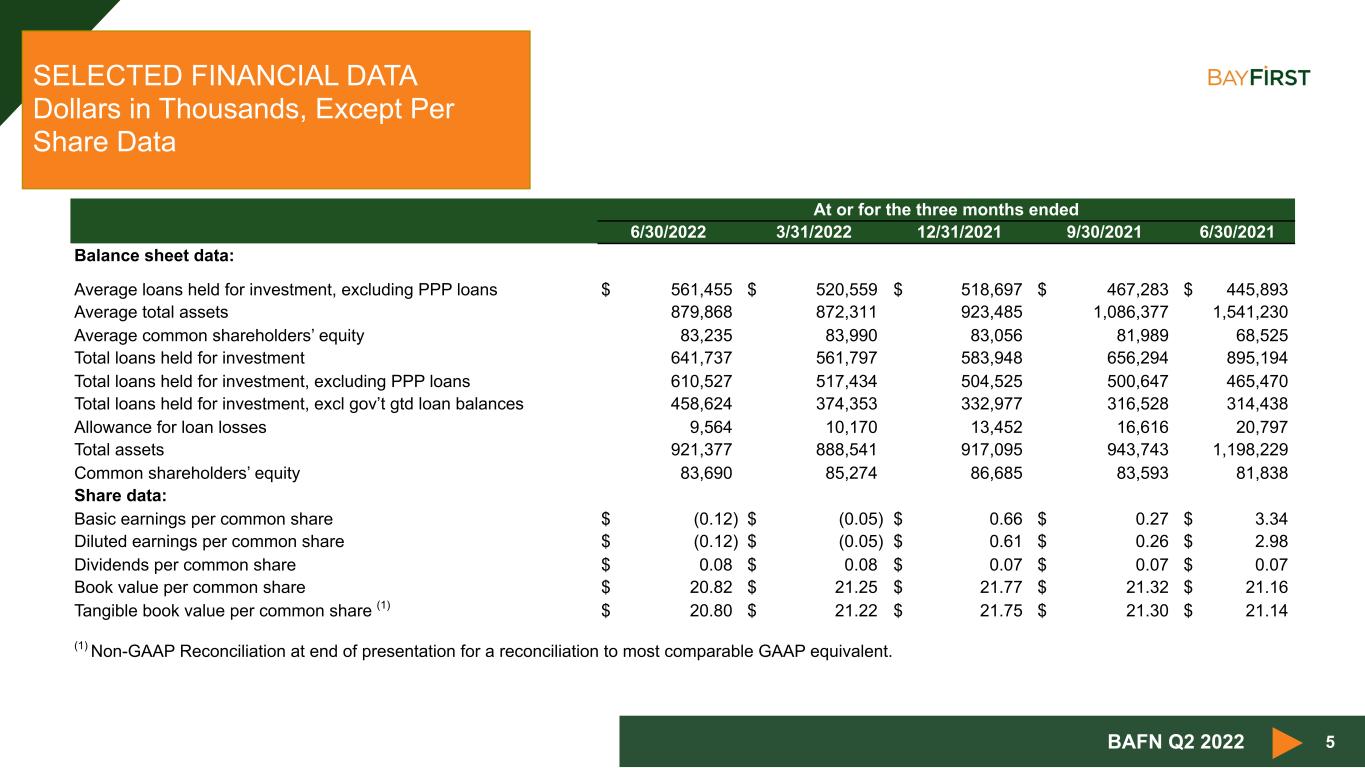
5 SELECTED FINANCIAL DATA Dollars in Thousands, Except Per Share Data At or for the three months ended 6/30/2022 3/31/2022 12/31/2021 9/30/2021 6/30/2021 Balance sheet data: Average loans held for investment, excluding PPP loans $ 561,455 $ 520,559 $ 518,697 $ 467,283 $ 445,893 Average total assets 879,868 872,311 923,485 1,086,377 1,541,230 Average common shareholders’ equity 83,235 83,990 83,056 81,989 68,525 Total loans held for investment 641,737 561,797 583,948 656,294 895,194 Total loans held for investment, excluding PPP loans 610,527 517,434 504,525 500,647 465,470 Total loans held for investment, excl gov’t gtd loan balances 458,624 374,353 332,977 316,528 314,438 Allowance for loan losses 9,564 10,170 13,452 16,616 20,797 Total assets 921,377 888,541 917,095 943,743 1,198,229 Common shareholders’ equity 83,690 85,274 86,685 83,593 81,838 Share data: Basic earnings per common share $ (0.12) $ (0.05) $ 0.66 $ 0.27 $ 3.34 Diluted earnings per common share $ (0.12) $ (0.05) $ 0.61 $ 0.26 $ 2.98 Dividends per common share $ 0.08 $ 0.08 $ 0.07 $ 0.07 $ 0.07 Book value per common share $ 20.82 $ 21.25 $ 21.77 $ 21.32 $ 21.16 Tangible book value per common share (1) $ 20.80 $ 21.22 $ 21.75 $ 21.30 $ 21.14 (1) Non-GAAP Reconciliation at end of presentation for a reconciliation to most comparable GAAP equivalent. BAFN Q2 2022
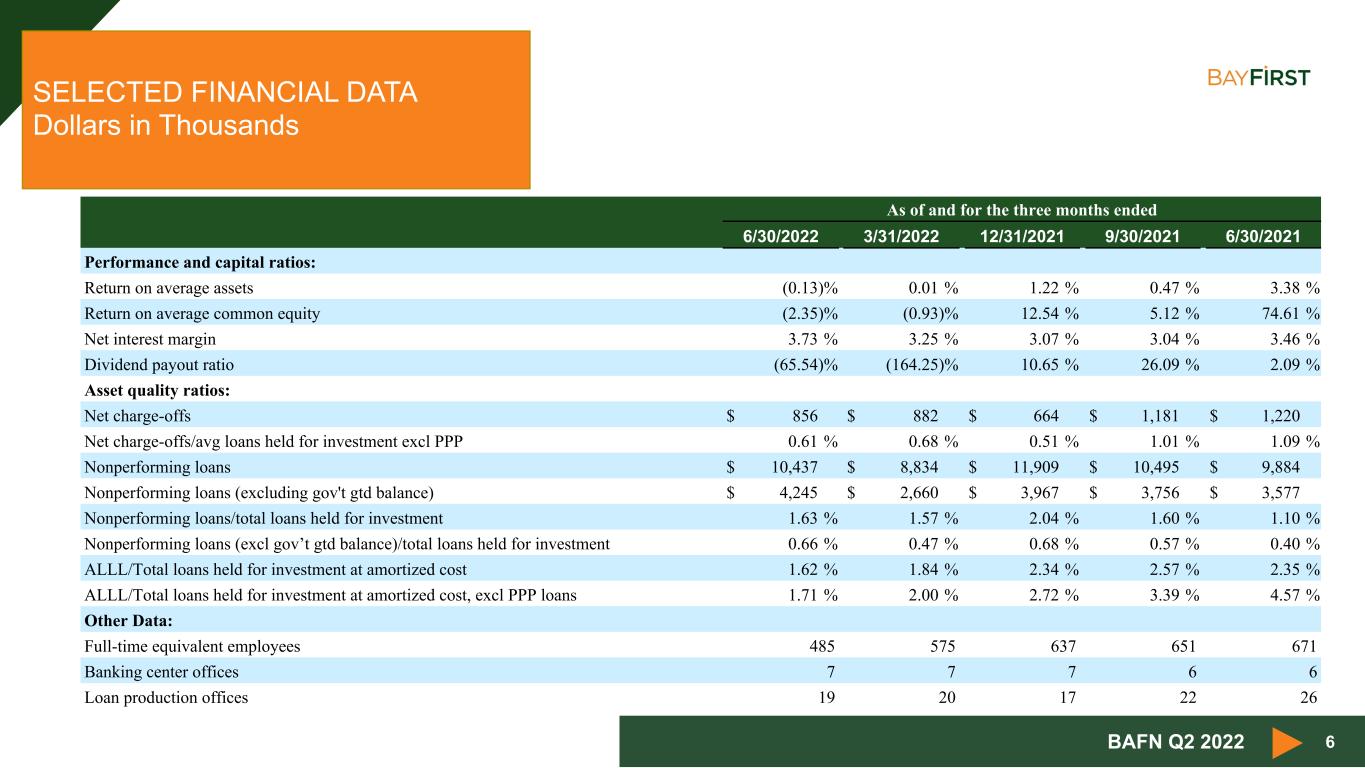
6 SELECTED FINANCIAL DATA Dollars in Thousands BAFN Q2 2022 As of and for the three months ended 6/30/2022 3/31/2022 12/31/2021 9/30/2021 6/30/2021 Performance and capital ratios: Return on average assets (0.13) % 0.01 % 1.22 % 0.47 % 3.38 % Return on average common equity (2.35) % (0.93) % 12.54 % 5.12 % 74.61 % Net interest margin 3.73 % 3.25 % 3.07 % 3.04 % 3.46 % Dividend payout ratio (65.54) % (164.25) % 10.65 % 26.09 % 2.09 % Asset quality ratios: Net charge-offs $ 856 $ 882 $ 664 $ 1,181 $ 1,220 Net charge-offs/avg loans held for investment excl PPP 0.61 % 0.68 % 0.51 % 1.01 % 1.09 % Nonperforming loans $ 10,437 $ 8,834 $ 11,909 $ 10,495 $ 9,884 Nonperforming loans (excluding gov't gtd balance) $ 4,245 $ 2,660 $ 3,967 $ 3,756 $ 3,577 Nonperforming loans/total loans held for investment 1.63 % 1.57 % 2.04 % 1.60 % 1.10 % Nonperforming loans (excl gov’t gtd balance)/total loans held for investment 0.66 % 0.47 % 0.68 % 0.57 % 0.40 % ALLL/Total loans held for investment at amortized cost 1.62 % 1.84 % 2.34 % 2.57 % 2.35 % ALLL/Total loans held for investment at amortized cost, excl PPP loans 1.71 % 2.00 % 2.72 % 3.39 % 4.57 % Other Data: Full-time equivalent employees 485 575 637 651 671 Banking center offices 7 7 7 6 6 Loan production offices 19 20 17 22 26

An Innovative Community Bank 7 Management Depth, Diverse Board Strategically Driven, Progressive Organization Innovative, Dynamic and Profitable Community Bank Attractive Market with Scarcity of Community Banks Scalable Advanced Technology Platform, Diversified Revenue Model BAFN Q2 2022
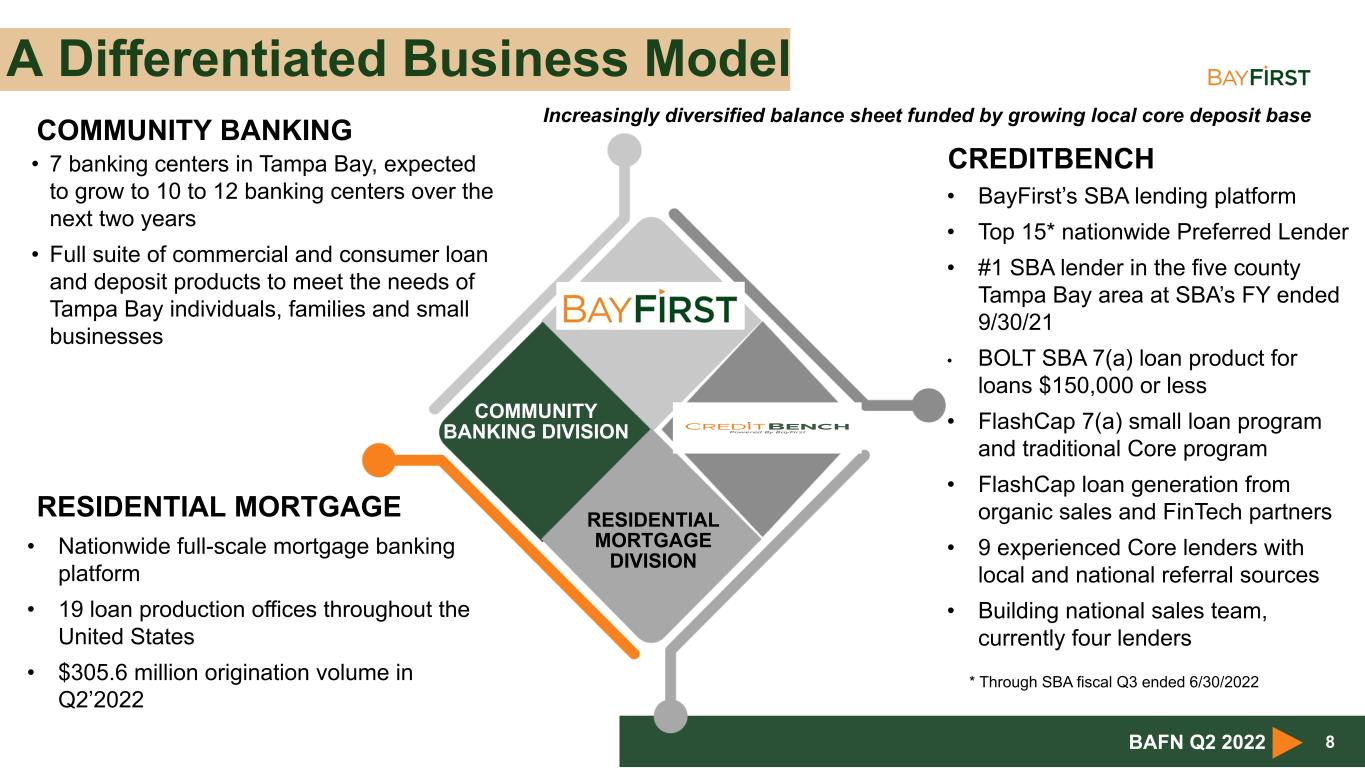
A Differentiated Business Model 8 CREDITBENCH • BayFirst’s SBA lending platform • Top 15* nationwide Preferred Lender • #1 SBA lender in the five county Tampa Bay area at SBA’s FY ended 9/30/21 • BOLT SBA 7(a) loan product for loans $150,000 or less • FlashCap 7(a) small loan program and traditional Core program • FlashCap loan generation from organic sales and FinTech partners • 9 experienced Core lenders with local and national referral sources • Building national sales team, currently four lenders RESIDENTIAL MORTGAGE • Nationwide full-scale mortgage banking platform • 19 loan production offices throughout the United States • $305.6 million origination volume in Q2’2022 COMMUNITY BANKING • 7 banking centers in Tampa Bay, expected to grow to 10 to 12 banking centers over the next two years • Full suite of commercial and consumer loan and deposit products to meet the needs of Tampa Bay individuals, families and small businesses RESIDENTIAL MORTGAGE DIVISION COMMUNITY BANKING DIVISION Increasingly diversified balance sheet funded by growing local core deposit base BAFN Q2 2022 * Through SBA fiscal Q3 ended 6/30/2022
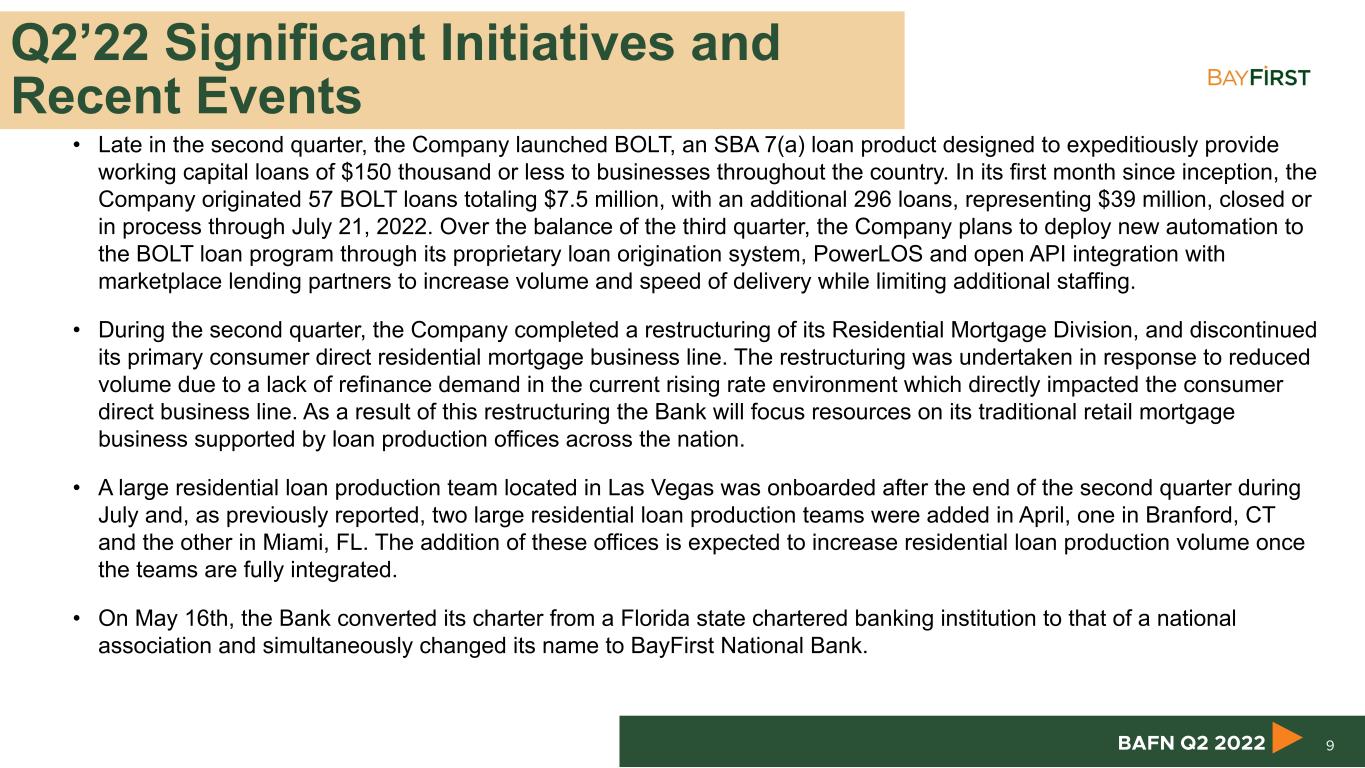
• Late in the second quarter, the Company launched BOLT, an SBA 7(a) loan product designed to expeditiously provide working capital loans of $150 thousand or less to businesses throughout the country. In its first month since inception, the Company originated 57 BOLT loans totaling $7.5 million, with an additional 296 loans, representing $39 million, closed or in process through July 21, 2022. Over the balance of the third quarter, the Company plans to deploy new automation to the BOLT loan program through its proprietary loan origination system, PowerLOS and open API integration with marketplace lending partners to increase volume and speed of delivery while limiting additional staffing. • During the second quarter, the Company completed a restructuring of its Residential Mortgage Division, and discontinued its primary consumer direct residential mortgage business line. The restructuring was undertaken in response to reduced volume due to a lack of refinance demand in the current rising rate environment which directly impacted the consumer direct business line. As a result of this restructuring the Bank will focus resources on its traditional retail mortgage business supported by loan production offices across the nation. • A large residential loan production team located in Las Vegas was onboarded after the end of the second quarter during July and, as previously reported, two large residential loan production teams were added in April, one in Branford, CT and the other in Miami, FL. The addition of these offices is expected to increase residential loan production volume once the teams are fully integrated. • On May 16th, the Bank converted its charter from a Florida state chartered banking institution to that of a national association and simultaneously changed its name to BayFirst National Bank. 9BAFN Q2 2022 Q2’22 Significant Initiatives and Recent Events
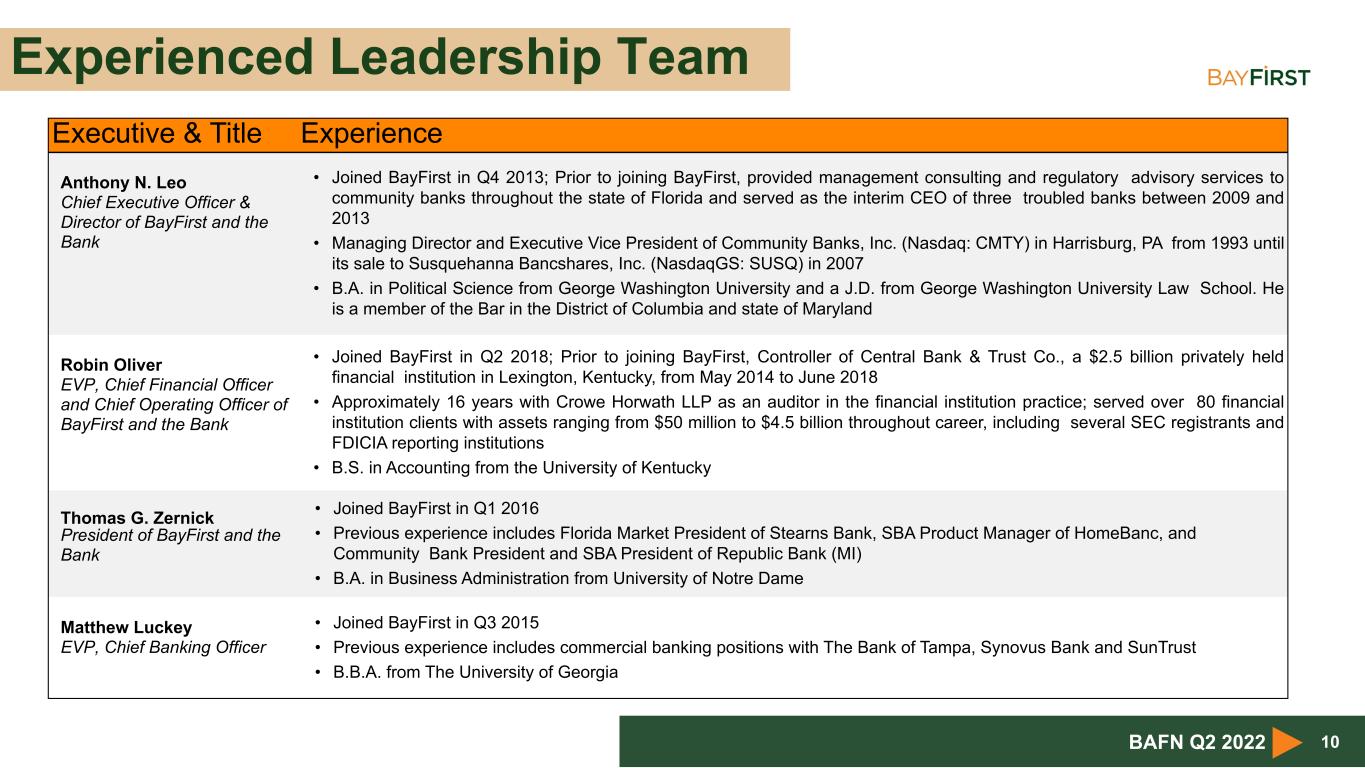
Experienced Leadership Team 10BAFN Q2 2022 Executive & Title Experience Anthony N. Leo Chief Executive Officer & Director of BayFirst and the Bank • Joined BayFirst in Q4 2013; Prior to joining BayFirst, provided management consulting and regulatory advisory services to community banks throughout the state of Florida and served as the interim CEO of three troubled banks between 2009 and 2013 • Managing Director and Executive Vice President of Community Banks, Inc. (Nasdaq: CMTY) in Harrisburg, PA from 1993 until its sale to Susquehanna Bancshares, Inc. (NasdaqGS: SUSQ) in 2007 • B.A. in Political Science from George Washington University and a J.D. from George Washington University Law School. He is a member of the Bar in the District of Columbia and state of Maryland Robin Oliver EVP, Chief Financial Officer and Chief Operating Officer of BayFirst and the Bank • Joined BayFirst in Q2 2018; Prior to joining BayFirst, Controller of Central Bank & Trust Co., a $2.5 billion privately held financial institution in Lexington, Kentucky, from May 2014 to June 2018 • Approximately 16 years with Crowe Horwath LLP as an auditor in the financial institution practice; served over 80 financial institution clients with assets ranging from $50 million to $4.5 billion throughout career, including several SEC registrants and FDICIA reporting institutions • B.S. in Accounting from the University of Kentucky Thomas G. Zernick President of BayFirst and the Bank • Joined BayFirst in Q1 2016 • Previous experience includes Florida Market President of Stearns Bank, SBA Product Manager of HomeBanc, and Community Bank President and SBA President of Republic Bank (MI) • B.A. in Business Administration from University of Notre Dame Matthew Luckey EVP, Chief Banking Officer • Joined BayFirst in Q3 2015 • Previous experience includes commercial banking positions with The Bank of Tampa, Synovus Bank and SunTrust • B.B.A. from The University of Georgia
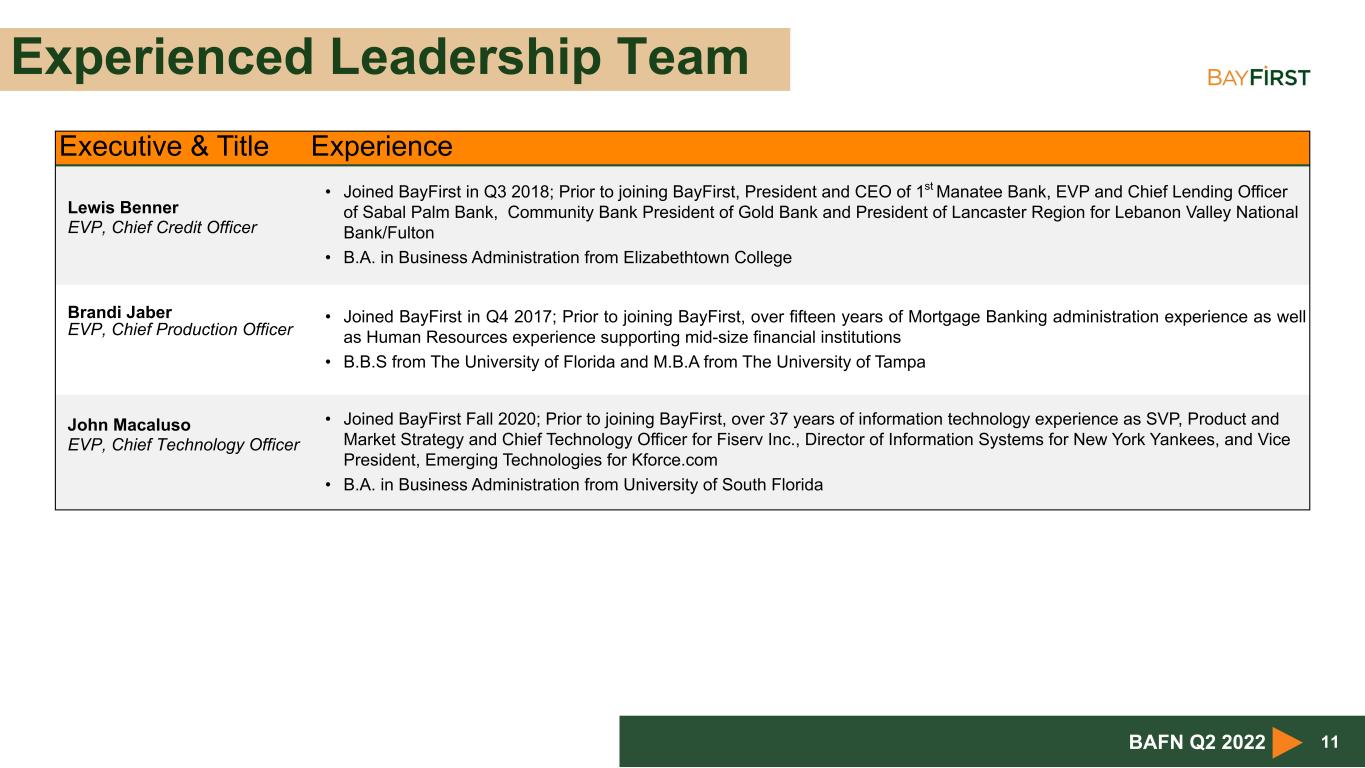
Experienced Leadership Team 11BAFN Q2 2022 Executive & Title Experience Lewis Benner EVP, Chief Credit Officer • Joined BayFirst in Q3 2018; Prior to joining BayFirst, President and CEO of 1st Manatee Bank, EVP and Chief Lending Officer of Sabal Palm Bank, Community Bank President of Gold Bank and President of Lancaster Region for Lebanon Valley National Bank/Fulton • B.A. in Business Administration from Elizabethtown College Brandi Jaber EVP, Chief Production Officer • Joined BayFirst in Q4 2017; Prior to joining BayFirst, over fifteen years of Mortgage Banking administration experience as well as Human Resources experience supporting mid-size financial institutions • B.B.S from The University of Florida and M.B.A from The University of Tampa John Macaluso EVP, Chief Technology Officer • Joined BayFirst Fall 2020; Prior to joining BayFirst, over 37 years of information technology experience as SVP, Product and Market Strategy and Chief Technology Officer for Fiserv Inc., Director of Information Systems for New York Yankees, and Vice President, Emerging Technologies for Kforce.com • B.A. in Business Administration from University of South Florida
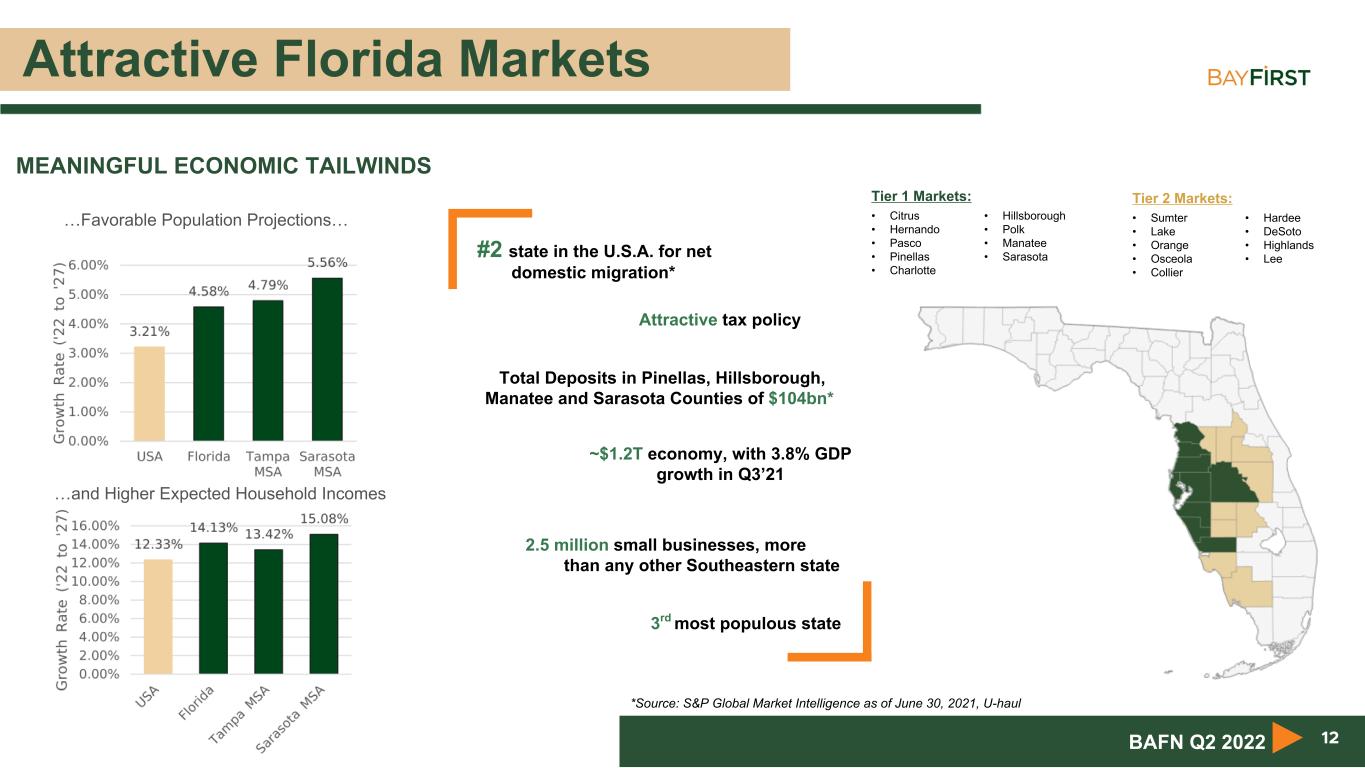
Attractive Florida Markets 12 MEANINGFUL ECONOMIC TAILWINDS #2 state in the U.S.A. for net domestic migration* ~$1.2T economy, with 3.8% GDP growth in Q3’21 Attractive tax policy 2.5 million small businesses, more than any other Southeastern state 3rd most populous state Total Deposits in Pinellas, Hillsborough, Manatee and Sarasota Counties of $104bn* …Favorable Population Projections… …and Higher Expected Household Incomes Tier 1 Markets: • Citrus • Hernando • Pasco • Pinellas • Charlotte • Hillsborough • Polk • Manatee • Sarasota Tier 2 Markets: • Sumter • Lake • Orange • Osceola • Collier • Hardee • DeSoto • Highlands • Lee BAFN Q2 2022 *Source: S&P Global Market Intelligence as of June 30, 2021, U-haul
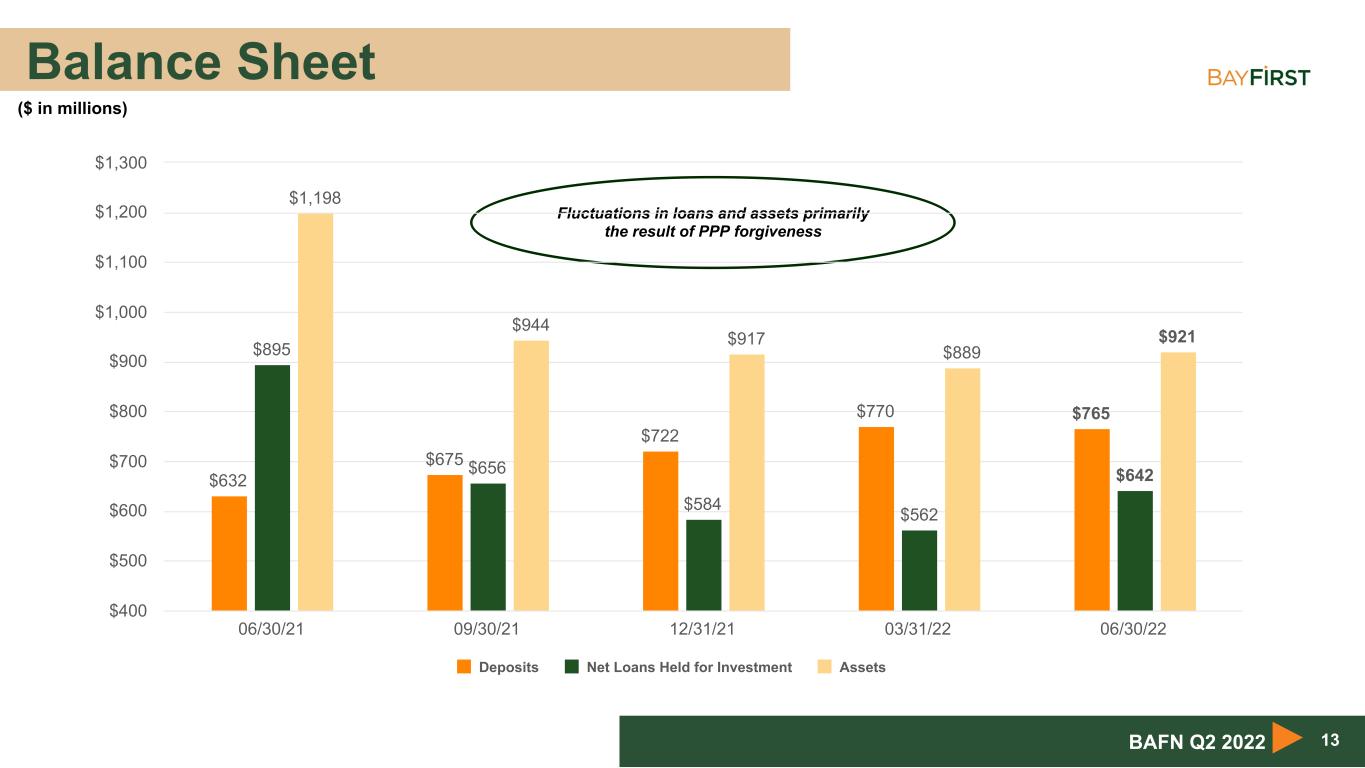
Balance Sheet 13BAFN Q2 2022 Fluctuations in loans and assets primarily the result of PPP forgiveness ($ in millions) $632 $675 $722 $770 $765 $895 $656 $584 $562 $642 $1,198 $944 $917 $889 $921 Deposits Net Loans Held for Investment Assets 06/30/21 09/30/21 12/31/21 03/31/22 06/30/22 $400 $500 $600 $700 $800 $900 $1,000 $1,100 $1,200 $1,300
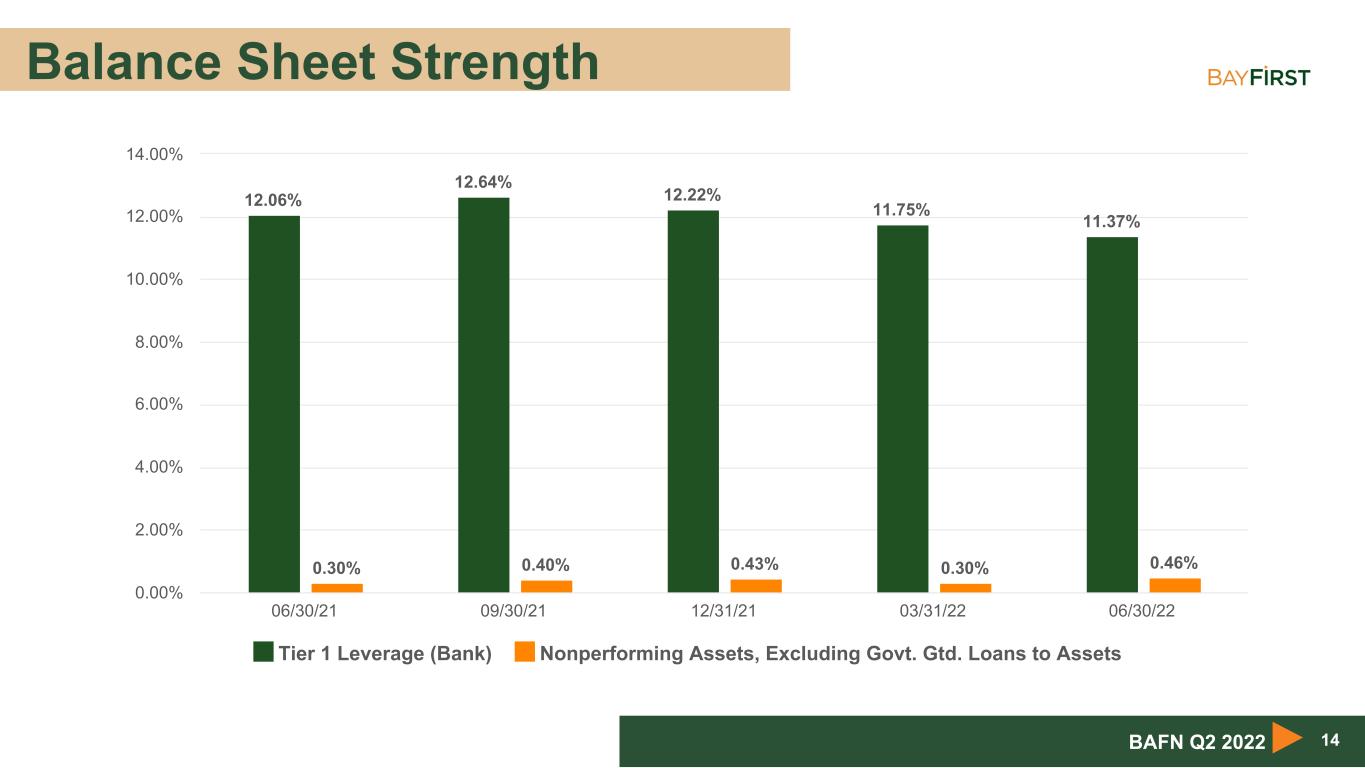
Balance Sheet Strength 14BAFN Q2 2022 12.06% 12.64% 12.22% 11.75% 11.37% 0.30% 0.40% 0.43% 0.30% 0.46% Tier 1 Leverage (Bank) Nonperforming Assets, Excluding Govt. Gtd. Loans to Assets 06/30/21 09/30/21 12/31/21 03/31/22 06/30/22 0.00% 2.00% 4.00% 6.00% 8.00% 10.00% 12.00% 14.00%
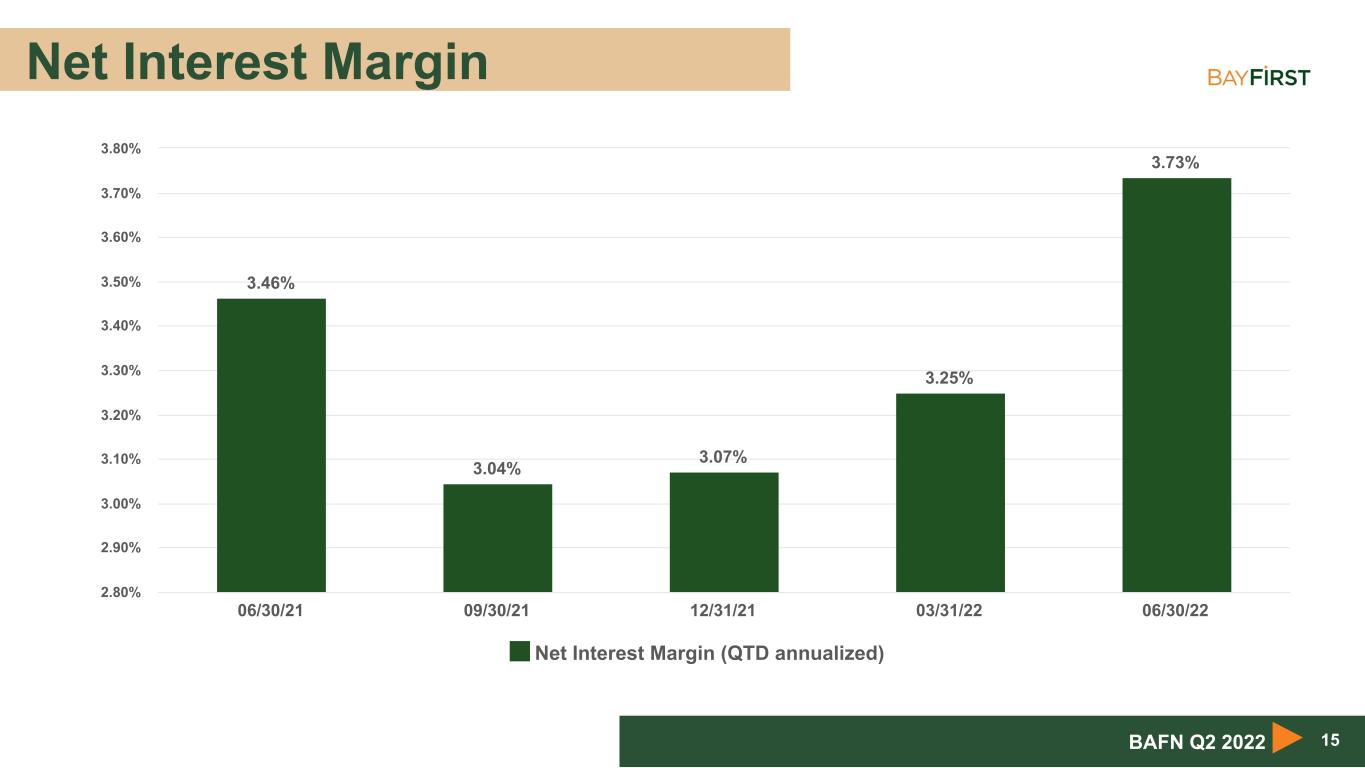
Net Interest Margin 15BAFN Q2 2022 3.46% 3.04% 3.07% 3.25% 3.73% Net Interest Margin (QTD annualized) 06/30/21 09/30/21 12/31/21 03/31/22 06/30/22 2.80% 2.90% 3.00% 3.10% 3.20% 3.30% 3.40% 3.50% 3.60% 3.70% 3.80%
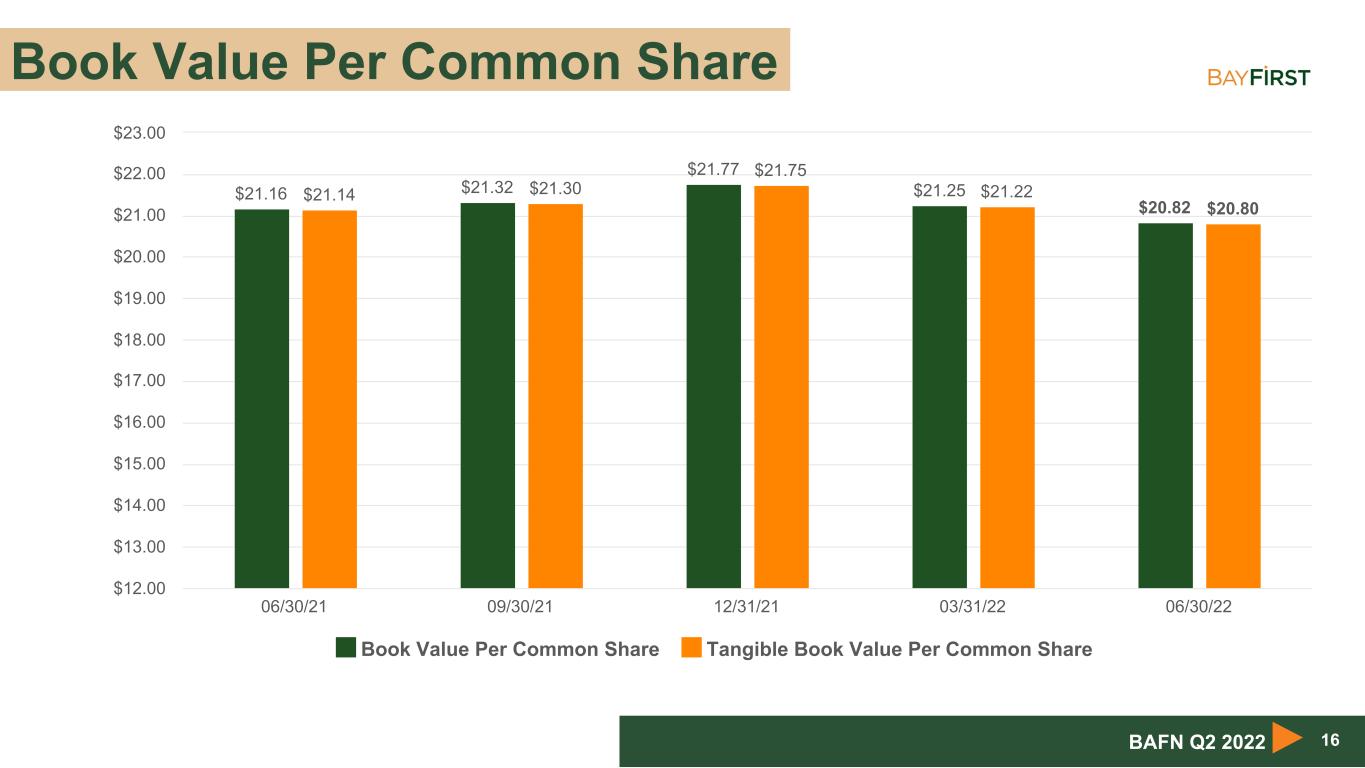
Book Value Per Common Share 16BAFN Q2 2022 $21.16 $21.32 $21.77 $21.25 $20.82 $21.14 $21.30 $21.75 $21.22 $20.80 Book Value Per Common Share Tangible Book Value Per Common Share 06/30/21 09/30/21 12/31/21 03/31/22 06/30/22 $12.00 $13.00 $14.00 $15.00 $16.00 $17.00 $18.00 $19.00 $20.00 $21.00 $22.00 $23.00
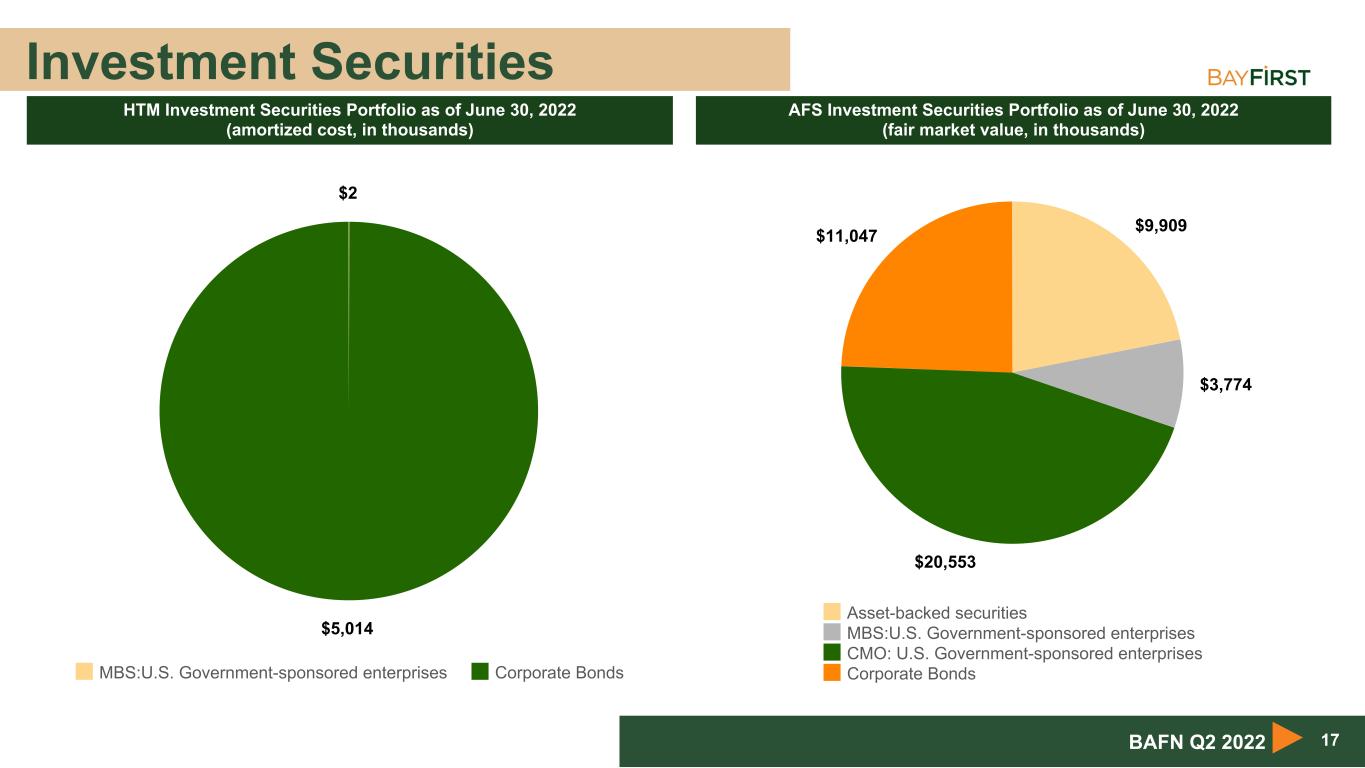
Investment Securities 17BAFN Q2 2022 AFS Investment Securities Portfolio as of June 30, 2022 (fair market value, in thousands) $9,909 $3,774 $20,553 $11,047 Asset-backed securities MBS:U.S. Government-sponsored enterprises CMO: U.S. Government-sponsored enterprises Corporate Bonds HTM Investment Securities Portfolio as of June 30, 2022 (amortized cost, in thousands) $2 $5,014 MBS:U.S. Government-sponsored enterprises Corporate Bonds
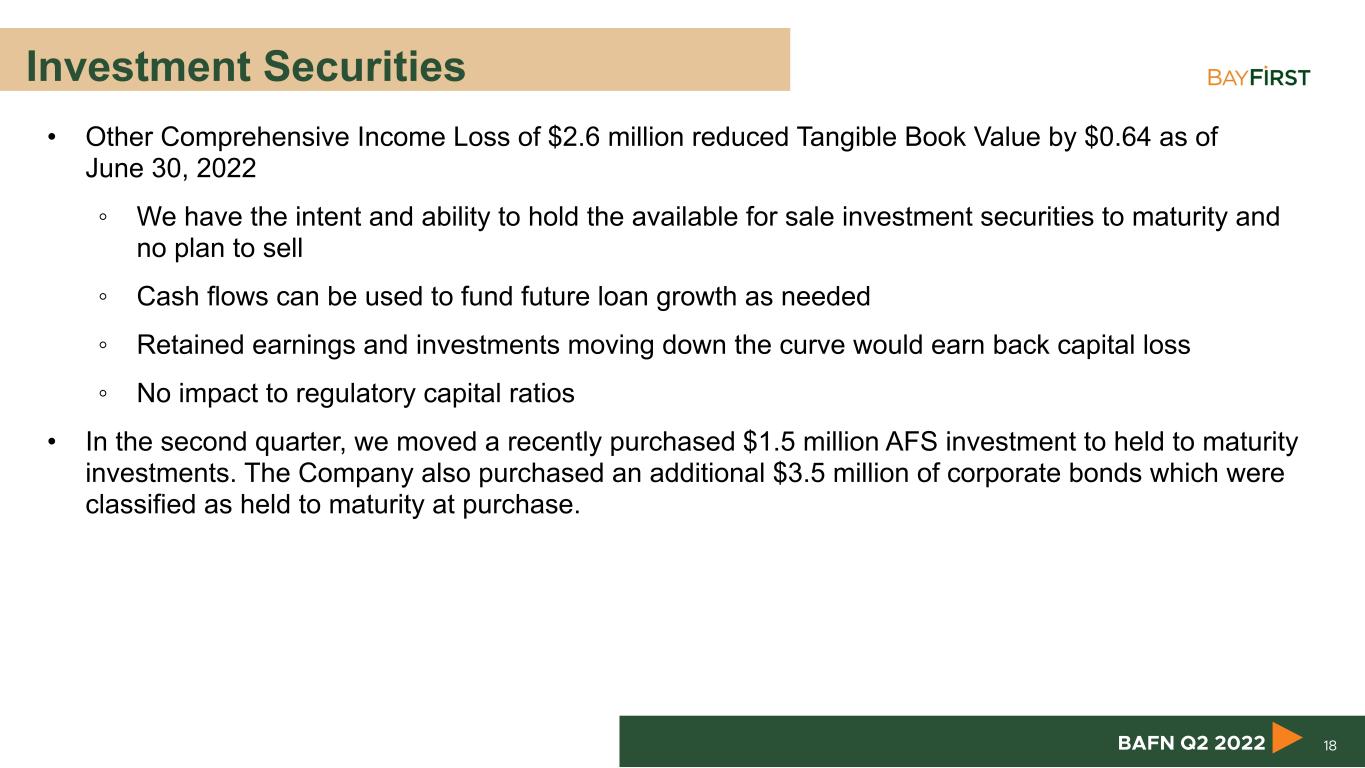
Investment Securities • Other Comprehensive Income Loss of $2.6 million reduced Tangible Book Value by $0.64 as of June 30, 2022 ◦ We have the intent and ability to hold the available for sale investment securities to maturity and no plan to sell ◦ Cash flows can be used to fund future loan growth as needed ◦ Retained earnings and investments moving down the curve would earn back capital loss ◦ No impact to regulatory capital ratios • In the second quarter, we moved a recently purchased $1.5 million AFS investment to held to maturity investments. The Company also purchased an additional $3.5 million of corporate bonds which were classified as held to maturity at purchase. 18BAFN Q2 2022
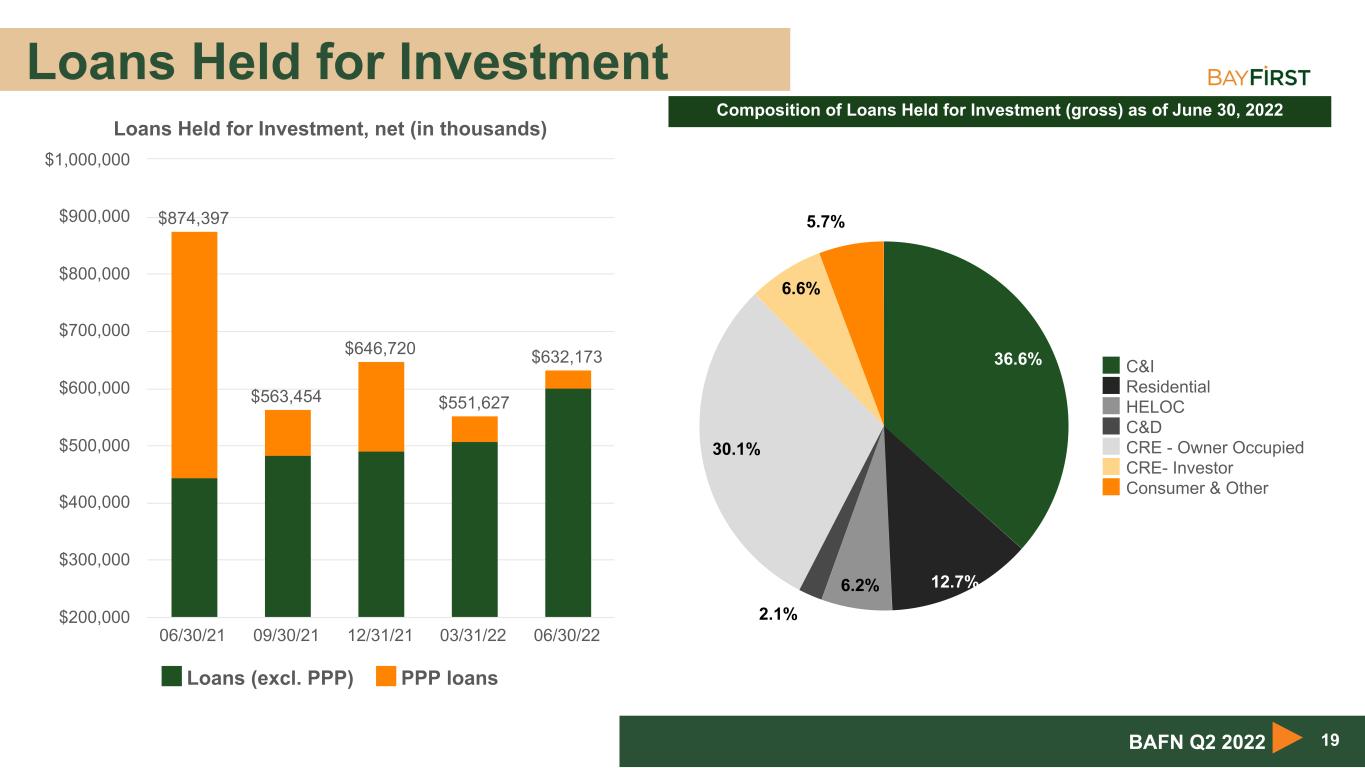
Loans Held for Investment 19BAFN Q2 2022 Composition of Loans Held for Investment (gross) as of June 30, 2022 Loans Held for Investment, net (in thousands) $874,397 $563,454 $646,720 $551,627 $632,173 Loans (excl. PPP) PPP loans 06/30/21 09/30/21 12/31/21 03/31/22 06/30/22 $200,000 $300,000 $400,000 $500,000 $600,000 $700,000 $800,000 $900,000 $1,000,000 36.6% 12.7%6.2% 2.1% 30.1% 6.6% 5.7% C&I Residential HELOC C&D CRE - Owner Occupied CRE- Investor Consumer & Other
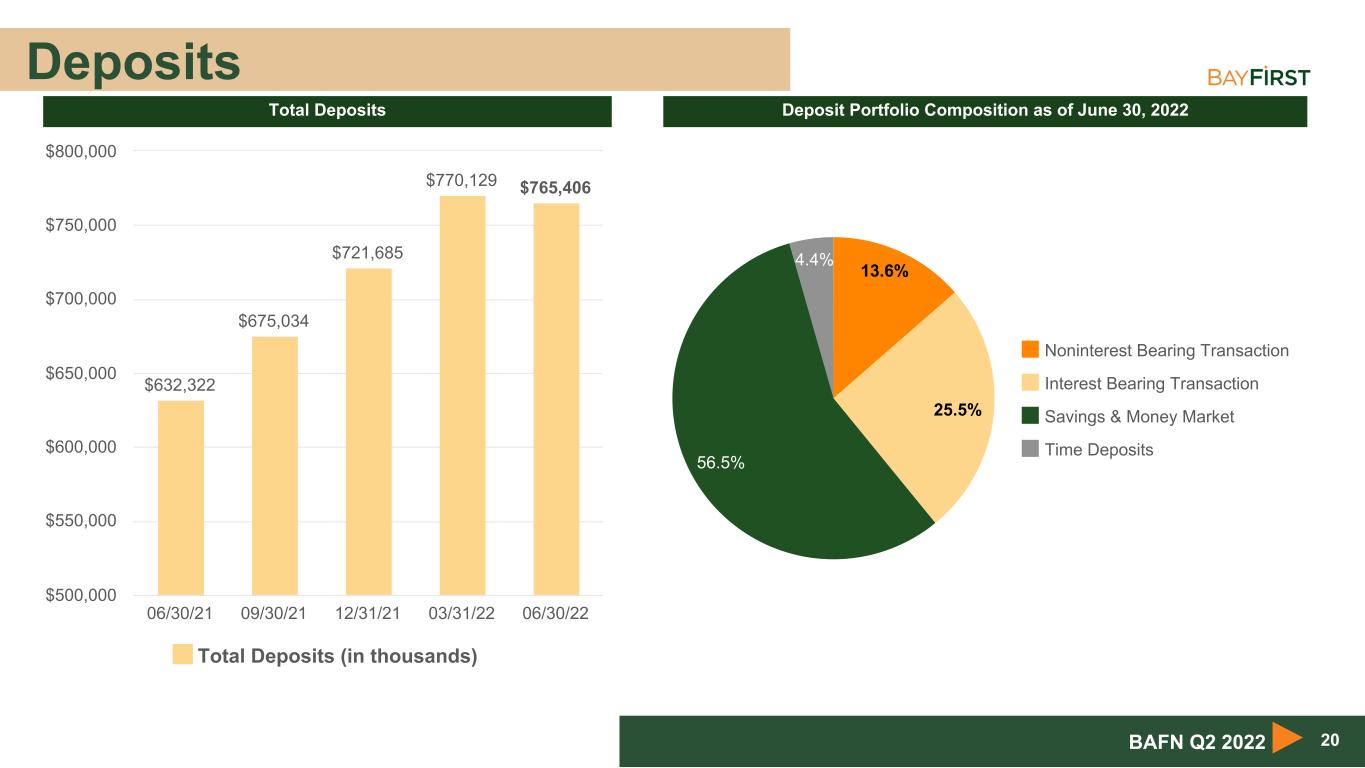
Deposits 20BAFN Q2 2022 Total Deposits Deposit Portfolio Composition as of June 30, 2022 $632,322 $675,034 $721,685 $770,129 $765,406 Total Deposits (in thousands) 06/30/21 09/30/21 12/31/21 03/31/22 06/30/22 $500,000 $550,000 $600,000 $650,000 $700,000 $750,000 $800,000 13.6% 25.5% 56.5% 4.4% Noninterest Bearing Transaction Interest Bearing Transaction Savings & Money Market Time Deposits
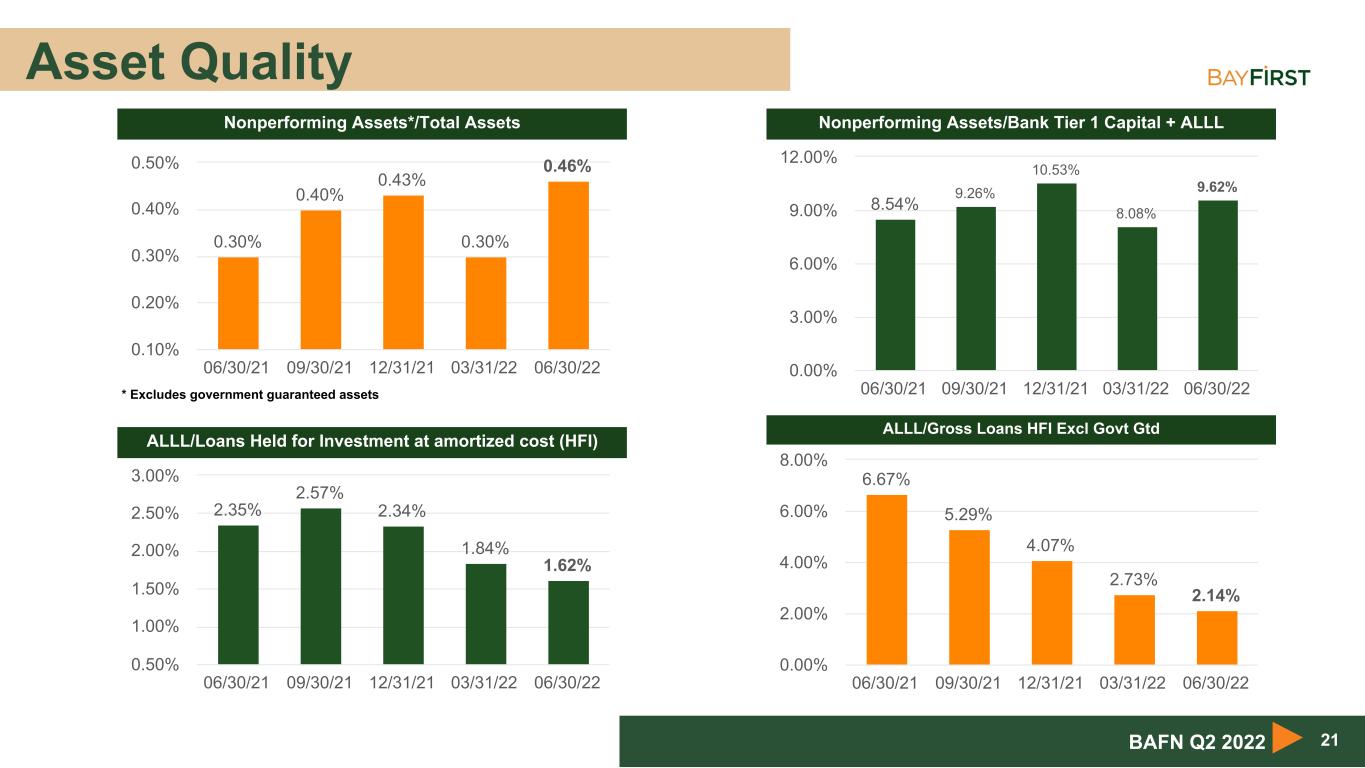
Asset Quality 21BAFN Q2 2022 Nonperforming Assets*/Total Assets Nonperforming Assets/Bank Tier 1 Capital + ALLL ALLL/Loans Held for Investment at amortized cost (HFI) ALLL/Gross Loans HFI Excl Govt Gtd * Excludes government guaranteed assets 0.30% 0.40% 0.43% 0.30% 0.46% 06/30/21 09/30/21 12/31/21 03/31/22 06/30/22 0.10% 0.20% 0.30% 0.40% 0.50% 2.35% 2.57% 2.34% 1.84% 1.62% 06/30/21 09/30/21 12/31/21 03/31/22 06/30/22 0.50% 1.00% 1.50% 2.00% 2.50% 3.00% 8.54% 9.26% 10.53% 8.08% 9.62% 06/30/21 09/30/21 12/31/21 03/31/22 06/30/22 0.00% 3.00% 6.00% 9.00% 12.00% 6.67% 5.29% 4.07% 2.73% 2.14% 06/30/21 09/30/21 12/31/21 03/31/22 06/30/22 0.00% 2.00% 4.00% 6.00% 8.00%
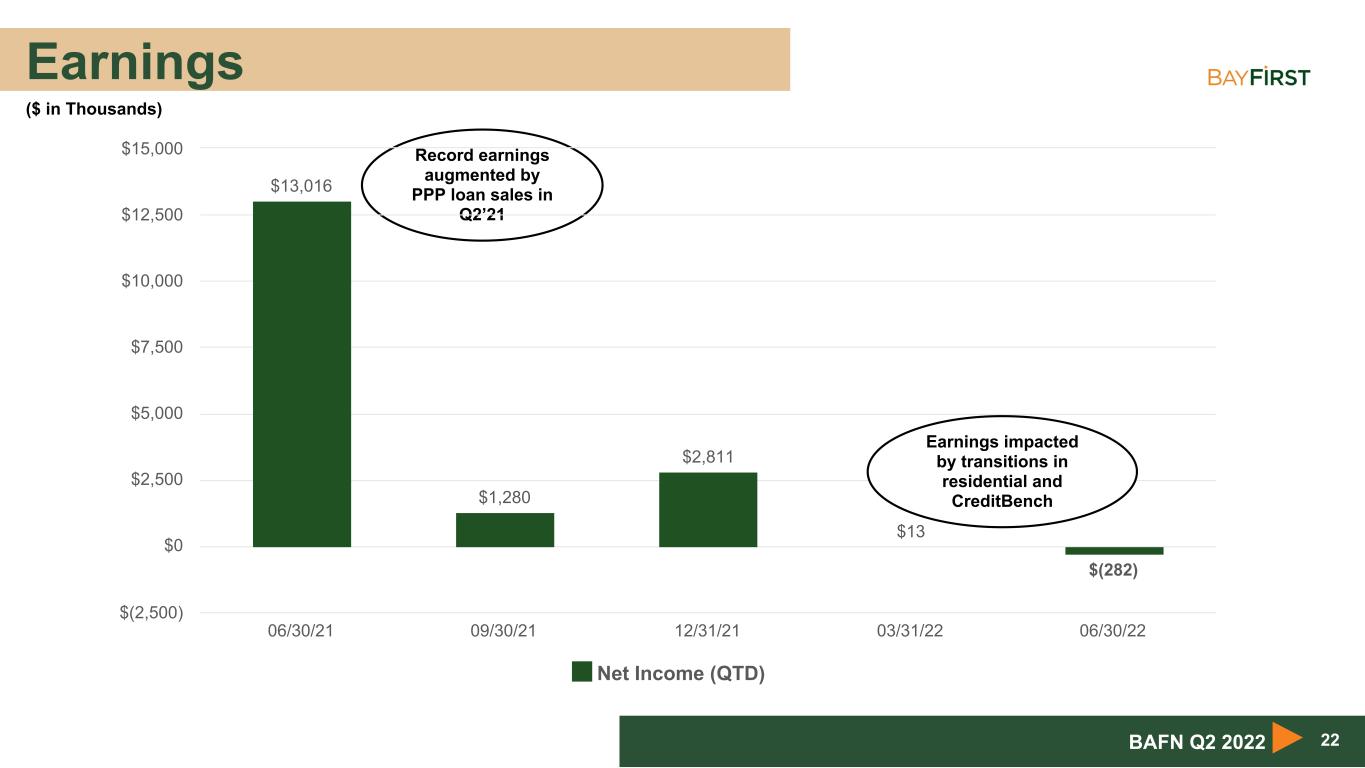
Earnings 22BAFN Q2 2022 Record earnings augmented by PPP loan sales in Q2’21 ($ in Thousands) $13,016 $1,280 $2,811 $13 $(282) Net Income (QTD) 06/30/21 09/30/21 12/31/21 03/31/22 06/30/22 $(2,500) $0 $2,500 $5,000 $7,500 $10,000 $12,500 $15,000 Earnings impacted by transitions in residential and CreditBench
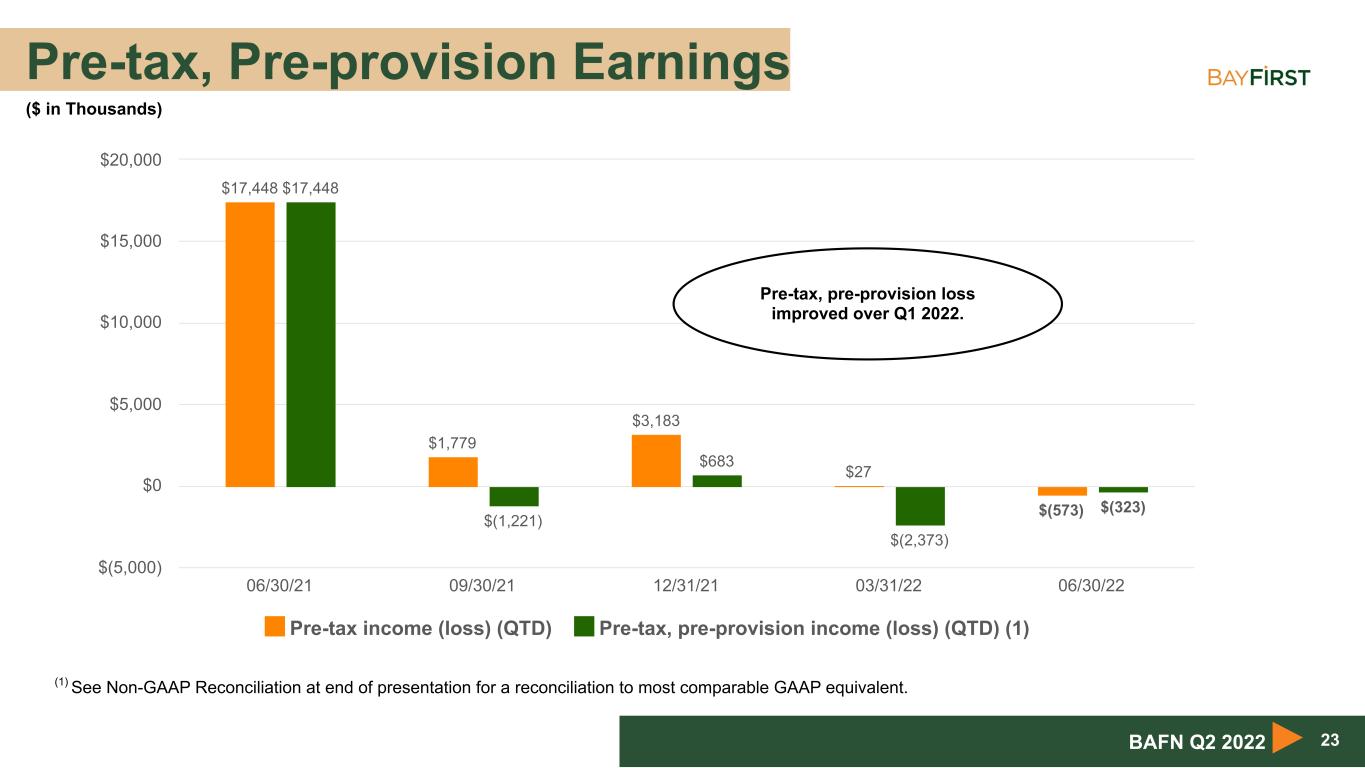
Pre-tax, Pre-provision Earnings 23BAFN Q2 2022 ($ in Thousands) $17,448 $1,779 $3,183 $27 $(573) $17,448 $(1,221) $683 $(2,373) $(323) Pre-tax income (loss) (QTD) Pre-tax, pre-provision income (loss) (QTD) (1) 06/30/21 09/30/21 12/31/21 03/31/22 06/30/22 $(5,000) $0 $5,000 $10,000 $15,000 $20,000 Pre-tax, pre-provision loss improved over Q1 2022. (1) See Non-GAAP Reconciliation at end of presentation for a reconciliation to most comparable GAAP equivalent.
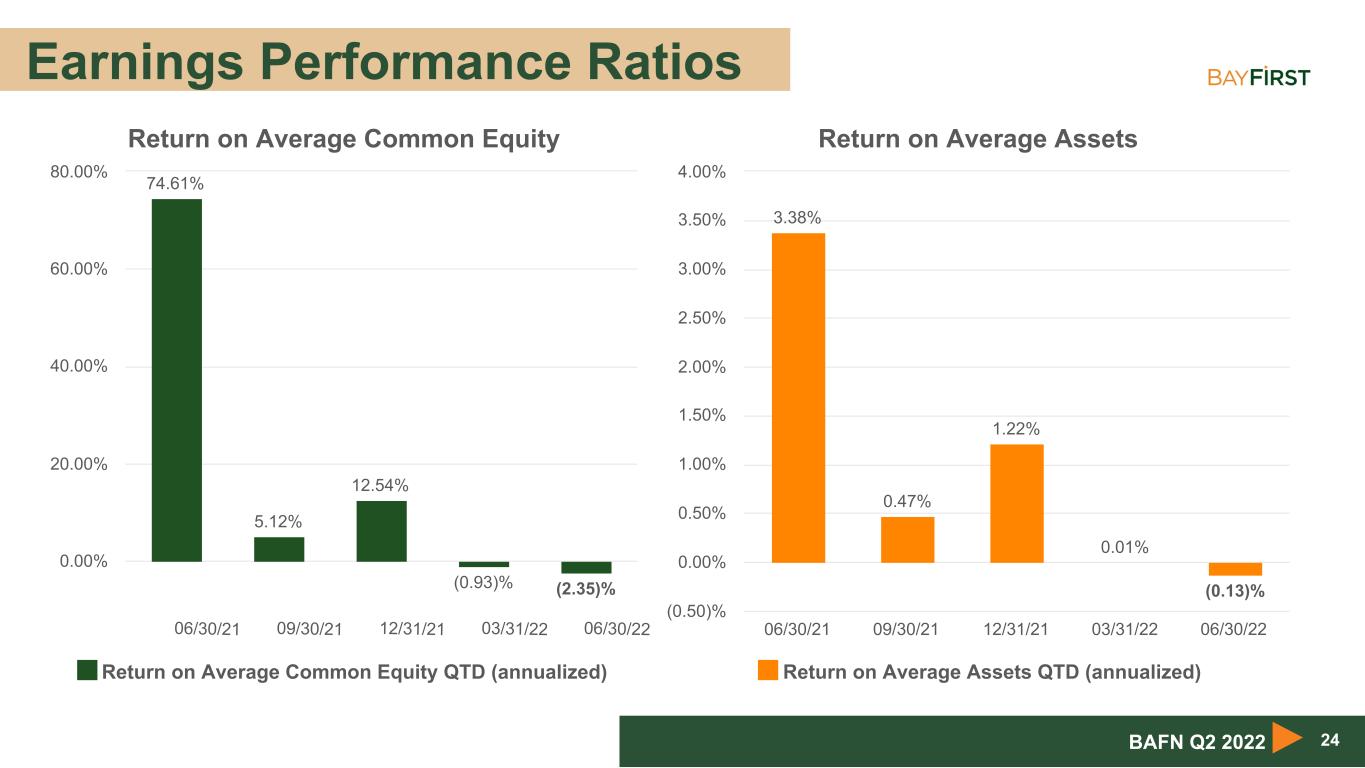
Earnings Performance Ratios 24BAFN Q2 2022 Return on Average Common Equity 74.61% 5.12% 12.54% (0.93)% (2.35)% Return on Average Common Equity QTD (annualized) 06/30/21 09/30/21 12/31/21 03/31/22 06/30/22 0.00% 20.00% 40.00% 60.00% 80.00% Return on Average Assets 3.38% 0.47% 1.22% 0.01% (0.13)% Return on Average Assets QTD (annualized) 06/30/21 09/30/21 12/31/21 03/31/22 06/30/22 (0.50)% 0.00% 0.50% 1.00% 1.50% 2.00% 2.50% 3.00% 3.50% 4.00%
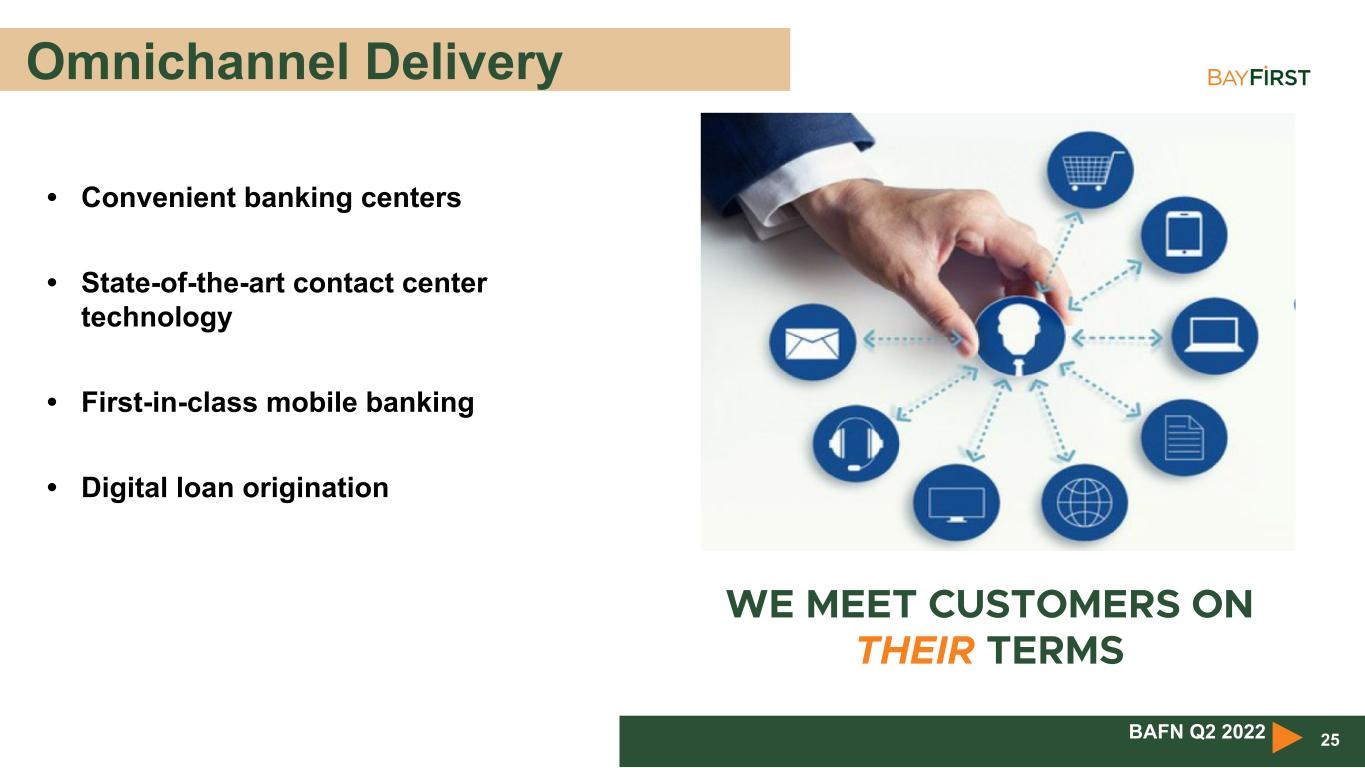
Omnichannel Delivery • Convenient banking centers • State-of-the-art contact center technology • First-in-class mobile banking • Digital loan origination 25BAFN Q2 2022 WE MEET CUSTOMERS ON THEIR TERMS
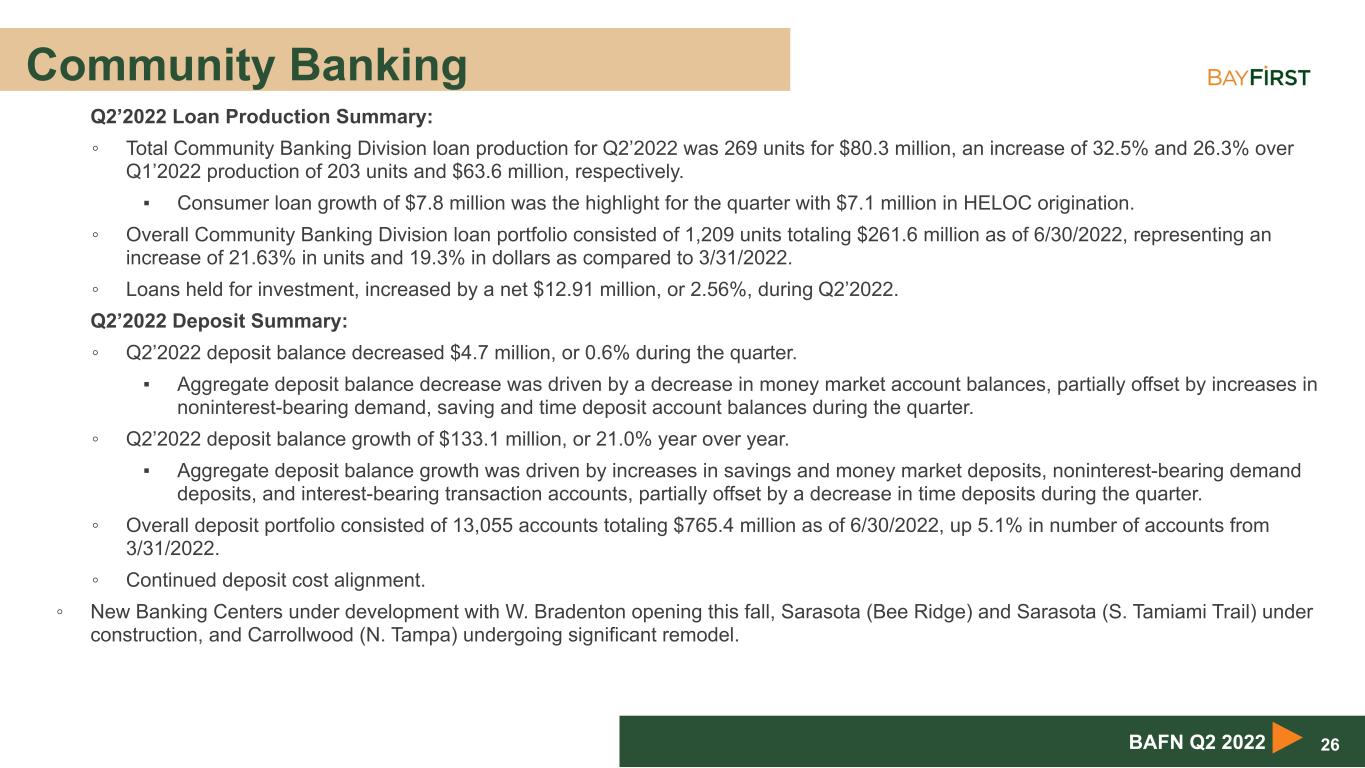
Community Banking • Q2’2022 Loan Production Summary: ◦ Total Community Banking Division loan production for Q2’2022 was 269 units for $80.3 million, an increase of 32.5% and 26.3% over Q1’2022 production of 203 units and $63.6 million, respectively. ▪ Consumer loan growth of $7.8 million was the highlight for the quarter with $7.1 million in HELOC origination. ◦ Overall Community Banking Division loan portfolio consisted of 1,209 units totaling $261.6 million as of 6/30/2022, representing an increase of 21.63% in units and 19.3% in dollars as compared to 3/31/2022. ◦ Loans held for investment, increased by a net $12.91 million, or 2.56%, during Q2’2022. • Q2’2022 Deposit Summary: ◦ Q2’2022 deposit balance decreased $4.7 million, or 0.6% during the quarter. ▪ Aggregate deposit balance decrease was driven by a decrease in money market account balances, partially offset by increases in noninterest-bearing demand, saving and time deposit account balances during the quarter. ◦ Q2’2022 deposit balance growth of $133.1 million, or 21.0% year over year. ▪ Aggregate deposit balance growth was driven by increases in savings and money market deposits, noninterest-bearing demand deposits, and interest-bearing transaction accounts, partially offset by a decrease in time deposits during the quarter. ◦ Overall deposit portfolio consisted of 13,055 accounts totaling $765.4 million as of 6/30/2022, up 5.1% in number of accounts from 3/31/2022. ◦ Continued deposit cost alignment. ◦ New Banking Centers under development with W. Bradenton opening this fall, Sarasota (Bee Ridge) and Sarasota (S. Tamiami Trail) under construction, and Carrollwood (N. Tampa) undergoing significant remodel. 26BAFN Q2 2022
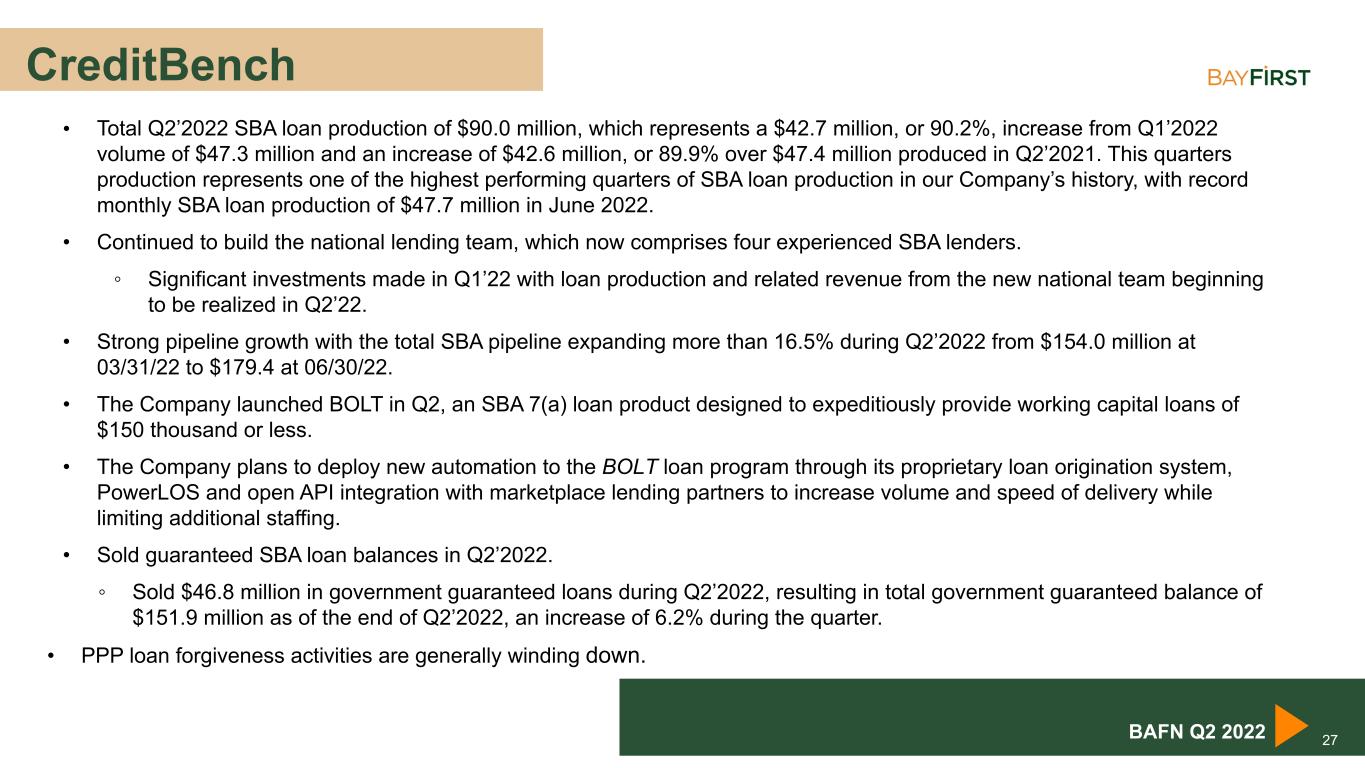
CreditBench • Total Q2’2022 SBA loan production of $90.0 million, which represents a $42.7 million, or 90.2%, increase from Q1’2022 volume of $47.3 million and an increase of $42.6 million, or 89.9% over $47.4 million produced in Q2’2021. This quarters production represents one of the highest performing quarters of SBA loan production in our Company’s history, with record monthly SBA loan production of $47.7 million in June 2022. • Continued to build the national lending team, which now comprises four experienced SBA lenders. ◦ Significant investments made in Q1’22 with loan production and related revenue from the new national team beginning to be realized in Q2’22. • Strong pipeline growth with the total SBA pipeline expanding more than 16.5% during Q2’2022 from $154.0 million at 03/31/22 to $179.4 at 06/30/22. • The Company launched BOLT in Q2, an SBA 7(a) loan product designed to expeditiously provide working capital loans of $150 thousand or less. • The Company plans to deploy new automation to the BOLT loan program through its proprietary loan origination system, PowerLOS and open API integration with marketplace lending partners to increase volume and speed of delivery while limiting additional staffing. • Sold guaranteed SBA loan balances in Q2’2022. ◦ Sold $46.8 million in government guaranteed loans during Q2’2022, resulting in total government guaranteed balance of $151.9 million as of the end of Q2’2022, an increase of 6.2% during the quarter. • PPP loan forgiveness activities are generally winding down. 27BAFN Q2 2022
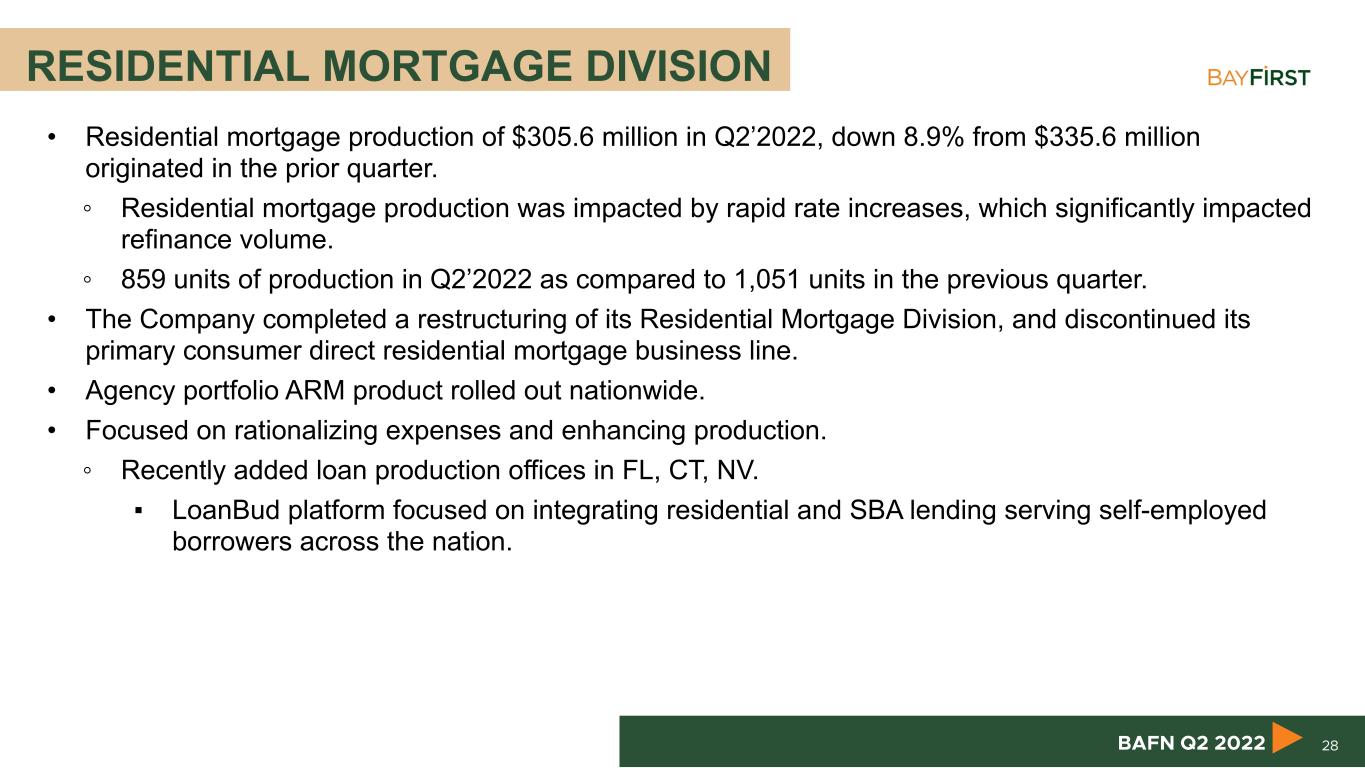
RESIDENTIAL MORTGAGE DIVISION • Residential mortgage production of $305.6 million in Q2’2022, down 8.9% from $335.6 million originated in the prior quarter. ◦ Residential mortgage production was impacted by rapid rate increases, which significantly impacted refinance volume. ◦ 859 units of production in Q2’2022 as compared to 1,051 units in the previous quarter. • The Company completed a restructuring of its Residential Mortgage Division, and discontinued its primary consumer direct residential mortgage business line. • Agency portfolio ARM product rolled out nationwide. • Focused on rationalizing expenses and enhancing production. ◦ Recently added loan production offices in FL, CT, NV. ▪ LoanBud platform focused on integrating residential and SBA lending serving self-employed borrowers across the nation. 28BAFN Q2 2022
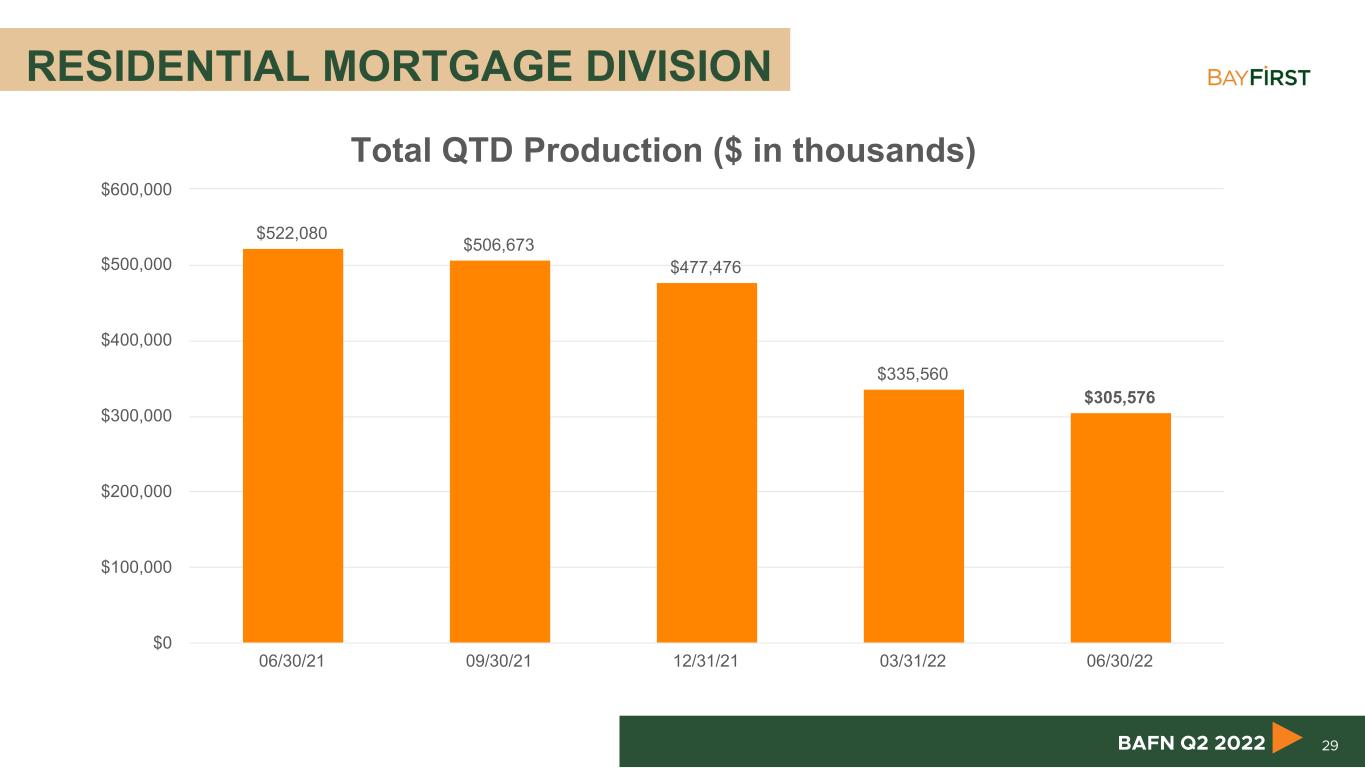
RESIDENTIAL MORTGAGE DIVISION 29BAFN Q2 2022 Total QTD Production ($ in thousands) $522,080 $506,673 $477,476 $335,560 $305,576 06/30/21 09/30/21 12/31/21 03/31/22 06/30/22 $0 $100,000 $200,000 $300,000 $400,000 $500,000 $600,000
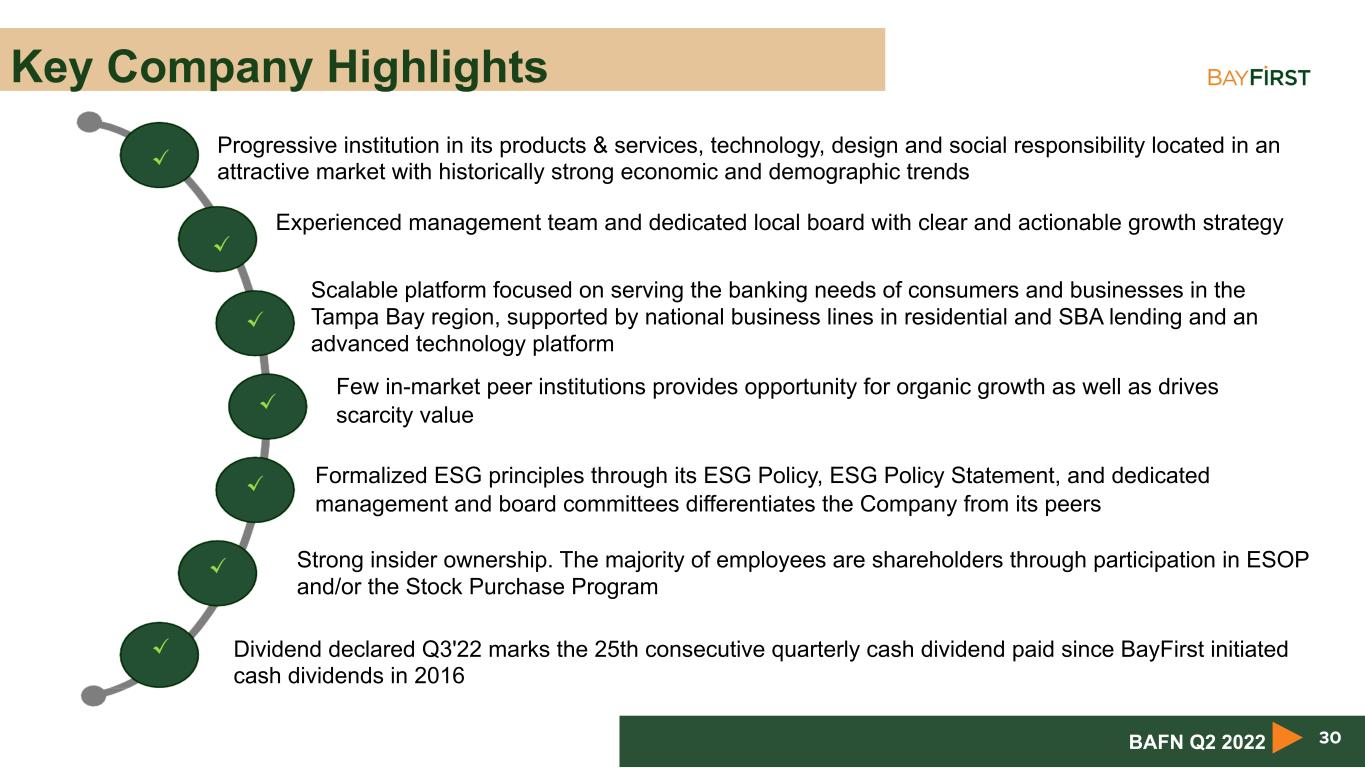
Key Company Highlights 30 Progressive institution in its products & services, technology, design and social responsibility located in an attractive market with historically strong economic and demographic trends Experienced management team and dedicated local board with clear and actionable growth strategy Few in-market peer institutions provides opportunity for organic growth as well as drives scarcity value Scalable platform focused on serving the banking needs of consumers and businesses in the Tampa Bay region, supported by national business lines in residential and SBA lending and an advanced technology platform Strong insider ownership. The majority of employees are shareholders through participation in ESOP and/or the Stock Purchase Program Dividend declared Q3'22 marks the 25th consecutive quarterly cash dividend paid since BayFirst initiated cash dividends in 2016 ✔ ✔ ✔ ✔ ✔ ✔ ✔ Formalized ESG principles through its ESG Policy, ESG Policy Statement, and dedicated management and board committees differentiates the Company from its peers BAFN Q2 2022
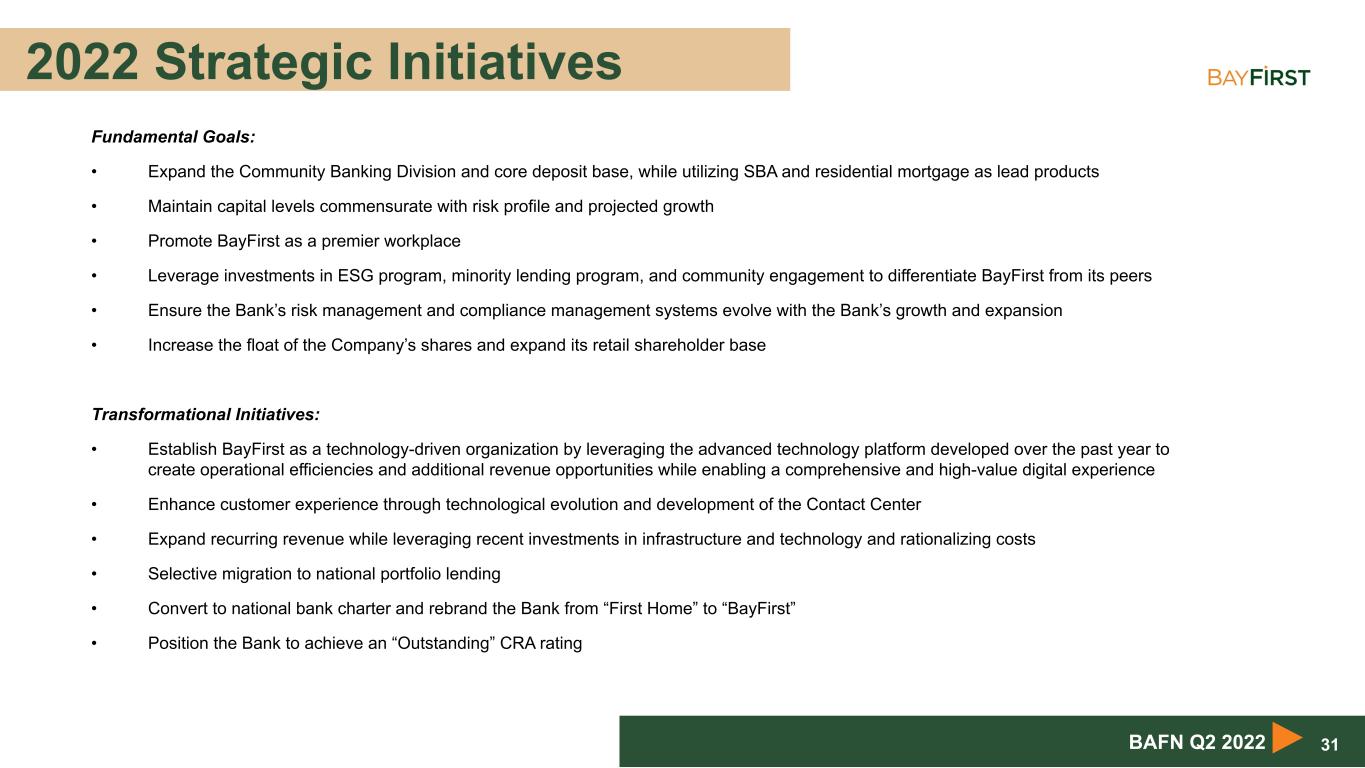
2022 Strategic Initiatives Fundamental Goals: • Expand the Community Banking Division and core deposit base, while utilizing SBA and residential mortgage as lead products • Maintain capital levels commensurate with risk profile and projected growth • Promote BayFirst as a premier workplace • Leverage investments in ESG program, minority lending program, and community engagement to differentiate BayFirst from its peers • Ensure the Bank’s risk management and compliance management systems evolve with the Bank’s growth and expansion • Increase the float of the Company’s shares and expand its retail shareholder base Transformational Initiatives: • Establish BayFirst as a technology-driven organization by leveraging the advanced technology platform developed over the past year to create operational efficiencies and additional revenue opportunities while enabling a comprehensive and high-value digital experience • Enhance customer experience through technological evolution and development of the Contact Center • Expand recurring revenue while leveraging recent investments in infrastructure and technology and rationalizing costs • Selective migration to national portfolio lending • Convert to national bank charter and rebrand the Bank from “First Home” to “BayFirst” • Position the Bank to achieve an “Outstanding” CRA rating 31BAFN Q2 2022
Financial Statements
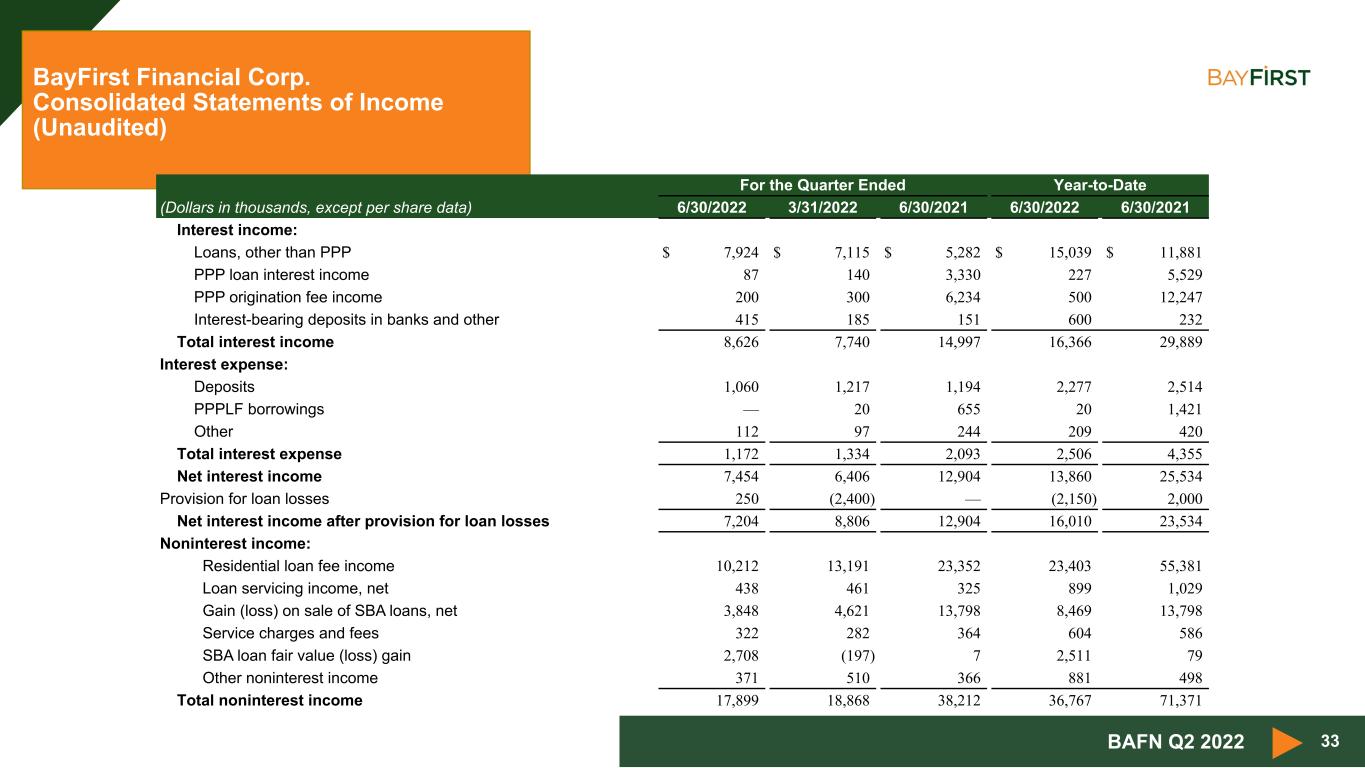
33 BayFirst Financial Corp. Consolidated Statements of Income (Unaudited) BAFN Q2 2022 For the Quarter Ended Year-to-Date (Dollars in thousands, except per share data) 6/30/2022 3/31/2022 6/30/2021 6/30/2022 6/30/2021 Interest income: Loans, other than PPP $ 7,924 $ 7,115 $ 5,282 $ 15,039 $ 11,881 PPP loan interest income 87 140 3,330 227 5,529 PPP origination fee income 200 300 6,234 500 12,247 Interest-bearing deposits in banks and other 415 185 151 600 232 Total interest income 8,626 7,740 14,997 16,366 29,889 Interest expense: Deposits 1,060 1,217 1,194 2,277 2,514 PPPLF borrowings — 20 655 20 1,421 Other 112 97 244 209 420 Total interest expense 1,172 1,334 2,093 2,506 4,355 Net interest income 7,454 6,406 12,904 13,860 25,534 Provision for loan losses 250 (2,400) — (2,150) 2,000 Net interest income after provision for loan losses 7,204 8,806 12,904 16,010 23,534 Noninterest income: Residential loan fee income 10,212 13,191 23,352 23,403 55,381 Loan servicing income, net 438 461 325 899 1,029 Gain (loss) on sale of SBA loans, net 3,848 4,621 13,798 8,469 13,798 Service charges and fees 322 282 364 604 586 SBA loan fair value (loss) gain 2,708 (197) 7 2,511 79 Other noninterest income 371 510 366 881 498 Total noninterest income 17,899 18,868 38,212 36,767 71,371
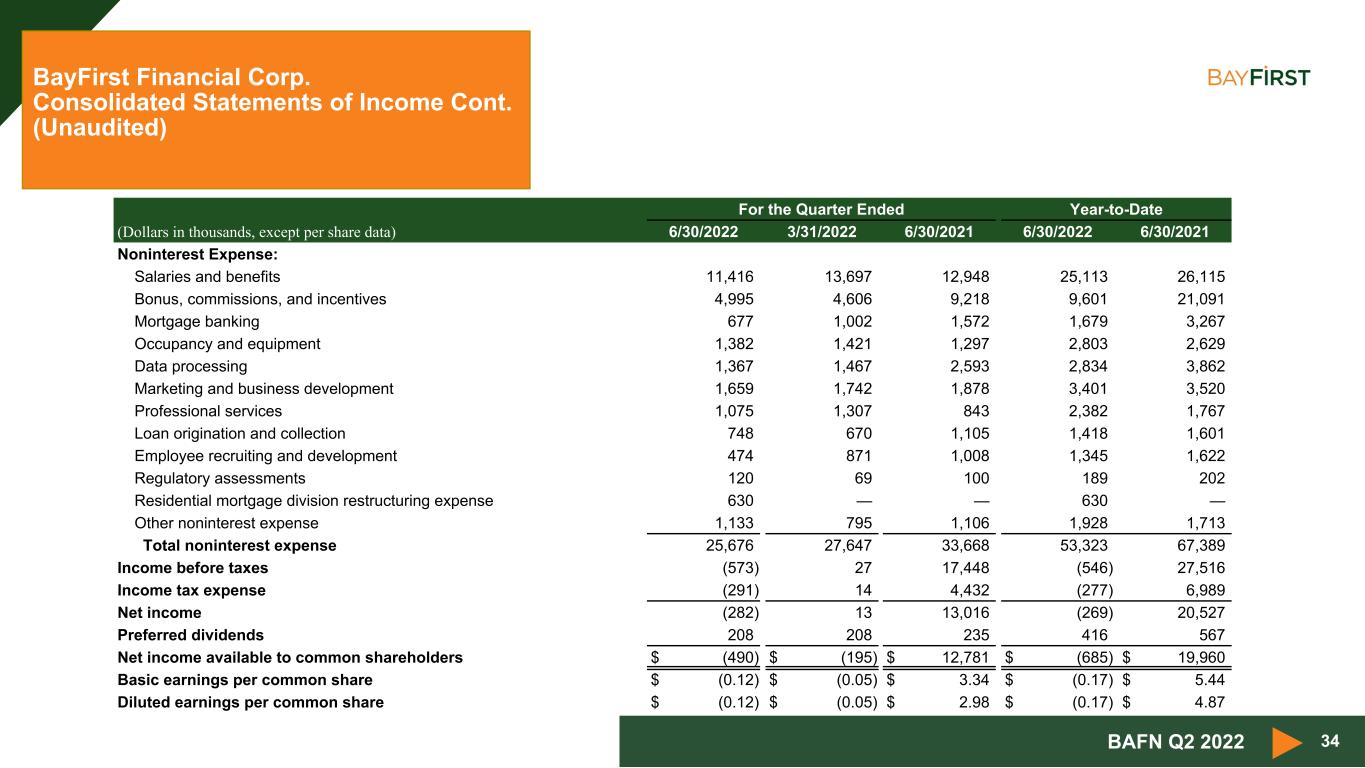
34 BayFirst Financial Corp. Consolidated Statements of Income Cont. (Unaudited) BAFN Q2 2022 For the Quarter Ended Year-to-Date (Dollars in thousands, except per share data) 6/30/2022 3/31/2022 6/30/2021 6/30/2022 6/30/2021 Noninterest Expense: Salaries and benefits 11,416 13,697 12,948 25,113 26,115 Bonus, commissions, and incentives 4,995 4,606 9,218 9,601 21,091 Mortgage banking 677 1,002 1,572 1,679 3,267 Occupancy and equipment 1,382 1,421 1,297 2,803 2,629 Data processing 1,367 1,467 2,593 2,834 3,862 Marketing and business development 1,659 1,742 1,878 3,401 3,520 Professional services 1,075 1,307 843 2,382 1,767 Loan origination and collection 748 670 1,105 1,418 1,601 Employee recruiting and development 474 871 1,008 1,345 1,622 Regulatory assessments 120 69 100 189 202 Residential mortgage division restructuring expense 630 — — 630 — Other noninterest expense 1,133 795 1,106 1,928 1,713 Total noninterest expense 25,676 27,647 33,668 53,323 67,389 Income before taxes (573) 27 17,448 (546) 27,516 Income tax expense (291) 14 4,432 (277) 6,989 Net income (282) 13 13,016 (269) 20,527 Preferred dividends 208 208 235 416 567 Net income available to common shareholders $ (490) $ (195) $ 12,781 $ (685) $ 19,960 Basic earnings per common share $ (0.12) $ (0.05) $ 3.34 $ (0.17) $ 5.44 Diluted earnings per common share $ (0.12) $ (0.05) $ 2.98 $ (0.17) $ 4.87
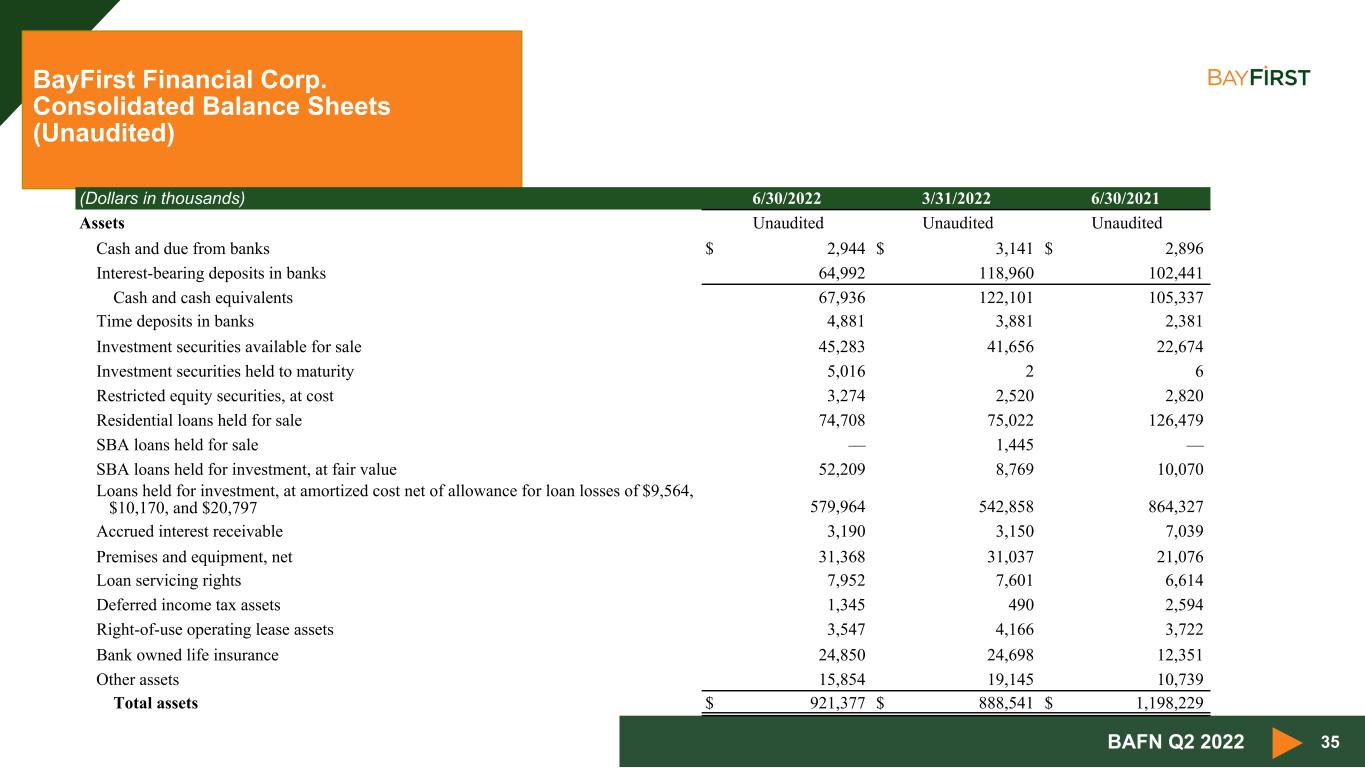
35 BayFirst Financial Corp. Consolidated Balance Sheets (Unaudited) BAFN Q2 2022 (Dollars in thousands) 6/30/2022 3/31/2022 6/30/2021 Assets Unaudited Unaudited Unaudited Cash and due from banks $ 2,944 $ 3,141 $ 2,896 Interest-bearing deposits in banks 64,992 118,960 102,441 Cash and cash equivalents 67,936 122,101 105,337 Time deposits in banks 4,881 3,881 2,381 Investment securities available for sale 45,283 41,656 22,674 Investment securities held to maturity 5,016 2 6 Restricted equity securities, at cost 3,274 2,520 2,820 Residential loans held for sale 74,708 75,022 126,479 SBA loans held for sale — 1,445 — SBA loans held for investment, at fair value 52,209 8,769 10,070 Loans held for investment, at amortized cost net of allowance for loan losses of $9,564, $10,170, and $20,797 579,964 542,858 864,327 Accrued interest receivable 3,190 3,150 7,039 Premises and equipment, net 31,368 31,037 21,076 Loan servicing rights 7,952 7,601 6,614 Deferred income tax assets 1,345 490 2,594 Right-of-use operating lease assets 3,547 4,166 3,722 Bank owned life insurance 24,850 24,698 12,351 Other assets 15,854 19,145 10,739 Total assets $ 921,377 $ 888,541 $ 1,198,229
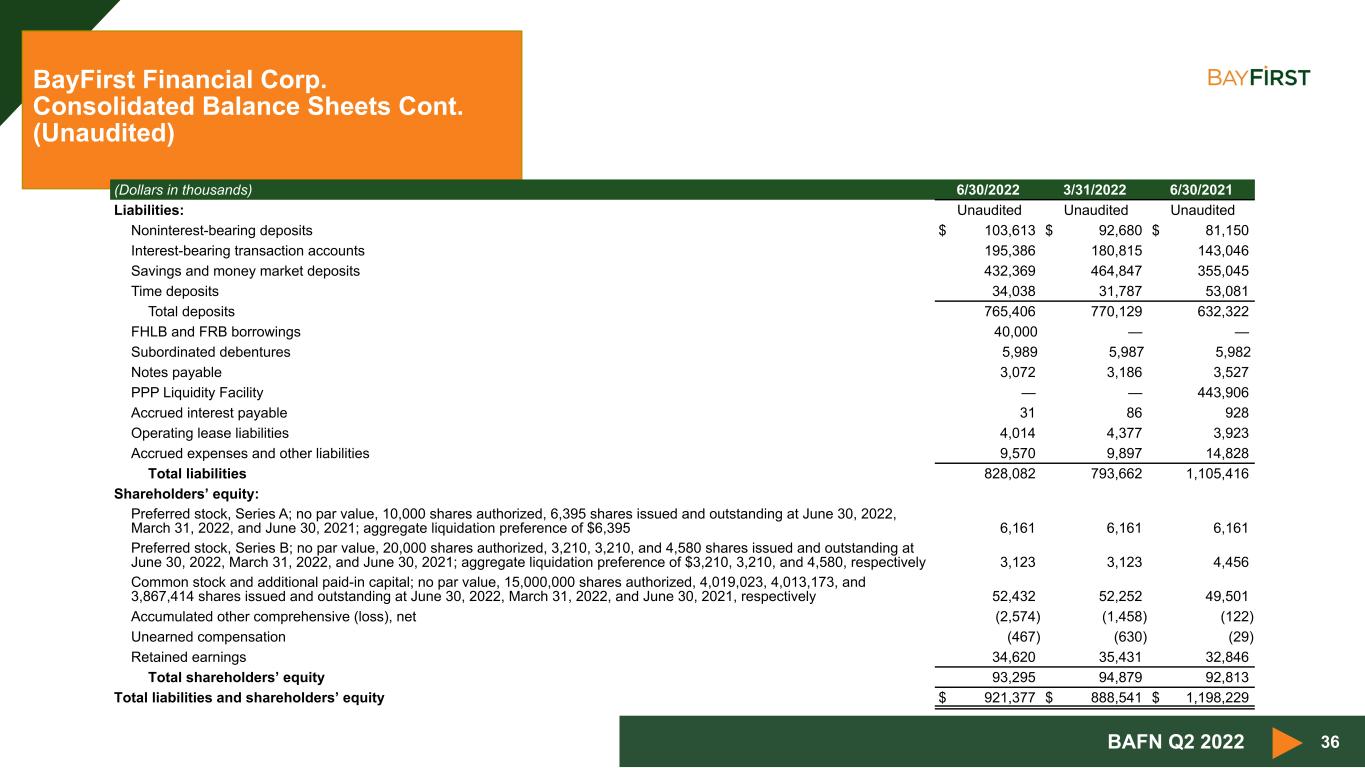
36 BayFirst Financial Corp. Consolidated Balance Sheets Cont. (Unaudited) BAFN Q2 2022 (Dollars in thousands) 6/30/2022 3/31/2022 6/30/2021 Liabilities: Unaudited Unaudited Unaudited Noninterest-bearing deposits $ 103,613 $ 92,680 $ 81,150 Interest-bearing transaction accounts 195,386 180,815 143,046 Savings and money market deposits 432,369 464,847 355,045 Time deposits 34,038 31,787 53,081 Total deposits 765,406 770,129 632,322 FHLB and FRB borrowings 40,000 — — Subordinated debentures 5,989 5,987 5,982 Notes payable 3,072 3,186 3,527 PPP Liquidity Facility — — 443,906 Accrued interest payable 31 86 928 Operating lease liabilities 4,014 4,377 3,923 Accrued expenses and other liabilities 9,570 9,897 14,828 Total liabilities 828,082 793,662 1,105,416 Shareholders’ equity: Preferred stock, Series A; no par value, 10,000 shares authorized, 6,395 shares issued and outstanding at June 30, 2022, March 31, 2022, and June 30, 2021; aggregate liquidation preference of $6,395 6,161 6,161 6,161 Preferred stock, Series B; no par value, 20,000 shares authorized, 3,210, 3,210, and 4,580 shares issued and outstanding at June 30, 2022, March 31, 2022, and June 30, 2021; aggregate liquidation preference of $3,210, 3,210, and 4,580, respectively 3,123 3,123 4,456 Common stock and additional paid-in capital; no par value, 15,000,000 shares authorized, 4,019,023, 4,013,173, and 3,867,414 shares issued and outstanding at June 30, 2022, March 31, 2022, and June 30, 2021, respectively 52,432 52,252 49,501 Accumulated other comprehensive (loss), net (2,574) (1,458) (122) Unearned compensation (467) (630) (29) Retained earnings 34,620 35,431 32,846 Total shareholders’ equity 93,295 94,879 92,813 Total liabilities and shareholders’ equity $ 921,377 $ 888,541 $ 1,198,229
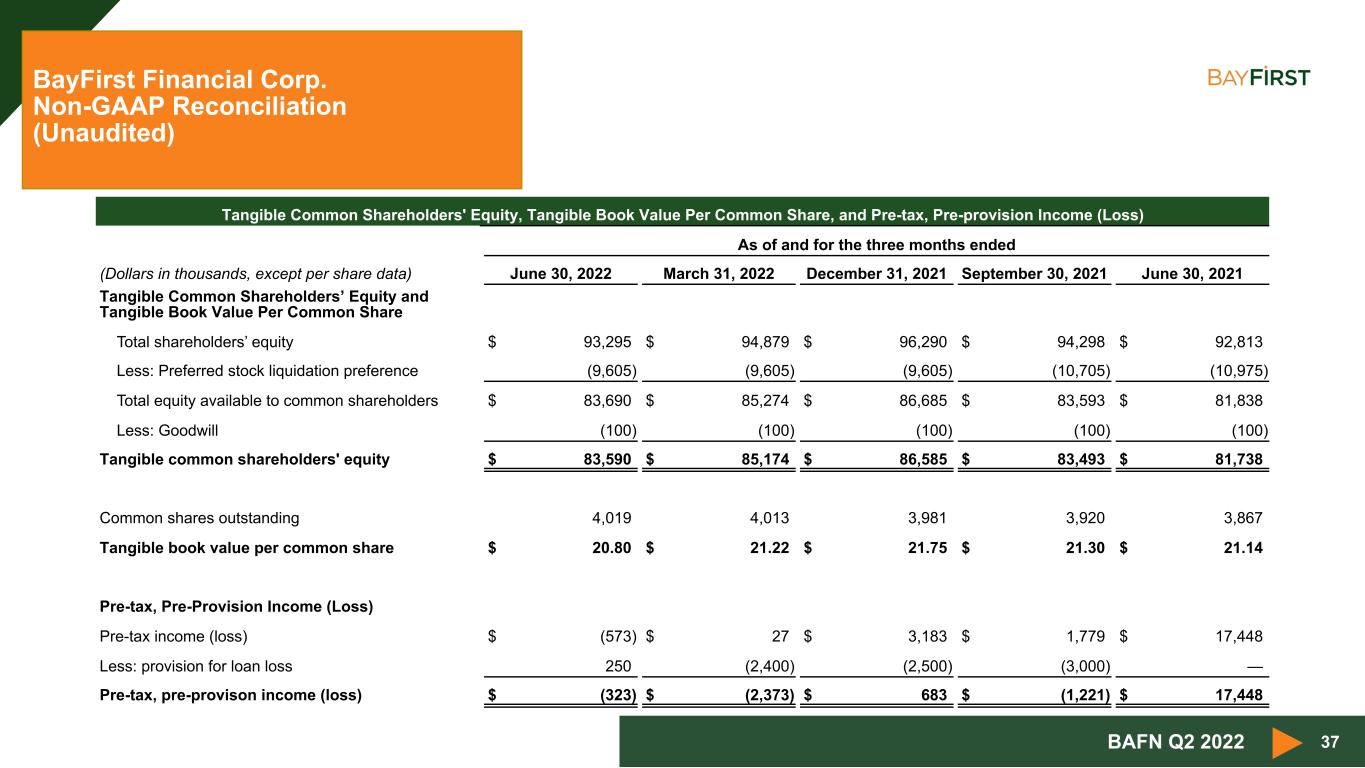
37 BayFirst Financial Corp. Non-GAAP Reconciliation (Unaudited) BAFN Q2 2022 Tangible Common Shareholders' Equity, Tangible Book Value Per Common Share, and Pre-tax, Pre-provision Income (Loss) As of and for the three months ended (Dollars in thousands, except per share data) June 30, 2022 March 31, 2022 December 31, 2021 September 30, 2021 June 30, 2021 Tangible Common Shareholders’ Equity and Tangible Book Value Per Common Share Total shareholders’ equity $ 93,295 $ 94,879 $ 96,290 $ 94,298 $ 92,813 Less: Preferred stock liquidation preference (9,605) (9,605) (9,605) (10,705) (10,975) Total equity available to common shareholders $ 83,690 $ 85,274 $ 86,685 $ 83,593 $ 81,838 Less: Goodwill (100) (100) (100) (100) (100) Tangible common shareholders' equity $ 83,590 $ 85,174 $ 86,585 $ 83,493 $ 81,738 Common shares outstanding 4,019 4,013 3,981 3,920 3,867 Tangible book value per common share $ 20.80 $ 21.22 $ 21.75 $ 21.30 $ 21.14 Pre-tax, Pre-Provision Income (Loss) Pre-tax income (loss) $ (573) $ 27 $ 3,183 $ 1,779 $ 17,448 Less: provision for loan loss 250 (2,400) (2,500) (3,000) — Pre-tax, pre-provison income (loss) $ (323) $ (2,373) $ 683 $ (1,221) $ 17,448


