
BayFirst Financial Corp. (NASDAQ:BAFN) 2022 – Year-end and Fourth Quarter Results (Unaudited)
22 In addition to the historical information contained herein, this presentation includes "forward-looking statements" within the meaning of such term in the Private Securities Litigation Reform Act of 1995. These statements are subject to many risks and uncertainties, including, but not limited to, the effects of the COVID-19 pandemic, global military hostilities, or climate change, including their effects on the economic environment, our customers and our operations, as well as any changes to federal, state or local government laws, regulations or orders in connection with them; the ability of the Company to implement its strategy and expand its banking operations; changes in interest rates and other general economic, business and political conditions, including changes in the financial markets; changes in business plans as circumstances warrant; risks related to mergers and acquisitions; changes in benchmark interest rates used to price loans and deposits, changes in tax laws, regulations and guidance; and other risks detailed from time to time in filings made by the Company with the SEC, including, but not limited to those “Risk Factors” described in our most recent Form 10-K and Form 10-Q. Readers should note that the forward-looking statements included herein are not a guarantee of future events, and that actual events may differ materially from those made in or suggested by the forward- looking statements. Cautionary Statement Concerning Forward-Looking Information Forward-looking statements generally can be identified by the use of forward-looking terminology such as "will," "propose," "may," "plan," "seek," "expect," "intend," "estimate," "anticipate," "believe," "continue," or similar terminology. Any forward-looking statements presented herein are made only as of the date of this document, and we do not undertake any obligation to update or revise any forward-looking statements to reflect changes in assumptions, the occurrence of unanticipated events, or otherwise.
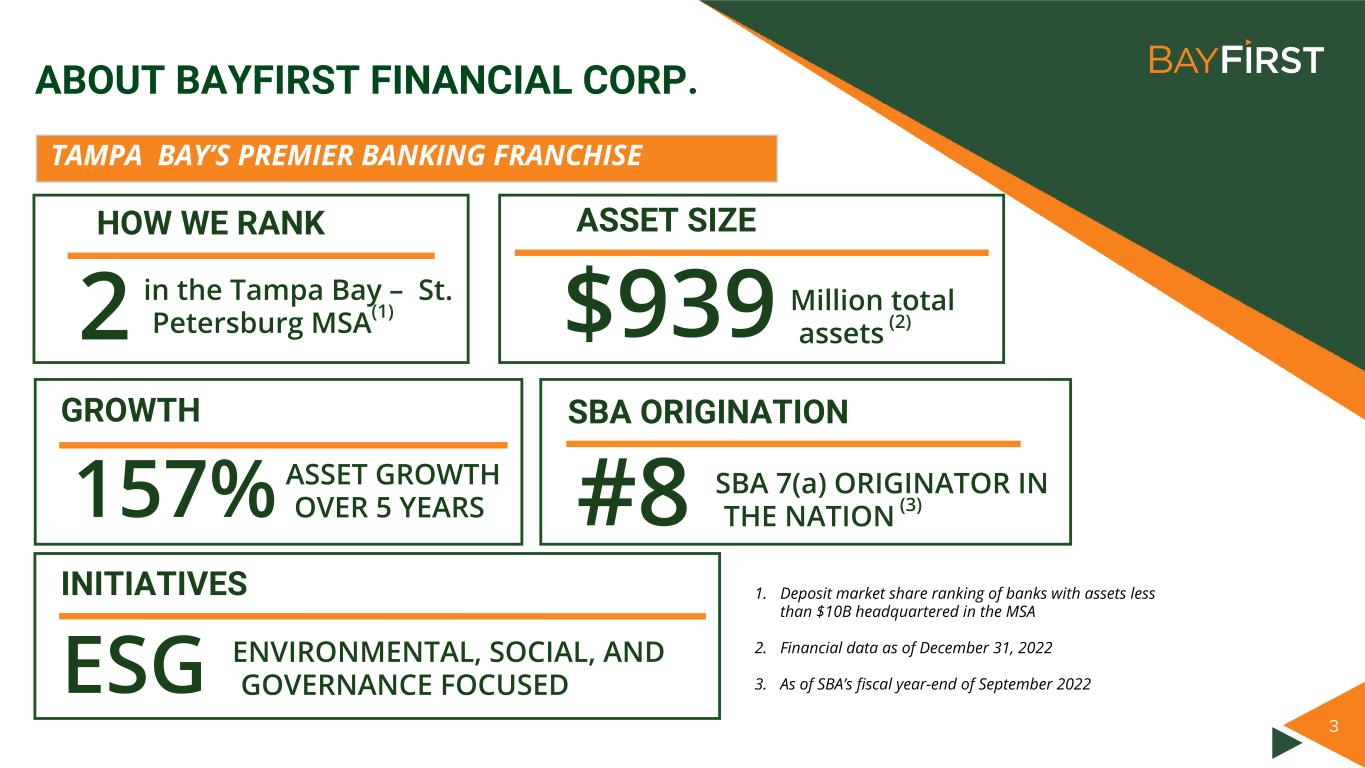
3 ABOUT BAYFIRST FINANCIAL CORP. TAMPA BAY’S PREMIER BANKING FRANCHISE in the Tampa Bay – St. Petersburg MSA(1) HOW WE RANK 2 ASSET SIZE Million total assets (2)$939 SBA ORIGINATION SBA 7(a) ORIGINATOR IN THE NATION (3) #8 GROWTH ASSET GROWTH OVER 5 YEARS157% 1. Deposit market share ranking of banks with assets less than $10B headquartered in the MSA 2. Financial data as of December 31, 2022 3. As of SBA’s fiscal year-end of September 2022 INITIATIVES ENVIRONMENTAL, SOCIAL, AND GOVERNANCE FOCUSED ESG

44 ABOUT BAYFIRST FINANCIAL CORP. CURRENT BANKING CENTER LOCATION FUTURE BANKING CENTER LOCATION EXPANDING BANKING CENTER FRANCHISE
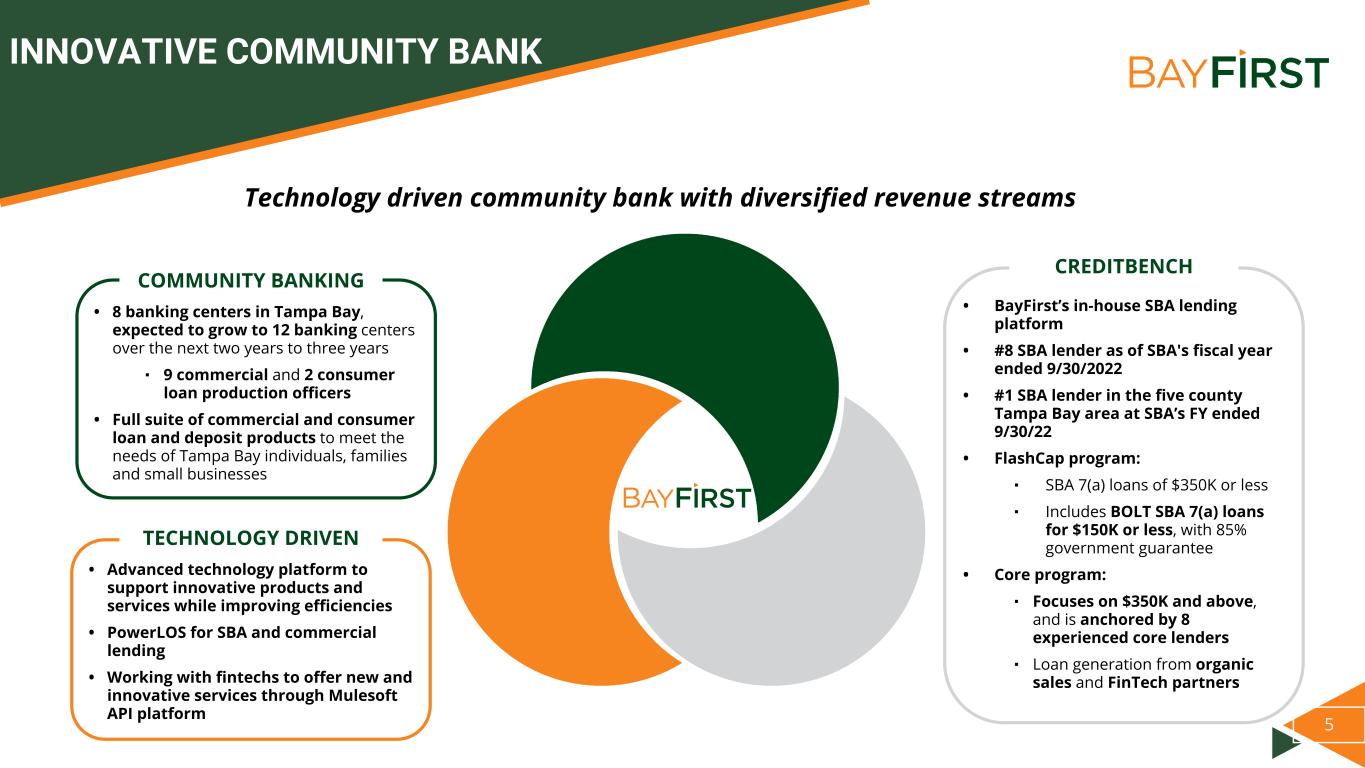
5 • Advanced technology platform to support innovative products and services while improving efficiencies • PowerLOS for SBA and commercial lending • Working with fintechs to offer new and innovative services through Mulesoft API platform • 8 banking centers in Tampa Bay, expected to grow to 12 banking centers over the next two years to three years ▪ 9 commercial and 2 consumer loan production officers • Full suite of commercial and consumer loan and deposit products to meet the needs of Tampa Bay individuals, families and small businesses • BayFirst’s in-house SBA lending platform • #8 SBA lender as of SBA's fiscal year ended 9/30/2022 • #1 SBA lender in the five county Tampa Bay area at SBA’s FY ended 9/30/22 • FlashCap program: ▪ SBA 7(a) loans of $350K or less ▪ Includes BOLT SBA 7(a) loans for $150K or less, with 85% government guarantee • Core program: ▪ Focuses on $350K and above, and is anchored by 8 experienced core lenders ▪ Loan generation from organic sales and FinTech partners COMMUNITY BANKING TECHNOLOGY DRIVEN INNOVATIVE COMMUNITY BANK Technology driven community bank with diversified revenue streams CREDITBENCH

6 ATTRACTIVE LOAN AND DEPOSIT COMPOSITION Composition of Loans Held for Investment as of December 31, 2022 Deposit Portfolio Composition as of December 31, 2022 32.4% 19.0%8.4%1.9% 33.2% 5.1% C&I Residential HELOC C&D Secured by Other Real Estate Consumer & Other 11.7% 25.5% 45.7% 17.1% Noninterest Bearing Transaction Interest Bearing Transaction Savings & Money Market Time Deposits

Divider + Image Click image icon to insert rectangular image. No content below the lineNo content below the line Only use S&P Global Red for key text high- lights, not shapes or charts. It’s available in the custom color palette. Footer : Never change the footer text on individual slides. Change, turn on or off footer by using Insert Header & Footer Enter / change text Click Apply All. Data color order: Used with accent colors: Complimentary colors: Font: Follow the link below to download Akkurat, the S&P Global Font: https:// mediaportal.spglobal.c om/ selection/044f0784c26 0101db38e31ccde3bbe ff/detail/28188 7 KEY STRATEGIC INITIATIVES FOR 2023 AND BEYOND • Grow community banking franchise through new banking centers and expansion of commercial and consumer lending teams • Strive to be a top 5 SBA lender • Promote innovation through the Company while enhancing omnichannel and digital delivery • Optimize efficiency through technology and workflow improvements • Differentiate the Company through a commitment to social responsibility
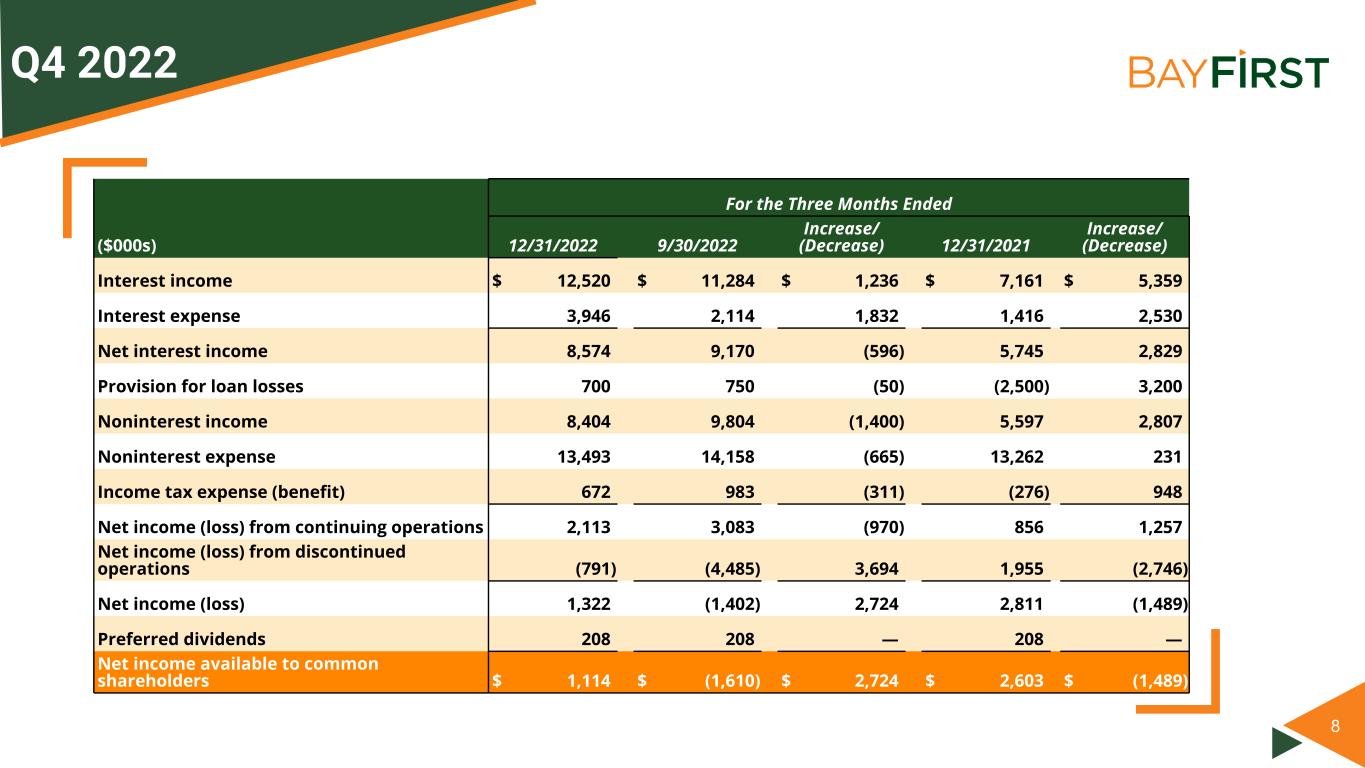
8 Q4 2022 For the Three Months Ended ($000s) 12/31/2022 9/30/2022 Increase/ (Decrease) 12/31/2021 Increase/ (Decrease) Interest income $ 12,520 $ 11,284 $ 1,236 $ 7,161 $ 5,359 Interest expense 3,946 2,114 1,832 1,416 2,530 Net interest income 8,574 9,170 (596) 5,745 2,829 Provision for loan losses 700 750 (50) (2,500) 3,200 Noninterest income 8,404 9,804 (1,400) 5,597 2,807 Noninterest expense 13,493 14,158 (665) 13,262 231 Income tax expense (benefit) 672 983 (311) (276) 948 Net income (loss) from continuing operations 2,113 3,083 (970) 856 1,257 Net income (loss) from discontinued operations (791) (4,485) 3,694 1,955 (2,746) Net income (loss) 1,322 (1,402) 2,724 2,811 (1,489) Preferred dividends 208 208 — 208 — Net income available to common shareholders $ 1,114 $ (1,610) $ 2,724 $ 2,603 $ (1,489) 8

9 Q4 2022 Year Ended December 31, ($000s) 2022 2021 Increase/ (Decrease) Interest income $ 38,566 $ 43,826 $ (5,260) Interest expense 8,566 7,300 1,266 Net interest income 30,000 36,526 (6,526) Provision for loan losses (700) (3,500) 2,800 Noninterest income 31,550 21,973 9,577 Noninterest expense 55,212 50,279 4,933 Income tax expense (benefit) 1,560 2,691 (1,131) Net income (loss) from continuing operations 5,478 9,029 (3,551) Net income (loss) from discontinued operations (5,827) 15,589 (21,416) Net income (loss) (349) 24,618 (24,967) Preferred dividends 832 1,005 (173) Net income available to common shareholders $ (1,181) $ 23,613 $ (24,794) 9
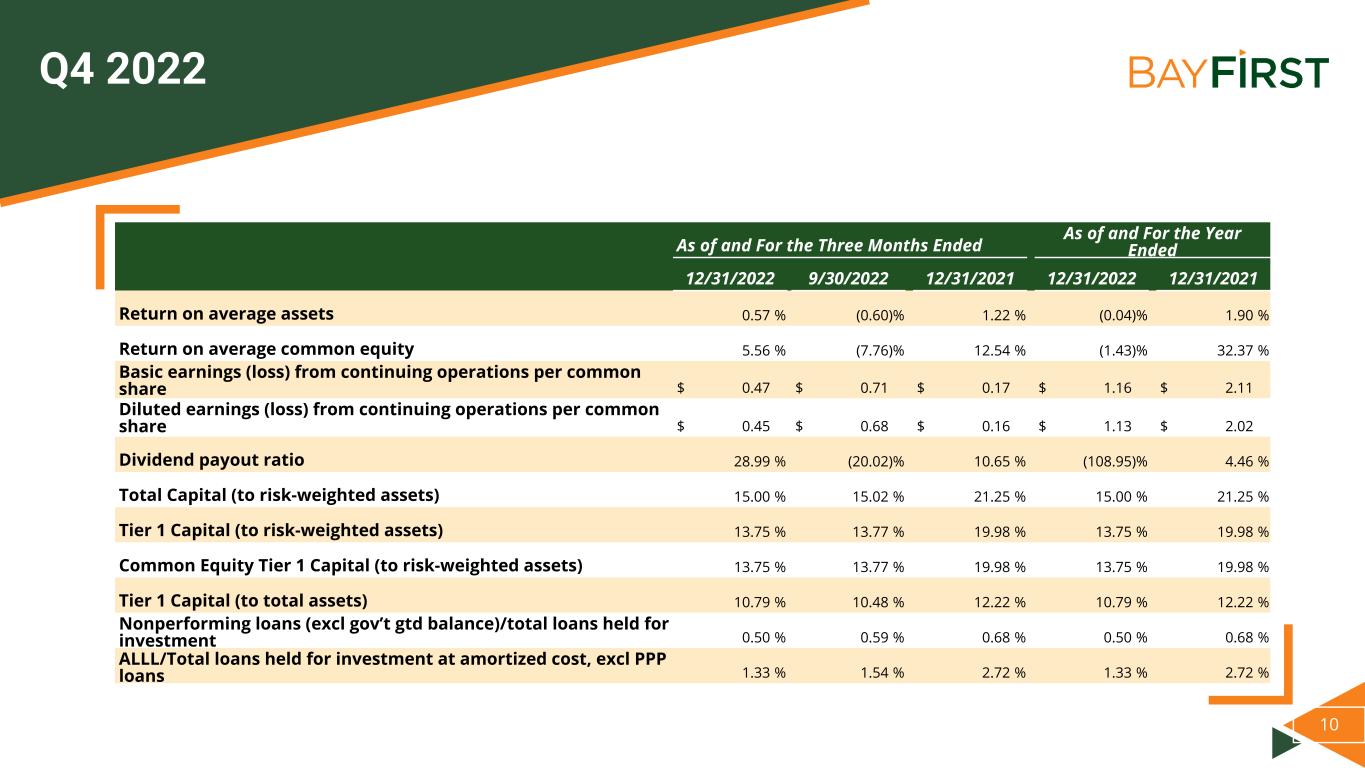
10 Q4 2022 As of and For the Three Months Ended As of and For the Year Ended 12/31/2022 9/30/2022 12/31/2021 12/31/2022 12/31/2021 Return on average assets 0.57 % (0.60) % 1.22 % (0.04) % 1.90 % Return on average common equity 5.56 % (7.76) % 12.54 % (1.43) % 32.37 % Basic earnings (loss) from continuing operations per common share $ 0.47 $ 0.71 $ 0.17 $ 1.16 $ 2.11 Diluted earnings (loss) from continuing operations per common share $ 0.45 $ 0.68 $ 0.16 $ 1.13 $ 2.02 Dividend payout ratio 28.99 % (20.02) % 10.65 % (108.95) % 4.46 % Total Capital (to risk-weighted assets) 15.00 % 15.02 % 21.25 % 15.00 % 21.25 % Tier 1 Capital (to risk-weighted assets) 13.75 % 13.77 % 19.98 % 13.75 % 19.98 % Common Equity Tier 1 Capital (to risk-weighted assets) 13.75 % 13.77 % 19.98 % 13.75 % 19.98 % Tier 1 Capital (to total assets) 10.79 % 10.48 % 12.22 % 10.79 % 12.22 % Nonperforming loans (excl gov’t gtd balance)/total loans held for investment 0.50 % 0.59 % 0.68 % 0.50 % 0.68 % ALLL/Total loans held for investment at amortized cost, excl PPP loans 1.33 % 1.54 % 2.72 % 1.33 % 2.72 %

11 $43 $56 $85 $82 2019Y 2020Y 2021Y 2022Y $20 $40 $60 $80 $100 $120 Strong balance sheet on track for continued organic growth RECORD ORGANIC GROWTH Total Assets excluding PPP Loans ($M) Total Net Loans HFI excluding PPP loans ($M) Total Deposits ($M) Tangible Common Equity ($M) Capitalizing on $15.0M after-ta x gain on sale of PPP loans in ’20 & ‘21 $531 $706 $844 $920 2019Y 2020Y 2021Y 2022Y $0 $200 $400 $600 $800 $1,000 $303 $471 $491 $700 2019Y 2020Y 2021Y 2022Y $0 $200 $400 $600 $800 $450 $559 $722 $795 2019Y 2020Y 2021Y 2022Y $0 $200 $400 $600 $800 $1,000

12 POSITIONED TO RETURN TO STRONG PROFITABILITY ROAA (%) ROATCE (%) Net Interest Margin (%) Non-Interest Income / Total Revenue from Continuing Operations Volatility in 2022 due to discontinued operations mortgage; company repositioned for future (1) The NIM was depressed due to impact of low yield PPP loan portfolio 0.99% 1.06% 1.90% (0.04)% 2019Y 2020Y 2021Y 2022Y (0.50)% 0.00% 0.50% 1.00% 1.50% 2.00% 2.50% 11.60% 25.60% 32.40% (1.43)% 2019Y 2020Y 2021Y 2022Y 0.00% 7.50% 15.00% 22.50% 30.00% 4.08% 2.88% 3.23% 3.97% 2019Y 2020Y 2021Y 2022Y 0.00% 1.00% 2.00% 3.00% 4.00% 5.00% (1) (1) 58.22% 7.63% 37.56% 51.26% 2019Y 2020Y 2021Y 2022Y 0% 10% 20% 30% 40% 50% 60%
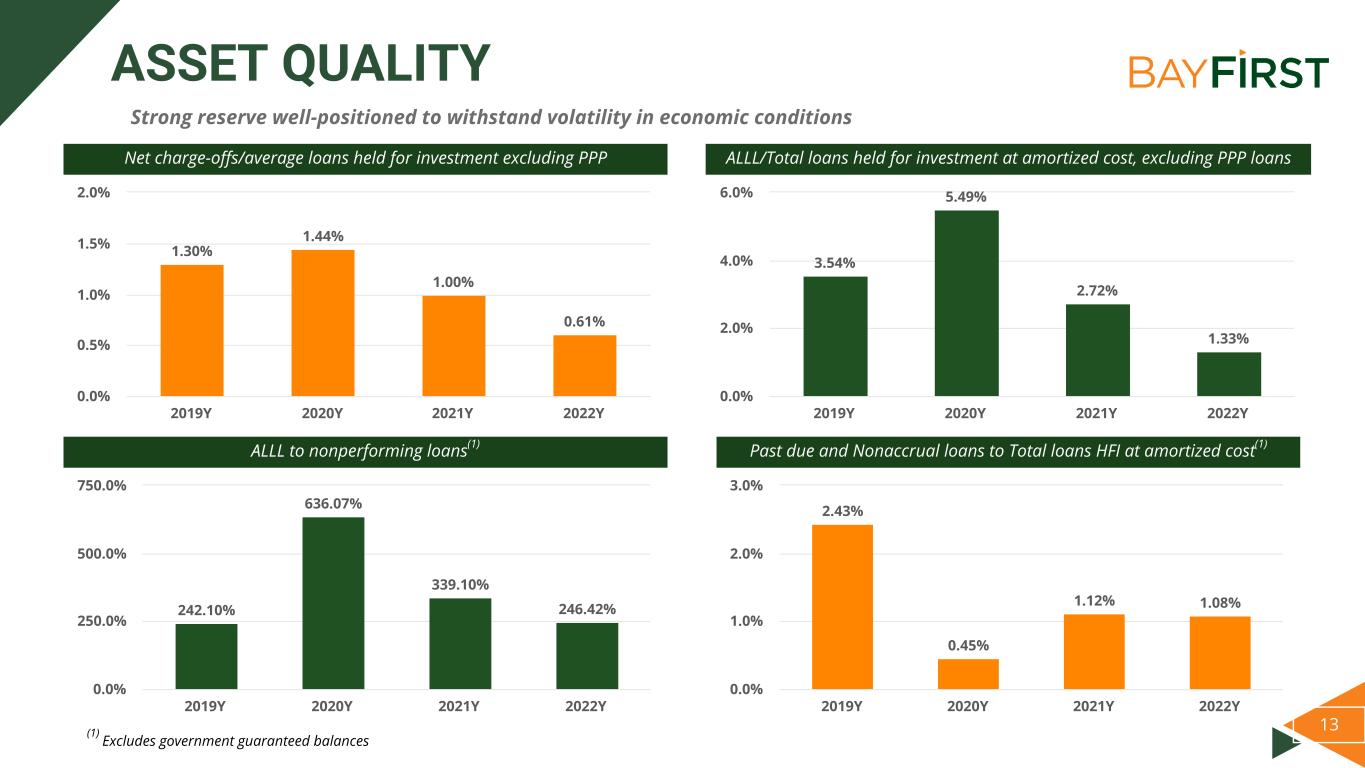
13 ASSET QUALITY Strong reserve well-positioned to withstand volatility in economic conditions 1.30% 1.44% 1.00% 0.61% 2019Y 2020Y 2021Y 2022Y 0.0% 0.5% 1.0% 1.5% 2.0% Net charge-offs/average loans held for investment excluding PPP ALLL/Total loans held for investment at amortized cost, excluding PPP loans 3.54% 5.49% 2.72% 1.33% 2019Y 2020Y 2021Y 2022Y 0.0% 2.0% 4.0% 6.0% ALLL to nonperforming loans(1) Past due and Nonaccrual loans to Total loans HFI at amortized cost(1) 242.10% 636.07% 339.10% 246.42% 2019Y 2020Y 2021Y 2022Y 0.0% 250.0% 500.0% 750.0% 2.43% 0.45% 1.12% 1.08% 2019Y 2020Y 2021Y 2022Y 0.0% 1.0% 2.0% 3.0% (1) Excludes government guaranteed balances

14 SHAREHOLDER VALUE CREATION Impressive Tangible Book Value Per Share growth in recent years $11.40 $11.49 $12.77 $16.02 $21.75 $20.35 2017Y 2018Y 2019Y 2020Y 2021Y 2022Y $0 $3 $5 $8 $10 $13 $15 $18 $20 $23 $25

15 COMMUNITY BANKING PERFORMANCE Q4’2022 Loan Production Summary: ▪ Loan production during the quarter was $48.1 million(1) ▪ Loans held for investment increased by a net $50.8 million QoQ Q4’2022 Deposit Summary: ▪ Q4’2022 deposit balance grew $73.4 million YoY ▪ Deposit portfolio increased by 3.8% in number of accounts (to 14,673 totaling $795.1 million) QoQ Q4’ 2022 Highlights Branch & Deposits Market Share ($ in 000s) Total Deposits # Branch Year Opened 12/31/2022 12/31/2021 12/31/2020 1 Saint Petersburg(2) 2017 $ 246,813 $ 228,718 $ 207,304 2 Sarasota 2018 159,302 175,427 114,681 3 Seminole 1999 131,257 146,072 125,410 4 Pinellas Park 2005 69,976 68,429 52,535 5 Countryside 2018 66,827 62,201 48,897 6 West Tampa 2020 68,834 40,838 9,957 7 Belleair Bluffs 2021 31,011 — — 8 West Bradenton 2022 21,050 — — Total Branches (8) $ 795,070 $ 721,685 $ 558,784 (1) Excludes SBA loan production and residential mortgage production from discontinued operations (2) Saint Petersburg branch deposits include other deposits generated by CreditBench, Cash Management, Corporate Treasury, and Virtual.

16 $316 $101 $169 $386 1,287 320 374 1,364 2019 2020 2021 2022 $0 $50 $100 $150 $200 $250 $300 $350 $400 0 250 500 750 1,000 1,250 1,500 • Pre- Pandemic: ~80% of loan production sourced through third-party partners • Post- Pandemic: over ~80% of production in-house through CreditBench • Ranked #8 in total SBA production in the SBA fiscal year ending September 30, 2022 • Total Q4’2022 SBA loan production increased 84.6% from Q4’2021 • Launched BOLT, an SBA 7(a) loan product designed to provide working capital loans of $150 thousand or less to businesses throughout the country ◦ June 1 launch and have already done $121.2 million YTD, including $57.6 million in Q4’2022 ◦ New automation program launched through its proprietary loan origination system PowerLOS and Open API, allowing increased volume and speed while limiting additional staff CREDITBENCH (SBA LENDING) Q4’ 2022 Highlights SBA Loan Amount ($M) and Volume (1) CreditBench concentrated on PPP loan production for years 2020 to 2021 Excludes $877M PPP loans originated in ’20 and $329M during ‘21(1)

Divider + Image Click image icon to insert rectangular image. No content below the lineNo content below the line Only use S&P Global Red for key text high- lights, not shapes or charts. It’s available in the custom color palette. Footer : Never change the footer text on individual slides. Change, turn on or off footer by using Insert Header & Footer Enter / change text Click Apply All. Data color order: Used with accent colors: Complimentary colors: Font: Follow the link below to download Akkurat, the S&P Global Font: https:// mediaportal.spglobal.c om/ selection/044f0784c26 0101db38e31ccde3bbe ff/detail/28188 17 KEY INVESTMENT POINTS Second largest community bank (deposits) based in attractive Tampa Bay market area Total asset growth of 157% since YE2017 Innovative technology driven bank planning for the future of banking Among the nation’s top SBA loan generators Experienced management team Strong insider ownership of 15% ✔ ✔ ✔ ✔ ✔ ✔ ✔ Consistent dividend growing 100% over past 5 years

Divider + Image Click image icon to insert rectangular image. No content below the lineNo content below the line Only use S&P Global Red for key text high- lights, not shapes or charts. It’s available in the custom color palette. Footer : Never change the footer text on individual slides. Change, turn on or off footer by using Insert Header & Footer Enter / change text Click Apply All. Data color order: Used with accent colors: Complimentary colors: Font: Follow the link below to download Akkurat, the S&P Global Font: https:// mediaportal.spglobal.c om/ selection/044f0784c26 0101db38e31ccde3bbe ff/detail/28188 18 APPENDIX

19 INVESTMENT SECURITIES AFS Investment Securities Portfolio as of December 31, 2022 (fair market value, in thousands) (1)Investment Securities Portfolio Details • Other Comprehensive Loss of $3.7 million reduced Tangible Book Value by $0.92 QoQ as of December 31, 2022 ◦ We intend and have the ability to hold the available for sale investment securities to maturity; no plan to sell ◦ Cash flows could be used to fund future loan growth as needed ◦ Retained earnings and investments moving down the curve would earn back capital loss ◦ No impact to regulatory capital ratios • In the second quarter, we moved a recently purchased $1.5 million AFS investment to held to maturity investments. The Company also purchased an additional $3.5 million of corporate bonds which were classified as held to maturity at purchase. (1) HTM Investment Securities makes up 10% of total investment securities portfolio $9,605 $3,440 $18,220 $11,084 Asset-backed securities MBS: U.S. Government-sponsored enterprises CMO: U.S. Government-sponsored enterprises Corporate Bonds
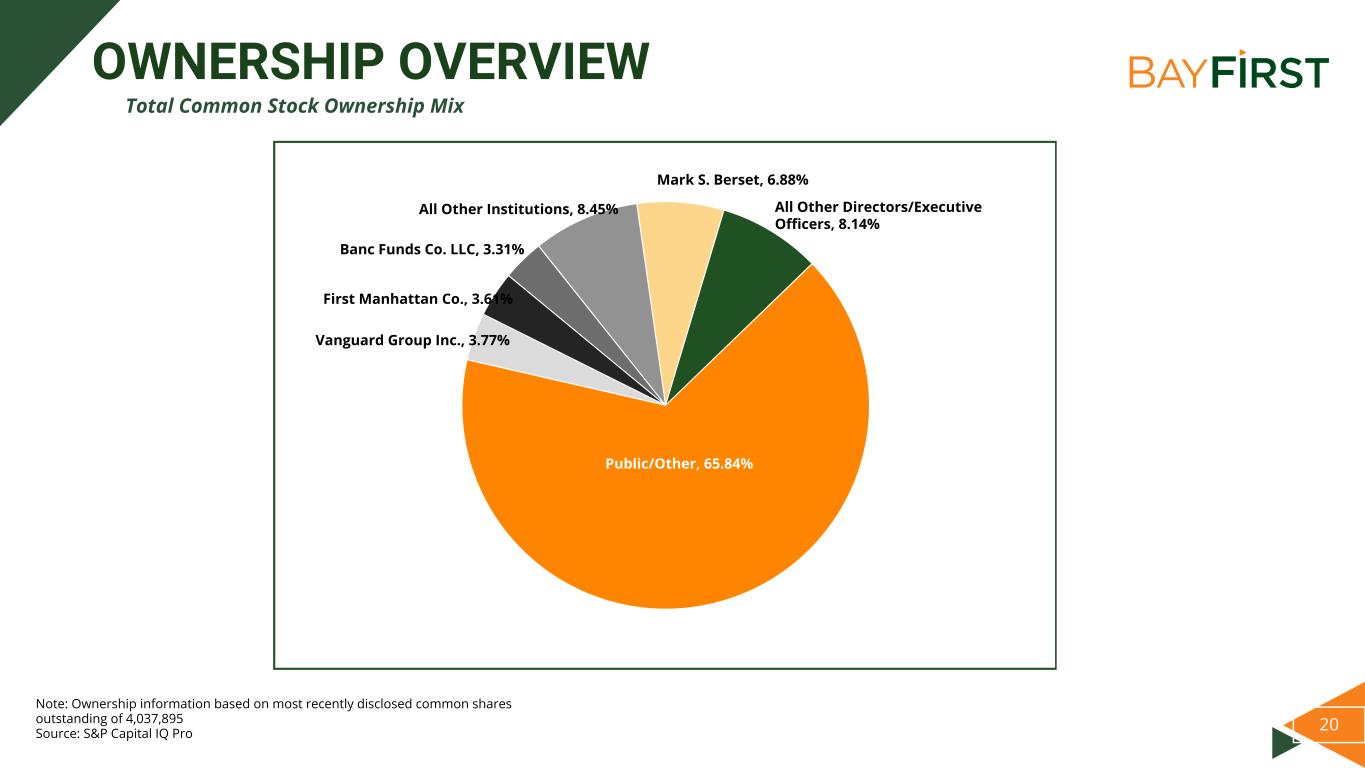
20 OWNERSHIP OVERVIEW Total Common Stock Ownership Mix Note: Ownership information based on most recently disclosed common shares outstanding of 4,037,895 Source: S&P Capital IQ Pro Vanguard Group Inc., 3.77% First Manhattan Co., 3.61% Banc Funds Co. LLC, 3.31% All Other Institutions, 8.45% Mark S. Berset, 6.88% All Other Directors/Executive Officers, 8.14% Public/Other, 65.84%

21 ATTRACTIVE FLORIDA MARKETS MEANINGFUL ECONOMIC TAILWINDS #2 state in the U.S.A. for net domestic migration and top 3 growth state* ~$1.4T economy, with 3.8% GDP growth in Q3’22 Attractive tax policy 3.0 million small businesses, more than any other Southeastern state 3rd most populous state Total Deposits in Pinellas, Hillsborough, Manatee and Sarasota Counties of $113bn* …Favorable Population Projections… …and Favorable Expected Household Incomes Tier 1 Markets: • Citrus • Hernando • Pasco • Pinellas • Charlotte • Hillsborough • Polk • Manatee • Sarasota Tier 2 Markets: • Sumter • Lake • Orange • Osceola • Collier • Hardee • DeSoto • Highlands • Lee *Source: S&P Global Market Intelligence as of January 2023, U-haul G ro w th R at e ('2 3 to '2 8) 2.12% 5.00% 5.19% 7.73% USA Florida Tampa MSA Sarasota MSA 0% 3% 5% 8% 10% G ro w th R at e ('2 3 to '2 8) 13.13% 12.55% 13.28% 12.29% USA Florida Tampa MSA Sarasota MSA 0% 5% 10% 15%

Divider + Image Click image icon to insert rectangular image. No content below the lineNo content below the line Only use S&P Global Red for key text high- lights, not shapes or charts. It’s available in the custom color palette. Footer : Never change the footer text on individual slides. Change, turn on or off footer by using Insert Header & Footer Enter / change text Click Apply All. Data color order: Used with accent colors: Complimentary colors: Font: Follow the link below to download Akkurat, the S&P Global Font: https:// mediaportal.spglobal.c om/ selection/044f0784c26 0101db38e31ccde3bbe ff/detail/28188 22 DEPOSIT MARKET SHARE Tampa-St. Petersburg MSA (Total Assets <$10BN and HQ in MSA) Note: Deposit data as of June 30, 2022 Source: S&P Capital IQ Pro Average Deposits Branches Deposits per Branch Market Share Rank Institution ($ millions) (No.) ($ millions) (%) 1 Tampa Bay Banking Co. $2,938 11 $267 65.09 % 2 BayFirst Financial Corp. 618 6 103 13.70 % 3 West Florida Bank Corp. 444 6 73 9.83 % 4 TCM Bank NA 226 1 226 5.00 % 5 Central Financial Holdings Inc. 128 1 128 2.83 % 6 Century Bancshares of Florida Inc. 97 1 97 2.14 % 7 Waterfall Bank 64 1 64 1.41 %

23 EXPERIENCED LEADERSHIP TEAM • Joined BayFirst in Q4 2013; Prior to joining BayFirst, provided management consulting and regulatory advisory services to community banks throughout the state of Florida and served as the interim CEO of three troubled banks between 2009 and 2013 • Managing Director and Executive Vice President of Community Banks, Inc. (Nasdaq: CMTY) in Harrisburg, PA from 1993 until its sale to Susquehanna Bancshares, Inc. (NasdaqGS: SUSQ) in 2007 • B.A. in Political Science from George Washington University and a J.D. from George Washington University Law School • Joined BayFirst in Q2 2018; Prior to joining BayFirst, Controller of Central Bank & Trust Co., a $2.5 billion privately held financial institution in Lexington, Kentucky, from May 2014 to June 2018 • Approximately 16 years with Crowe Horwath LLP as an auditor in the financial institution practice; served over 80 financial institution clients with assets ranging from $50 million to $4.5 billion throughout career, including several SEC registrants and FDICIA reporting institutions • B.S. in Accounting from the University of Kentucky • Joined BayFirst in Q1 2016 • Previous experience includes Florida Market President of Stearns Bank, SBA Product Manager of HomeBanc, and Community Bank President and SBA President of Republic Bank (MI) • B.A. in Business Administration from University of Notre Dame Anthony N. Leo Robin Oliver Thomas G. Zernick Chief Executive Officer & Director of BayFirst and the Bank EVP, Chief Financial Officer and Chief Operating Officer of BayFirst and the Bank President of BayFirst and the Bank

24 EXPERIENCED LEADERSHIP TEAM • Joined BayFirst in Q4 2017; Prior to joining BayFirst, over fifteen years of Mortgage Banking administration experience as well as Human Resources experience supporting mid-size financial institutions • B.B.S from The University of Florida and M.B.A from The University of Tampa • Joined BayFirst in Q4 2020 • 37 years information technology experience • Served as CTO for Fiserv, Inc. • B.A. from University of South Florida Brandi Jaber John Macaluso EVP, Chief Production Officer EVP, Chief Technology Officer Lewis Benner EVP, Chief Credit Officer • Joined BayFirst in 2018; Prior to joining BayFirst, Mr. Benner served in leadership roles from multiple financial institutions • B.A. in Business Administration from Elizabethtown College


