
Exhibit 99.2 ICR Investor Conference January 2023
Disclaimer Forward-Looking Statements This presentation dated December 1, 2022 includes “forward-looking statements” within the meaning of the Private Securities Litigation Reform Act of 1995. All statements, other than statements of historical facts included in this presentation, including statements concerning Duluth Holdings Inc.'s (dba Duluth Trading Company) (“Duluth Trading” or the “Company”) plans, objectives, goals, beliefs, business strategies, future events, business conditions, its results of operations, financial position and its business outlook, business trends and certain other information herein are forward-looking statements, including its ability to execute on its growth strategies. You can identify forward-looking statements by the use of words such as “may,” ”might,” “will,” “should,” “expect,” “plan,” “anticipate,” “could,” “believe,” “estimate,” “project,” “target,” “predict,” “intend,” “future,” “budget,” “goals,” “potential,” “continue,” “design,” “objective,” “would” and other similar expressions. The forward-looking statements are not historical facts, and are based upon Duluth Trading's current expectations, beliefs, estimates, and projections, and various assumptions, many of which, by their nature, are inherently uncertain and beyond Duluth Trading's control. Duluth Trading's expectations, beliefs and projections are expressed in good faith, and Duluth Trading believes there is a reasonable basis for them. However, there can be no assurance that management's expectations, beliefs, estimates, and projections will be achieved and actual results may vary materially from what is expressed in or indicated by the forward-looking statements. Forward-looking statements are subject to risks and uncertainties that could cause actual performance or results to differ materially from those expressed in the forward-looking statements, including, among others, the risks, uncertainties, and factors set forth under Part 1, Item 1A “Risk Factors” in Duluth Trading’s Annual Report on Form 10-K filed with the SEC on March 25, 2022, and other factors as may be periodically described in Duluth Trading’s subsequent filings with the SEC. Forward-looking statements speak only as of the date the statements are made. Duluth Trading assumes no obligation to update forward-looking statements to reflect actual results, subsequent events or circumstances or other changes affecting forward-looking information except to the extent required by applicable securities laws. Non-GAAP Measurements Management believes that non-GAAP financial measures may be useful in certain instances to provide additional meaningful comparisons between current results and results in prior operating periods. Within this presentation, reference is made to adjusted earnings before interest, taxes, depreciation and amortization (EBITDA) and Free Cash Flow. See Appendix Table “Adjusted EBITDA,” for a reconciliation of net income to EBITDA and EBITDA to Adjusted EBITDA and “Free Cash Flow” for a reconciliation of Net cash provided by operating activities to Free Cash Flow. Adjusted EBITDA is a metric used by management and frequently used by the financial community, which provides insight into an organization’s operating trends and facilitates comparisons between peer companies, since interest, taxes, depreciation and amortization can differ greatly between organizations as a result of differing capital structures and tax strategies. Adjusted EBITDA excludes certain items, such as stock-based compensation. Management believes Free Cash Flow is a useful measure of performance as an indication of an organization’s financial strength and provides additional perspective on the ability to efficiently use capital in executing growth strategies. Free Cash Flow is used to facilitate a comparison of operating performance on a consistent basis from period- to-period and the ability to generate cash. Free Cash Flow is defined as net cash provided by operating activities less purchase of property and equipment and capital contributions towards build-to-suit stores. The Company provides this information to investors to assist in comparisons of past, present and future operating results and to assist in highlighting the results of on-going operations. While the Company’s management believes that non-GAAP measurements are useful supplemental information, such adjusted results are not intended to replace the Company’s GAAP financial results and should be read in conjunction with those GAAP results. January 2023 2

THERE’S ALWAYS GOTTA BE A BETTER WAY Duluth Trading Co. was founded on the belief that there’s always a better way to be found. A better way to solve. A better way to make. A better way to be. We’re on a mission to build better, harder-working apparel and gear that helps enable everyone from the young — to the young at heart — to take on life with their own two hands, and live on terms that are uniquely their own.

Secret Sauce Better Brands A brood of sub-brands all bonded by the belief that you can accomplish anything that you put your own mind and own two hands to Better Innovation Long, colorful history of product innovation and solution-based design Better Marketing Distinctive marketing made to break through the clutter and drive buying Better Customer Experiences Outstanding and engaging customer experience Better Distribution Nationwide omnichannel presence with controlled distribution January 2023 5

FINANCIAL REVIEW
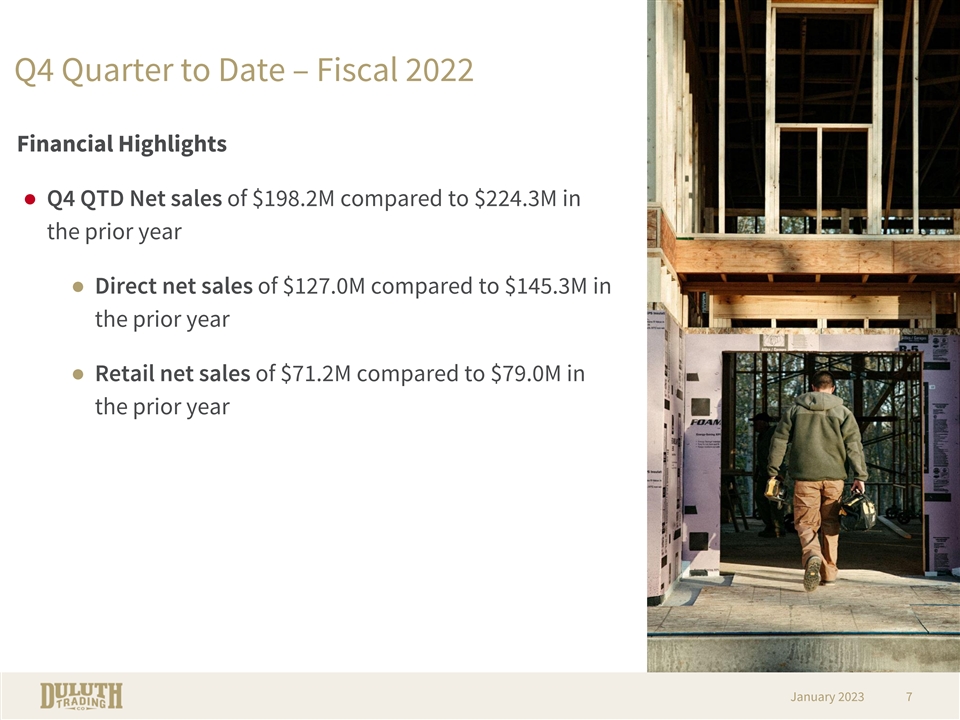
Q4 Quarter to Date – Fiscal 2022 Financial Highlights ● Q4 QTD Net sales of $198.2M compared to $224.3M in the prior year ● Direct net sales of $127.0M compared to $145.3M in the prior year ● Retail net sales of $71.2M compared to $79.0M in the prior year January 2023 7
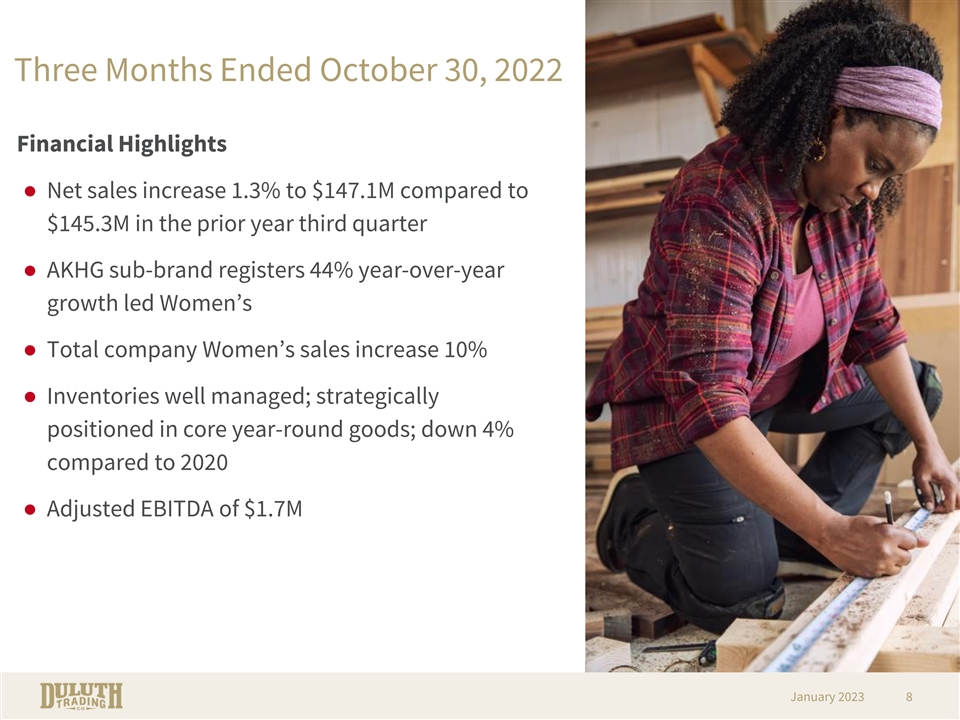
Three Months Ended October 30, 2022 Financial Highlights ● Net sales increase 1.3% to $147.1M compared to $145.3M in the prior year third quarter ● AKHG sub-brand registers 44% year-over-year growth led Women’s ● Total company Women’s sales increase 10% ● Inventories well managed; strategically positioned in core year-round goods; down 4% compared to 2020 ● Adjusted EBITDA of $1.7M January 2023 8
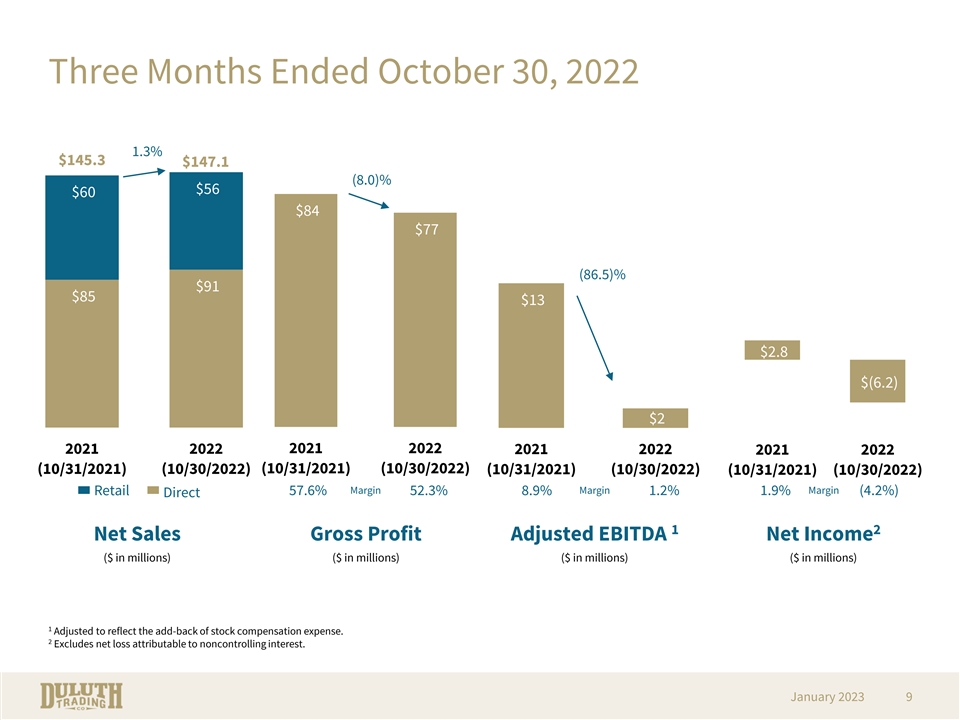
Three Months Ended October 30, 2022 1.3% $145.3 $147.1 (8.0)% $56 $60 $84 $77 (86.5)% $91 $85 $13 $2.8 $(6.2) $2 2021 2022 2021 2022 2021 2022 2021 2022 (10/31/2021) (10/30/2022) (10/31/2021) (10/30/2022) (10/31/2021) (10/30/2022) (10/31/2021) (10/30/2022) Retail Direct 1 2 Net Sales Gross Profit Adjusted EBITDA Net Income ($ in millions) ($ in millions) ($ in millions) ($ in millions) 1 Adjusted to reflect the add-back of stock compensation expense. 2 Excludes net loss attributable to noncontrolling interest. January 2023 9
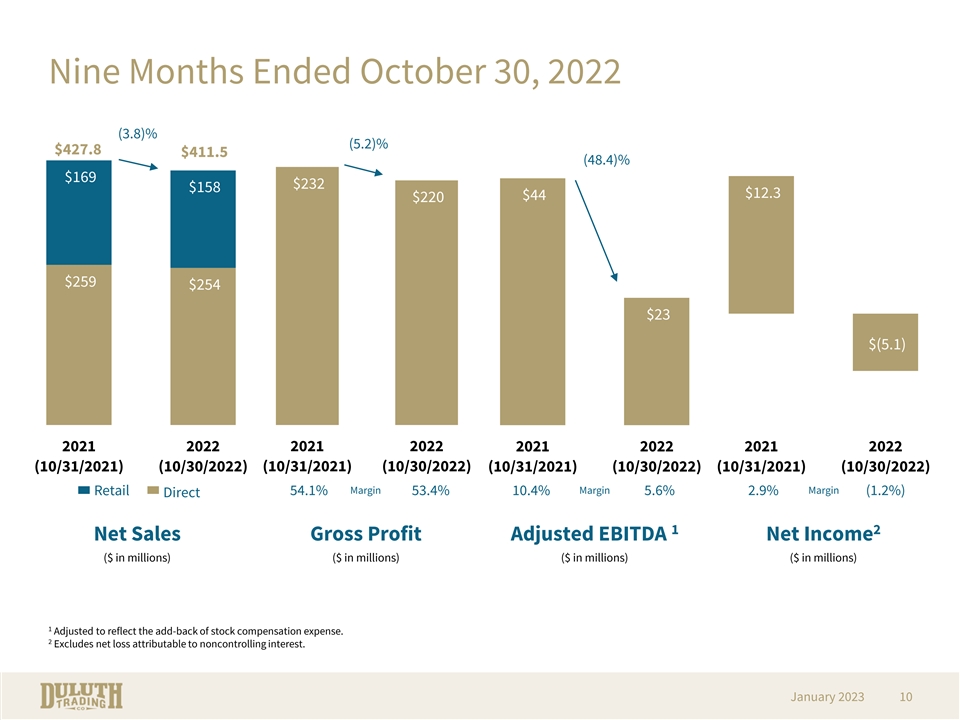
Nine Months Ended October 30, 2022 (3.8)% (5.2)% $427.8 $411.5 (48.4)% $169 $232 $158 $12.3 $44 $220 $259 $254 $23 $(5.1) 2021 2022 2021 2022 2021 2022 2021 2022 (10/31/2021) (10/30/2022) (10/31/2021) (10/30/2022) (10/31/2021) (10/30/2022) (10/31/2021) (10/30/2022) Retail Direct 1 2 Net Sales Gross Profit Adjusted EBITDA Net Income ($ in millions) ($ in millions) ($ in millions) ($ in millions) 1 Adjusted to reflect the add-back of stock compensation expense. 2 Excludes net loss attributable to noncontrolling interest. January 2023 10

Net Sales and Adjusted EBITDA ● Strong track record of 15% Net Sales and 15% Adjusted EBITDA growth ● Strategic investments and operating efficiencies support long-term objectives of accelerated earnings growth 699 77 639 616 568 55 471 52 52 46 376 41 304 34 2015 2016 2017 2018 2019 2020 2021 2015 2016 2017 2018 2019 2020 2021 1 Net Sales Adjusted EBITDA ($ in millions) ($ in millions) 1 Adjusted to reflect the add-back of stock compensation expense. January 2023 11

Strong Balance Sheet, Liquidity and FCF (1,2) Debt to Capital Free Cash Flow ($ in millions) As of October 30, 2022 Cash $9.4 $23.7 Debt: Line of Credit 10.0 Term Loan 0.0 Total Debt 10.0 Total Shareholders’ Equity $218.6 Total Capitalization $228.6 $(75.3) 2021 2022 Debt to Capital ratio 4.4% (October 31, 2021) (October 30, 2022) 1 Debt balances do not include TRI Holdings, LLC, a variable interest entity that is consolidated for reporting purposes 2 The New Credit Agreement matures on July 8, 2027 and provides for borrowings of up to $200.0 million that are available under a revolving senior credit facility. January 2023 12

Fiscal 2022 Financial Guidance ($ in millions) 2021 2022 Guidance Reconciliation to 2022 Forecasted Adj. EBITDA Fiscal Year Ended January 29, 2023 Net Sales $698.6 $650 to $680 Forcasted ($ in millions) Low High -7.0% to -2.7% Net Income $1.5 $6.7 (+) Depreciation and amortization 30.0 30.2 Adj. $77.4 $42 to $49 (+) Amortization of internal-use software -45.7% to -36.7% EBITDA 3.1 3.1 hosting subscription implementation costs (+) Interest expense 3.9 3.8 (+) Income tax expense 0.5 2.2 EPS $0.90 $0.05 to $0.20 -94.4% to -77.8% EBITDA $39.0 $46.0 (+) Stock based compensation 3.0 3.0 1 CAPEX $15.1 ~$35 Adjusted EBITDA $42.0 $49.0 1 2021 and 2022 include $4.7M and ~$6M, respectively, of additional investments in implementation costs to enhance the value of hosting arrangements, which are included in Prepaid expenses & other current assets on the Company’s Consolidated Balance Sheets. January 2023 13

Investment Highlights ● Growing lifestyle platform of sub-brands with well-established digitally-led omnichannel business ● Multiple revenue growth opportunities led through five strategic pillars ● Strategic investments support long-term EBITDA margin expansion ● Generating positive cash flow with a strong balance sheet January 2023 14

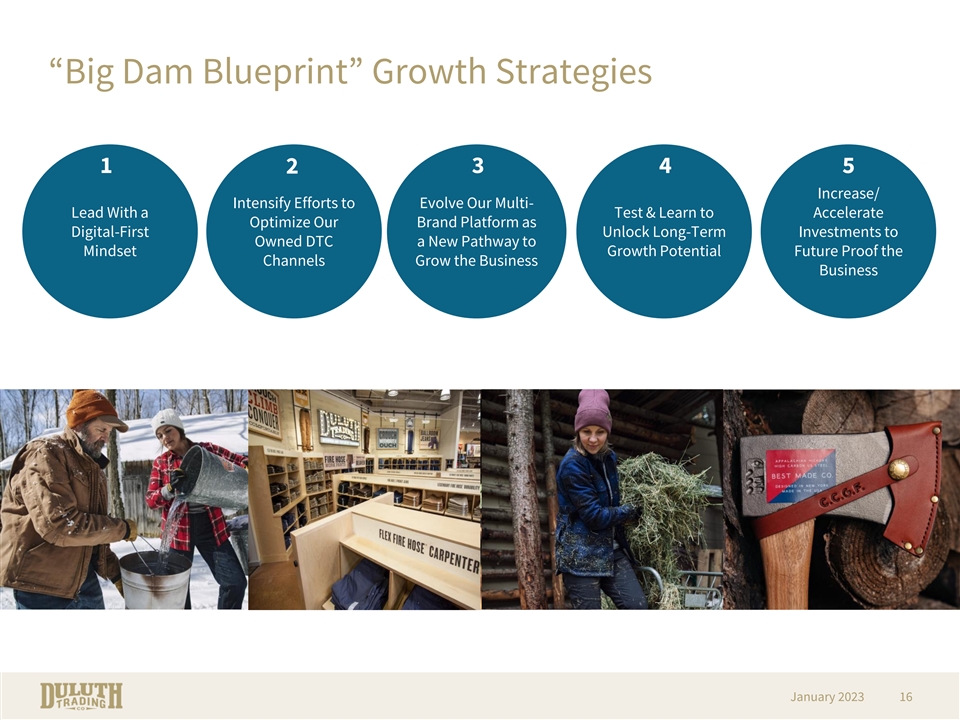
“Big Dam Blueprint” Growth Strategies 1 2 3 4 5 Increase/ Intensify Efforts to Evolve Our Multi- Lead With a Test & Learn to Accelerate Optimize Our Brand Platform as Digital-First Unlock Long-Term Investments to Owned DTC a New Pathway to Mindset Growth Potential Future Proof the Channels Grow the Business Business January 2023 16

1 2 3 4 5 Lead With a Digital-First Mindset ● Transform Duluth into a digitally-led organization integrating data and digital technology into all areas of our business, fundamentally changing how we operate and deliver value to customers ● Our digital transformation will provide the structure for how we prioritize our short, mid, and long-term efforts, investments, and overall operations of the business ● We will deepen relationships and build brand loyalty with our customer primarily through digital experiences ● Focus on more active, personalized engagement achieved through leveraging first-party data and one-on-one communication based on customer preferences, informed by data that is shared by customers throughout the value exchange cycle ● We will digitally enable operations to stay competitive, improve efficiency and deliver value creating results January 2023 17

1 2 3 4 5 Intensify Efforts to Optimize Our Owned DTC Channels ● Increase our focus and investments in our direct channel as our primary growth vehicle ● Our customer places a high value on our stores and they will continue to serve as a critical piece of the omnichannel ecosystem: ○ Convenient touchpoint for services like buy online pick-up in store/curbside, ship to store, and returns & exchanges ○ Stores play an important role in servicing business needs, such as online fulfillment ● We are conducting research to better inform our future store decisions including location and size: ○ Market research will provide better insight into the size and composition of markets and the opportunity to capture share ○ Identify what the store of the future should look like at Duluth to best serve the needs of our customers and deliver sustainable growth and profitability ● Refine store “selling & service” model to drive continuous improvements in key KPI’s January 2023 18
1 2 3 4 5 Evolve our Multi-brand Platform as a New Pathway to Grow the Business ● Ladder to the Greater Purpose: “Celebrating the can-do spirit by enabling anyone who takes on life with their own two hands.” ● Focus on features, benefits, durability, innovation and a strong value proposition ● Prioritize size inclusivity; understand how our customer likes clothes to fit ● Focus on provocative, break-through marketing in each sub-brand through media channels consumed by the target customer January 2023 19
1 2 3 4 5 Test & Learn to Unlock Long-term Growth Potential ● Gain operational learnings to implement wholesale opportunities including logistics, systems and people needed to scale efficiently ● Gain direct-from-manufacturer operational learnings to offer unique and customized products based on customer’s preferences ● Test the viability of potential drop-ship model ● Seek compelling partnerships with brands that share common threads with Duluth Trading portfolio sub-brands January 2023 20
1 2 3 4 5 Increase and, in Some Areas, Accelerate Investments to Future Proof the Business ● Analyze and identify investments that will allow us to scale more easily and effectively, as well as deliver on ever-evolving customer expectations: ○ Increased investments in automation across our logistics network to strengthen our supply chain resilience and increasing speed from click to door ○ Further investments in technology to improve overall operations, generate positive impact and sustainable returns ○ Enhance our multi-brand platform to support growth through multiple sub- brands, and seamlessly integrate new brands into the portfolio ○ Attract talent, skillsets, and expertise needed to scale the business January 2023 21

THANK YOU

Appendix Reconciliation to 2022 Adjusted EBITDA and Free Cash Flow Adjusted EBITDA Free Cash Flow 3 Months Ended 9 Months Ended 9 Months Ended October October October October October October ($ in millions) ($ in millions) 30, 2022 31, 2021 30, 2022 31, 2021 30, 2022 31, 2021 Net cash provided by operating Net Income $(6.2) $2.8 $(5.2) $12.2 $(51.0) $32.8 activities (+) Depreciation and Purchases of property and 7.6 7.3 22.9 21.8 (24.2) (9.1) amortization equipment (+) Amortization of internal- Free Cash Flow (non-GAAP) $(75.3) $23.7 use software hosting 0.8 0.5 2.2 1.3 subscription implementation costs (+) Interest expense 1.0 0.9 2.7 3.4 (+) Income tax expense (2.1) 0.9 (1.8) 4.0 EBITDA $1.0 $12.4 $20.9 $42.7 (+) Stock based 0.7 0.6 2.0 1.6 compensation Adjusted EBITDA $1.7 $13.0 $22.9 $44.3 January 2023 23