
Exhibit 99.2 Investor Presentation Third Quarter 2024 December 5, 2024
Disclaimer Forward-Looking Statements This presentation dated December 5, 2024 includes “forward-looking statements” within the meaning of the Private Securities Litigation Reform Act of 1995. All statements, other than statements of historical facts included in this press release, including statements concerning Duluth Trading's plans, objectives, goals, beliefs, business strategies, future events, business conditions, its results of operations, financial position and its business outlook, business trends and certain other information herein including statements under the heading “Fiscal 2024 Year to Date and Financial Guidance” are forward-looking statements. You can identify forward-looking statements by the use of words such as “may,” ”might,” “will,” “should,” “expect,” “plan,” “anticipate,” “could,” “believe,” “estimate,” “project,” “target,” “predict,” “intend,” “future,” “budget,” “goals,” “potential,” “continue,” “design,” “objective,” “forecasted,” “would” and other similar expressions. The forward-looking statements are not historical facts, and are based upon Duluth Trading's current expectations, beliefs, estimates, and projections, and various assumptions, many of which, by their nature, are inherently uncertain and beyond Duluth Trading's control. Duluth Trading's expectations, beliefs and projections are expressed in good faith, and Duluth Trading believes there is a reasonable basis for them. However, there can be no assurance that management's expectations, beliefs, estimates, and projections will be achieved and actual results may vary materially from what is expressed in or indicated by the forward-looking statements. Forward-looking statements are subject to risks and uncertainties that could cause actual performance or results to differ materially from those expressed in the forward-looking statements, including, among others, the risks, uncertainties, and factors set forth under Part 1, Item 1A “Risk Factors” in the Company’s Annual Report on Form 10-K filed with the SEC on March 22, 2024 and other factors as may be periodically described in Duluth Trading’s subsequent filings with the SEC. These risks and uncertainties include, but are not limited to, the following: the impact of inflation and measures to control inflation on our results of operations; the prolonged effects of economic uncertainties on store and website traffic and disruptions to our distribution network, supply chains and operations; failure to effectively manage inventory levels; our ability to maintain and enhance a strong brand and sub-brand image; adapting to declines in consumer confidence, inflation and decreases in consumer spending; disruptions in our e-commerce platform; effectively adapting to new challenges associated with our expansion into new geographic markets; our ability to meet customer delivery time expectations; natural disasters, unusually adverse weather conditions, boycotts, prolonged public health crises, epidemics or pandemics and unanticipated events; generating adequate cash from our existing stores and direct sales to support our growth; the impact of changes in corporate tax regulations and sales tax; identifying and responding to new and changing customer preferences; the success of the locations in which our stores are located; effectively relying on sources for merchandise located in foreign markets; transportation delays and interruptions, including port congestion; inability to timely and effectively obtain shipments of products from our suppliers and deliver merchandise to our customers; the inability to maintain the performance of a maturing store portfolio; our inability to deploy marketing tactics to strengthen brand awareness and attract new customers in a cost effective manner; our ability to successfully open new stores; competing effectively in an environment of intense competition; our ability to adapt to significant changes in sales due to the seasonality of our business; price reductions or inventory shortages resulting from failure to purchase the appropriate amount of inventory in advance of the season in which it will be sold; the potential for further increases in price and availability of raw materials; our dependence on third-party vendors to provide us with sufficient quantities of merchandise at acceptable prices; the susceptibility of the price and availability of our merchandise to international trade conditions; failure of our vendors and their manufacturing sources to use acceptable labor or other practices; our dependence upon key executive management or our inability to hire or retain the talent required for our business; increases in costs of fuel or other energy, transportation or utility costs and in the costs of labor and employment; failure of our information technology systems to support our current and growing business, before and after our planned upgrades; disruptions in our supply chain and fulfillment centers; our inability to protect our trademarks or other intellectual property rights; infringement on the intellectual property of third parties; acts of war, terrorism or civil unrest; the impact of governmental laws and regulations and the outcomes of legal proceedings; changes in U.S. and non-U.S. laws affecting the importation and taxation of goods, including imposition of unilateral tariffs on imported goods; our ability to secure the personal and/or financial information of our customers and employees; our ability to comply with the security standards for the credit card industry; our failure to maintain adequate internal controls over our financial and management systems; acquisition, disposition, and development risks; and other factors that may be disclosed in our SEC filings or otherwise. Forward-looking statements speak only as of the date the statements are made. Duluth Trading assumes no obligation to update forward-looking statements to reflect actual results, subsequent events or circumstances or other changes affecting forward-looking information except to the extent required by applicable securities laws. December 5, 2024 2
Disclaimer Non-GAAP Measurements Management believes that non-GAAP financial measures may be useful in certain instances to provide additional meaningful comparisons between current results and results in prior operating periods. Within this presentation, reference is made to adjusted earnings before interest, taxes, depreciation and amortization (EBITDA) and Free Cash Flow. See Appendix Table “Adjusted EBITDA,” for a reconciliation of net income to EBITDA and EBITDA to Adjusted EBITDA and “Free Cash Flow” for a reconciliation of Net cash provided by operating activities to Free Cash Flow. Adjusted EBITDA is a metric used by management and frequently used by the financial community, which provides insight into an organization’s operating trends and facilitates comparisons between peer companies, since interest, taxes, depreciation and amortization can differ greatly between organizations as a result of differing capital structures and tax strategies. Adjusted EBITDA excludes certain items, such as stock-based compensation. Management believes Free Cash Flow is a useful measure of performance as an indication of an organization’s financial strength and provides additional perspective on the ability to efficiently use capital in executing growth strategies. Free Cash Flow is used to facilitate a comparison of operating performance on a consistent basis from period- to-period and the ability to generate cash. Free Cash Flow is defined as net cash provided by operating activities less purchase of property and equipment and capital contributions towards build-to-suit stores. The Company provides this information to investors to assist in comparisons of past, present and future operating results and to assist in highlighting the results of on-going operations. While the Company’s management believes that non-GAAP measurements are useful supplemental information, such adjusted results are not intended to replace the Company’s GAAP financial results and should be read in conjunction with those GAAP results. December 5, 2024 3

OUR GREATER PURPOSE “Celebrating the can-do spirit by enabling anyone who takes on life with their own two hands.” OUR MISSION STATEMENT “We build high-quality, solution-based products for work, play and every day. We craft our raw materials – unique brands, durable products, standout customer service, and a No Bull Guarantee – into industry-leading consumer experiences. Job done right means we never forget that “there’s gotta be a better way.”

Secret Sauce Better Brands A brood of sub-brands all bonded by the belief that you can accomplish anything that you put your own mind and own two hands to Better Innovation Long, colorful history of product innovation and solution-based design Better Marketing Distinctive marketing made to break through the clutter and drive buying Better Customer Experiences Outstanding and engaging customer experience December 5, 2024 6

FINANCIAL REVIEW
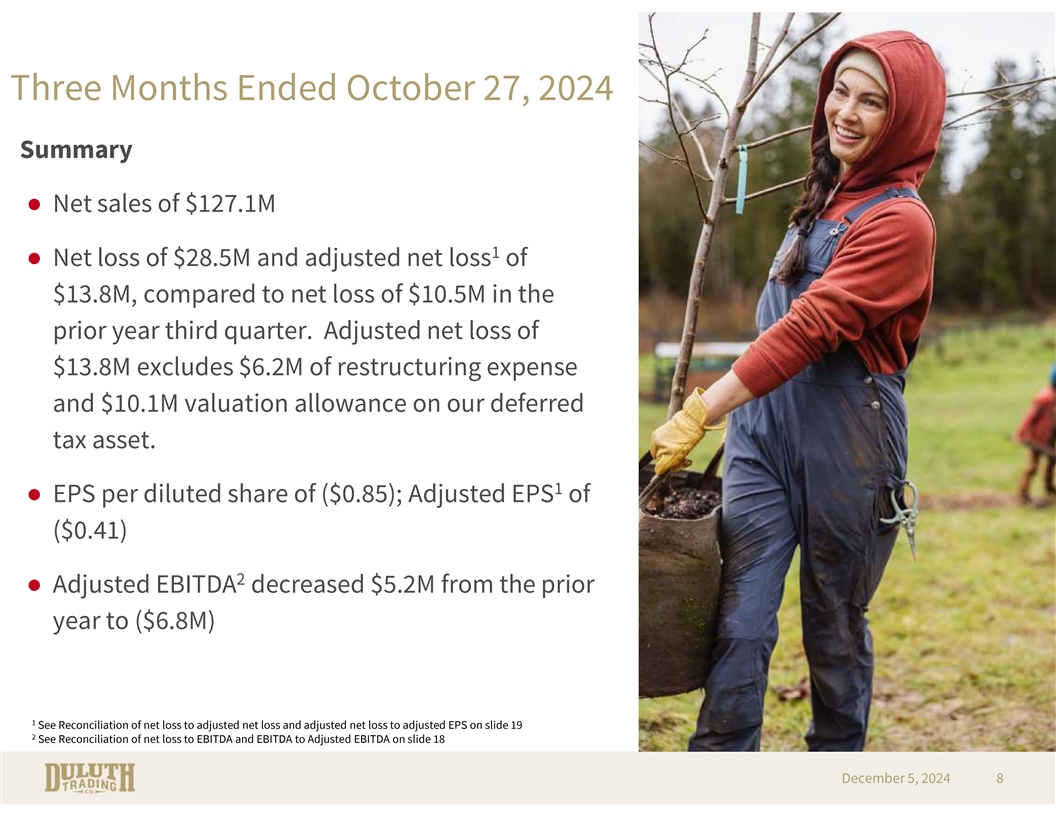
Three Months Ended October 27, 2024 Summary ● Net sales of $127.1M 1 ● Net loss of $28.5M and adjusted net loss of $13.8M, compared to net loss of $10.5M in the prior year third quarter. Adjusted net loss of $13.8M excludes $6.2M of restructuring expense and $10.1M valuation allowance on our deferred tax asset. 1 ● EPS per diluted share of ($0.85); Adjusted EPS of ($0.41) 2 ● Adjusted EBITDA decreased $5.2M from the prior year to ($6.8M) 1 See Reconciliation of net loss to adjusted net loss and adjusted net loss to adjusted EPS on slide 19 2 See Reconciliation of net loss to EBITDA and EBITDA to Adjusted EBITDA on slide 18 December 5, 2024 8

Three Months Ended October 27, 2024 (8.1%) $138.2 (4.3%) $127.1 $69 $51 $66 $47 $87 $(10) $80 $(2) $(14) $(7) 2023 2024 2023 2024 2023 2024 2023 2024 (10/29/2023) (10/27/2024) (10/29/2023) (10/27/2024) (10/29/2023) (10/27/2024) (10/29/2023) (10/27/2024) Retail Direct 1,2 3,4 Net Sales Gross Profit Adjusted EBITDA Adjusted Net Loss ($ in millions) ($ in millions) ($ in millions) ($ in millions) 1 Adjusted to reflect the add-back of stock compensation, restructuring, and sales tax expenses. 2 See Reconciliation of net loss to EBITDA and EBITDA to Adjusted EBITDA on slide 18 3 Excludes net income (loss) attributable to noncontrolling interest. 4 See Reconciliation of net loss to adjusted net loss on slide 19 December 5, 2024 9
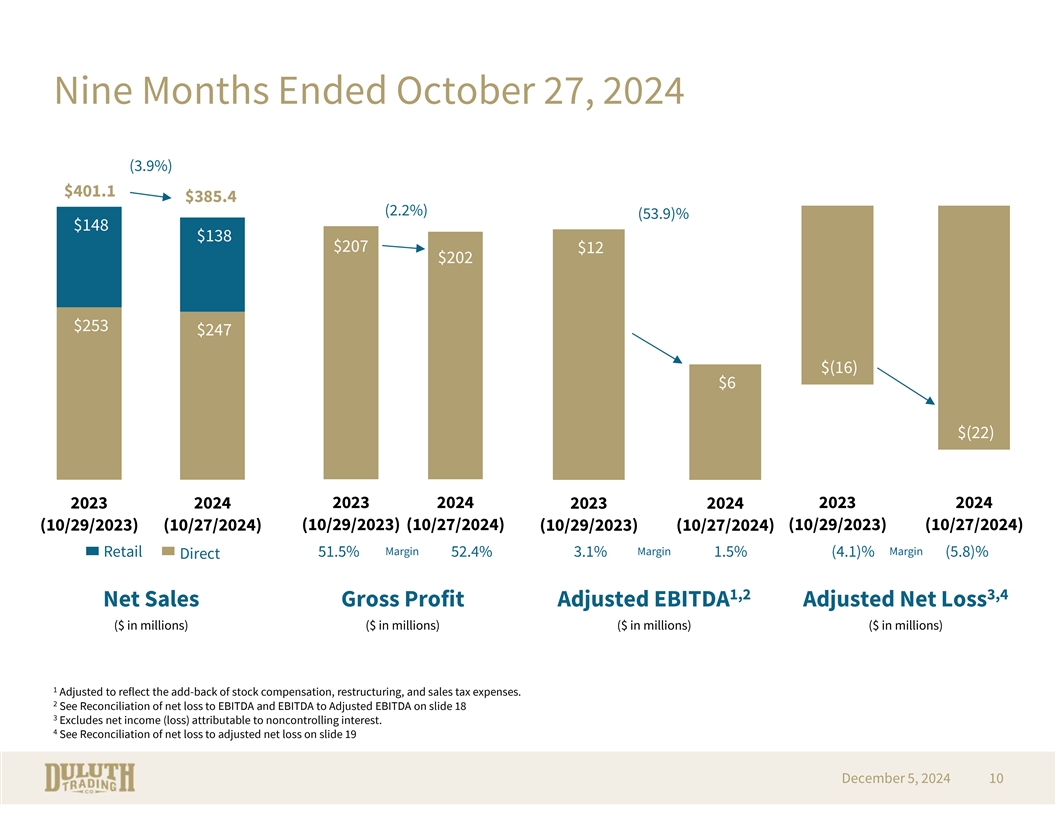
Nine Months Ended October 27, 2024 (3.9%) $401.1 $385.4 (2.2%) (53.9)% $148 $138 $207 $12 $202 $253 $247 $(16) $6 $(22) 2023 2024 2023 2024 2023 2024 2023 2024 (10/29/2023) (10/27/2024) (10/29/2023) (10/27/2024) (10/29/2023) (10/27/2024) (10/29/2023) (10/27/2024) Retail Direct 1,2 3,4 Net Sales Gross Profit Adjusted EBITDA Adjusted Net Loss ($ in millions) ($ in millions) ($ in millions) ($ in millions) 1 Adjusted to reflect the add-back of stock compensation, restructuring, and sales tax expenses. 2 See Reconciliation of net loss to EBITDA and EBITDA to Adjusted EBITDA on slide 18 3 Excludes net income (loss) attributable to noncontrolling interest. 4 See Reconciliation of net loss to adjusted net loss on slide 19 December 5, 2024 10

Strong Balance Sheet, Liquidity and Free Cash Flow 1,2 3 Debt to Capital Free Cash Flow (Nine Months Ended) ($ in millions) As of October 27, 2024 Cash $9.3 Debt: Line of Credit 44.0 Term Loan 0.0 Total Debt 44.0 $(63.9) Total Shareholders’ Equity $185.1 $(71.0) Total Capitalization $229.1 2023 2024 Debt to Capital ratio 19.2% (Oct 29, 2023) (Oct 27, 2024) 1 Debt balances do not include TRI Holdings, LLC, a variable interest entity that is consolidated for reporting purposes 2 The New Credit Agreement matures on July 8, 2027 and provides for borrowings of up to $200.0 million that are available under a revolving senior credit facility. 3 See Reconciliation of Free Cash Flow on slide 18 December 5, 2024 11

Fiscal 2024 Year to Date and Financial Guidance Year to Date (9 Months Ended) Full Year Guidance ($ in millions) ($ in millions) 2023 YTD 2024 YTD 2023 2024 Guidance Net Sales $401.1 $385.4 Net Sales $646.7 $640 (3.9)% (1.0)% Gross 51.5% 52.4% Gross 50.3% 49.0% +90 bps (125) bps Margin % Margin % 1 1 SG&A % 56.1% 59.0% SG&A % 51.6% 52.4% (290) bps (80) bps 2 CAPEX $43.8 $13.4 CAPEX $53.2 ~$23 1 2 2024 SG&A % excludes the impact of a $2.4M sales tax contingency 2023 and 2024 include $6.7M and ~$11M, respectively, of additional investments in implementation costs to enhance the value of hosting arrangements, which are included in Prepaid expenses & other current assets on the Company’s Consolidated Balance Sheets. December 5, 2024 12

Net Sales and Adjusted EBITDA 1 Net Sales Adjusted EBITDA ($ in millions) ($ in millions) 77 699 653 647 639 616 55 568 52 52 44 33 2018 2019 2020 2021 2022 2023 2018 2019 2020 2021 2022 2023 1 Adjusted to reflect the add-back of stock compensation expense. December 5, 2024 13
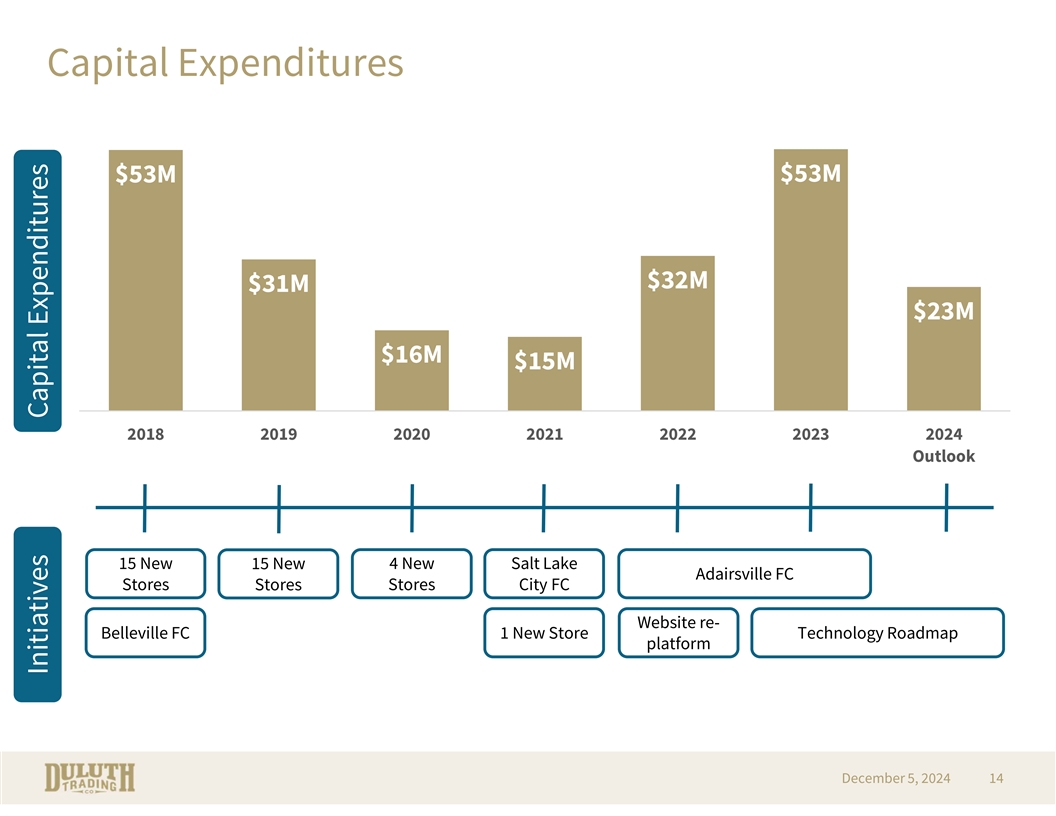
Capital Expenditures $53M $53M $32M $31M $23M $16M $15M 2018 2019 2020 2021 2022 2023 2024 Outlook 15 New 15 New 4 New Salt Lake Adairsville FC Stores Stores Stores City FC Website re- Belleville FC 1 New Store Technology Roadmap platform December 5, 2024 14 Initiatives Capital Expenditures

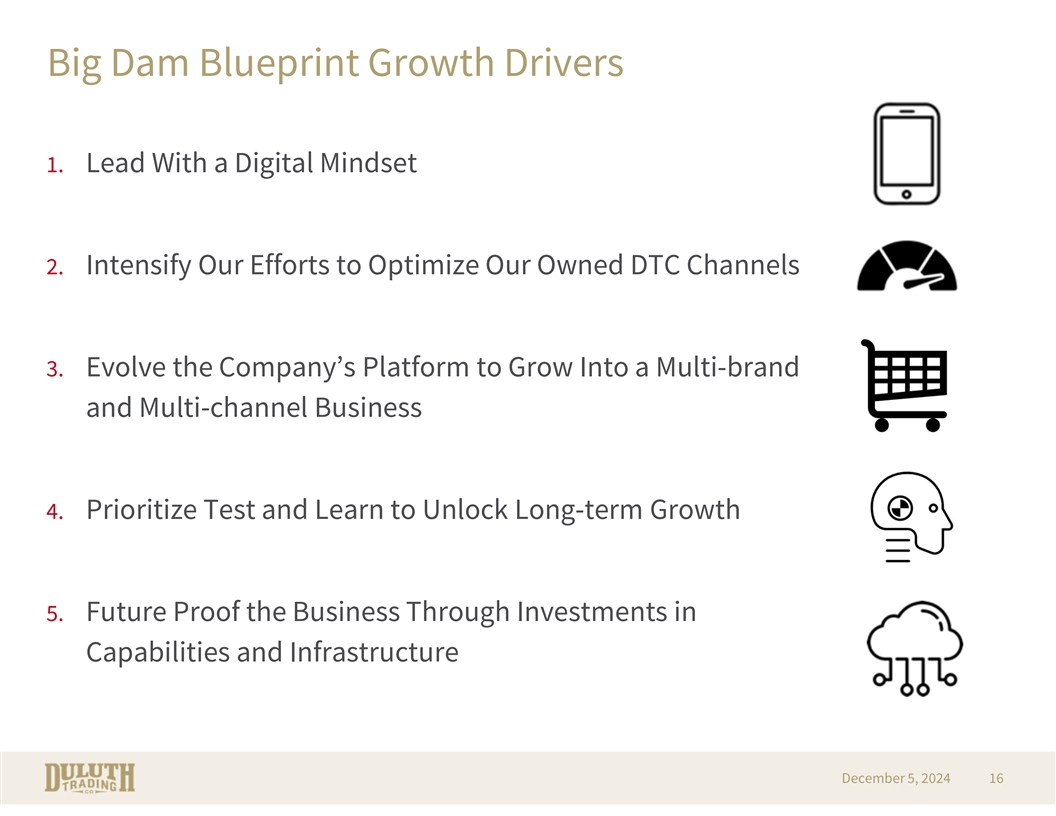
Big Dam Blueprint Growth Drivers 1. Lead With a Digital Mindset 2. Intensify Our Efforts to Optimize Our Owned DTC Channels 3. Evolve the Company’s Platform to Grow Into a Multi-brand and Multi-channel Business 4. Prioritize Test and Learn to Unlock Long-term Growth 5. Future Proof the Business Through Investments in Capabilities and Infrastructure December 5, 2024 16

THANK YOU

Appendix Reconciliation to 2024 Adjusted EBITDA and Free Cash Flow Adjusted EBITDA Free Cash Flow 3 Months Ended 9 Months Ended 9 Months Ended Oct 27, Oct 29, Oct 27, Oct 29, Oct 27, Oct 29, ($ in millions) ($ in millions) 2024 2023 2024 2023 2024 2023 Net cash used in operating Net loss $(28.5) $(10.5) $(40.1) $(16.4) $(58.1) $(31.0) activities (+) Depreciation and Purchases of property and 7.3 8.6 23.6 23.4 (5.8) (40.0) amortization equipment (+) Amortization of internal- Free Cash Flow (non-GAAP) $(63.9) $(71.0) use software hosting 1.4 1.2 3.9 3.6 subscription implementation costs (+) Interest expense 1.3 1.2 3.2 3.0 (+) Income tax expense 4.7 (3.1) 1.6 (4.8) (benefit) EBITDA $(13.9) $(2.6) $(7.8) $9.0 (+) Stock based compensation 1.0 1.0 3.4 3.3 (+) Restructuring expenses 6.2 — 7.7 — (+) Sales tax expense accrual — — 2.4 — Adjusted EBITDA $(6.8) $(1.6) $5.7 $12.3 December 5, 2024 18
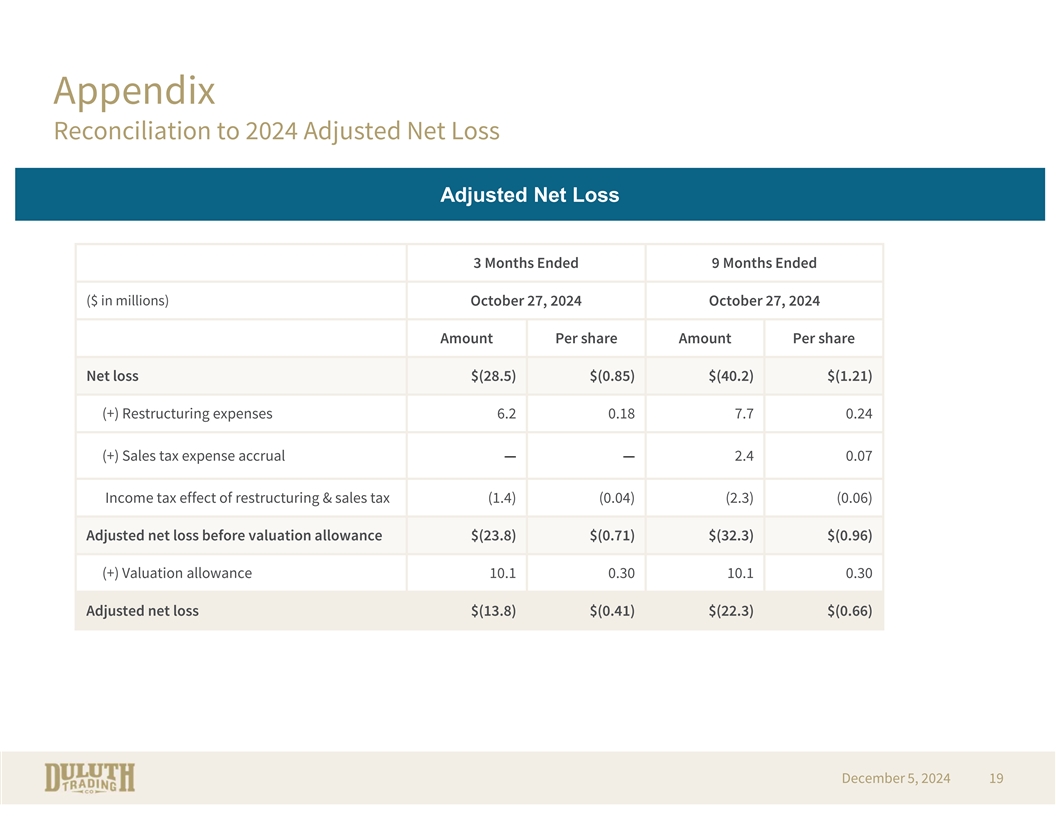
Appendix Reconciliation to 2024 Adjusted Net Loss Adjusted Net Loss 3 Months Ended 9 Months Ended ($ in millions) October 27, 2024 October 27, 2024 Amount Per share Amount Per share Net loss $(28.5) $(0.85) $(40.2) $(1.21) (+) Restructuring expenses 6.2 0.18 7.7 0.24 (+) Sales tax expense accrual — — 2.4 0.07 Income tax effect of restructuring & sales tax (1.4) (0.04) (2.3) (0.06) Adjusted net loss before valuation allowance $(23.8) $(0.71) $(32.3) $(0.96) (+) Valuation allowance 10.1 0.30 10.1 0.30 Adjusted net loss $(13.8) $(0.41) $(22.3) $(0.66) December 5, 2024 19