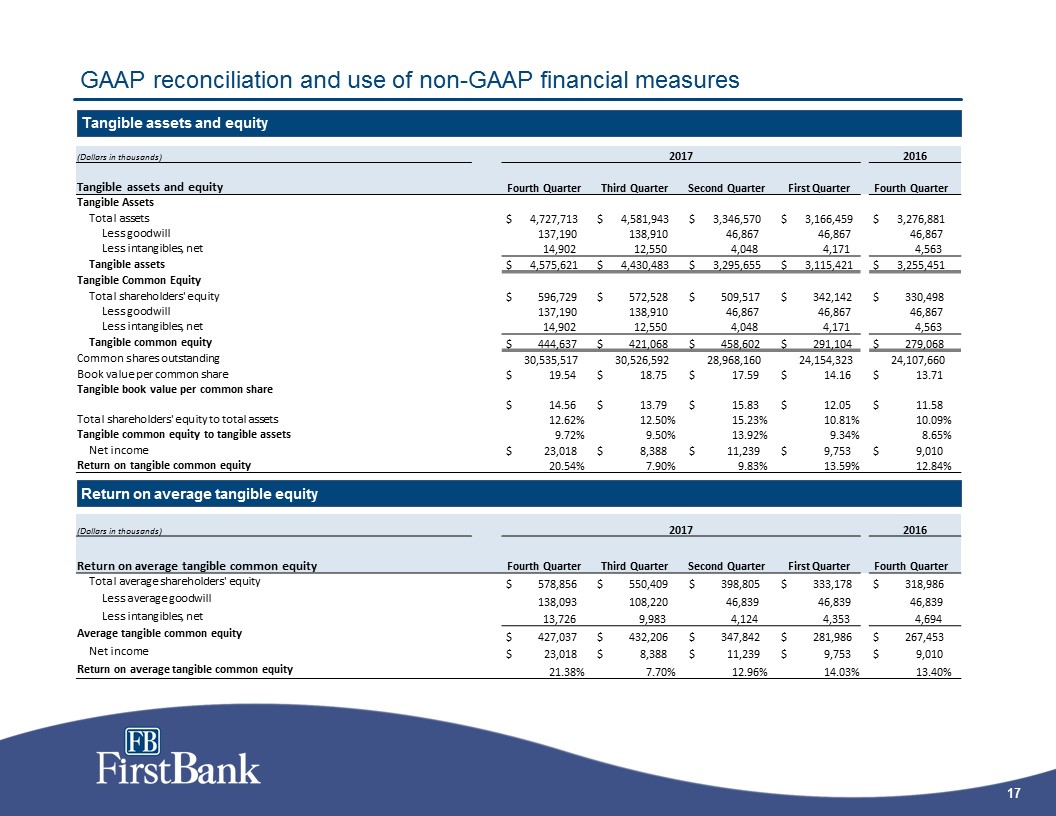
GAAP reconciliation and use of non-GAAP financial measures Tangible assets and equity Return on average tangible equity (Dollars in thousands) 2017 2016 Tangible assets and equity Fourth Quarter Third Quarter Second Quarter First Quarter Fourth Quarter Tangible Assets Total assets $ 4,727,713 $ 4,581,943 $ 3,346,570 $ 3,166,459 $ 3,276,881 Less goodwill 137,190 138,910 46,867 46,867 46,867 Less intangibles, net 14,902 12,550 4,048 4,171 4,563 Tangible assets $ 4,575,621 $ 4,430,483 $ 3,295,655 $ 3,115,421 $ 3,255,451 Tangible Common Equity Total shareholders' equity $ 596,729 $ 572,528 $ 509,517 $ 342,142 $ 330,498 Less goodwill 137,190 138,910 46,867 46,867 46,867 Less intangibles, net 14,902 12,550 4,048 4,171 4,563 Tangible common equity $ 444,637 $ 421,068 $ 458,602 $ 291,104 $ 279,068 Common shares outstanding 30,535,517 30,526,592 28,968,160 24,154,323 24,107,660 Book value per common share $ 19.54 $ 18.75 $ 17.59 $ 14.16 $ 13.71 Tangible book value per common share $ 14.56 $ 13.79 $ 15.83 $ 12.05 $ 11.58 Total shareholders' equity to total assets 12.62% 12.50% 15.23% 10.81% 10.09% Tangible common equity to tangible assets 9.72% 9.50% 13.92% 9.34% 8.65% Net income $ 23,018 $ 8,388 $ 11,239 $ 9,753 $ 9,010 Return on tangible common equity 20.54% 7.90% 9.83% 13.59% 12.84% (Dollars in thousands) 2017 2016 Return on average tangible common equity Fourth Quarter Third Quarter Second Quarter First Quarter Fourth Quarter Total average shareholders' equity $ 578,856 $ 550,409 $ 398,805 $ 333,178 $ 318,986 Less average goodwill 138,093 108,220 46,839 46,839 46,839 Less intangibles, net 13,726 9,983 4,124 4,353 4,694 Average tangible common equity $ 427,037 $ 432,206 $ 347,842 $ 281,986 $ 267,453 Net income $ 23,018 $ 8,388 $ 11,239 $ 9,753 $ 9,010 Return on average tangible common equity 21.38% 7.70% 12.96% 14.03% 13.40%