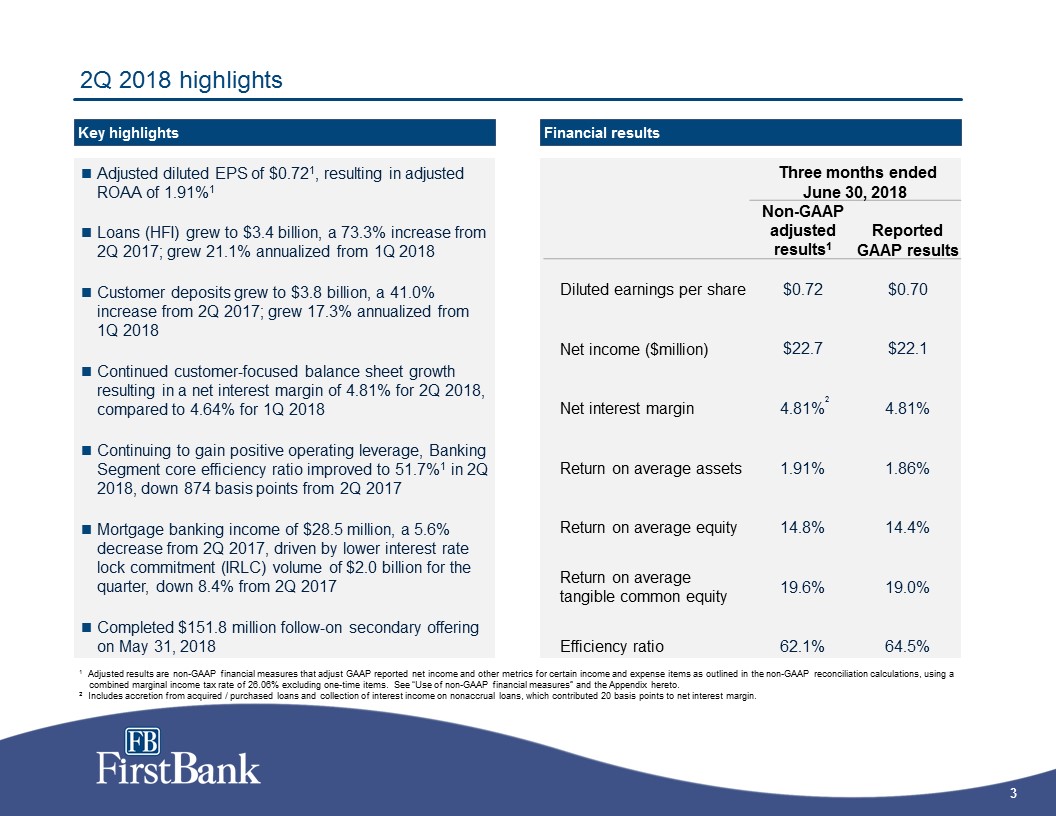
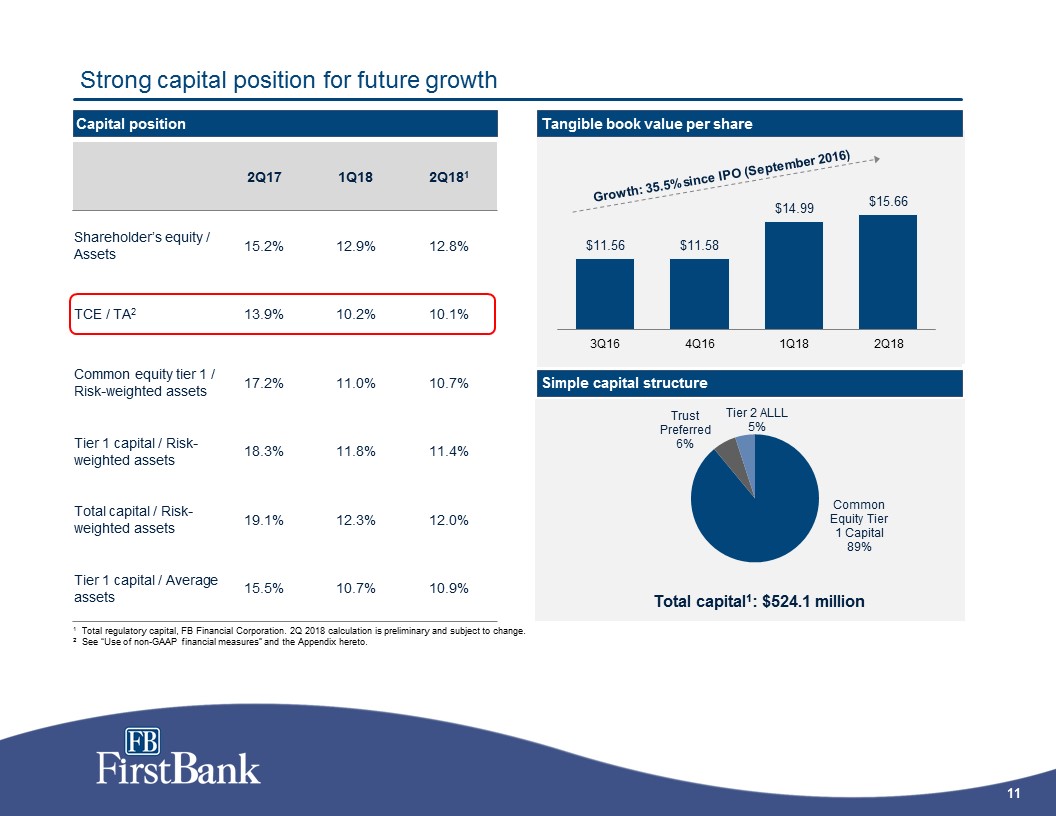
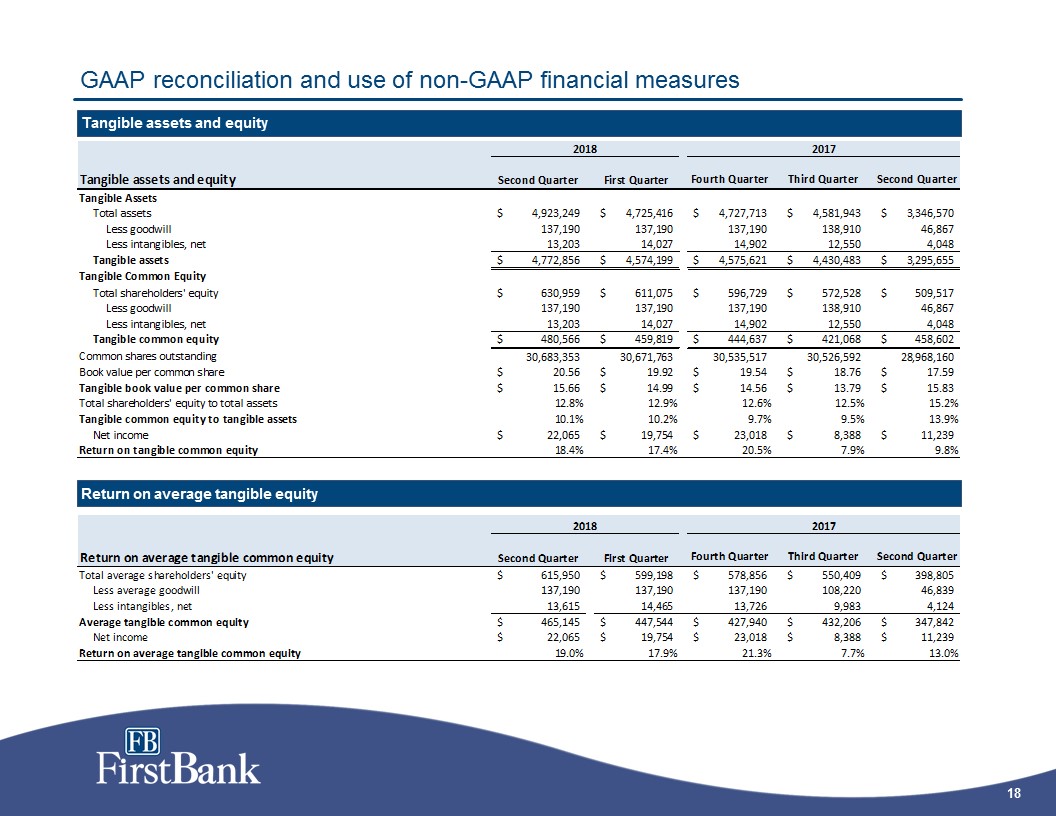
18 GAAP reconciliation and use of non-GAAP financial measures Tangible assets and equity Return on average tangible equity Tangible assets and equity Second Quarter First Quarter Fourth Quarter Third Quarter Second Quarter Tangible Assets Total assets $ 4,923,249 $ 4,725,416 $ 4,727,713 $ 4,581,943 $ 3,346,570 Less goodwill 137,190 137,190 137,190 138,910 46,867 Less intangibles, net 13,203 14,027 14,902 12,550 4,048 Tangible assets $ 4,772,856 $ 4,574,199 $ 4,575,621 $ 4,430,483 $ 3,295,655 Tangible Common Equity Total shareholders' equity $ 630,959 $ 611,075 $ 596,729 $ 572,528 $ 509,517 Less goodwill 137,190 137,190 137,190 138,910 46,867 Less intangibles, net 13,203 14,027 14,902 12,550 4,048 Tangible common equity $ 480,566 $ 459,819 $ 444,637 $ 421,068 $ 458,602 Common shares outstanding 30,683,353 30,671,763 30,535,517 30,526,592 28,968,160 Book value per common share $ 20.56 $ 19.92 $ 19.54 $ 18.76 $ 17.59 Tangible book value per common share $ 15.66 $ 14.99 $ 14.56 $ 13.79 $ 15.83 Total shareholders' equity to total assets 12.8% 12.9% 12.6% 12.5% 15.2% Tangible common equity to tangible assets 10.1% 10.2% 9.7% 9.5% 13.9% Net income $ 22,065 $ 19,754 $ 23,018 $ 8,388 $ 11,239 Return on tangible common equity 18.4% 17.4% 20.5% 7.9% 9.8% 2018 2017 Return on average tangible common equity Second Quarter First Quarter Fourth Quarter Third Quarter Second Quarter Total average shareholders' equity $ 615,950 $ 599,198 $ 578,856 $ 550,409 $ 398,805 Less average goodwill 137,190 137,190 137,190 108,220 46,839 Less intangibles, net 13,615 14,465 13,726 9,983 4,124 Average tangible common equity $ 465,145 $ 447,544 $ 427,940 $ 432,206 $ 347,842 Net income $ 22,065 $ 19,754 $ 23,018 $ 8,388 $ 11,239 Return on average tangible common equity 19.0% 17.9% 21.3% 7.7% 13.0% 2018 2017