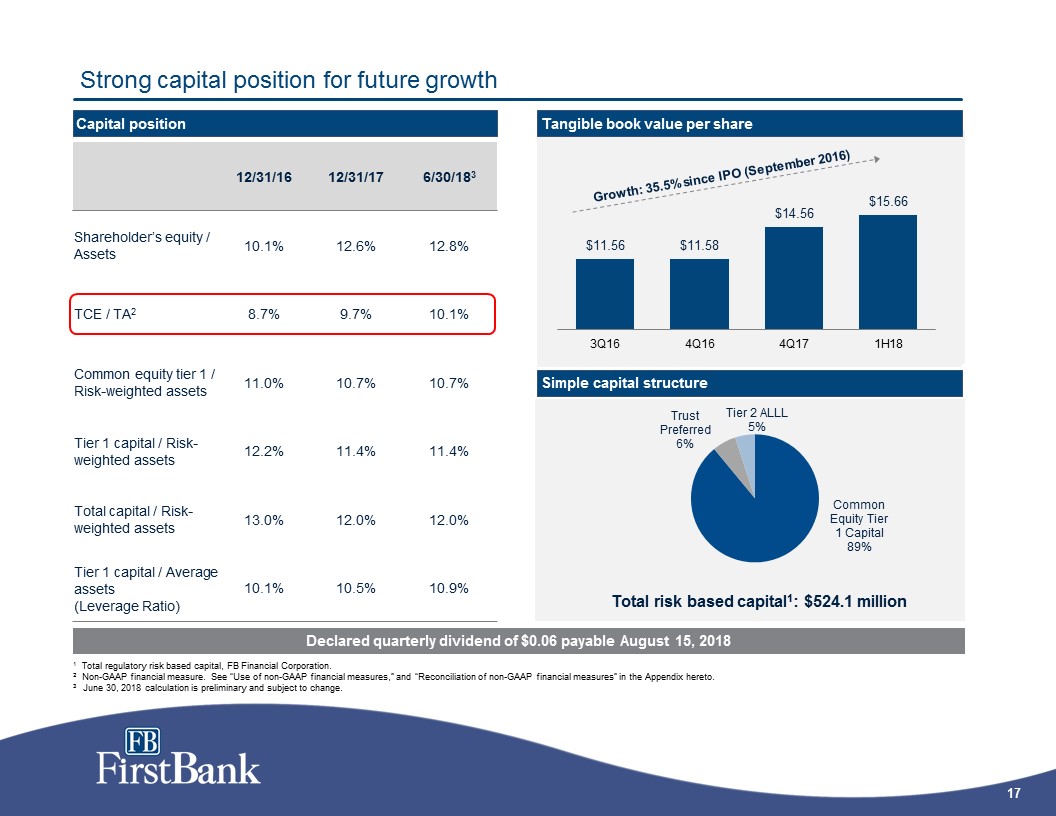
Tangible book value per common share and tangible common equity to tangible assets Reconciliation of non-GAAP financial measures (cont’d) 25 Tangible book value per common share and tangible common equity to tangible assets Reconciliation of non-GAAP financial measures (cont’d) 2017 (Dollars in thousands) Second Quarter First Quarter Fourth Quarter Third Quarter Second Quarter First Quarter Fourth Quarter Third Quarter Tangible Assets Total assets $ 4,923,249 $ 4,725,416 $ 4,727,713 $ 4,581,943 $ 3,346,570 $ 3,166,459 $ 3,276,881 $ 3,187,180 Less goodwill 137,190 137,190 137,190 138,910 46,867 46,867 46,867 46,867 Less intangibles, net 13,203 14,027 14,902 12,550 4,048 4,171 4,563 5,090 Tangible assets $ 5,073,642 $ 4,574,199 $ 4,575,621 $ 4,430,483 $ 3,295,655 $ 3,115,421 $ 3,225,451 $ 3,135,223 Tangible Common Equity Total shareholders' equity $ 630,959 $ 611,075 $ 596,729 $ 572,528 $ 509,517 $ 342,142 $ 330,498 $ 329,108 Less goodwill 137,190 137,190 137,190 138,910 46,867 46,867 46,867 46,867 Less intangibles, net 13,203 14,027 14,902 12,550 4,048 4,171 4,563 5,090 Tangible common equity $ 781,352 $ 459,858 $ 444,637 $ 421,068 $ 458,602 $ 291,104 $ 279,068 $ 277,151 Common shares outstanding 30,683,353 30,671,763 30,535,517 30,526,592 28,968,160 24,154,323 24,107,660 23,975,122 Book value per common share $ 20.56 $ 19.92 $ 19.54 $ 18.76 $ 17.59 $ 14.16 $ 13.71 $ 13.73 Tangible book value per common share $ 15.66 $ 14.99 $ 14.56 $ 13.79 $ 15.83 $ 12.05 $ 11.58 $ 11.56 Total shareholders' equity to total assets 12.8% 12.9% 12.6% 12.5% 15.2% 10.8% 10.1% 10.3% Tangible common equity to tangible assets 10.1% 10.2% 9.7% 9.5% 13.9% 9.3% 8.7% 8.8%