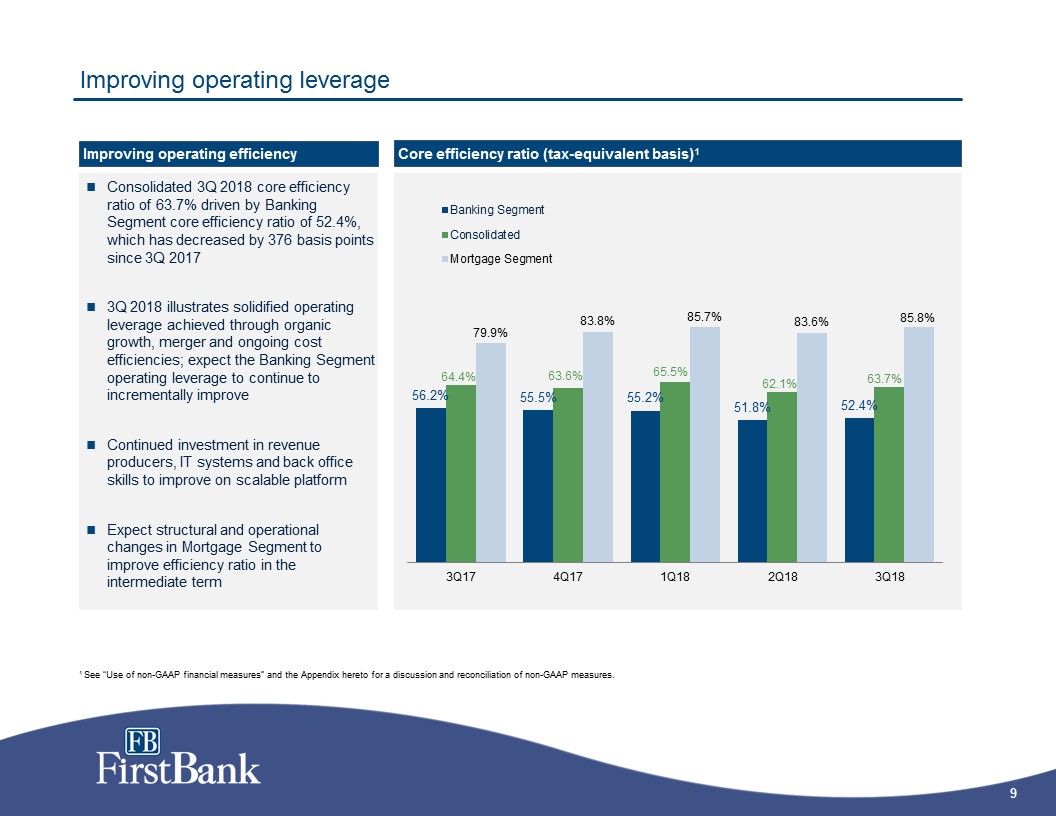
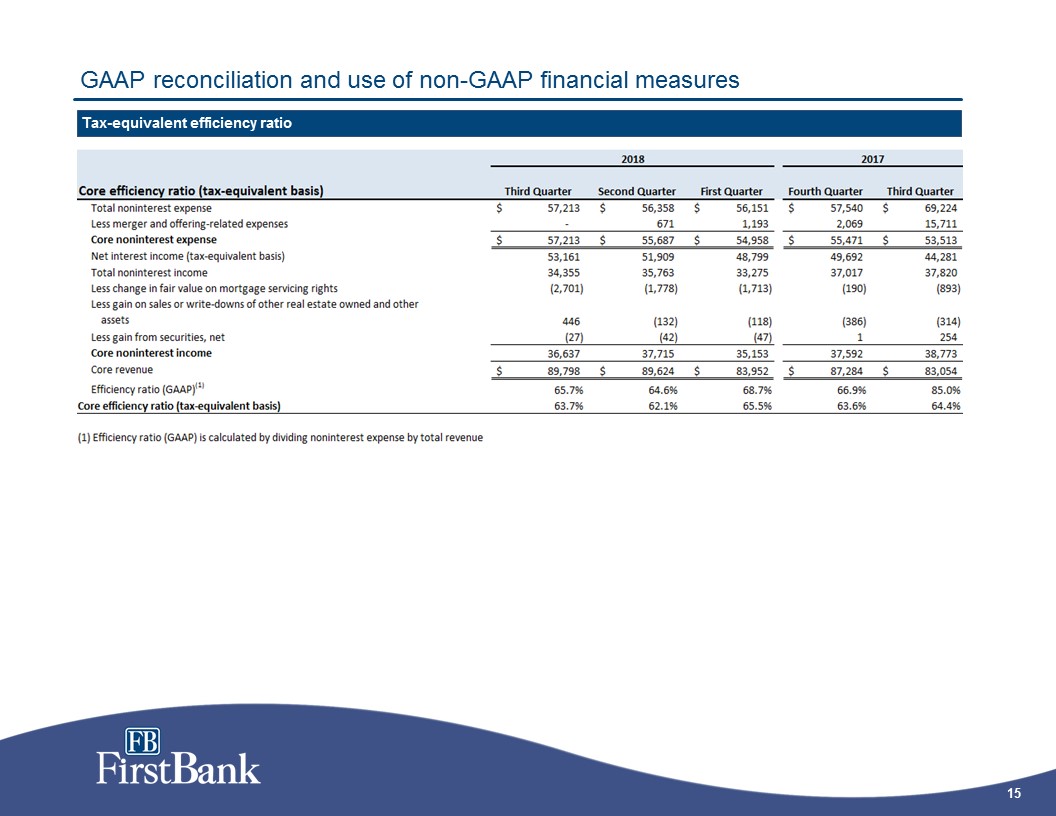
GAAP reconciliation and use of non-GAAP financial measures Segment tax-equivalent efficiency ratio 2018 2017 Banking segment core efficiency ratio (tax equivalent) Third Quarter Second Quarter First Quarter Fourth Quarter Third Quarter Core consolidated noninterest expense $ 57,213 $ 55,687 $ 54,958 $ 55,471 $ 53,513 Less Mortgage segment noninterest expense 18,821 19,582 18,910 20,117 19,757 Add loss on sale of mortgage servicing rights - - - - - Adjusted Banking segment noninterest expense 38,392 36,105 36,048 35,354 33,756 Adjusted core revenue 89,798 89,624 83,952 87,284 83,054 Less Mortgage segment noninterest income 19,232 21,650 20,363 23,825 23,836 Less change in fair value on mortgage servicing rights (2,701) (1,778) (1,713) (190) (893) Adjusted Banking segment total revenue $ 73,267 $ 69,752 $ 65,302 $ 63,649 $ 60,111 Banking segment core efficiency ratio (tax-equivalent basis) 52.4% 51.8% 55.2% 55.5% 56.2% Mortgage segment core efficiency ratio (tax equivalent) Consolidated noninterest expense $ 57,213 $ 56,358 $ 56,151 $ 57,540 $ 69,224 Less loss on sale of mortgage servicing rights - - - - - Less Banking segment noninterest expense 38,392 36,721 37,241 37,423 49,467 Adjusted Mortgage segment noninterest expense $ 18,821 $ 19,637 $ 18,910 $ 20,117 $ 19,757 Total noninterest income 34,355 35,763 33,275 37,017 37,820 Less Banking segment noninterest income 15,123 14,058 12,912 13,192 13,984 Less change in fair value on mortgage servicing rights (2,701) (1,778) (1,713) (190) (893) Adjusted Mortgage segment total revenue $ 21,933 $ 23,483 $ 22,076 $ 24,015 $ 24,729 Mortgage segment core efficiency ratio (tax-equivalent basis) 85.8% 83.6% 85.7% 83.8% 79.9%