Exhibit 99.3

First Quarter 2019 Earnings Presentation April 23, 2019
This presentation contains “forward-looking statements” within the meaning of Section 27A of the Securities Act of 1933, as amended, and Section 21E of the Securities Exchange Act of 1934, as amended, that have been made pursuant to the safe harbor provisions of the Private Securities Litigation Reform Act of 1995. You can identify these forward-looking statements in some cases through the use of words such as “believes,” “anticipates,” “expects,” “may,” “will,” “assumes,” “should,” “predicts,” “could,” “would,” “intends,” “targets,” “estimates,” “projects,” “plans,” “potential” and other similar words and expressions of the future or otherwise regarding the proposed acquisition, including the timing, anticipated benefits and financial impact thereof, and the outlook for our future business and financial performance.These forward-looking statements include, without limitation, statements relating to FB Financial’s assets, business, cash flows, condition (financial or otherwise), credit quality, financial performance, liquidity, short and long-term performance goals, prospects, results of operations, strategic initiatives and the timing, benefits, as well as statements relating to the anticipated benefits and financial impact of FB Financial’s mortgage segment restructuring and the acquisition by FirstBank of the Atlantic Capital branches, including: acceptance by the customers of the acquired Atlantic Capital branches of FB Financial’s products and services, the opportunities to enhance market share in certain markets, market acceptance of FB Financial generally in new markets, expectations regarding future investment in the acquired Atlantic Capital branches’ markets and the integration of the acquired Atlantic Capital branches’ operations, disposition, and other growth opportunities. Forward-looking statements are based on the information known to, and current beliefs and expectations of, FB Financial’s management and are subject to significant risks and uncertainties. Actual results may differ materially from those contemplated by such forward-looking statements. A number of important factors could cause actual results to differ materially from those contemplated by the forward-looking statements in this presentation including, without limitation: FB Financial's ability to achieve the anticipated benefits and cost synergies of the mortgage segment restructuring, the parties’ ability to meet expectations regarding the accounting and tax treatment of the Atlantic Capital acquisition; the possibility that any of the anticipated benefits of the Atlantic Capital acquisition will not be fully realized or will not be realized within the expected time period; the risk that integration of the acquired Atlantic Capital branches’ operations with those of FB Financial or will be more costly than expected; the effect of the announcement of the closing of the Atlantic Capital acquisition on employee and customer relationships and operating results (including, without limitation, difficulties in maintaining relationships with employees and customers); general competitive, economic, political and market conditions and fluctuations; and the other risk factors set forth in our December 31, 2018 Form 10-K, filed with the Securities and Exchange Commission on March 12, 2019, under the captions “Cautionary note regarding forward-looking statements” and “Risk factors”. Many of these factors are difficult to foresee and are beyond our ability to control or predict. We believe the forward-looking statements contained herein are reasonable; however, undue reliance should not be placed on any forward-looking statements, which are based on current expectations and speak only as of the date that they are made. We do not assume any obligation to update any forward-looking statements as a result of new information, future developments or otherwise, except as otherwise may be required by law. Forward looking statements
Use of non-GAAP financial measures This presentation contains certain financial measures that are not measures recognized under U.S. generally accepted accounting principles (“GAAP”) and therefore are considered non-GAAP financial measures. These non‐GAAP financial measures include, without limitation, adjusted net income, adjusted diluted earnings per share, adjusted pro forma net income, adjusted pro forma diluted earnings per share, core noninterest expense, core revenue, core noninterest income, core efficiency ratio (tax-equivalent basis), banking segment core efficiency ratio (tax-equivalent basis), mortgage segment core efficiency ratio (tax-efficiency basis), adjusted mortgage contribution, adjusted return on average assets and equity. Each of these non-GAAP metrics excludes certain income and expense items that the Company’s management considers to be non‐core/adjusted in nature. The Company refers to these non‐GAAP measures as adjusted or core measures. The corresponding Earnings Release also presents tangible assets, tangible common equity, tangible book value per common share, tangible common equity to tangible assets, return on tangible common equity, return on average tangible common equity, adjusted return on average assets, adjusted return on average equity, adjusted return on average tangible common equity, pro forma return on average assets and equity, pro forma adjusted return on average assets and equity. Each of these non-GAAP metrics excludes the impact of goodwill and other intangibles.The Company’s management uses these non-GAAP financial measures in their analysis of the Company’s performance, financial condition and the efficiency of its operations as management believes such measures facilitate period-to-period comparisons and provide meaningful indications of its operating performance as they eliminate both gains and charges that management views as non-recurring or not indicative of operating performance. Management believes that these non-GAAP financial measures provide a greater understanding of ongoing operations and enhance comparability of results with prior periods as well as demonstrating the effects of significant non-core gains and charges in the current and prior periods. The Company’s management also believes that investors find these non-GAAP financial measures useful as they assist investors in understanding the Company’s underlying operating performance and in the analysis of ongoing operating trends. In addition, because intangible assets such as goodwill and other intangibles, and the other items excluded each vary extensively from company to company, the Company believes that the presentation of this information allows investors to more easily compare the Company’s results to the results of other companies. However, the non-GAAP financial measures discussed herein should not be considered in isolation or as a substitute for the most directly comparable or other financial measures calculated in accordance with GAAP. Moreover, the manner in which the Company calculates the non-GAAP financial measures discussed herein may differ from that of other companies reporting measures with similar names. You should understand how such other banking organizations calculate their financial measures similar or with names similar to the non-GAAP financial measures the Company has discussed herein when comparing such non-GAAP financial measures. The following tables provide a reconciliation of these measures to the most directly comparable GAAP financial measures.
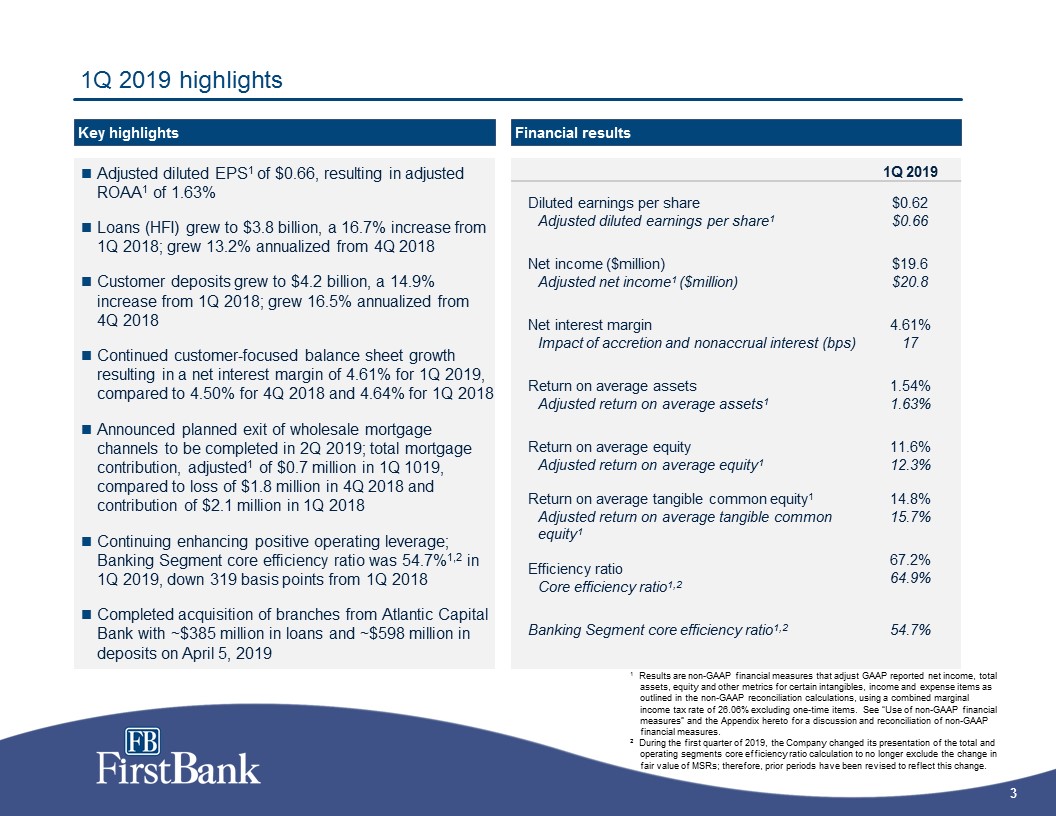
1Q 2019 Diluted earnings per shareAdjusted diluted earnings per share1 $0.62$0.66 Net income ($million)Adjusted net income1 ($million) $19.6$20.8 Net interest marginImpact of accretion and nonaccrual interest (bps) 4.61%17 Return on average assets Adjusted return on average assets1 1.54%1.63% Return on average equityAdjusted return on average equity1 11.6%12.3% Return on average tangible common equity1Adjusted return on average tangible common equity1 14.8%15.7% Efficiency ratioCore efficiency ratio1,2 67.2%64.9% Banking Segment core efficiency ratio1,2 54.7% 1Q 2019 highlights Key highlights Financial results 1 Results are non-GAAP financial measures that adjust GAAP reported net income, total assets, equity and other metrics for certain intangibles, income and expense items as outlined in the non-GAAP reconciliation calculations, using a combined marginal income tax rate of 26.06% excluding one-time items. See “Use of non-GAAP financial measures” and the Appendix hereto for a discussion and reconciliation of non-GAAP financial measures.2 During the first quarter of 2019, the Company changed its presentation of the total and operating segments core efficiency ratio calculation to no longer exclude the change in fair value of MSRs; therefore, prior periods have been revised to reflect this change. Adjusted diluted EPS1 of $0.66, resulting in adjusted ROAA1 of 1.63%Loans (HFI) grew to $3.8 billion, a 16.7% increase from 1Q 2018; grew 13.2% annualized from 4Q 2018Customer deposits grew to $4.2 billion, a 14.9% increase from 1Q 2018; grew 16.5% annualized from 4Q 2018Continued customer-focused balance sheet growth resulting in a net interest margin of 4.61% for 1Q 2019, compared to 4.50% for 4Q 2018 and 4.64% for 1Q 2018Announced planned exit of wholesale mortgage channels to be completed in 2Q 2019; total mortgage contribution, adjusted1 of $0.7 million in 1Q 1019, compared to loss of $1.8 million in 4Q 2018 and contribution of $2.1 million in 1Q 2018Continuing enhancing positive operating leverage; Banking Segment core efficiency ratio was 54.7%1,2 in 1Q 2019, down 319 basis points from 1Q 2018Completed acquisition of branches from Atlantic Capital Bank with ~$385 million in loans and ~$598 million in deposits on April 5, 2019
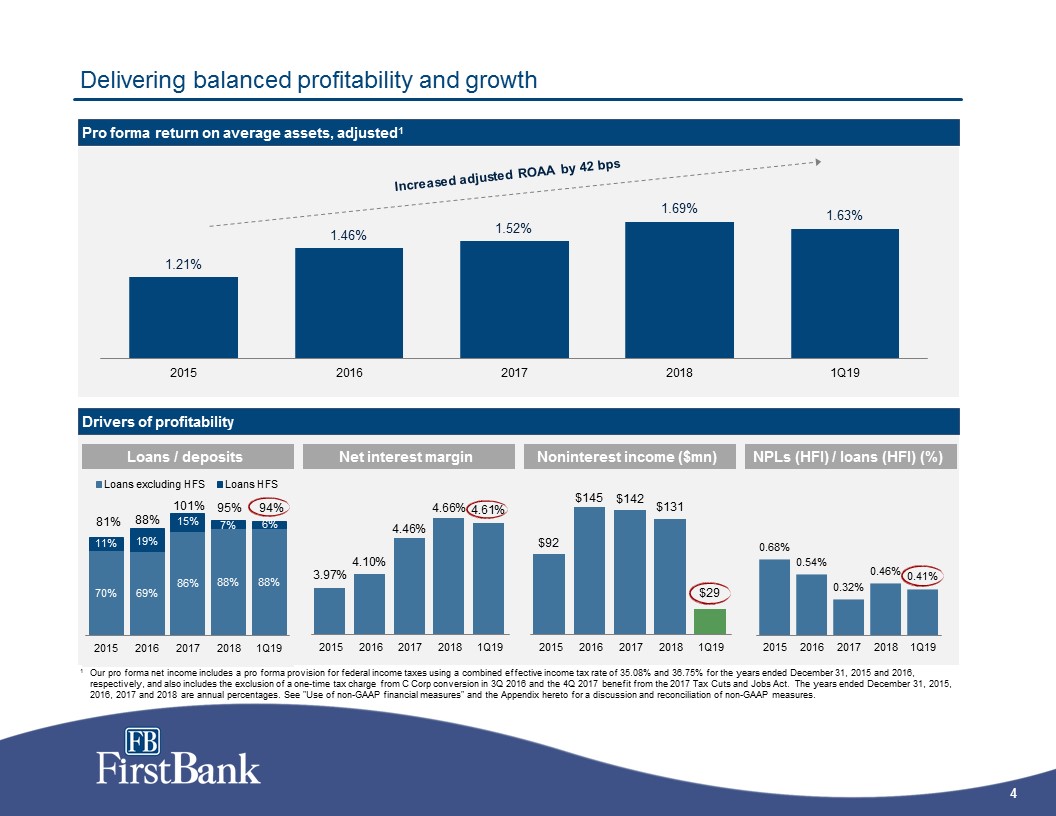
Delivering balanced profitability and growth Drivers of profitability Pro forma return on average assets, adjusted1 Net interest margin Noninterest income ($mn) Loans / deposits 1 Our pro forma net income includes a pro forma provision for federal income taxes using a combined effective income tax rate of 35.08% and 36.75% for the years ended December 31, 2015 and 2016, respectively, and also includes the exclusion of a one-time tax charge from C Corp conversion in 3Q 2016 and the 4Q 2017 benefit from the 2017 Tax Cuts and Jobs Act. The years ended December 31, 2015, 2016, 2017 and 2018 are annual percentages. See "Use of non-GAAP financial measures" and the Appendix hereto for a discussion and reconciliation of non-GAAP measures. NPLs (HFI) / loans (HFI) (%)
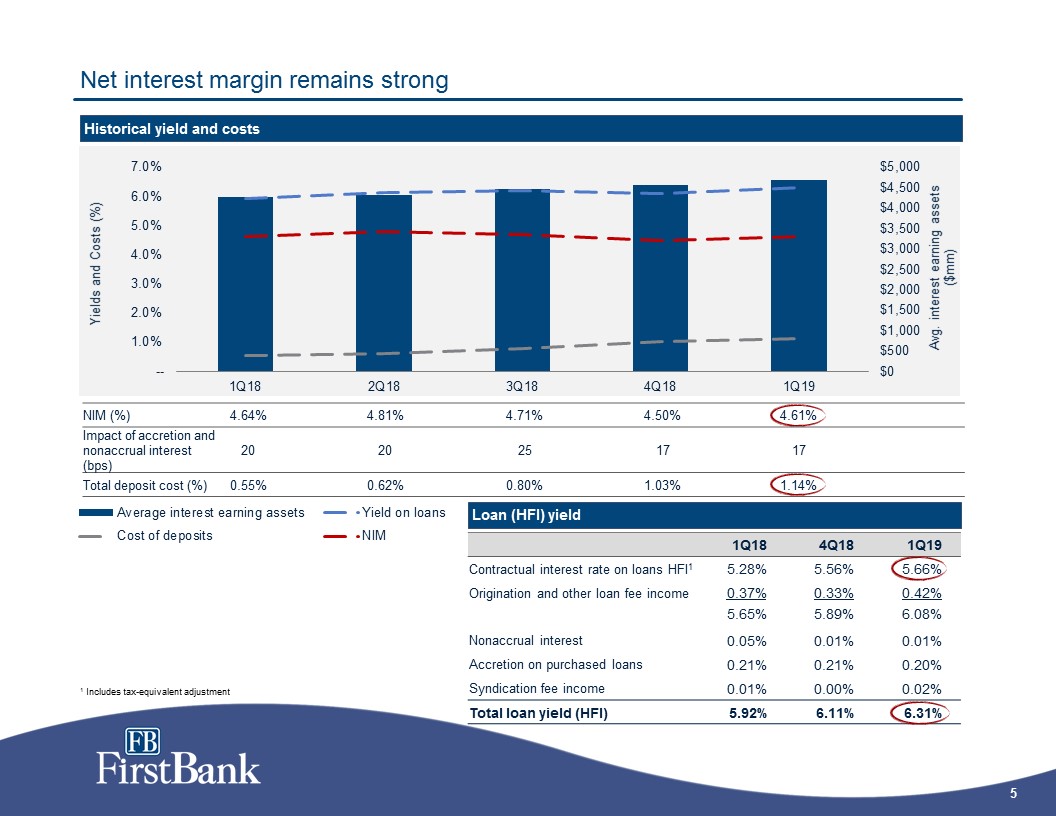
Net interest margin remains strong Historical yield and costs 1 Includes tax-equivalent adjustment Loan (HFI) yield 1Q18 4Q18 1Q19 Contractual interest rate on loans HFI1 5.28% 5.56% 5.66% Origination and other loan fee income 0.37% 0.33% 0.42% 5.65% 5.89% 6.08% Nonaccrual interest 0.05% 0.01% 0.01% Accretion on purchased loans 0.21% 0.21% 0.20% Syndication fee income 0.01% 0.00% 0.02% Total loan yield (HFI) 5.92% 6.11% 6.31% NIM (%) 4.64% 4.81% 4.71% 4.50% 4.61% Impact of accretion and nonaccrual interest (bps) 20 20 25 17 17 Total deposit cost (%) 0.55% 0.62% 0.80% 1.03% 1.14%
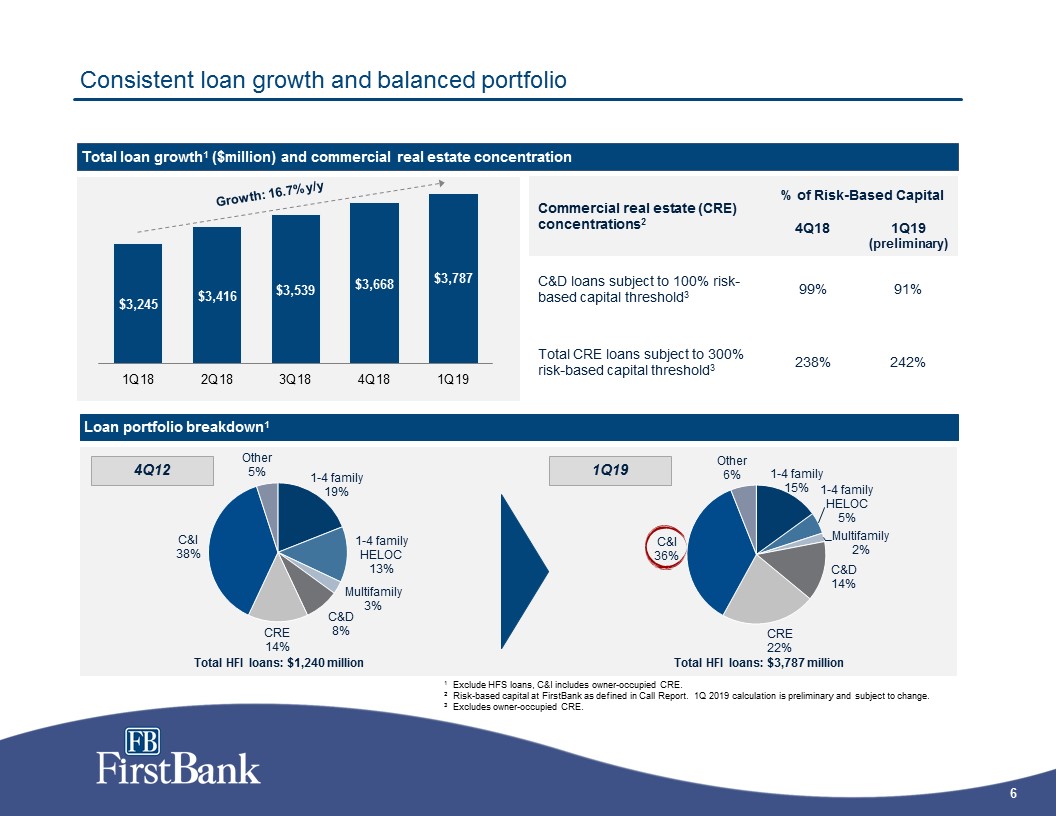
Consistent loan growth and balanced portfolio Total loan growth1 ($million) and commercial real estate concentration Loan portfolio breakdown1 4Q12 1Q19 Total HFI loans: $3,787 million 1 Exclude HFS loans, C&I includes owner-occupied CRE.2 Risk-based capital at FirstBank as defined in Call Report. 1Q 2019 calculation is preliminary and subject to change.3 Excludes owner-occupied CRE. Commercial real estate (CRE) concentrations2 % of Risk-Based Capital 4Q18 1Q19(preliminary) C&D loans subject to 100% risk-based capital threshold3 99% 91% Total CRE loans subject to 300% risk-based capital threshold3 238% 242%
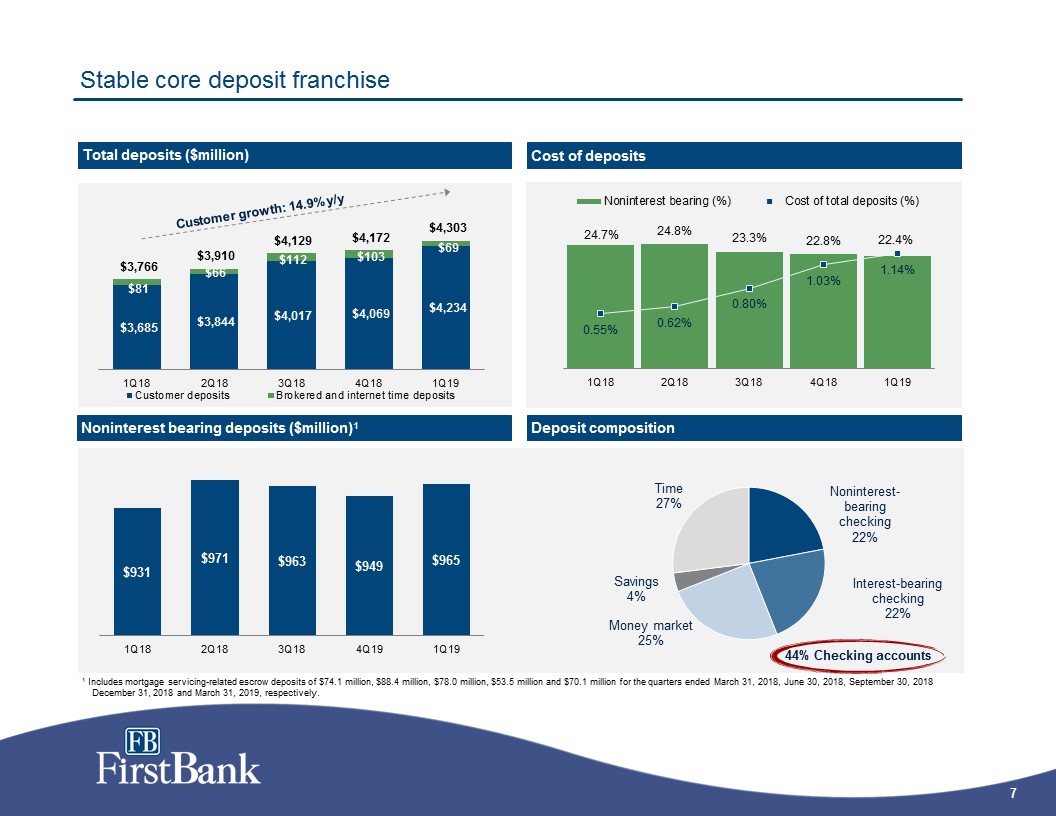
Stable core deposit franchise Total deposits ($million) 1 Includes mortgage servicing-related escrow deposits of $74.1 million, $88.4 million, $78.0 million, $53.5 million and $70.1 million for the quarters ended March 31, 2018, June 30, 2018, September 30, 2018 December 31, 2018 and March 31, 2019, respectively. Noninterest bearing deposits ($million)1 Deposit composition Cost of deposits Customer growth: 14.9% y/y
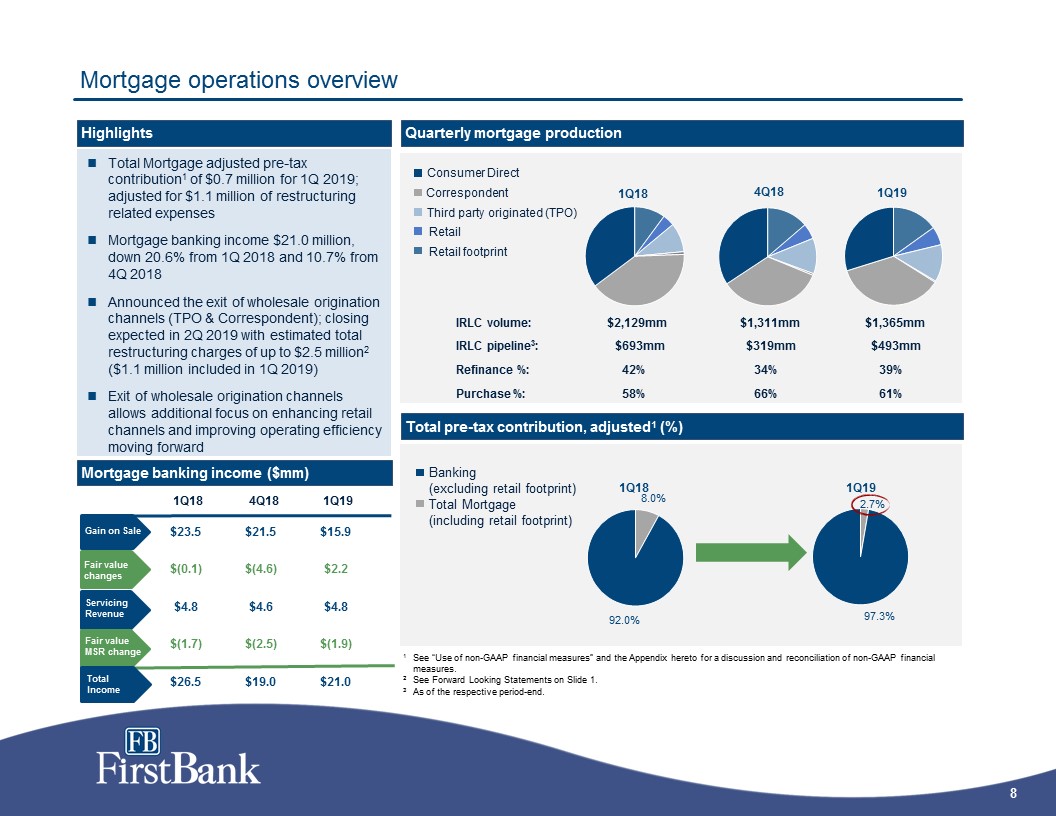
$23.5 $21.5 $15.9 $(0.1) $(4.6) $2.2 $4.8 $4.6 $4.8 $(1.7) $(2.5) $(1.9) $26.5 $19.0 $21.0 Mortgage operations overview Total Mortgage adjusted pre-tax contribution1 of $0.7 million for 1Q 2019; adjusted for $1.1 million of restructuring related expensesMortgage banking income $21.0 million, down 20.6% from 1Q 2018 and 10.7% from 4Q 2018Announced the exit of wholesale origination channels (TPO & Correspondent); closing expected in 2Q 2019 with estimated total restructuring charges of up to $2.5 million2 ($1.1 million included in 1Q 2019)Exit of wholesale origination channels allows additional focus on enhancing retail channels and improving operating efficiency moving forward Highlights Gain on Sale Quarterly mortgage production Consumer Direct Correspondent Third party originated (TPO) Retail Retail footprint 1Q18 4Q18 1Q19 Fair value changes Fair value MSR change Mortgage banking income ($mm) Servicing Revenue Total Income $2,129mm $1,311mm IRLC volume: $1,365mm IRLC pipeline3: $693mm $319mm $493mm Refinance %: 42% 34% 39% Purchase %: 58% 66% 61% 1 See “Use of non-GAAP financial measures” and the Appendix hereto for a discussion and reconciliation of non-GAAP financial measures.2 See Forward Looking Statements on Slide 1.3 As of the respective period-end. Total pre-tax contribution, adjusted1 (%) Total Mortgage (including retail footprint) Banking (excluding retail footprint)
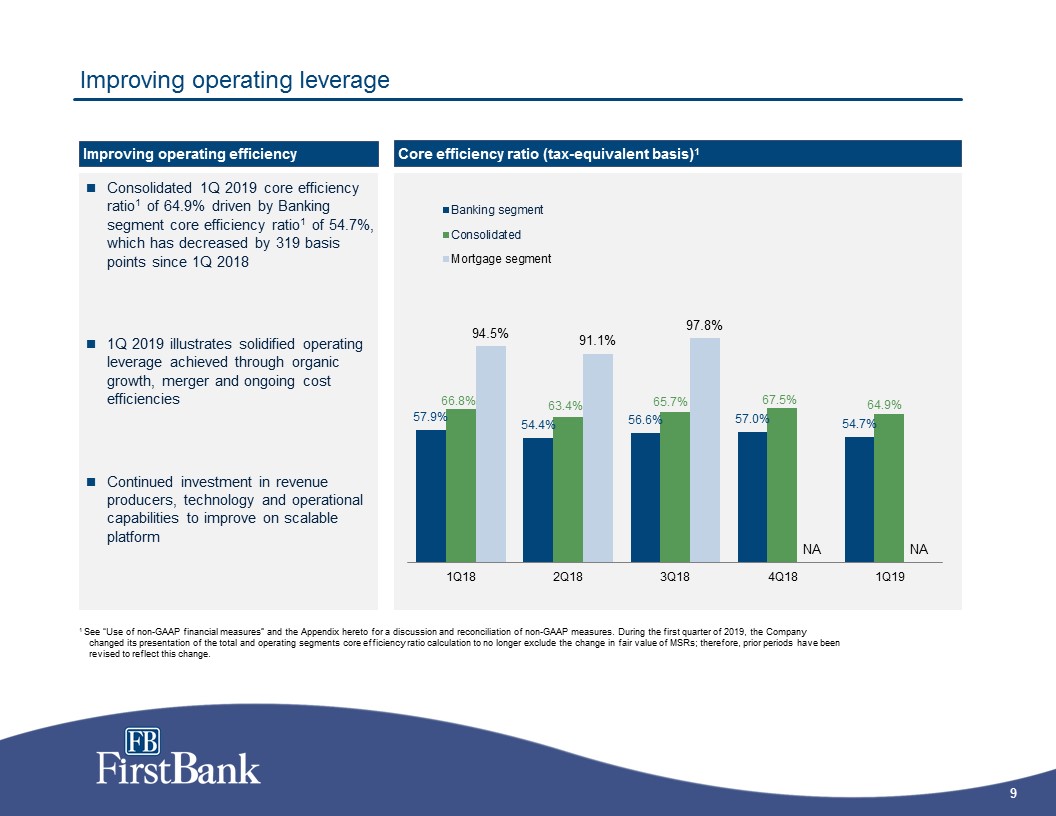
Improving operating leverage Consolidated 1Q 2019 core efficiency ratio1 of 64.9% driven by Banking segment core efficiency ratio1 of 54.7%, which has decreased by 319 basis points since 1Q 2018 1Q 2019 illustrates solidified operating leverage achieved through organic growth, merger and ongoing cost efficienciesContinued investment in revenue producers, technology and operational capabilities to improve on scalable platform Core efficiency ratio (tax-equivalent basis)1 Improving operating efficiency 1 See “Use of non-GAAP financial measures” and the Appendix hereto for a discussion and reconciliation of non-GAAP measures. During the first quarter of 2019, the Company changed its presentation of the total and operating segments core efficiency ratio calculation to no longer exclude the change in fair value of MSRs; therefore, prior periods have been revised to reflect this change.
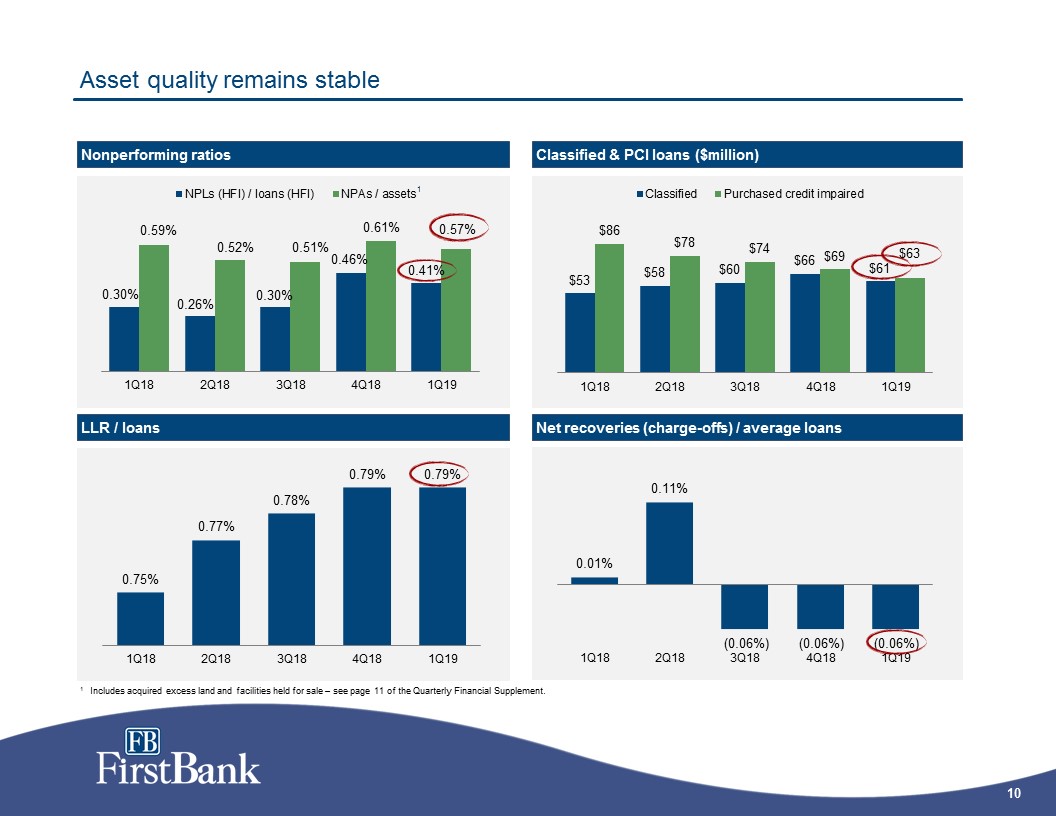
Asset quality remains stable Classified & PCI loans ($million) Net recoveries (charge-offs) / average loans Nonperforming ratios LLR / loans 1 Includes acquired excess land and facilities held for sale – see page 11 of the Quarterly Financial Supplement. 1

Strong capital position for future growth 1 Total regulatory capital, FB Financial Corporation. 1Q 2019 calculation is preliminary and subject to change.2 See “Use of non-GAAP financial measures” and the Appendix hereto for a discussion and reconciliation of non-GAAP measures. Capital position Simple capital structure 1Q18 4Q18 1Q191 Shareholder’s equity / Assets 12.9% 13.1% 13.0% TCE / TA2 10.1% 10.5% 10.5% Common equity tier 1 / Risk-weighted assets 11.0% 11.7% 12.0% Tier 1 capital / Risk-weighted assets 11.8% 12.4% 12.7% Total capital / Risk-weighted assets 12.3% 13.0% 13.4% Tier 1 capital / Average assets 10.7% 11.4% 11.5% Tangible book value per share Growth: 53.4% since IPO (September 2016)

Appendix
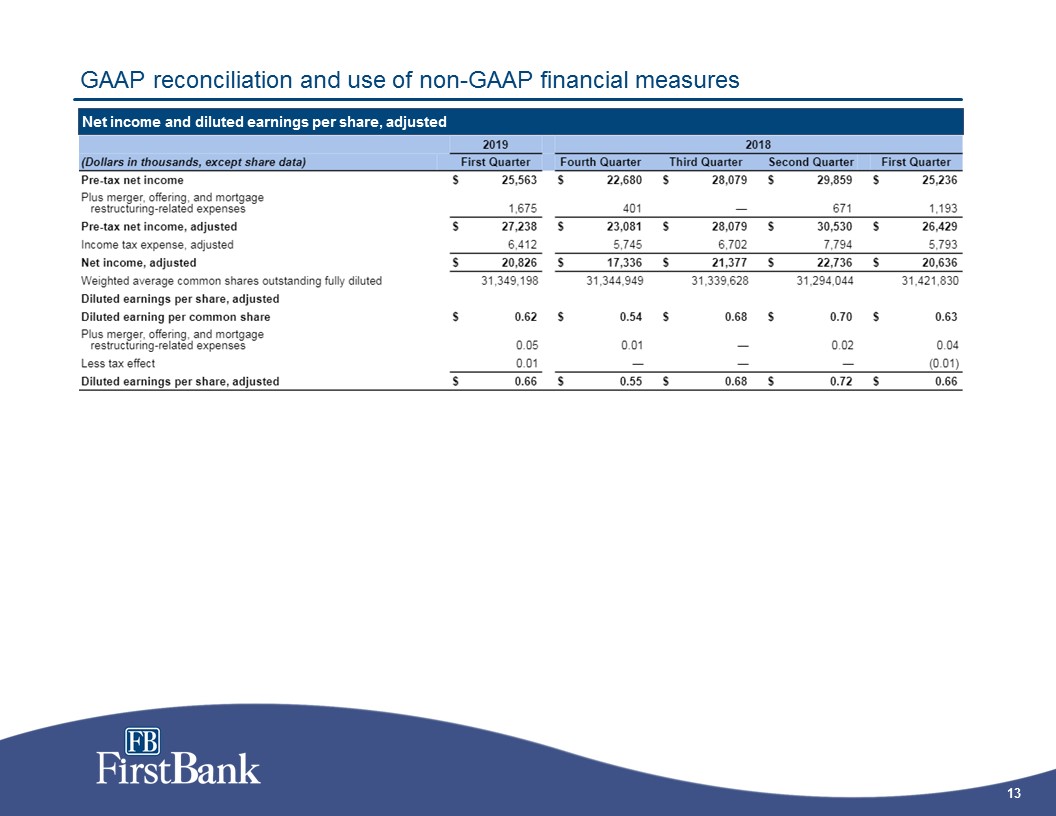
GAAP reconciliation and use of non-GAAP financial measures Net income and diluted earnings per share, adjusted
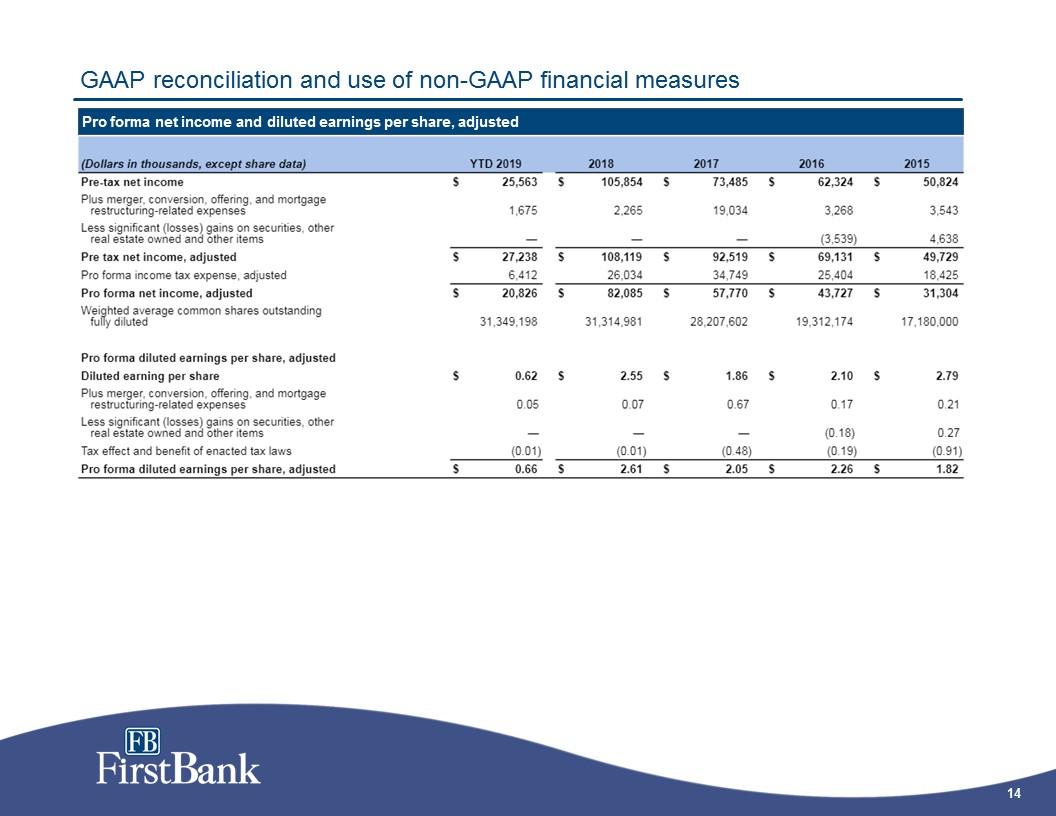
GAAP reconciliation and use of non-GAAP financial measures Pro forma net income and diluted earnings per share, adjusted

GAAP reconciliation and use of non-GAAP financial measures Core efficiency ratio (tax-equivalent basis)(a)
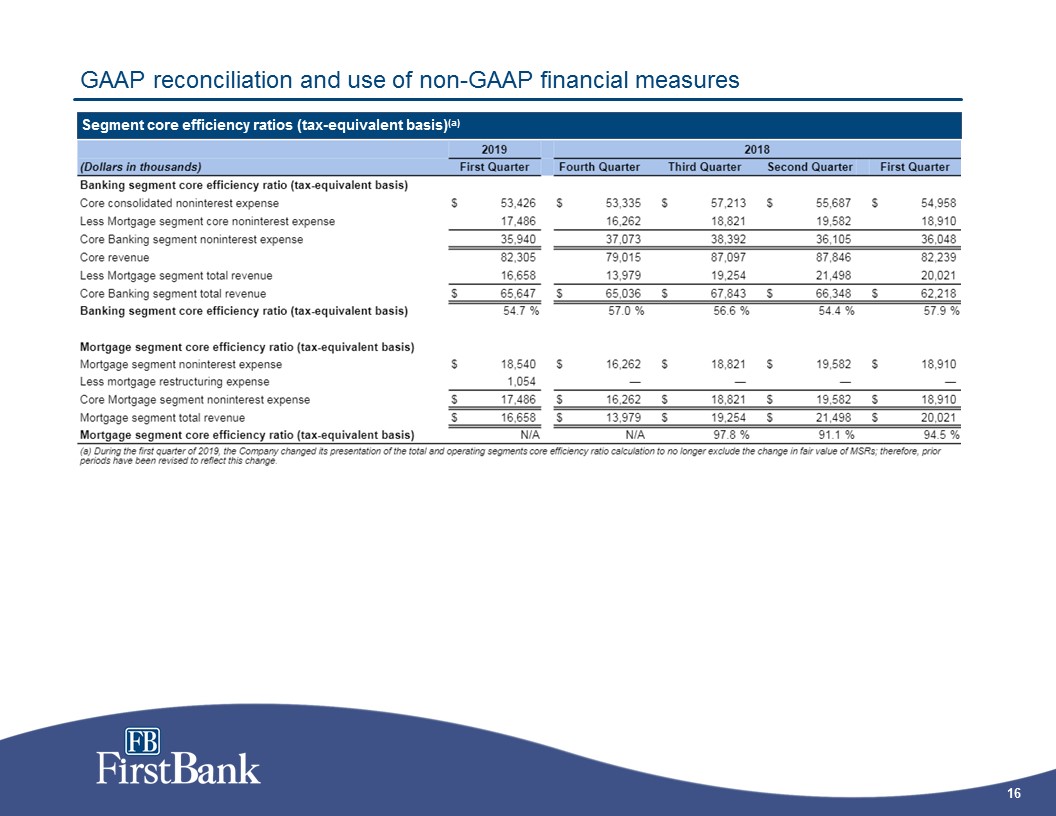
GAAP reconciliation and use of non-GAAP financial measures Segment core efficiency ratios (tax-equivalent basis)(a)
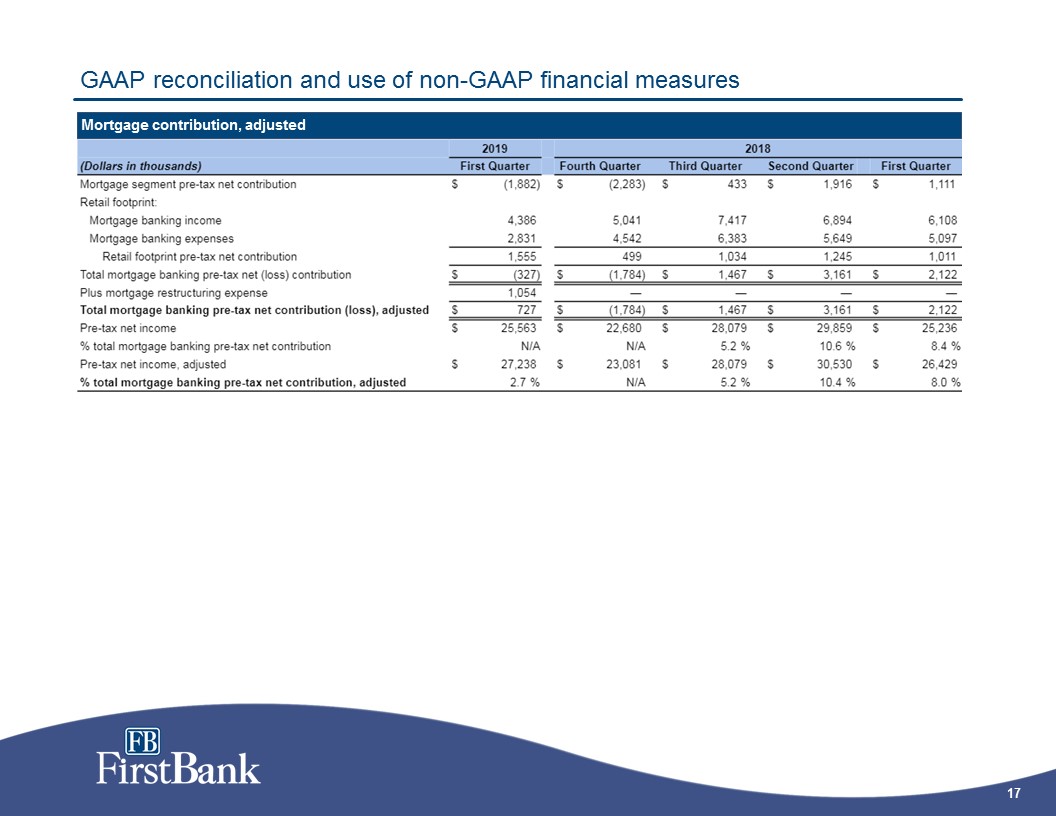
GAAP reconciliation and use of non-GAAP financial measures Mortgage contribution, adjusted
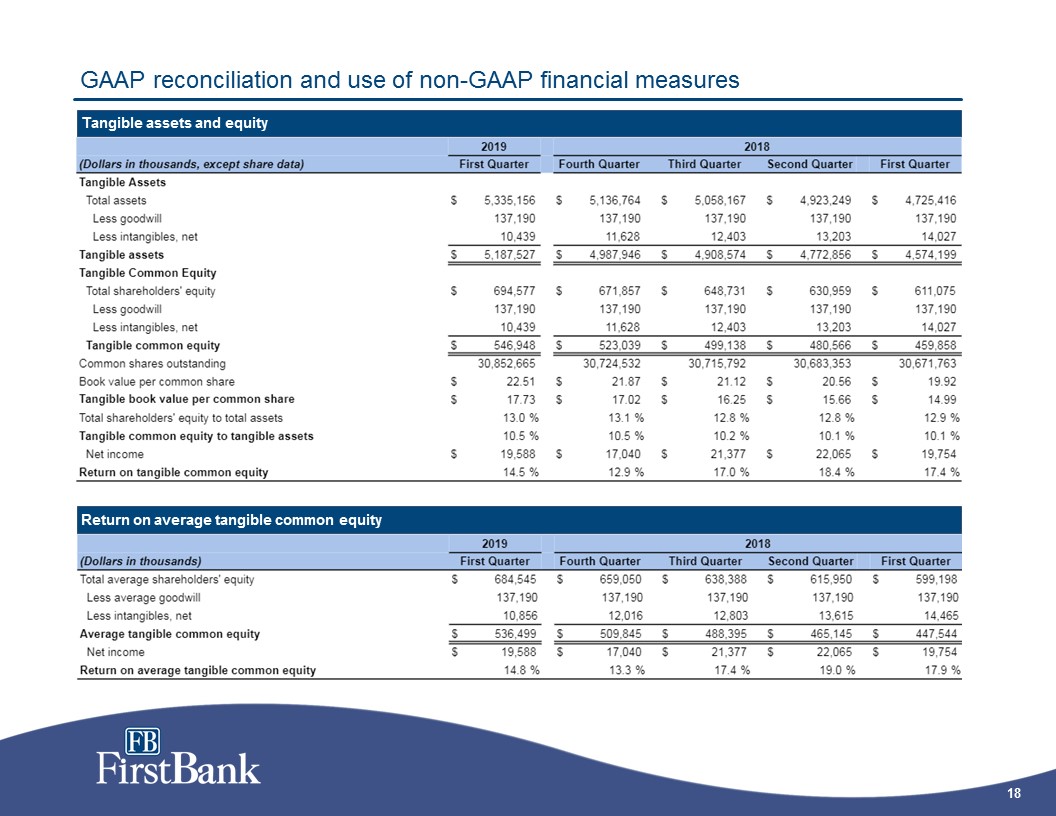
GAAP reconciliation and use of non-GAAP financial measures Tangible assets and equity Return on average tangible common equity
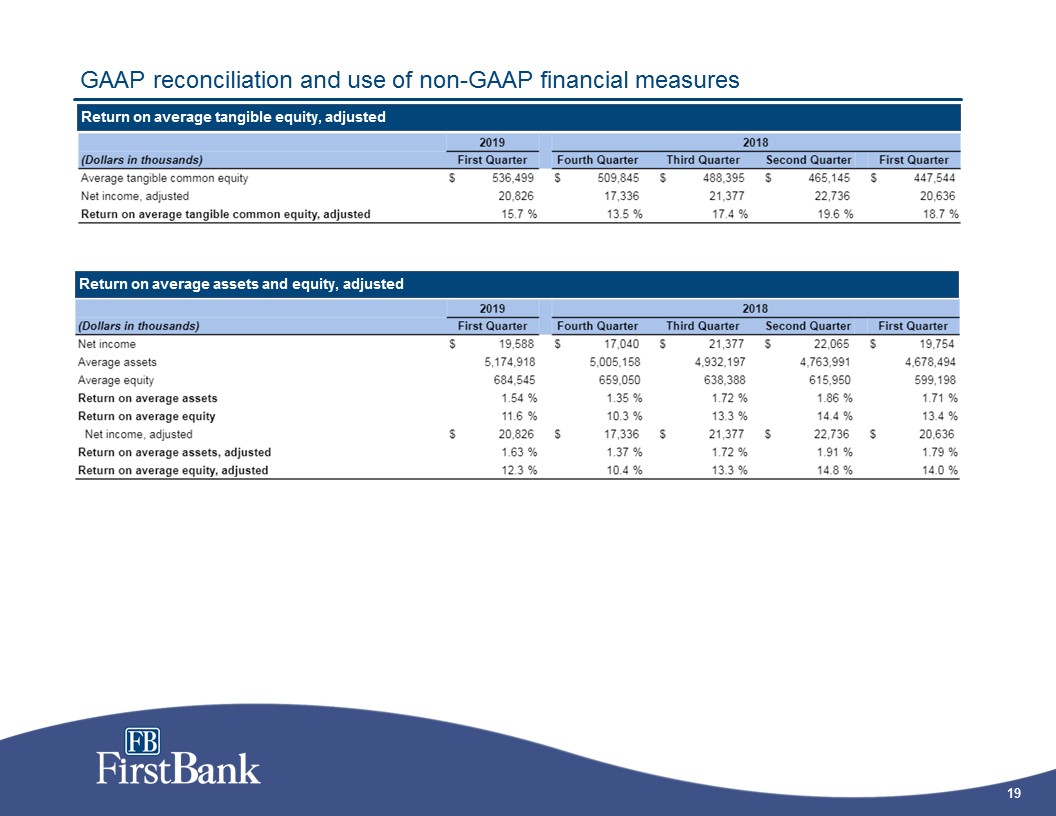
GAAP reconciliation and use of non-GAAP financial measures Return on average tangible equity, adjusted Return on average assets and equity, adjusted
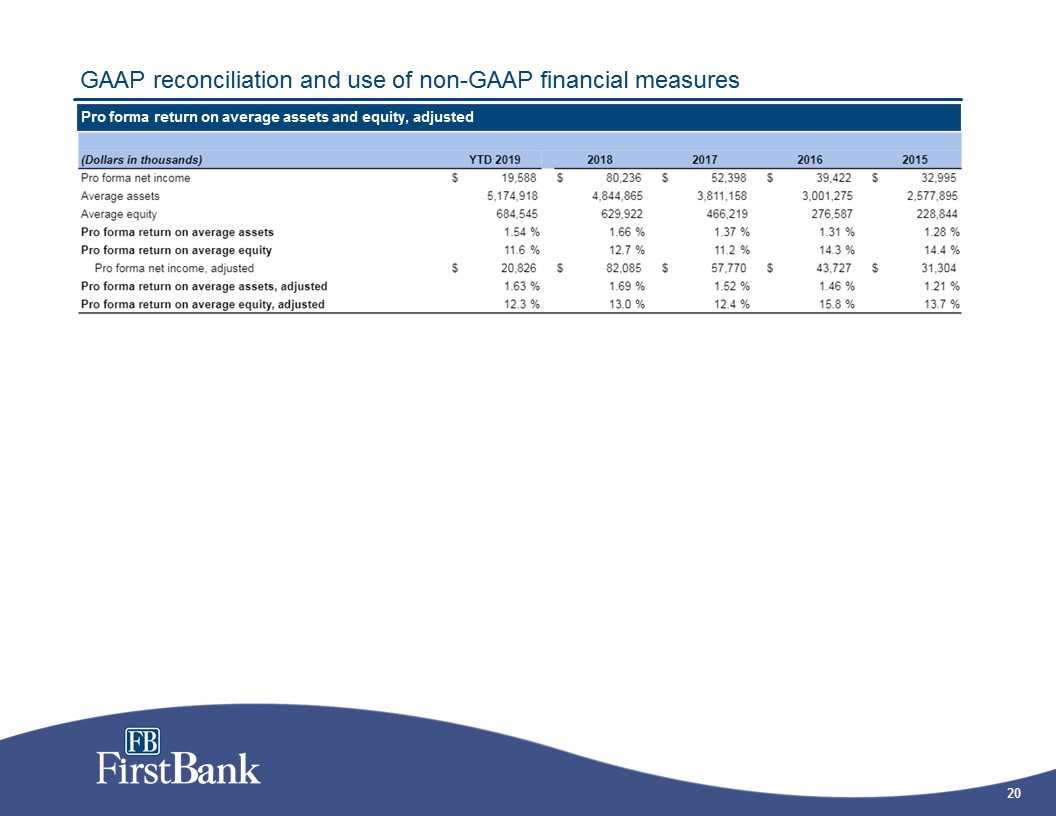
GAAP reconciliation and use of non-GAAP financial measures Pro forma return on average assets and equity, adjusted