Exhibit 99.1

Second Quarter 2019 Investor Presentation
This presentation contains “forward-looking statements” within the meaning of Section 27A of the Securities Act of 1933, as amended, and Section 21E of the Securities Exchange Act of 1934, as amended, that have been made pursuant to the safe harbor provisions of the Private Securities Litigation Reform Act of 1995. You can identify these forward-looking statements in some cases through the use of words such as “believes,” “anticipates,” “expects,” “may,” “will,” “assumes,” “should,” “predicts,” “could,” “would,” “intends,” “targets,” “estimates,” “projects,” “plans,” “potential” and other similar words and expressions of the future or otherwise regarding the proposed acquisition, including the timing, anticipated benefits and financial impact thereof, and the outlook for our future business and financial performance.These forward-looking statements include, without limitation, statements relating to FB Financial’s assets, business, cash flows, condition (financial or otherwise), credit quality, financial performance, liquidity, short and long-term performance goals, prospects, results of operations, strategic initiatives and the timing, benefits, as well as statements relating to the anticipated benefits and financial impact of FB Financial’s mortgage segment restructuring and the acquisition by FirstBank of the Atlantic Capital branches, including: acceptance by the customers of the acquired Atlantic Capital branches of FB Financial’s products and services, the opportunities to enhance market share in certain markets, market acceptance of FB Financial generally in new markets, expectations regarding future investment in the acquired Atlantic Capital branches’ markets and the integration of the acquired Atlantic Capital branches’ operations, disposition, and other growth opportunities. Forward-looking statements are based on the information known to, and current beliefs and expectations of, FB Financial’s management and are subject to significant risks and uncertainties. Actual results may differ materially from those contemplated by such forward-looking statements. A number of important factors could cause actual results to differ materially from those contemplated by the forward-looking statements in this presentation including, without limitation: FB Financial's ability to achieve the anticipated benefits and cost synergies of the mortgage segment restructuring, the parties’ ability to meet expectations regarding the accounting and tax treatment of the Atlantic Capital acquisition; the possibility that any of the anticipated benefits of the Atlantic Capital acquisition will not be fully realized or will not be realized within the expected time period; the risk that integration of the acquired Atlantic Capital branches’ operations with those of FB Financial or will be more costly than expected; the effect of the announcement of the closing of the Atlantic Capital acquisition on employee and customer relationships and operating results (including, without limitation, difficulties in maintaining relationships with employees and customers); general competitive, economic, political and market conditions and fluctuations; and the other risk factors set forth in our December 31, 2018 Form 10-K, filed with the Securities and Exchange Commission on March 12, 2019, under the captions “Cautionary note regarding forward-looking statements” and “Risk factors”. Many of these factors are difficult to foresee and are beyond our ability to control or predict. We believe the forward-looking statements contained herein are reasonable; however, undue reliance should not be placed on any forward-looking statements, which are based on current expectations and speak only as of the date that they are made. We do not assume any obligation to update any forward-looking statements as a result of new information, future developments or otherwise, except as otherwise may be required by law. Forward looking statements
Use of non-GAAP financial measures This presentation contains certain financial measures that are not measures recognized under U.S. generally accepted accounting principles (“GAAP”) and therefore are considered non-GAAP financial measures. These non‐GAAP financial measures include, without limitation, adjusted net income, adjusted diluted earnings per share, adjusted pro forma net income, adjusted pro forma diluted earnings per share, core noninterest expense, core noninterest income, core efficiency ratio (tax-equivalent basis), banking segment core efficiency ratio (tax-equivalent basis), mortgage segment core efficiency ratio (tax-efficiency basis), adjusted mortgage contribution, and adjusted return on average assets and equity. Each of these non-GAAP metrics excludes certain income and expense items that the Company’s management considers to be non‐core/adjusted in nature. The Company refers to these non‐GAAP measures as adjusted or core measures. The presentation also presents tangible assets, tangible common equity, tangible book value per common share, tangible common equity to tangible assets, return on tangible common equity, return on average tangible common equity, adjusted return on average assets, adjusted return on average equity, adjusted return on average tangible common equity, pro forma return on average assets and equity and pro forma adjusted return on average assets and equity. Each of these non-GAAP metrics excludes the impact of goodwill and other intangibles.The Company’s management uses these non-GAAP financial measures in their analysis of the Company’s performance, financial condition and the efficiency of its operations as management believes such measures facilitate period-to-period comparisons and provide meaningful indications of its operating performance as they eliminate both gains and charges that management views as non-recurring or not indicative of operating performance. Management believes that these non-GAAP financial measures provide a greater understanding of ongoing operations and enhance comparability of results with prior periods as well as demonstrating the effects of significant non-core gains and charges in the current and prior periods. The Company’s management also believes that investors find these non-GAAP financial measures useful as they assist investors in understanding the Company’s underlying operating performance and in the analysis of ongoing operating trends. In addition, because intangible assets such as goodwill and other intangibles, and the other items excluded each vary extensively from company to company, the Company believes that the presentation of this information allows investors to more easily compare the Company’s results to the results of other companies. However, the non-GAAP financial measures discussed herein should not be considered in isolation or as a substitute for the most directly comparable or other financial measures calculated in accordance with GAAP. Moreover, the manner in which the Company calculates the non-GAAP financial measures discussed herein may differ from that of other companies reporting measures with similar names. You should understand how such other banking organizations calculate their financial measures similar or with names similar to the non-GAAP financial measures the Company has discussed herein when comparing such non-GAAP financial measures. The tables included in the Appendix to this presentation provide a reconciliation of these measures to the most directly comparable GAAP financial measures.
Strategic drivers Great Place to Work Strategic M&A and Capital Optimization Experienced Senior Management Team Elite Financial Performance Scalable Platforms Enabled by Technology Empowered Teams Across Attractive Metro and Community Markets
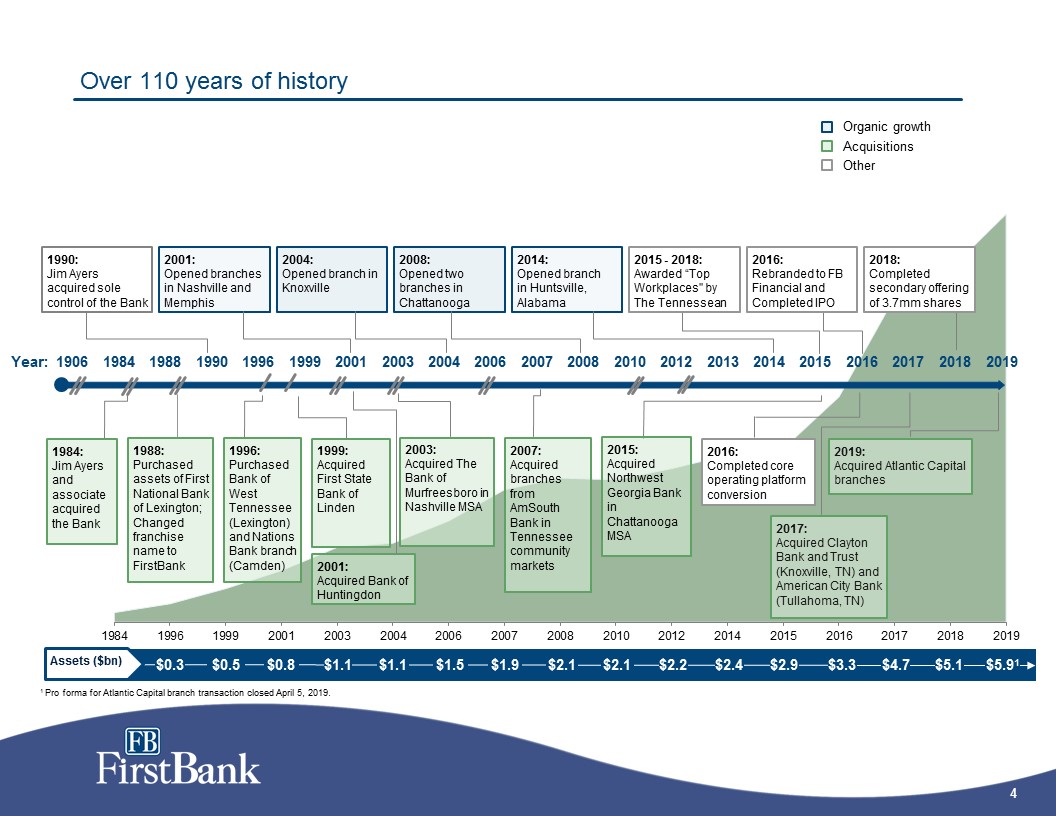
Over 110 years of history 2003: Acquired The Bank of Murfreesboro in Nashville MSA 2007: Acquired branches from AmSouth Bank in Tennessee community markets 1984 1988 1996 1999 2001 2003 2004 2006 2012 2013 2015 Year: 2001: Opened branches in Nashville and Memphis 2004: Opened branch in Knoxville Acquisitions Organic growth Other 1999: Acquired First State Bank of Linden 1906 2010 2007 2008 2008: Opened two branches in Chattanooga 1990 1996: Purchased Bank of West Tennessee (Lexington) and Nations Bank branch (Camden) 2001: Acquired Bank of Huntingdon 2014 2014: Opened branch in Huntsville, Alabama 1990: Jim Ayers acquired sole control of the Bank 2016 $0.3 $0.5 $0.8 $1.1 $1.1 $1.5 $2.2 $2.4 $2.9 $3.3 $1.9 $2.1 $2.1 $5.1 2016:Completed core operating platform conversion 1988: Purchased assets of First National Bank of Lexington; Changed franchise name to FirstBank 1984: Jim Ayers and associate acquired the Bank 2015: Acquired Northwest Georgia Bank in Chattanooga MSA Assets ($bn) 2017 2017:Acquired Clayton Bank and Trust (Knoxville, TN) and American City Bank (Tullahoma, TN) 2018 $4.7 2018:Completed secondary offering of 3.7mm shares 2016:Rebranded to FB Financial and Completed IPO 2015 - 2018: Awarded “Top Workplaces" by The Tennessean 2019:Acquired Atlantic Capital branches 2019 $5.91 1 Pro forma for Atlantic Capital branch transaction closed April 5, 2019.
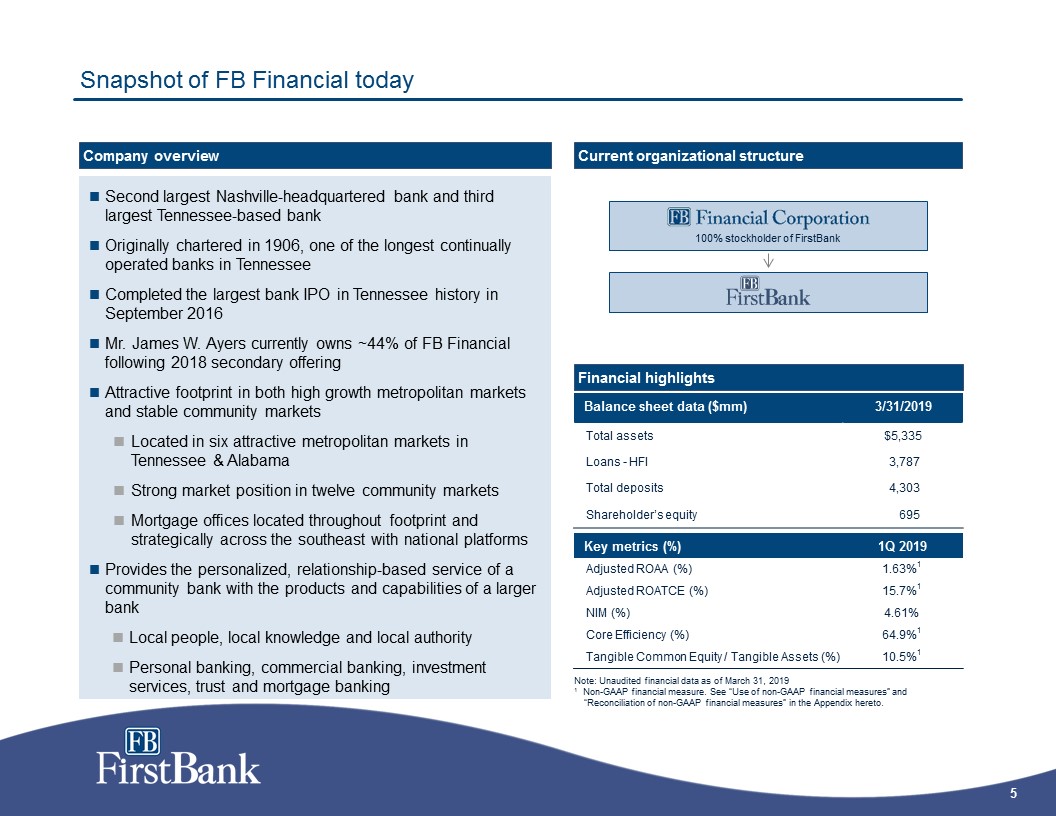
Snapshot of FB Financial today Financial highlights Company overview Second largest Nashville-headquartered bank and third largest Tennessee-based bankOriginally chartered in 1906, one of the longest continually operated banks in Tennessee Completed the largest bank IPO in Tennessee history in September 2016Mr. James W. Ayers currently owns ~44% of FB Financial following 2018 secondary offeringAttractive footprint in both high growth metropolitan markets and stable community marketsLocated in six attractive metropolitan markets in Tennessee & AlabamaStrong market position in twelve community marketsMortgage offices located throughout footprint and strategically across the southeast with national platformsProvides the personalized, relationship-based service of a community bank with the products and capabilities of a larger bankLocal people, local knowledge and local authorityPersonal banking, commercial banking, investment services, trust and mortgage banking Note: Unaudited financial data as of March 31, 20191 Non-GAAP financial measure. See “Use of non-GAAP financial measures” and “Reconciliation of non-GAAP financial measures” in the Appendix hereto. Current organizational structure Balance sheet data ($mm) 3/31/2019 Total assets $5,335 Loans - HFI 3,787 Total deposits 4,303 Shareholder’s equity 695 Key metrics (%) 1Q 2019 Adjusted ROAA (%) 1.63%1 Adjusted ROATCE (%) 15.7%1 NIM (%) 4.61% Core Efficiency (%) 64.9%1 Tangible Common Equity / Tangible Assets (%) 10.5%1 100% stockholder of FirstBank
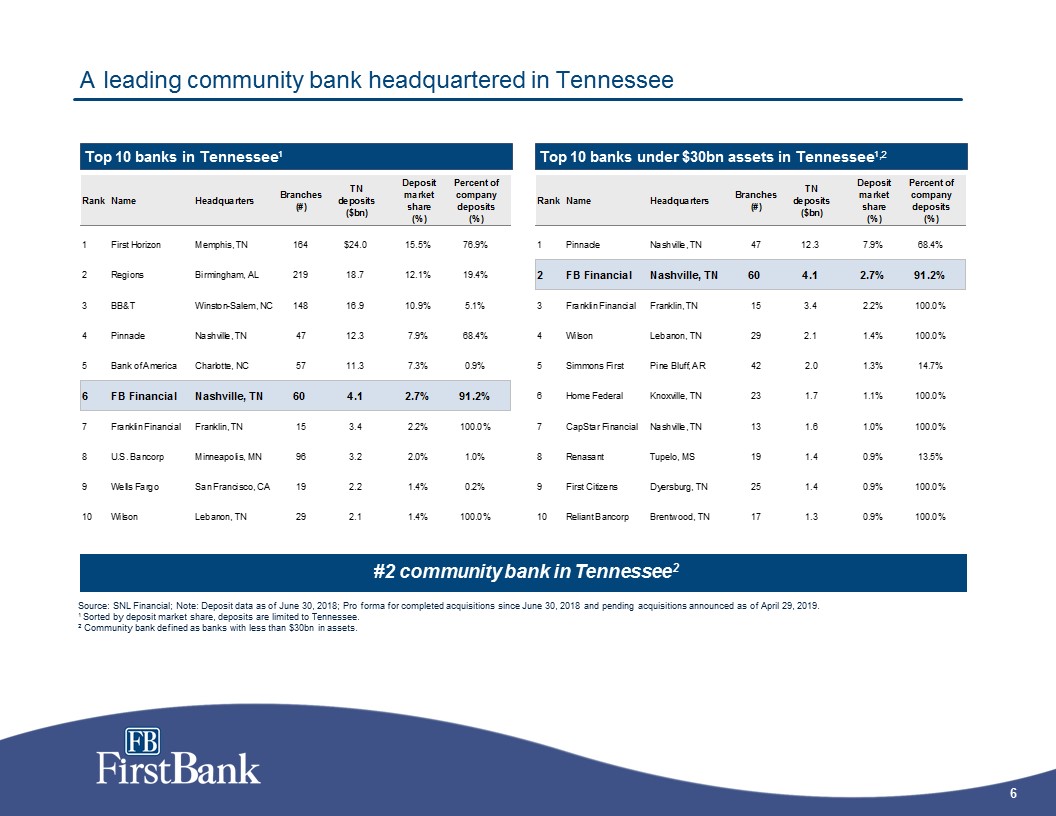
A leading community bank headquartered in Tennessee Top 10 banks in Tennessee¹ Top 10 banks under $30bn assets in Tennessee¹,2 Source: SNL Financial; Note: Deposit data as of June 30, 2018; Pro forma for completed acquisitions since June 30, 2018 and pending acquisitions announced as of April 29, 2019.1 Sorted by deposit market share, deposits are limited to Tennessee.2 Community bank defined as banks with less than $30bn in assets. #2 community bank in Tennessee2
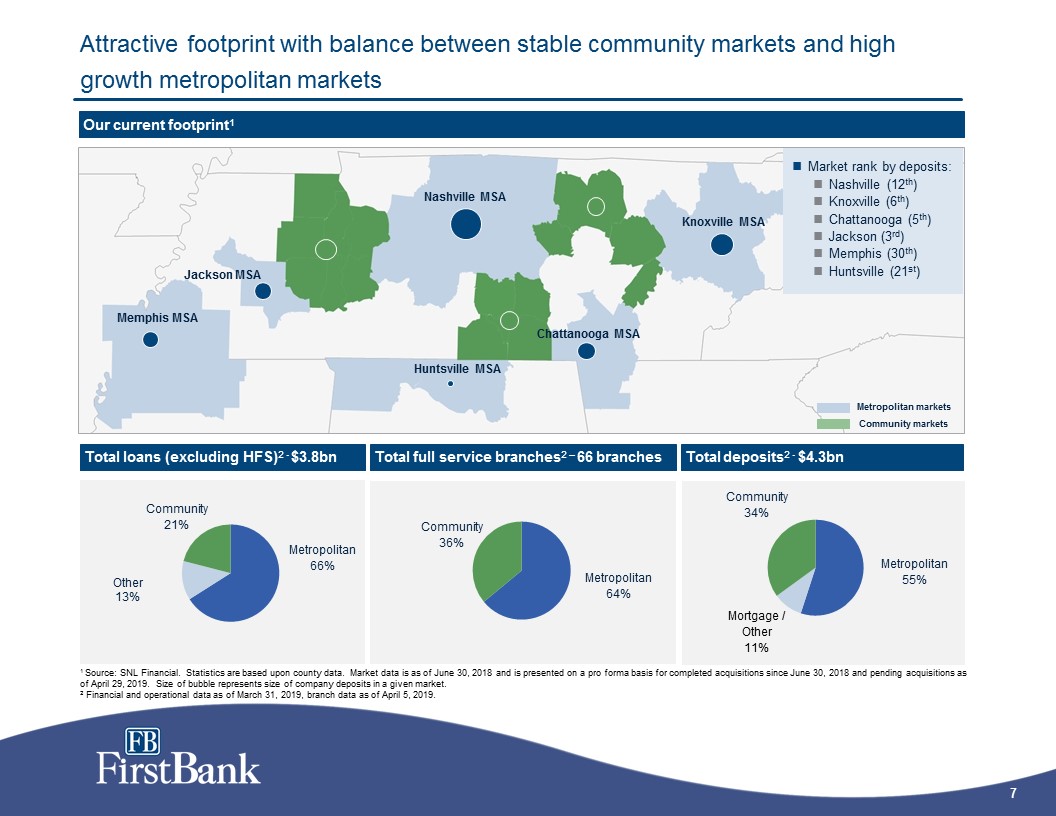
Attractive footprint with balance between stable community markets and high growth metropolitan markets 269123Blue dots 193210228Metro markets 130131135Highway 167169172State county outlines 8715487Green dots 148194148Community markets Source files are619754_FirstBank Bancorp.ai and mapinfo 1 Source: SNL Financial. Statistics are based upon county data. Market data is as of June 30, 2018 and is presented on a pro forma basis for completed acquisitions since June 30, 2018 and pending acquisitions as of April 29, 2019. Size of bubble represents size of company deposits in a given market.2 Financial and operational data as of March 31, 2019, branch data as of April 5, 2019. Nashville MSA Knoxville MSA Chattanooga MSA Huntsville MSA Memphis MSA Jackson MSA Metropolitan marketsCommunity markets Our current footprint1 Total loans (excluding HFS)2 - $3.8bn Total full service branches2 – 66 branches Total deposits2 - $4.3bn Market rank by deposits: Nashville (12th)Knoxville (6th) Chattanooga (5th) Jackson (3rd) Memphis (30th)Huntsville (21st) Community Metropolitan66% Community 21% Community 36% Metropolitan64% Metropolitan55% Community 34%
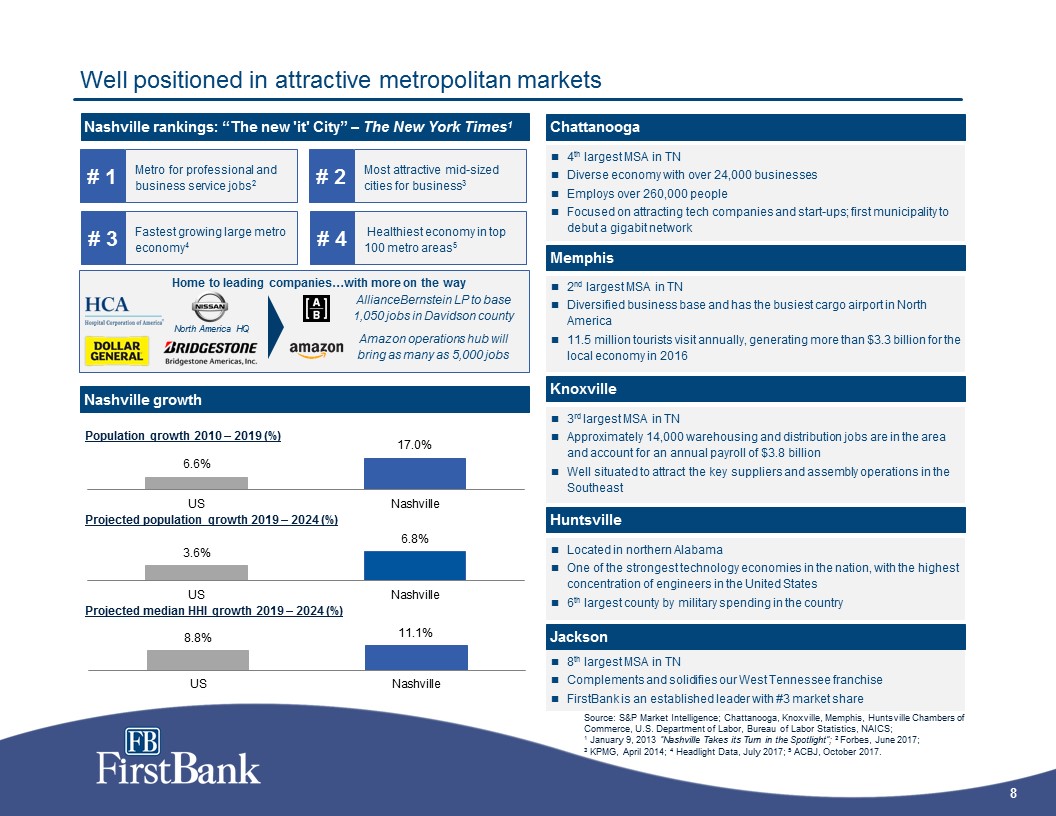
Well positioned in attractive metropolitan markets 269123Blue dots 193210228Metro markets 130131135Highway 167169172State county outlines 8715487Green dots 148194148Community markets Source files are619754_FirstBank Bancorp.ai and mapinfo Nashville rankings: “The new 'it' City” – The New York Times1 Most attractive mid-sized cities for business3 # 2 Home to leading companies…with more on the way Nashville growth Population growth 2010 – 2019 (%) Projected median HHI growth 2019 – 2024 (%) Projected population growth 2019 – 2024 (%) Located in northern Alabama One of the strongest technology economies in the nation, with the highest concentration of engineers in the United States6th largest county by military spending in the country Huntsville Chattanooga 4th largest MSA in TNDiverse economy with over 24,000 businesses Employs over 260,000 people Focused on attracting tech companies and start-ups; first municipality to debut a gigabit network Memphis 2nd largest MSA in TNDiversified business base and has the busiest cargo airport in North America11.5 million tourists visit annually, generating more than $3.3 billion for the local economy in 2016 Knoxville 3rd largest MSA in TN Approximately 14,000 warehousing and distribution jobs are in the area and account for an annual payroll of $3.8 billionWell situated to attract the key suppliers and assembly operations in the Southeast Source: S&P Market Intelligence; Chattanooga, Knoxville, Memphis, Huntsville Chambers of Commerce, U.S. Department of Labor, Bureau of Labor Statistics, NAICS; 1 January 9, 2013 “Nashville Takes its Turn in the Spotlight”; 2 Forbes, June 2017; 3 KPMG, April 2014; 4 Headlight Data, July 2017; 5 ACBJ, October 2017. 8th largest MSA in TNComplements and solidifies our West Tennessee franchiseFirstBank is an established leader with #3 market share Jackson Metro for professional and business service jobs2 # 1 North America HQ AllianceBernstein LP to base 1,050 jobs in Davidson county Healthiest economy in top 100 metro areas5 # 4 Fastest growing large metro economy4 # 3 Amazon operations hub will bring as many as 5,000 jobs
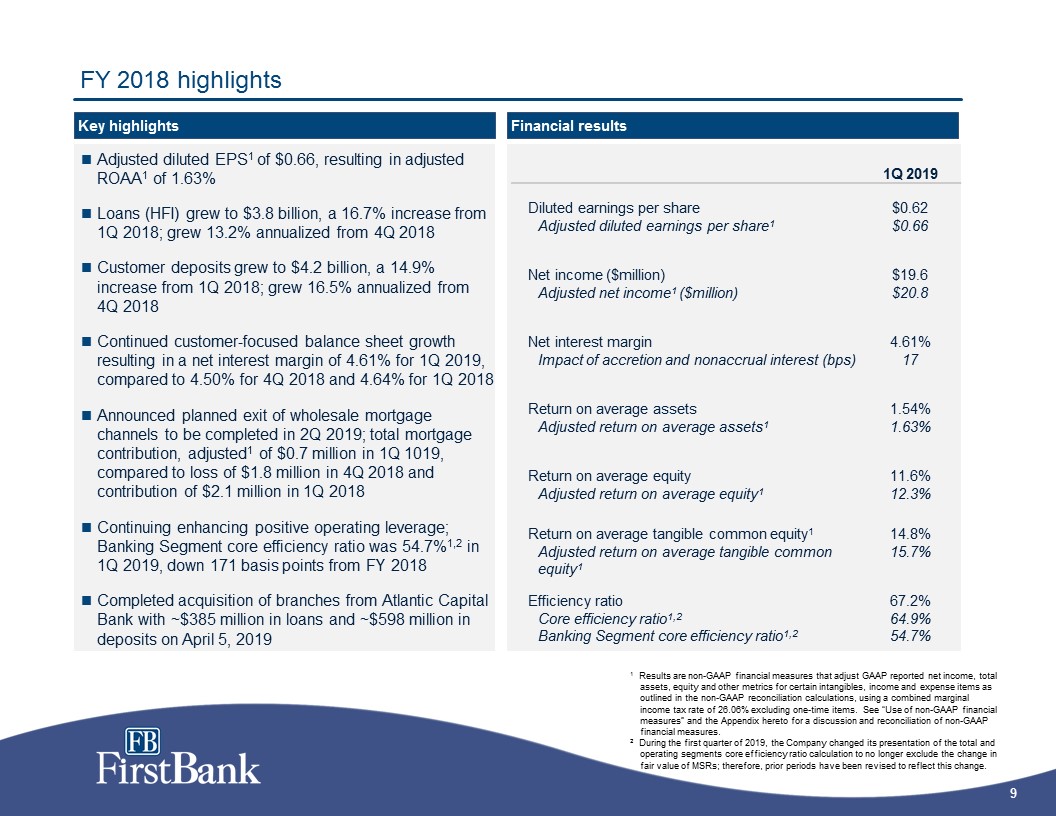
1Q 2019 Diluted earnings per shareAdjusted diluted earnings per share1 $0.62$0.66 Net income ($million)Adjusted net income1 ($million) $19.6$20.8 Net interest marginImpact of accretion and nonaccrual interest (bps) 4.61%17 Return on average assets Adjusted return on average assets1 1.54%1.63% Return on average equityAdjusted return on average equity1 11.6%12.3% Return on average tangible common equity1Adjusted return on average tangible common equity1 14.8%15.7% Efficiency ratioCore efficiency ratio1,2Banking Segment core efficiency ratio1,2 67.2%64.9%54.7% FY 2018 highlights Key highlights Financial results Adjusted diluted EPS1 of $0.66, resulting in adjusted ROAA1 of 1.63%Loans (HFI) grew to $3.8 billion, a 16.7% increase from 1Q 2018; grew 13.2% annualized from 4Q 2018Customer deposits grew to $4.2 billion, a 14.9% increase from 1Q 2018; grew 16.5% annualized from 4Q 2018Continued customer-focused balance sheet growth resulting in a net interest margin of 4.61% for 1Q 2019, compared to 4.50% for 4Q 2018 and 4.64% for 1Q 2018Announced planned exit of wholesale mortgage channels to be completed in 2Q 2019; total mortgage contribution, adjusted1 of $0.7 million in 1Q 1019, compared to loss of $1.8 million in 4Q 2018 and contribution of $2.1 million in 1Q 2018Continuing enhancing positive operating leverage; Banking Segment core efficiency ratio was 54.7%1,2 in 1Q 2019, down 171 basis points from FY 2018Completed acquisition of branches from Atlantic Capital Bank with ~$385 million in loans and ~$598 million in deposits on April 5, 2019 1 Results are non-GAAP financial measures that adjust GAAP reported net income, total assets, equity and other metrics for certain intangibles, income and expense items as outlined in the non-GAAP reconciliation calculations, using a combined marginal income tax rate of 26.06% excluding one-time items. See “Use of non-GAAP financial measures” and the Appendix hereto for a discussion and reconciliation of non-GAAP financial measures.2 During the first quarter of 2019, the Company changed its presentation of the total and operating segments core efficiency ratio calculation to no longer exclude the change in fair value of MSRs; therefore, prior periods have been revised to reflect this change.
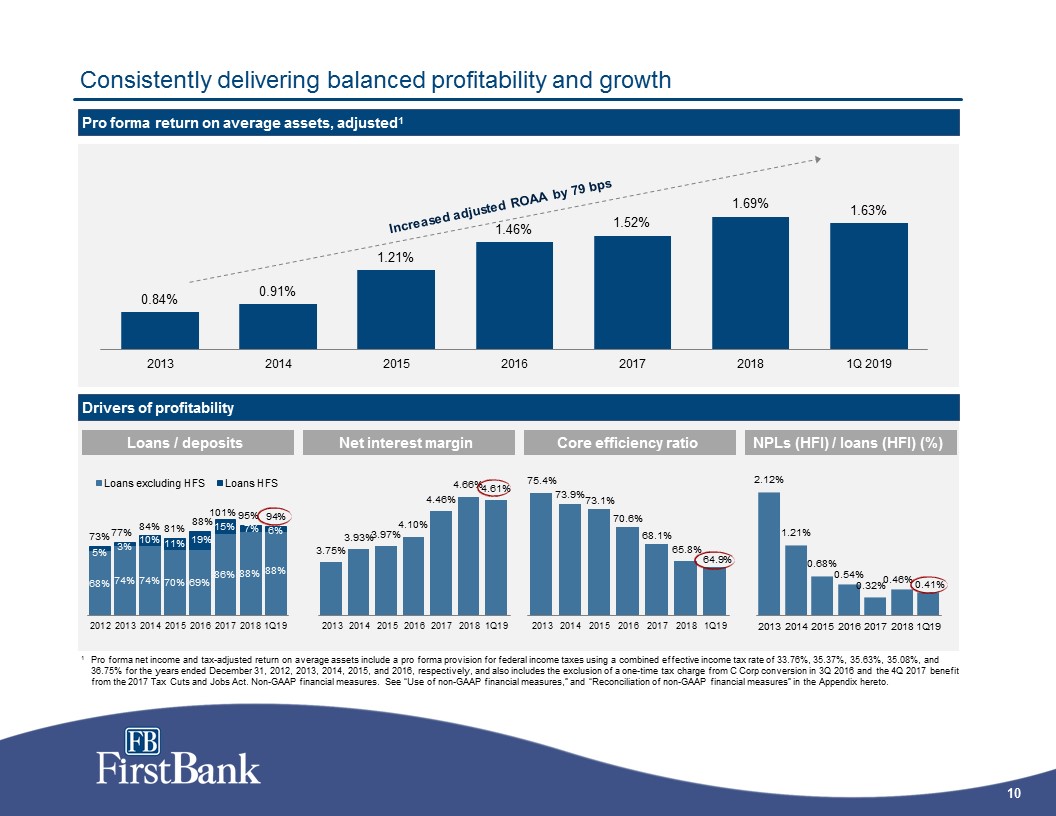
Consistently delivering balanced profitability and growth Drivers of profitability Pro forma return on average assets, adjusted1 Net interest margin Core efficiency ratio Loans / deposits 1 Pro forma net income and tax-adjusted return on average assets include a pro forma provision for federal income taxes using a combined effective income tax rate of 33.76%, 35.37%, 35.63%, 35.08%, and 36.75% for the years ended December 31, 2012, 2013, 2014, 2015, and 2016, respectively, and also includes the exclusion of a one-time tax charge from C Corp conversion in 3Q 2016 and the 4Q 2017 benefit from the 2017 Tax Cuts and Jobs Act. Non-GAAP financial measures. See “Use of non-GAAP financial measures,” and “Reconciliation of non-GAAP financial measures” in the Appendix hereto. NPLs (HFI) / loans (HFI) (%)
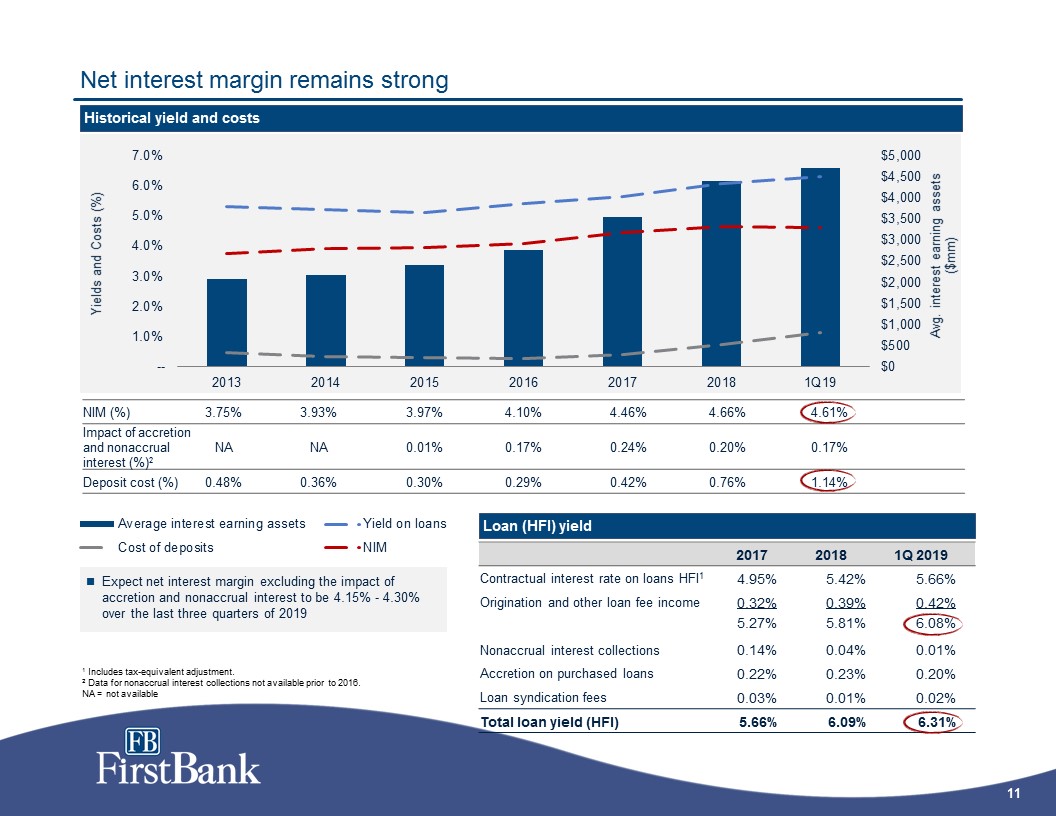
Net interest margin remains strong Historical yield and costs 1 Includes tax-equivalent adjustment.2 Data for nonaccrual interest collections not available prior to 2016.NA = not available NIM (%) 3.75% 3.93% 3.97% 4.10% 4.46% 4.66% 4.61% Impact of accretion and nonaccrual interest (%)2 NA NA 0.01% 0.17% 0.24% 0.20% 0.17% Deposit cost (%) 0.48% 0.36% 0.30% 0.29% 0.42% 0.76% 1.14% Loan (HFI) yield 2017 2018 1Q 2019 Contractual interest rate on loans HFI1 4.95% 5.42% 5.66% Origination and other loan fee income 0.32% 0.39% 0.42% 5.27% 5.81% 6.08% Nonaccrual interest collections 0.14% 0.04% 0.01% Accretion on purchased loans 0.22% 0.23% 0.20% Loan syndication fees 0.03% 0.01% 0.02% Total loan yield (HFI) 5.66% 6.09% 6.31% Expect net interest margin excluding the impact of accretion and nonaccrual interest to be 4.15% - 4.30% over the last three quarters of 2019
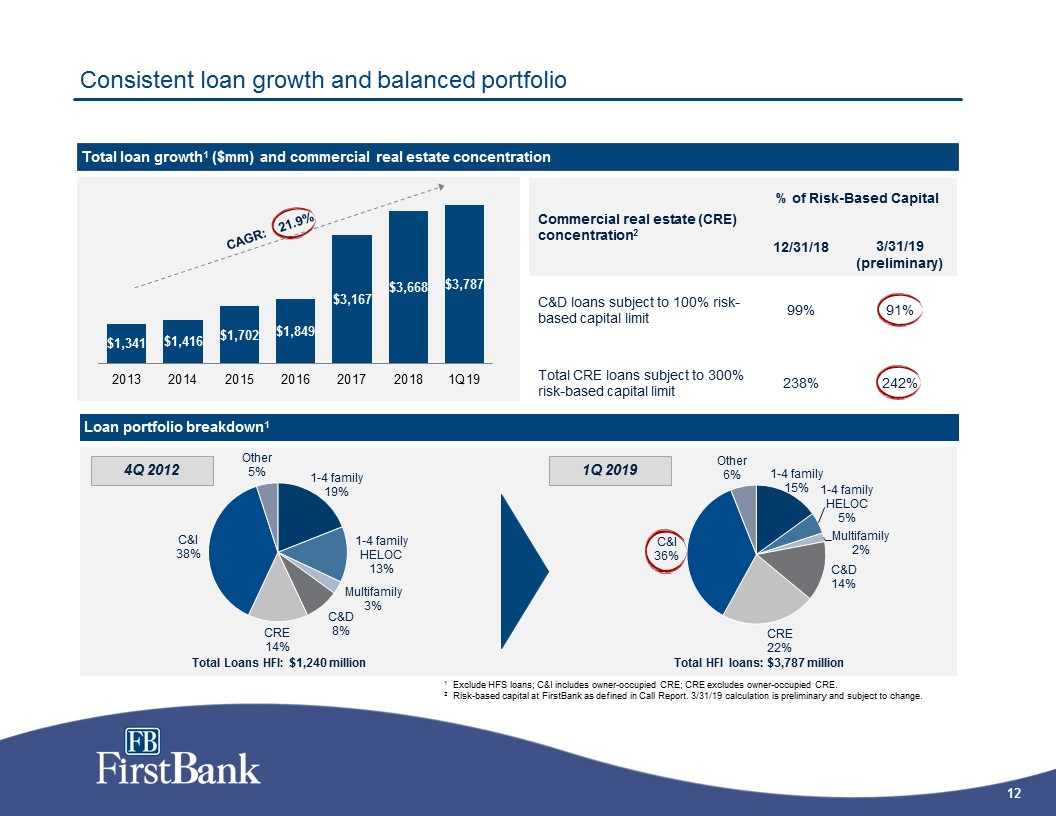
Consistent loan growth and balanced portfolio Total loan growth1 ($mm) and commercial real estate concentration Loan portfolio breakdown1 4Q 2012 1 Exclude HFS loans; C&I includes owner-occupied CRE; CRE excludes owner-occupied CRE.2 Risk-based capital at FirstBank as defined in Call Report. 3/31/19 calculation is preliminary and subject to change. Commercial real estate (CRE) concentration2 % of Risk-Based Capital 12/31/18 3/31/19(preliminary) C&D loans subject to 100% risk-based capital limit 99% 91% Total CRE loans subject to 300% risk-based capital limit 238% 242% 1Q 2019 Total HFI loans: $3,787 million
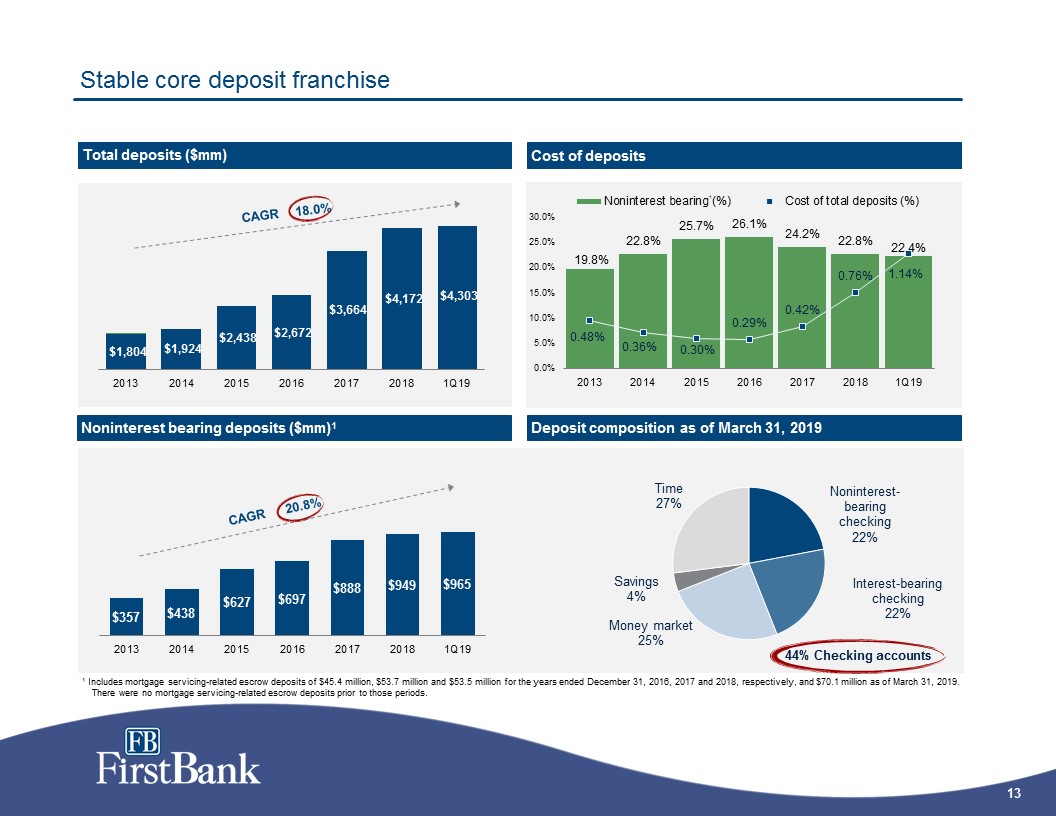
Stable core deposit franchise Total deposits ($mm) 1 Includes mortgage servicing-related escrow deposits of $45.4 million, $53.7 million and $53.5 million for the years ended December 31, 2016, 2017 and 2018, respectively, and $70.1 million as of March 31, 2019. There were no mortgage servicing-related escrow deposits prior to those periods. Noninterest bearing deposits ($mm)1 Deposit composition as of March 31, 2019 Cost of deposits CAGR 18.0% CAGR 20.8% 1
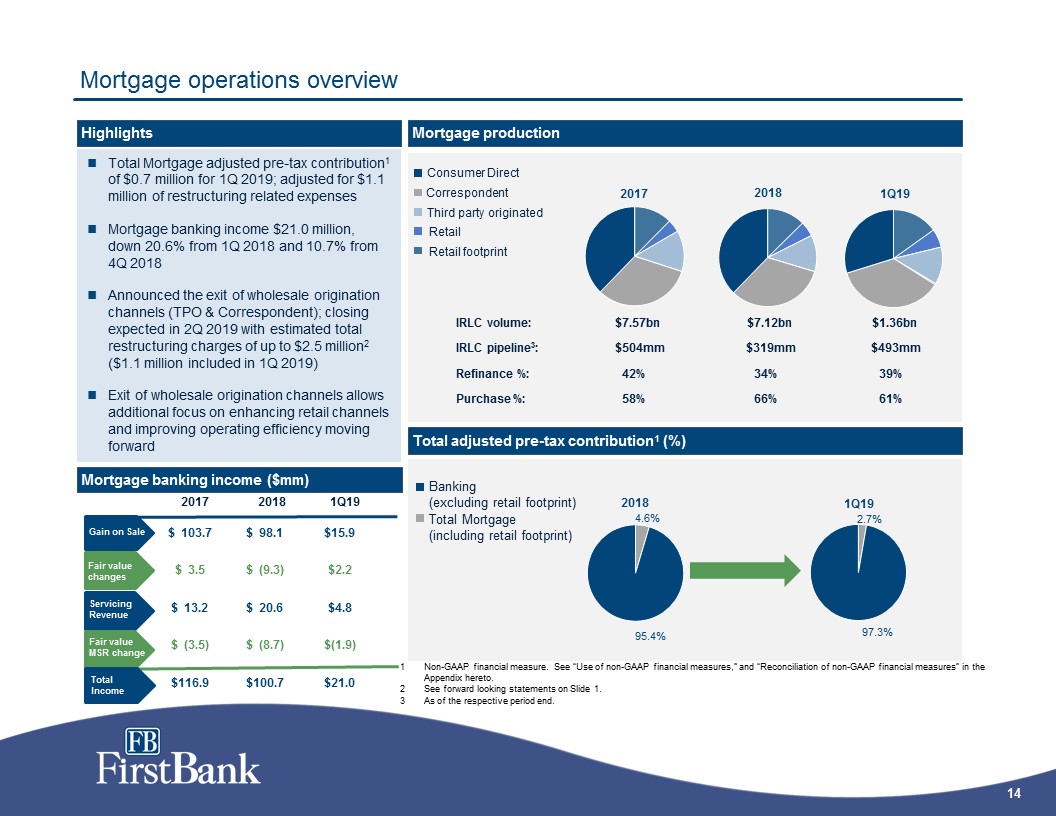
$ 103.7 $ 98.1 $15.9 $ 3.5 $ (9.3) $2.2 $ 13.2 $ 20.6 $4.8 $ (3.5) $ (8.7) $(1.9) $116.9 $100.7 $21.0 Total Mortgage adjusted pre-tax contribution1 of $0.7 million for 1Q 2019; adjusted for $1.1 million of restructuring related expensesMortgage banking income $21.0 million, down 20.6% from 1Q 2018 and 10.7% from 4Q 2018Announced the exit of wholesale origination channels (TPO & Correspondent); closing expected in 2Q 2019 with estimated total restructuring charges of up to $2.5 million2 ($1.1 million included in 1Q 2019)Exit of wholesale origination channels allows additional focus on enhancing retail channels and improving operating efficiency moving forward Mortgage operations overview Highlights Gain on Sale Total adjusted pre-tax contribution1 (%) Mortgage production Consumer Direct Correspondent Third party originated Retail Retail footprint Total Mortgage (including retail footprint) Banking (excluding retail footprint) 2017 2018 1Q19 Fair value changes Fair value MSR change Mortgage banking income ($mm) Servicing Revenue Total Income Confirm 2017 numbers $7.57bn $7.12bn IRLC volume: $1.36bn IRLC pipeline3: $504mm $319mm $493mm Refinance %: 42% 34% 39% Purchase %: 58% 66% 61% Non-GAAP financial measure. See “Use of non-GAAP financial measures,” and “Reconciliation of non-GAAP financial measures” in the Appendix hereto. See forward looking statements on Slide 1.As of the respective period end.
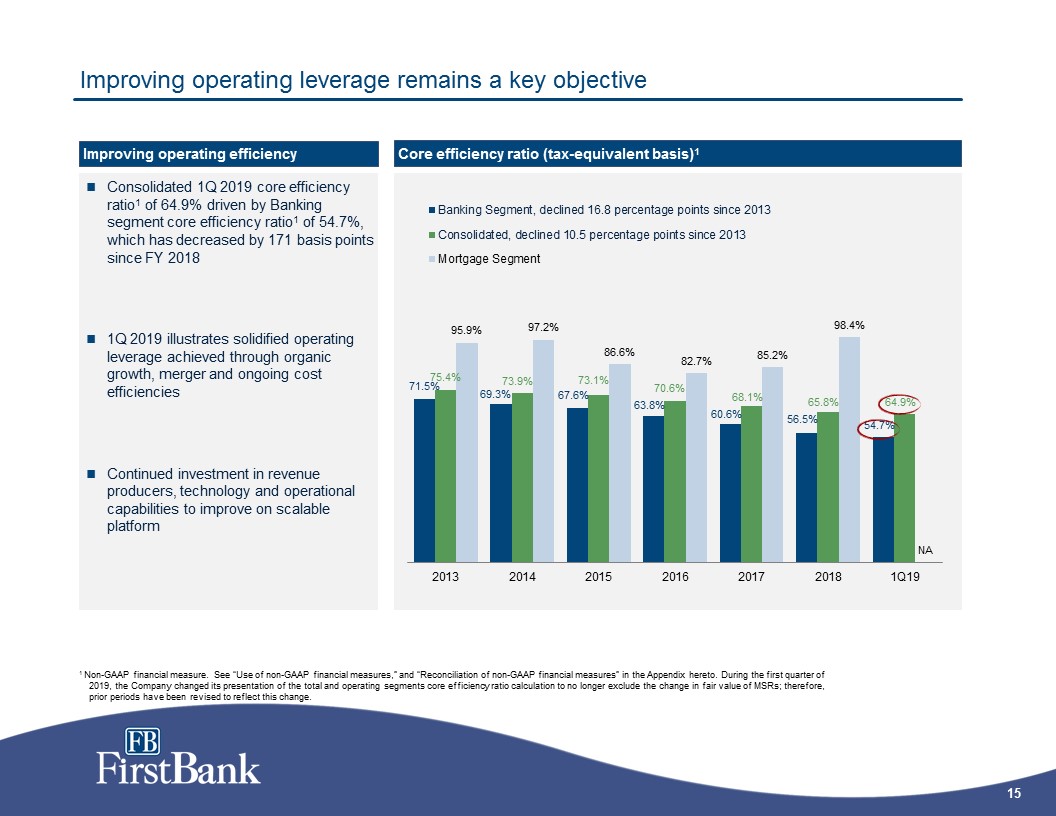
Improving operating leverage remains a key objective Consolidated 1Q 2019 core efficiency ratio1 of 64.9% driven by Banking segment core efficiency ratio1 of 54.7%, which has decreased by 171 basis points since FY 2018 1Q 2019 illustrates solidified operating leverage achieved through organic growth, merger and ongoing cost efficienciesContinued investment in revenue producers, technology and operational capabilities to improve on scalable platform Core efficiency ratio (tax-equivalent basis)1 Improving operating efficiency 1 Non-GAAP financial measure. See “Use of non-GAAP financial measures,” and “Reconciliation of non-GAAP financial measures” in the Appendix hereto. During the first quarter of 2019, the Company changed its presentation of the total and operating segments core efficiency ratio calculation to no longer exclude the change in fair value of MSRs; therefore, prior periods have been revised to reflect this change.
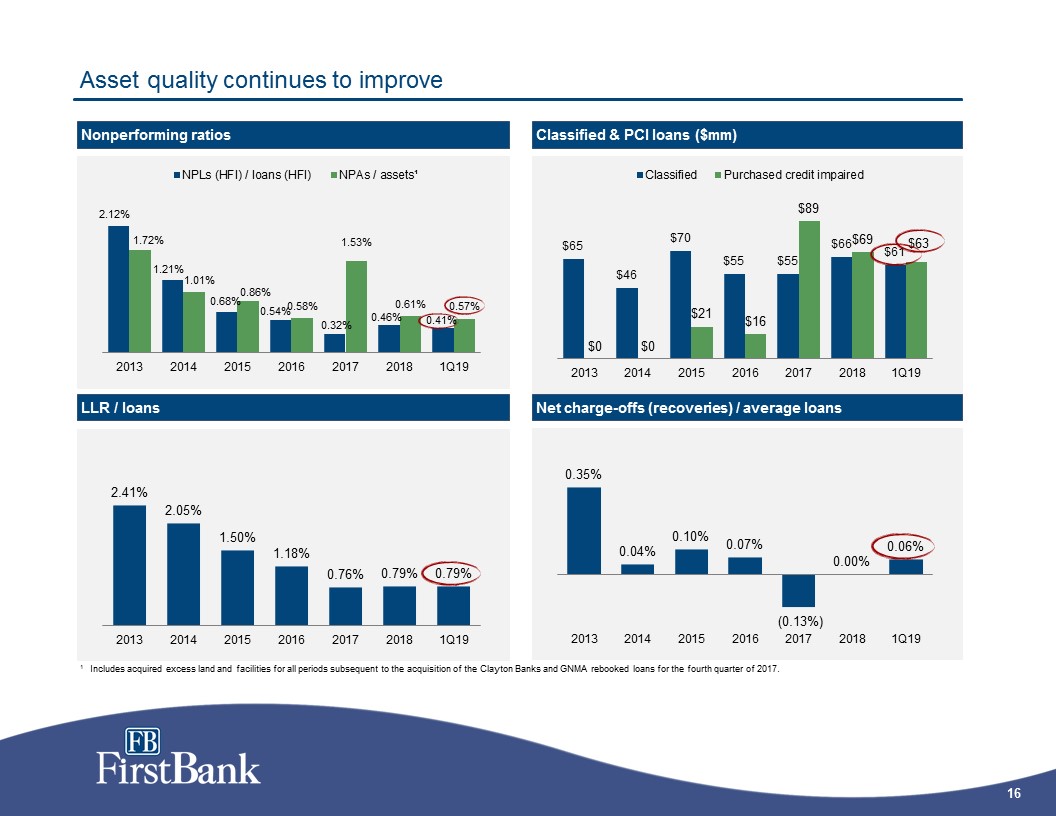
Asset quality continues to improve Classified & PCI loans ($mm) Net charge-offs (recoveries) / average loans Nonperforming ratios LLR / loans 1 Includes acquired excess land and facilities for all periods subsequent to the acquisition of the Clayton Banks and GNMA rebooked loans for the fourth quarter of 2017.
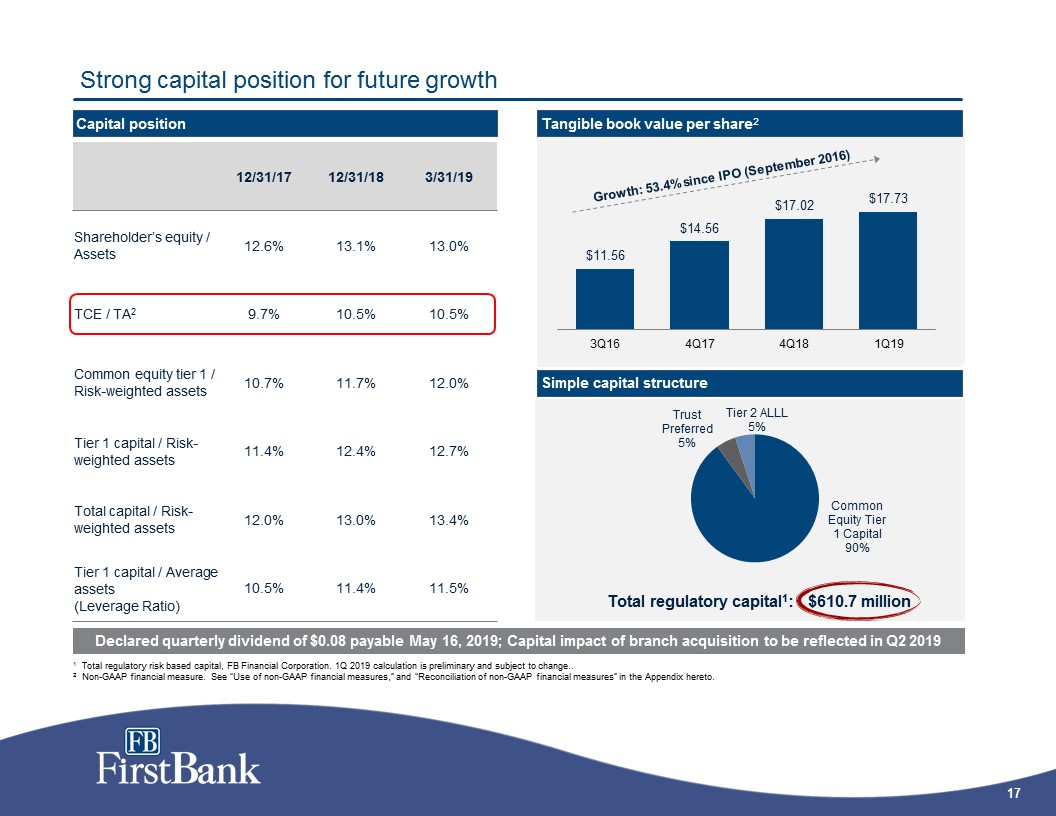
Strong capital position for future growth 1 Total regulatory risk based capital, FB Financial Corporation. 1Q 2019 calculation is preliminary and subject to change..2 Non-GAAP financial measure. See “Use of non-GAAP financial measures,” and “Reconciliation of non-GAAP financial measures” in the Appendix hereto. Capital position 12/31/17 12/31/18 3/31/19 Shareholder’s equity / Assets 12.6% 13.1% 13.0% TCE / TA2 9.7% 10.5% 10.5% Common equity tier 1 / Risk-weighted assets 10.7% 11.7% 12.0% Tier 1 capital / Risk-weighted assets 11.4% 12.4% 12.7% Total capital / Risk-weighted assets 12.0% 13.0% 13.4% Tier 1 capital / Average assets (Leverage Ratio) 10.5% 11.4% 11.5% Simple capital structure Tangible book value per share2 Growth: 53.4% since IPO (September 2016) Declared quarterly dividend of $0.08 payable May 16, 2019; Capital impact of branch acquisition to be reflected in Q2 2019
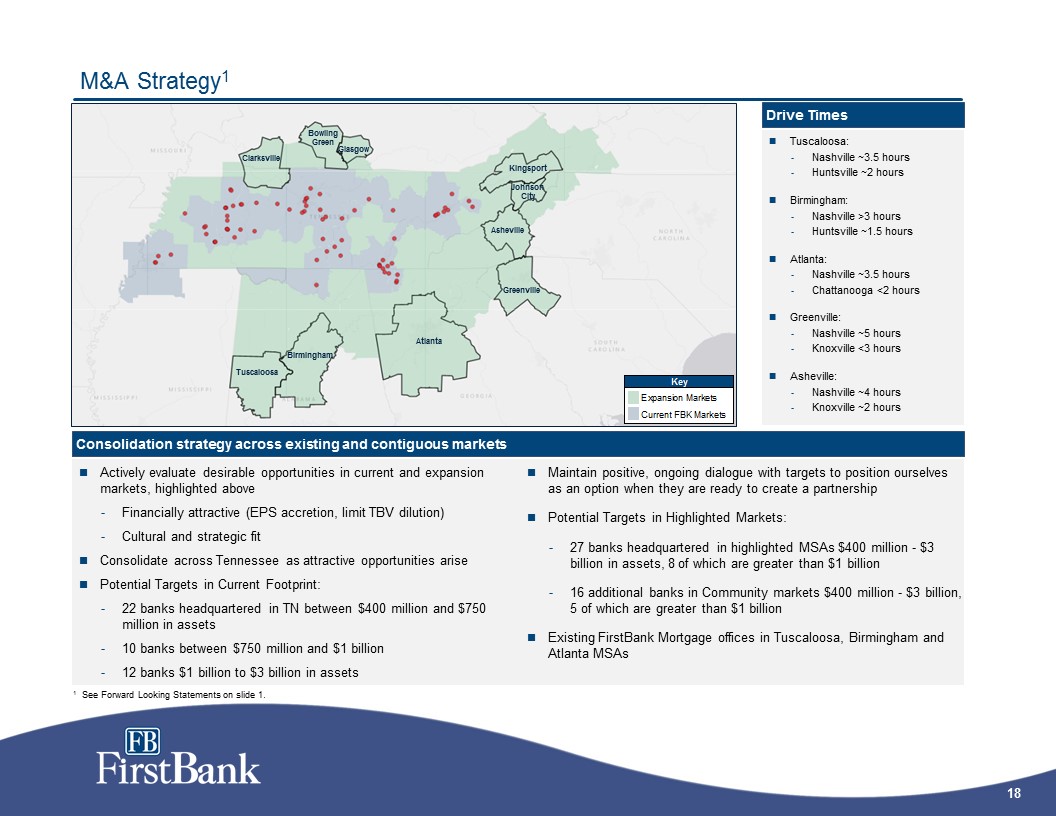
M&A Strategy1 Tuscaloosa Drive time from Nashville 3:30 / Huntsville 2:10Birmingham from Nashville 2:40 / Huntsville 1:30Atlanta 3:30 / Chattanooga 1:40Greenville 5:10 / Chattanooga 3:30 / Knoxville 2:40Asheville 4:20 / Knoxville 1:50Blacksburg 5:50 / Knoxville 3:20Roanoke 6:10 / Knoxville 3:40Bowling Green 1:00Glasgow 1:30 Consolidation strategy across existing and contiguous markets Actively evaluate desirable opportunities in current and expansion markets, highlighted aboveFinancially attractive (EPS accretion, limit TBV dilution)Cultural and strategic fitConsolidate across Tennessee as attractive opportunities arisePotential Targets in Current Footprint:22 banks headquartered in TN between $400 million and $750 million in assets10 banks between $750 million and $1 billion12 banks $1 billion to $3 billion in assets Maintain positive, ongoing dialogue with targets to position ourselves as an option when they are ready to create a partnershipPotential Targets in Highlighted Markets:27 banks headquartered in highlighted MSAs $400 million - $3 billion in assets, 8 of which are greater than $1 billion16 additional banks in Community markets $400 million - $3 billion, 5 of which are greater than $1 billionExisting FirstBank Mortgage offices in Tuscaloosa, Birmingham and Atlanta MSAs Drive Times Tuscaloosa:Nashville ~3.5 hoursHuntsville ~2 hoursBirmingham:Nashville >3 hoursHuntsville ~1.5 hoursAtlanta:Nashville ~3.5 hoursChattanooga <2 hoursGreenville:Nashville ~5 hoursKnoxville <3 hoursAsheville:Nashville ~4 hoursKnoxville ~2 hours Atlanta Birmingham Tuscaloosa Greenville Asheville BowlingGreen Glasgow Clarksville Kingsport JohnsonCity 1 See Forward Looking Statements on slide 1.

Appendix
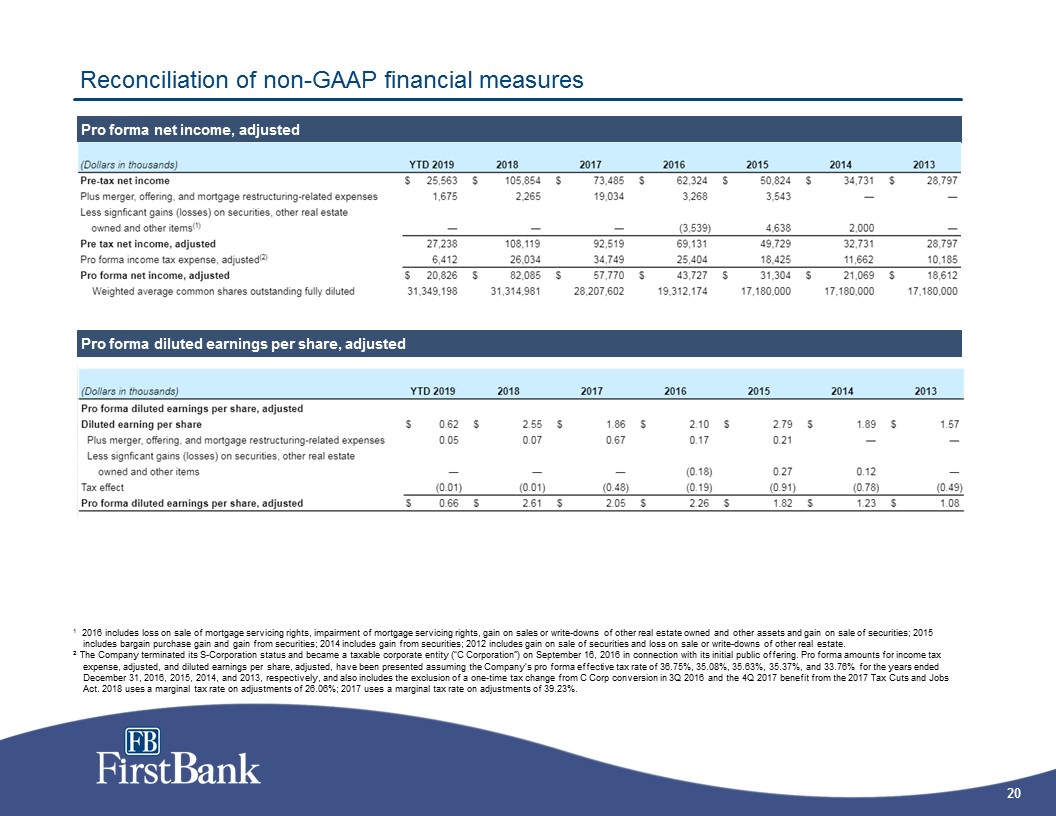
Reconciliation of non-GAAP financial measures Pro forma net income, adjusted Pro forma diluted earnings per share, adjusted 1 2016 includes loss on sale of mortgage servicing rights, impairment of mortgage servicing rights, gain on sales or write-downs of other real estate owned and other assets and gain on sale of securities; 2015 includes bargain purchase gain and gain from securities; 2014 includes gain from securities; 2012 includes gain on sale of securities and loss on sale or write-downs of other real estate.2 The Company terminated its S-Corporation status and became a taxable corporate entity (“C Corporation”) on September 16, 2016 in connection with its initial public offering. Pro forma amounts for income tax expense, adjusted, and diluted earnings per share, adjusted, have been presented assuming the Company’s pro forma effective tax rate of 36.75%, 35.08%, 35.63%, 35.37%, and 33.76% for the years ended December 31, 2016, 2015, 2014, and 2013, respectively, and also includes the exclusion of a one-time tax change from C Corp conversion in 3Q 2016 and the 4Q 2017 benefit from the 2017 Tax Cuts and Jobs Act. 2018 uses a marginal tax rate on adjustments of 26.06%; 2017 uses a marginal tax rate on adjustments of 39.23%.
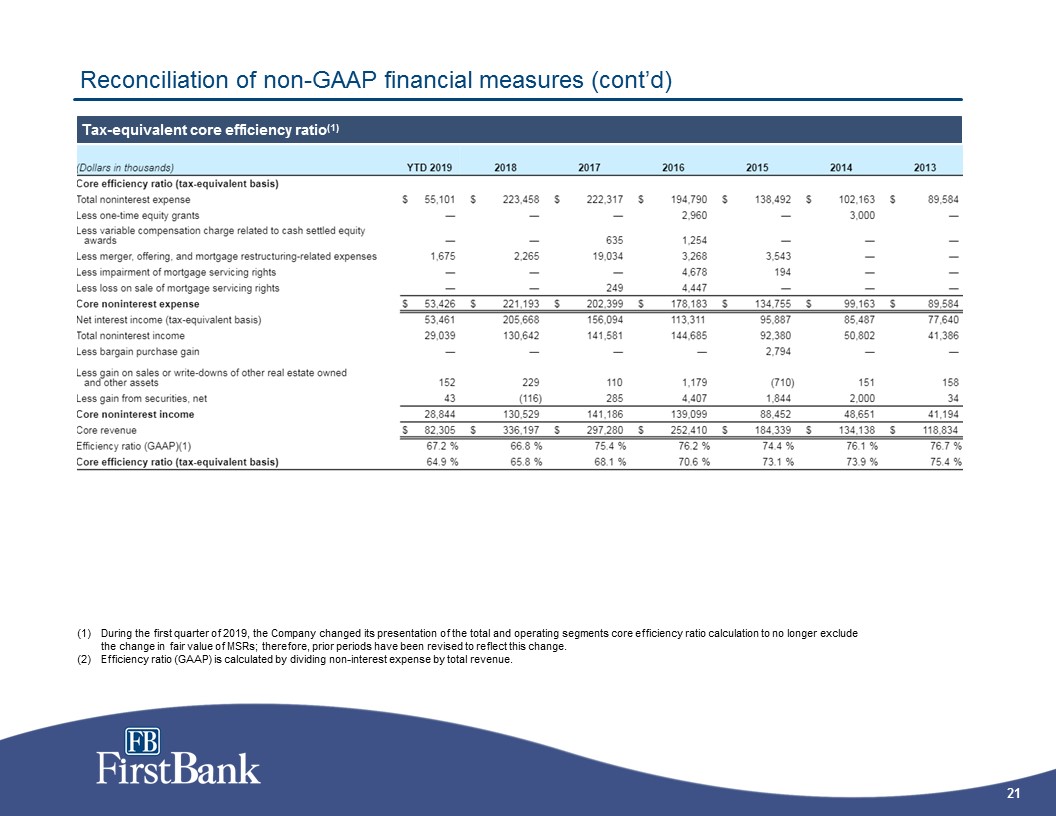
Reconciliation of non-GAAP financial measures (cont’d) Tax-equivalent core efficiency ratio(1) During the first quarter of 2019, the Company changed its presentation of the total and operating segments core efficiency ratio calculation to no longer exclude the change in fair value of MSRs; therefore, prior periods have been revised to reflect this change. Efficiency ratio (GAAP) is calculated by dividing non-interest expense by total revenue.
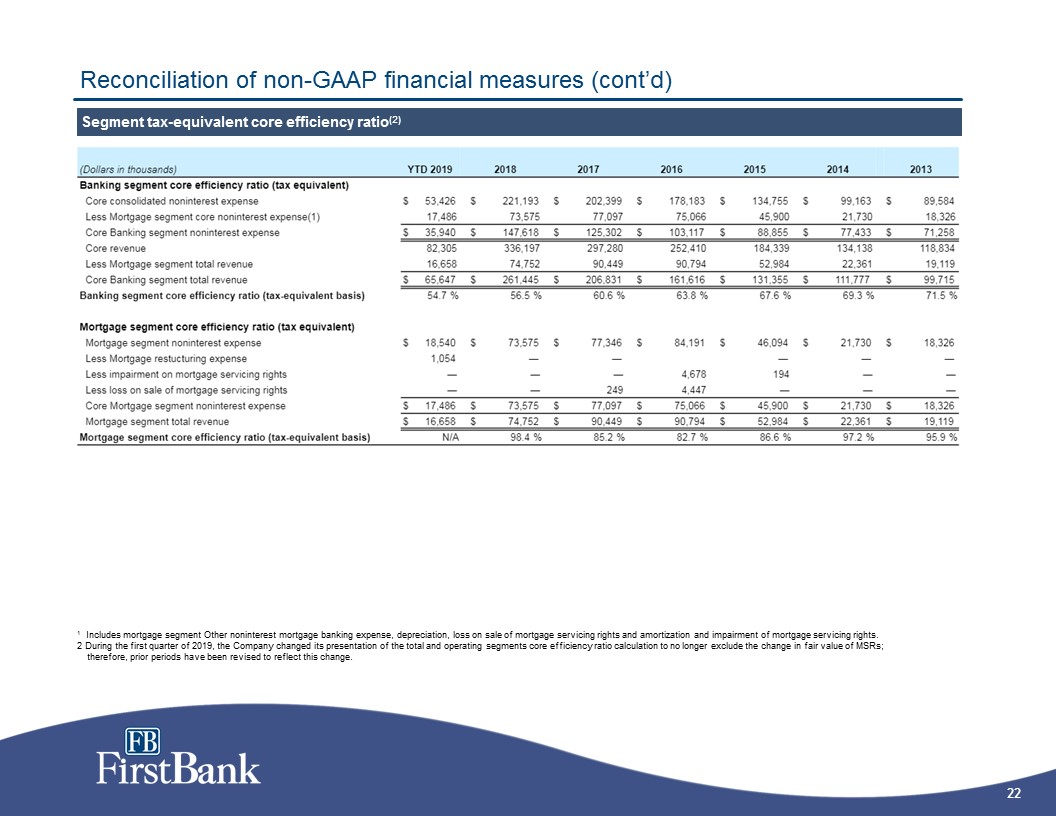
Reconciliation of non-GAAP financial measures (cont’d) Segment tax-equivalent core efficiency ratio(2) 1 Includes mortgage segment Other noninterest mortgage banking expense, depreciation, loss on sale of mortgage servicing rights and amortization and impairment of mortgage servicing rights.2 During the first quarter of 2019, the Company changed its presentation of the total and operating segments core efficiency ratio calculation to no longer exclude the change in fair value of MSRs; therefore, prior periods have been revised to reflect this change.
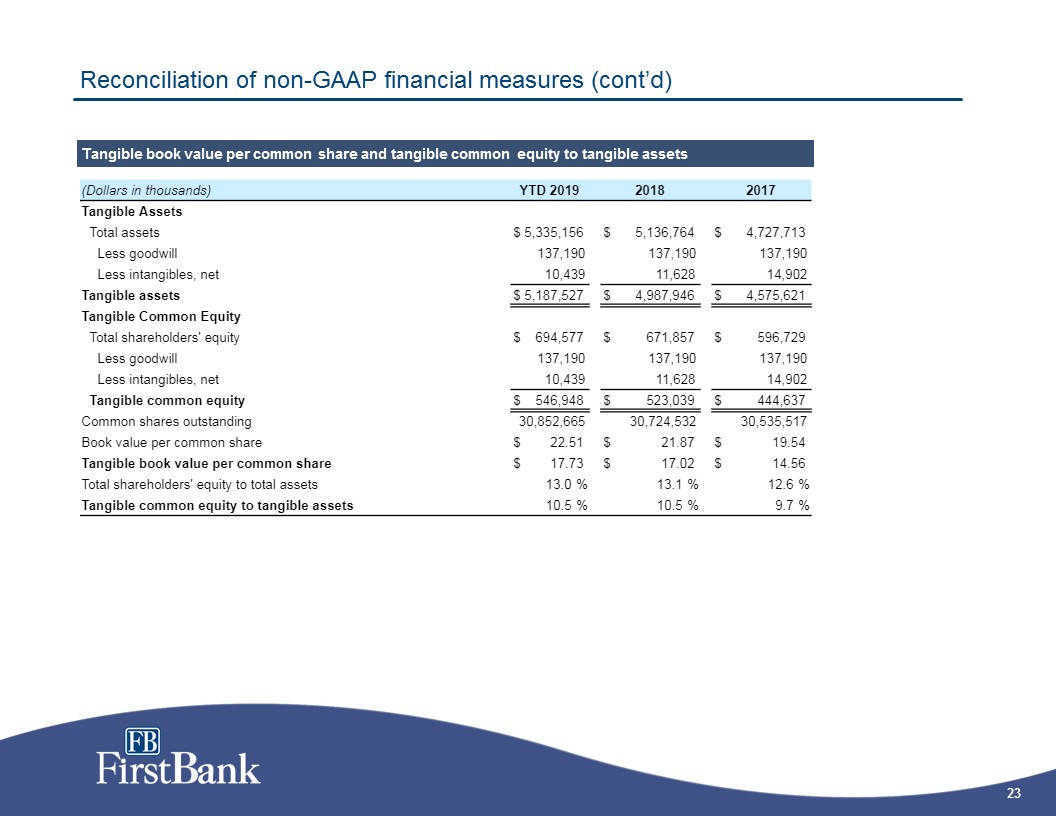
Tangible book value per common share and tangible common equity to tangible assets Reconciliation of non-GAAP financial measures (cont’d)
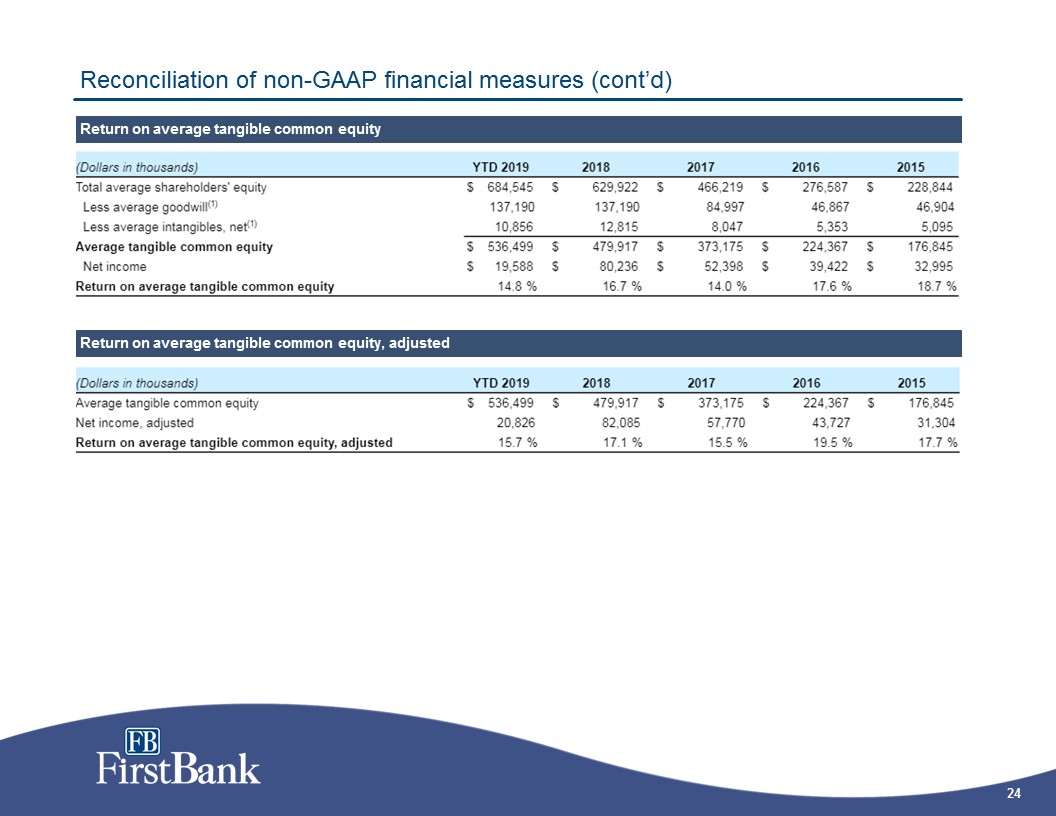
Reconciliation of non-GAAP financial measures (cont’d) Return on average tangible common equity Return on average tangible common equity, adjusted
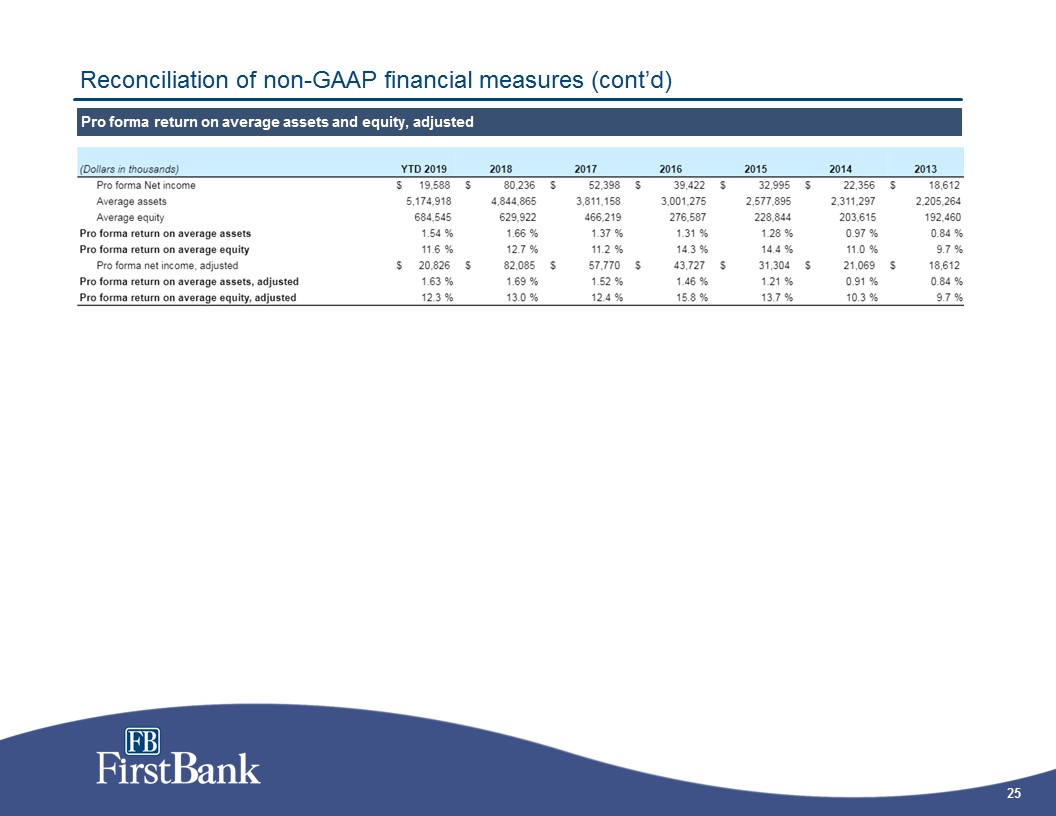
Reconciliation of non-GAAP financial measures (cont’d) Pro forma return on average assets and equity, adjusted

Reconciliation of non-GAAP financial measures (cont’d) Total mortgage contribution, adjusted