
Third Quarter 2020 Earnings Presentation October 27, 2020
Forward–Looking Statements Certain statements contained in this presentation may constitute forward-looking statements within the meaning of Section 27A of the Securities Act of 1933, as amended, and Section 21E of the Securities Exchange Act of 1934, as amended. These forward-looking statements include, without limitation, statements regarding the projected impact of the COVID-19 global pandemic on our business operations, statements relating to the timing, benefits, costs, and synergies of the mergers with Franklin Financial Network, Inc. (“Franklin”) (the “Franklin merger”) and FNB Financial Corp. (“FNB”) (together with the Franklin merger, the “mergers”), and FB Financial’s future plans, results, strategies, and expectations. These statements can generally be identified by the use of the words and phrases “may,” “will,” “should,” “could,” “would,” “goal,” “plan,” “potential,” “estimate,” “project,” “believe,” “intend,” “anticipate,” “expect,” “target,” “aim,” “predict,” “continue,” “seek,” “projection,” and other variations of such words and phrases and similar expressions. These forward-looking statements are not historical facts, and are based upon current expectations, estimates, and projections, many of which, by their nature, are inherently uncertain and beyond FB Financial’s control. The inclusion of these forward-looking statements should not be regarded as a representation by FB Financial or any other person that such expectations, estimates, and projections will be achieved. Accordingly, FB Financial cautions shareholders and investors that any such forward-looking statements are not guarantees of future performance and are subject to risks, assumptions, and uncertainties that are difficult to predict. Actual results may prove to be materially different from the results expressed or implied by the forward-looking statements. A number of factors could cause actual results to differ materially from those contemplated by the forward-looking statements including, without limitation, (1) current and future economic conditions, including the effects of declines in housing and commercial real estate prices, high unemployment rates, and a continued slowdown in economic growth in the local or regional economies in which we operate and/or the US economy generally, (2) the effects of the COVID-19 pandemic, including the magnitude and duration of the pandemic and its impact on general economic and financial market conditions and on our business and our customers' business, results of operations, asset quality and financial condition, (3) changes in government interest rate policies and its impact on our business, net interest margin, and mortgage operations, (4) our ability to effectively manage problem credits, (5) the risk that the cost savings and any revenue synergies from the mergers or another acquisition may not be realized or may take longer than anticipated to be realized, (6) disruption from the mergers with customer, supplier, or employee relationships, (7) the risks related to the integrations of the combined businesses following the Franklin merger, (8) the diversion of management time on issues related to the mergers, (9) the ability of FB Financial to effectively manage the larger and more complex operations of the combined company following the Franklin merger, (10) the risks associated with FB Financial’s pursuit of future acquisitions, (11) reputational risk and the reaction of the parties’ respective customers to the mergers, (12) FB Financial’s ability to successful execute its various business strategies, (13) uncertainty regarding changes to the U.S. presidential administration and/or Congress and any resulting impact on economic policy, capital markets, federal regulation, and the response to the COVD-19 pandemic; and (14) general competitive, economic, political, and market conditions. Further information regarding FB Financial and factors which could affect the forward-looking statements contained herein can be found in FB Financial's Annual Report on Form 10-K for the fiscal year ended December 31, 2019, and its other filings with the Securities and Exchange Commission (the “SEC”). Many of these factors are beyond FB Financial’s ability to control or predict. If one or more events related to these or other risks or uncertainties materialize, or if the underlying assumptions prove to be incorrect, actual results may differ materially from the forward-looking statements. Accordingly, shareholders and investors should not place undue reliance on any such forward-looking statements. Any forward- looking statement speaks only as of the date of this presentation, and FB Financial undertakes no obligation to publicly update or review any forward-looking statement, whether as a result of new information, future developments or otherwise, except as required by law. New risks and uncertainties may emerge from time to time, and it is not possible for FB Financial to predict their occurrence or how they will affect the company. FB Financial qualifies all forward-looking statements by these cautionary statements. 1

Use of non-GAAP financial measures This presentation contains certain financial measures that are not measures recognized under U.S. generally accepted accounting principles (“GAAP”) and therefore are considered non-GAAP financial measures. These non‐GAAP financial measures include, without limitation, adjusted net income, adjusted diluted earnings per share, adjusted pro forma net income, adjusted pro forma diluted earnings per share, pre-tax, pre-provision earnings, adjusted pre-tax, pre- provision earnings, adjusted pre-tax, pre-provision earnings per share, core noninterest expense, core revenue, core noninterest income, core efficiency ratio (tax-equivalent basis), banking segment core efficiency ratio (tax-equivalent basis), mortgage segment core efficiency ratio (tax-efficiency basis), adjusted mortgage contribution, adjusted return on average assets, equity and tangible common equity, pre-tax, pre-provision return on average assets, equity and tangible common equity, pro forma return on average assets and equity, pro forma adjusted return on average assets, equity and tangible common equity and adjusted pre-tax, pre-provision return on average assets, equity and tangible common equity, adjusted allowance for credit losses, adjusted loans held for investment, and adjusted allowance for credit losses as a percentage of loans held for investment, which excludes the impact of PPP loans. Each of these non- GAAP metrics excludes certain income and expense items that the Company’s management considers to be non‐core/adjusted in nature. The Company refers to these non‐GAAP measures as adjusted or core measures. The corresponding Earnings Release also presents tangible assets, tangible common equity, tangible book value per common share, tangible common equity to tangible assets, return on tangible common equity, return on average tangible common equity, and adjusted return on average tangible common equity. Each of these non-GAAP metrics excludes the impact of goodwill and other intangibles. The Company’s management uses these non-GAAP financial measures in their analysis of the Company’s performance, financial condition and the efficiency of its operations as management believes such measures facilitate period-to-period comparisons and provide meaningful indications of its operating performance as they eliminate both gains and charges that management views as non-recurring or not indicative of operating performance. Management believes that these non-GAAP financial measures provide a greater understanding of ongoing operations and enhance comparability of results with prior periods as well as demonstrating the effects of significant non-core gains and charges in the current and prior periods. The Company’s management also believes that investors find these non-GAAP financial measures useful as they assist investors in understanding the Company’s underlying operating performance and in the analysis of ongoing operating trends. In addition, because intangible assets such as goodwill and other intangibles, and the other items excluded each vary extensively from company to company, the Company believes that the presentation of this information allows investors to more easily compare the Company’s results to the results of other companies. However, the non-GAAP financial measures discussed herein should not be considered in isolation or as a substitute for the most directly comparable or other financial measures calculated in accordance with GAAP. Moreover, the manner in which the Company calculates the non-GAAP financial measures discussed herein may differ from that of other companies reporting measures with similar names. You should understand how such other banking organizations calculate their financial measures similar or with names similar to the non-GAAP financial measures the Company has discussed herein when comparing such non-GAAP financial measures. The following tables provide a reconciliation of these measures to the most directly comparable GAAP financial measures. 2

3Q 2020 highlights Key highlights Financial results Closed Franklin Financial Network (“FSB”) merger in August; 3Q 2020 completed systems conversion on October 12th Diluted earnings per share $(0.14) Converted mobile and online banking platform in July Adjusted diluted earnings per share1 $1.46 Raised $100 million in bank-level subordinated notes with 4.50% Net income ($mm) $(5.6) 1 coupon in August Adjusted net income ($mm) $59.5 Return on average assets (0.24)% Increased on-balance sheet liquidity to 14.7% of tangible assets from Adjusted return on average assets1 2.58% 14.0% in 2Q 2020; loans HFI / deposits to 79.3% Return on average equity (2.1)% FSB merger related provisioning increased Adjusted ACL / Gross Adjusted return on average equity1 22.6% Loans HFI (excluding PPP loans) 1 to 2.66% Adjusted pre-tax, pre-provision earnings1 ($mm) $72.3 Adjusted pre-tax, pre-provision earnings1 of $72.3 million, up 25.0% over 2Q 2020, resulting in adjusted pre-tax, pre-provision ROAA1 of Adjusted pre-tax, pre-provision return on average 3.13% 3.13% assets1 Zero rate environment and impact of liquidity and PPP loans results in Adjusted pre-tax, pre-provision return on average 35.1% a net interest margin of 3.28% for 3Q 2020 tangible common equity1 – Contractual yield on loans of 4.36%, down 21 bps from 2Q 2020; Net interest margin 3.28% PPP loans had an 18 bps impact on contractual yield Impact of accretion and nonaccrual interest (bps) 5 Efficiency ratio 71.2% – Cost of total deposits of 0.56%, down 9 bps from 2Q 2020. Core efficiency ratio1 58.2% 1 Total adjusted pre-tax mortgage contribution of $39.5 million in 3Q Tangible common equity / tangible assets1 9.2% 2020 Organic customer deposit growth of $64.7 million, or 4.3% annualized from 2Q 2020 1 Results are non-GAAP financial measures that adjust GAAP reported net income, total assets, equity and other metrics for certain intangibles, income and expense items as outlined in the non-GAAP reconciliation calculations, using a combined marginal income tax rate of 26.06% excluding one-time items. See “Use of non-GAAP financial measures” and the Appendix hereto for a discussion and reconciliation of non-GAAP financial measures. 3

Aggressively managing for impact of COVID-19 .No pandemic related reductions in force, and remote work environment has been effective Health and .Branch lobby service reinstated across the footprint with sneeze guards and social distancing methods Safety in place .Back office personnel have begun transition back to the office with social distancing guidelines in place .Loans HFI / Deposits of 79.3% .Monitoring movement of deposits as balances and organic growth remain elevated Liquidity .Approximately $571 million in non-core funding expected to leave the balance sheet by December 31, 2020, consisting of $51 million in non-core customer CDs, $420 million in institutional money market accounts and $100 million in FHLB Advances .Total Risk Based Capital ratio increased to 15.9% as of September 30, 2020 from 13.2% as of June 30, 2020 on the strength of strong core earnings and $100 million subordinated notes raised in August Capital .Increased Allowance for Credit Losses to 2.55% of Loans HFI, or 2.66% adjusted to exclude PPP loans1 .C&D / Total RBC of 90%, under regulatory guidance of 100% a year earlier than expected .Mortgage continues to capitalize on low rate environment, delivered $39.5 million in total mortgage direct contribution in the third quarter and has delivered $81.1 million year-to-date Profitability .Cost of total deposits declined 9 bps from 2Q 2020 to 0.56% .$257 million in time deposits with a weighted average cost of 1.77% mature in 4Q 2020 .Risk-off related paydowns and limited economic activity hampered organic loan growth in 3Q 2020 .Strong pipeline reported by the field; expect return to organic loan growth in 4Q 2020 and 2021 Growth .Lifted out a strong commercial team in Memphis that has been performing well in their first months as part of the FirstBank team ¹ See “Use of non-GAAP financial measures” and the Appendix hereto for a discussion and reconciliation of non-GAAP financial measures. 4

Markets have reopened for economic activity Government Guidance on Economic Activity Close Contact Entertainment Map Market Retail Restaurant Gyms Mask Orders Providers Venues Key Open w/ Open w/ Open w/ Open w/ Open w/ Strongly Tennessee1 Distancing Distancing Distancing Distancing Distancing Encouraged Open w/ Open w/ Open w/ Open w/ Strongly Georgia2 50% Capacity Distancing Distancing Distancing Distancing Encouraged Requirement, as Kentucky3 50% Capacity 50% Capacity 50% Capacity 50% Capacity 50% Capacity of September 15 Open w/ Open w/ Open w/ Requirement, as Alabama4 50% Capacity 50% Capacity Distancing Distancing Distancing of October 2 Davidson Requirement, as 75% Capacity 50% Capacity 50% Capacity 50% Capacity 50% Capacity County5 of October 1 Open w/ Open w/ Open w/ Open w/ Open w/ Requirement, as Shelby County6 Distancing Distancing Distancing Distancing Distancing of August 24 FBK County Footprint Reopening Map 1 Source: tn.gov/governor/covid-19. Tennessee Pledge 2 Source: georgia.org/covid19bizguide#other. Georgia’s Statewide Executive Order: Guidelines for Businesses. 3 Source: govstatus.egov.com/ky-healthy-at-work. Healthy at Work - Reopening Kentucky. 4 Source: alabamapublichealth.gov. Coronavirus Disease 2019. 5 Source: asafenashville.org. Roadmap for Reopening Nashville: Phase 2 Guidance and Resources 6 Source: https://insight.livestories.com/s/v2/covid-19-frequently-asked-questions-directives-shelby-county-tn. Health Directive from The Shelby County Public Health Department. 5

And many customers are executing on the reopening Color from the field . “Economic activity across our markets continues to pick back up. Residential construction continues to perform very well, and we are seeing continued demand for commercial real estate transactions. We have taken a closer look at some of our sponsor relationships to ensure that we are comfortable with all of our exposures, which has led to some de-risking of the portfolio to the tune of $40 to $50 million over the past two quarters. Consistent with the rest of our footprint, our hotels and restaurants continue to struggle due to the pandemic, but we feel good about the operators and guarantors that we have partnered with.” – Jim Mosby, Nashville North Regional President . “Williamson and Rutherford counties are pretty well re-opened and are seeing a fair amount of economic activity. Residential demand remains very strong for those two counties, and our homebuilder clients continue to have strong years as a result. The systems conversion has gone about as well as could be expected for our clients, and the limited issues that we’ve seen so far have been manageable. Our team is excited to be fully part of the FirstBank family.” – David McDaniel, Nashville South Regional President . “We have our new Knoxville headquarters location opening this quarter. It is a high visibility property in a great part of town and has spurred some chatter in the market. The East Region has gotten some exciting opportunities this year that frankly wouldn’t have been available to us a few years ago as the result of our increased presence in those markets. We’ve also been using this year to take a critical view of the loan portfolio, so in general we feel very good about our current portfolio. However, we do continue to see some softness in the small business market. The consensus out of the East Region is that the first and second quarters of 2021 should be very strong.” – Nathan Hunter, East Tennessee Regional President . “We lifted out a very strong commercial team in Memphis early in the third quarter which at this point is almost fully fleshed out. That group has been doing very well in bringing their customer base over to FirstBank, and we expect pretty strong loan growth out of the team as that process continues over the next few quarters. Across the rest of West Tennessee, activity has been fairly steady. No real credit concerns have been popping up yet. We are also seeing some strong demand for real estate deals as clients choose to park their money there rather than in low yields from financial institutions or what many view as an overvalued stock market.” – David Burden, West Tennessee Regional President . “The community markets are seeing consistent demand for new loan opportunities. Our loan portfolio continues to perform with minimal concerns. The area has experienced an increase in new and existing home prices year over year. Our homebuilder portfolio continues to perform. I have sensed some level of concern from home builders and individuals that were planning on starting new projects relating to the spike in cost of building materials. The area is seeing solid growth in new deposit relationships.” – Troy Martin, South Central Tennessee Area President . “Our customers are doing great, and we don’t have lingering concerns about clients that received deferrals. The economy in North Alabama is very strong right now; lumber, trucking and residential construction are industries that have bounced back particularly well. We are doing well to convert prospects to customers, particularly on the C&I front where we are winning the full loan, deposit and treasury relationship. We should have a strong fourth quarter and see that carrying over into 2021.” – Mike McCrary, North Alabama Area President 6

While we continue to work with impacted customers Deferral programs Remaining deferrals by type ($465 million1) . First deferral held no requirements; granting of second $270.6 deferrals are being decided on a case-by-case basis . Standard consumer loan received 2-payment relief; standard commercial loan received 90 day principal and interest forbearance; relationship managers had authority to offer plans that varied from the standard $86.3 $43.3 $35.9 . Working with customers in industries disproportionately $19.0 $9.2 4.2% 16.5% 3.0% 3.8% $0.6 affected by social distancing restrictions, including 11.5% 2.2% hospitality and restaurants C&I 3 CRE C&D Multifamily 1-4 Family 1-4 Family Consumer & HELOC Other Returned to normal / other by type ($1.2 billion2) . Of the $1.6 billion in loans given a deferral, $465 million, or $441.5 $432.5 6.4% of total loans HFI, remain in some sort of deferral as of September 30, 2020 – $116 million are still in the first deferral period – $349 million have been granted additional deferrals $116.8 $112.5 . Approximately 6.1% of loans held in our mortgage servicing $50.9 portfolio were in forbearance as of September 30, 2020 $11.5 $15.5 21.7% 26.3% 9.8% 30.7% 9.9% 2.7% C&I 3 CRE C&D Multifamily 1-4 Family 1-4 Family Consumer & HELOC Other ¹ Balances based on deferral participants’ loan balances outstanding as of September 30, 2020. %’s are deferrals as a percentage of total outstanding balances in each reporting category as of September 30, 2020. 2 Balances based on deferral participants’ as of September 30, 2020 and loan balances outstanding as of September 30, 2020. %’s are deferrals as a percentage of each reporting category as of September 30, 2020.3 Includes owner-occupied CRE, excludes PPP loans. 7
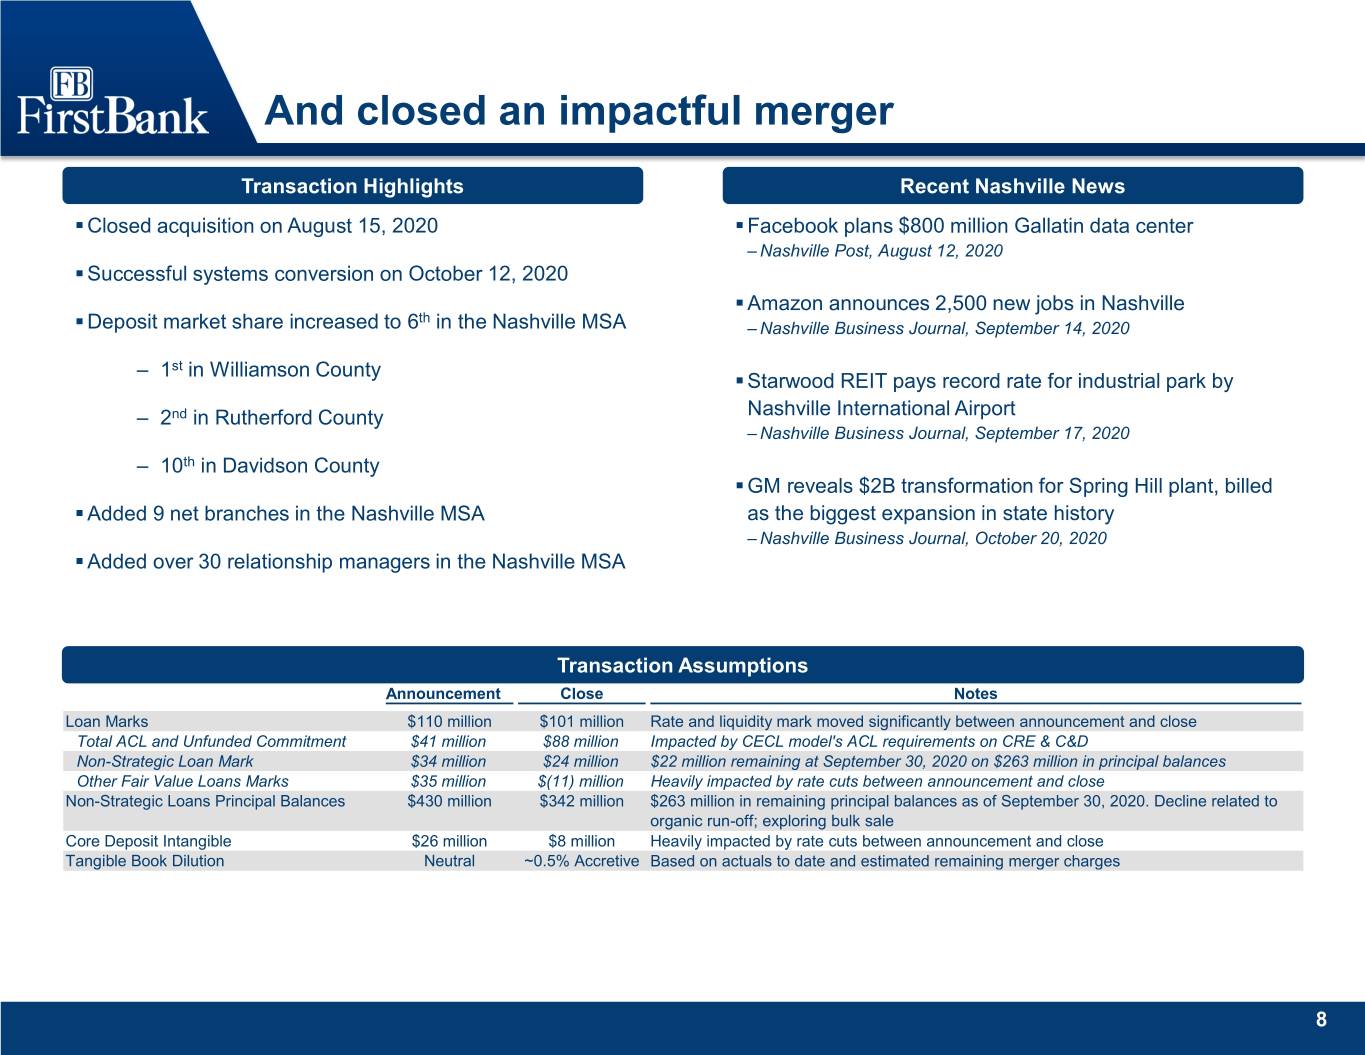
And closed an impactful merger Transaction Highlights Recent Nashville News . Closed acquisition on August 15, 2020 . Facebook plans $800 million Gallatin data center – Nashville Post, August 12, 2020 . Successful systems conversion on October 12, 2020 . Amazon announces 2,500 new jobs in Nashville th . Deposit market share increased to 6 in the Nashville MSA – Nashville Business Journal, September 14, 2020 – 1st in Williamson County . Starwood REIT pays record rate for industrial park by – 2nd in Rutherford County Nashville International Airport – Nashville Business Journal, September 17, 2020 – 10th in Davidson County . GM reveals $2B transformation for Spring Hill plant, billed . Added 9 net branches in the Nashville MSA as the biggest expansion in state history – Nashville Business Journal, October 20, 2020 . Added over 30 relationship managers in the Nashville MSA Transaction Assumptions Announcement Close Notes Loan Marks $110 million $101 million Rate and liquidity mark moved significantly between announcement and close Total ACL and Unfunded Commitment $41 million $88 million Impacted by CECL model's ACL requirements on CRE & C&D Non-Strategic Loan Mark $34 million $24 million $22 million remaining at September 30, 2020 on $263 million in principal balances Other Fair Value Loans Marks $35 million $(11) million Heavily impacted by rate cuts between announcement and close Non-Strategic Loans Principal Balances $430 million $342 million $263 million in remaining principal balances as of September 30, 2020. Decline related to organic run-off; exploring bulk sale Core Deposit Intangible $26 million $8 million Heavily impacted by rate cuts between announcement and close Tangible Book Dilution Neutral ~0.5% Accretive Based on actuals to date and estimated remaining merger charges 8

Strong liquidity position Customer deposit base has seen consistent growth in On Balance Sheet Liquidity balances over the past 12 months and remains a stable base of funding and liquidity On-Balance Sheet Liqudity On balance sheet liquidity / tangible assets $1,585.0 Finalizing plan for the remaining non-core funding acquired $1,600.0 $1,400.0 in FSB merger $1,200.0 $988.5 $1,000.0 $773.5 $800.0 $581.4 $550.7 Monitoring movement of recent influx of deposits $600.0 14.0% 14.7% $400.0 12.0% 9.9% $200.0 9.3% $- 3Q19 4Q19 1Q20 2Q20 3Q20 Loans HFI / Customer Deposits Sources of Liquidity 3Q 2020 89.7% 88.7% Current On-Balance Sheet: 85.3% Cash and Equivalents $1,062.4 81.3% 80.1% Unpledged Securities 518.2 Equity Securities 4.4 Total On-Balance Sheet $1,585.0 Available Sources of Liquidity: Brokered CDs and Unsecured Lines $2,961.1 FHLB 1,569.7 Discount Window 1,605.2 Total Available Sources $6,136.0 3Q19 4Q19 1Q20 2Q20 3Q20 9
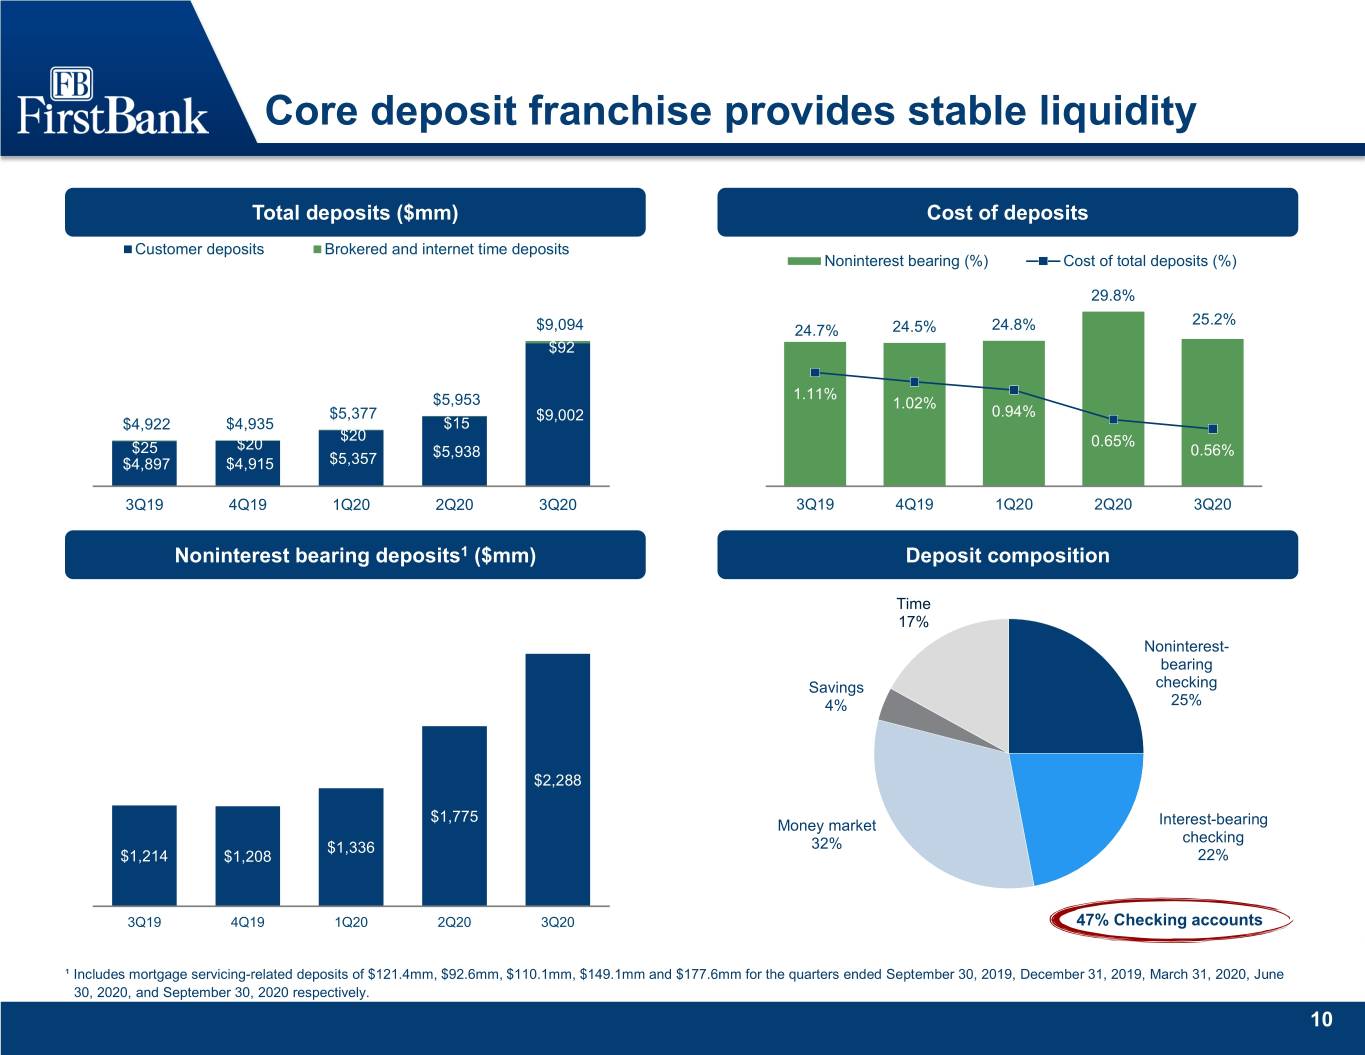
Core deposit franchise provides stable liquidity Total deposits ($mm) Cost of deposits Customer deposits Brokered and internet time deposits Noninterest bearing (%) Cost of total deposits (%) 35.0% 29.8% 30.0% 25.2% $9,094 24.7% 24.5% 24.8% 25.0% $92 20.0% 1.11% $5,953 15.0% 1.02% $5,377 $9,002 0.94% $4,922 $4,935 $15 10.0% $20 $25 $20 0.65% $5,938 5.0% 0.56% $4,897 $4,915 $5,357 0.0% 3Q19 4Q19 1Q20 2Q20 3Q20 3Q19 4Q19 1Q20 2Q20 3Q20 Noninterest bearing deposits1 ($mm) Deposit composition Time 17% Noninterest- bearing Savings checking 4% 25% $2,288 $1,775 Money market Interest-bearing checking $1,336 32% $1,214 $1,208 22% 3Q19 4Q19 1Q20 2Q20 3Q20 47% Checking accounts ¹ Includes mortgage servicing-related deposits of $121.4mm, $92.6mm, $110.1mm, $149.1mm and $177.6mm for the quarters ended September 30, 2019, December 31, 2019, March 31, 2020, June 30, 2020, and September 30, 2020 respectively. 10
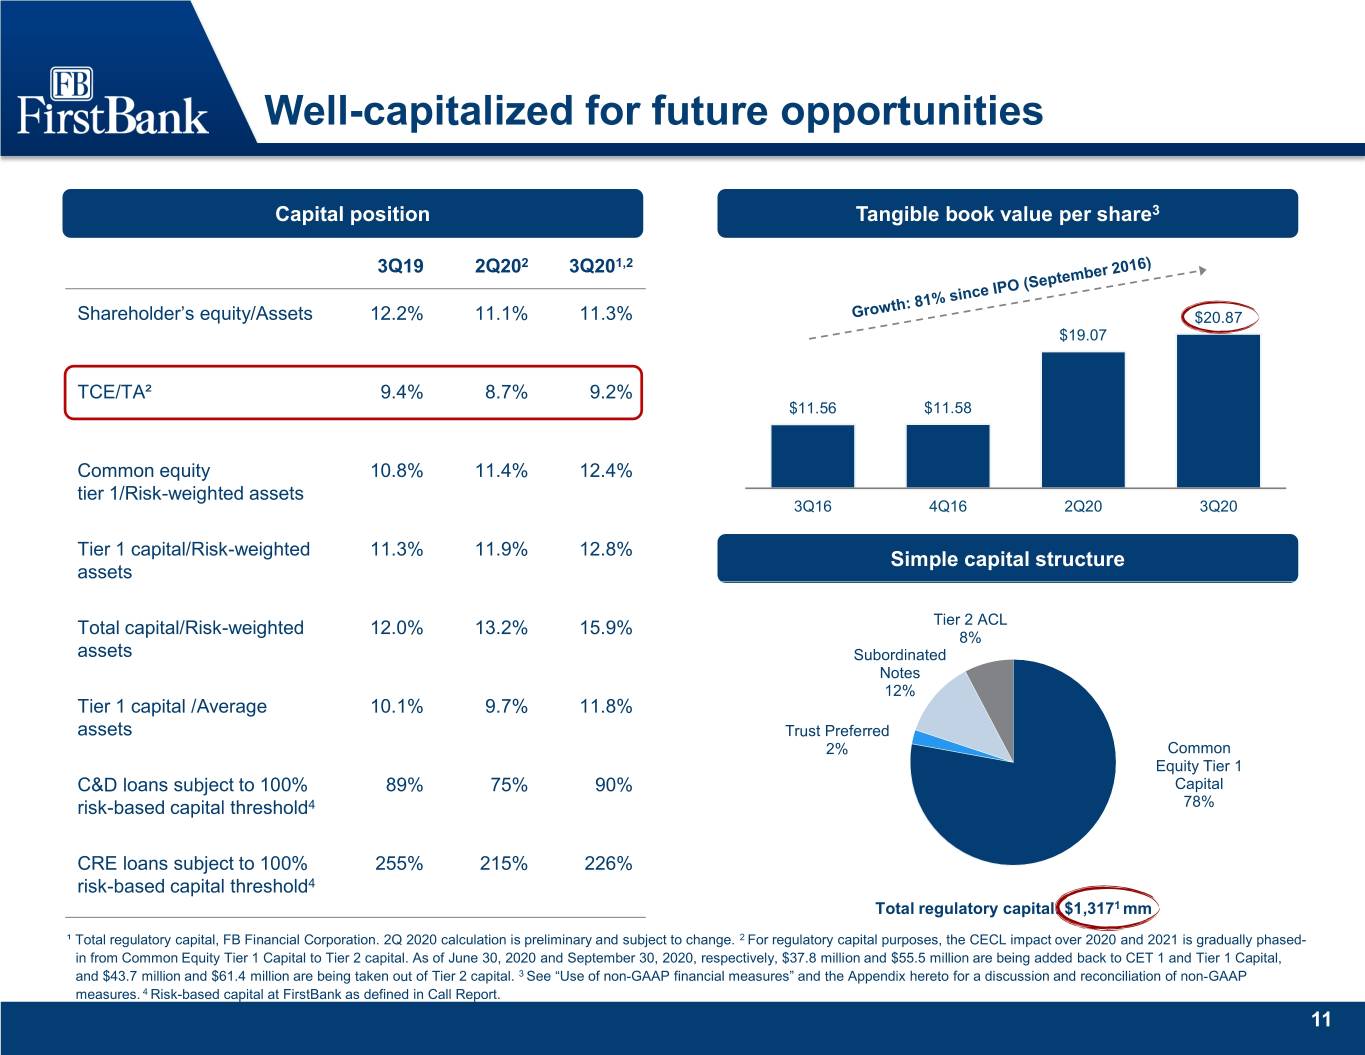
Well-capitalized for future opportunities Capital position Tangible book value per share3 3Q19 2Q202 3Q201,2 Shareholder’s equity/Assets 12.2% 11.1% 11.3% $20.87 $19.07 TCE/TA² 9.4% 8.7% 9.2% $11.56 $11.58 Common equity 10.8% 11.4% 12.4% tier 1/Risk-weighted assets 3Q16 4Q16 2Q20 3Q20 Tier 1 capital/Risk-weighted 11.3% 11.9% 12.8% Simple capital structure assets Tier 2 ACL Total capital/Risk-weighted 12.0% 13.2% 15.9% 8% assets Subordinated Notes 12% Tier 1 capital /Average 10.1% 9.7% 11.8% assets Trust Preferred 2% Common Equity Tier 1 C&D loans subject to 100% 89% 75% 90% Capital risk-based capital threshold4 78% CRE loans subject to 100% 255% 215% 226% risk-based capital threshold4 Total regulatory capital: $1,3171 mm ¹ Total regulatory capital, FB Financial Corporation. 2Q 2020 calculation is preliminary and subject to change. 2 For regulatory capital purposes, the CECL impact over 2020 and 2021 is gradually phased- in from Common Equity Tier 1 Capital to Tier 2 capital. As of June 30, 2020 and September 30, 2020, respectively, $37.8 million and $55.5 million are being added back to CET 1 and Tier 1 Capital, and $43.7 million and $61.4 million are being taken out of Tier 2 capital. 3 See “Use of non-GAAP financial measures” and the Appendix hereto for a discussion and reconciliation of non-GAAP measures. 4 Risk-based capital at FirstBank as defined in Call Report. 11
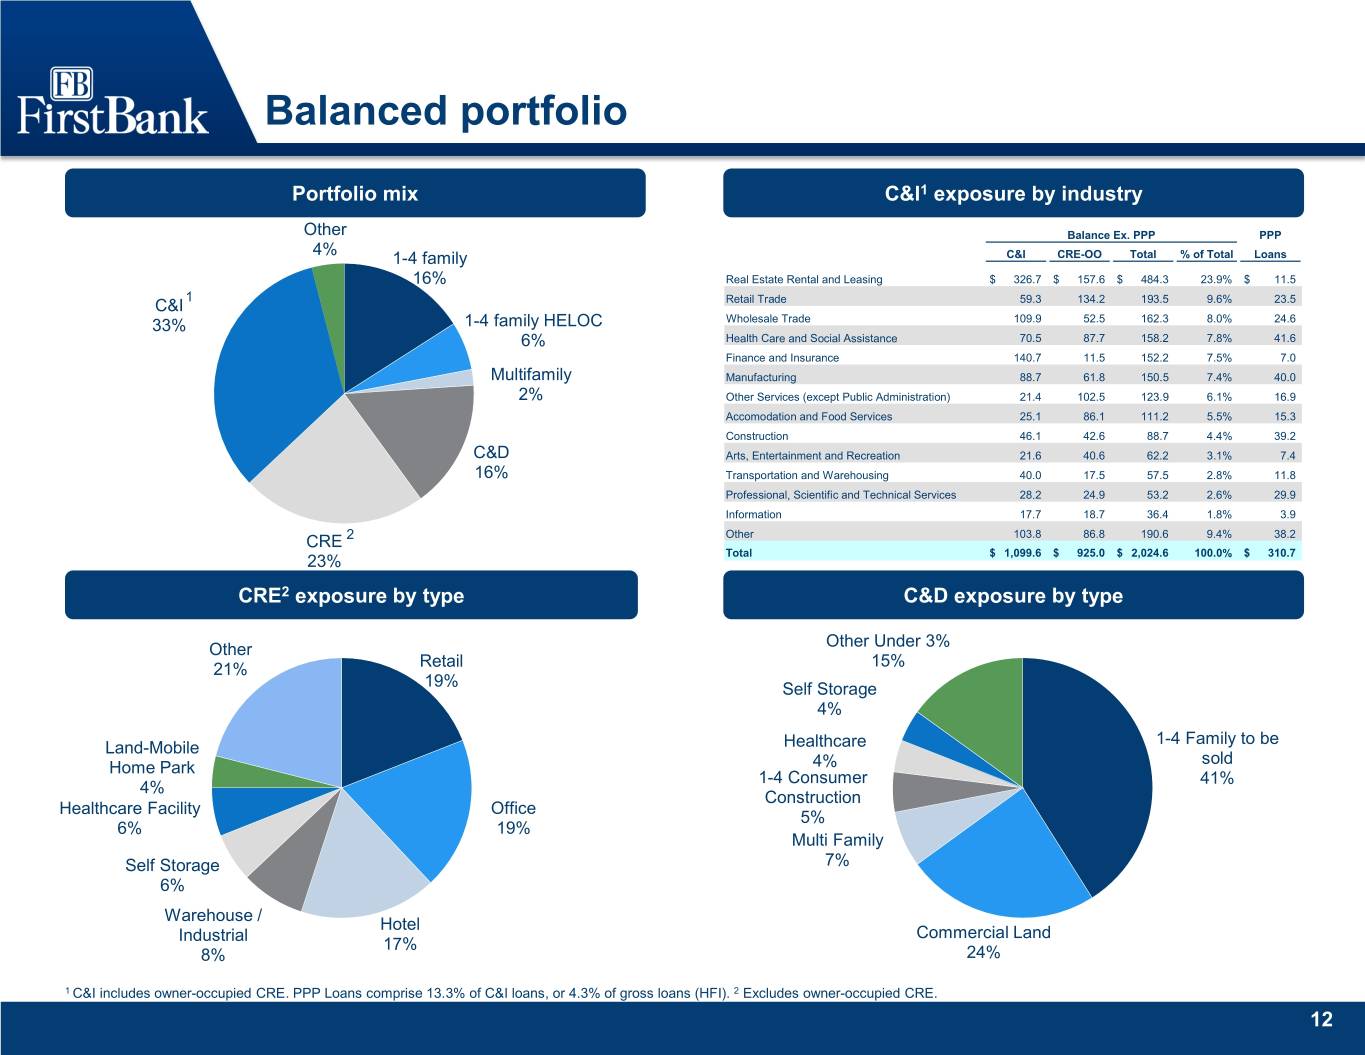
Balanced portfolio Portfolio mix C&I1 exposure by industry Other Balance Ex. PPP PPP 4% 1-4 family C&I CRE-OO Total % of Total Loans 16% Real Estate Rental and Leasing $ 326.7 $ 157.6 $ 484.3 23.9% $ 11.5 1 C&I Retail Trade 59.3 134.2 193.5 9.6% 23.5 33% 1-4 family HELOC Wholesale Trade 109.9 52.5 162.3 8.0% 24.6 6% Health Care and Social Assistance 70.5 87.7 158.2 7.8% 41.6 Finance and Insurance 140.7 11.5 152.2 7.5% 7.0 Multifamily Manufacturing 88.7 61.8 150.5 7.4% 40.0 2% Other Services (except Public Administration) 21.4 102.5 123.9 6.1% 16.9 Accomodation and Food Services 25.1 86.1 111.2 5.5% 15.3 Construction 46.1 42.6 88.7 4.4% 39.2 C&D Arts, Entertainment and Recreation 21.6 40.6 62.2 3.1% 7.4 16% Transportation and Warehousing 40.0 17.5 57.5 2.8% 11.8 Professional, Scientific and Technical Services 28.2 24.9 53.2 2.6% 29.9 Information 17.7 18.7 36.4 1.8% 3.9 CRE 2 Other 103.8 86.8 190.6 9.4% 38.2 Total $ 1,099.6 $ 925.0 $ 2,024.6 100.0% $ 310.7 23% CRE2 exposure by type C&D exposure by type Other Other Under 3% 21% Retail 15% 19% Self Storage 4% 1-4 Family to be Land-Mobile Healthcare sold Home Park 4% 1-4 Consumer 41% 4% Construction Healthcare Facility Office 5% 6% 19% Multi Family Self Storage 7% 6% Warehouse / Hotel Industrial Commercial Land 17% 8% 24% 1 C&I includes owner-occupied CRE. PPP Loans comprise 13.3% of C&I loans, or 4.3% of gross loans (HFI). 2 Excludes owner-occupied CRE. 12

Industries of concern Industries initially considered to be the most susceptible to Industry exposures / gross loans (HFI) issues associated with the pandemic 8.7% Credit quality remains satisfactory overall Optimistic regarding the group’s resiliency and ability to manage through this economy 4.7% 4.7% Significant level of initial deferrals but steady improvement and return to pre-COVID payment plans 1.9% 1.8% 1.8% Hotel business continues to face biggest challenges Retail Hotel Healthcare Restaurant Other Leisure Transportation Industries of concern credit quality Industries of concern deferral participants 92.1% $448 $242 $58 4.4% 1.4% 2.0% $9 Pass Watch Special Mention Substandard Remaining First Second Deferrals Returned to Normal Other Deferrals Note: Exposures included will differ from “C&I Exposure by Industry” table on slide 12 due to inclusion of non-owner occupied and other balances as well as additional tangential exposures. 13

Retail portfolio – 8.7% of gross loans HFI 64% CRE Non-OO and Other and 36% C&I / CRE-OO Portfolio overview CRE Non-owner occupied and Other Car, RV, Boat and – Diverse portfolio across the footprint, primarily local ATV Dealers 17% properties, largely smaller strip centers Gas Stations and Convenience Stores – Concentration increased with FSB merger, but generally 5% Pharmacies and drug stores similar portfolio characteristics 2% – Merger did add a ~$35 million mall property, performing Other Retailers < as agreed, no deferral, low loan to value 3% Non-Owner Occ / 13% Other CRE C&I / CRE-OO portfolio 64% – Largest segment related to Car, RV and Boat Dealers, which has experienced satisfactory post-COVID results – Limited deferrals Credit quality Deferral participants $241 95.4% $17 $8 $- 1.3% 1.7% 1.6% Remaining First Second Deferrals Returned to Normal Other Deferrals Pass Watch Special Mention Substandard Note: Exposures included will differ from “C&I Exposure by Industry” table on slide 12 due to inclusion of non-owner occupied and other balances as well as additional tangential exposures. 14
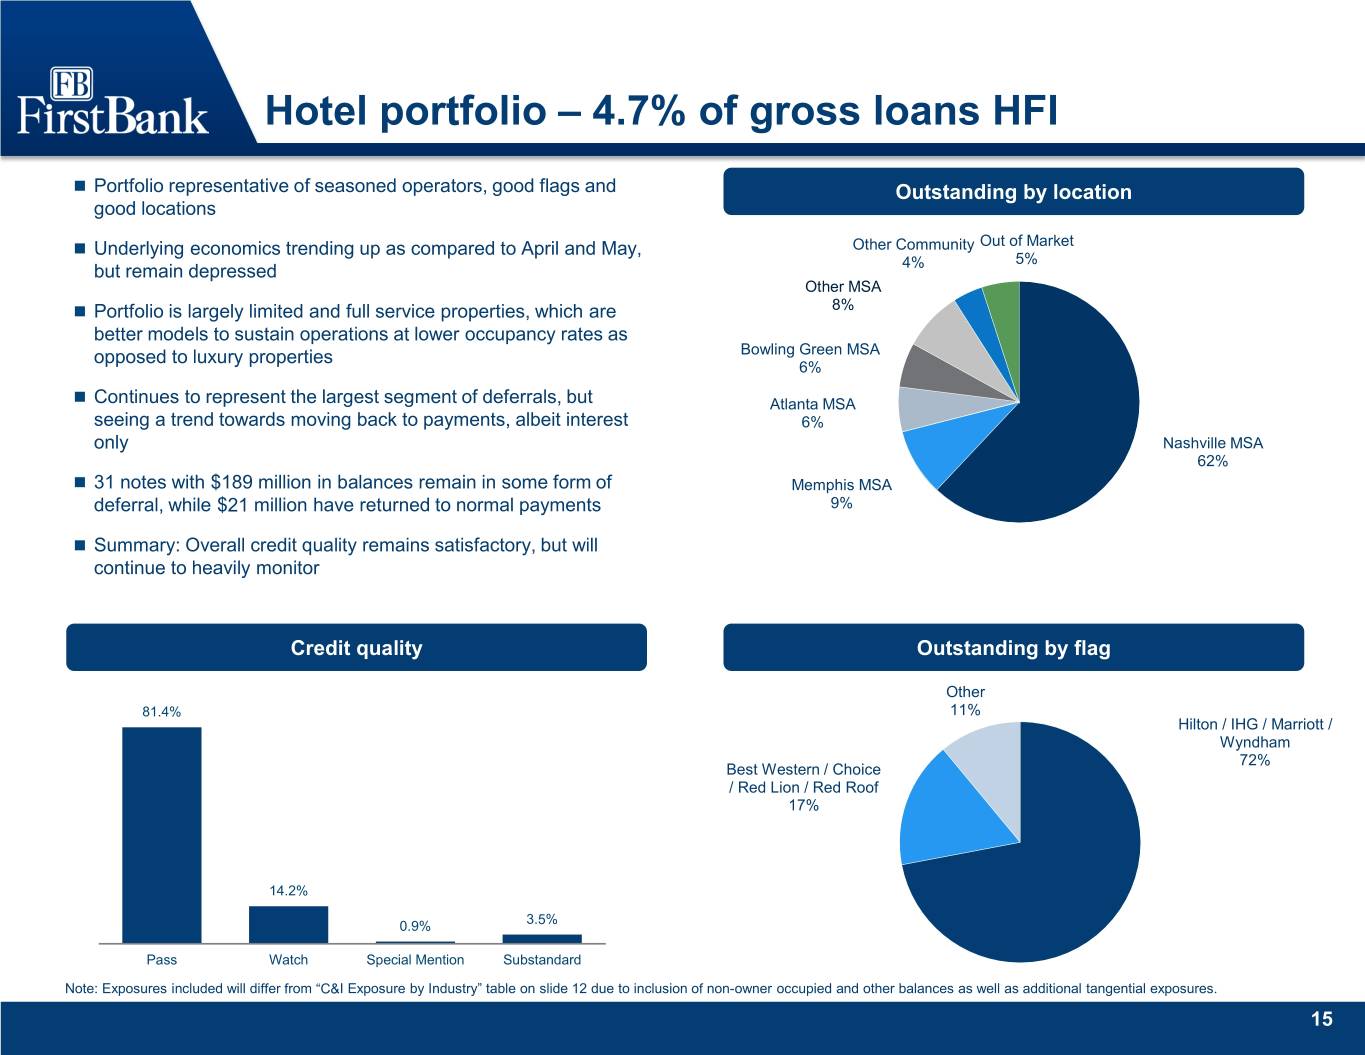
Hotel portfolio – 4.7% of gross loans HFI Portfolio representative of seasoned operators, good flags and Outstanding by location good locations Underlying economics trending up as compared to April and May, Other Community Out of Market 5% but remain depressed 4% Other MSA Portfolio is largely limited and full service properties, which are 8% better models to sustain operations at lower occupancy rates as opposed to luxury properties Bowling Green MSA 6% Continues to represent the largest segment of deferrals, but Atlanta MSA seeing a trend towards moving back to payments, albeit interest 6% only Nashville MSA 62% 31 notes with $189 million in balances remain in some form of Memphis MSA deferral, while $21 million have returned to normal payments 9% Summary: Overall credit quality remains satisfactory, but will continue to heavily monitor Credit quality Outstanding by flag Other 81.4% 11% Hilton / IHG / Marriott / Wyndham 72% Best Western / Choice / Red Lion / Red Roof 17% 14.2% 0.9% 3.5% Pass Watch Special Mention Substandard Note: Exposures included will differ from “C&I Exposure by Industry” table on slide 12 due to inclusion of non-owner occupied and other balances as well as additional tangential exposures. 15
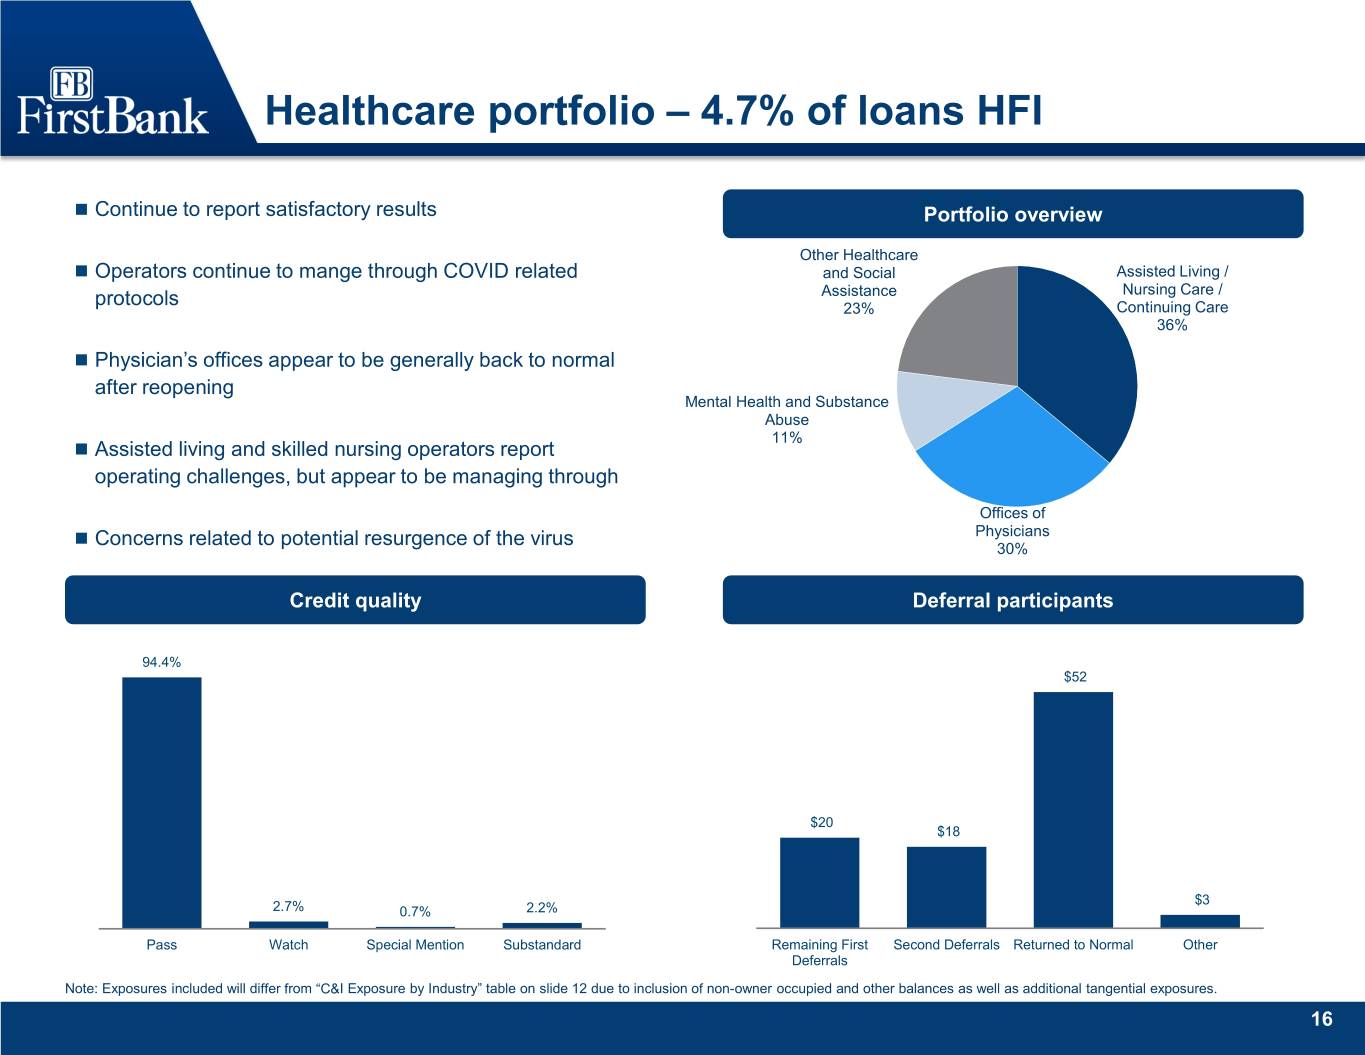
Healthcare portfolio – 4.7% of loans HFI Continue to report satisfactory results Portfolio overview Other Healthcare Operators continue to mange through COVID related and Social Assisted Living / Assistance Nursing Care / protocols 23% Continuing Care 36% Physician’s offices appear to be generally back to normal after reopening Mental Health and Substance Abuse 11% Assisted living and skilled nursing operators report operating challenges, but appear to be managing through Offices of Physicians Concerns related to potential resurgence of the virus 30% Credit quality Deferral participants 94.4% $52 $20 $18 $3 2.7% 0.7% 2.2% Pass Watch Special Mention Substandard Remaining First Second Deferrals Returned to Normal Other Deferrals Note: Exposures included will differ from “C&I Exposure by Industry” table on slide 12 due to inclusion of non-owner occupied and other balances as well as additional tangential exposures. 16
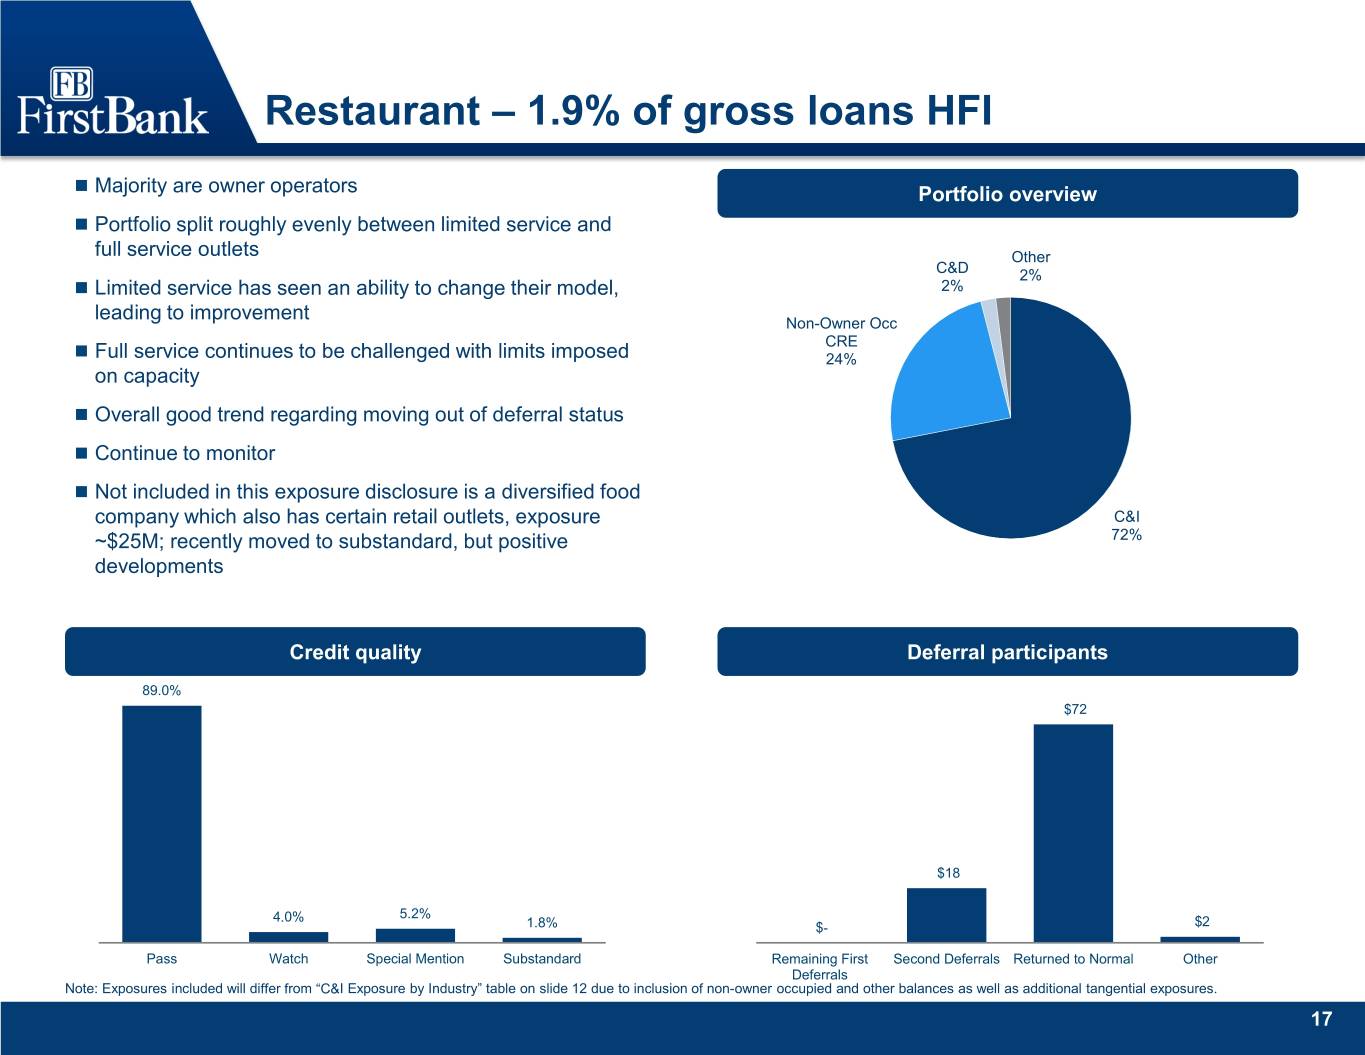
Restaurant – 1.9% of gross loans HFI Majority are owner operators Portfolio overview Portfolio split roughly evenly between limited service and full service outlets Other C&D 2% Limited service has seen an ability to change their model, 2% leading to improvement Non-Owner Occ CRE Full service continues to be challenged with limits imposed 24% on capacity Overall good trend regarding moving out of deferral status Continue to monitor Not included in this exposure disclosure is a diversified food company which also has certain retail outlets, exposure C&I ~$25M; recently moved to substandard, but positive 72% developments Credit quality Deferral participants 89.0% $72 $18 4.0% 5.2% 1.8% $- $2 Pass Watch Special Mention Substandard Remaining First Second Deferrals Returned to Normal Other Deferrals Note: Exposures included will differ from “C&I Exposure by Industry” table on slide 12 due to inclusion of non-owner occupied and other balances as well as additional tangential exposures. 17
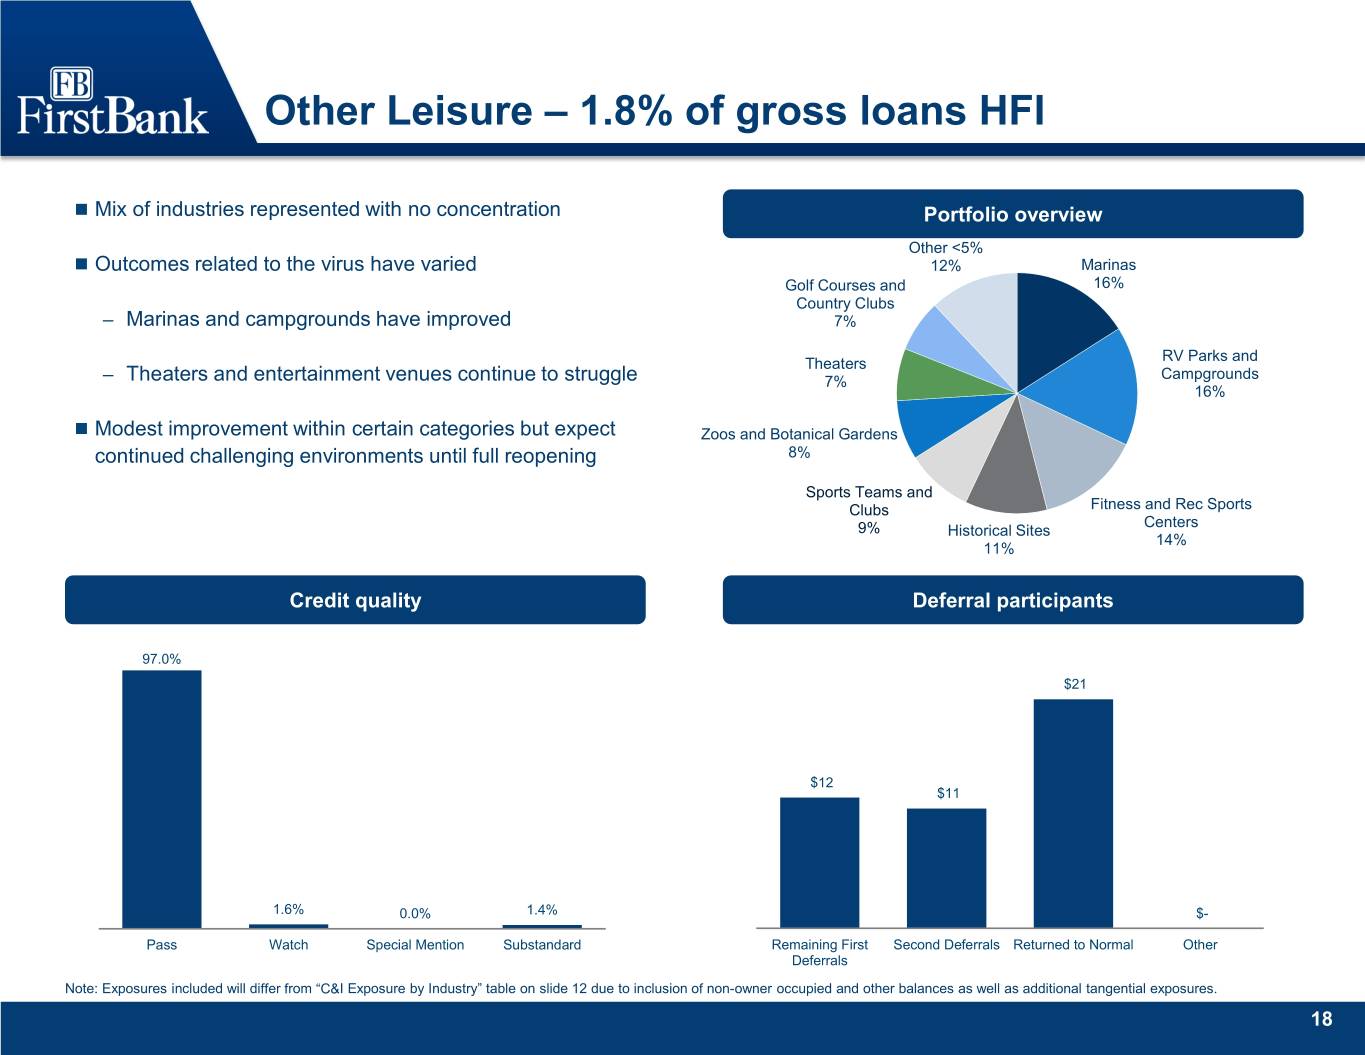
Other Leisure – 1.8% of gross loans HFI Mix of industries represented with no concentration Portfolio overview Other <5% Outcomes related to the virus have varied 12% Marinas Golf Courses and 16% Country Clubs – Marinas and campgrounds have improved 7% RV Parks and Theaters Campgrounds – Theaters and entertainment venues continue to struggle 7% 16% Modest improvement within certain categories but expect Zoos and Botanical Gardens continued challenging environments until full reopening 8% Sports Teams and Clubs Fitness and Rec Sports Centers 9% Historical Sites 14% 11% Credit quality Deferral participants 97.0% $21 $12 $11 1.6% 0.0% 1.4% $- Pass Watch Special Mention Substandard Remaining First Second Deferrals Returned to Normal Other Deferrals Note: Exposures included will differ from “C&I Exposure by Industry” table on slide 12 due to inclusion of non-owner occupied and other balances as well as additional tangential exposures. 18
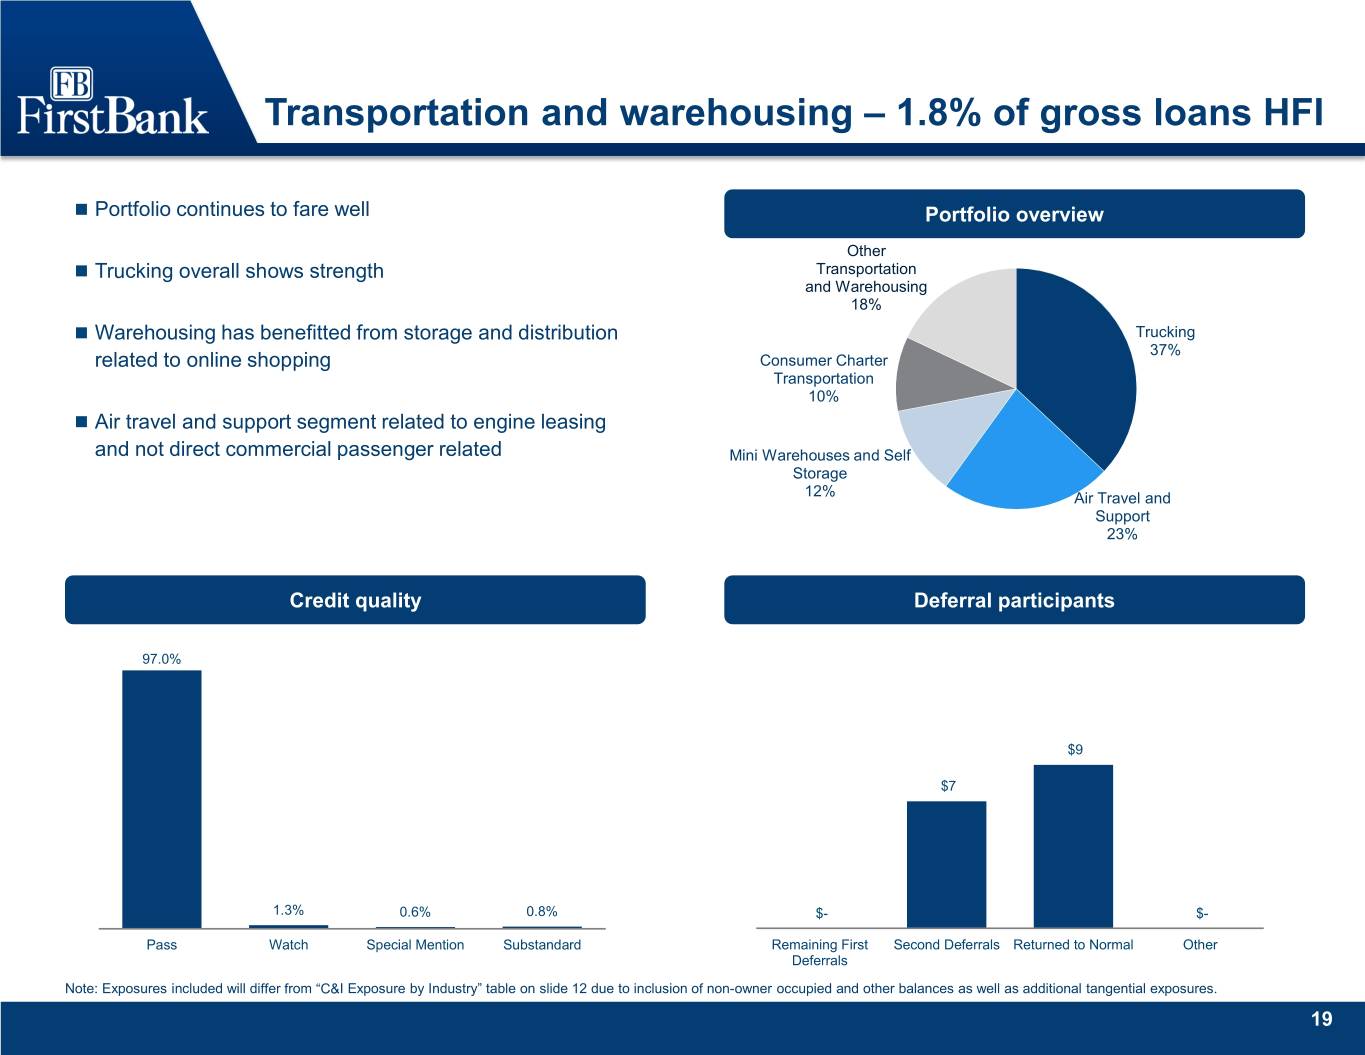
Transportation and warehousing – 1.8% of gross loans HFI Portfolio continues to fare well Portfolio overview Other Trucking overall shows strength Transportation and Warehousing 18% Warehousing has benefitted from storage and distribution Trucking 37% related to online shopping Consumer Charter Transportation 10% Air travel and support segment related to engine leasing and not direct commercial passenger related Mini Warehouses and Self Storage 12% Air Travel and Support 23% Credit quality Deferral participants 97.0% $9 $7 1.3% 0.6% 0.8% $- $- Pass Watch Special Mention Substandard Remaining First Second Deferrals Returned to Normal Other Deferrals Note: Exposures included will differ from “C&I Exposure by Industry” table on slide 12 due to inclusion of non-owner occupied and other balances as well as additional tangential exposures. 19

Allowance for credit losses overview Current Expected Credit Loss (CECL) Allowance for Credit Losses (ACL) model utilizes a blend of Moody’s economic scenarios from the third quarter, with resulting key economic data summarized below: FQE, FYE 12/31, 4Q 2020 1Q 2021 2020 2021 2022 2023 2024 GDP (bcw$) $ 18,342.9 $ 18,552.9 $ 18,135.6 $ 18,889.5 $ 19,932.7 $ 20,714.1 $ 21,257.5 Annualized % Change 5.7% 4.7% (4.9%) 4.2% 5.5% 4.0% 2.7% Total Employment (millions) 142.7 143.7 142.5 145.0 149.2 153.4 155.4 Unemployment Rate 8.8% 8.6% 8.7% 8.0% 6.1% 4.5% 4.3% CRE Price Index 249 248.8 249 273.775 312.35 344.275 359.25 NCREIF Property Index: Rate of Return 7.8% 2.2% (4.1%) 3.3% 4.2% 3.2% 2.2% Components of provision expense this quarter include – $7.0 million in standard quarterly CECL related ACL release – $0.9 million in legacy FBK related release in reserve for unfunded commitments – $52.8 million in initial provision expense related to FSB non-PCD loans (excluded from adjusted earnings) – $10.4 million in initial FSB related reserve on unfunded commitments (excluded from adjusted earnings) ACL / Loans HFI by Category 4Q 2019 2Q 2020 3Q 2020 6.43% 5.37% 4.37% 3.91% 3.50% 3.30% 3.23% 2.87%2.73% 2.51%2.66% 2.48% 1.85% 1.68%1.61% 1.10% 0.71% 0.83%0.66% 0.78% 0.54% 0.50% 0.44% 0.34% Gross Loans HFI (Ex. Commercial & Non-Owner Occ CRE Construction Multifamily 1-4 Family Mortgage 1-4 Family HELOC Consumer & Other PPP) 2 Industrial 3 1Source: Moody’s “July 2020 U.S. Macroeconomic Outlook Baseline and Alternative Scenarios”. 2 See “Use of non-GAAP financial measures” and the Appendix hereto for a discussion and reconciliation of non-GAAP measures. 3 Commercial and Industrial includes $310.7 million in PPP loans, which has a 10 bps impact on September 30, 2020 ACL / Loans HFI. 20

Allowance for credit losses overview Adjusted Pre-Tax Earnings Components1 Merger Other Adjusted Related Non-Core GAAP Net Interest Income $ 68,828 $ - $ - $ 68,828 Provision for credit losses (6,988) 52,822 - 45,834 Provision for credit losses on unfunded commitments (862) 10,429 - 9,567 Total Provision Expense (7,850) 63,251 - 55,401 Noninterest Income 100,836 - (3,810) 97,026 Noninterest Expense 97,362 20,730 - 118,092 Pre-Tax Income $ 80,152 $ (83,981) $ (3,810) $ (7,639) 2Q 2020 to 3Q 2020 ACL Bridge $24.8 $0.2 $184.0 $52.8 ( $7.0 ) $113.1 6/30/20 Non-merger related ACL release FSB Related non-PCD ACL FSB Related PCD ACL Net Recoveries 9/30/2020 ¹ See “Use of non-GAAP financial measures” and the Appendix hereto for a discussion and reconciliation of non-GAAP measures. 21
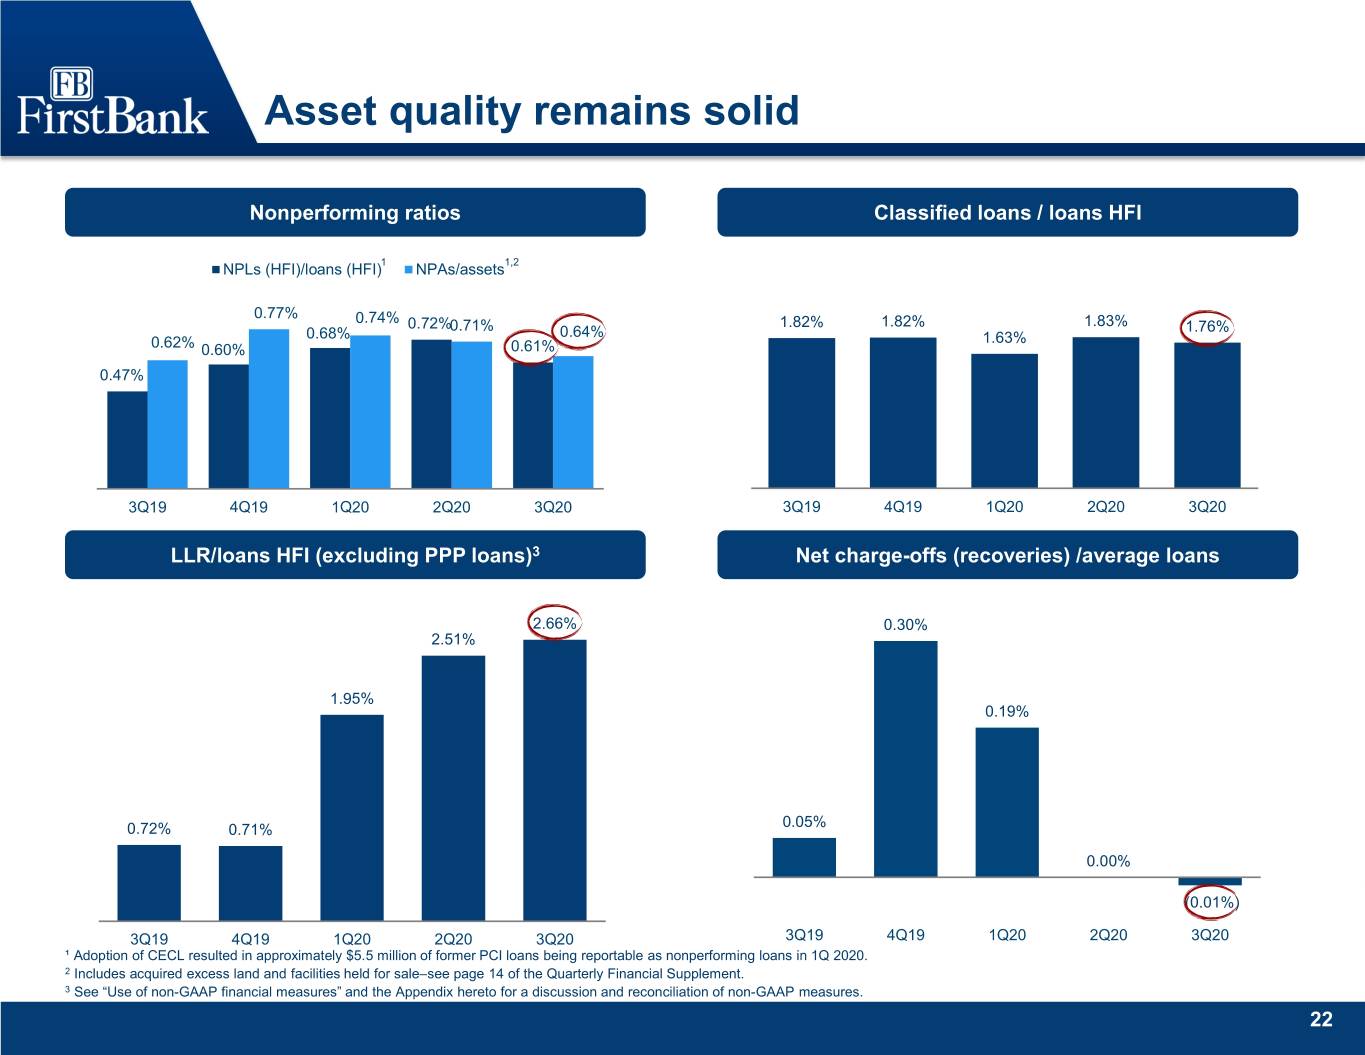
Asset quality remains solid Nonperforming ratios Classified loans / loans HFI 1 1,2 NPLs (HFI)/loans (HFI) NPAs/assets 0.77% 0.74% 0.72%0.71% 1.82% 1.82% 1.83% 1.76% 0.68% 0.64% 1.63% 0.62% 0.60% 0.61% 0.47% 3Q19 4Q19 1Q20 2Q20 3Q20 3Q19 4Q19 1Q20 2Q20 3Q20 LLR/loans HFI (excluding PPP loans)3 Net charge-offs (recoveries) /average loans 2.66% 0.30% 2.51% 1.95% 0.19% 0.05% 0.72% 0.71% 0.00% (0.01%) 3Q19 4Q19 1Q20 2Q20 3Q20 3Q19 4Q19 1Q20 2Q20 3Q20 ¹ Adoption of CECL resulted in approximately $5.5 million of former PCI loans being reportable as nonperforming loans in 1Q 2020. 2 Includes acquired excess land and facilities held for sale–see page 14 of the Quarterly Financial Supplement. 3 See “Use of non-GAAP financial measures” and the Appendix hereto for a discussion and reconciliation of non-GAAP measures. 22
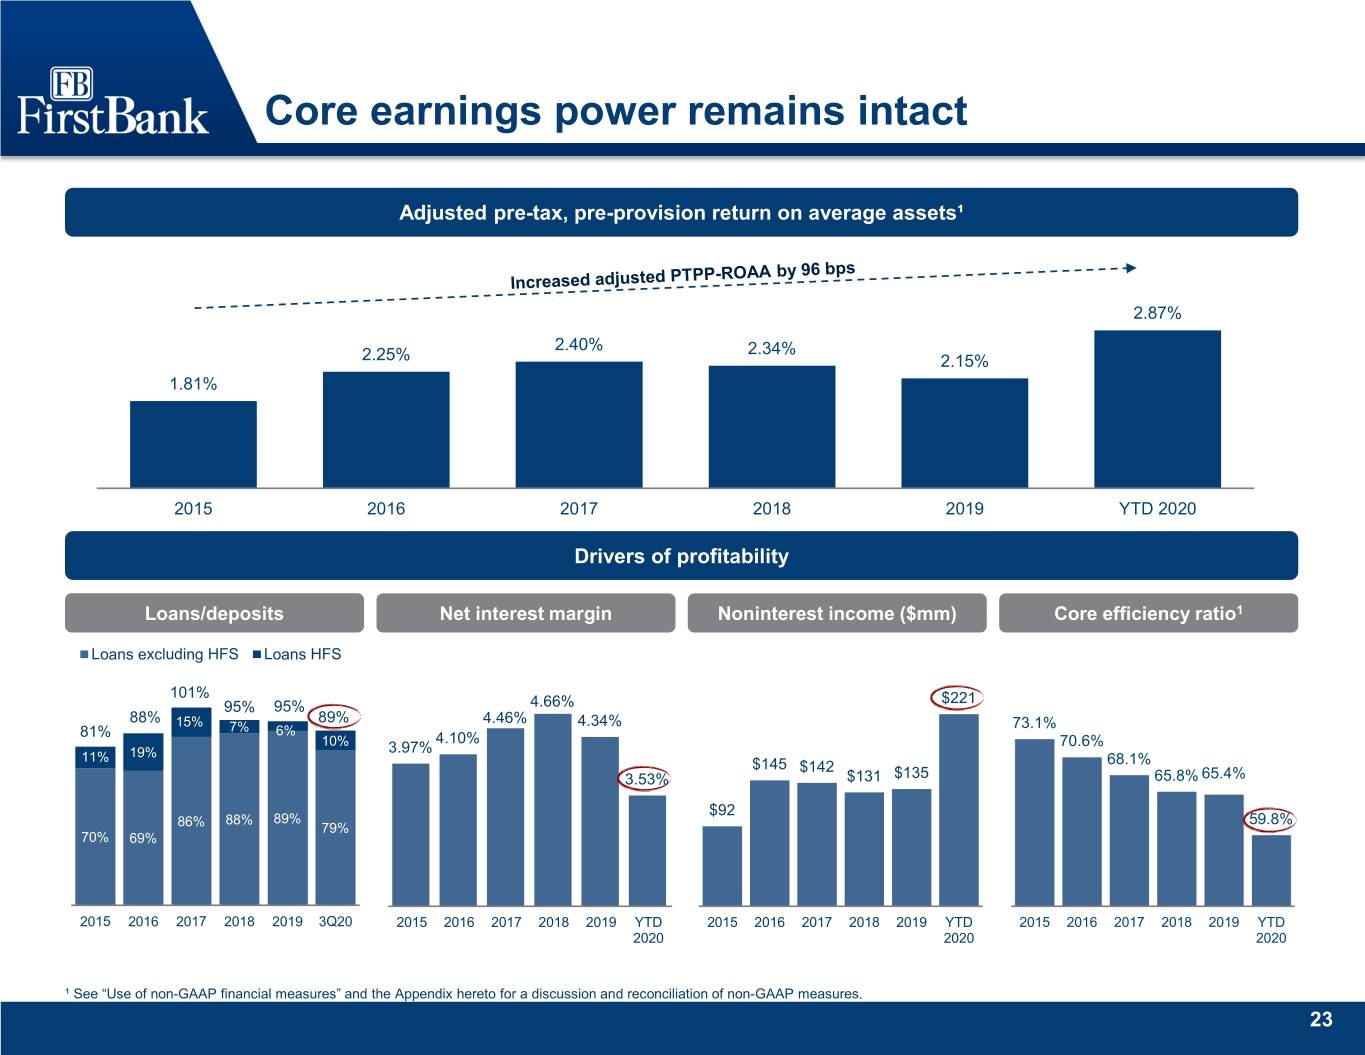
Core earnings power remains intact Adjusted pre-tax, pre-provision return on average assets¹ 2.87% 2.40% 2.34% 2.25% 2.15% 1.81% 2015 2016 2017 2018 2019 YTD 2020 Drivers of profitability Loans/deposits Net interest margin Noninterest income ($mm) Core efficiency ratio1 Loans excluding HFS Loans HFS 101% $221 95% 95% 4.66% 88% 89% 4.46% 15% 7% 4.34% 73.1% 81% 6% 4.10% 10% 3.97% 70.6% 11% 19% $145 $142 68.1% 3.53% $131 $135 65.8% 65.4% $92 88% 89% 59.8% 86% 79% 70% 69% 2015 2016 2017 2018 2019 3Q20 2015 2016 2017 2018 2019 YTD 2015 2016 2017 2018 2019 YTD 2015 2016 2017 2018 2019 YTD 2020 2020 2020 ¹ See “Use of non-GAAP financial measures” and the Appendix hereto for a discussion and reconciliation of non-GAAP measures. 23
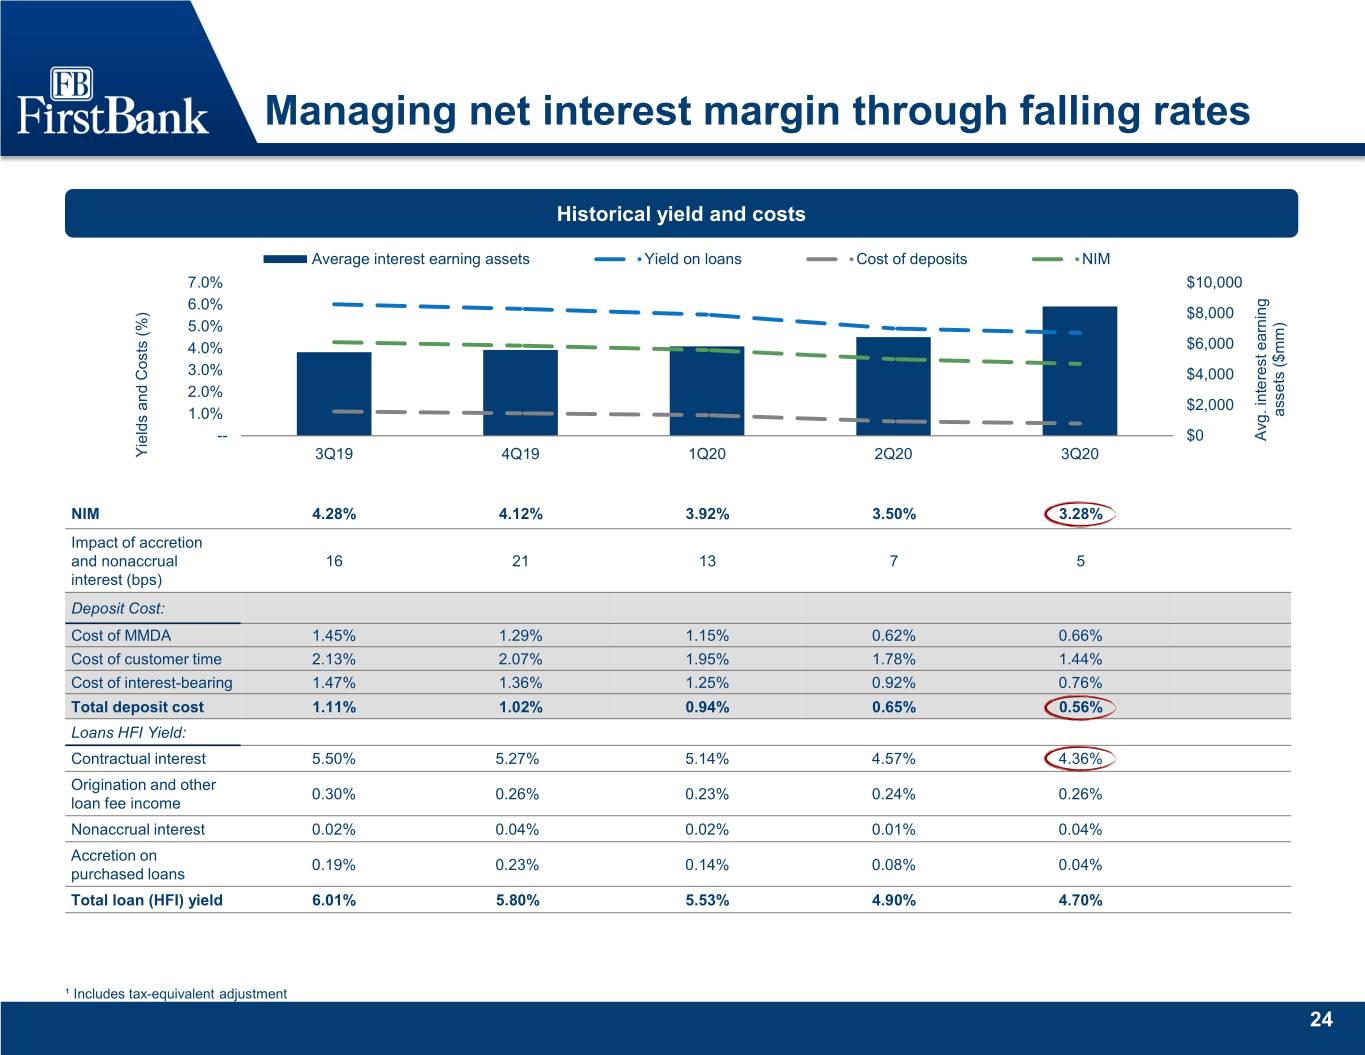
Managing net interest margin through falling rates Historical yield and costs Average interest earning assets Yield on loans Cost of deposits NIM 7.0% $10,000 6.0% $8,000 5.0% 4.0% $6,000 3.0% $4,000 2.0% $2,000 1.0% ($mm) assets -- $0 Avg. earning interest Yields and Costs (%) and Costs Yields 3Q19 4Q19 1Q20 2Q20 3Q20 NIM 4.28% 4.12% 3.92% 3.50% 3.28% Impact of accretion and nonaccrual 16 21 13 7 5 interest (bps) Deposit Cost: Cost of MMDA 1.45% 1.29% 1.15% 0.62% 0.66% Cost of customer time 2.13% 2.07% 1.95% 1.78% 1.44% Cost of interest-bearing 1.47% 1.36% 1.25% 0.92% 0.76% Total deposit cost 1.11% 1.02% 0.94% 0.65% 0.56% Loans HFI Yield: Contractual interest 5.50% 5.27% 5.14% 4.57% 4.36% Origination and other 0.30% 0.26% 0.23% 0.24% 0.26% loan fee income Nonaccrual interest 0.02% 0.04% 0.02% 0.01% 0.04% Accretion on 0.19% 0.23% 0.14% 0.08% 0.04% purchased loans Total loan (HFI) yield 6.01% 5.80% 5.53% 4.90% 4.70% ¹ Includes tax-equivalent adjustment 24
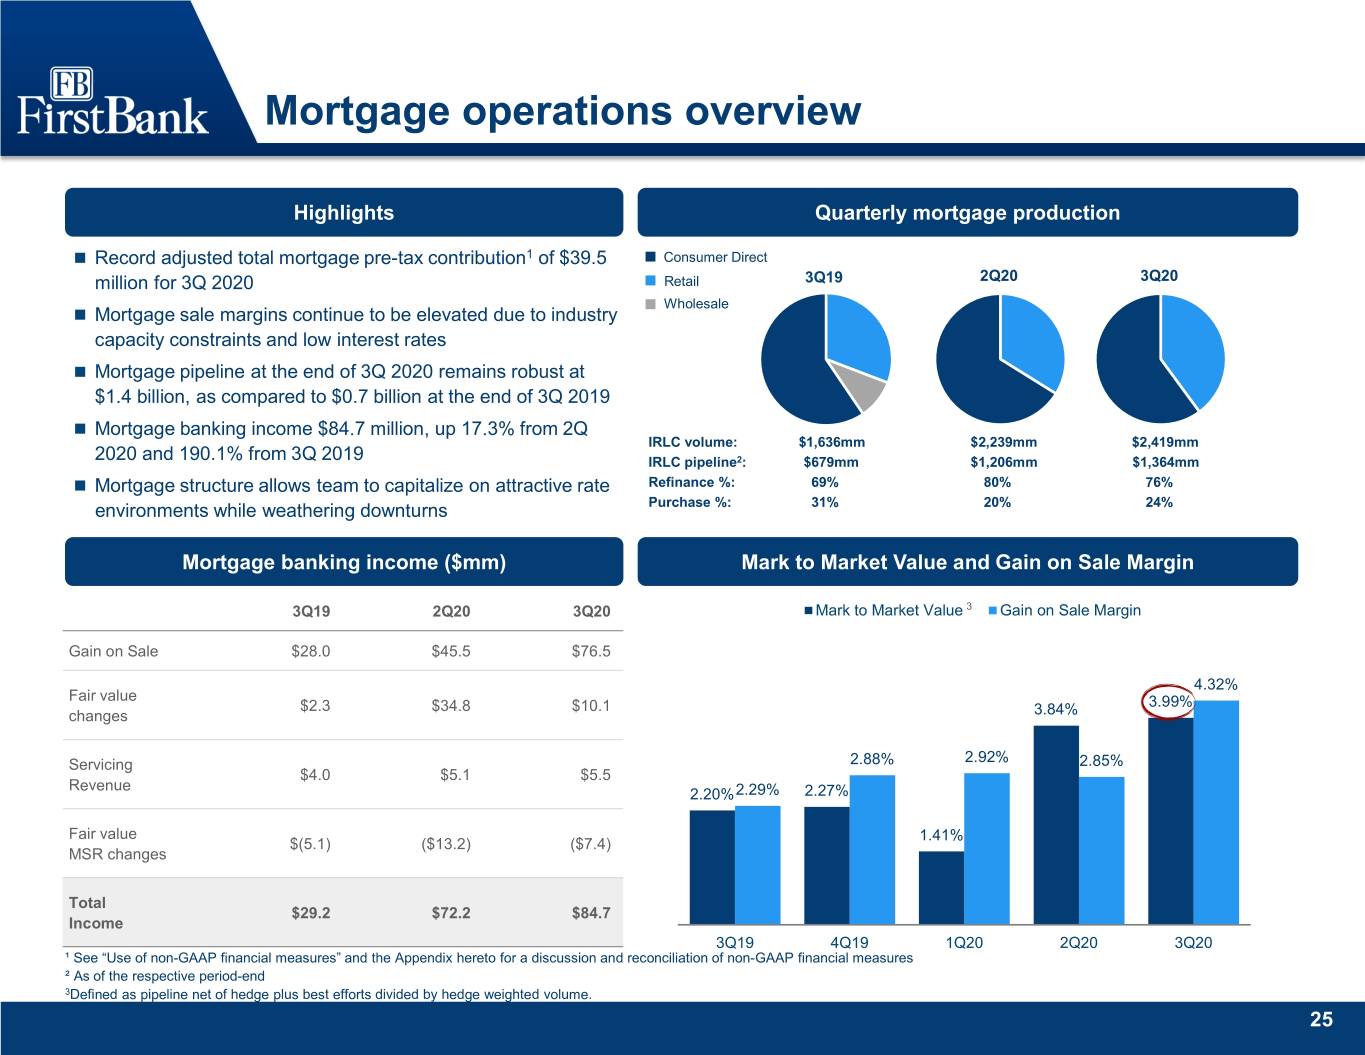
Mortgage operations overview Highlights Quarterly mortgage production Record adjusted total mortgage pre-tax contribution1 of $39.5 Consumer Direct million for 3Q 2020 Retail 3Q19 2Q20 3Q20 Wholesale Mortgage sale margins continue to be elevated due to industry capacity constraints and low interest rates Mortgage pipeline at the end of 3Q 2020 remains robust at $1.4 billion, as compared to $0.7 billion at the end of 3Q 2019 Mortgage banking income $84.7 million, up 17.3% from 2Q IRLC volume: $1,636mm $2,239mm $2,419mm 2020 and 190.1% from 3Q 2019 IRLC pipeline2: $679mm $1,206mm $1,364mm Mortgage structure allows team to capitalize on attractive rate Refinance %: 69% 80% 76% environments while weathering downturns Purchase %: 31% 20% 24% Mortgage banking income ($mm) Mark to Market Value and Gain on Sale Margin 3Q19 2Q20 3Q20 Mark to Market Value 3 Gain on Sale Margin Gain on Sale $28.0 $45.5 $76.5 4.32% Fair value $2.3 $34.8 $10.1 3.99% changes 3.84% Servicing 2.88% 2.92% 2.85% $4.0 $5.1 $5.5 Revenue 2.20%2.29% 2.27% Fair value 1.41% $(5.1) ($13.2) ($7.4) MSR changes Total $29.2 $72.2 $84.7 Income 3Q19 4Q19 1Q20 2Q20 3Q20 ¹ See “Use of non-GAAP financial measures” and the Appendix hereto for a discussion and reconciliation of non-GAAP financial measures ² As of the respective period-end 3Defined as pipeline net of hedge plus best efforts divided by hedge weighted volume. 25
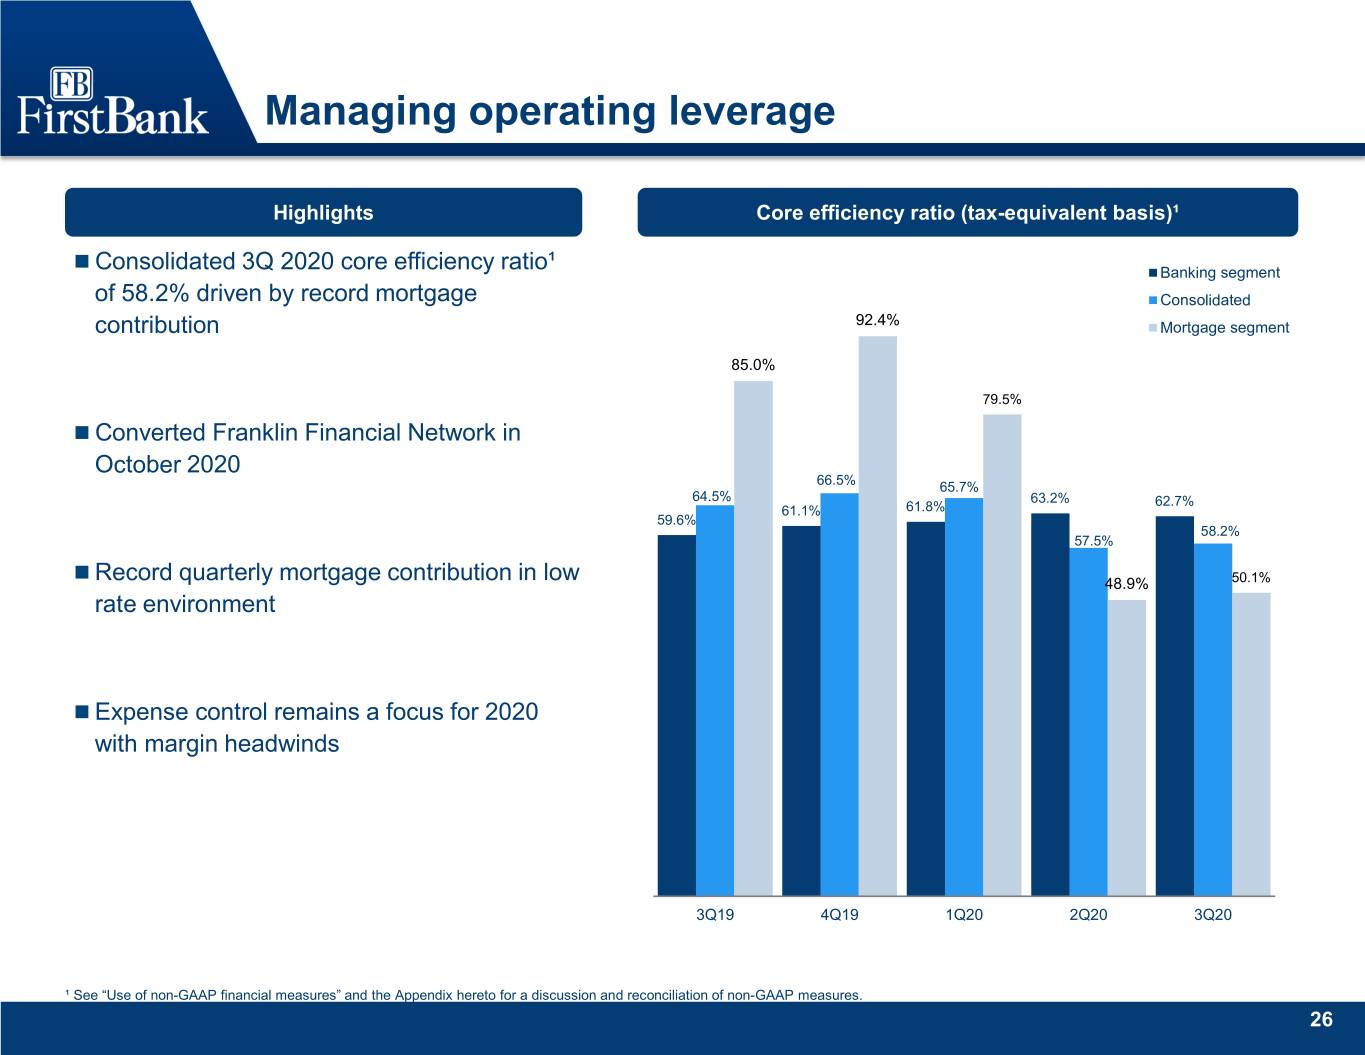
Managing operating leverage Highlights Core efficiency ratio (tax-equivalent basis)¹ Consolidated 3Q 2020 core efficiency ratio¹ Banking segment of 58.2% driven by record mortgage Consolidated contribution 92.4% Mortgage segment 85.0% 79.5% Converted Franklin Financial Network in October 2020 66.5% 65.7% 64.5% 63.2% 62.7% 61.1% 61.8% 59.6% 58.2% 57.5% Record quarterly mortgage contribution in low 48.9% 50.1% rate environment Expense control remains a focus for 2020 with margin headwinds 3Q19 4Q19 1Q20 2Q20 3Q20 ¹ See “Use of non-GAAP financial measures” and the Appendix hereto for a discussion and reconciliation of non-GAAP measures. 26
Appendix 27
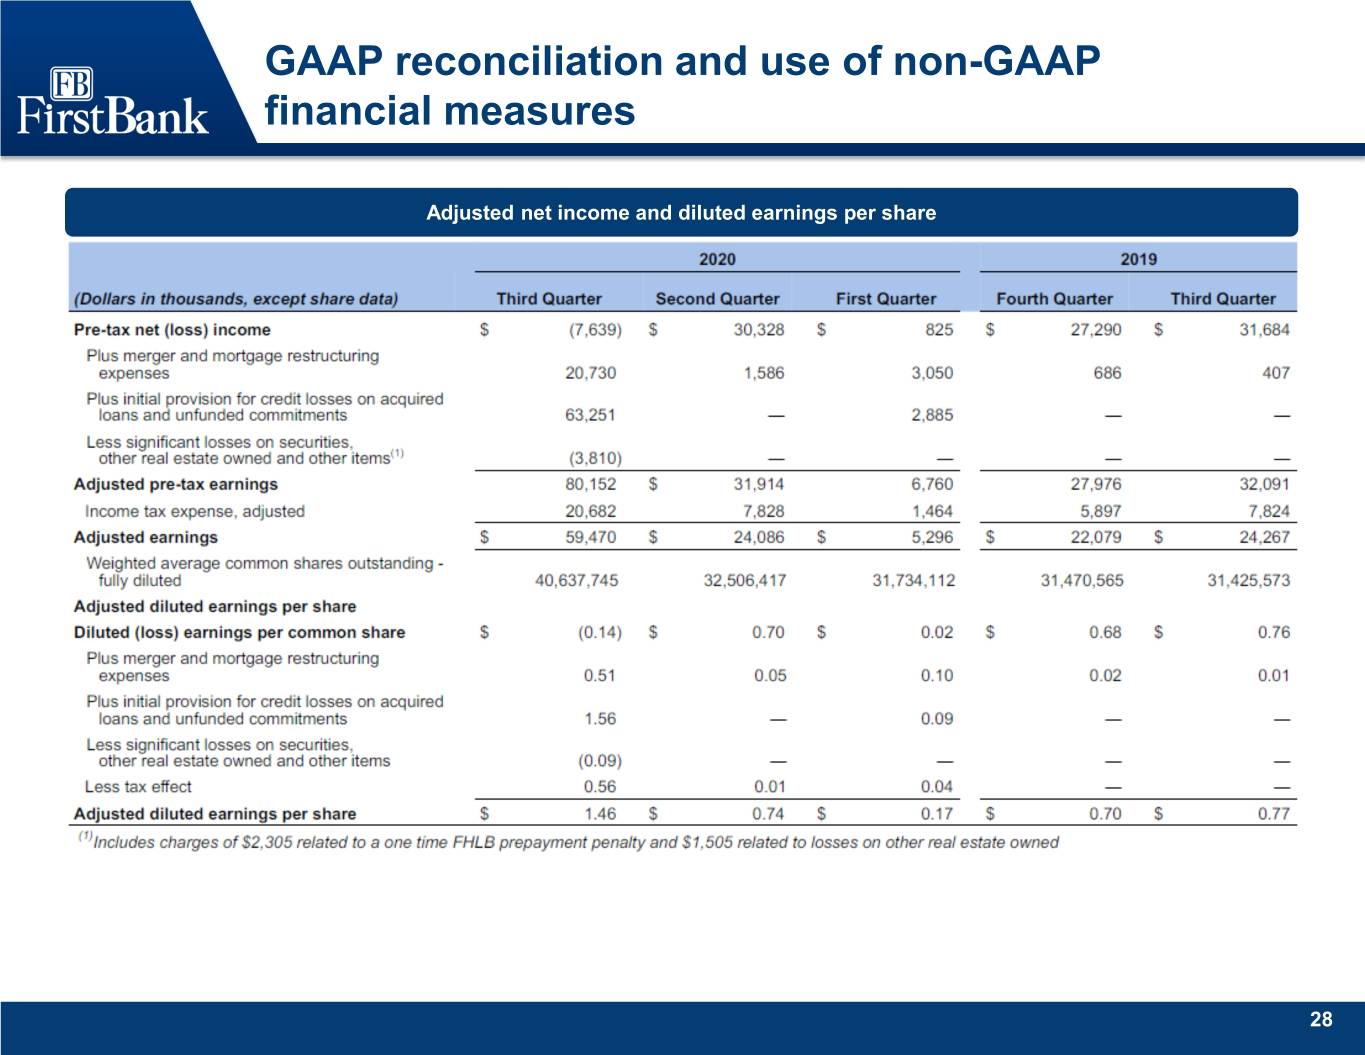
GAAP reconciliation and use of non-GAAP financial measures Adjusted net income and diluted earnings per share 28

GAAP reconciliation and use of non-GAAP financial measures Pre-tax, pre-provision earnings and diluted earnings per share 29
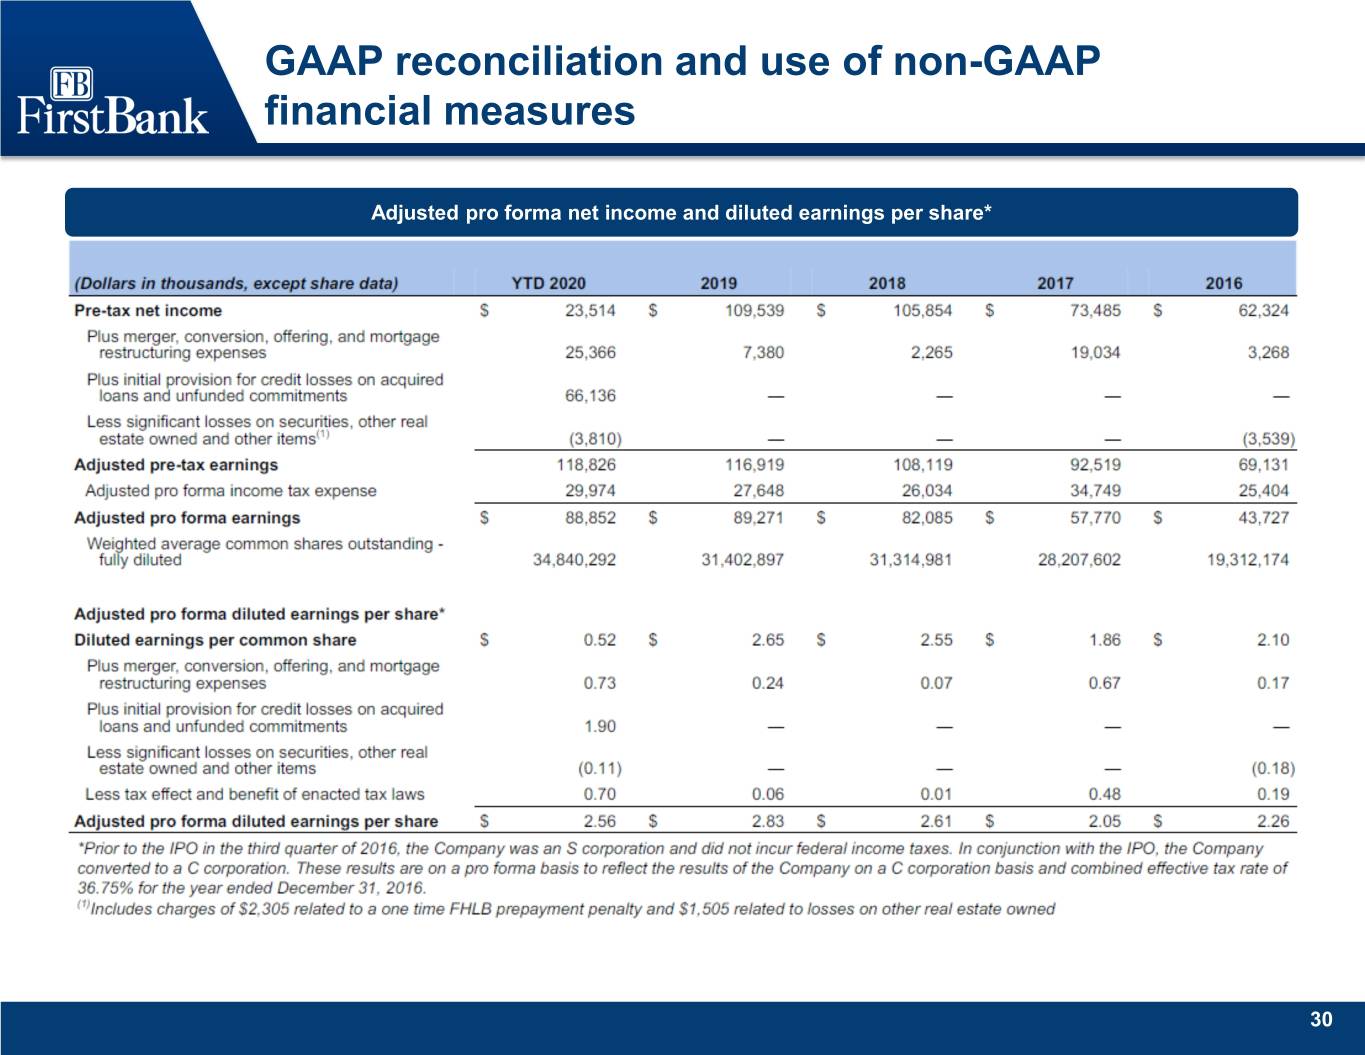
GAAP reconciliation and use of non-GAAP financial measures Adjusted pro forma net income and diluted earnings per share* 30
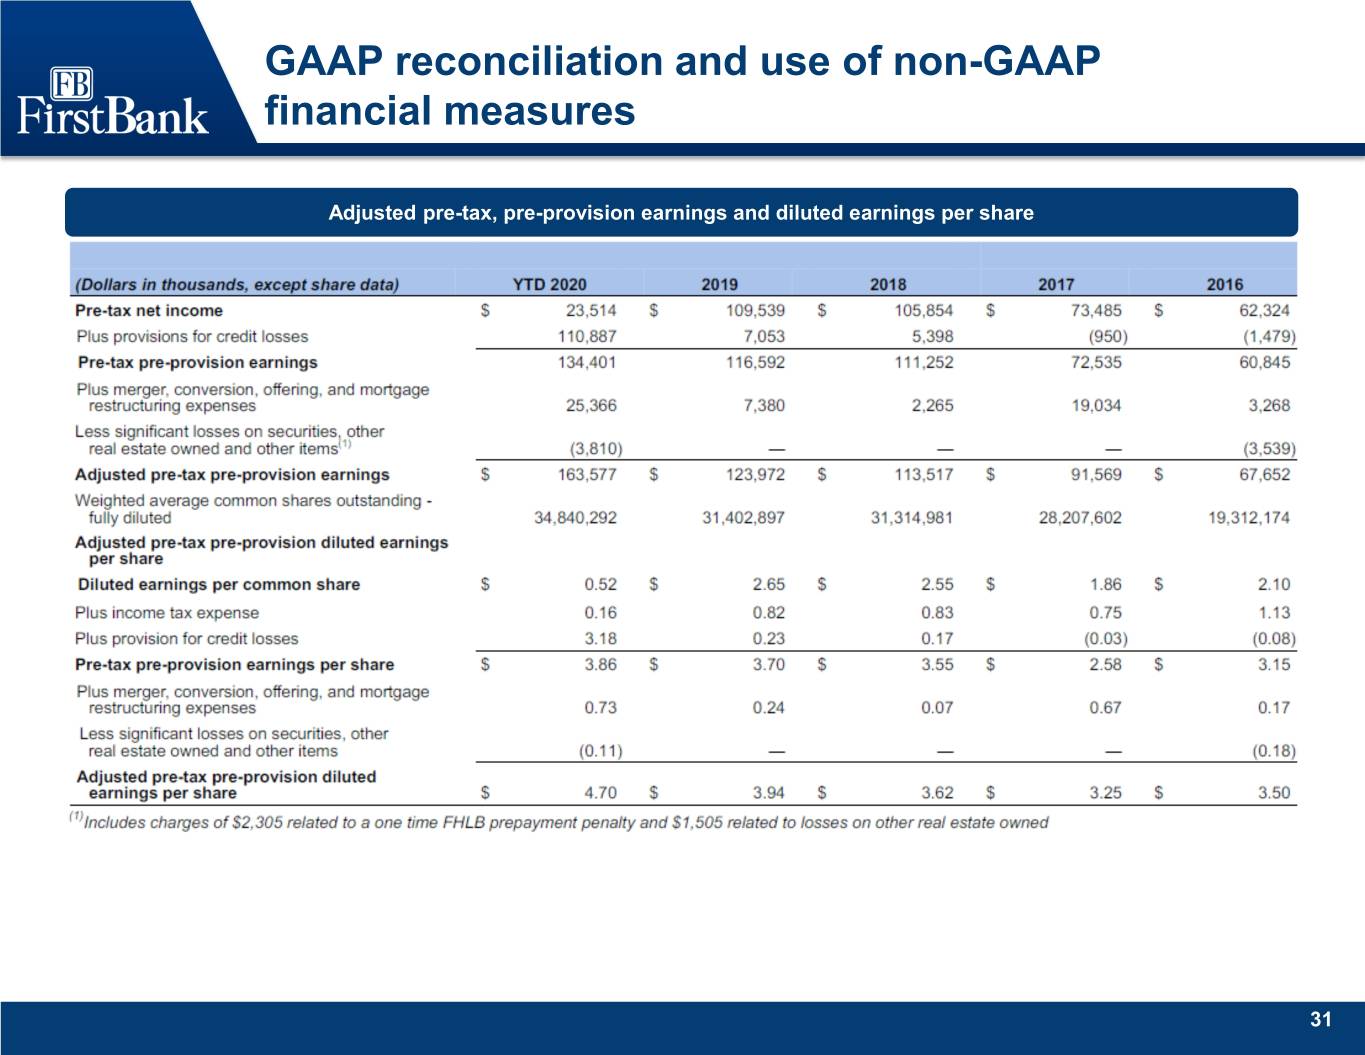
GAAP reconciliation and use of non-GAAP financial measures Adjusted pre-tax, pre-provision earnings and diluted earnings per share 31
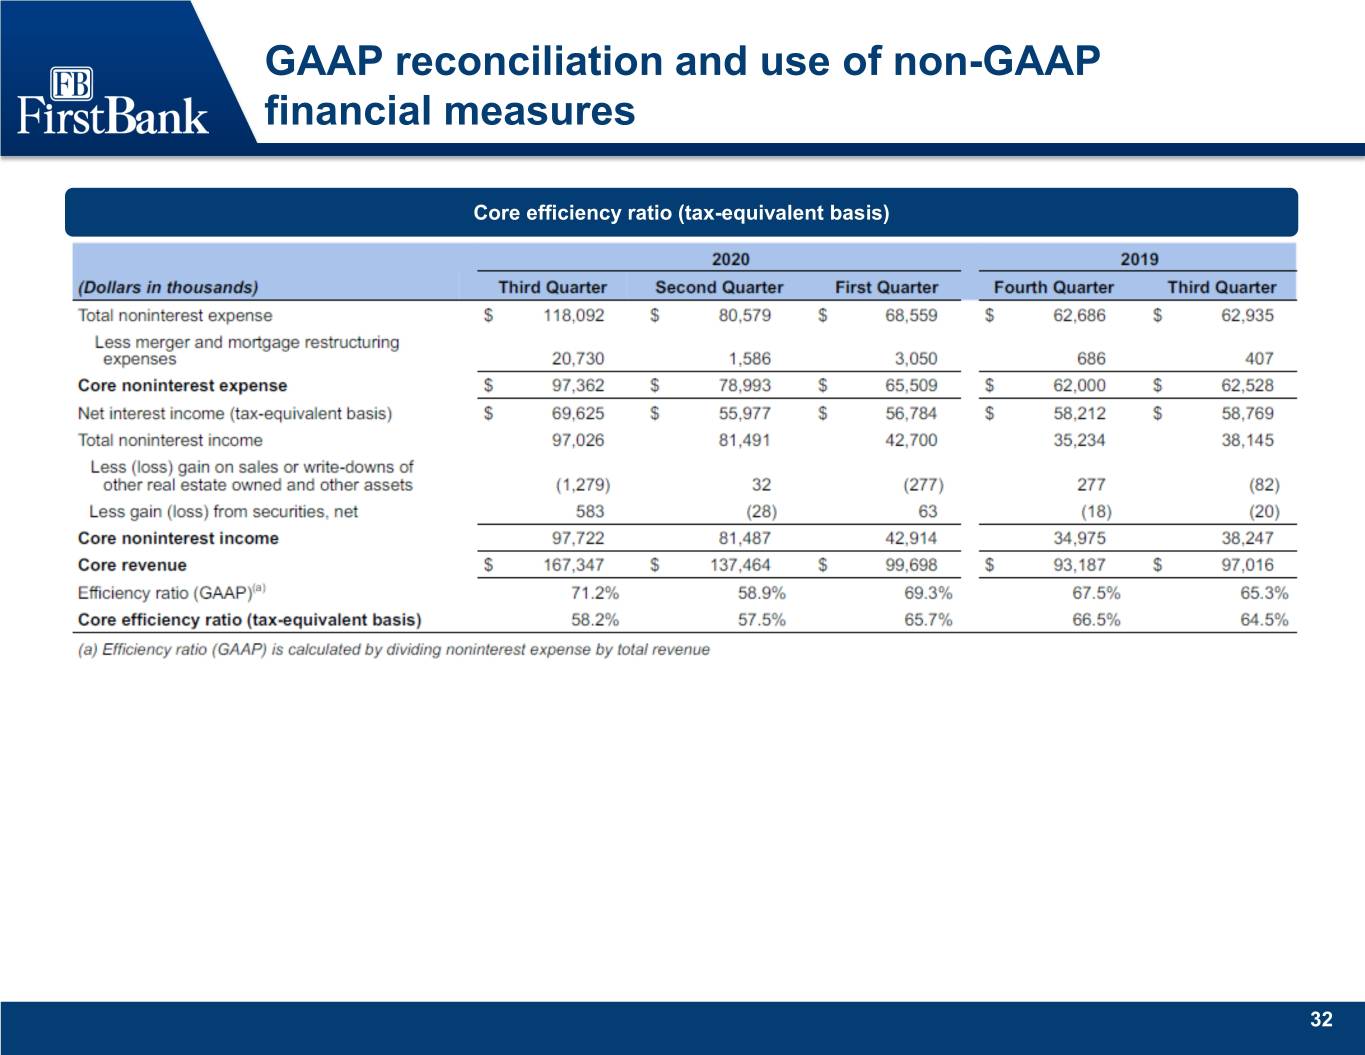
GAAP reconciliation and use of non-GAAP financial measures Core efficiency ratio (tax-equivalent basis) 32
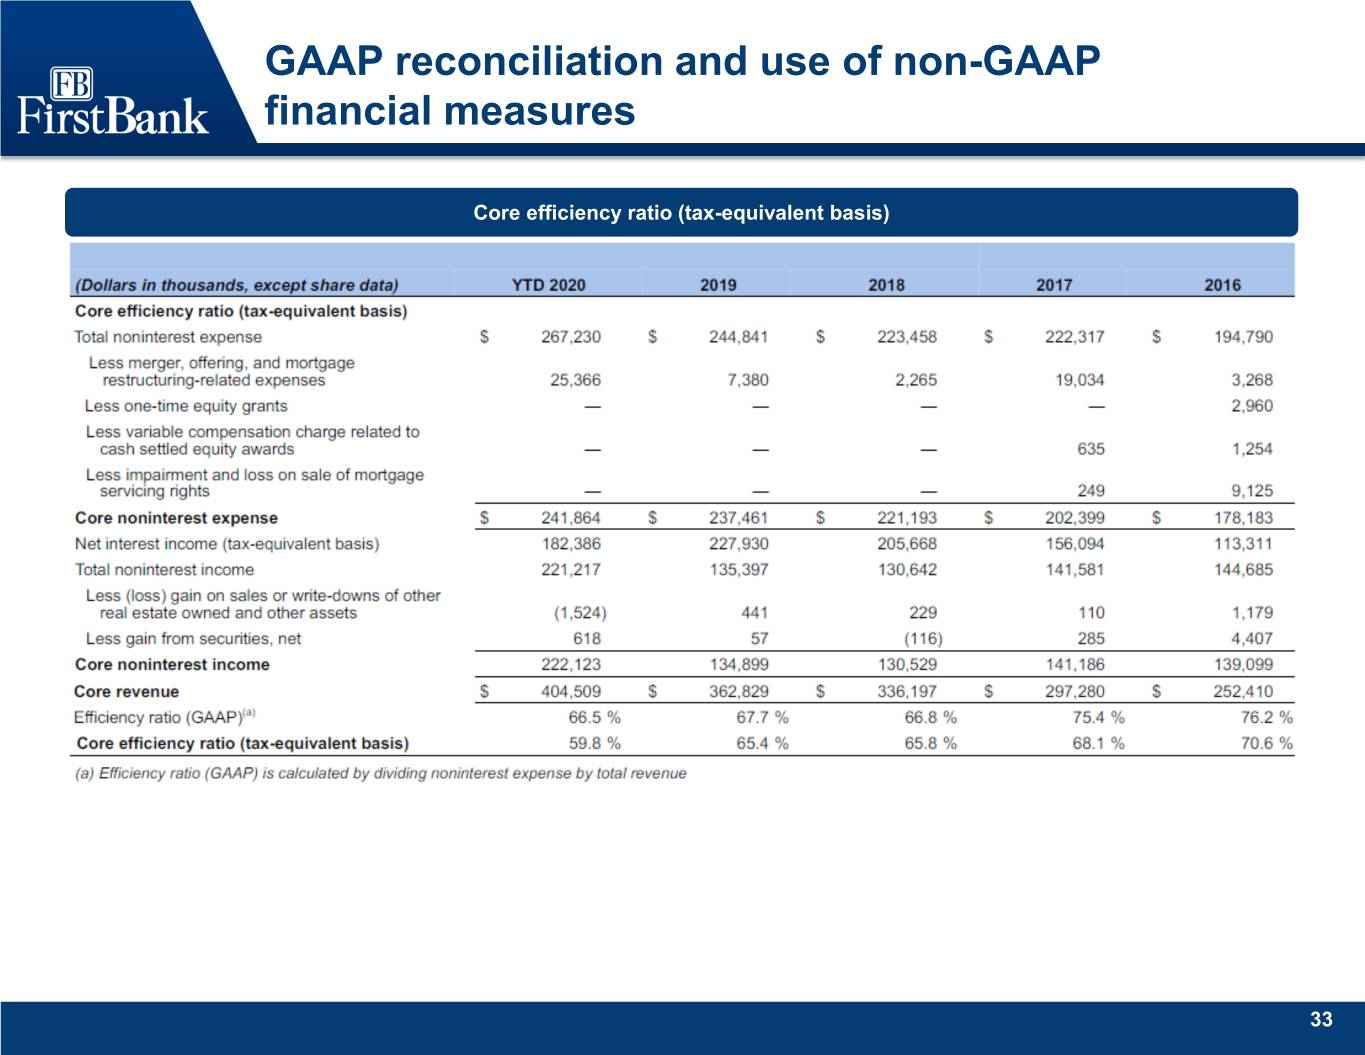
GAAP reconciliation and use of non-GAAP financial measures Core efficiency ratio (tax-equivalent basis) 33
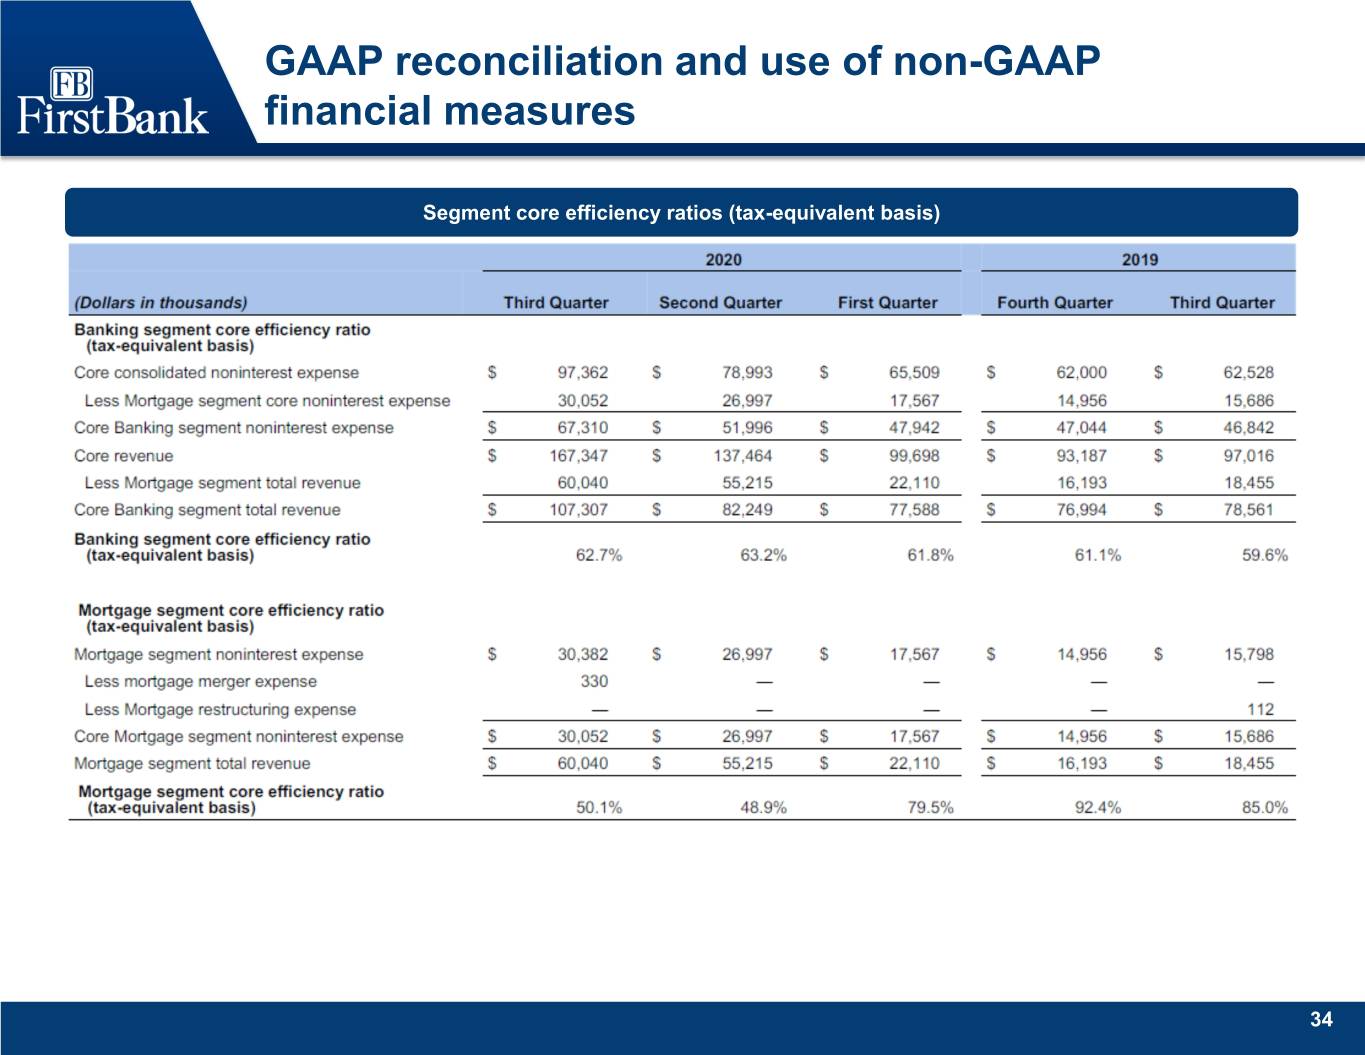
GAAP reconciliation and use of non-GAAP financial measures Segment core efficiency ratios (tax-equivalent basis) 34

GAAP reconciliation and use of non-GAAP financial measures Adjusted mortgage contribution 35

GAAP reconciliation and use of non-GAAP financial measures Tangible assets and equity 36

GAAP reconciliation and use of non-GAAP financial measures Return on average tangible common equity 37
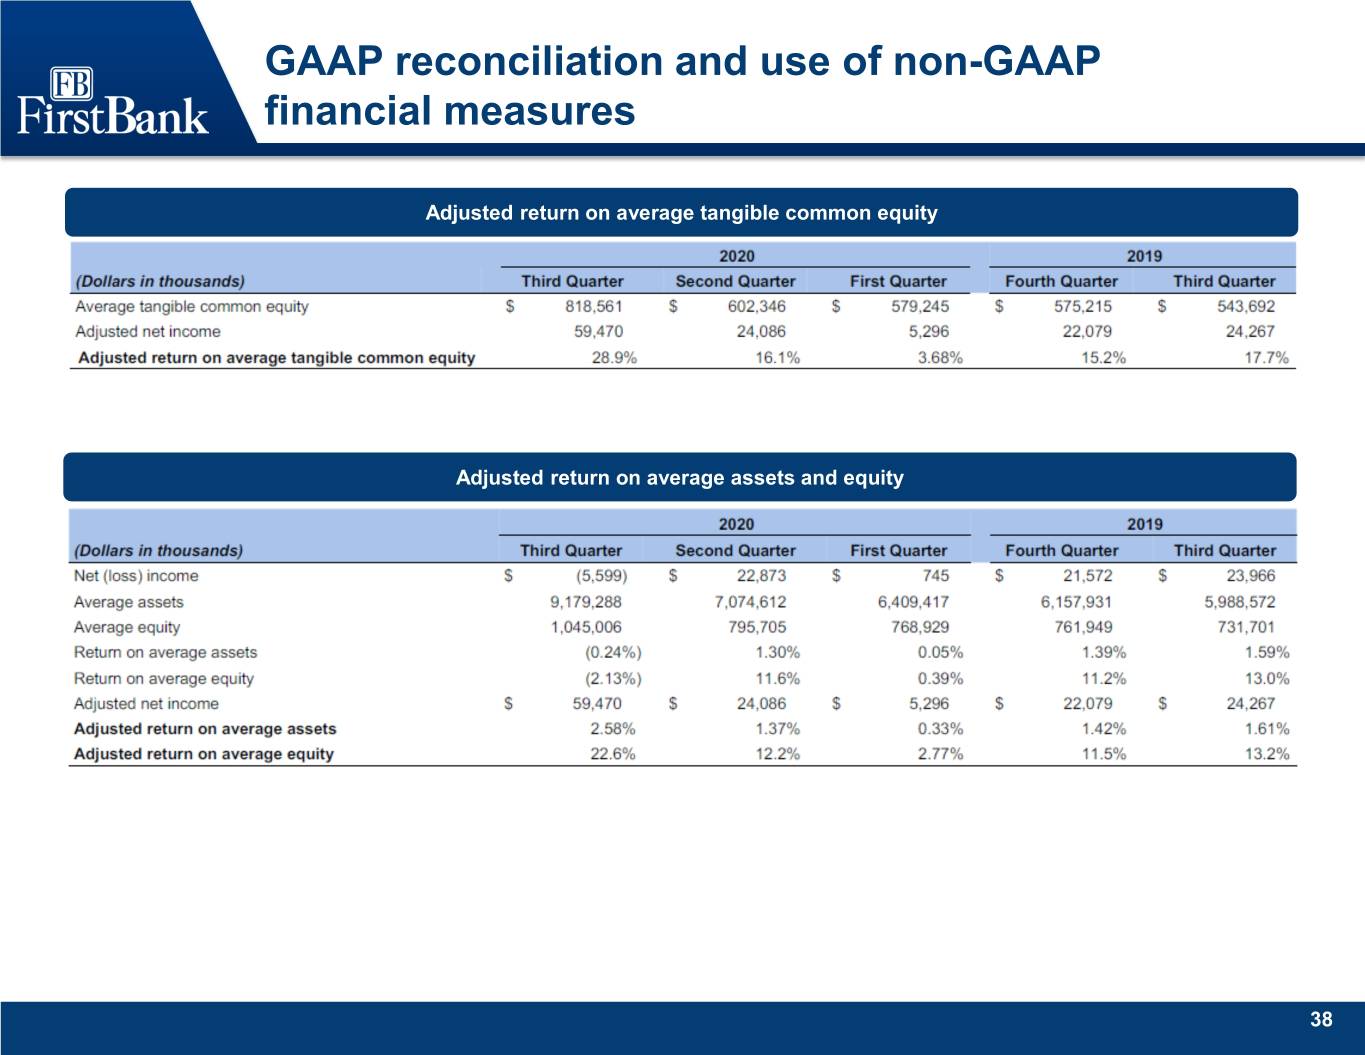
GAAP reconciliation and use of non-GAAP financial measures Adjusted return on average tangible common equity Adjusted return on average assets and equity 38
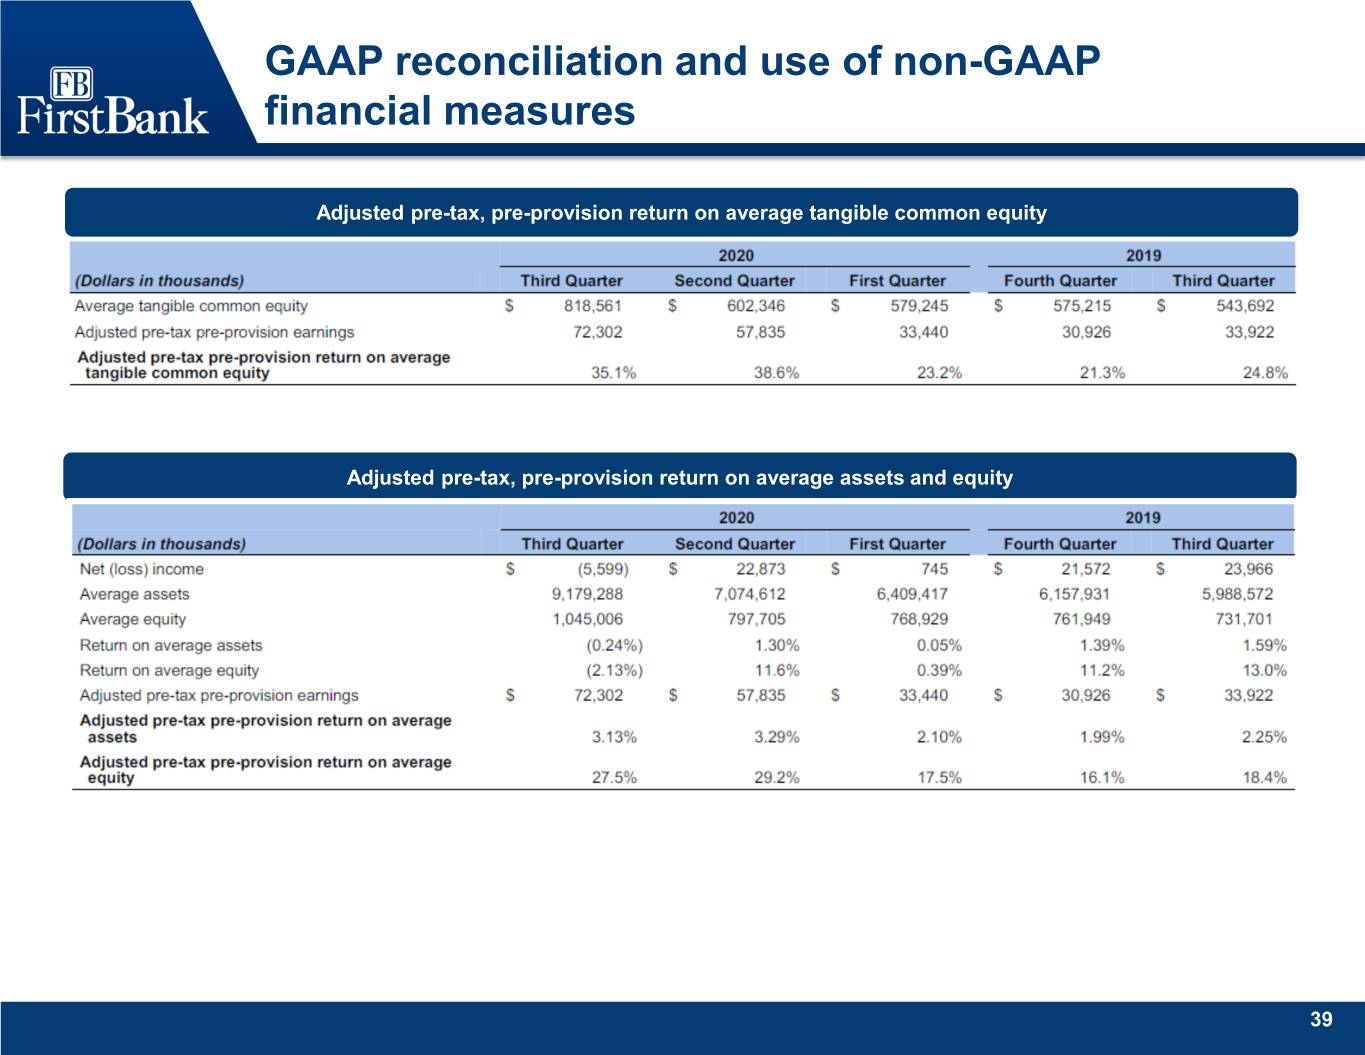
GAAP reconciliation and use of non-GAAP financial measures Adjusted pre-tax, pre-provision return on average tangible common equity Adjusted pre-tax, pre-provision return on average assets and equity 39

GAAP reconciliation and use of non-GAAP financial measures Adjusted pro forma return on average assets and equity Adjusted pre-tax, pre-provision return on average assets and equity 40
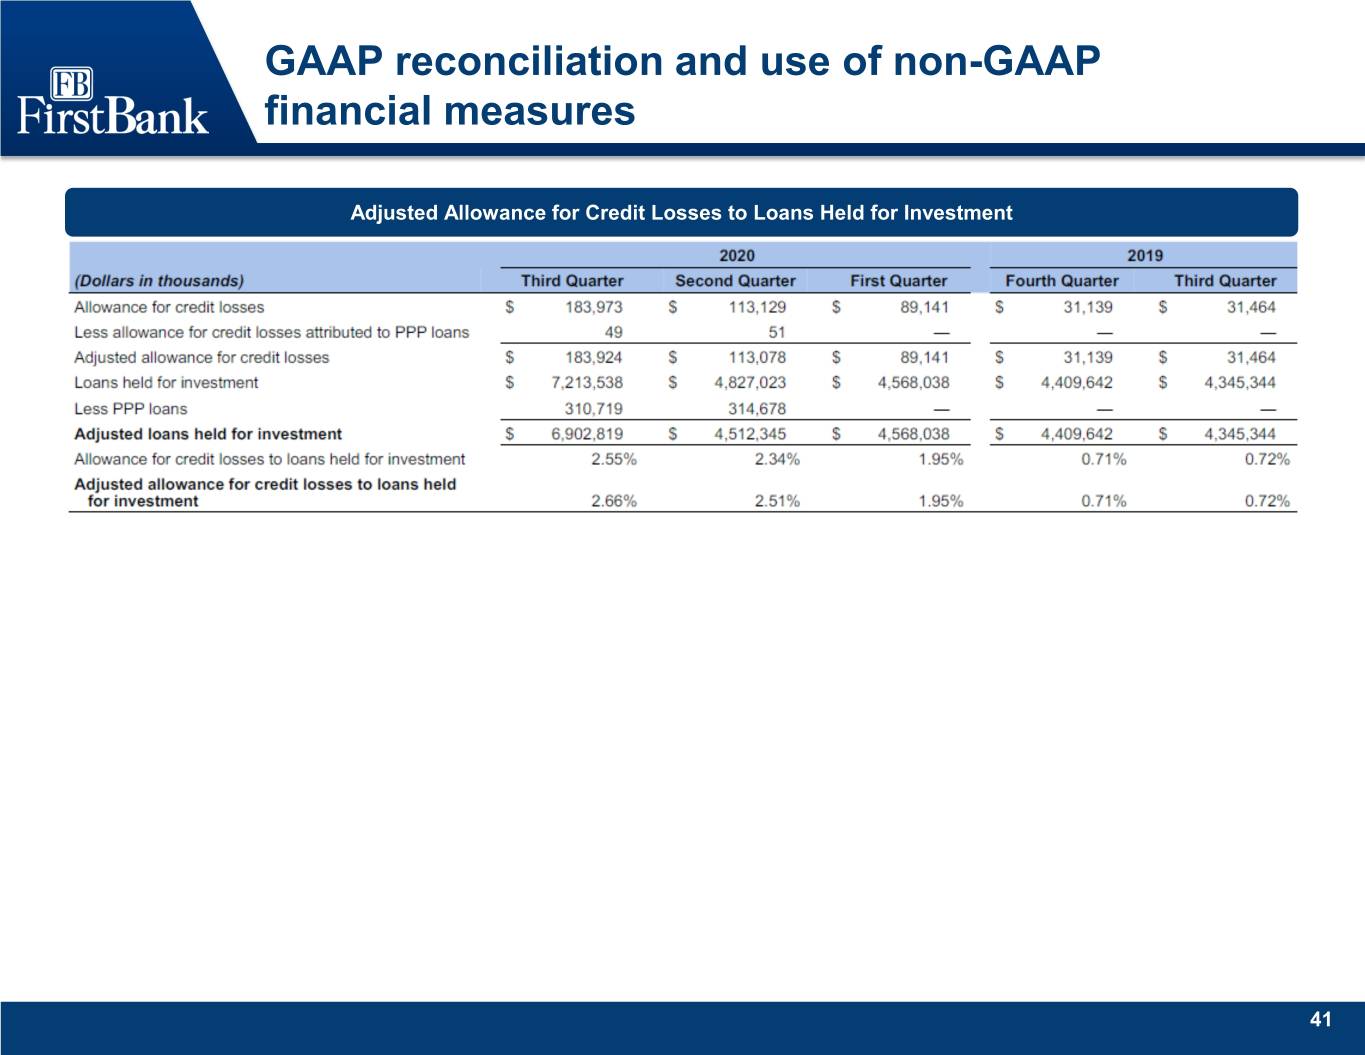
GAAP reconciliation and use of non-GAAP financial measures Adjusted Allowance for Credit Losses to Loans Held for Investment 41


