
February 16, 2022 First Quarter 2022 Investor Presentation
1 Forward–Looking Statements Certain statements contained in this presentation that are not historical in nature may be considered forward-looking statements within the meaning of the Private Securities Litigation Reform Act of 1995. These forward-looking statements include, without limitation, statements regarding the ongoing impact of the COVID-19 global pandemic and new virus variants on FB Financial Corporation’s (the “Company”) business operations and statements related to the Company’s future plans, results, strategies, and expectations. These statements can generally be identified by the use of the words and phrases “may,” “will,” “should,” “could,” “would,” “goal,” “plan,” “potential,” “estimate,” “project,” “believe,” “intend,” “anticipate,” “expect,” “target,” “aim,” “predict,” “continue,” “seek,” “project,” and other variations of such words and phrases and similar expressions. These forward-looking statements are not historical facts, and are based upon management's current expectations, estimates, and projections, many of which, by their nature, are inherently uncertain and beyond the Company’s control. The inclusion of these forward-looking statements should not be regarded as a representation by the Company or any other person that such expectations, estimates, and projections will be achieved. Accordingly, the Company cautions shareholders and investors that any such forward-looking statements are not guarantees of future performance and are subject to risks, assumptions, and uncertainties that are difficult to predict. Actual results may prove to be materially different from the results expressed or implied by the forward-looking statements. A number of factors could cause actual results to differ materially from those contemplated by the forward-looking statements including, without limitation, (1) current and future economic conditions, including the effects of inflation, interest rate fluctuations, changes in the economy or global supply chain, supply-demand imbalances affecting local real estate prices, and high unemployment rates in the local or regional economies in which the Company operates and/or the US economy generally, (2) the ongoing effects of the COVID-19 pandemic, including the magnitude and duration of the pandemic and the emergence of new variants, and its impact on general economic and financial market conditions and on the Company’s business and the Company’s customers' business, results of operations, asset quality and financial condition, (3) ongoing public response to the vaccines that were developed against the virus as well as the decisions of governmental agencies with respect to vaccines, including recommendations related to booster shots and requirements that seek to mandate that individuals receive or employers require that their employees receive the vaccine, (4) those vaccines' efficacy against the virus, including new variants, (5) changes in government interest rate policies and its impact on the Company’s business, net interest margin, and mortgage operations, (6) the Company’s ability to effectively manage problem credits, (7) the Company’s ability to identify potential candidates for, consummate, and achieve synergies from, potential future acquisitions, (8) difficulties and delays in integrating acquired businesses or fully realizing costs savings, revenue synergies and other benefits from future and prior acquisitions, (9) the Company’s ability to successfully execute its various business strategies, (10) changes in state and federal legislation, regulations or policies applicable to banks and other financial service providers, including legislative developments, (11) the potential impact of the proposed phase-out of the London Interbank Offered Rate ("LIBOR") or other changes involving LIBOR, (12) the effectiveness of the Company’s cybersecurity controls and procedures to prevent and mitigate attempted intrusions, (13) the Company's dependence on information technology systems of third party service providers and the risk of systems failures, interruptions, or breaches of security, and (14) general competitive, economic, political, and market conditions. Further information regarding the Company and factors which could affect the forward-looking statements contained herein can be found in the Company’s Annual Report on Form 10- K for the fiscal year ended December 31, 2020, and in any of the Company’s subsequent filings with the Securities and Exchange Commission. Many of these factors are beyond the Company’s ability to control or predict. If one or more events related to these or other risks or uncertainties materialize, or if the underlying assumptions prove to be incorrect, actual results may differ materially from the forward-looking statements. Accordingly, shareholders and investors should not place undue reliance on any such forward-looking statements. Any forward-looking statement speaks only as of the date of this presentation, and the Company undertakes no obligation to publicly update or review any forward-looking statement, whether as a result of new information, future developments or otherwise, except as required by law. New risks and uncertainties may emerge from time to time, and it is not possible for the Company to predict their occurrence or how they will affect the company. The Company qualifies all forward-looking statements by these cautionary statements.
2 Use of non-GAAP financial measures This presentation contains certain financial measures that are not measures recognized under U.S. generally accepted accounting principles (“GAAP”) and therefore are considered non-GAAP financial measures. These non-GAAP financial measures include, without limitation, adjusted earnings, adjusted diluted earnings per share, adjusted and unadjusted pre-tax pre-provision earnings, core revenue, core noninterest expense and core noninterest income, core efficiency ratio (tax equivalent basis), Banking segment core efficiency ratio (tax equivalent basis), Mortgage segment core efficiency ratio (tax equivalent basis), adjusted mortgage contribution, adjusted return on average tangible common equity, adjusted pretax pre-provision return on average tangible common equity, adjusted return on average assets and equity, and adjusted pre-tax pre-provision return on average assets and equity. Each of these non-GAAP metrics excludes certain income and expense items that the Company’s management considers to be non-core/adjusted in nature. The Company also includes an adjusted allowance for credit losses, adjusted loans held for investment, and adjusted allowance for credit losses to loans held for investment, which all exclude the impact of PPP loans. The Company refers to these non-GAAP measures as adjusted measures. Also, the Company presents tangible assets, tangible common equity, tangible book value per common share, tangible common equity to tangible assets, return on average tangible common equity and adjusted return on average tangible common equity. Each of these non-GAAP metrics excludes the impact of goodwill and other intangibles. The Company’s management uses these non-GAAP financial measures in their analysis of the Company’s performance, financial condition and the efficiency of its operations as management believes such measures facilitate period-to-period comparisons and provide meaningful indications of its operating performance as they eliminate both gains and charges that management views as non-recurring or not indicative of operating performance. Management believes that these non- GAAP financial measures provide a greater understanding of ongoing operations and enhance comparability of results with prior periods as well as demonstrating the effects of significant non-core gains and charges in the current and prior periods. The Company’s management also believes that investors find these non- GAAP financial measures useful as they assist investors in understanding the Company’s underlying operating performance and in the analysis of ongoing operating trends. In addition, because intangible assets such as goodwill and other intangibles, and the other items excluded each vary extensively from company to company, the Company believes that the presentation of this information allows investors to more easily compare the Company’s results to the results of other companies. However, the non-GAAP financial measures discussed herein should not be considered in isolation or as a substitute for the most directly comparable or other financial measures calculated in accordance with GAAP. Moreover, the manner in which the Company calculates the non-GAAP financial measures discussed herein may differ from that of other companies reporting measures with similar names. You should understand how such other banking organizations calculate their financial measures similar or with names similar to the non-GAAP financial measures the Company has discussed herein when comparing such non-GAAP financial measures. The following tables provide a reconciliation of these measures to the most directly comparable GAAP financial measures.
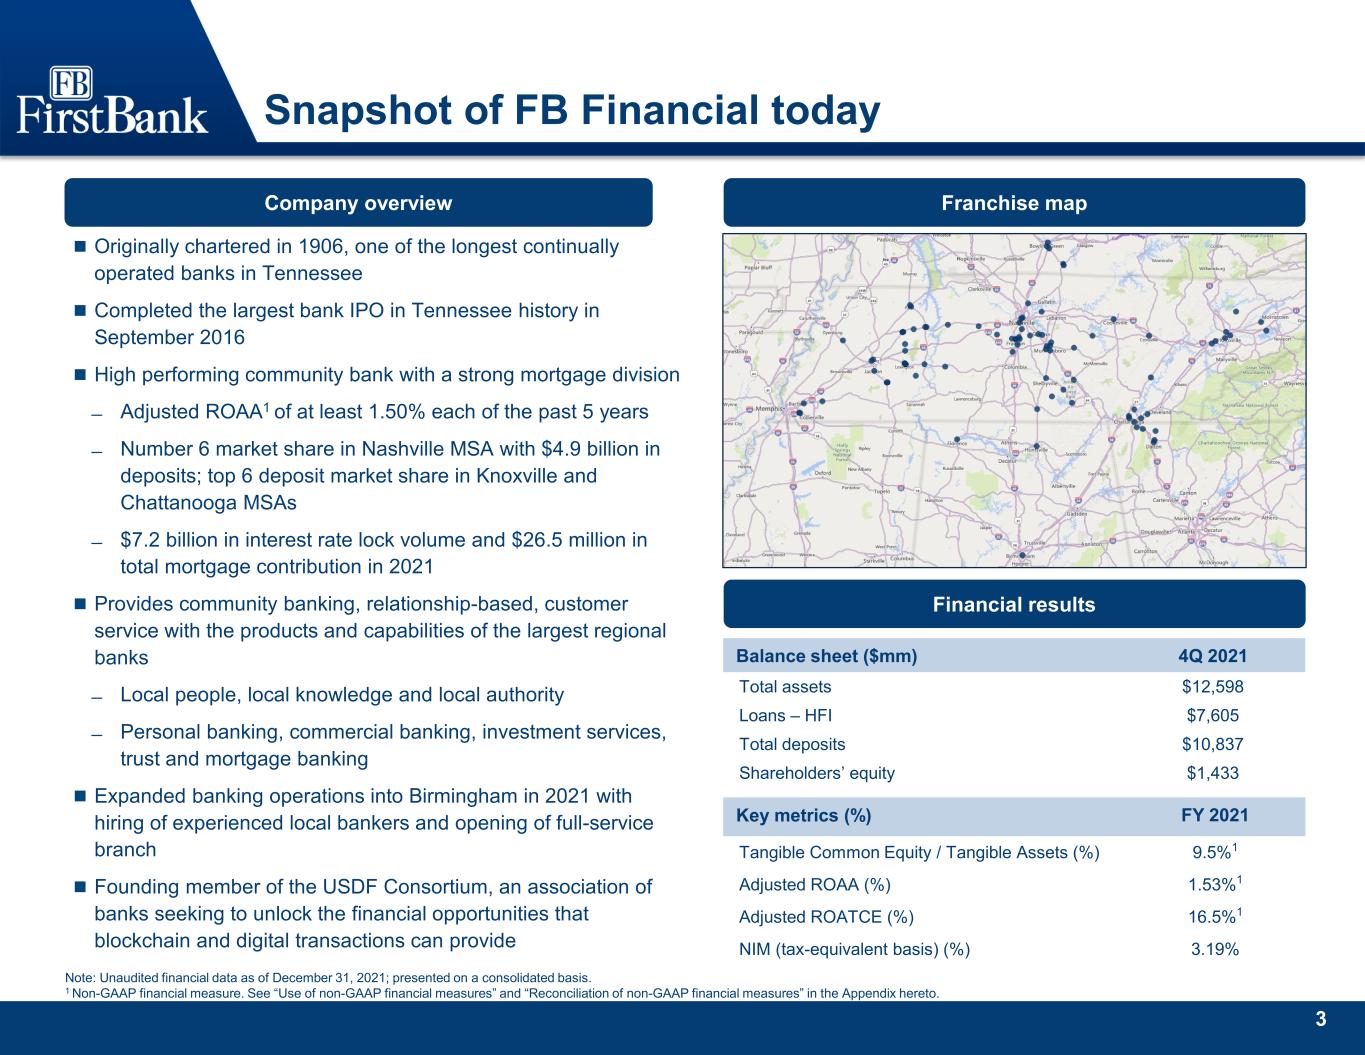
3 Snapshot of FB Financial today Note: Unaudited financial data as of December 31, 2021; presented on a consolidated basis. 1 Non-GAAP financial measure. See “Use of non-GAAP financial measures” and “Reconciliation of non-GAAP financial measures” in the Appendix hereto. Financial results Balance sheet ($mm) 4Q 2021 Total assets $12,598 Loans – HFI $7,605 Total deposits $10,837 Shareholders’ equity $1,433 Company overview Originally chartered in 1906, one of the longest continually operated banks in Tennessee Completed the largest bank IPO in Tennessee history in September 2016 High performing community bank with a strong mortgage division ̶ Adjusted ROAA1 of at least 1.50% each of the past 5 years ̶ Number 6 market share in Nashville MSA with $4.9 billion in deposits; top 6 deposit market share in Knoxville and Chattanooga MSAs ̶ $7.2 billion in interest rate lock volume and $26.5 million in total mortgage contribution in 2021 Provides community banking, relationship-based, customer service with the products and capabilities of the largest regional banks ̶ Local people, local knowledge and local authority ̶ Personal banking, commercial banking, investment services, trust and mortgage banking Expanded banking operations into Birmingham in 2021 with hiring of experienced local bankers and opening of full-service branch Founding member of the USDF Consortium, an association of banks seeking to unlock the financial opportunities that blockchain and digital transactions can provide Franchise map Key metrics (%) FY 2021 Tangible Common Equity / Tangible Assets (%) 9.5%1 Adjusted ROAA (%) 1.53%1 Adjusted ROATCE (%) 16.5%1 NIM (tax-equivalent basis) (%) 3.19%

4 Strategic drivers Elite Financial Performance Proven Opportunistic Acquirer with Scalable Platforms and Technology Highly Motivated Senior Management Team Great Place to Work Organic Growth Focused Empowered Teams Across Attractive Metro and Community Markets
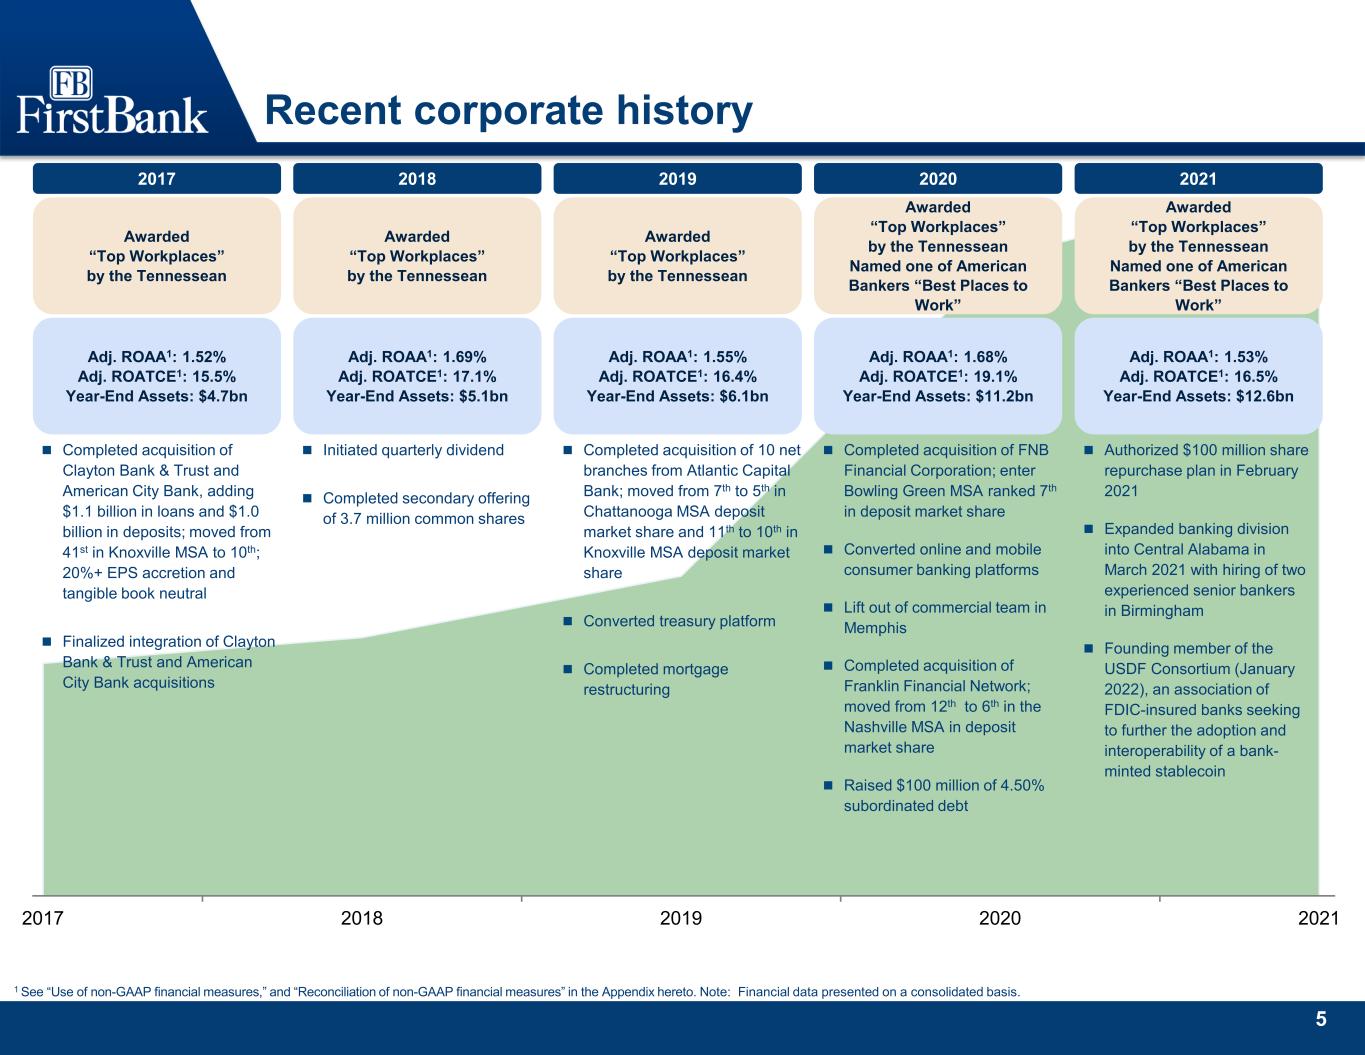
5 2017 2018 2019 2020 2021 Recent corporate history 1 See “Use of non-GAAP financial measures,” and “Reconciliation of non-GAAP financial measures” in the Appendix hereto. Note: Financial data presented on a consolidated basis. 202020182017 Completed acquisition of Clayton Bank & Trust and American City Bank, adding $1.1 billion in loans and $1.0 billion in deposits; moved from 41st in Knoxville MSA to 10th; 20%+ EPS accretion and tangible book neutral Finalized integration of Clayton Bank & Trust and American City Bank acquisitions Initiated quarterly dividend Completed secondary offering of 3.7 million common shares Completed acquisition of 10 net branches from Atlantic Capital Bank; moved from 7th to 5th in Chattanooga MSA deposit market share and 11th to 10th in Knoxville MSA deposit market share Converted treasury platform Completed mortgage restructuring Adj. ROAA1: 1.55% Adj. ROATCE1: 16.4% Year-End Assets: $6.1bn Adj. ROAA1: 1.69% Adj. ROATCE1: 17.1% Year-End Assets: $5.1bn Adj. ROAA1: 1.52% Adj. ROATCE1: 15.5% Year-End Assets: $4.7bn Awarded “Top Workplaces” by the Tennessean Awarded “Top Workplaces” by the Tennessean Awarded “Top Workplaces” by the Tennessean Named one of American Bankers “Best Places to Work” 2019 Adj. ROAA1: 1.68% Adj. ROATCE1: 19.1% Year-End Assets: $11.2bn Awarded “Top Workplaces” by the Tennessean Completed acquisition of FNB Financial Corporation; enter Bowling Green MSA ranked 7th in deposit market share Converted online and mobile consumer banking platforms Lift out of commercial team in Memphis Completed acquisition of Franklin Financial Network; moved from 12th to 6th in the Nashville MSA in deposit market share Raised $100 million of 4.50% subordinated debt 2021 Awarded “Top Workplaces” by the Tennessean Named one of American Bankers “Best Places to Work” Adj. ROAA1: 1.53% Adj. ROATCE1: 16.5% Year-End Assets: $12.6bn Authorized $100 million share repurchase plan in February 2021 Expanded banking division into Central Alabama in March 2021 with hiring of two experienced senior bankers in Birmingham Founding member of the USDF Consortium (January 2022), an association of FDIC-insured banks seeking to further the adoption and interoperability of a bank- minted stablecoin
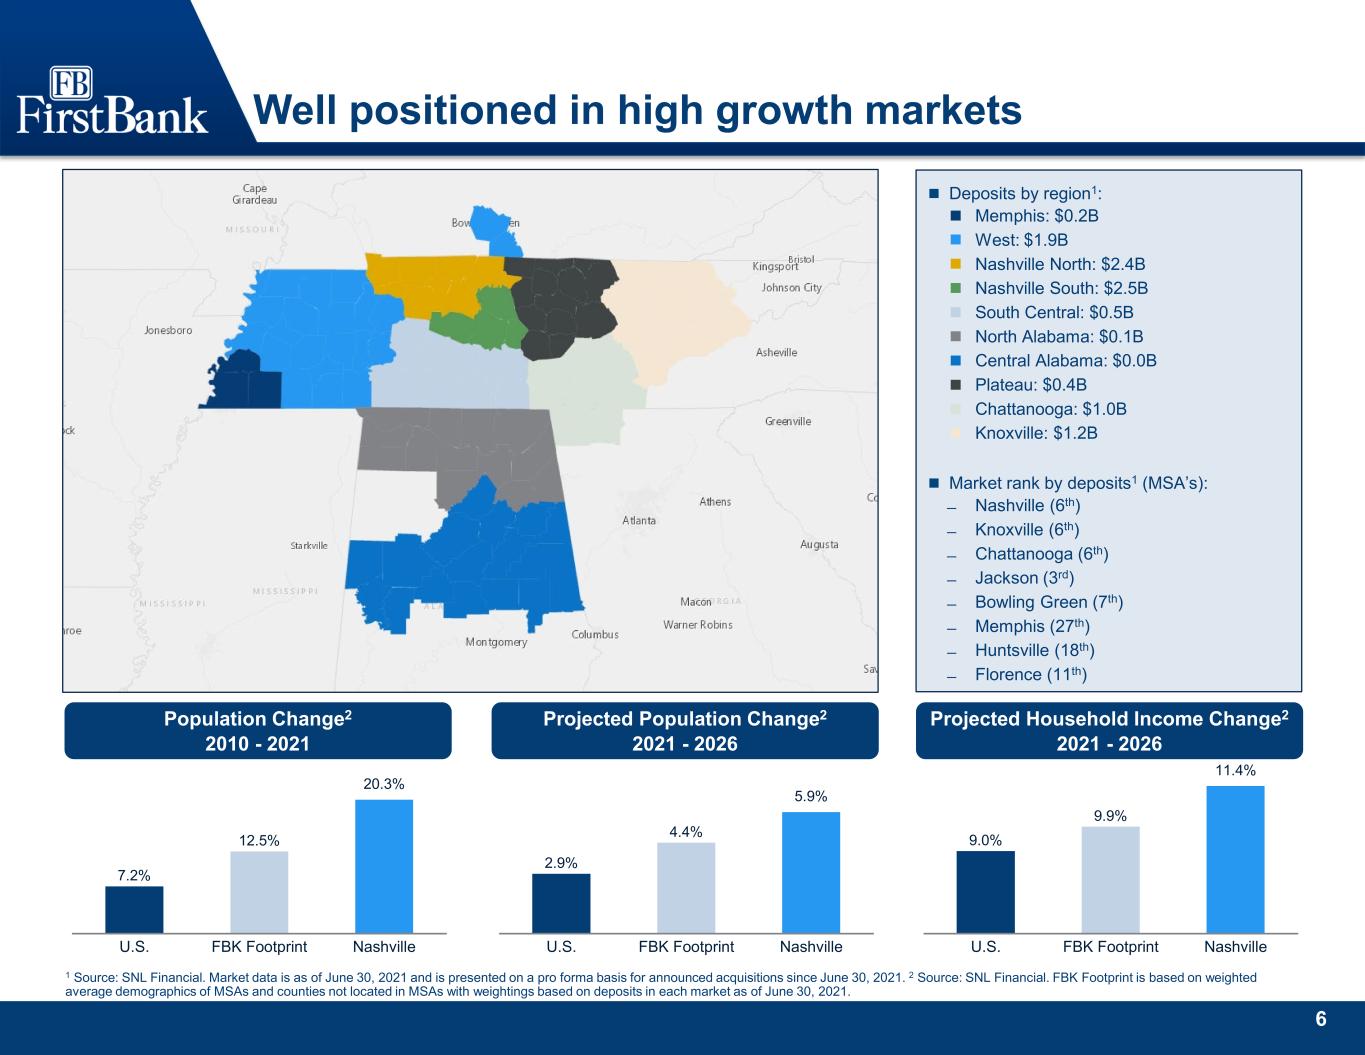
6 Well positioned in high growth markets 1 Source: SNL Financial. Market data is as of June 30, 2021 and is presented on a pro forma basis for announced acquisitions since June 30, 2021. 2 Source: SNL Financial. FBK Footprint is based on weighted average demographics of MSAs and counties not located in MSAs with weightings based on deposits in each market as of June 30, 2021. 7.2% 12.5% 20.3% U.S. FBK Footprint Nashville Population Change2 2010 - 2021 Projected Population Change2 2021 - 2026 Projected Household Income Change2 2021 - 2026 2.9% 4.4% 5.9% U.S. FBK Footprint Nashville 9.0% 9.9% 11.4% U.S. FBK Footprint Nashville Deposits by region1: Memphis: $0.2B West: $1.9B Nashville North: $2.4B Nashville South: $2.5B South Central: $0.5B North Alabama: $0.1B Central Alabama: $0.0B Plateau: $0.4B Chattanooga: $1.0B Knoxville: $1.2B Market rank by deposits1 (MSA’s): ̶ Nashville (6th) ̶ Knoxville (6th) ̶ Chattanooga (6th) ̶ Jackson (3rd) ̶ Bowling Green (7th) ̶ Memphis (27th) ̶ Huntsville (18th) ̶ Florence (11th)
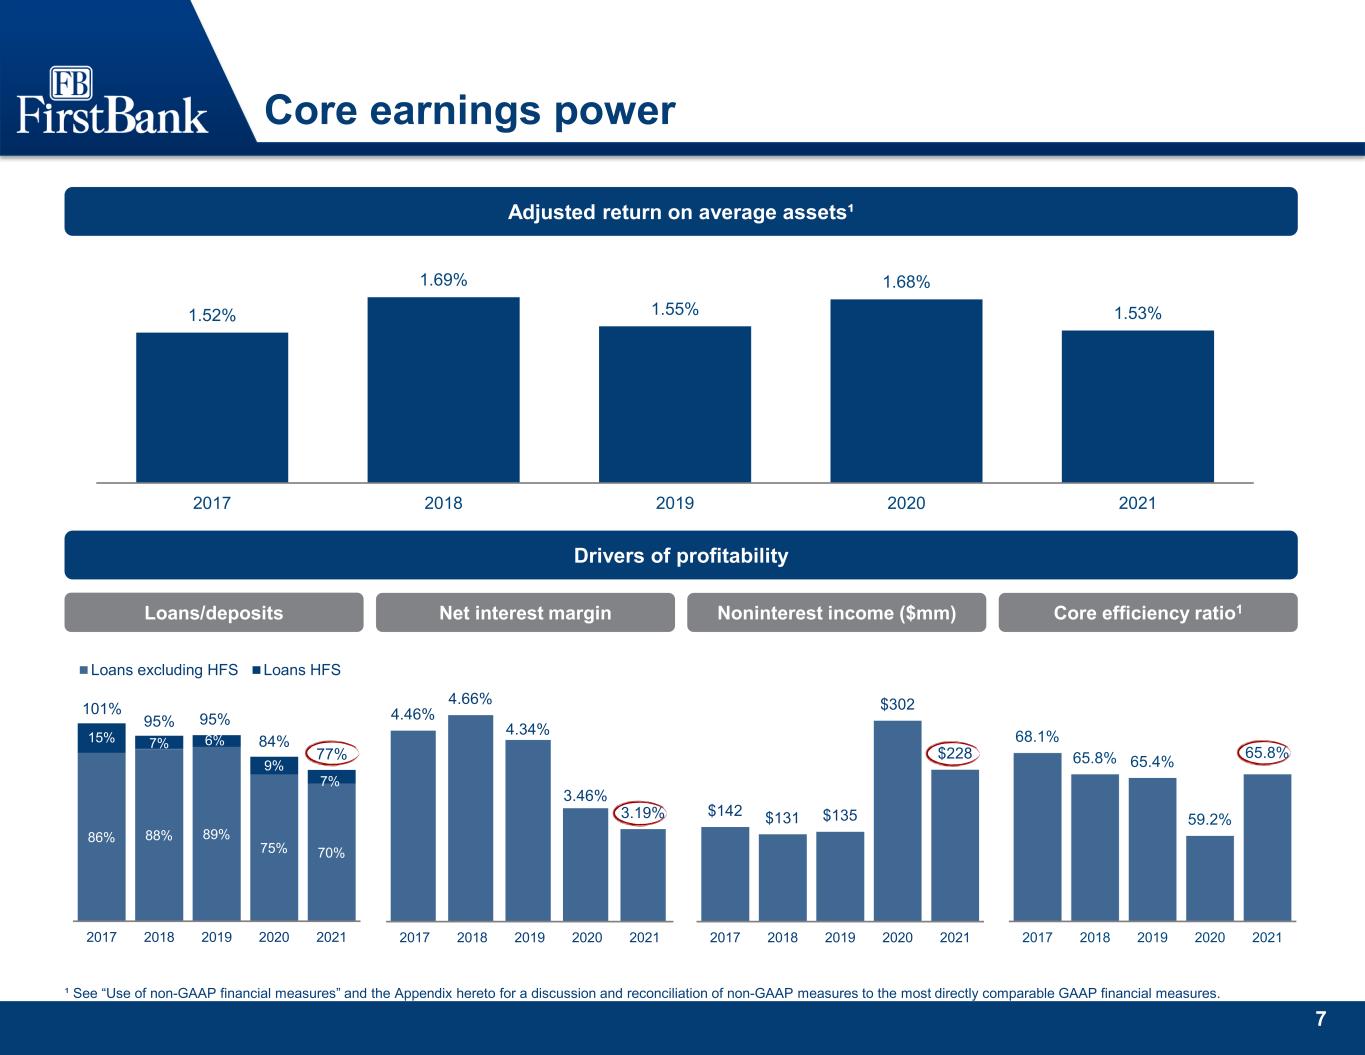
7 68.1% 65.8% 65.4% 59.2% 65.8% 2017 2018 2019 2020 2021 4.46% 4.66% 4.34% 3.46% 3.19% 2017 2018 2019 2020 2021 Core earnings power ¹ See “Use of non-GAAP financial measures” and the Appendix hereto for a discussion and reconciliation of non-GAAP measures to the most directly comparable GAAP financial measures. Adjusted return on average assets¹ 1.52% 1.69% 1.55% 1.68% 1.53% 2017 2018 2019 2020 2021 Drivers of profitability Net interest margin Noninterest income ($mm)Loans/deposits Core efficiency ratio1 $142 $131 $135 $302 $228 2017 2018 2019 2020 2021 101% 95% 95% 84% 77% 86% 88% 89% 75% 70% 15% 7% 6% 9% 7% 2017 2018 2019 2020 2021 Loans excluding HFS Loans HFS
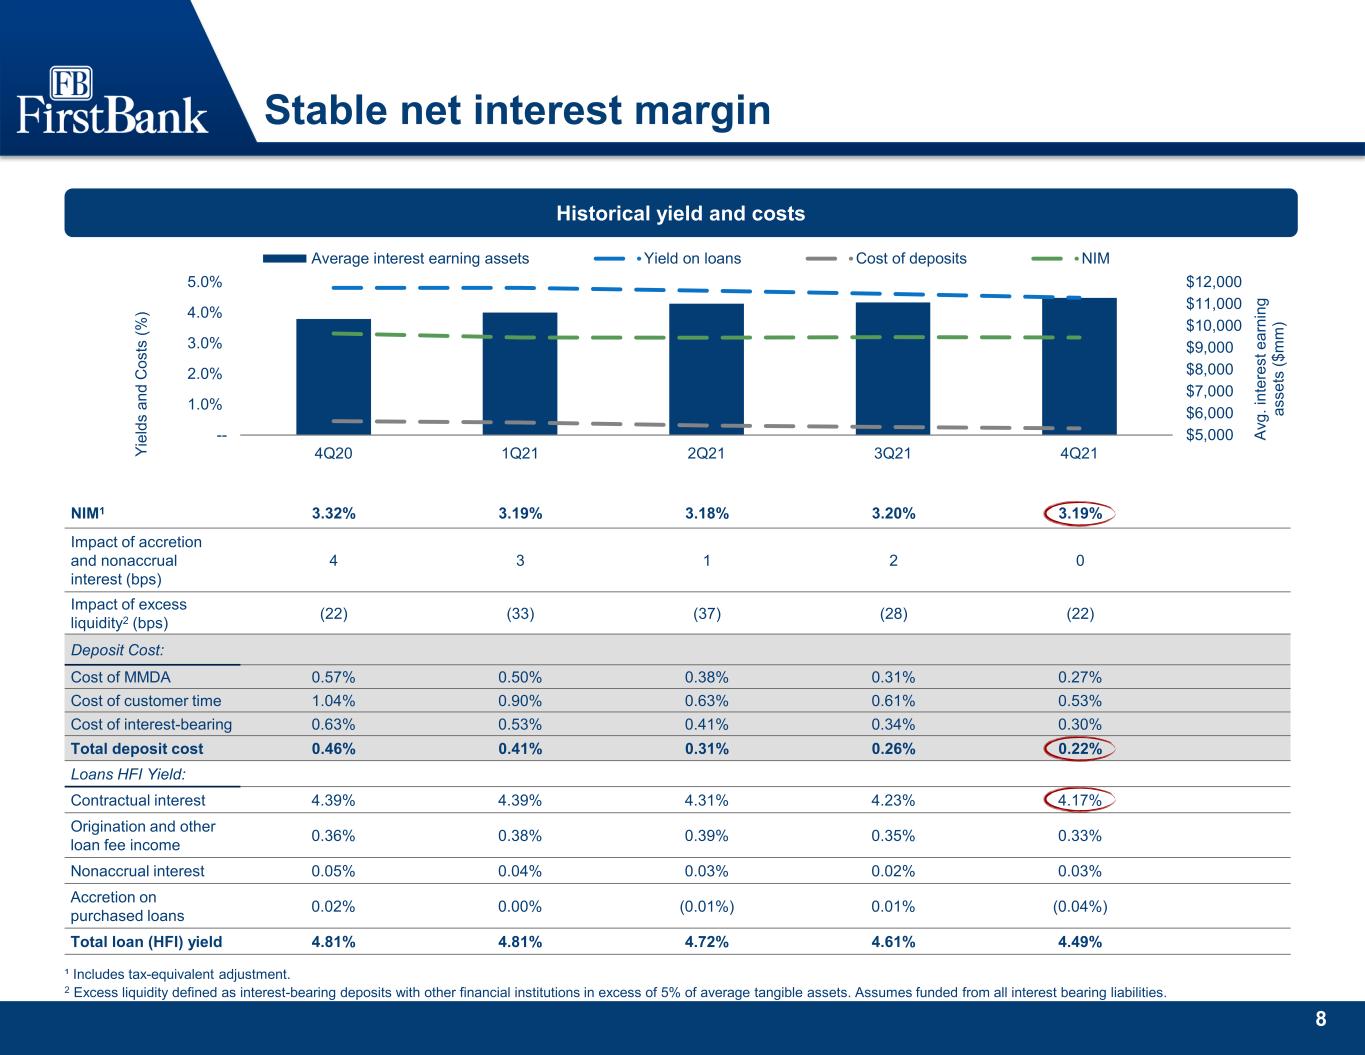
8 Stable net interest margin Historical yield and costs ¹ Includes tax-equivalent adjustment. 2 Excess liquidity defined as interest-bearing deposits with other financial institutions in excess of 5% of average tangible assets. Assumes funded from all interest bearing liabilities. $5,000 $6,000 $7,000 $8,000 $9,000 $10,000 $11,000 $12,000 -- 1.0% 2.0% 3.0% 4.0% 5.0% 4Q20 1Q21 2Q21 3Q21 4Q21 Av g. in te re st e ar ni ng as se ts ($ m m ) Yi el ds a nd C os ts (% ) Average interest earning assets Yield on loans Cost of deposits NIM NIM1 3.32% 3.19% 3.18% 3.20% 3.19% Impact of accretion and nonaccrual interest (bps) 4 3 1 2 0 Impact of excess liquidity2 (bps) (22) (33) (37) (28) (22) Deposit Cost: Cost of MMDA 0.57% 0.50% 0.38% 0.31% 0.27% Cost of customer time 1.04% 0.90% 0.63% 0.61% 0.53% Cost of interest-bearing 0.63% 0.53% 0.41% 0.34% 0.30% Total deposit cost 0.46% 0.41% 0.31% 0.26% 0.22% Loans HFI Yield: Contractual interest 4.39% 4.39% 4.31% 4.23% 4.17% Origination and other loan fee income 0.36% 0.38% 0.39% 0.35% 0.33% Nonaccrual interest 0.05% 0.04% 0.03% 0.02% 0.03% Accretion on purchased loans 0.02% 0.00% (0.01%) 0.01% (0.04%) Total loan (HFI) yield 4.81% 4.81% 4.72% 4.61% 4.49%

9 3Q21 Mortgage operations overview Highlights Rising rates are weighing on refinance volumes, which is expected to continue throughout 2022. Total mortgage pre-tax contribution1 of $0.7 million for the fourth quarter Mortgage banking income of $31.4 million in 4Q 2021 compared to $45.4 million in 3Q 2021 Pipeline at the end of 4Q 2021 of $487 million, as compared to $738 million at the end of 3Q 2021 Strategy adjusted to attract more nonreferral business by rebranding internet delivery channel from ConsumerDirect to Real Genius (Q1 2022) Mortgage banking income ($mm) 4Q20 3Q21 4Q21 Gain on Sale $84.0 $39.2 $37.5 Fair value changes ($16.9) $1.0 ($12.5) Servicing Revenue $6.4 $7.6 $7.7 Fair value MSR changes ($7.8) ($2.4) ($1.3) Total Income $65.7 $45.4 $31.4 ¹ See “Use of non-GAAP financial measures” and the Appendix hereto for a discussion and reconciliation of non-GAAP financial measures to the most directly comparable GAAP financial measures. 2 Defined as the fair value plus related derivatives for mandatory and best efforts divided by their pull-through weighted volume. Quarterly mortgage production Mark to Market Value and Gain on Sale Margin 4Q20 4Q21 IRLC volume: IRLC pipeline2: Refinance %: Purchase %: $2,187mm $2,012mm $1,484mm $1,192mm $738mm $487mm 76% 66% 57% 24% 34% 43% Consumer Direct Retail 3.42% 2.91% 2.42% 2.44% 1.96% 4.59% 3.68% 2.94% 2.55% 2.66% 4Q20 1Q21 2Q21 3Q21 4Q21 Mark to Market Value Gain on Sale Margin2
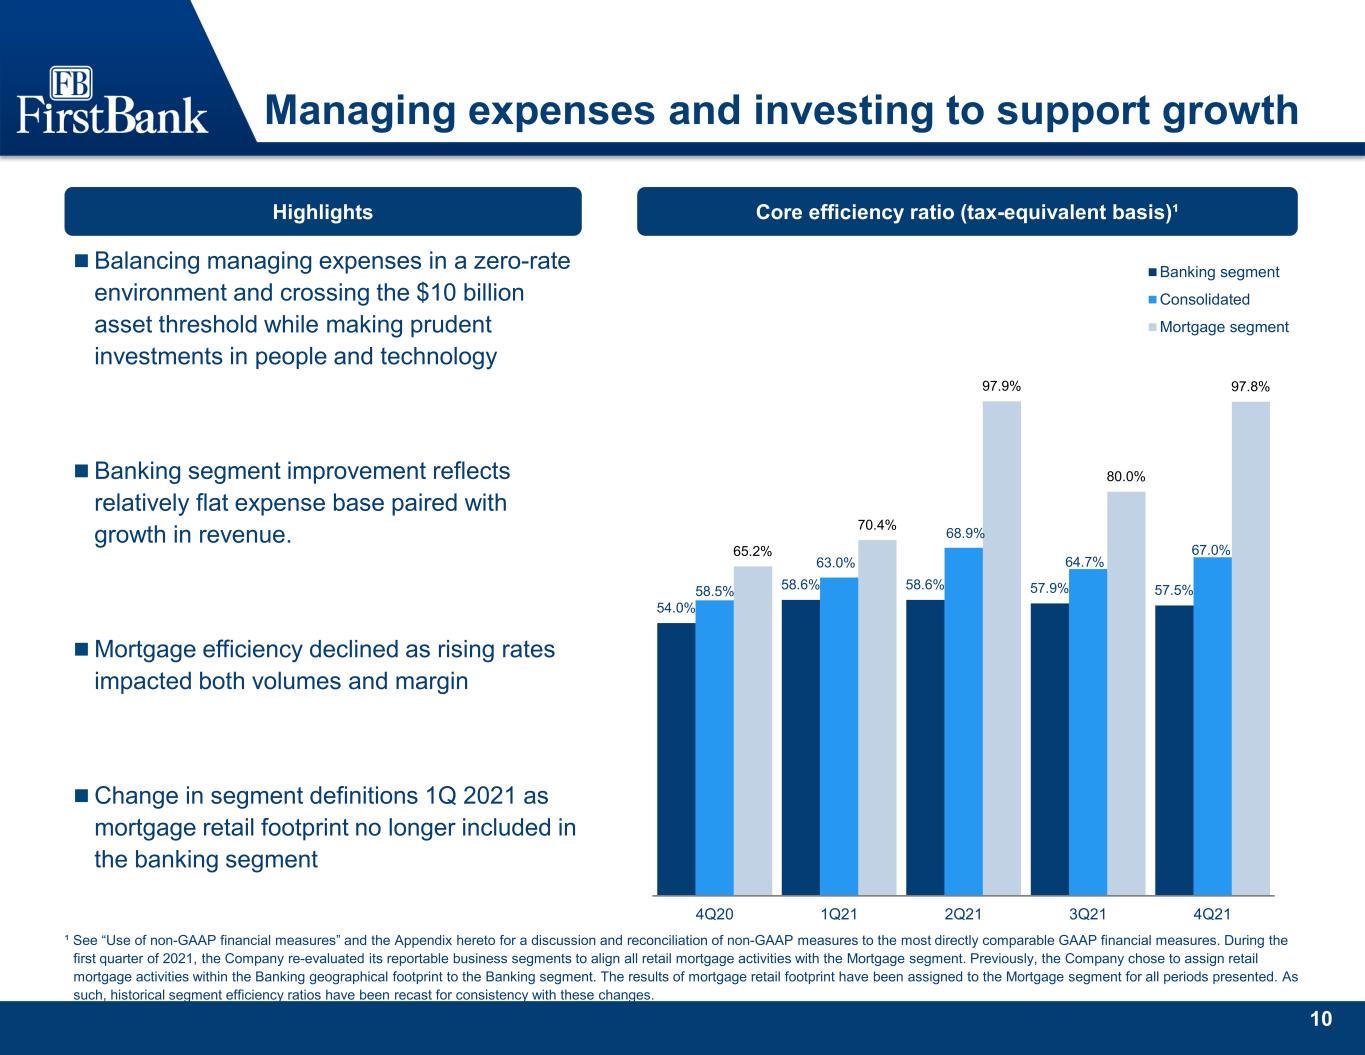
10 Managing expenses and investing to support growth Highlights Balancing managing expenses in a zero-rate environment and crossing the $10 billion asset threshold while making prudent investments in people and technology Banking segment improvement reflects relatively flat expense base paired with growth in revenue. Mortgage efficiency declined as rising rates impacted both volumes and margin Change in segment definitions 1Q 2021 as mortgage retail footprint no longer included in the banking segment ¹ See “Use of non-GAAP financial measures” and the Appendix hereto for a discussion and reconciliation of non-GAAP measures to the most directly comparable GAAP financial measures. During the first quarter of 2021, the Company re-evaluated its reportable business segments to align all retail mortgage activities with the Mortgage segment. Previously, the Company chose to assign retail mortgage activities within the Banking geographical footprint to the Banking segment. The results of mortgage retail footprint have been assigned to the Mortgage segment for all periods presented. As such, historical segment efficiency ratios have been recast for consistency with these changes. Core efficiency ratio (tax-equivalent basis)¹ 54.0% 58.6% 58.6% 57.9% 57.5% 58.5% 63.0% 68.9% 64.7% 67.0% 65.2% 70.4% 97.9% 80.0% 97.8% 4Q20 1Q21 2Q21 3Q21 4Q21 Banking segment Consolidated Mortgage segment

11 Well-capitalized for future opportunities Tangible book value per share3 Simple capital structure Common Equity Tier 1 Capital 85% Trust Preferred 2% Subordinated Notes 7% Tier 2 ACL 6% Total regulatory capital: $1,4292 mm $11.56 $11.58 $14.56 $17.02 $18.55 $21.73 $24.67 3Q16 4Q16 4Q17 4Q18 4Q19 4Q20 4Q21 4Q201 3Q211 4Q211,2 Shareholder’s equity/Assets 11.5% 11.9% 11.4% TCE/TA3 9.4% 9.9% 9.5% Common equity tier 1/Risk-weighted assets 11.7% 12.4% 12.3% Tier 1 capital/Risk-weighted assets 12.0% 12.7% 12.6% Total capital/Risk-weighted assets 15.0% 14.6% 14.4% Tier 1 capital /Average assets 10.0% 10.4% 10.5% C&D loans subject to 100% tier 1 capital plus ACL4 93% 91% 99% CRE loans subject to 300% tier 1 capital plus ACL4 228% 247% 254% Capital position 1 For regulatory capital purposes, the CECL impact over 2020 and 2021 is gradually phased-in from Common Equity Tier 1 Capital to Tier 2 capital. As of 4Q20, 3Q21 and 4Q21, respectively, $52.1 million, $44.4 million and $40.9 million are being added back to CET 1 and Tier 1 Capital, and $58.0 million, $50.2 million and $46.8 million are being taken out of Tier 2 capital. 2 Total regulatory capital, FB Financial Corporation. 4Q21 calculation is preliminary and subject to change. 3 See “Use of non-GAAP financial measures” and the Appendix hereto for a discussion and reconciliation of non-GAAP measures. 4 Tier 1 capital at FirstBank as defined in Call Report.
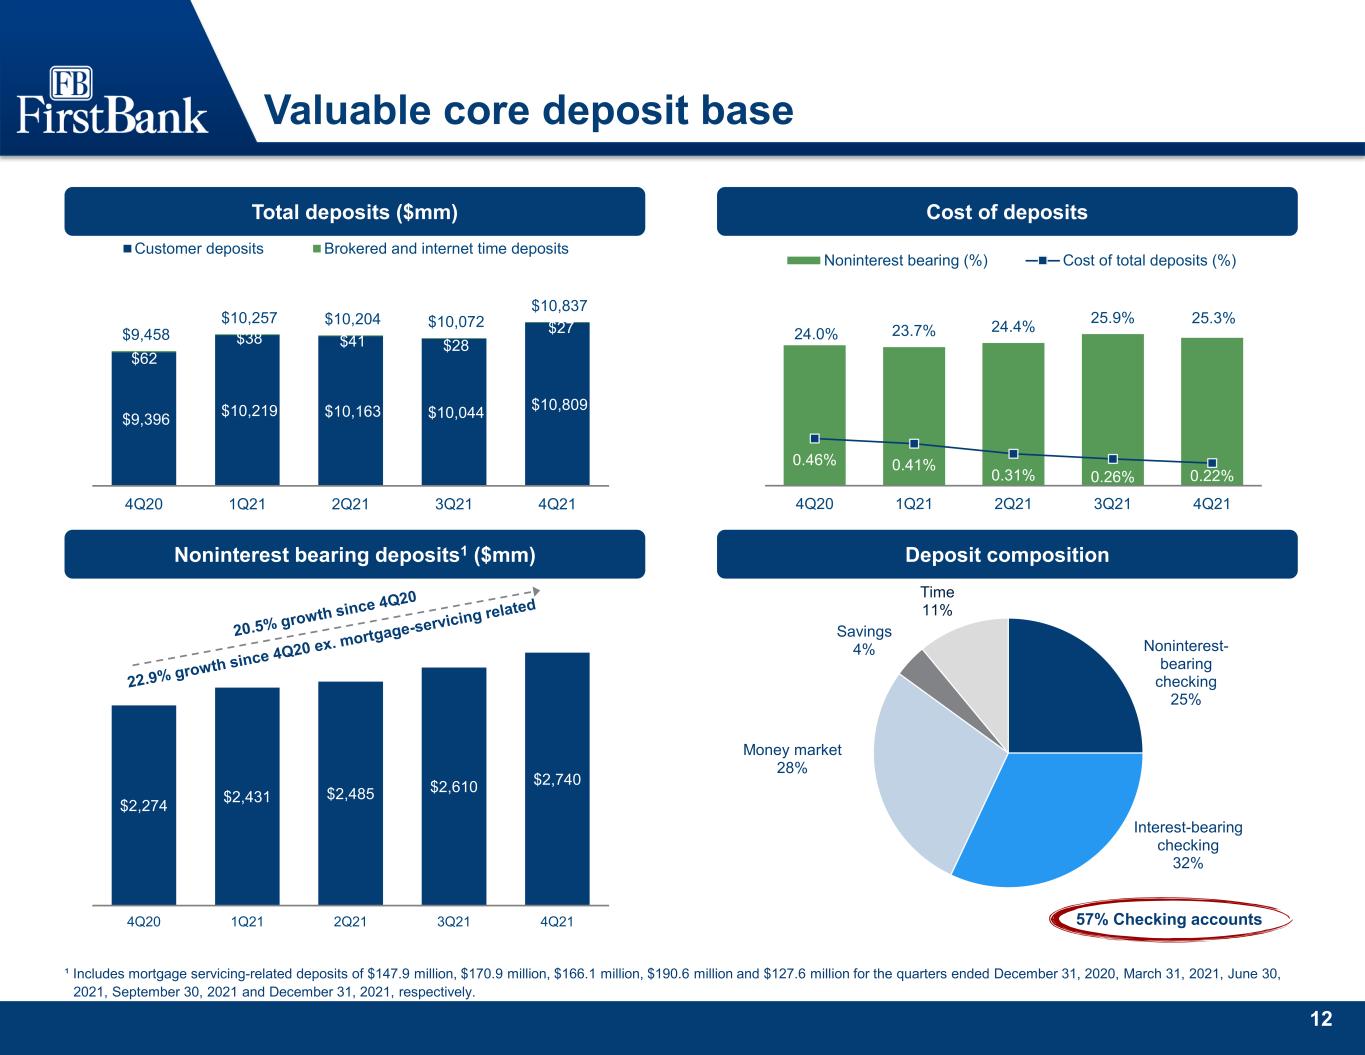
12 Noninterest- bearing checking 25% Interest-bearing checking 32% Money market 28% Savings 4% Time 11% 57% Checking accounts Valuable core deposit base ¹ Includes mortgage servicing-related deposits of $147.9 million, $170.9 million, $166.1 million, $190.6 million and $127.6 million for the quarters ended December 31, 2020, March 31, 2021, June 30, 2021, September 30, 2021 and December 31, 2021, respectively. Total deposits ($mm) Cost of deposits Noninterest bearing deposits1 ($mm) Deposit composition $9,396 $10,219 $10,163 $10,044 $10,809 $62 $38 $41 $28 $27 $9,458 $10,257 $10,204 $10,072 $10,837 4Q20 1Q21 2Q21 3Q21 4Q21 Customer deposits Brokered and internet time deposits $2,274 $2,431 $2,485 $2,610 $2,740 4Q20 1Q21 2Q21 3Q21 4Q21 24.0% 23.7% 24.4% 25.9% 25.3% 0.46% 0.41% 0.31% 0.26% 0.22% 0.0% 5.0% 10.0% 15.0% 20.0% 25.0% 30.0% 35.0% 4Q20 1Q21 2Q21 3Q21 4Q21 Noninterest bearing (%) Cost of total deposits (%)
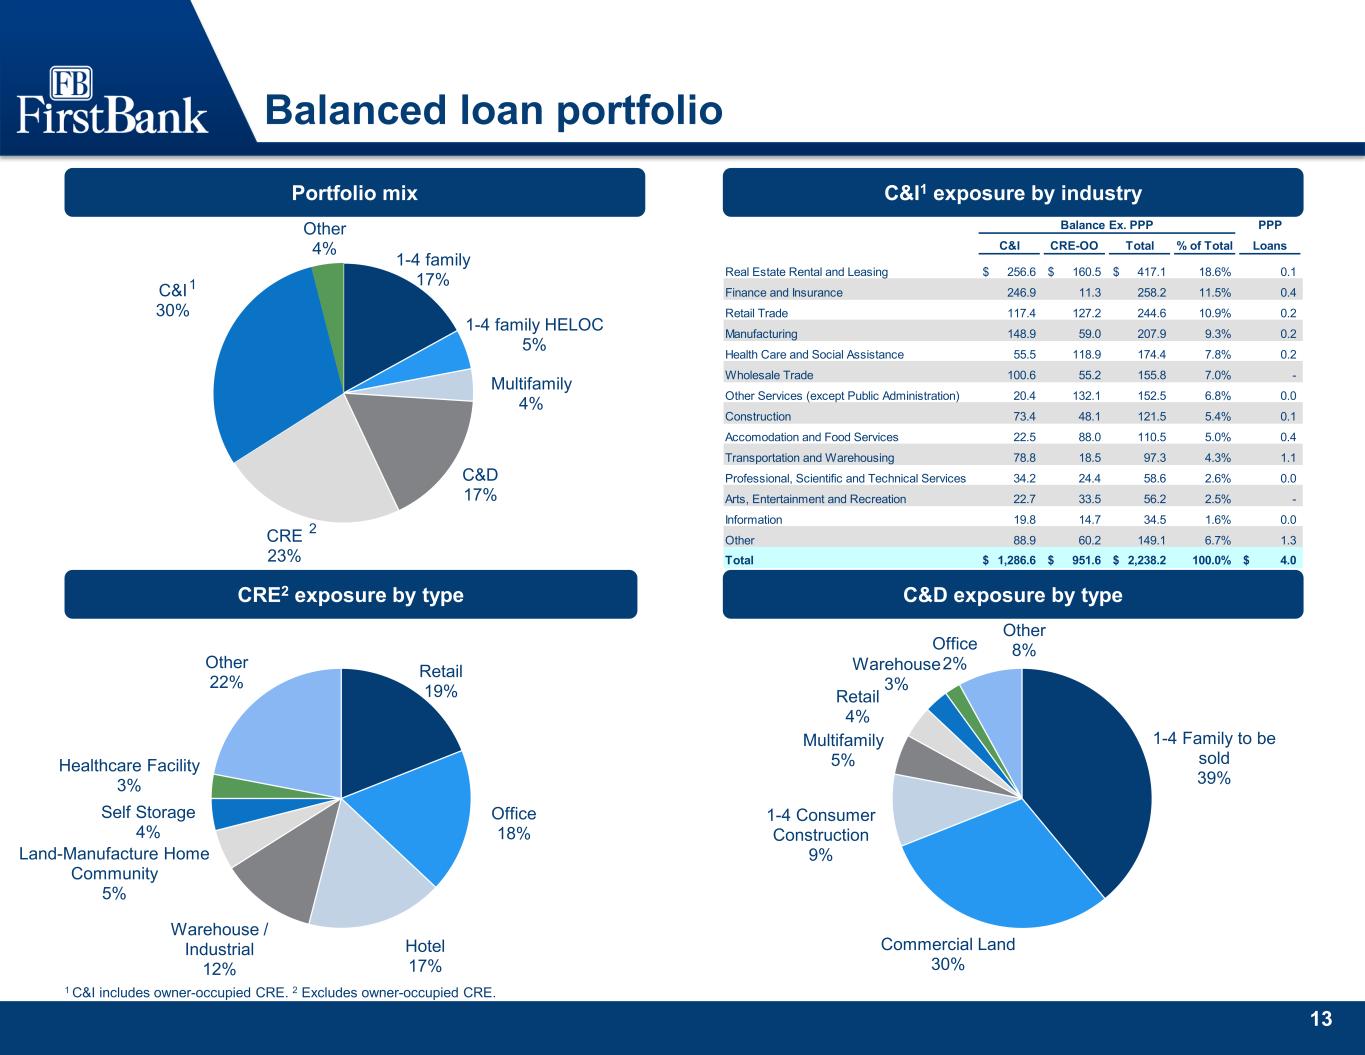
13 Retail 19% Office 18% Hotel 17% Warehouse / Industrial 12% Land-Manufacture Home Community 5% Self Storage 4% Healthcare Facility 3% Other 22% 1-4 Family to be sold 39% Commercial Land 30% 1-4 Consumer Construction 9% Multifamily 5% Retail 4% Warehouse 3% Office 2% Other 8% 1-4 family 17% 1-4 family HELOC 5% Multifamily 4% C&D 17% CRE 23% C&I 30% Other 4% Balanced loan portfolio CRE2 exposure by type Portfolio mix 1 C&I includes owner-occupied CRE. 2 Excludes owner-occupied CRE. C&I1 exposure by industry 1 2 C&D exposure by type Balance Ex. PPP PPP C&I CRE-OO Total % of Total Loans Real Estate Rental and Leasing 256.6$ 160.5$ 417.1$ 18.6% 0.1 Finance and Insurance 246.9 11.3 258.2 11.5% 0.4 Retail Trade 117.4 127.2 244.6 10.9% 0.2 Manufacturing 148.9 59.0 207.9 9.3% 0.2 Health Care and Social Assistance 55.5 118.9 174.4 7.8% 0.2 Wholesale Trade 100.6 55.2 155.8 7.0% - Other Services (except Public Administration) 20.4 132.1 152.5 6.8% 0.0 Construction 73.4 48.1 121.5 5.4% 0.1 Accomodation and Food Services 22.5 88.0 110.5 5.0% 0.4 Transportation and Warehousing 78.8 18.5 97.3 4.3% 1.1 Professional, Scientific and Technical Services 34.2 24.4 58.6 2.6% 0.0 Arts, Entertainment and Recreation 22.7 33.5 56.2 2.5% - Information 19.8 14.7 34.5 1.6% 0.0 Other 88.9 60.2 149.1 6.7% 1.3 Total 1,286.6$ 951.6$ 2,238.2$ 100.0% 4.0$
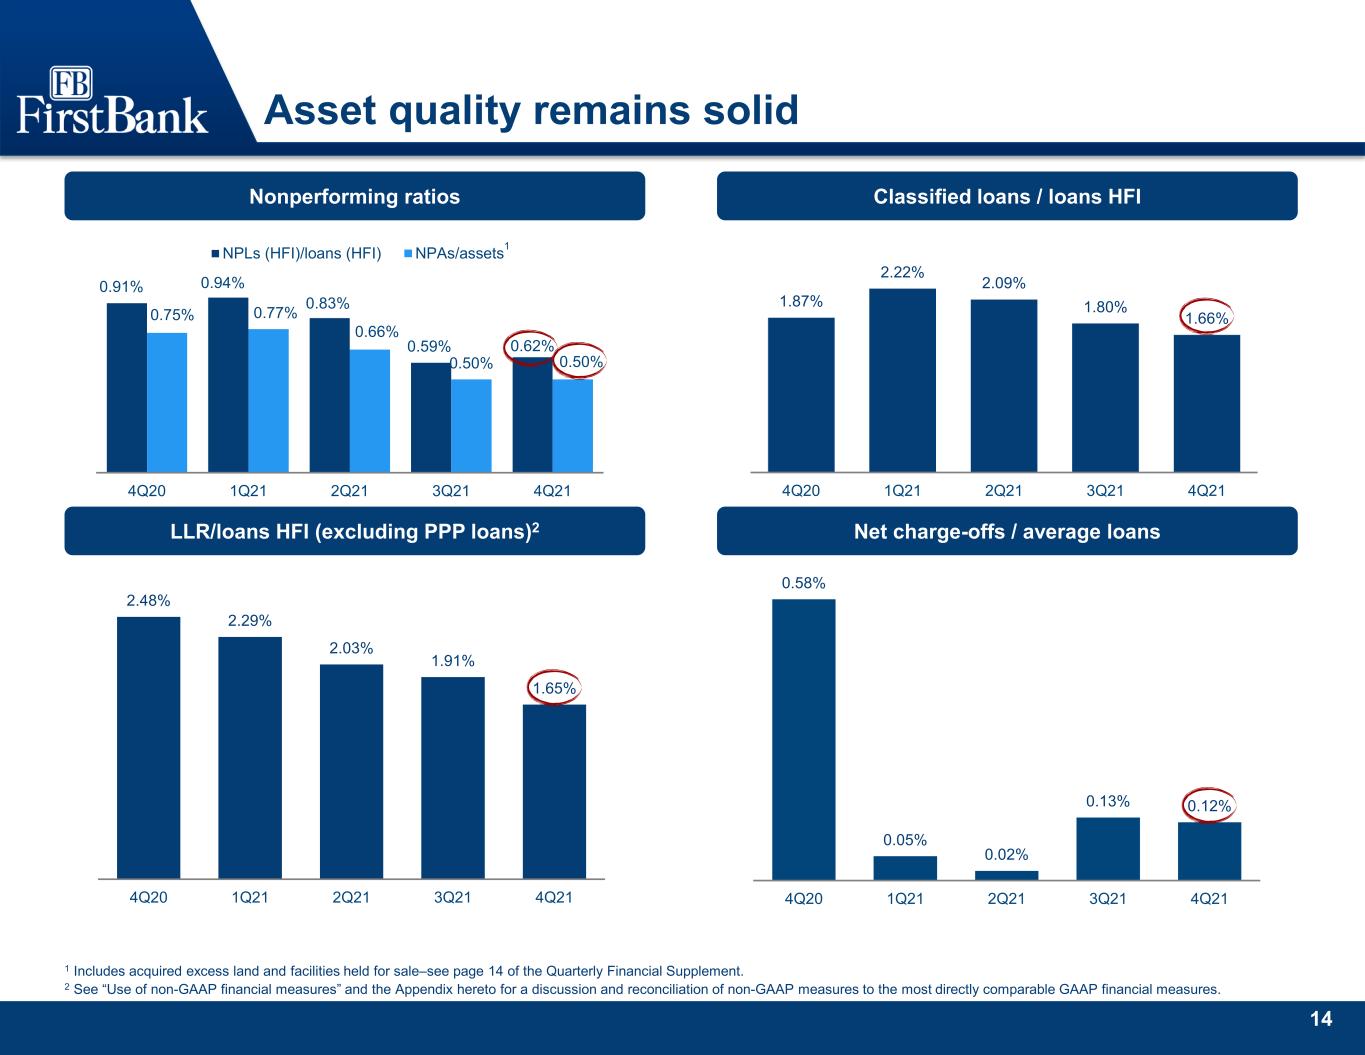
14 0.91% 0.94% 0.83% 0.59% 0.62% 0.75% 0.77% 0.66% 0.50% 0.50% 4Q20 1Q21 2Q21 3Q21 4Q21 NPLs (HFI)/loans (HFI) NPAs/assets 2.48% 2.29% 2.03% 1.91% 1.65% 4Q20 1Q21 2Q21 3Q21 4Q21 0.58% 0.05% 0.02% 0.13% 0.12% 4Q20 1Q21 2Q21 3Q21 4Q21 Asset quality remains solid Nonperforming ratios Classified loans / loans HFI LLR/loans HFI (excluding PPP loans)2 Net charge-offs / average loans 1 Includes acquired excess land and facilities held for sale–see page 14 of the Quarterly Financial Supplement. 2 See “Use of non-GAAP financial measures” and the Appendix hereto for a discussion and reconciliation of non-GAAP measures to the most directly comparable GAAP financial measures. 1.87% 2.22% 2.09% 1.80% 1.66% 4Q20 1Q21 2Q21 3Q21 4Q21 1
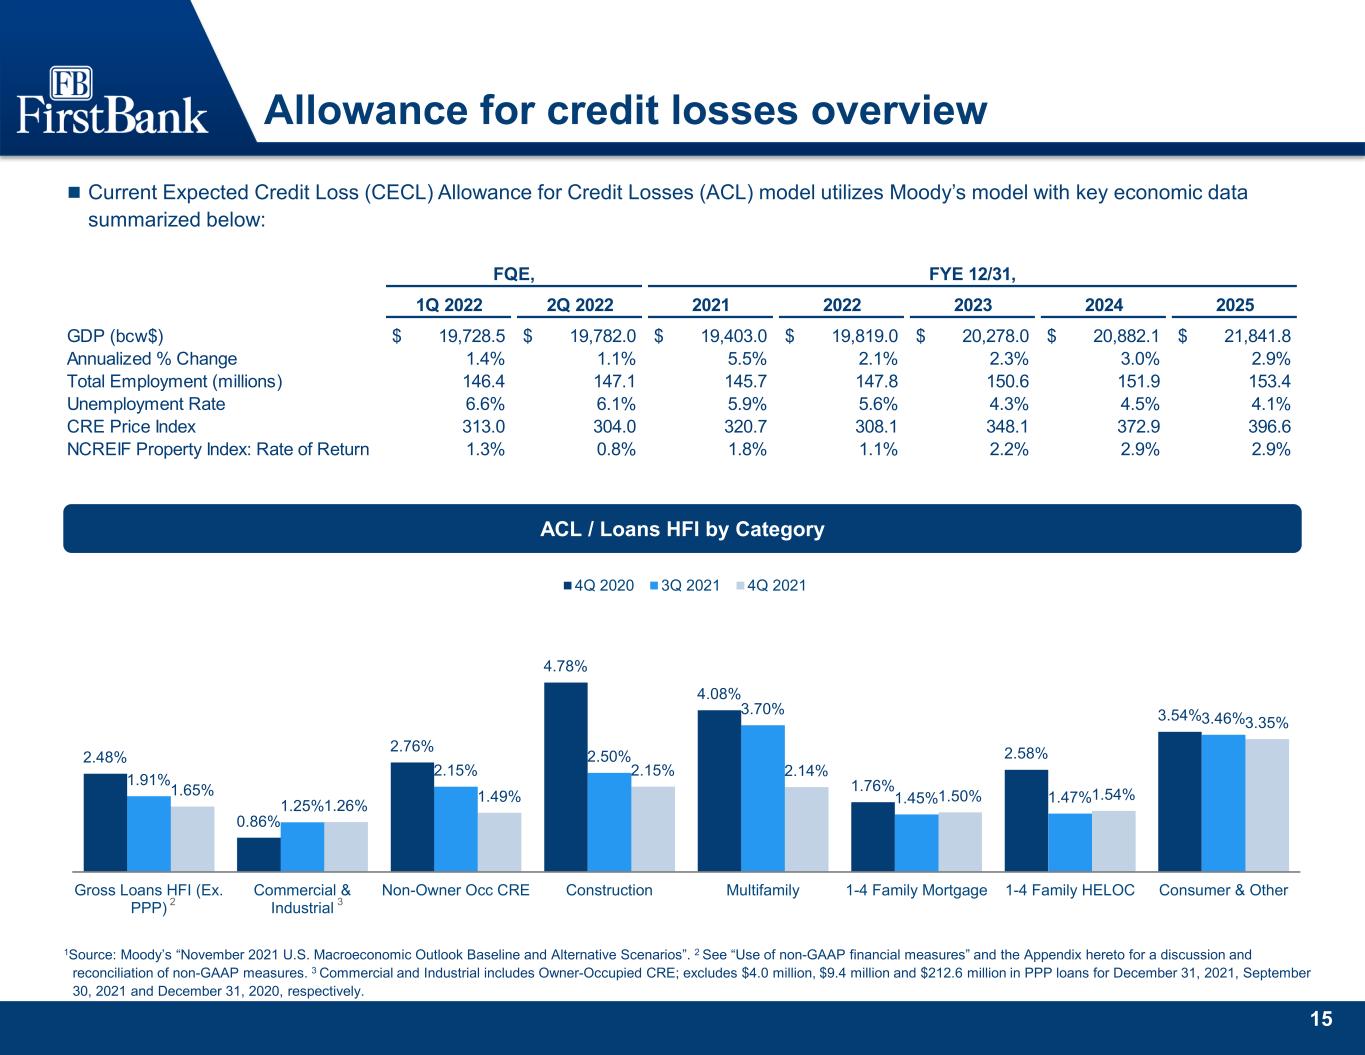
15 Allowance for credit losses overview ACL / Loans HFI by Category Current Expected Credit Loss (CECL) Allowance for Credit Losses (ACL) model utilizes Moody’s model with key economic data summarized below: 1Source: Moody’s “November 2021 U.S. Macroeconomic Outlook Baseline and Alternative Scenarios”. 2 See “Use of non-GAAP financial measures” and the Appendix hereto for a discussion and reconciliation of non-GAAP measures. 3 Commercial and Industrial includes Owner-Occupied CRE; excludes $4.0 million, $9.4 million and $212.6 million in PPP loans for December 31, 2021, September 30, 2021 and December 31, 2020, respectively. 32 2.48% 0.86% 2.76% 4.78% 4.08% 1.76% 2.58% 3.54% 1.91% 1.25% 2.15% 2.50% 3.70% 1.45% 1.47% 3.46% 1.65% 1.26% 1.49% 2.15% 2.14% 1.50% 1.54% 3.35% Gross Loans HFI (Ex. PPP) Commercial & Industrial Non-Owner Occ CRE Construction Multifamily 1-4 Family Mortgage 1-4 Family HELOC Consumer & Other 4Q 2020 3Q 2021 4Q 2021 FQE, FYE 12/31, 1Q 2022 2Q 2022 2021 2022 2023 2024 2025 GDP (bcw$) 19,728.5$ 19,782.0$ 19,403.0$ 19,819.0$ 20,278.0$ 20,882.1$ 21,841.8$ Annualized % Change 1.4% 1.1% 5.5% 2.1% 2.3% 3.0% 2.9% Total Employment (millions) 146.4 147.1 145.7 147.8 150.6 151.9 153.4 Unemployment Rate 6.6% 6.1% 5.9% 5.6% 4.3% 4.5% 4.1% CRE Price Index 313.0 304.0 320.7 308.1 348.1 372.9 396.6 NCREIF Property Index: Rate of Return 1.3% 0.8% 1.8% 1.1% 2.2% 2.9% 2.9%

16 Appendix
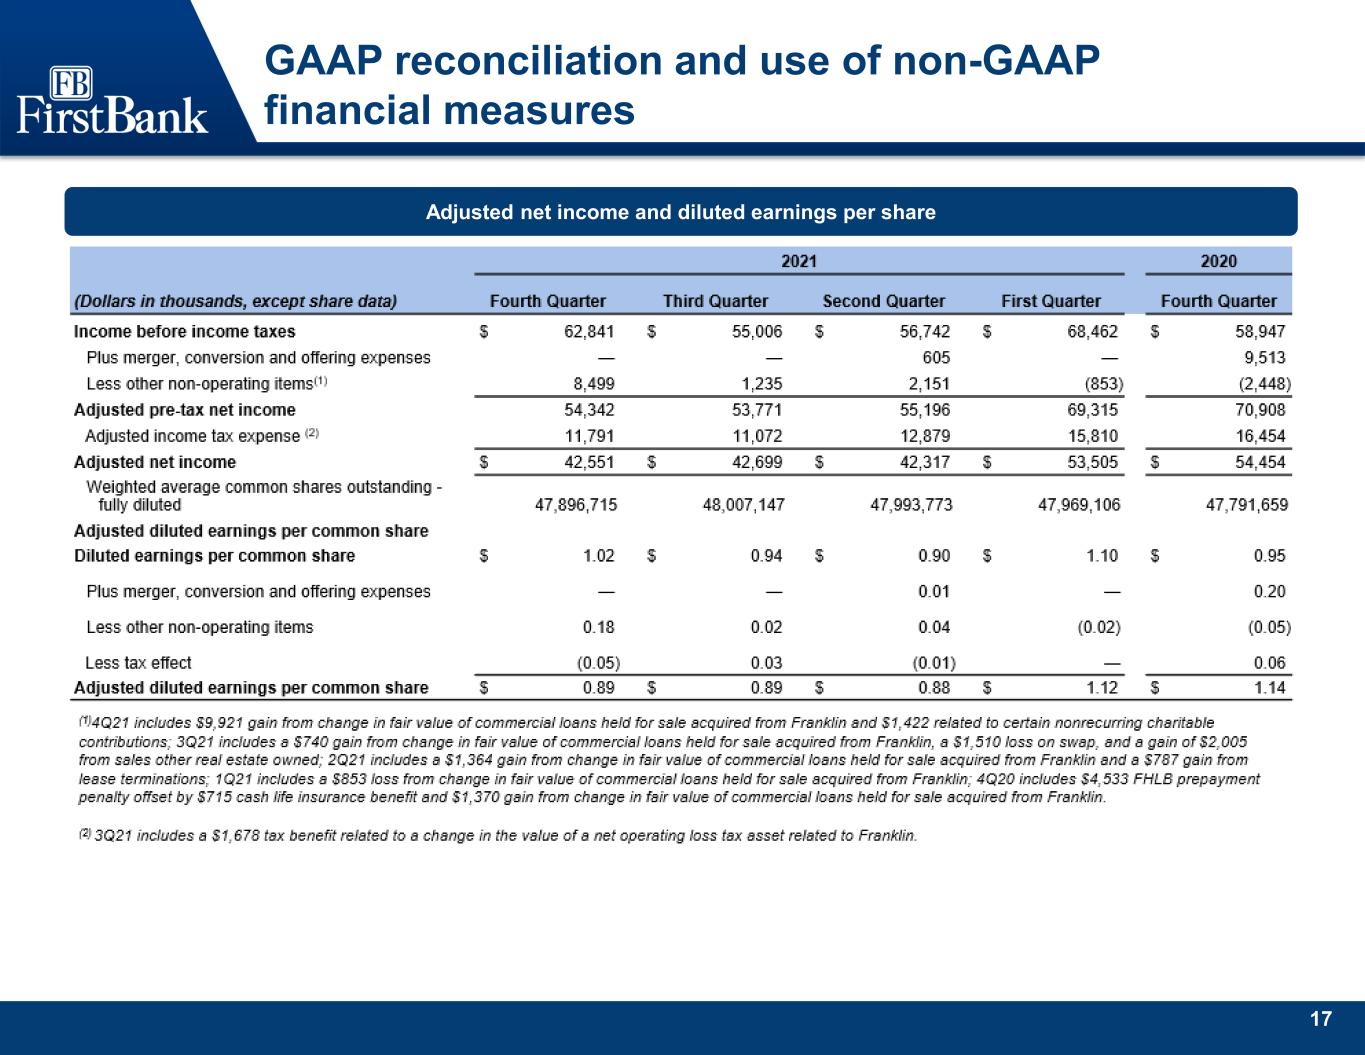
17 GAAP reconciliation and use of non-GAAP financial measures Adjusted net income and diluted earnings per share
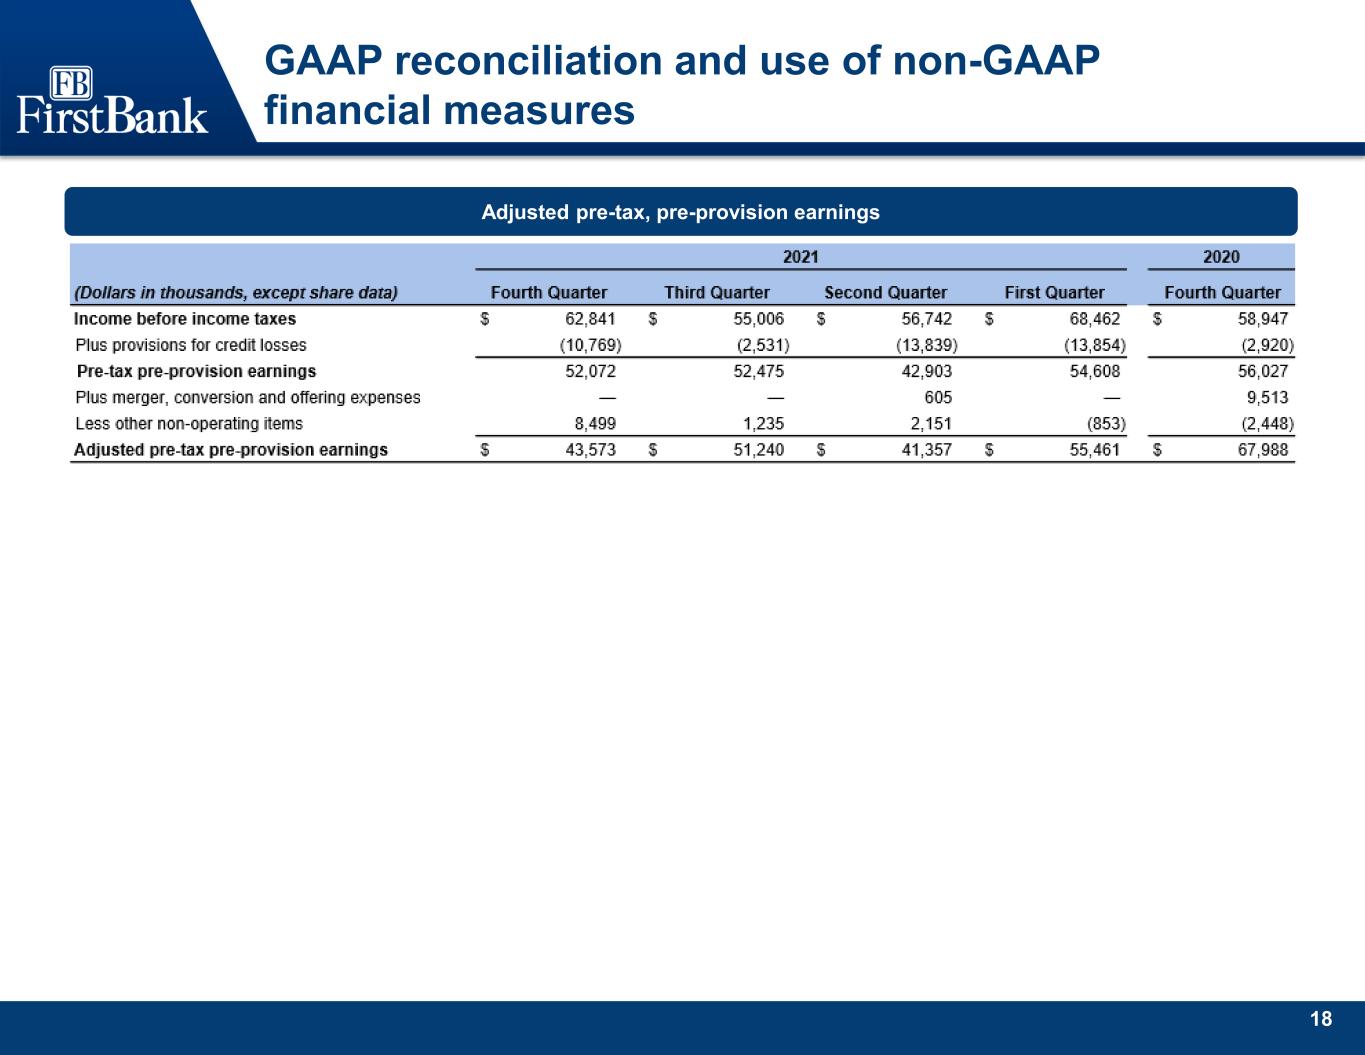
18 GAAP reconciliation and use of non-GAAP financial measures Adjusted pre-tax, pre-provision earnings

19 GAAP reconciliation and use of non-GAAP financial measures Adjusted earnings and diluted earnings per share*
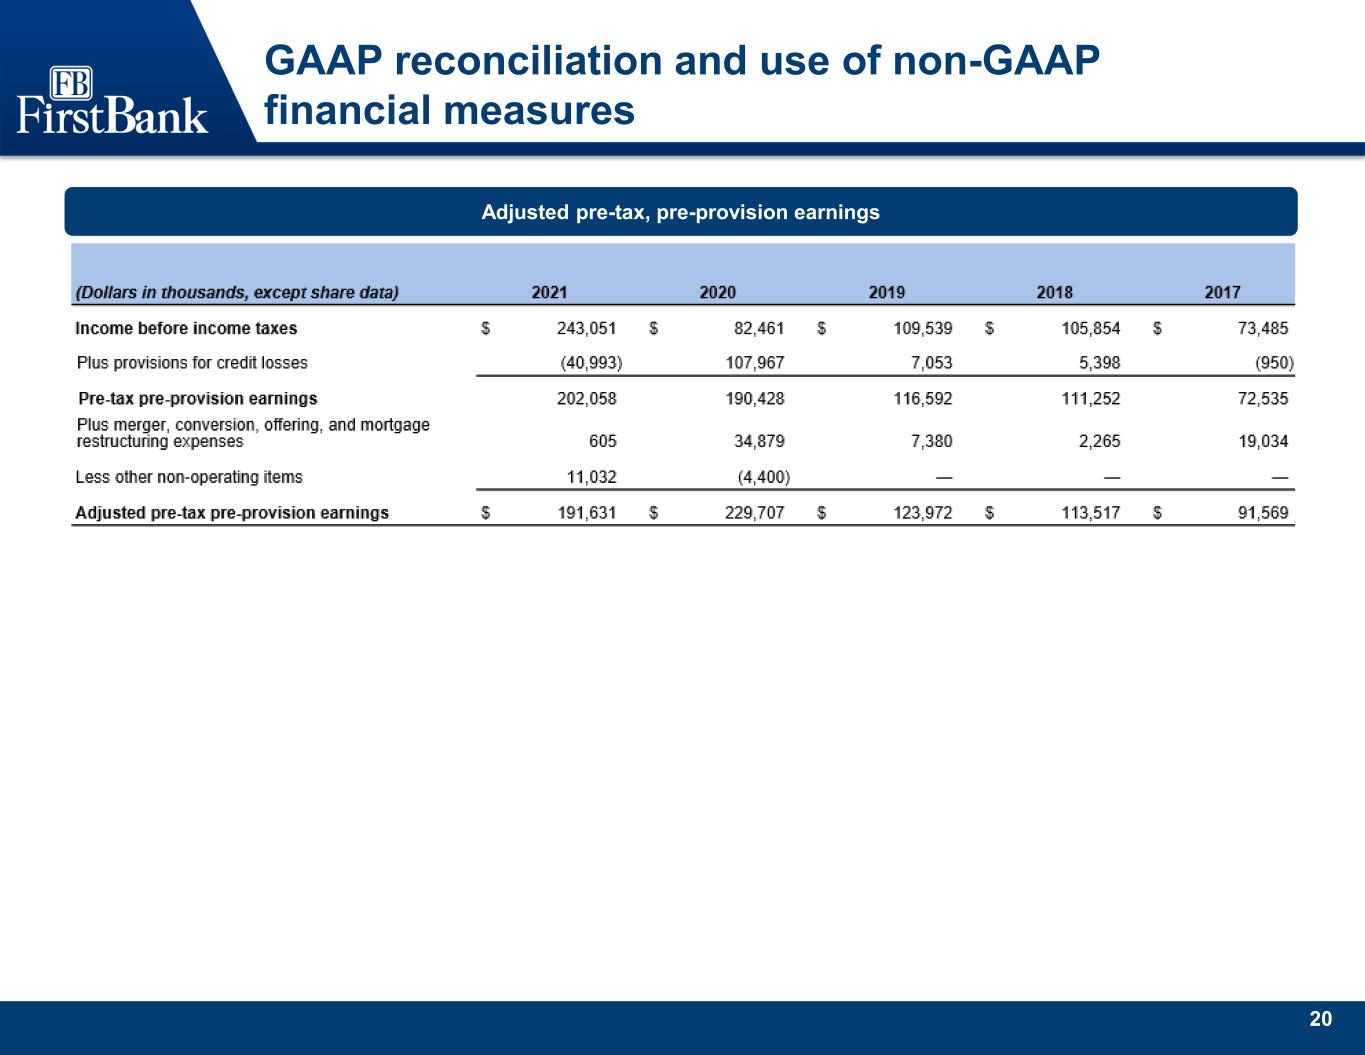
20 GAAP reconciliation and use of non-GAAP financial measures Adjusted pre-tax, pre-provision earnings
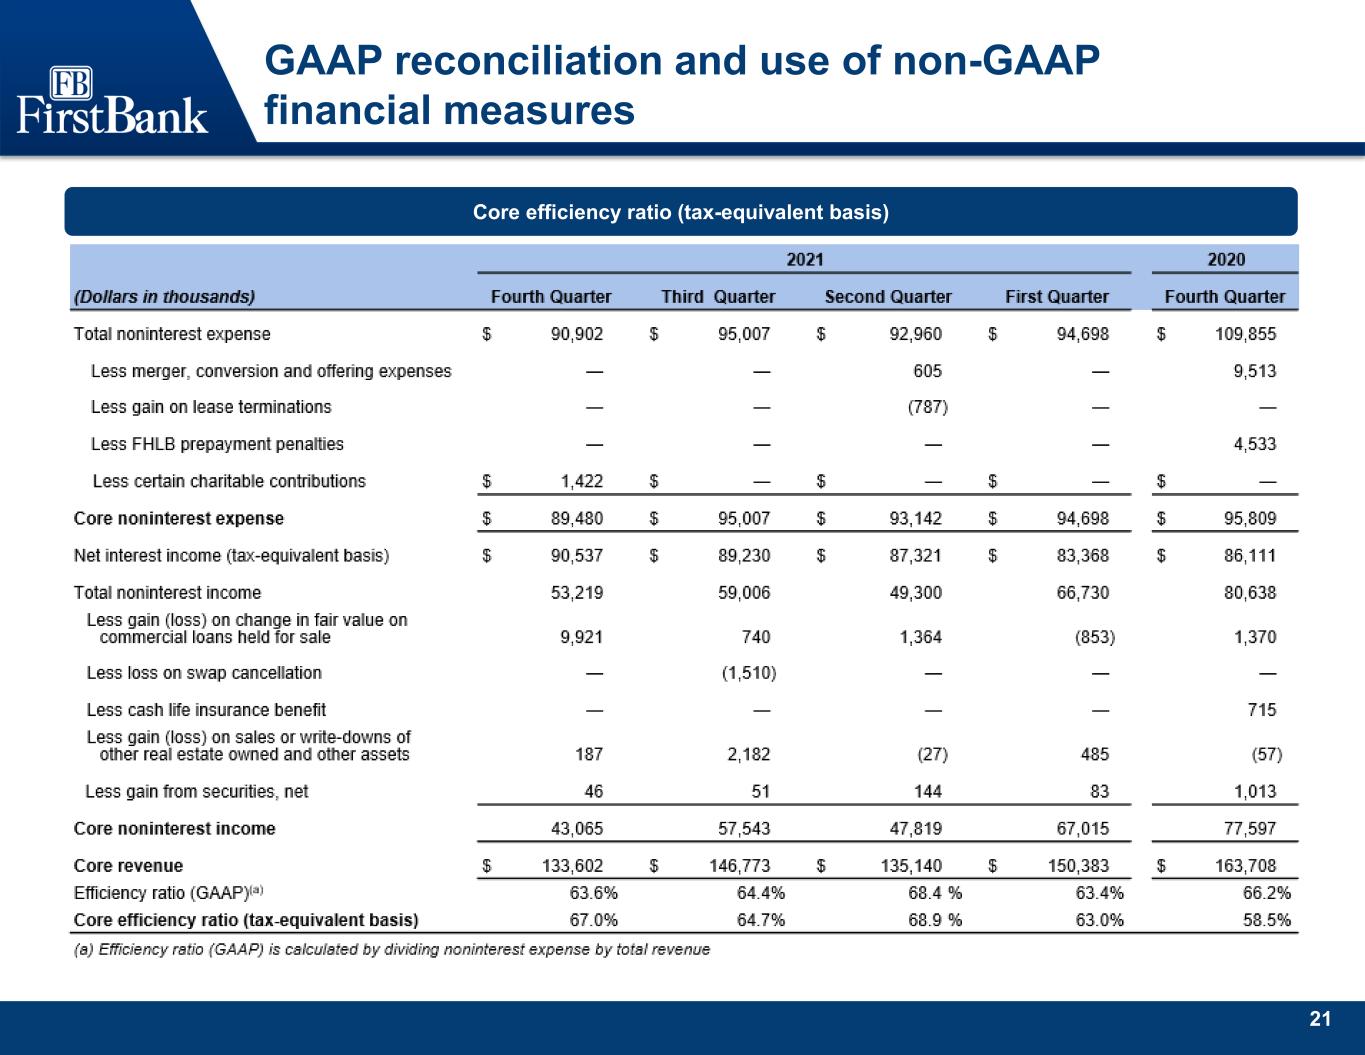
21 GAAP reconciliation and use of non-GAAP financial measures Core efficiency ratio (tax-equivalent basis)
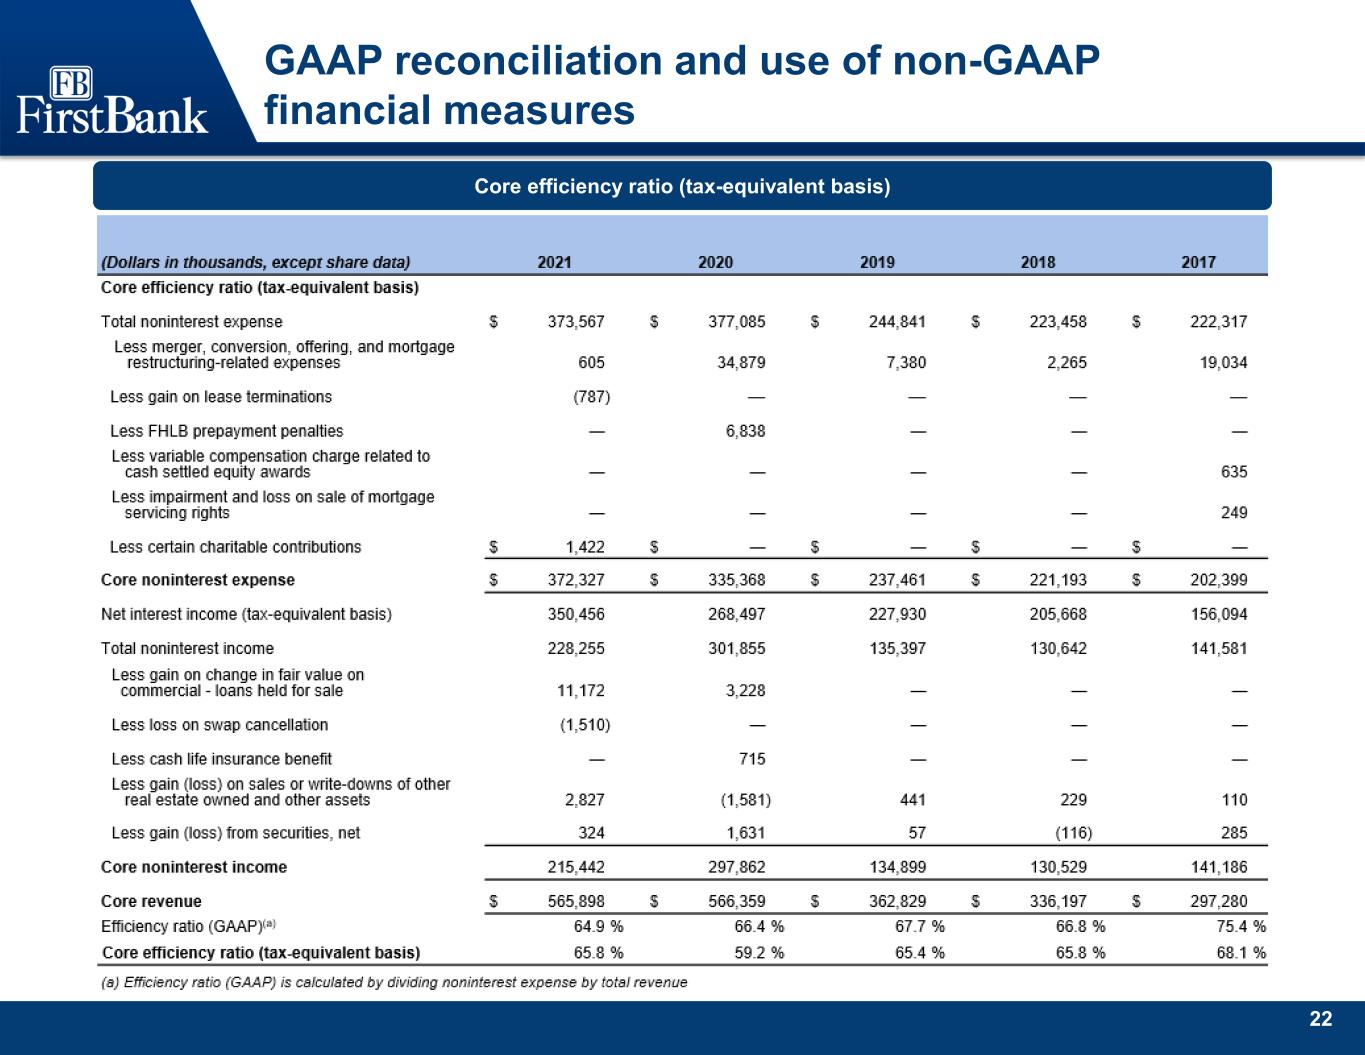
22 GAAP reconciliation and use of non-GAAP financial measures Core efficiency ratio (tax-equivalent basis)
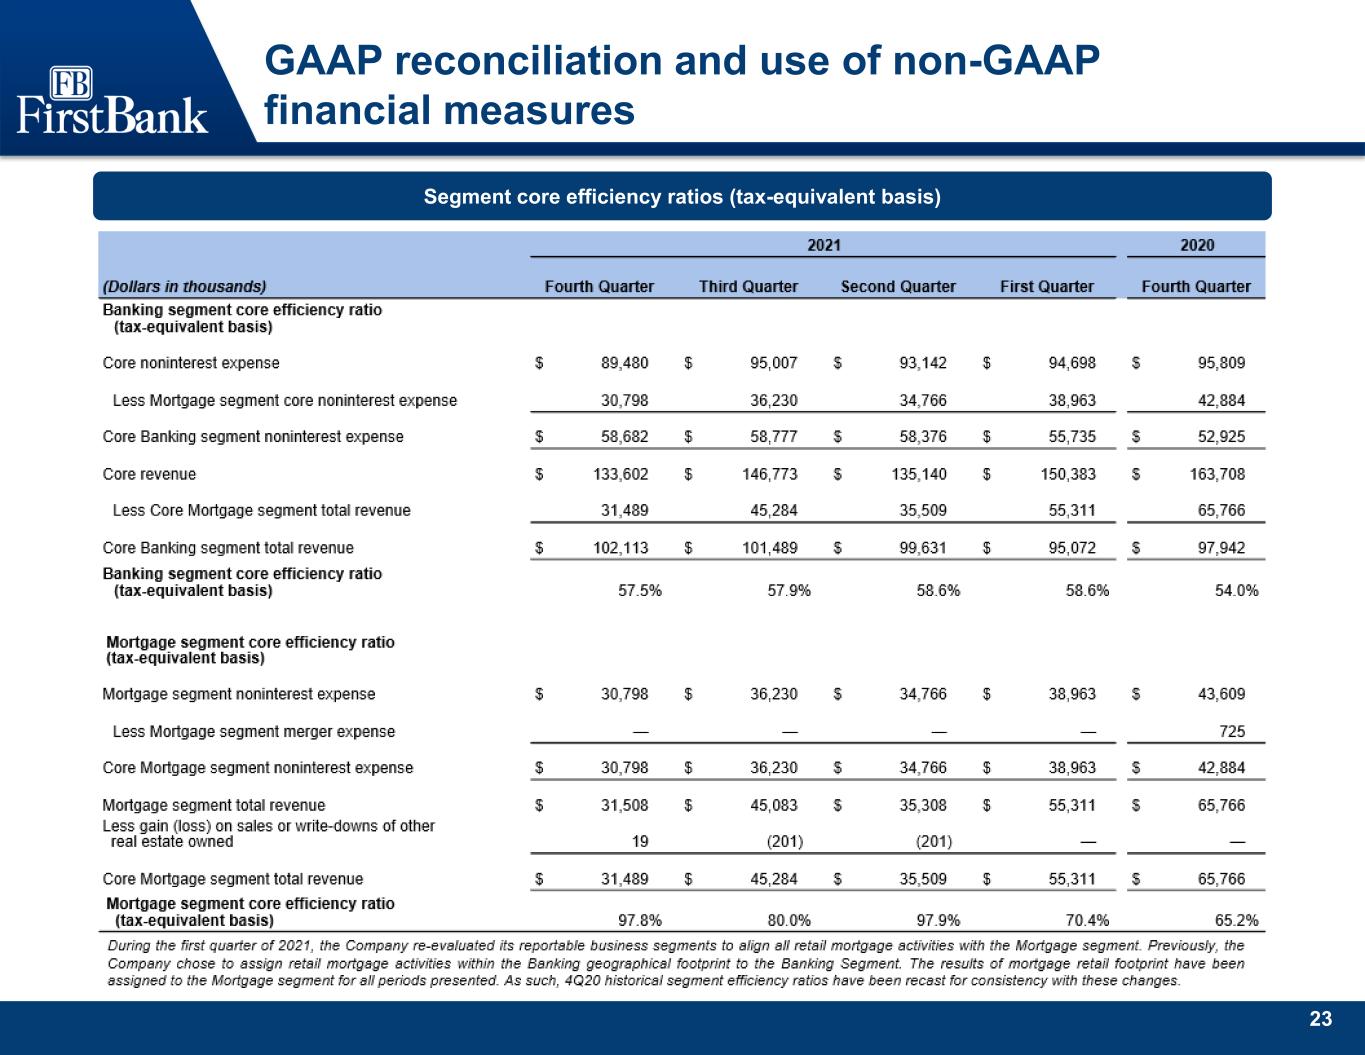
23 GAAP reconciliation and use of non-GAAP financial measures Segment core efficiency ratios (tax-equivalent basis)
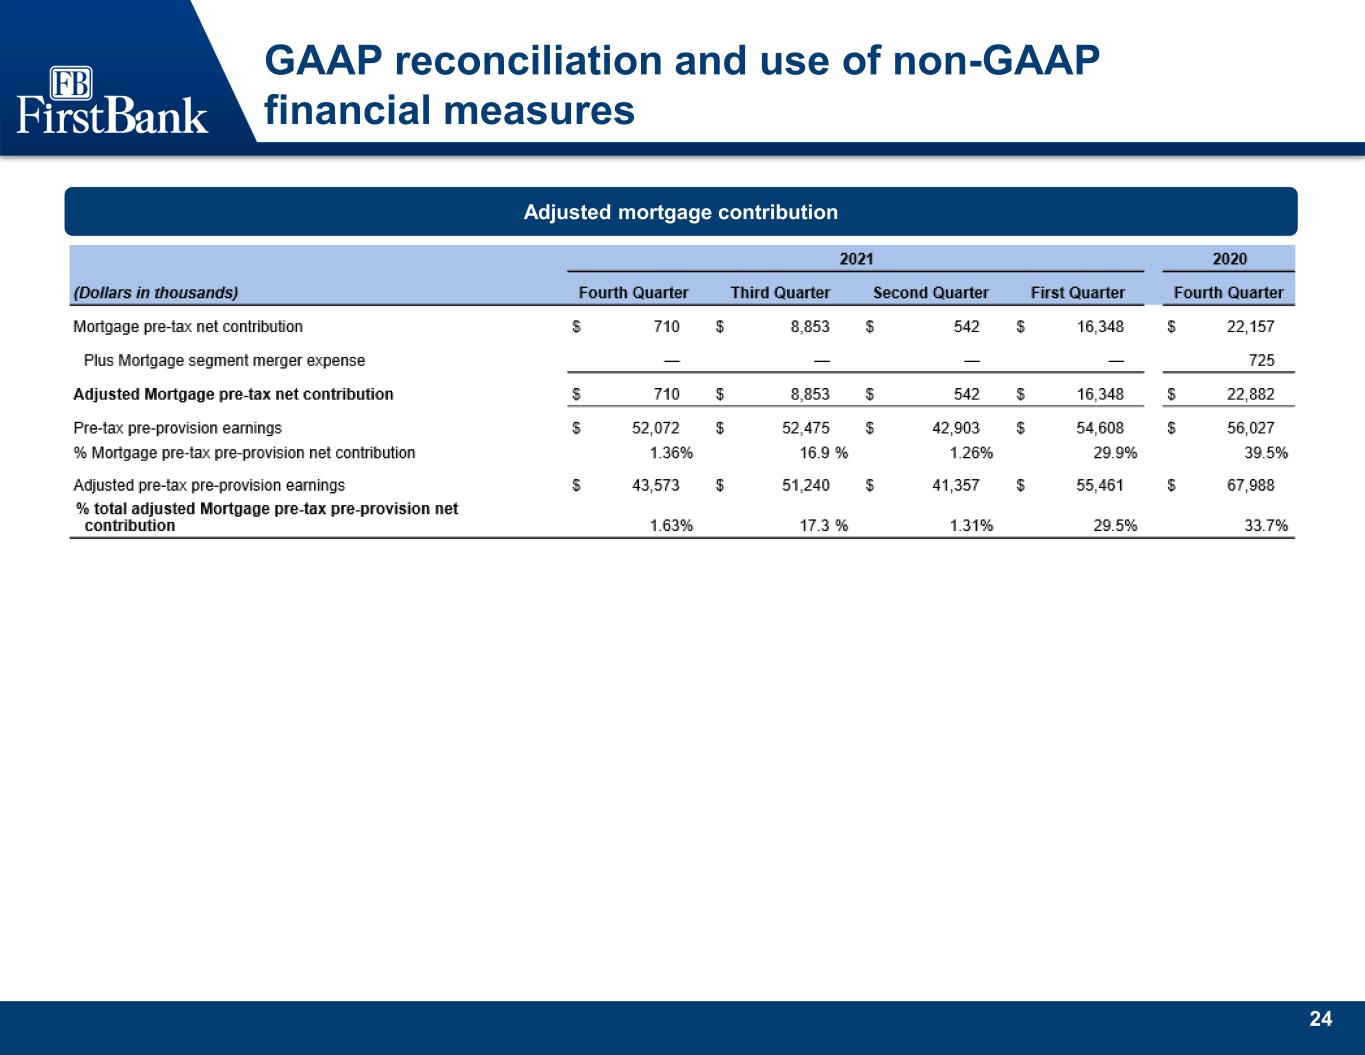
24 GAAP reconciliation and use of non-GAAP financial measures Adjusted mortgage contribution
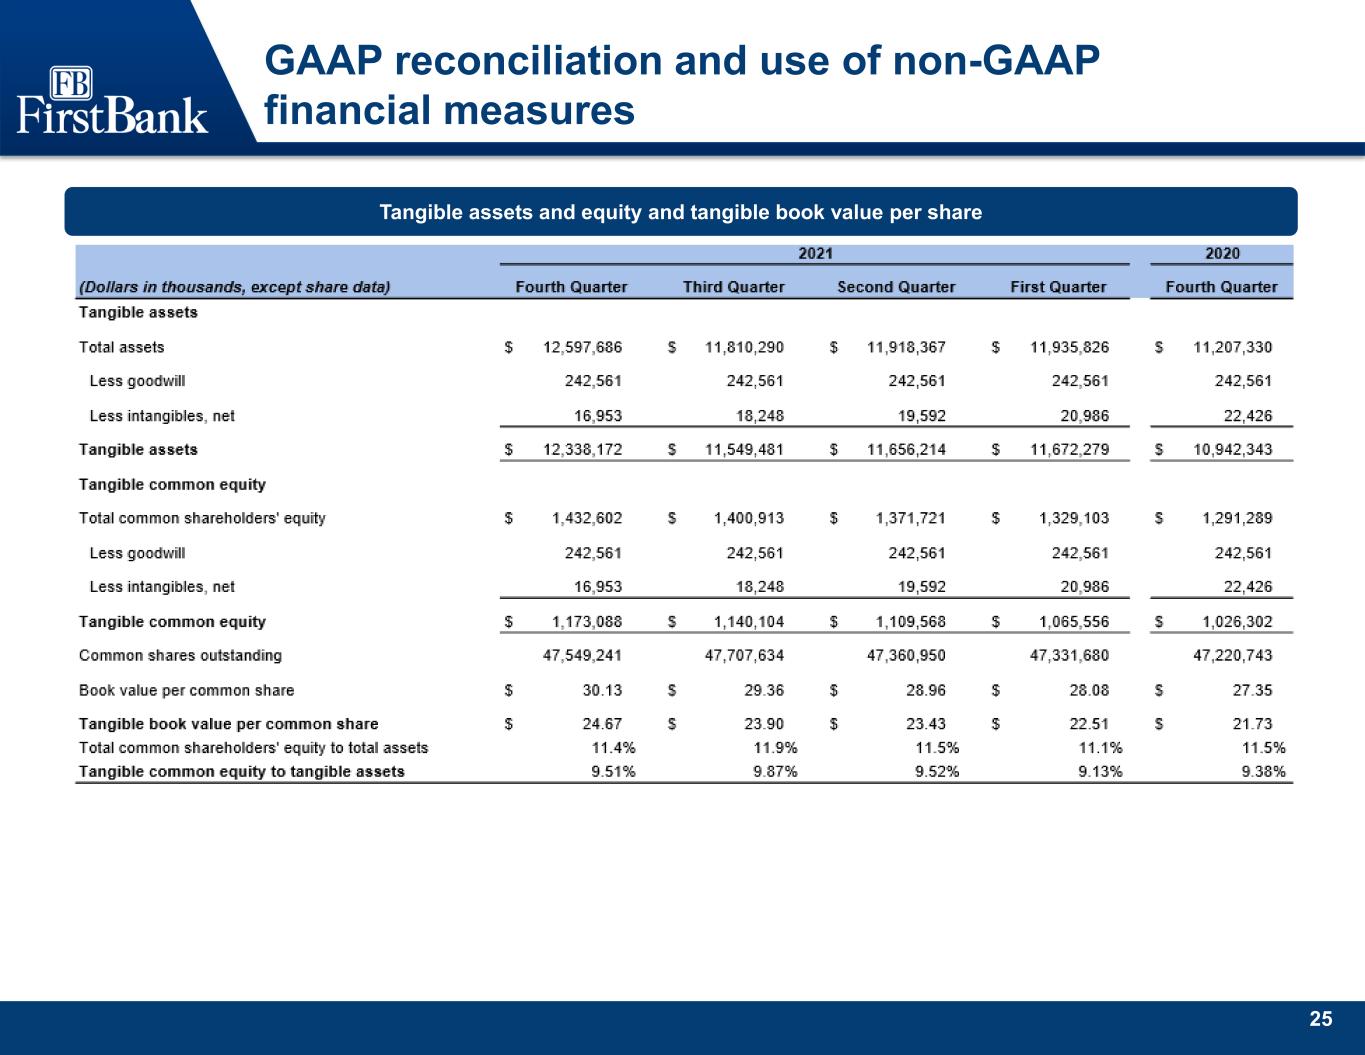
25 GAAP reconciliation and use of non-GAAP financial measures Tangible assets and equity and tangible book value per share

26 GAAP reconciliation and use of non-GAAP financial measures Return on average tangible common equity and adjusted pre-tax pre-provision return on average tangible common equity

27 GAAP reconciliation and use of non-GAAP financial measures Return on average tangible common equity and adjusted pre-tax pre-provision return on average tangible common equity

28 GAAP reconciliation and use of non-GAAP financial measures Adjusted return on average assets and equity and adjusted pre-tax pre-provision return on average assets and equity
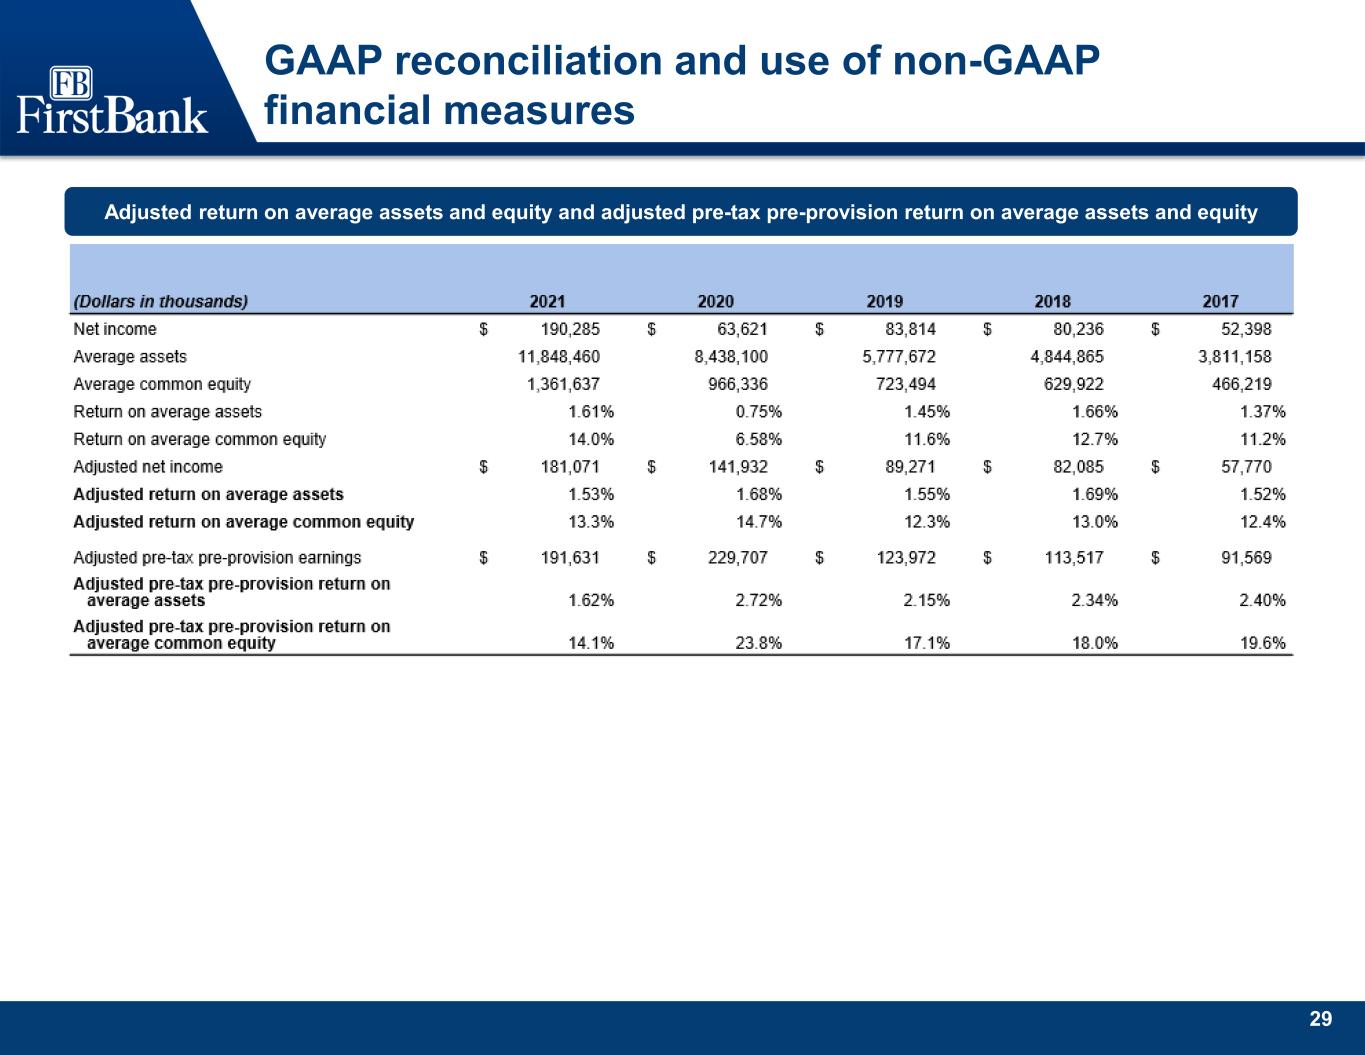
29 GAAP reconciliation and use of non-GAAP financial measures Adjusted return on average assets and equity and adjusted pre-tax pre-provision return on average assets and equity
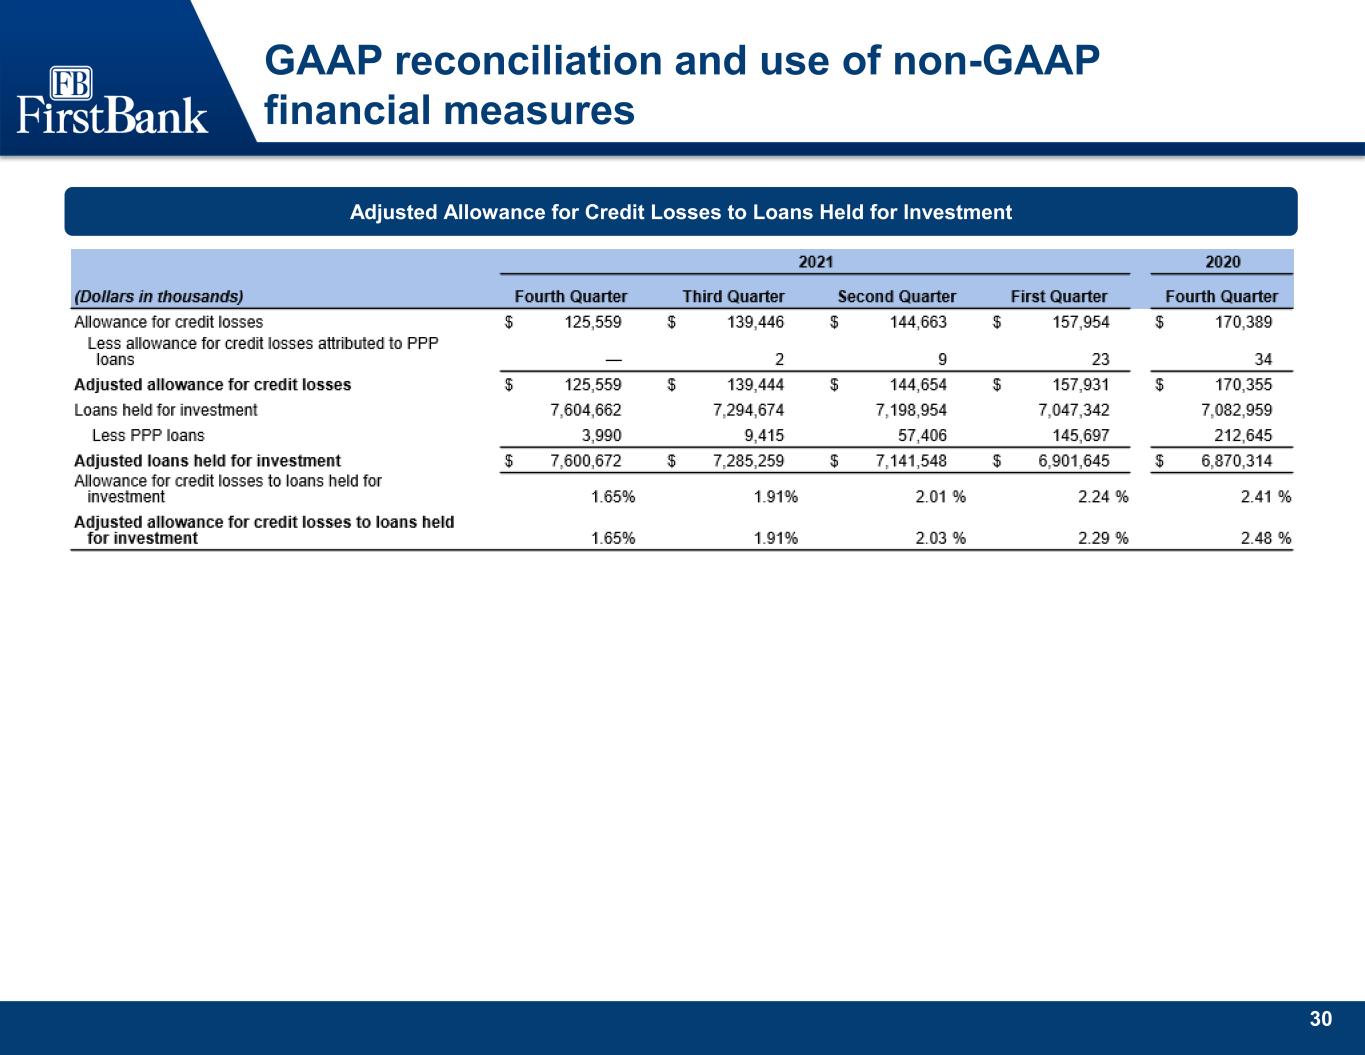
30 GAAP reconciliation and use of non-GAAP financial measures Adjusted Allowance for Credit Losses to Loans Held for Investment


