CAPITAL RAISING & ACQUISITIONS UPDATE AUGUST 2024 Four Corners Property Trust NYSE: FCPT
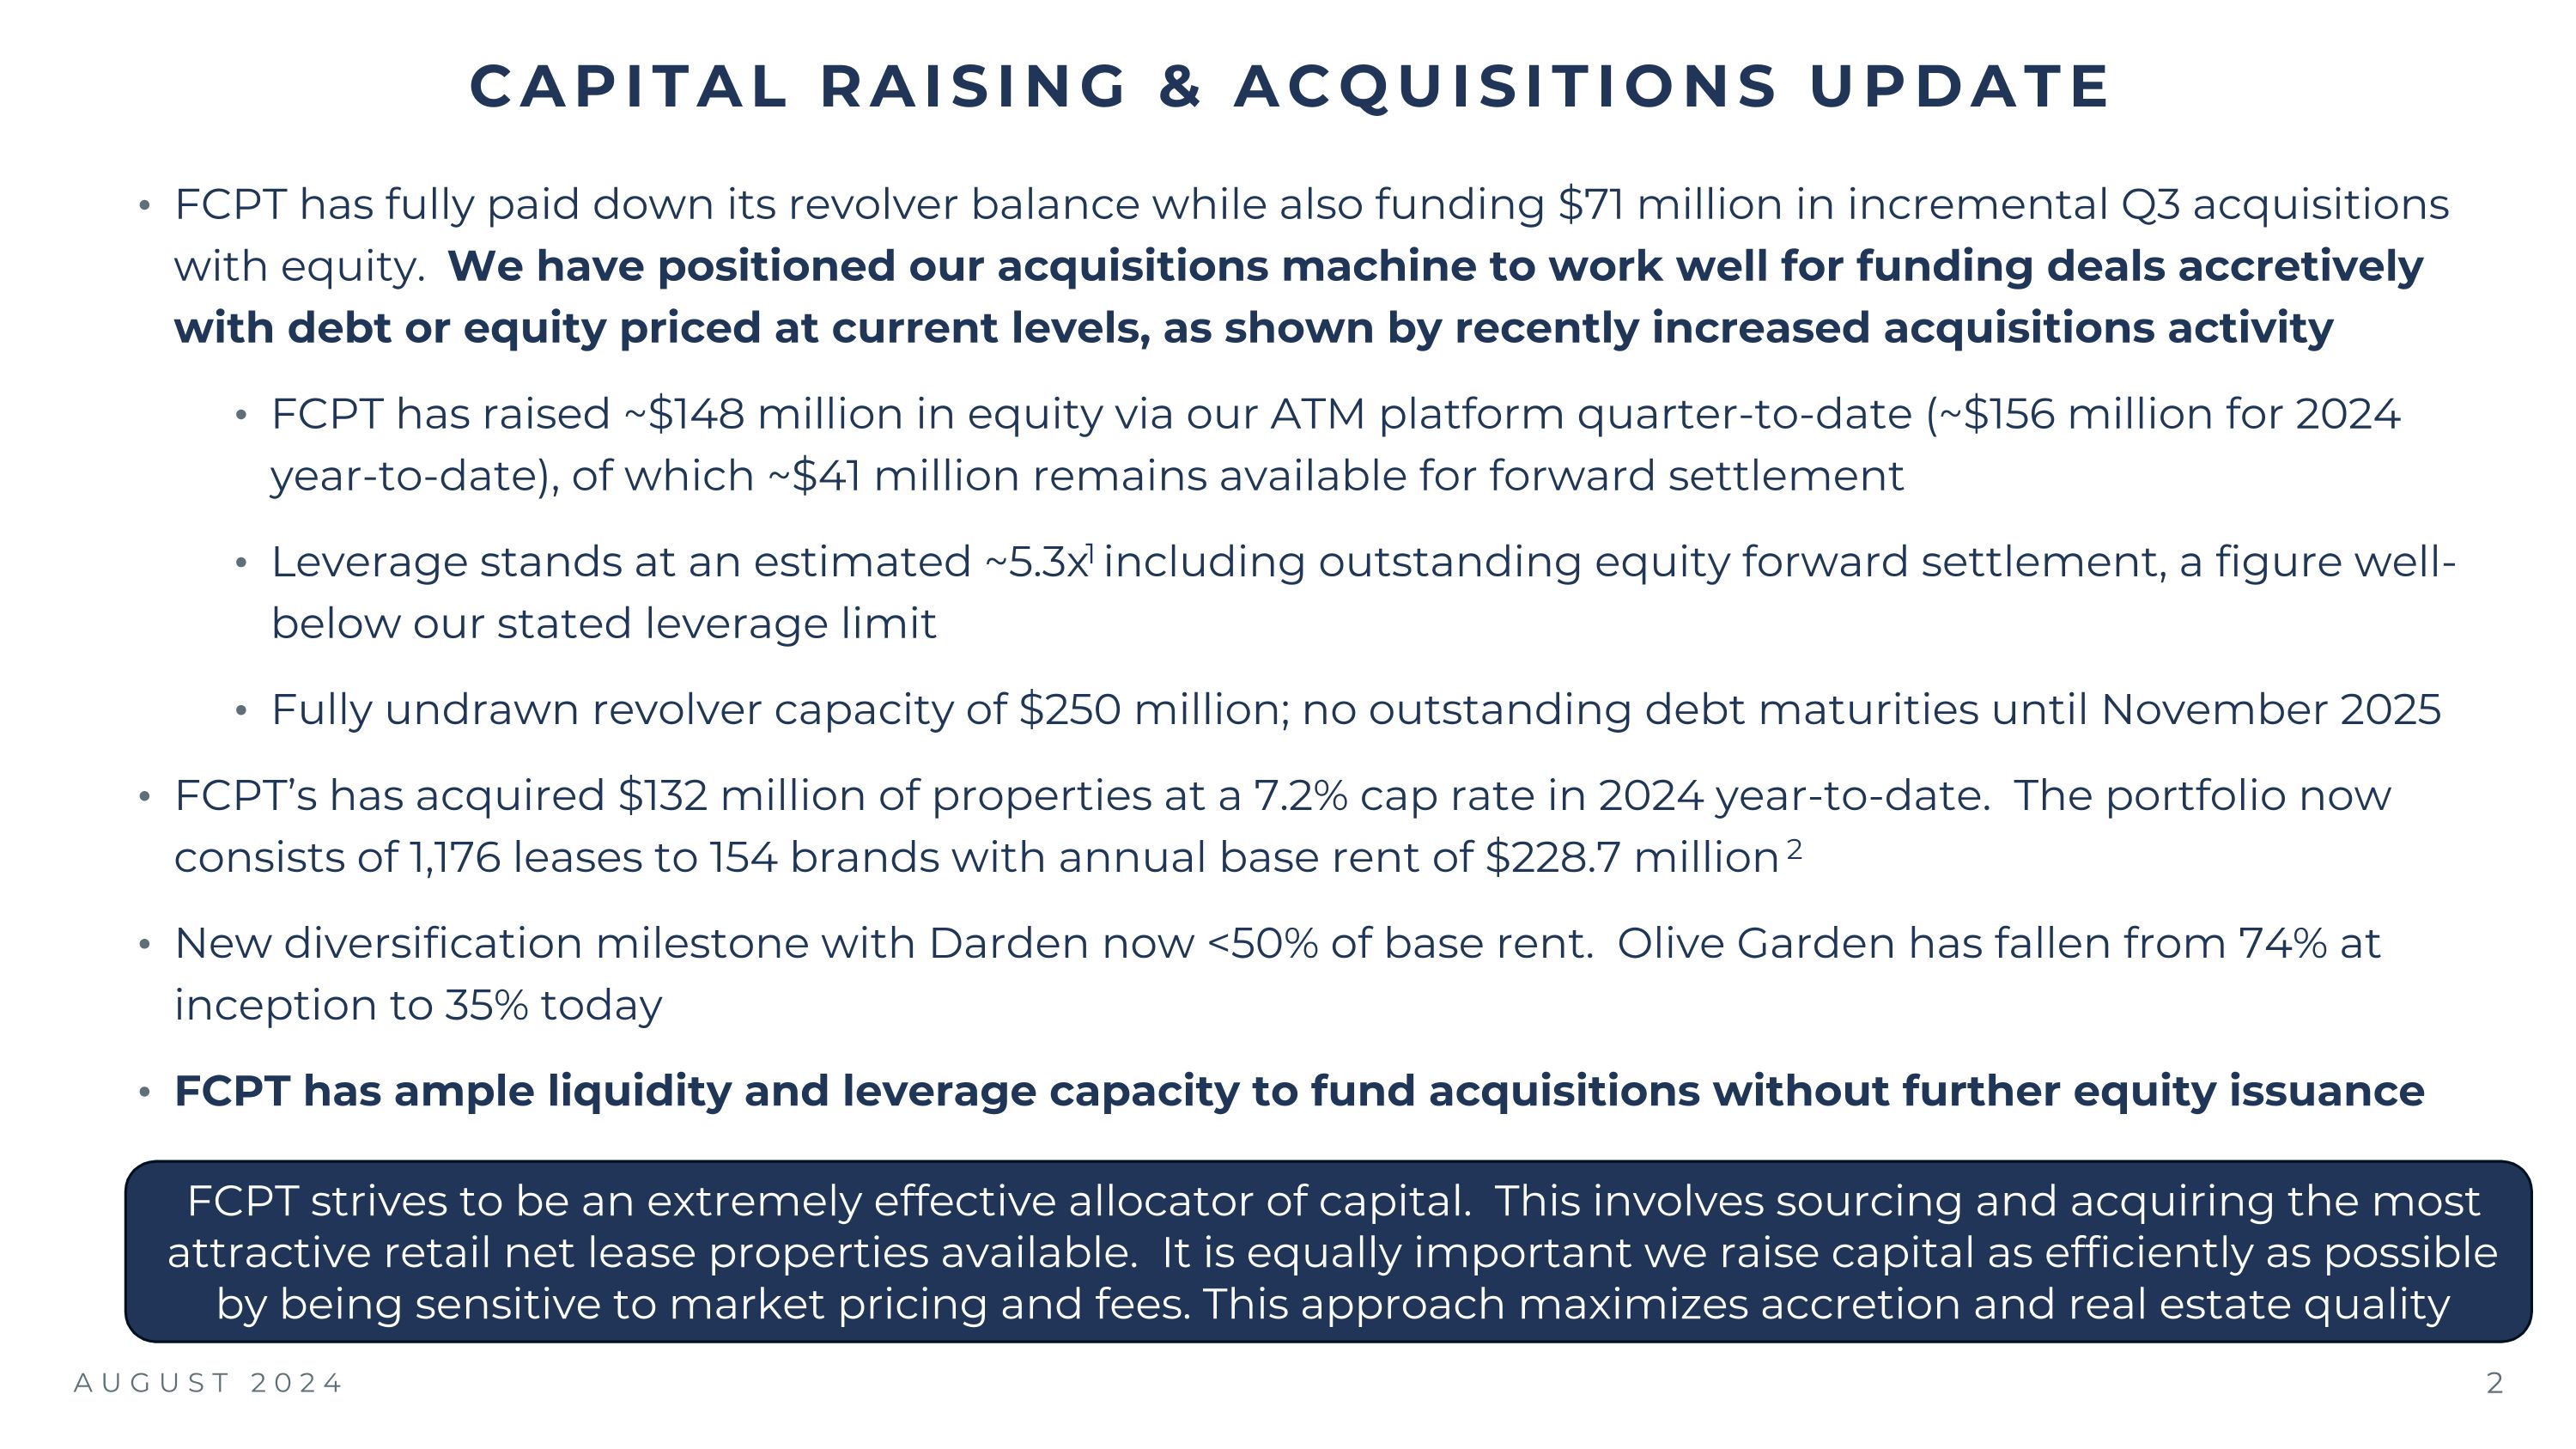
CAPITAL RAISING & ACQUISITIONS UPDATE AUGUST 2024 FCPT has fully paid down its revolver balance while also funding $71 million in incremental Q3 acquisitions with equity. We have positioned our acquisitions machine to work well for funding deals accretively with debt or equity priced at current levels, as shown by recently increased acquisitions activity FCPT has raised ~$148 million in equity via our ATM platform quarter-to-date (~$156 million for 2024 year-to-date), of which ~$41 million remains available for forward settlement Leverage stands at an estimated ~5.3x1 including outstanding equity forward settlement, a figure well-below our stated leverage limit Fully undrawn revolver capacity of $250 million; no outstanding debt maturities until November 2025 FCPT’s has acquired $132 million of properties at a 7.2% cap rate in 2024 year-to-date. The portfolio now consists of 1,176 leases to 154 brands with annual base rent of $228.7 million 2 New diversification milestone with Darden now <50% of base rent. Olive Garden has fallen from 74% at inception to 35% today FCPT has ample liquidity and leverage capacity to fund acquisitions without further equity issuance FCPT strives to be an extremely effective allocator of capital. This involves sourcing and acquiring the most attractive retail net lease properties available. It is equally important we raise capital as efficiently as possible by being sensitive to market pricing and fees. This approach maximizes accretion and real estate quality
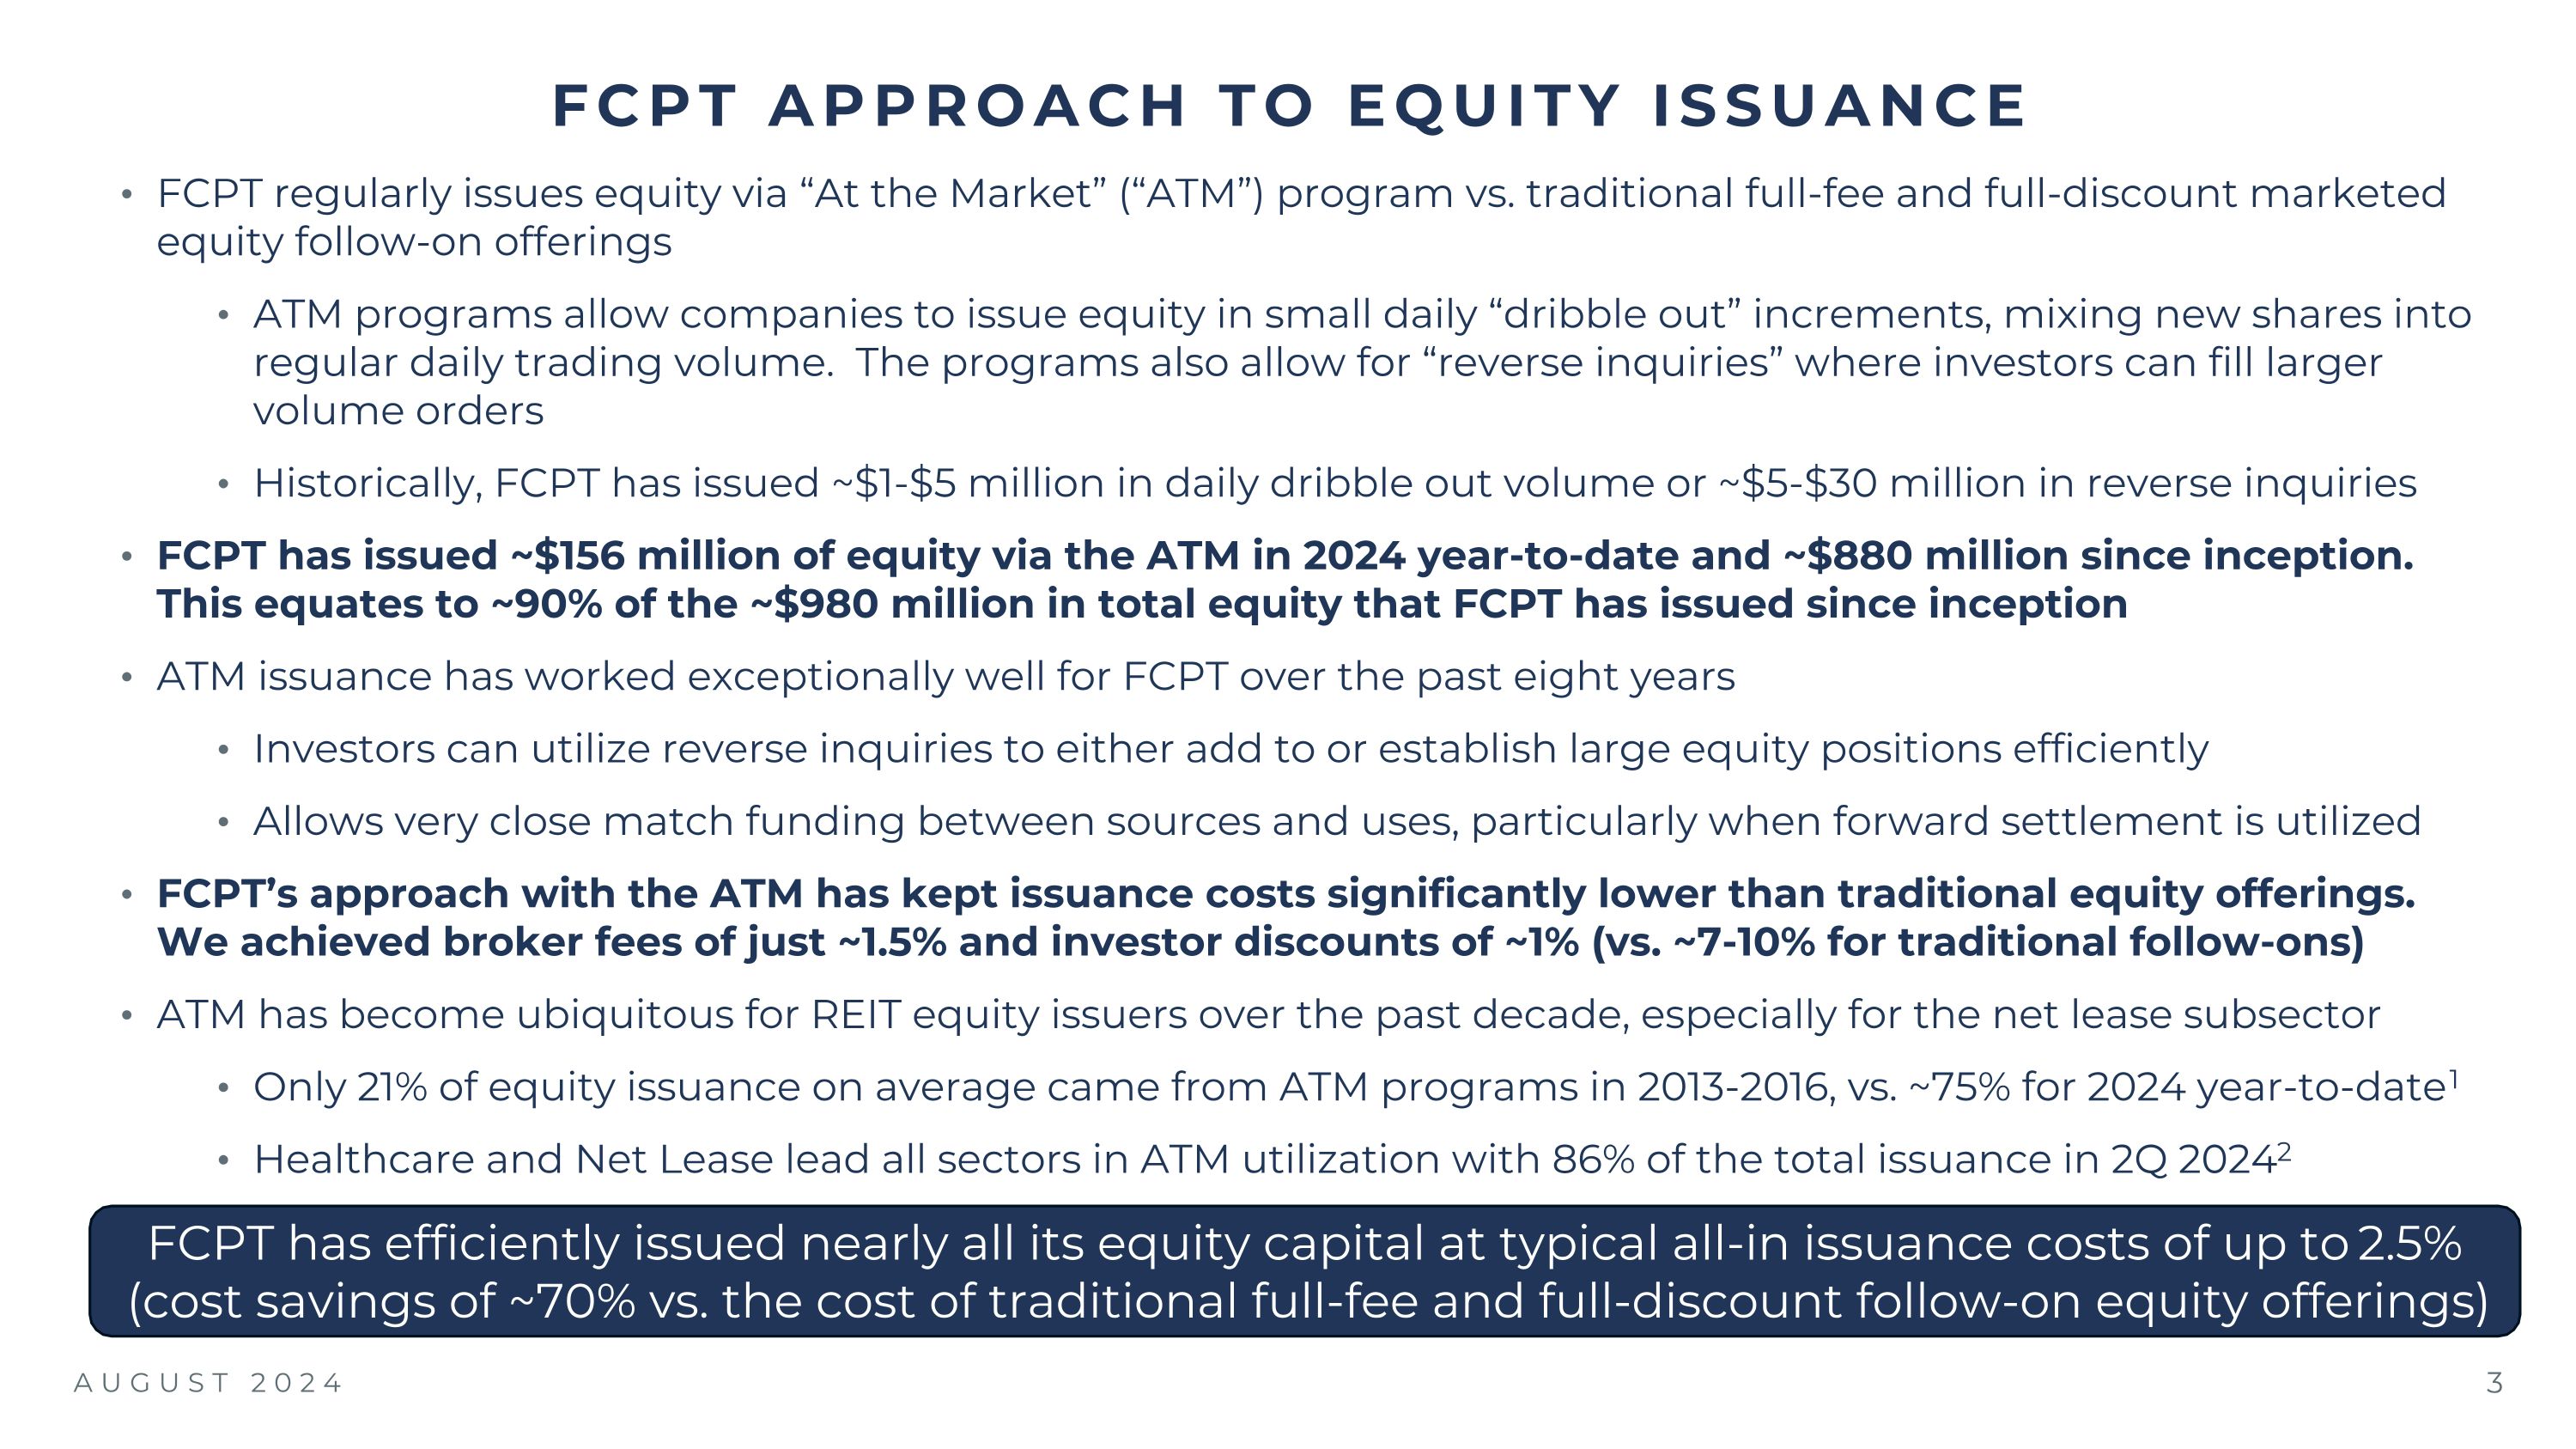
FCPT APPROACH TO EQUITY ISSUANCE AUGUST 2024 FCPT regularly issues equity via “At the Market” (“ATM”) program vs. traditional full-fee and full-discount marketed equity follow-on offerings ATM programs allow companies to issue equity in small daily “dribble out” increments, mixing new shares into regular daily trading volume. The programs also allow for “reverse inquiries” where investors can fill larger volume orders Historically, FCPT has issued ~$1-$5 million in daily dribble out volume or ~$5-$30 million in reverse inquiries FCPT has issued ~$156 million of equity via the ATM in 2024 year-to-date and ~$880 million since inception. This equates to ~90% of the ~$980 million in total equity that FCPT has issued since inception ATM issuance has worked exceptionally well for FCPT over the past eight years Investors can utilize reverse inquiries to either add to or establish large equity positions efficiently Allows very close match funding between sources and uses, particularly when forward settlement is utilized FCPT’s approach with the ATM has kept issuance costs significantly lower than traditional equity offerings. We achieved broker fees of just ~1.5% and investor discounts of ~1% (vs. ~7-10% for traditional follow-ons) ATM has become ubiquitous for REIT equity issuers over the past decade, especially for the net lease subsector Only 21% of equity issuance on average came from ATM programs in 2013-2016, vs. ~75% for 2024 year-to-date 1 Healthcare and Net Lease lead all sectors in ATM utilization with 86% of the total issuance in 2Q 2024 2 FCPT has efficiently issued nearly all its equity capital at typical all-in issuance costs of up to 2.5% �(cost savings of ~70% vs. the cost of traditional full-fee and full-discount follow-on equity offerings)
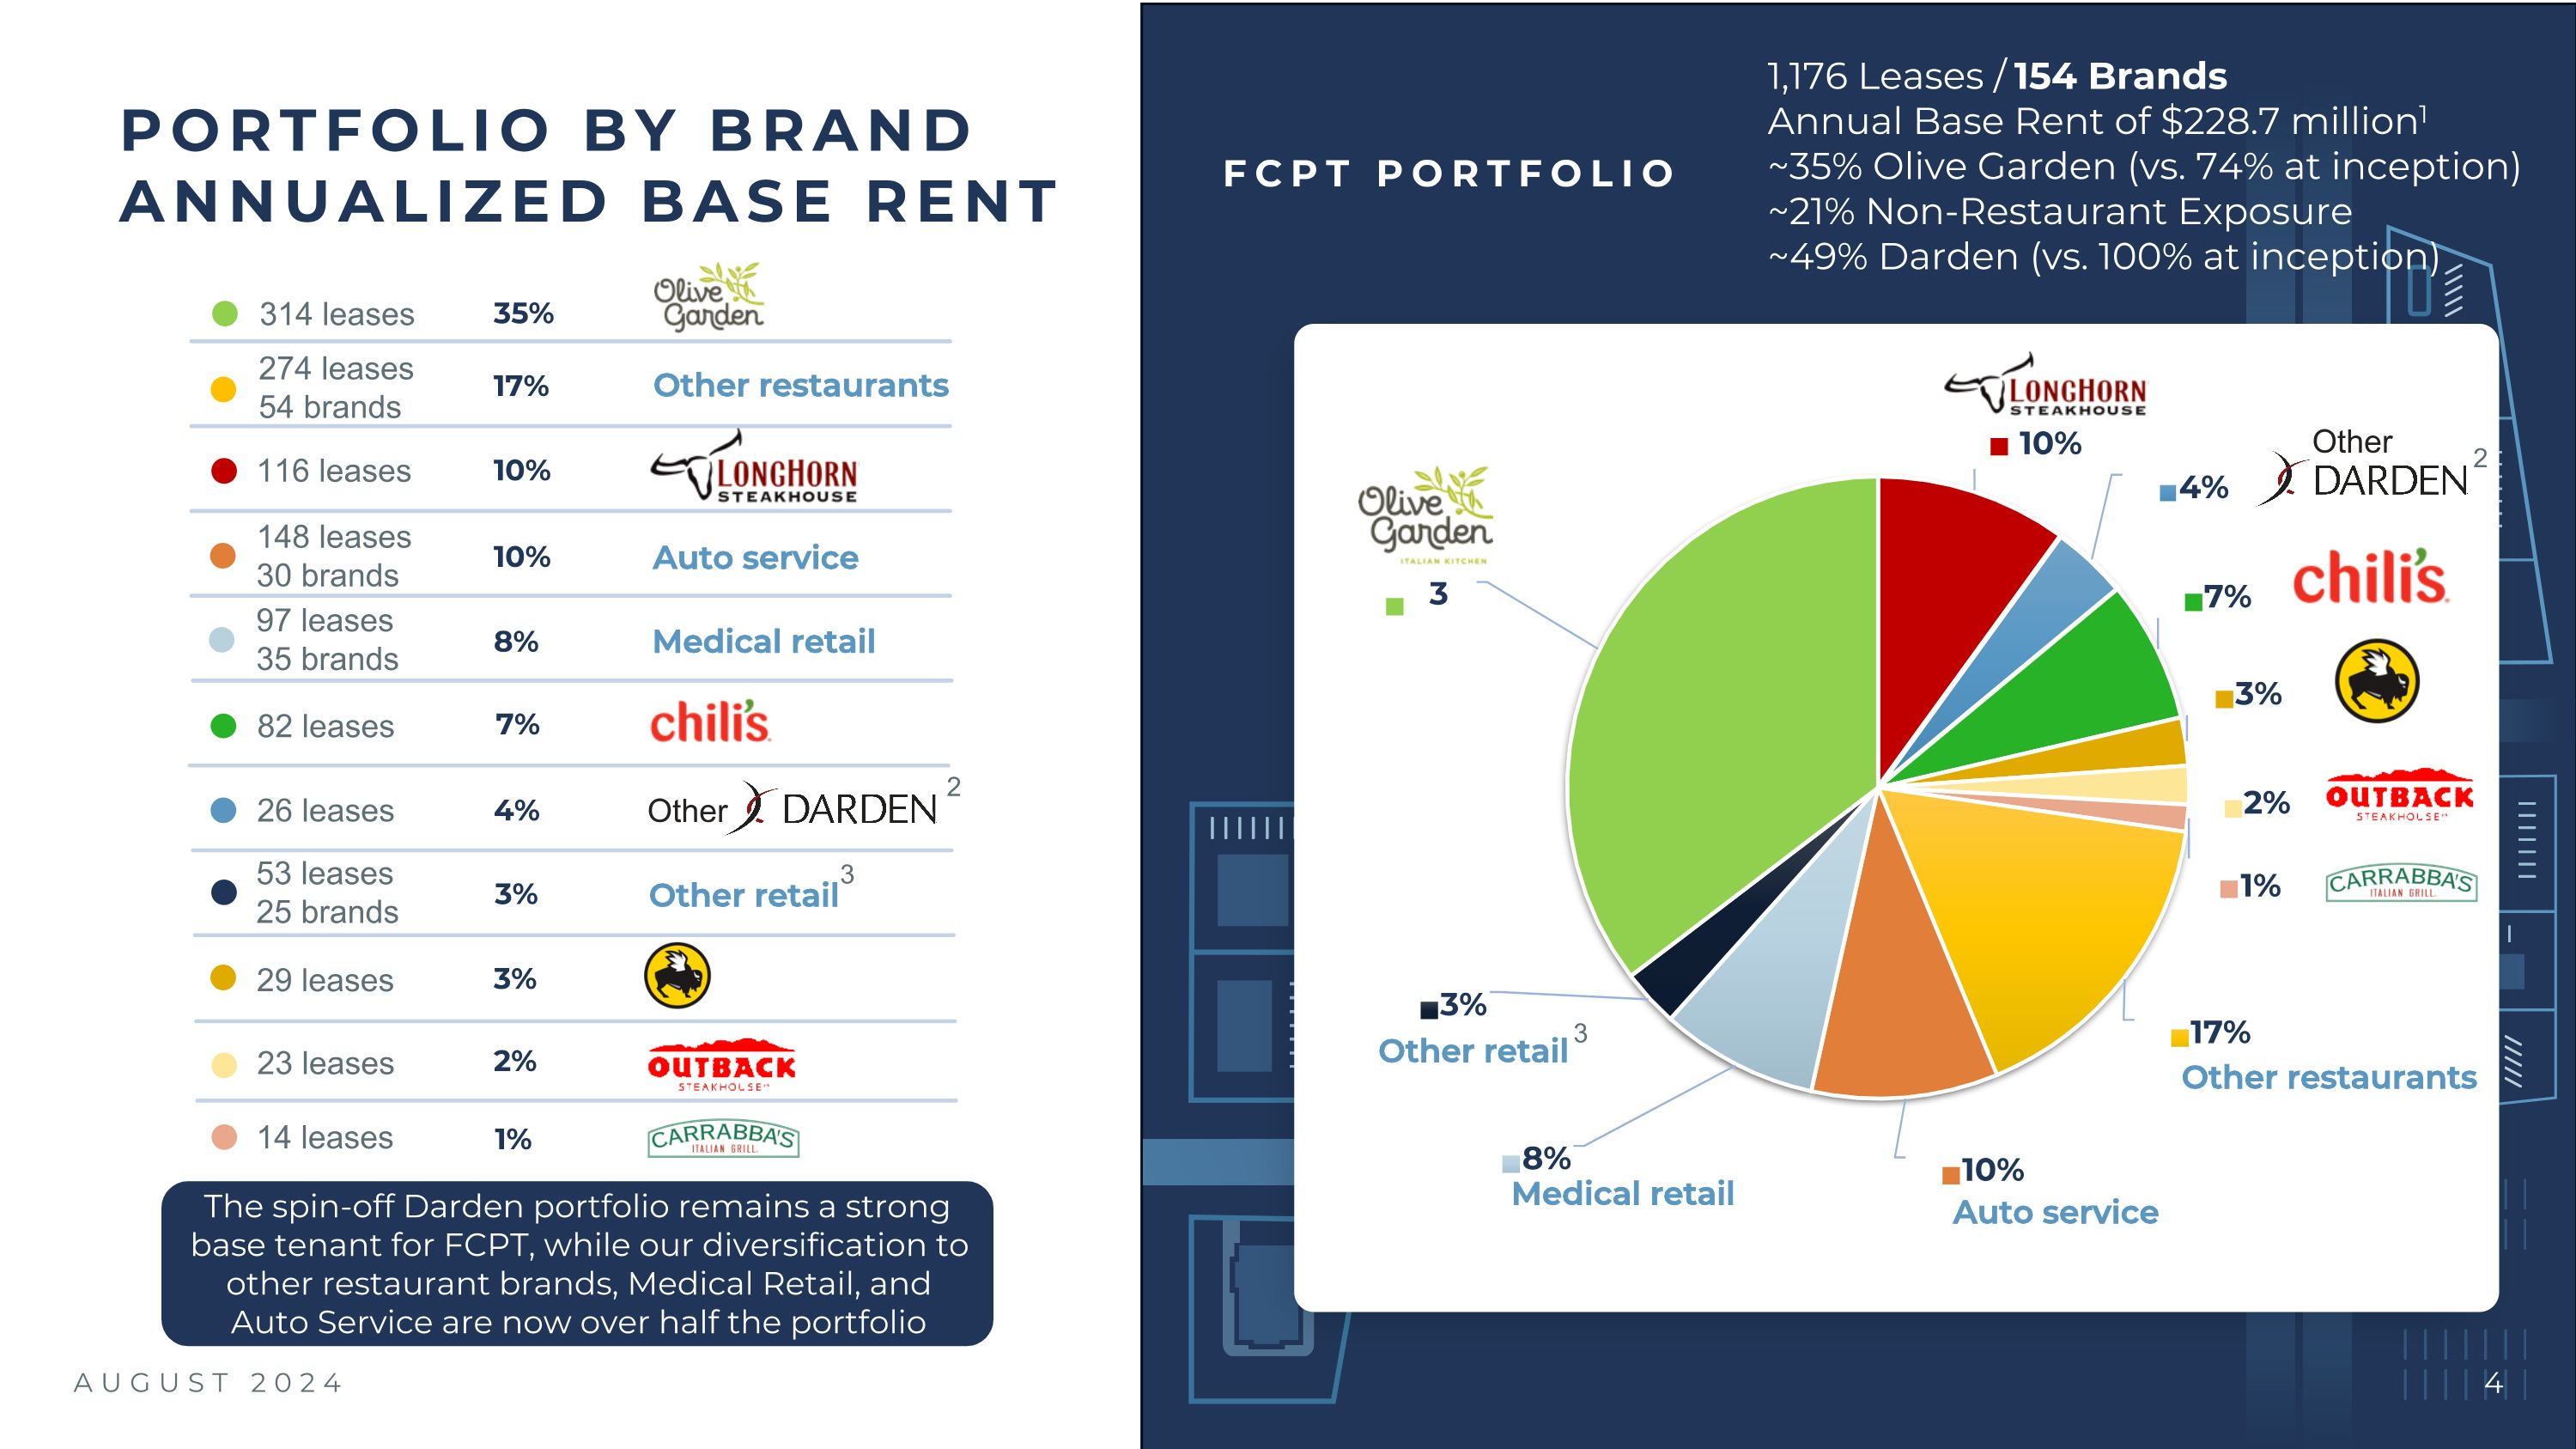
AUGUST 2024 PORTFOLIO BY BRAND ANNUALIZED BASE RENT 314 leases 82 leases 274 leases 54 brands 26 leases 148 leases 30 brands 116 leases Other restaurants Auto service 97 leases 35 brands Medical retail 53 leases 25 brands Other retail 1,176 Leases / 154 Brands Annual Base Rent of $228.7 million1 ~35% Olive Garden (vs. 74% at inception) ~21% Non-Restaurant Exposure�~49% Darden (vs. 100% at inception) FCPT PORTFOLIO Other restaurants Auto service Medical retail Other retail Other Other 35% 17% 10% 10% 7% 8% 4% 3% 2 2 3 The spin-off Darden portfolio remains a strong base tenant for FCPT, while our diversification to other restaurant brands, Medical Retail, and Auto Service are now over half the portfolio 23 leases 2% 29 leases 1% 3% 14 leases 3
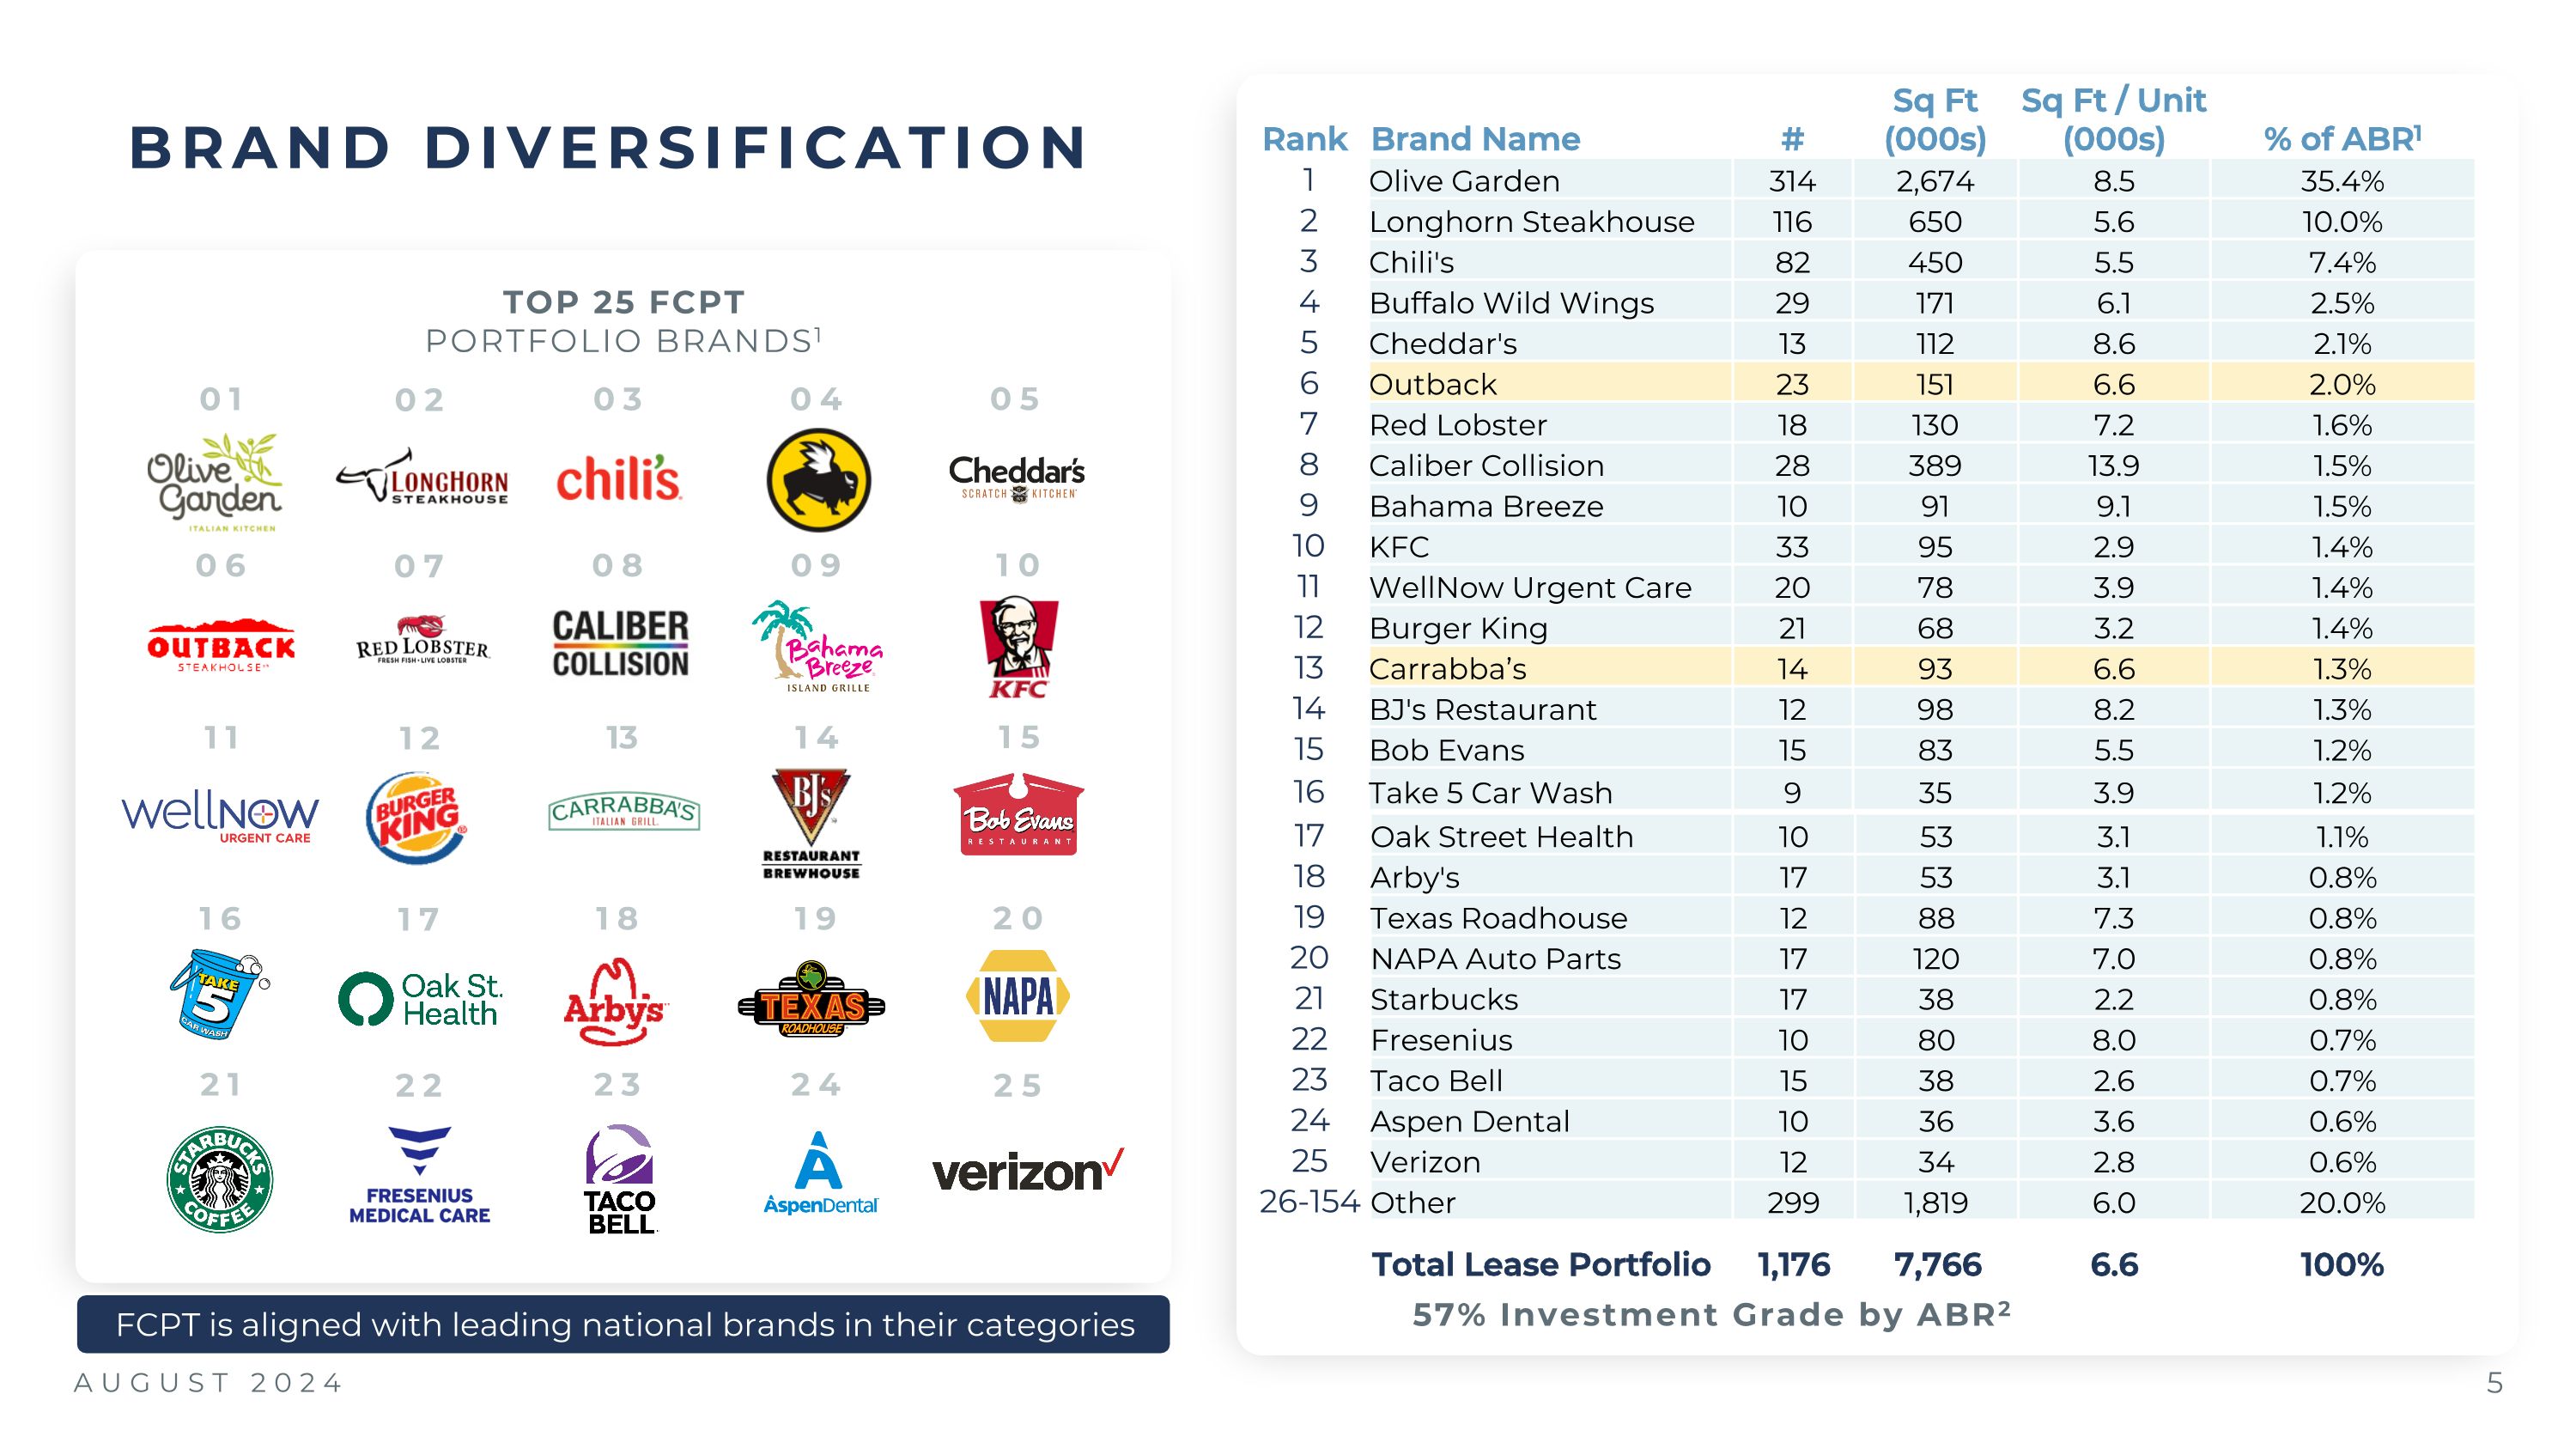
AUGUST 2024 BRAND DIVERSIFICATION Rank Brand Name # Sq Ft (000s) Sq Ft / Unit (000s) % of ABR1 1 Olive Garden 314 2,674 8.5 35.4% 2 Longhorn Steakhouse 116 650 5.6 10.0% 3 Chili's 82 450 5.5 7.4% 4 Buffalo Wild Wings 29 171 6.1 2.5% 5 Cheddar's 13 112 8.6 2.1% 6 Outback 23 151 6.6 2.0% 7 Red Lobster 18 130 7.2 1.6% 8 Caliber Collision 28 389 13.9 1.5% 9 Bahama Breeze 10 91 9.1 1.5% 10 KFC 33 95 2.9 1.4% 11 WellNow Urgent Care 20 78 3.9 1.4% 12 Burger King 21 68 3.2 1.4% 13 Carrabba’s 14 93 6.6 1.3% 14 BJ's Restaurant 12 98 8.2 1.3% 15 Bob Evans 15 83 5.5 1.2% 16 Take 5 Car Wash 9 35 3.9 1.2% 17 Oak Street Health 10 53 3.1 1.1% 18 Arby's 17 53 3.1 0.8% 19 Texas Roadhouse 12 88 7.3 0.8% 20 NAPA Auto Parts 17 120 7.0 0.8% 21 Starbucks 17 38 2.2 0.8% 22 Fresenius 10 80 8.0 0.7% 23 Taco Bell 15 38 2.6 0.7% 24 Aspen Dental 10 36 3.6 0.6% 25 Verizon 12 34 2.8 0.6% 26-154 Other 299 1,819 6.0 20.0% Total Lease Portfolio 1,176 7,766 6.6 100% TOP 25 FCPT PORTFOLIO BRANDS1 01 02 57% Investment Grade by ABR2 FCPT is aligned with leading national brands in their categories 03 04 05 06 07 08 09 1 0 11 12 13 14 1 5 16 17 18 19 2 0 21 22 23 24 2 5
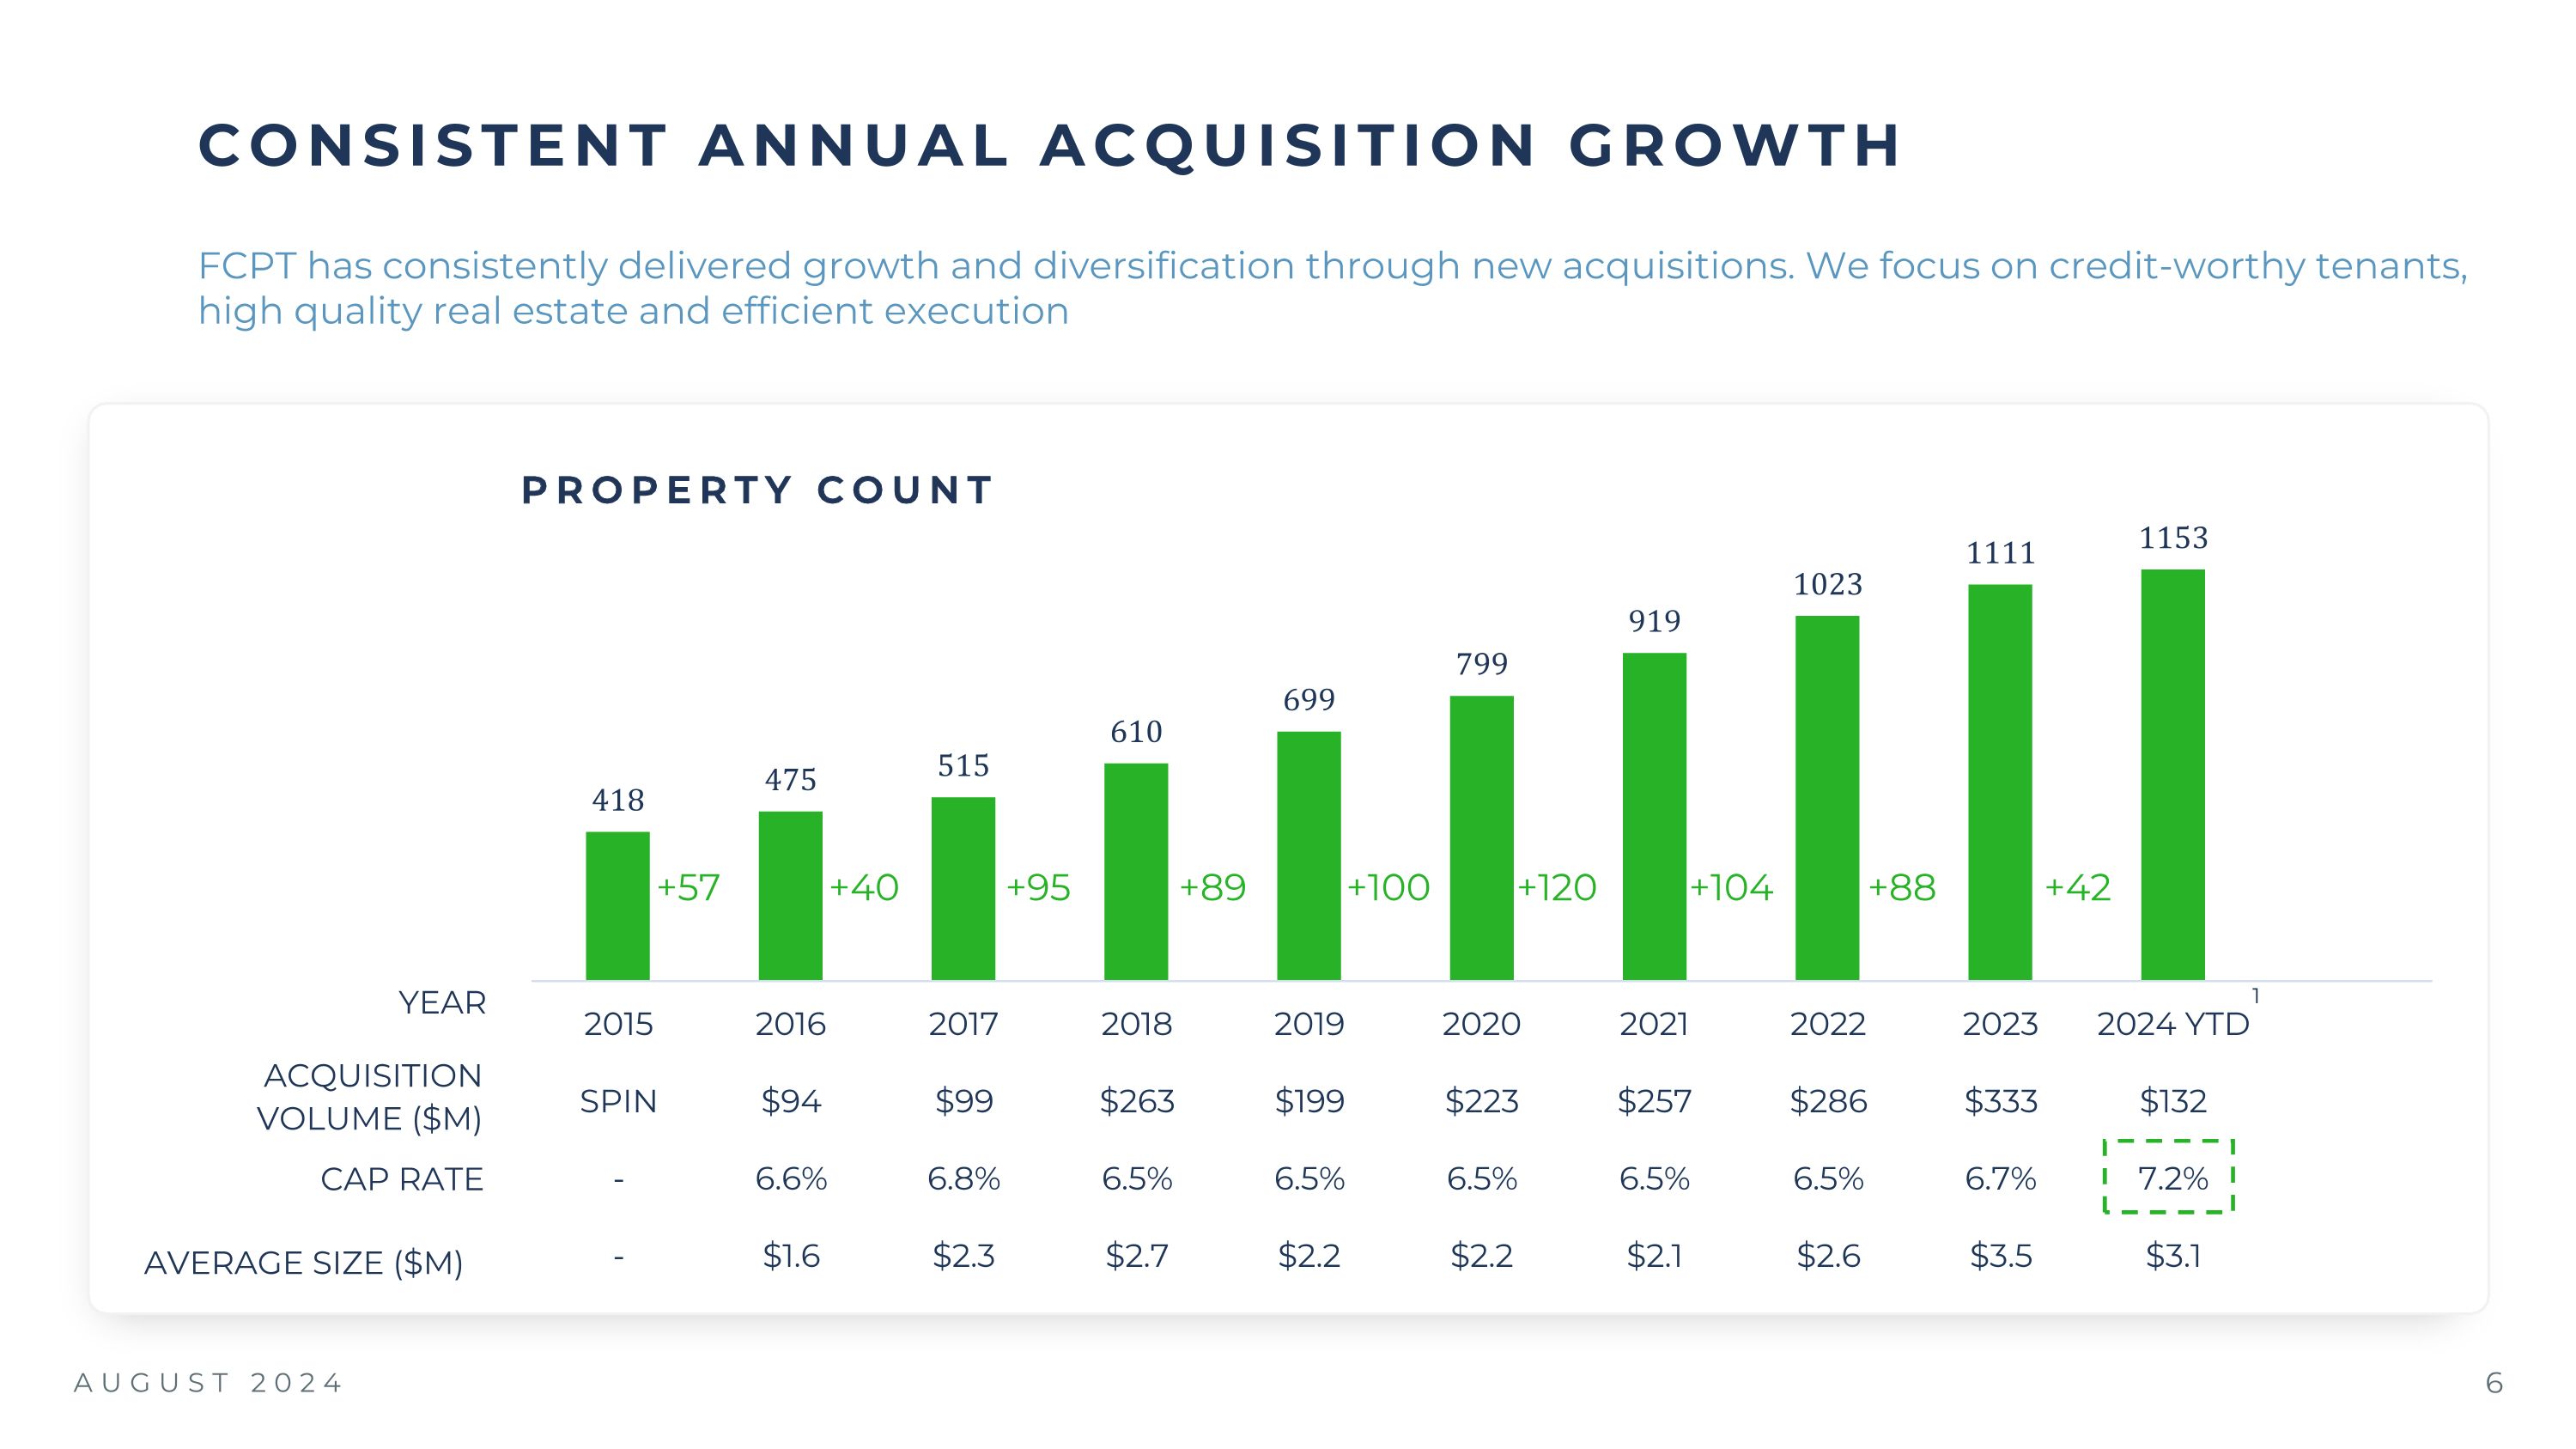
AUGUST 2024 CONSISTENT ANNUAL ACQUISITION GROWTH +57 +40 +95 +89 +100 +120 +104 YEAR ACQUISITION VOLUME ($M) CAP RATE +88 FCPT has consistently delivered growth and diversification through new acquisitions. We focus on credit-worthy tenants, high quality real estate and efficient execution PROPERTY COUNT AVERAGE SIZE ($M) +42 1
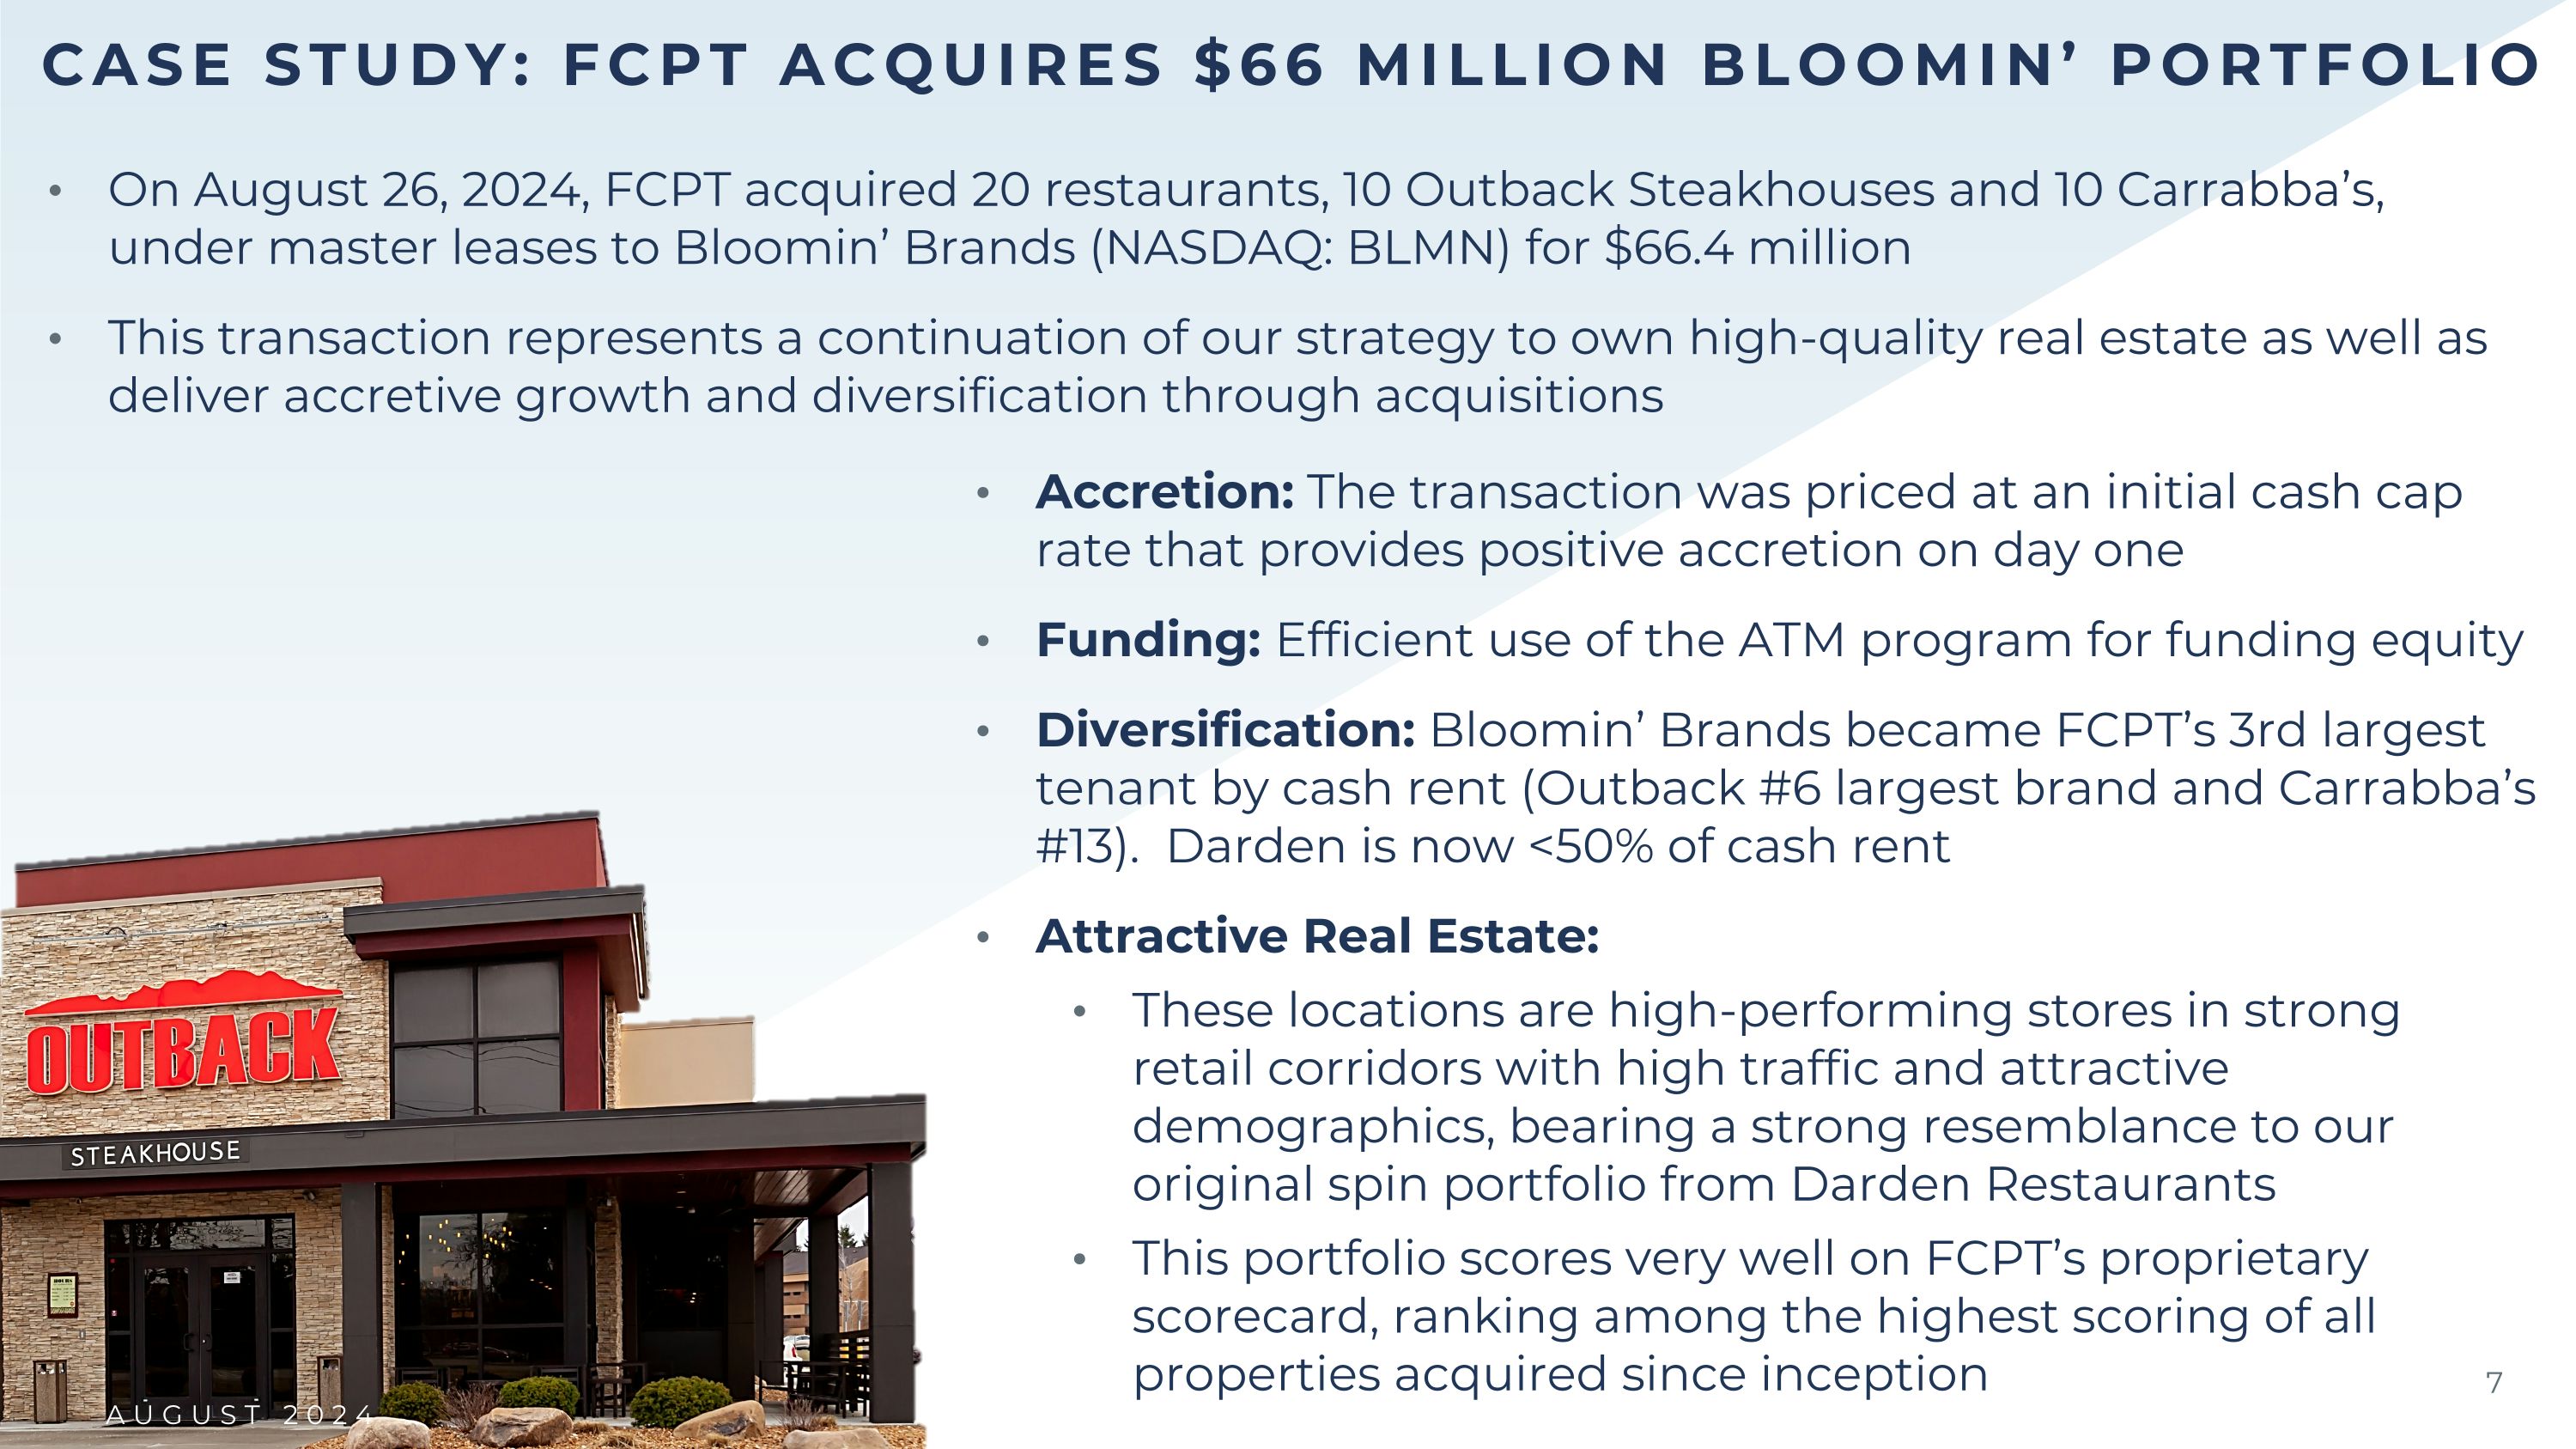
AUGUST 2024 CASE STUDY: FCPT ACQUIRES $66 MILLION BLOOMIN’ PORTFOLIO Accretion: The transaction was priced at an initial cash cap rate that provides positive accretion on day one Funding: Efficient use of the ATM program for funding equity Diversification: Bloomin’ Brands became FCPT’s 3rd largest tenant by cash rent (Outback #6 largest brand and Carrabba’s #13). Darden is now <50% of cash rent Attractive Real Estate: These locations are high-performing stores in strong retail corridors with high traffic and attractive demographics, bearing a strong resemblance to our original spin portfolio from Darden Restaurants This portfolio scores very well on FCPT’s proprietary scorecard, ranking among the highest scoring of all properties acquired since inception AUGUST 2024 On August 26, 2024, FCPT acquired 20 restaurants, 10 Outback Steakhouses and 10 Carrabba’s, under master leases to Bloomin’ Brands (NASDAQ: BLMN) for $66.4 million This transaction represents a continuation of our strategy to own high-quality real estate as well as deliver accretive growth and diversification through acquisitions
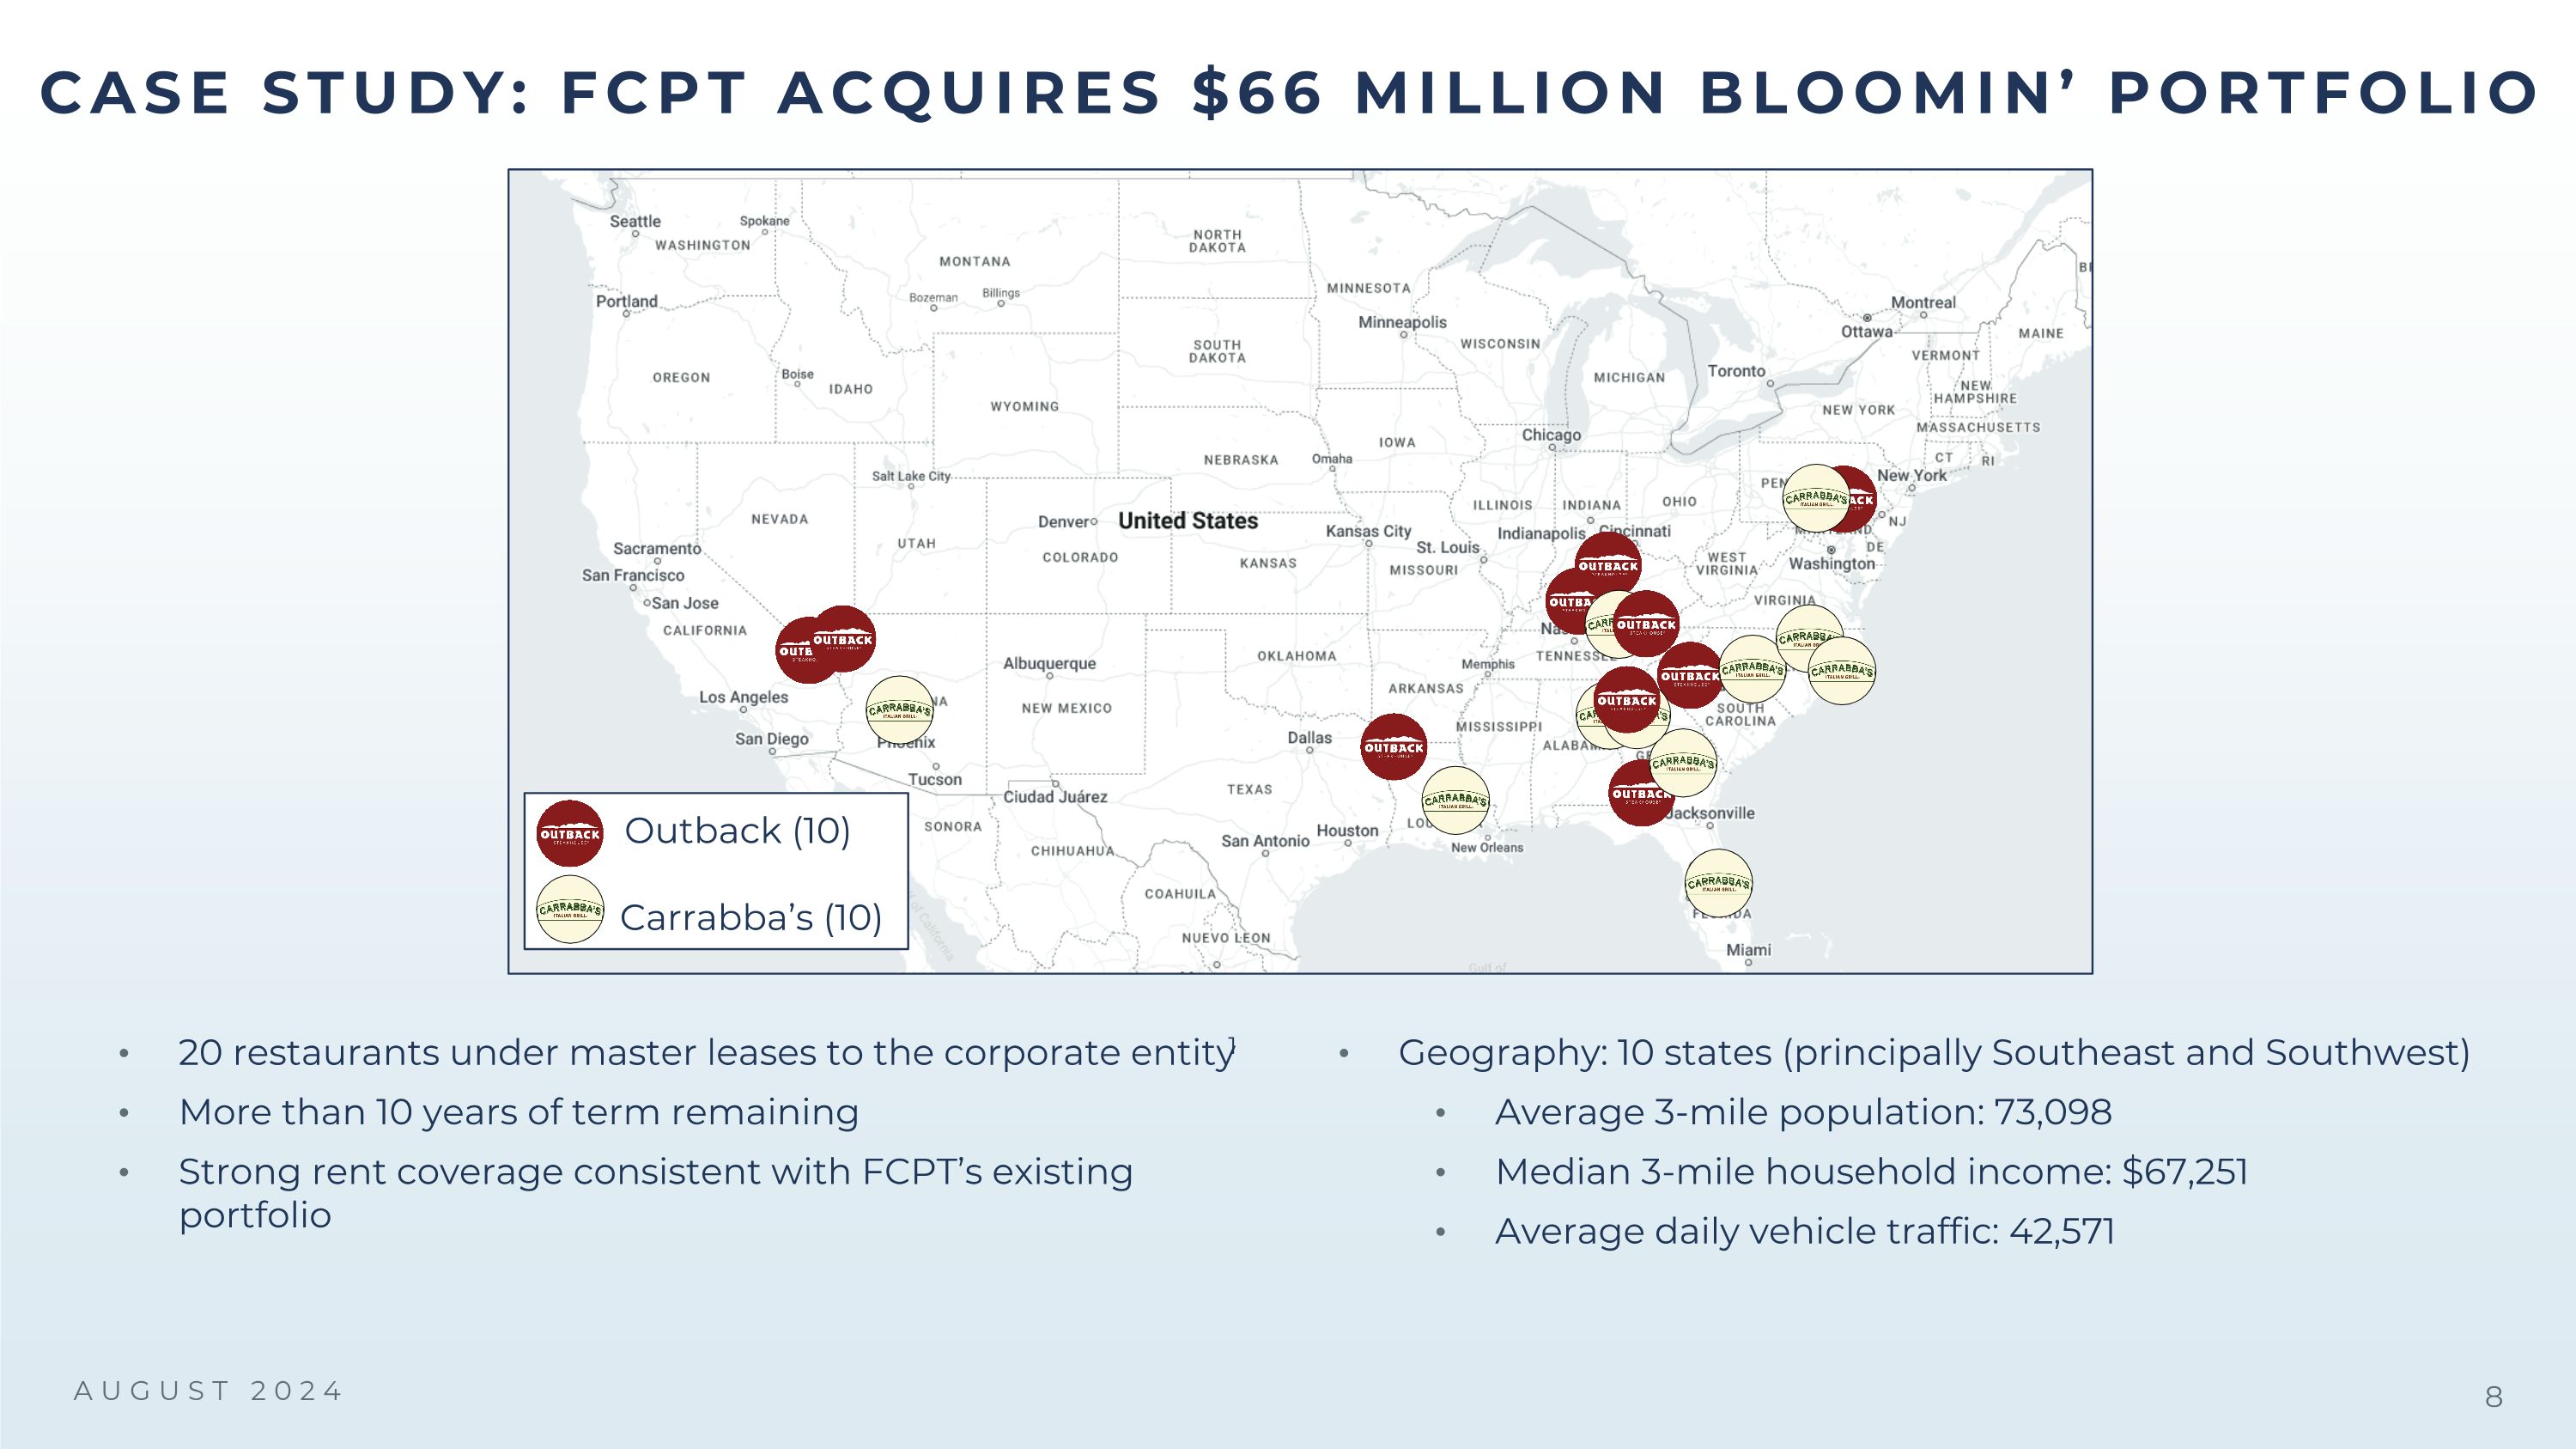
AUGUST 2024 20 restaurants under master leases to the corporate entity1 More than 10 years of term remaining Strong rent coverage consistent with FCPT’s existing portfolio Geography: 10 states (principally Southeast and Southwest) Average 3-mile population: 73,098 Median 3-mile household income: $67,251 Average daily vehicle traffic: 42,571 CASE STUDY: FCPT ACQUIRES $66 MILLION BLOOMIN’ PORTFOLIO Outback (10) Carrabba’s (10)
AUGUST 2024 APPENDIX
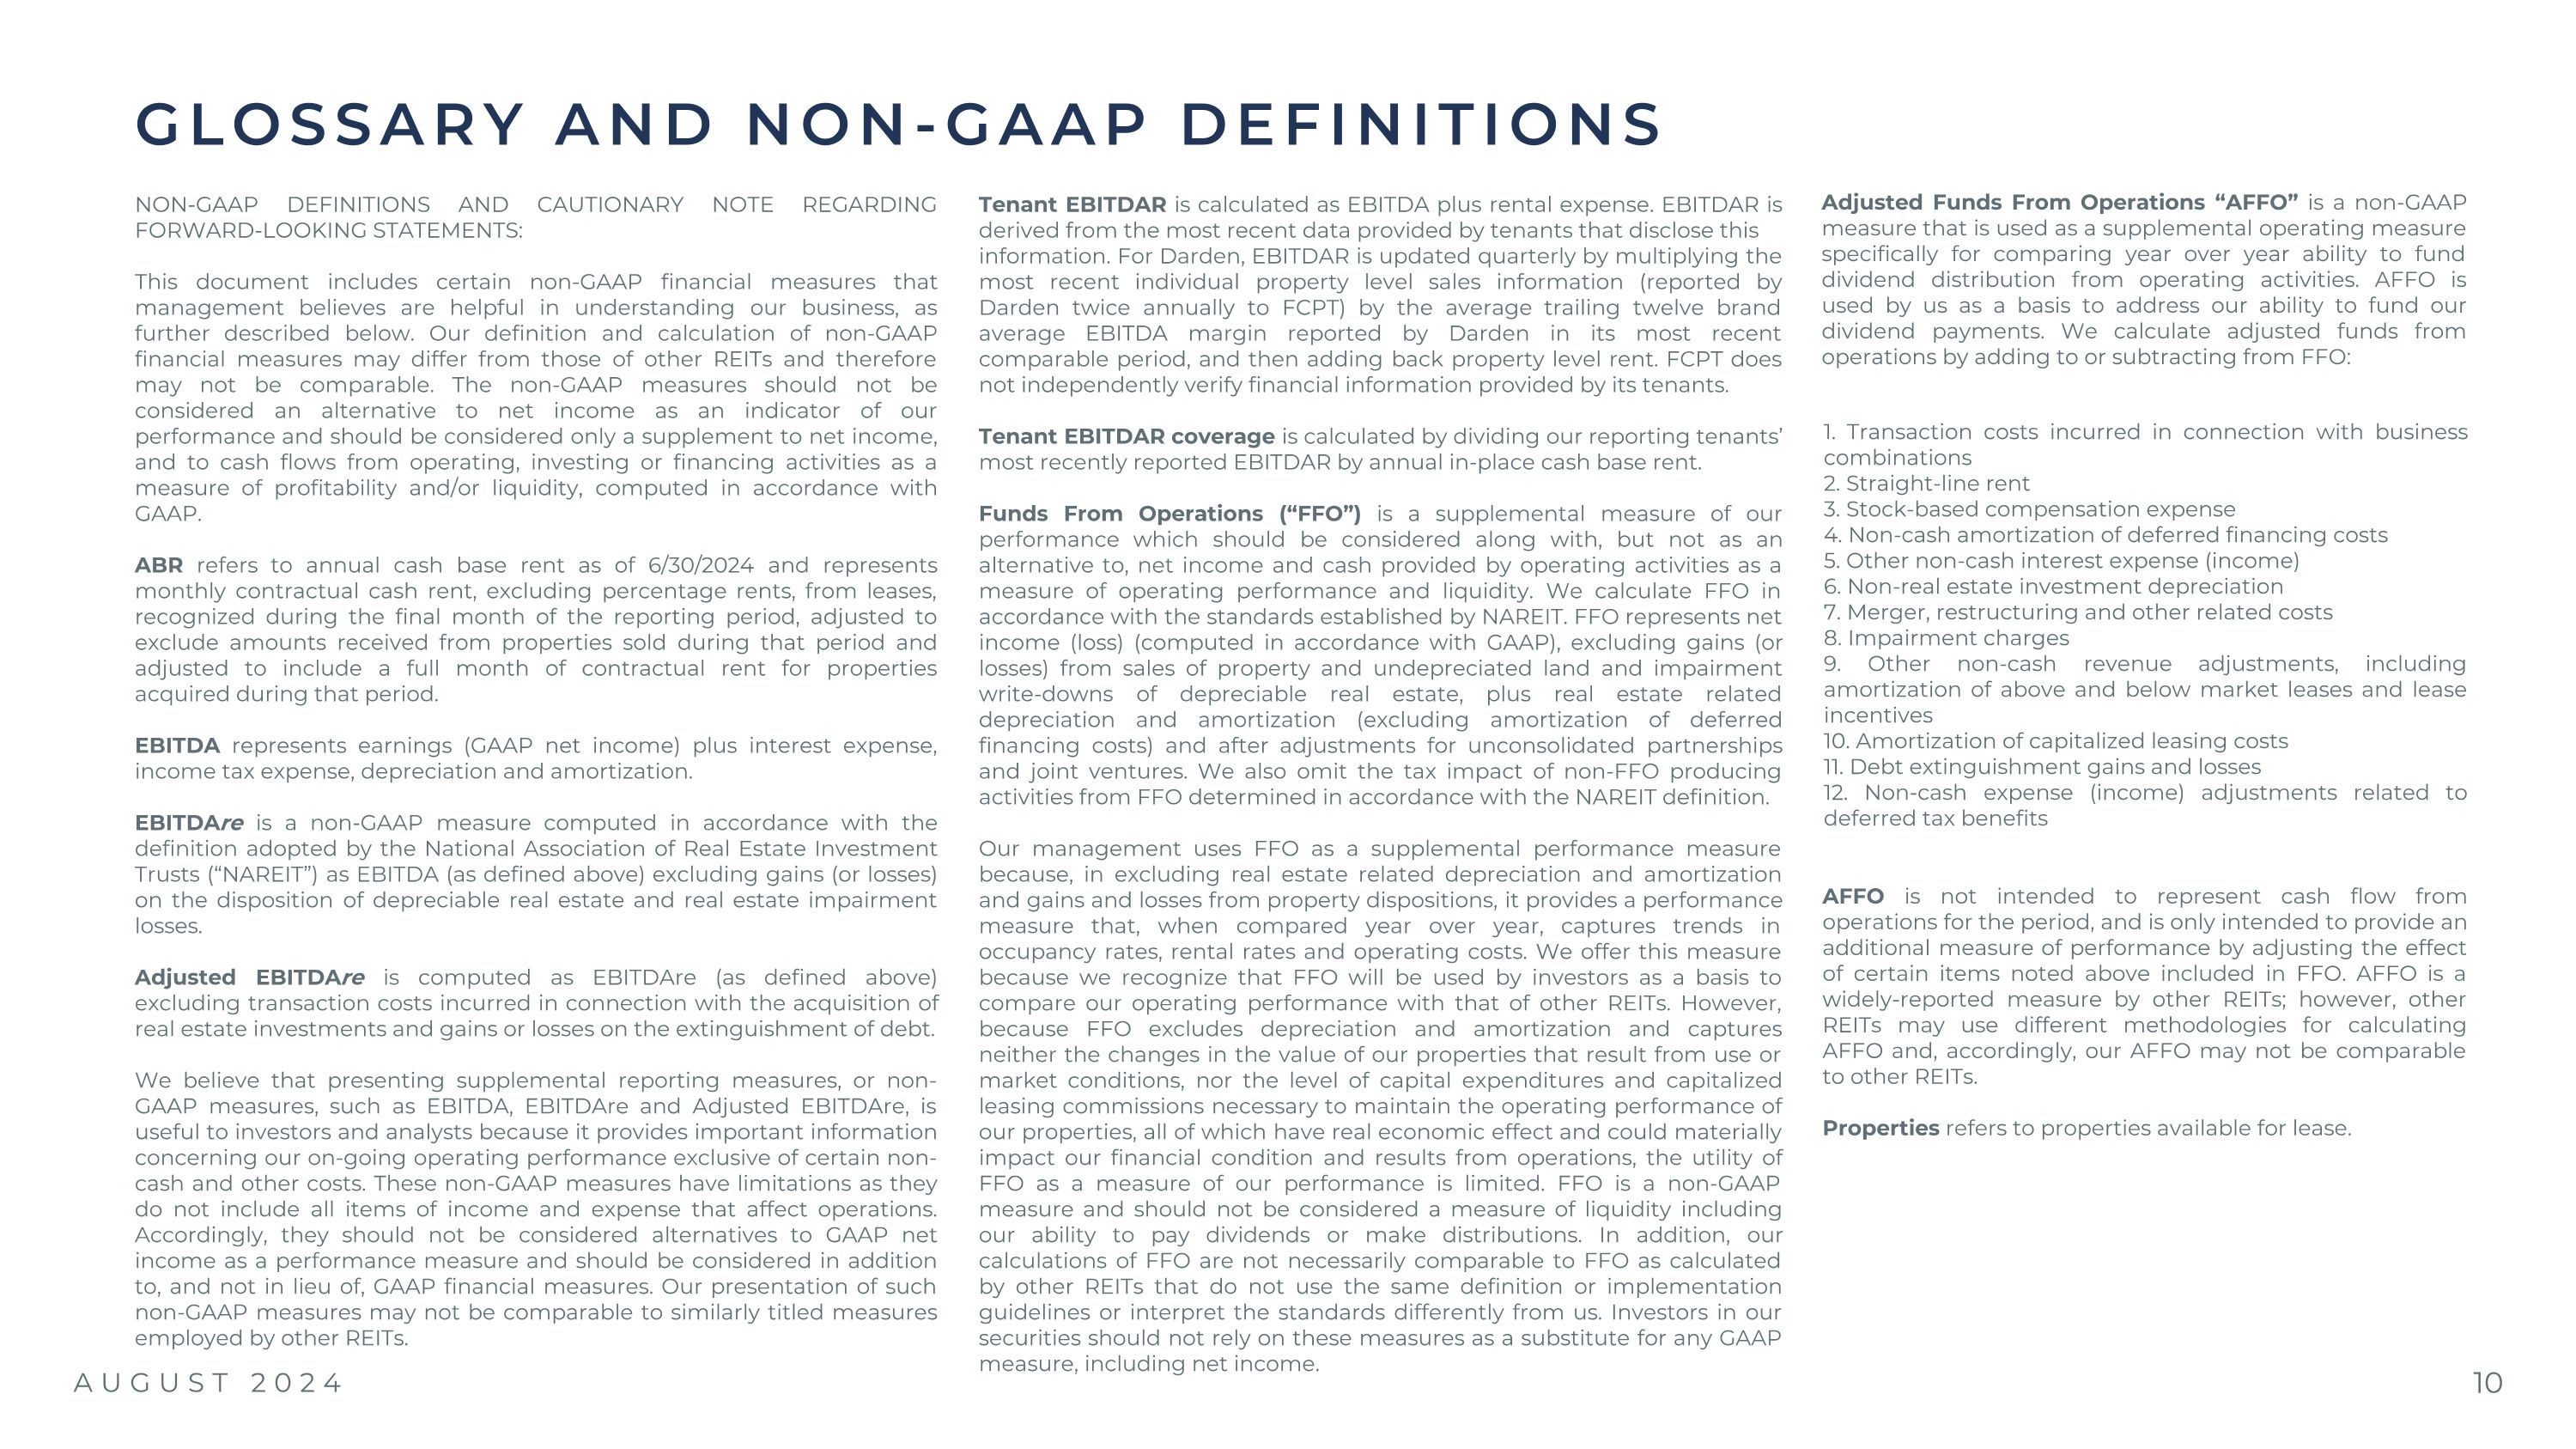
NON-GAAP DEFINITIONS AND CAUTIONARY NOTE REGARDING FORWARD-LOOKING STATEMENTS: This document includes certain non-GAAP financial measures that management believes are helpful in understanding our business, as further described below. Our definition and calculation of non-GAAP financial measures may differ from those of other REITs and therefore may not be comparable. The non-GAAP measures should not be considered an alternative to net income as an indicator of our performance and should be considered only a supplement to net income, and to cash flows from operating, investing or financing activities as a measure of profitability and/or liquidity, computed in accordance with GAAP. ABR refers to annual cash base rent as of 6/30/2024 and represents monthly contractual cash rent, excluding percentage rents, from leases, recognized during the final month of the reporting period, adjusted to exclude amounts received from properties sold during that period and adjusted to include a full month of contractual rent for properties acquired during that period. EBITDA represents earnings (GAAP net income) plus interest expense, income tax expense, depreciation and amortization. EBITDAre is a non-GAAP measure computed in accordance with the definition adopted by the National Association of Real Estate Investment Trusts (“NAREIT”) as EBITDA (as defined above) excluding gains (or losses) on the disposition of depreciable real estate and real estate impairment losses. Adjusted EBITDAre is computed as EBITDAre (as defined above) excluding transaction costs incurred in connection with the acquisition of real estate investments and gains or losses on the extinguishment of debt. We believe that presenting supplemental reporting measures, or non-GAAP measures, such as EBITDA, EBITDAre and Adjusted EBITDAre, is useful to investors and analysts because it provides important information concerning our on-going operating performance exclusive of certain non-cash and other costs. These non-GAAP measures have limitations as they do not include all items of income and expense that affect operations. Accordingly, they should not be considered alternatives to GAAP net income as a performance measure and should be considered in addition to, and not in lieu of, GAAP financial measures. Our presentation of such non-GAAP measures may not be comparable to similarly titled measures employed by other REITs. Tenant EBITDAR is calculated as EBITDA plus rental expense. EBITDAR is derived from the most recent data provided by tenants that disclose this information. For Darden, EBITDAR is updated quarterly by multiplying the most recent individual property level sales information (reported by Darden twice annually to FCPT) by the average trailing twelve brand average EBITDA margin reported by Darden in its most recent comparable period, and then adding back property level rent. FCPT does not independently verify financial information provided by its tenants. Tenant EBITDAR coverage is calculated by dividing our reporting tenants’ most recently reported EBITDAR by annual in-place cash base rent. Funds From Operations (“FFO”) is a supplemental measure of our performance which should be considered along with, but not as an alternative to, net income and cash provided by operating activities as a measure of operating performance and liquidity. We calculate FFO in accordance with the standards established by NAREIT. FFO represents net income (loss) (computed in accordance with GAAP), excluding gains (or losses) from sales of property and undepreciated land and impairment write-downs of depreciable real estate, plus real estate related depreciation and amortization (excluding amortization of deferred financing costs) and after adjustments for unconsolidated partnerships and joint ventures. We also omit the tax impact of non-FFO producing activities from FFO determined in accordance with the NAREIT definition. Our management uses FFO as a supplemental performance measure because, in excluding real estate related depreciation and amortization and gains and losses from property dispositions, it provides a performance measure that, when compared year over year, captures trends in occupancy rates, rental rates and operating costs. We offer this measure because we recognize that FFO will be used by investors as a basis to compare our operating performance with that of other REITs. However, because FFO excludes depreciation and amortization and captures neither the changes in the value of our properties that result from use or market conditions, nor the level of capital expenditures and capitalized leasing commissions necessary to maintain the operating performance of our properties, all of which have real economic effect and could materially impact our financial condition and results from operations, the utility of FFO as a measure of our performance is limited. FFO is a non-GAAP measure and should not be considered a measure of liquidity including our ability to pay dividends or make distributions. In addition, our calculations of FFO are not necessarily comparable to FFO as calculated by other REITs that do not use the same definition or implementation guidelines or interpret the standards differently from us. Investors in our securities should not rely on these measures as a substitute for any GAAP measure, including net income. Adjusted Funds From Operations “AFFO” is a non-GAAP measure that is used as a supplemental operating measure specifically for comparing year over year ability to fund dividend distribution from operating activities. AFFO is used by us as a basis to address our ability to fund our dividend payments. We calculate adjusted funds from operations by adding to or subtracting from FFO: 1. Transaction costs incurred in connection with business combinations 2. Straight-line rent 3. Stock-based compensation expense 4. Non-cash amortization of deferred financing costs 5. Other non-cash interest expense (income) 6. Non-real estate investment depreciation 7. Merger, restructuring and other related costs 8. Impairment charges 9. Other non-cash revenue adjustments, including amortization of above and below market leases and lease incentives 10. Amortization of capitalized leasing costs 11. Debt extinguishment gains and losses 12. Non-cash expense (income) adjustments related to deferred tax benefits AFFO is not intended to represent cash flow from operations for the period, and is only intended to provide an additional measure of performance by adjusting the effect of certain items noted above included in FFO. AFFO is a widely-reported measure by other REITs; however, other REITs may use different methodologies for calculating AFFO and, accordingly, our AFFO may not be comparable to other REITs. Properties refers to properties available for lease. GLOSSARY AND NON-GAAP DEFINITIONS AUGUST 2024
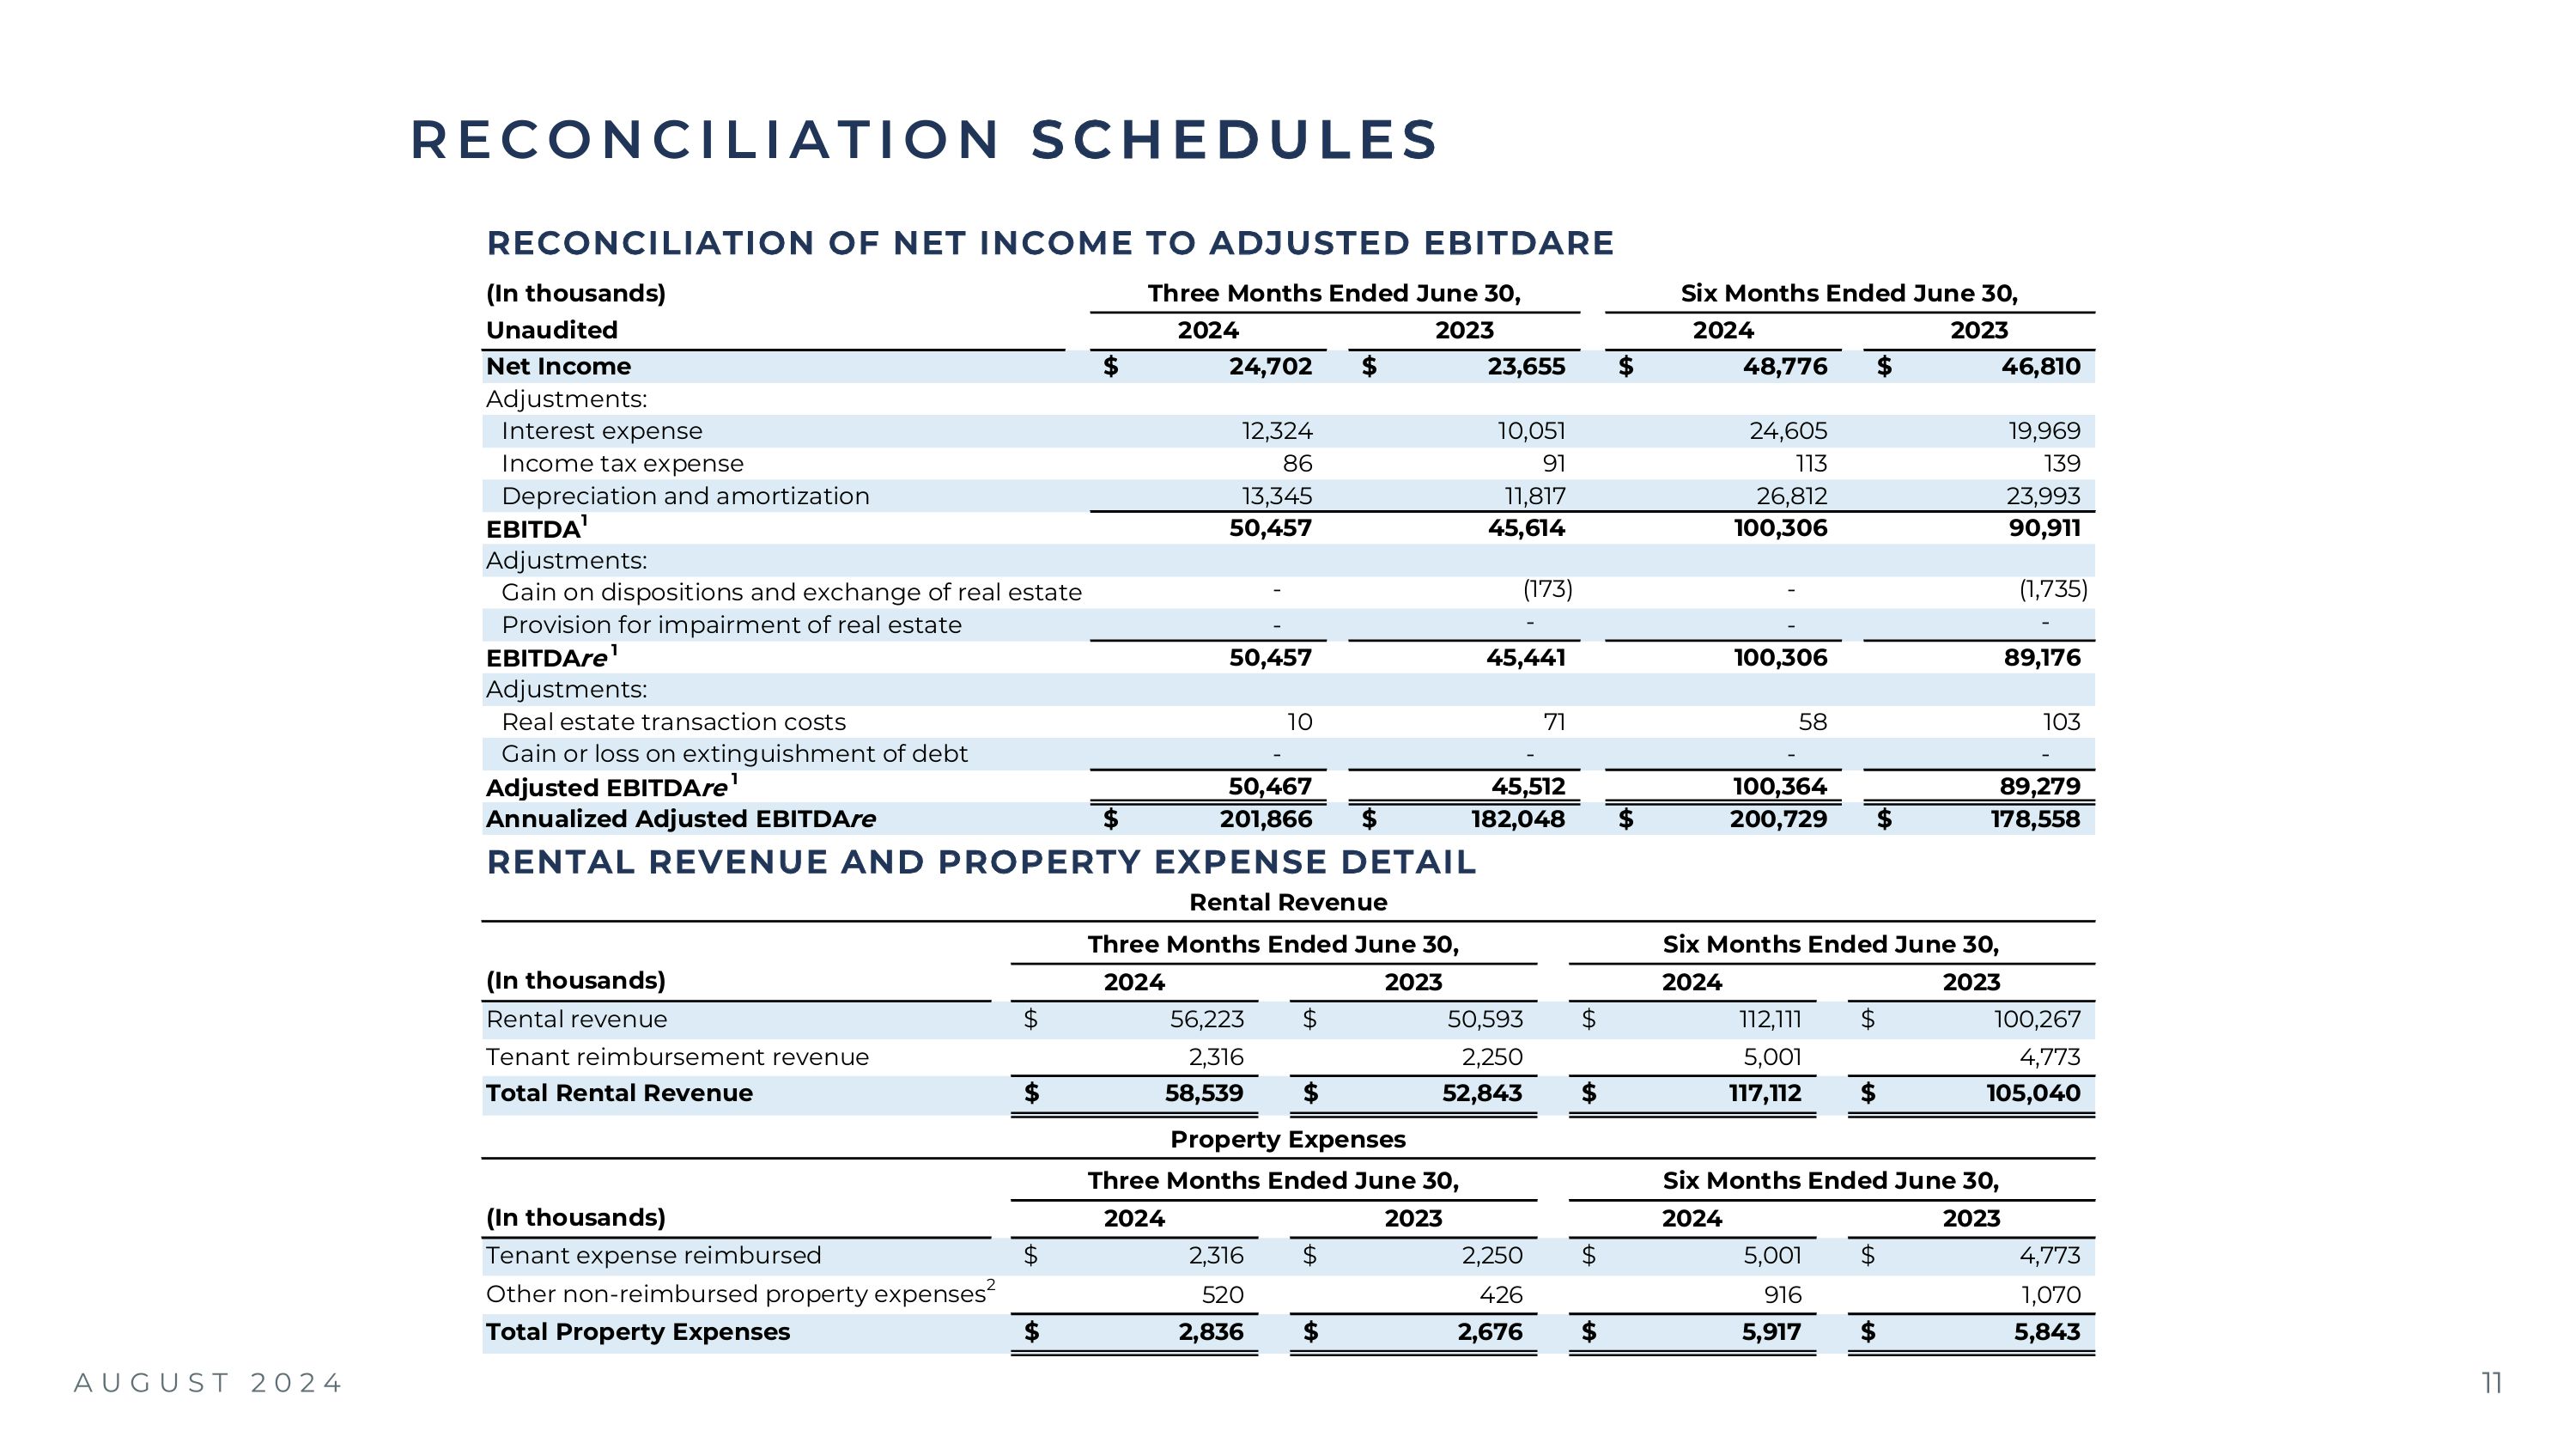
RECONCILIATION SCHEDULES RECONCILIATION OF NET INCOME TO ADJUSTED EBITDARE RENTAL REVENUE AND PROPERTY EXPENSE DETAIL AUGUST 2024
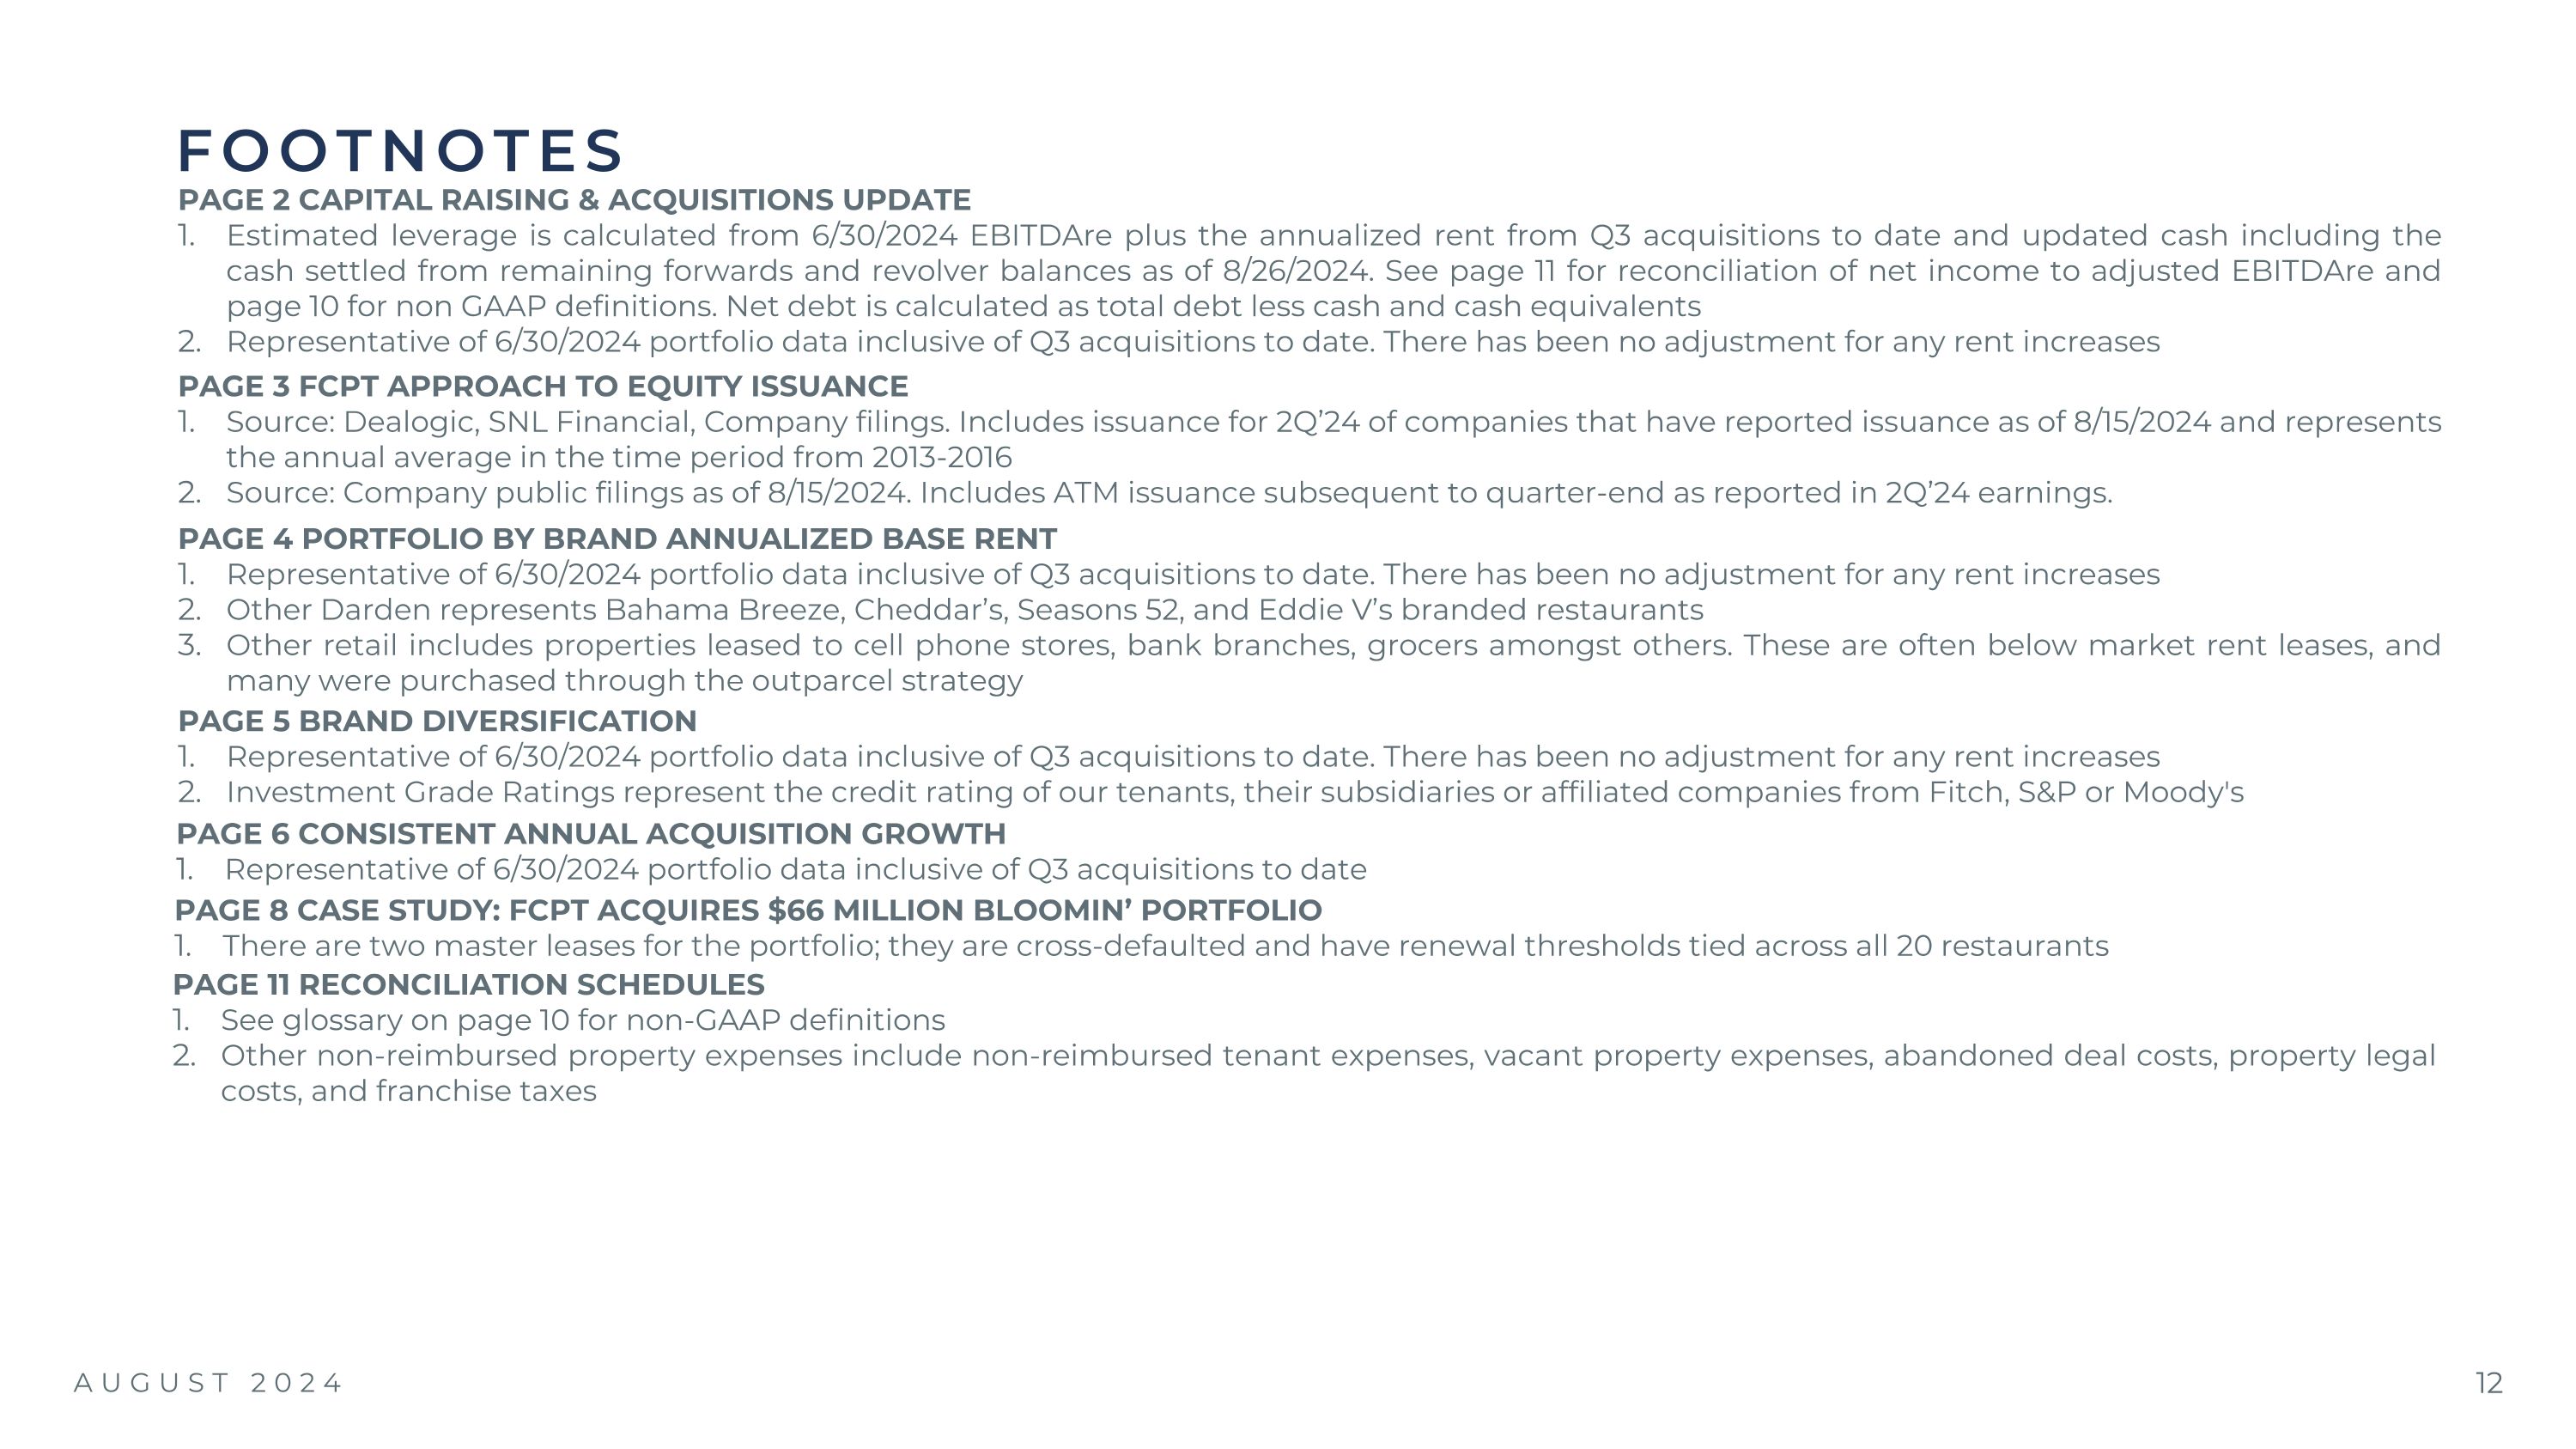
AUGUST 2024 FOOTNOTES PAGE 4 PORTFOLIO BY BRAND ANNUALIZED BASE RENT Representative of 6/30/2024 portfolio data inclusive of Q3 acquisitions to date. There has been no adjustment for any rent increases Other Darden represents Bahama Breeze, Cheddar’s, Seasons 52, and Eddie V’s branded restaurants Other retail includes properties leased to cell phone stores, bank branches, grocers amongst others. These are often below market rent leases, and many were purchased through the outparcel strategy PAGE 5 BRAND DIVERSIFICATION Representative of 6/30/2024 portfolio data inclusive of Q3 acquisitions to date. There has been no adjustment for any rent increases Investment Grade Ratings represent the credit rating of our tenants, their subsidiaries or affiliated companies from Fitch, S&P or Moody's PAGE 6 CONSISTENT ANNUAL ACQUISITION GROWTH Representative of 6/30/2024 portfolio data inclusive of Q3 acquisitions to date PAGE 3 FCPT APPROACH TO EQUITY ISSUANCE Source: Dealogic, SNL Financial, Company filings. Includes issuance for 2Q’24 of companies that have reported issuance as of 8/15/2024 and represents the annual average in the time period from 2013-2016 Source: Company public filings as of 8/15/2024. Includes ATM issuance subsequent to quarter-end as reported in 2Q’24 earnings. PAGE 2 CAPITAL RAISING & ACQUISITIONS UPDATE Estimated leverage is calculated from 6/30/2024 EBITDAre plus the annualized rent from Q3 acquisitions to date and updated cash including the cash settled from remaining forwards and revolver balances as of 8/26/2024. See page 11 for reconciliation of net income to adjusted EBITDAre and page 10 for non GAAP definitions. Net debt is calculated as total debt less cash and cash equivalents Representative of 6/30/2024 portfolio data inclusive of Q3 acquisitions to date. There has been no adjustment for any rent increases PAGE 11 RECONCILIATION SCHEDULES See glossary on page 10 for non-GAAP definitions Other non-reimbursed property expenses include non-reimbursed tenant expenses, vacant property expenses, abandoned deal costs, property legal costs, and franchise taxes PAGE 8 CASE STUDY: FCPT ACQUIRES $66 MILLION BLOOMIN’ PORTFOLIO There are two master leases for the portfolio; they are cross-defaulted and have renewal thresholds tied across all 20 restaurants

CAPITAL RAISING & ACQUISITIONS UPDATE AUGUST 2024


