Exhibit 99.2

Supplemental Financial & Operating Information
Year Ended – December 31, 2016
Four Corners Property Trust, Inc. (“FCPT” or the “Company”, NYSE: FCPT), headquartered in Mill Valley, CA, is primarily engaged in the acquisition and leasing of restaurant properties. FCPT seeks to grow its portfolio by acquiring additional real estate to lease, on a triple net basis, for use in the restaurant and related food services industry. As of December 31, 2016, FCPT’s leased portfolio consists of 475 restaurant properties located in 44 states. The properties are 100% occupied under long-term, triple net leases with a weighted average remaining lease term of approximately 13.7 years and an estimated portfolio weighted average EBITDAR to Lease Rent coverage of 4.2x.


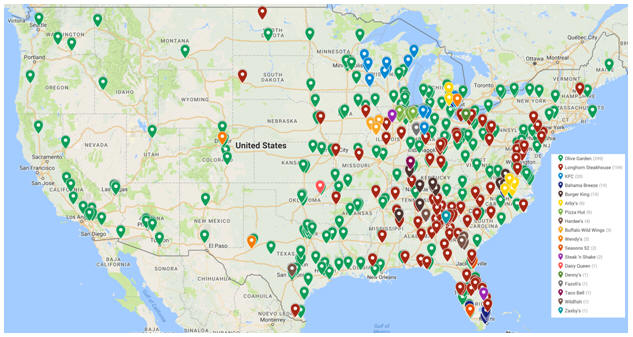
Table of Contents
| | | | |
| |
Non-GAAP Definitions | | | 3 | |
| |
Consolidated Balance Sheets | | | 5 | |
| |
Consolidated Statements of Operations | | | 6 | |
| |
FFO and AFFO Statement | | | 7 | |
| |
Leased Portfolio Summary | | | 8 | |
| |
Diversification by State | | | 9 | |
| |
Lease Expirations | | | 10 | |
2
Non-GAAP Definitions and Cautionary Note Regarding Forward-Looking Statements:
This document includes certain non-GAAP financial measures that management believes are helpful in understanding our business, as further described below. Our definition and calculation of non-GAAP financial measures may differ from those of other REITs and therefore may not be comparable. The non-GAAP measures should not be considered an alternative to net income as an indicator of our performance and should be considered only a supplement to net income, and to cash flows from operating, investing or financing activities as a measure of profitability and/or liquidity, computed in accordance with GAAP.
Funds From Operations (“FFO”) is a supplemental measure of our performance which should be considered along with, but not as an alternative to, net income and cash provided by operating activities as a measure of operating performance and liquidity. We calculate FFO in accordance with the standards established by the National Association of Real Estate Investment Trusts (“NAREIT”). FFO represents net income (loss) (computed in accordance with GAAP), excluding gains (or losses) from sales of property and undepreciated land and impairment write-downs of depreciable real estate, plus real estate related depreciation and amortization (excluding amortization of deferred financing costs) and after adjustments for unconsolidated partnerships and joint ventures. We also omit the tax impact of non-FFO producing activities from FFO determined in accordance with the NAREIT definition.
Our management uses FFO as a supplemental performance measure because, in excluding real estate related depreciation and amortization and gains and losses from property dispositions, it provides a performance measure that, when compared year over year, captures trends in occupancy rates, rental rates and operating costs. We offer this measure because we recognize that FFO will be used by investors as a basis to compare our operating performance with that of other REITs. However, because FFO excludes depreciation and amortization and captures neither the changes in the value of our properties that result from use or market conditions, nor the level of capital expenditures and capitalized leasing commissions necessary to maintain the operating performance of our properties, all of which have real economic effect and could materially impact our financial condition and results from operations, the utility of FFO as a measure of our performance is limited. FFO is a non-GAAP measure and should not be considered a measure of liquidity including our ability to pay dividends or make distributions. In addition, our calculations of FFO are not necessarily comparable to FFO as calculated by other REITs that do not use the same definition or implementation guidelines or interpret the standards differently from us. Investors in our securities should not rely on these measures as a substitute for any GAAP measure, including net income.
Adjusted Funds From Operations “AFFO” is a non-GAAP measure that is used as a supplemental operating measure specifically for comparing year over year ability to fund dividend distribution from operating activities. AFFO is used by us as a basis to address our ability to fund our dividend payments. We calculate adjusted funds from operations by adding to or subtracting from FFO:
| | 1. | Transaction costs incurred in connection with the acquisition of real estate investments |
| | 2. | Non-cash stock-based compensation expense |
| | 3. | Amortization of deferred financing costs |
| | 4. | Other non-cash interest expense |
| | 5. | Non-real estate depreciation |
| | 6. | Merger, restructuring and other related costs |
| | 8. | Amortization of capitalized leasing costs |
| | 9. | Straight-line rent revenue adjustment |
3
| | 10. | Amortization of above and below market leases |
| | 11. | Debt extinguishment gains and losses |
| | 12. | Recurring capital expenditures and tenant improvements |
AFFO is not intended to represent cash flow from operations for the period, and is only intended to provide an additional measure of performance by adjusting the effect of certain items noted above included in FFO. AFFO is a widely reported measure by other REITs; however, other REITs may use different methodologies for calculating AFFO and, accordingly, our AFFO may not be comparable to other REITs.
EBITDAR represents earnings before interest, taxes, depreciation, amortization and rent. Calculated as EBITDA plus rental expense.
EBITDAR to Lease Rent coverage is calculated by dividing our reporting tenants’ trailing 12-month EBITDAR by annual contractual rent.
Cautionary Note Regarding Forward-Looking Statements:
This press release contains forward-looking statements within the meaning of the federal securities laws. Forward-looking statements include all statements that are not historical statements of fact and those regarding the Company’s intent, belief or expectations, including, but not limited to, statements regarding: operating and financial performance; and expectations regarding the making of distributions and the payment of dividends. Words such as “anticipate(s),” “expect(s),” “intend(s),” “plan(s),” “believe(s),” “may,” “will,” “would,” “could,” “should,” “seek(s)” and similar expressions, or the negative of these terms, are intended to identify such forward-looking statements. Forward-looking statements speak only as of the date on which such statements are made and, except in the normal course of the Company’s public disclosure obligations, the Company expressly disclaims any obligation to publicly release any updates or revisions to any forward-looking statements to reflect any change in the Company’s expectations or any change in events, conditions or circumstances on which any statement is based. Forward-looking statements are based on management’s current expectations and beliefs and the Company can give no assurance that its expectations or the events described will occur as described. Forward-looking statements are subject to a number of risks and uncertainties that could cause actual results to differ materially from those set forth in or implied by such forward-looking statements.
Factors that could have a material adverse effect on the Company’s operations and future prospects or that could cause actual results to differ materially from the Company’s expectations are included in the sections entitled “Business,” “Risk Factors” and “Management’s Discussion and Analysis of Financial Condition and Results of Operations” of the Company’s Annual Report on Form 10-K filed with the Securities and Exchange Commission on March 22, 2016.
4
Consolidating Balance Sheet
December, 31 2016
(Unaudited)
(In thousands)
| | | | | | | | | | | | | | | | |
| | | Real Estate
Operations | | | Restaurant
Operations | | | Elimination | | | Consolidated
FCPT | |
| ASSETS | | | | | | | | | | | | | | | | |
Real estate investments: | | | | | | | | | | | | | | | | |
Land | | $ | 418,880 | | | $ | 3,061 | | | $ | — | | | $ | 421,941 | |
Buildings, equipment and improvements | | | 1,042,087 | | | | 13,537 | | | | — | | | | 1,055,624 | |
| | | | | | | | | | | | | | | | |
Total real estate investments | | | 1,460,967 | | | | 16,598 | | | | — | | | | 1,477,565 | |
Less: accumulated depreciation | | | (577,392 | ) | | | (5,915 | ) | | | — | | | | (583,307 | ) |
| | | | | | | | | | | | | | | | |
Total real estate investments, net | | | 883,575 | | | | 10,683 | | | | — | | | | 894,258 | |
Cash and cash equivalents | | | 24,412 | | | | 2,231 | | | | — | | | | 26,643 | |
Deferred rent | | | 11,594 | | | | — | | | | — | | | | 11,594 | |
Other assets | | | 4,166 | | | | 490 | | | | — | | | | 4,656 | |
Investment in subsidiary | | | 10,953 | | | | — | | | | (10,953 | ) | | | — | |
Intercompany receivable | | | 769 | | | | — | | | | (769 | ) | | | — | |
| | | | | | | | | | | | | | | | |
Total Assets | | $ | 935,469 | | | $ | 13,404 | | | $ | (11,722 | ) | | $ | 937,151 | |
| | | | | | | | | | | | | | | | |
| LIABILITIES AND EQUITY | | | | | | | | | | | | | | | | |
Liabilities: | | | | | | | | | | | | | | | | |
Notes payable, net of deferred financing costs | | $ | 438,895 | | | $ | — | | | $ | — | | | $ | 438,895 | |
Deferred rental revenue | | | 7,974 | | | | — | | | | — | | | | 7,974 | |
Deferred tax liability | | | 196 | | | | — | | | | — | | | | 196 | |
Dividends payable | | | 14,519 | | | | — | | | | — | | | | 14,519 | |
Other liabilities | | | 3,288 | | | | 2,162 | | | | — | | | | 5,450 | |
Intercompany payable | | | — | | | | 769 | | | | (769 | ) | | | — | |
| | | | | | | | | | | | | | | | |
Total liabilities | | | 464,872 | | | | 2,931 | | | | (769 | ) | | | 467,034 | |
| | | | | | | | | | | | | | | | |
Equity: | | | | | | | | | | | | | | | | |
Preferred stock | | | — | | | | — | | | | — | | | | — | |
Common stock | | | 6 | | | | — | | | | — | | | | 6 | |
Additional paid-in capital | | | 438,864 | | | | 10,953 | | | | (10,953 | ) | | | 438,864 | |
Accumulated other comprehensive gain | | | 207 | | | | — | | | | — | | | | 207 | |
Noncontrolling interest | | | 5,097 | | | | | | | | | | | | 5,097 | |
Retained earnings | | | 26,423 | | | | (480 | ) | | | — | | | | 25,943 | |
| | | | | | | | | | | | | | | | |
Total equity | | | 470,597 | | | | 10,473 | | | | (10,953 | ) | | | 470,117 | |
| | | | | | | | | | | | | | | | |
Total Liabilities and Equity | | $ | 935,469 | | | $ | 13,404 | | | $ | (11,722 | ) | | $ | 937,151 | |
| | | | | | | | | | | | | | | | |
5
Consolidated and Combined Statements of Operations
Three Months and Year Ended December 31, 2016 and 2015
(Unaudited)
(In thousands, except shares and per share data)
| | | | | | | | | | | | | | | | |
| | | Three Months Ended December 31, | | | Year Ended December 31, | |
| | | 2016 | | | 2015 | | | 2016 | | | 2015 | |
Revenues: | | | | | | | | | | | | | | | | |
Rental revenue | | $ | 26,876 | | | $ | 15,134 | | | $ | 105,624 | | | $ | 15,134 | |
Restaurant revenue | | | 4,391 | | | | 4,319 | | | | 18,394 | | | | 18,322 | |
| | | | | | | | | | | | | | | | |
Total revenues | | | 31,267 | | | | 19,453 | | | | 124,018 | | | | 33,456 | |
Operating expenses: | | | | | | | | | | | | | | | | |
General and administrative | | | 2,546 | | | | 1,856 | | | | 10,977 | | | | 1,856 | |
Depreciation and amortization | | | 5,231 | | | | 3,153 | | | | 20,577 | | | | 3,758 | |
Restaurant expenses | | | 4,253 | | | | 3,396 | | | | 17,853 | | | | 16,996 | |
Interest expense | | | 3,239 | | | | 2,203 | | | | 14,828 | | | | 2,203 | |
| | | | | | | | | | | | | | | | |
Total operating expenses | | | 15,269 | | | | 10,608 | | | | 64,235 | | | | 24,813 | |
| | | | | | | | | | | | | | | | |
Other income | | | 9 | | | | — | | | | 97 | | | | — | |
Realized gain on sale, net | | | 16,623 | | | | — | | | | 16,623 | | | | — | |
| | | | | | | | | | | | | | | | |
Income before provision for income taxes | | | 32,630 | | | | 8,845 | | | | 76,503 | | | | 8,643 | |
(Provision for) benefit from income taxes | | | (108 | ) | | | (2,949 | ) | | | 80,347 | | | | (2,944 | ) |
| | | | | | | | | | | | | | | | |
Net Income | | $ | 32,522 | | | $ | 5,896 | | | $ | 156,850 | | | $ | 5,699 | |
| | | | | | | | | | | | | | | | |
Net income attributable to noncontrolling interest | | | (41 | ) | | | — | | | | (41 | ) | | | — | |
| | | | | | | | | | | | | | | | |
Net Income Available to Common Shareholders | | $ | 32,481 | | | $ | 5,896 | | | $ | 156,809 | | | $ | 5,699 | |
| | | | | | | | | | | | | | | | |
Basic net income per share | | $ | 0.54 | | | $ | 0.50 | | | $ | 3.02 | | | $ | 0.92 | |
Diluted net income per share | | $ | 0.54 | | | $ | 0.49 | | | $ | 2.89 | | | $ | 0.91 | |
Weighted-average shares outstanding: | | | | | | | | | | | | | | | | |
Basic | | | 59,837,636 | | | | 24,385,346 | | | | 56,984,561 | | | | 6,206,375 | |
Diluted | | | 59,871,465 | | | | 24,680,656 | | | | 59,568,067 | | | | 6,263,921 | |
Regular dividends declared per share | | $ | 0.2425 | | | | N/A | | | $ | 0.9700 | | | | N/A | |
6
FFO and AFFO Statement
Three Months and Year Ended December 31, 2016
(Unaudited)
(In thousands, except shares and per share data)
| | | | | | | | |
| | | Three Months Ended
December 31, 2016 | | | Year Ended
December 31, 2016 | |
Funds from operations (FFO): | | | | | | | | |
Net income attributable to shareholders in accordance with GAAP | | $ | 32,481 | | | $ | 156,809 | |
Depreciation and amortization | | | 5,231 | | | | 20,577 | |
Deferred tax benefit from REIT election | | | — | | | | (80,410 | ) |
Realized gain on sales of real estate | | | (16,623 | ) | | | (16,623 | ) |
| | | | | | | | |
FFO (as defined by NAREIT) | | $ | 21,089 | | | $ | 80,353 | |
| | | | | | | | |
Non-cash stock-based compensation | | | 394 | | | | 1,550 | |
Non-cash amortization of deferred financing costs | | | 398 | | | | 1,592 | |
Other non-cash interest (income) expense | | | (749 | ) | | | (610 | ) |
Straight-line rent | | | (2,295 | ) | | | (10,095 | ) |
| | | | | | | | |
Adjusted funds from operations (AFFO) | | $ | 18,837 | | | $ | 72,790 | |
| | | | | | | | |
Fully diluted shares outstanding | | | 59,871,465 | | | | 59,568,067 | |
FFO per diluted share | | $ | 0.35 | | | $ | 1.35 | |
AFFO per diluted share | | $ | 0.31 | | | $ | 1.22 | |
7
Leased Portfolio Summary
Three Months Ended December 31, 2016
| | | | | | | | | | | | | | | | | | | | | | | | | | | | | | |
Fourth Quarter 2016 | | Properties | | Number of
Four
Corners
Properties | | | Total
Square
Feet
(000s) | | | Annual
Cash Base
Rent -2017
($000s) | | | Percentage of
Total
Annualized
Base Rent
(2017) | | | Avg. Rent
Per
Square
Foot ($) | | | EBITDAR
Coverage(1) | | | Lease Term
Before
Renewals
(Yrs)(2) | |
Existing properties | | | | | | | | | | | | | | | | | | | | | | | | | | | | | | |
| | Olive Garden | | | 300 | | | | 2,565 | | | $ | 71,226 | | | | 70.6 | % | | $ | 28 | | | | 4.4x | | | | 13.8 | |
| | LongHorn Steakhouse | | | 104 | | | | 579 | | | | 19,229 | | | | 19.0 | % | | | 33 | | | | 3.9x | | | | 12.7 | |
| | Other Brands - Darden | | | 14 | | | | 143 | | | | 5,568 | | | | 5.5 | % | | | 39 | | | | 3.6x | | | | 11.6 | |
| | Other Brands-non - Darden | | | 16 | | | | 54 | | | | 1,558 | | | | 1.5 | % | | | 29 | | | | 2.7x | | | | 15.9 | |
Properties acquired in Q4 2016(3) | | | | | | | | | | | | | | | | | | | | | | | | | | | | | | |
| | 8 Transactions | | | 43 | | | | 130 | | | | 4,572 | | | | 4.6 | % | | | 35 | | | | 2.9x | | | | 17.3 | |
Properties sold | | | | | | | | | | | | | | | | | | | | | | | | | | | | | | |
| | Olive Garden | | | (1 | ) | | | (9 | ) | | | (300 | ) | | | (0.3 | %) | | | (33 | ) | | | (4.7x | ) | | | (16.8 | ) |
| | Bahama Breeze | | | (1 | ) | | | (17 | ) | | | (880 | ) | | | (0.9 | %) | | | (52 | ) | | | (5.0x | ) | | | (12.8 | ) |
| | | | | | | | | | | | | | | | | | | | | | | | | | | | | | |
Lease terminations | | | | | | | | | | | | | | | | | | | | | | | | | | | | | | |
| | No terminations in Q4 2016 | | | — | | | | — | | | | — | | | | — | | | | — | | | | — | | | | — | |
| | | | | | | | | | | | | | | | | | | | | | | | | | | | | | |
| | Total/Weighted Avg. | | | 475 | | | | 3,445 | | | $ | 100,973 | | | | 100.0 | % | | $ | 29 | | | | 4.2x | | | | 13.7 | |
| | | | | | | | | | | | | | | | | | | | | | | | | | | | | | |
| (1) | EBITDAR Coverage is calculated by dividing our tenants estimated trailing 12-month EBITDAR by annual contractual cash rent paid to FCPT. EBITDAR is defined as earnings before interest, income taxes, depreciation, amortization, and rent. EBITDAR is derived from the most recent data from tenants who disclose this information, representing approximately 98% of our run-rate rental income. FCPT does not independently verify financial information provided by its tenants. |
| (2) | Lease term weighted by cash base rent. |
| (3) | FCPT acquired 43 properties in Q4 2016 consisting of the following brands: KFC (16), Burger King (10), Hardee’s (4), Arby’s (4), Wendy’s (2), Steak N’ Shake (2), Taco Bell (1), Dairy Queen (1), Denny’s (1), Fazoli’s (1), Zaxby’s (1) |
8
Leased Portfolio Diversification by State
As of December 31, 2016
| | | | |
State | | # of Properties | | % of Annual Base Rent |
FL | | 45 | | 11.8% |
TX | | 43 | | 10.8% |
GA | | 44 | | 8.4% |
OH | | 33 | | 6.4% |
MI | | 25 | | 4.1% |
IN | | 24 | | 3.4% |
TN | | 18 | | 3.3% |
NC | | 17 | | 3.2% |
CA | | 10 | | 3.2% |
PA | | 13 | | 3.0% |
IL | | 17 | | 2.7% |
VA | | 14 | | 2.6% |
WI | | 16 | | 2.4% |
NY | | 9 | | 2.2% |
MD | | 10 | | 2.2% |
KY | | 10 | | 2.0% |
AL | | 11 | | 2.0% |
IA | | 10 | | 1.9% |
SC | | 8 | | 1.9% |
AZ | | 8 | | 1.8% |
NV | | 6 | | 1.8% |
MN | | 8 | | 1.7% |
OK | | 7 | | 1.5% |
CO | | 7 | | 1.5% |
MS | | 7 | | 1.4% |
AR | | 7 | | 1.3% |
KS | | 5 | | 1.3% |
LA | | 6 | | 1.3% |
WV | | 5 | | 1.2% |
MO | | 6 | | 1.1% |
14 States | | 26 | | 6.3% |
| | | | |
Total | | 475 | | 100.0% |
| | | | |
9
Lease Expirations
As of December 31, 2016
| | | | | | | | | | | | | | | | |
Leases Expiring In | | Number of
Properties | | | Expiring 2017 Base
Rent
($ in thousands) | | | Total Square
Footage
(in thousands) | | | Percent of Total
Expiring Annual
Rent | |
2017 | | | 1 | | | | 53 | | | | 3 | | | | 0.1 | % |
2018 | | | — | | | | — | | | | — | | | | — | |
2019 | | | — | | | | — | | | | — | | | | — | |
2020 | | | 1 | | | | 59 | | | | 4 | | | | 0.1 | % |
2021 | | | 1 | | | | 86 | | | | 2 | | | | 0.1 | % |
2022 | | | — | | | | — | | | | — | | | | 0.0 | % |
2023 | | | 2 | | | | 207 | | | | 5 | | | | 0.2 | % |
2024 | | | — | | | | — | | | | — | | | | — | |
2025 | | | — | | | | — | | | | — | | | | — | |
2026 | | | 2 | | | | 234 | | | | 7 | | | | 0.2 | % |
2027 | | | 71 | | | | 15,920 | | | | 520 | | | | 15.8 | % |
2028 | | | 74 | | | | 16,741 | | | | 539 | | | | 16.6 | % |
2029 | | | 68 | | | | 15,103 | | | | 520 | | | | 15.0 | % |
2030 | | | 67 | | | | 14,667 | | | | 518 | | | | 14.5 | % |
2031 | | | 59 | | | | 13,385 | | | | 477 | | | | 13.3 | % |
2032 | | | 43 | | | | 10,081 | | | | 357 | | | | 10.0 | % |
2033 | | | 42 | | | | 10,002 | | | | 365 | | | | 9.9 | % |
2034 | | | 4 | | | | 510 | | | | 13 | | | | 0.5 | % |
2035 | | | 1 | | | | 173 | | | | 3 | | | | 0.2 | % |
2036 | | | 39 | | | | 3,752 | | | | 112 | | | | 3.7 | % |
Vacant | | | — | | | | — | | | | — | | | | — | |
| | | | | | | | | | | | | | | | |
Total | | | 475 | | | $ | 100,973 | | | | 3,431 | | | | 100.0 | % |
| | | | | | | | | | | | | | | | |
10