1 | FCPT | NOVEMBER 2022 www.fcpt .comINVESTOR PRESENTATION | NOVEMBER 2022 FOUR CORNERS PROPERTY TRUST N YS E : F C P T

2 | FCPT | NOVEMBER 2022 FORWARD LOOKING STATEMENTS AND DISCLAIMERS Cautionary Note Regarding Forward-Looking Statements: This presentation contains forward-looking statements within the meaning of the federal securities laws. Forward-looking statements include all statements that are not historical statements of fact and those regarding FCPT’s intent, belief or expectations, including, but not limited to, statements regarding: operating and financial performance, acquisition pipeline, expectations regarding the making of distributions and the payment of dividends, and the effect of pandemics such as COVID-19 on the business operations of FCPT and FCPT’s tenants and their continued ability to pay rent in a timely manner or at all. Words such as “anticipate(s),” “expect(s),” “intend(s),” “plan(s),” “believe(s),” “may,” “will,” “would,” “could,” “should,” “seek(s)” and similar expressions, or the negative of these terms, are intended to identify such forward-looking statements. Forward-looking statements speak only as of the date on which such statements are made and, except in the normal course of FCPT’s public disclosure obligations, FCPT expressly disclaims any obligation to publicly release any updates or revisions to any forward- looking statements to reflect any change in FCPT’s expectations or any change in events, conditions or circumstances on which any statement is based. Forward-looking statements are based on management’s current expectations and beliefs and FCPT can give no assurance that its expectations or the events described will occur as described. For a further discussion of these and other factors that could cause FCPT’s future results to differ materially from any forward-looking statements, see the risk factors described under the section entitled “Item 1A. Risk Factors” in FCPT’s annual report on Form 10-K for the year ended December 31, 2021 and other risks described in documents subsequently filed by FCPT from time to time with the Securities and Exchange Commission. Notice Regarding Non-GAAP Financial Measures: The information in this communication contains and refers to certain non-GAAP financial measures, including FFO and AFFO. These non- GAAP financial measures are in addition to, not a substitute for or superior to, measures of financial performance prepared in accordance with GAAP. These non-GAAP financial measures should not be considered replacements for, and should be read together with, the most comparable GAAP financial measures. Reconciliations to the most directly comparable GAAP financial measures and statements of why management believes these measures are useful to investors are included in the supplemental financial and operating report, which can be found in the Investors section of our website at www.fcpt.com, and on page 30 of this presentation.
3 | FCPT | NOVEMBER 2022 AGENDA Restaurant Industry Update Page 14 Company Overview Page 3 Appendix and Selected Supplemental Slides Page 21 High Quality Portfolio Page 9 Conservative Financial Position Page 17
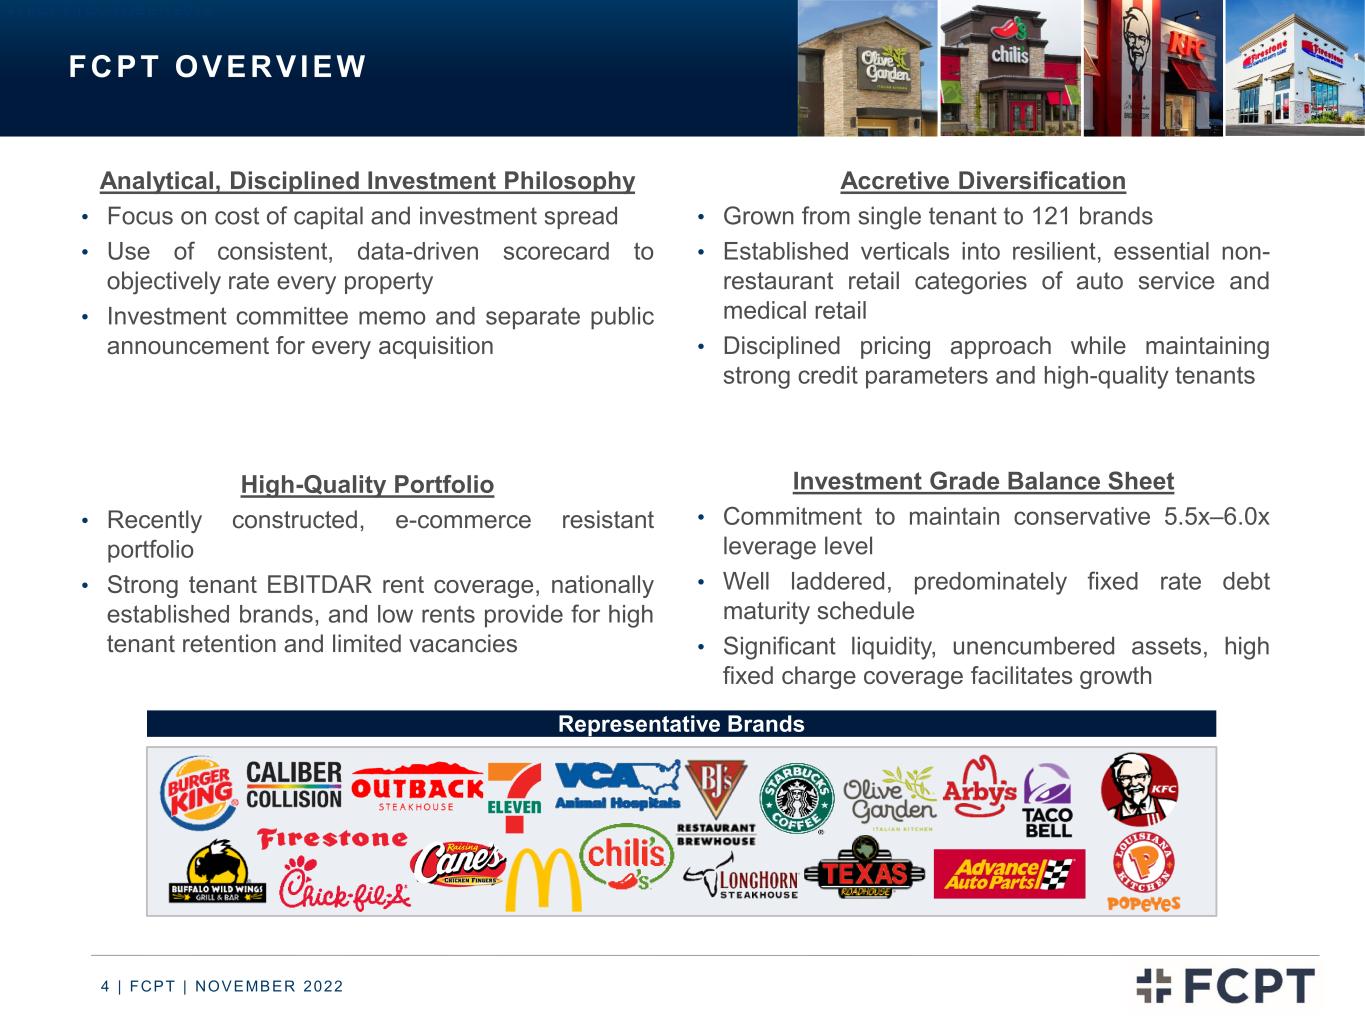
4 | FCPT | NOVEMBER 2022 FCPT OVERVIEW 4 | FCPT | OCTOBER 2019 Analytical, Disciplined Investment Philosophy • Focus on cost of capital and investment spread • Use of consistent, data-driven scorecard to objectively rate every property • Investment committee memo and separate public announcement for every acquisition High-Quality Portfolio • Recently constructed, e-commerce resistant portfolio • Strong tenant EBITDAR rent coverage, nationally established brands, and low rents provide for high tenant retention and limited vacancies Accretive Diversification • Grown from single tenant to 121 brands • Established verticals into resilient, essential non- restaurant retail categories of auto service and medical retail • Disciplined pricing approach while maintaining strong credit parameters and high-quality tenants Investment Grade Balance Sheet • Commitment to maintain conservative 5.5x–6.0x leverage level • Well laddered, predominately fixed rate debt maturity schedule • Significant liquidity, unencumbered assets, high fixed charge coverage facilitates growth Representative Brands
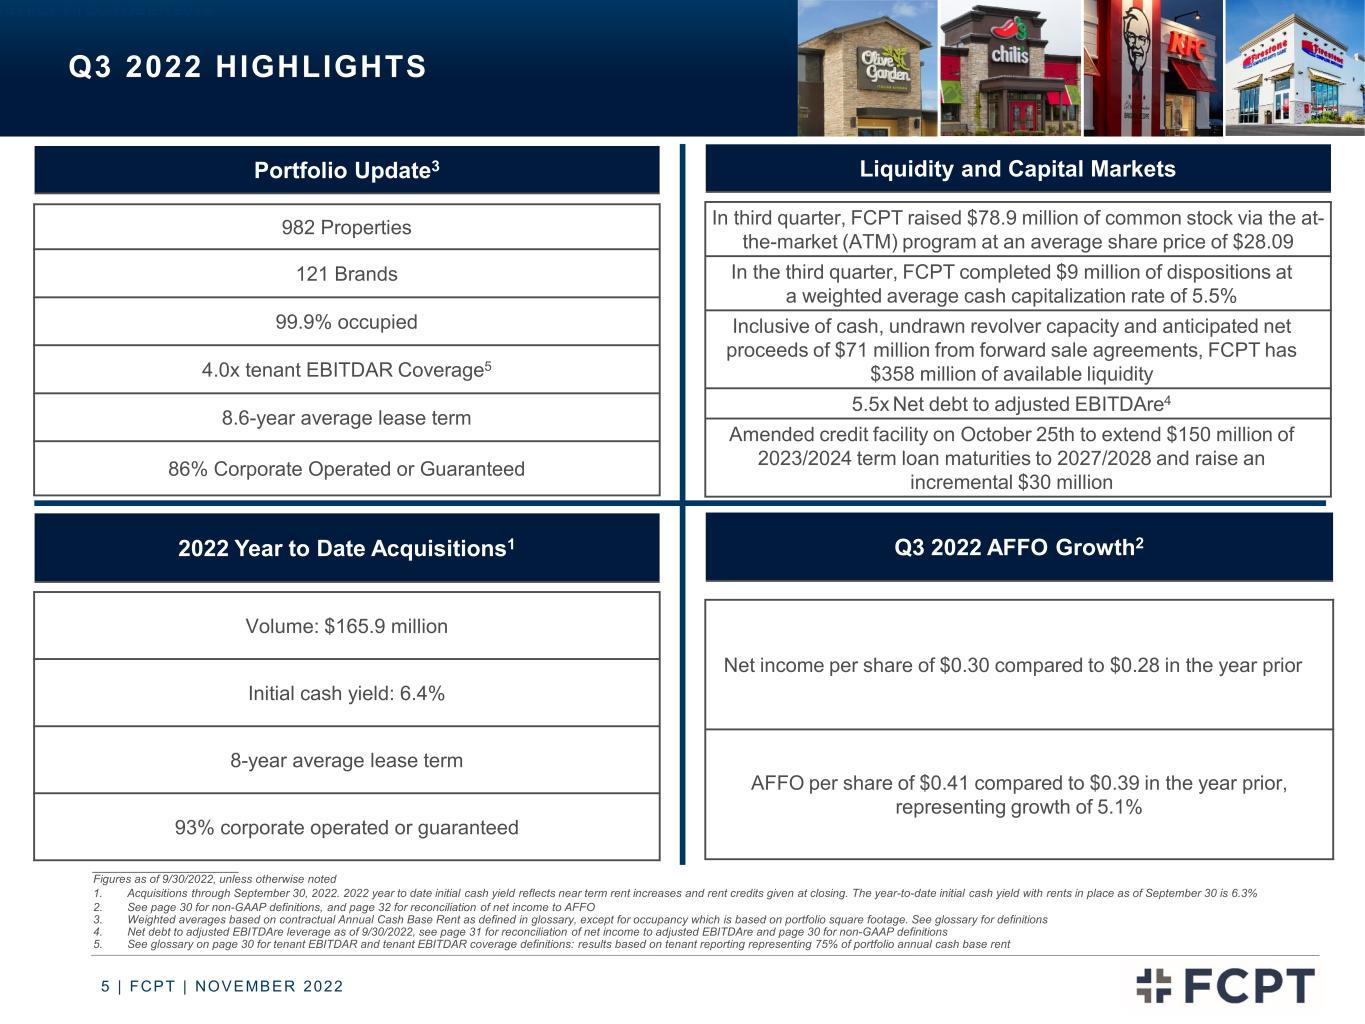
5 | FCPT | NOVEMBER 2022 Q3 2022 HIGHLIGHTS 5 | FCPT | OCTOBER 2019 ____________________ Figures as of 9/30/2022, unless otherwise noted 1. Acquisitions through September 30, 2022. 2022 year to date initial cash yield reflects near term rent increases and rent credits given at closing. The year-to-date initial cash yield with rents in place as of September 30 is 6.3% 2. See page 30 for non-GAAP definitions, and page 32 for reconciliation of net income to AFFO 3. Weighted averages based on contractual Annual Cash Base Rent as defined in glossary, except for occupancy which is based on portfolio square footage. See glossary for definitions 4. Net debt to adjusted EBITDAre leverage as of 9/30/2022, see page 31 for reconciliation of net income to adjusted EBITDAre and page 30 for non-GAAP definitions 5. See glossary on page 30 for tenant EBITDAR and tenant EBITDAR coverage definitions: results based on tenant reporting representing 75% of portfolio annual cash base rent 2022 Year to Date Acquisitions1 Volume: $165.9 million Initial cash yield: 6.4% 8-year average lease term 93% corporate operated or guaranteed Liquidity and Capital Markets In third quarter, FCPT raised $78.9 million of common stock via the at- the-market (ATM) program at an average share price of $28.09 In the third quarter, FCPT completed $9 million of dispositions at a weighted average cash capitalization rate of 5.5% Inclusive of cash, undrawn revolver capacity and anticipated net proceeds of $71 million from forward sale agreements, FCPT has $358 million of available liquidity 5.5x Net debt to adjusted EBITDAre4 Amended credit facility on October 25th to extend $150 million of 2023/2024 term loan maturities to 2027/2028 and raise an incremental $30 million Q3 2022 AFFO Growth2 Net income per share of $0.30 compared to $0.28 in the year prior AFFO per share of $0.41 compared to $0.39 in the year prior, representing growth of 5.1% Portfolio Update3 982 Properties 121 Brands 99.9% occupied 4.0x tenant EBITDAR Coverage5 8.6-year average lease term 86% Corporate Operated or Guaranteed
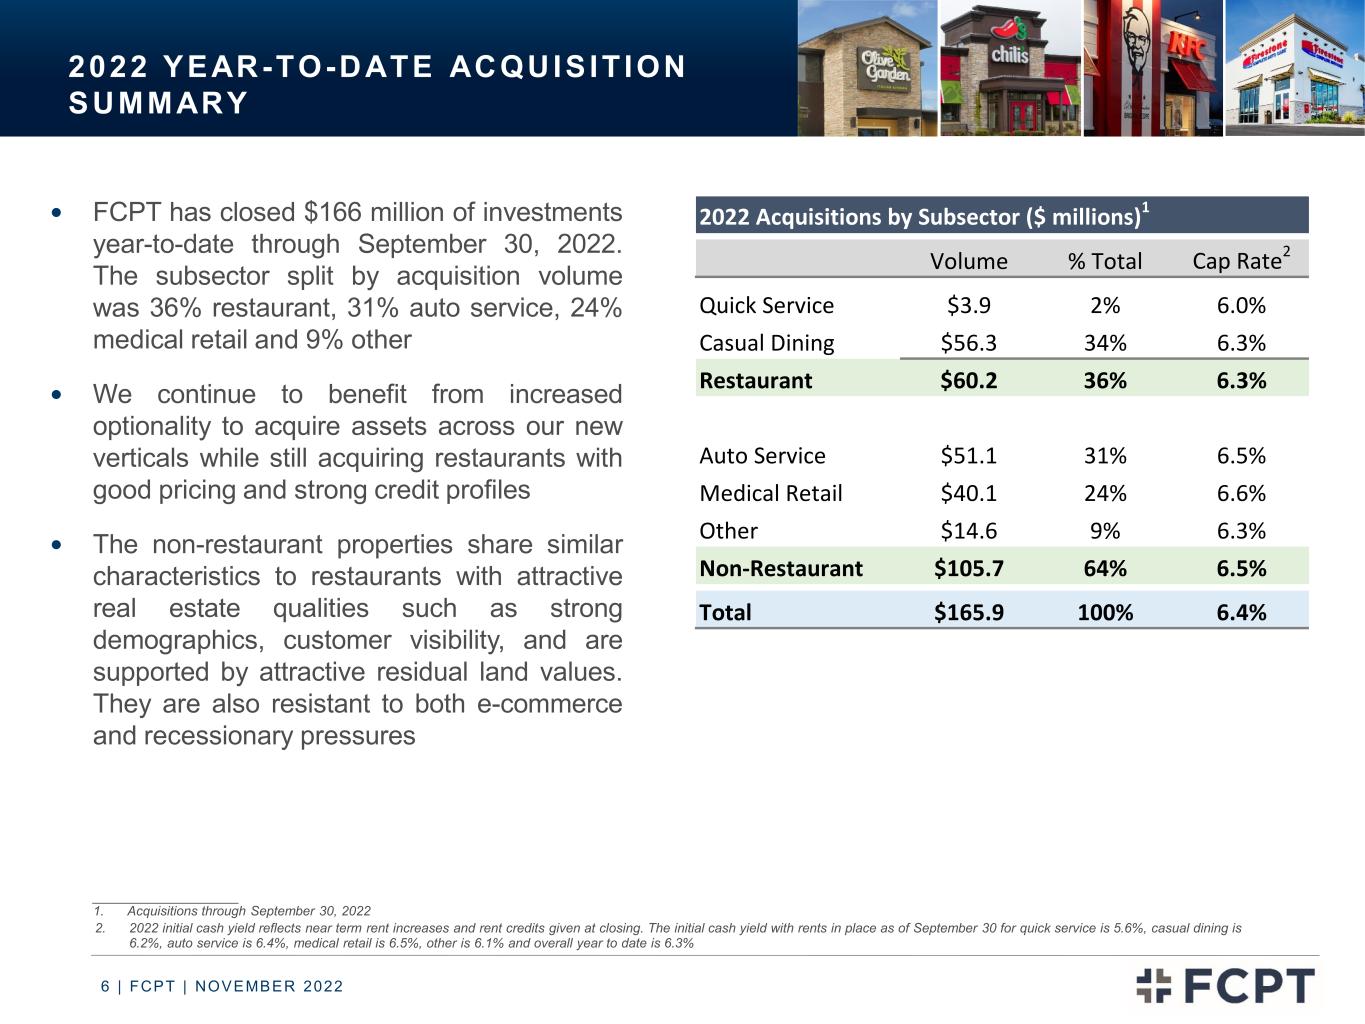
6 | FCPT | NOVEMBER 2022 2022 YEAR-TO-DATE ACQUIS IT ION SUMMARY FCPT has closed $166 million of investments year-to-date through September 30, 2022. The subsector split by acquisition volume was 36% restaurant, 31% auto service, 24% medical retail and 9% other We continue to benefit from increased optionality to acquire assets across our new verticals while still acquiring restaurants with good pricing and strong credit profiles The non-restaurant properties share similar characteristics to restaurants with attractive real estate qualities such as strong demographics, customer visibility, and are supported by attractive residual land values. They are also resistant to both e-commerce and recessionary pressures ____________________ 1. Acquisitions through September 30, 2022 2. 2022 initial cash yield reflects near term rent increases and rent credits given at closing. The initial cash yield with rents in place as of September 30 for quick service is 5.6%, casual dining is 6.2%, auto service is 6.4%, medical retail is 6.5%, other is 6.1% and overall year to date is 6.3% 2022 Acquisitions by Subsector ($ millions)1 Volume % Total Cap Rate2 Quick Service $3.9 2% 6.0% Casual Dining $56.3 34% 6.3% Restaurant $60.2 36% 6.3% Auto Service $51.1 31% 6.5% Medical Retail $40.1 24% 6.6% Other $14.6 9% 6.3% Non-Restaurant $105.7 64% 6.5% Total $165.9 100% 6.4%

7 | FCPT | NOVEMBER 2022 418 418 418 434 475 484 506 508 515 527 535 591 610 621 642 650 699 722 733 751 799 810 833 886 919 937 960 982 4Q15 1Q16 2Q16 3Q16 4Q16 1Q17 2Q17 3Q17 4Q17 1Q18 2Q18 3Q18 4Q18 1Q19 2Q19 3Q19 4Q19 1Q20 2Q20 3Q20 4Q20 1Q21 2Q21 3Q21 4Q21 1Q22 2Q22 3Q22 ACQUIS IT ION GROWTH Annual Cash Base Rent ($ million)1 7 | FCPT | OCTOBER 2019 Number of Properties . 94 94 94 96 101 102 105 105 108 109 110 121 126 127 130 131 139 142 144 148 156 158 162 169 175 178 181 185 4Q15 1Q16 2Q16 3Q16 4Q16 1Q17 2Q17 3Q17 4Q17 1Q18 2Q18 3Q18 4Q18 1Q19 2Q19 3Q19 4Q19 1Q20 2Q20 3Q20 4Q20 1Q21 2Q21 3Q21 4Q21 1Q22 2Q22 3Q22 +11% CAGR ___________________ 1. As defined on page 30 +14% CAGR
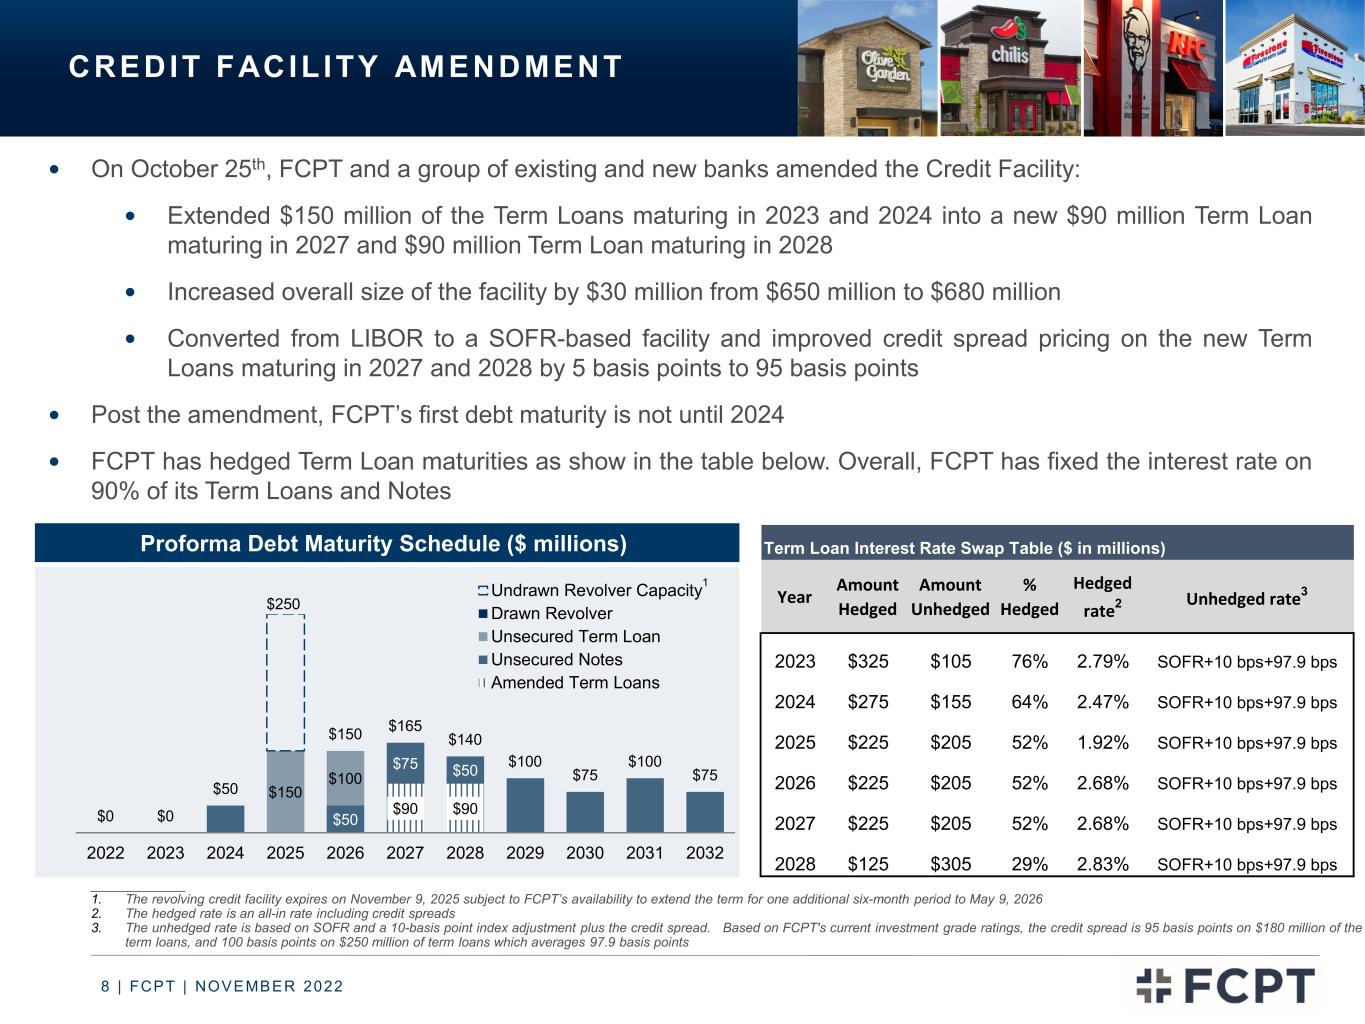
8 | FCPT | NOVEMBER 2022 On October 25th, FCPT and a group of existing and new banks amended the Credit Facility: Extended $150 million of the Term Loans maturing in 2023 and 2024 into a new $90 million Term Loan maturing in 2027 and $90 million Term Loan maturing in 2028 Increased overall size of the facility by $30 million from $650 million to $680 million Converted from LIBOR to a SOFR-based facility and improved credit spread pricing on the new Term Loans maturing in 2027 and 2028 by 5 basis points to 95 basis points Post the amendment, FCPT’s first debt maturity is not until 2024 FCPT has hedged Term Loan maturities as show in the table below. Overall, FCPT has fixed the interest rate on 90% of its Term Loans and Notes Proforma Debt Maturity Schedule ($ millions) $90 $90 $50 $75 $50 $150 $100 $250 $0 $0 $50 $150 $165 $140 $100 $75 $100 $75 2022 2023 2024 2025 2026 2027 2028 2029 2030 2031 2032 Undrawn Revolver Capacity Drawn Revolver Unsecured Term Loan Unsecured Notes Amended Term Loans CREDIT FACIL ITY AMENDMENT _____________ 1. The revolving credit facility expires on November 9, 2025 subject to FCPT’s availability to extend the term for one additional six-month period to May 9, 2026 2. The hedged rate is an all-in rate including credit spreads 3. The unhedged rate is based on SOFR and a 10-basis point index adjustment plus the credit spread. Based on FCPT's current investment grade ratings, the credit spread is 95 basis points on $180 million of the term loans, and 100 basis points on $250 million of term loans which averages 97.9 basis points 1 Term Loan Interest Rate Swap Table ($ in millions) Year Amount Hedged Amount Unhedged % Hedged Hedged rate2 Unhedged rate3 2023 $325 $105 76% 2.79% SOFR+10 bps+97.9 bps 2024 $275 $155 64% 2.47% SOFR+10 bps+97.9 bps 2025 $225 $205 52% 1.92% SOFR+10 bps+97.9 bps 2026 $225 $205 52% 2.68% SOFR+10 bps+97.9 bps 2027 $225 $205 52% 2.68% SOFR+10 bps+97.9 bps 2028 $125 $305 29% 2.83% SOFR+10 bps+97.9 bps

9 | FCPT | NOVEMBER 2022 AGENDA Restaurant Industry Update Page 14 Company Overview Page 3 Appendix and Selected Supplemental Slides Page 21 High Quality Portfolio Page 9 Conservative Financial Position Page 17

10 | FCPT | NOVEMBER 2022 FCPT’S STRONG PERFORMANCE DURING THE PANDEMIC 99.5% 98.8% 99.6% 99.6% 99.7% 99.8% 99.8% 99.8% 99.7% 99.9% 99.8% Q1 2020 Q2 2020 Q3 2020 Q4 2020 Q1 2021 Q2 2021 Q3 2021 Q4 2021 Q1 2022 Q2 2022 Q3 2022 99.6% 99.6% 99.6% 99.6% 99.7% 99.7% 99.8% 99.9% 99.9% 99.9% 99.9% Q1 2020 Q2 2020 Q3 2020 Q4 2020 Q1 2021 Q2 2021 Q3 2021 Q4 2021 Q1 2022 Q2 2022 Q3 2022 • FCPT has one of the highest-quality portfolios in the net lease sector that has performed at a high level even during the COVID-19 period ____________________ 1. FCPT reported 92% collected rent in Q2 2020, with 4% abated in return for lease modifications and 3% deferred. FCPT collected the 3% deferred rent in Q4 2020. The 98.8% number above included deferred rent that was paid and the abated rent for which FCPT received beneficial lease modifications 2. Occupancy based on portfolio square footage Occupancy2 Rent Collections 1

11 | FCPT | NOVEMBER 2022 ___________________ Figures as of 9/30/2022 1. Annual Cash Base Rent (ABR) as defined on page 30 2. Sun Belt States include AZ, NM, OK,TX, MS, AL, GA, SC, NC, TN, AR, LA, FL, southern CA, and southern NV 3. Source: U-Haul growth index 2021 Annualized Base Rent1 (%) ≥10.0% 5.0%–10.0% 3.0%–5.0% 2.0%–3.0% 1.0 %–2.0% <1.0% No Properties FCPT’s portfolio is primarily suburban and located in fast-growing regions of the Sun Belt, which makes up approximately 49%2 of the portfolio by ABR Texas and Florida, our largest two states which each represent 10% of ABR, were the two highest in-migration states in 20213 MN SD NJ OHINIL VT NHID AL AZ AR CA CO CT DE FL GA IA KS KY LA ME MD MA MI MS MO MT NE NV NM NY NC ND OK OR PA RI SC TN TX UT VA WA WV WI WY Lower taxes, the pandemic, and a shift toward work-from-home has accelerated a shift toward low-cost of living and high-quality of life states, especially in the warm weather climates of the Sun Belt SUN BELT FOCUSED PORTFOLIO 49%

12 | FCPT | NOVEMBER 2022 Building and Ground Lease: 35% 426 leases Darden Spin Portfolio: 54% 410 leases Ground Lease: 11% 162 leases ___________________ 1. See glossary on page 30 for tenant EBITDAR and tenant EBITDAR coverage definitions: results based on tenant reporting representing 75% of portfolio annual cash base rent. Reporting for non- restaurant sector not included as most non-restaurant tenants do not report financial data. We have estimated Darden current EBITDAR coverage using sales results for the reported FCPT portfolio for the year ending May 2022 and updated total Darden brand average for the quarter ending August 2022 2. Represents current Annual Cash Base Rent (ABR) as of 9/30/2022, as defined on page 30 104 leases 300 leases 14 leases FCPT Portfolio2: FCPT’s portfolio is characterized by low rents and high EBITDAR to rent coverage of over 4.0x1 54% of the portfolio is the original Darden spin properties where rents were purposely set low as evidenced by strong EBITDAR to rent coverage of 4.7x. Current rent to sales, a metric that is commonly used to gauge the health of a restaurant’s operation and the level of rent those operations can support, is approximately 5% for the Darden portfolio. It is common to see restaurants with 8% to 10% rent to sales figures FCPT has also acquired properties with ground leases equal to 11% of the portfolio. These leases are characterized by low rents tied to the land value since the tenant constructed and owns the building. The building ownership typically reverts to FCPT at the end of the lease Because of its relatively recent inception, FCPT does not have “legacy assets” that have been impacted by modern retail trends such as Amazon and the adoption of smart phones Tenant Rental Coverage1: 4.7x 2.7x 4.0x Darden Other Reporting Tenants Total Reporting Tenants LOW RENT / H IGH COVERAGE PORTFOLIO
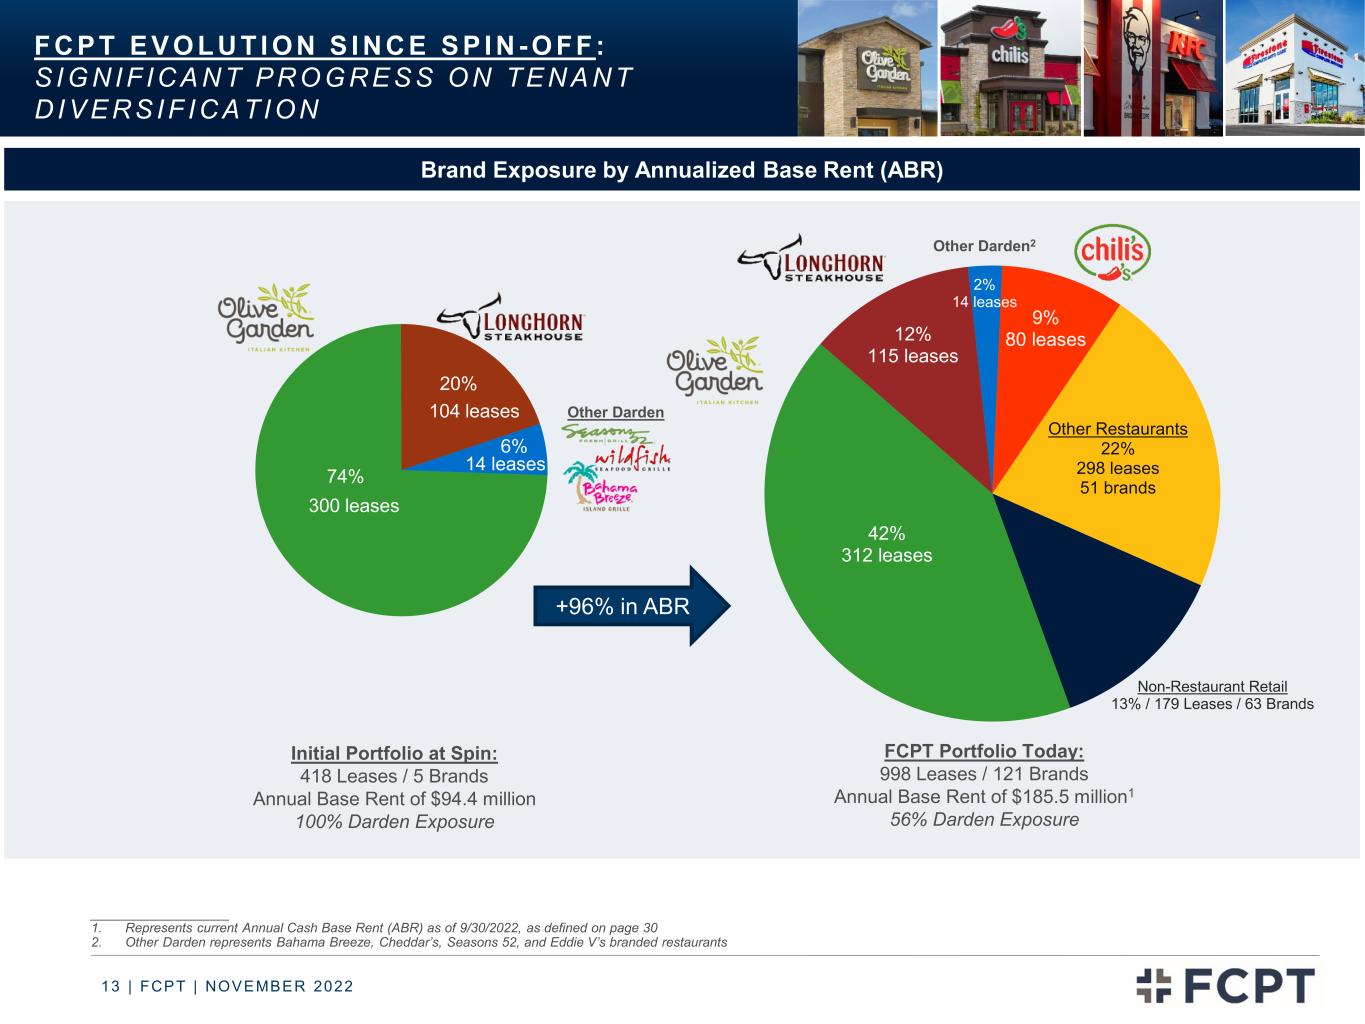
13 | FCPT | NOVEMBER 2022 F C P T E V O L U T I ON S I N C E S P I N - O FF : S I G N I F I C A N T P R O G R E S S O N T E N A N T D I V E R S I F I C A TI ON ___________________ 1. Represents current Annual Cash Base Rent (ABR) as of 9/30/2022, as defined on page 30 2. Other Darden represents Bahama Breeze, Cheddar’s, Seasons 52, and Eddie V’s branded restaurants 74% 20% 6% Initial Portfolio at Spin: 418 Leases / 5 Brands Annual Base Rent of $94.4 million 100% Darden Exposure 104 leases 300 leases 14 leases FCPT Portfolio Today: 998 Leases / 121 Brands Annual Base Rent of $185.5 million1 56% Darden Exposure +96% in ABR 42% 312 leases 12% 115 leases 2% 14 leases 9% 80 leases Other Restaurants 22% 298 leases 51 brands Non-Restaurant Retail 13% / 179 Leases / 63 Brands Other Darden2 Other Darden Brand Exposure by Annualized Base Rent (ABR)

14 | FCPT | NOVEMBER 2022 AGENDA Restaurant Industry Update Page 14 Company Overview Page 3 Appendix and Selected Supplemental Slides Page 21 High Quality Portfolio Page 9 Conservative Financial Position Page 17

15 | FCPT | NOVEMBER 2022 • Inflation for food at home/grocery has outpaced food away from home/restaurant inflation for 12 consecutive months, with the gap between the two categories widening to 4.9% for September ____________________ Sources: R.W. Baird & Co. Equity Research report 10/13/2022, Bureau of Labor Statistics, USDA Note: Results shown may not be indicative of the ability or willingness of our tenants to pay rent on a timely basis or at all FOOD INFLATION Food Away From Home vs. Food At Home Inflation
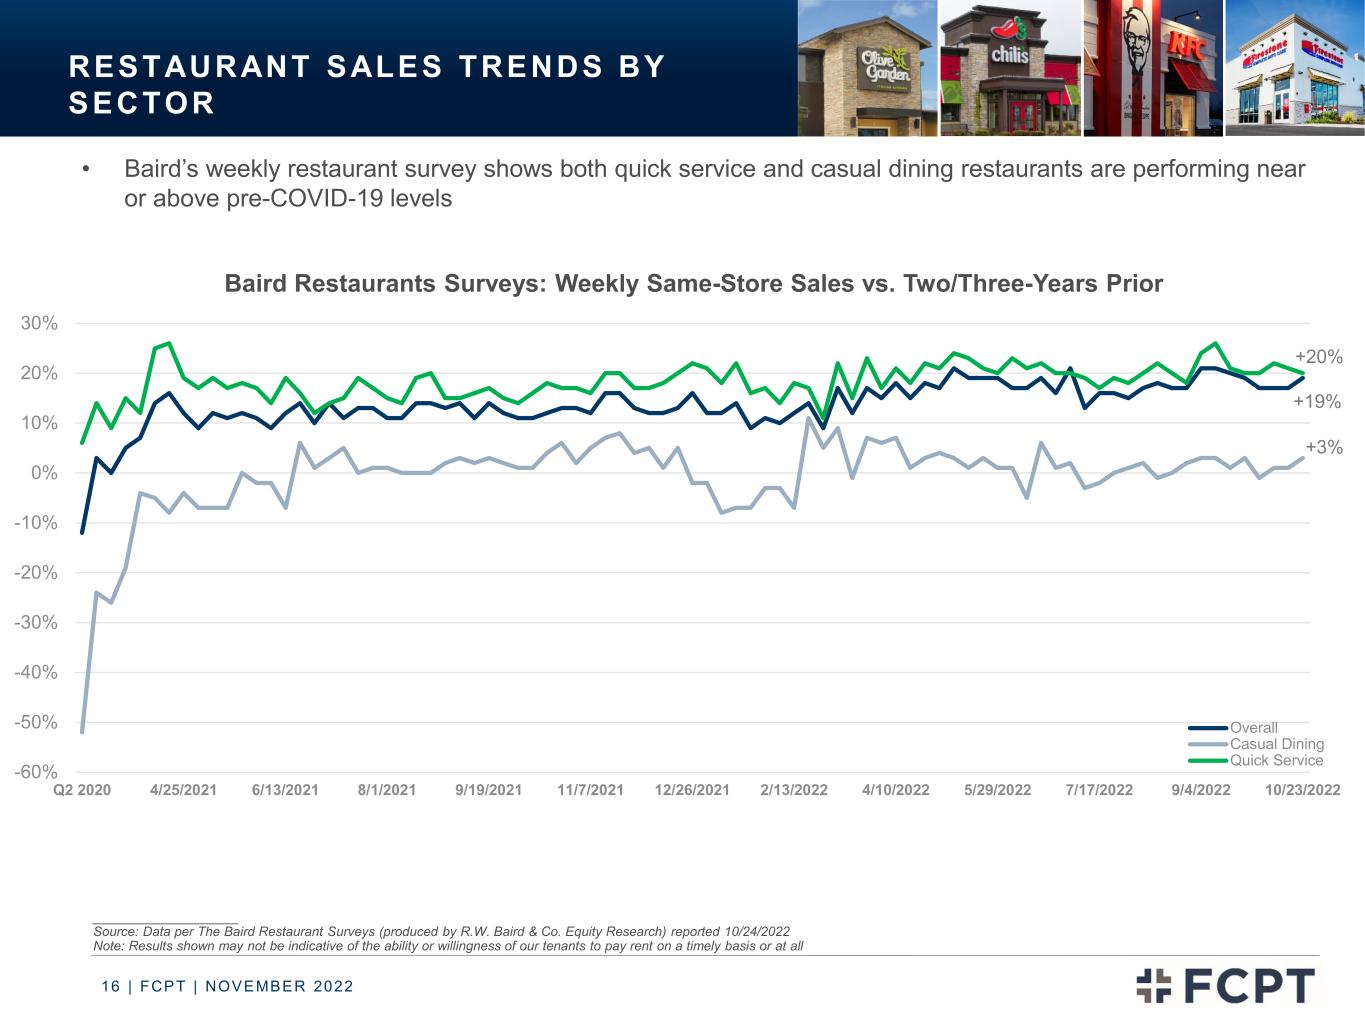
16 | FCPT | NOVEMBER 2022 • Baird’s weekly restaurant survey shows both quick service and casual dining restaurants are performing near or above pre-COVID-19 levels Baird Restaurants Surveys: Weekly Same-Store Sales vs. Two/Three-Years Prior ____________________ Source: Data per The Baird Restaurant Surveys (produced by R.W. Baird & Co. Equity Research) reported 10/24/2022 Note: Results shown may not be indicative of the ability or willingness of our tenants to pay rent on a timely basis or at all +19% +3% +20% -60% -50% -40% -30% -20% -10% 0% 10% 20% 30% Q2 2020 4/25/2021 6/13/2021 8/1/2021 9/19/2021 11/7/2021 12/26/2021 2/13/2022 4/10/2022 5/29/2022 7/17/2022 9/4/2022 10/23/2022 Overall Casual Dining Quick Service RESTAURANT SALES TRENDS BY SECTOR

17 | FCPT | NOVEMBER 2022 AGENDA Restaurant Industry Update Page 14 Company Overview Page 3 Appendix and Selected Supplemental Slides Page 21 High Quality Portfolio Page 9 Conservative Financial Position Page 17

18 | FCPT | NOVEMBER 2022 CONSERVATIVE F INANCIAL POLICIES As FCPT continues to grow and diversify, the Company is committed to maintaining a conservative balance sheet with financial flexibility Leverage Continue to maintain conservative leverage and coverage metrics Net debt to cash EBITDA ratio is 5.5x1; long-term objective is to maintain ratio below 5.5-6.0x Fixed charge coverage of 4.9x Focus on a predominantly unsecured capital structure, maintaining a large unencumbered assets base Asset base is 100% unencumbered Minimize floating rate exposure As of 9/30/2022, 87.5% of $400 million term loans is currently fixed via forward swaps with reduced amounts in place through 2028 Maintain a staggered debt maturity schedule with no near-term debt maturities No more than 15% of total debt is due in any one year Liquidity Strong liquidity profile ($250 million revolver with full available capacity as of 9/30/2022) Maintain access to multiple equity and debt capital sources Conservative dividend payout ratio of approximately 80% of AFFO Conservative Financial Policies are Sacrosanct Conservative leverage and high coverage significantly mitigate tenant concentration We access the equity markets to support growth but have been capitalized to succeed even if equity capital is not available (reasonable leverage, no earning or acquisition guidance, low G&A overhead, strong currency in dispositions of existing assets) _ Note: All figures as of 9/30/2022 unless otherwise noted 1. Net debt to adjusted EBITDAre leverage as of 9/30/2022, see page 31 for reconciliation of net income to adjusted EBITDAre and page 30 for non-GAAP definitions

19 | FCPT | NOVEMBER 2022 COM PAN Y MOM ENTUM SINCE INCEPTION Team Members 4 +30 34 Annual Base Rent1 $94.4 million +$91.1 million / +96% $185.5 million Properties 418 +564 / +135% 982 Brands 5 +116 121 % Darden2 100% -44% 56% Weighted Average Lease Term 15 years - 6.4 years 8.6 years Equity Market Cap $848 million +$1.2 billion $2.0 billion3 Enterprise Value $1.3 billion +$1.6 billion $2.9 billion3 Financial Leverage 4.6x +0.9x 5.5x3 Rating Unrated BBB (Fitch) / Baa3 (Moody’s) As of 9/30/2022November 2015 ____________________ 1. Annual Cash Base Rent (ABR) as defined on page 30 2. Based on Annual Base Rent 3. See page 20 for calculation Restaurant Non-Restaurant Representative Brands

20 | FCPT | NOVEMBER 2022 ___________________ Figures represent FCPT financials as of and for three months ended 9/30/2022 1. Represents Q3 2022 annualized results. See page 31 for reconciliation of net income to adjusted EBITDAre and page 30 for non-GAAP definitions 2. Figure represents Annual Cash Base Rent (ABR) as of 9/30/2022 3. Based on quarterly cash dividend of $0.3325 per share declared on 9/16/2022 annualized. The declaration of future dividends will be at the discretion of FCPT’s Board of Directors 4. Dividend yield calculated based on the price per share as of 9/30/2022 and declared dividend per share for the most recent quarter, annualized 5. Net debt figure (in $ millions) represents total debt ($975 million) less cash and cash equivalents ($37 million) as of 9/30/2022 SUMMARY CAPITALIZATION AND F INANCIALS Capitalization ($ million, except per share) Share price (9/30/2022) $24.19 Shares and OP units outstanding (millions) 82.9 Equity value $2,006 Debt: Bank term debt $400 Revolving credit facility $0 Unsecured private notes $575 Total market capitalization $2,981 Less: Cash and cash equivalents ($37) Implied enterprise Value $2,945 Credit Metrics Current Net debt5 to enterprise value 31.9% Net debt5 to adjusted EBITDAre1 5.5x Current Trading Metrics Annual base rent2 ($ million) $185.5 Implied Cap Rate 6.2% Annualized Dividend per share3 $1.33 Dividend Yield3,4 5.5%

21 | FCPT | NOVEMBER 2022 AGENDA Restaurant Industry Update Page 14 Company Overview Page 3 Appendix and Selected Supplemental Slides Page 21 High Quality Portfolio Page 9 Conservative Financial Position Page 17
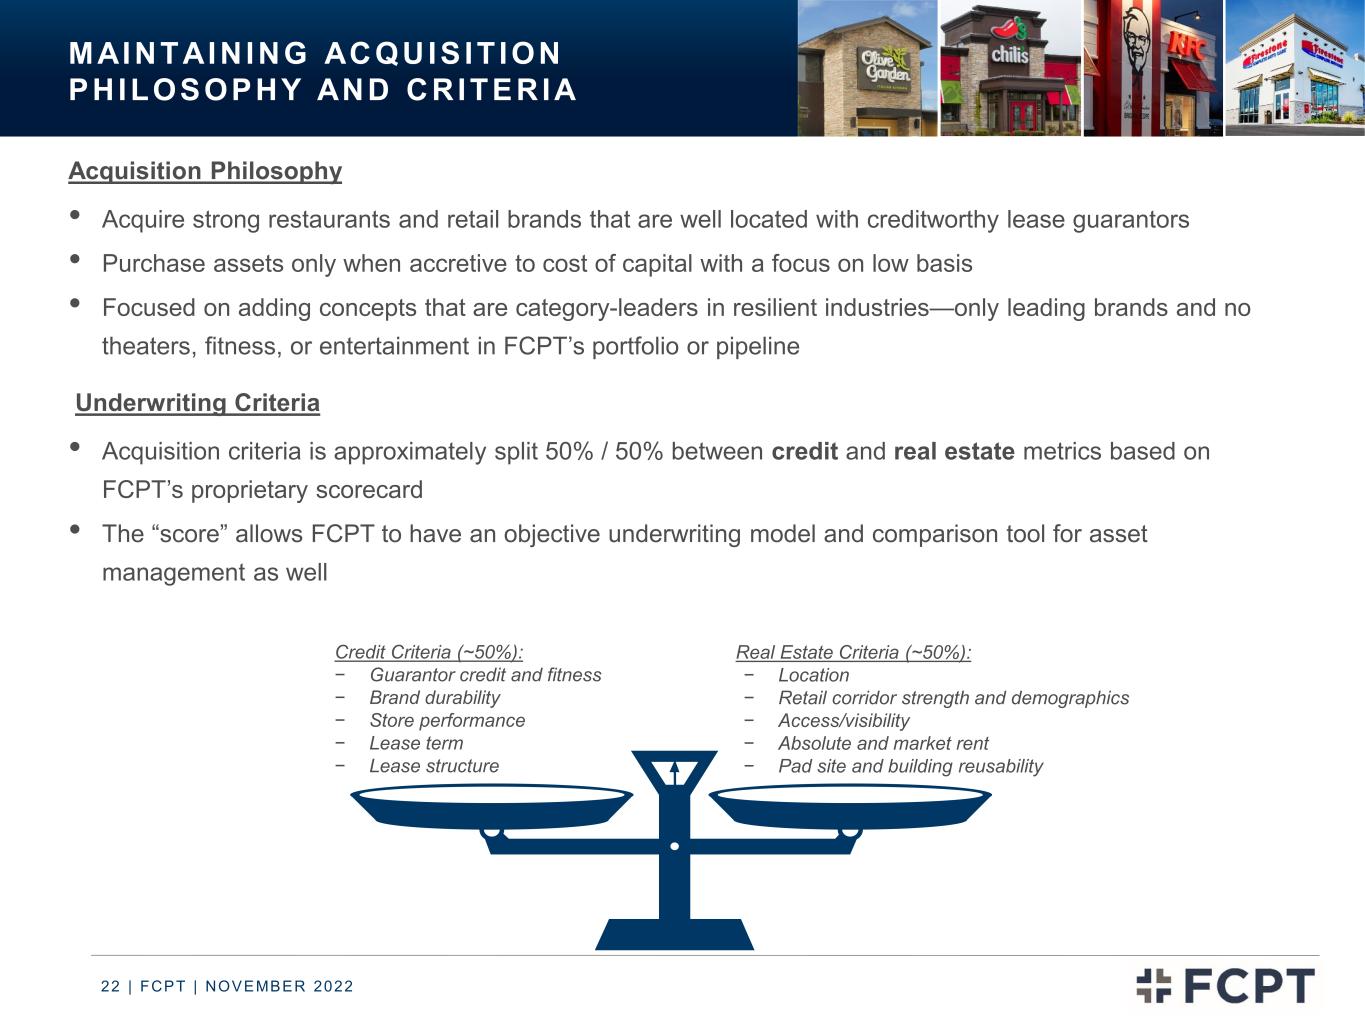
22 | FCPT | NOVEMBER 2022 MAINTAINING ACQUIS IT ION PHILOSOPHY AND CRITERIA Acquisition Philosophy • Acquire strong restaurants and retail brands that are well located with creditworthy lease guarantors • Purchase assets only when accretive to cost of capital with a focus on low basis • Focused on adding concepts that are category-leaders in resilient industries—only leading brands and no theaters, fitness, or entertainment in FCPT’s portfolio or pipeline Underwriting Criteria • Acquisition criteria is approximately split 50% / 50% between credit and real estate metrics based on FCPT’s proprietary scorecard • The “score” allows FCPT to have an objective underwriting model and comparison tool for asset management as well Real Estate Criteria (~50%): − Location − Retail corridor strength and demographics − Access/visibility − Absolute and market rent − Pad site and building reusability Credit Criteria (~50%): − Guarantor credit and fitness − Brand durability − Store performance − Lease term − Lease structure

23 | FCPT | NOVEMBER 2022 ACQUIS IT IONS BY YEAR Note: Figures exclude capitalized transaction costs. Initial cash yield calculation excludes $2.1 million, and $2.4 million of real estate purchases in our Kerrow operating business for 2019 and 2020, respectively and 2022 YTD initial cash yield reflects near term rent increases and rent credits given at closing; the initial cash yield with rents in place as of September 30 is 6.3% year to date 982 919 799 699 610 515475 418 2022 YTD +$166 6.4% 2021 +$257 6.5% 2020 +$223 6.5% 2019 +$199 6.5% 2018 +$263 6.5% 2017 +$99 6.8% 2016 +$94 6.6% 2015 Spin - Year Volume ($ millions) Cap Rate FCPT has been built deliberately with a focus on consistency and efficient execution Property Count
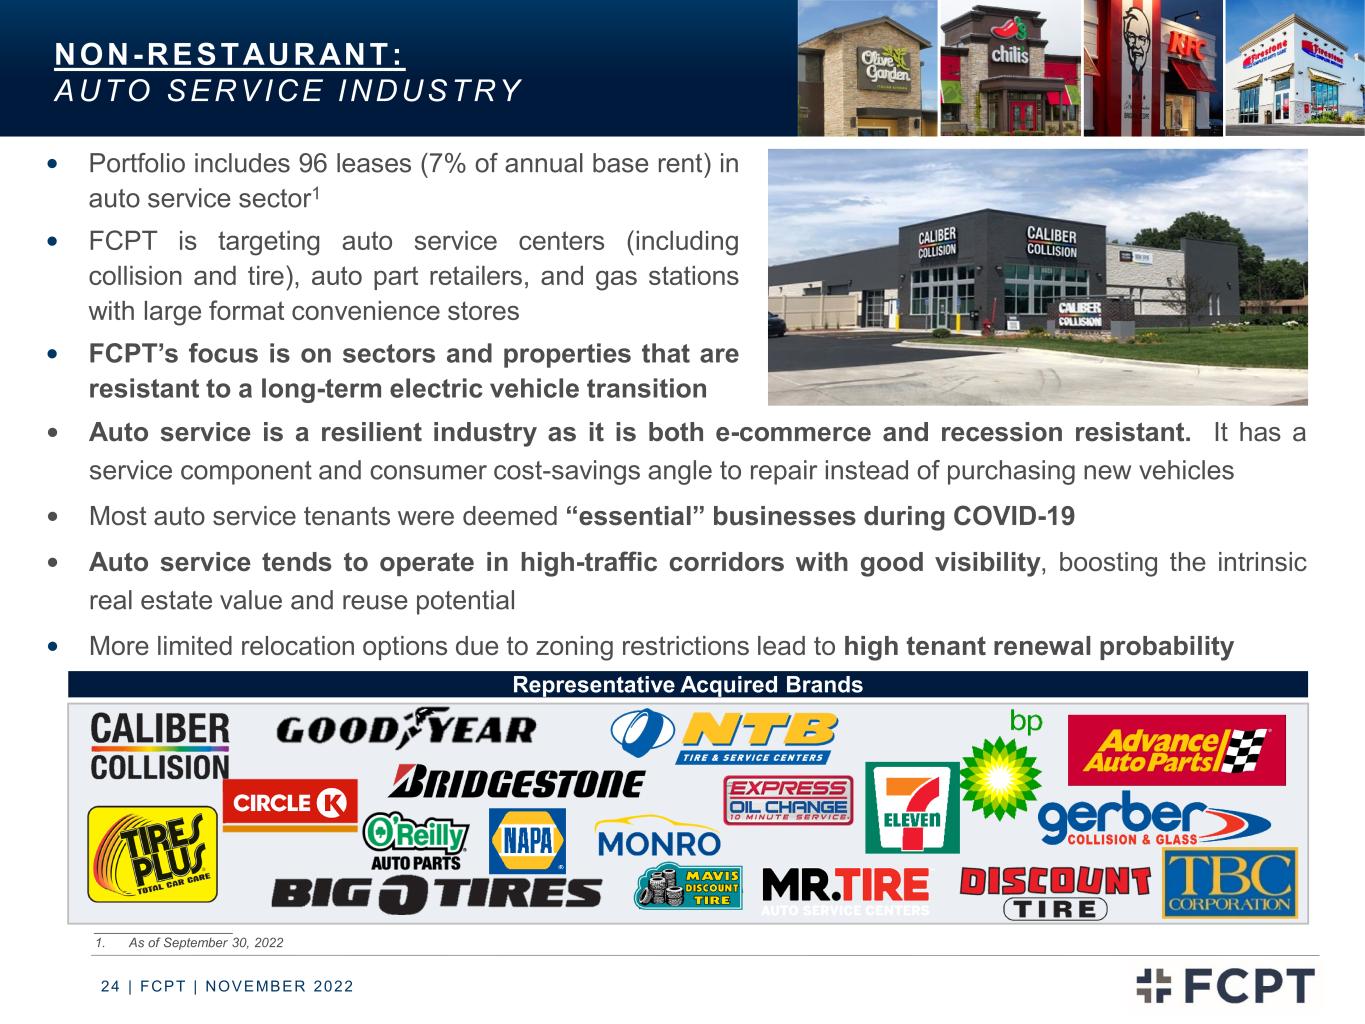
24 | FCPT | NOVEMBER 2022 Auto service is a resilient industry as it is both e-commerce and recession resistant. It has a service component and consumer cost-savings angle to repair instead of purchasing new vehicles Most auto service tenants were deemed “essential” businesses during COVID-19 Auto service tends to operate in high-traffic corridors with good visibility, boosting the intrinsic real estate value and reuse potential More limited relocation options due to zoning restrictions lead to high tenant renewal probability Representative Acquired Brands Portfolio includes 96 leases (7% of annual base rent) in auto service sector1 FCPT is targeting auto service centers (including collision and tire), auto part retailers, and gas stations with large format convenience stores FCPT’s focus is on sectors and properties that are resistant to a long-term electric vehicle transition NON-RESTAURANT: AUTO SERVICE INDUSTRY ___________________ 1. As of September 30, 2022

25 | FCPT | NOVEMBER 2022 Representative Acquired Brands NON-RESTAURANT: MEDICAL RETAIL INDUSTRY Portfolio includes 37 leases (3% of annual base rent)1 FCPT targets medical retail locations such as urgent care, dental clinics, dialysis centers, and veterinary care E-commerce and recession resistant industry given its service- based nature Deemed “essential” businesses during COVID-19 Large opportunity for growth with rapid spending increases on healthcare and pets – The number of urgent care centers has grown 52% since 20132 – Spending on pets has grown 14.7% since 20183 Medical net-lease opportunities are increasing given credit upgrades and store count growth that comes with consolidation amongst regional and national operators to take advantage of shared resources and costs Site selection process is similar to that of branded restaurants for both chain dental and urgent care clinics boosting intrinsic real estate value and reuse potential Large customer base as healthcare remains an essential service across lifespan Favorable demographic tailwinds with both the aging of baby boomers and increased pet ownership ___________________ 1. As of September 30, 2022 2. Source: Urgent Care Association 3. Source: American Pet Products Association 2021 State of the Industry

26 | FCPT | NOVEMBER 2022 0.0% 0.8% 2.4% 2.2% 2.6% 13.7% 12.7% 10.7%10.8%10.5% 6.5% 13.4% 1.5% 1.7% 2.9% 1.4% 0.1% 0.4% 1.6% 0.9% 0.5% 0.0% 2.5% 2022 2023 2024 2025 2026 2027 2028 2029 2030 2031 2032 2033 2034 2035 2036 2037 2038 2039 2040 2041 2042 2043 2044 LEASE MATURITY SCHEDULE ___________________ Note: Excludes renewal options. All data as of 9/30/2022 1. Annual cash base rent (ABR) as defined in glossary 2. Occupancy based on portfolio square footage Lease Maturity Schedule (% Annualized Cash Base Rent1) 99.9% occupied2 as of 9/30/2022 Weighted average lease term of 8.6 years Less than 8.0% of rental income matures prior to 2027

27 | FCPT | NOVEMBER 2022 FCPT Portfolio Brands Rank Brand Name Number Square Feet (000s) % of ABR(1) Rank Brand Name Number Square Feet (000s) % of ABR(1) 1 Olive Garden 312 2,654 41.9% 16 Starbucks 13 29 0.7% 2 Longhorn Steakhouse 115 645 11.9% 17 NAPA Auto Parts 13 92 0.7% 3 Chili's 80 438 8.8% 18 Verizon 12 34 0.7% 4 Red Lobster 23 170 2.9% 19 National Tire & Battery 10 69 0.7% 5 Buffalo Wild Wings 24 148 2.3% 20 Tires Plus 10 63 0.6% 6 Burger King 23 73 1.7% 21 Taco Bell 12 31 0.6% 7 Bahama Breeze 10 92 1.7% 22 Chick-Fil-A 8 39 0.5% 8 KFC 33 95 1.7% 23 REI 2 48 0.5% 9 BJ's Restaurant 12 98 1.5% 24 Firestone 4 32 0.5% 10 Bob Evans 15 83 1.4% 25 Wendy's 7 24 0.4% 11 Caliber Collision 21 270 1.2% 26-121 Other 191 925 13.3% 12 Outback Steakhouse 12 81 1.0% Total Lease Portfolio 998 6,436 100% 13 Arby's 16 50 0.9% 14 Texas Roadhouse 11 81 0.8% 15 Fresenius 9 72 0.8% BRAND DIVERSIF ICATION ___________________ 1. Annual Cash Base Rent (ABR) as of 9/30/2022 as defined on page 30 2. Investment Grade Ratings represent the credit rating of our tenants, their subsidiaries or affiliated companies from Fitch, S&P or Moody's % Investment Grade2: 62%

28 | FCPT | NOVEMBER 2022 SUSTAINABIL ITY FRAMEWORK Our commitment to sustainability and Environmental, Social and Governance (ESG) principles creates value for FCPT and our shareholders. We continuously review our internal policies to advance in the areas of environmental sustainability, social responsibility, employee well-being, and governance Social We apply values-based negative screening in our underwriting process and do not transact with any tenant, buyer, or seller or acquire any properties with negative social factors. We do not process or have access to any consumer data Governance We aim for best-in-class corporate governance structures and compensation practices that closely align the interests of our board and leadership with those of our stockholders. Three of our seven board directors are female and six are independent, including our chairperson. Only independent directors serve on the board’s committees Our Team Our culture is inclusive and team-oriented with a high retention rate. We hire for the long-term and invest in development, with a flat organization that drives employee engagement. We are ‘A Great Place to Work’ certified company Environment We evaluate our business operations and the environmental risk aspects of our investment portfolio on an ongoing basis and strive to adhere to sustainable business practices More information can be found in the FCPT 2021 ESG Report on our website at https://fcpt.com/about-us/

29 | FCPT | NOVEMBER 2022 2022 YEAR TO DATE ACQUIS IT IONS 1. Totals indicate weighted average 2. Q2 and Q3 2022 initial cash yield reflects near term rent increases and rent credits given at closing. The initial cash yield with rents in place as of September 30 is 6.1% for the second quarter, 6.2% for the third quarter and 6.3% year to date 2022 Closed Acquisitions # of Properties Purchase Price ($ millions) Initial Cash Yield2 Initial Term (years)1 Q1 2022 Summary: 18 $42.0 6.7% 8 Q2 2022 Summary: 26 $54.0 6.4% 6 Q3 2022 Closed Acquisitions: Tenant Location # of Properties Operator / Guarantor Purchase Price ($ millions) Initial Cash Yield Initial Term (years)1 Announcement Date Thrive Pet Healthcare IL 1 Corporate $12.5 -- 15 7/8/2022 Caliber Collision MI 1 Corporate $1.1 6.6% 9 7/12/2022 Advance Auto Parts IL 1 Corporate $2.3 6.3% -- 7/12/2022 Advance Auto Parts MI 1 Corporate $0.9 7.2% 3 7/15/2022 Outback Steakhouse IN 1 Corporate $2.3 6.8% 4 7/22/2022 VCA IN 1 Corporate $1.0 7.3% 4 7/27/2022 PREIT: Capital One / Chuck E. Cheese MD, SC 2 Corporate $3.3 -- -- 8/5/2022 Buffalo Wild Wings IL 1 Corporate $2.3 6.3% 3 8/8/2022 Mr. Tire NJ 1 Corporate $1.2 6.5% 10 8/12/2022 National Tire & Battery NC 2 Corporate $2.8 6.1% 7 8/30/2022 Outparcel: IHOP, Taco Bell, AT&T, BJ's, Krispy Kreme, Hook & Reel TX 6 5 Corporate, 1 Franchisee $14.0 -- 4 8/31/2022 Caliber Collision MI 1 Corporate $0.9 -- 9 9/9/2022 Circle K / Firestone IL 2 Corporate $6.5 7.0% 5 9/15/2022 PREIT: Miller's Ale House, Olive Garden, Outback Steakhouse MD 3 Corporate $8.5 -- 8 9/15/2022 Buffalo Wild Wings NJ 2 Franchisee $10.2 6.4% 20 9/26/2022 Q3 2022 Total/Weighted Average 26 $69.9 6.3% 9 2022 YTD Total/Weighted Average 70 $165.9 6.4% 8
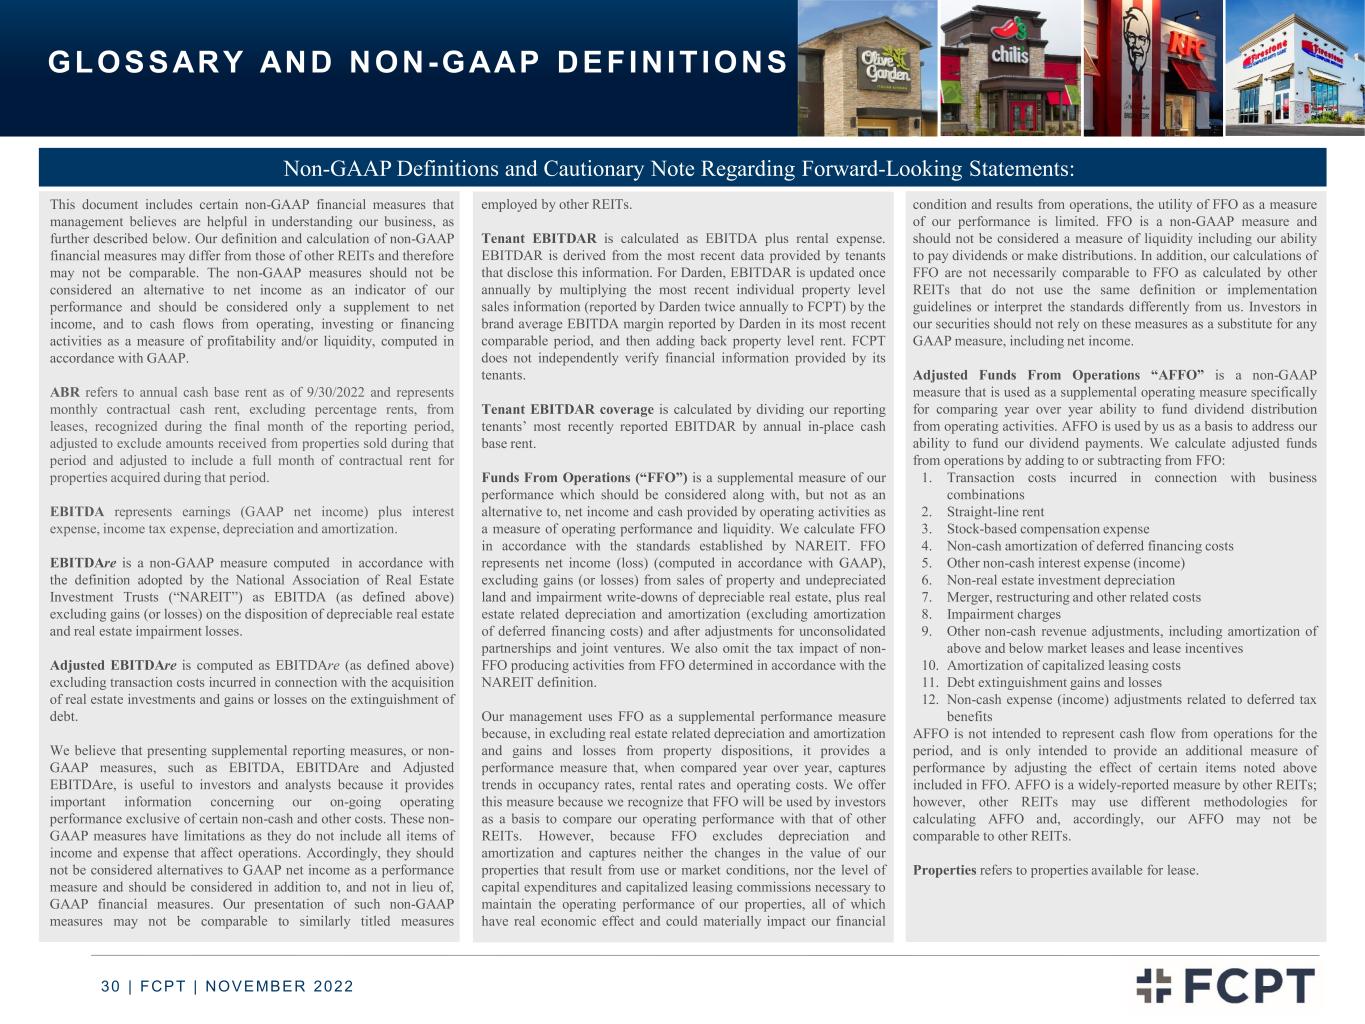
30 | FCPT | NOVEMBER 2022 GLOSSARY AND NON-GAAP DEFINIT IONS This document includes certain non-GAAP financial measures that management believes are helpful in understanding our business, as further described below. Our definition and calculation of non-GAAP financial measures may differ from those of other REITs and therefore may not be comparable. The non-GAAP measures should not be considered an alternative to net income as an indicator of our performance and should be considered only a supplement to net income, and to cash flows from operating, investing or financing activities as a measure of profitability and/or liquidity, computed in accordance with GAAP. ABR refers to annual cash base rent as of 9/30/2022 and represents monthly contractual cash rent, excluding percentage rents, from leases, recognized during the final month of the reporting period, adjusted to exclude amounts received from properties sold during that period and adjusted to include a full month of contractual rent for properties acquired during that period. EBITDA represents earnings (GAAP net income) plus interest expense, income tax expense, depreciation and amortization. EBITDAre is a non-GAAP measure computed in accordance with the definition adopted by the National Association of Real Estate Investment Trusts (“NAREIT”) as EBITDA (as defined above) excluding gains (or losses) on the disposition of depreciable real estate and real estate impairment losses. Adjusted EBITDAre is computed as EBITDAre (as defined above) excluding transaction costs incurred in connection with the acquisition of real estate investments and gains or losses on the extinguishment of debt. We believe that presenting supplemental reporting measures, or non- GAAP measures, such as EBITDA, EBITDAre and Adjusted EBITDAre, is useful to investors and analysts because it provides important information concerning our on-going operating performance exclusive of certain non-cash and other costs. These non- GAAP measures have limitations as they do not include all items of income and expense that affect operations. Accordingly, they should not be considered alternatives to GAAP net income as a performance measure and should be considered in addition to, and not in lieu of, GAAP financial measures. Our presentation of such non-GAAP measures may not be comparable to similarly titled measures employed by other REITs. Tenant EBITDAR is calculated as EBITDA plus rental expense. EBITDAR is derived from the most recent data provided by tenants that disclose this information. For Darden, EBITDAR is updated once annually by multiplying the most recent individual property level sales information (reported by Darden twice annually to FCPT) by the brand average EBITDA margin reported by Darden in its most recent comparable period, and then adding back property level rent. FCPT does not independently verify financial information provided by its tenants. Tenant EBITDAR coverage is calculated by dividing our reporting tenants’ most recently reported EBITDAR by annual in-place cash base rent. Funds From Operations (“FFO”) is a supplemental measure of our performance which should be considered along with, but not as an alternative to, net income and cash provided by operating activities as a measure of operating performance and liquidity. We calculate FFO in accordance with the standards established by NAREIT. FFO represents net income (loss) (computed in accordance with GAAP), excluding gains (or losses) from sales of property and undepreciated land and impairment write-downs of depreciable real estate, plus real estate related depreciation and amortization (excluding amortization of deferred financing costs) and after adjustments for unconsolidated partnerships and joint ventures. We also omit the tax impact of non- FFO producing activities from FFO determined in accordance with the NAREIT definition. Our management uses FFO as a supplemental performance measure because, in excluding real estate related depreciation and amortization and gains and losses from property dispositions, it provides a performance measure that, when compared year over year, captures trends in occupancy rates, rental rates and operating costs. We offer this measure because we recognize that FFO will be used by investors as a basis to compare our operating performance with that of other REITs. However, because FFO excludes depreciation and amortization and captures neither the changes in the value of our properties that result from use or market conditions, nor the level of capital expenditures and capitalized leasing commissions necessary to maintain the operating performance of our properties, all of which have real economic effect and could materially impact our financial condition and results from operations, the utility of FFO as a measure of our performance is limited. FFO is a non-GAAP measure and should not be considered a measure of liquidity including our ability to pay dividends or make distributions. In addition, our calculations of FFO are not necessarily comparable to FFO as calculated by other REITs that do not use the same definition or implementation guidelines or interpret the standards differently from us. Investors in our securities should not rely on these measures as a substitute for any GAAP measure, including net income. Adjusted Funds From Operations “AFFO” is a non-GAAP measure that is used as a supplemental operating measure specifically for comparing year over year ability to fund dividend distribution from operating activities. AFFO is used by us as a basis to address our ability to fund our dividend payments. We calculate adjusted funds from operations by adding to or subtracting from FFO: 1. Transaction costs incurred in connection with business combinations 2. Straight-line rent 3. Stock-based compensation expense 4. Non-cash amortization of deferred financing costs 5. Other non-cash interest expense (income) 6. Non-real estate investment depreciation 7. Merger, restructuring and other related costs 8. Impairment charges 9. Other non-cash revenue adjustments, including amortization of above and below market leases and lease incentives 10. Amortization of capitalized leasing costs 11. Debt extinguishment gains and losses 12. Non-cash expense (income) adjustments related to deferred tax benefits AFFO is not intended to represent cash flow from operations for the period, and is only intended to provide an additional measure of performance by adjusting the effect of certain items noted above included in FFO. AFFO is a widely-reported measure by other REITs; however, other REITs may use different methodologies for calculating AFFO and, accordingly, our AFFO may not be comparable to other REITs. Properties refers to properties available for lease. Non-GAAP Definitions and Cautionary Note Regarding Forward-Looking Statements:

31 | FCPT | NOVEMBER 2022 RECONCIL IATION OF NET INCOME TO ADJUSTED EBITDAR E _________________________ 1. See glossary on page 30 for non-GAAP definitions ($000s, except shares and per share data) Unaudited 2022 2021 2022 2021 Net Income 24,552$ 21,208$ 75,008$ 62,010$ Adjustments: Interest expense 9,177 8,311 26,583 24,328 Income tax expense (23) 97 209 231 Depreciation and amortization 10,588 8,831 30,420 25,455 EBITDA(1) 44,294 38,447 132,220 112,024 Adjustments: Gain on dispositions and exchange of real estate (1,828) - (7,584) (431) Provision for impairment of real estate - - - - EBITDAre (1) 42,466 38,447 124,636 111,593 Adjustments: Real estate transaction costs 40 69 164 139 Gain or loss on extinguishment of debt - - - - Adjusted EBITDAre (1) 42,506 38,516 124,800 111,732 Annualized Adjusted EBITDAre 170,026$ 154,063$ 166,400$ 148,976$ Three Months Ended September 30, Nine Months Ended September 30,
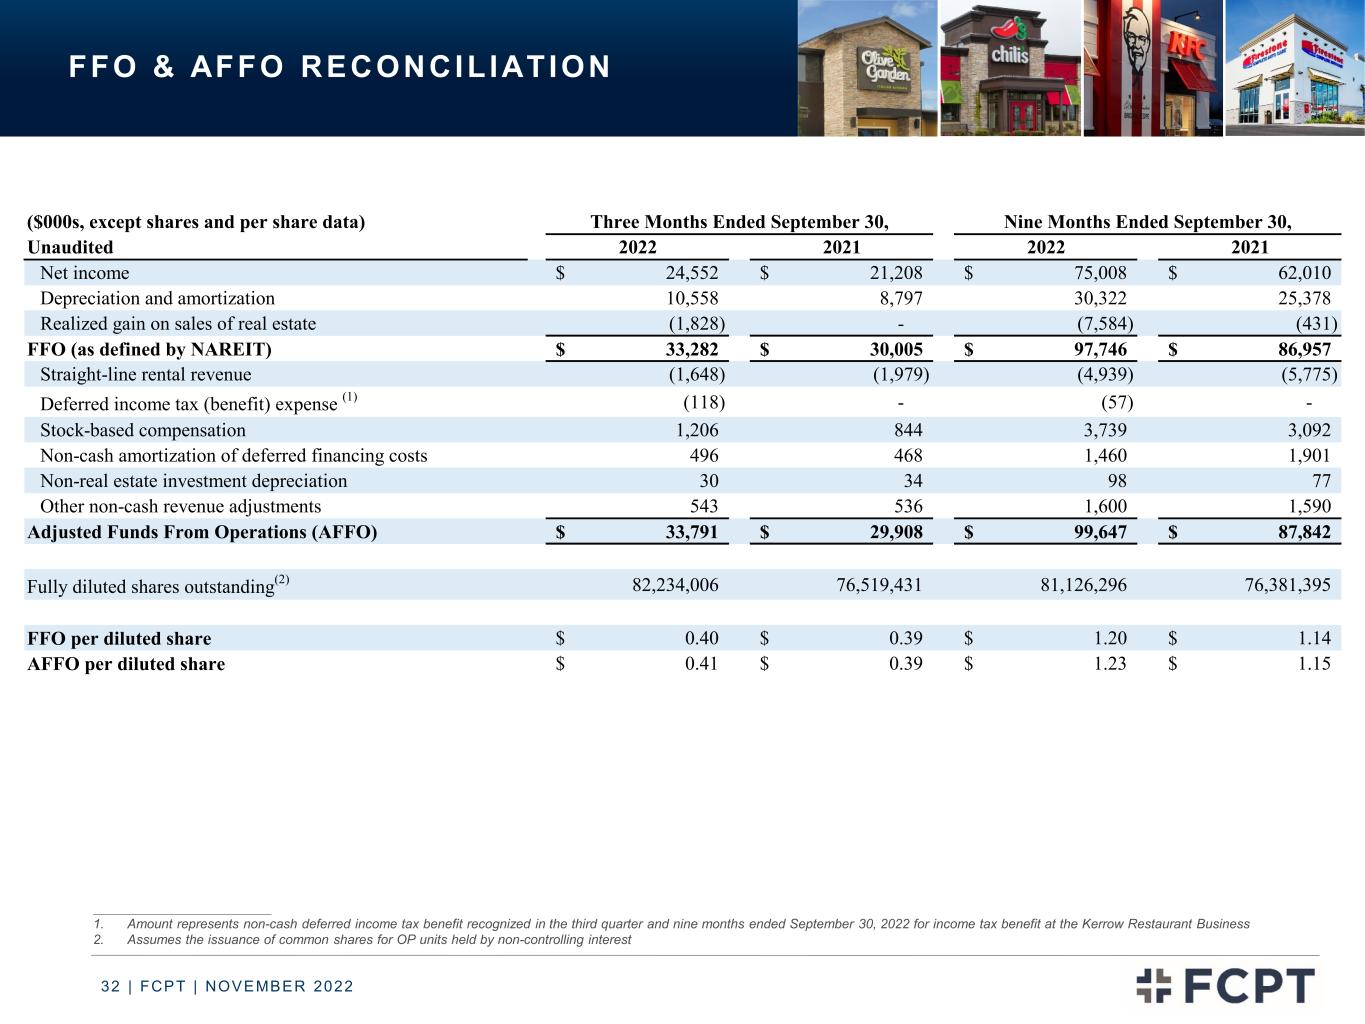
32 | FCPT | NOVEMBER 2022 FFO & AFFO RECONCIL IATION ___________________________ 1. Amount represents non-cash deferred income tax benefit recognized in the third quarter and nine months ended September 30, 2022 for income tax benefit at the Kerrow Restaurant Business 2. Assumes the issuance of common shares for OP units held by non-controlling interest ($000s, except shares and per share data) Unaudited 2022 2021 2022 2021 Net income 24,552$ 21,208$ 75,008$ 62,010$ Depreciation and amortization 10,558 8,797 30,322 25,378 Realized gain on sales of real estate (1,828) - (7,584) (431) FFO (as defined by NAREIT) 33,282$ 30,005$ 97,746$ 86,957$ Straight-line rental revenue (1,648) (1,979) (4,939) (5,775) Deferred income tax (benefit) expense (1) (118) - (57) - Stock-based compensation 1,206 844 3,739 3,092 Non-cash amortization of deferred financing costs 496 468 1,460 1,901 Non-real estate investment depreciation 30 34 98 77 Other non-cash revenue adjustments 543 536 1,600 1,590 Adjusted Funds From Operations (AFFO) 33,791$ 29,908$ 99,647$ 87,842$ Fully diluted shares outstanding(2) 82,234,006 76,519,431 81,126,296 76,381,395 FFO per diluted share 0.40$ 0.39$ 1.20$ 1.14$ AFFO per diluted share 0.41$ 0.39$ 1.23$ 1.15$ Three Months Ended September 30, Nine Months Ended September 30,

33 | FCPT | NOVEMBER 2022 www.fcpt .comINVESTOR PRESENTATION | NOVEMBER 2022 FOUR CORNERS PROPERTY TRUST N YS E : F C P T


