UNITED STATES
SECURITIES AND EXCHANGE COMMISSION
Washington, D.C. 20549
SECURITIES AND EXCHANGE COMMISSION
Washington, D.C. 20549
FORM N-CSR
CERTIFIED SHAREHOLDER REPORT OF REGISTERED
MANAGEMENT INVESTMENT COMPANIES
Investment Company Act file number 811-23084
Series Portfolios Trust
(Exact name of registrant as specified in charter)
(Exact name of registrant as specified in charter)
615 East Michigan Street
Milwaukee, WI 53202
(Address of principal executive offices) (Zip code)
(Address of principal executive offices) (Zip code)
Ryan Roell, President
Series Portfolios Trust
c/o U.S. Bancorp Fund Services, LLC
777 East Wisconsin Ave, 5th Fl
Milwaukee, WI 53202
(Name and address of agent for service)
(Name and address of agent for service)
(414) 765-6839
Registrant's telephone number, including area code
Date of fiscal year end: October 31, 2020
Date of reporting period: October 31, 2020
Item 1. Reports to Stockholders.
Weiss Alternative Balanced Risk Fund
Class K – weikx
Investor Class – weizx
Beginning on January 1, 2021, as permitted by regulations adopted by the Securities and Exchange Commission, paper copies of the Fund’s shareholder reports will no longer be sent by mail, unless you specifically request paper copies of the reports. Instead, the reports will be made available on the Fund’s website www.weissfunds.com, and you will be notified by mail each time a report is posted and provided with a website link to access the report.
If you already elected to receive shareholder reports electronically, you will not be affected by this change and you need not take any action. You may elect to receive shareholder reports and other communications from the Fund electronically by contacting your financial intermediary (such as a broker-dealer or bank) or, if you are a direct investor, by calling 866-530-2690 or by sending an email request to investorrelations@gweiss.com.
You may elect to receive all future reports in paper free of charge. If you invest through a financial intermediary, you can contact your financial intermediary to request that you continue to receive paper copies of your shareholder reports. If you invest directly with the Fund, you can call 866-530-2690 or send an email request to investorrelations@gweiss.com to let the Fund know you wish to continue receiving paper copies of your shareholder reports. Your election to receive reports in paper will apply to all funds held in your account if you invest through your financial intermediary.
Annual Report
October 31, 2020
WEISS ALTERNATIVE BALANCED RISK FUND
Dear Shareholders:
The Weiss Alternative Balanced Risk Fund (the “Fund”) is our multi-asset class solution seeking to offer superior liquidity, improved relative returns, and moderate volatility consistent with the expectations of fixed income investors. The Fund utilizes a dynamic, risk-weighted asset allocation in an effort to create a balanced portfolio that is optimized for a variety of market climates, and with a lower correlation to traditional fixed income and equity asset classes. The portfolio consists of investments in three diversified asset classes, including equities, fixed income, and an allocation to market neutral strategies designed to attempt to generate uncorrelated alpha.
| • | Mutual Fund Performance Review |
| o | Annual Performance Review, including portfolio attribution |
| • | For the full fiscal year ending October 31, 2020, the Weiss Alternative Balanced Risk Fund (“Weiss ABR”) turned in an admirable result with Class K finishing up +5.79% on a net total return basis. Given the circumstances surrounding the COVID-19 pandemic, economic recession, and the resulting market volatility, we are particularly pleased with this year’s results. Fund volatility as measured by the 252-day historical annualized standard deviation was 12.73%. While higher than our average annualized volatility since inception, it was not unexpected given the sharp declines and recoveries in the equity and fixed income marketplaces. | |||
| • | Similarly, the benchmark Bloomberg Barclays US Aggregate Bond Index finished the same fiscal year 2020 period up +6.19% and with a trailing annualized volatility of 4.83%. The result is only a marginal underperformance of Weiss ABR relative to our benchmark largely owing to the flight to safety trade in treasury securities. Nonetheless, it is important to emphasize that Weiss ABR still very closely mimicked an index known for capital preservation and thus fulfilled one of our most important mandates. | |||
| • | At the component level, our dynamic and forward-looking market neutral component, which has historically benefitted from price dispersion, led all asset classes and finished the year up +10.69%. Next, our fixed income component increased +8.92%, largely as a result of its defensive nature. And rounding out the portfolio, the equity component fought its way back to a +2.46% return despite incredible volatility at the peak of the pandemic. | |||
| • | The fixed income component’s outperformance was again propelled by a very strong showing throughout the year in longer dated Treasury securities. This is understandable given the broader financial markets uncertainty surrounding the pandemic, economic stagnation and the Presidential election. Following on its heels was investment grade corporate bonds. Once again, and similar to the equity markets, high yield credit barely eked out a positive fiscal year, hampering stronger returns in the asset class. | |||
| • | As mentioned, the equity component offered meager returns, but did valiantly overcome a substantial drawdown in March and April. While large-cap securities offered a positive contribution to the asset class component, mid-cap securities hampered stronger gains while small-cap names positively suffocated the component. Indeed, evidence of this size factor relationship was evident not only in the stock market but in the broader economy as well with small businesses suffering dramatically during the lockdowns. |
1
WEISS ALTERNATIVE BALANCED RISK FUND
| • | Fiscal year 2020 turned out to be the year of our Market Neutral component once again, which finished up +10.69%. It emphasizes the importance of dispersion and a low correlation to the traditional asset classes. Indeed, Weiss ABR benefited from a modest drawdown and strong performance into year-end completely as a result of our signature asset class component. | |||
| • | Derivatives are utilized for some of these assets only to provide a more capital efficient exposure to our long only passive equity and long only fixed income. We do not use the derivatives in these long only exposures to generate enhanced leverage. We observed a positive correlation of the annual return for these two bellwether asset classes. |
| o | Portfolio composition and other analysis |
| • | In the 2020 fiscal year, the fixed income component averaged 36.5% as a percentage of the Fund’s gross notional exposure. The equity component averaged 10.5%, down from a peak of 11.8% earlier in the fiscal year. Lastly, the market neutral alpha component averaged approximately 53.0%. | |||
| • | Overall portfolio risk for the Fund was 12.73% (Source: Bloomberg, 252-day trailing volatility, annualized). The figure is up from last year, but we are comfortable with the heightened risk profile relative to past years given the solid performance amid this year’s troubling circumstances. The contribution to the Fund’s overall portfolio risk for the fixed income, equity, and market neutral components was 40.1%, 49.3% and 10.5%, respectively. |
| o | Market and economic outlook |
| • | 2020 was a year with unexpected, unpredictable events that helped shape the markets. 2020 will forever be known as the year of Covid-19. Everyone around the globe had to adjust as a pandemic changed our lives forever. Markets responded to the extreme uncertainty of the future by seeing assets falling sharply in the first quarter, testing the resolve of governments and central bankers to respond faster than ever before to a global crisis. The experience and programs created in the years following the Great Financial crisis helped to balance out the economic uncertainty leading to a sharp and violent reversal in assets over the final nine months of the year. The economic disaster in the first and second quarter was followed by an equally surprising recovery in the second half of the year. Eyes then turned to the US Presidential election and the potential uncertainty of a contested outcome. In the end, for those who were able to navigate the first three months and take advantage of the opportunities created, it was a good year. |
2021 will likely have a very different path and outcome. As is generally the case with a recession, investors during the uncertainty move to quality and companies with stable growth, while abandoning those most suffering from the recession. Historically, once stabilization occurs, there have been great opportunities for idiosyncratic fundamental security selection. Given the historical valuation gap that exits in the market today, we believe there will be many unexpected winners going forward particularly in small and mid-cap stocks, emerging markets and commodities.
2
WEISS ALTERNATIVE BALANCED RISK FUND
Alpha is an annualized return measure of how much better or worse a fund’s performance is relative to an index of funds in the same category, after allowing for differences in risk.
Standard Deviation is a measure of the dispersion of a set of data from its mean.
Correlation is a statistical measure of the degree to which the movements of two variables (stock/option/convertible prices or returns) are related.
Bloomberg Barclays U.S. Aggregate Bond Index is a broad base index, maintained by Barclays Capital, and is often used to represent investment grade bonds being traded in United States.
One cannot invest directly in an index.
Opinions expressed are subject to change at any time, are not guaranteed and should not be considered investment advice.
Diversification does not assure a profit nor protect against loss in a declining market.
Mutual fund investing involves risk. Principal loss is possible. Derivatives involve special risks including correlation, counterparty, liquidity, operational, accounting and tax risks. These risks, in certain cases, may be greater than the risks presented by more traditional investments. The Fund may also use options and future contracts, which have the risks of unlimited losses of the underlying holdings due to unanticipated market movements and failure to correctly predict the direction of securities prices, interest rates and currency exchange rates. The investment in options is not suitable for all investors. The Fund invests in foreign securities which involve greater volatility and political, economic and currency risks and differences in accounting methods. These risks are greater in emerging markets. Investment by the Fund in lower-rated and non-rated securities presents a greater risk of loss to principal and interest than higher-rated securities. The Fund may use leverage which may exaggerate the effect of any increase or decrease in the value of portfolio securities or the Net Asset Value of the Fund, and money borrowed will be subject to interest costs. Investments in debt securities typically decrease in value when interest rates rise. This risk is usually greater for longer-term debt securities. Small- and Medium-capitalization companies tend to have limited liquidity and greater price volatility than large-capitalization companies. Investing in ETFs are subject to additional risks that do not apply to conventional mutual funds, including the risks that the market price of the shares may trade at a discount to its net asset value (“NAV”), an active secondary trading market may not develop or be maintained, or trading may be halted by the exchange in which they trade, which may impact a Funds ability to sell its shares. The Fund may make short sales of securities, which involves the risk that losses may exceed the original amount invested.
Must be preceded or accompanied by a prospectus.
The Weiss Alternative Balanced Risk Fund is distributed by Quasar Distributors, LLC.
3
WEISS ALTERNATIVE BALANCED RISK FUND
Value of $100,000 Investment (Unaudited)

The chart assumes an initial investment of $100,000. Performance reflects waivers of fees and operating expenses in effect. In the absence of such waivers, total return would be reduced. Past performance is not predictive of future performance. Investment return and principal value will fluctuate, so that your shares, when redeemed, may be worth more or less than their original cost. Performance assumes the reinvestment of capital gains and income distributions. The performance does not reflect the deduction of taxes that a shareholder would pay on Fund distributions or the redemption of Fund shares.
Rates of Return (%) – As of October 31, 2020
One Year | Since Inception(1)(2) | |
| Class K | 5.79% | 5.86% |
Bloomberg Barclays U.S. Aggregate Bond Index(3) | 6.19% | 4.14% |
| Investor Class | 5.48% | 6.35% |
Bloomberg Barclays U.S. Aggregate Bond Index(3) | 6.19% | 4.77% |
(1) | Inception Date of Class K was December 1, 2015. |
(2) | Inception Date of Investor Class was February 28, 2017. |
(3) | The Bloomberg Barclays U.S. Aggregate Bond Index covers the USD-denominated, investment-grade, fixed rate, taxable bond market of SEC-registered securities. The Index includes multiple types of government and corporate-issued bonds, some of which are asset-backed. The securities that comprise the Barclays U.S. Aggregate Bond Index may differ substantially from the securities in the Fund’s portfolio. It is not possible to directly invest in an index. |
The returns reflect the actual performance for each period and do not include the impact of trades executed on the last business day of the period that were recorded on the first business day of the next period.
4
WEISS ALTERNATIVE BALANCED RISK FUND
Expense Example (Unaudited)
October 31, 2020
As a shareholder of the Fund, you incur two types of costs: (1) transaction costs, and (2) ongoing costs, including management fees and other Fund specific expenses. The expense example is intended to help the shareholder understand ongoing costs (in dollars) of investing in the Fund and to compare these costs with the ongoing costs of investing in other mutual funds. The example is based on an investment of $1,000 invested at the beginning of the period and held for the most recent six-month period.
The Actual Expenses comparison provides information about actual account values and actual expenses. A shareholder may use the information in this line, together with the amount invested, to estimate the expenses paid over the period. A shareholder may divide his/her account value by $1,000 (e.g., an $8,600 account value divided by $1,000 = 8.6), then multiply the result by the number in the first line under the heading entitled “Expenses Paid During Period” to estimate the expenses paid on his/her account during this period.
The Hypothetical Example for Comparison Purposes provides information about hypothetical account values and hypothetical expenses based on each Fund’s actual expense ratio and an assumed rate of return of 5% per year before expenses, which is not the Fund’s actual return. The hypothetical account values and expenses may not be used to estimate the actual ending account balance or expenses paid for the period. A shareholder may use this information to compare the ongoing costs of investing in the Funds and other funds. To do so, a shareholder would compare this 5% hypothetical example with the 5% hypothetical examples that appear in the shareholder reports of other funds.
The expenses shown in the table are meant to highlight your ongoing costs only and do not reflect any transactional costs, such as sales charges (loads), redemptions fees or exchange fees. Therefore, the Hypothetical Example for Comparisons Purposes is useful in comparing ongoing costs only and will not help to determine the relevant total costs of owning different funds. In addition, if these transactional costs were included, shareholder costs would have been higher.
| Expenses Paid | ||||
| Annualized Net | Beginning | Ending | During Period(1) | |
| Expense Ratio | Account Value | Account Value | (5/1/2020 to | |
(10/31/2020) | (5/1/2020) | (10/31/2020) | 10/31/2020) | |
| Class K | ||||
Actual(2)(3) | 2.89% | $1,000.00 | $1,057.90 | $14.95 |
| Hypothetical (5% annual return | ||||
before expenses)(4) | 2.89% | $1,000.00 | $1,010.61 | $14.61 |
| Investor Class | ||||
Actual(2)(3) | 3.24% | $1,000.00 | $1,054.80 | $16.73 |
| Hypothetical (5% annual return | ||||
before expenses)(4) | 3.24% | $1,000.00 | $1,008.85 | $16.36 |
(1) | Expenses are equal to the Fund’s annualized expense ratio for the period multiplied by the average account value over the period, multiplied by 184/366 to reflect its six-month period. |
(2) | Based on the actual returns for the period from May 1, 2020 through October 31, 2020, of 5.64% and 5.49% for Class K and Investor Class, respectively. |
(3) | Excluding dividends on short positions and borrowing expense, your actual cost of investing in Class K and Investor Class would be $7.76 and $9.56, respectively. |
(4) | Excluding dividends on short positions and borrowing expense, your hypothetical cost of investing in Class K and Investor Class would be $7.61 and $9.37, respectively. |
5
WEISS ALTERNATIVE BALANCED RISK FUND
Allocation of Portfolio (Unaudited)
October 31, 2020
LONG INVESTMENTS(1)(2)

(1) | Data expressed as a percentage of long common stocks, long contingent value rights, long exchange traded funds, long preferred stocks, long warrants, long rights, long short-term investments, purchased options, long swap contracts, long forward currency exchange contracts and long futures contracts as of October 31, 2020. Data expressed excludes securities sold short, written options, short swap contracts, short forward currency exchange contracts, short futures contracts and other assets in excess of liabilities. Please refer to the Schedule of Investments, Schedule of Written Options, Schedule of Open Swap Contracts, Schedule of Open Forward Currency Contracts, and Schedule of Open Futures Contracts for more details on the Fund’s individual holdings. |
(2) | The value of option, swap, foreign currency and futures contracts are expressed as notional and not fair value. |
6
WEISS ALTERNATIVE BALANCED RISK FUND
Allocation of Portfolio (Unaudited)
October 31, 2020
SHORT INVESTMENTS(3)(4)
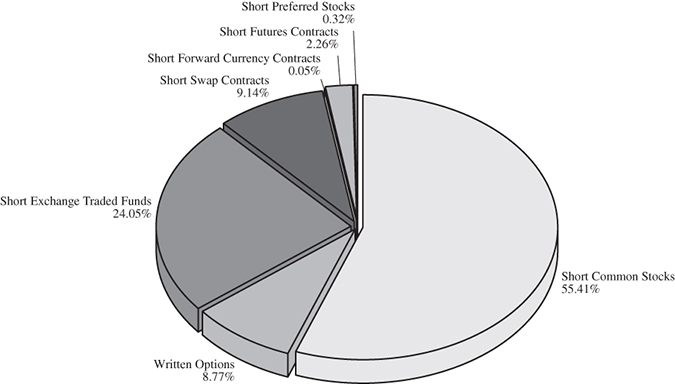
(3) | Data expressed as a percentage of short common stocks, short exchange traded funds, short preferred stocks, written options, short swap contracts, short foreign currency exchange contracts and short futures contracts as of October 31, 2020. Data expressed excludes long investments, long swap contracts, long futures contracts and other assets in excess of liabilities. Please refer to the Schedule of Investments, Schedule of Written Options, Schedule of Open Swap Contracts, Schedule of Open Forward Currency Contracts and Schedule of Open Futures Contracts for more details on the Fund’s individual holdings. |
(4) | The value of option, swap, forward currency and futures contracts are expressed as notional and not fair value. |
7
WEISS ALTERNATIVE BALANCED RISK FUND
Schedule of Investments
October 31, 2020
| Shares | Value | |||||||
| LONG COMMON STOCKS – 43.85% | ||||||||
| Aerospace & Defense – 0.59% | ||||||||
| CAE, Inc. (b) | 1,270 | $ | 21,705 | |||||
| Kratos Defense & Security Solutions, Inc. (a) | 10,932 | 206,505 | ||||||
| Lockheed Martin Corporation | 105 | 36,764 | ||||||
| TransDigm Group, Inc. | 18 | 8,593 | ||||||
| Virgin Galactic Holdings, Inc. (a) | 17,481 | 304,519 | ||||||
| 578,086 | ||||||||
| Air Freight & Logistics – 0.53% | ||||||||
| C.H. Robinson Worldwide, Inc. | 1,218 | 107,708 | ||||||
| DSV Panalpina A/S (b) | 104 | 16,873 | ||||||
| FedEx Corporation | 88 | 22,833 | ||||||
| Hub Group, Inc., Class A (a) | 580 | 29,075 | ||||||
| XPO Logistics, Inc. (a) | 3,786 | 340,740 | ||||||
| 517,229 | ||||||||
| Airlines – 0.30% | ||||||||
| Air Canada (a)(b) | 13,402 | 148,173 | ||||||
| Delta Air Lines, Inc. | 1,238 | 37,932 | ||||||
| Hawaiian Holdings, Inc. | 638 | 8,836 | ||||||
| JetBlue Airways Corporation (a) | 1,972 | 23,605 | ||||||
| Southwest Airlines Company | 1,768 | 69,889 | ||||||
| Spirit Airlines, Inc. (a) | 290 | 5,095 | ||||||
| 293,530 | ||||||||
| Auto Components – 0.23% | ||||||||
| Adient plc (a) | 1,677 | 35,586 | ||||||
| Aptiv plc (b) | 496 | 47,859 | ||||||
| BorgWarner, Inc. | 1,419 | 49,637 | ||||||
| Dana, Inc. | 2,150 | 30,078 | ||||||
| Lear Corporation | 249 | 30,082 | ||||||
| Magna International, Inc. (b) | 696 | 35,573 | ||||||
| 228,815 | ||||||||
| Automobiles – 0.22% | ||||||||
| Bayerische Motoren Werke AG (b) | 359 | 24,534 | ||||||
| Fiat Chrysler Automobiles NV (a)(b) | 2,665 | 32,693 | ||||||
| Fiat Chrysler Automobiles NV (a)(b) | 2,374 | 29,176 | ||||||
| Ford Motor Company (h) | 507 | 3,919 | ||||||
| General Motors Company (h) | 2,074 | 71,615 | ||||||
| Peugeot SA (a)(b) | 360 | 6,467 | ||||||
| Tesla, Inc. (a)(h) | 127 | 49,281 | ||||||
| 217,685 | ||||||||
The accompanying notes are an integral part of these financial statements.
8
WEISS ALTERNATIVE BALANCED RISK FUND
Schedule of Investments – Continued
October 31, 2020
| Shares | Value | |||||||
| Banks – 0.59% | ||||||||
| Banco BPM SpA (a)(b) | 19,431 | $ | 35,199 | |||||
| Banco Santander SA (b) | 34,505 | 69,098 | ||||||
| CIT Group, Inc. | 66 | 1,944 | ||||||
| Citigroup, Inc. | 504 | 20,876 | ||||||
| Commerzbank AG (b) | 7,766 | 36,759 | ||||||
| FinecoBank Banca Fineco SpA (b) | 3,382 | 46,434 | ||||||
| First Republic Bank | 465 | 58,655 | ||||||
| ING Groep NV (a)(b) | 5,784 | 39,619 | ||||||
| Kaspi.KZ JSC Reg – GDR (b) | 259 | 11,124 | ||||||
| National Australia Bank Ltd. (b) | 1,478 | 19,337 | ||||||
| Nordea Bank Abp (a)(b) | 6,638 | 49,820 | ||||||
| Signature Bank | 61 | 4,925 | ||||||
| Skandinaviska Enskilda Banken AB (a)(b) | 10,035 | 86,113 | ||||||
| Sumitomo Mitsui Financial Group, Inc. (a)(b) | 476 | 13,177 | ||||||
| Svenska Handelsbanken AB, Class A (b) | 7,608 | 61,645 | ||||||
| Westpac Banking Corporation (b) | 1,571 | 19,884 | ||||||
| 574,609 | ||||||||
| Beverages – 0.37% | ||||||||
| The Coca-Cola Company | 217 | 10,429 | ||||||
| Coca-Cola European Partners plc (b) | 601 | 21,462 | ||||||
| Constellation Brands, Inc., Class A | 88 | 14,540 | ||||||
| Keurig Dr Pepper, Inc. | 9,072 | 244,037 | ||||||
| Monster Beverage Corporation (a) | 895 | 68,530 | ||||||
| 358,998 | ||||||||
| Biotechnology – 1.02% | ||||||||
| AbbVie, Inc. | 406 | 34,551 | ||||||
| ACADIA Pharmaceuticals, Inc. (a) | 1,577 | 73,252 | ||||||
| Acceleron Pharma, Inc. (a) | 521 | 54,486 | ||||||
| Albireo Pharma, Inc. (a) | 180 | 5,681 | ||||||
| Aldeyra Therapeutics, Inc. (a) | 1,381 | 9,225 | ||||||
| Alexion Pharmaceuticals, Inc. (a) | 72 | 8,290 | ||||||
| Applied Genetic Technologies Corporation (a) | 216 | 1,115 | ||||||
| Argenx SE – ADR (a)(b) | 169 | 41,934 | ||||||
| Arrowhead Pharmaceuticals, Inc. (a) | 121 | 6,933 | ||||||
| Ascendis Pharma A/S – ADR (a)(b) | 105 | 17,152 | ||||||
| Aurinia Pharmaceuticals, Inc. (a)(b) | 242 | 3,795 | ||||||
| Autolus Therapeutics plc (a)(b) | 596 | 6,443 | ||||||
| BELLUS Health, Inc. (a)(b) | 419 | 968 | ||||||
| Biohaven Pharmaceutical Holding Company Ltd. (a) | 819 | 63,440 | ||||||
| BioMarin Pharmaceutical, Inc. (a) | 241 | 17,938 | ||||||
The accompanying notes are an integral part of these financial statements.
9
WEISS ALTERNATIVE BALANCED RISK FUND
Schedule of Investments – Continued
October 31, 2020
| Shares | Value | |||||||
| Biotechnology – 1.02% (Continued) | ||||||||
| BioNTech SE – ADR (a)(b) | 93 | $ | 7,938 | |||||
| Bioxcel Therapeutics, Inc. (a) | 209 | 9,549 | ||||||
| Deciphera Pharmaceuticals, Inc. (a) | 133 | 7,723 | ||||||
| Dynavax Technologies Corporation (a) | 358 | 1,336 | ||||||
| Eiger BioPharmaceuticals, Inc. (a) | 2,402 | 21,330 | ||||||
| Epizyme, Inc. (a) | 323 | 3,992 | ||||||
| Esperion Therapeutics, Inc. (a) | 180 | 5,395 | ||||||
| Exact Sciences Corporation (a) | 158 | 19,565 | ||||||
| Exelixis, Inc. (a) | 1,080 | 22,118 | ||||||
| Fate Therapeutics, Inc. (a) | 240 | 10,656 | ||||||
| FibroGen, Inc. (a) | 527 | 20,226 | ||||||
| Galecto, Inc. (a) | 1,312 | 19,680 | ||||||
| Galera Therapeutics, Inc. (a) | 433 | 3,546 | ||||||
| Global Blood Therapeutics, Inc. (a) | 385 | 20,359 | ||||||
| Heron Therapeutics, Inc. (a) | 299 | 4,877 | ||||||
| Incyte Corporation (a) | 359 | 31,104 | ||||||
| Insmed, Inc. (a) | 384 | 12,649 | ||||||
| Iovance Biotherapeutics, Inc. (a) | 307 | 10,954 | ||||||
| Karyopharm Therapeutics, Inc. (a) | 299 | 4,431 | ||||||
| Legend Biotech Corporation – ADR (a) | 93 | 2,406 | ||||||
| Merus NV (a)(b) | 248 | 3,021 | ||||||
| Mirati Therapeutics, Inc. (a) | 12 | 2,606 | ||||||
| Molecular Templates, Inc. (a) | 468 | 4,137 | ||||||
| Natera, Inc. (a) | 13 | 874 | ||||||
| Neurocrine Biosciences, Inc. (a) | 420 | 41,441 | ||||||
| Nurix Therapeutics, Inc. (a) | 472 | 11,937 | ||||||
| Pandion Therapeutics, Inc. (a) | 481 | 5,681 | ||||||
| Passage Bio, Inc. (a) | 3,509 | 58,986 | ||||||
| Regeneron Pharmaceuticals, Inc. (a) | 29 | 15,763 | ||||||
| Repare Therapeutics, Inc. (a)(b) | 37 | 1,000 | ||||||
| Rigel Pharmaceuticals, Inc. (a) | 5,585 | 13,851 | ||||||
| Rocket Pharmaceuticals, Inc. (a) | 120 | 3,353 | ||||||
| Sage Therapeutics, Inc. (a) | 60 | 4,403 | ||||||
| Sangamo Therapeutics, Inc. (a) | 108 | 1,117 | ||||||
| Sarepta Therapeutics, Inc. (a) | 144 | 19,571 | ||||||
| Seagen, Inc. (a) | 252 | 42,034 | ||||||
| Turning Point Therapeutics, Inc. (a) | 70 | 6,453 | ||||||
| Twist Bioscience Corporation (a) | 480 | 36,787 | ||||||
| uniQure NV (a)(b) | 55 | 2,224 | ||||||
| United Therapeutics Corporation (a) | 226 | 30,336 | ||||||
The accompanying notes are an integral part of these financial statements.
10
WEISS ALTERNATIVE BALANCED RISK FUND
Schedule of Investments – Continued
October 31, 2020
| Shares | Value | |||||||
| Biotechnology – 1.02% (Continued) | ||||||||
| Vertex Pharmaceuticals, Inc. (a) | 443 | $ | 92,303 | |||||
| Zymeworks, Inc. (a)(b) | 241 | 9,428 | ||||||
| 992,343 | ||||||||
| Building Products – 0.26% | ||||||||
| The AZEK Company, Inc. (a) | 1,584 | 52,969 | ||||||
| Builders FirstSource, Inc. (a) | 702 | 21,271 | ||||||
| Carrier Global Corporation | 1,921 | 64,142 | ||||||
| Fortune Brands Home & Security, Inc. | 192 | 15,527 | ||||||
| Johnson Controls International plc | 632 | 26,677 | ||||||
| Masco Corporation | 1,203 | 64,481 | ||||||
| Trane Technologies plc (b) | 77 | 10,222 | ||||||
| Trex Company, Inc. (a) | 1 | 70 | ||||||
| 255,359 | ||||||||
| Capital Markets – 0.36% | ||||||||
| Anima Holding SpA (b) | 2,595 | 9,723 | ||||||
| Brookfield Asset Management, Inc., Class A (b) | 661 | 19,685 | ||||||
| DWS Group GmbH & Company KGaA (b) | 397 | 13,480 | ||||||
| Eaton Vance Corporation (a) | 4,757 | 284,421 | ||||||
| Julius Baer Group Ltd. (b) | 371 | 16,511 | ||||||
| Morgan Stanley | 217 | 10,449 | ||||||
| 354,269 | ||||||||
| Chemicals – 0.57% | ||||||||
| Axalta Coating Systems Ltd. (a) | 2,916 | 73,221 | ||||||
| DuPont de Nemours, Inc. | 5,620 | 319,666 | ||||||
| Kraton Corporation (a) | 178 | 5,037 | ||||||
| Linde plc (b) | 211 | 46,492 | ||||||
| The Mosaic Company | 1,767 | 32,689 | ||||||
| PPG Industries, Inc. | 91 | 11,805 | ||||||
| PQ Group Holdings, Inc. (a) | 696 | 8,046 | ||||||
| RPM International, Inc. | 69 | 5,842 | ||||||
| The Scotts Miracle-Gro Company | 290 | 43,514 | ||||||
| The Sherwin-Williams Company | 21 | 14,448 | ||||||
| 560,760 | ||||||||
| Commercial Services & Supplies – 0.11% | ||||||||
| Clean Harbors, Inc. (a) | 743 | 39,357 | ||||||
| Copart, Inc. (a) | 58 | 6,401 | ||||||
| Republic Services, Inc. | 197 | 17,369 | ||||||
| Waste Management, Inc. | 419 | 45,214 | ||||||
| 108,341 | ||||||||
The accompanying notes are an integral part of these financial statements.
11
WEISS ALTERNATIVE BALANCED RISK FUND
Schedule of Investments – Continued
October 31, 2020
| Shares | Value | |||||||
| Communications Equipment – 0.77% | ||||||||
| Acacia Communications, Inc. (a) | 2,489 | $ | 168,605 | |||||
| Applied Optoelectronics, Inc. (a) | 2,407 | 21,133 | ||||||
| Arista Networks, Inc. (a) | 496 | 103,614 | ||||||
| Calix, Inc. (a) | 2,610 | 61,100 | ||||||
| Ciena Corporation (a) | 576 | 22,689 | ||||||
| CommScope Holding Company, Inc. (a) | 24,008 | 213,671 | ||||||
| F5 Networks, Inc. (a) | 1,022 | 135,865 | ||||||
| Nokia OYJ – ADR (a)(b) | 2,662 | 8,971 | ||||||
| Telefonaktiebolaget LM Ericsson – ADR (b) | 1,559 | 17,476 | ||||||
| 753,124 | ||||||||
| Construction & Engineering – 0.10% | ||||||||
| AECOM (a) | 656 | 29,415 | ||||||
| WillScot Mobile Mini Holdings Corporation (a) | 3,636 | 67,557 | ||||||
| 96,972 | ||||||||
| Containers & Packaging – 0.11% | ||||||||
| Berry Global Group, Inc. (a) | 780 | 36,371 | ||||||
| WestRock Company | 1,893 | 71,082 | ||||||
| 107,453 | ||||||||
| Distributors – 0.00% | ||||||||
| LKQ Corporation (a) | 22 | 704 | ||||||
| Pool Corporation | 1 | 350 | ||||||
| 1,054 | ||||||||
| Diversified Consumer Services – 0.02% | ||||||||
| WW International, Inc. (a) | 1,080 | 22,853 | ||||||
| Diversified Telecommunication Services – 0.04% | ||||||||
| AT&T, Inc. | 192 | 5,188 | ||||||
| Verizon Communications, Inc. | 526 | 29,977 | ||||||
| 35,165 | ||||||||
| Electric Utilities – 1.88% | ||||||||
| Alliant Energy Corporation | 4,329 | 239,307 | ||||||
| Avangrid, Inc. | 194 | 9,572 | ||||||
| Entergy Corporation | 1,392 | 140,898 | ||||||
| Evergy, Inc. (h) | 3,480 | 192,096 | ||||||
| Eversource Energy | 464 | 40,493 | ||||||
| Fortum Oyj (b) | 788 | 14,812 | ||||||
| Iberdrola SA (b) | 1,696 | 20,026 | ||||||
| IDACORP, Inc. | 841 | 73,781 | ||||||
| NextEra Energy, Inc. | 4,950 | 362,389 | ||||||
The accompanying notes are an integral part of these financial statements.
12
WEISS ALTERNATIVE BALANCED RISK FUND
Schedule of Investments – Continued
October 31, 2020
| Shares | Value | |||||||
| Electric Utilities – 1.88% (Continued) | ||||||||
| Oersted A/S (b) | 232 | $ | 36,822 | |||||
| Pinnacle West Capital Corporation | 1,002 | 81,733 | ||||||
| PNM Resources, Inc. | 5,856 | 292,800 | ||||||
| PPL Corporation | 5,464 | 150,260 | ||||||
| Xcel Energy, Inc. | 2,526 | 176,896 | ||||||
| 1,831,885 | ||||||||
| Electrical Equipment – 0.70% | ||||||||
| ABB Ltd. – Reg (b) | 721 | 17,535 | ||||||
| AMETEK, Inc. | 490 | 48,118 | ||||||
| Bloom Energy Corporation, Class A (a) | 937 | 11,844 | ||||||
| Eaton Corporation plc | 899 | 93,307 | ||||||
| Generac Holdings, Inc. | 74 | 15,551 | ||||||
| nVent Electric plc (b) | 527 | 9,512 | ||||||
| Regal Beloit Corporation | 583 | 57,513 | ||||||
| Rockwell Automation, Inc. | 124 | 29,403 | ||||||
| Sensata Technologies Holding plc (a) | 747 | 32,651 | ||||||
| Siemens Energy AG (a)(b) | 1,650 | 36,127 | ||||||
| Siemens Gamesa Renewable Energy SA (b) | 232 | 6,574 | ||||||
| TPI Composites, Inc. (a) | 348 | 11,526 | ||||||
| Vertiv Holdings Company | 17,849 | 315,035 | ||||||
| 684,696 | ||||||||
| Electronic Equipment, Instruments & Components – 1.19% | ||||||||
| Cognex Corporation | 348 | 22,933 | ||||||
| Corning, Inc. | 534 | 17,072 | ||||||
| Flex Ltd. (a) | 2,726 | 38,573 | ||||||
| Hitachi Ltd. (b) | 9,032 | 304,417 | ||||||
| II-VI, Inc. (a) | 140 | 6,366 | ||||||
| Jabil, Inc. | 4,806 | 159,271 | ||||||
| SYNNEX Corporation (h) | 2,702 | 355,691 | ||||||
| Vontier Corporation | 9,118 | 262,057 | ||||||
| 1,166,380 | ||||||||
| Energy Equipment & Services – 0.23% | ||||||||
| ChampionX Corporation (a) | 6,802 | 59,381 | ||||||
| Helix Energy Solutions Group, Inc. (a) | 13,836 | 34,313 | ||||||
| Liberty Oilfield Services, Inc., Class A | 9,036 | 60,360 | ||||||
| ProPetro Holding Corporation (a) | 2,195 | 8,670 | ||||||
| TechnipFMC plc | 11,843 | 65,492 | ||||||
| 228,216 | ||||||||
The accompanying notes are an integral part of these financial statements.
13
WEISS ALTERNATIVE BALANCED RISK FUND
Schedule of Investments – Continued
October 31, 2020
| Shares | Value | |||||||
| Entertainment – 0.79% | ||||||||
| Activision Blizzard, Inc. | 4,387 | $ | 332,227 | |||||
| Live Nation Entertainment, Inc. (a) | 288 | 14,054 | ||||||
| Madison Square Garden Sports Company (a) | 90 | 12,748 | ||||||
| Netflix, Inc. (a) | 230 | 109,420 | ||||||
| Sciplay Corporation, Class A (a) | 1,920 | 25,632 | ||||||
| Take-Two Interactive Software, Inc. (a) | 430 | 66,616 | ||||||
| Ubisoft Entertainment SA (a)(b) | 293 | 25,882 | ||||||
| The Walt Disney Company (h) | 539 | 65,354 | ||||||
| Zynga, Inc., Class A (a)(h) | 12,904 | 116,007 | ||||||
| 767,940 | ||||||||
| Food & Staples Retailing – 0.21% | ||||||||
| Alimentation Couche-Tard, Inc., Class B (b) | 702 | 21,619 | ||||||
| Casey’s General Stores, Inc. | 255 | 42,985 | ||||||
| Costco Wholesale Corporation | 69 | 24,676 | ||||||
| The Kroger Company | 1,102 | 35,495 | ||||||
| Sysco Corporation | 326 | 18,031 | ||||||
| Wal-Mart Stores, Inc. | 478 | 66,322 | ||||||
| 209,128 | ||||||||
| Food Products – 0.92% | ||||||||
| Bunge Ltd. | 2,384 | 135,244 | ||||||
| Cal-Maine Foods, Inc. (a) | 2,279 | 87,400 | ||||||
| The Hershey Company | 1,116 | 153,405 | ||||||
| Hostess Brands, Inc. (a) | 8,169 | 103,256 | ||||||
| The JM Smucker Company | 638 | 71,584 | ||||||
| The Kraft Heinz Company | 780 | 23,860 | ||||||
| Lancaster Colony Corporation | 82 | 13,623 | ||||||
| Mondelez International, Inc., Class A | 5,275 | 280,208 | ||||||
| Sanderson Farms, Inc. | 232 | 29,689 | ||||||
| 898,269 | ||||||||
| Gas Utilities – 0.07% | ||||||||
| South Jersey Industries, Inc. | 1,384 | 26,670 | ||||||
| Spire, Inc. | 711 | 39,844 | ||||||
| 66,514 | ||||||||
| Health Care Equipment & Supplies – 0.81% | ||||||||
| ABIOMED, Inc. (a) | 144 | 36,271 | ||||||
| Boston Scientific Corporation (a) | 1,323 | 45,339 | ||||||
| Cardiovascular Systems, Inc. (a) | 131 | 4,670 | ||||||
| Danaher Corporation | 270 | 61,976 | ||||||
| DexCom, Inc. (a) | 241 | 77,019 | ||||||
The accompanying notes are an integral part of these financial statements.
14
WEISS ALTERNATIVE BALANCED RISK FUND
Schedule of Investments – Continued
October 31, 2020
| Shares | Value | |||||||
| Health Care Equipment & Supplies – 0.81% (Continued) | ||||||||
| Eargo, Inc. (a) | 596 | $ | 20,651 | |||||
| Edwards Lifesciences Corporation (a) | 962 | 68,966 | ||||||
| Envista Holdings Corporation (a) | 1,354 | 35,773 | ||||||
| Haemonetics Corporation (a) | 119 | 12,030 | ||||||
| Hologic, Inc. (a) | 60 | 4,129 | ||||||
| Inari Medical, Inc. (a) | 145 | 9,599 | ||||||
| iRhythm Technologies, Inc. (a) | 120 | 25,374 | ||||||
| Outset Medical, Inc. (a) | 70 | 3,253 | ||||||
| Penumbra, Inc. (a) | 12 | 3,132 | ||||||
| Pulmonx Corporation (a) | 1,601 | 67,338 | ||||||
| Quidel Corporation (a) | 1 | 268 | ||||||
| Silk Road Medical, Inc. (a) | 211 | 12,787 | ||||||
| STAAR Surgical Company (a) | 60 | 4,350 | ||||||
| Tactile Systems Technology, Inc. (a) | 119 | 4,353 | ||||||
| Tandem Diabetes Care, Inc. (a) | 131 | 14,279 | ||||||
| Varian Medical Systems, Inc. (a) | 889 | 153,619 | ||||||
| ViewRay, Inc. (a) | 311 | 924 | ||||||
| Wright Medical Group NV (a)(b) | 3,925 | 120,066 | ||||||
| Zimmer Biomet Holdings, Inc. | 13 | 1,717 | ||||||
| 787,883 | ||||||||
| Health Care Providers & Services – 0.18% | ||||||||
| Amedisys, Inc. (a) | 36 | 9,324 | ||||||
| Centene Corporation (a) | 264 | 15,602 | ||||||
| Guardant Health, Inc. (a) | 123 | 13,119 | ||||||
| Humana, Inc. | 120 | 47,914 | ||||||
| Oak Street Health, Inc. (a) | 180 | 8,566 | ||||||
| Option Care Health, Inc. (a) | 301 | 4,012 | ||||||
| Progyny, Inc. (a) | 3,020 | 73,597 | ||||||
| 172,134 | ||||||||
| Health Care Technology – 0.36% | ||||||||
| Allscripts Healthcare Solutions, Inc. (a) | 13,337 | 134,437 | ||||||
| American Well Corporation, Class A (a) | 58 | 1,497 | ||||||
| GoodRx Holdings, Inc., Class A(a) | 50 | 2,419 | ||||||
| HMS Holdings Corporation (a) | 2,880 | 76,666 | ||||||
| iCAD, Inc. (a) | 361 | 3,523 | ||||||
| Inovalon Holdings, Inc., Class A (a) | 5,307 | 100,780 | ||||||
| Inspire Medical Systems, Inc. (a) | 58 | 6,927 | ||||||
| Veeva Systems, Inc., Class A (a) | 90 | 24,304 | ||||||
| 350,553 | ||||||||
The accompanying notes are an integral part of these financial statements.
15
WEISS ALTERNATIVE BALANCED RISK FUND
Schedule of Investments – Continued
October 31, 2020
| Shares | Value | |||||||
| Hotels, Restaurants & Leisure – 0.89% | ||||||||
| Aramark | 834 | $ | 23,135 | |||||
| Boyd Gaming Corporation | 2,117 | 67,151 | ||||||
| Cracker Barrel Old Country Store, Inc. | 104 | 11,837 | ||||||
| Darden Restaurants, Inc. (h) | 778 | 71,514 | ||||||
| Domino’s Pizza, Inc. | 19 | 7,188 | ||||||
| DraftKings, Inc., Class A (a)(h) | 168 | 5,947 | ||||||
| Dunkin’ Brands Group, Inc. | 314 | 31,309 | ||||||
| Hilton Grand Vacations, Inc. (a) | 1,740 | 35,844 | ||||||
| Hilton Worldwide Holdings, Inc. | 162 | 14,225 | ||||||
| Jack in the Box, Inc. | 546 | 43,713 | ||||||
| Las Vegas Sands Corporation (h) | 2,333 | 112,124 | ||||||
| Marriott Vacations Worldwide Corporation | 648 | 62,597 | ||||||
| McDonald’s Corporation | 159 | 33,867 | ||||||
| Melco Crown Entertainment Ltd. – ADR (b) | 1,160 | 18,699 | ||||||
| Norwegian Cruise Line Holdings Ltd. (a) | 7,475 | 124,309 | ||||||
| Royal Caribbean Cruises Ltd. | 1,042 | 58,790 | ||||||
| Starbucks Corporation | 811 | 70,525 | ||||||
| Wynn Resorts Ltd. | 410 | 29,696 | ||||||
| Yum China Holdings, Inc. (b) | 714 | 38,006 | ||||||
| Yum! Brands, Inc. | 116 | 10,826 | ||||||
| 871,302 | ||||||||
| Household Durables – 0.25% | ||||||||
| D.R. Horton, Inc. | 501 | 33,472 | ||||||
| Installed Building Products, Inc. (a) | 127 | 11,499 | ||||||
| KB Home | 1,402 | 45,214 | ||||||
| Leggett & Platt, Inc. | 858 | 35,804 | ||||||
| Newell Brands, Inc. | 2,371 | 41,872 | ||||||
| NVR, Inc. | 4 | 15,812 | ||||||
| PulteGroup, Inc. | 421 | 17,160 | ||||||
| TopBuild Corporation (a) | 92 | 14,095 | ||||||
| Whirlpool Corporation | 166 | 30,703 | ||||||
| 245,631 | ||||||||
| Household Products – 0.31% | ||||||||
| The Procter & Gamble Company | 1,483 | 203,319 | ||||||
| Spectrum Brands Holdings, Inc. | 1,702 | 96,793 | ||||||
| 300,112 | ||||||||
| Independent Power and Renewable Electricity Producers – 0.25% | ||||||||
| The AES Corporation | 8,700 | 169,650 | ||||||
| Clearway Energy, Inc., Class C | 1,160 | 32,666 | ||||||
The accompanying notes are an integral part of these financial statements.
16
WEISS ALTERNATIVE BALANCED RISK FUND
Schedule of Investments – Continued
October 31, 2020
| Shares | Value | |||||||
| Independent Power and Renewable Electricity Producers – 0.25% (Continued) | ||||||||
| NextEra Energy Partners LP (h) | 19 | $ | 1,193 | |||||
| Ormat Technologies, Inc. | 545 | 38,624 | ||||||
| 242,133 | ||||||||
| Industrial Conglomerates – 0.03% | ||||||||
| Honeywell International, Inc. | 93 | 15,340 | ||||||
| Siemens AG – Reg (b) | 131 | 15,368 | ||||||
| 30,708 | ||||||||
| Insurance – 0.51% | ||||||||
| Aegon NV (b) | 14,563 | 39,175 | ||||||
| AIA Group Ltd. (b) | 1,200 | 11,421 | ||||||
| Allianz SE (b) | 175 | 30,827 | ||||||
| GoHealth, Inc., Class A (a) | 7 | 73 | ||||||
| International General Insurance Holdings Ltd. (b) | 29,450 | 206,150 | ||||||
| Storebrand ASA (a)(b) | 2,480 | 13,088 | ||||||
| Sun Life Financial, Inc. (b) | 298 | 11,857 | ||||||
| Syncora Holdings Ltd. | 2,808 | 803 | ||||||
| Tokio Marine Holdings, Inc. (b) | 545 | 24,359 | ||||||
| Topdanmark A/S (b) | 421 | 16,486 | ||||||
| Tryg A/S (b) | 1,431 | 39,714 | ||||||
| Willis Towers Watson plc | 550 | 100,364 | ||||||
| 494,317 | ||||||||
| Interactive Media & Services – 1.09% | ||||||||
| Alphabet, Inc., Class A (a) | 226 | 365,241 | ||||||
| Alphabet, Inc., Class C (a) | 45 | 72,945 | ||||||
| ANGI Homeservices, Inc., Class A (a) | 2,146 | 22,748 | ||||||
| Facebook, Inc., Class A (a) | 825 | 217,066 | ||||||
| IAC/InterActiveCorp (a) | 1,960 | 236,611 | ||||||
| QuinStreet, Inc. (a) | 7,009 | 112,179 | ||||||
| Snap, Inc., Class A (a) | 580 | 22,846 | ||||||
| Twitter, Inc. (a) | 174 | 7,197 | ||||||
| Zillow Group, Inc., Class C (a) | 72 | 6,381 | ||||||
| 1,063,214 | ||||||||
| Internet & Direct Marketing Retail – 0.54% | ||||||||
| Alibaba Group Holding Ltd. – ADR (a)(b) | 247 | 75,258 | ||||||
| Amazon.com, Inc. (a) | 91 | 276,290 | ||||||
| Booking Holdings, Inc. (a) | 23 | 37,317 | ||||||
| eBay, Inc. | 1,199 | 57,108 | ||||||
| Etsy, Inc. (a) | 134 | 16,293 | ||||||
| Expedia Group, Inc. | 408 | 38,413 | ||||||
The accompanying notes are an integral part of these financial statements.
17
WEISS ALTERNATIVE BALANCED RISK FUND
Schedule of Investments – Continued
October 31, 2020
| Shares | Value | |||||||
| Internet & Direct Marketing Retail – 0.54% (Continued) | ||||||||
| MercadoLibre, Inc. (a)(b) | 24 | $ | 29,137 | |||||
| Overstock.com, Inc. (a) | 23 | 1,290 | ||||||
| 531,106 | ||||||||
| IT Services – 1.58% | ||||||||
| Akamai Technologies, Inc. (a) | 2,555 | 243,032 | ||||||
| Conduent, Inc. (a) | 9,600 | 33,456 | ||||||
| DXC Technology Company | 9,235 | 170,109 | ||||||
| Fidelity National Information Services, Inc. | 290 | 36,131 | ||||||
| Fujitsu Ltd. (b) | 2,143 | 253,548 | ||||||
| Global Payments, Inc. (h) | 290 | 45,745 | ||||||
| LiveRamp Holdings, Inc. (a) | 4,586 | 303,089 | ||||||
| MongoDB, Inc. (a) | 18 | 4,112 | ||||||
| Nexi SpA (a)(b) | 1,540 | 23,707 | ||||||
| PayPal Holdings, Inc. (a)(h) | 398 | 74,080 | ||||||
| Sabre Corporation | 3,132 | 20,421 | ||||||
| Shift4 Payments, Inc., Class A (a) | 232 | 11,811 | ||||||
| Shopify, Inc., Class A (a)(b) | 65 | 60,153 | ||||||
| Snowflake, Inc., Class A (a) | 33 | 8,251 | ||||||
| Square, Inc., Class A (a) | 87 | 13,475 | ||||||
| Twilio, Inc., Class A (a) | 877 | 244,657 | ||||||
| 1,545,777 | ||||||||
| Leisure Products – 0.02% | ||||||||
| Brunswick Corporation | 120 | 7,645 | ||||||
| Old PSG Wind-Down Ltd. (a)(b)(g) | 2,127 | 202 | ||||||
| Peloton Interactive, Inc., Class A (a) | 103 | 11,352 | ||||||
| 19,199 | ||||||||
| Life Sciences Tools & Services – 0.27% | ||||||||
| Adaptive Biotechnologies Corporation (a) | 30 | 1,382 | ||||||
| Berkeley Lights, Inc. (a) | 184 | 13,353 | ||||||
| Fluidigm Corporation (a) | 120 | 689 | ||||||
| NanoString Technologies, Inc. (a) | 420 | 15,393 | ||||||
| Pacific Biosciences of California, Inc. (a) | 1,741 | 22,824 | ||||||
| PPD, Inc. (a) | 4,776 | 157,035 | ||||||
| Qiagen NV (a)(b) | 425 | 20,162 | ||||||
| Repligen Corporation (a) | 204 | 33,980 | ||||||
| 264,818 | ||||||||
| Machinery – 1.00% | ||||||||
| AGCO Corporation | 246 | 18,949 | ||||||
| Allison Transmission Holdings, Inc. | 185 | 6,688 | ||||||
The accompanying notes are an integral part of these financial statements.
18
WEISS ALTERNATIVE BALANCED RISK FUND
Schedule of Investments – Continued
October 31, 2020
| Shares | Value | |||||||
| Machinery – 1.00% (Continued) | ||||||||
| Caterpillar, Inc. | 116 | $ | 18,218 | |||||
| Chart Industries, Inc. (a) | 765 | 64,604 | ||||||
| Colfax Corporation (a) | 61 | 1,659 | ||||||
| Cummins, Inc. (h) | 953 | 209,555 | ||||||
| Deere & Company | 72 | 16,265 | ||||||
| Dover Corporation | 1,371 | 151,783 | ||||||
| Fortive Corporation | 585 | 36,036 | ||||||
| Illinois Tool Works, Inc. | 85 | 16,650 | ||||||
| ITT, Inc. | 62 | 3,752 | ||||||
| Navistar International Corporation | 936 | 40,351 | ||||||
| Otis Worldwide Corporation | 281 | 17,220 | ||||||
| Parker-Hannifin Corporation | 1,054 | 219,611 | ||||||
| Rexnord Corporation | 2,582 | 82,831 | ||||||
| Stanley Black & Decker, Inc. | 71 | 11,800 | ||||||
| The Timken Company | 988 | 58,984 | ||||||
| 974,956 | ||||||||
| Media – 0.63% | ||||||||
| Altice USA, Inc., Class A (a) | 5,235 | 141,083 | ||||||
| Charter Communications, Inc., Class A (a) | 165 | 99,630 | ||||||
| Comcast Corporation, Class A | 236 | 9,969 | ||||||
| comScore, Inc. (a) | 73,362 | 146,357 | ||||||
| Discovery, Inc., Class A (a) | 1,571 | 31,797 | ||||||
| DISH Network Corporation, Class A (a) | 541 | 13,790 | ||||||
| Nexstar Media Group, Inc., Class A | 1,478 | 121,787 | ||||||
| Sinclair Broadcast Group, Inc., Class A | 1,420 | 26,384 | ||||||
| TEGNA, Inc. | 1,959 | 23,567 | ||||||
| 614,364 | ||||||||
| Metals & Mining – 0.75% | ||||||||
| ArcelorMittal SA – ADR (a) | 5,102 | 69,387 | ||||||
| Barrick Gold Corporation (b) | 1,801 | 48,141 | ||||||
| ERO Copper Corporation (a)(b) | 481 | 6,300 | ||||||
| Freeport-McMoRan, Inc. | 14,845 | 257,412 | ||||||
| Orla Mining Ltd. (a)(b) | 2,102 | 8,472 | ||||||
| Vale SA – ADR (b) | 32,623 | 344,825 | ||||||
| 734,537 | ||||||||
| Multi-Utilities – 1.28% | ||||||||
| Ameren Corporation | 1,682 | 136,444 | ||||||
| CenterPoint Energy, Inc. | 13,411 | 283,374 | ||||||
| CMS Energy Corporation | 2,320 | 146,926 | ||||||
The accompanying notes are an integral part of these financial statements.
19
WEISS ALTERNATIVE BALANCED RISK FUND
Schedule of Investments – Continued
October 31, 2020
| Shares | Value | |||||||
| Multi-Utilities – 1.28% (Continued) | ||||||||
| Dominion Resources, Inc. | 3,159 | $ | 253,794 | |||||
| Just Energy Group, Inc. (a)(b) | 761 | 3,912 | ||||||
| NiSource, Inc. | 4,201 | 96,497 | ||||||
| Public Service Enterprise Group, Inc. | 1,566 | 91,063 | ||||||
| RWE AG (b) | 1,634 | 60,470 | ||||||
| Sempra Energy | 1,451 | 181,897 | ||||||
| 1,254,377 | ||||||||
| Oil, Gas & Consumable Fuels – 2.45% | �� | |||||||
| Apache Corporation | 26,651 | 221,203 | ||||||
| Ardmore Shipping Corporation (b) | 4,520 | 12,656 | ||||||
| Cabot Oil & Gas Corporation | 5,788 | 102,969 | ||||||
| Canadian Natural Resources Ltd. (b) | 5,016 | 80,005 | ||||||
| Cimarex Energy Company | 5,876 | 149,074 | ||||||
| CNX Resources Corporation (a) | 20,104 | 195,009 | ||||||
| Concho Resources, Inc. | 4,988 | 207,052 | ||||||
| EQT Corporation | 9,242 | 139,924 | ||||||
| Golar LNG Ltd. (a)(b) | 328 | 2,476 | ||||||
| Hess Corporation | 5,671 | 211,075 | ||||||
| Marathon Petroleum Corporation | 3,751 | 110,654 | ||||||
| Matador Resources Company (a) | 27,532 | 194,651 | ||||||
| Neste Oyj (b) | 878 | 45,791 | ||||||
| Nordic American Tankers Ltd. (b) | 3,900 | 11,349 | ||||||
| Northern Oil and Gas, Inc. (a) | 28,906 | 106,952 | ||||||
| Occidental Petroleum Corporation | 3,480 | 31,772 | ||||||
| Ovintiv, Inc. | 13,081 | 120,345 | ||||||
| Parsley Energy, Inc., Class A | 20,671 | 206,917 | ||||||
| PDC Energy, Inc. (a) | 13,314 | 158,703 | ||||||
| World Fuel Services Corporation | 1,177 | 24,776 | ||||||
| WPX Energy, Inc. (a) | 14,551 | 67,080 | ||||||
| 2,400,433 | ||||||||
| Paper & Forest Products – 0.03% | ||||||||
| Louisiana-Pacific Corporation | 961 | 27,465 | ||||||
| Personal Products – 0.07% | ||||||||
| e.l.f. Beauty, Inc. (a) | 580 | 11,757 | ||||||
| The Estee Lauder Companies, Inc., Class A | 237 | 52,059 | ||||||
| 63,816 | ||||||||
| Pharmaceuticals – 0.89% | ||||||||
| Aerie Pharmaceuticals, Inc. (a) | 132 | 1,400 | ||||||
| AstraZeneca plc – ADR (b) | 994 | 49,859 | ||||||
The accompanying notes are an integral part of these financial statements.
20
WEISS ALTERNATIVE BALANCED RISK FUND
Schedule of Investments – Continued
October 31, 2020
| Shares | Value | |||||||
| Pharmaceuticals – 0.89% (Continued) | ||||||||
| Axsome Therapeutics, Inc. (a) | 175 | $ | 11,604 | |||||
| Bristol Myers-Squibb Company | 1,097 | 64,120 | ||||||
| Cara Therapeutics, Inc. (a) | 480 | 6,365 | ||||||
| Catalent, Inc. (a) | 42 | 3,686 | ||||||
| Cresco Labs, Inc. (a) | 1,961 | 13,865 | ||||||
| Eli Lilly & Company | 116 | 15,133 | ||||||
| Green Thumb Industries, Inc. CA (a) | 7,199 | 112,662 | ||||||
| Green Thumb Industries, Inc. (a) | 5,170 | 81,376 | ||||||
| GW Pharmaceuticals plc – ADR (a)(b) | 241 | 21,692 | ||||||
| Horizon Therapeutics plc (a) | 433 | 32,445 | ||||||
| Intersect ENT, Inc. (a) | 479 | 7,424 | ||||||
| Intra-Cellular Therapies, Inc. (a) | 318 | 7,845 | ||||||
| Merck & Company, Inc. | 301 | 22,638 | ||||||
| MyoKardia, Inc. (a) | 1,602 | 358,095 | ||||||
| TherapeuticsMD, Inc. (a) | 1,848 | 2,255 | ||||||
| Reata Pharmaceuticals, Inc., Class A(a) | 217 | 25,326 | ||||||
| Relmada Therapeutics, Inc. (a) | 94 | 2,907 | ||||||
| Trulieve Cannabis Corporation (a) | 954 | 22,441 | ||||||
| Zogenix, Inc. (a) | 361 | 7,697 | ||||||
| 870,835 | ||||||||
| Professional Services – 0.12% | ||||||||
| CoreLogic, Inc. | 1,555 | 119,626 | ||||||
| Real Estate Investment Trusts (REITs) – 5.17% | ||||||||
| Acadia Realty Trust | 17,260 | 161,036 | ||||||
| Agree Realty Corporation | 3,052 | 189,438 | ||||||
| Americold Realty Trust | 8,382 | 303,680 | ||||||
| Brixmor Property Group, Inc. | 6,196 | 67,908 | ||||||
| Broadstone Net Lease, Inc., Class A | 1,598 | 26,367 | ||||||
| CareTrust REIT, Inc. | 13,877 | 237,297 | ||||||
| Cedar Realty Trust, Inc. | 27,984 | 26,585 | ||||||
| Corporate Office Properties Trust | 2,436 | 54,639 | ||||||
| Duke Realty Corporation | 5,084 | 193,141 | ||||||
| Equity Residential | 2,624 | 123,276 | ||||||
| First Industrial Realty Trust, Inc. | 3,588 | 142,838 | ||||||
| Franklin Street Properties Corporation | 16,177 | 67,943 | ||||||
| Front Yard Residential Corporation | 17,400 | 232,986 | ||||||
| Healthcare Realty Trust, Inc. | 3,656 | 101,637 | ||||||
| Highwoods Properties, Inc. | 5,328 | 158,615 | ||||||
| Invitation Homes, Inc. | 8,512 | 232,037 | ||||||
The accompanying notes are an integral part of these financial statements.
21
WEISS ALTERNATIVE BALANCED RISK FUND
Schedule of Investments – Continued
October 31, 2020
| Shares | Value | |||||||
| Real Estate Investment Trusts (REITs) – 5.17% (Continued) | ||||||||
| Kilroy Realty Corporation | 1,371 | $ | 64,547 | |||||
| Life Storage, Inc. | 901 | 102,849 | ||||||
| Mid-America Apartment Communities, Inc. | 1,495 | 174,362 | ||||||
| NETSTREIT Corporation | 8,112 | 142,284 | ||||||
| Piedmont Office Realty Trust, Inc., Class A | 27,433 | 313,285 | ||||||
| Plymouth Industrial REIT, Inc. | 5,763 | 73,248 | ||||||
| QTS Realty Trust, Inc., Class A | 1,027 | 63,171 | ||||||
| RPT Realty | 40,006 | 195,629 | ||||||
| Sabra Health Care REIT, Inc. | 12,995 | 171,014 | ||||||
| Spirit Realty Capital, Inc. | 10,347 | 310,927 | ||||||
| Sun Communities, Inc. | 385 | 52,988 | ||||||
| UDR, Inc. | 7,915 | 247,265 | ||||||
| Urban Edge Properties | 11,527 | 108,354 | ||||||
| Ventas, Inc. | 4,066 | 160,485 | ||||||
| VICI Properties, Inc. | 11,651 | 267,390 | ||||||
| Welltower, Inc. | 3,753 | 201,799 | ||||||
| Weyerhaeuser Company | 3,179 | 86,755 | ||||||
| 5,055,775 | ||||||||
| Road & Rail – 2.42% | ||||||||
| Canadian National Railway Company (b) | 348 | 34,609 | ||||||
| CSX Corporation | 609 | 48,074 | ||||||
| Heartland Express, Inc. | 471 | 8,624 | ||||||
| J.B. Hunt Transport Services, Inc. | 1,037 | 126,244 | ||||||
| Kansas City Southern | 3,890 | 685,185 | ||||||
| Knight-Swift Transportation Holdings, Inc. | 11,205 | 425,678 | ||||||
| Landstar System, Inc. | 116 | 14,465 | ||||||
| Norfolk Southern Corporation | 1,535 | 320,999 | ||||||
| Old Dominion Freight Line, Inc. | 376 | 71,579 | ||||||
| Ryder System, Inc. | 232 | 11,428 | ||||||
| Saia, Inc. (a) | 175 | 25,840 | ||||||
| Uber Technologies, Inc. (a) | 644 | 21,516 | ||||||
| Union Pacific Corporation | 2,564 | 454,315 | ||||||
| Werner Enterprises, Inc. | 3,204 | 121,816 | ||||||
| 2,370,372 | ||||||||
| Semiconductors & Semiconductor Equipment – 3.48% | ||||||||
| Advanced Micro Devices, Inc. (a) | 3,459 | 260,428 | ||||||
| Allegro Microsystems, Inc. (a) | 656 | 12,005 | ||||||
| Ambarella, Inc. (a) | 4,175 | 228,247 | ||||||
| Applied Materials, Inc. | 934 | 55,321 | ||||||
| ASML Holding NV – ADR (b) | 175 | 63,212 | ||||||
The accompanying notes are an integral part of these financial statements.
22
WEISS ALTERNATIVE BALANCED RISK FUND
Schedule of Investments – Continued
October 31, 2020
| Shares | Value | |||||||
| Semiconductors & Semiconductor Equipment – 3.48% (Continued) | ||||||||
| Broadcom, Inc. | 301 | $ | 105,239 | |||||
| Cree, Inc. (a) | 390 | 24,804 | ||||||
| Enphase Energy, Inc. (a) | 307 | 30,114 | ||||||
| First Solar, Inc. (a) | 240 | 20,891 | ||||||
| Inphi Corporation (a) | 209 | 29,210 | ||||||
| Lam Research Corporation | 112 | 38,313 | ||||||
| MACOM Technology Solutions Holdings, Inc. (a) | 3,426 | 125,049 | ||||||
| Marvell Technology Group Ltd. (h) | 4,494 | 168,570 | ||||||
| Maxim Integrated Products, Inc. | 3,341 | 232,701 | ||||||
| Micron Technology, Inc. (a) | 5,990 | 301,537 | ||||||
| NVIDIA Corporation | 294 | 147,400 | ||||||
| NXP Semiconductors NV (b)(h) | 3,141 | 424,412 | ||||||
| ON Semiconductor Corporation (a) | 2,244 | 56,302 | ||||||
| QUALCOMM, Inc. (h) | 3,941 | 486,162 | ||||||
| Skyworks Solutions, Inc. | 744 | 105,120 | ||||||
| SolarEdge Technologies, Inc. (a)(b) | 60 | 15,461 | ||||||
| Synaptics, Inc. (a) | 2,842 | 217,896 | ||||||
| Taiwan Semiconductor Manufacturing Company Ltd. – ADR (b) | 775 | 64,999 | ||||||
| Texas Instruments, Inc. (h) | 128 | 18,508 | ||||||
| Xilinx, Inc. (h) | 1,397 | 165,810 | ||||||
| 3,397,711 | ||||||||
| Software – 3.77% | ||||||||
| Adobe, Inc. (a) | 627 | 280,332 | ||||||
| Atlassian Corporation plc, Class A (a)(b) | 234 | 44,839 | ||||||
| Autodesk, Inc. (a) | 174 | 40,984 | ||||||
| Avalara, Inc. (a) | 84 | 12,520 | ||||||
| Avaya Holdings Corporation (a) | 24,216 | 416,515 | ||||||
| Box, Inc., Class A (a) | 403 | 6,246 | ||||||
| Cadence Design Systems, Inc. (a) | 577 | 63,106 | ||||||
| Check Point Software Technologies Ltd. (a)(b)(h) | 2,456 | 278,903 | ||||||
| Cloudera, Inc. (a) | 1,565 | 15,212 | ||||||
| CommVault Systems, Inc. (a) | 290 | 11,481 | ||||||
| Crowdstrike Holdings, Inc., Class A (a)(h) | 1,607 | 199,011 | ||||||
| CyberArk Software Ltd. (a)(b) | 290 | 28,753 | ||||||
| Datadog, Inc., Class A (a) | 111 | 10,073 | ||||||
| The Descartes Systems Group, Inc. (a)(b) | 218 | 11,720 | ||||||
| DocuSign, Inc. (a) | 275 | 55,619 | ||||||
| Domo, Inc., Class B (a) | 647 | 20,555 | ||||||
| Dynatrace, Inc. (a) | 354 | 12,500 | ||||||
| Elastic NV (a) | 253 | 25,657 | ||||||
The accompanying notes are an integral part of these financial statements.
23
WEISS ALTERNATIVE BALANCED RISK FUND
Schedule of Investments – Continued
October 31, 2020
| Shares | Value | |||||||
| Software – 3.77% (Continued) | ||||||||
| FireEye, Inc. (a)(h) | 14,851 | $ | 205,538 | |||||
| HubSpot, Inc. (a) | 404 | 117,188 | ||||||
| JFrog Ltd. (a)(b) | 129 | 9,343 | ||||||
| LivePerson, Inc. (a) | 650 | 34,749 | ||||||
| Manhattan Associates, Inc. (a) | 482 | 41,211 | ||||||
| McAfee Corporation, Class A (a) | 889 | 14,900 | ||||||
| Microsoft Corporation | 2,434 | 492,812 | ||||||
| MobileIron, Inc. (a) | 1,360 | 9,574 | ||||||
| Oracle Corporation (h) | 142 | 7,968 | ||||||
| Palo Alto Networks, Inc. (a)(h) | 1,150 | 254,368 | ||||||
| RingCentral, Inc., Class A (a) | 384 | 99,203 | ||||||
| SailPoint Technologies Holdings, Inc. (a) | 845 | 35,076 | ||||||
| salesforce.com, Inc. (a)(h) | 1,158 | 268,969 | ||||||
| ServiceNow, Inc. (a) | 211 | 104,987 | ||||||
| Slack Technologies, Inc., Class A (a) | 2,312 | 59,141 | ||||||
| Smartsheet, Inc., Class A (a) | 120 | 5,982 | ||||||
| SVMK, Inc. (a) | 444 | 9,293 | ||||||
| Synopsys, Inc. (a) | 301 | 64,372 | ||||||
| Tenable Holdings, Inc. (a) | 1,587 | 54,133 | ||||||
| Tufin Software Technologies Ltd. (a)(b) | 2,204 | 14,194 | ||||||
| Unity Software, Inc. (a) | 116 | 11,006 | ||||||
| Varonis Systems, Inc. (a) | 176 | 20,340 | ||||||
| Workday, Inc., Class A (a) | 175 | 36,771 | ||||||
| Zendesk, Inc. (a) | 128 | 14,200 | ||||||
| Zoom Video Communications, Inc., Class A (a) | 70 | 32,264 | ||||||
| Zscaler, Inc. (a) | 952 | 129,234 | ||||||
| 3,680,842 | ||||||||
| Special Purpose Acquisition Vehicle – 1.11% | ||||||||
| ACON S2 Acquisition Corporation (a) | 646 | 6,395 | ||||||
| AEA-Bridges Impact Corporation (a)(b) | 1,078 | 10,705 | ||||||
| Ajax I (a) | 426 | 4,294 | ||||||
| Alussa Energy Acquisition Corporation, Class A (a)(b) | 370 | 3,644 | ||||||
| Apollo Strategic Growth Capital (a) | 961 | 9,572 | ||||||
| Artius Acquisition, Inc. (a) | 639 | 6,371 | ||||||
| Atlas Crest Investment Corporation (a) | 856 | 8,500 | ||||||
| Avanti Acquisition Corporation (a)(b) | 855 | 8,473 | ||||||
| Bridgetown Holdings Ltd. (a)(b) | 470 | 4,747 | ||||||
| Burgundy Technology Acquisition Corporation (a) | 207 | 2,060 | ||||||
| Churchill Capital Corporation II, Class A (a) | 638 | 6,361 | ||||||
| Churchill Capital Corporation IV, Class A (a) | 363 | 3,496 | ||||||
| CM Life Sciences, Inc., Class A (a) | 63,233 | 829,301 | ||||||
The accompanying notes are an integral part of these financial statements.
24
WEISS ALTERNATIVE BALANCED RISK FUND
Schedule of Investments – Continued
October 31, 2020
| Shares | Value | |||||||
| Special Purpose Acquisition Vehicle – 1.11% (Continued) | ||||||||
| Cohn Robbins Holdings Corporation (a) | 413 | $ | 4,122 | |||||
| D8 Holdings Corporation (a)(b) | 363 | 3,612 | ||||||
| Equity Distribution Acquisition Corporation (a) | 207 | 2,080 | ||||||
| Flying Eagle Acquisition Corporation, Class A (a) | 290 | 3,344 | ||||||
| Foley Trasimene Acquisition Corporation II (a) | 1,248 | 12,430 | ||||||
| Fusion Acquisition Corporation, Class A (a) | 258 | 2,526 | ||||||
| GO Acquisition Corporation (a) | 633 | 6,286 | ||||||
| Gores Holdings IV, Inc., Class A (a) | 629 | 6,259 | ||||||
| Gores Metropoulos, Inc., Class A (a) | 1,204 | 12,281 | ||||||
| GS Acquisition Holdings Corporation II (a) | 972 | 10,012 | ||||||
| Haymaker Acquisition Corporation II, Class A (a) | 777 | 7,786 | ||||||
| HPX Corporation (a) | 416 | 4,185 | ||||||
| Lefteris Acquisition Corporation (a) | 1,046 | 10,345 | ||||||
| LGL Systems Acquisition Corporation, Class A (a) | 1 | 10 | ||||||
| Oaktree Acquisition Corporation II (a) | 1,473 | 14,730 | ||||||
| Peridot Acquisition Corporation (a) | 756 | 7,496 | ||||||
| Reinvent Technology Partners (a) | 20 | 215 | ||||||
| Social Capital Hedosophia Holdings Corporation III (a) | 186 | 1,933 | ||||||
| Spartacus Acquisition Corporation (a) | 570 | 5,660 | ||||||
| Star Peak Energy Transition Corporation (a) | 425 | 4,241 | ||||||
| Starboard Value Acquisition Corporation (a) | 755 | 7,512 | ||||||
| Sustainable Opportunities Acquisition Corporation (a) | 575 | 5,934 | ||||||
| Tortoise Acquisition Corporation II (a) | 80 | 818 | ||||||
| TPG Pace Beneficial Finance Corporation (a) | 1,366 | 13,674 | ||||||
| TPG Pace Tech Opportunities Corporation (a) | 1,364 | 13,640 | ||||||
| Turmeric Acquisition Corporation (a) | 939 | 9,343 | ||||||
| VG Acquisition Corporation (a) | 431 | 4,258 | ||||||
| Vy Global Growth (a)(b) | 1,004 | 10,331 | ||||||
| 1,088,982 | ||||||||
| Specialty Retail – 0.62% | ||||||||
| Aaron’s Holdings Company, Inc. | 1,106 | 57,800 | ||||||
| Best Buy Company, Inc. | 568 | 63,360 | ||||||
| Carvana Company (a) | 47 | 8,711 | ||||||
| Dick’s Sporting Goods, Inc. (h) | 630 | 35,689 | ||||||
| Gamestop Corporation, Class A (a)(h) | 840 | 8,795 | ||||||
| The Gap, Inc. | 351 | 6,827 | ||||||
| GrowGeneration Corporation (a) | 2,494 | 41,650 | ||||||
| The Home Depot, Inc. | 45 | 12,002 | ||||||
| Leslie’s, Inc. (a) | 78 | 1,714 | ||||||
| Lithia Motors, Inc., Class A | 219 | 50,276 | ||||||
| Lowe’s Companies, Inc. (h) | 596 | 94,228 | ||||||
The accompanying notes are an integral part of these financial statements.
25
WEISS ALTERNATIVE BALANCED RISK FUND
Schedule of Investments – Continued
October 31, 2020
| Shares | Value | |||||||
| Specialty Retail – 0.62% (Continued) | ||||||||
| Tiffany & Company | 1,627 | $ | 212,877 | |||||
| Williams-Sonoma, Inc. | 182 | 16,600 | ||||||
| 610,529 | ||||||||
| Technology Hardware, Storage & Peripherals – 0.45% | ||||||||
| Apple, Inc. | 2,682 | 291,963 | ||||||
| Dell Technologies, Inc., Class C (a) | 2,474 | 149,083 | ||||||
| 441,046 | ||||||||
| Textiles, Apparel & Luxury Goods – 0.04% | ||||||||
| NIKE, Inc., Class B | 311 | 37,345 | ||||||
| Tobacco – 0.05% | ||||||||
| Philip Morris International, Inc. | 718 | 50,992 | ||||||
| Trading Companies & Distributors – 0.11% | ||||||||
| BMC Stock Holdings, Inc. (a) | 1,018 | 40,303 | ||||||
| HD Supply Holdings, Inc. (a) | 534 | 21,285 | ||||||
| MSC Industrial Direct Company, Inc. | 262 | 18,251 | ||||||
| United Rentals, Inc. (a) | 129 | 22,999 | ||||||
| WESCO International, Inc. (a) | 198 | 8,166 | ||||||
| 111,004 | ||||||||
| Wireless Communication Services – 0.01% | ||||||||
| NII Holdings, Inc. (a)(g) | 6,235 | 13,405 | ||||||
| Wireless Telecommunication Services – 0.13% | ||||||||
| T-Mobile U.S., Inc. (a) | 1,196 | 131,046 | ||||||
| Total Long Common Stocks | ||||||||
| (Cost $44,015,746) | 42,878,018 | |||||||
| LONG CONTINGENT VALUE RIGHTS – 0.00% | ||||||||
| A. Menarini Industrie Farmaceutiche Riunite Srl (a)(g) | 523 | 157 | ||||||
| Total Long Contingent Value Rights | ||||||||
| (Cost $—) | 157 | |||||||
| LONG RIGHTS – 0.02% | ||||||||
| Bristol-Myers Squibb Company (a) | 4,606 | 15,016 | ||||||
| Pan American Silver Corporation (a)(b) | 2,345 | 1,688 | ||||||
| Total Long Rights | ||||||||
| (Cost $13,373) | 16,704 | |||||||
The accompanying notes are an integral part of these financial statements.
26
WEISS ALTERNATIVE BALANCED RISK FUND
Schedule of Investments – Continued
October 31, 2020
| Shares | Value | |||||||
| LONG WARRANTS – 0.06% | ||||||||
| CM Life Sciences, Inc. (a) | ||||||||
| Exercise Price: $11.50, 9/4/2027 | 21,078 | $ | 42,261 | |||||
| International General Insurance Holdings Ltd. (a) | ||||||||
| Exercise Price: $25.00, 3/17/2025 | 29,450 | 18,848 | ||||||
| Multiplan Corporation (a) | ||||||||
| Exercise Price: $27.00, 10/8/2025 | 1,725 | 2,191 | ||||||
| Valeritas Holdings, Inc. (a)(g) | ||||||||
| Exercise Price: $12.00, 11/14/2023 | 1,688 | — | ||||||
| Total Long Warrants | ||||||||
| (Cost $61,599) | 63,300 | |||||||
| LONG EXCHANGE TRADED FUNDS – 39.24% | ||||||||
| Energy Select Sector SPDR Fund | 1,089 | 31,276 | ||||||
| Financial Select Sector SPDR Fund | 1,392 | 33,213 | ||||||
| Health Care Select Sector SPDR Fund | 30 | 3,050 | ||||||
| Industrial Select Sector SPDR Fund | 1,041 | 78,981 | ||||||
| Invesco QQQ Trust Series 1 | 73 | 19,665 | ||||||
| Invesco S&P 500 Equal Weight ETF | 1,048 | 112,670 | ||||||
| iShares 20+ Year Treasury Bond ETF (h) | 1,497 | 235,882 | ||||||
| iShares China Large-Cap ETF | 58 | 2,558 | ||||||
| iShares iBoxx $High Yield Corporate Bond ETF (d) | 222,700 | 18,680,076 | ||||||
| iShares iBoxx $Investment Grade Corporate Bond ETF (d) | 138,500 | 18,521,605 | ||||||
| iShares MSCI China ETF | 65 | 5,052 | ||||||
| iShares MSCI Germany ETF | 41 | 1,077 | ||||||
| iShares Russell 2000 ETF (h) | 124 | 18,983 | ||||||
| iShares Silver Trust (a) | 116 | 2,551 | ||||||
| iShares U.S. Home Construction ETF | 496 | 25,802 | ||||||
| ProShares VIX Short-Term Futures ETF (a) | 737 | 16,015 | ||||||
| SPDR Gold Shares (a) | 905 | 159,461 | ||||||
| SPDR S&P 500 ETF Trust (h) | 249 | 81,308 | ||||||
| SPDR S&P Biotech ETF | 26 | 2,932 | ||||||
| SPDR S&P Homebuilders ETF | 574 | 29,836 | ||||||
| SPDR S&P Metals & Mining ETF | 7,579 | 185,155 | ||||||
| SPDR S&P Regional Banking ETF | 978 | 40,245 | ||||||
| SPDR S&P Retail ETF | 965 | 48,096 | ||||||
| VanEck Vectors Gold Miners ETF (a) | 348 | 13,047 | ||||||
| VanEck Vectors Semiconductor ETF (a)(h) | 103 | 18,020 | ||||||
| Total Long Exchange Traded Funds | ||||||||
| (Cost $36,778,217) | 38,366,556 | |||||||
The accompanying notes are an integral part of these financial statements.
27
WEISS ALTERNATIVE BALANCED RISK FUND
Schedule of Investments – Continued
October 31, 2020
| Shares | Value | |||||||
| LONG PREFERRED STOCKS – 0.01% | ||||||||
| Volkswagen AG (b) | 51 | $ | 7,429 | |||||
| Total Long Preferred Stocks | ||||||||
| (Cost $8,291) | 7,429 | |||||||
| Notional | ||||||||||||
| PURCHASED OPTIONS (a) – 0.12% | Contracts (c) | Amount | ||||||||||
| Purchased Call Options – 0.05% | ||||||||||||
| American Electric Power Company, Inc. | ||||||||||||
| Expiration: November 2020, Exercise Price: $92.50 | 29 | $ | 260,797 | 3,915 | ||||||||
| Amgen, Inc. | ||||||||||||
| Expiration: November 2020, Exercise Price: $240.00 | 1 | 21,694 | 121 | |||||||||
| Aramark | ||||||||||||
| Expiration: December 2020, Exercise Price: $33.00 | 7 | 19,418 | 367 | |||||||||
| Collegium Pharmaceutical, Inc. | ||||||||||||
| Expiration: November 2020, Exercise Price: $22.50 | 1 | 1,783 | 10 | |||||||||
| Cummins, Inc. (h) | ||||||||||||
| Expiration: November 2020, Exercise Price: $230.00 | 1 | 21,989 | 350 | |||||||||
| Direxion Daily S&P Bear 3X Shares | ||||||||||||
| Expiration: November 2020, Exercise Price: $7.00 | 26 | 15,834 | 1,118 | |||||||||
| Exelon Corporation | ||||||||||||
| Expiration: November 2020, Exercise Price: $41.00 | 44 | 175,516 | 3,740 | |||||||||
| Financial Select Sector SPDR Fund | ||||||||||||
| Expiration: November 2020, Exercise Price: $25.00 | 22 | 52,492 | 935 | |||||||||
| FireEye, Inc. (h) | ||||||||||||
| Expiration: January 2021, Exercise Price: $14.00 | 27 | 37,368 | 2,983 | |||||||||
| Ford Motor Company | ||||||||||||
| Expiration: November 2020, Exercise Price: $8.50 | 20 | 15,460 | 250 | |||||||||
| GameStop Corporation (h) | ||||||||||||
| Expiration: January 2021, Exercise Price: $12.00 | 2 | 2,094 | 433 | |||||||||
| General Electric Company | ||||||||||||
| Expiration: December 2020, Exercise Price: $7.00 | 20 | 14,840 | 1,680 | |||||||||
| General Motors Company (h) | ||||||||||||
| Expiration: January 2021, Exercise Price: $35.00 | 21 | 72,513 | 6,300 | |||||||||
| Golar LNG Ltd. | ||||||||||||
| Expiration: December 2020, Exercise Price: $10.00 | 24 | 18,120 | 1,140 | |||||||||
| iShares 20+ Year Treasury Bond ETF (h) | ||||||||||||
| Expiration: November 2020, Exercise Price: $163.00 | 28 | 441,196 | 1,386 | |||||||||
| iShares MSCI Singapore ETF | ||||||||||||
| Expiration: December 2020, Exercise Price: $20.00 | 7 | 12,621 | 35 | |||||||||
| iShares Russell 2000 ETF (h) | ||||||||||||
| Expiration: December 2020, Exercise Price: $163.00 | 8 | 122,472 | 2,780 | |||||||||
The accompanying notes are an integral part of these financial statements.
28
WEISS ALTERNATIVE BALANCED RISK FUND
Schedule of Investments – Continued
October 31, 2020
| Notional | ||||||||||||
| Contracts (c) | Amount | Value | ||||||||||
| Purchased Call Options – 0.05% (Continued) | ||||||||||||
| Las Vegas Sands Corporation (h) | ||||||||||||
| Expiration: November 2020, Exercise Price: $51.00 | 4 | $ | 19,224 | $ | 630 | |||||||
| Lowe’s Companies, Inc. (h) | ||||||||||||
| Expiration: November 2020, Exercise Price: $185.00 | 4 | 63,240 | 232 | |||||||||
| Lyft, Inc. (h) | ||||||||||||
| Expiration: November 2020, Exercise Price: $26.00 | 2 | 4,566 | 240 | |||||||||
| Marriott International, Inc. | ||||||||||||
| Expiration: November 2020, Exercise Price: $120.00 | 4 | 37,152 | 146 | |||||||||
| Marvell Technology Group Ltd. | ||||||||||||
| Expiration: December 2020, Exercise Price: $40.00 | 8 | 30,008 | 1,512 | |||||||||
| Navigator Holdings Ltd. | ||||||||||||
| Expiration: December 2020, Exercise Price: $10.00 | 13 | 8,905 | 260 | |||||||||
| NextEra Energy Partners LP (h) | ||||||||||||
| Expiration: November 2020, Exercise Price: $70.00 | 24 | 150,720 | 1,200 | |||||||||
| Sanderson Farms, Inc. | ||||||||||||
| Expiration: November 2020, Exercise Price: $155.00 | 5 | 63,985 | 737 | |||||||||
| Expiration: December 2020, Exercise Price: $155.00 | 2 | 25,594 | 600 | |||||||||
| Scorpio Tankers, Inc. | ||||||||||||
| Expiration: November 2020, Exercise Price: $13.00 | 26 | 22,932 | 260 | |||||||||
| The Southern Company | ||||||||||||
| Expiration: November 2020, Exercise Price: $61.00 | 24 | 137,880 | 864 | |||||||||
| SPDR S&P 500 ETF Trust (h) | ||||||||||||
| Expiration: November 2020, Exercise Price: $345.00 | 7 | 228,578 | 2,030 | |||||||||
| Tilray, Inc. | ||||||||||||
| Expiration: November 2020, Exercise Price: $7.00 | 5 | 2,855 | 175 | |||||||||
| United States Natural Gas Fund LP (h) | ||||||||||||
| Expiration: January 2021, Exercise Price: $14.00 | 43 | 54,782 | 4,407 | |||||||||
| The Walt Disney Company (h) | ||||||||||||
| Expiration: December 2020, Exercise Price: $135.00 | 3 | 36,375 | 738 | |||||||||
| Wynn Resorts Ltd. | ||||||||||||
| Expiration: January 2021, Exercise Price: $80.00 | 6 | 43,458 | 3,615 | |||||||||
| Xilinx, Inc. (h) | ||||||||||||
| Expiration: November 2020, Exercise Price: $125.00 | 18 | 213,642 | 5,553 | |||||||||
| Zynga, Inc. (h) | ||||||||||||
| Expiration: November 2020, Exercise Price: $9.00 | 21 | 18,879 | 1,166 | |||||||||
| 51,908 | ||||||||||||
| Purchased Put Options – 0.07% | ||||||||||||
| The Blackstone Group, Inc. | ||||||||||||
| Expiration: December 2020, Exercise Price: $50.00 | 32 | 161,344 | 9,056 | |||||||||
The accompanying notes are an integral part of these financial statements.
29
WEISS ALTERNATIVE BALANCED RISK FUND
Schedule of Investments – Continued
October 31, 2020
| Notional | ||||||||||||
| Contracts (c) | Amount | Value | ||||||||||
| Purchased Put Options – 0.07% (Continued) | ||||||||||||
| CBOE Volatility Index | ||||||||||||
| Expiration: November 2020, Exercise Price: $22.00 | 2 | $ | 7,604 | $ | 40 | |||||||
| Expiration: November 2020, Exercise Price: $25.00 | 18 | 68,436 | 1,395 | |||||||||
| Cytokinetics, Inc. | ||||||||||||
| Expiration: November 2020, Exercise Price: $20.00 | 1 | 1,537 | 500 | |||||||||
| Electronic Arts, Inc. (h) | ||||||||||||
| Expiration: November 2020, Exercise Price: $120.00 | 5 | 59,915 | 2,675 | |||||||||
| iShares Global Clean Energy ETF | ||||||||||||
| Expiration: November 2020, Exercise Price: $19.00 | 13 | 25,428 | 1,300 | |||||||||
| iShares iBoxx High Yield Corporate Bond ETF | ||||||||||||
| Expiration: November 2020, Exercise Price: $81.00 | 13 | 109,044 | 760 | |||||||||
| iShares Russell 2000 ETF (h) | ||||||||||||
| Expiration: November 2020, Exercise Price: $152.00 | 23 | 352,107 | 8,142 | |||||||||
| KKR & Company, Inc. | ||||||||||||
| Expiration: December 2020, Exercise Price: $35.00 | 43 | 146,845 | 11,073 | |||||||||
| Penn National Gaming, Inc. (h) | ||||||||||||
| Expiration: November 2020, Exercise Price: $60.00 | 3 | 16,194 | 2,558 | |||||||||
| Reata Pharmaceuticals, Inc. | ||||||||||||
| Expiration: December 2020, Exercise Price: $75.00 | 1 | 11,671 | 455 | |||||||||
| Expiration: December 2020, Exercise Price: $80.00 | 1 | 11,671 | 595 | |||||||||
| Expiration: December 2020, Exercise Price: $85.00 | 1 | 11,671 | 750 | |||||||||
| S&P 500 Index | ||||||||||||
| Expiration: December 2020, Exercise Price: $3,350.00 | 1 | 326,996 | 18,624 | |||||||||
| Silgan Holdings, Inc. | ||||||||||||
| Expiration: November 2020, Exercise Price: $30.00 | 2 | 6,890 | 235 | |||||||||
| Utilities Select Sector SPDR Fund | ||||||||||||
| Expiration: November 2020, Exercise Price: $62.00 | 47 | 293,186 | 4,230 | |||||||||
| 62,388 | ||||||||||||
| Total Purchased Options | ||||||||||||
| (Cost $127,363) | 114,296 | |||||||||||
| LONG SHORT-TERM INVESTMENTS – 11.96% | Shares | |||||||
| Fidelity Investments Money Market Funds Government | ||||||||
| Portfolio, Institutional Class, 0.01% (e) | 11,688,982 | 11,688,982 | ||||||
| Total Long Short-Term Investments | ||||||||
| (Cost $11,688,982) | 11,688,982 | |||||||
| Total Long Investments | ||||||||
| (Cost $92,693,571) – 95.26% | 93,135,442 | |||||||
The accompanying notes are an integral part of these financial statements.
30
WEISS ALTERNATIVE BALANCED RISK FUND
Schedule of Investments – Continued
October 31, 2020
| Shares | Value | |||||||
| SECURITIES SOLD SHORT (f) – (36.26)% | ||||||||
| SHORT COMMON STOCKS – (25.19)% | ||||||||
| Aerospace & Defense – (0.52)% | ||||||||
| AeroVironment, Inc. | (9 | ) | $ | (687 | ) | |||
| The Boeing Company | (1,903 | ) | (274,774 | ) | ||||
| Cubic Corporation | (22 | ) | (1,300 | ) | ||||
| General Dynamics Corporation | (424 | ) | (55,684 | ) | ||||
| Hexcel Corporation | (2,441 | ) | (81,725 | ) | ||||
| L3Harris Technologies, Inc. | (11 | ) | (1,772 | ) | ||||
| Northrop Grumman Corporation | (6 | ) | (1,739 | ) | ||||
| Textron, Inc. | (1,127 | ) | (40,347 | ) | ||||
| TransDigm Group, Inc. | (108 | ) | (51,560 | ) | ||||
| (509,588 | ) | |||||||
| Air Freight & Logistics – (0.10)% | ||||||||
| Atlas Air Worldwide Holdings, Inc. | (464 | ) | (27,450 | ) | ||||
| DSV PANALPINA A/S (b) | (62 | ) | (10,059 | ) | ||||
| Expeditors International of Washington, Inc. | (723 | ) | (63,892 | ) | ||||
| (101,401 | ) | |||||||
| Airlines – (0.02)% | ||||||||
| American Airlines Group, Inc. | (464 | ) | (5,234 | ) | ||||
| Copa Holdings SA, Class A (b) | (108 | ) | (5,322 | ) | ||||
| United Airlines Holdings, Inc. | (372 | ) | (12,596 | ) | ||||
| (23,152 | ) | |||||||
| Auto Components – (0.05)% | ||||||||
| Autoliv, Inc. (b) | (625 | ) | (47,375 | ) | ||||
| Automobiles – (0.08)% | ||||||||
| Ferrari NV (b) | (12 | ) | (2,141 | ) | ||||
| Ford Motor Company | (9,287 | ) | (71,789 | ) | ||||
| General Motors Company | (40 | ) | (1,381 | ) | ||||
| Tesla, Inc. | (6 | ) | (2,328 | ) | ||||
| (77,639 | ) | |||||||
| Banks – (0.48)% | ||||||||
| Banco Bilbao Vizcaya Argentaria SA (b) | (35,125 | ) | (101,341 | ) | ||||
| Citizens Financial Group, Inc. | (2,218 | ) | (60,440 | ) | ||||
| Danske Bank A/S (b) | (2,514 | ) | (33,506 | ) | ||||
| DNB ASA (b) | (580 | ) | (7,833 | ) | ||||
| Erste Group Bank AG (b) | (3,787 | ) | (77,843 | ) | ||||
| First Citizens BancShares, Inc., Class A | (5 | ) | (2,313 | ) | ||||
The accompanying notes are an integral part of these financial statements.
31
WEISS ALTERNATIVE BALANCED RISK FUND
Schedule of Investments – Continued
October 31, 2020
| Shares | Value | |||||||
| Banks – (0.48)% (Continued) | ||||||||
| Intesa Sanpaolo SpA (b) | (48,483 | ) | $ | (80,487 | ) | |||
| Mizuho Financial Group, Inc. (b) | (1,035 | ) | (12,743 | ) | ||||
| National Bank of Canada (b) | (371 | ) | (17,805 | ) | ||||
| Royal Bank of Canada (b) | (396 | ) | (27,690 | ) | ||||
| Swedbank AB, Class A (b) | (3,106 | ) | (48,626 | ) | ||||
| (470,627 | ) | |||||||
| Beverages – (0.78)% | ||||||||
| Anheuser-Busch InBev SA/NV – ADR (b) | (3,237 | ) | (168,033 | ) | ||||
| Anheuser-Busch InBev SA/NV (b) | (3,972 | ) | (205,456 | ) | ||||
| Brown-Forman Corporation, Class B | (176 | ) | (12,269 | ) | ||||
| The Coca-Cola Company | (228 | ) | (10,958 | ) | ||||
| Heineken NV (b) | (2,265 | ) | (200,492 | ) | ||||
| Molson Coors Brewing Company, Class B | (755 | ) | (26,621 | ) | ||||
| PepsiCo, Inc. | (1,056 | ) | (140,754 | ) | ||||
| (764,583 | ) | |||||||
| Biotechnology – (0.44)% | ||||||||
| AbbVie, Inc. | (3,882 | ) | (330,358 | ) | ||||
| Allakos, Inc. | (12 | ) | (1,142 | ) | ||||
| Amgen, Inc. | (300 | ) | (65,082 | ) | ||||
| Arrowhead Pharmaceuticals, Inc. | (40 | ) | (2,292 | ) | ||||
| Denali Therapeutics, Inc. | (151 | ) | (6,460 | ) | ||||
| Forma Therapeutics Holdings, Inc. | (17 | ) | (733 | ) | ||||
| Generation Bio Company | (62 | ) | (1,602 | ) | ||||
| Moderna, Inc. | (137 | ) | (9,243 | ) | ||||
| Passage Bio, Inc. | (874 | ) | (14,692 | ) | ||||
| (431,604 | ) | |||||||
| Building Products – (0.20)% | ||||||||
| A.O. Smith Corporation | (588 | ) | (30,394 | ) | ||||
| Allegion plc (b) | (302 | ) | (29,747 | ) | ||||
| Apogee Enterprises, Inc. | (4 | ) | (96 | ) | ||||
| Armstrong World Industries, Inc. | (141 | ) | (8,446 | ) | ||||
| Builders FirstSource, Inc. | (1,335 | ) | (40,450 | ) | ||||
| JELD-WEN Holding, Inc. | (1 | ) | (21 | ) | ||||
| Lennox International, Inc. | (261 | ) | (70,903 | ) | ||||
| Owens Corning | (275 | ) | (18,004 | ) | ||||
| (198,061 | ) | |||||||
| Capital Markets – (0.31)% | ||||||||
| Ameriprise Financial, Inc. | (12 | ) | (1,930 | ) | ||||
| Azimut Holding SpA (b) | (1,027 | ) | (17,311 | ) | ||||
The accompanying notes are an integral part of these financial statements.
32
WEISS ALTERNATIVE BALANCED RISK FUND
Schedule of Investments – Continued
October 31, 2020
| Shares | Value | |||||||
| Capital Markets – (0.31)% (Continued) | ||||||||
| Credit Suisse Group AG (b) | (1,480 | ) | $ | (13,958 | ) | |||
| Deutsche Bank AG (b) | (10,801 | ) | (99,813 | ) | ||||
| FactSet Research Systems, Inc. | (84 | ) | (25,746 | ) | ||||
| Morgan Stanley | (2,442 | ) | (117,582 | ) | ||||
| Partners Group Holding AG (b) | (28 | ) | (25,209 | ) | ||||
| Raymond James Financial, Inc. | (24 | ) | (1,835 | ) | ||||
| (303,384 | ) | |||||||
| Chemicals – (0.65)% | ||||||||
| Albemarle Corporation | (1,456 | ) | (135,714 | ) | ||||
| Balchem Corporation | (4 | ) | (400 | ) | ||||
| BASF SE (b) | (1,550 | ) | (84,875 | ) | ||||
| Chr Hansen Holding A/S (b) | (486 | ) | (49,042 | ) | ||||
| Dow, Inc. | (38 | ) | (1,729 | ) | ||||
| Evonik Industries AG (b) | (6,962 | ) | (167,623 | ) | ||||
| International Flavors & Fragrances, Inc. | (1,225 | ) | (125,758 | ) | ||||
| LyondellBasell Industries NV, Class A | (815 | ) | (55,787 | ) | ||||
| Olin Corporation | (812 | ) | (13,439 | ) | ||||
| (634,367 | ) | |||||||
| Commercial Services & Supplies – (0.06)% | ||||||||
| Interface, Inc. | (1 | ) | (6 | ) | ||||
| Republic Services, Inc. | (329 | ) | (29,008 | ) | ||||
| Waste Connections, Inc. | (328 | ) | (32,577 | ) | ||||
| (61,591 | ) | |||||||
| Communications Equipment – (0.38)% | ||||||||
| Cisco Systems, Inc. | (7,041 | ) | (252,772 | ) | ||||
| Nokia OYJ – ADR (b) | (34,800 | ) | (117,276 | ) | ||||
| (370,048 | ) | |||||||
| Construction & Engineering – 0.00% | ||||||||
| AECOM | (41 | ) | (1,838 | ) | ||||
| Construction Materials – (0.05)% | ||||||||
| Cemex SAB de CV – ADR (b) | (21 | ) | (87 | ) | ||||
| Eagle Materials, Inc. | (45 | ) | (3,836 | ) | ||||
| Martin Marietta Materials, Inc. | (146 | ) | (38,887 | ) | ||||
| Vulcan Materials Company | (34 | ) | (4,925 | ) | ||||
| (47,735 | ) | |||||||
| Consumer Finance – (0.13)% | ||||||||
| Credit Acceptance Corporation | (335 | ) | (99,870 | ) | ||||
The accompanying notes are an integral part of these financial statements.
33
WEISS ALTERNATIVE BALANCED RISK FUND
Schedule of Investments – Continued
October 31, 2020
| Shares | Value | |||||||
| Consumer Finance – (0.13)% (Continued) | ||||||||
| Discover Financial Services | (352 | ) | $ | (22,884 | ) | |||
| (122,754 | ) | |||||||
| Containers & Packaging – (0.06)% | ||||||||
| Amcor plc (b) | (4,802 | ) | (50,085 | ) | ||||
| O-I Glass, Inc. | (464 | ) | (4,376 | ) | ||||
| (54,461 | ) | |||||||
| Distributors – 0.00% | ||||||||
| LKQ Corporation | (64 | ) | (2,047 | ) | ||||
| Diversified Consumer Services – 0.00% | ||||||||
| Grand Canyon Education, Inc. | (12 | ) | (940 | ) | ||||
| Service Corporation International | (42 | ) | (1,945 | ) | ||||
| (2,885 | ) | |||||||
| Diversified Telecommunication Services – (0.18)% | ||||||||
| AT&T, Inc. | (356 | ) | (9,619 | ) | ||||
| Verizon Communications, Inc. | (2,851 | ) | (162,478 | ) | ||||
| (172,097 | ) | |||||||
| Electric Utilities – (0.60)% | ||||||||
| American Electrical Power Company, Inc. | (2,407 | ) | (216,462 | ) | ||||
| Avangrid, Inc. | (1,170 | ) | (57,728 | ) | ||||
| Edison International | (293 | ) | (16,420 | ) | ||||
| Emera, Inc. (b) | (696 | ) | (27,766 | ) | ||||
| Exelon Corporation | (1,638 | ) | (65,340 | ) | ||||
| Hawaiian Electric Industries, Inc. | (2,340 | ) | (77,314 | ) | ||||
| NRG Energy, Inc. | (58 | ) | (1,834 | ) | ||||
| OGE Energy Corporation | (3,182 | ) | (97,910 | ) | ||||
| PG&E Corporation | (2,925 | ) | (27,963 | ) | ||||
| (588,737 | ) | |||||||
| Electrical Equipment – (0.16)% | ||||||||
| Acuity Brands, Inc. | (328 | ) | (29,238 | ) | ||||
| Emerson Electric Company | (1,290 | ) | (83,579 | ) | ||||
| EnerSys | (9 | ) | (644 | ) | ||||
| Hubbell, Inc. | (94 | ) | (13,678 | ) | ||||
| Vestas Wind Systems A/S (b) | (183 | ) | (31,396 | ) | ||||
| (158,535 | ) | |||||||
| Electronic Equipment, Instruments & Components – (0.46)% | ||||||||
| Fitbit, Inc., Class A | (57,330 | ) | (403,603 | ) | ||||
| II-VI, Inc. | (920 | ) | (41,832 | ) | ||||
| (445,435 | ) | |||||||
The accompanying notes are an integral part of these financial statements.
34
WEISS ALTERNATIVE BALANCED RISK FUND
Schedule of Investments – Continued
October 31, 2020
| Shares | Value | |||||||
| Energy Equipment & Services – (0.50)% | ||||||||
| Baker Hughes, Inc. | (12,496 | ) | $ | (184,566 | ) | |||
| Halliburton Company | (6,082 | ) | (73,349 | ) | ||||
| Helmerich & Payne, Inc. | (4,494 | ) | (66,826 | ) | ||||
| Nabors Industries Ltd. | (1,195 | ) | (33,962 | ) | ||||
| National Oilwell Varco, Inc. | (7,359 | ) | (61,816 | ) | ||||
| Patterson-UTI Energy, Inc. | (13,092 | ) | (33,516 | ) | ||||
| Tenaris SA – ADR (b) | (3,304 | ) | (31,586 | ) | ||||
| (485,621 | ) | |||||||
| Entertainment – (0.63)% | ||||||||
| CD Projekt SA (b) | (174 | ) | (14,775 | ) | ||||
| Electronic Arts, Inc. | (2,721 | ) | (326,057 | ) | ||||
| Roku, Inc. | (1,214 | ) | (245,714 | ) | ||||
| Spotify Technology SA (b) | (116 | ) | (27,827 | ) | ||||
| (614,373 | ) | |||||||
| Food & Staples Retailing – (0.14)% | ||||||||
| Albertsons Companies, Inc., Class A | (1,044 | ) | (15,336 | ) | ||||
| Grocery Outlet Holding Corporation | (406 | ) | (17,872 | ) | ||||
| The Kroger Company | (2,548 | ) | (82,071 | ) | ||||
| Performance Food Group Company | (545 | ) | (18,317 | ) | ||||
| (133,596 | ) | |||||||
| Food Products – (1.05)% | ||||||||
| Conagra Brands, Inc. | (5,281 | ) | (185,310 | ) | ||||
| Flowers Foods, Inc. | (6,161 | ) | (145,276 | ) | ||||
| General Mills, Inc. | (3,522 | ) | (208,221 | ) | ||||
| Hormel Foods Corporation | (7,237 | ) | (352,370 | ) | ||||
| Kellogg Company | (464 | ) | (29,181 | ) | ||||
| Lamb Weston Holdings, Inc. | (443 | ) | (28,108 | ) | ||||
| McCormick & Company, Inc. | (138 | ) | (24,910 | ) | ||||
| Nomad Foods Ltd. (b) | (2,323 | ) | (56,333 | ) | ||||
| (1,029,709 | ) | |||||||
| Gas Utilities – (0.15)% | ||||||||
| Atmos Energy Corporation | (855 | ) | (78,378 | ) | ||||
| New Jersey Resources Corporation | (1,720 | ) | (50,190 | ) | ||||
| ONE Gas, Inc. | (193 | ) | (13,325 | ) | ||||
| (141,893 | ) | |||||||
| Health Care Equipment & Supplies – (0.12)% | ||||||||
| Baxter International, Inc. | (363 | ) | (28,158 | ) | ||||
| Becton, Dickinson and Company | (8 | ) | (1,849 | ) | ||||
| Boston Scientific Corporation | (47 | ) | (1,611 | ) | ||||
The accompanying notes are an integral part of these financial statements.
35
WEISS ALTERNATIVE BALANCED RISK FUND
Schedule of Investments – Continued
October 31, 2020
| Shares | Value | |||||||
| Health Care Equipment & Supplies – (0.12)% (Continued) | ||||||||
| Haemonetics Corporation | (16 | ) | $ | (1,617 | ) | |||
| Medtronic plc (b) | (318 | ) | (31,981 | ) | ||||
| Nevro Corporation | (121 | ) | (18,054 | ) | ||||
| STERIS plc | (186 | ) | (32,957 | ) | ||||
| Teleflex, Inc. | (5 | ) | (1,591 | ) | ||||
| (117,818 | ) | |||||||
| Health Care Providers & Services – (0.23)% | ||||||||
| AMN Healthcare Services, Inc. | (16 | ) | (1,044 | ) | ||||
| Anthem, Inc. | (7 | ) | (1,910 | ) | ||||
| BioTelemetry, Inc. | (17 | ) | (724 | ) | ||||
| Cigna Corporation | (11 | ) | (1,837 | ) | ||||
| CVS Health Corporation | (450 | ) | (25,241 | ) | ||||
| Encompass Health Corporation | (25 | ) | (1,533 | ) | ||||
| HCA Holdings, Inc. | (469 | ) | (58,128 | ) | ||||
| Quest Diagnostics, Inc. | (210 | ) | (25,649 | ) | ||||
| UnitedHealth Group, Inc. | (360 | ) | (109,850 | ) | ||||
| (225,916 | ) | |||||||
| Health Care Technology – (0.49)% | ||||||||
| Cerner Corporation | (2,408 | ) | (168,777 | ) | ||||
| HMS Holdings Corporation | (26 | ) | (692 | ) | ||||
| Teladoc Health, Inc. | (1,561 | ) | (306,674 | ) | ||||
| (476,143 | ) | |||||||
| Hotels, Restaurants & Leisure – (0.38)% | ||||||||
| Accor SA (b) | (580 | ) | (14,783 | ) | ||||
| Aramark | (23 | ) | (638 | ) | ||||
| The Cheesecake Factory, Inc. | (841 | ) | (24,995 | ) | ||||
| Chipotle Mexican Grill, Inc. | (9 | ) | (10,813 | ) | ||||
| Hyatt Hotels Corporation, Class A | (1,303 | ) | (71,847 | ) | ||||
| Marriott International, Inc., Class A | (592 | ) | (54,985 | ) | ||||
| MGM Resorts International | (1,218 | ) | (25,054 | ) | ||||
| Papa John’s International, Inc. | (306 | ) | (23,440 | ) | ||||
| Penn National Gaming, Inc. | (662 | ) | (35,735 | ) | ||||
| Planet Fitness, Inc., Class A | (3 | ) | (178 | ) | ||||
| Royal Caribbean Cruises Ltd. | (164 | ) | (9,253 | ) | ||||
| Scientific Games Corporation | (754 | ) | (24,038 | ) | ||||
| Shake Shack, Inc., Class A | (171 | ) | (11,546 | ) | ||||
| Vail Resorts, Inc. | (108 | ) | (25,060 | ) | ||||
| The Wendy’s Company | (765 | ) | (16,715 | ) | ||||
The accompanying notes are an integral part of these financial statements.
36
WEISS ALTERNATIVE BALANCED RISK FUND
Schedule of Investments – Continued
October 31, 2020
| Shares | Value | |||||||
| Hotels, Restaurants & Leisure – (0.38)% (Continued) | ||||||||
| Wyndham Hotels & Resorts, Inc. | (478 | ) | $ | (22,232 | ) | |||
| (371,312 | ) | |||||||
| Household Durables – (0.16)% | ||||||||
| Helen of Troy Ltd. | (197 | ) | (37,351 | ) | ||||
| Leggett & Platt, Inc. | (37 | ) | (1,544 | ) | ||||
| Lennar Corporation, Class A | (436 | ) | (30,620 | ) | ||||
| Mohawk Industries, Inc. | (37 | ) | (3,818 | ) | ||||
| Toll Brothers, Inc. | (2,054 | ) | (86,843 | ) | ||||
| (160,176 | ) | |||||||
| Household Products – (0.58)% | ||||||||
| Church & Dwight Company, Inc. | (481 | ) | (42,516 | ) | ||||
| The Clorox Company | (1,052 | ) | (218,027 | ) | ||||
| Colgate-Palmolive Company | (653 | ) | (51,515 | ) | ||||
| Kimberly-Clark Corporation | (1,928 | ) | (255,634 | ) | ||||
| (567,692 | ) | |||||||
| Independent Power and Renewable Electricity Producers – (0.02)% | ||||||||
| Uniper SE (b) | (671 | ) | (20,042 | ) | ||||
| Industrial Conglomerates – (0.37)% | ||||||||
| 3M Company | (1,722 | ) | (275,451 | ) | ||||
| General Electric Company | (879 | ) | (6,522 | ) | ||||
| Honeywell International, Inc. | (146 | ) | (24,083 | ) | ||||
| Roper Technologies, Inc. | (149 | ) | (55,330 | ) | ||||
| (361,386 | ) | |||||||
| Insurance – (0.31)% | ||||||||
| Aon plc, Class A | (589 | ) | (108,382 | ) | ||||
| Assicurazioni Generali SpA (b) | (3,302 | ) | (44,294 | ) | ||||
| eHealth, Inc. | (20 | ) | (1,342 | ) | ||||
| Gjensidige Forsikring ASA (b) | (414 | ) | (7,889 | ) | ||||
| Hannover Rueck SE (b) | (132 | ) | (19,182 | ) | ||||
| Manulife Financial Corporation (b) | (2,258 | ) | (30,608 | ) | ||||
| Mapfre SA (b) | (25,220 | ) | (38,052 | ) | ||||
| NN Group NV (b) | (1,066 | ) | (37,098 | ) | ||||
| Ping An Insurance Group Company of China Ltd. (b) | (1,767 | ) | (18,270 | ) | ||||
| (305,117 | ) | |||||||
| Interactive Media & Services – (0.05)% | ||||||||
| Facebook, Inc., Class A | (52 | ) | (13,682 | ) | ||||
| Snap, Inc., Class A | (314 | ) | (12,368 | ) | ||||
The accompanying notes are an integral part of these financial statements.
37
WEISS ALTERNATIVE BALANCED RISK FUND
Schedule of Investments – Continued
October 31, 2020
| Shares | Value | |||||||
| Interactive Media & Services – (0.05)% (Continued) | ||||||||
| Twitter, Inc. | (520 | ) | $ | (21,507 | ) | |||
| (47,557 | ) | |||||||
| Internet & Direct Marketing Retail – (0.21)% | ||||||||
| Chewy, Inc., Class A | (104 | ) | (6,406 | ) | ||||
| eBay, Inc. | (3,254 | ) | (154,988 | ) | ||||
| Overstock.com, Inc. | (23 | ) | (1,290 | ) | ||||
| Wayfair, Inc., Class A | (166 | ) | (41,173 | ) | ||||
| (203,857 | ) | |||||||
| IT Services – (0.77)% | ||||||||
| Accenture plc, Class A (b) | (904 | ) | (196,087 | ) | ||||
| Automatic Data Processing, Inc. | (240 | ) | (37,910 | ) | ||||
| BigCommerce Holdings, Inc. | (106 | ) | (7,780 | ) | ||||
| Fastly, Inc., Class A | (2,963 | ) | (188,180 | ) | ||||
| Fiserv, Inc. | (255 | ) | (24,345 | ) | ||||
| Global Payments, Inc. | (10 | ) | (1,577 | ) | ||||
| International Business Machines Corporation | (2,075 | ) | (231,695 | ) | ||||
| Mastercard, Inc., Class A | (58 | ) | (16,741 | ) | ||||
| Okta, Inc. | (236 | ) | (49,520 | ) | ||||
| Perficient, Inc. | (15 | ) | (587 | ) | ||||
| Science Applications International Corporation | (23 | ) | (1,757 | ) | ||||
| (756,179 | ) | |||||||
| Leisure Products – (0.06)% | ||||||||
| Brunswick Corporation | (211 | ) | (13,443 | ) | ||||
| Callaway Golf Company | (53 | ) | (821 | ) | ||||
| Hasbro, Inc. | (22 | ) | (1,820 | ) | ||||
| Peloton Interactive, Inc., Class A | (348 | ) | (38,353 | ) | ||||
| (54,437 | ) | |||||||
| Life Sciences Tools & Services – (0.16)% | ||||||||
| Evotec SE (b) | (12 | ) | (317 | ) | ||||
| Thermo Fisher Scientific, Inc. | (324 | ) | (153,291 | ) | ||||
| Syneos Health, Inc. | (32 | ) | (1,699 | ) | ||||
| (155,307 | ) | |||||||
| Machinery – (0.71)% | ||||||||
| Caterpillar, Inc. | (485 | ) | (76,169 | ) | ||||
| Colfax Corporation | (591 | ) | (16,069 | ) | ||||
| Flowserve Corporation | (98 | ) | (2,854 | ) | ||||
| Fortive Corporation | (576 | ) | (35,482 | ) | ||||
| Hillenbrand, Inc. | (17 | ) | (497 | ) | ||||
The accompanying notes are an integral part of these financial statements.
38
WEISS ALTERNATIVE BALANCED RISK FUND
Schedule of Investments – Continued
October 31, 2020
| Shares | Value | |||||||
| Machinery – (0.71)% (Continued) | ||||||||
| IDEX Corporation | (103 | ) | $ | (17,550 | ) | |||
| Illinois Tool Works, Inc. | (327 | ) | (64,053 | ) | ||||
| Ingersoll Rand, Inc. | (1,271 | ) | (44,409 | ) | ||||
| ITT, Inc. | (22 | ) | (1,331 | ) | ||||
| Kennametal, Inc. | (98 | ) | (3,038 | ) | ||||
| Navistar International Corporation | (4,084 | ) | (176,061 | ) | ||||
| PACCAR, Inc. | (44 | ) | (3,757 | ) | ||||
| Pentair plc (b) | (85 | ) | (4,230 | ) | ||||
| Snap-on, Inc. | (967 | ) | (152,332 | ) | ||||
| SPX Corporation | (13 | ) | (551 | ) | ||||
| Stanley Black & Decker, Inc. | (64 | ) | (10,637 | ) | ||||
| Terex Corporation | (455 | ) | (11,234 | ) | ||||
| Wabtec Corporation | (270 | ) | (16,011 | ) | ||||
| Xylem, Inc. | (610 | ) | (53,155 | ) | ||||
| (689,420 | ) | |||||||
| Marine – (0.03)% | ||||||||
| Golden Ocean Group Ltd. (b) | (1,820 | ) | (5,897 | ) | ||||
| Kuehne + Nagel International AG – Reg (b) | (58 | ) | (11,582 | ) | ||||
| Star Bulk Carriers Corporation (b) | (904 | ) | (5,641 | ) | ||||
| (23,120 | ) | |||||||
| Media – (0.34)% | ||||||||
| AMC Networks, Inc., Class A | (2,013 | ) | (42,776 | ) | ||||
| Comcast Corporation, Class A | (376 | ) | (15,882 | ) | ||||
| Fox Corporation, Class A | (1,109 | ) | (29,411 | ) | ||||
| The Interpublic Group of Companies, Inc. | (137 | ) | (2,478 | ) | ||||
| Meredith Corporation | (240 | ) | (2,640 | ) | ||||
| MSG Networks, Inc., Class A | (780 | ) | (6,973 | ) | ||||
| National CineMedia, Inc. | (90 | ) | (179 | ) | ||||
| Omnicom Group, Inc. | (1,947 | ) | (91,898 | ) | ||||
| Publicis Groupe SA (b) | (3,159 | ) | (109,751 | ) | ||||
| ViacomCBS, Inc., Class B | (1,162 | ) | (33,198 | ) | ||||
| (335,186 | ) | |||||||
| Metals & Mining – 0.00% | ||||||||
| Allegheny Technologies, Inc. | (29 | ) | (267 | ) | ||||
| Multiline Retail – (0.03)% | ||||||||
| Ollie’s Bargain Outlet Holdings, Inc. | (123 | ) | (10,712 | ) | ||||
| Target Corporation | (139 | ) | (21,159 | ) | ||||
| (31,871 | ) | |||||||
The accompanying notes are an integral part of these financial statements.
39
WEISS ALTERNATIVE BALANCED RISK FUND
Schedule of Investments – Continued
October 31, 2020
| Shares | Value | |||||||
| Multi-Utilities – (0.83)% | ||||||||
| Avista Corporation | (292 | ) | $ | (9,700 | ) | |||
| Consolidated Edison, Inc. | (4,408 | ) | (345,984 | ) | ||||
| National Grid plc – ADR (b) | (3,483 | ) | (207,064 | ) | ||||
| NorthWestern Corporation | (464 | ) | (24,188 | ) | ||||
| WEC Energy Group, Inc. | (2,186 | ) | (219,802 | ) | ||||
| (806,738 | ) | |||||||
| Oil, Gas & Consumable Fuels – (2.09)% | ||||||||
| Antero Resources Corporation | (10,466 | ) | (35,584 | ) | ||||
| BP plc – ADR (b) | (10,012 | ) | (154,986 | ) | ||||
| Callon Petroleum Company | (596 | ) | (3,117 | ) | ||||
| Cenovus Energy, Inc. (b) | (23,164 | ) | (75,978 | ) | ||||
| Centennial Resource Development, Inc., Class A | (6,933 | ) | (4,296 | ) | ||||
| Chevron Corporation | (1,697 | ) | (117,942 | ) | ||||
| Comstock Resources, Inc. | (12,277 | ) | (65,191 | ) | ||||
| Continental Resources, Inc. | (9,814 | ) | (118,063 | ) | ||||
| Delek U.S. Holdings, Inc. | (2,574 | ) | (25,894 | ) | ||||
| Devon Energy Corporation | (27,139 | ) | (242,351 | ) | ||||
| Diamondback Energy, Inc. | (4,630 | ) | (120,195 | ) | ||||
| EOG Resources, Inc. | (3,253 | ) | (111,383 | ) | ||||
| Euronav NV (b) | (936 | ) | (6,889 | ) | ||||
| Exxon Mobil Corporation | (5,673 | ) | (185,053 | ) | ||||
| HollyFrontier Corporation | (1,871 | ) | (34,632 | ) | ||||
| Marathon Oil Corporation | (38,928 | ) | (154,155 | ) | ||||
| Marathon Petroleum Corporation | (503 | ) | (14,839 | ) | ||||
| Murphy Oil Corporation | (12,149 | ) | (93,790 | ) | ||||
| Phillips 66 | (690 | ) | (32,195 | ) | ||||
| Range Resources Corporation | (7,683 | ) | (50,554 | ) | ||||
| Royal Dutch Shell plc – ADR, Class A (b) | (5,471 | ) | (139,784 | ) | ||||
| SM Energy Company | (14,644 | ) | (23,577 | ) | ||||
| Southwestern Energy Company | (15,245 | ) | (40,704 | ) | ||||
| Suncor Energy, Inc. (b) | (10,084 | ) | (113,848 | ) | ||||
| Valero Energy Corporation | (1,910 | ) | (73,745 | ) | ||||
| (2,038,745 | ) | |||||||
| Personal Products – (0.17)% | ||||||||
| Beiersdorf AG (b) | (1,594 | ) | (166,906 | ) | ||||
| Pharmaceuticals – (0.09)% | ||||||||
| Canopy Growth Corporation (b) | (1,798 | ) | (33,779 | ) | ||||
| GlaxoSmithKline plc – ADR (b) | (120 | ) | (4,010 | ) | ||||
| H Lundbeck A/S (b) | (60 | ) | (1,691 | ) | ||||
The accompanying notes are an integral part of these financial statements.
40
WEISS ALTERNATIVE BALANCED RISK FUND
Schedule of Investments – Continued
October 31, 2020
| Shares | Value | |||||||
| Pharmaceuticals – (0.09)% (Continued) | ||||||||
| Novartis AG – ADR (b) | (300 | ) | $ | (23,424 | ) | |||
| Pfizer, Inc. | (541 | ) | (19,195 | ) | ||||
| Royalty Pharma plc, Class A | (82 | ) | (3,009 | ) | ||||
| (85,108 | ) | |||||||
| Professional Services – 0.00% | ||||||||
| FTI Consulting, Inc. | (17 | ) | (1,674 | ) | ||||
| Real Estate Investment Trusts (REITs) – (4.27)% | ||||||||
| American Assets Trust, Inc. | (2,533 | ) | (53,016 | ) | ||||
| American Homes 4 Rent, Class A | (4,593 | ) | (129,844 | ) | ||||
| American Tower Corporation | (46 | ) | (10,564 | ) | ||||
| AvalonBay Communities, Inc. | (2,053 | ) | (285,634 | ) | ||||
| Brandywine Realty Trust | (16,975 | ) | (148,701 | ) | ||||
| Camden Property Trust | (2,251 | ) | (207,632 | ) | ||||
| Cousins Properties, Inc. | (8,189 | ) | (208,656 | ) | ||||
| Douglas Emmett, Inc. | (3,597 | ) | (84,889 | ) | ||||
| EastGroup Properties, Inc. | (812 | ) | (108,061 | ) | ||||
| Essential Properties Realty Trust, Inc. | (6,049 | ) | (99,929 | ) | ||||
| Essex Property Trust, Inc. | (339 | ) | (69,356 | ) | ||||
| Extra Space Storage, Inc. | (903 | ) | (104,703 | ) | ||||
| Federal Realty Investment Trust | (1,651 | ) | (113,556 | ) | ||||
| Gaming and Leisure Properties, Inc. | (2,776 | ) | (100,908 | ) | ||||
| Healthpeak Properties, Inc. | (6,834 | ) | (184,313 | ) | ||||
| Host Hotels & Resorts, Inc. | (1,419 | ) | (14,871 | ) | ||||
| Hudson Pacific Properties, Inc. | (3,454 | ) | (66,524 | ) | ||||
| Kite Realty Group Trust | (18,316 | ) | (189,754 | ) | ||||
| LTC Properties, Inc. | (1,933 | ) | (63,808 | ) | ||||
| Medical Properties Trust, Inc. | (6,893 | ) | (122,833 | ) | ||||
| National Health Investors, Inc. | (1,830 | ) | (102,572 | ) | ||||
| Omega Healthcare Investors, Inc. | (8,194 | ) | (236,069 | ) | ||||
| Pebblebrook Hotel Trust | (1,914 | ) | (22,930 | ) | ||||
| Physicians Realty Trust | (11,363 | ) | (191,580 | ) | ||||
| Prologis, Inc. | (3,190 | ) | (316,448 | ) | ||||
| Realty Income Corporation | (1,562 | ) | (90,377 | ) | ||||
| Regency Centers Corporation | (2,184 | ) | (77,729 | ) | ||||
| Retail Opportunity Investments Corporation | (4,445 | ) | (43,250 | ) | ||||
| Retail Properties of America, Inc., Class A | (12,542 | ) | (65,720 | ) | ||||
| SBA Communications Corporation | (27 | ) | (7,840 | ) | ||||
| SL Green Realty Corporation | (1,800 | ) | (77,058 | ) | ||||
| STORE Capital Corporation | (12,231 | ) | (314,337 | ) | ||||
| Tanger Factory Outlet Centers, Inc. | (13,085 | ) | (80,996 | ) | ||||
The accompanying notes are an integral part of these financial statements.
41
WEISS ALTERNATIVE BALANCED RISK FUND
Schedule of Investments – Continued
October 31, 2020
| Shares | Value | |||||||
| Real Estate Investment Trusts (REITs) – (4.27)% (Continued) | ||||||||
| Vornado Realty Trust | (4,669 | ) | $ | (143,478 | ) | |||
| Washington Real Estate Investment Trust | (2,107 | ) | (36,830 | ) | ||||
| Weyerhaeuser Company | (60 | ) | (1,637 | ) | ||||
| (4,176,403 | ) | |||||||
| Real Estate Management & Development – 0.00% | ||||||||
| Realogy Holdings Corporation | (285 | ) | (3,181 | ) | ||||
| Road & Rail – (0.50)% | ||||||||
| ArcBest Corporation | (208 | ) | (6,348 | ) | ||||
| Canadian National Railway Company (b) | (677 | ) | (67,328 | ) | ||||
| Canadian Pacific Railway Ltd. (b) | (116 | ) | (34,699 | ) | ||||
| Covenant Transportation Group, Inc. | (1,798 | ) | (24,758 | ) | ||||
| CSX Corporation | (980 | ) | (77,361 | ) | ||||
| Saia, Inc. | (1,206 | ) | (178,078 | ) | ||||
| Schneider National, Inc., Class B | (1,682 | ) | (37,105 | ) | ||||
| TFI International, Inc. (b) | (1,160 | ) | (51,690 | ) | ||||
| Uber Technologies, Inc. | (453 | ) | (15,135 | ) | ||||
| (492,502 | ) | |||||||
| Semiconductors & Semiconductor Equipment – (1.33)% | ||||||||
| Advanced Micro Devices, Inc. | (2,325 | ) | (175,049 | ) | ||||
| Analog Devices, Inc. | (2,091 | ) | (247,846 | ) | ||||
| Applied Materials, Inc. | (4,123 | ) | (244,205 | ) | ||||
| Intel Corporation | (3,747 | ) | (165,917 | ) | ||||
| Microchip Technology, Inc. | (2,560 | ) | (269,005 | ) | ||||
| STMicroelectronics NV – ADR | (1,206 | ) | (36,831 | ) | ||||
| Teradyne, Inc. | (60 | ) | (5,271 | ) | ||||
| Texas Instruments, Inc. (b) | (1,044 | ) | (150,952 | ) | ||||
| (1,295,076 | ) | |||||||
| Software – (1.67)% | ||||||||
| Appian Corporation | (348 | ) | (22,028 | ) | ||||
| CDK Global, Inc. | (35 | ) | (1,509 | ) | ||||
| Ceridian HCM Holding, Inc. | (130 | ) | (11,209 | ) | ||||
| Citrix Systems, Inc. | (1,158 | ) | (131,167 | ) | ||||
| Coupa Software, Inc. | (237 | ) | (63,445 | ) | ||||
| CyberArk Software Ltd. (b) | (195 | ) | (19,334 | ) | ||||
| Everbridge, Inc. | (58 | ) | (6,072 | ) | ||||
| Fortinet, Inc. | (174 | ) | (19,204 | ) | ||||
| fuboTV, Inc. | (796 | ) | (10,738 | ) | ||||
| Intuit, Inc. | (554 | ) | (174,333 | ) | ||||
The accompanying notes are an integral part of these financial statements.
42
WEISS ALTERNATIVE BALANCED RISK FUND
Schedule of Investments – Continued
October 31, 2020
| Shares | Value | |||||||
| Software – (1.67)% (Continued) | ||||||||
| Mimecast Ltd. | (242 | ) | $ | (9,247 | ) | |||
| Oracle Corporation | (752 | ) | (42,195 | ) | ||||
| PagerDuty, Inc. | (7,675 | ) | (207,992 | ) | ||||
| Palantir Technologies, Inc., Class A | (1,273 | ) | (12,895 | ) | ||||
| Palo Alto Networks, Inc. | (400 | ) | (88,476 | ) | ||||
| Paycom Software, Inc. | (139 | ) | (50,609 | ) | ||||
| Qualys, Inc. | (353 | ) | (31,011 | ) | ||||
| SAP SE – ADR (b) | (357 | ) | (38,138 | ) | ||||
| Slack Technologies, Inc., Class A | (572 | ) | (14,632 | ) | ||||
| SolarWinds Corporation | (1,160 | ) | (23,699 | ) | ||||
| Splunk, Inc. | (293 | ) | (58,026 | ) | ||||
| The Trade Desk, Inc., Class A | (415 | ) | (235,077 | ) | ||||
| Tyler Technologies, Inc. | (12 | ) | (4,613 | ) | ||||
| VMware, Inc., Class A | (600 | ) | (77,238 | ) | ||||
| Workday, Inc., Class A | (1,309 | ) | (275,047 | ) | ||||
| Zoom Video Communications, Inc., Class A | (15 | ) | (6,914 | ) | ||||
| (1,634,848 | ) | |||||||
| Special Purpose Acquisition Companies – 0.00% | ||||||||
| CM Life Sciences, Inc. | (105 | ) | (1,078 | ) | ||||
| Specialty Retail – (0.25)% | ||||||||
| Foot Locker, Inc. | (638 | ) | (23,529 | ) | ||||
| Group 1 Automotive, Inc. | (7 | ) | (743 | ) | ||||
| O’Reilly Automotive, Inc. | (28 | ) | (12,225 | ) | ||||
| The TJX Companies, Inc. | (345 | ) | (17,526 | ) | ||||
| Tractor Supply Company | (11 | ) | (1,465 | ) | ||||
| Ulta Beauty, Inc. | (4 | ) | (827 | ) | ||||
| Williams-Sonoma, Inc. | (2,039 | ) | (185,977 | ) | ||||
| (242,292 | ) | |||||||
| Technology Hardware, Storage & Peripherals – (0.17)% | ||||||||
| Hewlett Packard Enterprise Company | (11,106 | ) | (95,956 | ) | ||||
| NetApp, Inc. | (348 | ) | (15,274 | ) | ||||
| Seagate Technology plc | (1,170 | ) | (55,949 | ) | ||||
| (167,179 | ) | |||||||
| Textiles, Apparel & Luxury Goods – (0.01)% | ||||||||
| Lululemon Athletica, Inc. (b) | (32 | ) | (10,217 | ) | ||||
| Wolverine World Wide, Inc. | (30 | ) | (800 | ) | ||||
| (11,017 | ) | |||||||
The accompanying notes are an integral part of these financial statements.
43
WEISS ALTERNATIVE BALANCED RISK FUND
Schedule of Investments – Continued
October 31, 2020
| Shares | Value | |||||||
| Thrifts & Mortgage Finance – 0.00% | ||||||||
| Flagstar Bancorp, Inc. | (19 | ) | $ | (558 | ) | |||
| Walker & Dunlop, Inc. | (8 | ) | (503 | ) | ||||
| (1,061 | ) | |||||||
| Tobacco – (0.02)% | ||||||||
| Altria Group, Inc. | (408 | ) | (14,721 | ) | ||||
| Trading Companies & Distributors – (0.20)% | ||||||||
| Beacon Roofing Supply, Inc. | (4 | ) | (123 | ) | ||||
| Fastenal Company | (2,940 | ) | (127,096 | ) | ||||
| HD Supply Holdings, Inc. | (84 | ) | (3,348 | ) | ||||
| MSC Industrial Direct Company, Inc. | (46 | ) | (3,204 | ) | ||||
| W.W. Grainger, Inc. | (87 | ) | (30,452 | ) | ||||
| Watsco, Inc. | (152 | ) | (34,069 | ) | ||||
| WESCO International, Inc. | (19 | ) | (784 | ) | ||||
| (199,076 | ) | |||||||
| Water Utilities – (0.12)% | ||||||||
| American Water Works Company, Inc. | (754 | ) | (113,485 | ) | ||||
| Essential Utilities, Inc. | (44 | ) | (1,813 | ) | ||||
| (115,298 | ) | |||||||
| Wireless Telecommunication Services – (0.27)% | ||||||||
| T-Mobile U.S., Inc. | (2,442 | ) | (267,570 | ) | ||||
| Total Short Common Stocks | ||||||||
| Proceeds $(25,771,881) | (24,618,412 | ) | ||||||
| SHORT PREFERRED STOCKS – (0.14)% | ||||||||
| Henkel AG & Company KGaA (b) | (1,464 | ) | (142,462 | ) | ||||
| Total Short Preferred Stocks | ||||||||
| Proceeds $(151,162) | (142,462 | ) | ||||||
| SHORT EXCHANGE TRADED FUNDS – (10.93)% | ||||||||
| Amplify Online Retail ETF | (252 | ) | (22,362 | ) | ||||
| Communication Services Select Sector SPDR Fund | (1,856 | ) | (109,875 | ) | ||||
| Consumer Discretionary Select Sector SPDR Fund | (340 | ) | (48,610 | ) | ||||
| Consumer Staples Select Sector SPDR Fund | (5,740 | ) | (357,372 | ) | ||||
| ETFMG Prime Cyber Security ETF | (2,827 | ) | (127,356 | ) | ||||
| Financial Select Sector SPDR Fund | (1,610 | ) | (38,415 | ) | ||||
| Health Care Select Sector SPDR Fund | (2,867 | ) | (291,459 | ) | ||||
| Industrial Select Sector SPDR Fund | (1,510 | ) | (114,564 | ) | ||||
The accompanying notes are an integral part of these financial statements.
44
WEISS ALTERNATIVE BALANCED RISK FUND
Schedule of Investments – Continued
October 31, 2020
| Shares | Value | |||||||
| SHORT EXCHANGE TRADED FUNDS – (10.93)% (Continued) | ||||||||
| Invesco QQQ Trust Series 1 | (5,276 | ) | $ | (1,421,249 | ) | |||
| Invesco S&P 500 Low Volatility ETF | (231 | ) | (12,019 | ) | ||||
| Invesco Solar ETF | (517 | ) | (35,554 | ) | ||||
| iShares 20+ Year Treasury Bond ETF | (250 | ) | (39,393 | ) | ||||
| iShares China Large-Cap ETF | (773 | ) | (34,089 | ) | ||||
| iShares Core DAX UCITS ETF DE (b) | (249 | ) | (28,568 | ) | ||||
| iShares MSCI Emerging Markets ETF | (45 | ) | (2,012 | ) | ||||
| iShares MSCI Eurozone ETF | (599 | ) | (21,492 | ) | ||||
| iShares MSCI India ETF | (64 | ) | (2,150 | ) | ||||
| iShares Nasdaq Biotechnology ETF | (541 | ) | (70,665 | ) | ||||
| iShares Expanded Tech-Software ETF | (1,842 | ) | (561,147 | ) | ||||
| iShares Russell 2000 ETF | (7,709 | ) | (1,180,171 | ) | ||||
| iShares Russell 2000 Value ETF | (580 | ) | (59,734 | ) | ||||
| iShares S&P 500 Value ETF | (66 | ) | (7,286 | ) | ||||
| iShares S&P/TSX 60 Index ETF (b) | (1,920 | ) | (33,909 | ) | ||||
| iShares Transportation Average ETF | (1,601 | ) | (314,773 | ) | ||||
| iShares U.S. Medical Devices ETF | (60 | ) | (17,890 | ) | ||||
| iShares U.S. Real Estate ETF | (1,712 | ) | (132,697 | ) | ||||
| iShares U.S. Technology ETF | (2,349 | ) | (687,646 | ) | ||||
| Material Select Sector SPDR | (176 | ) | (11,120 | ) | ||||
| SPDR S&P 500 ETF Trust | (7,609 | ) | (2,484,643 | ) | ||||
| SPDR S&P Biotech ETF | (961 | ) | (108,372 | ) | ||||
| SPDR S&P Retail ETF | (2,622 | ) | (130,680 | ) | ||||
| SPDR S&P Semiconductor ETF | (4,672 | ) | (619,133 | ) | ||||
| United States Oil Fund LP | (376 | ) | (9,494 | ) | ||||
| Utilities Select Sector SPDR Fund | (10,523 | ) | (656,425 | ) | ||||
| VanEck Vectors Semiconductor ETF | (1,847 | ) | (323,133 | ) | ||||
| Vanguard REIT ETF | (7,437 | ) | (569,601 | ) | ||||
| Total Short Exchange Traded Funds | ||||||||
| Proceeds $(10,854,100) | (10,685,058 | ) | ||||||
| Total Securities Sold Short | ||||||||
| Proceeds $(36,777,143) – (36.26)% | (35,445,932 | ) | ||||||
| Total Investments | ||||||||
| (Cost $55,916,428) – 59.00% | 57,689,510 | |||||||
| Other Assets In Excess Of Liabilities – 41.00% | 40,080,380 | |||||||
| Total Net Assets – 100.00% | $ | 97,769,890 | ||||||
The Global Industry Classification Standard (GICS®) was developed by and/or is the exclusive property of MSCI, Inc. and Standard & Poor Financial Services LLC (“S&P”). GICS is a service mark of MSCI and S&P and has been licensed for use by U.S. Bancorp Fund Services, LLC, doing business as U.S. Bank Global Fund Services (“Fund Services”).
The accompanying notes are an integral part of these financial statements.
45
WEISS ALTERNATIVE BALANCED RISK FUND
Schedule of Investments – Continued
October 31, 2020
| (a) | Non-income producing security. |
| (b) | Foreign security. |
| (c) | 100 shares per contract unless otherwise noted. |
| (d) | All or a portion of the assets have been committed as collateral for open securities sold short, written option contracts, swap contacts, futures contracts and forward currency exchange contracts. The total value of assets committed as collateral as of October 31, 2020, is $37,201,681. |
| (e) | The rate quoted is the annualized seven-day effective yield as of October 31, 2020. |
| (f) | Securities sold short are not owned by the Fund and cannot produce income. |
| (g) | Level 3 security. Please see Note 2 for more information. |
| (h) | Held in connection with a written option contract, see Schedule of Written Options for more details. |
ADR – American Depository Receipt
CA – Canadian
ETF – Exchange Traded Fund
GDR – Global Depository Receipt
plc – Public Limited Company
Reg – Registered
The accompanying notes are an integral part of these financial statements.
46
WEISS ALTERNATIVE BALANCED RISK FUND
Schedule of Written Options
October 31, 2020
| Contracts (a) | Notional Amount | Value | ||||||||||
| WRITTEN CALL OPTIONS | ||||||||||||
| Check Point Software Technologies Ltd. | ||||||||||||
| Expiration: November 2020, Exercise Price: $125.00 | (2 | ) | $ | (22,712 | ) | $ | (100 | ) | ||||
| CrowdStrike Holdings, Inc. | ||||||||||||
| Expiration: November 2020, Exercise Price: $130.00 | (3 | ) | (37,152 | ) | (1,383 | ) | ||||||
| Cummins, Inc. | ||||||||||||
| Expiration: November 2020, Exercise Price: $240.00 | (1 | ) | (21,989 | ) | (225 | ) | ||||||
| Darden Restaurants, Inc. | ||||||||||||
| Expiration: November 2020, Exercise Price: $100.00 | (3 | ) | (27,576 | ) | (532 | ) | ||||||
| Dick’s Sporting Goods, Inc. | ||||||||||||
| Expiration: November 2020, Exercise Price: $65.00 | (2 | ) | (11,330 | ) | (70 | ) | ||||||
| Evergy, Inc. | ||||||||||||
| Expiration: November 2020, Exercise Price: $55.00 | (18 | ) | (99,360 | ) | (3,195 | ) | ||||||
| FireEye, Inc. | ||||||||||||
| Expiration: January 2021, Exercise Price: $17.00 | (27 | ) | (37,368 | ) | (972 | ) | ||||||
| GameStop Corporation | ||||||||||||
| Expiration: January 2021, Exercise Price: $22.00 | (5 | ) | (5,235 | ) | (378 | ) | ||||||
| General Motors Company | ||||||||||||
| Expiration: November 2020, Exercise Price: $35.00 | (4 | ) | (13,812 | ) | (686 | ) | ||||||
| Expiration: November 2020, Exercise Price: $36.50 | (4 | ) | (13,812 | ) | (444 | ) | ||||||
| Expiration: January 2021, Exercise Price: $42.00 | (13 | ) | (44,889 | ) | (1,086 | ) | ||||||
| Global Payments, Inc. | ||||||||||||
| Expiration: November 2020, Exercise Price: $180.00 | (1 | ) | (15,774 | ) | (65 | ) | ||||||
| iShares 20+ Year Treasury Bond ETF | ||||||||||||
| Expiration: November 2020, Exercise Price: $169.00 | (28 | ) | (441,196 | ) | (308 | ) | ||||||
| iShares Russell 2000 ETF | ||||||||||||
| Expiration: December 2020, Exercise Price: $170.00 | (8 | ) | (122,472 | ) | (1,220 | ) | ||||||
| Las Vegas Sands Corporation | ||||||||||||
| Expiration: November 2020, Exercise Price: $57.50 | (4 | ) | (19,224 | ) | (158 | ) | ||||||
| Lowe’s Companies, Inc. | ||||||||||||
| Expiration: November 2020, Exercise Price: $200.00 | (6 | ) | (94,860 | ) | (93 | ) | ||||||
| Lyft, Inc. | ||||||||||||
| Expiration: November 2020, Exercise Price: $32.00 | (2 | ) | (4,566 | ) | (36 | ) | ||||||
| Marriott International, Inc. | ||||||||||||
| Expiration: November 2020, Exercise Price: $110.00 | (4 | ) | (37,152 | ) | (394 | ) | ||||||
| NextEra Energy Partners LP | ||||||||||||
| Expiration: November 2020, Exercise Price: $75.00 | (24 | ) | (150,720 | ) | (240 | ) | ||||||
| NXP Semiconductors NV (b) | ||||||||||||
| Expiration: November 2020, Exercise Price: $145.00 | (2 | ) | (27,024 | ) | (475 | ) | ||||||
| Palo Alto Networks, Inc. | ||||||||||||
| Expiration: November 2020, Exercise Price: $250.00 | (1 | ) | (22,119 | ) | (150 | ) | ||||||
| PayPal Holdings, Inc. | ||||||||||||
| Expiration: November 2020, Exercise Price: $190.00 | (1 | ) | (18,613 | ) | (740 | ) | ||||||
The accompanying notes are an integral part of these financial statements.
47
WEISS ALTERNATIVE BALANCED RISK FUND
Schedule of Written Options – Continued
October 31, 2020
| Contracts (a) | Notional Amount | Value | ||||||||||
| WRITTEN CALL OPTIONS (Continued) | ||||||||||||
| QUALCOMM, Inc. | ||||||||||||
| Expiration: November 2020, Exercise Price: $135.00 | (2 | ) | $ | (24,672 | ) | $ | (469 | ) | ||||
| S&P 500 Index | ||||||||||||
| Expiration: December 2020, Exercise Price: $3,350.00 | (1 | ) | (326,996 | ) | (10,730 | ) | ||||||
| salesforce.com, Inc. | ||||||||||||
| Expiration: November 2020, Exercise Price: $260.00 | (1 | ) | (23,227 | ) | (236 | ) | ||||||
| SPDR S&P 500 ETF Trust | ||||||||||||
| Expiration: November 2020, Exercise Price: $355.00 | (14 | ) | (457,156 | ) | (1,218 | ) | ||||||
| SYNNEX Corporation | ||||||||||||
| Expiration: November 2020, Exercise Price: $150.00 | (1 | ) | (13,164 | ) | (110 | ) | ||||||
| Tesla, Inc. | ||||||||||||
| Expiration: November 2020, Exercise Price: $435.00 | (2 | ) | (77,608 | ) | (1,545 | ) | ||||||
| Texas Instruments, Inc. | ||||||||||||
| Expiration: November 2020, Exercise Price: $160.00 | (1 | ) | (14,459 | ) | (55 | ) | ||||||
| United States Natural Gas Fund LP | ||||||||||||
| Expiration: January 2021, Exercise Price: $19.00 | (33 | ) | (42,042 | ) | (1,122 | ) | ||||||
| The Walt Disney Company | ||||||||||||
| Expiration: December 2020, Exercise Price: $145.00 | (3 | ) | (36,375 | ) | (313 | ) | ||||||
| Xilinx, Inc. | ||||||||||||
| Expiration: November 2020, Exercise Price: $130.00 | (18 | ) | (213,642 | ) | (3,240 | ) | ||||||
| Zynga, Inc. | ||||||||||||
| Expiration: November 2020, Exercise Price: $11.00 | (21 | ) | (18,879 | ) | (168 | ) | ||||||
| (32,156 | ) | |||||||||||
| WRITTEN PUT OPTIONS | ||||||||||||
| American Electric Power Company, Inc. | ||||||||||||
| Expiration: November 2020, Exercise Price: $87.50 | (29 | ) | (260,797 | ) | (6,380 | ) | ||||||
| Amgen, Inc. | ||||||||||||
| Expiration: November 2020, Exercise Price: $210.00 | (1 | ) | (21,694 | ) | (575 | ) | ||||||
| Autoliv, Inc. (b) | ||||||||||||
| Expiration: November 2020, Exercise Price: $70.00 | (1 | ) | (7,580 | ) | (165 | ) | ||||||
| Consolidated Edison, Inc. | ||||||||||||
| Expiration: November 2020, Exercise Price: $80.00 | (11 | ) | (86,339 | ) | (3,960 | ) | ||||||
| Cummins, Inc. | ||||||||||||
| Expiration: November 2020, Exercise Price: $210.00 | (1 | ) | (21,989 | ) | (580 | ) | ||||||
| DraftKings, Inc. | ||||||||||||
| Expiration: November 2020, Exercise Price: $40.00 | (14 | ) | (49,560 | ) | (9,240 | ) | ||||||
| Electronic Arts, Inc. | ||||||||||||
| Expiration: November 2020, Exercise Price: $105.00 | (5 | ) | (59,915 | ) | (467 | ) | ||||||
| Ford Motor Company | ||||||||||||
| Expiration: November 2020, Exercise Price: $7.00 | (20 | ) | (15,460 | ) | (290 | ) | ||||||
The accompanying notes are an integral part of these financial statements.
48
WEISS ALTERNATIVE BALANCED RISK FUND
Schedule of Written Options – Continued
October 31, 2020
| Contracts (a) | Notional Amount | Value | ||||||||||
| WRITTEN PUT OPTIONS (Continued) | ||||||||||||
| Intel Corporation | ||||||||||||
| Expiration: November 2020, Exercise Price: $46.00 | (8 | ) | $ | (35,424 | ) | $ | (2,248 | ) | ||||
| iShares Expanded Tech-Software Sector ETF | ||||||||||||
| Expiration: November 2020, Exercise Price: $300.00 | (3 | ) | (91,392 | ) | (3,150 | ) | ||||||
| Expiration: November 2020, Exercise Price: $310.00 | (2 | ) | (60,928 | ) | (3,050 | ) | ||||||
| iShares Russell 2000 ETF | ||||||||||||
| Expiration: November 2020, Exercise Price: $145.00 | (17 | ) | (260,253 | ) | (2,550 | ) | ||||||
| Marvell Technology Group Ltd. | ||||||||||||
| Expiration: December 2020, Exercise Price: $35.00 | (8 | ) | (30,008 | ) | (1,176 | ) | ||||||
| Oracle Corporation | ||||||||||||
| Expiration: November 2020, Exercise Price: $60.00 | (12 | ) | (67,332 | ) | (5,190 | ) | ||||||
| Penn National Gaming, Inc. | ||||||||||||
| Expiration: November 2020, Exercise Price: $50.00 | (3 | ) | (16,194 | ) | (930 | ) | ||||||
| Silgan Holdings, Inc. | ||||||||||||
| Expiration: November 2020, Exercise Price: $35.00 | (2 | ) | (6,890 | ) | (450 | ) | ||||||
| VanEck Vectors Semiconductor ETF | ||||||||||||
| Expiration: November 2020, Exercise Price: $180.00 | (3 | ) | (52,485 | ) | (2,812 | ) | ||||||
| Xilinx, Inc. | ||||||||||||
| Expiration: November 2020, Exercise Price: $115.00 | (18 | ) | (213,642 | ) | (7,920 | ) | ||||||
| (51,133 | ) | |||||||||||
| TOTAL WRITTEN OPTIONS | ||||||||||||
| (Premiums received $89,766) | $ | (83,289 | ) | |||||||||
| (a) | 100 shares per contract. |
| (b) | Foreign security. |
ETF – Exchange Traded Fund
The accompanying notes are an integral part of these financial statements.
49
WEISS ALTERNATIVE BALANCED RISK FUND
Schedule of Open Forward Currency Contracts*
October 31, 2020
| Unrealized | |||||||||||||||
| Settlement | Currency to be | Value | Currency to be | Value | Appreciation | ||||||||||
| Date | Delivered | (USD) | Received | (USD) | (Depreciation)** | ||||||||||
| 11/4/20 | 21,805 USD | $ | 21,806 | 2,275,345 JPY | $ | 21,735 | $ | (71 | ) | ||||||
| $ | 21,806 | $ | 21,735 | $ | (71 | ) | |||||||||
JPY – Japanese Yen
| * | Morgan Stanley is the counterparty for all open forward currency contracts held by the Fund as of October 31, 2020. | |
| ** | Unrealized appreciation is a receivable and unrealized depreciation is a payable. |
The accompanying notes are an integral part of these financial statements.
50
WEISS ALTERNATIVE BALANCED RISK FUND
Schedule of Open Swap Contracts
October 31, 2020
| Value of | |||||||||||||||||||||||||||
| Pay/Receive | Number of | Unrealized | |||||||||||||||||||||||||
| Counter- | Maturity | Financing | Financing | Payment | Shares/ | Notional | Upfront | Appreciation | |||||||||||||||||||
| party | Security | Date | Rate | Rate | Frequency | Units | Amount | Payment | (Depreciation)* | ||||||||||||||||||
| LONG EQUITY SWAP CONTRACTS | |||||||||||||||||||||||||||
| Morgan | AIB Group plc | 5/6/2022 | Pay | 0.600% + 1 Day EONIA(3) | Monthly | 11,626 | $ | 13,151 | $ | — | $ | 180 | |||||||||||||||
| Stanley | |||||||||||||||||||||||||||
| Morgan | Airbus SE | 11/29/2021 | Pay | 0.600% + 1 Day EONIA(3) | Monthly | 1,066 | 77,995 | — | (2,442 | ) | |||||||||||||||||
| Stanley | |||||||||||||||||||||||||||
| Morgan | Aviva plc | 5/6/2022 | Pay | 0.600% + 1 Day SONIA(1) | Monthly | 15,778 | 52,629 | — | (4,207 | ) | |||||||||||||||||
| Stanley | |||||||||||||||||||||||||||
| Morgan | Barclays plc | 5/6/2022 | Pay | 0.600% + 1 Day SONIA(1) | Monthly | 68,987 | 95,621 | — | 2,809 | ||||||||||||||||||
| Stanley | |||||||||||||||||||||||||||
| Morgan | Beazley plc | 5/6/2022 | Pay | 0.600% + 1 Day SONIA(1) | Monthly | 7,061 | 26,919 | — | (4,391 | ) | |||||||||||||||||
| Stanley | |||||||||||||||||||||||||||
| Morgan | Blue Prism | 1/31/2022 | Pay | 0.600% + 1 Day SONIA(1) | Monthly | 7,380 | 147,362 | — | 11,839 | ||||||||||||||||||
| Stanley | Group plc | ||||||||||||||||||||||||||
| Morgan | BNP | 5/6/2022 | Pay | 0.600% + 1 Day EONIA(3) | Monthly | 2,383 | 83,106 | — | (6,244 | ) | |||||||||||||||||
| Stanley | Paribas SA | ||||||||||||||||||||||||||
| Morgan | Coca-Cola | 6/22/2022 | Pay | 0.600% + 1 Day SONIA(1) | Monthly | 1,664 | 37,798 | — | (4,151 | ) | |||||||||||||||||
| Stanley | HBC AG | ||||||||||||||||||||||||||
| Morgan | Engie SA | 11/29/2021 | Pay | 0.600% + 1 Day EONIA(3) | Monthly | 11,294 | 136,595 | — | (22,357 | ) | |||||||||||||||||
| Stanley | |||||||||||||||||||||||||||
| Morgan | High Beta | 3/22/2021 | Pay | 0.500% + FED(2) | Monthly | 695 | 27,487 | — | 485 | ||||||||||||||||||
| Stanley | Cyclicals | ||||||||||||||||||||||||||
| Morgan | Inegnico | 11/29/2021 | Pay | 0.600% + 1 Day EONIA(3) | Monthly | 1,389 | 199,703 | — | (24,215 | ) | |||||||||||||||||
| Stanley | Group | ||||||||||||||||||||||||||
| Morgan | iShares Core | 2/2/2022 | Pay | 0.600% + 1 Day SONIA(1) | Monthly | 1,606 | 11,450 | — | (388 | ) | |||||||||||||||||
| Stanley | FTSE 100 | ||||||||||||||||||||||||||
| UCITS ETF | |||||||||||||||||||||||||||
| Morgan | Green Recovery | 6/21/2022 | Pay | 0.600% + 1 Day EONIA(3) | Monthly | 328 | 44,022 | — | (4,310 | ) | |||||||||||||||||
| Stanley | Basket | ||||||||||||||||||||||||||
| Morgan | Growth vs. | 7/20/2021 | Receive | (0.850)% Fixed Rate | Monthly | 713 | 129,566 | — | 1,190 | ||||||||||||||||||
| Stanley | Value Basket | ||||||||||||||||||||||||||
| Morgan | The Morgan | 8/9/2022 | Pay | 0.500% + FED(2) | Monthly | 812 | 74,249 | — | (817 | ) | |||||||||||||||||
| Stanley | Stanley U.S. | ||||||||||||||||||||||||||
| Reflationary | |||||||||||||||||||||||||||
| Pro-Cyclical | |||||||||||||||||||||||||||
| Basket | |||||||||||||||||||||||||||
| Morgan | The Morgan | 10/8/2022 | Pay | 0.500% + FED(2) | Monthly | 65 | 11,151 | — | (752 | ) | |||||||||||||||||
| Stanley | Stanley Work | ||||||||||||||||||||||||||
| From Home | |||||||||||||||||||||||||||
| Basket | |||||||||||||||||||||||||||
The accompanying notes are an integral part of these financial statements.
51
WEISS ALTERNATIVE BALANCED RISK FUND
Schedule of Open Swap Contracts – Continued
October 31, 2020
| Value of | |||||||||||||||||||||||||||
| Pay/Receive | Number of | Unrealized | |||||||||||||||||||||||||
| Counter- | Maturity | Financing | Financing | Payment | Shares/ | Notional | Upfront | Appreciation | |||||||||||||||||||
| party | Security | Date | Rate | Rate | Frequency | Units | Amount | Payment | (Depreciation)* | ||||||||||||||||||
| LONG EQUITY SWAP CONTRACTS (Continued) | |||||||||||||||||||||||||||
| Morgan | The Morgan | 7/20/2021 | Pay | 0.850% Fixed Rate | Monthly | 434 | $ | 32,355 | $ | — | $ | 2,393 | |||||||||||||||
| Stanley | Stanley Cyclicals | ||||||||||||||||||||||||||
| vs. Defensives | |||||||||||||||||||||||||||
| Baskets | |||||||||||||||||||||||||||
| Morgan | Peugeot SA | 11/29/2021 | Pay | 0.600% + 1 Day EONIA(3) | Monthly | 16,905 | 303,684 | — | (12,578 | ) | |||||||||||||||||
| Stanley | |||||||||||||||||||||||||||
| Morgan | Poste | 5/6/2022 | Pay | 0.600% + 1 Day EONIA(3) | Monthly | 6,420 | 52,411 | — | (6,980 | ) | |||||||||||||||||
| Stanley | Italiane SpA | ||||||||||||||||||||||||||
| Morgan | Societe | 5/6/2022 | Pay | 0.600% + 1 Day EONIA(3) | Monthly | 3,971 | 53,957 | — | (3,520 | ) | |||||||||||||||||
| Stanley | Generale SA | ||||||||||||||||||||||||||
| Morgan | Standard | 5/6/2022 | Pay | 0.600% + 1 Day SONIA(1) | Monthly | 12,616 | 57,653 | — | (3,738 | ) | |||||||||||||||||
| Stanley | Chartered plc | ||||||||||||||||||||||||||
| Morgan | Teleperformance | 11/29/2021 | Pay | 0.600% + 1 Day EONIA(3) | Monthly | 752 | 225,737 | — | (13,775 | ) | |||||||||||||||||
| Stanley | SE | ||||||||||||||||||||||||||
| Morgan | U.S. Quality | 2/8/2022 | Pay | 0.950% Fixed Rate | Monthly | 261 | 29,958 | — | (69 | ) | |||||||||||||||||
| Stanley | Basket | ||||||||||||||||||||||||||
| Morgan | U.S. TMT | 4/13/2022 | Pay | 0.500% + FED(2) | Monthly | 168 | 25,474 | — | 3,318 | ||||||||||||||||||
| Stanley | Momentum | ||||||||||||||||||||||||||
| Short Basket | |||||||||||||||||||||||||||
| Morgan | U.S. Value | 4/13/2022 | Pay | 0.500% + FED(2) | Monthly | 1,384 | 123,282 | — | 2,675 | ||||||||||||||||||
| Stanley | Long Basket | ||||||||||||||||||||||||||
| Morgan | U.S. Value | 4/13/2022 | Pay | 0.500% + FED(2) | Monthly | 71 | 18,860 | — | 5,673 | ||||||||||||||||||
| Stanley | Short Basket | ||||||||||||||||||||||||||
| Morgan | United Utilities | 6/29/2022 | Pay | 0.600% + 1 Day SONIA(1) | Monthly | 641 | 7,166 | — | (112 | ) | |||||||||||||||||
| Stanley | Group plc | ||||||||||||||||||||||||||
| Morgan | Vacation | 4/8/2022 | Pay | 0.500% + FED(2) | Monthly | 2,925 | 276,208 | — | (10,738 | ) | |||||||||||||||||
| Stanley | Basket | ||||||||||||||||||||||||||
| Morgan | Valeo | 11/29/2021 | Pay | 0.600% + 1 Day EONIA(3) | Monthly | 2,563 | 77,534 | — | (3,872 | ) | |||||||||||||||||
| Stanley | |||||||||||||||||||||||||||
| Morgan | William | 4/25/2022 | Pay | 0.600% + 1 Day SONIA(1) | Monthly | 1,624 | 5,768 | — | 53 | ||||||||||||||||||
| Stanley | Hill plc | ||||||||||||||||||||||||||
| Morgan | Worldline SA | 11/29/2021 | Pay | 0.600% + 1 Day EONIA(3) | Monthly | 5,771 | 427,436 | — | (53,039 | ) | |||||||||||||||||
| Stanley | |||||||||||||||||||||||||||
| SHORT EQUITY SWAP CONTRACTS | |||||||||||||||||||||||||||
| Morgan | ABN AMRO | 5/6/2022 | Pay | (0.500)% + 1 Day EONIA(3) | Monthly | (3,399 | ) | (27,920 | ) | — | 2,537 | ||||||||||||||||
| Stanley | Bank N.V. | ||||||||||||||||||||||||||
| Morgan | Ashmore | 5/6/2022 | Pay | (0.500)% + 1 Day SONIA(1) | Monthly | (3,480 | ) | (16,100 | ) | — | 1,557 | ||||||||||||||||
| Stanley | Group plc | ||||||||||||||||||||||||||
| Morgan | AXA SA | 5/6/2022 | Pay | (0.500)% + 1 Day EONIA(3) | Monthly | (1,964 | ) | (31,540 | ) | — | 5,628 | ||||||||||||||||
| Stanley | |||||||||||||||||||||||||||
The accompanying notes are an integral part of these financial statements.
52
WEISS ALTERNATIVE BALANCED RISK FUND
Schedule of Open Swap Contracts – Continued
October 31, 2020
| Value of | |||||||||||||||||||||||||||
| Pay/Receive | Number of | Unrealized | |||||||||||||||||||||||||
| Counter- | Maturity | Financing | Financing | Payment | Shares/ | Notional | Upfront | Appreciation | |||||||||||||||||||
| party | Security | Date | Rate | Rate | Frequency | Units | Amount | Payment | (Depreciation)* | ||||||||||||||||||
| SHORT EQUITY SWAP CONTRACTS (Continued) | |||||||||||||||||||||||||||
| Morgan | Communications | 6/20/2022 | Pay | (0.400)% + FED(2) | Monthly | (2,066 | ) | $ | (82,165 | ) | $ | — | $ | 733 | |||||||||||||
| Stanley | Equipment Basket | ||||||||||||||||||||||||||
| Morgan | Faurecia SE | 12/8/2021 | Pay | (0.500)% + 1 Day EONIA(3) | Monthly | (197 | ) | (7,471 | ) | — | 1,667 | ||||||||||||||||
| Stanley | |||||||||||||||||||||||||||
| Morgan | Euro Growth vs. | 9/26/2022 | Receive | (1.050)% Fixed Rate | Monthly | (986 | ) | (210,422 | ) | — | 419 | ||||||||||||||||
| Stanley | Value Basket | ||||||||||||||||||||||||||
| Morgan | Growth vs. | 7/20/2021 | Receive | (0.850)% Fixed Rate | Monthly | (3,102 | ) | (563,695 | ) | — | 3,022 | ||||||||||||||||
| Stanley | Value Basket | ||||||||||||||||||||||||||
| Morgan | HSBC | 5/6/2022 | Pay | (0.500)% + 1 Day SONIA(1) | Monthly | (26,318 | ) | (110,288 | ) | — | (4,231 | ) | |||||||||||||||
| Stanley | Holdings plc | ||||||||||||||||||||||||||
| Morgan | Infotech | 6/30/2022 | Pay | (0.450)% + FED(2) | Monthly | (885 | ) | (128,183 | ) | — | (21,918 | ) | |||||||||||||||
| Stanley | Basket | ||||||||||||||||||||||||||
| Morgan | InterContinental | 2/1/2022 | Pay | (0.500)% + 1 Day SONIA(1) | Monthly | (276 | ) | (14,024 | ) | — | (28 | ) | |||||||||||||||
| Stanley | Hotels Group plc | ||||||||||||||||||||||||||
| Morgan | Media Basket | 6/30/2022 | Pay | (0.400)% + FED(2) | Monthly | (1,213 | ) | (69,723 | ) | — | 3,545 | ||||||||||||||||
| Stanley | |||||||||||||||||||||||||||
| Morgan | VOW3 Hedged | 2/9/2022 | Pay | (0.450)% + 1 Day EONIA(3) | Monthly | (1,245 | ) | (223,979 | ) | — | 534 | ||||||||||||||||
| Stanley | Basket | ||||||||||||||||||||||||||
| Morgan | The Morgan | 3/15/2022 | Pay | (0.700)% + FED(2) | Monthly | (2,396 | ) | (453,702 | ) | — | (46,332 | ) | |||||||||||||||
| Stanley | Stanley U.S. | ||||||||||||||||||||||||||
| Growth Long | |||||||||||||||||||||||||||
| Basket | |||||||||||||||||||||||||||
| Morgan | The Morgan | 2/2/2022 | Pay | (0.400)% + FED(2) | Monthly | (533 | ) | (95,487 | ) | — | (6,201 | ) | |||||||||||||||
| Stanley | Stanley U.S. | ||||||||||||||||||||||||||
| Momentum Long | |||||||||||||||||||||||||||
| Basket | |||||||||||||||||||||||||||
| Morgan | SAAS Basket | 2/2/2022 | Pay | (0.300)% + FED(2) | Monthly | (586 | ) | (340,396 | ) | — | 40,167 | ||||||||||||||||
| Stanley | |||||||||||||||||||||||||||
| Morgan | Hitachi Ltd. | 9/8/2021 | Pay | (0.400)% + TONAR(4) | Monthly | (22,830 | ) | (229,408 | ) | — | (20,038 | ) | |||||||||||||||
| Stanley | |||||||||||||||||||||||||||
| Morgan | SX7P Basket | 6/21/2022 | Pay | (0.450)% + 1 Day EONIA(3) | Monthly | (942 | ) | (91,311 | ) | — | 4,208 | ||||||||||||||||
| Stanley | |||||||||||||||||||||||||||
| Morgan | SXIP | 6/21/2022 | Pay | (0.450)% + 1 Day EONIA(3) | Monthly | (273 | ) | (69,516 | ) | — | 2,147 | ||||||||||||||||
| Stanley | Index Basket | ||||||||||||||||||||||||||
| Morgan | Tax Loss Selling | 2/2/2022 | Pay | (0.300)% + FED(2) | Monthly | (2,606 | ) | (258,489 | ) | — | 14,110 | ||||||||||||||||
| Stanley | 2020 Basket | ||||||||||||||||||||||||||
| Morgan | The Morgan | 3/22/2021 | Pay | (0.500)% + FED(2) | Monthly | (12 | ) | (1,434 | ) | — | 44 | ||||||||||||||||
| Stanley | Stanley Crowd | ||||||||||||||||||||||||||
| Basket | |||||||||||||||||||||||||||
| Morgan | NatWest | 2/2/2022 | Pay | (0.500)% + 1 Day SONIA(1) | Monthly | (26,863 | ) | (43,313 | ) | — | (3,534 | ) | |||||||||||||||
| Stanley | Group plc | ||||||||||||||||||||||||||
The accompanying notes are an integral part of these financial statements.
53
WEISS ALTERNATIVE BALANCED RISK FUND
Schedule of Open Swap Contracts – Continued
October 31, 2020
| Value of | |||||||||||||||||||||||||||
| Pay/Receive | Number of | Unrealized | |||||||||||||||||||||||||
| Counter- | Maturity | Financing | Financing | Payment | Shares/ | Notional | Upfront | Appreciation | |||||||||||||||||||
| party | Security | Date | Rate | Rate | Frequency | Units | Amount | Payment | (Depreciation)* | ||||||||||||||||||
| SHORT EQUITY SWAP CONTRACTS (Continued) | |||||||||||||||||||||||||||
| Morgan | Natixis SA | 5/6/2022 | Pay | (0.500)% + 1 Day EONIA(3) | Monthly | (4,255 | ) | $ | (9,911 | ) | $ | — | $ | 376 | |||||||||||||
| Stanley | |||||||||||||||||||||||||||
| Morgan | Peugeot SA | 12/8/2021 | Pay | (0.500)% + 1 Day EONIA(3) | Monthly | (2,590 | ) | (46,527 | ) | — | 6,043 | ||||||||||||||||
| Stanley | |||||||||||||||||||||||||||
| Morgan | Retail Bricks and | 7/22/2022 | Pay | (0.450)% + FED(2) | Monthly | (232 | ) | (7,132 | ) | — | (536 | ) | |||||||||||||||
| Stanley | Mortar Basket | ||||||||||||||||||||||||||
| Morgan | Schroders plc | 5/6/2022 | Pay | (0.500)% + 1 Day SONIA(1) | Monthly | (262 | ) | (8,876 | ) | — | 362 | ||||||||||||||||
| Stanley | |||||||||||||||||||||||||||
| Morgan | Severn Trent plc | 6/29/2022 | Pay | (0.500)% + 1 Day SONIA(1) | Monthly | (232 | ) | (7,302 | ) | — | (162 | ) | |||||||||||||||
| Stanley | |||||||||||||||||||||||||||
| Morgan | Software | 6/30/2022 | Pay | (0.400)% + FED(2) | Monthly | (2,673 | ) | (462,643 | ) | — | (24,470 | ) | |||||||||||||||
| Stanley | Basket | ||||||||||||||||||||||||||
| Morgan | U.S. Quality | 4/29/2022 | Receive | (0.750)% + FED(2) | Monthly | (2,362 | ) | (309,233 | ) | — | 2,871 | ||||||||||||||||
| Stanley | Short Basket | ||||||||||||||||||||||||||
| Morgan | U.S. Value | 4/1/2022 | Pay | (0.550)% + FED(2) | Monthly | (522 | ) | (138,662 | ) | — | 19,526 | ||||||||||||||||
| Stanley | Short Basket | ||||||||||||||||||||||||||
| Morgan | WPP plc | 2/2/2022 | Pay | (0.500)% + 1 Day SONIA(1) | Monthly | (575 | ) | (4,593 | ) | — | (22 | ) | |||||||||||||||
| Stanley | |||||||||||||||||||||||||||
| $ | (170,056 | ) | |||||||||||||||||||||||||
| (1) | Sterling OverNight Index Average |
| (2) | Federal Funds Rate |
| (3) | Euro OverNight Index Average |
| (4) | Bank of Japan Estimate Unsecured Overnight Call Rate |
| plc – | Public Limited Company |
| * | Based on the net swap value held at each counterparty, unrealized appreciation is a receivable and unrealized depreciation is a payable. |
The accompanying notes are an integral part of these financial statements.
54
WEISS ALTERNATIVE BALANCED RISK FUND
Schedule of Open Futures Contracts
October 31, 2020
| Value and | ||||||||||||||
| Number of | Unrealized | |||||||||||||
| Contracts | Notional | Appreciation | ||||||||||||
Expiration Date | Description | Purchased | Amount | (Depreciation) | ||||||||||
| LONG FUTURES CONTRACTS | ||||||||||||||
| 12/21/2020 | CBT 10-Year U.S. Treasury Bond | 134 | $ | 14,828,163 | $ | (83,996 | ) | |||||||
| 12/21/2020 | CBT Long Term U.S. Treasury Bond | 10 | 1,471,158 | (24,273 | ) | |||||||||
| 12/21/2020 | CBT Ultra Long Term U.S. Treasury Bond | 75 | 9,795,938 | (260,219 | ) | |||||||||
| 12/18/2020 | E-Mini Russell 2000 | 16 | 1,229,440 | 34,240 | ||||||||||
| 12/18/2020 | E-Mini S&P 500 | 67 | 10,936,745 | (195,956 | ) | |||||||||
| 12/18/2020 | E-Mini S&P MidCap 400 | 32 | 6,065,920 | 146,599 | ||||||||||
| 11/3/2020 | LME Aluminum | 1 | 46,175 | 1,922 | ||||||||||
| 11/5/2020 | LME Aluminum | 3 | 138,600 | 5,804 | ||||||||||
| 11/6/2020 | LME Aluminum | 1 | 46,213 | 1,934 | ||||||||||
| 11/13/2020 | LME Aluminum | 4 | 185,225 | 10,613 | ||||||||||
| 11/4/2020 | LME Nickel | 2 | 181,485 | 12,123 | ||||||||||
| 11/5/2020 | LME Nickel | 1 | 90,745 | 4,222 | ||||||||||
| 11/13/2020 | LME Nickel | 1 | 90,764 | 4,745 | ||||||||||
| 11/4/2020 | LME Zinc | 2 | 125,700 | 8,719 | ||||||||||
| 11/5/2020 | LME Zinc | 1 | 62,856 | 2,628 | ||||||||||
| $ | 45,295,127 | $ | (330,895 | ) | ||||||||||
| SHORT FUTURES CONTRACTS | ||||||||||||||
| 12/18/2020 | Euro STOXX 50 | (1 | ) | $ | (34,462 | ) | $ | (1 | ) | |||||
| 11/3/2020 | LME Aluminum | (1 | ) | (46,175 | ) | (2,453 | ) | |||||||
| 11/5/2020 | LME Aluminum | (3 | ) | (138,600 | ) | (5,872 | ) | |||||||
| 11/6/2020 | LME Aluminum | (1 | ) | (46,213 | ) | (2,066 | ) | |||||||
| 11/13/2020 | LME Aluminum | (4 | ) | (185,225 | ) | (8,737 | ) | |||||||
| 11/4/2020 | LME Nickel | (2 | ) | (181,485 | ) | (14,271 | ) | |||||||
| 11/5/2020 | LME Nickel | (1 | ) | (90,745 | ) | (3,238 | ) | |||||||
| 11/13/2020 | LME Nickel | (1 | ) | (90,764 | ) | (4,637 | ) | |||||||
| 11/4/2020 | LME Zinc | (2 | ) | (125,700 | ) | (10,244 | ) | |||||||
| 11/5/2020 | LME Zinc | (1 | ) | (62,856 | ) | (3,347 | ) | |||||||
| $ | (1,002,225 | ) | $ | (54,866 | ) | |||||||||
London Metal Exchange (“LME”) futures contracts settle on their respective maturity date, and do not have daily cash movements like other futures contracts. The unrealized appreciation on these contracts is a receivable for unsettled open futures contracts and the unrealized depreciation is a payable for unsettled open futures contracts on the Fund’s Statement of Assets and Liabilities.
The accompanying notes are an integral part of these financial statements.
55
WEISS ALTERNATIVE BALANCED RISK FUND
Statement of Assets and Liabilities
October 31, 2020
| ASSETS: | ||||
| Investments, at value (Cost $92,693,571) | $ | 93,135,442 | ||
| Cash | 90,675 | |||
| Foreign currency, at value (Cost $2,206,234) | 2,191,578 | |||
| Deposits at broker for securities sold short | 37,323,635 | |||
| Receivable for investments sold | 9,962,828 | |||
| Deposits for futures | 1,930,880 | |||
| Collateral for swap contracts | 1,236,000 | |||
| Receivable for fund shares sold | 95,000 | |||
| Receivable for unsettled open futures contracts | 52,710 | |||
| Receivable from Adviser expense reimbursement, net | 42,713 | |||
| Dividends and interest receivable | 25,011 | |||
| Prepaid expenses and other receivables | 7,867 | |||
| Total assets | 146,094,339 | |||
| LIABILITIES: | ||||
| Securities sold short, at value (Proceeds $36,777,143) | 35,445,932 | |||
| Written option contracts, at value (Premiums received $89,766) | 83,289 | |||
| Payable for investments purchased | 11,273,309 | |||
| Payable to broker – foreign currency, at value (Cost $781,013) | 786,401 | |||
| Variation margin payable, net | 257,470 | |||
| Payable for swap contracts, net | 170,056 | |||
| Payable for custodian fees | 88,091 | |||
| Payable for unsettled open futures contracts | 54,865 | |||
| Payable for fund administration and fund accounting fees | 42,624 | |||
| Dividends and interest payable for securities sold short | 30,436 | |||
| Payable for transfer agent fees and expenses | 15,804 | |||
| Payable for compliance fees | 2,693 | |||
| Distribution and shareholder servicing fees payable | 1,750 | |||
| Payable for forward currency contracts | 71 | |||
| Accrued expenses and other liabilities | 71,658 | |||
| Total liabilities | 48,324,449 | |||
| NET ASSETS | $ | 97,769,890 | ||
| NET ASSETS CONSISTS OF: | ||||
| Paid-in capital | $ | 95,923,630 | ||
| Total distributable earnings | 1,846,260 | |||
| Total net assets | $ | 97,769,890 | ||
| Class K | Investor | |||||||
| Shares | Class Shares | |||||||
| Net assets | $ | 91,864,458 | $ | 5,905,432 | ||||
Shares issued and outstanding(1) | 8,610,845 | 559,149 | ||||||
| Net asset value, offering, and redemption price per share | $ | 10.67 | $ | 10.56 | ||||
(1) | Unlimited shares authorized without par value. |
The accompanying notes are an integral part of these financial statements.
56
WEISS ALTERNATIVE BALANCED RISK FUND
Statement of Operations
For the Year Ended October 31, 2020
| INVESTMENT INCOME: | ||||
| Dividend income on long positions (net of foreign withholding taxes of $8,419) | $ | 2,143,932 | ||
| Interest income, including broker interest on short positions | 526,020 | |||
| Total investment income | 2,669,952 | |||
| EXPENSES: | ||||
| Investment advisory fees (See Note 3) | 1,423,139 | |||
| Dividends on securities sold short | 951,613 | |||
| Borrowing expense on securities sold short | 518,241 | |||
| Custodian fees (See Note 3) | 460,552 | |||
| Fund administration and fund accounting fees (See Note 3) | 228,400 | |||
| Transfer agent fees (See Note 3) | 94,415 | |||
| Legal fees | 45,400 | |||
| Audit fees | 44,500 | |||
| Federal and state registration fees | 40,400 | |||
| Compliance fees (See Note 3) | 15,860 | |||
| Reports to shareholders | 14,801 | |||
| Distribution fees – Investor Class (See Note 3) | 13,976 | |||
| Trustees’ fees (See Note 3) | 11,174 | |||
| Insurance fees | 8,646 | |||
| Shareholder servicing fees – Investor Class (See Note 5) | 5,591 | |||
| Other | 5,300 | |||
| Total expenses before reimbursement | 3,882,008 | |||
| Less: Expense reimbursement by Adviser (See Note 3) | (969,449 | ) | ||
| Net expenses | 2,912,559 | |||
| NET INVESTMENT LOSS | (242,607 | ) | ||
| REALIZED AND CHANGE IN UNREALIZED GAIN (LOSS) ON INVESTMENTS: | ||||
| Net realized gain (loss) on: | ||||
| Investments | 3,430,749 | |||
| Securities sold short | 623,365 | |||
| Written option contracts expired or closed | 322,555 | |||
| Swap contracts | (677,536 | ) | ||
| Futures contracts | 1,495,333 | |||
| Forward currency contracts | 552 | |||
| Foreign currency transactions | (36,881 | ) | ||
| Net realized gain | 5,158,137 | |||
| Net change in unrealized appreciation/depreciation on: | ||||
| Investments | (2,037,654 | ) | ||
| Securities sold short | 2,394,387 | |||
| Written option contracts | (14,253 | ) | ||
| Swap contracts | (179,907 | ) | ||
| Futures contracts | 85,654 | |||
| Forward currency contracts | (45 | ) | ||
| Foreign currency translation | (26,183 | ) | ||
| Net change in unrealized appreciation/depreciation | 221,999 | |||
| Net realized and change in unrealized gain on investments | 5,380,136 | |||
| NET INCREASE IN NET ASSETS RESULTING FROM OPERATIONS | $ | 5,137,529 | ||
The accompanying notes are an integral part of these financial statements.
57
WEISS ALTERNATIVE BALANCED RISK FUND
Statements of Changes in Net Assets
| Year Ended | Year Ended | |||||||
| October 31, 2020 | October 31, 2019 | |||||||
| OPERATIONS: | ||||||||
| Net investment income (loss) | $ | (242,607 | ) | $ | 689,249 | |||
| Net realized gain on investments, securities sold short, | ||||||||
| written option contracts expired or closed, swap contracts, | ||||||||
| futures contracts, forward currency contracts, | ||||||||
| and foreign currency transactions | 5,158,137 | 5,903,966 | ||||||
| Change in unrealized appreciation/depreciation on investments, | ||||||||
| securities sold short, written option contracts, swap contracts, | ||||||||
| futures contracts, forward currency contracts, | ||||||||
| and foreign currency translation | 221,999 | 4,070,109 | ||||||
| Net increase in net assets resulting from operations | 5,137,529 | 10,663,324 | ||||||
| DISTRIBUTIONS TO SHAREHOLDERS: | ||||||||
| Class K | (9,169,641 | ) | (3,518,998 | ) | ||||
| Investor Class | (568,710 | ) | (177,276 | ) | ||||
| Total distributions to shareholders | (9,738,351 | ) | (3,696,274 | ) | ||||
| CAPITAL SHARE TRANSACTIONS: | ||||||||
Net increase in net assets resulting from capital share transactions(1) | 7,256,590 | 2,521,846 | ||||||
| NET INCREASE IN NET ASSETS | 2,655,768 | 9,488,896 | ||||||
| NET ASSETS: | ||||||||
| Beginning of year | 95,114,122 | 85,625,226 | ||||||
| End of year | $ | 97,769,890 | $ | 95,114,122 | ||||
The accompanying notes are an integral part of these financial statements.
58
WEISS ALTERNATIVE BALANCED RISK FUND
Statements of Changes in Net Assets – Continued
(1) | A summary of capital share transactions is as follows: |
SHARE TRANSACTIONS:
| For the Year Ended | For the Year Ended | |||||||||||||||
| October 31, 2020 | October 31, 2019 | |||||||||||||||
| Shares | Amount | Shares | Amount | |||||||||||||
| Class K: | ||||||||||||||||
| Issued | 1,268,413 | $ | 13,295,986 | 679,776 | $ | 7,281,352 | ||||||||||
| Issued to holders in | ||||||||||||||||
| reinvestment of dividends | 617,320 | 6,315,180 | 244,955 | 2,429,956 | ||||||||||||
| Redeemed | (1,242,086 | ) | (13,070,540 | ) | (766,787 | ) | (8,182,577 | ) | ||||||||
| Redemption fees | — | — | — | — | ||||||||||||
| Net increase in Class K | 643,647 | $ | 6,540,626 | 157,944 | $ | 1,528,731 | ||||||||||
| Investor Class: | ||||||||||||||||
| Issued | 97,053 | $ | 1,005,108 | 109,416 | $ | 1,157,963 | ||||||||||
| Issued to holders in | ||||||||||||||||
| reinvestment of dividends | 55,975 | 568,710 | 17,961 | 177,276 | ||||||||||||
| Redeemed | (85,616 | ) | (857,855 | ) | (33,138 | ) | (342,134 | ) | ||||||||
| Redemption fees | — | 1 | — | 10 | ||||||||||||
| Net increase in Investor Class | 67,412 | $ | 715,964 | 94,239 | $ | 993,115 | ||||||||||
| Net increase in shares outstanding | 711,059 | $ | 7,256,590 | 252,183 | $ | 2,521,846 | ||||||||||
The accompanying notes are an integral part of these financial statements.
59
WEISS ALTERNATIVE BALANCED RISK FUND
Statement of Cash Flows
For the Year Ended October 31, 2020
| CASH FLOWS FROM OPERATING ACTIVITIES: | ||||
| Net increase in net assets resulting from operations | $ | 5,137,529 | ||
| Adjustments to reconcile net increase in net assets from operations to net cash | ||||
| from operating activities: | ||||
| Purchases of investments | (614,203,459 | ) | ||
| Purchases of short-term investments, net | (1,178,220 | ) | ||
| Proceeds from sales of investments | 620,347,116 | |||
| Decrease in variation margin receivable | 587,686 | |||
| Decrease in receivable for investments sold | 1,087,361 | |||
| Decrease in net receivable for swap contracts | 179,907 | |||
| Increase in payable for forward currency contracts | 45 | |||
| Decrease in net payable to Adviser | (118,890 | ) | ||
| Decrease in dividends and interest receivable | 30,395 | |||
| Decrease in prepaid expenses and other receivables | 35,085 | |||
| Proceeds from securities sold short | 610,215,640 | |||
| Purchases to cover securities sold short | (613,756,489 | ) | ||
| Premiums received on written option contracts | 1,224,983 | |||
| Written option contracts expired or closed | (750,457 | ) | ||
| Decrease in payable for investments purchased | (148 | ) | ||
| Increase in payable for fund administration and fund accounting fees | 11,242 | |||
| Increase in payable for custodian fees | 46,219 | |||
| Increase in payable for transfer agent fees and expenses | 218 | |||
| Decrease in net payable for unsettled open futures contracts | (6,614 | ) | ||
| Decrease in dividends and interest payable for securities sold short | (15,221 | ) | ||
| Increase in payable for compliance fees | 309 | |||
| Increase in distribution and shareholder servicing fees payable | 236 | |||
| Decrease in payable for trustees’ fees | (2,383 | ) | ||
| Increase in accrued expenses and other liabilities | 10,228 | |||
| Net realized gain on investments | (3,430,749 | ) | ||
| Net realized gain on securities sold short | (623,365 | ) | ||
| Net realized gain on written option contracts expired or closed | (322,555 | ) | ||
| Net realized loss on foreign currency transactions | 36,881 | |||
| Change in unrealized appreciation/depreciation on investments | 2,037,654 | |||
| Change in unrealized appreciation/depreciation on securities sold short | (2,394,387 | ) | ||
| Change in unrealized appreciation/depreciation on written option contracts | 14,253 | |||
| Change in unrealized appreciation/depreciation on foreign currency translation | 26,183 | |||
| Net cash from operating activities | 4,226,233 | |||
The accompanying notes are an integral part of these financial statements.
60
WEISS ALTERNATIVE BALANCED RISK FUND
Statement of Cash Flows – Continued
For the Year Ended October 31, 2020
| CASH FLOWS FROM FINANCING ACTIVITIES: | ||||
| Proceeds from shares sold | $ | 14,217,542 | ||
| Payment for shares redeemed | (13,928,394 | ) | ||
| Cash distributions paid to shareholders | (2,854,462 | ) | ||
| Net cash used in financing activities | (2,565,314 | ) | ||
| Net change in cash, foreign currency and restricted cash | $ | 1,660,919 | ||
| CASH, FOREIGN CURRENCY AND RESTRICTED CASH: | ||||
| Beginning Balance | $ | 40,325,448 | ||
| Ending Balance | $ | 41,986,367 | ||
| SUPPLEMENTAL DISCLOSURES: | ||||
| Borrowing expense on securities sold short | $ | 518,241 | ||
| Non-cash financing activities – reinvestment of distributions | $ | 6,883,890 | ||
| Non-cash financing activities – increase in receivable for fund shares sold | $ | 83,552 | ||
| RECONCILIATION OF RESTRICTED AND | ||||
| UNRESTRICTED CASH AND FOREIGN | ||||
| CURRENCY AT THE BEGINNING OF YEAR | ||||
| TO THE STATEMENT OF ASSETS AND LIABILITIES | ||||
| Cash | $ | 100,000 | ||
| Foreign currency, at value | 563,702 | |||
| Deposit with brokers | ||||
| Collateral for swap contracts | 605,000 | |||
| Deposits for futures | 1,301,558 | |||
| Short sale proceeds | 37,755,188 | |||
| RECONCILIATION OF RESTRICTED AND | ||||
| UNRESTRICTED CASH AND FOREIGN | ||||
| CURRENCY AT THE END OF YEAR TO THE | ||||
| STATEMENT OF ASSETS AND LIABILITIES | ||||
| Cash | $ | 90,675 | ||
| Foreign currency, at value | 2,191,578 | |||
| Payable to broker – foreign currency, at value | (786,401 | ) | ||
| Deposit with brokers | ||||
| Collateral for swap contracts | 1,236,000 | |||
| Deposits for futures | 1,930,880 | |||
| Deposits at broker for securities sold short | 37,323,635 | |||
The accompanying notes are an integral part of these financial statements.
61
WEISS ALTERNATIVE BALANCED RISK FUND
Financial Highlights
| Year Ended | Year Ended | Year Ended | Year Ended | Period Ended | ||||||||||||||||
| October 31, | October 31, | October 31, | October 31, | October 31, | ||||||||||||||||
| Class K | 2020 | 2019 | 2018 | 2017 | 2016(1) | |||||||||||||||
PER SHARE DATA(2): | ||||||||||||||||||||
| Net asset value, beginning of period | $ | 11.25 | $ | 10.44 | $ | 10.45 | $ | 10.40 | $ | 10.00 | ||||||||||
| INVESTMENT OPERATIONS: | ||||||||||||||||||||
Net investment income (loss)(3) | (0.02 | ) | 0.08 | 0.01 | (0.10 | ) | (0.05 | ) | ||||||||||||
| Net realized and unrealized | ||||||||||||||||||||
| gain on investments | 0.62 | 1.18 | 0.17 | 0.59 | 0.45 | |||||||||||||||
| Total from investment operations | 0.60 | 1.26 | 0.18 | 0.49 | 0.40 | |||||||||||||||
| LESS DISTRIBUTIONS FROM: | ||||||||||||||||||||
| Net investment income | (0.11 | ) | (0.21 | ) | — | (0.05 | ) | — | ||||||||||||
| Net realized gains | (1.07 | ) | (0.24 | ) | (0.19 | ) | (0.39 | ) | — | |||||||||||
| Total distributions | (1.18 | ) | (0.45 | ) | (0.19 | ) | (0.44 | ) | — | |||||||||||
| Redemption fees | — | — | 0.00 | (4) | — | — | ||||||||||||||
| Net asset value, end of period | $ | 10.67 | $ | 11.25 | $ | 10.44 | $ | 10.45 | $ | 10.40 | ||||||||||
TOTAL RETURN(5) | 5.79 | % | 12.76 | % | 1.61 | % | 4.97 | % | 4.00 | % | ||||||||||
| SUPPLEMENTAL DATA AND RATIOS: | ||||||||||||||||||||
| Net assets, end of period (in thousands) | $ | 91,865 | $ | 89,627 | $ | 81,498 | $ | 33,214 | $ | 2,701 | ||||||||||
| Ratio of gross expenses to average net assets: | ||||||||||||||||||||
Before expense reimbursement(6)(7) | 4.07 | % | 3.95 | % | 4.25 | % | 8.70 | % | 12.86 | % | ||||||||||
After expense reimbursement(6)(7) | 3.05 | % | 3.16 | % | 3.27 | % | 3.37 | % | 3.44 | % | ||||||||||
| Ratio of dividends, interest, and borrowing expense | ||||||||||||||||||||
on securities sold short to average net assets(6) | 1.55 | % | 1.66 | % | 1.77 | % | 1.69 | % | 1.29 | % | ||||||||||
| Ratio of operating expenses to average net assets | ||||||||||||||||||||
| excluding dividends, interest, and borrowing | ||||||||||||||||||||
expense on securities sold short(6)(7) | 1.50 | % | 1.50 | % | 1.50 | % | 1.68 | % | 2.15 | % | ||||||||||
| Ratio of net investment income (loss) | ||||||||||||||||||||
to average net assets(6)(7) | (0.24 | )% | 0.78 | % | 0.11 | % | (0.96 | )% | (0.53 | )% | ||||||||||
Portfolio turnover rate(5)(8) | 738 | % | 585 | % | 700 | % | 494 | % | 304 | % | ||||||||||
(1) | Inception date of Class K was December 1, 2015. |
(2) | For a Class K share outstanding for the entire period. |
(3) | Calculated based on average shares outstanding during the periods. |
(4) | Amount per share is less than $0.005. |
(5) | Not annualized for periods less than one year. |
(6) | Annualized for periods less than one year. |
(7) | These ratios exclude the impact of expenses of the underlying exchange-traded funds as represented in the Schedule of Investments. Recognition of net investment income by the Fund is affected by the timing of the declaration of dividends by the underlying exchange-traded funds in which the Fund invests. |
(8) | The portfolio turnover disclosed is for the Fund as a whole. The numerator for the portfolio turnover rate includes the lesser of purchases or sales (excluding short-term investments, short-term options, swap contracts, forward currency contracts, futures contracts and short positions). The denominator includes the average fair value of long positions throughout the periods ended. |
The accompanying notes are an integral part of these financial statements.
62
WEISS ALTERNATIVE BALANCED RISK FUND
Financial Highlights
| Year Ended | Year Ended | Year Ended | Period Ended | |||||||||||||
| October 31, | October 31, | October 31, | October 31, | |||||||||||||
| Investor Class | 2020 | 2019 | 2018 | 2017(1) | ||||||||||||
PER SHARE DATA(2): | ||||||||||||||||
| Net asset value, beginning of period | $ | 11.16 | $ | 10.38 | $ | 10.44 | $ | 9.99 | ||||||||
| INVESTMENT OPERATIONS: | ||||||||||||||||
Net investment income (loss)(3) | (0.06 | ) | 0.05 | (0.02 | ) | (0.07 | ) | |||||||||
Net realized and unrealized gain on investments(9) | 0.61 | 1.18 | 0.15 | 0.52 | ||||||||||||
| Total from investment operations | 0.55 | 1.23 | 0.13 | 0.45 | ||||||||||||
| LESS DISTRIBUTIONS FROM: | ||||||||||||||||
| Net investment income | (0.08 | ) | (0.21 | ) | — | — | ||||||||||
| Net realized gains | (1.07 | ) | (0.24 | ) | (0.19 | ) | — | |||||||||
| Total distributions | (1.15 | ) | (0.45 | ) | (0.19 | ) | — | |||||||||
| Redemption fees | 0.00 | (4) | 0.00 | (4) | 0.00 | (4) | — | |||||||||
| Net asset value, end of period | $ | 10.56 | $ | 11.16 | $ | 10.38 | $ | 10.44 | ||||||||
TOTAL RETURN(5) | 5.48 | % | 12.36 | % | 1.22 | % | 4.50 | % | ||||||||
| SUPPLEMENTAL DATA AND RATIOS: | ||||||||||||||||
| Net assets, end of period (in thousands) | $ | 5,905 | $ | 5,487 | $ | 4,128 | $ | 2,989 | ||||||||
| Ratio of gross expenses to average net assets: | ||||||||||||||||
Before expense reimbursement(6)(7) | 4.42 | % | 4.30 | % | 4.60 | % | 11.46 | % | ||||||||
After expense reimbursement(6)(7) | 3.40 | % | 3.51 | % | 3.62 | % | 3.96 | % | ||||||||
| Ratio of dividends, interest, and borrowing expense | ||||||||||||||||
on securities sold short to average net assets(6) | 1.55 | % | 1.66 | % | 1.77 | % | 1.95 | % | ||||||||
| Ratio of operating expenses to average net assets | ||||||||||||||||
| excluding dividends, interest, and borrowing | ||||||||||||||||
expense on securities sold short(6)(7) | 1.85 | % | 1.85 | % | 1.85 | % | 2.01 | % | ||||||||
| Ratio of net investment income (loss) | ||||||||||||||||
to average net assets(6)(7) | (0.59 | )% | 0.43 | % | (0.24 | )% | (1.02 | )% | ||||||||
Portfolio turnover rate(5)(8) | 738 | % | 585 | % | 700 | % | 494 | % | ||||||||
(1) | Inception date of the Investor Class was February 28, 2017. |
(2) | For an Investor Class share outstanding for the entire period. |
(3) | Calculated based on average shares outstanding during the periods. |
(4) | Amount per share is less than $0.005. |
(5) | Not annualized for periods less than one year. |
(6) | Annualized for periods less than one year. |
(7) | These ratios exclude the impact of expenses of the underlying exchange-traded funds as represented in the Schedule of Investments. Recognition of net investment income by the Fund is affected by the timing of the declaration of dividends by the underlying exchange traded funds in which the Fund invests. |
(8) | The portfolio turnover disclosed is for the Fund as a whole. The numerator for the portfolio turnover rate includes the lesser of purchases or sales (excluding short-term investments, short-term options, swap contracts, forward currency contracts, futures contracts and short positions). The denominator includes the average fair value of long positions throughout the periods ended. |
(9) | Realized and unrealized gain and losses per share in this caption are balancing amounts necessary to reconcile the change in net asset value per share for the periods, and may not reconcile with the aggregate gains and losses in the Statement of Operations due to share transactions for the period. |
The accompanying notes are an integral part of these financial statements.
63
WEISS ALTERNATIVE BALANCED RISK FUND
Notes to the Financial Statements
October 31, 2020
1. ORGANIZATION
Series Portfolios Trust (the “Trust”) was organized as a Delaware statutory trust under a Declaration of Trust dated July 27, 2015. The Trust is registered under the Investment Company Act of 1940, as amended (the “1940 Act”), as an open-end management investment company. The Weiss Alternative Balanced Risk Fund (the “Fund”) is a diversified series with its own investment objectives and policies within the Trust. The Fund’s investment adviser, Weiss Multi-Strategy Advisers LLC (the “Adviser”), is responsible for investment advisory services, day-to-day management of the Fund’s assets, as well as compliance, sales, marketing and operation services to the Fund. The primary investment objective of the Fund is to provide returns with moderate volatility and reduced correlation to the bond and equity markets. A secondary objective of the Fund is to limit capital losses during periods when the bond and equity markets decline. The Fund commenced operations on December 1, 2015. The Fund is an investment company and accordingly follows the investment company accounting and reporting guidance of the Financial Accounting Standards Board (“FASB”) Accounting Standards Codification (the “Codification”) Topic 946 Financial Services – Investment Companies. The Fund does not hold itself out as related to any other series of the Trust for purposes of investment and investor services, nor does it share the same investment adviser with any other series of the Trust.
The Fund offers four share classes, Class A, Class I, Class K and Investor Class. Effective March 31, 2017, the Fund ceased offering Class I. As of October 31, 2020, Class A and Class I shares are not available for purchase. Class K and Investor Class shares have no front-end sales load, no deferred sales charge, and a 1.00% redemption fee prior to November 22, 2019. Investor Class shares are subject to a 0.25% distribution fee and a shareholder servicing fee of up to 0.10% of average daily net assets. Class K shares are not subject to a distribution fee or a shareholder servicing fee.
The Fund may issue an unlimited number of shares of beneficial interest, with no par value. All shares of the Fund have equal rights and privileges except with respect to distribution fees and voting rights on matters affecting a single share class.
2. SIGNIFICANT ACCOUNTING POLICIES
The following is a summary of significant accounting policies consistently followed by the Fund in the preparation of its financial statements. These policies are in conformity with generally accepted accounting principles in the United States of America (“GAAP”).
A. Investment Valuation – The following is a summary of the Fund’s pricing procedures. It is intended to be a general discussion and may not necessarily reflect all the pricing procedures followed by the Fund. Equity securities, including common stocks, preferred stocks, and real estate investment trusts (“REITS”) that are traded on a national securities exchange, except those listed on the Nasdaq Global Market®, Nasdaq Global Select Market® and the Nasdaq Capital Market® exchanges (collectively “Nasdaq”), are valued at the last reported sale price on that exchange on which the security is principally traded. Securities traded on Nasdaq will be valued at the Nasdaq Official Closing Price (“NOCP”). If, on a particular day, an exchange traded or Nasdaq security does not trade, then the mean between the most recent quoted bid and asked prices will be used. All equity securities that are not traded on a listed exchange are valued at the last sale price in the over-the-counter (“OTC”) market. If a non-exchanged traded equity security does not trade on a particular day, then the mean between the last quoted closing bid and asked price will be used. To the extent these securities are actively traded and valuation adjustments are not applied, they are categorized in Level 1 of the fair value hierarchy.
Fixed income securities, including short-term debt instruments having a maturity less than 60 days, are valued at the evaluated mean price supplied by an approved independent third-party pricing service (“Pricing Service”). These securities are categorized in Level 2 of the fair value hierarchy.
64
WEISS ALTERNATIVE BALANCED RISK FUND
Notes to the Financial Statements – Continued
October 31, 2020
In the case of foreign securities, the occurrence of events after the close of foreign markets, but prior to the time the Fund’s NAV is calculated will result in an adjustment to the trading prices of foreign securities when foreign markets open on the following business day. The Fund will value foreign securities at fair value, taking into account such events in calculating the NAV. In such cases, use of fair valuation can reduce an investor’s ability to seek profit by estimating the Fund’s NAV in advance of the time the NAV is calculated. These securities are categorized in Level 2 of the fair value hierarchy.
Exchange traded funds and closed-end funds are valued at the last reported sale price on the exchange on which the security is principally traded. If, on a particular day, an exchange-traded fund does not trade, then the mean between the most recent quoted bid and asked prices will be used. To the extent these securities are actively traded and valuation adjustments are not applied, they are categorized in Level 1 of the fair value hierarchy.
Investments in registered open-end investment companies (including money market funds), other than exchange-traded funds, are typically valued at their reported NAV per share. To the extent these securities are valued at their NAV per share, they are categorized in Level 1 of the fair value hierarchy.
Forward currency contracts maturing in two or fewer days are valued at the spot rate. Forward currency contracts maturing in three days or more are valued at the midpoint prices calculated by U.S. Bancorp Fund Services, LLC, doing business as U.S. Bank Global Fund Services (“Fund Services” or the “Administrator”) using an “interpolation” methodology that incorporates foreign-exchange prices obtained from an approved pricing service for standard forward-settlement periods, such as one month, three months, six months and one year. These securities are categorized in Level 2 of the fair value hierarchy.
Exchange traded options and Flexible Exchange® options (“FLEX options”) are valued at the composite mean price, which calculates the mean of the highest bid price and lowest ask price across the exchanges where the option is principally traded. If the composite mean price is not available, the last sale or settlement price may be used. For non-exchange traded options, models such as Black-Scholes can be used to value the options. On the last trading day prior to expiration, expiring options may be priced at intrinsic value. These securities are categorized in Level 2 of the fair value hierarchy.
Futures contracts are valued at the settlement price on the exchange on which they are principally traded. The settlement price is the average of the prices at which a futures contract trades immediately before the close of trading for the day. Equity swap contract prices are determined by using the same methods used to price the underlying security. These securities are categorized in Level 1 or Level 2 of the fair value hierarchy.
Securities for which market quotations are not readily available, or if the closing price does not represent fair value, are valued following procedures approved by the Board of Trustees (the “Board”). These procedures consider many factors, including the type of security, size of holding, trading volume and news events. There can be no assurance that the Fund could obtain the fair value assigned to a security if they were to sell the security at approximately the time at which the Fund determines their net asset values per share. The Board has established a Valuation Committee to administer, implement, and oversee the fair valuation process, and to make fair value decisions when necessary. The Board regularly reviews reports that describe any fair value determinations and methods.
The Fund has adopted authoritative fair value accounting standards which establish an authoritative definition of fair value and set out a hierarchy for measuring fair value. These standards require additional disclosures about the various inputs and valuation techniques used to develop the measurements of fair value, a discussion in changes in valuation techniques and related inputs during the period and expanded disclosure of valuation levels for major security types. These inputs are summarized in the three broad levels listed below:
65
WEISS ALTERNATIVE BALANCED RISK FUND
Notes to the Financial Statements – Continued
October 31, 2020
| Level 1 – | Unadjusted quoted prices in active markets for identical assets or liabilities that the Fund has the ability to access. |
| Level 2 – | Observable inputs other than quoted prices included in Level 1 that are observable for the asset or liability, either directly or indirectly. These inputs may include quoted prices for the identical instrument on an inactive market, prices for similar instruments, interest rates, prepayment speeds, credit risk, yield curves, default rates and similar data. |
| Level 3 – | Unobservable inputs for the asset or liability, to the extent relevant observable inputs are not available, representing the Fund’s own assumptions about the assumptions a market participant would use in valuing the asset or liability, and would be based on the best information available. |
The inputs or methodology used for valuing securities are not an indication of the risk associated with investing in those securities.
The following table is a summary of the inputs used to value the Fund’s securities by level within the fair value hierarchy as of October 31, 2020:
| Level 1 | Level 2 | Level 3 | Total | |||||||||||||
| Assets | ||||||||||||||||
Investments at Fair Value | ||||||||||||||||
Long Common Stocks(1) | $ | 40,487,863 | $ | 2,376,548 | $ | 13,607 | $ | 42,878,018 | ||||||||
| Long Contingent Value Rights | — | — | 157 | 157 | ||||||||||||
| Long Exchange Traded Funds | 38,366,556 | — | — | 38,366,556 | ||||||||||||
| Long Preferred Stocks | — | 7,429 | — | 7,429 | ||||||||||||
| Long Rights | 16,704 | — | — | 16,704 | ||||||||||||
| Long Warrants | 21,039 | 42,261 | — | (3) | 63,300 | |||||||||||
| Purchased Options | 15,759 | 98,537 | — | 114,296 | ||||||||||||
| Long Short-Term Investments | 11,688,982 | — | — | 11,688,982 | ||||||||||||
| $ | 90,596,903 | $ | 2,524,775 | $ | 13,764 | $ | 93,135,442 | |||||||||
| Liabilities | ||||||||||||||||
Investments at Fair Value | ||||||||||||||||
Short Common Stocks(1) | $ | (22,857,750 | ) | $ | (1,760,662 | ) | $ | — | $ | (24,618,412 | ) | |||||
| Short Exchange Traded Funds | (10,656,489 | ) | (28,569 | ) | — | (10,685,058 | ) | |||||||||
| Short Preferred Stocks | — | (142,462 | ) | — | (142,462 | ) | ||||||||||
Other Instruments | ||||||||||||||||
| Written Call Options | (3,377 | ) | (28,779 | ) | — | (32,156 | ) | |||||||||
| Written Put Options | (2,715 | ) | (48,418 | ) | — | (51,133 | ) | |||||||||
Swap Contracts(2) | — | (170,056 | ) | — | (170,056 | ) | ||||||||||
Forward Currency Contracts(2) | — | (71 | ) | — | (71 | ) | ||||||||||
Futures Contracts(2) | — | (385,761 | ) | — | (385,761 | ) | ||||||||||
| $ | (33,520,331 | ) | $ | (2,564,778 | ) | $ | — | $ | (36,085,109 | ) | ||||||
(1) | Please refer to the Schedule of Investments to view long and short common stocks segregated by industry type. |
(2) | Swap contracts, future contracts and forward currency contracts are valued at the net unrealized appreciation (depreciation) on the instrument as presented on the Schedules of Open Swap Contracts, Open Forward Currency Contracts, and Open Futures Contracts. |
(3) | Amount less than $0.50. |
For the year ended October 31, 2020, there were no transfers into or out of Level 3.
66
WEISS ALTERNATIVE BALANCED RISK FUND
Notes to the Financial Statements – Continued
October 31, 2020
B. Securities Sold Short – The Fund sells securities or currencies short for economic hedging purposes or any other investment purpose. For financial statement purposes, an amount equal to the settlement amount is initially included in the Statement of Assets and Liabilities as an asset and an equivalent liability. The amount of the liability is subsequently priced to reflect the current value of the short position. Subsequent fluctuations in the market prices of securities or currencies sold, but not yet purchased, may require purchasing the securities or currencies at prices which may differ from the fair value reflected on the Statement of Assets and Liabilities. Short sale transactions result in off balance sheet risk because the ultimate obligation may exceed the related amounts shown in the Statement of Assets and Liabilities. The Fund will incur losses if the price of the security increases between the date of the short sale and the date on which the Fund purchases the securities to replace the borrowed securities. The Fund’s losses on short sales are potentially unlimited because there is no upward limit on the price a borrowed security could attain.
The Fund is liable for any dividends and interest payable on securities while those securities are sold short. Until the security is replaced, the Fund is required to pay to the lender any income earned, which is recorded as an expense by the Fund. The Fund’s policy is to segregate liquid assets in an amount equal to the fair value of securities sold short (not including proceeds received), which is reflected in the Schedule of Investments. These assets are required to be adjusted daily to reflect changes in the value of the securities or currencies sold short.
C. Transactions with Brokers – The Fund’s deposits at brokers for securities sold short are with one securities dealer. The Fund does not require the brokers to maintain collateral in support of the receivables from the brokers for proceeds on securities sold short. The Fund is required by the brokers to maintain collateral at the brokers or in a segregated account at the Fund’s custodian for securities sold short. The Fund may maintain cash deposits at brokers beyond the receivables for short sales.
The Fund’s written options contracts’, equity swap contracts’, forward currency contracts’ and futures contracts cash deposits are monitored daily by the Adviser and counterparty. Cash deposits beyond the short sale proceeds by the Fund are presented as deposits at brokers on the Statement of Assets and Liabilities. The Fund’s securities sold short and written option contracts are traded through the same account at Morgan Stanley and the deposits associated with these investments are not able to be determined by security or contract type. These transactions may involve market risk in excess of the amounts receivable or payable reflected on the Statement of Assets and Liabilities.
D. Written Option Contracts – The Fund is subject to equity price risk in the normal course of pursuing its investment objectives. The Fund writes (sells) put or call options for hedging purposes, volatility management purposes, or otherwise to gain, or reduce, long or short exposure to one or more asset classes or issuers. When a Fund writes (sells) an option, an amount equal to the premium received by the Fund is included in the Statement of Assets and Liabilities as an asset and an equivalent liability. The amount of the liability is subsequently priced daily to reflect the current value of the option written. Refer to Note 2 A. for a pricing description. By writing an option, a Fund may become obligated during the term of the option to deliver or purchase the securities underlying the option at the exercise price if the option is exercised. These contracts may involve market risk in excess of the amounts receivable or payable reflected on the Statement of Assets and Liabilities. Refer to Note 2 R. for further derivative disclosures, and Note 2 P. for further counterparty risk disclosure.
When an option expires on its stipulated expiration date or the Fund enters into a closing purchase transaction, the Fund realizes gains or losses if the cost of the closing purchase transaction differs from the premium received when the option was sold without regard to any unrealized appreciation or depreciation on the underlying security,
67
WEISS ALTERNATIVE BALANCED RISK FUND
Notes to the Financial Statements – Continued
October 31, 2020
and the liability related to such option is eliminated. When a written call option is exercised, the premium originally received decreases the cost basis of the security and the Fund realizes gains or losses from the sale of the underlying security. When a written put option is exercised, the cost of the security acquired is decreased by the premium received for the put.
E. Purchased Option Contracts – The Fund is subject to equity price risk in the normal course of pursuing its investment objectives. The Fund purchases put or call options for hedging purposes, volatility management purposes, or otherwise to gain, or reduce, long or short exposure to one or more asset classes or issuers. When the Fund purchases an option contract, an amount equal to the premiums paid is included in the Statement of Assets and Liabilities Investments at value as an investment, and is subsequently priced daily to reflect the value of the purchased option contract. Refer to Note 2 A. for a pricing description. Refer to Note 2 R. for further derivative disclosures, and Note 2 P. for further counterparty risk disclosure.
When an option expires on its stipulated expiration date or the Fund enters into a closing sale transaction, the Fund realizes gains or losses if the cost of the closing sale transaction differs from the premiums paid, when the option was purchased without regard to any unrealized appreciation or depreciation on the underlaying security, and the asset related to such option is eliminated. When a purchased call option is exercised, the premiums originally paid increase the cost basis of the security and the Fund realizes gains or losses form the sale of the underlying security. When a purchased put option is exercised, the cost of the security acquired is increased by the premium paid for the put.
F. Flex Options – FLEX Options are customized option contracts available through the CBOE that are guaranteed for settlement by The Options Clearing Corporation (“OCC” or the “Clearinghouse”). FLEX Options provide investors with the ability to customize exercise prices and expiration dates, while achieving price discovery in competitive, transparent auctions markets and avoiding the counterparty exposure of over-the-counter (“OTC”) options positions. The Fund bears the risk that the Clearinghouse will be unable or unwilling to perform its obligations under the FLEX Options contracts.
G. Forward Currency Contracts – The Fund is subject to foreign currency rate risk in the normal course of pursuing its investment objectives. The Fund may enter into forward contracts for foreign currency hedging purposes, volatility management purposes or otherwise to gain, or reduce, long or short exposure to one or more asset classes or issuers. The Fund may enter into forward currency exchange contracts obligating the Fund to deliver and receive a currency at a specified future date. Forward contracts are valued daily, and unrealized appreciation or depreciation is recorded daily as the difference between the contract exchange rate and the closing forward rate applied to the face amount of the contract. Refer to Note 2 A. for a pricing description. A realized gain or loss is recorded at the time the forward contract expires. Credit risk may arise as a result of the failure of the counterparty to comply with the terms of the contract. Refer to Note 2 P. for further counterparty risk disclosure.
The use of forward currency exchange contracts does not eliminate fluctuations in the underlying prices of the Fund’s investment securities. The use of forward currency exchange contracts involves the risk that anticipated currency movements will not be accurately predicted. A forward currency exchange contract would limit the risk of loss due to a decline in the value of a particular currency; however, it would also limit any potential gain that might result should the value of the currency increase instead of decrease. These contracts may involve market risk in excess of the amounts receivable or payable reflected on the Statement of Assets and Liabilities. Refer to Note 2 R. for further derivative disclosures.
68
WEISS ALTERNATIVE BALANCED RISK FUND
Notes to the Financial Statements – Continued
October 31, 2020
H. Futures Contracts – The Fund may enter into futures contracts traded on domestic and international exchanges, including stock index and fixed income futures contracts. The Fund may enter into futures contracts for hedging purposes, volatility management purposes, or otherwise to gain or reduce long or short exposure to one or more asset classes. Upon entering into a contract, the Fund deposits and maintains as collateral such initial margin as required by the exchange on which the transaction is affected. Pursuant to the contract, the Fund agrees to receive from or pay to the broker an amount of cash equal to the daily fluctuation in value of the contract (with the exception of futures contracts traded on the London Metal Exchange (“LME”). Such receipts or payments are known as variation margin and are recorded by the Fund as unrealized gains and losses. When the contract is closed, the Fund records a realized gain or loss equal to the difference between the value of the contract at the time it was opened and the value at the time it was closed. The variation margin on LME futures contracts do not settle daily, but rather settle at their respective maturity dates. At year end, the unrealized appreciation and depreciation on LME futures contracts is shown as a receivable for unsettled open futures contracts and payable for unsettled futures contracts, respectively, on the Statement of Assets and Liabilities. The risks inherent in the use of futures contracts include adverse changes in the value of such instruments. Refer to Note 2 A. for a pricing description. Refer to Note 2 R. for further derivative disclosures, and Note 2 P. for further counterparty risk disclosure.
I. Equity Swap Contracts – The Fund is subject to equity price risk and interest rate risk in the normal course of pursuing its investment objectives. During the year ended October 31, 2020, the Fund entered into both long and short equity swap contracts. The Fund may enter into swap contracts for hedging purposes, volatility management purposes, or otherwise to gain or reduce long or short exposure to one or more asset classes. A long equity swap contract entitles the Fund to receive from the counterparty any appreciation and dividends paid on an individual security, while obligating the Fund to pay the counterparty any depreciation on the security as well as interest on the notional amount of the contract generally at a rate equal to the Euro OverNight Index Average (“EONIA”) or the Sterling OverNight Index Average (“SONIA”), Bank of Japan Estimate Unsecured Overnight Call Rate (“TONAR”) or the Federal Funds Rate (“FED”) (plus an additional rate. Please see the Schedule of Swaps for details on a contract by contract basis). A short equity swap contract obligates the Fund to pay the counterparty any appreciation and dividends paid on an individual security, while entitling the Fund to receive from the counterparty any depreciation on the security, and to pay to or receive from the counterparty interest on the notional value of the contract generally at a rate equal to EONIA, SONIA, TONAR or FED (plus an additional rate. Please see the Schedule of Open Swap Contracts for details on a contract by contract basis).
Fluctuations in the value of an open contract are recorded daily as net unrealized appreciation or depreciation. The Fund will realize gains or losses upon termination or reset of the contract. Either party, under certain conditions, may terminate the contract prior to the contract’s expiration date. Refer to Note 2 A. for a pricing description. Credit risk may arise as a result of the failure of the counterparty to comply with the terms of the contract. Refer to Note 2 P. for further counterparty risk disclosure. Additionally, risk may arise from unanticipated movements in interest rates or in the value of the underlying securities. These contracts may involve market risk in excess of the amounts receivable or payable reflected on the Statement of Assets and Liabilities. Refer to Note 2 R. for further derivative disclosures.
J. Foreign Securities and Currency Translation – Investment securities and other assets and liabilities denominated in foreign currencies are translated into U.S. dollar amounts at the date of valuation. Purchases and sales of investment securities and income and expense items denominated in foreign currencies are translated into U.S. dollar amounts on the respective dates of such transactions. The Fund does not isolate the portion of the results of operations from changes in foreign exchange rates on investments from the fluctuations arising from changes in market prices of securities held. Reported net realized foreign exchange gains or losses arise from sales
69
WEISS ALTERNATIVE BALANCED RISK FUND
Notes to the Financial Statements – Continued
October 31, 2020
of foreign currencies, and the difference between the amounts of dividends, interest, and foreign withholding taxes recorded on the Fund’s books and the U.S. dollar equivalent of the amounts actually received or paid. Net unrealized foreign exchange gains and losses arise from changes in the fair values of assets and liabilities, other than investments in securities at fiscal year-end, resulting from changes in exchange rates.
Investments in foreign securities entail certain risks. There may be a possibility of nationalization or expropriation of assets, confiscatory taxation, political or financial instability, and diplomatic developments that could affect the value of the Fund’s investments in certain foreign countries. Since foreign securities normally are denominated and traded in foreign currencies, the value of the Fund’s assets may be affected favorably or unfavorably by currency exchange rates, currency exchange control regulations, foreign withholding taxes, and restrictions or prohibitions on the repatriation of foreign currencies. There may be less information publicly available about a foreign issuer than about a U.S. issuer, and foreign issuers are not generally subject to accounting, auditing, and financial reporting standards and practices comparable to those in the United States. The securities of some foreign issuers are less liquid and at times more volatile than securities of comparable U.S. issuers.
K. Cash and Cash Equivalents – The Fund considers highly liquid short-term fixed income investments purchased with an original maturity of less than three months to be cash equivalents. Cash equivalents are included in short-term investments on the Schedule of Investments as well as in investments on the Statement of Assets and Liabilities.
L. Guarantees and Indemnifications – In the normal course of business, the Fund enters into contracts with service providers that contain general indemnification clauses. The Fund’s maximum exposure under these arrangements is unknown, as this would involve future claims that may be made against the Fund that have not yet occurred.
M. Security Transactions, Income and Expenses – The Fund follows industry practice and records security transactions on the trade date. Realized gains and losses on sales of securities are calculated on the basis of identified cost. Dividend income and expense is recorded on the ex-dividend date and interest income and expense is recorded on an accrual basis. Withholding taxes on foreign dividends have been provided for in accordance with the Fund’s understanding of the applicable country’s tax rules and regulations. Discounts and premiums on securities purchased are amortized over the expected life of the respective securities. Interest income is accounted for on the accrual basis and includes amortization of premiums and accretion of discounts on the effective interest method.
N. Allocation of Income, Expenses and Gains/Losses – Income, expenses (other than those deemed attributable to a specific share class), and gains and losses of the Fund are allocated daily to each class of shares based upon the ratio of net assets represented by each class as a percentage of the net assets of the Fund. Expenses deemed directly attributable to a class of shares are recorded by the specific class. Most Fund expenses are allocated by class based on relative net assets. 12b-1 fees are expensed at 0.25% of average daily net assets of Investor Class shares (See Note 5). Shareholder servicing fees are expensed at an annual rate of up to 0.10% of average daily net assets of Investor Class shares (See Note 5). Trust Expenses associated with a specific fund in the Trust are charged to that fund. Common Trust expenses are typically allocated evenly between the funds of the Trust, or by other equitable means.
O. Share Valuation – The NAV per share of the Fund is calculated by dividing the sum of the value of the securities held by the Fund, plus cash and other assets, minus all liabilities (including estimated accrued expenses) by the total number of shares outstanding for the Fund, rounded to the nearest cent. The Fund’s shares will not be priced on days which the New York Stock Exchange (“NYSE”) is closed for trading.
70
WEISS ALTERNATIVE BALANCED RISK FUND
Notes to the Financial Statements – Continued
October 31, 2020
P. Counterparty Risk – The Fund helps manage counterparty credit risk by entering into agreements only with counterparties the Adviser believes have the financial resources to honor its obligations. The Adviser considers the credit worthiness of each counterparty to a contract in evaluating potential credit risk. The counterparty risk for forward currency exchange contracts to the Fund includes the amount of any net unrealized appreciation on the contract. The counterparty risk for equity swaps contracts to the Fund includes the risk of loss of the full amount of any net unrealized appreciation on the contract, along with dividends receivable on long equity contracts and interest receivable on short equity contracts. Written and purchased options and futures contracts sold on an exchange do not expose the Fund to counterparty risk; the exchange’s clearinghouse guarantees the options and futures against counterparty nonperformance. Over-the-counter options counterparty risk includes the risk of loss of the full amount of any net unrealized appreciation.
Q. Use of Estimates – The preparation of financial statements in conformity with GAAP requires management to make estimates and assumptions that affect the reported amounts of assets and liabilities and disclosure of contingent assets and liabilities at the date of the financial statements and the reported amounts of revenues and expenses during the reporting period. Actual results could differ from those estimates.
R. Derivatives – The Fund may utilize derivative instruments such as options, swaps, futures, forward currency exchange contracts and other instruments with similar characteristics to the extent that they are consistent with the Fund’s respective investment objectives and limitations. The use of these instruments may involve additional investment risks, including the possibility of illiquid markets or imperfect correlation between the value of the instruments and the underlying securities. Derivatives also may create leverage which will amplify the effect of their performance on the Fund and may produce significant losses. Refer to Note 7 for further derivative disclosure.
The Fund has adopted authoritative standards regarding disclosure about derivatives and hedging activities and how they affect the Fund’s Statement of Assets and Liabilities and Statement of Operations. For the year ended October 31, 2020, the Fund’s average derivative volume is described below:
| Monthly Average | Monthly Average | |||||||
| Quantity | Notional Value | |||||||
| Purchased Options Contracts | 2,099 | $ | 9,674,307 | |||||
| Written Options Contracts | 935 | 3,418,343 | ||||||
| Long Total Return Swap Contracts | 142,018 | 1,859,586 | ||||||
| Short Total Return Swap Contracts | 120,616 | 3,592,432 | ||||||
| Long Futures Contracts | 425 | 47,732,526 | ||||||
| Short Futures Contracts | 49 | 3,827,018 | ||||||
| Long Forward Currency Contracts | 305,361 | 42,679 | ||||||
| Short Forward Currency Contracts | 184,894 | 43,157 | ||||||
71
WEISS ALTERNATIVE BALANCED RISK FUND
Notes to the Financial Statements – Continued
October 31, 2020
Statement of Assets and Liabilities
The effect of derivative instruments as of October 31, 2020:
| Statement of Assets and | |||||||||||
Liabilities Location | Assets | Liabilities | |||||||||
| Purchased Option Contracts | |||||||||||
| Equity | Investments, at value | $ | 114,296 | $ | — | ||||||
| Written Option Contracts | |||||||||||
| Equity | Written option contracts, at value | — | 83,289 | ||||||||
| Swap Contracts | |||||||||||
| Equity | Payable for swap contracts | — | 170,056 | ||||||||
| Forward Currency Contracts | |||||||||||
| Foreign Exchange | Payable for forward | ||||||||||
| currency contracts | — | 71 | |||||||||
| Futures Contracts | |||||||||||
| Commodity | Receivable/Payable for unsettled | ||||||||||
| open futures contracts | 52,710 | 54,865 | |||||||||
| Equity | Variation margin for futures contracts | — | 188,751 | ||||||||
| Interest rate | Variation margin for futures contracts | — | 68,719 | ||||||||
| Total Futures Contracts | 52,710 | 312,335 | |||||||||
| Total | $ | 167,006 | $ | 565,751 | |||||||
Statement of Operations
The effect of derivative instruments on the Statement of Operations for the year ended October 31, 2020:
| Net Realized Gain (Loss) on Derivatives | ||||||||||||||||||||||||
| Purchased | Written | Forward | ||||||||||||||||||||||
| Option | Option | Swap | Futures | Currency | ||||||||||||||||||||
Derivatives | Contracts* | Contracts | Contracts | Contracts | Contracts | Total | ||||||||||||||||||
| Equity Contracts | $ | (426,429 | ) | $ | 322,555 | $ | (677,536 | ) | $ | (849,486 | ) | $ | — | $ | (1,630,896 | ) | ||||||||
| Commodity Contracts | — | — | — | (205,126 | ) | — | (205,126 | ) | ||||||||||||||||
| Interest Rate Contracts | — | — | — | 2,549,945 | — | 2,549,945 | ||||||||||||||||||
| Foreign Exchange Contracts | — | — | — | — | 552 | 552 | ||||||||||||||||||
| Total | $ | (426,429 | ) | $ | 322,555 | $ | (677,536 | ) | $ | 1,495,333 | $ | 552 | $ | 714,475 | ||||||||||
72
WEISS ALTERNATIVE BALANCED RISK FUND
Notes to the Financial Statements – Continued
October 31, 2020
| Net Change in Unrealized Appreciation/Depreciation on Derivatives | ||||||||||||||||||||||||
| Purchased | Written | Forward | ||||||||||||||||||||||
| Option | Option | Swap | Futures | Currency | ||||||||||||||||||||
Derivatives | Contracts** | Contracts | Contracts | Contracts | Contracts | Total | ||||||||||||||||||
| Equity Contracts | $ | 167,180 | $ | (14,253 | ) | $ | (179,907 | ) | $ | (324,289 | ) | $ | — | $ | (351,269 | ) | ||||||||
| Commodity Contracts | — | — | — | 71,134 | — | 71,134 | ||||||||||||||||||
| Interest Rate Contracts | — | — | — | 338,809 | — | 338,809 | ||||||||||||||||||
| Foreign Exchange Contracts | — | — | — | — | (45 | ) | (45 | ) | ||||||||||||||||
| Total | $ | 167,180 | $ | (14,253 | ) | $ | (179,907 | ) | $ | 85,654 | $ | (45 | ) | $ | 58,629 | |||||||||
| * | The amounts disclosed are included in net realized gain (loss) on investments. | |
| ** | The amounts disclosed are included in net change in unrealized appreciation/depreciation on investments. |
3. RELATED PARTY TRANSACTIONS
The Trust has an agreement with the Adviser to furnish investment advisory services to the Fund. Pursuant to an Investment Advisory Agreement between the Trust and the Adviser, the Adviser is entitled to receive, on a monthly basis, an annual advisory fee equal to 1.50% of the Fund’s average daily net assets.
The Fund’s Adviser has contractually agreed in an Operating Expenses Limitation Agreement to reduce its management fees and/or absorb expenses of the Fund to ensure that total annual operating expenses after fee waiver and/or expense reimbursement (excluding 12b-1 fees – Class A and Investor Class (see Note 5), shareholder servicing fees – Class A, Class I and Investor Class (see Note 5), any acquired fund fees and expenses, front-end or contingent deferred loads, redemption fees, swap fees and expenses, dividends and interest on short positions, taxes, leverage interest, brokerage fees (including commissions, mark-ups and mark-downs), annual account fees for margin accounts, expenses incurred in connection with any merger or reorganization and extraordinary expenses such as litigation) do not exceed 1.50% of the Fund’s average daily net assets. As of October 31, 2020, Class A shares and Class I shares are not available. The Adviser may request recoupment of previously waived fees and reimbursed Fund expenses from the Fund for three years from the date they were waived or reimbursed, provided that, after payment of the recoupment, the Total Annual Fund Operating Expenses do not exceed the lesser of the Expense Cap: (i) in effect at the time of the waiver or reimbursement; or (ii) in effect at the time of recoupment. The Operating Expenses Limitation Agreement is intended to be continual in nature and cannot be terminated within one year after the effective date of the Fund’s prospectus and subject thereafter to termination at any time upon 60 days written notice and approval by the Board or the Advisor, with consent of the Board. Waived fees and reimbursed expenses subject to potential recovery during the fiscal year of expiration are as follows:
Expiration | Amount | |||
| November 2020 to October 2021 | $ | 693,183 | ||
| November 2021 to October 2022 | 712,179 | |||
| November 2022 to October 2023 | 969,449 | |||
Fund Services acts as the Fund’s Administrator, transfer agent, and fund accountant. U.S. Bank N.A. (the “Custodian”) serves as the custodian to the Fund. The Custodian is an affiliate of the Administrator. The Administrator performs various administrative and accounting services for the Fund. The Administrator prepares various federal and state regulatory filings, reports and returns for the Fund; prepares reports and materials to be supplied to the Trustees; monitors the activities of the Fund’s custodian; coordinates the payment of the Fund’s expenses and reviews the Fund’s expense accruals. The officers of the Trust, including the Chief Compliance
73
WEISS ALTERNATIVE BALANCED RISK FUND
Notes to the Financial Statements – Continued
October 31, 2020
Officer, are employees of the Administrator. A trustee of the Trust is an officer of the Administrator. As compensation for its services, the Administrator is entitled to a monthly fee at an annual rate based upon the average daily net assets of the Fund, subject to annual minimums. Fees paid by the Fund for administration and accounting, transfer agency, custody and compliance services for the year ended October 31, 2020, are disclosed in the Statement of Operations.
During the period November 1, 2019 through March 31, 2020, Quasar Distributors, LLC (“Quasar”), an affiliate of the Administrator, served as the Fund’s distributor and principal underwriter in the continuous public offering of the Fund’s shares before being acquired by Foreside Financial Group, LLC (“Foreside”). A Trustee of the Trust also was an interested person of Quasar during that period. Effective March 31, 2020, Foreside acquired Quasar, the Fund’s Distributor, from U.S. Bancorp. As a result of the acquisition, Quasar became a wholly-owned broker-dealer subsidiary of Foreside and is no longer affiliated with U.S. Bancorp. The Board has approved a new Distribution Agreement to enable Quasar to continue serving as the Fund’s distributor.
4. TAX FOOTNOTE
Federal Income Taxes – The Fund intends to comply with the requirements of Subchapter M of the Internal Revenue Code of 1986, as amended, necessary to qualify as a regulated investment company and distributes substantially all net taxable investment income and net realized gains to shareholders in a manner which results in no tax cost to the Fund. Therefore, no federal income or excise tax provision is required. As of and during the year ended October 31, 2020, the Fund did not have any tax positions that did not meet the “more-likely-than-not” threshold of being sustained by the applicable tax authority and did not have liabilities for any unrecognized tax benefits. The Fund recognizes interest and penalties, if any, related to unrecognized tax benefits on uncertain tax positions as income tax expense in the Statement of Operations. The Fund is not subject to examination by taxing authorities for tax years prior to October 31, 2017.
As of October 31, 2020, the components of accumulated earnings (losses) on a tax basis were as follows:
| Tax cost of investments* | $ | 63,689,304 | ||
| Gross unrealized appreciation | $ | 4,778,962 | ||
| Gross unrealized depreciation | (10,012,756 | ) | ||
| Net unrealized depreciation | (5,233,794 | ) | ||
| Undistributed ordinary income | — | |||
| Undistributed long-term capital gain | 7,264,313 | |||
| Other accumulated losses | (184,259 | ) | ||
| Total distributable earnings | $ | 1,846,260 |
| * | Represents cost for federal income tax purposes and differs from the cost for financial reporting purposes due to partnership adjustments, wash sales, derivatives and constructive sales. |
As of October 31, 2020, the Fund did not have any capital loss carryovers. A regulated investment company may elect for any taxable year to treat any portion of any qualified late year loss as arising on the first day of the next taxable year. Qualified late year losses are certain ordinary losses which occur during the portion of the Fund’s taxable period subsequent to December 31. For the taxable year ended October 31, 2020, the Fund does not plan to defer any qualified late year losses.
74
WEISS ALTERNATIVE BALANCED RISK FUND
Notes to the Financial Statements – Continued
October 31, 2020
Distributions to Shareholders – The Fund distributes substantially all net investment income, if any, and net realized capital gains, if any, annually. Distributions to shareholders are recorded on the ex-dividend date. The treatment for financial reporting purposes of distributions made to shareholders during the year from net investment income or net realized capital gains may differ from their treatment for federal income tax purposes. These differences are caused primarily by differences in the timing of the recognition of certain components of income, expense or realized capital gain for federal income tax purposes. Where such differences are permanent in nature, GAAP requires that they be reclassified in the components of the net assets based on their ultimate characterization for federal income tax purposes. Any such reclassifications will have no effect on net assets, results of operations or net asset values per share of the Fund. For the year ended October 31, 2020 the following table shows the reclassifications made:
| Total | |||
| Distributable | |||
Earnings | Paid-in Capital | ||
| $(433,751) | $433,751 |
The tax character of distributions paid for the years ended October 31, 2020 and October 31, 2019 were as follows:
| Ordinary Income* | Long-Term Capital Gain | Total | ||||||||||
| 2020 | $ | 6,836,476 | $ | 2,901,875 | $ | 9,738,351 | ||||||
| 2019 | 3,696,274 | — | 3,696,274 | |||||||||
| * | For federal income tax purposes, distributions of short-term capital gains are treated as ordinary income distributions. |
5. DISTRIBUTION & SHAREHOLDER SERVICING FEES
The Fund has adopted a Distribution Plan pursuant to Rule 12b-1 (the “Plan”) for Class A and the Investor Class. The Plan permits the Fund to pay for distribution and related expenses at an annual rate of 0.25% average daily net assets of Class A and the Investor Class. Amounts paid under the Plan are paid to the Distributor to compensate it for costs of the services it provides to Class A and Investor Class shares of the Fund and the expenses it bears in the distribution of the Fund’s Class A and Investor Class shares, including overhead and telephone expenses; printing and distribution of prospectuses and reports used in connection with the offering of the Fund’s Investor class shares to prospective investors; and preparation, printing, payments to intermediaries and distribution of sales literature and advertising materials.
Under the Plan, the Trustees will be furnished quarterly with information detailing the amount of expenses paid under the Plan and the purposes for which payments were made. The Plan may be terminated at any time by vote of a majority of the Trustees of the Trust who are not interested persons. Continuation of the Plan is considered by such Trustees no less frequently than annually. With the exception of the Distributor and the Adviser, in their capacities as the Fund’s principal underwriter and distribution coordinator, respectively, no interested person has or had a direct or indirect financial interest in the Plan or any related agreement. As of October 31, 2020, Class A shares are not available. For the year ended October 31, 2020, the Investor Class incurred expenses of $13,976 pursuant to the Plan.
In addition, pursuant to a Shareholder Service Plan (the “Shareholder Servicing Plan”) adopted by the Trust on behalf of the Fund, the Advisor is authorized to engage financial institutions, securities dealers and other industry professionals (“Shareholder Servicing Agent”) to provide personal shareholder services relating to the servicing and maintenance of shareholder accounts not otherwise provided to the Fund. Payments made pursuant to the Shareholder Servicing Plan shall not exceed 0.10% of the average daily net asset value of Class A, Class I and the
75
WEISS ALTERNATIVE BALANCED RISK FUND
Notes to the Financial Statements – Continued
October 31, 2020
Investor Class of the Fund’s shares. For the year ended October 31, 2020, the Investor Class incurred expenses of $5,591 to the plan. As of October 31, 2020 Class A and Class I shares are not available for purchase.
Payments made under the Shareholder Servicing Plan shall be used to compensate Shareholder Servicing Agents for providing general shareholder liaison services, including, but not limited to: (i) answering inquiries from shareholders regarding account status and history, the manner in which purchases and redemptions of the Fund shares may be effected, and other matters pertaining to the Fund; (ii) assisting shareholders in designating and changing dividend options, account designations and addresses; (iii) arranging for wiring of funds and transmitting and receiving funds in connection with orders to purchase or redeem Fund shares; (iv) verifying and guaranteeing shareholder signatures in connection with orders to purchase or redeem Fund shares; (v) providing such other similar services related to the maintenance of shareholder accounts; and (vi) providing necessary personnel and facilities to conduct the activities described above.
Distribution and shareholder servicing fees are not subject to the Operating Expenses Limitation Agreement to reduce management fees and/or absorb Fund expenses by the Adviser. Distribution and shareholder servicing fees will increase the expenses beyond the Operating Expenses Limitation Agreement rate of 1.50% for Class A, Class I and Investor Class.
6. INVESTMENT TRANSACTIONS
The aggregate purchases and sales, excluding short-term investments, by the Fund for the year ended October 31, 2020, were as follows:
| Purchases | Sales | |||||||
| U.S. Government | $ | — | $ | — | ||||
| Other | 610,468,531 | 617,498,389 | ||||||
7. OFFSETTING ASSETS AND LIABILITIES
The Fund is subject to various Master Netting Arrangements, which govern the terms of certain transactions with select counterparties. The Master Netting Arrangements allow the Fund to close out and net its total exposure to a counterparty in the event of a default with respect to all the transactions governed under a single agreement with a counterparty. The Master Netting Arrangements also specify collateral posting arrangements at pre-arranged exposure levels. Under the Master Netting Arrangements, collateral is routinely transferred if the total net exposure to certain transactions (net of existing collateral already in place) governed under the relevant Master Netting Arrangement with a counterparty in a given account exceeds a specified threshold depending on the counterparty and the type of Master Netting Arrangement. Morgan Stanley is the prime broker for exchange traded derivatives and the counterparty for swaps.
76
WEISS ALTERNATIVE BALANCED RISK FUND
Notes to the Financial Statements – Continued
October 31, 2020
| Gross | Net Amounts | Gross Amounts not offset in the Statement of Assets and Liabilities | ||||||||||||||||||||||
| Gross | Amounts | Presented | ||||||||||||||||||||||
| Amounts of | Offset in the | in the | ||||||||||||||||||||||
| Recognized | Statement of | Statement | Collateral | |||||||||||||||||||||
| Assets/ | Assets and | of Assets | Financial | Received/ | Net | |||||||||||||||||||
| Liabilities | Liabilities | and Liabilities | Instruments | Pledged* | Amount | |||||||||||||||||||
| Assets: | ||||||||||||||||||||||||
| Description | ||||||||||||||||||||||||
| Swap Contracts | $ | 140,111 | $ | 140,111 | $ | — | $ | — | $ | — | $ | — | ||||||||||||
| Forward Currency Contracts | — | — | — | — | — | — | ||||||||||||||||||
| Futures Contracts | 52,710 | — | 52,710 | 52,710 | — | — | ||||||||||||||||||
| $ | 192,821 | $ | 140,111 | $ | 52,710 | $ | 52,710 | $ | — | $ | — | |||||||||||||
| Liabilities: | ||||||||||||||||||||||||
| Description | ||||||||||||||||||||||||
| Written Option Contracts | $ | 83,289 | $ | — | $ | 83,289 | $ | — | $ | 83,289 | $ | — | ||||||||||||
| Swap Contracts | 310,167 | 140,111 | 170,056 | — | 170,056 | — | ||||||||||||||||||
| Futures Contracts | 312,335 | — | 312,335 | 52,710 | 259,625 | — | ||||||||||||||||||
| Forward Currency Contracts | 71 | — | 71 | — | 71 | — | ||||||||||||||||||
| $ | 705,862 | $ | 140,111 | $ | 565,751 | $ | 52,710 | $ | 513,041 | $ | — | |||||||||||||
| * | In some instances, the actual collateral pledged/received may be more than amount shown. |
8. BENEFICIAL OWNERSHIP
The beneficial ownership, either directly or indirectly, of more than 25% of the voting securities of a fund creates a presumption of control of the fund, under Section 2(a)(9) of the Investment Company Act of 1940. As of October 31, 2020, affiliates of the Adviser owned 26.36% of the outstanding shares of the Fund and National Financial Services, for the benefit of its customers, owned 63.92% of the outstanding shares of the Fund.
9. COVID-19
The global outbreak of COVID-19 (commonly referred to as “coronavirus”) has disrupted economic markets and the prolonged economic impact is uncertain. The ultimate economic fallout from the pandemic, and the long-term impact on economies, markets, industries and individual issuers, are not known. The operational and financial performance of the issuers of securities in which the Fund invests depends on future developments, including the duration and spread of the outbreak, and such uncertainty may in turn adversely affect the value and liquidity of the Fund’s investments, impair the Fund’s ability to satisfy redemption requests, and negatively impact the Fund’s performance.
10. SUBSEQUENT EVENTS
Management has evaluated events and transactions for potential recognition or disclosure through the date the financial statements were issued.
On December 22, 2020, the Fund declared a short term capital gain distribution of $0.79206 per share for the Investor Class and Class K, and an income distribution of $0.01201883 and $0.01870831 per share for the Investor Class and Class K, respectively; all payable on December 22, 2020 to the shareholders of record on December 21, 2020.
77
WEISS ALTERNATIVE BALANCED RISK FUND
Report of Independent Registered Public Accounting Firm
To the Shareholders of Weiss Alternative Balanced Risk Fund and
Board of Trustees of Series Portfolios Trust
Opinion on the Financial Statements
We have audited the accompanying statement of assets and liabilities, including the schedules of investments, written options, open forward currency contracts, open swap contracts, and open futures contracts, of Weiss Alternative Balanced Risk Fund (the “Fund”), a series of Series Portfolios Trust, as of October 31, 2020, the related statements of operations and cash flows for the year then ended, the statements of changes in net assets for each of the two years in the period then ended, including the related notes, and the financial highlights for each of the five periods in the period then ended (collectively referred to as the “financial statements”). In our opinion, the financial statements present fairly, in all material respects, the financial position of the Fund as of October 31, 2020, the results of its operations and its cash flows for the year then ended, the changes in its net assets for each of the two years in the period then ended, and the financial highlights for each of the five periods in the period then ended, in conformity with accounting principles generally accepted in the United States of America.
Basis for Opinion
These financial statements are the responsibility of the Fund’s management. Our responsibility is to express an opinion on the Fund’s financial statements based on our audits. We are a public accounting firm registered with the Public Company Accounting Oversight Board (United States) (“PCAOB”) and are required to be independent with respect to the Fund in accordance with the U.S. federal securities laws and the applicable rules and regulations of the Securities and Exchange Commission and the PCAOB.
We conducted our audits in accordance with the standards of the PCAOB. Those standards require that we plan and perform the audit to obtain reasonable assurance about whether the financial statements are free of material misstatement whether due to error or fraud.
Our audits included performing procedures to assess the risks of material misstatement of the financial statements, whether due to error or fraud, and performing procedures that respond to those risks. Such procedures included examining, on a test basis, evidence regarding the amounts and disclosures in the financial statements. Our procedures included confirmation of securities owned as of October 31, 2020, by correspondence with the custodian and brokers, or by other appropriate auditing procedures where replies from brokers were not received. Our audits also included evaluating the accounting principles used and significant estimates made by management, as well as evaluating the overall presentation of the financial statements. We believe that our audits provide a reasonable basis for our opinion.
We have served as the Fund’s auditor since 2015.

COHEN & COMPANY, LTD.
Milwaukee, Wisconsin
December 30, 2020
78
WEISS ALTERNATIVE BALANCED RISK FUND
Board Consideration of Investment Advisory Agreement (Unaudited)
October 31, 2020
Under Section 15 of the Investment Company Act of 1940 (the “1940 Act”), the Board of Trustees (the “Board” or the “Trustees”) of Series Portfolios Trust (the “Trust”), including a majority of the Trustees who have no direct or indirect interest in the investment advisory agreement and who are not “interested persons” of the Trust, as defined in the 1940 Act (the “Independent Trustees”), must determine annually whether to approve the continuation of the Trust’s investment advisory agreements.
At an in-person meeting held on July 23, 2020 (the “Meeting”), the Board, including the Independent Trustees, considered and approved the continuance of the advisory agreement (the “Advisory Agreement”) between the Trust, on behalf of the Weiss Alternative Balanced Risk Fund (the “Fund”), and Weiss Multi-Strategy Advisors, LLC (“Weiss”), for an additional one-year term. At the Meeting, the Board considered the factors and reached the conclusions described below in reviewing and approving Weiss to continue serving as the Fund’s investment adviser for another year.
In connection with the annual review process and in advance of the Meeting, Weiss provided information to the Board in response to requests submitted to it by U.S. Bank Global Fund Services (“Fund Services”), the Fund’s administrator, on behalf of the Board, to facilitate the Board’s evaluation of the terms of the Advisory Agreement. The information furnished by Weiss included materials describing, among other matters: (i) the nature, extent, and quality of the services provided by Weiss, including Weiss’ portfolio managers and other personnel, and the investment practices and techniques used by Weiss in managing the Fund; (ii) the historical investment performance of the Fund; (iii) the management fees payable by the Fund to Weiss and the Fund’s overall fees and operating expenses compared with those of a peer group of mutual funds; (iv) Weiss’ profitability and economies of scale; and (v) other ancillary or “fall-out” benefits Weiss and/or its affiliates may receive based on their relationships with the Fund. In addition to the Meeting, the Board met virtually on July 8, 2020 with Fund Services to discuss the materials that had been furnished by Weiss in response to the information requests. The Board also met periodically over the course of the year. At these meetings, representatives of Weiss furnished quarterly reports and other information to the Board regarding the performance of the Fund, the services provided to the Fund by Weiss, and compliance and operational matters related to the Fund and Weiss.
In considering and approving the Advisory Agreement for another year, the Board considered the information it deemed relevant, including but not limited to the information discussed below. The Board considered not only the specific information presented in connection with the Meeting, but also the knowledge gained over time through previous interactions with Weiss. The Board did not identify any particular information or consideration that was all-important or controlling, and each individual Trustee may have attributed different weights to various factors. The Independent Trustees were assisted in their evaluation of the Advisory Agreement by independent legal counsel, from whom they received separate legal advice and with whom they met separately from management and the Interested Trustee. The following summarizes a number of relevant, but not necessarily all, factors considered by the Board in reaching its determination.
Nature, Extent and Quality of Services to be Provided to the Fund
The Board considered the nature, extent and quality of services provided to the Fund by Weiss under the Advisory Agreement. This information included, among other things, the qualifications, background, tenure and responsibilities of each of the portfolio managers who are primarily responsible for the day-to-day portfolio management of the Fund. It also included information about Weiss’ investment process and portfolio strategy for the Fund, the approach to security selection and the overall positioning of the Fund’s portfolio. The Board noted that Weiss had been managing the Fund’s portfolio since its inception.
79
WEISS ALTERNATIVE BALANCED RISK FUND
Board Consideration of Investment Advisory Agreement (Unaudited) – Continued
October 31, 2020
The Board evaluated the ability of Weiss, based on attributes such as its financial condition, resources and reputation, to attract and retain qualified investment professionals, including research, advisory and supervisory personnel. The Board further considered Weiss’ compliance program and its compliance record since the inception of the Fund, noting no material deficiencies.
Based on the above factors, as well as those discussed below, the Board concluded, within the context of its full deliberations, that Weiss is capable of continuing to provide services of the nature, extent and quality contemplated by the terms of the Advisory Agreement.
Investment Performance
The Board considered the Fund’s investment performance information as of June 30, 2020 as compared to its benchmark index, the Bloomberg Barclays US Aggregate Bond Index, and noted that the Fund’s Class K and Investor Class shares outperformed the index for the three-year and since inception periods. The Board also noted that the Fund’s Class K and Investor Class shares underperformed the index for the one-year period ended June 30, 2020. Additionally, the Board considered the Fund’s investment performance for the year-to-date, one-year and three-year periods ended April 30, 2020 as compared to a peer group derived from funds in the Morningstar, Inc. (“Morningstar”) US Fund Multialternative category. The Trustees noted that the Fund’s Class K shares outperformed the Morningstar peer group average and median for all such applicable periods.
After considering the investment performance information described above, the Trustees concluded that the performance obtained by Weiss for the Fund was satisfactory under current market conditions. Although past performance is not a guarantee or indication of future results, the Trustees determined that the Fund and its shareholders were likely to benefit from Weiss’s continued management.
Fees and Expenses
The Board reviewed and considered the contractual investment management fee rate payable by the Fund to Weiss for investment management services (the “Management Fee Rate”). Among other information reviewed by the Board was a comparison of the Management Fee Rate of the Fund with those of other funds in an expense group (the “Expense Group”) that was derived from information provided by Morningstar based on screening criteria applied by Fund Services in consultation with Weiss. The Board noted that the Management Fee Rate was higher than the Expense Group average and median.
The Board received and evaluated information about the nature and extent of responsibilities and duties assumed by Weiss. The Board also noted that Weiss reported that it does not manage any accounts using the same or similar strategy as that applied to the Fund.
Based on its consideration of the factors and information it deemed relevant, including those described here, the Board determined that the Management Fee Rate was reasonable in light of the services expected to be covered, and those currently being covered, by the Advisory Agreement.
The Board received and considered information regarding the Fund’s net operating expense ratios and their various components, including contractual and/or estimated management fees, administrative fees, custodian and other non-management fees, Rule 12b-1 and non-Rule 12b-1 service fees and fee waiver and expense reimbursement arrangements. The Board recognized that Weiss had entered into an expense limitation agreement (the “Expense Limitation Agreement”) to limit the total annual fund operating expenses of each class of the Fund
80
WEISS ALTERNATIVE BALANCED RISK FUND
Board Consideration of Investment Advisory Agreement (Unaudited) – Continued
October 31, 2020
(excluding Rule 12b-1 fees, shareholder servicing fees, redemption fees, swap fees and expenses, dividends and interest on short positions, taxes, leverage interest, brokerage fees (including commissions, mark-ups and mark-downs), annual account fees for margin accounts, expenses incurred in connection with any merger or reorganization, or extraordinary expenses such as litigation) to 1.50% of the average daily net assets. The Board considered the net operating expense ratios in comparison to the average and median ratios of the Expense Group. The Board received a description of the methodology and screening criteria used by Fund Services to select the mutual funds and share classes in the Expense Group. The Board noted that the Fund’s net expense ratio for each of Class K and Investor Class shares was higher than both the average ratio and median ratio of the Expense Group. The Board acknowledged that Weiss absorbs all expenses incurred by the Fund above its management fee, excepting any expenses not covered under the Expense Limitation Agreement.
Based on its consideration of the factors and information it deemed relevant, including the distinguishing features of the Fund as described above, the Board concluded that the expense structure of the Fund supported the continuation of the Advisory Agreement.
Profitability and Economies of Scale
The Board requested and received a report on Weiss’ revenue and expenses resulting from services provided to the Fund pursuant to the Advisory Agreement for the twelve months ended March 31, 2020. The Board noted that Weiss has subsidized the Fund’s operations since inception but has not yet recouped those subsidies. The Board further observed that Weiss’s profit from sponsoring the Fund had not been, and currently was not, excessive.
With respect to economies of scale, the Board reviewed the Fund’s operating history and noted that the Fund had experienced growth since it commenced operations. The Board then considered whether the Fund was large enough to generate economies of scale for shareholders or whether economies of scale would be expected to be realized as Fund assets grow. The Board was advised that the Expense Limitation Agreement limits costs to shareholders and provides a means of sharing potential economies of scale with the Fund. The Board noted that it would have an opportunity to consider economies of scale in the context of future contract renewals as Weiss continues to expand its operations and the Fund grows.
Ancillary Benefits Derived from the Relationship with the Fund
The Board received and considered information regarding ancillary or “fall-out” benefits to Weiss as a result of its relationship with the Fund. Ancillary benefits could include, among others, benefits attributable to research credits generated by Fund portfolio transactions. In this regard, Weiss confirmed it had benefited firm-wide from research credits generated by Fund portfolio transactions over the past twelve months. Ancillary benefits could also include benefits potentially derived from an increase in Weiss’ business as a result of its relationship with the Fund (such as the ability to market to shareholders other potential financial products and services offered by Weiss, or to operate other products and services that follow investment strategies similar to those of the Fund). Based on its consideration of the factors and information it deemed relevant, including those described here, the Board did not find that any ancillary benefits received by Weiss were unreasonable.
Conclusions
In considering the renewal of the Advisory Agreement, the Trustees did not identify any one factor as all-important, but rather considered these factors collectively in light of the Fund’s surrounding circumstances. After considering the above-described factors and based on its deliberations and its evaluation of the information described above, the Board unanimously approved the Advisory Agreement for an additional one-year term.
81
WEISS ALTERNATIVE BALANCED RISK FUND
Statement Regarding the Fund’s Liquidity Risk Management Program (Unaudited)
October 31, 2020
In accordance with Rule 22e-4 under the Investment Company Act of 1940, as amended, Series Portfolios Trust (the “Trust”) has adopted and implemented a liquidity risk management program (the “Trust Program”). As required under the Trust Program, Weiss Multi-Strategy Advisers, LLC (the “Adviser”), the investment adviser to the Weiss Alternative Balanced Risk Fund (the “Fund”), a series of the Trust, has adopted and implemented a liquidity risk management program tailored specifically to the Fund (the “Adviser Program”). The Adviser Program seeks to promote effective liquidity risk management for the Fund and to protect Fund shareholders from dilution of their interests. The Board of Trustees (the “Board”) of the Trust has approved the Adviser as the administrator for the Adviser Program (the “Program Administrator”). The Program Administrator has further delegated administration of the Adviser Program to its Liquidity Risk Management Committee. The Program Administrator is required to provide a written annual report to the Board and the Trust’s chief compliance officer regarding the adequacy and effectiveness of the Adviser Program, including the operation of the Fund’s highly liquid investment minimum, if applicable, and any material changes to the Adviser Program.
On October 22, 2020, the Board reviewed the Program Administrator’s written annual report for the period June 1, 2019 through June 30, 2020 (the “Report”). The Report provided an assessment of the Fund’s liquidity risk: the risk that the Fund could not meet requests to redeem shares issued by the Fund without significant dilution of the remaining investors’ interests in the Fund. The Adviser Program assesses liquidity risk under both normal and reasonably foreseeable stressed market conditions. The Program Administrator has retained ICE Data Services, Inc., a third-party vendor, to provide portfolio investment classification services, and the Report noted that the Fund primarily held investments that were classified as highly liquid during the review period. The Report noted that the Fund’s portfolio is expected to continue to primarily hold highly liquid investments and the determination that the Fund be designated as a “primarily highly liquid fund” (as defined in Rule 22e-4) remains appropriate and the Fund can therefore continue to rely on the exclusion in Rule 22e-4 from the requirements to determine and review a highly liquid investment minimum for the Fund and to adopt policies and procedures for responding to a highly liquid investment minimum shortfall. The Report noted that there were no breaches of the Fund’s restriction on holding illiquid investments exceeding 15% of its net assets during the review period. The Report confirmed that the Fund’s investment strategy was appropriate for an open-end management investment company. The Report also indicated that no material changes had been made to the Adviser Program during the review period.
The Program Administrator determined that the Fund is reasonably likely to be able to meet redemption requests without adversely affecting non-redeeming Fund shareholders through significant dilution. The Program Administrator concluded that the Adviser Program was adequately designed and effectively implemented during the review period.
82
WEISS ALTERNATIVE BALANCED RISK FUND
Additional Information (Unaudited)
October 31, 2020
TRUSTEES AND OFFICERS
| Number of | |||||
| Portfolios | |||||
| in Fund | Other | ||||
| Positions | Term of Office | Complex(2) | Directorships | ||
| Name and | with | and Length of | Principal Occupations | Overseen | Held During |
Year of Birth | the Trust | Time Served | During Past Five Years | by Trustees | Past Five Years |
Independent Trustees of the Trust(1) | |||||
| Koji Felton | Trustee | Indefinite Term; | Counsel, Kohlberg Kravis | 1 | Independent |
| (born 1961) | Since | Roberts & Co. L.P. | Trustee, | ||
| September | (2013 – 2015). | Listed Funds | |||
| 2015. | Trust | ||||
| (Since 2019). | |||||
| Debra McGinty-Poteet | Trustee | Indefinite Term; | Retired. | 1 | Independent |
| (born 1956) | Since | Trustee, | |||
| September | First Western | ||||
| 2015. | Funds Trust | ||||
| (Since | |||||
| May 2015). | |||||
| Daniel B. Willey | Trustee | Indefinite Term; | Retired. Chief Compliance | 1 | None |
| (born 1955) | Since | Officer, United Nations | |||
| September | Joint Staff Pension Fund | ||||
| 2015. | (2009 – 2017). | ||||
| Interested Trustee | |||||
Jeanine M. Bajczyk(3) | Chair, | Indefinite Term; | Senior Vice President, | 1 | None |
| (born 1965) | Trustee | Since | U.S. Bank Global Fund | ||
| July | Services (since 2006). | ||||
| 2020. | |||||
| Officers of the Trust | |||||
| Ryan L. Roell | President | Indefinite Term; | Vice President, | Not | Not |
| (born 1973) | and | Since | U.S. Bank Global Fund | Applicable | Applicable |
| Principal | July | Services (since 2005). | |||
| Executive | 2019. | ||||
| Officer | |||||
| Cullen O. Small | Vice | Indefinite Term; | Vice President, | Not | Not |
| (born 1987) | President, | Since | U.S. Bank Global Fund | Applicable | Applicable |
| Treasurer | January | Services (since 2010). | |||
| and Principal | 2019. | ||||
| Financial | |||||
| Officer | |||||
83
WEISS ALTERNATIVE BALANCED RISK FUND
Additional Information (Unaudited) – Continued
October 31, 2020
| Number of | |||||
| Portfolios | |||||
| in Fund | Other | ||||
| Positions | Term of Office | Complex(2) | Directorships | ||
| Name and | with | and Length of | Principal Occupations | Overseen | Held During |
Year of Birth | the Trust | Time Served | During Past Five Years | by Trustees | Past Five Years |
| Donna Barrette | Vice | Indefinite Term; | Senior Vice President | Not | Not |
| (born 1966) | President, | Since | and Compliance Officer, | Applicable | Applicable |
| Chief | November | U.S. Bank Global Fund | |||
| Compliance | 2019. | Services (since 2004). | |||
| Officer and | |||||
| Anti-Money | |||||
| Laundering | |||||
| Officer | |||||
| Adam W. Smith | Secretary | Indefinite Term; | Vice President, | Not | Not |
| (born 1981) | Since | U.S. Bank Global | Applicable | Applicable | |
| June | Services Fund | ||||
| 2019. | (since 2012). | ||||
| Hailey S. Glaser | Assistant | Indefinite Term; | Assistant Vice President, | Not | Not |
| (born 1989) | Treasurer | Since | U.S. Bank Global Fund | Applicable | Applicable |
| July | Services (since 2015); | ||||
| 2019. | Audit Senior, Deloitte & | ||||
| Touche LP | |||||
| (2012 – 2015). | |||||
| Kristen M. Pierson | Assistant | Indefinite Term; | Assistant Vice President, | Not | Not |
| (born 1979) | Treasurer | Since | U.S. Bank Global Fund | Applicable | Applicable |
| July | Services (since 2017); | ||||
| 2019. | Lead Fund Accountant, | ||||
| UMB Fund Services, Inc. | |||||
| (2006 – 2017). |
(1) | The Trustees of the Trust who are not “interested persons” of the Trust as defined by the 1940 Act (“Independent Trustees”). |
(2) | As of October 31, 2020, the Trust was comprised of 7 portfolios (including the Fund) managed by unaffiliated investment advisers. The term “Fund Complex” applies only to the Fund. The Fund does not hold itself out as related to any other series within the Trust for investment purposes, nor does it share the same investment adviser with any other series within the Trust. |
(3) | Ms. Bajczyk, as a result of her employment with U.S. Bank Global Fund Services, which acts as transfer agent, administrator, and fund accountant to the Trust, is considered to be an “interested person” of the Trust, as defined by the 1940 Act. |
84
WEISS ALTERNATIVE BALANCED RISK FUND
Additional Information (Unaudited) – Continued
October 31, 2020
AVAILABILITY OF FUND PORTFOLIO INFORMATION
The Fund files complete schedules of portfolio holdings with the SEC for the first and third quarters of each fiscal year on Part F of Form N-PORT, which is available on the SEC’s website at www.sec.gov. The Fund’s Part F of Form N-PORT may be reviewed and copied at the SEC’s Public Reference Room in Washington, D.C. For information on the Public Reference Room call 1-800-SEC-0330. In addition, the Fund’s Part F of Form N-PORT is available without charge upon request by calling 1-866-530-2690.
AVAILABILITY OF PROXY VOTING INFORMATION
A description of the Fund’s Proxy Voting Policies and Procedures is available without charge, upon request, by calling 1-866-530-2690. Information regarding how the Fund voted proxies relating to portfolio securities during the most recent period ended June 30, is available (1) without charge, upon request, by calling 1-866-530-2690, or (2) on the SEC’s website at www.sec.gov.
QUALIFIED DIVIDEND INCOME/DIVIDENDS RECEIVED DEDUCTION
For the year ended October 31, 2020, certain dividends paid by the Fund may be reported as qualified dividend income (QDI) and may be eligible for the taxation of capital gains rates. The percentage of dividends declared from ordinary income designated as QDI was 2.67%.
For corporate shareholders, the percent of ordinary income distributions qualifying for the corporate dividends received deduction for the fiscal year ended October 31, 2020 was 2.94%.
The percentage of taxable ordinary income distributions that are designated as short-term capital gain distributions under Internal Revenue Section 871 (k)(2)(c) was 100%.
85
WEISS ALTERNATIVE BALANCED RISK FUND
Privacy Notice (Unaudited)
The Fund collects non-public information about you from the following sources:
• Information we receive about you on applications or other forms;
• Information you give us orally; and/or
• Information about your transactions with us or others
We do not disclose any non-public personal information about our customers or former customers without the customer’s authorization, except as permitted by law. We may share information with affiliated and unaffiliated third parties with whom we have contracts for servicing the Fund. We will provide unaffiliated third parties with only the information necessary to carry out their assigned responsibilities. We maintain physical, electronic and procedural safeguards to guard your personal information and require third parties to treat your personal information with the same high degree of confidentiality.
In the event that you hold shares of the Fund through a financial intermediary, including, but not limited to, a broker-dealer, bank, or trust company, the privacy policy of your financial intermediary would govern how your non-public personal information would be shared with unaffiliated third parties.
86
(This Page Intentionally Left Blank.)
INVESTMENT ADVISER
Weiss Multi-Strategy Advisers LLC
320 Park Avenue, 20th Floor
New York, NY 10022
DISTRIBUTOR
Quasar Distributors, LLC
111 East Kilbourn Avenue, Suite 2200
Milwaukee, WI 53202
CUSTODIAN
U.S. Bank N.A.
1555 North Rivercenter Drive, Suite 302
Milwaukee, WI 53212
ADMINISTRATOR, FUND ACCOUNTANT
AND TRANSFER AGENT
U.S. Bancorp Fund Services, LLC
615 East Michigan Street
Milwaukee, WI 53202
INDEPENDENT REGISTERED PUBLIC ACCOUNTING FIRM
Cohen & Company, Ltd.
342 North Water Street, Suite 830
Milwaukee, WI 53202
LEGAL COUNSEL
Goodwin Procter LLP
901 New York Avenue NW
Washington, DC 20001
This report should be accompanied or preceded by a prospectus.
The Fund’s Statement of Additional Information contains additional information about the
Fund’s trustees and is available without charge upon request by calling 1-866-530-2690.
Item 2. Code of Ethics.
The registrant has adopted a code of ethics that applies to the registrant’s principal executive officer and principal financial officer. The registrant has not made any substantive amendments to its code of ethics during the period covered by this report. The registrant has not granted any waivers from any provisions of the code of ethics during the period covered by this report.
File: A copy of the registrant’s Code of Ethics is filed herewith.
Item 3. Audit Committee Financial Expert.
The registrant’s board of trustees has determined that there is at least one audit committee financial expert serving on its audit committee. Debra McGinty-Poteet is the “audit committee financial expert” and is considered to be “independent” as each term is defined in Item 3 of Form N‑CSR.
Item 4. Principal Accountant Fees and Services.
The registrant has engaged its principal accountant to perform audit services, audit-related services, tax services and other services during the past fiscal year. “Audit services” refer to performing an audit of the registrant's annual financial statements or services that are normally provided by the accountant in connection with statutory and regulatory filings or engagements for the past fiscal year. “Audit-related services” refer to the assurance and related services by the principal accountant that are reasonably related to the performance of the audit. “Tax services” refer to professional services rendered by the principal accountant for tax compliance, tax advice, and tax planning; including reviewing the Fund’s tax returns and distribution calculations. There were no “other services” provided by the principal accountant. For the fiscal years ended October 31, 2020 and October 31, 2019, the Fund’s principal accountant was Cohen & Company, Ltd. The following table details the aggregate fees billed or expected to be billed for each of the last two fiscal years for audit fees, audit-related fees, tax fees and other fees by the principal accountant.
| FYE 10/31/2020 | FYE 10/31/2019 | |
Audit Fees | $42,500 | $35,000 |
Audit-Related Fees | $0 | $0 |
Tax Fees | $7,000 | $6,500 |
All Other Fees | $0 | $0 |
The audit committee has adopted pre-approval policies and procedures that require the audit committee to pre‑approve all audit and non‑audit services of the registrant, including services provided to any entity affiliated with the registrant.
The percentage of fees billed by Cohen & Company, Ltd. applicable to non-audit services pursuant to waiver of pre-approval requirement were as follows:
| FYE 10/31/2020 | FYE 10/31/2019 | |
Audit-Related Fees | 0% | 0% |
Tax Fees | 0% | 0% |
All Other Fees | 0% | 0% |
All of the principal accountant’s hours spent on auditing the registrant’s financial statements were attributed to work performed by full‑time permanent employees of the principal accountant.
The following table indicates the non-audit fees billed or expected to be billed by the registrant’s accountant for services to the registrant and to the registrant’s investment adviser (and any other controlling entity, etc.—not sub-adviser) for the last two fiscal years. The audit committee of the board of trustees has considered whether the provision of non-audit services that were rendered to the registrant's investment adviser is compatible with maintaining the principal accountant's independence and has concluded that the provision of such non-audit services by the accountant has not compromised the accountant’s independence.
Non-Audit Related Fees | FYE 10/31/2020 | FYE 10/31/2019 |
Registrant | $0 | $0 |
Registrant’s Investment Adviser | $0 | $0 |
Item 5. Audit Committee of Listed Registrants.
Not applicable to registrants who are not listed issuers (as defined in Rule 10A-3 under the Securities Exchange Act of 1934).
Item 6. Investments.
(a) | Schedule of Investments is included as part of the report to shareholders filed under Item 1 of this Form. |
(b) | Not applicable. |
Item 7. Disclosure of Proxy Voting Policies and Procedures for Closed-End Management Investment Companies.
Not applicable to open-end investment companies.
Item 8. Portfolio Managers of Closed-End Management Investment Companies.
Not applicable to open-end investment companies.
Item 9. Purchases of Equity Securities by Closed‑End Management Investment Company and Affiliated Purchasers.
Not applicable to open-end investment companies.
Item 10. Submission of Matters to a Vote of Security Holders.
There have been no material changes to the procedures by which shareholders may recommend nominees to the registrant’s board of trustees.
Item 11. Controls and Procedures.
(a) | The Registrant’s President and Treasurer have reviewed the Registrant's disclosure controls and procedures (as defined in Rule 30a-3(c) under the Investment Company Act of 1940 (the “Act”)) as of a date within 90 days of the filing of this report, as required by Rule 30a-3(b) under the Act and Rules 13a-15(b) or 15d‑15(b) under the Securities Exchange Act of 1934. Based on their review, such officers have concluded that the disclosure controls and procedures are effective in ensuring that information required to be disclosed in this report is appropriately recorded, processed, summarized and reported and made known to them by others within the Registrant and by the Registrant’s service provider. |
(b) | There were no changes in the Registrant's internal control over financial reporting (as defined in Rule 30a-3(d) under the Act) that occurred during the second fiscal quarter of the period covered by this report that has materially affected, or is reasonably likely to materially affect, the Registrant's internal control over financial reporting. |
Item 12. Disclosure of Securities Lending Activities for Closed-End management Investment Companies.
Not applicable to open-end investment companies.
Item 13. Exhibits.
(3) Any written solicitation to purchase securities under Rule 23c‑1 under the Act sent or given during the period covered by the report by or on behalf of the registrant to 10 or more persons. Not applicable to open-end investment companies.
(4) Change in the registrant’s independent public accountant. There was no change in the registrant’s independent public accountant for the period covered by this report.
SIGNATURES
Pursuant to the requirements of the Securities Exchange Act of 1934 and the Investment Company Act of 1940, the registrant has duly caused this report to be signed on its behalf by the undersigned, thereunto duly authorized.
(Registrant) Series Portfolios Trust
By (Signature and Title) /s/Ryan Roell
Ryan Roell, President
Date January 6, 2021
Pursuant to the requirements of the Securities Exchange Act of 1934 and the Investment Company Act of 1940, this report has been signed below by the following persons on behalf of the registrant and in the capacities and on the dates indicated.
By (Signature and Title) /s/Ryan Roell
Ryan Roell, President
Date January 6, 2021
By (Signature and Title) /s/Cullen Small
Cullen Small, Principal Financial Officer
Date January 6, 2021