UNITED STATES
SECURITIES AND EXCHANGE COMMISSION
Washington, D.C. 20549
SECURITIES AND EXCHANGE COMMISSION
Washington, D.C. 20549
FORM N-CSR
CERTIFIED SHAREHOLDER REPORT OF REGISTERED
MANAGEMENT INVESTMENT COMPANIES
Investment Company Act file number 811-23084
Series Portfolios Trust
(Exact name of registrant as specified in charter)
(Exact name of registrant as specified in charter)
615 East Michigan Street
Milwaukee, WI 53202
(Address of principal executive offices) (Zip code)
(Address of principal executive offices) (Zip code)
Ryan L. Roell, President
Series Portfolios Trust
c/o U.S. Bancorp Fund Services, LLC
777 East Wisconsin Ave, 5th Fl
Milwaukee, WI 53202
(Name and address of agent for service)
(Name and address of agent for service)
(414) 516-1652
Registrant's telephone number, including area code
Date of fiscal year end: December 31, 2022
Date of reporting period: June 30, 2022
Item 1. Report to Stockholders.
| (a) |
| Kayne Anderson | |
| Renewable Infrastructure Fund | |

Semi-Annual Report |
June 30, 2022 |
KAYNE ANDERSON RENEWABLE INFRASTRUCTURE FUND
August 24, 2022
Dear Shareholder,
The Kayne Renewable Infrastructure Fund (the “Fund”) Institutional class, traded under the symbol KARIX, returned -6.00% in the first six months of 2022.
Semi-Annual Market Review
Global equity markets sold off heavily in the first half of 2022 as investors reacted to surging bond yields and increasingly aggressive measures pursued by central banks to address high inflation. This contributed to growing fears of a policy-induced recession. The war in Ukraine, deteriorating economic indicators in China, and persistent global supply chain challenges also weighed on investor sentiment during the period.
The S&P 500 Index returned -19.96%, the worst first-half decline for the index in 50 years. The U.S. investment grade corporate bond market posted its biggest six-month decline in 43 years over the same period. Technology and “growth” sectors were among the weakest amid the rising rate environment in the first half of the year, with the NASDAQ Composite falling -29.23%.
The clean energy sector outperformed the market, with most reference indices returning between -6.0% and -13.0%. Among the best-performing subsectors were defensive green utilities, renewable developers with beneficial exposure to accelerating renewables development in the EU, and solar equipment manufacturers.
The Fund’s primary benchmark, the S&P Global Broad Market Index (USD Hedged), returned -17.81% during the period, and the Fund’s secondary benchmark, the S&P Global Infrastructure Index (USD Hedged), generated a total return of 2.95%, as defensive or recession-resistant sectors outperformed the market.
Semi-Annual Portfolio Review
Our top contributor to performance in the first half of 2022 was Albioma SA (“ABIO”), which generated a 48.0% return. Albioma is a French-listed generator of solar power and biomass, primarily in overseas France and Brazil. In April, KKR announced a €50.00 per share all-cash tender offer for Albioma. This represented a ~52% premium to the unaffected share price in February, prior to news of a potential transaction being reported.
Another notable positive contributor was Terna Energy S.A. (“TENERGY”), whose shares returned 26.4% in the first half of the year. Terna Energy is the largest renewable power producer in Greece, having been an early pioneer in that market, with their first wind farm completed in 2000. Since then, they have methodically built out an impressive portfolio of contracted, cash-flowing renewable power assets, with a growing pipeline of growth and opportunity as renewables deployment in Greece continues to accelerate. The strength in Terna’s shares in the first half of the year was driven partly by unconfirmed press reports suggesting that the company was the subject of takeover interest from private infrastructure funds.
Interestingly, our largest negative contributor in 1H’22 was also a Greek-listed company – Public Power Corporation S.A. (“PPC”), whose shares fell 44.2%. Public Power is the state-owned power company and utility of Greece. We initially invested in the shares last year as part of a large equity capital raise aimed at funding a dramatic transition of Public Power’s business away from lignite coal and towards renewables. We expect this process to be transformative for Greece’s energy mix and CO2 emissions profile. However, the energy crisis in Europe, exacerbated by Russia’s invasion of Ukraine, led to concerns about natural gas procurement, customer bill collections, political intervention in energy markets, and potential delays in PPC’s energy transition plan. These concerns all conspired to weigh heavily on the shares during the period.
1
KAYNE ANDERSON RENEWABLE INFRASTRUCTURE FUND
Another negative contributor was China Longyuan Power Corp. (“916”), which returned -15.8% in the first half of the year. Longyuan is the largest listed renewable power producer in China, with one of the largest portfolios of wind farms in the world. After very strong performance in 2021, shares were weak in 1H’22 on a combination of weak wind output and deteriorating investor sentiment towards China, given political tensions and weak Chinese economic data.
Update on the Energy Crisis and Response in Europe
In May, the European Commission published “REPowerEU”, billed as “a plan to rapidly reduce dependence on Russian fossil fuels and fast forward the green transition”. The plan involves a number of initiatives to achieve this goal, including energy savings, identifying alternative sources of natural gas procurement like LNG imports, and expanded use of heat pumps in buildings. But the largest and most ambitious portion of the plan involves a “massive scaling up and speeding up of renewable energy in power generation, industry, buildings, and transport.”
Specifics related to accelerated renewable deployment include:
| • | A dedicated EU Solar Strategy to double solar photovoltaic capacity by 2025 and install 600 GW by 2030 (in other words, building the same amount of solar in Europe in the next 3 years as built in the last 20) | |
| • | A commission recommendation to tackle slow and complex permitting for major renewable energy projects, and recognition of renewable energy as an overriding public interest | |
| • | Dedicated “go-to” areas for renewables to be put in place by member states, with shortened and simplified permitting processes in areas with lower environmental risks. The commission is making available datasets for its digital mapping tool to help member states quickly identify such “go-to” areas |
Some of these renewable energy aspirations seem ambitious (like doubling EU solar capacity in three years). However, our Europe-focused portfolio holdings stand ready with projects, capital, and expertise to help achieve these goals and rapidly reduce Europe’s Russian energy dependency. Renewable energy projects can be built very quickly (usually within 6-18 months) once a site is prepared and necessary approvals are granted. The key will be whether member states can follow through on the expedited permitting and approvals of projects, which is the main bottleneck to more rapid deployment of renewable energy in Europe. We will be monitoring progress on this aspect closely in coming months.
In general, our holdings in European-focused renewable energy developers have significantly outperformed equity markets this year as investors have recognized their ability to benefit from this seismic shift in EU energy policy. We expect portfolio holdings like Acciona Energia (“ANE”), Terna Energy (“TENERGY”), ERG (“ERG”), Ørsted (“ORSTED”), EDP Renewables (“EDP/EDPR”), SSE (“SSE”), and Neoen (“NEOEN”) to take a leading role in driving the acceleration of renewable energy in Europe through mid-decade.
Thoughts on Nuclear Power as an “Alternative” to Growth in Renewables
The heavy focus on renewables deployment in the REPowerEU plan highlights a key benefit of wind & solar today; they can be deployed quickly, at scale, and at an energy cost that is highly competitive with conventional power. By replacing or reducing the utilization of coal and gas plants, they directly cut into the largest source of CO2 emissions in Europe. And because renewable power plants can be configured in almost any conceivable size and shape, they are a form of infrastructure that is accessible to hundreds of nimble companies that can participate in the buildout of the industry.
2
KAYNE ANDERSON RENEWABLE INFRASTRUCTURE FUND
Contrast this with nuclear power, which we see increasingly touted as an “alternative” to renewable energy. A new nuclear power plant can take 10-15 years to design and construct at a cost that makes such investments prohibitive for all but the world’s largest energy companies and utilities (most of which aren’t attempting them either).
Two nuclear reactors currently under construction in the United States and the UK (Vogtle Units 3 & 4 and Hinkley Point C) are billions of dollars over budget and years behind schedule, providing a sense of the challenge.
The problem with the current generation of nuclear power is that it involves the construction of massive, highly sensitive, and complex facilities requiring stringent safety and security precautions. Advocates of nuclear note that its safety track record is statistically quite strong, despite some high-profile incidents (Chernobyl, Three Mile Island, Fukushima). The plants cited above will be even safer than plants built in the 60s and 70s. But it’s partly that pursuit of extreme safety that makes the power plants very expensive and time-consuming to design and build.
As a result of these long timelines, a new nuclear plant initiated today will not be a factor in the energy mix until the 2030s, limiting the ability of nuclear to be part of a plan to rapidly reduce the EU’s reliance on Russian gas. Instead, policymakers will focus on whether existing nuclear power plants should pursue extensions of their planned asset lives, which is a sensible policy in our view. Germany’s decision to phase out its nuclear power plants early (initially as a reaction to the Fukushima incident in Japan) is looking increasingly misguided, as it has made Germany even more dependent on Russian natural gas and CO2-intensive lignite coal power generation.
While current-generation nuclear power plants are unlikely to factor heavily in the energy transition over the coming decade, there is a growing amount of talent, capital, and interest being directed towards developing the next generation of nuclear power technologies. These include small modular nuclear reactors (“SMR”s), which could be built much cheaper and faster, and nuclear fusion - the mother of all clean energy sources if it could be harnessed and made commercially viable. While these technologies could revolutionize the energy space down the road, we believe the earliest they could begin to have a real impact would be the mid-2030s (in the case of SMRs). And as forward-thinking, innovative, and technology-agnostic developers of power infrastructure, we would expect our portfolio holdings to play a leading role in helping to commercialize and scale any such new energy technologies at that time.
But in the meantime, the 2020s belong to wind, solar, and energy storage. Our portfolio companies already have projects delineated and contracted to 2025 that should more than double the amount of renewable generating capacity they operate today. Wind, solar, and battery storage currently comprise 80-90% of new electricity generation capacity being built around the world each year. We estimate that our ~30 portfolio holdings account for about ~10% of all renewable energy deployment expected globally through 2025. It will be renewables, and the companies in our portfolio, which will play a lead role in rapidly shifting the energy mix in Europe away from Russian gas and volatile fossil fuels (while affecting a very significant reduction in CO2 emissions).
Update on Renewables M&A Activity and Portfolio Implications
The take-private of Albioma (“ABIO”) by KKR discussed earlier in this letter was the third such transaction in our portfolio in the last 12 months. Last year, the Fund benefited from substantial premiums paid by private equity funds to acquire Covanta (“CVA”) and Falck Renewables (“FKR”).
Also, in 1H’22, Terna Energy (“TENERGY”), our longtime Greek renewables holding, was reported to be exploring strategic options amid interest from private equity funds. Omega Energia (“MEGA3”), a Brazilian
3
KAYNE ANDERSON RENEWABLE INFRASTRUCTURE FUND
renewable energy holding in the Fund, received a large equity investment commitment from Actis, who agreed to buy shares at prices up to 32-57% higher than where they traded prior to the announcement. And finally, Italian renewable developer (and Fund holding) ERG received a minority investment from IFM, who will buy a portion of the controlling family’s stake and provide capital for growth.
In addition to a ramp-up of private equity interest in publicly listed renewable energy companies, we have continued to see significant investments in the space from oil majors (especially European ones) looking to continue the gradual transition of their businesses. Recently, French oil major TotalEnergies (formerly “Total”) acquired a 50% interest in Clearway Energy Group, the parent company of Fund holding Clearway Energy Inc. (“CWEN”). Clearway will effectively become the U.S.-based renewable monetization vehicle for TotalEnergies, who has given the company a right of first offer on their large 8 GW onshore U.S. development portfolio.
We expect this flurry of transaction activity in the global renewables sector to continue. Private equity funds have recently raised record amounts of capital aimed at renewable/sustainable/energy transition investments and are looking for targets. Oil majors are flush with cash from high energy prices and continue to look for ways to accelerate the growth of their electricity and renewables businesses – consistent with their investor commitments and net zero emissions targets.
We believe the Fund’s strong “hit rate” in identifying private equity acquisition targets is the result of a similar approach in how we identify and evaluate attractive renewable energy investments. We seek to identify the best renewable energy businesses or platforms in various global markets and then invest in the ones that are available at a reasonable price. We define “reasonable price” as one where you are ascribing value primarily to existing operating assets and secured growth projects and not paying up for large pipelines of hypothetical projects that may be built 5-10+ years from now. If a seemingly rational infrastructure private equity fund is willing to pay 25-50% more than the public market equity value for one of our holdings after due diligence, it’s at least one data point that suggests we didn’t overpay for the business at the outset.
Outlook
The last 18 months have been a challenging period for the portfolio. Early 2021 saw a sharp selloff in the clean energy sector, largely as a hangover from the exuberance that followed the election of Joe Biden in late 2020. Defensive infrastructure investments fell further out of favor last year as the economy rebounded sharply from the COVID-19 downturn, and investors sought stocks that would benefit more directly from the cycle. The economic jump-start resulted in widespread supply chain issues that have put pressure on many renewable energy companies. The S&P Clean Energy Index (which is the reference for the largest passive ETFs in the sector) has fallen 30.60% since the end of 2020.
These periods where the portfolio can seem like it’s treading water are not unusual and should not give the impression that there is little value creation happening in the underlying holdings. While our holdings tend to grow their businesses through consistent deployment of infrastructure capital into growth projects each year, the realization of that value creation into equity prices has rarely been as consistent or linear. Our returns have often come quickly through position-specific event catalysts or broad investor rotations into the clean energy sector in response to policy changes, energy sector developments, macroeconomic conditions, or climate events.
As a result of our holdings continuing to grow their cash flows, dividends, and net asset value, at the same time, their stock prices have been stagnant or declining, and they have gotten cheaper. As of the end of 1H’22, our portfolio was trading at a weighted average multiple of ~11.5x next year’s EBITDA. The median for the portfolio
4
KAYNE ANDERSON RENEWABLE INFRASTRUCTURE FUND
was ~10.5x. In addition to being a discount to the multiple on the S&P 500, we believe this is the “cheapest” our portfolio has been on this metric since sometime in 2019, though portfolio composition changes affect comparability over time. The portfolio trades at about a ~3.5% gross dividend yield, based on expected calendar 2023 payouts. On a weighted average basis, we expect our portfolio holdings to grow their per-share dividends by 14% in 2023 vs. 2022. Most meaningfully to us, the challenges in the sector over the last 18 months have allowed many more companies to trade at valuations we view as attractive – which typically involves prices that ascribe value to existing assets and contracted or secured backlog – without having to pay up for long term growth aspirations (those should drive investment upside over time, rather than justifying valuations today).
And while valuations have become more compelling, the outlook for further acceleration of renewable energy deployment into the mid-2020s is becoming even more compelling. As discussed above, the conflict in Ukraine should boost EU renewable energy development and the pace of project permitting in coming years. Most recently, President Biden signed the Inflation Reduction Act (“IRA”) into law – a landmark piece of climate legislation that provides an enormous boost to the energy transition in the United States, which is the second largest market for renewable energy in the world after China. By enhancing tax credits for clean energy technologies and extending their visibility into the 2030s, the IRA legislation helps provide long-term visibility for investment and growth.
At the end of the day, that is the kind of information that really matters relative to the long-term performance of the Fund. Are there ample opportunities for our companies to deploy infrastructure capital into new renewable energy projects? Do our companies have the expertise, scale, and discipline to extract attractive returns on those investments in a way that creates positive equity value over time? And are we invested in companies at valuations that allow us to generate attractive returns as our portfolio companies grow? The answer to those questions continues to be a clear yes. So, while we can’t predict what the market will do or over what months or quarters our returns will be distributed, we feel confident that the Fund is positioned to generate very attractive equity returns in coming years.
As always, please reach out with any questions.
With best regards,
 |  |
| Justin Campeau | J.C. Frey |
| Portfolio Manager | Portfolio Manager |
This report has been prepared for shareholders and may be distributed to others only if preceded or accompanied by a current prospectus.
Past performance is not a guarantee of future results.
The information contained herein has been prepared by Kayne Anderson Capital Advisors, L.P. and reflects our views and opinions as of the date herein, which are subject to change at any time based on market and other conditions. We disclaim any responsibility to update these views. These views should not be relied on as investment advice or an indication of trading intent on behalf of the Fund. Any statements or facts derived from third-party sources are believed to be reliable but are not guaranteed as to their accuracy or completeness.
Please refer to the Schedule of Investments in this report for a complete list of Fund holdings for June 30, 2022.
Mutual fund investing involves risk. Principal loss is possible. An investment in the Fund could suffer loss. The Fund is non-diversified, meaning it may concentrate its assets in fewer individual holdings than a diversified fund. Therefore, the Fund is
5
KAYNE ANDERSON RENEWABLE INFRASTRUCTURE FUND
more exposed to individual stock volatility than a diversified fund. Diversification does not assure a profit or protect against loss in a declining market. Because the Fund invests in Renewable Infrastructure Companies, the value of the Fund shares may be affected by events that adversely affect companies in that industry. The Fund has investments in non-U.S. issuers or U.S. issuers with significant non-U.S. operations, which may be subject to additional political, social, regulatory, and economic risks. As a result, the Fund may be exposed to risks that the exchange rate of the U.S. dollar relative to other currencies may change in a manner that could have an adverse effect on the gain and loss generated from the Fund’s investments denominated in currencies other than the U.S. dollar. Market risk is the potential for changes in the fair value of financial instruments from market changes, including fluctuations in market price. Market risk is directly affected by the volatility and liquidity in markets in which the related underlying assets are traded.
The NASDAQ Composite Index measures all NASDAQ domestic and international based common type stocks listed on The NASDAQ Stock Market. It tracks more than 2,500 companies using a straightforward market capitalization weighting scheme, with constituents determined each day. To be eligible for inclusion in the Index, the security’s U.S. listing must be exclusively on The Nasdaq Stock Market. The security types eligible for the Index include common stocks, ordinary shares, ADRs, shares of beneficial interest or limited partnership interests and tracking stocks. Security types not included in the Index are closed-end funds, convertible debentures, exchange traded funds, preferred stocks, rights, warrants, units and other derivative securities. There is no minimum requirement for market cap, liquidity, float, geography, industry/sector, or any other eligibility criteria besides being Nasdaq-listed. It is not possible to invest directly in an index.
The S&P Global BMI (Broad Market Index) (USD Hedged) is designed to capture the global, investable opportunity set. Spanning 50 developed and emerging market countries and more than 11,000 companies, it tracks over 99% of each constituent country’s available market capitalization. Over 200,000 subindices are broken down by country, region, size, GICS® sector, and style, helping investors act on views broad and narrow. The index is hedged against the fluctuations of the constituent currencies versus the U.S. dollar. It is not possible to invest directly in an index.
The S&P Global Infrastructure USD Hedged Index is designed to track 75 companies from around the world chosen to represent the listed infrastructure industry while maintaining liquidity and tradability. To create diversified exposure, the index includes three distinct infrastructure clusters: energy, transportation, and utilities. The index is hedged against the fluctuations of the constituent currencies versus the U.S. dollar. It is not possible to invest directly in an index.
The S&P 500 Index is an unmanaged index of 500 common stocks primarily traded on the New York Stock Exchange, weighted by market capitalization. Index performance includes the reinvestment of dividends and capital gains. It is not possible to invest directly in an index.
The S&P Global Clean Energy Index is designed to measure the performance of companies in global clean energy-related businesses from both developed and emerging markets, with a target constituent count of 100. It is not possible to invest directly in an index.
The S&P Global BMI Utilities (Sector) provides investors with a benchmark that reflects those companies included in the S&P Global BMI that are classified as members of the GICS® utilities sector and sub-industries. It is not possible to invest directly in an index.
This communication is provided for informational purposes only. This communication shall not constitute an offer to sell or a solicitation to buy, nor shall there be any sale of any securities in any jurisdiction in which such offer or sale is not permitted. Nothing contained in this communication is intended to recommend any investment policy or investment strategy or take into account any investor’s specific objectives or circumstances. Any tax or legal information provided merely summarizes our understanding and interpretation of some of the current income tax regulations and is not exhaustive. Investors must consult their tax advisor or legal counsel for advice and information concerning their particular situation. Neither the Fund nor any of its representatives may give legal or tax advice.
Distributed by Quasar Distributors, LLC.
Member FINRA/SIPC.
NOT FDIC INSURED | NO BANK GUARANTEE | MAY LOSE VALUE
6
KAYNE ANDERSON RENEWABLE INFRASTRUCTURE FUND
Expense Example (Unaudited)
June 30, 2022
As a shareholder of the Fund, you incur two types of costs: (1) transaction costs, and (2) ongoing costs, including management fees and other Fund specific expenses. The expense example is intended to help the shareholder understand ongoing costs (in dollars) of investing in the Fund and to compare these costs with the ongoing costs of investing in other mutual funds. The example is based on an investment of $1,000 invested at the beginning of the period and held for the most recent six-month period.
The Actual Expenses comparison provides information about actual account values and actual expenses. A shareholder may use the information in this line, together with the amount invested, to estimate the expenses paid over the period. A shareholder may divide his/her account value by $1,000 (e.g., an $8,600 account value divided by $1,000 = 8.6), then multiply the result by the number in the first line under the heading entitled “Expenses Paid During Period” to estimate the expenses paid on his/her account during this period.
The Hypothetical Example for Comparison Purposes provides information about hypothetical account values and hypothetical expenses based on each Fund’s actual expense ratio and an assumed rate of return of 5% per year before expenses, which is not the Fund’s actual return. The hypothetical account values and expenses may not be used to estimate the actual ending account balance or expenses paid for the period. A shareholder may use this information to compare the ongoing costs of investing in the Fund and other funds. To do so, a shareholder would compare this 5% hypothetical example with the 5% hypothetical examples that appear in the shareholder reports of other funds.
The expenses shown in the table are meant to highlight your ongoing costs only and do not reflect any transactional costs, such as sales charges (loads), redemptions fees or exchange fees. Therefore, the Hypothetical Example for Comparisons Purposes is useful in comparing ongoing costs only and will not help to determine the relevant total costs of owning different funds. In addition, if these transactional costs were included, shareholder costs would have been higher.
| Expenses Paid | ||||
| Annualized Net | Beginning | Ending | During Period(1) | |
| Expense Ratio | Account Value | Account Value | (1/1/2022 to | |
(6/30/2022) | (1/1/2022) | (6/30/2022) | 6/30/2022) | |
| Class I | ||||
Actual(2) | 1.00% | $1,000.00 | $ 940.00 | $4.81 |
| Hypothetical (5% annual return | ||||
| before expenses) | 1.00% | $1,000.00 | $1,019.84 | $5.01 |
| Retail Class | ||||
Actual(2) | 1.25% | $1,000.00 | $ 938.70 | $6.01 |
| Hypothetical (5% annual return | ||||
| before expenses) | 1.25% | $1,000.00 | $1,018.60 | $6.26 |
(1) | Expenses are equal to the Fund’s annualized expense ratio for the period multiplied by the average account value over the period, multiplied by 181/365 to reflect its six-month period. |
(2) | Based on the actual returns for the period from January 1, 2022 through June 30, 2022 of -6.00% and -6.13% for Class I and Retail Class, respectively. |
7
KAYNE ANDERSON RENEWABLE INFRASTRUCTURE FUND
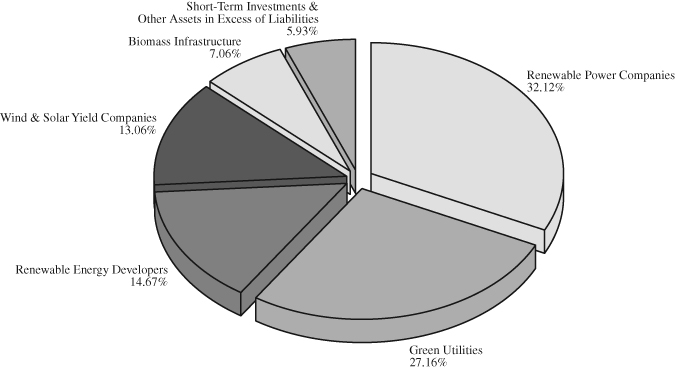
Allocation of Portfolio(1) (Unaudited)
As of June 30, 2022
(% of Net Assets)
Top Ten Equity Holdings(1) (Unaudited)
As of June 30, 2022
(% of Net Assets)
NextEra Energy, Inc. | 6.24 | % | |||
Atlantica Sustainable Infrastructure plc | 5.27 | % | |||
Clearway Energy, Inc., Class C | 4.57 | % | |||
Brookfield Renewable(2) | 3.97 | % | |||
TransAlta Corporation | 4.47 | % | |||
China Longyuan Power Group Corporation Ltd. | 3.85 | % | |||
Terna Energy SA | 3.83 | % | |||
Corporacion Acciona Energias Renovables SA | 3.62 | % | |||
The AES Corporation | 3.52 | % | |||
NextEra Energy Partners, LP | 3.22 | % |
(1) | Fund holdings and sector allocations are subject to change at any time and are not recommendations to buy or sell any security. |
(2) | Includes ownership of Brookfield Renewable Partners LP (2.89%) and Brookfield Renewable Corporation (1.08%). |
8
KAYNE ANDERSON RENEWABLE INFRASTRUCTURE FUND
Schedule of Investments (Unaudited)
June 30, 2022
| Shares | Value | |||||||
| LONG-TERM INVESTMENTS – 94.07% | ||||||||
| COMMON STOCKS – 89.86% | ||||||||
| Renewable Power Companies – 30.62% | ||||||||
Acciona SA (a) | 8,100 | $ | 1,492,500 | |||||
The AES Corporation | 186,600 | 3,920,466 | ||||||
Brookfield Renewable Corporation, Class A (a) | 33,700 | 1,200,057 | ||||||
Brookfield Renewable Partners LP (a) | 92,244 | 3,210,091 | ||||||
China Longyuan Power Group Corporation Ltd. (a) | 2,208,100 | 4,279,225 | ||||||
EDP Renovaveis SA (a) | 88,437 | 2,089,120 | ||||||
ERG SpA (a) | 100,000 | 3,117,544 | ||||||
Northland Power, Inc. (a) | 118,033 | 3,513,848 | ||||||
Omega Energia SA (a)(b)(c) | 1,294,525 | 2,960,851 | ||||||
Orsted A/S (a) | 31,314 | 3,298,113 | ||||||
TransAlta Corporation (a) | 435,476 | 4,969,812 | ||||||
34,051,627 | ||||||||
| Green Utilities – 24.45% | ||||||||
Centrais Elétricas Brasileiras SA – Electrobras (a) | 247,000 | 2,179,058 | ||||||
EDP – Energias de Portugal SA (a) | 583,656 | 2,720,045 | ||||||
Enel Chile SA (a) | 67,399,400 | 1,524,042 | ||||||
Enel SpA (a) | 574,900 | 3,152,893 | ||||||
Eversource Energy | 38,500 | 3,252,095 | ||||||
NextEra Energy, Inc. | 89,540 | 6,935,768 | ||||||
Public Power Corporation SA (a)(b) | 354,200 | 1,962,940 | ||||||
SSE plc (a) | 118,800 | 2,344,559 | ||||||
Xcel Energy, Inc. | 44,200 | 3,127,592 | ||||||
27,198,992 | ||||||||
| Renewable Energy Developers – 14.67% | ||||||||
Ameresco, Inc., Class A (b) | 24,600 | 1,120,776 | ||||||
Corporacion Acciona Energias Renovables SA (a) | 103,700 | 4,020,924 | ||||||
Neoen SA (a) | 45,552 | 1,717,172 | ||||||
ReNew Energy Global plc, Class A (a)(b) | 417,000 | 2,697,990 | ||||||
Sunrun, Inc. (b) | 106,800 | 2,494,848 | ||||||
Terna Energy SA (a) | 235,474 | 4,261,464 | ||||||
16,313,174 | ||||||||
| Wind & Solar Yield Companies – 13.06% | ||||||||
Atlantica Sustainable Infrastructure plc (a) | 181,573 | 5,857,545 | ||||||
Clearway Energy, Inc., Class C | 145,876 | 5,082,320 | ||||||
NextEra Energy Partners, LP | 48,378 | 3,587,712 | ||||||
14,527,577 | ||||||||
The accompanying notes are an integral part of these financial statements.
9
KAYNE ANDERSON RENEWABLE INFRASTRUCTURE FUND
Schedule of Investments (Unaudited) – Continued
June 30, 2022
| Shares | Value | |||||||
| Biomass Infrastructure – 7.06% | ||||||||
Albioma SA (a) | 23,340 | $ | 1,219,576 | |||||
Constellation Energy Corporation | 33,300 | 1,906,758 | ||||||
Enviva, Inc. | 45,100 | 2,580,622 | ||||||
Polaris Infrastructure, Inc. (a) | 141,900 | 2,146,359 | ||||||
7,853,315 | ||||||||
| Total Common Stocks | ||||||||
| (Cost $103,385,518) | 99,944,685 | |||||||
| CONVERTIBLE PREFERRED STOCKS – 4.21% | ||||||||
| Green Utilities – 2.71% | ||||||||
Algonquin Power & Utilities Corporation (a) | ||||||||
7.750%, 6/15/2024 | 68,800 | 3,010,688 | ||||||
| Renewable Power Companies – 1.50% | ||||||||
The AES Corporation | ||||||||
6.875%, 2/15/2024 | 19,400 | 1,674,802 | ||||||
| Total Convertible Preferred Stocks | ||||||||
| (Cost $1,937,900) | 4,685,490 | |||||||
| Total Long-Term Investments – 94.07% | ||||||||
| (Cost $105,323,418) | 104,630,175 | |||||||
| SHORT-TERM INVESTMENTS – 5.41% | ||||||||
| Money Market Fund – 5.41% | ||||||||
First American Treasury Obligations Fund, Class X, 1.31% (d) | 6,015,789 | 6,015,789 | ||||||
| Total Short-Term Investments | ||||||||
| (Cost $6,015,789) | 6,015,789 | |||||||
| Total Investments | ||||||||
| (Cost $111,339,207) – 99.48% | 110,645,964 | |||||||
| Other Assets in Excess of Liabilities – 0.52% | 580,029 | |||||||
| Total Net Assets – 100.00% | $ | 111,225,993 | ||||||
| (a) | Foreign security. |
| (b) | Non-income producing security. |
| (c) | Security is not currently paying cash distributions, but is expected to pay cash distributions within the next 12 months. |
| (d) | The rate quoted is the annualized seven-day effective yield as of June 30, 2022. |
At June 30, 2022, the Fund’s geographic allocation was follows:
| Geographic Location | % of Long-Term Investments |
| Europe/U.K. | 35.61% |
| United States | 34.10% |
| Canada | 17.25% |
| Australia, Brazil, Japan & Other | 13.04% |
The accompanying notes are an integral part of these financial statements.
10
KAYNE ANDERSON RENEWABLE INFRASTRUCTURE FUND
Schedule of Open Forward Currency Contracts*
June 30, 2022
| Unrealized | ||||||||||||||||||||||
| Settlement | Currency to be | Value | Currency to be | Value | Appreciation | |||||||||||||||||
| Date | Delivered | (USD) | Received | (USD) | (Depreciation)** | |||||||||||||||||
| 12/30/2022 | 25,191,918 | BRL | $ | 4,581,655 | 4,557,561 | USD | $ | 4,557,561 | $ | (24,094 | ) | |||||||||||
| 12/30/2022 | 13,062,089 | CAD | 10,154,499 | 10,145,312 | USD | 10,145,312 | (9,187 | ) | ||||||||||||||
| 12/30/2022 | 1,437,769,981 | CLP | 1,512,854 | 1,527,349 | USD | 1,527,349 | 14,495 | |||||||||||||||
| 12/30/2022 | 22,744,657 | DKK | 3,254,095 | 3,263,222 | USD | 3,263,222 | 9,127 | |||||||||||||||
| 12/30/2022 | 24,993,371 | EUR | 26,587,304 | 26,680,423 | USD | 26,680,423 | 93,119 | |||||||||||||||
| 12/30/2022 | 1,965,279 | GBP | 2,403,838 | 2,407,467 | USD | 2,407,467 | 3,629 | |||||||||||||||
| 12/30/2022 | 33,123,611 | HKD | 4,236,216 | 4,219,837 | USD | 4,219,837 | (16,379 | ) | ||||||||||||||
$ | 52,730,461 | $ | 52,801,171 | $ | 70,710 | |||||||||||||||||
BRL – Brazilian Real
CAD – Canadian Dollar
CLP – Chilean Peso
DKK – Danish Krone
EUR – Euro
GBP – British Pound Sterling
HKD – Hong Kong Dollar
USD – U.S. Dollar
| * | Bannockburn Global Forex, LLC is the counterparty for all open forward currency contracts held by the Fund as of June 30, 2022. | |
| ** | Unrealized appreciation is a receivable and unrealized depreciation is a payable. |
The accompanying notes are an integral part of these financial statements.
11
KAYNE ANDERSON RENEWABLE INFRASTRUCTURE FUND
Statement of Assets and Liabilities (Unaudited)
June 30, 2022
| ASSETS: | ||||
| Investments, at value (Cost $111,339,207) | $ | 110,645,964 | ||
| Foreign currency, at value (Cost $324,521) | 325,735 | |||
| Cash | 12,154 | |||
| Receivable for investments sold | 358,331 | |||
| Receivable for forward currency contracts, net | 70,710 | |||
| Receivable for fund shares sold | 108,000 | |||
| Dividends and interest receivable | 158,212 | |||
| Prepaid expenses and other receivables | 37,938 | |||
Total assets | 111,717,044 | |||
| LIABILITIES: | ||||
| Payable for fund shares redeemed | 234,607 | |||
| Dividends payable | 155,599 | |||
| Payable to Adviser | 31,225 | |||
| Payable for fund administration and fund accounting fees | 22,047 | |||
| Payable for transfer agent fees and expenses | 13,048 | |||
| Payable for custodian fees | 5,667 | |||
| Payable for compliance fees | 2,521 | |||
| Distribution fees payable | 2,340 | |||
| Accrued expenses and other liabilities | 23,997 | |||
Total liabilities | 491,051 | |||
| NET ASSETS | $ | 111,225,993 | ||
| NET ASSETS CONSIST OF: | ||||
| Paid-in capital | $ | 105,858,771 | ||
| Total distributable earnings | 5,367,222 | |||
Total net assets | $ | 111,225,993 | ||
| Class I | Retail Class | |||||||
| Shares | Shares | |||||||
Net assets | $ | 108,896,715 | $ | 2,329,278 | ||||
Shares issued and outstanding(1) | 9,446,748 | 202,207 | ||||||
Net asset value, offering, and redemption price per share | $ | 11.53 | $ | 11.52 | ||||
(1) | Unlimited shares authorized without par value. |
The accompanying notes are an integral part of these financial statements.
12
KAYNE ANDERSON RENEWABLE INFRASTRUCTURE FUND
Statement of Operations (Unaudited)
For the Six Months Ended June 30, 2022
| INVESTMENT INCOME: | ||||
Dividend income (net of foreign withholding taxes of $145,280) | $ | 963,874 | ||
Interest income | 11,391 | |||
Total investment income | 975,265 | |||
| EXPENSES: | ||||
Investment advisory fees (See Note 3) | 456,987 | |||
Fund administration and fund accounting fees (See Note 3) | 64,650 | |||
Transfer agent fees (See Note 3) | 37,956 | |||
Federal and state registration fees | 28,240 | |||
Custodian fees (See Note 3) | 21,077 | |||
Legal fees | 19,538 | |||
Audit fees | 10,162 | |||
Compliance fees (See Note 3) | 7,689 | |||
Reports to shareholders | 7,075 | |||
Trustees’ fees (See Note 3) | 6,323 | |||
Distribution fees – Retail Class (See Note 5) | 2,599 | |||
Excise Tax Expense | 14 | |||
Other | 5,971 | |||
Total expense before waiver/reimbursement | 668,281 | |||
Less: Expense waiver/reimbursement by Adviser (See Note 3) | (128,037 | ) | ||
Net expenses | 540,244 | |||
| NET INVESTMENT INCOME | 435,021 | |||
| REALIZED AND CHANGE IN UNREALIZED GAIN (LOSS) ON INVESTMENTS: | ||||
| Realized gain (loss) on: | ||||
| Investments | (437,262 | ) | ||
| Forward currency contracts | 2,441,866 | |||
| Foreign currency transactions | (49,480 | ) | ||
| Net realized gain | 1,955,124 | |||
| Net change in unrealized appreciation (depreciation) on: | ||||
| Investments | (9,738,945 | ) | ||
| Forward currency contracts | 541,711 | |||
| Foreign currency translation | (863 | ) | ||
| Net change in unrealized appreciation (depreciation) on: | (9,198,097 | ) | ||
| Net realized and change in unrealized loss on investments | (7,242,973 | ) | ||
| NET DECREASE IN NET ASSETS RESULTING FROM OPERATIONS | $ | (6,807,952 | ) | |
The accompanying notes are an integral part of these financial statements.
13
KAYNE ANDERSON RENEWABLE INFRASTRUCTURE FUND
Statements of Changes in Net Assets
| Six Months Ended | ||||||||
| June 30, 2022 | For the Year Ended | |||||||
| (Unaudited) | December 31, 2021 | |||||||
| OPERATIONS: | ||||||||
Net investment income | $ | 435,021 | $ | 564,956 | ||||
Net realized gain on investments, forward currency | ||||||||
contracts and foreign currency transactions | 1,955,124 | 1,316,469 | ||||||
Change in unrealized depreciation on investments, | ||||||||
forward currency contracts and foreign currency translation | (9,198,097 | ) | (992,007 | ) | ||||
Net increase (decrease) in net assets resulting from operations | (6,807,952 | ) | 889,418 | |||||
| DISTRIBUTIONS TO SHAREHOLDERS: | ||||||||
From distributable earnings | ||||||||
| Class I | (837,356 | ) | (2,461,509 | ) | ||||
| Retail Class | (16,299 | ) | (37,149 | ) | ||||
Total distributions to shareholders | (853,655 | ) | (2,498,658 | ) | ||||
| CAPITAL SHARE TRANSACTIONS: | ||||||||
Net increase in net assets resulting from capital share transactions(1) | 10,759,658 | 65,951,976 | ||||||
| NET INCREASE IN NET ASSETS | 3,098,051 | 64,342,736 | ||||||
| NET ASSETS: | ||||||||
Beginning of period | 108,127,942 | 43,785,206 | ||||||
End of period | $ | 111,225,993 | $ | 108,127,942 | ||||
The accompanying notes are an integral part of these financial statements.
14
KAYNE ANDERSON RENEWABLE INFRASTRUCTURE FUND
Statements of Changes in Net Assets – Continued
(1) | A summary of capital share transactions is as follows: |
SHARE TRANSACTIONS:
| Six Months Ended | ||||||||||||||||
| June 30, 2022 | For the Year Ended | |||||||||||||||
| (Unaudited) | December 31, 2021 | |||||||||||||||
| Shares | Amount | Shares | Amount | |||||||||||||
Class I | ||||||||||||||||
| Issued | 1,292,037 | $ | 15,189,833 | 5,391,183 | $ | 66,795,415 | ||||||||||
| Issued to holders in | ||||||||||||||||
| reinvestment of dividends | 51,320 | 605,585 | 138,583 | 1,693,590 | ||||||||||||
| Redeemed | (486,620 | ) | (5,624,353 | ) | (350,474 | ) | (4,334,801 | ) | ||||||||
| Net increase | ||||||||||||||||
| in Class I | 856,737 | $ | 10,171,065 | 5,179,292 | $ | 64,154,204 | ||||||||||
Retail Class | ||||||||||||||||
| Issued | 56,652 | $ | 662,757 | 158,628 | $ | 1,972,420 | ||||||||||
| Issued to holders in | ||||||||||||||||
| reinvestment of dividends | 1,299 | 15,333 | 2,935 | 35,854 | ||||||||||||
| Redeemed | (7,404 | ) | (89,497 | ) | (16,984 | ) | (210,502 | ) | ||||||||
| Net increase in Retail Class | 50,547 | $ | 588,593 | 144,579 | $ | 1,797,772 | ||||||||||
Net increase | ||||||||||||||||
in shares outstanding | 907,284 | $ | 10,759,658 | 5,323,871 | $ | 65,951,976 | ||||||||||
The accompanying notes are an integral part of these financial statements.
15
KAYNE ANDERSON RENEWABLE INFRASTRUCTURE FUND
Financial Highlights
| Six Months Ended | ||||||||||||
| June 30, 2022 | Year Ended | Year Ended | ||||||||||
| (Unaudited) | December 31, 2021 | December 31, 2020(1) | ||||||||||
| Class I | ||||||||||||
| PER SHARE DATA: | ||||||||||||
Net asset value, beginning of period | $ | 12.37 | $ | 12.81 | $ | 10.00 | ||||||
INVESTMENT OPERATIONS: | ||||||||||||
Net investment income(2) | 0.05 | 0.10 | — | |||||||||
| Net realized and unrealized | ||||||||||||
gain (loss) on investments(3) | (0.80 | ) | (0.22 | ) | 2.85 | |||||||
| Total from investment operations | (0.75 | ) | (0.12 | ) | 2.85 | |||||||
LESS DISTRIBUTIONS FROM: | ||||||||||||
| Net investment income | (0.09 | ) | (0.16 | ) | — | (5) | ||||||
| Net realized gains | — | (0.16 | ) | (0.03 | ) | |||||||
| Return of capital | — | — | (0.01 | ) | ||||||||
| Total distributions | (0.09 | ) | (0.32 | ) | (0.04 | ) | ||||||
Net asset value, end of period | $ | 11.53 | $ | 12.37 | $ | 12.81 | ||||||
TOTAL RETURN(5) | -6.00 | % | -0.93 | % | 28.54 | % | ||||||
| SUPPLEMENTAL DATA AND RATIOS: | ||||||||||||
Net assets, end of period (in thousands) | $ | 108,897 | $ | 106,252 | $ | 43,694 | ||||||
Ratio of gross expenses to average net assets: | ||||||||||||
Before expense waiver/reimbursement(6) | 1.24 | % | 1.46 | % | 2.01 | % | ||||||
After expense waiver/reimbursement(6) | 1.00 | % | 1.14 | %(8) | 1.30 | % | ||||||
Ratio of net investment income to average net assets(6) | 0.81 | % | 0.78 | % | (0.08 | )% | ||||||
Portfolio turnover rate(5)(8) | 30 | % | 58 | % | 11 | % | ||||||
(1) | Inception date of the Class I shares was July 23, 2020. |
(2) | Calculated based on average shares outstanding during the period. |
(3) | Realized and unrealized gains and losses per share in this caption are balancing amounts necessary to reconcile the change in net asset value per share for the years, and may not reconcile with the aggregate gains and losses in the Statement of Operations due to share transactions for the period. |
(4) | Amount per share is less than $0.005. |
(5) | Not annualized for periods less than one year. |
(6) | Annualized for periods less than one year. |
(7) | Prior to August 1, 2021, the annual expense limitation was 1.30% for Class I. |
(8) | The portfolio turnover disclosed is for the Fund as a whole. The numerator for the portfolio turnover rate includes the lesser of purchases or sales (excluding short-term investments). The denominator includes the average fair value of long positions throughout the period. |
The accompanying notes are an integral part of these financial statements.
16
KAYNE ANDERSON RENEWABLE INFRASTRUCTURE FUND
Financial Highlights
| Six Months Ended | ||||||||||||
| June 30, 2022 | Year Ended | Year Ended | ||||||||||
| (Unaudited) | December 31, 2021 | December 31, 2020(1) | ||||||||||
| Retail Class | ||||||||||||
| PER SHARE DATA: | ||||||||||||
Net asset value, beginning of period | $ | 12.37 | $ | 12.82 | $ | 11.72 | ||||||
INVESTMENT OPERATIONS: | ||||||||||||
Net investment income(2) | 0.03 | 0.06 | — | |||||||||
| Net realized and unrealized | ||||||||||||
gain (loss) on investments(3) | (0.80 | ) | (0.21 | ) | 1.12 | |||||||
| Total from investment operations | (0.77 | ) | (0.15 | ) | 1.12 | |||||||
LESS DISTRIBUTIONS FROM: | ||||||||||||
| Net investment income | (0.08 | ) | (0.14 | ) | — | |||||||
| Net realized gains | — | (0.16 | ) | (0.01 | ) | |||||||
| Return of capital | — | — | (0.01 | ) | ||||||||
| Total distributions | (0.08 | ) | (0.30 | ) | (0.02 | ) | ||||||
Net asset value, end of period | $ | 11.52 | $ | 12.37 | $ | 12.82 | ||||||
TOTAL RETURN(4) | -6.13 | % | -1.23 | % | 9.54 | % | ||||||
| SUPPLEMENTAL DATA AND RATIOS: | ||||||||||||
Net assets, end of period (in thousands) | $ | 2,329 | $ | 1,876 | $ | 91 | ||||||
Ratio of gross expenses to average net assets: | ||||||||||||
Before expense waiver/reimbursement(5) | 1.49 | % | 1.64 | % | 2.02 | % | ||||||
After expense waiver/reimbursement(5) | 1.25 | % | 1.34 | %(7) | 1.55 | % | ||||||
Ratio of net investment income to average net assets(5) | 0.56 | % | 0.47 | % | (0.41 | )% | ||||||
Portfolio turnover rate(4)(7) | 30 | % | 58 | % | 11 | % | ||||||
(1) | Inception date of the Retail Class was November 30, 2020. |
(2) | Calculated based on average shares outstanding during the period. |
(3) | Realized and unrealized gains and losses per share in this caption are balancing amounts necessary to reconcile the change in net asset value per share for the years, and may not reconcile with the aggregate gains and losses in the Statement of Operations due to share transactions for the period. |
(4) | Not annualized for periods less than one year. |
(5) | Annualized for periods less than one year. |
(6) | Prior to August 1, 2021, the annual expense limitation was 1.55% for the Retail Class. |
(7) | The portfolio turnover disclosed is for the Fund as a whole. The numerator for the portfolio turnover rate includes the lesser of purchases or sales (excluding short-term investments). The denominator includes the average fair value of long positions throughout the period. |
The accompanying notes are an integral part of these financial statements.
17
KAYNE ANDERSON RENEWABLE INFRASTRUCTURE FUND
Notes to the Financial Statements (Unaudited)
June 30, 2022
1. ORGANIZATION
Series Portfolios Trust (the “Trust”) was organized as a Delaware statutory trust under a Declaration of Trust dated July 27, 2015. The Trust is registered under the Investment Company Act of 1940, as amended (the “1940 Act”), as an open-end management investment company. The Kayne Anderson Renewable Infrastructure (the “Fund”) is a non-diversified series with its own investment objectives and policies within the Trust. The Fund’s investment adviser, Kayne Anderson Capital Advisors, L.P. (the “Adviser”), is responsible for investment advisory services, day-to-day management of the Fund’s assets, as well as compliance, sales, marketing and operation services to the Fund. The primary investment objective of the Fund is to provide total return through a combination of current income and capital appreciation.
The Fund is an investment company and accordingly follows the investment company accounting and reporting guidance of the Financial Accounting Standards Board (“FASB”) Accounting Standards Codification (the “Codification”) Topic 946 Financial Services – Investment Companies. The Fund does not hold itself out as related to any other series of the Trust for purposes of investment and investor services, nor does it share the same investment adviser with any other series of the Trust.
The Fund offers two share classes, Class I and Retail Class shares. The Retail Class commenced operations on November 30, 2020. Neither class of shares have any front end sales loads or deferred sales charges. Retail Class shares are subject to a distribution fee and shareholder servicing fee of up to 0.25% of average daily net assets. Class I shares are not subject to a distribution fee.
The Fund may issue an unlimited number of shares of beneficial interest, with no par value. All shares of the Fund have equal rights and privileges except with respect to distribution fees and voting rights on matters affecting a single share class.
2. SIGNIFICANT ACCOUNTING POLICIES
The following is a summary of significant accounting policies consistently followed by the Fund in the preparation of its financial statements. These policies are in conformity with generally accepted accounting principles in the United States of America (“GAAP”).
A. Investment Valuation – The following is a summary of the Fund’s pricing procedures. It is intended to be a general discussion and may not necessarily reflect all the pricing procedures followed by the Fund. Equity securities, including common stocks, preferred stocks, and real estate investment trusts (“REITS”) that are traded on a national securities exchange, except those listed on the Nasdaq Global Market®, Nasdaq Global Select Market® and the Nasdaq Capital Market® exchanges (collectively “Nasdaq”), are valued at the last reported sale price on that exchange on which the security is principally traded. Securities traded on Nasdaq will be valued at the Nasdaq Official Closing Price (“NOCP”). If, on a particular day, an exchange traded or Nasdaq security does not trade, then the mean between the most recent quoted bid and asked prices will be used. All equity securities that are not traded on a listed exchange are valued at the last sale price in the over-the-counter (“OTC”) market. If a non-exchanged traded equity security does not trade on a particular day, then the mean between the last quoted closing bid and asked price will be used. To the extent these securities are actively traded and valuation adjustments are not applied, they are categorized in Level 1 of the fair value hierarchy.
Fixed income securities, including short-term debt instruments having a maturity less than 60 days, are valued at the evaluated mean price supplied by an approved independent third-party pricing service (“Pricing Service”). These
18
KAYNE ANDERSON RENEWABLE INFRASTRUCTURE FUND
Notes to the Financial Statements (Unaudited) – Continued
June 30, 2022
securities are categorized in Level 2 of the fair value hierarchy. In the case of foreign securities, the occurrence of events after the close of foreign markets, but prior to the time the Fund’s NAV is calculated will result in an adjustment to the trading prices of foreign securities when foreign markets open on the following business day. The Fund will value foreign securities at fair value, taking into account such events in calculating the NAV. In such cases, use of fair valuation can reduce an investor’s ability to seek profit by estimating the Fund’s NAV in advance of the time the NAV is calculated. These securities are categorized in Level 2 of the fair value hierarchy.
Exchange traded funds and closed-end funds are valued at the last reported sale price on the exchange on which the security is principally traded. If, on a particular day, an exchange-traded fund does not trade, then the mean between the most recent quoted bid and asked prices will be used. To the extent these securities are actively traded and valuation adjustments are not applied, they are categorized in Level 1 of the fair value hierarchy.
Investments in registered open-end investment companies (including money market funds), other than exchange-traded funds, are typically valued at their reported NAV per share. To the extent these securities are valued at their NAV per share, they are categorized in Level 1 of the fair value hierarchy.
Forward currency contracts maturing in two or fewer days are valued at the spot rate. Forward currency contracts maturing in three days or more are valued at the midpoint prices calculated by U.S. Bancorp Fund Services, LLC, doing business as U.S. Bank Global Fund Services (“Fund Services” or the “Administrator”) using an “interpolation” methodology that incorporates foreign-exchange prices obtained from an approved pricing service for standard forward-settlement periods, such as one month, three months, six months and one year. These securities are categorized in Level 2 of the fair value hierarchy.
Exchange traded options and Flexible Exchange® options (“FLEX options”) are valued at the composite mean price, which calculates the mean of the highest bid price and lowest ask price across the exchanges where the option is principally traded. If the composite mean price is not available, the last sale or settlement price may be used. For non-exchange traded options, models such as Black-Scholes can be used to value the options. On the last trading day prior to expiration, expiring options may be priced at intrinsic value. These securities are categorized in Level 2 of the fair value hierarchy.
Futures contracts are valued at the settlement price on the exchange on which they are principally traded. The settlement price is the average of the prices at which a futures contract trades immediately before the close of trading for the day. Equity swap contract prices are determined by using the same methods used to price the underlying security. These securities are categorized in Level 1 or Level 2 of the fair value hierarchy.
Securities for which market quotations are not readily available, or if the closing price does not represent fair value, are valued following procedures approved by the Board of Trustees (the “Board”). These procedures consider many factors, including the type of security, size of holding, trading volume and news events. There can be no assurance that the Fund could obtain the fair value assigned to a security if they were to sell the security at approximately the time at which the Fund determines their net asset values per share. The Board has established a Valuation Committee to administer, implement, and oversee the fair valuation process, and to make fair value decisions when necessary. The Board regularly reviews reports that describe any fair value determinations and methods.
The Fund has adopted authoritative fair value accounting standards which establish an authoritative definition of fair value and set out a hierarchy for measuring fair value. These standards require additional disclosures about the various inputs and valuation techniques used to develop the measurements of fair value, a discussion in changes in
19
KAYNE ANDERSON RENEWABLE INFRASTRUCTURE FUND
Notes to the Financial Statements (Unaudited) – Continued
June 30, 2022
valuation techniques and related inputs during the period and expanded disclosure of valuation levels for major security types. These inputs are summarized in the three broad levels listed below:
| Level 1 – | Unadjusted quoted prices in active markets for identical assets or liabilities that the Fund has the ability to access. |
| Level 2 – | Observable inputs other than quoted prices included in Level 1 that are observable for the asset or liability, either directly or indirectly. These inputs may include quoted prices for the identical instrument on an inactive market, prices for similar instruments, interest rates, prepayment speeds, credit risk, yield curves, default rates and similar data. |
| Level 3 – | Unobservable inputs for the asset or liability, to the extent relevant observable inputs are not available, representing the Fund’s own assumptions about the assumptions a market participant would use in valuing the asset or liability, and would be based on the best information available. |
The inputs or methodology used for valuing securities are not an indication of the risk associated with investing in those securities.
The following table is a summary of the inputs used to value the Fund’s securities by level within the fair value hierarchy as of June 30, 2022:
| Assets | Level 1 | Level 2 | Level 3 | Total | ||||||||||||
Investments at Fair Value | ||||||||||||||||
Common Stocks(1) | $ | 64,268,611 | $ | 35,676,074 | $ | — | $ | 99,944,685 | ||||||||
Convertible Preferred Stocks | 4,685,490 | — | — | 4,685,490 | ||||||||||||
Short-Term Investments | 6,015,789 | — | — | 6,015,789 | ||||||||||||
$ | 74,969,890 | $ | 35,676,074 | $ | — | $ | 110,645,964 | |||||||||
Other Instruments | ||||||||||||||||
Forward Currency Contracts | $ | — | $ | 70,710 | $ | — | $ | 70,710 | ||||||||
$ | 74,969,890 | $ | 35,746,784 | $ | — | $ | 110,716,674 | |||||||||
(1) | Please refer to the Schedule of Investments to view common stocks segregated by sub-industry type. |
During the period ended June 30, 2022, the Fund did not hold any Level 3 securities, nor were there any transfers into or out of Level 3.
B. Forward Currency Contracts – The Fund is subject to foreign currency rate risk in the normal course of pursuing its investment objectives. The Fund utilizes forward contracts for foreign currency hedging purposes, volatility management purposes or otherwise to gain, or reduce, long or short exposure to one or more asset classes or issuers. The Fund holds forward currency exchange contracts obligating the Fund to deliver and receive a currency at a specified future date. Forward contracts are valued daily, and unrealized appreciation or depreciation is recorded daily as the difference between the contract exchange rate and the closing forward rate applied to the face amount of the contract. Refer to Note 2 A. for a pricing description. A realized gain or loss is recorded at the time the forward contract expires. Credit risk may arise as a result of the failure of the counterparty to comply with the terms of the contract. Refer to Note 2 I. for further counterparty risk disclosure.
20
KAYNE ANDERSON RENEWABLE INFRASTRUCTURE FUND
Notes to the Financial Statements (Unaudited) – Continued
June 30, 2022
The use of forward currency exchange contracts does not eliminate fluctuations in the underlying prices of the Fund’s investment securities. The use of forward currency exchange contracts involves the risk that anticipated currency movements will not be accurately predicted. A forward currency exchange contract would limit the risk of loss due to a decline in the value of a particular currency; however, it would also limit any potential gain that might result should the value of the currency increase instead of decrease. These contracts may involve market risk in excess of the net amount receivable or payable reflected on the Statement of Assets and Liabilities. Refer to Note 2 K. for further derivative disclosures.
C. Foreign Securities and Currency Translation – Investment securities and other assets and liabilities denominated in foreign currencies are translated into U.S. dollar amounts at the date of valuation. Purchases and sales of investment securities and income and expense items denominated in foreign currencies are translated into U.S. dollar amounts on the respective dates of such transactions. The Fund does not isolate the portion of the results of operations from changes in foreign exchange rates on investments from the fluctuations arising from changes in market prices of securities held. Reported net realized foreign exchange gains or losses arise from sales of foreign currencies, and the difference between the amounts of dividends, interest, and foreign withholding taxes recorded on the Fund’s books and the U.S. dollar equivalent of the amounts actually received or paid. Net unrealized foreign exchange gains and losses arise from changes in the fair values of assets and liabilities, other than investments in securities at fiscal year-end, resulting from changes in exchange rates.
Investments in foreign securities entail certain risks. There may be a possibility of nationalization or expropriation of assets, confiscatory taxation, political or financial instability, and diplomatic developments that could affect the value of the Fund’s investments in certain foreign countries. Since foreign securities normally are denominated and traded in foreign currencies, the value of the Fund’s assets may be affected favorably or unfavorably by currency exchange rates, currency exchange control regulations, foreign withholding taxes, and restrictions or prohibitions on the repatriation of foreign currencies. There may be less information publicly available about a foreign issuer than about a U.S. issuer, and foreign issuers are not generally subject to accounting, auditing, and financial reporting standards and practices comparable to those in the United States. The securities of some foreign issuers are less liquid and at times more volatile than securities of comparable U.S. issuers.
D. Cash and Cash Equivalents – The Fund considers highly liquid short-term fixed income investments purchased with an original maturity of less than three months to be cash equivalents. Cash equivalents are included in short-term investments on the Schedule of Investments as well as in investments on the Statement of Assets and Liabilities.
E. Guarantees and Indemnifications – In the normal course of business, the Fund enters into contracts with service providers that contain general indemnification clauses. The Fund’s maximum exposure under these arrangements is unknown, as this would involve future claims that may be made against the Fund that have not yet occurred.
F. Security Transactions, Income and Expenses – The Fund follows industry practice and records security transactions on the trade date. Realized gains and losses on sales of securities are calculated on the basis of identified cost. Dividend income and expense is recorded on the ex-dividend date and interest income and expense is recorded on an accrual basis. Certain dividends received from the Funds’ investments are comprised of ordinary income and return of capital. At the time such dividends are received, the Fund allocates dividends between investment income and return of capital based on estimates. Such estimates are based on information provided by each portfolio company and other industry sources. These estimates may subsequently be revised based on actual
21
KAYNE ANDERSON RENEWABLE INFRASTRUCTURE FUND
Notes to the Financial Statements (Unaudited) – Continued
June 30, 2022
allocations received from the portfolio companies after final tax reporting information is received. The return of capital portion of the dividends is a reduction to investment income that results in an equivalent reduction in the cost basis of the associated investments. During the period ended June 30, 2022, the Fund received $232,231 in dividends allocated to return of capital and the Fund increased the return of capital for prior year distributions received by $238,746 due to 2021 tax reporting information received by the Fund in fiscal 2022. Withholding taxes on foreign dividends have been provided for in accordance with the Fund’s understanding of the applicable country’s tax rules and regulations. Discounts and premiums on securities purchased are amortized over the expected life of the respective securities. Interest income is accounted for on the accrual basis and includes amortization of premiums and accretion of discounts on the effective interest method.
G. Allocation of Income, Expenses and Gains/Losses – Income, expenses (other than those deemed attributable to a specific share class), and gains and losses of the Fund are allocated daily to each class of shares based upon the ratio of net assets represented by each class as a percentage of the net assets of the Fund. Expenses deemed directly attributable to a class of shares are recorded by the specific class. Most Fund expenses are allocated by class based on relative net assets. 12b-1 fees are expensed at 0.25% of average daily net assets of Retail Class shares (See Note 5). Trust Expenses associated with a specific fund in the Trust are charged to that fund. Common Trust expenses are typically allocated evenly between the funds of the Trust, or by other equitable means.
H. Share Valuation – The NAV per share of the Fund is calculated by dividing the sum of the value of the securities held by the Fund, plus cash and other assets, minus all liabilities (including estimated accrued expenses) by the total number of shares outstanding for the Fund, rounded to the nearest cent. The Fund’s shares will not be priced on days which the New York Stock Exchange (“NYSE”) is closed for trading.
I. Counterparty Risk – The Fund helps manage counterparty credit risk by entering into agreements only with counterparties the Adviser believes have the financial resources to honor its obligations. The Adviser considers the credit worthiness of each counterparty to a contract in evaluating potential credit risk. The counterparty risk for forward currency exchange contracts to the Fund includes the amount of any net unrealized appreciation on the contract. The counterparty risk for equity swaps contracts to the Fund includes the risk of loss of the full amount of any net unrealized appreciation on the contract, along with dividends receivable on long equity contracts and interest receivable on short equity contracts. Written and purchased options and futures contracts sold on an exchange do not expose the Fund to counterparty risk; the exchange’s clearinghouse guarantees the options and futures against counterparty nonperformance. Over-the-counter options counterparty risk includes the risk of loss of the full amount of any net unrealized appreciation.
J. Use of Estimates – The preparation of financial statements in conformity with GAAP requires management to make estimates and assumptions that affect the reported amounts of assets and liabilities and disclosure of contingent assets and liabilities at the date of the financial statements and the reported amounts of income and expenses during the reporting period. Actual results could differ from those estimates.
K. Derivatives – The Fund may utilize derivative instruments such as options, forward currency exchange contracts and other instruments with similar characteristics to the extent that they are consistent with the Fund’s respective investment objectives and limitations. The use of these instruments may involve additional investment risks, including the possibility of illiquid markets or imperfect correlation between the value of the instruments and the underlying securities. Derivatives also may create leverage which will amplify the effect of their performance on the Fund and may produce significant losses.
22
KAYNE ANDERSON RENEWABLE INFRASTRUCTURE FUND
Notes to the Financial Statements (Unaudited) – Continued
June 30, 2022
L. Statement of Cash Flows – Pursuant to the Cash Flows Topic of the Codification, the Fund qualifies for an exemption from the requirement to provide a statement of cash flows and has elected not to provide a statement of cash flows.
The Fund has adopted authoritative standards regarding disclosure about derivatives and hedging activities and how they affect the Fund’s Statement of Assets and Liabilities and Statement of Operations. For the period ended June 30, 2022, the Fund’s average derivative volume is described below:
| Monthly Average | Monthly Average | |||||||
| Quantity | Notional Value | |||||||
| Long Forward Contracts | 71,398,361 | 59,410,278 | ||||||
| Short Forward Contracts | 1,509,046,322 | 59,020,961 | ||||||
Statement of Assets and Liabilities
The effect of derivative instruments as of June 30, 2022
| Fair Value | |||||||||
| Statement of Assets and | |||||||||
| Liabilities Location | Assets | Liabilities | |||||||
Forward Currency Contracts | |||||||||
Foreign Exchange | Receivable for forward currency contracts, net | $ | 70,710 | $ | — | ||||
Total | $ | 70,710 | $ | — | |||||
Statement of Operations
The effect of derivative instruments on the Statements of Operations for the period ended June 30, 2022:
| Net Realized Gain (Loss) on Derivatives | ||||||||
| Forward Currency | ||||||||
Derivatives | Contracts | Total | ||||||
Forward Currency Contracts | $ | 2,441,866 | $ | 2,441,866 | ||||
Total | $ | 2,441,866 | $ | 2,441,866 | ||||
| Net Change in Unrealized Appreciation | ||||||||
| (Depreciation) on Derivatives | ||||||||
| Forward Currency | ||||||||
Derivatives | Contracts | Total | ||||||
Forward Currency Contracts | $ | 541,711 | $ | 541,711 | ||||
Total | $ | 541,711 | $ | 541,711 | ||||
3. RELATED PARTY TRANSACTIONS
The Trust has an agreement with the Adviser to furnish investment advisory services to the Fund. Pursuant to an Investment Advisory Agreement between the Trust and the Adviser, the Adviser is entitled to receive, on a monthly basis, an annual advisory fee equal to 0.85% of the Fund’s average daily net assets.
23
KAYNE ANDERSON RENEWABLE INFRASTRUCTURE FUND
Notes to the Financial Statements (Unaudited) – Continued
June 30, 2022
The Fund’s Adviser has contractually agreed in an Operating Expenses Limitation Agreement to reduce its management fees and/or absorb expenses of the Fund to ensure that total annual operating expenses after fee waiver and/or expense reimbursement (excluding 12b-1 fees – Retail Class (see Note 5), shareholder servicing fees, redemption fees, taxes, leverage interest, brokerage fees (including commissions, mark-ups and mark-downs), any acquired fund fees and expenses, annual account fees for margin accounts, expenses incurred in connection with any merger or reorganization and extraordinary expenses such as litigation) do not exceed 1.00% of the Fund’s average daily net assets. The Adviser may request recoupment of previously waived fees and reimbursed Fund expenses from the Fund for three years from the date they were waived or reimbursed, provided that, after payment of the recoupment, the Total Annual Fund Operating Expenses do not exceed the lesser of the Expense Cap: (i) in effect at the time of the waiver or reimbursement; or (ii) in effect at the time of recoupment. The Operating Expenses Limitation Agreement is intended to be continual in nature and cannot be terminated within two years after the effective date of the Fund’s prospectus and subject thereafter to termination at any time upon 60 days written notice and approval by the Board or the Advisor, with consent of the Board. Waived fees and reimbursed expenses subject to potential recovery during the fiscal year of expiration are as follows:
Expiration | Amount | |||
July 2023 to December 2023 | $ | 100,140 | ||
January 2024 to December 2024 | 229,108 | |||
January 2025 to June 2025 | 128,037 | |||
Fund Services acts as the Fund’s Administrator, transfer agent, and fund accountant. U.S. Bank N.A. (the “Custodian”) serves as the custodian to the Fund. The Custodian is an affiliate of the Administrator. The Administrator performs various administrative and accounting services for the Fund. The Administrator prepares various federal and state regulatory filings, reports and returns for the Fund; prepares reports and materials to be supplied to the Trustees; monitors the activities of the Fund’s custodian; coordinates the payment of the Fund’s expenses and reviews the Fund’s expense accruals. The officers of the Trust, including the Chief Compliance Officer, are employees of the Administrator. A trustee of the Trust is an officer of the Administrator. As compensation for its services, the Administrator is entitled to a monthly fee at an annual rate based upon the average daily net assets of the Fund, subject to annual minimums. Fees paid by the Fund for administration and accounting, transfer agency, custody and compliance services for the period ended June 30, 2022 are disclosed in the Statement of Operations.
Quasar Distributors, LLC is the Fund’s distributor (the “Distributor”). The Distributor is not affiliated with the Adviser, Fund Services, or its affiliated companies.
4. TAX FOOTNOTE
Federal Income Taxes – The Fund intends to comply with the requirements of Subchapter M of the Internal Revenue Code of 1986, as amended, necessary to qualify as a regulated investment company and distributes substantially all net taxable investment income and net realized gains to shareholders in a manner which results in no tax cost to the Fund. Therefore, no federal income or excise tax provision is required. As of and during the period ended June 30, 2022, the Fund did not have any tax positions that did not meet the “more-likely-than-not” threshold of being sustained by the applicable tax authority and did not have liabilities for any unrecognized tax benefits. The Fund recognizes interest and penalties, if any, related to unrecognized tax benefits on uncertain tax positions as income tax expense in the Statement of Operations. The Fund is subject to examination by taxing authorities for the tax periods since the commencement of operations.
24
KAYNE ANDERSON RENEWABLE INFRASTRUCTURE FUND
Notes to the Financial Statements (Unaudited) – Continued
June 30, 2022
As of December 31, 2021, the Fund’s most recently completed fiscal year end, the components of distributable earnings on a tax basis were as follows:
| Tax cost of investments* | $ | 97,456,801 | ||
| Gross unrealized appreciation | $ | 16,357,372 | ||
| Gross unrealized depreciation | (4,027,027 | ) | ||
| Net unrealized appreciation | 12,330,345 | |||
| Undistributed ordinary income | 360,429 | |||
| Undistributed long-term capital gain | 527,872 | |||
| Other accumulated loss | (189,817 | ) | ||
| Total distributable earnings | $ | 13,028,829 |
As of December 31, 2021, the Fund did not have any capital loss carryovers. A regulated investment company may elect for any taxable year to treat any portion of any qualified late year loss as arising on the first day of the next taxable year. Qualified late year losses are certain ordinary losses which occur during the portion of the Fund’s taxable period subsequent to December 31.
Distributions to Shareholders – The Fund distributes substantially all net investment income, if any, and net realized capital gains, if any, annually. Distributions to shareholders are recorded on the ex-dividend date. The treatment for financial reporting purposes of distributions made to shareholders during the year from net investment income or net realized capital gains may differ from their treatment for federal income tax purposes. These differences are caused primarily by differences in the timing of the recognition of certain components of income, expense or realized capital gain for federal income tax purposes. Where such differences are permanent in nature, GAAP requires that they be reclassified in the components of the net assets based on their ultimate characterization for federal income tax purposes. Any such reclassifications will have no effect on net assets, results of operations or net asset values per share of the Fund. For the year ended December 31, 2021, the following table shows the reclassifications made:
| Distributable | |||
Earnings | Paid-In Capital | ||
| $(63,504) | $63,504 |
The tax character of distributions paid for the period ended June 30, 2022 and the year ended December 31, 2021 is as follows:
| Ordinary Income* | Long-Term Capital Gain | Return of Capital | Total | |||||||||||||
| 2022 | $ | 853,655 | $ | — | $ | — | $ | 853,655 | ||||||||
| 2021 | 1,096,090 | 1,402,568 | — | 2,498,658 | ||||||||||||
| * | For federal income tax purposes, distributions of short-term capital gains are treated as ordinary income distributions. |
5. DISTRIBUTION & SHAREHOLDER SERVICING FEES
The Fund has adopted a Distribution and Shareholder Servicing Plan pursuant to Rule 12b-1 (the “Plan”) for the Retail Class. The Plan permits the Fund to pay for distribution and related expenses at an annual rate of 0.25% average daily net assets of the Retail Class. Amounts paid under the Plan are paid to the Distributor to compensate it for costs of the services it provides to the Retail Class shares of the Fund and the expenses it bears in the distribution of the Fund’s Retail Class shares, including overhead and telephone expenses; printing and
25
KAYNE ANDERSON RENEWABLE INFRASTRUCTURE FUND
Notes to the Financial Statements (Unaudited) – Continued
June 30, 2022
distribution of prospectuses and reports used in connection with the offering of the Fund’s Retail Class shares to prospective investors; and preparation, printing, payments to intermediaries and distribution of sales literature and advertising materials.
Under the Plan, the Trustees will be furnished quarterly with information detailing the amount of expenses paid under the Plan and the purposes for which payments were made. The Plan may be terminated at any time by vote of a majority of the Trustees of the Trust who are not interested persons. Continuation of the Plan is considered by such Trustees no less frequently than annually. With the exception of the Distributor and the Adviser, in their capacities as the Fund’s principal underwriter and distribution coordinator, respectively, no interested person has or had a direct or indirect financial interest in the Plan or any related agreement. For the period ended June 30, 2022, the Retail Class incurred expenses of $2,599 pursuant to the Plan.
Distribution and fees are not subject to the Operating Expenses Limitation Agreement to reduce management fees and/or absorb Fund expenses by the Adviser. Distribution fees will increase the expenses beyond the Operating Expenses Limitation Agreement rate of 1.00% for the Retail Class, respectively.
6. INVESTMENT TRANSACTIONS
The aggregate purchases and sales, excluding short-term investments, by the Fund for the period ended June 30, 2022, were as follows:
| Purchases | Sales | |||||||
| U.S. Government | $ | — | $ | — | ||||
| Other | 43,731,654 | 31,263,854 | ||||||
7. OFFSETTING ASSETS AND LIABILITIES
During the course of business, the Fund may enter into transactions subject to enforceable netting agreements or other similar arrangements (“netting agreements”). Generally, the right to offset in netting agreements allows the Fund to offset any exposure to a specific counterparty with any collateral received or delivered to that counterparty based on the terms of the agreement. As of June 30, 2022, the Fund did not enter into any netting agreements which would require any portfolio securities to be netted.
| Gross Amounts not | ||||||||||||||||||||||||
| Gross | Net Amounts | offset in the Statement | ||||||||||||||||||||||
| Gross | Amounts | Presented | of Assets and Liabilities | |||||||||||||||||||||
| Amounts of | Offset in the | in the | ||||||||||||||||||||||
| Recognized | Statement of | Statement | Collateral | |||||||||||||||||||||
| Assets/ | Assets and | of Assets | Financial | Received/ | Net | |||||||||||||||||||
| Liabilities | Liabilities | and Liabilities | Instruments | Pledged* | Amount | |||||||||||||||||||
| Assets: | ||||||||||||||||||||||||
| Description | ||||||||||||||||||||||||
Forward Currency Contracts | $ | 120,370 | $ | 49,660 | $ | 70,710 | $ | — | $ | — | $ | 70,710 | ||||||||||||
$ | 120,370 | $ | 49,660 | $ | 70,710 | $ | — | $ | — | $ | 70,710 | |||||||||||||
| Liabilities: | ||||||||||||||||||||||||
| Description | ||||||||||||||||||||||||
Forward Currency Contracts | $ | 49,660 | $ | 49,660 | $ | — | $ | — | $ | — | $ | — | ||||||||||||
$ | 49,660 | $ | 49,660 | $ | — | $ | — | $ | — | $ | — | |||||||||||||
| * | In some instances, the actual collateral pledged/received may be more than amount shown. |
26
KAYNE ANDERSON RENEWABLE INFRASTRUCTURE FUND
Notes to the Financial Statements (Unaudited) – Continued
June 30, 2022
8. LINE OF CREDIT
On October 26, 2021, the Fund established a secured line of credit (“LOC”) in the amount of $15,000,000, 20% of the Fund’s gross market value or 33.33% of the fair market value of the Fund’s investments, whichever is less. When utilized the LOC would be collateralized by a first priority security interest in the assets of the Fund. The LOC matures, unless renewed on October 25, 2022. The LOC is intended to provide short-term financing, if necessary, subject to certain restrictions and covenants, in connection with shareholder redemptions. The LOC is with the Custodian. Interest is charged at the prime rate which was 4.75% as of June 30, 2022. The Fund has authorized the Custodian to charge any of the Fund’s accounts for any missed payments. During the period ended June 30, 2022, the Fund did not utilize its line of credit.
9. BENEFICIAL OWNERSHIP
The beneficial ownership, either directly or indirectly, of more than 25% of the voting securities of a fund creates a presumption of control of the fund, under Section 2(a)(9) of the Investment Company Act of 1940. As of June 30, 2022, Charles Schwab and National Financial Services, for the benefit of their customers, each owned more than 25% of the outstanding shares of the fund.
10. RECENT MARKET EVENTS RISK
The U.S. and international markets have experienced significant periods of volatility in recent years and months due to a number of economic, political and global macro factors including the impact of COVID-19 as a global pandemic, which has resulted in a public health crisis, disruptions to business operations and supply chains, stress on the global healthcare system, growth concerns in the U.S. and overseas, staffing shortages and the inability to meet consumer demand, and widespread concern and uncertainty. The global recovery from COVID-19 is proceeding at slower than expected rates due to the emergence of variant strains and may last for an extended period of time. Continuing uncertainties regarding interest rates, rising inflation, political events, rising government debt in the U.S. and trade tensions also contribute to market volatility. As a result of continuing political tensions and armed conflicts, including the war between Ukraine and Russia, the U.S. and the European Union imposed sanctions on certain Russian individuals and companies, including certain financial institutions, and have limited certain exports and imports to and from Russia. The war has contributed to recent market volatility and may continue to do so.
11. SUBSEQUENT EVENTS
Management has evaluated events and transactions for potential recognition or disclosure through the date the Financial statements were issued and has determined that no additional items require recognition or disclosure.
27
KAYNE ANDERSON RENEWABLE INFRASTRUCTURE FUND
Additional Information (Unaudited)
June 30, 2022
AVAILABILITY OF FUND PORTFOLIO INFORMATION
The Fund files complete schedules of portfolio holdings with the SEC for the first and third quarters of each fiscal year on Part F of Form N-PORT, which is available on the SEC’s website at www.sec.gov. The Fund’s Part F of Form N-PORT may be reviewed and copied at the SEC’s Public Reference Room in Washington, D.C. For information on the Public Reference Room call 1-800-SEC-0330. In addition, the Fund’s Part F of Form N-PORT is available without charge upon request by calling 1-844-955-2963.
AVAILABILITY OF PROXY VOTING INFORMATION
A description of the Fund’s Proxy Voting Policies and Procedures is available without charge, upon request, by calling 1-844-955-2963. Information regarding how the Fund voted proxies relating to portfolio securities during the most recent period ended June 30, is available (1) without charge, upon request, by calling 1-844-955-2963, or (2) on the SEC’s website at www.sec.gov.
28
KAYNE ANDERSON RENEWABLE INFRASTRUCTURE FUND
Privacy Notice (Unaudited)
The Fund collects non-public information about you from the following sources:
| • | Information we receive about you on applications or other forms; | |
| • | Information you give us orally; and/or | |
| • | Information about your transactions with us or others |
We do not disclose any non-public personal information about our customers or former customers without the customer’s authorization, except as permitted by law. We may share information with affiliated and unaffiliated third parties with whom we have contracts for servicing the Fund. We will provide unaffiliated third parties with only the information necessary to carry out their assigned responsibilities. We maintain physical, electronic and procedural safeguards to guard your personal information and require third parties to treat your personal information with the same high degree of confidentiality.
In the event that you hold shares of the Fund through a financial intermediary, including, but not limited to, a broker-dealer, bank, or trust company, the privacy policy of your financial intermediary would govern how your non-public personal information would be shared with unaffiliated third parties.
29
INVESTMENT ADVISER
Kayne Anderson Capital Advisors, L.P.
811 Main Street, 14th Floor
Houston, TX 77002
DISTRIBUTOR
Quasar Distributors, LLC
111 East Kilbourn Avenue, Suite 2200
Milwaukee, WI 53202
CUSTODIAN
U.S. Bank N.A.
1555 North Rivercenter Drive, Suite 302
Milwaukee, WI 53212
ADMINISTRATOR, FUND ACCOUNTANT
AND TRANSFER AGENT
U.S. Bancorp Fund Services, LLC
615 East Michigan Street
Milwaukee, WI 53202
INDEPENDENT REGISTERED PUBLIC ACCOUNTING FIRM
Cohen & Company, Ltd.
342 North Water Street, Suite 830
Milwaukee, WI 53202
LEGAL COUNSEL
Goodwin Procter LLP
1900 N Street, NW
Washington, DC 20036
| (b) | Not applicable. |
Item 2. Code of Ethics.
Not applicable for semi-annual reports.
Item 3. Audit Committee Financial Expert.
Not applicable for semi-annual reports.
Item 4. Principal Accountant Fees and Services.
Not applicable for semi-annual reports.
Item 5. Audit Committee of Listed Registrants.
Not applicable for semi-annual reports.
Item 6. Schedule of Investments.
(a) Schedule of Investments is included as part of the report to shareholders filed under Item 1 of this Form.
(b) Not applicable.
Item 7. Disclosure of Proxy Voting Policies and Procedures for Closed-End Management Investment Companies.
Not applicable to open-end investment companies.
Item 8. Portfolio Managers of Closed-End Management Investment Companies.
Not applicable to open-end investment companies.
Item 9. Purchases of Equity Securities by Closed‑End Management Investment Company and Affiliated Purchases.
Not applicable to open-end investment companies.
Item 10. Submission of Matters to a Vote of Security Holders.
There have been no material changes to the procedures by which shareholders may recommend nominees to the registrant’s board of trustees.
Item 11. Controls and Procedures.
(a) | The Registrant’s President and Treasurer have reviewed the Registrant's disclosure controls and procedures (as defined in Rule 30a-3(c) under the Investment Company Act of 1940 (the “Act”)) as of a date within 90 days of the filing of this report, as required by Rule 30a-3(b) under the Act and Rules 13a-15(b) or 15d‑15(b) under the Securities Exchange Act of 1934. Based on their review, such officers have concluded that the disclosure controls and procedures are effective in ensuring that information required to be disclosed in this report is appropriately recorded, processed, summarized and reported and made known to them by others within the Registrant and by the Registrant’s service provider. |
(b) | There were no significant changes in the Registrant's internal control over financial reporting (as defined in Rule 30a-3(d) under the Act) that occurred during the period covered by this report that has materially affected, or is reasonably likely to materially affect, the Registrant's internal control over financial reporting. |
Item 12. Disclosure of Securities Lending Activities for Closed-End Management Investment Companies.
Not applicable to open-end investment companies.
Item 13. Exhibits.
| (a) | (1) Any code of ethics or amendment thereto, that is the subject of the disclosure required by Item 2, to the extent that the registrant intends to satisfy Item 2 requirements through filing an exhibit. Not applicable for semi-annual reports. |
(3) Any written solicitation to purchase securities under Rule 23c‑1 under the Act sent or given during the period covered by the report by or on behalf of the registrant to 10 or more persons. Not applicable to open-end investment companies.
(4) Change in the registrant’s independent public accountant. There was no change in the registrant’s independent public accountant for the period covered by this report.
SIGNATURES
Pursuant to the requirements of the Securities Exchange Act of 1934 and the Investment Company Act of 1940, the registrant has duly caused this report to be signed on its behalf by the undersigned, thereunto duly authorized.
(Registrant) Series Portfolios Trust
By (Signature and Title)* /s/ Ryan L. Roell
Ryan L. Roell, President
Date 9/6/2022
Pursuant to the requirements of the Securities Exchange Act of 1934 and the Investment Company Act of 1940, this report has been signed below by the following persons on behalf of the registrant and in the capacities and on the dates indicated.
By (Signature and Title)* /s/ Ryan L. Roell
Ryan L. Roell, President
Date 9/6/2022
By (Signature and Title)* /s/ Cullen O. Small
Cullen O. Small, Treasurer
Date 9/6/2022
* Print the name and title of each signing officer under his or her signature.