Series Portfolios Trust
InfraCap Equity Income Fund ETF
Ticker Symbol: ICAP
InfraCap Small Cap Income ETF
Ticker Symbol: SCAP
Core Financial Statements
November 30, 2024
UNITED STATES
SECURITIES AND EXCHANGE COMMISSION
Washington, D.C. 20549
FORM N-CSR
CERTIFIED SHAREHOLDER REPORT OF REGISTERED
MANAGEMENT INVESTMENT COMPANIES
Investment Company Act file number 811-23084
Series Portfolios Trust
(Exact name of registrant as specified in charter)
615 East Michigan Street
Milwaukee, WI 53202
(Address of principal executive offices) (Zip code)
Ryan L. Roell, President
Series Portfolios Trust
c/o U.S. Bancorp Fund Services, LLC
777 East Wisconsin Ave, 6th Fl
Milwaukee, WI 53202
(Name and address of agent for service)
(414) 516-1709
Registrant’s telephone number, including area code
Date of fiscal year end: November 30, 2024
Date of reporting period: November 30, 2024
Item 1. Reports to Stockholders.
| (a) |
 | InfraCap Equity Income Fund ETF | |
| ICAP (Principal U.S. Listing Exchange: NYSE) | ||
| Annual Shareholder Report | November 30, 2024 |
Fund Name | Costs of a $10,000 investment | Costs paid as a percentage of a $10,000 investment |
| InfraCap Equity Income Fund ETF | $373 | 3.19% |
| FACTOR | IMPACT | SUMMARY |
| Financials | Positive | Overweight exposure to the information technology sector relative to the benchmark contributed to outperformance. |
| Communication Services | Positive | Overweight exposure to the Communication Services sector relative to the Benchmark contributed to outperformance. |
| Consumer Staples | Negative | Underweight exposure to Consumer Staples sector relative to the Benchmark detracted from relative performance. |
| Company Market Capitalization | Negative | Overweight exposure to select small company issuers underperformed relative to their larger capitalized peers during the period. |
| InfraCap Equity Income Fund ETF | PAGE 1 | TSR-AR-81752T619 |
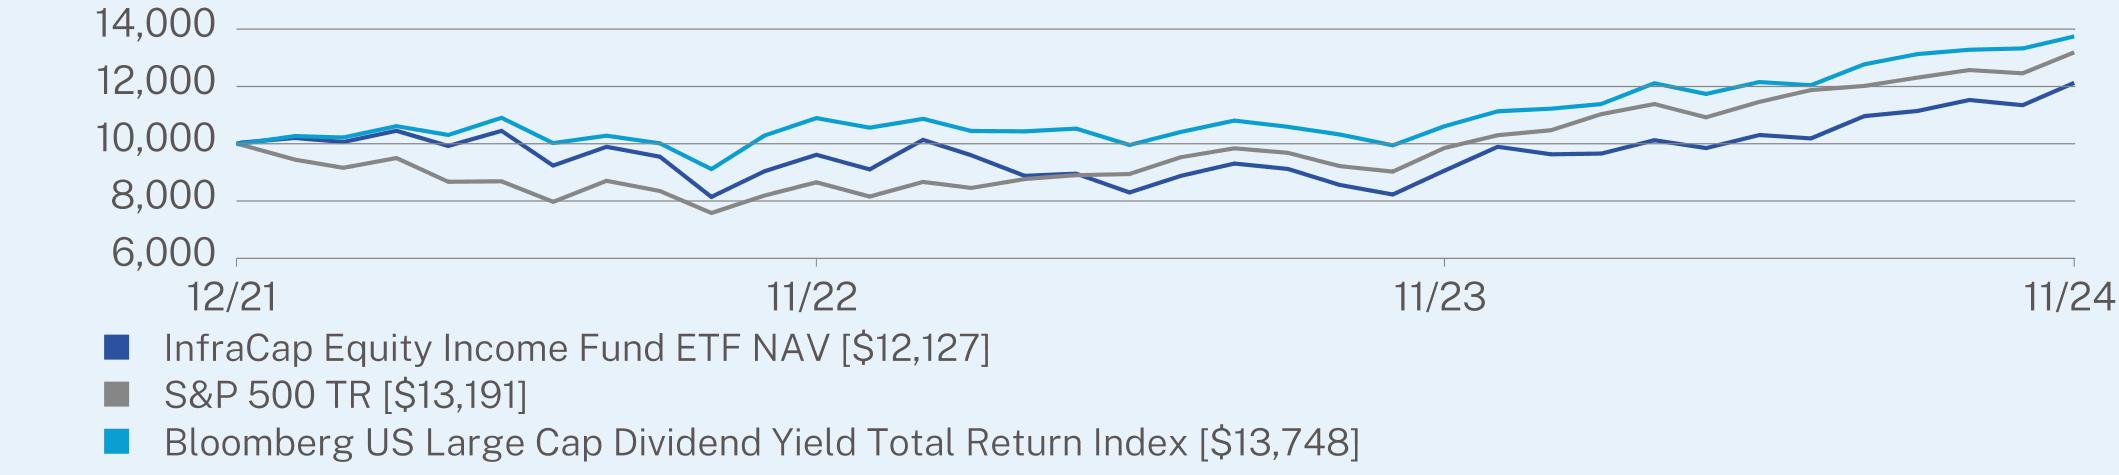
1 Year | Since Inception (12/28/2021) | |
InfraCap Equity Income Fund ETF NAV | 33.85 | 6.82 |
S&P 500 TR | 33.89 | 9.94 |
Bloomberg US Large Cap Dividend Yield Total Return Index | 29.56 | 11.50 |
| * | The Fund’s past performance is not a good predictor of how the Fund will perform in the future. The graph and table do not reflect the deduction of taxes that a shareholder would pay on Fund distributions or redemption of Fund shares. |
Net Assets | $60,814,638 |
Number of Holdings | 155 |
Net Advisory Fee | $429,563 |
Portfolio Turnover | 207% |
30-Day SEC Yield | 6.93% |
30-Day SEC Yield Unsubsidized | 6.93% |
Industry Breakdown | (% of investments) |
Banks | 14.5% |
Oil, Gas & Consumable Fuels | 12.4% |
Specialized REITs | 9.5% |
Capital Markets | 8.1% |
Office REITs | 7.1% |
Retail REITs | 4.5% |
Mortgage REITs | 3.9% |
Financial Services | 3.7% |
Software | 3.0% |
Cash & Other | 33.3% |
Top 10 Issuers | (% of net assets) |
Goldman Sachs Group, Inc. | 4.5% |
Equinix, Inc. | 4.4% |
Chevron Corp. | 4.3% |
Kilroy Realty Corp. | 4.0% |
M&T Bank Corp. | 4.0% |
MPLX LP | 3.5% |
Citigroup, Inc. | 3.3% |
Oracle Corp. | 3.3% |
Citizens Financial Group, Inc. | 3.2% |
Apollo Global Management, Inc. | 3.1% |
Security Type | (% of net assets) |
Common Stocks | 105.6% |
Preferred Stocks | 17.4% |
Convertible Preferred Stocks | 5.9% |
Written Options | -0.2% |
Cash & Other | -28.7% |
| InfraCap Equity Income Fund ETF | PAGE 2 | TSR-AR-81752T619 |
| InfraCap Equity Income Fund ETF | PAGE 3 | TSR-AR-81752T619 |
 | InfraCap Small Cap Income ETF | |
| SCAP (Principal U.S. Listing Exchange: NYSE) | ||
| Annual Shareholder Report | November 30, 2024 |
Fund Name | Costs of a $10,000 investment | Costs paid as a percentage of a $10,000 investment |
| InfraCap Small Cap Income ETF | $219 | 1.94% |
| * | Period is inception date of December 11, 2023 through November 30, 2024. |
| FACTOR | IMPACT | SUMMARY |
| Information Technology | Positive | Overweight exposure to the information technology sector relative to the benchmark contributed to outperformance. |
| Company Market Capitalization | Positive | Overweight exposure to larger market capitalized companies within the small cap company sector contributed to outperformance. |
| Energy | Negative | The Fund’s overweight exposure to the energy sector relative to the benchmark detracted from relative performance. |
| Real Estate | Negative | The Fund’s overweight exposure to the real estate sector relative to the benchmark detracted from relative performance. |
| InfraCap Small Cap Income ETF | PAGE 1 | TSR-AR-81752T445 |
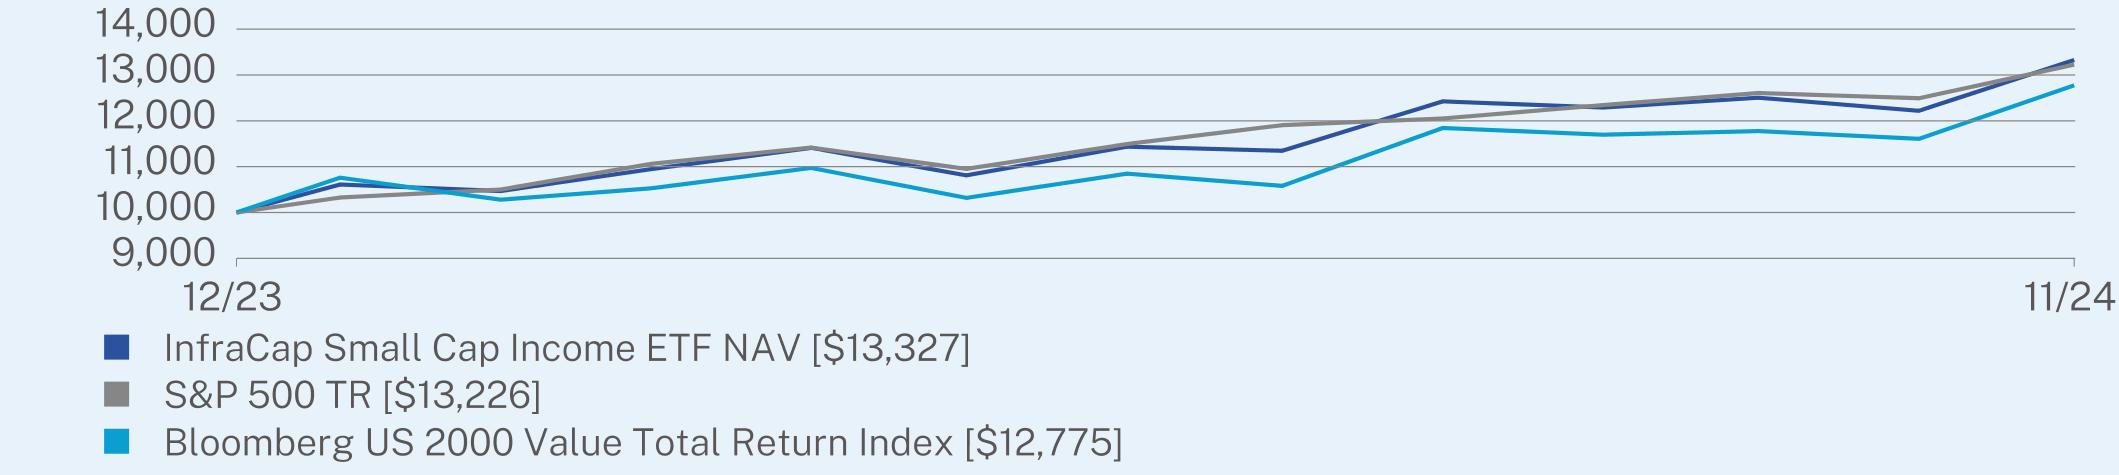
Since Inception (12/11/2023) | |
InfraCap Small Cap Income ETF NAV | 33.28 |
S&P 500 TR | 32.26 |
Bloomberg US 2000 Value Total Return Index | 27.75 |
| * | The Fund’s past performance is not a good predictor of how the Fund will perform in the future. The graph and table do not reflect the deduction of taxes that a shareholder would pay on Fund distributions or redemption of Fund shares. |
Net Assets | $12,476,230 |
Number of Holdings | 78 |
Net Advisory Fee | $52,889 |
Portfolio Turnover | 139% |
30-Day SEC Yield | 6.06% |
30-Day SEC Yield Unsubsidized | 6.06% |
Industry Breakdown | (% of investments) |
Banks | 18.1% |
Mortgage REITs | 10.3% |
Oil, Gas & Consumable Fuels | 9.8% |
Trading Companies & Distributors | 5.2% |
Chemicals | 5.1% |
Financial Services | 4.3% |
Capital Markets | 3.7% |
Office REITs | 3.2% |
Consumer Finance | 3.0% |
Cash & Other | 37.3% |
Top 10 Issuers | (% of net assets) |
iShares Russell 2000 ETF | 8.0% |
Apollo Global Management, Inc. | 3.8% |
Chart Industries, Inc. | 3.8% |
Chimera Investment Corp. | 3.6% |
Herc Holdings, Inc. | 3.5% |
Rithm Capital Corp. | 3.5% |
AGNC Investment Corp. | 3.4% |
Casey’s General Stores, Inc. | 3.2% |
Tapestry, Inc. | 3.2% |
GATX Corp. | 3.1% |
Security Type | (% of net assets) |
Common Stocks | 87.0% |
Preferred Stocks | 22.5% |
Convertible Preferred Stocks | 9.0% |
Exchange Traded Funds | 8.0% |
Written Options | 0.0% |
Cash & Other | -26.5% |
| InfraCap Small Cap Income ETF | PAGE 2 | TSR-AR-81752T445 |
| InfraCap Small Cap Income ETF | PAGE 3 | TSR-AR-81752T445 |
| (b) | Not applicable. |
Item 2. Code of Ethics.
The registrant has adopted a code of ethics that applies to the registrant’s principal executive officer and principal financial officer. The registrant has not made any substantive amendments to its code of ethics during the period covered by this report. The registrant has not granted any waivers from any provisions of the code of ethics during the period covered by this report.
File: A copy of the registrant’s Code of Ethics is filed herewith.
Item 3. Audit Committee Financial Expert.
The registrant’s board of trustees has determined that there is at least one audit committee financial expert serving on its audit committee. Debra McGinty-Poteet is the “audit committee financial expert” and is considered to be “independent” as each term is defined in Item 3 of Form N-CSR.
Item 4. Principal Accountant Fees and Services.
The registrant has engaged its principal accountant to perform audit services, audit-related services, tax services and other services during the past two fiscal years. “Audit services” refer to performing an audit of the registrant’s annual financial statements or services that are normally provided by the accountant in connection with statutory and regulatory filings or engagements for those two fiscal years. “Audit-related services” refer to the assurance and related services by the principal accountant that are reasonably related to the performance of the audit. “Tax services” refer to professional services rendered by the principal accountant for tax compliance, tax advice, and tax planning; including reviewing the Funds’ tax returns and distribution calculations. There were no “other services” provided by the principal accountant. For the fiscal years ended November 30, 2024 and November 30, 2023, the Funds’ principal accountant was Cohen & Company, Ltd. The following table details the aggregate fees billed or expected to be billed for each of the past two fiscal years for audit fees, audit-related fees, tax fees and other fees by the principal accountant.
| FYE 11/30/2024 | FYE 11/30/2023 | |
| (a) Audit Fees | $37,000 | $17,500 |
| (b) Audit-Related Fees | $0 | $0 |
| (c) Tax Fees | $8,000 | $4,000 |
| (d) All Other Fees | $0 | $0 |
(e)(1) The audit committee has adopted pre-approval policies and procedures that require the audit committee to pre-approve all audit and non-audit services of the registrant, including services provided to any entity affiliated with the registrant.
(e)(2) The percentage of fees billed by Cohen & Company, Ltd. applicable to non-audit services pursuant to waiver of pre-approval requirement were as follows:
| FYE 11/30/2024 | FYE 11/30/2023 | |
| Audit-Related Fees | 0% | 0% |
| Tax Fees | 0% | 0% |
| All Other Fees | 0% | 0% |
(f) All of the principal accountant’s hours spent on auditing the registrant’s financial statements were attributed to work performed by full-time permanent employees of the principal accountant.
(g) The following table indicates the non-audit fees billed or expected to be billed by the registrant’s accountant for services to the registrant and to the registrant’s investment adviser (and any other controlling entity, etc.—not sub-adviser) for the last two fiscal years.
| Non-Audit Related Fees | FYE 11/30/2024 | FYE 11/30/2023 |
| Registrant | $0 | $0 |
| Registrant’s Investment Adviser | $0 | $0 |
(h) The audit committee of the board of trustees has considered whether the provision of non-audit services that were rendered to the registrant’s investment adviser is compatible with maintaining the principal accountant’s independence and has concluded that the provision of such non-audit services by the accountant has not compromised the accountant’s independence.
(i) Not applicable
(j) Not applicable
Item 5. Audit Committee of Listed Registrants.
(a) The Registrant is an issuer as defined in Rule 10A-3 under the Securities Exchange Act of 1934, (the “Act”) and has a separately designated standing audit committee established in accordance with Section 3(a)(58)(A) of the Act. The members of the audit committee, all Independent Trustees, are as follows: Koji Felton, Debra McGinty-Poteet and Daniel B. Willey.
(b) Not applicable.
Item 6. Investments.
| (a) | Schedule of Investments is included within the financial statements filed under Item 7(a) of this Form. |
| (b) | Not applicable. |
Item 7. Financial Statements and Financial Highlights for Open-End Investment Companies.
| (a) |
Page | |||
Shares | Value | |||||
COMMON STOCKS - 105.6% | ||||||
Aerospace & Defense - 1.0% | ||||||
General Dynamics Corp. | 44 | $12,496 | ||||
RTX Corp.(a)(b) | 5,072 | 617,922 | ||||
630,418 | ||||||
Banks - 17.2% | ||||||
Bank of America Corp.(a)(c) | 29,124 | 1,383,681 | ||||
Citigroup, Inc.(a)(c) | 28,533 | 2,022,134 | ||||
Citizens Financial Group, Inc.(a)(c) | 39,838 | 1,917,801 | ||||
Fifth Third Bancorp(a)(c) | 13,152 | 632,085 | ||||
JPMorgan Chase & Company(c) | 927 | 231,491 | ||||
M&T Bank Corp.(a)(c) | 10,930 | 2,404,491 | ||||
Truist Financial Corp.(a)(c) | 26,106 | 1,244,734 | ||||
U.S. Bancorp(c) | 12,017 | 640,386 | ||||
10,476,803 | ||||||
Beverages - 0.1% | ||||||
Coca-Cola Co.(a) | 625 | 40,050 | ||||
Broadline Retail - 3.0% | ||||||
Amazon.com, Inc.(a)(b)(c)(d) | 8,790 | 1,827,353 | ||||
Capital Markets - 10.3% | ||||||
AllianceBernstein Holding LP(a)(c) | 37,740 | 1,368,830 | ||||
Ares Management Corp. - Class A(a)(c) | 5,118 | 904,504 | ||||
Goldman Sachs Group, Inc.(a)(c) | 4,474 | 2,722,742 | ||||
Morgan Stanley | 9,806 | 1,290,568 | ||||
6,286,644 | ||||||
Chemicals - 1.1% | ||||||
Dow, Inc.(a)(c) | 15,499 | 685,211 | ||||
Communications Equipment - 0.5% | ||||||
Cisco Systems, Inc.(b) | 5,077 | 300,609 | ||||
Diversified Telecommunication Services - 0.6% | ||||||
AT&T, Inc.(a)(c) | 4,867 | 112,720 | ||||
Verizon Communications, Inc.(a)(c) | 5,251 | 232,829 | ||||
345,549 | ||||||
Electric Utilities - 3.5% | ||||||
Duke Energy Corp. | 1,108 | 129,691 | ||||
Edison International(a)(c) | 11,973 | 1,050,631 | ||||
NextEra Energy, Inc.(b)(c) | 2,072 | 163,004 | ||||
Southern Co.(b)(c) | 8,591 | 765,716 | ||||
2,109,042 | ||||||
Food Products - 1.8% | ||||||
Kraft Heinz Co.(a)(b)(c) | 33,727 | 1,078,252 | ||||
1 |
Shares | Value | |||||
COMMON STOCKS - (Continued) | ||||||
Gas Utilities - 3.1% | ||||||
Northwest Natural Holding Co.(a)(c) | 10,750 | $471,065 | ||||
UGI Corp.(a)(c) | 46,510 | 1,412,509 | ||||
1,883,574 | ||||||
Health Care Providers & Services - 0.0%(e) | ||||||
UnitedHealth Group, Inc. | 11 | 6,712 | ||||
Health Care REITs - 0.8% | ||||||
Healthcare Realty Trust, Inc.(a)(c) | 25,747 | 471,685 | ||||
Hotels, Restaurants & Leisure - 3.2% | ||||||
Bloomin’ Brands, Inc.(a)(c) | 42,810 | 596,772 | ||||
McDonald’s Corp.(b) | 4,116 | 1,218,377 | ||||
Red Rock Resorts, Inc. - Class A(a)(c) | 3,035 | 152,023 | ||||
1,967,172 | ||||||
Industrial Conglomerates - 2.3% | ||||||
3M Company(a)(c) | 2,558 | 341,570 | ||||
Honeywell International, Inc.(a)(b) | 4,565 | 1,063,325 | ||||
1,404,895 | ||||||
Industrial REITs - 1.7% | ||||||
Rexford Industrial Realty, Inc.(a)(c) | 24,049 | 1,011,982 | ||||
Machinery - 0.7% | ||||||
Caterpillar, Inc.(b) | 1,036 | 420,730 | ||||
Multi-Utilities - 1.9% | ||||||
Algonquin Power & Utilities Corp.(a)(c) | 229,174 | 1,134,412 | ||||
Dominion Energy, Inc. | 99 | 5,816 | ||||
1,140,228 | ||||||
Office REITs - 9.1% | ||||||
Alexandria Real Estate Equities, Inc.(a)(c) | 11,189 | 1,233,363 | ||||
Boston Properties, Inc.(a)(c) | 23,195 | 1,901,758 | ||||
Kilroy Realty Corp.(a)(c) | 58,460 | 2,427,844 | ||||
5,562,965 | ||||||
Oil, Gas & Consumable Fuels - 16.0% | ||||||
Chevron Corp.(a)(b)(c) | 16,071 | 2,602,377 | ||||
Diamondback Energy, Inc.(a)(b)(c) | 4,765 | 846,216 | ||||
Enbridge, Inc.(a)(c) | 38,245 | 1,659,068 | ||||
Energy Transfer LP(a) | 964 | 19,145 | ||||
Exxon Mobil Corporation(a)(b)(c) | 12,631 | 1,489,953 | ||||
Kinder Morgan, Inc.(a)(c) | 21,943 | 620,328 | ||||
ONEOK, Inc.(a) | 1,011 | 114,850 | ||||
MPLX LP(a)(c) | 41,482 | 2,142,960 | ||||
Plains All American Pipeline LP(a)(c) | 10,360 | 193,421 | ||||
South Bow Corp. | 97 | 2,527 | ||||
2 |
Shares | Value | |||||
COMMON STOCKS - (Continued) | ||||||
Oil, Gas & Consumable Fuels - (Continued) | ||||||
TC Energy Corp. | 76 | $3,719 | ||||
Williams Cos., Inc. | 82 | 4,799 | ||||
9,699,363 | ||||||
Pharmaceuticals - 0.9% | ||||||
Johnson & Johnson(a) | 327 | 50,688 | ||||
Merck & Co., Inc.(a)(b)(c) | 5,095 | 517,856 | ||||
568,544 | ||||||
Retail REITs - 5.9% | ||||||
Federal Realty Investment Trust(a)(c) | 15,115 | 1,763,165 | ||||
Realty Income Corp.(a)(c) | 13,397 | 775,552 | ||||
Simon Property Group, Inc.(a)(c) | 5,575 | 1,023,570 | ||||
3,562,287 | ||||||
Semiconductors & Semiconductor Equipment - 1.8% | ||||||
Broadcom, Inc.(a)(b)(c) | 6,730 | 1,090,798 | ||||
Software - 3.8% | ||||||
Microsoft Corp. | 751 | 318,019 | ||||
Oracle Corp.(a)(b)(c) | 10,912 | 2,016,974 | ||||
2,334,993 | ||||||
Specialized REITs - 11.8% | ||||||
American Tower Corp.(a)(c) | 1,654 | 345,686 | ||||
Crown Castle, Inc.(a)(c) | 6,150 | 653,437 | ||||
Digital Realty Trust, Inc.(a)(c) | 9,166 | 1,793,695 | ||||
EPR Properties(a)(c) | 4,071 | 184,701 | ||||
Equinix, Inc.(a)(c) | 2,712 | 2,661,774 | ||||
Iron Mountain, Inc.(a) | 3,288 | 406,627 | ||||
Safehold, Inc.(a)(c) | 51,767 | 1,105,743 | ||||
7,151,663 | ||||||
Technology Hardware, Storage & Peripherals - 0.9% | ||||||
Hewlett Packard Enterprise Co.(a)(c) | 27,138 | 575,868 | ||||
Tobacco - 1.2% | ||||||
Altria Group, Inc. | 704 | 40,649 | ||||
Philip Morris International, Inc.(a)(b)(c) | 5,091 | 677,408 | ||||
718,057 | ||||||
Wireless Telecommunication Services - 1.4% | ||||||
Vodafone Group PLC - ADR(a)(c) | 96,843 | 868,682 | ||||
TOTAL COMMON STOCKS (Cost $60,030,711) | 64,220,129 | |||||
3 |
Shares | Value | |||||
PREFERRED STOCKS - 17.4% | ||||||
Banks - 1.5% | ||||||
Bank of America Corp. Series 02, 5.43% (3 mo. Term SOFR + 0.91%), Perpetual Maturity(a)(c) | 10,158 | $234,243 | ||||
Bank of Hawaii Corp. 8.00%, Perpetual Maturity(a)(c) | 1,173 | 31,202 | ||||
Flagstar Financial, Inc., Series A., 6.38% to 03/17/2027 then 3 mo. SOFR + 3.82%, Perpetual Maturity(f) | 5,118 | 114,285 | ||||
Valley National Bancorp, Series C, 8.25% to 09/30/2029 then 5 yr. CMT Rate + 4.18%, Perpetual Maturity(a)(c)(f) | 20,476 | 537,905 | ||||
917,635 | ||||||
Capital Markets - 0.1% | ||||||
Trinity Capital, Inc. 7.88%, 03/30/2029(a) | 1,727 | 43,935 | ||||
Commercial Services & Supplies - 0.2% | ||||||
Pitney Bowes, Inc. 6.70%, 03/07/2043(a)(c) | 5,180 | 103,652 | ||||
Consumer Finance - 2.8% | ||||||
Atlanticus Holdings Corp. Series *, 9.25%, 01/31/2029 | 1,036 | 25,848 | ||||
SLM Corp. Series B, 6.91% (3 mo. Term SOFR + 1.96%), Perpetual Maturity(a)(c)(f) | 22,104 | 1,658,242 | ||||
1,684,090 | ||||||
Diversified REITs - 0.9% | ||||||
Global Net Lease, Inc. Series B, 6.88%, Perpetual Maturity(a)(c) | 24,255 | 537,248 | ||||
Diversified Telecommunication Services - 0.3% | ||||||
Qwest Corp. | ||||||
6.75%, 06/15/2057 | 10,360 | 186,169 | ||||
6.50%, 09/01/2056 | 5 | 88 | ||||
186,257 | ||||||
Electrical Equipment - 1.2% | ||||||
Babcock & Wilcox Enterprises, Inc. Series A, 7.75%, Perpetual Maturity(a)(c) | 52,726 | 743,437 | ||||
Financial Services - 1.6% | ||||||
Corebridge Financial, Inc. 6.38%, 12/15/2064 | 40,000 | 995,520 | ||||
Health Care REITs - 0.6% | ||||||
Diversified Healthcare Trust | ||||||
5.63%, 08/01/2042(a)(c) | 24,626 | 365,942 | ||||
6.25%, 02/01/2046 | 641 | 9,878 | ||||
375,820 | ||||||
Hotel & Resort REITs - 1.9% | ||||||
RLJ Lodging Trust Series A, 1.95%, Perpetual Maturity | 45,754 | 1,158,949 | ||||
Insurance - 1.0% | ||||||
Aspen Insurance Holdings Ltd. 7.00%, Perpetual Maturity | 24,000 | 598,080 | ||||
4 |
Shares | Value | |||||
PREFERRED STOCKS - (Continued) | ||||||
Mortgage REITs - 5.1% | ||||||
AGNC Investment Corp., Series G, 7.75% to 10/15/2027 then 5 yr. CMT Rate + 4.39%, Perpetual Maturity(a)(c)(f) | 21,500 | $542,230 | ||||
MFA Financial, Inc. 8.88%, 02/15/2029(a) | 12,761 | 324,002 | ||||
New York Mortgage Trust, Inc., Series D, 8.00% to 10/15/2027 then 3 mo. SOFR + 5.70%, Perpetual Maturity(a)(c)(f) | 50,656 | 1,165,088 | ||||
Redwood Trust, Inc. 9.00%, 09/01/2029(a)(c) | 40,952 | 1,036,085 | ||||
3,067,405 | ||||||
Real Estate Management & Development - 0.2% | ||||||
DigitalBridge Group, Inc. Series H, 7.13%, Perpetual Maturity(c) | 4,993 | 125,824 | ||||
Wireless Telecommunication Services - 0.0%(e) | ||||||
United States Cellular Corp. | ||||||
6.25%, 09/01/2069 | 319 | 7,474 | ||||
5.50%, 03/01/2070 | 284 | 6,452 | ||||
5.50%, 06/01/2070 | 206 | 4,693 | ||||
18,619 | ||||||
TOTAL PREFERRED STOCKS (Cost $10,673,672) | 10,556,471 | |||||
CONVERTIBLE PREFERRED STOCKS - 5.9% | ||||||
Electric Utilities - 0.3% | ||||||
NextEra Energy, Inc. 6.93%, 09/01/2025(a)(c) | 3,795 | 164,741 | ||||
Financial Services - 3.1% | ||||||
Apollo Global Management, Inc. 6.75%, 07/31/2026 | 20,595 | 1,908,745 | ||||
Machinery - 0.9% | ||||||
Chart Industries, Inc. Series B, 6.75%, 12/15/2025(a)(c) | 7,832 | 563,591 | ||||
Specialized REITs - 0.4% | ||||||
EPR Properties Series E, 9.00%, Perpetual Maturity(a)(c) | 9,118 | 269,665 | ||||
Technology Hardware, Storage & Peripherals - 1.2% | ||||||
Hewlett Packard Enterprise Co. 7.63%, 09/01/2027(a)(c) | 11,261 | 696,605 | ||||
TOTAL CONVERTIBLE PREFERRED STOCKS (Cost $2,912,481) | 3,603,347 | |||||
TOTAL INVESTMENTS - 128.9% (Cost $73,616,864) | $78,379,947 | |||||
Liabilities in Excess of Other Assets - (28.9)% | (17,565,309) | |||||
TOTAL NET ASSETS - 100.0% | $60,814,638 | |||||
5 |
(a) | All or a portion of security has been committed as collateral for a borrowing facility. The total value of assets committed as collateral as of November 30, 2024 is $41,852,545. |
(b) | Held in connection with written option contracts. See Schedule of Written Options for further information. |
(c) | All or a portion of security has been committed as collateral for open written options contracts. The total value of assets committed as collateral as of November 30, 2024 is $11,444,782. |
(d) | Non-income producing security. |
(e) | Represents less than 0.05% of net assets. |
(f) | This security represents a fixed to float/variable rate preferred stock. The coupon rate shown represents the fixed rate as of November 30, 2024. |
6 |
Notional Amount | Contracts(a) | Value | |||||||
WRITTEN OPTIONS(b) | |||||||||
Call Options | |||||||||
Amazon.com, Inc. | |||||||||
Expiration: 12/06/2024; Exercise Price: $220.00 | $(207,890) | (10) | $(290) | ||||||
Expiration: 12/13/2024; Exercise Price: $225.00 | (207,890) | (10) | (370) | ||||||
Expiration: 12/20/2024; Exercise Price: $225.00 | (207,890) | (10) | (730) | ||||||
Broadcom, Inc. | |||||||||
Expiration: 12/06/2024; Exercise Price: $205.00 | (810,400) | (50) | (25) | ||||||
Expiration: 12/13/2024; Exercise Price: $205.00 | (486,240) | (30) | (390) | ||||||
Expiration: 12/20/2024; Exercise Price: $205.00 | (162,080) | (10) | (260) | ||||||
Expiration: 12/27/2024; Exercise Price: $205.00 | (162,080) | (10) | (335) | ||||||
Chevron Corp. | |||||||||
Expiration: 12/20/2024; Exercise Price: $170.00 | (1,619,300) | (100) | (4,200) | ||||||
Expiration: 01/17/2025; Exercise Price: $170.00 | (1,619,300) | (100) | (17,500) | ||||||
Cisco Systems, Inc. | |||||||||
Expiration: 12/20/2024; Exercise Price: $61.00 | (177,630) | (30) | (900) | ||||||
Expiration: 12/27/2024; Exercise Price: $62.00 | (59,210) | (10) | (240) | ||||||
Expiration: 01/03/2025; Exercise Price: $62.00 | (118,420) | (20) | (600) | ||||||
Diamondback Energy, Inc. | |||||||||
Expiration: 12/20/2024; Exercise Price: $200.00 | (355,180) | (20) | (600) | ||||||
Expiration: 12/27/2024; Exercise Price: $205.00 | (177,590) | (10) | (875) | ||||||
Expiration: 01/03/2025; Exercise Price: $195.00 | (177,590) | (10) | (1,900) | ||||||
Exxon Mobil Corp. | |||||||||
Expiration: 12/06/2024; Exercise Price: $126.00 | (117,960) | (10) | (30) | ||||||
Expiration: 12/13/2024; Exercise Price: $126.00 | (589,800) | (50) | (600) | ||||||
Expiration: 12/20/2024; Exercise Price: $126.00 | (353,880) | (30) | (810) | ||||||
Expiration: 12/27/2024; Exercise Price: $126.00 | (235,920) | (20) | (760) | ||||||
Expiration: 01/03/2025; Exercise Price: $126.00 | (235,920) | (20) | (1,070) | ||||||
Kraft Heinz Co. | |||||||||
Expiration: 12/13/2024; Exercise Price: $33.00 | (351,670) | (110) | (1,540) | ||||||
Expiration: 12/20/2024; Exercise Price: $33.00 | (319,700) | (100) | (2,050) | ||||||
McDonald’s Corp. | |||||||||
Expiration: 12/06/2024; Exercise Price: $320.00 | (1,480,050) | (50) | (350) | ||||||
Expiration: 12/13/2024; Exercise Price: $320.00 | (1,480,050) | (50) | (500) | ||||||
Expiration: 12/20/2024; Exercise Price: $320.00 | (2,960,100) | (100) | (1,400) | ||||||
Expiration: 12/27/2024; Exercise Price: $315.00 | (2,960,100) | (100) | (3,200) | ||||||
Expiration: 12/27/2024; Exercise Price: $325.00 | (2,960,100) | (100) | (1,000) | ||||||
Expiration: 01/03/2025; Exercise Price: $315.00 | (2,960,100) | (100) | (6,900) | ||||||
Expiration: 01/17/2025; Exercise Price: $315.00 | (1,776,060) | (60) | (8,040) | ||||||
Merck & Co., Inc. | |||||||||
Expiration: 12/06/2024; Exercise Price: $115.00 | (254,100) | (25) | (388) | ||||||
Expiration: 12/20/2024; Exercise Price: $115.00 | (254,100) | (25) | (125) | ||||||
Expiration: 12/27/2024; Exercise Price: $110.00 | (406,560) | (40) | (840) | ||||||
Expiration: 01/17/2025; Exercise Price: $110.00 | (304,920) | (30) | (2,430) | ||||||
7 |
Notional Amount | Contracts | Value | |||||||
WRITTEN OPTIONS - (Continued) | |||||||||
Call Options - (Continued) | |||||||||
NextEra Energy, Inc. | |||||||||
Expiration: 12/06/2024; Exercise Price: $80.00 | $(78,670) | (10) | $(490) | ||||||
Expiration: 12/13/2024; Exercise Price: $80.00 | (157,340) | (20) | (2,000) | ||||||
Expiration: 12/20/2024; Exercise Price: $82.50 | (78,670) | (10) | (580) | ||||||
Expiration: 01/17/2025; Exercise Price: $85.00 | (157,340) | (20) | (1,850) | ||||||
Oracle Corp., Expiration: 12/06/2024; Exercise Price: $192.50 | (369,680) | (20) | (780) | ||||||
RTX Corp., Expiration: 12/06/2024; Exercise Price: $123.00 | (243,660) | (20) | (1,540) | ||||||
Southern Co. | |||||||||
Expiration: 12/06/2024; Exercise Price: $91.00 | (445,650) | (50) | (450) | ||||||
Expiration: 12/13/2024; Exercise Price: $91.00 | (445,650) | (50) | (1,000) | ||||||
Expiration: 12/20/2024; Exercise Price: $91.00 | (445,650) | (50) | (6,250) | ||||||
Total Call Options | (76,188) | ||||||||
Put Options | |||||||||
Caterpillar, Inc., Expiration: 12/06/2024; Exercise Price: $380.00 | (406,110) | (10) | (190) | ||||||
Chevron Corp. | |||||||||
Expiration: 12/06/2024; Exercise Price: $160.00 | (809,650) | (50) | (3,350) | ||||||
Expiration: 12/13/2024; Exercise Price: $160.00 | (161,930) | (10) | (1,250) | ||||||
Exxon Mobil Corp., Expiration: 12/06/2024; Exercise Price: $120.00 | (294,900) | (25) | (5,925) | ||||||
Honeywell International, Inc., Expiration: 12/06/2024; Exercise Price: $230.00 | (465,860) | (20) | (2,600) | ||||||
Philip Morris International, Inc. | |||||||||
Expiration: 12/06/2024; Exercise Price: $128.00 | (133,060) | (10) | (110) | ||||||
Expiration: 12/13/2024; Exercise Price: $126.00 | (133,060) | (10) | (575) | ||||||
Expiration: 12/13/2024; Exercise Price: $127.00 | (133,060) | (10) | (300) | ||||||
Expiration: 12/20/2024; Exercise Price: $126.00 | (133,060) | (10) | (450) | ||||||
Expiration: 12/20/2024; Exercise Price: $127.00 | (266,120) | (20) | (1,020) | ||||||
Expiration: 12/27/2024; Exercise Price: $127.00 | (266,120) | (20) | (2,450) | ||||||
Total Put Options | (18,220) | ||||||||
TOTAL WRITTEN OPTIONS (Premiums received $110,766) | $(94,408) | ||||||||
(a) | 100 shares per contract. |
(b) | Non-income producing security. |
8 |
Shares | Value | |||||
COMMON STOCKS - 87.0% | ||||||
Aerospace & Defense - 1.8% | ||||||
Woodward, Inc.(a) | 1,222 | $220,351 | ||||
Banks - 17.9% | ||||||
Bank of NT Butterfield & Son Ltd.(a)(c) | 7,535 | 285,802 | ||||
BankUnited, Inc. | 1,900 | 79,933 | ||||
East West Bancorp, Inc.(a)(c) | 3,522 | 386,293 | ||||
ESSA Bancorp, Inc. | 3,800 | 78,546 | ||||
First Horizon Corp. | 100 | 2,113 | ||||
HarborOne Bancorp, Inc. | 5,950 | 76,636 | ||||
Kearny Financial Corp./MD | 9,600 | 76,032 | ||||
Metrocity Bankshares, Inc.(a) | 8,615 | 295,839 | ||||
Pinnacle Financial Partners, Inc.(a) | 2,544 | 323,368 | ||||
Popular, Inc.(a) | 1,336 | 132,745 | ||||
Preferred Bank/Los Angeles CA(a) | 3,717 | 350,625 | ||||
Western Alliance Bancorp(a) | 1,577 | 147,623 | ||||
2,235,555 | ||||||
Beverages - 0.0%(e) | ||||||
Celsius Holdings, Inc.(d) | 120 | 3,414 | ||||
Capital Markets - 4.7% | ||||||
AllianceBernstein Holding LP(a)(c) | 5,265 | 190,962 | ||||
Jefferies Financial Group, Inc.(a) | 2,641 | 209,009 | ||||
Lazard, Inc.(a) | 3,250 | 188,727 | ||||
588,698 | ||||||
Chemicals - 6.4% | ||||||
AdvanSix, Inc.(a) | 9,976 | 323,921 | ||||
Avient Corp.(a)(c) | 5,389 | 276,186 | ||||
Element Solutions, Inc.(a) | 7,098 | 203,571 | ||||
803,678 | ||||||
Consumer Finance - 1.6% | ||||||
SLM Corp.(a)(c) | 7,161 | 196,068 | ||||
Consumer Staples Distribution & Retail - 3.2% | ||||||
Casey’s General Stores, Inc.(a) | 953 | 401,108 | ||||
Diversified REITs - 1.5% | ||||||
Essential Properties Realty Trust, Inc.(a) | 5,580 | 190,278 | ||||
Electric Utilities - 1.9% | ||||||
Portland General Electric Co.(a) | 5,009 | 240,031 | ||||
Financial Services - 1.6% | ||||||
Mr Cooper Group, Inc.(a)(d) | 1,248 | 123,140 | ||||
Waterstone Financial, Inc. | 5,100 | 76,959 | ||||
200,099 | ||||||
9 |
Shares | Value | |||||
COMMON STOCKS - (Continued) | ||||||
Health Care REITs - 1.1% | ||||||
Community Healthcare Trust, Inc.(a) | 7,425 | $140,332 | ||||
Hotel & Resort REITs - 1.4% | ||||||
Park Hotels & Resorts, Inc.(a) | 10,825 | 168,329 | ||||
Hotels, Restaurants & Leisure - 1.5% | ||||||
Bloomin’ Brands, Inc.(a) | 13,108 | 182,726 | ||||
Industrial REITs - 2.8% | ||||||
Rexford Industrial Realty, Inc.(a) | 5,186 | 218,227 | ||||
STAG Industrial, Inc.(a)(c) | 3,696 | 135,976 | ||||
354,203 | ||||||
Insurance - 0.0%(e) | ||||||
Assurant, Inc. | 16 | 3,634 | ||||
Media - 1.8% | ||||||
New York Times Co. - Class A(a) | 4,105 | 222,737 | ||||
Mortgage REITs - 3.6% | ||||||
AGNC Investment Corp.(a) | 23,135 | 223,484 | ||||
Rithm Capital Corp.(a) | 20,348 | 228,915 | ||||
452,399 | ||||||
Multi-Utilities - 1.1% | ||||||
Algonquin Power & Utilities Corp.(a) | 26,375 | 130,556 | ||||
Office REITs - 2.1% | ||||||
Kilroy Realty Corp.(a)(c) | 6,237 | 259,023 | ||||
Oil, Gas & Consumable Fuels - 12.4% | ||||||
Chord Energy Corp.(a) | 2,437 | 310,766 | ||||
Delek Logistics Partners LP(a) | 6,282 | 253,416 | ||||
Murphy Oil Corp.(a) | 9,654 | 313,465 | ||||
Plains GP Holdings LP(a)(c) | 16,587 | 332,072 | ||||
SM Energy Co.(a) | 7,408 | 334,768 | ||||
1,544,487 | ||||||
Real Estate Management & Development - 1.1% | ||||||
Marcus & Millichap, Inc.(a) | 3,250 | 135,233 | ||||
Retail REITs - 3.5% | ||||||
Brixmor Property Group, Inc.(a)(c) | 8,316 | 250,062 | ||||
NETSTREIT Corp.(a)(c) | 11,758 | 190,597 | ||||
440,659 | ||||||
Semiconductors & Semiconductor Equipment - 3.0% | ||||||
MKS Instruments, Inc.(a) | 3,289 | 373,762 | ||||
10 |
Shares | Value | |||||
COMMON STOCKS - (Continued) | ||||||
Specialized REITs - 1.2% | ||||||
Safehold, Inc.(a) | 6,718 | $143,496 | ||||
Textiles, Apparel & Luxury Goods - 3.2% | ||||||
Tapestry, Inc. | 6,330 | 394,232 | ||||
Trading Companies & Distributors - 6.6% | ||||||
GATX Corp.(a) | 2,368 | 388,731 | ||||
Herc Holdings, Inc.(a)(c) | 1,884 | 437,088 | ||||
825,819 | ||||||
TOTAL COMMON STOCKS (Cost $9,853,895) | 10,850,907 | |||||
PREFERRED STOCKS - 22.5% | ||||||
Banks - 5.0% | ||||||
Banc of California, Inc., Series F, 7.75% to 09/01/2027 then 5 yr. CMT Rate + 4.82%, Perpetual Maturity(a)(c)(f) | 8,646 | 216,150 | ||||
Flagstar Financial, Inc., Series A., 6.38% to 03/17/2027 then 3 mo. SOFR + 3.82%, Perpetual Maturity(f) | 15,626 | 348,928 | ||||
Valley National Bancorp, Series A, 6.25% to 06/30/2025 then 3 mo. SOFR + 3.85%, Perpetual Maturity(a)(c)(f) | 2,226 | 56,051 | ||||
621,129 | ||||||
Commercial Services & Supplies - 0.9% | ||||||
Pitney Bowes, Inc. 6.70%, 03/07/2043(a) | 5,409 | 108,234 | ||||
Consumer Finance - 2.3% | ||||||
Atlanticus Holdings Corp. Series *, 9.25%, 01/31/2029(a) | 11,376 | 283,831 | ||||
Diversified REITs - 1.8% | ||||||
Global Net Lease, Inc. Series A, 7.25%, Perpetual Maturity(a) | 9,438 | 218,962 | ||||
Health Care REITs - 0.4% | ||||||
Diversified Healthcare Trust 5.63%, 08/01/2042(a) | 3,458 | 51,386 | ||||
Mortgage REITs - 9.3% | ||||||
AG Mortgage Investment Trust, Inc. Series B, 8.00%, Perpetual Maturity(a) | 14,601 | 317,718 | ||||
AGNC Investment Corp. Series D, 9.25% (3 mo. Term SOFR + 4.59%), Perpetual Maturity(a)(c)(f) | 7,821 | 199,122 | ||||
Chimera Investment Corp. | ||||||
Series A, 8.00%, Perpetual Maturity(a) | 9,380 | 225,026 | ||||
Series B, 10.66% (3 mo. Term SOFR + 6.05%), Perpetual Maturity(a)(f) | 8,695 | 219,375 | ||||
Rithm Capital Corp., Series D, 7.00% to 11/15/2026 then 5 yr. CMT Rate + 6.22%, Perpetual Maturity(a)(c)(f) | 8,514 | 203,570 | ||||
1,164,811 | ||||||
Office REITs - 2.0% | ||||||
Vornado Realty Trust Series L, 5.40%, Perpetual Maturity(a) | 13,740 | 250,206 | ||||
11 |
Shares | Value | |||||
PREFERRED STOCKS - (Continued) | ||||||
Trust, Fiduciary, and Custody Activities - 0.8% | ||||||
SCE Trust IV, Series J, 5.38% to 09/15/2025 then 3 mo. Term SOFR + 3.39%, Perpetual Maturity(a)(c)(f) | 4,234 | $105,130 | ||||
TOTAL PREFERRED STOCKS (Cost $2,649,907) | 2,803,689 | |||||
CONVERTIBLE PREFERRED STOCKS - 9.0% | ||||||
Financial Services - 3.8% | ||||||
Apollo Global Management, Inc. 6.75%, 07/31/2026 | 5,103 | 472,946 | ||||
Machinery - 3.8% | ||||||
Chart Industries, Inc. Series B, 6.75%, 12/15/2025(a)(c) | 6,557 | 471,842 | ||||
Technology Hardware, Storage & Peripherals - 1.4% | ||||||
Hewlett Packard Enterprise Co. 7.63%, 09/01/2027(a) | 2,874 | 177,785 | ||||
TOTAL CONVERTIBLE PREFERRED STOCKS (Cost $847,787) | 1,122,573 | |||||
EXCHANGE TRADED FUNDS - 8.0% | ||||||
iShares Russell 2000 ETF(a)(b) | 4,133 | 999,649 | ||||
TOTAL EXCHANGE TRADED FUNDS (Cost $905,006) | 999,649 | |||||
TOTAL INVESTMENTS - 126.5% (Cost $14,256,595) | $15,776,818 | |||||
Liabilities in Excess of Other Assets - (26.5)% | (3,300,588) | |||||
TOTAL NET ASSETS - 100.0% | $12,476,230 | |||||
(a) | All or a portion of security has been committed as collateral for a borrowing facility. The total value of assets committed as collateral as of November 30, 2024 is $11,487,954. |
(b) | Held in connection with written option contracts. See Schedule of Written Options for further information. |
(c) | All or a portion of security has been committed as collateral for open written options contracts. The total value of assets committed as collateral as of November 30, 2024 is $695,925. |
(d) | Non-income producing security. |
(e) | Represents less than 0.05% of net assets. |
(f) | This security represents a fixed to float/variable rate preferred stock. The coupon rate shown represents the fixed rate as of November 30, 2024. |
12 |
Notional Amount | Contracts(a) | Value | |||||||
WRITTEN OPTIONS(b) | |||||||||
Call Options | |||||||||
iShares Russell 2000 ETF | |||||||||
Expiration: 12/06/2024; Exercise Price: $250.00 | $(241,870) | (10) | $(500) | ||||||
Expiration: 12/06/2024; Exercise Price: $255.00 | (241,870) | (10) | (110) | ||||||
Expiration: 12/13/2024; Exercise Price: $260.00 | (241,870) | (10) | (220) | ||||||
Expiration: 12/13/2024; Exercise Price: $262.00 | (362,805) | (15) | (225) | ||||||
Expiration: 12/20/2024; Exercise Price: $255.00 | (241,870) | (10) | (1,140) | ||||||
Expiration: 12/20/2024; Exercise Price: $265.00 | (362,805) | (15) | (450) | ||||||
Expiration: 12/27/2024; Exercise Price: $258.00 | (241,870) | (10) | (1,070) | ||||||
Expiration: 12/27/2024; Exercise Price: $270.00 | (362,805) | (15) | (345) | ||||||
Expiration: 01/03/2025; Exercise Price: $265.00 | (241,870) | (10) | (630) | ||||||
Expiration: 01/03/2025; Exercise Price: $270.00 | (241,870) | (10) | (400) | ||||||
Total Call Options | (5,090) | ||||||||
TOTAL WRITTEN OPTIONS (Premiums received $5,716) | $(5,090) | ||||||||
(a) | 100 shares per contract. |
(b) | Non-income producing security. |
13 |
InfraCap Equity Income Fund ETF | InfraCap Small Cap Income ETF | |||||
ASSETS: | ||||||
Investments, at value | $78,379,947 | $15,776,818 | ||||
Cash | 1,782,967 | 178,684 | ||||
Receivable for investments sold | 901,150 | — | ||||
Dividends and interest receivable | 247,931 | 35,817 | ||||
Deposit at broker for written option contracts | — | 5,712 | ||||
Total assets | 81,311,995 | 15,997,031 | ||||
LIABILITIES: | ||||||
Written option contracts, at value | 94,408 | 5,090 | ||||
Loans payable | 19,258,928 | 3,498,341 | ||||
Payable for investments purchased | 812,800 | — | ||||
Due to broker for written option contracts | 204,457 | — | ||||
Accrued loan interest | 77,384 | 15,228 | ||||
Payable to Adviser | 32,121 | 2,047 | ||||
Accrued broker interest | 17,259 | 95 | ||||
Total liabilities | 20,497,357 | 3,520,801 | ||||
NET ASSETS | $60,814,638 | $12,476,230 | ||||
Net Assets Consists of: | ||||||
Paid-in capital | $57,100,519 | $10,893,585 | ||||
Total distributable earnings | 3,714,119 | 1,582,645 | ||||
Total net assets | $60,814,638 | $12,476,230 | ||||
Shares issued and outstanding(a) | 2,150,000 | 330,000 | ||||
Net asset value per share | $28.29 | $37.81 | ||||
Cost: | ||||||
Investments, at cost | $73,616,864 | $14,256,595 | ||||
Proceeds: | ||||||
Written options premium | $110,766 | $5,716 | ||||
(a) | Unlimited shares authorized without par value. |
14 |
InfraCap Equity Income Fund ETF | InfraCap Small Cap Income ETF(a) | |||||
INVESTMENT INCOME: | ||||||
Dividend income | $2,766,717 | $297,945 | ||||
Less: Dividend withholding taxes | (36,877) | (2,198) | ||||
Less: Issuance fees | (3,350) | — | ||||
Interest income | 21,981 | 2,730 | ||||
Total investment income | 2,748,471 | 298,477 | ||||
EXPENSES: | ||||||
Loan interest expense (See Note 8) | 1,039,626 | 74,138 | ||||
Investment advisory fee (See Note 3) | 429,563 | 52,889 | ||||
Broker interest expense | 245,152 | 1,327 | ||||
Other expenses | 561 | — | ||||
Total expenses | 1,714,902 | 128,354 | ||||
Net investment income | 1,033,569 | 170,123 | ||||
REALIZED AND change in unrealized gain/(loss) on investments: | ||||||
Net realized gain/(loss) from: | ||||||
Investments | 3,821,260 | 350,936 | ||||
In-kind redemptions | 615,334 | 279,332 | ||||
Written option contracts expired or closed | 666,141 | (27,390) | ||||
Securities sold short | 13 | — | ||||
Net realized gain | 5,102,748 | 602,878 | ||||
Net change in unrealized appreciation/depreciation on: | ||||||
Investments | 9,624,261 | 1,520,223 | ||||
Written option contracts | 61,691 | 626 | ||||
Net change in unrealized appreciation/depreciation | 9,685,952 | 1,520,849 | ||||
Net realized and unrealized gain | 14,788,700 | 2,123,727 | ||||
NET INCREASE IN NET ASSETS RESULTING FROM OPERATIONS | $15,822,269 | $2,293,850 | ||||
(a) | Commencement date of the Fund was December 11, 2023. |
15 |
InfraCap Equity Income Fund ETF | InfraCap Small Cap Income ETF | ||||||||
Year Ended November 30, | Period Ended November 30, 2024(a) | ||||||||
2024 | 2023 | ||||||||
OPERATIONS: | |||||||||
Net investment income | $1,033,569 | $1,970,824 | $170,123 | ||||||
Net realized gain/(loss) | 5,102,748 | (3,039,304) | 602,878 | ||||||
Net change in unrealized appreciation/(depreciation) | 9,685,952 | (2,359,308) | 1,520,849 | ||||||
Net increase/(decrease) in net assets from operations | 15,822,269 | (3,427,788) | 2,293,850 | ||||||
DISTRIBUTIONS TO SHAREHOLDERS: | |||||||||
From distributable earnings (See Note 4) | (3,140,035) | (2,221,837) | (428,525) | ||||||
From return of capital (See Note 4) | (1,467,965) | (1,956,746) | — | ||||||
Total distributions to shareholders | (4,608,000) | (4,178,583) | (428,525) | ||||||
CAPITAL TRANSACTIONS: | |||||||||
Subscriptions | 5,150,723 | 28,822,965 | 14,195,960 | ||||||
Redemptions | (4,446,940) | (1,936,460) | (3,585,055) | ||||||
Net increase in net assets from capital transactions | 703,783 | 26,886,505 | 10,610,905 | ||||||
Net increase in net assets | 11,918,052 | 19,280,134 | 12,476,230 | ||||||
NET ASSETS: | |||||||||
Beginning of the period | 48,896,586 | 29,616,452 | — | ||||||
End of the period | $60,814,638 | $48,896,586 | $12,476,230 | ||||||
SHARES TRANSACTIONS | |||||||||
Subscriptions | 200,000 | 1,100,000 | 440,000 | ||||||
Redemptions | (175,000) | (75,000) | (110,000) | ||||||
Total increase in shares outstanding | 25,000 | 1,025,000 | 330,000 | ||||||
(a) | Commencement date of the Fund was December 11, 2023. |
16 |
InfraCap Equity Income Fund ETF | InfraCap Small Cap Income ETF(a) | |||||
CASH FLOWS FROM OPERATING ACTIVITIES: | ||||||
Net increase in net assets resulting from operations | $15,822,269 | $2,293,850 | ||||
Adjustments to reconcile net increase in net assets from operations to net cash used in operating activities: | ||||||
Purchases of investments | (149,864,123) | (28,907,848) | ||||
Purchases of short-term investments, net | 367,302 | — | ||||
Proceeds from sales of investments | 149,931,899 | 15,281,521 | ||||
Increase in receivable for investments sold | (850,078) | — | ||||
Increase in payable to Adviser | 4,839 | 2,047 | ||||
(Increase) decrease in dividends and interest receivable | 167,132 | (35,817) | ||||
Purchases to cover securities sold short | (2,462) | — | ||||
Premiums received on written option contracts | 1,942,319 | 37,453 | ||||
Written option contracts expired or closed | (1,004,468) | (59,127) | ||||
Decrease in payable for investments purchased | (110,438) | — | ||||
(Decrease) increase in accrued expenses and other liabilities | (14,812) | 15,323 | ||||
Net realized gain on investments | (3,821,260) | (350,936) | ||||
Net realized gain on securities sold short | (13) | — | ||||
Net realized (gain) loss on written option contracts | (666,141) | 27,390 | ||||
Net realized gain on redemptions in-kind | (615,334) | (279,332) | ||||
Change in unrealized appreciation/depreciation on investments | (9,624,300) | (1,520,223) | ||||
Change in unrealized appreciation/depreciation on written option contracts | (61,691) | (626) | ||||
Net cash from operating activities | 1,600,640 | (13,496,325) | ||||
CASH FLOWS FROM FINANCING ACTIVITIES: | ||||||
Proceeds from shares sold, net of change in receivable for Fund shares sold | 5,150,723 | 14,195,960 | ||||
Payment for shares redeemed | (4,446,940) | (3,585,055) | ||||
Cash distributions paid to shareholders, net of reinvestments | (4,608,000) | (428,525) | ||||
Loan borrowings | 52,295,138 | 7,740,299 | ||||
Loan repayments | (48,499,999) | (4,241,958) | ||||
Net cash provided by financing activities | (109,078) | 13,680,721 | ||||
Net change in cash | 1,491,562 | 184,396 | ||||
CASH AND RESTRICTED CASH: | ||||||
Beginning Balance | 86,948 | — | ||||
Ending Balance | $1,578,510 | $184,396 | ||||
SUPPLEMENTAL DISCLOSURES: | ||||||
Broker expense on written options | 260,452 | 1,232 | ||||
Cash paid for loan interest expense | 1,039,138 | 58,910 | ||||
RECONCILIATION OF RESTRICTED AND UNRESTRICTED CASH AT THE BEGINNING OF PERIOD TO THE STATEMENT OF ASSETS AND LIABILITIES | ||||||
Cash | 30,978 | — | ||||
Deposits at broker for written options contracts | 55,970 | — | ||||
17 |
InfraCap Equity Income Fund ETF | InfraCap Small Cap Income ETF(a) | |||||
RECONCILIATION OF RESTRICTED AND UNRESTRICTED CASH AT THE END OF PERIOD TO THE STATEMENT OF ASSETS AND LIABILITIES | ||||||
Cash | $ 1,782,967 | $ 178,684 | ||||
Deposits at broker for written options contracts | — | 5,712 | ||||
Due to broker for written options contracts | (204,457) | — | ||||
(a) | Commencement date of the Fund was December 11, 2023. |
18 |
Year Ended November 30, | For the Period Inception through November, 30, 2022(a) | ||||||||
2024 | 2023 | ||||||||
PER SHARE DATA: | |||||||||
Net asset value, beginning of period | $23.01 | $26.92 | $30.00 | ||||||
INVESTMENT OPERATIONS: | |||||||||
Net investment income(b) | 0.49 | 1.08 | 1.25 | ||||||
Net realized and unrealized gain (loss) on investments | 6.97 | (2.68) | (2.41) | ||||||
Total from investment operations | 7.46 | (1.60) | (1.16) | ||||||
LESS DISTRIBUTIONS FROM: | |||||||||
Net investment income | (1.48) | (1.07) | (1.92) | ||||||
Net realized gains | — | (0.16) | — | ||||||
Return of capital | (0.70) | (1.08) | — | ||||||
Total distributions | (2.18) | (2.31) | (1.92) | ||||||
Net asset value, end of period | $28.29 | $23.01 | $26.92 | ||||||
Total return, at NAV(c) | 33.85% | −5.78% | −3.84% | ||||||
Total return, at market(c) | 33.89% | −5.37% | −4.08% | ||||||
SUPPLEMENTAL DATA AND RATIOS: | |||||||||
Net assets, end of period (in thousands) | $60,815 | $48,897 | $29,616 | ||||||
Ratio of gross expenses to average net assets(d) | 3.19% | 2.96% | 1.71% | ||||||
Ratio of broker interest expense to average net assets(d) | 2.39% | 2.16% | 0.91% | ||||||
Ratio of operational expenses to average net assets excluding broker interest expense(d) | 0.80% | 0.80% | 0.80% | ||||||
Ratio of net investment income to average net assets(d) | 1.92% | 4.54% | 4.89% | ||||||
Portfolio turnover rate(c)(e)(f) | 207% | 144% | 87% | ||||||
(a) | Commencement date of the Fund was December 28, 2021. |
(b) | Calculated based on average shares outstanding during the period. |
(c) | Not annualized for periods less than one year. |
(d) | Annualized for periods less than one year. |
(e) | Excludes in-kind transactions associated with creations of the Fund. |
(f) | The numerator for the portfolio turnover rate includes the lesser of purchases or sales (excluding short-term investments, written option contracts and in-kind transactions associated with the creation units and redemptions). The denominator includes the average fair value of long positions throughout the period. |
19 |
For the Period Inception through November, 30, 2024(a) | |||
PER SHARE DATA: | |||
Net asset value, beginning of period | $30.14 | ||
INVESTMENT OPERATIONS: | |||
Net investment income(b)(c) | 0.85 | ||
Net realized and unrealized gain on investments | 8.88 | ||
Total from investment operations | 9.73 | ||
LESS DISTRIBUTIONS FROM: | |||
Net investment income | (2.06) | ||
Total distributions | (2.06) | ||
Net asset value, end of period | $37.81 | ||
Total return, at NAV(d) | 33.28% | ||
Total return, at market(d) | 33.49% | ||
SUPPLEMENTAL DATA AND RATIOS: | |||
Net assets, end of period (in thousands) | $12,476 | ||
Ratio of expenses to average net assets(e)(f) | 1.94% | ||
Ratio of broker interest expense to average net assets(e)(f) | 1.14% | ||
Ratio of operational expenses to average net assets excluding broker interest expense (e)(f) | 0.80% | ||
Ratio of net investment income to average net assets(e)(f) | 2.57% | ||
Portfolio turnover rate(d)(g)(h) | 139% | ||
(a) | Commencement date of the Fund was December 11, 2023. |
(b) | Calculated based on average shares outstanding during the period. |
(c) | Recognition of net investment income by the Fund is affected by the timing of the declaration of dividends by the underlying exchange traded funds in which the Fund invests. The ratio does not include net investment income of the exchange traded funds in which the Fund invests. |
(d) | Not annualized. |
(e) | Annualized. |
(f) | These ratios exclude the impact of expenses of the underlying exchange traded funds as represented in the Schedule of Investments. Recognition of net investment income by the Fund is affected by the timing of the underlying exchange traded funds in which the Fund invests. |
(g) | Excludes in-kind transactions associated with creations of the Fund. |
(h) | The numerator for the portfolio turnover rate includes the lesser of purchases or sales (excluding short-term investments, written option contracts and in-kind transactions associated with the creation units and redemptions). The denominator includes the average fair value of long positions throughout the period. |
20 |
| A. | Investment Valuation – The following is a summary of the Funds’ pricing procedures. It is intended to be a general discussion and may not necessarily reflect all the pricing procedures followed by the Funds. Equity securities, including common stocks, convertible preferred stocks, preferred stocks, and real estate investment trusts (“REITS”) that are traded on a national securities exchange, except those listed on the Nasdaq Global Market®, Nasdaq Global Select Market® and the Nasdaq Capital Market® exchanges (collectively “Nasdaq”), are valued at the last reported sale price on that exchange on which the security is principally traded. Securities traded on Nasdaq will be valued at the Nasdaq Official Closing Price (“NOCP”). If, on a particular day, an exchange traded or Nasdaq security does not trade, then the mean between the most recent quoted bid and asked prices will be used. All equity securities that are not traded on a listed exchange are valued at the last sale price in the over-the-counter market. If a non-exchange traded |
21 |
| Level 1 – | Unadjusted quoted prices in active markets for identical assets or liabilities that the Funds have the ability to access. |
| Level 2 – | Observable inputs other than quoted prices included in Level 1 that are observable for the asset or liability, either directly or indirectly. These inputs may include quoted prices for the identical instrument on an inactive market, prices for similar instruments, interest rates, prepayment speeds, credit risk, yield curves, default rates and similar data. |
| Level 3 – | Unobservable inputs for the asset or liability, to the extent relevant observable inputs are not available, representing the Funds’ own assumptions about the assumptions a market participant would use in valuing the asset or liability, and would be based on the best information available. |
22 |
Level 1 | Level 2 | Level 3 | Total | |||||||||
Assets: | ||||||||||||
Investments: | ||||||||||||
Common Stocks | $64,220,129 | $— | $— | $64,220,129 | ||||||||
Preferred Stocks | 9,560,951 | 995,520 | — | 10,556,471 | ||||||||
Convertible Preferred Stocks | 3,603,347 | — | — | 3,603,347 | ||||||||
Total Investments | $77,384,427 | $995,520 | $— | $78,379,947 | ||||||||
Liabilities: | ||||||||||||
Investments: | ||||||||||||
Written Options | $(64,370) | $(30,038) | $— | $(94,408) | ||||||||
Total Investments | $(64,370) | $(30,038) | $— | $(94,408) | ||||||||
Level 1 | Level 2 | Level 3 | Total | |||||||||
Assets: | ||||||||||||
Investments: | ||||||||||||
Common Stocks | $10,850,907 | $— | $— | $10,850,907 | ||||||||
Preferred Stocks | 2,803,689 | — | — | 2,803,689 | ||||||||
Convertible Preferred Stocks | 1,122,573 | — | — | 1,122,573 | ||||||||
Exchange Traded Funds | 999,649 | — | — | 999,649 | ||||||||
Total Investments | $15,776,818 | $— | $— | $15,776,818 | ||||||||
Liabilities: | ||||||||||||
Investments: | ||||||||||||
Written Options | $(4,865) | $(225) | $— | $(5,090) | ||||||||
Total Investments | $(4,865) | $(225) | $— | $(5,090) | ||||||||
| B. | Transactions with Brokers – The Funds’ written options contracts’ cash deposits are monitored daily by the Adviser and counterparty. Cash deposits by the Funds are presented as “deposits at broker for written option contracts” on the Statement of Assets and Liabilities. These transactions may involve market risk in excess of the assets or liabilities reflected on the Statement of Assets and Liabilities. |
| C. | Cash and Cash Equivalents – The Funds consider highly liquid short-term fixed income investments purchased with an original maturity of less than three months and money market funds to be cash equivalents. Cash equivalents are included in short term investments on the Schedule of Investments as well as in investments on the Statement of Assets and Liabilities. Any temporary cash overdrafts are reported as a payable to custodian. |
23 |
| D. | Foreign Securities and Currency Translation – Investment securities and other assets and liabilities denominated in foreign currencies are translated into U.S. dollar amounts at the date of valuation. Purchases and sales of investment securities and income and expense items denominated in foreign currencies are translated into U.S. dollar amounts on the respective dates of such transactions. The Funds do not isolate the portion of the results of operations from changes in foreign exchange rates on investments from the fluctuations arising from changes in market prices of securities held. Reported net realized foreign exchange gains or losses arise from sales of foreign currencies, and the difference between the amounts of dividends, interest, and foreign withholding taxes recorded on the Funds’ books and the U.S. dollar equivalent of the amounts actually received or paid. Net unrealized foreign exchange gains and losses arise from changes in the fair values of assets and liabilities, other than investments in securities at fiscal year- end, resulting from changes in exchange rates. |
| E. | Written Option Contracts – The Funds are subject to equity price risk in the normal course of pursuing their investment objectives. The Adviser may write put and call options in an effort to (i) generate additional income and reduce volatility in the portfolio, (ii) remove or add securities from the portfolio (i.e., convertible securities), (iii) facilitate total return opportunities, and (iv) hedge against market risks or other risks in the Funds’ portfolio. When a Fund writes (sells) an option, an amount equal to the premium received by the Fund is included in the Statement of Assets and Liabilities as an asset and an equivalent liability. The amount of the liability is subsequently priced daily to reflect the current value of the option written. Refer to Note 2 A. for a pricing description. By writing an option, the Fund may become obligated during the term of the option to deliver or purchase the securities underlying the option at the exercise price if the option is exercised. These contracts may involve market risk in excess of the amounts receivable or payable reflected on the Statement of Assets and Liabilities. Refer to Note 2 K. for further derivative disclosures and Note 2 I. for further counterparty risk disclosure. |
| F. | Guarantees and Indemnifications – In the normal course of business, the Funds enter into contracts with service providers that contain general indemnification clauses. The Funds’ maximum exposure under these arrangements is unknown, as this would involve future claims that may be made against the Funds that have not yet occurred. |
| G. | Security Transactions, Income and Expenses – The Funds follow industry practice and record security transactions on the trade date. Realized gains and losses on sales of securities are calculated on the basis of identified cost. Dividend income is recorded on the ex-dividend date and interest income and expense is recorded on an accrual basis. Withholding taxes on foreign dividends have been provided for in accordance |
24 |
| H. | Share Valuation – The NAVs per share of the Funds are calculated by dividing the sum of the value of the securities held by the Fund, plus cash or other assets, minus all liabilities (including estimated accrued expenses) by the total number of shares outstanding for the Fund, rounded to the nearest cent. The Funds’ shares will not be priced on days which the New York Stock Exchange (“NYSE”) is closed for trading. |
| I. | Counterparty Risk – The Funds help manage counterparty credit risk by entering into agreements only with counterparties the Adviser believes have the financial resources to honor their obligations. The Adviser considers the credit worthiness of each counterparty to a contract in evaluating potential credit risk. Written options contracts sold on an exchange do not expose the Funds to counterparty risk; the exchange’s clearinghouse guarantees the options against counterparty nonperformance. Over-the-counter options counterparty risk includes the risk of loss of the full amount of any net unrealized appreciation. |
| J. | Use of Estimates – The preparation of financial statements in conformity with GAAP requires management to make estimates and assumptions that affect the reported amounts of assets and liabilities and disclosure of contingent assets and liabilities at the date of the financial statements and the reported amounts of income and expenses during the reporting period. Actual results could differ from those estimates. |
| K. | Derivatives – The Funds may utilize derivative instruments such as options and other instruments with similar characteristics to the extent that they are consistent with the Funds’ respective investment objectives and limitations. The use of these instruments may involve additional investment risks, including the possibility of illiquid markets or imperfect correlation between the value of the instruments and the underlying securities. Derivatives also may create leverage which will amplify the effect of their performance on the Funds and may produce significant losses. Refer to Note 9 for further derivative disclosure. |
Average Quantity | Average Notional Amount | |||||
InfraCap Equity Income Fund ETF | ||||||
Written Option Contracts | 3,152 | $36,628,213 | ||||
InfraCap Small Cap Income ETF | ||||||
Written Option Contracts | 75 | $1,636,504 | ||||
25 |
InfraCap Equity Income Fund ETF | InfraCap Small Cap Income ETF | ||||||||||||||
Statements of Assets and Liabilities Location | Fair Value | Fair Value | |||||||||||||
Assets | Liabilities | Assets | Liabilities | ||||||||||||
Written Option Contracts: | |||||||||||||||
Equity | Written option contracts, at value | $ — | $94,408 | $ — | $5,090 | ||||||||||
Total fair values of derivative instruments | $— | $94,408 | $— | $5,090 | |||||||||||
InfraCap Equity Income Fund ETF Net Realized Gain on Derivatives | InfraCap Small Cap Income ETF Net Realized Loss on Derivatives | |||||||||||
Derivatives | Written Option Contracts | Total | Written Option Contracts | Total | ||||||||
Equity Contracts | $666,141 | $666,141 | $(27,390) | $(27,390) | ||||||||
Total | $666,141 | $666,141 | $(27,390) | $(27,390) | ||||||||
Net Change in Unrealized Appreciation (Depreciation) on Derivatives | Net Change in Unrealized Appreciation (Depreciation) on Derivatives | |||||||||||
Derivatives | Written Option Contracts | Total | Written Option Contracts | Total | ||||||||
Equity Contracts | $61,691 | $61,691 | $626 | $626 | ||||||||
Total | $61,691 | $61,691 | $626 | $626 | ||||||||
26 |
InfraCap Equity Income Fund ETF | InfraCap Small Cap Income ETF | |||||
Tax cost of Investments* | $74,476,311 | $14,269,638 | ||||
Gross unrealized appreciation | $8,834,219 | $1,873,966 | ||||
Gross unrealized depreciation | (5,025,060) | (371,876) | ||||
Net unrealized appreciation (depreciation)** | 3,809,159 | 1,502,090 | ||||
Undistributed ordinary income | — | 82,182 | ||||
Undistributed long-term capital gains | — | 5,207 | ||||
Other accumulated losses | (95,040) | (6,834) | ||||
Total distributable earnings | $3,714,119 | $1,582,645 | ||||
| * | Tax cost of investments differs from book cost of investments due to wash sales and partnerships. |
| ** | Net unrealized appreciation (depreciation) is inclusive of unrealized appreciation (depreciation) on the Funds’ written option positions. |
27 |
Distributable Earnings | Paid-In Capital | |||||
InfraCap Equity Income Fund ETF | $(637,047) | $637,047 | ||||
InfraCap Small Cap Income Fund ETF | $(282,680) | $282,680 | ||||
Ordinary Income | Long-Term Capital Gain | Return of Capital | Total Distributions Paid | |||||||||
InfraCap Equity Income Fund ETF | ||||||||||||
November 30, 2024 | $3,140,035 | $— | $1,467,965 | $4,608,000 | ||||||||
November 30, 2023 | $2,212,284 | $9,553 | $1,956,746 | $4,178,583 | ||||||||
InfraCap Small Cap Income Fund ETF* | ||||||||||||
November 30, 2024 | $428,525 | $— | $— | $428,525 | ||||||||
| * | The Fund commenced operations on December 11, 2023. |
28 |
Purchases | Sales | Creations In-Kind | Redemptions In-Kind | |||||||||
U.S Government Securities | $— | $— | $— | $— | ||||||||
Other Securities | $143,206,785 | $143,473,296 | $6,531,583 | $5,569,340 | ||||||||
Purchases | Sales | Creations In-Kind | Redemptions In-Kind | |||||||||
U.S Government Securities | $— | $— | $— | $— | ||||||||
Other Securities | $13,141,075 | $11,681,209 | $15,766,773 | $3,550,508 | ||||||||
InfraCap Equity Income Fund ETF | InfraCap Small Cap Income ETF | |||||
Maximum borrowing | $19,881,228 | $3,601,648 | ||||
Date of maximum borrowing | July 18-22, 2024 | November 11-17, 2024 | ||||
Total interest expense | $1,039,626 | $74,138 | ||||
Weighted average interest rate | 6.28% | 6.14% | ||||
Average borrowings | $16,285,167 | $1,223,599 | ||||
29 |
Gross Amounts of Recognized Assets/ Liabilities | Gross Amounts Offset in the Statement of Assets and Liabilities | Net Amounts Presented in the Statement of Assets and Liabilities | Gross Amounts not Offset in the Statement of Assets and Liabilities | Net Amount | ||||||||||||||
Financial Instruments | Collateral Received/ Pledged* | |||||||||||||||||
InfraCap Equity Income Fund ETF | ||||||||||||||||||
Liabilities: | ||||||||||||||||||
Written Option Contracts** | $(94,408) | $ — | $(94,408) | $94,408 | $— | $ — | ||||||||||||
Total | $(94,408) | $(94,408) | $94,408 | $— | $— | |||||||||||||
InfraCap Small Cap Income ETF | ||||||||||||||||||
Liabilities: | ||||||||||||||||||
Written Option Contracts** | $(5,090) | $— | $ (5,090) | $ — | $ 5,090 | $— | ||||||||||||
Total | $(5,090) | $— | $ (5,090) | $ — | $ 5,090 | $— | ||||||||||||
| * | In some instances, the actual collateral pledged/received may be more than the amount shown as it includes securities pledged. |
| ** | As of November 30, 2024, the prime brokers for all written option contracts held by the InfraCap Equity Income Fund ETF and the InfraCap Small Cap Income ETF were Interactive Brokers, LLC and Wells Fargo Securities, LLC, respectively. |
30 |
Fund Name | Statements of Operations and Cash Flows | Statement(s) of Changes in Net Assets | Financial Highlights | ||||||
InfraCap Equity Income Fund ETF | For the year ended November 30, 2024 | For the years ended November 30, 2024 and 2023 | For the years ended November 30, 2024 and 2023 and for the period from December 28, 2021 (commencement of operations) through November 30, 2022 | ||||||
InfraCap Small Cap Income ETF | For the period from December 11, 2023 (commencement of operations) through November 30, 2024 | ||||||||

31 |
32 |
33 |
34 |
InfraCap Equity Income Fund ETF | 65.32% | ||
InfraCap Small Cap Income ETF | 33.31% | ||
InfraCap Equity Income Fund ETF | 53.97% | ||
InfraCap Small Cap Income ETF | 30.59% | ||
InfraCap Equity Income Fund ETF | 60.60% | ||
InfraCap Small Cap Income ETF | 60.30% | ||
35 |
| (b) | Financial Highlights are included within the financial statements filed under Item 7(a) of this Form. |
Item 8. Changes in and Disagreements with Accountants for Open-End Investment Companies.
There were no changes in or disagreements with accountants during the period covered by this report.
Item 9. Proxy Disclosure for Open-End Investment Companies.
There were no matters submitted to a vote of shareholders during the period covered by this report.
Item 10. Remuneration Paid to Directors, Officers, and Others of Open-End Investment Companies.
All fund expenses, including Trustee compensation, are paid by the Investment Adviser pursuant to the Investment Advisory Agreement. Additional information related to those fees is available in the Fund’s Statement of Additional Information.
Item 11. Statement Regarding Basis for Approval of Investment Advisory Contract.
See Board Consideration of Investment Advisory Agreement under Item 7(a) of this Form.
Item 12. Disclosure of Proxy Voting Policies and Procedures for Closed-End Management Investment Companies.
Not applicable to open-end investment companies.
Item 13. Portfolio Managers of Closed-End Management Investment Companies.
Not applicable to open-end investment companies.
Item 14. Purchases of Equity Securities by Closed-End Management Investment Company and Affiliated Purchasers.
Not applicable to open-end investment companies.
Item 15. Submission of Matters to a Vote of Security Holders.
There have been no material changes to the procedures by which shareholders may recommend nominees to the registrant’s board of trustees.
Item 16. Controls and Procedures.
| (a) | The Registrant’s Principal Executive Officer and Principal Financial Officer have reviewed the Registrant’s disclosure controls and procedures (as defined in Rule 30a-3(c) under the Investment Company Act of 1940 (the “Act”)) as of a date within 90 days of the filing of this report, as required by Rule 30a-3(b) under the Act and Rules 13a-15(b) or 15d-15(b) under the Securities Exchange Act of 1934. Based on their review, such officers have concluded that the disclosure controls and procedures are effective in ensuring that information required to be disclosed in this report is appropriately recorded, processed, summarized and reported and made known to them by others within the Registrant and by the Registrant’s service provider. |
| (b) | There were no changes in the Registrant’s internal control over financial reporting (as defined in Rule 30a-3(d) under the Act) that occurred during the period covered by this report that have materially affected, or are reasonably likely to materially affect, the Registrant’s internal control over financial reporting. |
Item 17. Disclosure of Securities Lending Activities for Closed-End Management Investment Companies
Not applicable to open-end investment companies.
Item 18. Recovery of Erroneously Awarded Compensation.
(a) Not Applicable
(b) Not Applicable
Item 19. Exhibits.
(2) Any policy required by the listing standards adopted pursuant to Rule 10D-1 under the Exchange Act (17 CFR 240.10D-1) by the registered national securities exchange or registered national securities association upon which the registrant’s securities are listed.
Not applicable.
(4) Any written solicitation to purchase securities under Rule 23c-1 under the Act sent or given during the period covered by the report by or on behalf of the registrant to 10 or more persons. Not applicable to open-end investment companies.
(5) Change in the registrant’s independent public accountant. Provide the information called for by Item 4 of Form 8-K under the Exchange Act (17 CFR 249.308). Unless otherwise specified by Item 4 or related to and necessary for a complete understanding of information not previously disclosed, the information should relate to events occurring during the reporting period. Not applicable to open-end investment companies.
| (b) | Certifications pursuant to Section 906 of the Sarbanes-Oxley Act of 2002. Furnished herewith. |
SIGNATURES
Pursuant to the requirements of the Securities Exchange Act of 1934 and the Investment Company Act of 1940, the registrant has duly caused this report to be signed on its behalf by the undersigned, thereunto duly authorized.
| (Registrant) | Series Portfolios Trust |
| By (Signature and Title)* | /s/ Ryan L. Roell | ||
| Ryan L. Roell, Principal Executive Officer |
| Date | February 5, 2025 |
Pursuant to the requirements of the Securities Exchange Act of 1934 and the Investment Company Act of 1940, this report has been signed below by the following persons on behalf of the registrant and in the capacities and on the dates indicated.
| By (Signature and Title)* | /s/ Ryan L. Roell | ||
| Ryan L. Roell, Principal Executive Officer |
| Date | February 5, 2025 |
| By (Signature and Title)* | /s/ Douglas Schafer | ||
| Douglas Schafer, Principal Financial Officer |
| Date | February 5, 2025 |
* Print the name and title of each signing officer under his or her signature.