Exhibit 99.1
 |
Investor Presentation
APRIL 14, 2016
0
|
Disclaimers
Except as otherwise indicated or unless the context otherwise requires, all references in this presentation to “we,” “our,” “us,” “QHC,” the “Company” or “Quorum Health” refer to Quorum Health Corporation and the combined business of the hospitals and related business operations, and Quorum Health Resources, LLC and its related business operations, that CHS will contribute to Quorum Health Corporation in connection with the proposed spin-off transaction. All references to “CHS“ refer to Community Health Systems, Inc. and its consolidated subsidiaries.
Forward-Looking Statements
This presentation contains forward-looking statements within the meaning of the Private Securities Litigation Reform Act of 1995 relating to, among other things, the proposed spin-off of Quorum Health by CHS and the future performance of Quorum Health. All statements in this presentation other than statements of historical fact, including statements regarding projections, expected operating results, expected timing of the completion of the spin-off transaction, the benefits of the spin-off transaction to either CHS or Quorum Health, the tax-free treatment of the spin-off transaction, the anticipated management of Quorum Health, the market position of Quorum Health and other events that depend upon or refer to future events or conditions or that include words such as “expects,” “anticipates,” “intends,” “plans,” “believes,” “estimates,” “thinks,” and similar expressions, are forward looking statements. Although we believe that these forward looking statements are based on reasonable assumptions, these assumptions are inherently subject to significant risks, uncertainties and contingencies, which are difficult or impossible to predict accurately and are beyond our control. Accordingly, there can be no assurance that the proposed transaction or these future events will occur as anticipated, if at all, or that actual results will be as expected. A number of factors could affect the future results of Quorum Health or the healthcare industry generally and could cause Quorum Healths expected results to differ materially from those expressed in this presentation. In addition, as it relates to the proposed transaction, such differences may result from a number of factors, including but not limited to: the timing and completion of the proposed transaction; a failure to obtain necessary regulatory approvals; a failure to obtain assurances of anticipated tax treatment; a deterioration in the business or prospects of Quorum Healths or CHS business; adverse developments in Quorum Healths or CHS markets; our ability to improve the operations of acquired or existing hospitals; adverse developments in the U.S. or global capital markets, credit markets or economies generally; the risk that the benefits of the proposed transaction may not be fully realized or may take longer to realize than expected; the impact of the proposed transaction on our third-party relationships; risks associated with Quorum Healths substantial indebtedness, leverage and debt service obligations; Quorum Healths ability to successfully make acquisitions and to integrate such hospitals, or complete hospitals; and changes in regulatory, social and political conditions.
More information about these risks and other factors that may affect our operating results are set forth in Quorum Healths most recent Registration Statement on Form 10 under the captions “Risk Factors” and “Cautionary Statement Concerning Forward-Looking Statements,” as well as CHS most recent Annual Report on Form 10-K and Quarterly Reports on Form 10-Q, copies of which may be obtained from the Investor Relations page of CHS website at www.chs.net or the Securities and Exchange Commission at www.sec.gov.
The combined operating results of Quorum Health for the year ended December 31, 2015, are not necessarily indicative of the results that may be experienced for any such future period or for any future year.
The forward-looking statements speak only as of the date of this presentation. Neither we nor CHS undertake any obligation to revise or update any of these statements, or to make any other forward looking statements, whether as a result of new information, future events or otherwise.
Non-GAAP Financial Measures
This presentation includes certain financial information defined as “non-GAAP financial measures” by the Securities and Exchange Commission. These measures may be different from non-GAAP financial measures used by other companies and should not be considered in isolation or as a substitute for net income, operating income, cash flows from operating, investing or financing activities or any other measure calculated in accordance with U.S. GAAP. A reconciliation of these non-GAAP measurements to the nearest comparable GAAP measure is available at the end of this presentation.
1
|

Spin-Off Overview
Community Health Systems (_CHS_) is spinning off a group of 38
hospitals and Quorum Health Resources, a leading hospital
management advisory and consulting services business (collectively,
_Quorum Health_ or _QHC_)
Transaction intended to qualify as a tax-free distribution to CHS and its
Proposed stockholders
Transaction
NYSE ticker: QHC
Spin-off expected to be completed April 29, 2016
When Issued Date: April 20, 2016
Record Date: April 22, 2016
1 QHC common share for each 4 CHS common shares via a special
distribution to CHS shareholders
Distribution Following the distribution, current CHS shareholders will own shares in
Process both CHS and QHC
[Graphic Appears Here]
Number of CHS shares owned by each shareholder will not change as a
result of this distribution
2
|
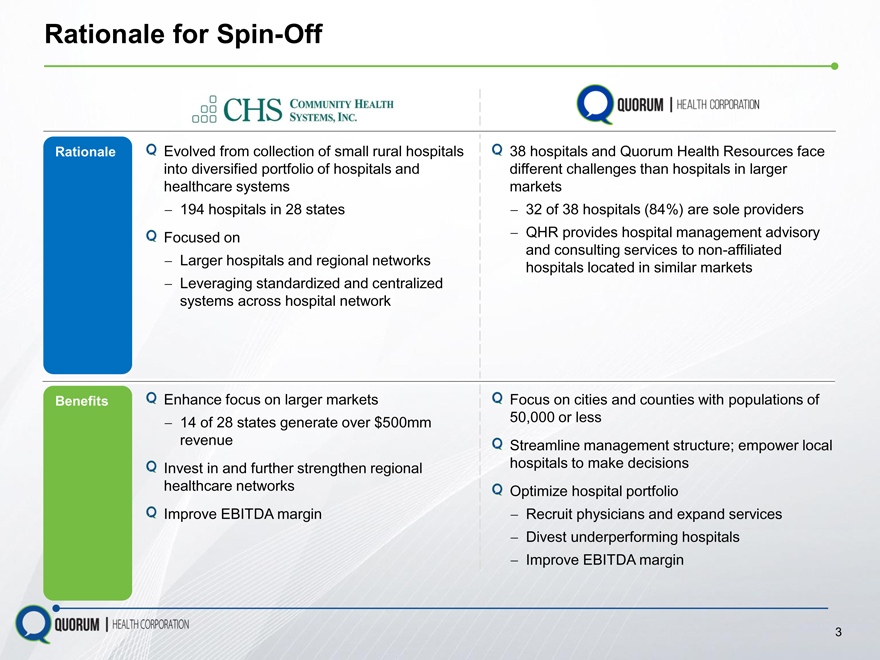
Rationale for Spin-Off
Rationale Evolved from collection of small rural hospitals 38 hospitals and Quorum Health Resources face
into diversified portfolio of hospitals and different challenges than hospitals in larger
healthcare systems markets
194 hospitals in 28 states 32 of 38 hospitals (84%) are sole providers
Focused on QHR provides hospital management advisory
and consulting services to non-affiliated
Larger hospitals and regional networks hospitals located in similar markets
Leveraging standardized and centralized
systems across hospital network
Benefits Enhance focus on larger markets Focus on cities and counties with populations of
14 of 28 states generate over $500mm 50,000 or less
revenue Streamline management structure; empower local
Invest in and further strengthen regional hospitals to make decisions
healthcare networks Optimize hospital portfolio
Improve EBITDA margin Recruit physicians and expand services
Divest underperforming hospitals
Improve EBITDA margin
3
|
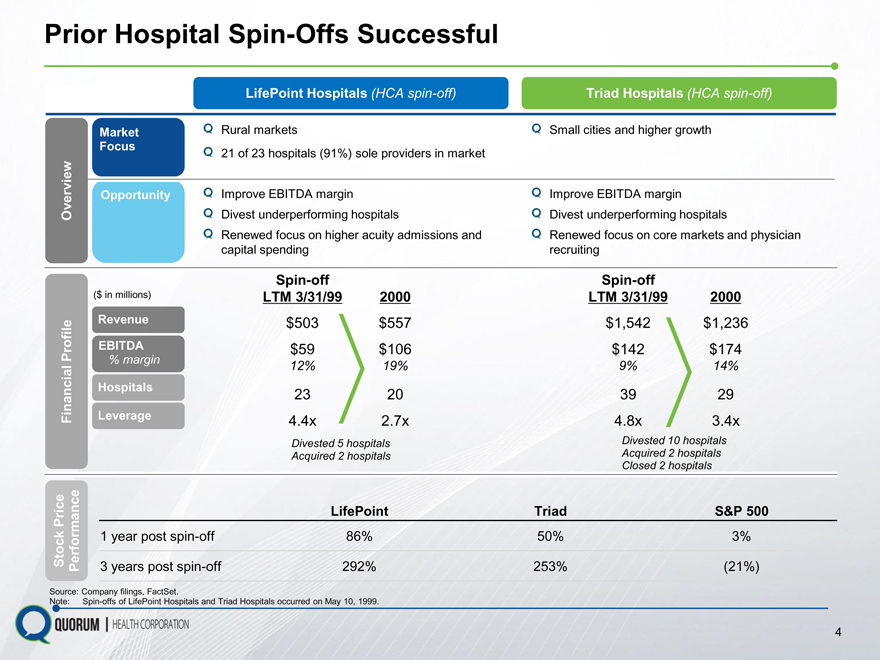
Prior Hospital Spin-Offs Successful
LifePoint Hospitals (HCA spin-off) Triad Hospitals (HCA spin-off)
Market Rural markets Small cities and higher growth
Focus 21 of 23 hospitals (91%) sole providers in market
Opportunity Improve EBITDA margin Improve EBITDA margin
Overview Divest underperforming hospitals Divest underperforming hospitals
Renewed focus on higher acuity admissions and Renewed focus on core markets and physician
capital spending recruiting
Spin-off Spin-off
($ in millions) LTM 3/31/99 2000 LTM 3/31/99 2000
Revenue $503 $ 557 $1,542 $1,236
EBITDA $59 $106 $142 $174
% margin 12% 19% 9% 14%
Hospitals 23 20 39 29
Financial Profile Leverage 4.4x 2.7x 4.8x 3.4x
Divested 5 hospitals Divested 10 hospitals
Acquired 2 hospitals Acquired 2 hospitals
Closed 2 hospitals
LifePoint Triad S&P 500
1 year post spin-off 86% 50% 3%
Stock Price Performance 3 years post spin-off 292% 253%(21%)
Source: Company filings, FactSet.
Note: Spin-offs of LifePoint Hospitals and Triad Hospitals occurred on May 10, 1999.
4
|
Company Overview
|
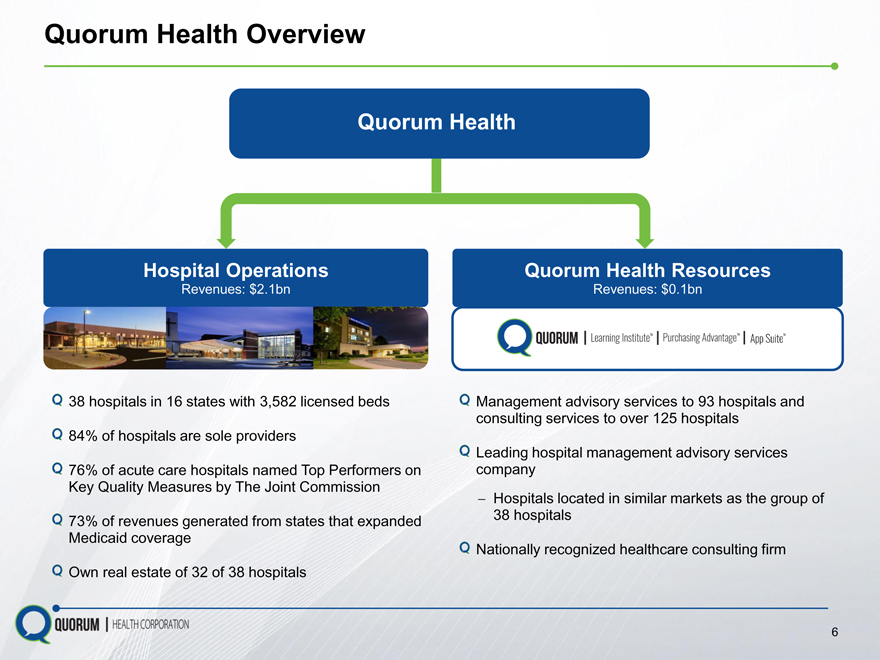
Quorum Health Overview
Quorum Health
Hospital Operations Quorum Health Resources
Revenues: $2.1bn Revenues: $0.1bn
38 hospitals in 16 states with 3,582 licensed beds Management advisory services to 93 hospitals and
consulting services to over 125 hospitals
84% of hospitals are sole providers
Leading hospital management advisory services
76% of acute care hospitals named Top Performers on company
Key Quality Measures by The Joint Commission
Hospitals located in similar markets as the group of
73% of revenues generated from states that expanded 38 hospitals
Medicaid coverage
Nationally recognized healthcare consulting firm
Own real estate of 32 of 38 hospitals
6
|
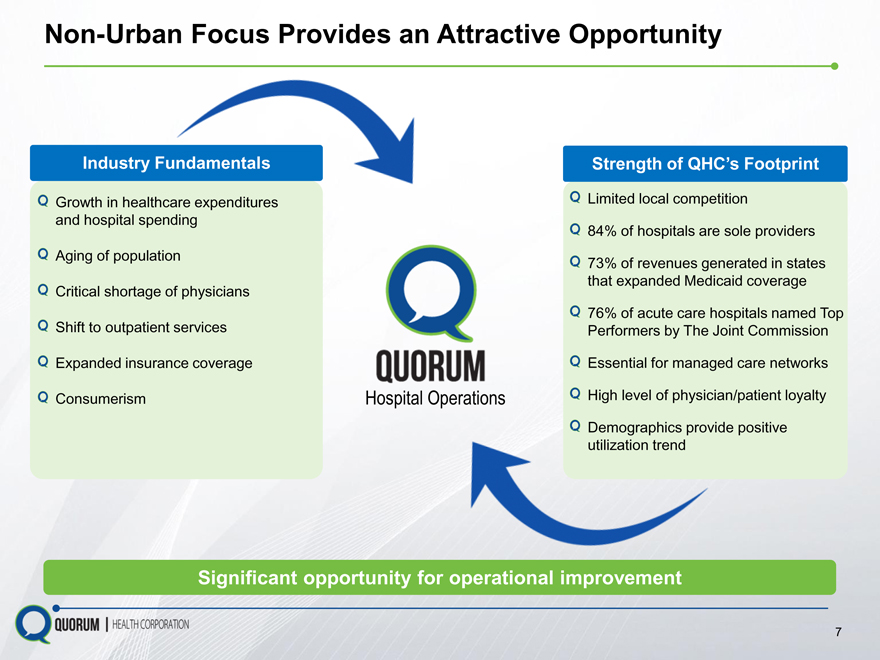
Non-Urban Focus Provides an Attractive Opportunity
Industry
Growth in health and hospital spending
Aging of population
Critical shortage of physicians Shift to outpatient services Expanded insurance coverage Consumerism
Strength of QHCs Footprint
Limited local competition
84% of hospitals are sole providers
73% of revenues generated in states
that expanded Medicaid coverage
76% of acute care hospitals named Top
Performers by The Joint Commission
Essential for managed care networks
Hospital Operations High level of physician/patient loyalty
positive
Significant opportunity for operational improvement
7
|
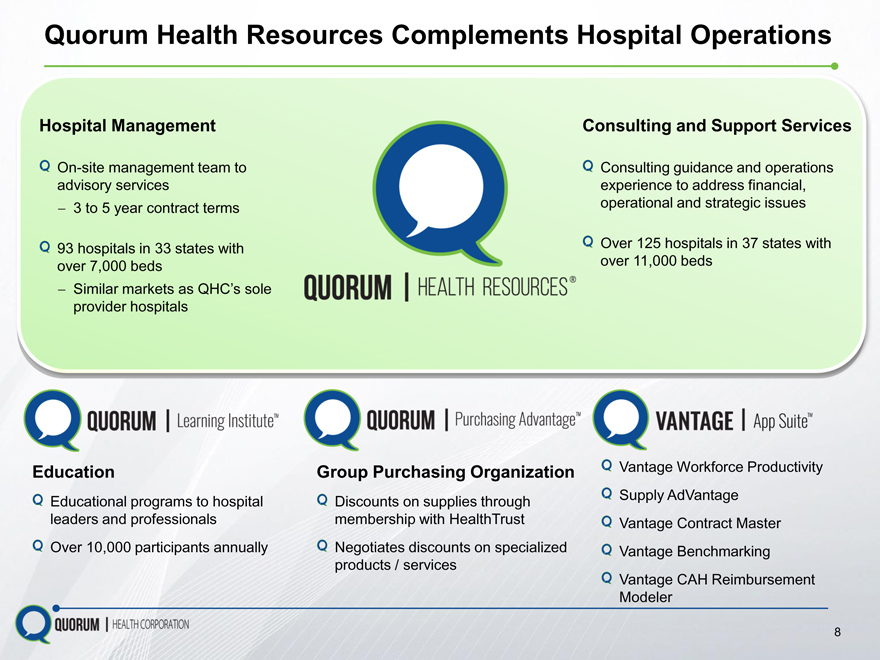
Quorum Health Resources Complements Hospital Operations
Hospital Management
On-site management team to advisory services 3 to 5 year contract terms
93 hospitals in 33 states with over 7,000 beds
Similar markets as QHCs sole
provider hospitals
Education
Educational programs to hospital leaders and professionals Over 10,000 participants annually
Consulting and Support Services
Consulting guidance and operations experience to address financial, operational and strategic issues
Over 125 hospitals in 37 states with over 11,000 beds
Group Purchasing Organization Vantage Workforce Productivity
Discounts on supplies through Supply AdVantage
membership with HealthTrust Vantage Contract Master
Negotiates discounts on specialized Vantage Benchmarking
products / services
Vantage CAH Reimbursement
Modeler
8
|

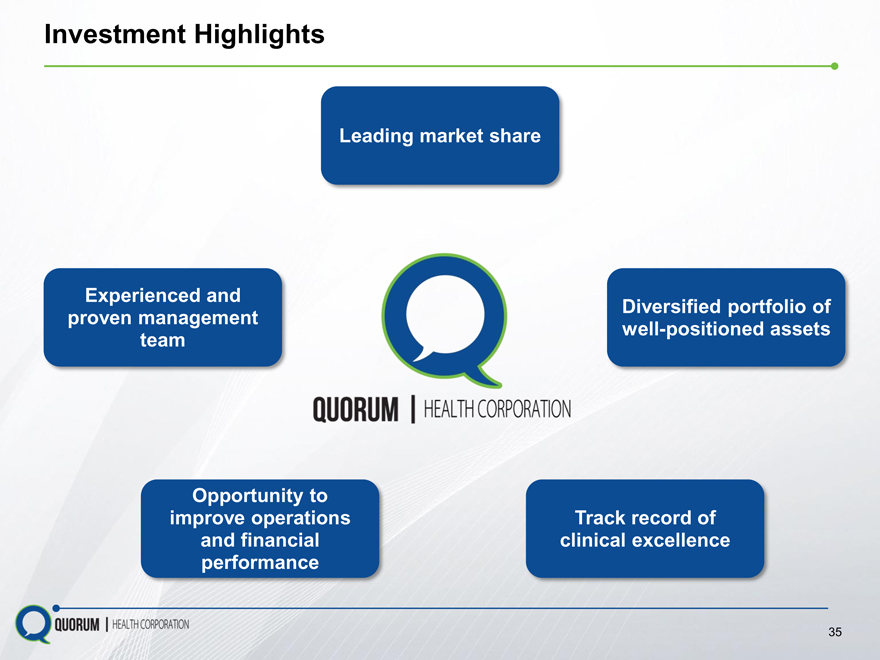
Our Competitive Strengths
Diversified Portfolio of
Leading Market Share Well-Positioned Assets
Track Record of Clinical Dedicated and
Experienced
Excellence Leadership Team
9
|
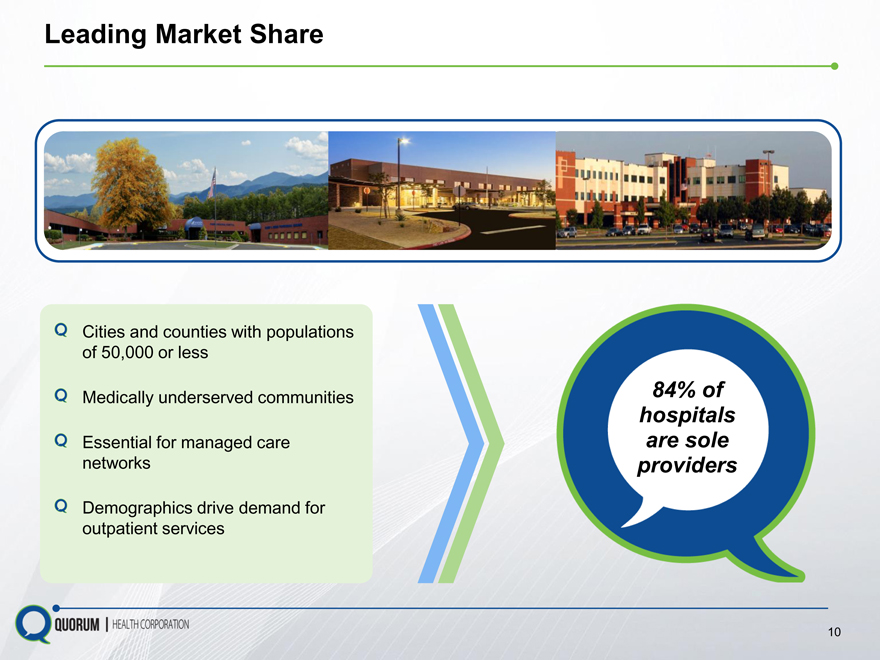
Leading Market Share
Cities and counties with populations
of 50,000 or less
Medically underserved communities 84% of
hospitals
Essential for managed care are sole
networks providers
Demographics drive demand for
outpatient services
10
|
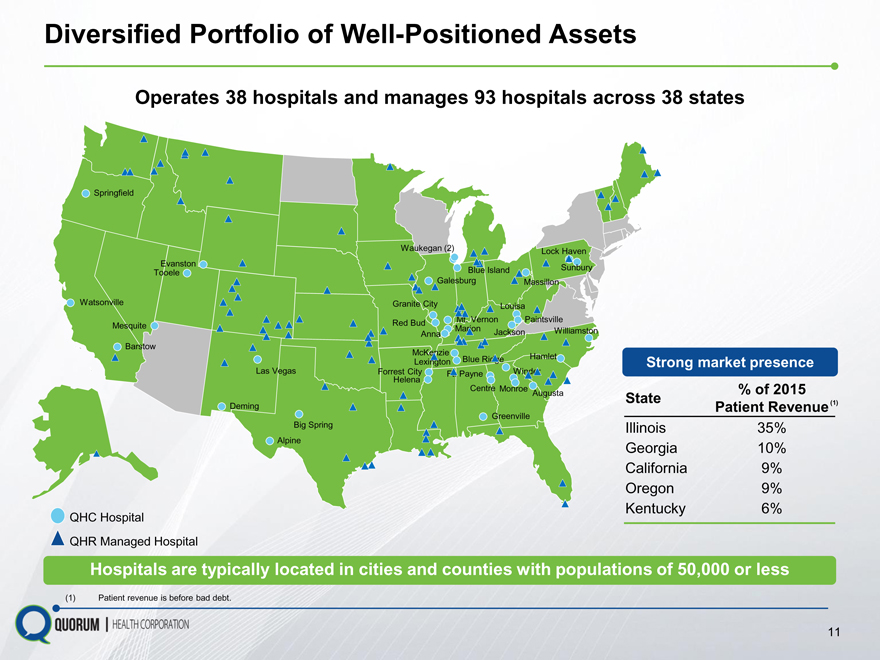
Diversified Portfolio of Well-Positioned Assets
Operates 38 hospitals and manages 93 hospitals across 38 states
Springfield
Waukegan (2) Lock Haven
Evanston
Tooele Blue Island Sunbury
Galesburg Massillon
Watsonville Granite City Louisa
Mt. Vernon Paintsville
Mesquite Red Bud Anna Marion Jackson Williamston
Barstow
McKenzie
Lexington Blue Ridge Hamlet Strong market presence
Las Vegas Forrest City Ft. Payne Winder
Helena
Centre Monroe% of 2015
Augusta State
Deming Patient Revenue (1)
Greenville
Big Spring Illinois 35%
Alpine
Georgia 10%
California 9%
Oregon 9%
Kentucky 6%
QHC Hospital
QHR Managed Hospital
Hospitals are typically located in cities and counties with populations of 50,000 or less
(1) Patient revenue is before bad debt.
11
|
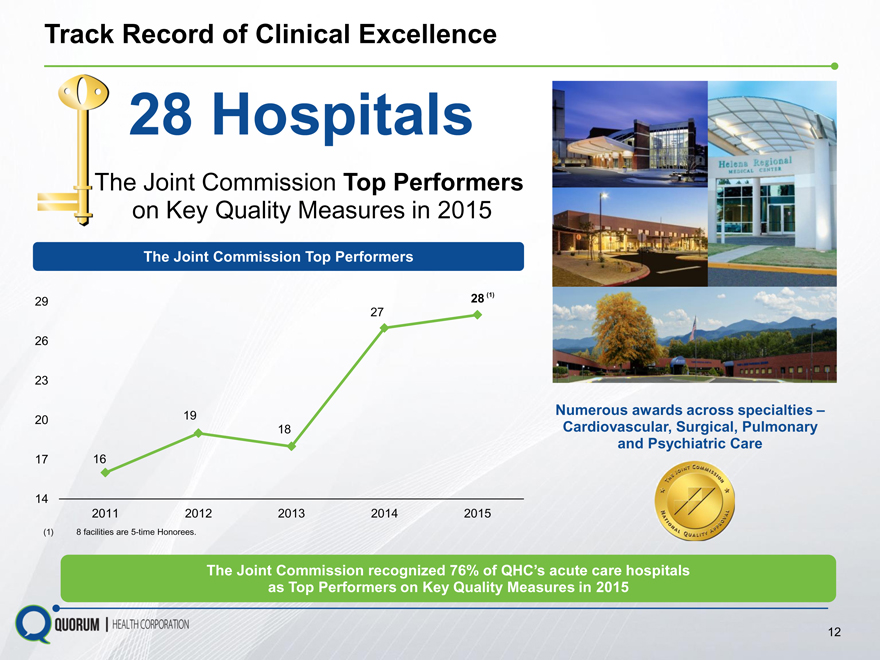
Track Record of Clinical Excellence
28 Hospitals
The Joint Commission Top Performers
on Key Quality Measures in 2015
The Joint Commission Top Performers
29 28 (1)
27
26
23
Numerous awards across specialties
20 19 18 Cardiovascular, Surgical, Pulmonary
and Psychiatric Care
17 16
14
2011 2012 2013 2014 2015
(1) 8 facilities are 5-time Honorees.
The Joint Commission recognized 76% of QHCs acute care hospitals
as Top Performers on Key Quality Measures in 2015
12
|
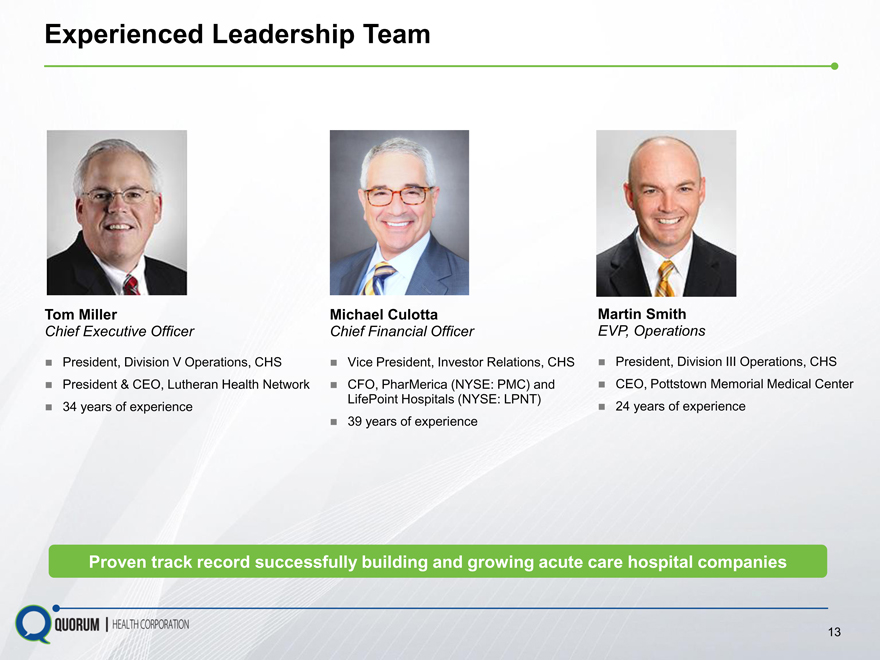
Experienced Leadership Team
Tom Miller Michael Culotta Martin Smith
Chief Executive Officer Chief Financial Officer EVP, Operations
President, Division V Operations, CHS Vice President, Investor Relations, CHS President, Division III Operations, CHS
President & CEO, Lutheran Health Network CFO, PharMerica (NYSE: PMC) and CEO, Pottstown Memorial Medical Center
LifePoint Hospitals (NYSE: LPNT)
34 years of experience 24 years of experience
39 years of experience
Proven track record successfully building and growing acute care hospital companies
13
|
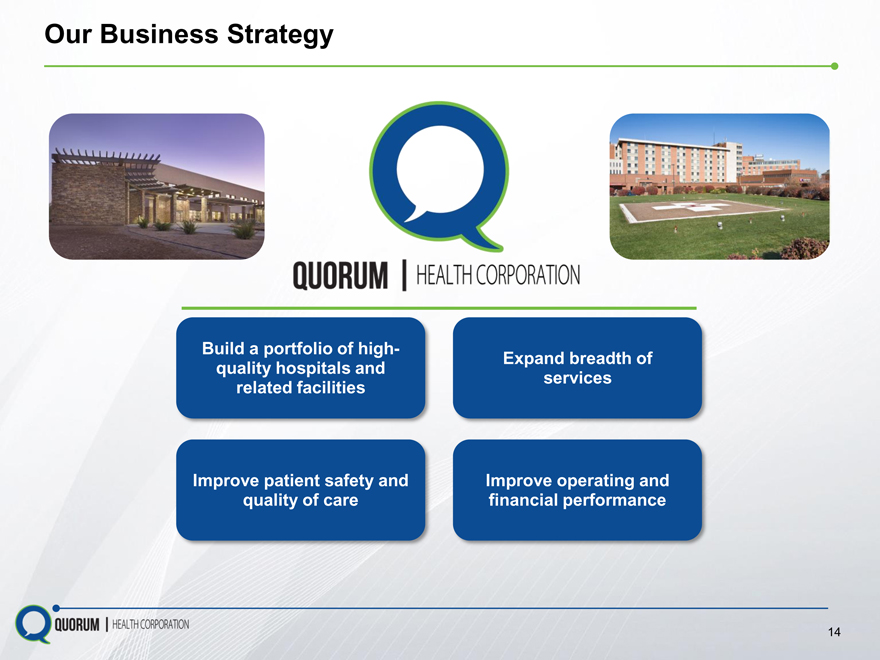
Our Business Strategy
Build a portfolio of high- Expand breadth of
quality hospitals and services
related facilities
Improve patient safety and Improve operating and
quality of care financial performance
14
|
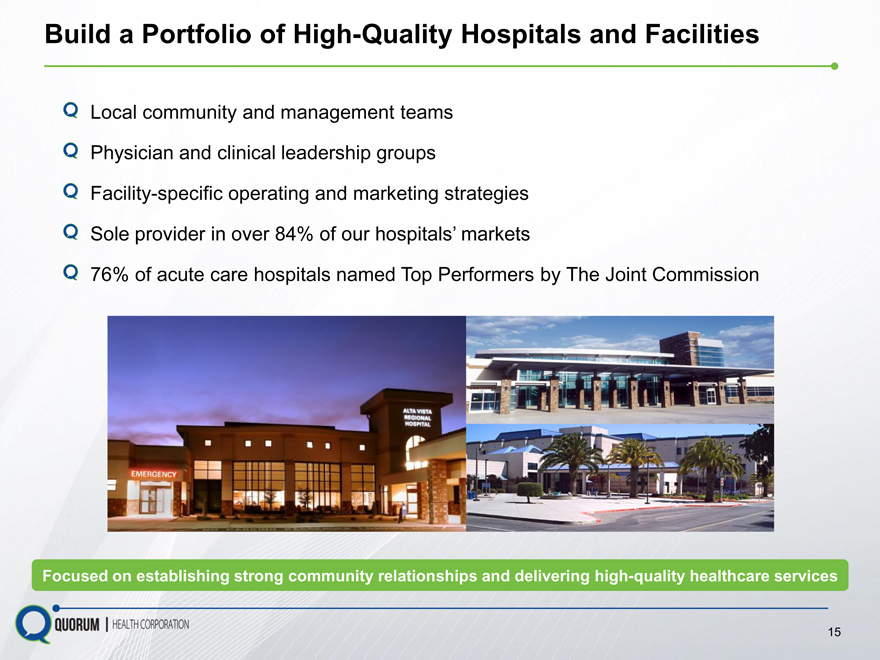
Build a Portfolio of High-Quality Hospitals and Facilities
Local community and management teams
Physician and clinical leadership groups
Facility-specific operating and marketing strategies
Sole provider in over 84% of our hospitals markets
76% of acute care hospitals named Top Performers by The Joint Commission
Focused on establishing strong community relationships and delivering high-quality healthcare services
15
|
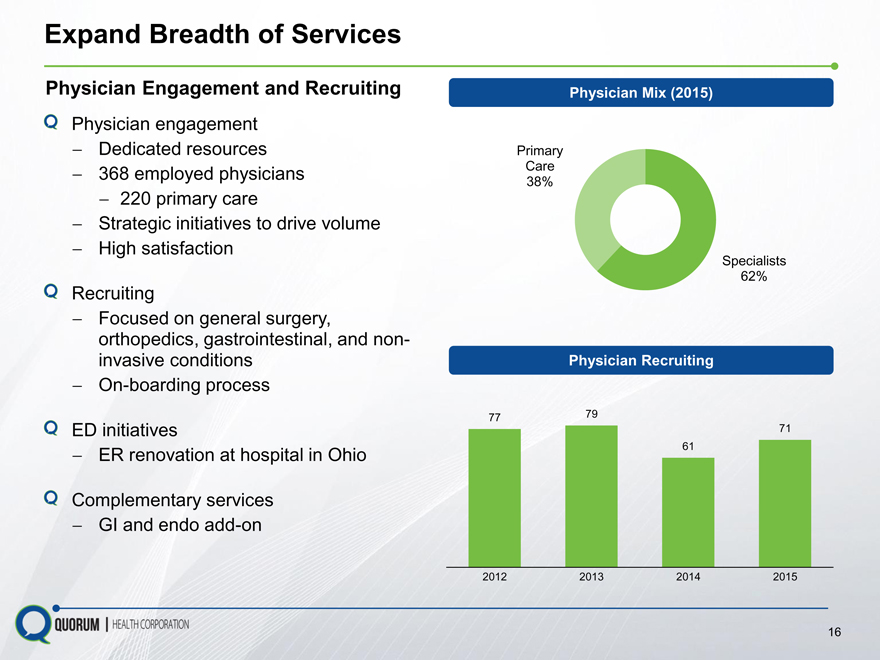
Expand Breadth of Services
Physician Engagement and Recruiting
Physician engagement Dedicated resources 368 employed physicians
220 primary care
Strategic initiatives to drive volume
High satisfaction
Recruiting
Focused on general surgery, orthopedics, gastrointestinal, and non-invasive conditions On-boarding process
ED initiatives
ER renovation at hospital in Ohio
Complementary services GI and endo add-on
Physician Mix (2015)
Primary
Care
38%
Specialists
62%
Physician Recruiting
77 79
71
61
2012 2013 2014 2015
16
|
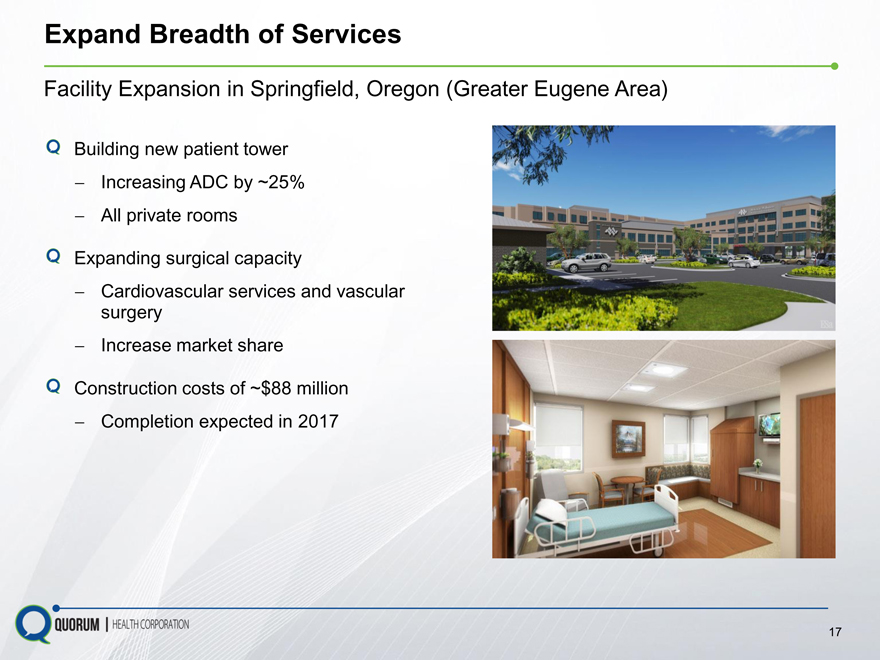
Expand Breadth of Services
Facility Expansion in Springfield, Oregon (Greater Eugene Area)
Building new patient tower
Increasing ADC by ~25%
All private rooms
Expanding surgical capacity
Cardiovascular services and vascular
surgery
Increase market share
Construction costs of ~$88 million
Completion expected in 2017
17
|
Disciplined Approach to Acquisitions and Divestitures
Intend to divest hospitals to reduce leverage and improve cash flow and financial performance
Selectively pursue acquisitions based on the following criteria:
Located in similar markets as our hospitals
Sole or primary provider of acute care services in the community
Not-for-profit hospitals
Potential for service expansion
Financial and operating performance that will benefit from our management skills
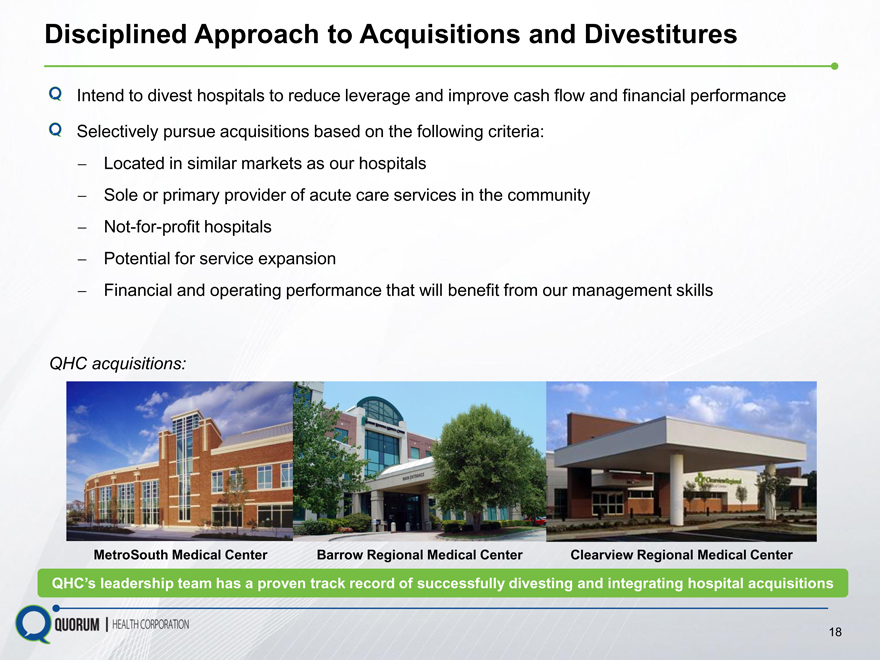
QHC acquisitions:
MetroSouth Medical Center
Barrow Regional Medical Center
Clearview Regional Medical Center
QHCs leadership team has a proven track record of successfully divesting and integrating hospital acquisitions
18
|
Improve Patient Safety and Quality of Care
Safety and quality training programs for all staff
Sharing of best practices
Infrastructure and technological capability to enhance patient quality of care
Standardized compliance processes
Consistent measurement of patient, physician and employee satisfaction
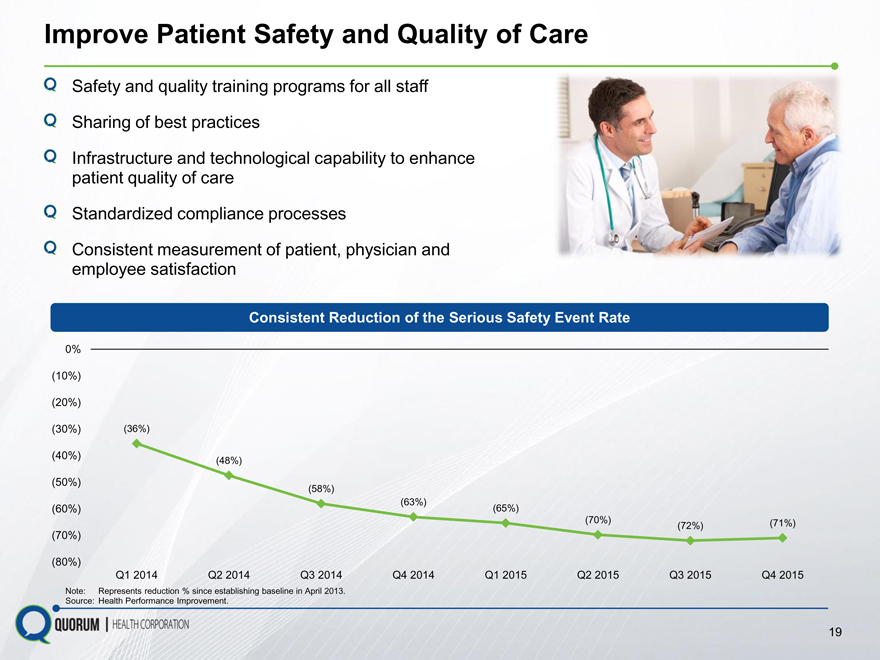
Consistent Reduction of the Serious Safety Event Rate
0%
(10%)
(20%)
(30%)(36%)
(40%)(48%)
(50%)(58%)
(63%)
(60%)(65%)
(70%)(72%)(71%)
(70%)
(80%)
Q1 2014 Q2 2014 Q3 2014 Q4 2014 Q1 2015 Q2 2015 Q3 2015 Q4 2015
Note: Represents reduction % since establishing baseline in April 2013.
Source: Health Performance Improvement.
19
|
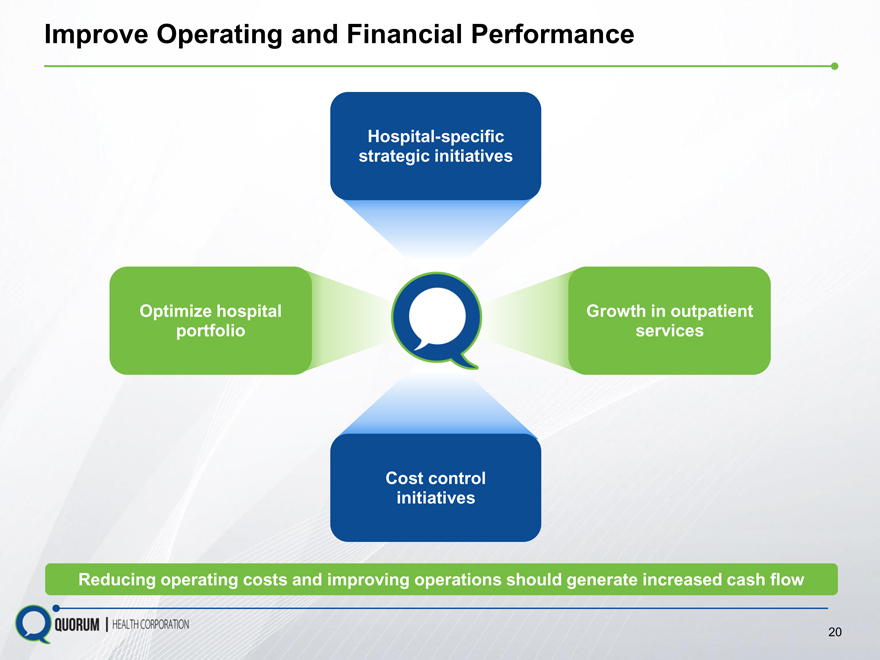
Improve Operating and Financial Performance
Hospital-specific
strategic initiatives
Optimize hospital Growth in outpatient
portfolio services
Cost control
initiatives
Reducing operating costs and improving operations should generate increased cash flow
20
|
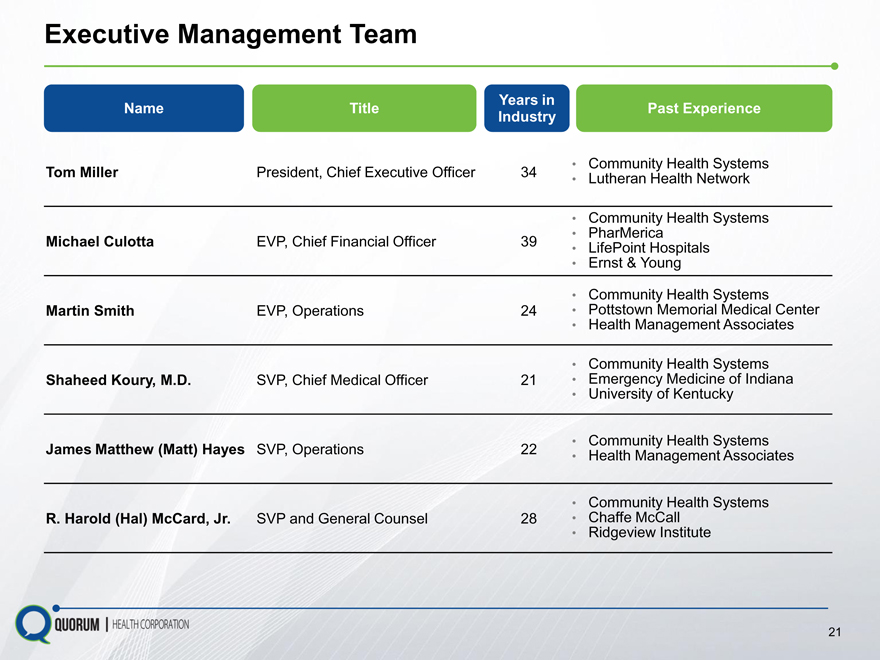
Executive Management Team
Years in
Name Title Past Experience Industry
Community Health Systems
Tom Miller President, Chief Executive Officer 34 Lutheran Health Network
Community Health Systems
PharMerica
Michael Culotta EVP, Chief Financial Officer 39 LifePoint Hospitals
Ernst & Young
Community Health Systems
Martin Smith EVP, Operations 24 Pottstown Memorial Medical Center
Health Management Associates
Community Health Systems
Shaheed Koury, M.D. SVP, Chief Medical Officer 21 Emergency Medicine of Indiana
University of Kentucky
Community Health Systems
James Matthew (Matt) Hayes SVP, Operations 22 Health Management Associates
Community Health Systems
R. Harold (Hal) McCard, Jr. SVP and General Counsel 28 Chaffe McCall
Ridgeview Institute
21
|
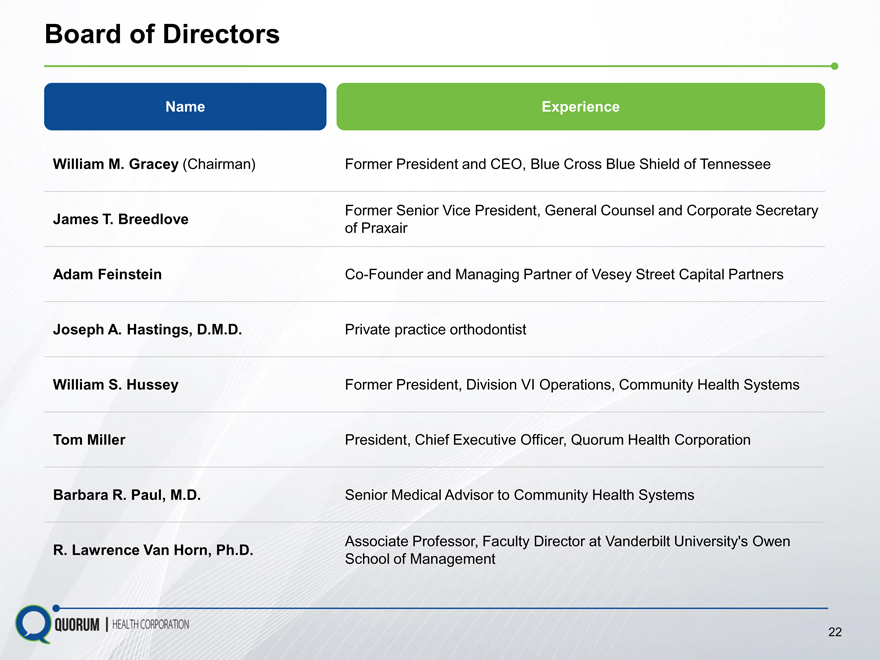
Board of Directors
Name Experience
William M. Gracey (Chairman) Former President and CEO, Blue Cross Blue Shield of Tennessee
James T. Breedlove Former Senior Vice President, General Counsel and Corporate Secretary
of Praxair
Adam Feinstein Co-Founder and Managing Partner of Vesey Street Capital Partners
Joseph A. Hastings, D.M.D. Private practice orthodontist
William S. Hussey Former President, Division VI Operations, Community Health Systems
Tom Miller President, Chief Executive Officer, Quorum Health Corporation
Barbara R. Paul, M.D. Senior Medical Advisor to Community Health Systems
Associate Professor, Faculty Director at Vanderbilt University’s Owen
R. Lawrence Van Horn, Ph.D. School of Management
22
|
Financial Summary
|
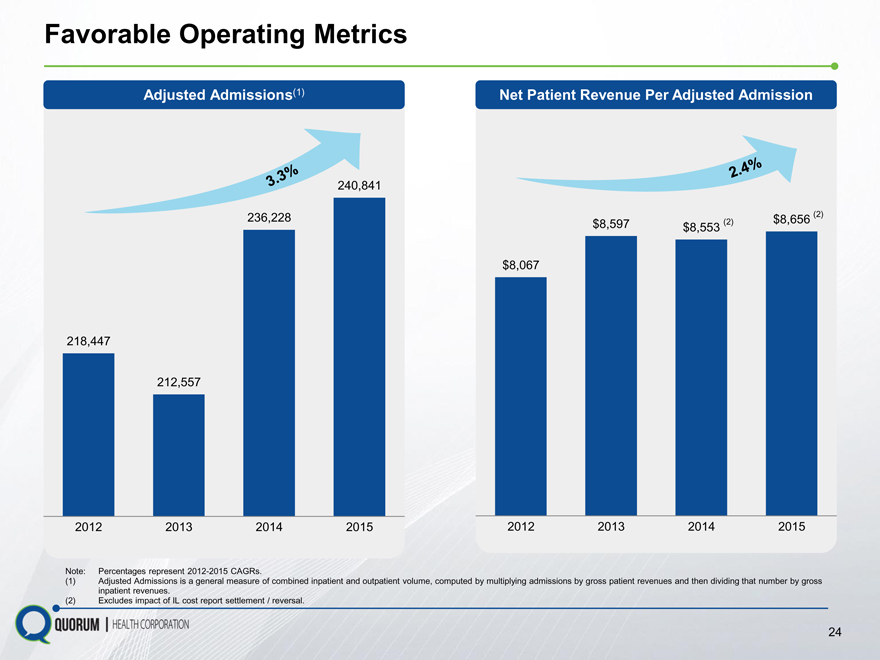
Favorable Operating Metrics
Adjusted Admissions(1)
Net Patient Revenue Per Adjusted Admission
240,841
236,228 $8,597 $8,553 (2) $8,656 (2)
$8,067
218,447
212,557
2012 2013 2014 2015 2012 2013 2014 2015
Note: Percentages represent 2012-2015 CAGRs.
Adjusted Admissions is a general measure of combined inpatient and outpatient volume, computed by multiplying admissions by gross patient revenues and then dividing that number by gross inpatient revenues.
Excludes impact of IL cost report settlement / reversal.
24
|
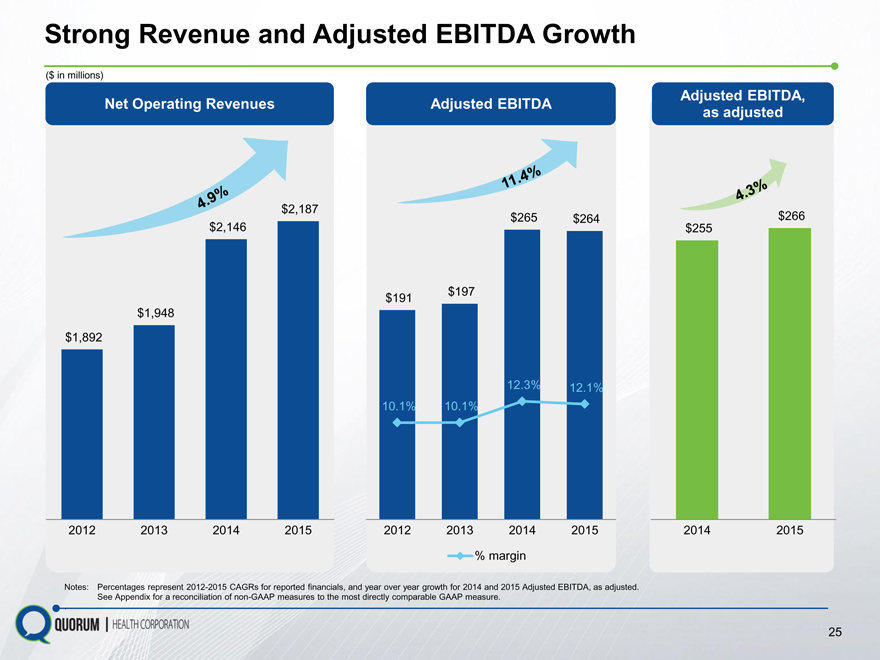
Strong Revenue and Adjusted EBITDA Growth
($ in millions)
Net Operating Revenues Adjusted EBITDA Adjusted EBITDA,
as adjusted
$2,187 $265 $264 $266
$2,146 $255
$191 $197
$1,948
$1,892
12.3% 12.1%
10.1% 10.1%
2012 2013 2014 2015 2012 2013 2014 2015 2014 2015
% margin
Notes: Percentages represent 2012-2015 CAGRs for reported financials, and year over year growth for 2014 and 2015 Adjusted EBITDA, as adjusted.
See Appendix for a reconciliation of non-GAAP measures to the most directly comparable GAAP measure.
.
25
|
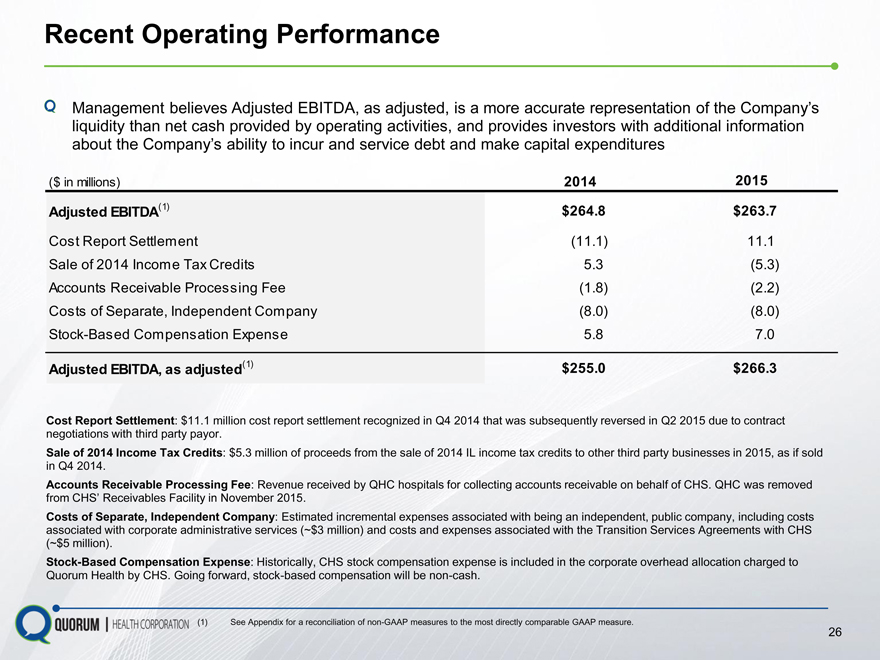
Recent Operating Performance
Management believes Adjusted EBITDA, as adjusted, is a more accurate representation of the Companys liquidity than net cash provided by operating activities, and provides investors with additional information about the Companys ability to incur and service debt and make capital expenditures
($ in millions) 2014 2015
Adjusted EBITDA(1) $ 264.8 $ 263.7
Cost Report Settlement(11.1) 11.1
Sale of 2014 Income Tax Credits 5.3(5.3)
Accounts Receivable Processing Fee(1.8)(2.2)
Costs of Separate, Independent Company(8.0)(8.0)
Stock-Based Compensation Expense 5.8 7.0
Adjusted EBITDA, as adjusted(1) $ 255.0 $ 266.3
Losses from Intended Hospital Divestitures 7.7
that was subsequently reversed in Q2 2015 due to contract
Adjusted EBITDA, as adjusted and after intended divestitures (1) $ 274.0
Sale of 2014 Income Tax Credits: $5.3 million of proceeds from the sale of 2014 IL income tax credits to other third party businesses in 2015, as if sold in Q4 2014.
Accounts Receivable Processing Fee: Revenue received by QHC hospitals for collecting accounts receivable on behalf of CHS. QHC was removed from CHS Receivables Facility in November 2015.
Costs of Separate, Independent Company: Estimated incremental expenses associated with being an independent, public company, including costs associated with corporate administrative services (~$3 million) and costs and expenses associated with the Transition Services Agreements with CHS (~$5 million).
Stock-Based Compensation Expense: Historically, CHS stock compensation expense is included in the corporate overhead allocation charged to Quorum Health by CHS. Going forward, stock-based compensation will be non-cash.
(1) See Appendix for a reconciliation of non-GAAP measures to the most directly comparable GAAP measure.
26
|
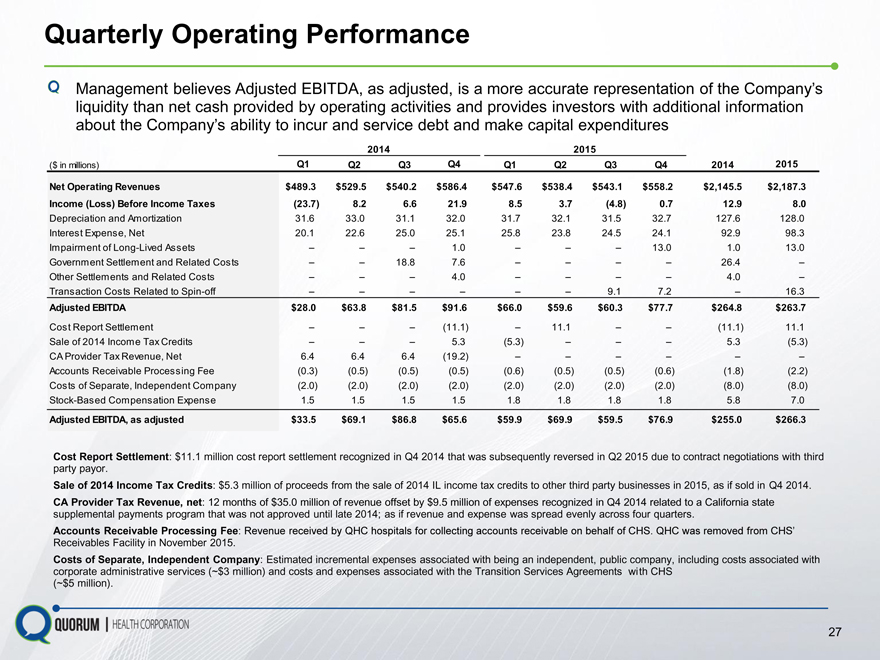
Quarterly Operating Performance
Management believes Adjusted EBITDA, as adjusted, is a more accurate representation of the Companys liquidity than net cash provided by operating activities and provides investors with additional information about the Companys ability to incur and service debt and make capital expenditures
2014 2015
($ in millions) Q1 Q2 Q3 Q4 Q1 Q2 Q3 Q4 2014 2015
Net Operating Revenues $489.3 $529.5 $540.2 $586.4 $547.6 $538.4 $543.1 $558.2 $2,145.5 $2,187.3
Income (Loss) Before Income Taxes(23.7) 8.2 6.6 21.9 8.5 3.7(4.8) 0.7 12.9 8.0
Depreciation and Amortization 31.6 33.0 31.1 32.0 31.7 32.1 31.5 32.7 127.6 128.0
Interest Expense, Net 20.1 22.6 25.0 25.1 25.8 23.8 24.5 24.1 92.9 98.3
Impairment of Long-Lived Assets 1.0 13.0 1.0 13.0
Government Settlement and Related Costs 18.8 7.6 26.4
Other Settlements and Related Costs 4.0 4.0
Transaction Costs Related to Spin-off 9.1 7.2 16.3
Adjusted EBITDA $28.0 $63.8 $81.5 $91.6 $66.0 $59.6 $60.3 $77.7 $264.8 $263.7
Cost Report Settlement(11.1) 11.1(11.1) 11.1
Sale of 2014 Income Tax Credits 5.3(5.3) 5.3(5.3)
CA Provider Tax Revenue, Net 6.4 6.4 6.4(19.2)
Accounts Receivable Processing Fee(0.3)(0.5)(0.5)(0.5)(0.6)(0.5)(0.5)(0.6)(1.8)(2.2)
Costs of Separate, Independent Company(2.0)(2.0)(2.0)(2.0)(2.0)(2.0)(2.0)(2.0)(8.0)(8.0)
Stock-Based Compensation Expense 1.5 1.5 1.5 1.5 1.8 1.8 1.8 1.8 5.8 7.0
Adjusted EBITDA, as adjusted $33.5 $69.1 $86.8 $65.6 $59.9 $69.9 $59.5 $76.9 $255.0 $266.3
Cost Report Settlement: $11.1 million cost report settlement recognized in Q4 2014 that was subsequently reversed in Q2 2015 due to contract negotiations with third party payor.
Sale of 2014 Income Tax Credits: $5.3 million of proceeds from the sale of 2014 IL income tax credits to other third party businesses in 2015, as if sold in Q4 2014. CA Provider Tax Revenue, net: 12 months of $35.0 million of revenue offset by $9.5 million of expenses recognized in Q4 2014 related to a California state supplemental payments program that was not approved until late 2014; as if revenue and expense was spread evenly across four quarters.
Accounts Receivable Processing Fee: Revenue received by QHC hospitals for collecting accounts receivable on behalf of CHS. QHC was removed from CHS
Receivables Facility in November 2015.
Costs of Separate, Independent Company: Estimated incremental expenses associated with being an independent, public company, including costs associated with corporate administrative services (~$3 million) and costs and expenses associated with the Transition Services Agreements with CHS
(~$5 million).
27
|
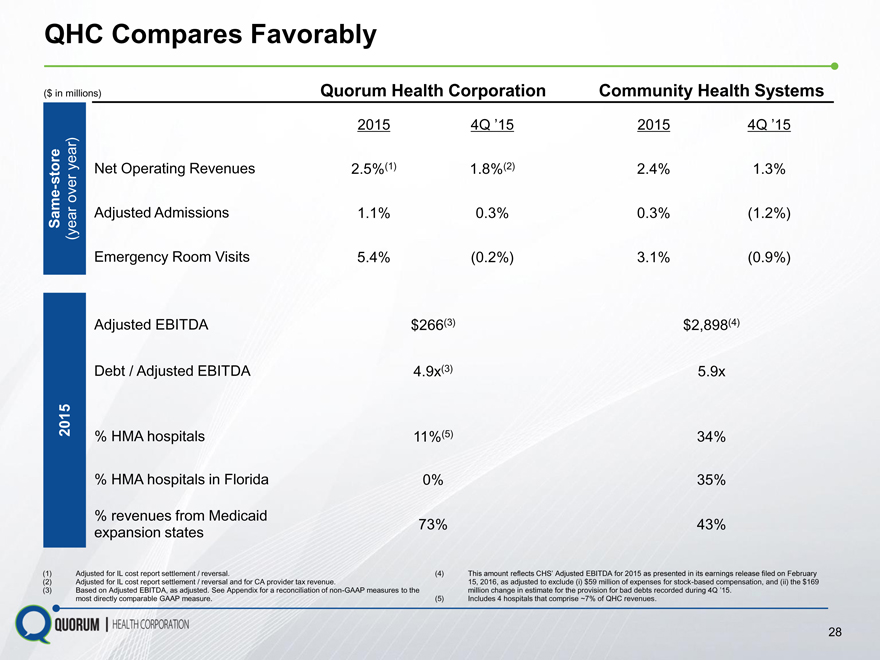
QHC Compares Favorably
($ in millions) Quorum Health Corporation Community Health Systems
2015 4Q 15 2015 4Q 15
Net Operating Revenues 2.5%(1) 1.8%(2) 2.4% 1.3%
Same—store (year over year) Adjusted Admissions 1.1% 0.3% 0.3%(1.2%)
Emergency Room Visits 5.4%(0.2%) 3.1%(0.9%)
Adjusted EBITDA $266(3) $2,898(4)
Debt / Adjusted EBITDA 4.9x(3) 5.9x
2015 % HMA hospitals 11%(5) 34%
% HMA hospitals in Florida 0% 35%
% revenues from Medicaid
expansion states 73% 43%
Adjusted for IL cost report settlement / reversal.
Adjusted for IL cost report settlement / reversal and for CA provider tax revenue.
Based on Adjusted EBITDA, as adjusted. See Appendix for a reconciliation of non-GAAP measures to the most directly comparable GAAP measure.
This amount reflects CHS Adjusted EBITDA for 2015 as presented in its earnings release filed on February
15, 2016, as adjusted to exclude (i) $59 million of expenses for stock-based compensation, and (ii) the $169 million change in estimate for the provision for bad debts recorded during 4Q 15.
Includes 4 hospitals that comprise ~7% of QHC revenues.
28
|
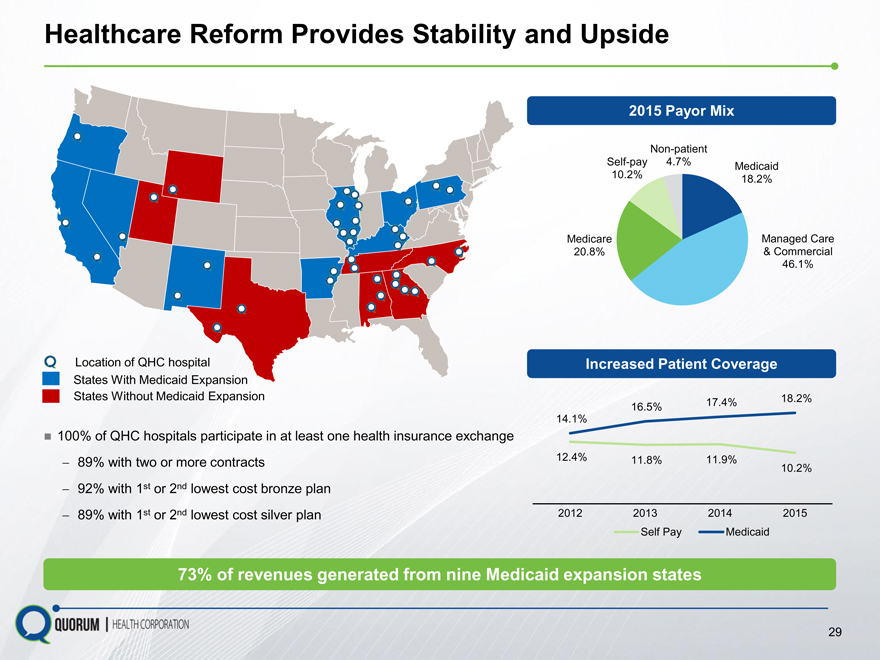
Healthcare Reform Provides Stability and Upside
Location of QHC hospital States With Medicaid Expansion States Without Medicaid Expansion
2015 Payor Mix
Non-patient
Self-pay 4.7% Medicaid
10.2% 18.2%
Medicare Managed Care
20.8% & Commercial
46.1%
100% of QHC hospitals participate in at least one health insurance exchange
89% with two or more contracts
92% with 1st or 2nd lowest cost bronze plan
89% with 1st or 2nd lowest cost silver plan
Increased Patient Coverage
17.4% 18.2%
16.5%
14.1%
12.4% 11.8% 11.9%
10.2%
2012 2013 2014 2015
Self Pay Medicaid
73% of revenues generated from nine Medicaid expansion states
29
|
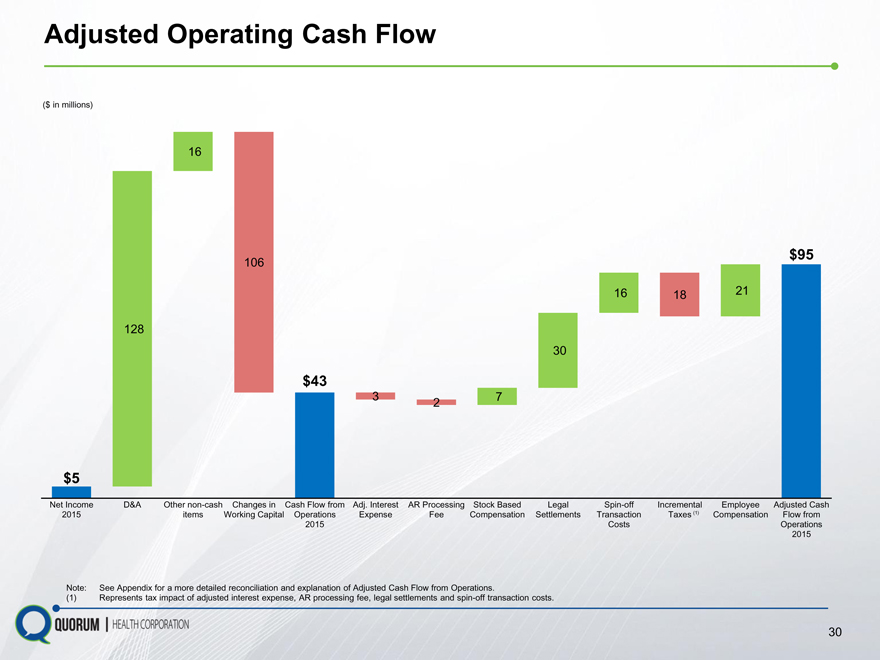
Adjusted Operating Cash Flow
($ in millions)
16
106 $95
16 18 21
128
30
$43
3 7
2
$5
Net Income D&A Other non-cash Changes in Cash Flow from Adj. Interest AR Processing Stock Based Legal Spin-off Incremental Employee Adjusted Cash
2015 items Working Capital Operations Expense Fee Compensation Settlements Transaction Taxes (1) Compensation Flow from
2015 Costs Operations
2015
Note: See Appendix for a more detailed reconciliation and explanation of Adjusted Cash Flow from Operations.
(1) Represents tax impact of adjusted interest expense, AR processing fee, legal settlements and spin-off transaction costs.
30
|
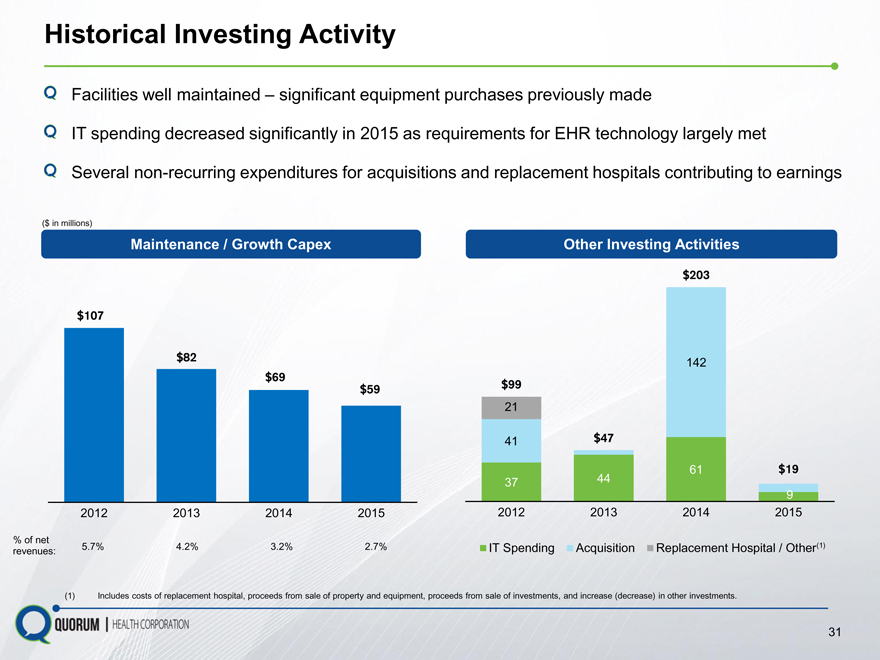
Historical Investing Activity
Facilities well maintained significant equipment purchases previously made
IT spending decreased significantly in 2015 as requirements for EHR technology largely met
Several non-recurring expenditures for acquisitions and replacement hospitals contributing to earnings
($ in millions)
Maintenance / Growth Capex
Other Investing Activities
$203
$107
$82 142
$69
$59 $99
21
41 $47
61 $19
37 44
9
2012 2013 2014 2015 2012 2013 2014 2015
% of net
revenues: 5.7% 4.2% 3.2% 2.7% IT Spending Acquisition Replacement Hospital / Other(1)
(1) Includes costs of replacement hospital, proceeds from sale of property and equipment, proceeds from sale of investments, and increase (decrease) in other investments.
31
|
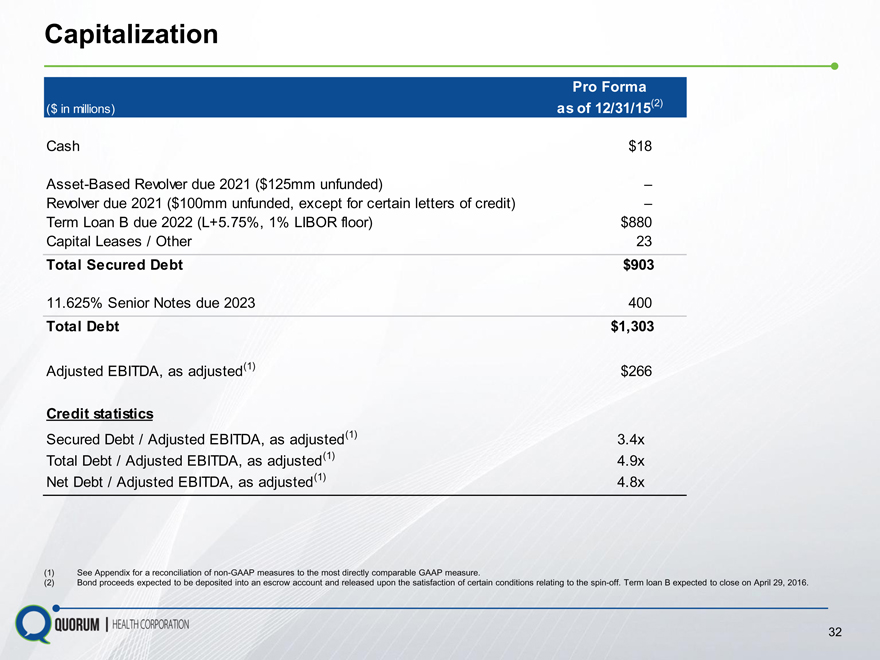
Capitalization
Pro Forma
($ in millions) as of 12/31/15(2)
Cash $18
Asset-Based Revolver due 2021 ($125mm unfunded)
Revolver due 2021 ($100mm unfunded, except for certain letters of credit)
Term Loan B due 2022 (L+5.75%, 1% LIBOR floor) $880
Capital Leases / Other 23
Total Secured Debt $903
11.625% Senior Notes due 2023 400
Total Debt $1,303
Adjusted EBITDA, as adjusted(1) $266
Credit statistics
Secured Debt / Adjusted EBITDA, as adjusted(1) 3.4x
Total Debt / Adjusted EBITDA, as adjusted(1) 4.9x
Net Debt / Adjusted EBITDA, as adjusted(1) 4.8x
See Appendix for a reconciliation of non-GAAP measures to the most directly comparable GAAP measure.
Bond proceeds expected to be deposited into an escrow account and released upon the satisfaction of certain conditions relating to the spin-off. Term loan B expected to close on April 29, 2016.
32
|
Separation Costs
QHC will enter into five year transition services agreements with CHS to provide administrative services for:
Information technology
Revenue cycle management for hospitals and physician practices
Payroll processing
Eligibility screening services
Collections
QHC is expected to incur administrative expenses commensurate to the cost of these services provided by CHS prior to the spin-off plus an additional ~$5 million of costs annually
QHC is expected to incur an additional ~$3 million of public company costs annually
33
|
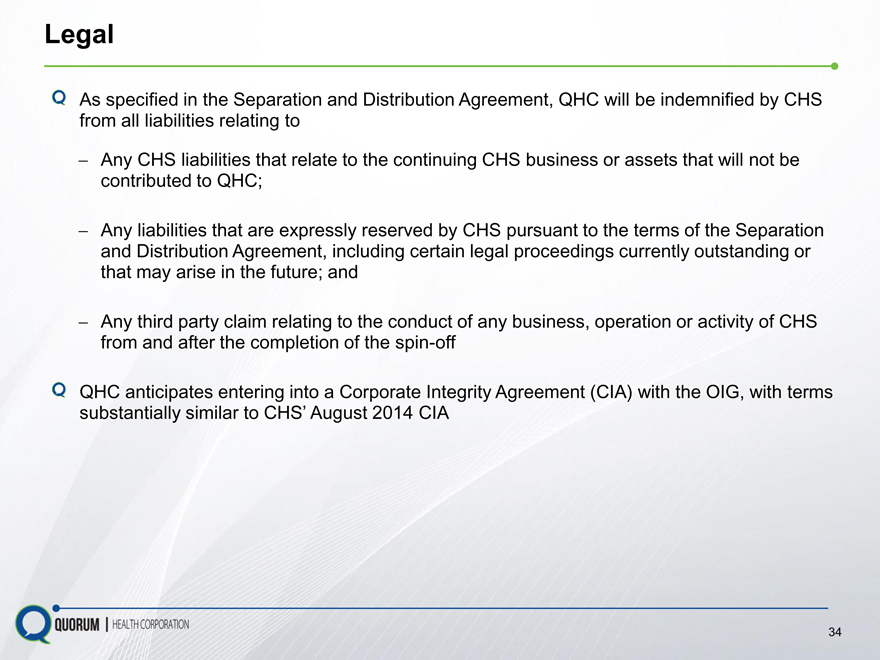
Legal
As specified in the Separation and Distribution Agreement, QHC will be indemnified by CHS from all liabilities relating to
Any CHS liabilities that relate to the continuing CHS business or assets that will not be
contributed to QHC;
Any liabilities that are expressly reserved by CHS pursuant to the terms of the Separation
and Distribution Agreement, including certain legal proceedings currently outstanding or
that may arise in the future; and
Any third party claim relating to the conduct of any business, operation or activity of CHS
from and after the completion of the spin-off
QHC anticipates entering into a Corporate Integrity Agreement (CIA) with the OIG, with terms substantially similar to CHS August 2014 CIA
34
|
Investment Highlights
Leading market share
Experienced and Diversified portfolio of
proven management
team well-positioned assets
Opportunity to
improve operations Track record of
and financial clinical excellence
performance
35
|
Appendix
|
QHC Unaudited Supplemental Information
Non-GAAP Financial Measures
EBITDA consists of net income attributable to Quorum Health before interest, income taxes, depreciation and amortization. Adjusted EBITDA is EBITDA adjusted to exclude the impact of net income (loss) attributable to noncontrolling interests, expenses related to certain legal settlements and related costs, impairment of long-lived assets and transaction costs related to the spin-off. We have from time to time sold noncontrolling interests in certain of our subsidiaries or acquired subsidiaries with existing noncontrolling interest ownership positions. We believe that it is useful to present Adjusted EBITDA because it excludes the portion of EBITDA attributable to these third-party interests. We use Adjusted EBITDA as a measure of liquidity.
Adjusted EBITDA, as adjusted, is Adjusted EBITDA further adjusted to exclude the impacts of (i) a favorable cost report settlement that was subsequently reversed, (ii) revenue received by QHC hospitals for collecting accounts receivable on behalf of CHS in connection with CHS receivables facility prior to our termination of participation in November 2015, and (iii) stock-based compensation expense, which is a non-cash item, and include the impacts of (x) the proceeds from the sale of 2014 income tax credits to other third party businesses as if those credits were sold in 2014 and (y) estimated incremental expenses associated with being an independent, public company.
We have included these financial measures because we believe they provide investors with additional information about our ability to incur and service debt and make capital expenditures. In addition, we believe that analysts and rating agencies consider these measures useful. Our (i) Adjusted EBITDA and (ii) Adjusted EBITDA, as adjusted, are not measurements of financial performance or liquidity under GAAP. None of these measures should be considered in isolation or as a substitute for net income, operating income, cash flows from operating, investing or financing activities, or any other measure calculated in accordance with GAAP. The items excluded from (i) Adjusted EBITDA and (ii) Adjusted EBITDA, as adjusted, are significant components in understanding and evaluating our operating and financial performance and liquidity. Our calculation of (i) Adjusted EBITDA and (ii) Adjusted EBITDA, as adjusted, may not be comparable to similarly titled measures reported by other companies. A reconciliation of these non-GAAP measurements to the nearest GAAP measure is provided.
37
|
QHC Unaudited Supplemental Information
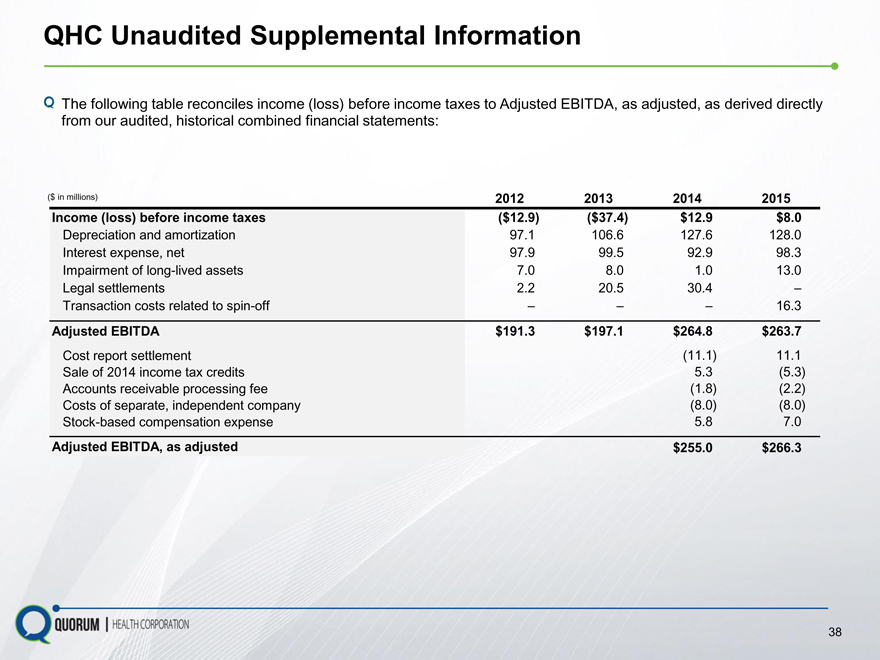
The following table reconciles income (loss) before income taxes to Adjusted EBITDA, as adjusted, as derived directly from our audited, historical combined financial statements:
($ in millions) 2012 2013 2014 2015
Income (loss) before income taxes($12.9)($37.4) $12.9 $8.0
Depreciation and amortization 97.1 106.6 127.6 128.0
Interest expense, net 97.9 99.5 92.9 98.3
Impairment of long-lived assets 7.0 8.0 1.0 13.0
Legal settlements 2.2 20.5 30.4
Transaction costs related to spin-off 16.3
Adjusted EBITDA $191.3 $197.1 $264.8 $263.7
Cost report settlement(11.1) 11.1
Sale of 2014 income tax credits 5.3(5.3)
Accounts receivable processing fee(1.8)(2.2)
Costs of separate, independent company(8.0)(8.0)
Stock-based compensation expense 5.8 7.0
Adjusted EBITDA, as adjusted $255.0 $266.3
38
|
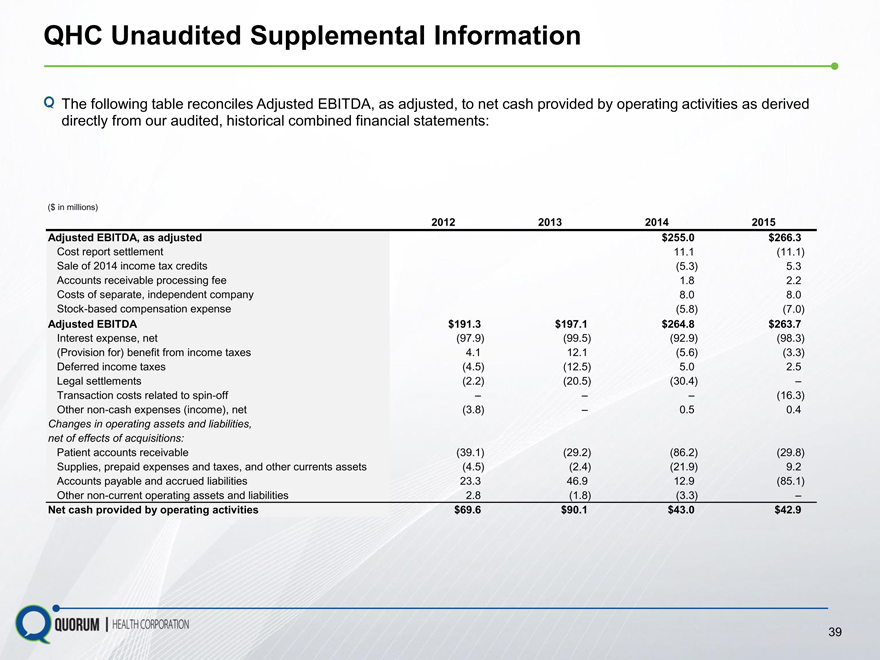
QHC Unaudited Supplemental Information
The following table reconciles Adjusted EBITDA, as adjusted, to net cash provided by operating activities as derived directly from our audited, historical combined financial statements:
($ in millions)
2012 2013 2014 2015
Adjusted EBITDA, as adjusted $255.0 $266.3
Cost report settlement 11.1(11.1)
Sale of 2014 income tax credits(5.3) 5.3
Accounts receivable processing fee 1.8 2.2
Costs of separate, independent company 8.0 8.0
Stock-based compensation expense(5.8)(7.0)
Adjusted EBITDA $191.3 $197.1 $264.8 $263.7
Interest expense, net(97.9)(99.5)(92.9)(98.3)
(Provision for) benefit from income taxes 4.1 12.1(5.6)(3.3)
Deferred income taxes(4.5)(12.5) 5.0 2.5
Legal settlements(2.2)(20.5)(30.4)
Transaction costs related to spin-off(16.3)
Other non-cash expenses (income), net(3.8) 0.5 0.4
Changes in operating assets and liabilities,
net of effects of acquisitions:
Patient accounts receivable(39.1)(29.2)(86.2)(29.8)
Supplies, prepaid expenses and taxes, and other currents assets(4.5)(2.4)(21.9) 9.2
Accounts payable and accrued liabilities 23.3 46.9 12.9(85.1)
Other non-current operating assets and liabilities 2.8(1.8)(3.3)
Net cash provided by operating activities $69.6 $90.1 $43.0 $42.9
39
|
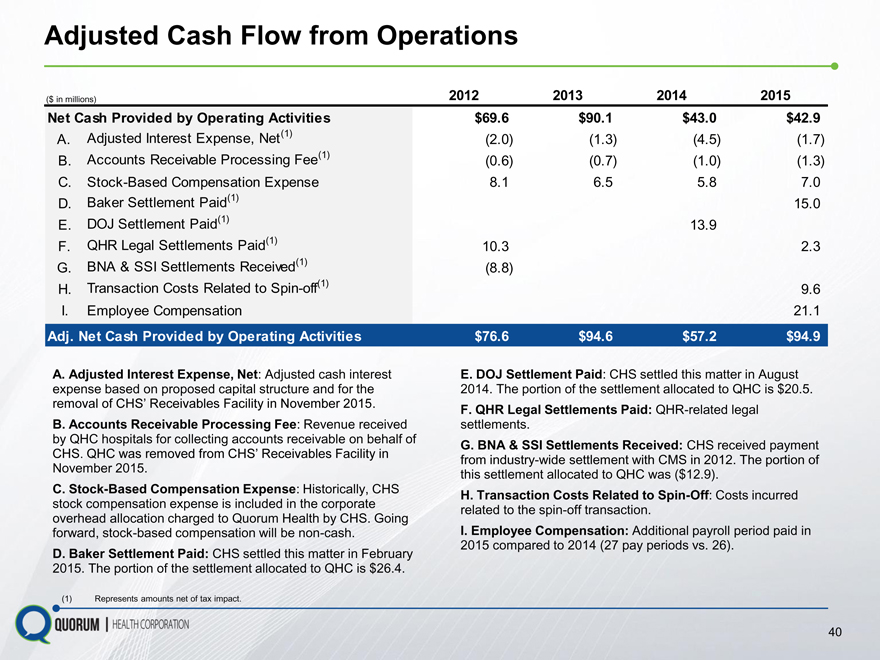
Adjusted Cash Flow from Operations
($ in millions)
2012
2013
2014
2015
Net Cash Provided by Operating Activities
Adjusted Interest Expense, Net (1)
Accounts Receivable Processing Fee(1)
Stock-Based Compensation Expense
Baker Settlement Paid(1)
DOJ Settlement Paid(1)
QHR Legal Settlements Paid(1)
BNA & SSI Settlements Received(1)
Transaction Costs Related to Spin-off(1)
Employee Compensation
Adj. Net Cash Provided by Operating Activities
A. Adjusted Interest Expense, Net: Adjusted cash interest expense based on proposed capital structure and for the removal of CHS Receivables Facility in November 2015.
B. Accounts Receivable Processing Fee: Revenue received by QHC hospitals for collecting accounts receivable on behalf of
CHS. QHC was removed from CHS Receivables Facility in
November 2015.
C. Stock-Based Compensation Expense: Historically, CHS stock compensation expense is included in the corporate overhead allocation charged to Quorum Health by CHS. Going forward, stock-based compensation will be non-cash.
D. Baker Settlement Paid: CHS settled this matter in February 2015. The portion of the settlement allocated to QHC is $26.4.
(1) Represents amounts net of tax impact.
$69.6 $90.1 $43.0 $42.9
(2.0)(1.3)(4.5)(1.7)
(0.6)(0.7)(1.0)(1.3)
8.1 6.5 5.8 7.0
15.0
13.9
10.3 2.3
(8.8)
9.6
21.1
$76.6 $94.6 $57.2 $94.9
E. DOJ Settlement Paid: CHS settled this matter in August 2014. The portion of the settlement allocated to QHC is $20.5.
F. QHR Legal Settlements Paid: QHR-related legal settlements.
G. BNA & SSI Settlements Received: CHS received payment from industry-wide settlement with CMS in 2012. The portion of this settlement allocated to QHC was ($12.9) .
H. Transaction Costs Related to Spin-Off: Costs incurred related to the spin-off transaction.
I. Employee Compensation: Additional payroll period paid in 2015 compared to 2014 (27 pay periods vs. 26).
40
|
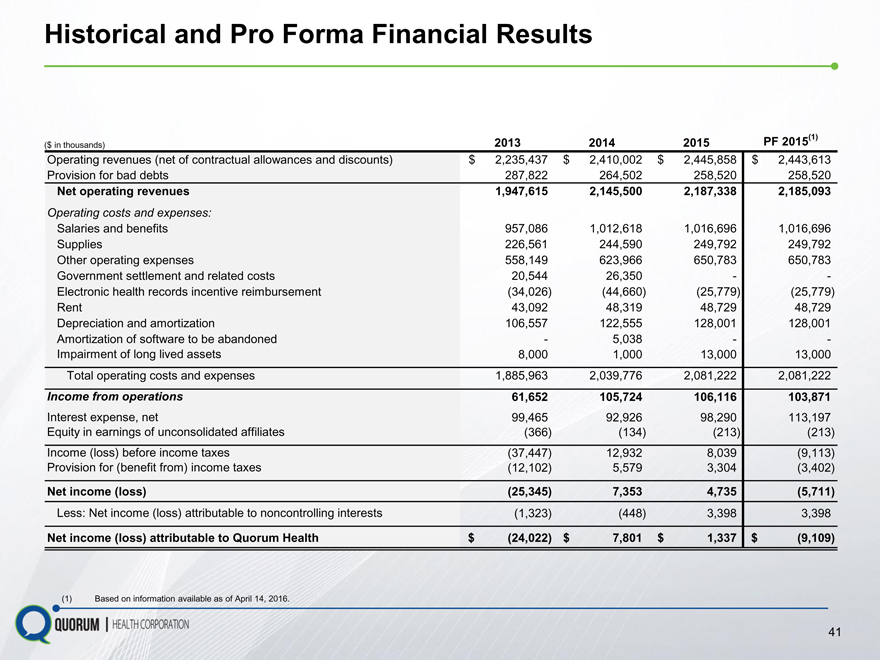
Historical and Pro Forma Financial Results
($ in thousands) 2013 2014 2015 PF 2015(1)
Operating revenues (net of contractual allowances and discounts) $ 2,235,437 $ 2,410,002 $ 2,445,858 $ 2,443,613
Provision for bad debts 287,822 264,502 258,520 258,520
Net operating revenues 1,947,615 2,145,500 2,187,338 2,185,093
Operating costs and expenses:
Salaries and benefits 957,086 1,012,618 1,016,696 1,016,696
Supplies 226,561 244,590 249,792 249,792
Other operating expenses 558,149 623,966 650,783 650,783
Government settlement and related costs 20,544 26,350 —
Electronic health records incentive reimbursement(34,026)(44,660)(25,779)(25,779)
Rent 43,092 48,319 48,729 48,729
Depreciation and amortization 106,557 122,555 128,001 128,001
Amortization of software to be abandoned—5,038 —
Impairment of long lived assets 8,000 1,000 13,000 13,000
Total operating costs and expenses 1,885,963 2,039,776 2,081,222 2,081,222
Income from operations 61,652 105,724 106,116 103,871
Interest expense, net 99,465 92,926 98,290 113,197
Equity in earnings of unconsolidated affiliates(366)(134)(213)(213)
Income (loss) before income taxes(37,447) 12,932 8,039(9,113)
Provision for (benefit from) income taxes(12,102) 5,579 3,304(3,402)
Net income (loss)(25,345) 7,353 4,735(5,711)
Less: Net income (loss) attributable to noncontrolling interests(1,323)(448) 3,398 3,398
Net income (loss) attributable to Quorum Health $(24,022) $ 7,801 $ 1,337 $(9,109)
(1) Based on information available as of April 14, 2016.
41
|
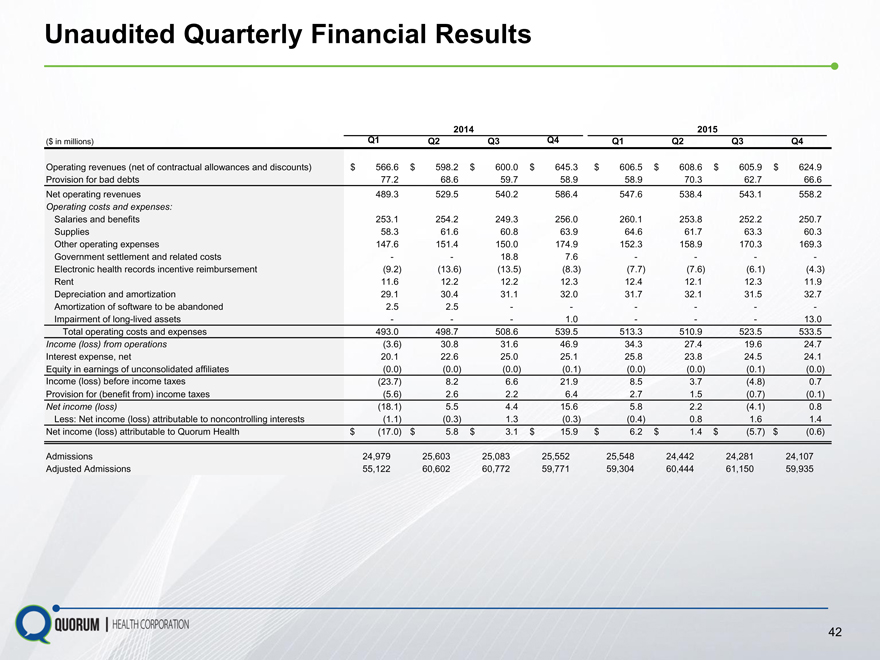
Unaudited Quarterly Financial Results
2014 2015
($ in millions) Q1 Q2 Q3 Q4 Q1 Q2 Q3 Q4
Operating revenues (net of contractual allowances and discounts) $ 566.6 $ 598.2 $ 600.0 $ 645.3 $ 606.5 $ 608.6 $ 605.9 $ 624.9
Provision for bad debts 77.2 68.6 59.7 58.9 58.9 70.3 62.7 66.6
Net operating revenues 489.3 529.5 540.2 586.4 547.6 538.4 543.1 558.2
Operating costs and expenses:
Salaries and benefits 253.1 254.2 249.3 256.0 260.1 253.8 252.2 250.7
Supplies 58.3 61.6 60.8 63.9 64.6 61.7 63.3 60.3
Other operating expenses 147.6 151.4 150.0 174.9 152.3 158.9 170.3 169.3
Government settlement and related costs — 18.8 7.6 — —
Electronic health records incentive reimbursement(9.2)(13.6)(13.5)(8.3)(7.7)(7.6)(6.1)(4.3)
Rent 11.6 12.2 12.2 12.3 12.4 12.1 12.3 11.9
Depreciation and amortization 29.1 30.4 31.1 32.0 31.7 32.1 31.5 32.7
Amortization of software to be abandoned 2.5 2.5 — — —
Impairment of long-lived assets ——1.0 ——13.0
Total operating costs and expenses 493.0 498.7 508.6 539.5 513.3 510.9 523.5 533.5
Income (loss) from operations(3.6) 30.8 31.6 46.9 34.3 27.4 19.6 24.7
Interest expense, net 20.1 22.6 25.0 25.1 25.8 23.8 24.5 24.1
Equity in earnings of unconsolidated affiliates(0.0)(0.0)(0.0)(0.1)(0.0)(0.0)(0.1)(0.0)
Income (loss) before income taxes(23.7) 8.2 6.6 21.9 8.5 3.7(4.8) 0.7
Provision for (benefit from) income taxes(5.6) 2.6 2.2 6.4 2.7 1.5(0.7)(0.1)
Net income (loss)(18.1) 5.5 4.4 15.6 5.8 2.2(4.1) 0.8
Less: Net income (loss) attributable to noncontrolling interests(1.1)(0.3) 1.3(0.3)(0.4) 0.8 1.6 1.4
Net income (loss) attributable to Quorum Health $ (17.0) $ 5.8 $ 3.1 $ 15.9 $ 6.2 $ 1.4 $(5.7) $(0.6)
Admissions 24,979 25,603 25,083 25,552 25,548 24,442 24,281 24,107
Adjusted Admissions 55,122 60,602 60,772 59,771 59,304 60,444 61,150 59,935
42
|
Quorum Health Corporation