Exhibit 99.2

Focus Financial Partners Inc. 2020 Second Quarter Earnings Release Supplement August 6, 2020

2 Disclaimer Special Note Regarding Forward - Looking Statements Some of the information in this presentation may contain forward - looking statements . Forward - looking statements give our current expectations, contain projections of results of operations or of financial condition, or forecasts of future events . Words such as “may,” “assume,” “forecast,” “position,” “predict,” “strategy,” “expect,” “intend,” “plan,” “estimate,” “anticipate,” “believe,” “project,” “budget,” “potential,” “continue,” “will” and similar expressions are used to identify forward - looking statements . They can be affected by assumptions used or by known or unknown risks or uncertainties . Consequently, no forward - looking statements can be guaranteed . When considering these forward - looking statements, you should keep in mind the risk factors and other cautionary statements in this presentation . Actual results may vary materially . You are cautioned not to place undue reliance on any forward - looking statements . You should also understand that it is not possible to predict or identify all such factors and should not consider the following list to be a complete statement of all potential risks and uncertainties . Factors that could cause our actual results to differ materially from the results contemplated by such forward - looking statements include the impact and duration of the outbreak of the novel coronavirus, fluctuations in wealth management fees, our reliance on our partner firms and the principals who manage their businesses, our ability to make successful acquisitions, unknown liabilities of or poor performance by acquired businesses, harm to our reputation, our inability to facilitate smooth succession planning at our partner firms, our inability to compete, our reliance on key personnel, our inability to attract, develop and retain talented wealth management professionals, our inability to retain clients following an acquisition, write down of goodwill and other intangible assets, our failure to maintain and properly safeguard an adequate technology infrastructure, cyber - attacks, our inability to recover from business continuity problems, inadequate insurance coverage, the termination of management agreements by management companies, our inability to generate sufficient cash to service all of our indebtedness, the failure of our partner firms to comply with applicable U . S . and non - U . S . regulatory requirements, legal proceedings and governmental inquiries and certain other factors . All forward - looking statements are expressly qualified in their entirety by the foregoing cautionary statements . Our forward - looking statements speak only as of the date of this presentation or as of the date as of which they are made . Except as required by applicable law, including federal securities laws, we do not intend to update or revise any forward - looking statements . Non - GAAP Financial Measures Adjusted EBITDA is a non - GAAP measure . Adjusted EBITDA is defined as net income (loss) excluding interest income, interest expense, income tax expense (benefit), amortization of debt financing costs, intangible amortization and impairments, if any, depreciation and other amortization, non - cash equity compensation expense, non - cash changes in fair value of estimated contingent consideration, gain on sale of investment, loss on extinguishment of borrowings, other expense/income, net, impairment of equity method investment, management contract buyout, delayed offering cost expense and other one time transaction expenses . We believe that Adjusted EBITDA, viewed in addition to and not in lieu of, our reported GAAP results, provides additional useful information to investors regarding our performance and overall results of operations for various reasons, including the following : (i) non - cash equity grants made to employees or non - employees at a certain price and point in time do not necessarily reflect how our business is performing at any particular time ; stock - based compensation expense is not a key measure of our operating performance, (ii) contingent consideration or earn outs can vary substantially from company to company and depending upon each company’s growth metrics and accounting assumption methods ; the non - cash changes in fair value of estimated contingent consideration is not considered a key measure in comparing our operating performance, and (iii) amortization expenses can vary substantially from company to company and from period to period depending upon each company’s financing and accounting methods, the fair value and average expected life of acquired intangible assets and the method by which assets were acquired ; the amortization of intangible assets obtained in acquisitions are not considered a key measure in comparing our operating performance . We use Adjusted EBITDA (i) as a measure of operating performance, (ii) for planning purposes, including the preparation of budgets and forecasts, (iii) to allocate resources to enhance the financial performance of our business, and (iv) to evaluate the effectiveness of our business strategies . Adjusted EBITDA does not purport to be an alternative to net income (loss) or cash flows from operating activities . The term Adjusted EBITDA is not defined under GAAP, and Adjusted EBITDA is not a measure of net income (loss), operating income or any other performance or liquidity measure derived in accordance with GAAP . Therefore, Adjusted EBITDA has limitations as an analytical tool and should not be considered in isolation or as a substitute for analysis of our results as reported under GAAP . Some of these limitations are : (i) Adjusted EBITDA does not reflect all cash expenditures, future requirements for capital expenditures or contractual commitments, (ii) Adjusted EBITDA does not reflect changes in, or cash requirements for, working capital needs, and (iii) Adjusted EBITDA does not reflect the interest expense on our debt or the cash requirements necessary to service interest or principal payments . In addition, Adjusted EBITDA can differ significantly from company to company depending on strategic decisions regarding capital structure, the tax jurisdictions in which companies operate and capital investments . We compensate for these limitations by relying also on the GAAP results and using Adjusted EBITDA as supplemental information . We analyze our performance using Adjusted Net Income and Adjusted Net Income Per Share . Adjusted Net Income and Adjusted Net Income Per Share are non GAAP measures . We define Adjusted Net Income as net income (loss) excluding income tax expense (benefit), amortization of debt financing costs, intangible amortization and impairments, if any, non - cash equity compensation expense, non - cash changes in fair value of estimated contingent consideration, gain on sale of investment, loss on extinguishment of borrowings, impairment of equity method investment, delayed offering cost expense, management contract buyout and other one time transaction expenses . The calculation of Adjusted Net Income also includes adjustments to reflect (i) a pro forma 27 % income tax rate assuming all earnings of Focus LLC were recognized by Focus Inc . and no earnings were attributable to non controlling interests and (ii) tax adjustments from intangible asset related income tax benefits from acquisitions based on a pro forma 27 % tax rate . We believe that Adjusted Net Income and Adjusted Net Income Per Share, viewed in addition to and not in lieu of, our reported GAAP results, provide additional useful information to investors regarding our performance and overall results of operations for various reasons, including the following : (i) non - cash equity grants made to employees or non - employees at a certain price and point in time do not necessarily reflect how our business is performing at any particular time ; stock - based compensation expense is not a key measure of our operating performance, (ii) contingent consideration or earn outs can vary substantially from company to company and depending upon each company’s growth metrics and accounting assumption methods ; the non - cash changes in fair value of estimated contingent consideration is not considered a key measure in comparing our operating performance, and (iii) amortization expenses can vary substantially from company to company and from period to period depending upon each company’s financing and accounting methods, the fair value and average expected life of acquired intangible assets and the method by which assets were acquired ; the amortization of intangible assets obtained in acquisitions are not considered a key measure in comparing our operating performance . Adjusted Net Income and Adjusted Net Income Per Share do not purport to be an alternative to net income (loss) or cash flows from operating activities . The terms Adjusted Net Income and Adjusted Net Income Per Share are not defined under GAAP, and Adjusted Net Income and Adjusted Net Income Per Share are not a measure of net income (loss), operating income or any other performance or liquidity measure derived in accordance with GAAP . Therefore, Adjusted Net Income and Adjusted Net Income Per Share have limitations as an analytical tool and should not be considered in isolation or as a substitute for analysis of our results as reported under GAAP . Some of these limitations are : (i) Adjusted Net Income and Adjusted Net Income Per Share do not reflect all cash expenditures, future requirements for capital expenditures or contractual commitments, (ii) Adjusted Net Income and Adjusted Net Income Per Share do not reflect changes in, or cash requirements for, working capital needs, and (iii) Other companies in the financial services industry may calculate Adjusted Net Income and Adjusted Net Income Per Share differently than we do, limiting its usefulness as a comparative measure . In addition, Adjusted Net Income and Adjusted Net Income Per Share can differ significantly from company to company depending on strategic decisions regarding capital structure, the tax jurisdictions in which companies operate and capital investments . We compensate for these limitations by relying also on the GAAP results and use Adjusted Net Income and Adjusted Net Income Per Share as supplemental information . To supplement our statements of cash flows presented on a GAAP basis, we use non - GAAP liquidity measures on a trailing 4 - quarter basis to analyze cash flows generated from our operations . We consider Adjusted Free Cash Flow and Cash Flow Available for Capital Allocation to be liquidity measures that provide useful information to investors about the amount of cash generated by the business and are two factors in evaluating the amount of cash available to pay contingent consideration, make strategic acquisitions and repay outstanding borrowings . Adjusted Free Cash Flow and Cash Flow Available for Capital Allocation do not represent our residual cash flow available for discretionary expenditures as they do not deduct our mandatory debt service requirements and other non - discretionary expenditures . We define Adjusted Free Cash Flow as net cash provided by operating activities, less purchase of fixed assets, distributions for unitholders and payments under tax receivable agreements (if any) . We define Cash Flow Available for Capital Allocation as Adjusted Free Cash Flow plus the portion of contingent consideration paid which is classified as operating cash flows under GAAP . Adjusted Free Cash Flow and Cash Flow Available for Capital Allocation are not defined under GAAP and should not be considered as alternatives to net cash from operating, investing or financing activities . In addition, Adjusted Free Cash Flow and Cash Flow Available for Capital Allocation can differ significantly from company to company .
Table of Contents 3 Pages Long - Term Growth Trends 4 - 7 Second Quarter 2020 Recap 8 - 17 RIA Industry Growth Trends 18 - 20 Third Quarter 2020 Outlook 21 - 22 Leverage Sensitivity Analysis 23 - 25 Cash Flows 26 - 28 Appendix 29 - 33
Long - Term Growth Trends 4

1. Non - GAAP financial measure. See Appendix for reconciliations. Resilient Business Model Drives Strong and Sustained Financial Performance 5 $325.6 $382.3 $485.4 $662.9 $910.9 $1,218.3 $650.2 2014 2015 2016 2017 2018 2019 Q2 2020 YTD Revenues ($ in millions) CAGR: 30.2% $0.65 $0.73 $0.95 $1.21 $1.74 $2.38 $1.43 2014 2015 2016 2017 2018 2019 Q2 2020 YTD ANI Per Share (1) CAGR: 29.6% $67.8 $75.4 $103.0 $145.2 $203.4 $269.8 $152.8 2014 2015 2016 2017 2018 2019 Q2 2020 YTD Adjusted EBITDA (1) ($ in millions) CAGR: 31.8% $46.7 $52.3 $68.6 $86.7 $125.3 $178.6 $108.7 2014 2015 2016 2017 2018 2019 Q2 2020 YTD Adjusted Net Income (1) ($ in millions) CAGR: 30.8%
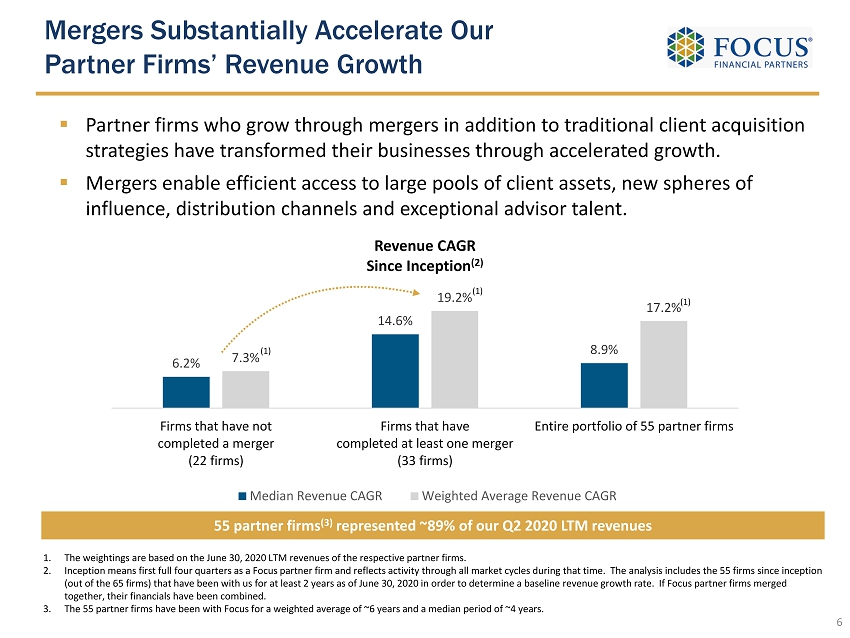
1. The weightings are based on the June 30, 2020 LTM revenues of the respective partner firms. 2. Inception means first full four quarters as a Focus partner firm and reflects activity through all market cycles during that tim e. The analysis includes the 55 firms since inception (out of the 65 firms) that have been with us for at least 2 years as of June 30, 2020 in order to determine a baseline revenu e g rowth rate. If Focus partner firms merged together, their financials have been combined. 3. The 55 partner firms have been with Focus for a weighted average of ~6 years and a median period of ~4 years. 6.2% 14.6% 8.9% 7.3% 19.2% 17.2% Firms that have not completed a merger (22 firms) Firms that have completed at least one merger (33 firms) Entire portfolio of 55 partner firms Revenue CAGR Since Inception (2) Median Revenue CAGR Weighted Average Revenue CAGR Mergers Substantially Accelerate Our Partner Firms’ Revenue Growth 6 ▪ Partner firms who grow through mergers in addition to traditional client acquisition strategies have transformed their businesses through accelerated growth. ▪ Mergers enable efficient access to large pools of client assets, new spheres of influence, distribution channels and exceptional advisor talent. 55 partner firms (3) represented ~89% of our Q2 2020 LTM revenues (1) (1) (1)
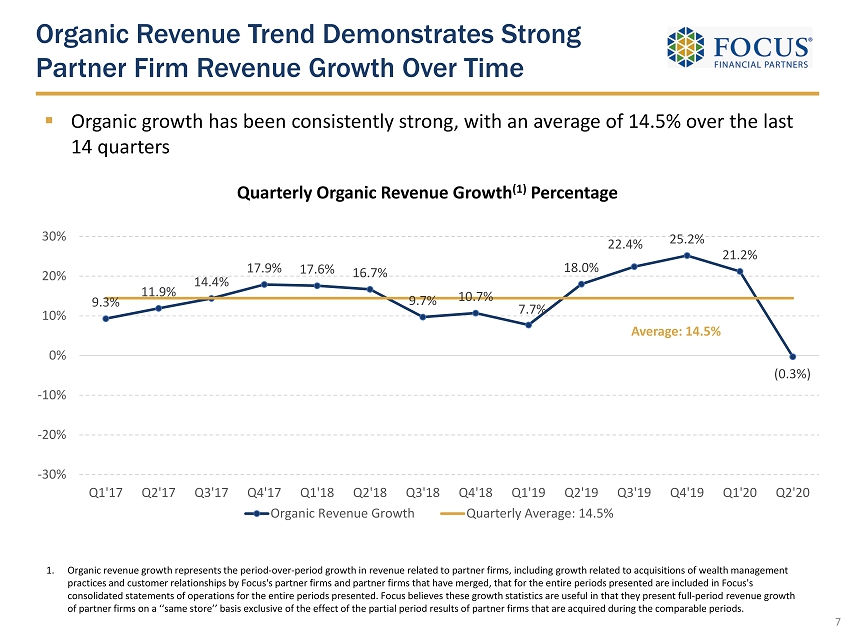
Organic Revenue Trend Demonstrates Strong Partner Firm Revenue Growth Over Time ▪ Organic growth has been consistently strong, with an average of 14.5% over the last 14 quarters 1. Organic revenue growth represents the period - over - period growth in revenue related to partner firms, including growth related to acquisitions of wealth management practices and customer relationships by Focus's partner firms and partner firms that have merged, that for the entire periods pr esented are included in Focus's consolidated statements of operations for the entire periods presented. Focus believes these growth statistics are useful in tha t they present full - period revenue growth of partner firms on a ‘‘same store’’ basis exclusive of the effect of the partial period results of partner firms that are ac qui red during the comparable periods. 7 9.3% 11.9% 14.4% 17.9% 17.6% 16.7% 9.7% 10.7% 7.7% 18.0% 22.4% 25.2% 21.2% (0.3%) -30% -20% -10% 0% 10% 20% 30% Q1'17 Q2'17 Q3'17 Q4'17 Q1'18 Q2'18 Q3'18 Q4'18 Q1'19 Q2'19 Q3'19 Q4'19 Q1'20 Q2'20 Quarterly Organic Revenue Growth (1) Percentage Organic Revenue Growth Quarterly Average: 14.5% Average: 14.5%
Second Quarter 2020 Recap 8
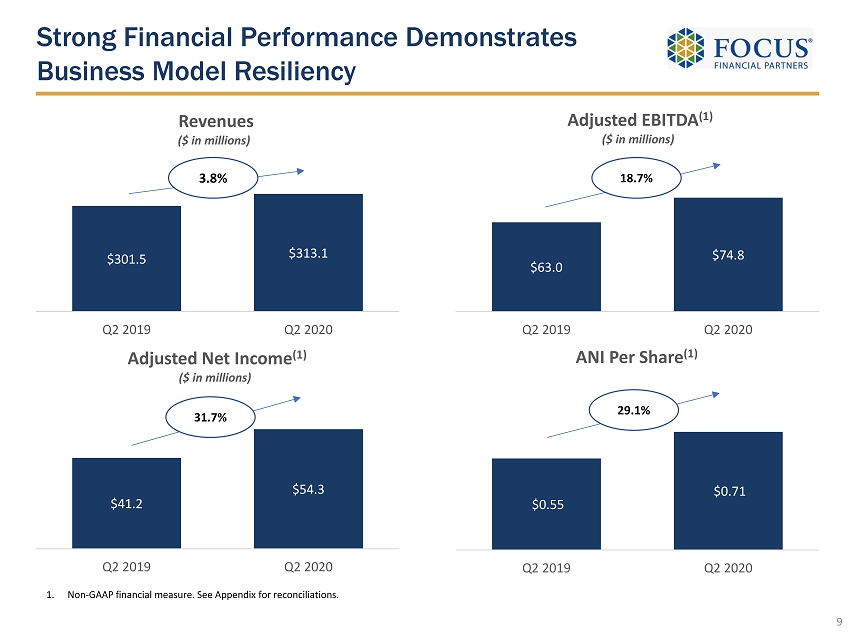
Strong Financial Performance Demonstrates Business Model Resiliency 1. Non - GAAP financial measure. See Appendix for reconciliations. 9 $301.5 $313.1 Q2 2019 Q2 2020 Revenues ($ in millions) 3.8% $0.55 $0.71 Q2 2019 Q2 2020 ANI Per Share (1) 29.1% $63.0 $74.8 Q2 2019 Q2 2020 Adjusted EBITDA (1) ($ in millions) 18.7% $41.2 $54.3 Q2 2019 Q2 2020 Adjusted Net Income (1) ($ in millions) 31.7%
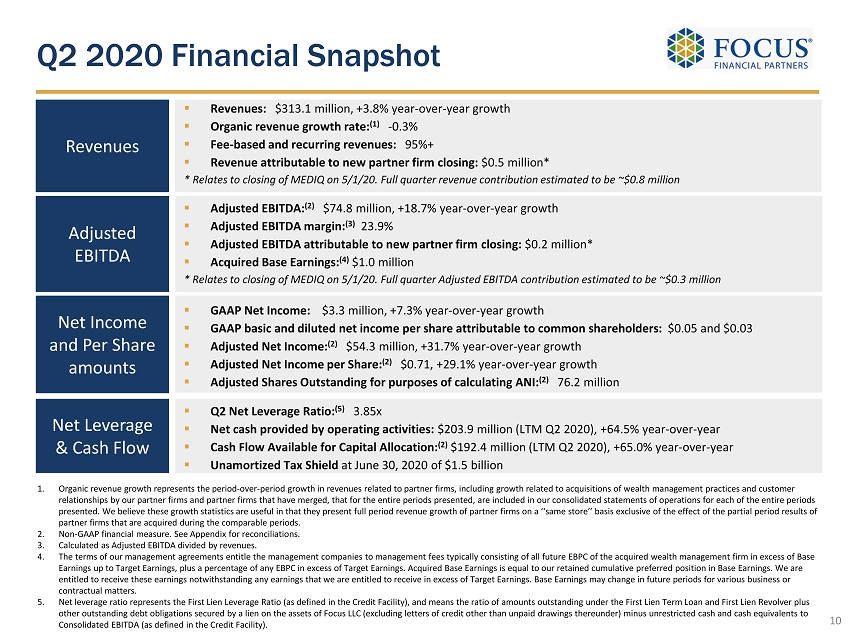
▪ GAAP Net Income: $3.3 million, +7.3% year - over - year growth ▪ GAAP basic and diluted net income per share attributable to common shareholders: $0.05 and $0.03 ▪ Adjusted Net Income: (2) $54.3 million, +31.7% year - over - year growth ▪ Adjusted Net Income per Share: (2) $0.71, +29.1% year - over - year growth ▪ Adjusted Shares Outstanding for purposes of calculating ANI : (2) 76.2 million ▪ Adjusted EBITDA: (2) $74.8 million, + 18.7 % year - over - year growth ▪ Adjusted EBITDA margin: (3) 23.9% ▪ Adjusted EBITDA attributable to new partner firm closing: $0.2 million* ▪ Acquired Base Earnings: (4) $1.0 million * Relates to closing of MEDIQ on 5/1/20. Full quarter Adjusted EBITDA contribution estimated to be ~$0.3 million ▪ Revenues: $313.1 million, +3.8% year - over - year growth ▪ Organic revenue growth rate: (1) - 0.3 % ▪ Fee - based and recurring revenues: 95%+ ▪ Revenue attributable to new partner firm closing: $ 0.5 million* * Relates to closing of MEDIQ on 5/1/20. Full quarter revenue contribution estimated to be ~$ 0.8 million Adjusted EBITDA Q2 2020 Financial Snapshot Revenues Net Income and Per Share amounts 1. Organic revenue growth represents the period - over - period growth in revenues related to partner firms, including growth related t o acquisitions of wealth management practices and customer relationships by our partner firms and partner firms that have merged, that for the entire periods presented, are included in ou r consolidated statements of operations for each of the entire periods presented. We believe these growth statistics are useful in that they present full period revenue growth of partner firms on a ‘ ‘same store’’ basis exclusive of the effect of the partial period results of partner firms that are acquired during the comparable periods. 2. Non - GAAP financial measure. See Appendix for reconciliations. 3. Calculated as Adjusted EBITDA divided by revenues. 4. The terms of our management agreements entitle the management companies to management fees typically consisting of all future EB PC of the acquired wealth management firm in excess of Base Earnings up to Target Earnings, plus a percentage of any EBPC in excess of Target Earnings. Acquired Base Earnings is equal t o o ur retained cumulative preferred position in Base Earnings. We are entitled to receive these earnings notwithstanding any earnings that we are entitled to receive in excess of Target Earnings. Ba se Earnings may change in future periods for various business or contractual matters. 5. Net leverage ratio represents the First Lien Leverage Ratio (as defined in the Credit Facility), and means the ratio of amoun ts outstanding under the First Lien Term Loan and First Lien Revolver plus other outstanding debt obligations secured by a lien on the assets of Focus LLC (excluding letters of credit other than unpai d d rawings thereunder) minus unrestricted cash and cash equivalents to Consolidated EBITDA (as defined in the Credit Facility). 10 Net Leverage & Cash Flow ▪ Q2 Net Leverage Ratio: (5) 3 .85x ▪ Net cash provided by operating activities: $203.9 million (LTM Q2 2020), +64.5% year - over - year ▪ Cash Flow Available for Capital Allocation: (2) $192.4 million (LTM Q2 2020), + 65.0 % year - over - year ▪ Unamortized Tax Shield at June 30, 2020 of $1.5 billion

Q2 Performance Demonstrated the Stability and Resiliency of Our Business 11 Q2 2020 results exceeded the high end of our expectations despite market volatility … ▪ Q2 revenues of $313.1 million above $290 - $300 million expectations as market conditions improved and family office service type revenues were better than anticipated. ▪ Adjusted EBITDA margin (1) was 23.9%, well above 22.0% expectations as expense management across the partnership was also better than expected. ▪ Earnings preference not a concern because partner firms are stable and adjusting costs where needed. ▪ Net Leverage R atio (2) of 3.85x as of June 30, 2020 and reaffirmation of 3.5x to 4.5x target Net Leverage range. … Demonstrating the stability and resiliency of our business model ▪ Revenues are 95+% fee - based and recurring and are generated from diverse sources, reducing the impact of market volatility. ▪ Earnings preference protects Adjusted EBITDA when revenues decline. ▪ Expense base is highly variable because management fees, second largest expense category, automatically adjust with the profitability of our partner firms. ▪ Partner firms are performing well through the crisis and managing their costs effectively. ▪ High degree of financial alignment between Focus and its partner firms. 1. Calculated as Adjusted EBITDA divided by revenues. 2. Net leverage ratio represents the First Lien Leverage Ratio (as defined in the Credit Facility), and means the ratio of amoun ts outstanding under the First Lien Term Loan and First Lien Revolver plus other outstanding debt obligations secured by a lien on the assets of Focus LLC (excluding letters o f c redit other than unpaid drawings thereunder) minus unrestricted cash and cash equivalents to Consolidated EBITDA (as defined in the Credit Facility).
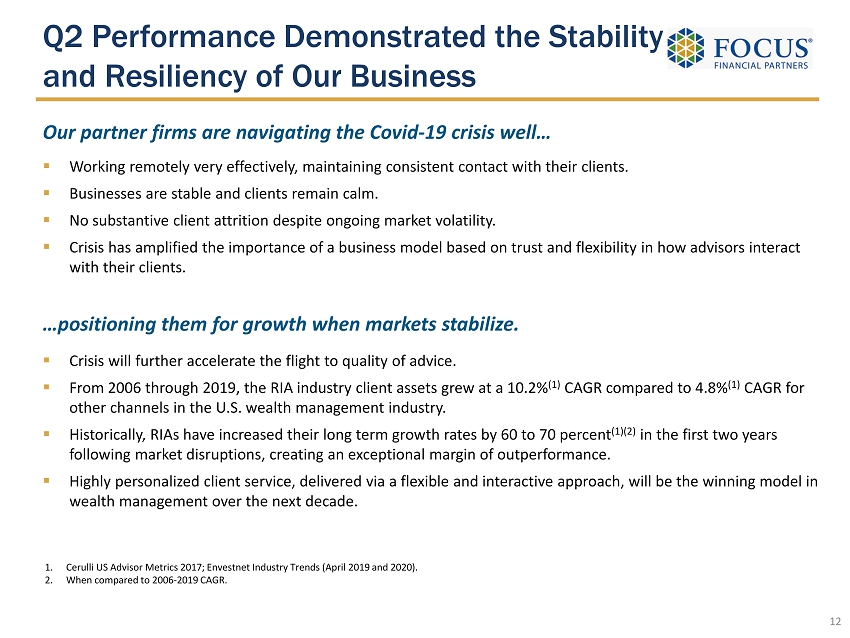
Q2 Performance Demonstrated the Stability and Resiliency of Our Business 12 Our partner firms are navigating the Covid - 19 crisis well… ▪ Working remotely very effectively, maintaining consistent contact with their clients. ▪ Businesses are stable and clients remain calm. ▪ No substantive client attrition despite ongoing market volatility. ▪ Crisis has amplified the importance of a business model based on trust and flexibility in how advisors interact with their clients. …positioning them for growth when markets stabilize. ▪ Crisis will further accelerate the flight to quality of advice. ▪ From 2006 through 2019, the RIA industry client assets grew at a 10.2% (1) CAGR compared to 4.8% (1) CAGR for other channels in the U.S. wealth management industry. ▪ Historically, RIAs have increased their long term growth rates by 60 to 70 percent (1)(2) in the first two years following market disruptions, creating an exceptional margin of outperformance. ▪ Highly personalized client service, delivered via a flexible and interactive approach, will be the winning model in wealth management over the next decade. 1. Cerulli US Advisor Metrics 2017; Envestnet Industry Trends (April 2019 and 2020). 2. When compared to 2006 - 2019 CAGR.
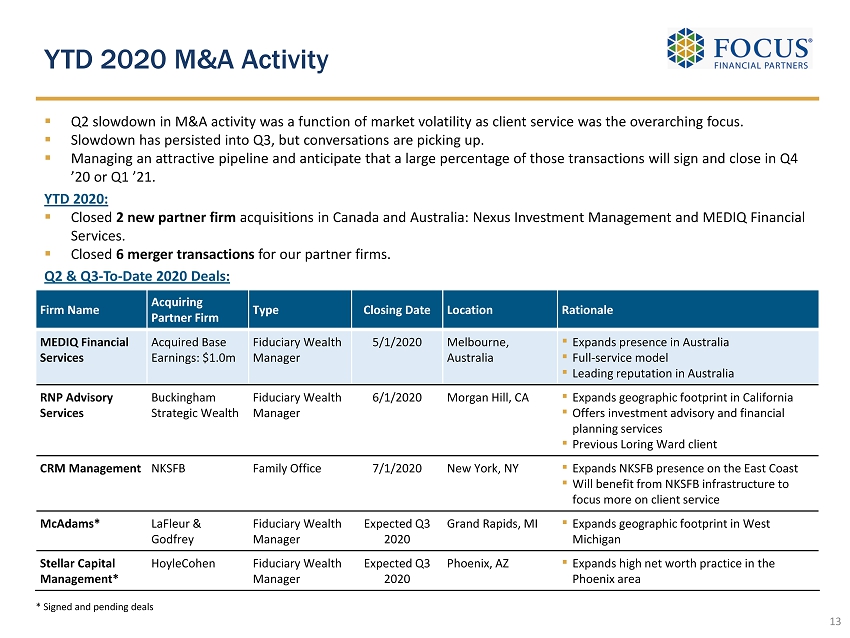
▪ Q2 slowdown in M&A activity was a function of market volatility as client service was the overarching focus. ▪ Slowdown has persisted into Q3, but conversations are picking up. ▪ Managing an attractive pipeline and anticipate that a large percentage of those transactions will sign and close in Q4 ’20 or Q1 ’21. YTD 2020: ▪ Closed 2 new partner firm acquisitions in Canada and Australia: Nexus Investment Management and MEDIQ Financial Services. ▪ Closed 6 merger transactions for our partner firms. Q2 & Q3 - To - Date 2020 Deals: YTD 2020 M&A Activity 13 * Signed and pending deals Firm Name Acquiring Partner Firm Type Closing Date Location Rationale MEDIQ Financial Services Acquired Base Earnings: $1.0m Fiduciary Wealth Manager 5/1/2020 Melbourne, Australia ▪ Expands presence in Australia ▪ Full - service model ▪ Leading reputation in Australia RNP Advisory Services Buckingham Strategic Wealth Fiduciary Wealth Manager 6/1/2020 Morgan Hill, CA ▪ Expands geographic footprint in California ▪ Offers investment advisory and financial planning services ▪ Previous Loring Ward client CRM Management NKSFB Family Office 7/1/2020 New York, NY ▪ Expands NKSFB presence on the East Coast ▪ Will benefit from NKSFB infrastructure to focus more on client service McAdams* LaFleur & Godfrey Fiduciary Wealth Manager Expected Q3 2020 Grand Rapids, MI ▪ Expands geographic footprint in West Michigan Stellar Capital Management* HoyleCohen Fiduciary Wealth Manager Expected Q3 2020 Phoenix, AZ ▪ Expands high net worth practice in the Phoenix area
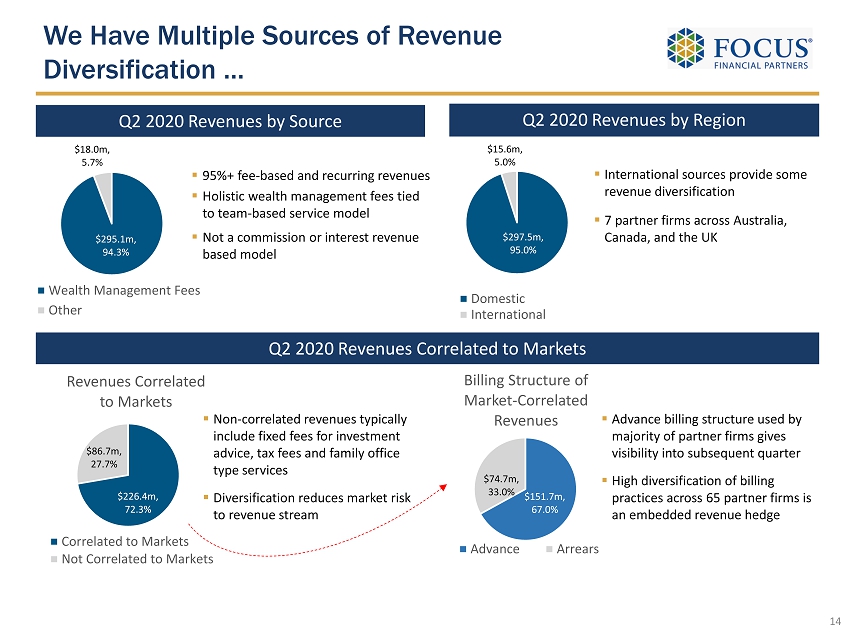
$295.1m , 94.3% $18.0m , 5.7% Wealth Management Fees Other ▪ 95%+ fee - based and recurring revenues ▪ Holistic wealth management fees tied to team - based service model ▪ Not a commission or interest revenue based model We Have Multiple Sources of Revenue Diversification … $226.4m , 72.3% $86.7m , 27.7% Revenues Correlated to Markets Correlated to Markets Not Correlated to Markets ▪ Advance billing structure used by majority of partner firms gives visibility into subsequent quarter ▪ High diversification of billing practices across 65 partner firms is an embedded revenue hedge ▪ Non - correlated revenues typically include fixed fees for investment advice, tax fees and family office type services ▪ Diversification reduces market risk to revenue stream ▪ International sources provide some revenue diversification ▪ 7 partner firms across Australia, Canada, and the UK $297.5m , 95.0% $15.6m , 5.0% Domestic International Q2 2020 Revenues by Source Q2 2020 Revenues by Region Q2 2020 Revenues Correlated to Markets 14 $151.7m , 67.0% $74.7m , 33.0% Billing Structure of Market - Correlated Revenues Advance Arrears
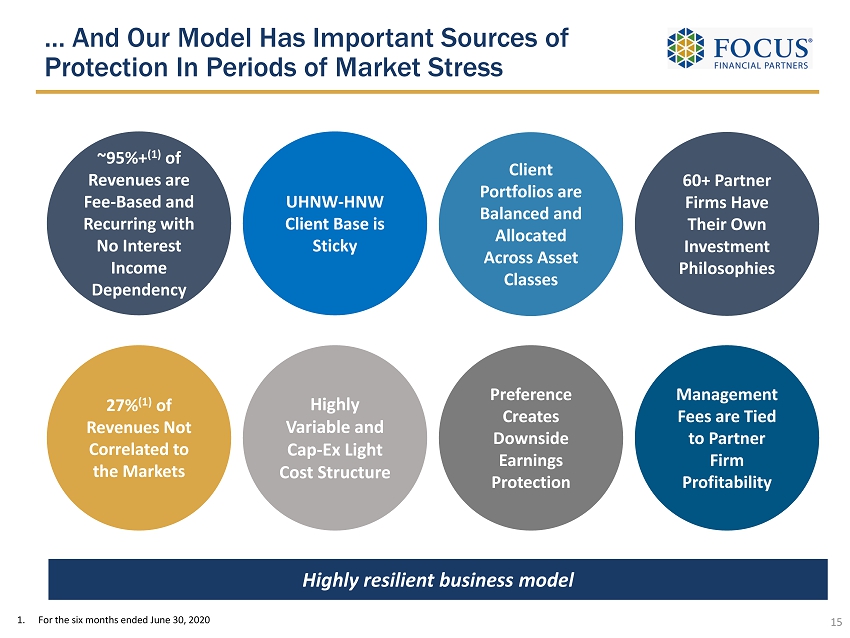
… And Our Model Has Important Sources of Protection In Periods of Market Stress ~95%+ (1) of Revenues are Fee - Based and Recurring with No Interest Income Dependency Preference Creates Downside Earnings Protection 27% (1) of Revenues Not Correlated to the Markets Client Portfolios are Balanced and Allocated Across Asset Classes UHNW - HNW Client Base is Sticky 60+ Partner Firms Have Their Own Investment Philosophies Management Fees are Tied to Partner Firm Profitability Highly Variable and Cap - Ex Light Cost Structure 15 Highly resilient business model 1. For the six months ended June 30, 2020

…Positioning Our Business for Continued Success Post Crisis Strong Financial Fundamentals Resilient Business Model Capital Resources Publicly Traded 60+ Partner Firms 16 - Year Track Record Industry - Leading Scale 16 Positioned for Growth

17 Feedback from The Partnership: Growth Through Differentiated Client Service Please see the video on our website in which our partners discuss their perspectives on client service. Kelly Downing CEO Bartlett Wealth Management Tom Myers Managing Partner and CEO Bordeaux Wealth Advisors Hank McLarty Founder and President Gratus Capital Mickey Segal Managing Partner NKSFB “ From an entrepreneurial perspective, we’re able to create a vision, we can be nimble, and we can change … and I can tell you after 15 years in a wirehouse , they don’t change fast, even when it’s necessary. ” “ I really think the biggest thing is the accessibility. You’re talking about some - body with 10, 20, 50 million dollars under management at your firm, they expect to be able to talk to the decision makers. ” “ The biggest learning for us has been that we can do this digitally. It saves them a lot of time and at some point, they can come in and kick the tires and see the office. ” “ We’re starting to find that clients are concerned that the firms they’re with are going to be here when the dust settles. We’re seeing long - term clients moving … so I think the future is very, very bright in our space. ” Melissa Bouchillon Managing Partner Soundview Wealth Advisors “ It’s markets like these that cause investors to reflect on whether the advisors they’re working with are doing a good job, or whether their confidence is shaken from being self - directed and they start to seek advice … those are all tailwinds for us. ”

RIA Industry Growth Trends 18

▪ RIAs are the fastest growing segment of market share of advisor managed assets, growing at a 10.2% CAGR, compared to the other channels in the industry growing at an average of 4.8% CAGR. RIA Growth is Outpacing Other Sectors in Wealth Management … 19 15% 17% 17% 19% 20% 19% 21% 21% 22% 23% 23% 23% 24% 25% 46% 43% 41% 39% 40% 41% 40% 38% 38% 36% 36% 35% 34% 33% 39% 41% 42% 42% 40% 40% 39% 40% 40% 41% 41% 41% 42% 42% 0% 20% 40% 60% 80% 100% 2006 2007 2008 2009 2010 2011 2012 2013 2014 2015 2016 2017 2018 2019 +3% (13%) +10% 1,727 6,124 5,364 8,100 4,547 10,174 $11,638 bn $24,398 bn 2006 2019 B/D Wirehouse RIA +10.2% CAGR / +10% Market Share +3.2% CAGR / - 13% Market Share +6.4% CAGR / +3% Market Share Advisor Managed Assets (1) 1. Broker Dealers include National and regional B/D, IBD, Insurance B/D and Retail bank B/D. Sources: Cerulli US Advisor Metrics 2017; Envestnet Industry Trends (April 2019 and 2020).
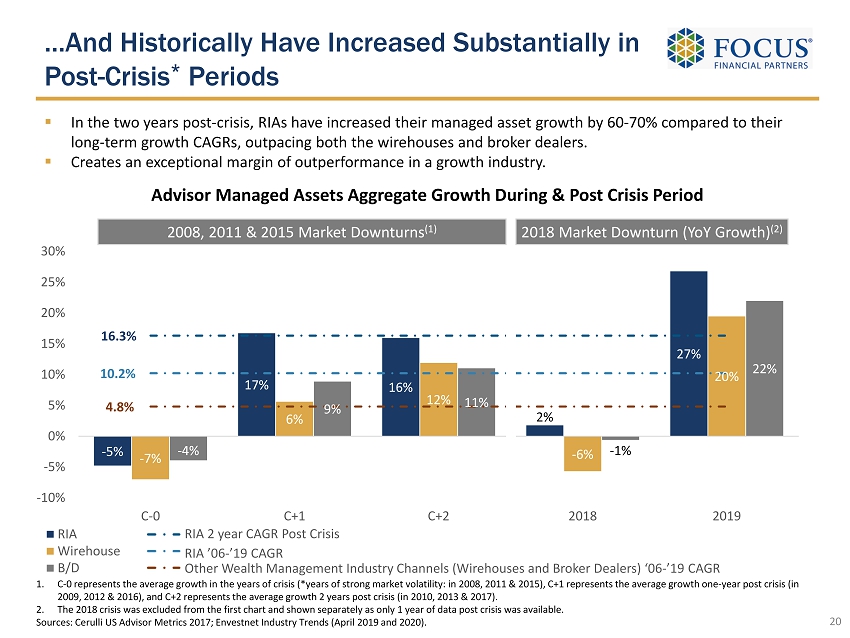
▪ In the two years post - crisis, RIAs have increased their managed asset growth by 60 - 70% compared to their long - term growth CAGRs, outpacing both the wirehouses and broker dealers. ▪ Creates an exceptional margin of outperformance in a growth industry. …And Historically Have Increased Substantially in Post - Crisis * Periods 20 2008, 2011 & 2015 Market Downturns (1) 2018 Market Downturn (YoY Growth) (2) - 5% 17% 16% 2% 27% - 7% 6% 12% - 6% 20% - 4% 9% 11% - 1% 22% 16.3% 10.2% 4.8% -10% -5% 0% 5% 10% 15% 20% 25% 30% C-0 C+1 C+2 2018 2019 RIA Wirehouse B/D 1. C - 0 represents the average growth in the years of crisis (*years of strong market volatility: in 2008, 2011 & 2015), C+1 repres e nts the average growth one - year post crisis (in 2009, 2012 & 2016), and C+2 represents the average growth 2 years post crisis (in 2010, 2013 & 2017). 2. The 2018 crisis was excluded from the first chart and shown separately as only 1 year of data post crisis was available. Sources: Cerulli US Advisor Metrics 2017; Envestnet Industry Trends (April 2019 and 2020). Advisor Managed Assets Aggregate Growth During & Post Crisis Period RIA 2 year CAGR Post Crisis RIA ’06 - ’19 CAGR Other Wealth Management Industry Channels ( Wirehouses and Broker Dealers) ‘06 - ’19 CAGR

21 Third Quarter 2020 Outlook
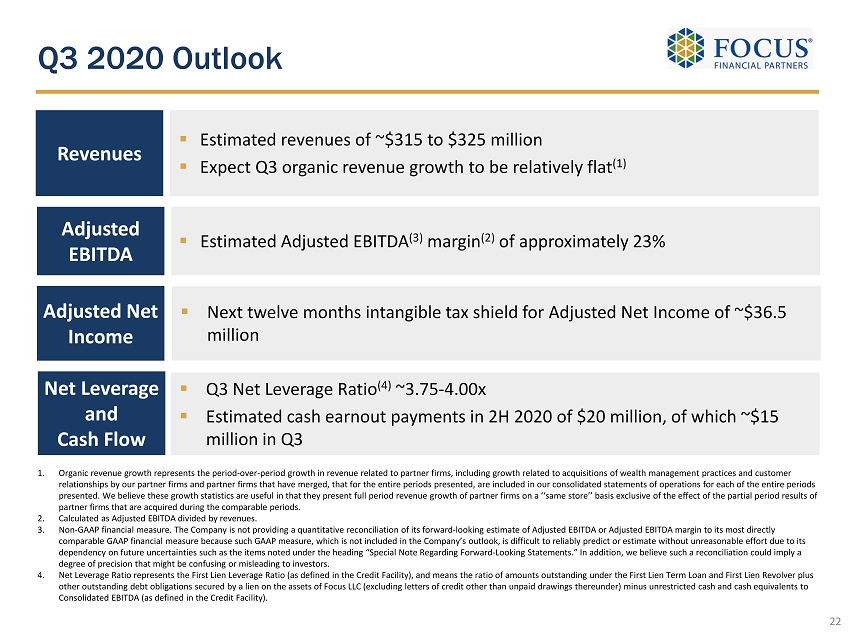
▪ Q3 Net Leverage Ratio (4) ~3.75 - 4.00x ▪ Estimated cash earnout payments in 2H 2020 of $20 million, of which ~$15 million in Q3 Q3 2020 Outlook ▪ Estimated Adjusted EBITDA (3) margin (2) of approximately 23% 1. Organic revenue growth represents the period - over - period growth in revenue related to partner firms, including growth related to acquisitions of wealth management practices and customer relationships by our partner firms and partner firms that have merged, that for the entire periods presented, are included in ou r consolidated statements of operations for each of the entire periods presented. We believe these growth statistics are useful in that they present full period revenue growth of partner firms on a ‘ ‘same store’’ basis exclusive of the effect of the partial period results of partner firms that are acquired during the comparable periods. 2. Calculated as Adjusted EBITDA divided by revenues. 3. Non - GAAP financial measure. The Company is not providing a quantitative reconciliation of its forward - looking estimate of Adjust ed EBITDA or Adjusted EBITDA margin to its most directly comparable GAAP financial measure because such GAAP measure, which is not included in the Company’s outlook, is difficult to rel iably predict or estimate without unreasonable effort due to its dependency on future uncertainties such as the items noted under the heading “Special Note Regarding Forward - Looking Statements. ” In addition, we believe such a reconciliation could imply a degree of precision that might be confusing or misleading to investors. 4. Net Leverage Ratio represents the First Lien Leverage Ratio (as defined in the Credit Facility), and means the ratio of amoun ts outstanding under the First Lien Term Loan and First Lien Revolver plus other outstanding debt obligations secured by a lien on the assets of Focus LLC (excluding letters of credit other than unpai d d rawings thereunder) minus unrestricted cash and cash equivalents to Consolidated EBITDA (as defined in the Credit Facility). ▪ Estimated revenues of ~$315 to $325 million ▪ Expect Q3 organic revenue growth to be relatively flat (1) 22 Revenues Adjusted EBITDA ▪ Next twelve months intangible tax shield for Adjusted Net Income of ~$36.5 million Adjusted Net Income Net Leverage and Cash Flow

Leverage Sensitivity Analysis 23
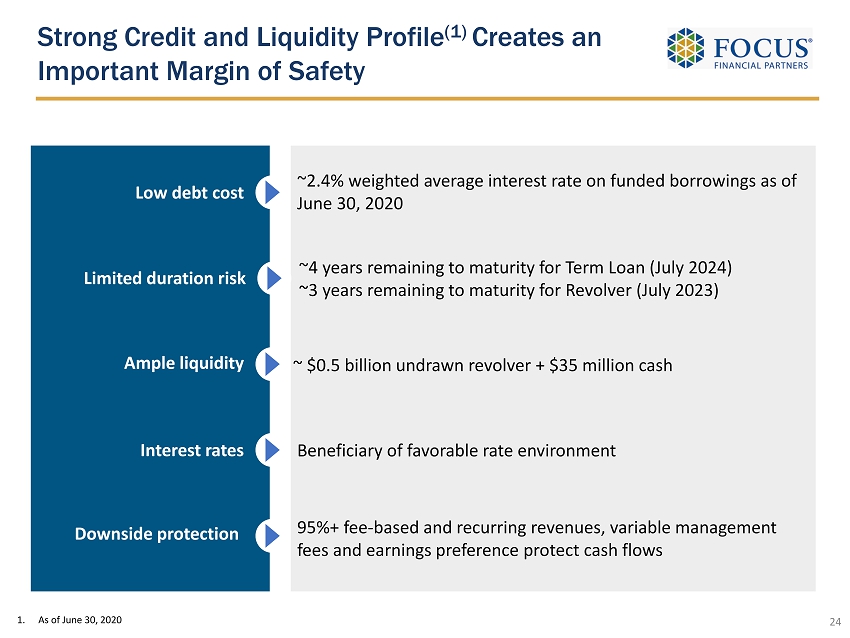
Strong Credit and Liquidity Profile (1) Creates an Important Margin of Safety Low debt cost ~2.4% weighted average interest rate on funded borrowings as of June 30, 2020 Limited duration risk ~4 years remaining to maturity for Term Loan (July 2024) ~3 years remaining to maturity for Revolver (July 2023) Ample liquidity ~ $0.5 billion undrawn revolver + $35 million cash Interest rates Beneficiary of favorable rate environment 95%+ fee - based and recurring revenues, variable management fees and earnings preference protect cash flows Downside protection 24 1. As of June 30, 2020
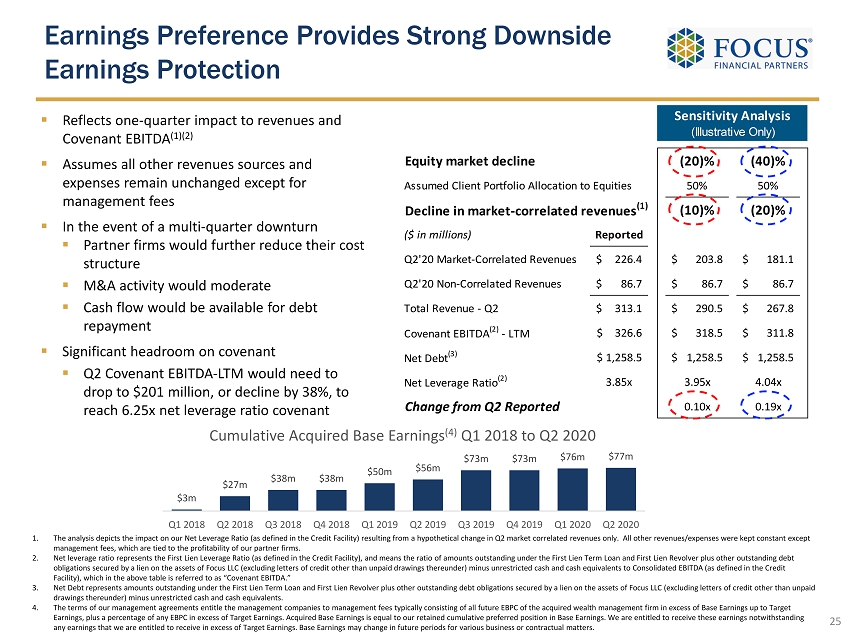
Equity market decline (20)% (40)% Assumed Client Portfolio Allocation to Equities 50% 50% Decline in market-correlated revenues (1) (10)% (20)% ($ in millions) Reported Q2'20 Market-Correlated Revenues 226.4$ 203.8$ 181.1$ Q2'20 Non-Correlated Revenues 86.7$ 86.7$ 86.7$ Total Revenue - Q2 313.1$ 290.5$ 267.8$ Covenant EBITDA (2) - LTM 326.6$ 318.5$ 311.8$ Net Debt (3) 1,258.5$ 1,258.5$ 1,258.5$ Net Leverage Ratio (2) 3.85x 3.95x 4.04x Change from Q2 Reported 0.10x 0.19x Sensitivity Analysis (Illustrative Only) Earnings Preference Provides Strong Downside Earnings Protection 1. The analysis depicts the impact on our Net Leverage Ratio (as defined in the Credit Facility) resulting from a hypothetical c han ge in Q2 market correlated revenues only. All other revenues/expenses were kept constant except management fees, which are tied to the profitability of our partner firms. 2. Net leverage ratio represents the First Lien Leverage Ratio (as defined in the Credit Facility), and means the ratio of amoun ts outstanding under the First Lien Term Loan and First Lien Revolver plus other outstanding debt obligations secured by a lien on the assets of Focus LLC (excluding letters of credit other than unpaid drawings thereunder) min us unrestricted cash and cash equivalents to Consolidated EBITDA (as defined in the Credit Facility), which in the above table is referred to as “Covenant EBITDA.” 3. Net Debt represents amounts outstanding under the First Lien Term Loan and First Lien Revolver plus other outstanding debt ob lig ations secured by a lien on the assets of Focus LLC (excluding letters of credit other than unpaid drawings thereunder) minus unrestricted cash and cash equivalents. 4. The terms of our management agreements entitle the management companies to management fees typically consisting of all future EB PC of the acquired wealth management firm in excess of Base Earnings up to Target Earnings, plus a percentage of any EBPC in excess of Target Earnings. Acquired Base Earnings is equal to our retained cumulat ive preferred position in Base Earnings. We are entitled to receive these earnings notwithstanding any earnings that we are entitled to receive in excess of Target Earnings. Base Earnings may change in future periods for var iou s business or contractual matters. ▪ Reflects one - quarter impact to revenues and Covenant EBITDA (1)(2) ▪ Assumes all other revenues sources and expenses remain unchanged except for management fees ▪ In the event of a multi - quarter downturn ▪ Partner firms would further reduce their cost structure ▪ M&A activity would moderate ▪ Cash flow would be available for debt r epayment ▪ Significant head room on covenant ▪ Q2 Covenant EBITDA - LTM would need to drop to $201 million, or decline by 38%, to reach 6.25x net leverage ratio covenant 25 $3m $27m $38m $38m $50m $56m $73m $73m $76m $77m Q1 2018 Q2 2018 Q3 2018 Q4 2018 Q1 2019 Q2 2019 Q3 2019 Q4 2019 Q1 2020 Q2 2020 Cumulative Acquired Base Earnings (4) Q1 2018 to Q2 2020

Cash Flows 26

$124.0 $116.6 $203.9 $192.4 Net cash provided by operating activities Cash Flow Available for Capital Allocation Q2 2019 LTM Q2 2020 LTM 2020 Primary Uses, Excluding Future M&A Activities Strong Growth in Cash Flow As % of Adjusted EBITDA (1) 52% 63% Cash Flows ▪ Remaining 2020 estimated cash earnouts of ~$20 million (2) , of which ~$15 million will be paid in Q3 ▪ There have been no historical tax receivable agreements (“TRA”) payments ▪ There are no TRA payments due in 2020 ▪ TRA liability of $51.9 million was generated at the time of our IPO and as a result of quarterly Focus LLC common and incentive unit exchanges ▪ TRA liability will be paid out over 15+ years, subject to utilization of tax deductions ▪ Required term loan amortization of $11.6 million (~$2.9 million per quarter) ▪ Based on the terms of the Credit Facility, no excess cash flow payments required in 2020 ($ in millions) 1. Non - GAAP financial measure. See Appendix for reconciliations. 2. Based on certain assumptions that could change materially. 27 2020 Capital Allocation Priorities ▪ Strategic M&A to continue capitalizing on industry consolidation ▪ Fund earnout payments +65% +64% (1)
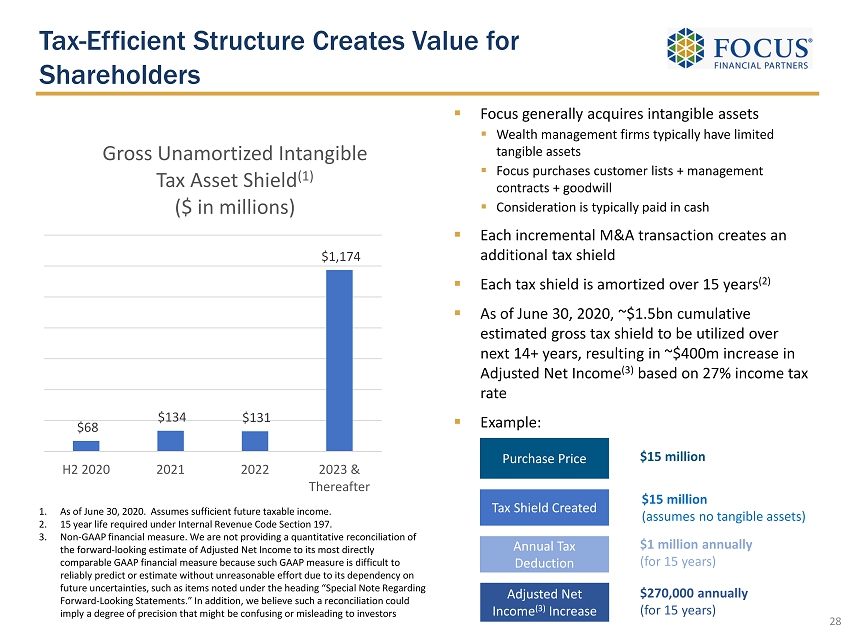
Tax - Efficient Structure Creates Value for Shareholders 28 $68 $134 $131 $1,174 H2 2020 2021 2022 2023 & Thereafter Gross Unamortized Intangible Tax Asset Shield (1) ($ in millions) 1. As of June 30, 2020. Assumes sufficient future taxable income. 2. 15 year life required under Internal Revenue Code Section 197. 3. Non - GAAP financial measure. We are not providing a quantitative reconciliation of the forward - looking estimate of Adjusted Net Income to its most directly comparable GAAP financial measure because such GAAP measure is difficult to reliably predict or estimate without unreasonable effort due to its dependency on future uncertainties, such as items noted under the heading “Special Note Regarding Forward - Looking Statements.” In addition, we believe such a reconciliation could imply a degree of precision that might be confusing or misleading to investors ▪ Focus generally acquires intangible assets ▪ Wealth management firms typically have limited tangible assets ▪ Focus purchases customer lists + management contracts + goodwill ▪ Consideration is typically paid in cash ▪ Each incremental M&A transaction creates an additional tax shield ▪ Each tax shield is amortized over 15 years (2) ▪ As of June 30, 2020, ~$1.5bn cumulative estimated gross tax shield to be utilized over next 14+ years, resulting in ~$400m increase in Adjusted Net Income (3) based on 27% income tax rate ▪ Example: Purchase Price $15 million Tax Shield Created $15 million (assumes no tangible assets) $1 million annually (for 15 years) Annual Tax Deduction $270,000 annually (for 15 years) Adjusted Net Income (3) Increase

Appendix 29

Net Income (Loss) to Adjusted EBITDA Reconciliation 1. Represents one - time expenses primarily related to an acquisition and our IPO and Reorganization Transactions. Refer to our 10 - Q and 10 - K filings for additional details. 30 ($ in thousands) 2014 2015 2016 2017 2018 2019 June 30, 2019 June 30, 2020 June 30, 2019 June 30, 2020 June 30, 2019 June 30, 2020 Net income (loss) 11,996$ 9,321$ 15,722$ (48,359)$ (41,087)$ (12,025)$ 3,102$ 3,328$ 274$ 37,347$ (21,103)$ 25,048$ Interest income (104) (90) (88) (222) (1,266) (1,164) (339) (66) (536) (351) (1,425) (979) Interest expense 6,994 9,977 21,327 41,861 56,448 58,291 14,424 10,057 27,283 23,643 51,247 54,651 Income tax expense (benefit) 212 649 981 (1,501) 9,450 7,049 1,425 37 204 12,107 7,732 18,952 Amortization of debt financing costs 1,599 1,770 2,482 4,084 3,498 3,452 782 709 1,564 1,491 3,174 3,379 Intangible amortization and impairments 28,549 35,421 50,942 64,367 90,381 130,718 31,221 36,012 59,962 71,735 108,559 142,491 Depreciation and other amortization 4,667 5,327 5,680 6,686 8,370 10,675 2,425 3,029 4,738 6,011 9,064 11,948 Non-cash equity compensation expense 4,319 13,537 8,520 34,879 44,468 18,329 5,178 5,248 9,099 10,282 46,012 19,512 Non-cash changes in fair value of estimated contingent consideration 7,395 (160) (1,143) 22,294 6,638 38,797 3,847 16,472 11,261 (14,901) (416) 12,635 Gain on sale of investment — — — — (5,509) — — — — — — — Loss on extinguishment of borrowings — — — 8,106 21,071 — — — — 6,094 7,060 6,094 Other expense (income), net 328 (310) (1,385) 3,191 2,350 1,049 468 (70) 704 (682) 3,350 (337) Impairment of equity method investment — — — — — 11,749 — — — — — 11,749 Management contract buyout 1,800 — — — — 1,428 — — 1,428 — 1,428 — Delayed offering cost expense — — — 9,840 — — — — — — — — Other one-time transaction expenses(1) — — — — 8,590 1,486 420 — 1,486 — 10,076 — Adjusted EBITDA 67,755$ 75,442$ 103,038$ 145,226$ 203,402$ 269,834$ 62,953$ 74,756$ 117,467$ 152,776$ 224,758$ 305,143$ Three months ended Six months ended Trailing 4-Quarters Ended
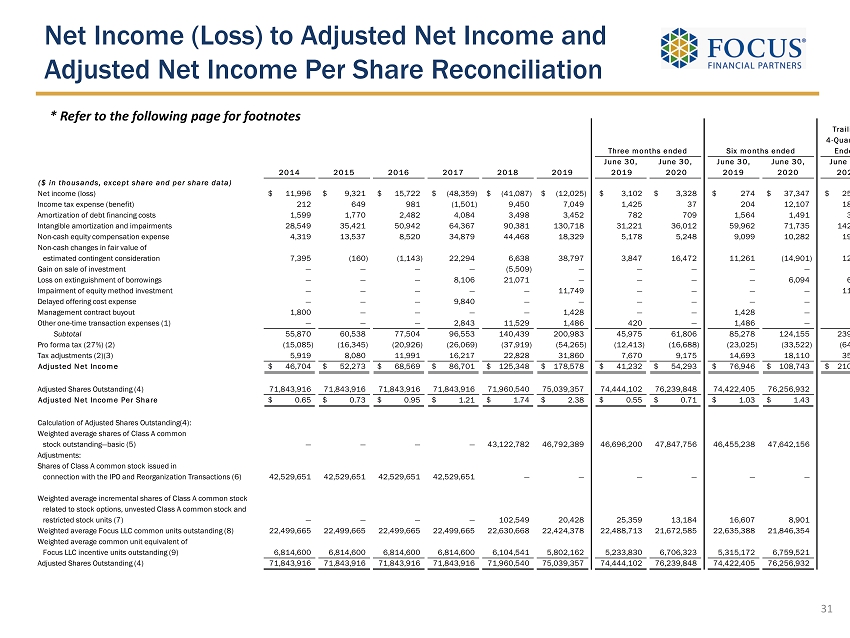
Trailing 4-Quarters Ended 2014 2015 2016 2017 2018 2019 June 30, 2019 June 30, 2020 June 30, 2019 June 30, 2020 June 30, 2020 ($ in thousands, except share and per share data) Net income (loss) 11,996$ 9,321$ 15,722$ (48,359)$ (41,087)$ (12,025)$ 3,102$ 3,328$ 274$ 37,347$ 25,048$ Income tax expense (benefit) 212 649 981 (1,501) 9,450 7,049 1,425 37 204 12,107 18,952 Amortization of debt financing costs 1,599 1,770 2,482 4,084 3,498 3,452 782 709 1,564 1,491 3,379 Intangible amortization and impairments 28,549 35,421 50,942 64,367 90,381 130,718 31,221 36,012 59,962 71,735 142,491 Non-cash equity compensation expense 4,319 13,537 8,520 34,879 44,468 18,329 5,178 5,248 9,099 10,282 19,512 Non-cash changes in fair value of estimated contingent consideration 7,395 (160) (1,143) 22,294 6,638 38,797 3,847 16,472 11,261 (14,901) 12,635 Gain on sale of investment — — — — (5,509) — — — — — — Loss on extinguishment of borrowings — — — 8,106 21,071 — — — — 6,094 6,094 Impairment of equity method investment — — — — — 11,749 — — — — 11,749 Delayed offering cost expense — — — 9,840 — — — — — — — Management contract buyout 1,800 — — — — 1,428 — — 1,428 — — Other one-time transaction expenses (1) — — — 2,843 11,529 1,486 420 — 1,486 — — Subtotal 55,870 60,538 77,504 96,553 140,439 200,983 45,975 61,806 85,278 124,155 239,860 Pro forma tax (27%) (2) (15,085) (16,345) (20,926) (26,069) (37,919) (54,265) (12,413) (16,688) (23,025) (33,522) (64,762) Tax adjustments (2)(3) 5,919 8,080 11,991 16,217 22,828 31,860 7,670 9,175 14,693 18,110 35,277 Adjusted Net Income 46,704$ 52,273$ 68,569$ 86,701$ 125,348$ 178,578$ 41,232$ 54,293$ 76,946$ 108,743$ 210,375$ Adjusted Shares Outstanding (4) 71,843,916 71,843,916 71,843,916 71,843,916 71,960,540 75,039,357 74,444,102 76,239,848 74,422,405 76,256,932 Adjusted Net Income Per Share 0.65$ 0.73$ 0.95$ 1.21$ 1.74$ 2.38$ 0.55$ 0.71$ 1.03$ 1.43$ Calculation of Adjusted Shares Outstanding(4): Weighted average shares of Class A common stock outstanding—basic (5) — — — — 43,122,782 46,792,389 46,696,200 47,847,756 46,455,238 47,642,156 Adjustments: Shares of Class A common stock issued in connection with the IPO and Reorganization Transactions (6) 42,529,651 42,529,651 42,529,651 42,529,651 — — — — — — Weighted average incremental shares of Class A common stock related to stock options, unvested Class A common stock and restricted stock units (7) — — — — 102,549 20,428 25,359 13,184 16,607 8,901 Weighted average Focus LLC common units outstanding (8) 22,499,665 22,499,665 22,499,665 22,499,665 22,630,668 22,424,378 22,488,713 21,672,585 22,635,388 21,846,354 Weighted average common unit equivalent of Focus LLC incentive units outstanding (9) 6,814,600 6,814,600 6,814,600 6,814,600 6,104,541 5,802,162 5,233,830 6,706,323 5,315,172 6,759,521 Adjusted Shares Outstanding (4) 71,843,916 71,843,916 71,843,916 71,843,916 71,960,540 75,039,357 74,444,102 76,239,848 74,422,405 76,256,932 Three months ended Six months ended Net Income (Loss) to Adjusted Net Income and Adjusted Net Income Per Share Reconciliation * Refer to the following page for footnotes 31
* These footnotes refer to the table on the previous page. 1. Represents one - time expenses primarily related to an acquisition and our IPO and Reorganization Transactions. Refer to our 10 - Q and 10 - K filings for additional details. 2. For periods ended prior to the closing of the IPO and consummation of the related Reorganization Transactions on July 30, 2018, certain tax related adjustments are being made for comparative purposes only. 3. As of June 30, 2020, the estimated tax adjustments from intangible asset related income tax benefits from closed acquisitions based on a pro forma 27% tax rate for the next 12 months is ~$36.5 million. 4. For periods ended prior to the closing of the IPO and the consummation of the Reorganization Transactions on July 30, 2018, the Adjusted Shares Outstanding are deemed to be outstanding for comparative purposes only. 5. Represents our GAAP weighted average Class A common stock outstanding – basic. 6. The issuance of Class A common stock that occurred upon closing of the IPO and the consummation of the Reorganization Transactions on July 30, 2018 is assumed to have occurred as of January 1, 2014 for comparative purposes. 7. Represents the incremental shares related to stock options, unvested Class A common stock and restricted stock units as calculated under the treasury stock method. 8. Assumes that 100% of the Focus LLC common units were exchanged for Class A common stock. 9. Assumes that 100% of the vested and unvested Focus LLC incentive units were converted into Focus LLC common units based on the closing price of our Class A common stock at the end of the respective period and such Focus LLC common units were exchanged for Class A common stock. For the periods ending prior to July 30, 2018, the conversion to Focus LLC common units was based on the $33.00 IPO price. 32 Net Income (Loss) to Adjusted Net Income and Adjusted Net Income Per Share Reconciliation
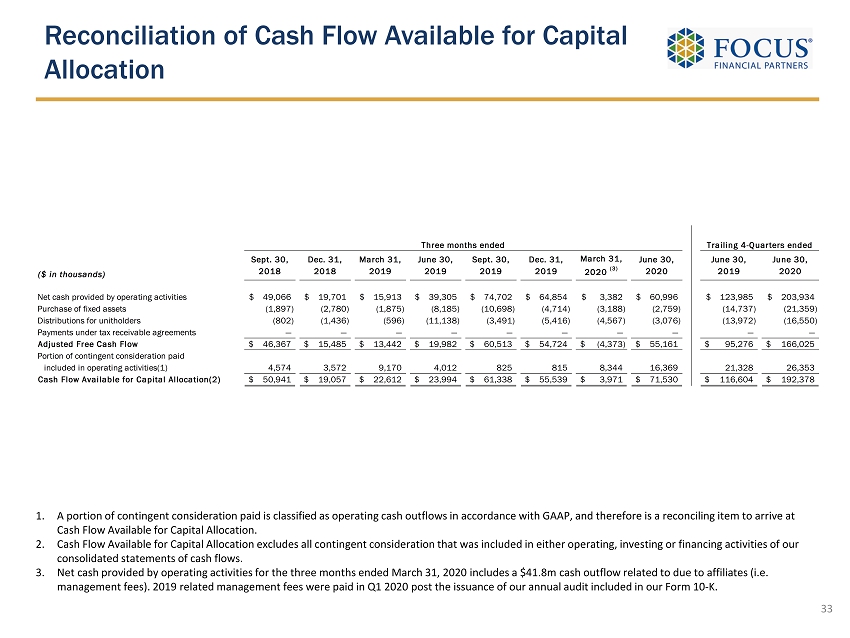
Reconciliation of Cash Flow Available for Capital Allocation 33 1. A portion of contingent consideration paid is classified as operating cash outflows in accordance with GAAP, and therefore is a reconciling item to arrive at Cash Flow Available for Capital Allocation. 2. Cash Flow Available for Capital Allocation excludes all contingent consideration that was included in either operating, inves tin g or financing activities of our consolidated statements of cash flows. 3. Net cash provided by operating activities for the three months ended March 31, 2020 includes a $41.8m cash outflow related to du e to affiliates (i.e. management fees). 2019 related management fees were paid in Q1 2020 post the issuance of our annual audit included in our For m 1 0 - K. ($ in thousands) Sept. 30, 2018 Dec. 31, 2018 March 31, 2019 June 30, 2019 Sept. 30, 2019 Dec. 31, 2019 March 31, 2020 (3) June 30, 2020 June 30, 2019 June 30, 2020 Net cash provided by operating activities 49,066$ 19,701$ 15,913$ 39,305$ 74,702$ 64,854$ 3,382$ 60,996$ 123,985$ 203,934$ Purchase of fixed assets (1,897) (2,780) (1,875) (8,185) (10,698) (4,714) (3,188) (2,759) (14,737) (21,359) Distributions for unitholders (802) (1,436) (596) (11,138) (3,491) (5,416) (4,567) (3,076) (13,972) (16,550) Payments under tax receivable agreements — — — — — — — — — — Adjusted Free Cash Flow 46,367$ 15,485$ 13,442$ 19,982$ 60,513$ 54,724$ (4,373)$ 55,161$ 95,276$ 166,025$ Portion of contingent consideration paid included in operating activities(1) 4,574 3,572 9,170 4,012 825 815 8,344 16,369 21,328 26,353 Cash Flow Available for Capital Allocation(2) 50,941$ 19,057$ 22,612$ 23,994$ 61,338$ 55,539$ 3,971$ 71,530$ 116,604$ 192,378$ Trailing 4-Quarters endedThree months ended