Exhibit 99.2

Focus Financial Partners Inc. Fourth Quarter & Full Year 2021 Earnings Release Supplement February 17, 2022

2 Disclaimer Special Note Regarding Forward - Looking Statements Some of the information in this presentation may contain forward - looking statements . Forward - looking statements give our current expectations, contain projections of results of operations or of financial condition, or forecasts of future events . Words such as “may,” “assume,” “forecast,” “position,” “predict,” “strategy,” “expect,” “intend,” “plan,” “estimate,” “anticipate,” “believe,” “project,” “budget,” “potential,” “continue,” “will” and similar expressions are used to identify forward - looking statements . They can be affected by assumptions used or by known or unknown risks or uncertainties . Consequently, no forward - looking statements can be guaranteed . When considering these forward - looking statements, you should keep in mind the risk factors and other cautionary statements in this presentation . Actual results may vary materially . You are cautioned not to place undue reliance on any forward - looking statements . You should also understand that it is not possible to predict or identify all such factors and should not consider the following list to be a complete statement of all potential risks and uncertainties . Factors that could cause our actual results to differ materially from the results contemplated by such forward - looking statements include the impact and duration of the outbreak of the novel coronavirus, fluctuations in wealth management fees, our reliance on our partner firms and the principals who manage their businesses, our ability to make successful acquisitions, unknown liabilities of or poor performance by acquired businesses, harm to our reputation, our inability to facilitate smooth succession planning at our partner firms, our inability to compete, our reliance on key personnel, our inability to attract, develop and retain talented wealth management professionals, our inability to retain clients following an acquisition, write down of goodwill and other intangible assets, our failure to maintain and properly safeguard an adequate technology infrastructure, cyber - attacks, our inability to recover from business continuity problems, inadequate insurance coverage, the termination of management agreements by management companies, our inability to generate sufficient cash to service all of our indebtedness, the failure of our partner firms to comply with applicable U . S . and non - U . S . regulatory requirements, legal proceedings and governmental inquiries and certain other factors . All forward - looking statements are expressly qualified in their entirety by the foregoing cautionary statements . Our forward - looking statements speak only as of the date of this presentation or as of the date as of which they are made . Except as required by applicable law, including federal securities laws, we do not intend to update or revise any forward - looking statements . Non - GAAP Financial Measures Adjusted EBITDA is a non - GAAP measure . Adjusted EBITDA is defined as net income (loss) excluding interest income, interest expense, income tax expense, amortization of debt financing costs, intangible amortization, depreciation and other amortization, non - cash equity compensation expense, non - cash changes in fair value of estimated contingent consideration, loss on extinguishment of borrowings, other expense, net, impairment of equity method investment, management contract buyout, secondary offering expenses and other one - time transaction expenses . We believe that Adjusted EBITDA, viewed in addition to and not in lieu of, our reported GAAP results, provides additional useful information to investors regarding our performance and overall results of operations for various reasons, including the following : ( i ) non - cash equity grants made to employees or non - employees at a certain price and point in time do not necessarily reflect how our business is performing at any particular time ; stock - based compensation expense is not a key measure of our operating performance, (ii) contingent consideration or earn outs can vary substantially from company to company and depending upon each company’s growth metrics and accounting assumption methods ; the non - cash changes in fair value of estimated contingent consideration is not considered a key measure in comparing our operating performance, and (iii) amortization expenses can vary substantially from company to company and from period to period depending upon each company’s financing and accounting methods, the fair value and average expected life of acquired intangible assets and the method by which assets were acquired ; the amortization of intangible assets obtained in acquisitions are not considered a key measure in comparing our operating performance . We use Adjusted EBITDA ( i ) as a measure of operating performance, (ii) for planning purposes, including the preparation of budgets and forecasts, (iii) to allocate resources to enhance the financial performance of our business, and (iv) to evaluate the effectiveness of our business strategies . Adjusted EBITDA does not purport to be an alternative to net income (loss) or cash flows from operating activities . The term Adjusted EBITDA is not defined under GAAP, and Adjusted EBITDA is not a measure of net income (loss), operating income or any other performance or liquidity measure derived in accordance with GAAP . Therefore, Adjusted EBITDA has limitations as an analytical tool and should not be considered in isolation or as a substitute for analysis of our results as reported under GAAP . Some of these limitations are : ( i ) Adjusted EBITDA does not reflect all cash expenditures, future requirements for capital expenditures or contractual commitments, (ii) Adjusted EBITDA does not reflect changes in, or cash requirements for, working capital needs, and (iii) Adjusted EBITDA does not reflect the interest expense on our debt or the cash requirements necessary to service interest or principal payments . In addition, Adjusted EBITDA can differ significantly from company to company depending on strategic decisions regarding capital structure, the tax jurisdictions in which companies operate and capital investments . We compensate for these limitations by relying also on the GAAP results and using Adjusted EBITDA as supplemental information . We analyze our performance using Adjusted Net Income Excluding Tax Adjustments and Adjusted Net Income Excluding Tax Adjustments Per Share . Adjusted Net Income Excluding Tax Adjustments and Adjusted Net Income Excluding Tax Adjustments Per Share are non - GAAP measures . We define Adjusted Net Income Excluding Tax Adjustments as net income (loss) excluding income tax expense, amortization of debt financing costs, intangible amortization, non - cash equity compensation expense, non - cash changes in fair value of estimated contingent consideration, loss on extinguishment of borrowings, management contract buyout, secondary offering expenses and other one - time transaction expenses . The calculation of Adjusted Net Income Excluding Tax Adjustments also includes adjustments to reflect a pro forma 27 % income tax rate reflecting the estimated U . S . federal, state, local and foreign income tax rates applicable to corporations in the jurisdictions we conduct business . We believe that Adjusted Net Income Excluding Tax Adjustments and Adjusted Net Income Excluding Tax Adjustments Per Share, viewed in addition to and not in lieu of, our reported GAAP results, provide additional useful information to investors regarding our performance and overall results of operations for various reasons, including the following : ( i ) non - cash equity grants made to employees or non - employees at a certain price and point in time do not necessarily reflect how our business is performing at any particular time ; stock - based compensation expense is not a key measure of our operating performance, (ii) contingent consideration or earn outs can vary substantially from company to company and depending upon each company’s growth metrics and accounting assumption methods ; the non - cash changes in fair value of estimated contingent consideration is not considered a key measure in comparing our operating performance, and (iii) amortization expenses can vary substantially from company to company and from period to period depending upon each company’s financing and accounting methods, the fair value and average expected life of acquired intangible assets and the method by which assets were acquired ; the amortization of intangible assets obtained in acquisitions are not considered a key measure in comparing our operating performance . Adjusted Net Income Excluding Tax Adjustments and Adjusted Net Income Excluding Tax Adjustments Per Share do not purport to be an alternative to net income (loss) or cash flows from operating activities . The terms Adjusted Net Income Excluding Tax Adjustments and Adjusted Net Income Excluding Tax Adjustments Per Share are not defined under GAAP, and Adjusted Net Income Excluding Tax Adjustments and Adjusted Net Income Excluding Tax Adjustments Per Share are not a measure of net income (loss), operating income or any other performance or liquidity measure derived in accordance with GAAP . Therefore, Adjusted Net Income Excluding Tax Adjustments and Adjusted Net Income Excluding Tax Adjustments Per Share have limitations as an analytical tool and should not be considered in isolation or as a substitute for analysis of our results as reported under GAAP . Some of these limitations are : ( i ) Adjusted Net Income Excluding Tax Adjustments and Adjusted Net Income Excluding Tax Adjustments Per Share do not reflect all cash expenditures, future requirements for capital expenditures or contractual commitments, (ii) Adjusted Net Income Excluding Tax Adjustments and Adjusted Net Income Excluding Tax Adjustments Per Share do not reflect changes in, or cash requirements for, working capital needs, and (iii) Other companies in the financial services industry may calculate Adjusted Net Income Excluding Tax Adjustments and Adjusted Net Income Excluding Tax Adjustments Per Share differently than we do, limiting its usefulness as a comparative measure . In addition, Adjusted Net Income Excluding Tax Adjustments and Adjusted Net Income Excluding Tax Adjustments Per Share can differ significantly from company to company depending on strategic decisions regarding capital structure, the tax jurisdictions in which companies operate and capital investments . We compensate for these limitations by relying also on the GAAP results and use Adjusted Net Income Excluding Tax Adjustments and Adjusted Net Income Excluding Tax Adjustments Per Share as supplemental information . To supplement our statements of cash flows presented on a GAAP basis, we use non - GAAP liquidity measures on a trailing 4 - quarter basis to analyze cash flows generated from our operations . We consider Adjusted Free Cash Flow and Cash Flow Available for Capital Allocation to be liquidity measures that provide useful information to investors about the amount of cash generated by the business and are two factors in evaluating the amount of cash available to pay contingent consideration, make strategic acquisitions and repay outstanding borrowings . Adjusted Free Cash Flow and Cash Flow Available for Capital Allocation do not represent our residual cash flow available for discretionary expenditures as they do not deduct our mandatory debt service requirements and other non - discretionary expenditures . We define Adjusted Free Cash Flow as net cash provided by operating activities, less purchase of fixed assets, distributions for unitholders and payments under tax receivable agreements (if any) . We define Cash Flow Available for Capital Allocation as Adjusted Free Cash Flow plus the portion of contingent consideration paid which is classified as operating cash flows under GAAP . Adjusted Free Cash Flow and Cash Flow Available for Capital Allocation are not defined under GAAP and should not be considered as alternatives to net cash from operating, investing or financing activities . In addition, Adjusted Free Cash Flow and Cash Flow Available for Capital Allocation can differ significantly from company to company .
Table of Contents 3 Pages Investor Day Recap 4 - 8 Key Growth Trends 9 - 13 Fourth Quarter 2021 Recap 14 - 18 Full Year 2021 Recap 19 - 28 First Quarter 2022 Outlook 29 - 30 Leverage 31 - 34 Cash Flows 35 - 37 Appendix 38 - 42

Investor Day Recap 4

Our Bold New Vision for 2025 1. Non - GAAP financial measure. See Appendix for reconciliations. 2. Non - GAAP financial measure. The Company is not providing a quantitative reconciliation of its forward - looking estimate of Adjust ed EBITDA or Adjusted EBITDA margin to its most directly comparable GAAP financial measure because such GAAP measure, which is not included in the Company’s outlook, is difficult to reliably predict or estimate witho ut unreasonable effort due to its dependency on future uncertainties such as the items noted under the heading “Special Note Regarding Forward - Looking Statements.” In addition, we believe such a reconciliation could imply a deg ree of precision that might be confusing or misleading to investors. 3. Adjusted EBITDA divided by revenue. 4. As of November 20, 2019. Original Vision: ~$3.5 billion revenues ~$840 million Adjusted EBITDA (2) ~ 24% Adjusted EBITDA Margin (3) ~100 partner firms FOCUS 2025 November 2019 Investor Day Results: ~$1.1 billion revenues ~$241 million Adjusted EBITDA (1) ~ 21% Adjusted EBITDA Margin (3) 63 partner firms (4) Q3 LTM 2019 New Vision: ~$ 4.0 billion revenues ~$1.1 b illion Adjusted EBITDA (2) ~28% Adjusted EBITDA Margin (3) ~125 partner firms +14% +31% +25% +4 ppts Versus Original Vision: 5 FOCUS 2025 December 2021 Investor Day

Our Investor Day Addressed Key Questions 1 Why do partner firms join Focus? 2 What returns do you achieve? >25% Weighted Average Levered IRR (1) >30% Median Levered IRR (1) >90% of Firms Generate Levered IRRs in Excess of 20% (1) 3 What is your organic growth? ▪ 15% Partner firm weighted average revenue CAGR since inception, including M&A (2,3) ▪ 9.6% Partner firm weighted average revenue CAGR since inception, excluding M&A (entire portfolio) (2,3) ▪ 11.2% Partner firm weighted average revenue CAGR since inception, excluding M&A (US wealth management firms) (2,3,4) 4 How sustainable is your long - term growth? ▪ 10.2% Estimated asset CAGR for US RIA segment through 2024 (vs 2.4% for wirehouses ) (5) ▪ $9.2T Estimated US RIA opportunity in 2024, plus multi - trillion int’l opportunity (5,6) ▪ $60B - $100B of estimated capital required to support industry consolidation over the next 5+ years (7) Unique value proposition and alignment of interests with x Clients x Partners x Shareholders Drives true differentiation 1. Based on the 64 firms that were with us for at least 2 years as of September 30, 2021. Reflects Focus capital structure as of Se ptember 30, 2021: 2.5% pre - tax cost of debt and 27.0% tax rate offset by tax intangibles generated by partner firms since joining Focus. Capital deployed based on cash and stock consideration since inception. Terminal value bas ed on each partner firm’s respective weighted average acquired Adjusted EBITDA multiple, inclusive of mergers, multiplied by Q3 2021 LTM Adjusted EBITDA and Q3 2021 run - rate Adjusted EBITDA for firms that completed an M&A transaction within the past 12 months. 2. Inception means first full four quarters as a Focus partner firm and reflects activity through all market cycles during that tim e. The analysis includes the 64 firms since inception (out of the 76 firms) that have been with us for at least 2 years as of September 30, 2021 in order to determine a baseline revenue growth rate. If Focus partner firms merged to gether, their financials have been combined. The weightings are based on the September 30, 2021 LTM revenues of the respective partner firms. 3. Excluded the first full annual revenue from all the mergers made by our partner firm portfolio since joining Focus. 4. The 52 US based wealth management firms have been with Focus for a weighted average of ~6 years and a median period of ~5 yea rs. Revenues are inclusive of all affiliated business lines. Excludes dedicated family office type partner firms, international firms as well as partner firms affiliated with Third Party Administration revenues. 5. Sources: Cerulli US Advisor Metrics 2020; Envestnet Industry Trends (March 2021) 6. Sources: Advocis -- The Financial Advisors Association of Canada; Canadian Investment Funds Industry: Recent Developments and Outlook (2019). In cludes private wealth, full - service brokerage and financial advisor assets; IBIS World Report on UK Financial Advice, July 2020; PIMFA, January 2021; 2019 Australian Financial Advice Landscape 7. Source: Cerulli U.S. RIA Marketplace 2020 6

Our Investor Day Addressed Key Questions 5 Why do value - added services matter? 6 Are you experiencing fee pressure? ▪ Client priorities have evolved ▪ Differentiated services are a necessity, especially for UHNW clients ▪ Only 20% of RIAs offer Trust Services, 7% offer Private Banking (1) ▪ RIAs face key challenges and scale is increasingly important Built for clients, designed for advisors Increased Need for Advice Willingness to Pay No Fee Pressure + = 0 50 100 150 $100K $300K $750K $1.5M $5M $10M 2015 2020 Average AUM - Based Advisory Fees (in bps) 7 How does your tax efficiency enhance cash flows? 8 What lends your financial model stability, particularly in volatile markets? 1. Source: Cerulli US RIA Marketplace 2020 / Envestnet State of the RIA Market January 2021. 2. Source: Cerulli US Retail Investor Advice Relationships 2020, US RIA Marketplace 2020. Envestnet State of the RIA Market January 2021. 3. Focus partner firms typically have limited tangible assets on acquisition date. Focus typically purchases customer lists, man age ment contracts and goodwill. Consideration is typically paid in cash. Each incremental M&A transaction creates an additional tax shield which generates substantial value for shareholders and enhances our cash flows. Eac h tax shield is amortized over 15 years (as required under Internal Revenue Code Section 197). 4. As of September 30, 2021. 5. Based on 27% pro forma tax rate. 6. Based on assumed 8% discount rate. 7. Non - GAAP financial measure based on Q3 2021 Adjusted Shares Outstanding. See Appendix for reconciliations. 8. For the 3 months ended September 30, 2021. . (2) ~$2.0B Cumulative unamortized gross tax shield (3,4) ~$543M Economic benefit (5) (~ $350M NPV (6) ) ~$4.28 per share (6,7) Revenue Earnings Cash Flow Expenses 95+% fee - based and recurring (8) Variable and tied to profitability Strong and increasing operating leverage Preference on partner firm earnings 7

Our Investor Day Addressed Key Questions ▪ Programmatic M&A model with unique value proposition ▪ Accelerating deal velocity with attractive economics ▪ Large, growing addressable market both in the US and abroad ▪ Favorable demographic trends ▪ Differentiated value - added services ▪ Capital flexibility with a strong credit profile ▪ A stress - tested, tax - efficient financial model ~23% Revenue CAGR to ~$4.0B ~26% Adjusted EBITDA (1) CAGR to ~$1.1B ~300bps of Adjusted EBITDA Margin (2) Growth to 28% ~50% More Partner Firms vs. Today to ~125 20%+ Adjusted Net Income Excluding Tax Adjustments Per Share CAGR (1) Focus 2025 Why are your 2025 targets achievable? Committed to Net Leverage Ratio (3) Target of 3.5x – 4.5x 1. Non - GAAP financial measure. We are not providing a quantitative reconciliation of the forward - looking estimate of Adjusted EBITD A, Adjusted EBITDA margin, or Adjusted Net Income Excluding Tax Adjustments Per Share to its most directly comparable GAAP financial measure because such GAAP measure is difficult to reliably predict or estimate wi tho ut unreasonable effort due to its dependency on future uncertainties, such as items noted under the heading “Disclosure – Special Note Regarding Forward - Looking Statements”. In addition, we believe such a reconciliatio n could imply a degree of precision that might be confusing or misleading to investors. 2. Adjusted EBITDA divided by revenue. 3. Net Leverage Ratio represents the First Lien Leverage Ratio (as defined in the Credit Facility) and means the ratio of amount s o utstanding under the First Lien Term Loan and First Lien Revolver plus other outstanding debt obligations secured by a lien on the assets of Focus LLC (excluding letters of credit other than unpaid drawings thereunder) min us unrestricted cash and cash equivalents to Consolidated EBITDA (as defined in the Credit Facility). 8

Key Growth Trends 9

$68.7 $75.2 $80.6 $1,149.7 $1,286.1 $1,717.4 FY 2019 FY 2020 FY 2021 94.4% 94.5% 95.5% Wealth Management Fees Allocation ($ in millions (3) , % of Revenues) 1. Non - GAAP financial measure. See Appendix for reconciliations. 2. Calculated as Adjusted EBITDA divided by revenues. 3. The sum of wealth management fees and other revenues as presented in this chart may not agree to total revenues as presented due to rounding. Strong and Sustained Revenue and Adjusted EBITDA Growth… 10 Revenues ($ in millions) Adjusted EBITDA (1) ($ in millions) Adjusted EBITDA Margin (2) (% o f Revenues) Wealth management fees Other revenues 22.1% 23.6% 25.1% FY 2019 FY 2020 FY 2021 Margin: +3.0% $1,218.3 $1,361.3 $1,798.0 FY 2019 FY 2020 FY 2021 CAGR: 21.5% $269.8 $321.8 $451.3 FY 2019 FY 2020 FY 2021 CAGR: 29.3%

$0.42 $0.47 $0.56 FY 2019 FY 2020 FY 2021 CAGR: 15.5% $1.96 $2.46 $3.36 FY 2019 FY 2020 FY 2021 CAGR: 30.9% 1. Non - GAAP financial measure. See Appendix for reconciliations. 2. Tax Adjustments represent the tax benefits of intangible assets, including goodwill, associated with deductions allowed for t ax amortization of intangible assets in the respective periods based on a pro forma 27% income tax rate. Such amounts were generated from acquisitions completed where the Company received a step - up in basis for tax purposes. Acquired intangible assets may be amortized for tax purposes, generally over a 15 - year period. Due to the Company’s acquisitive nature, tax deductions allowed on acquired intangible assets provide additional significant supplemental economic benefit. The tax benefit from amortization is identified to show the full economic benefit of deduction s f or acquired intangible assets with the step - up in tax basis. … Drives Strong Bottom - Line Performance Enhanced by a Tax Efficient Structure 11 Adjusted Net Income Excluding Tax Adjustments (1) ($ in millions) ANI Excluding Tax Adjustments Per Share (1) Tax Adjustments (2) ($ in millions) Tax Adjustments Per Share (1) $146.7 $195.6 $278.7 FY 2019 FY 2020 FY 2021 CAGR: 37.8% $31.9 $37.3 $46.8 FY 2019 FY 2020 FY 2021 CAGR: 21.2%
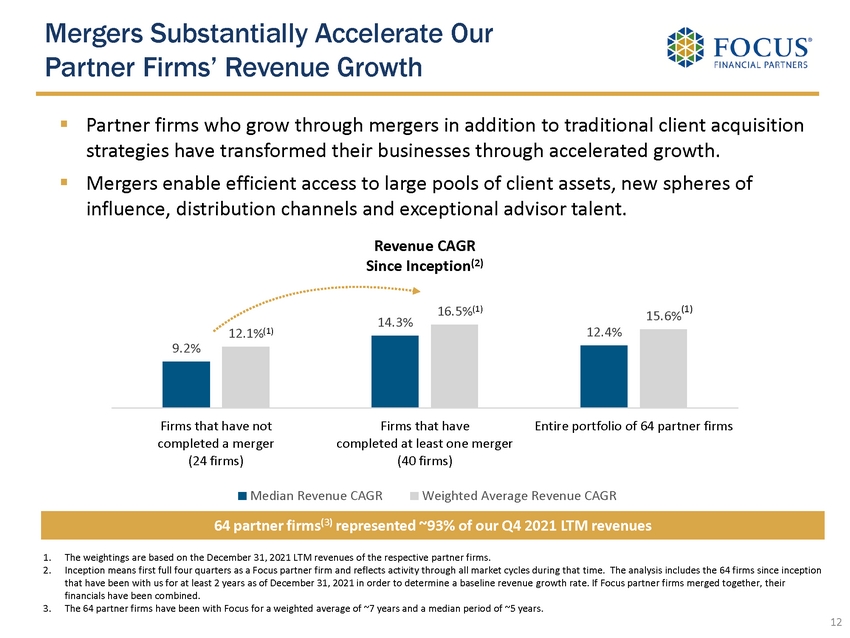
1. The weightings are based on the December 31, 2021 LTM revenues of the respective partner firms. 2. Inception means first full four quarters as a Focus partner firm and reflects activity through all market cycles during that tim e. The analysis includes the 64 firms since inception that have been with us for at least 2 years as of December 31, 2021 in order to determine a baseline revenue growth rate. If Foc us partner firms merged together, their financials have been combined. 3. The 64 partner firms have been with Focus for a weighted average of ~7 years and a median period of ~5 years. 9.2% 14.3% 12.4% 12.1% 16.5% 15.6% Firms that have not completed a merger (24 firms) Firms that have completed at least one merger (40 firms) Entire portfolio of 64 partner firms Revenue CAGR Since Inception (2) Median Revenue CAGR Weighted Average Revenue CAGR Mergers Substantially Accelerate Our Partner Firms’ Revenue Growth 12 ▪ Partner firms who grow through mergers in addition to traditional client acquisition strategies have transformed their businesses through accelerated growth. ▪ Mergers enable efficient access to large pools of client assets, new spheres of influence, distribution channels and exceptional advisor talent. 64 partner firms (3) represented ~93% of our Q4 2021 LTM revenues (1) (1) (1)
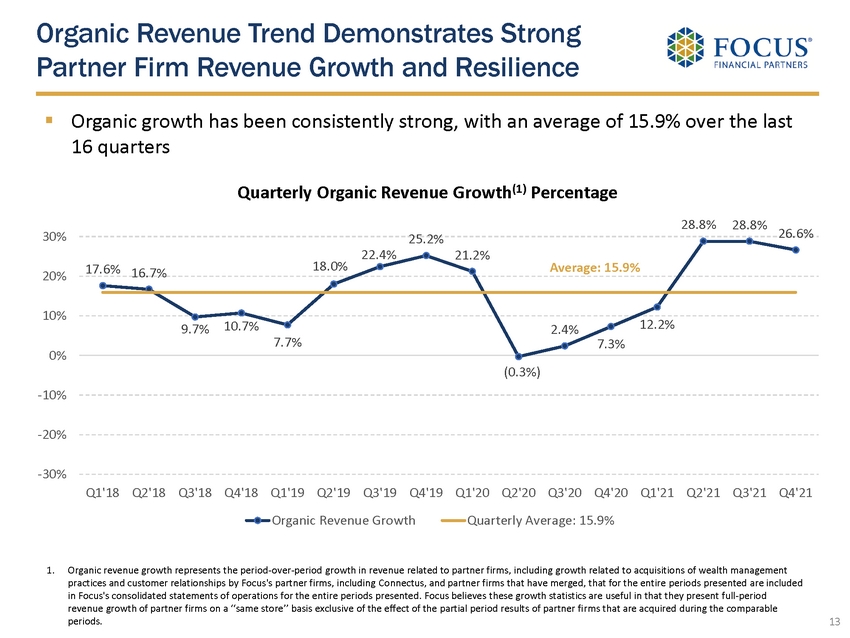
Organic Revenue Trend Demonstrates Strong Partner Firm Revenue Growth and Resilience ▪ Organic growth has been consistently strong, with an average of 15.9% over the last 16 quarters 1. Organic revenue growth represents the period - over - period growth in revenue related to partner firms, including growth related to acquisitions of wealth management practices and customer relationships by Focus's partner firms, including Connectus , and partner firms that have merged, that for the entire periods presented are included in Focus's consolidated statements of operations for the entire periods presented. Focus believes these growth statistics are us eful in that they present full - period revenue growth of partner firms on a ‘‘same store’’ basis exclusive of the effect of the partial period results of partner fi rms that are acquired during the comparable periods. 13 17.6% 16.7% 9.7% 10.7% 7.7% 18.0% 22.4% 25.2% 21.2% (0.3%) 2.4% 7.3% 12.2% 28.8% 28.8% 26.6% -30% -20% -10% 0% 10% 20% 30% Q1'18 Q2'18 Q3'18 Q4'18 Q1'19 Q2'19 Q3'19 Q4'19 Q1'20 Q2'20 Q3'20 Q4'20 Q1'21 Q2'21 Q3'21 Q4'21 Quarterly Organic Revenue Growth (1) Percentage Organic Revenue Growth Quarterly Average: 15.9% Average: 15.9%
Fourth Quarter 2021 Recap 14
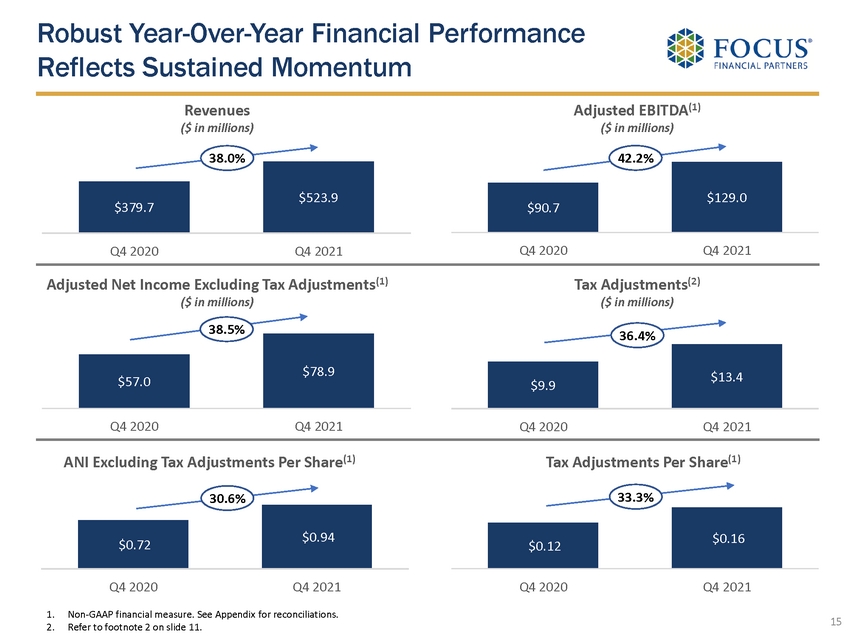
Robust Year - Over - Year Financial Performance Reflects Sustained Momentum 15 Adjusted Net Income Excluding Tax Adjustments (1) ($ in millions) 1. Non - GAAP financial measure. See Appendix for reconciliations. 2. Refer to footnote 2 on slide 11. Revenues ($ in millions) Adjusted EBITDA (1) ($ in millions) ANI Excluding Tax Adjustments Per Share (1) Tax Adjustments (2) ($ in millions) Tax Adjustments Per Share (1) $379.7 $523.9 Q4 2020 Q4 2021 38.0% $90.7 $129.0 Q4 2020 Q4 2021 42.2% $57.0 $78.9 Q4 2020 Q4 2021 38.5% $9.9 $13.4 Q4 2020 Q4 2021 36.4% $0.72 $0.94 Q4 2020 Q4 2021 30.6% $0.12 $0.16 Q4 2020 Q4 2021 33.3%

▪ Adjusted EBITDA: (2) $129.0 million, +42.2% year - over - year growth ▪ Adjusted EBITDA margin: (3) 24.6 % ▪ Adjusted EBITDA attributable to new partner firm closings: $5.6 million* ▪ Acquired Base Earnings: (4) $49.5 million * Relates to the closings of Ancora , Sonora and Cardinal Point. Aggregate full quarter Adjusted EBITDA contribution, including the new partner firms (Ullman, Mosaic, Alley, Cassaday and Provident/London) as of 12/31/21, estimated to be ~$12.4 million. ▪ Revenues: $523.9 million, +38.0% year - over - year growth ▪ Organic revenue growth rate: (1) + 26.6% year - over - year growth ▪ Revenue attributable to new partner firm closings: $16.8 million* * Relates to the closings of Ancora , Sonora and Cardinal Point. Aggregate full quarter revenue contribution, including the new partner firms (Ullman, Mosaic, Alley, Cassaday and Provident/London) as of 12/31/21, estimated to be ~$37 million. ▪ GAAP Net Income: $14.9 million, compared to $7.7 million in Q4 2020 ▪ GAAP basic and diluted net income per share attributable to common shareholders: $0.12 ▪ Adjusted Net Income Excluding Tax Adjustments: (2) $78.9 million, +38.5% year - over - year growth ▪ Tax Adjustments: (5) $13.4 million, +36.4% year - over - year growth ▪ Adjusted Net Income Excluding Tax Adjustments Per Share: (2) $0.94, +30.6% year - over - year growth ▪ Tax Adjustments Per Share: (2) $0.16, +33.3% year - over - year Adjusted EBITDA Q4 2021 Financial Snapshot Revenues Net Income and Per Share Amounts 1. Organic revenue growth represents the period - over - period growth in revenues related to partner firms, including growth related t o acquisitions of wealth management practices and customer relationships by our partner firms, including Connectus , and partner firms that have merged, that for the entire periods presented, are included in our consolidated statements of o per ations for each of the entire periods presented. We believe these growth statistics are useful in that they present full period revenue growth of partner firms on a ‘‘same store’’ basis exclusive of th e effect of the partial period results of partner firms that are acquired during the comparable periods. 2. Non - GAAP financial measure. See Appendix for reconciliations. 3. Calculated as Adjusted EBITDA divided by revenues. 4. The terms of our management agreements entitle the management companies to management fees typically consisting of all future EB PC of the acquired wealth management firm in excess of Base Earnings up to Target Earnings, plus a percentage of any EBPC in excess of Target Earnings. Acquired Base Earnings is equal to our preferred position in Base Ea rnings or comparable measures. We are entitled to receive these earnings notwithstanding any earnings that we are entitled to receive in excess of Target Earnings. Base Earnings may change in future periods for various bu siness or contractual matters. 5. Tax Adjustments represent the tax benefits of intangible assets, including goodwill, associated with deductions allowed for t ax amortization of intangible assets in the respective periods based on a pro forma 27% income tax rate. Such amounts were generated from acquisitions completed where the Company received a step - up in basis for tax purposes. Acquired intangible assets may be amortized for tax purposes, generally over a 15 - year period. Due to the Company’s acquisitive nature, tax deductions allowed on acquired intangible assets provide additional significant supplem ent al economic benefit. The tax benefit from amortization is identified to show the full economic benefit of deductions for acquired intangible assets with the step - up in tax basis. 6. Net leverage ratio represents the First Lien Leverage Ratio (as defined in the Credit Facility) and means the ratio of amount s o utstanding under the First Lien Term Loan and First Lien Revolver plus other outstanding debt obligations secured by a lien on the assets of Focus LLC (excluding letters of credit other than unpaid drawings thereunder) min us unrestricted cash and cash equivalents to Consolidated EBITDA (as defined in the Credit Facility). 16 Net Leverage & Cash Flow ▪ Net Leverage Ratio: (6) 3 .85x ▪ Net cash provided by operating activities: $313.9 million (LTM Q4 2021), +48.5% year - over - year ▪ Cash Flow Available for Capital Allocation: (2) $319.9 million (LTM Q4 2021), +59.6% year - over - year ▪ Unamortized Gross Tax Shield at December 31, 2021 of $ 2.5 + billion, an ~$800 million increase vs. Dec. 31, 2020
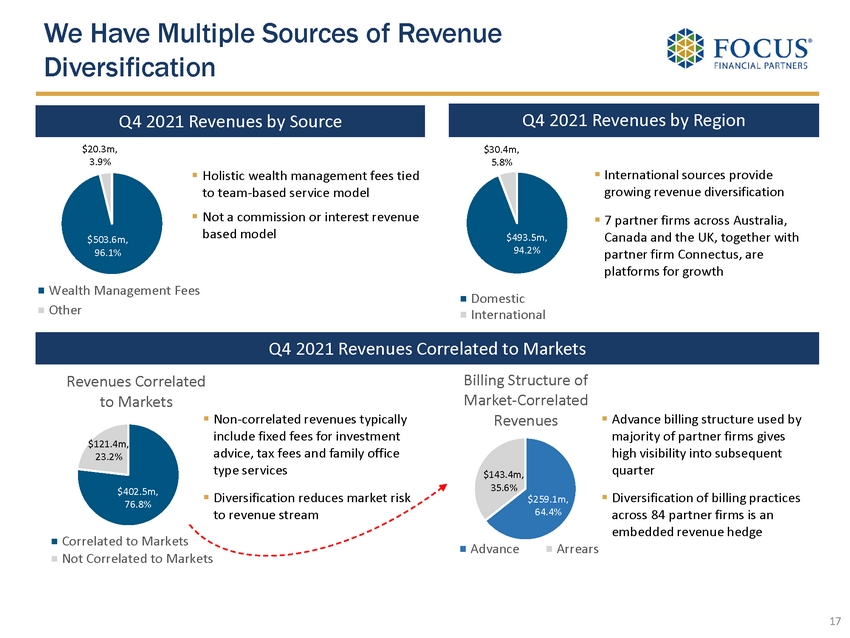
$503.6m , 96.1% $20.3m , 3.9% Wealth Management Fees Other ▪ Holistic wealth management fees tied to team - based service model ▪ Not a commission or interest revenue based model We Have Multiple Sources of Revenue Diversification $402.5m , 76.8% $121.4m , 23.2% Revenues Correlated to Markets Correlated to Markets Not Correlated to Markets ▪ Advance billing structure used by majority of partner firms gives high visibility into subsequent quarter ▪ Diversification of billing practices across 84 partner firms is an embedded revenue hedge ▪ Non - correlated revenues typically include fixed fees for investment advice, tax fees and family office type services ▪ Diversification reduces market risk to revenue stream ▪ International sources provide growing revenue diversification ▪ 7 partner firms across Australia, Canada and the UK, together with partner firm Connectus, are platforms for growth $493.5m , 94.2% $30.4m , 5.8% Domestic International Q4 2021 Revenues by Source Q4 2021 Revenues by Region Q4 2021 Revenues Correlated to Markets 17 $259.1m , 64.4% $143.4m , 35.6% Billing Structure of Market - Correlated Revenues Advance Arrears

Q4 Financial Performance Reflected Excellent Fundamentals & Growth 18 We delivered another strong quarter in Q4 as our partner firms delivered excellent results ▪ Revenues were $523.9 million, above the top end of our $475 to $485 million Q4 outlook, and up 38.0% YOY ▪ Adjusted EBITDA (1) was $129.0 million, up 42.2% YOY ▪ Adjusted EBITDA margin (2) was 24.6%, in line with our Q4 outlook of ~25% ▪ Adjusted Net Income E xcluding Tax Adjustments Per Share (1) was $0.94, with Tax Adjustments Per Share (1) of $0.16 ▪ Net Leverage Ratio (3) was 3.85x as of December 31, 2021, at the low end of our Q4 Net Leverage Ratio (3) outlook of 4.0x to 4.25x due to incremental Adjusted EBITDA and our December 2021 primary equity issuance ▪ Cash Flow Available for Capital Allocation (1) was $319.9 million (LTM Q4 2021), up 59.6% year - over - year ▪ Performance fees associated with investment funds positively impacted revenues and Adjusted EBITDA by ~$20 million and ~$7 million respectively. We closed 22 transactions in Q4, reflecting a record pace of M&A activity in 2021 ▪ Demonstrated the attractiveness of our value proposition and the scale benefits we offer our partner firms globally ▪ Pipeline for 2022 is large and we anticipate that it will continue to expand ▪ Connectus also has robust pipeline and will further expand its global footprint in 2022 We raised $161.9 million, net of offering expenses and a synthetic secondary, through our December primary equity issuance ▪ Creates working capital flexibility to execute on growing M&A opportunities globally ▪ Industry M&A activity continues to increase, and the opportunity set internationally is also growing 1. Non - GAAP financial measure. See appendix for reconciliations. 2. Calculated as Adjusted EBITDA divided by revenues. 3. Net leverage ratio represents the First Lien Leverage Ratio (as defined in the Credit Facility) and means the ratio of amount s o utstanding under the First Lien Term Loan and First Lien Revolver plus other outstanding debt obligations secured by a lien on the assets of Focus LLC (excluding letters of credit other than unpai d d rawings thereunder) minus unrestricted cash and cash equivalents to Consolidated EBITDA (as defined in the Credit Facility).

Full Year 2021 Recap 19

Robust Year - Over - Year Financial Performance Reflects Sustained Momentum 20 Adjusted Net Income Excluding Tax Adjustments (1) ($ in millions) 1. Non - GAAP financial measure. See Appendix for reconciliations. 2. Refer to footnote 2 on slide 11. Revenues ($ in millions) Adjusted EBITDA (1) ($ in millions) ANI Excluding Tax Adjustments Per Share (1) Tax Adjustments (2) ($ in millions) Tax Adjustments Per Share (1) $1,361.3 $1,798.0 FY 2020 FY 2021 32.1% $195.6 $278.7 FY 2020 FY 2021 42.5% $2.46 $3.36 FY 2020 FY 2021 36.6% $321.8 $451.3 FY 2020 FY 2021 40.3% $37.3 $46.8 FY 2020 FY 2021 25.6% $0.47 $0.56 FY 2020 FY 2021 19.1%
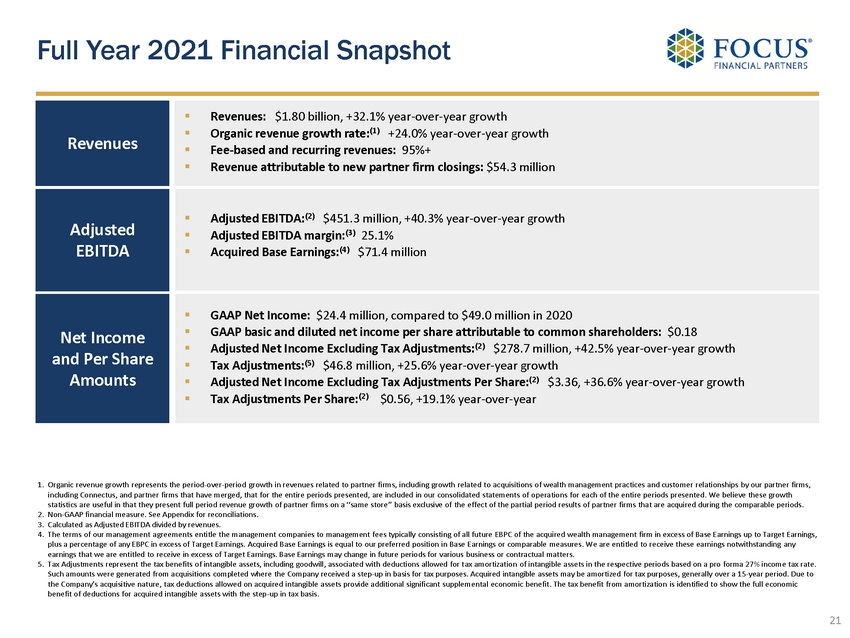
▪ Adjusted EBITDA: (2) $451.3 million, +40.3% year - over - year growth ▪ Adjusted EBITDA margin: (3) 25.1 % ▪ Acquired Base Earnings: (4) $71.4 million ▪ Revenues: $1.80 billion, +32.1% year - over - year growth ▪ Organic revenue growth rate: (1) + 24.0% year - over - year growth ▪ Fee - based and recurring revenues: 95%+ ▪ Revenue attributable to new partner firm closings: $54.3 million ▪ GAAP Net Income: $24.4 million, compared to $49.0 million in 2020 ▪ GAAP basic and diluted net income per share attributable to common shareholders: $0.18 ▪ Adjusted Net Income Excluding Tax Adjustments: (2) $278.7 million, +42.5% year - over - year growth ▪ Tax Adjustments: (5) $46.8 million, +25.6% year - over - year growth ▪ Adjusted Net Income Excluding Tax Adjustments Per Share: (2) $3.36, +36.6% year - over - year growth ▪ Tax Adjustments Per Share: (2) $0.56, +19.1% year - over - year Adjusted EBITDA Full Year 2021 Financial Snapshot Revenues Net Income and Per Share Amounts 1. Organic revenue growth represents the period - over - period growth in revenues related to partner firms, including growth related t o acquisitions of wealth management practices and customer relationships by our partner firms, including Connectus , and partner firms that have merged, that for the entire periods presented, are included in our consolidated statements of o per ations for each of the entire periods presented. We believe these growth statistics are useful in that they present full period revenue growth of partner firms on a ‘‘same store’’ basis exclusive of th e effect of the partial period results of partner firms that are acquired during the comparable periods. 2. Non - GAAP financial measure. See Appendix for reconciliations. 3. Calculated as Adjusted EBITDA divided by revenues. 4. The terms of our management agreements entitle the management companies to management fees typically consisting of all future EB PC of the acquired wealth management firm in excess of Base Earnings up to Target Earnings, plus a percentage of any EBPC in excess of Target Earnings. Acquired Base Earnings is equal to our preferred position in Base Ea rnings or comparable measures. We are entitled to receive these earnings notwithstanding any earnings that we are entitled to receive in excess of Target Earnings. Base Earnings may change in future periods for various bu siness or contractual matters. 5. Tax Adjustments represent the tax benefits of intangible assets, including goodwill, associated with deductions allowed for t ax amortization of intangible assets in the respective periods based on a pro forma 27% income tax rate. Such amounts were generated from acquisitions completed where the Company received a step - up in basis for tax purposes. Acquired intangible assets may be amortized for tax purposes, generally over a 15 - year period. Due to the Company’s acquisitive nature, tax deductions allowed on acquired intangible assets provide additional significant supplem ent al economic benefit. The tax benefit from amortization is identified to show the full economic benefit of deductions for acquired intangible assets with the step - up in tax basis. 21

Outstanding Year Reinforcing Leadership in the Independent Wealth Management Sector 22 Our business again delivered excellent results for shareholders in 2021… ▪ Ended the year with 84 partner firms in 4 countries globally ▪ Strong growth and margin expansion, combined with meaningful cash flow generation on a full - year basis. ▪ Revenues of $1.8 billion, reflecting 32.1% YOY growth. ▪ Adjusted EBITDA margin (1) of 25.1%, 150 percentage points higher year - over - year. ▪ Adjusted Net Income Excluding Tax Adjustments Per Share (2) of $3.36, up 36.6% versus 2020. ▪ Significant growth in Cash Flow Available for Capital Allocation (2) , increasing 59.6% YOY to $319.9 million. ▪ Tax efficient acquisition structure continued to generate substantial value with expanding cash flows. …And we completed a record year of M&A activity ▪ Closed 14 new partner firms and 24 mergers, totaling 38 transactions. ▪ Expanded our presence in key wealth markets across the U.S. and internationally. ▪ Continued to add outstanding new partner firms, each an industry leader with strong businesses, talented advisors, and deep, long - standing client relationships. 1. Calculated as Adjusted EBITDA divided by revenues. 2. Non - GAAP financial measure. See appendix for reconciliations.

Outstanding Year Reinforcing Leadership in the Independent Wealth Management Sector 23 The momentum of our business into 2022 remains substantial… ▪ At current market levels we believe this dynamic supports: ▪ 20+% annual growth in revenues and Adjusted EBITDA. ▪ Full year 2022 Adjusted EBITDA margin (1) of ~25.5%. ▪ Management fees, which are highly variable because they are tied to the profitability of our partner firms, limit the effect of revenue volatility or increases in operating expenses on our Adjusted EBITDA. ▪ Maintaining our Net Leverage Ratio (2) target range at 3.5x to 4.5x. … And we are well positioned to capitalize on the forward opportunity ▪ Participating in a multi - trillion, global industry that is experiencing a transformational shift globally. ▪ Despite recent merger activity, consolidation in this industry is just beginning, representing a forward opportunity that will span many years. ▪ We are delivering consistently high growth supported by outstanding execution, discipline and nimbleness. 1. Calculated as Adjusted EBITDA divided by revenues. 2. Net leverage ratio represents the First Lien Leverage Ratio (as defined in the Credit Facility) and means the ratio of amount s o utstanding under the First Lien Term Loan and First Lien Revolver plus other outstanding debt obligations secured by a lien on the assets of Focus LLC (excluding letters of credit other than unpai d d rawings thereunder) minus unrestricted cash and cash equivalents to Consolidated EBITDA (as defined in the Credit Facility).
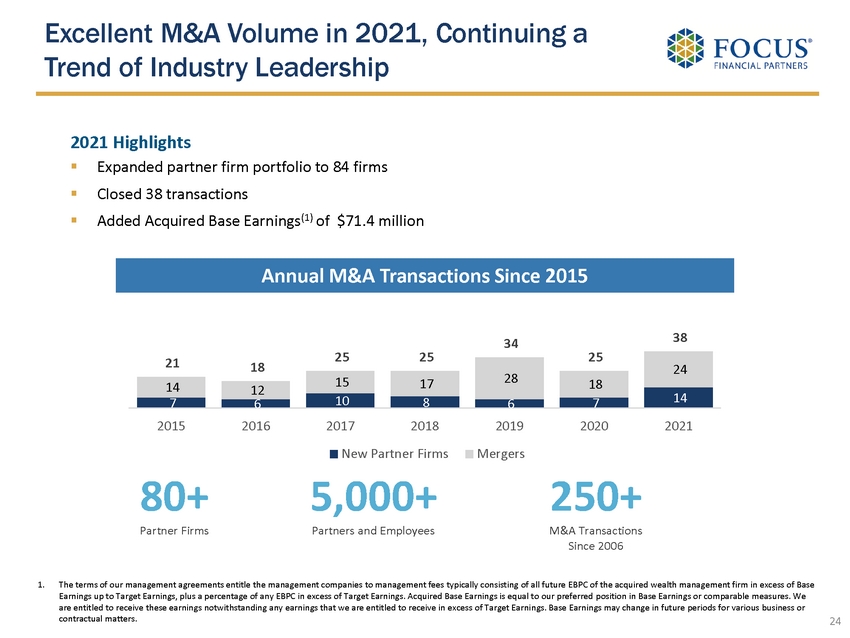
Excellent M&A Volume in 2021, Continuing a Trend of Industry Leadership 24 2021 Highlights ▪ Expanded partner firm portfolio to 84 firms ▪ Closed 38 transactions ▪ Added Acquired Base Earnings (1) of $71.4 million 80+ Partner Firms 250+ M&A Transactions Since 2006 5,000+ Partners and Employees 1. The terms of our management agreements entitle the management companies to management fees typically consisting of all future EB PC of the acquired wealth management firm in excess of Base Earnings up to Target Earnings, plus a percentage of any EBPC in excess of Target Earnings. Acquired Base Earnings is equal t o o ur preferred position in Base Earnings or comparable measures. We are entitled to receive these earnings notwithstanding any earnings that we are entitled to receive in excess of Target Earni ngs . Base Earnings may change in future periods for various business or contractual matters. Annual M&A Transactions Since 2015 7 6 10 8 6 7 14 14 12 15 17 28 18 24 21 18 25 25 34 25 38 2015 2016 2017 2018 2019 2020 2021 New Partner Firms Mergers
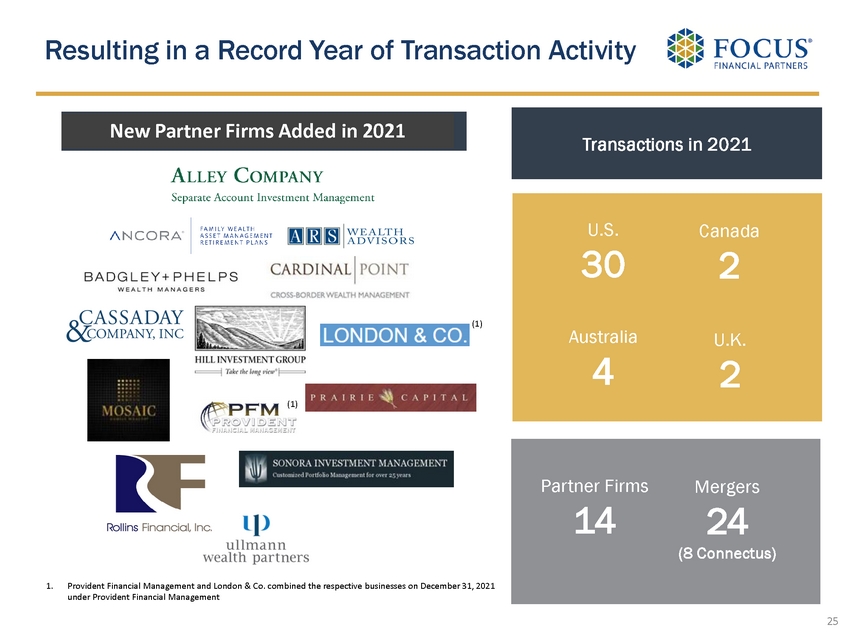
Resulting in a Record Year of Transaction Activity 25 Transactions in 2021 U.S. 30 Australia 4 Canada 2 U.K. 2 U.S. RIA [27] Non - U.S. RIA [11] New Partner Firms Added in 2021 Partner Firms 14 Mergers 24 (8 Connectus) 1. Provident Financial Management and London & Co. combined the respective businesses on December 31, 2021 under Provident Financial Management (1) (1)

M&A Momentum Remained Strong in Q4 2021 26 Type Acquiring Partner Firm Closing Date Primary Office Location Q1 2022 Mergers 1. Harris, Saunders & Leach The Colony Group 2/4/2022 Washington, DC 1. Ancora 10/1/2021 Cleveland, OH 2. Sonora Investment Management 10/1/2021 Phoenix, AZ 3. Cardinal Point 11/1/2021 Toronto, Canada 4. Alley Company 12/31/2021 Lake Forest, IL 5. Cassaday & Company 12/31/2021 McLean, Virginia 6. Mosaic Family Wealth 12/31/2021 St. Louis, MO 7. London & Co. 12/31/2021 Los Angeles, CA 8. Provident Financial Management 12/31/2021 Santa Monica, CA 9. Ullmann Wealth Partners 12/31/2021 Jacksonville Beach, FL 1. Gavin Group Connectus 10/1/2021 Toronto, Canada 2. Misso Wealth Management Connectus 10/1/2021 Brisbane, Australia 3. Siena Investments Buckingham Strategic Wealth 10/1/2021 Grand Ledge, MI 4. Trident Financial Planning Connectus 10/1/2021 Berkshire, UK 5. Wechter Feldman Wealth Management GYL Financial Synergies 10/1/2021 Parsippany, NJ 6. Harrison, McCarthy The Colony Group 11/1/2021 Millburn, NJ 7. New England Investment & Retirement Group Connectus 11/1/2021 North Andover, MA 8. Northcoast Connectus 11/1/2021 Greenwich, CT 9. The Planned Approach Buckingham Strategic Wealth 11/1/2021 Kansas City, MO 10. Capital Advisors The Colony Group 12/1/2021 Southborough, MA 11. Avery & Greig NKSFB 12/31/2021 Santa Monica, CA 12. Deaton Relative Value Partners 12/31/2021 Chicago, IL 13. Derby and Company The Colony Group 12/31/2021 Newton, MA Firm Name Mergers Q4 2021 Partner Firm Acquisitions

And Throughout 2021 27 Type Acquiring Partner Firm Closing Date Primary Office Location 1. ARS Wealth Advisors 7/1/2021 St. Petersburg, FL 2. Badgley Phelps Wealth Managers 8/1/2021 Seattle, WA 1. Carolina Capital Consulting Buckingham Strategic Wealth 7/1/2021 Charlotte, NC 2. George Ferizis Group Connectus 7/1/2021 Sydney, Australia 3. Integer Wealth Advisors Group JFS Wealth Advisors 7/1/2021 Philadelphia, PA 4. Pitt Escala Partners 7/12/2021 Melbourne, Australia 5. New Providence Asset Management The Colony Group 8/1/2021 New York, NY 6. Collins Investment Group XML Financial Group 9/1/2021 Bethesda, MD 7. Legacy Wealth Partners The Colony Group 9/1/2021 Calabasas, CA 1. Prairie Capital Management 4/1/2021 Kansas City, MO 2. Rollins Financial 4/1/2021 Atlanta, GA 1. Matheys Lane Capital Management SCS Financial 4/1/2021 Providence, RI 2. Aspiri Financial Services Connectus 5/1/2021 Brisbane, Australia 3. Investment Counsel LaFleur & Godfrey 5/1/2021 Petoskey, MI Partner Firm Acquisitions 1. Hill Investment Group 3/1/2021 St. Louis, MO Mergers 1. Watterson Financial Planning Connectus 2/1/2021 Cheshire, UK Firm Name Q1 2021 Partner Firm Acquisitions Mergers Partner Firm Acquisitions Q2 2021 Mergers Q3 2021
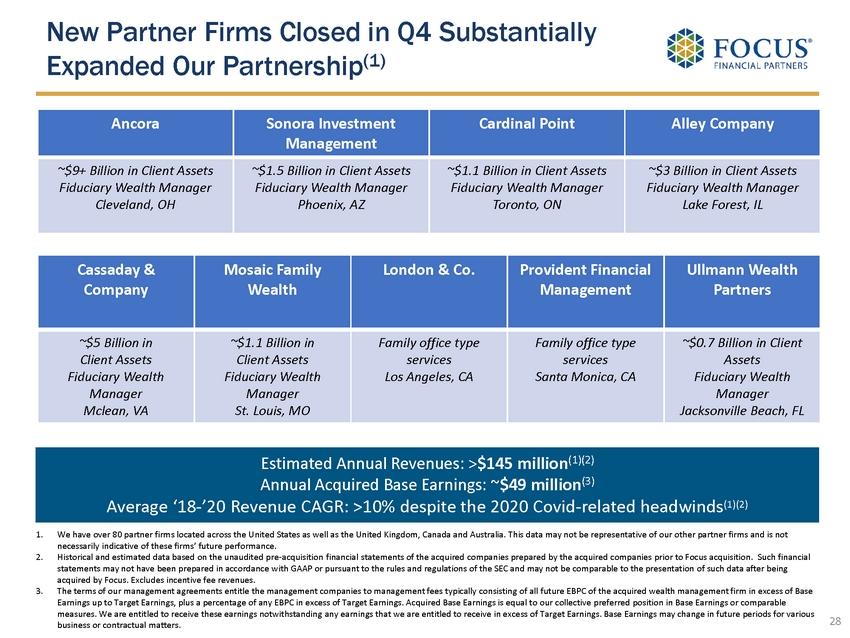
New Partner Firms Closed in Q4 Substantially Expanded Our Partnership (1) 28 1. We have over 80 partner firms located across the United States as well as the United Kingdom, Canada and Australia. This data ma y not be representative of our other partner firms and is not necessarily indicative of these firms’ future performance. 2. Historical and estimated data based on the unaudited pre - acquisition financial statements of the acquired companies prepared by the acquired companies prior to Focus acquisition. Such financial statements may not have been prepared in accordance with GAAP or pursuant to the rules and regulations of the SEC and may not be comparable to the presentation of such data after being acquired by Focus. Excludes incentive fee revenues. 3. The terms of our management agreements entitle the management companies to management fees typically consisting of all future EB PC of the acquired wealth management firm in excess of Base Earnings up to Target Earnings, plus a percentage of any EBPC in excess of Target Earnings. Acquired Base Earnings is equal t o o ur collective preferred position in Base Earnings or comparable measures. We are entitled to receive these earnings notwithstanding any earnings that we are entitled to receive in excess of Ta rget Earnings. Base Earnings may change in future periods for various business or contractual matters. Estimated Annual Revenues: > $145 million ( 1)(2) Annual Acquired Base Earnings: ~ $49 million (3) Average ‘18 - ’20 Revenue CAGR: >10% despite the 2020 Covid - related headwinds (1)(2) Ancora Sonora Investment Management Cardinal Point Alley Company ~$9+ Billion in Client Assets Fiduciary Wealth Manager Cleveland, OH ~$1.5 Billion in Client Assets Fiduciary Wealth Manager Phoenix, AZ ~$1.1 Billion in Client Assets Fiduciary Wealth Manager Toronto, ON ~$3 Billion in Client Assets Fiduciary Wealth Manager Lake Forest, IL Cassaday & Company Mosaic Family Wealth London & Co. Provident Financial Management Ullmann Wealth Partners ~$5 Billion in Client Assets Fiduciary Wealth Manager Mclean, VA ~$1.1 Billion in Client Assets Fiduciary Wealth Manager St. Louis, MO Family office type services Los Angeles, CA Family office type services Santa Monica, CA ~$0.7 Billion in Client Assets Fiduciary Wealth Manager Jacksonville Beach, FL
29 First Quarter 2022 Outlook
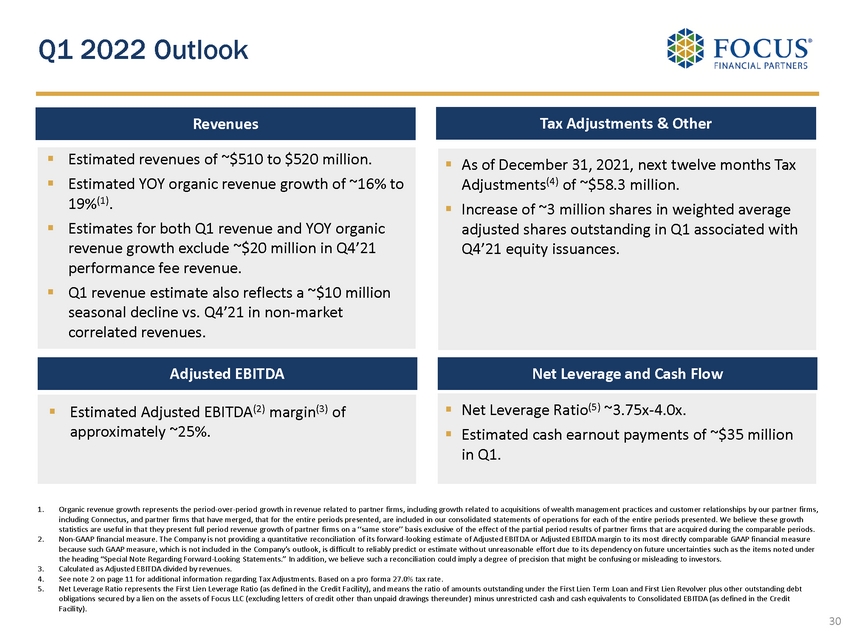
▪ Estimated revenues of ~$510 to $520 million. ▪ Estimated YOY organic revenue growth of ~16% to 19% (1) . ▪ Estimates for both Q1 revenue and YOY organic revenue growth exclude ~$20 million in Q4’21 performance fee revenue. ▪ Q1 revenue estimate also reflects a ~$10 million seasonal decline vs. Q4’21 in non - market correlated revenues. Q1 2022 Outlook 1. Organic revenue growth represents the period - over - period growth in revenue related to partner firms, including growth related to acquisitions of wealth management practices and customer relationships by our partner firms, including Connectus , and partner firms that have merged, that for the entire periods presented, are included in our consolidated statements of o per ations for each of the entire periods presented. We believe these growth statistics are useful in that they present full period revenue growth of partner firms on a ‘‘same store’’ basis exclusive of th e effect of the partial period results of partner firms that are acquired during the comparable periods. 2. Non - GAAP financial measure. The Company is not providing a quantitative reconciliation of its forward - looking estimate of Adjust ed EBITDA or Adjusted EBITDA margin to its most directly comparable GAAP financial measure because such GAAP measure, which is not included in the Company’s outlook, is difficult to reliably predict or estimate witho ut unreasonable effort due to its dependency on future uncertainties such as the items noted under the heading “Special Note Regarding Forward - Looking Statements.” In addition, we believe such a reconciliation could imply a deg ree of precision that might be confusing or misleading to investors. 3. Calculated as Adjusted EBITDA divided by revenues. 4. See note 2 on page 11 for additional information regarding Tax Adjustments. Based on a pro forma 27.0% tax rate. 5. Net Leverage Ratio represents the First Lien Leverage Ratio (as defined in the Credit Facility), and means the ratio of amoun ts outstanding under the First Lien Term Loan and First Lien Revolver plus other outstanding debt obligations secured by a lien on the assets of Focus LLC (excluding letters of credit other than unpaid drawings thereunder) min us unrestricted cash and cash equivalents to Consolidated EBITDA (as defined in the Credit Facility). 30 Revenues Adjusted EBITDA ▪ Estimated Adjusted EBITDA (2) margin (3) of approximately ~2 5 %. ▪ As of December 31, 2021, next twelve months Tax Adjustments (4) of ~$58.3 million. ▪ Increase of ~3 million shares in weighted average adjusted shares outstanding in Q1 associated with Q4’21 equity issuances. Tax Adjustments & Other Net Leverage and Cash Flow ▪ Net Leverage Ratio (5) ~3.75x - 4.0x. ▪ Estimated cash earnout payments of ~$35 million in Q1.

Leverage 31

Strong Credit and Liquidity Profile Low debt cost ~2.6% weighted average interest rate on funded borrowings Limited duration risk ~2.5 years remaining to maturity for Tranche A Term Loan (July 2024) ~6.5 years remaining to maturity for Tranche B Term Loan (June 2028) ~1.5 years remaining to maturity for Revolver (July 2023) Interest rates $800 million or ~35% of total debt is fixed via hedges at ~2.6% (inclusive of the 200 basis point spread) ~$796 million of floating rate debt is subject to a 50 basis point LIBOR floor 95%+ fee - based and recurring revenues, variable management fees and earnings preference protect cash flows Downside protection 32 Ample liquidity ~$311 m illion cash ~$642 million available revolver capacity ~$320 million LTM Cash Flow Available for Capital Allocation (1) As of December 31, 2021: 1. Non - GAAP financial measure. See Appendix for reconciliations.

Equity market decline (20)% (40)% Assumed Client Portfolio Allocation to Equities 50% 50% Decline in market-correlated revenues (1) (10)% (20)% ($ in millions) Reported Q4'21 Market-Correlated Revenues 402.5$ 362.3$ 322.0$ Q4'21 Non-Correlated Revenues 121.4$ 121.4$ 121.4$ Total Revenue - Q4 523.9$ 483.7$ 443.4$ Covenant EBITDA (2) - LTM 544.8$ 524.7$ 505.0$ Net Debt (3) 2,096.7$ 2,096.7$ 2,096.7$ Net Leverage Ratio (2) 3.85x 4.00x 4.15x Change from Q4 Reported 0.15x 0.30x Sensitivity Analysis (Illustrative Only) Earnings Preference Provides Strong Downside Earnings Protection 1. The analysis depicts the impact on our Net Leverage Ratio (as defined in the Credit Facility) resulting from a hypothetical c han ge in Q4 market correlated revenues only. All other revenues/expenses were kept constant except management fees, which are tied to the profitability of our partner firms. 2. Net leverage ratio represents the First Lien Leverage Ratio (as defined in the Credit Facility), and means the ratio of amoun ts outstanding under the First Lien Term Loan and First Lien Revolver plus other outstanding debt obligations secured by a lien on the assets of Focus LLC (excluding letters of credit other than unpaid drawings thereunder) min us unrestricted cash and cash equivalents to Consolidated EBITDA (as defined in the Credit Facility), which in the above table is referred to as “Covenant EBITDA.” 3. Net Debt represents amounts outstanding under the First Lien Term Loan and First Lien Revolver plus other outstanding debt ob lig ations secured by a lien on the assets of Focus LLC (excluding letters of credit other than unpaid drawings thereunder) minus unrestricted cash and cash equivalents. 4. The terms of our management agreements entitle the management companies to management fees typically consisting of all future EB PC of the acquired wealth management firm in excess of Base Earnings up to Target Earnings, plus a percentage of any EBPC in excess of Target Earnings. Acquired Base Earnings is equal to our collective prefe rre d position in Base Earnings or comparable measures. We are entitled to receive these earnings notwithstanding any earnings that we are entitled to receive in excess of Target Earnings. Base Earnings may change in future pe riods for various business or contractual matters. ▪ Reflects one - quarter impact to revenues and Covenant EBITDA (1)(2) ▪ Assumes all other revenue sources and expenses remain unchanged except for management fees ▪ In the event of a multi - quarter downturn ▪ Partner firms would further reduce their cost structure ▪ M&A activity would moderate ▪ Cash flow would be available for debt r epayment ▪ Significant head room on covenant ▪ Q4 Covenant EBITDA - LTM (2) would need to drop to $335.5 million, or decline by 38%, to reach 6.25x net leverage ratio covenant 33

$12 $19 $35 $35 $38 $39 $39 $57 $58 $68 $79 $129 Q1 2019 Q2 2019 Q3 2019 Q4 2019 Q1 2020 Q2 2020 Q3 2020 Q4 2020 Q1 2021 Q2 2021 Q3 2021 Q4 2021 Supported By Substantial Acquired Base Earnings (1) 34 1. The terms of our management agreements entitle the management companies to management fees typically consisting of all future EB PC of the acquired wealth management firm in excess of Base Earnings up to Target Earnings, plus a percentage of any EBPC in excess of Target Earnings. Acquired Base Earnings is equal to our preferred positi on in Base Earnings or comparable measures. We are entitled to receive these earnings notwithstanding any earnings that we are entitled to receive in excess of Target Earnings. Base Earnings may change in future pe riods for various business or contractual matters. 3 5 6 6 7 8 8 13 14 16 18 27 ($ in Millions) Cumulative New Partner Firms Cumulative Acquired Base Earnings Cumulative New Partner Firms and Acquired Base Earnings (1) Since Q1 2019

Cash Flows 35
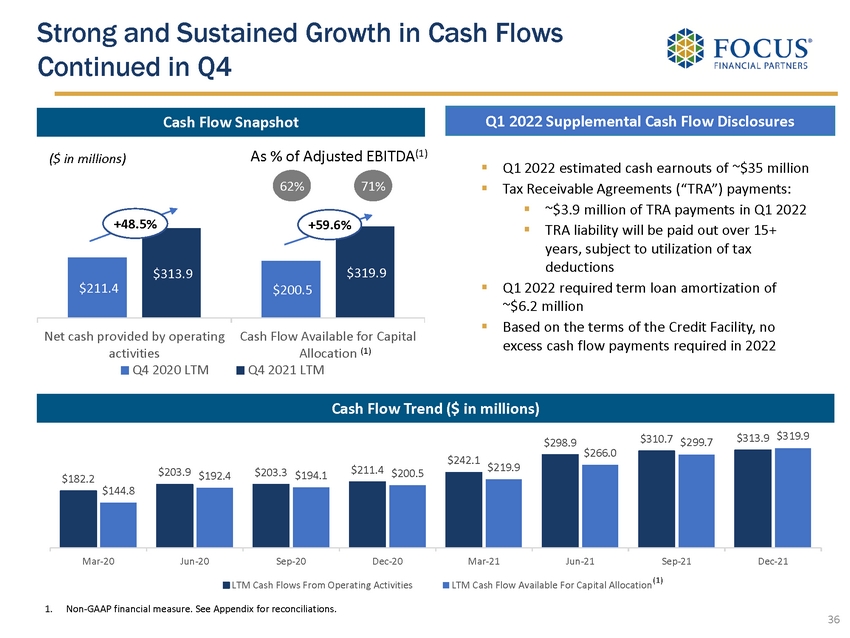
$211.4 $200.5 $313.9 $319.9 Net cash provided by operating activities Cash Flow Available for Capital Allocation Q4 2020 LTM Q4 2021 LTM Q1 2022 Supplemental Cash Flow Disclosures Strong and Sustained Growth in Cash Flows Continued in Q4 As % of Adjusted EBITDA (1) 62 % 71% Cash Flow Snapshot ▪ Q1 2022 estimated cash earnouts of ~$35 million ▪ Tax Receivable Agreements (“TRA”) payments: ▪ ~$3.9 million of TRA payments in Q1 2022 ▪ TRA liability will be paid out over 15+ years, subject to utilization of tax deductions ▪ Q1 2022 required term loan amortization of ~$6.2 million ▪ Based on the terms of the Credit Facility, no excess cash flow payments required in 2022 ($ in millions) 1. Non - GAAP financial measure. See Appendix for reconciliations. 36 +48.5% (1) +59.6% Cash Flow Trend ($ in millions) $182.2 $203.9 $203.3 $211.4 $242.1 $298.9 $310.7 $313.9 $144.8 $192.4 $194.1 $200.5 $219.9 $266.0 $299.7 $319.9 Mar-20 Jun-20 Sep-20 Dec-20 Mar-21 Jun-21 Sep-21 Dec-21 LTM Cash Flows From Operating Activities LTM Cash Flow Available For Capital Allocation (1)

Over $2.5 Billion Tax Shield Created by Tax Efficient Transaction Structure 37 $216 $210 $209 $1,910 $58 $57 $56 $516 2022 2023 2024 2025 & Thereafter Unamortized Gross Tax Shield Estimated Tax Benefit Focus generally acquires intangible assets which generate tax shields (1) ($ in millions) 1. Focus partner firms typically have limited tangible assets on acquisition date. Focus typically purchases customer lists, man age ment contracts and goodwill. Consideration is typically paid in cash. Each incremental M&A transaction creates an additional tax shield which generates substantial value for shareholders and enhances our cash flows. Each tax shi eld is amortized over 15 years (as required under Internal Revenue Code Section 197). 2. As of December 31, 2021. 3. Based on 27% pro forma tax rate. 4. Based on assumed 8% discount rate. 5. Based on Q4 2021 Adjusted Shares Outstanding. See Appendix for reconciliation of number of shares. $2.5+ billion cumulative unamortized gross tax shield (1,2) ~$687 million economic benefit (3) ~$5.27 per share (4,5) ~$441 million net present value (4) Incremental acquisitions & earnout payments will drive new tax shields in the future. Any increase in corporate tax rates will also increase tax benefits.

Appendix 38

Net Income (Loss) to Adjusted EBITDA Reconciliation 1. Represents one - time expenses primarily related to an acquisition. Refer to our 10 - Q and 10 - K filings for additional details. 2. Relates to offering expenses associated with the March 2021 and June 2021 secondary offerings. 39 LTM ($ in thousands) 2019 2020 2021 Dec. 31, 2020 Dec. 31, 2021 Sept. 30, 2019 Net income (loss) (12,025)$ 48,965$ 24,440$ 7,674$ 14,935$ 18,213$ Interest income (1,164) (453) (422) (41) (112) (1,284) Interest expense 58,291 41,658 55,001 9,112 17,108 54,103 Income tax expense 7,049 20,660 20,082 4,148 14,044 82 Amortization of debt financing costs 3,452 2,909 3,958 709 1,102 3,265 Intangible amortization 130,718 147,783 187,848 39,024 54,807 119,841 Depreciation and other amortization 10,675 12,451 14,625 3,320 3,790 9,784 Non-cash equity compensation expense 18,329 22,285 31,602 6,697 7,033 26,231 Non-cash changes in fair value of estimated contingent consideration 38,797 19,197 112,416 19,818 16,175 3,455 Loss on extinguishment of borrowings — 6,094 — — — — Other expense, net 1,049 214 337 239 118 2,816 Impairment of equity method investment 11,749 — — — — — Management contract buyout 1,428 — — — — 1,428 Other one-time transaction expenses (1) 1,486 — — — — 3,107 Secondary offering expenses (2) — — 1,409 — — — Adjusted EBITDA 269,834$ 321,763$ 451,296$ 90,700$ 129,000$ 241,041$ Three months ended
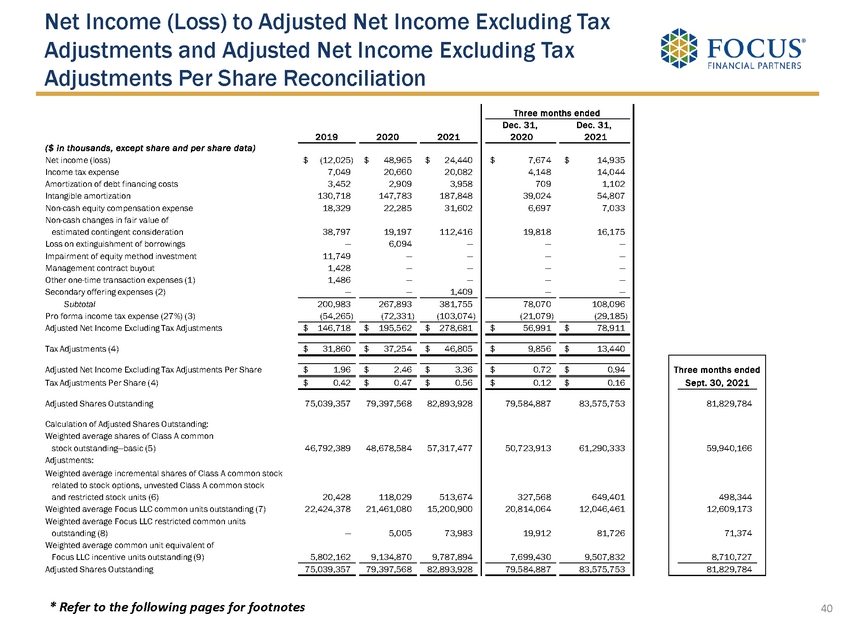
Net Income (Loss) to Adjusted Net Income Excluding Tax Adjustments and Adjusted Net Income Excluding Tax Adjustments Per Share Reconciliation * Refer to the following pages for footnotes 40 2019 2020 2021 Dec. 31, 2020 Dec. 31, 2021 ($ in thousands, except share and per share data) Net income (loss) (12,025)$ 48,965$ 24,440$ 7,674$ 14,935$ Income tax expense 7,049 20,660 20,082 4,148 14,044 Amortization of debt financing costs 3,452 2,909 3,958 709 1,102 Intangible amortization 130,718 147,783 187,848 39,024 54,807 Non-cash equity compensation expense 18,329 22,285 31,602 6,697 7,033 Non-cash changes in fair value of estimated contingent consideration 38,797 19,197 112,416 19,818 16,175 Loss on extinguishment of borrowings — 6,094 — — — Impairment of equity method investment 11,749 — — — — Management contract buyout 1,428 — — — — Other one-time transaction expenses (1) 1,486 — — — — Secondary offering expenses (2) — — 1,409 — — Subtotal 200,983 267,893 381,755 78,070 108,096 Pro forma income tax expense (27%) (3) (54,265) (72,331) (103,074) (21,079) (29,185) Adjusted Net Income Excluding Tax Adjustments 146,718$ 195,562$ 278,681$ 56,991$ 78,911$ Tax Adjustments (4) 31,860$ 37,254$ 46,805$ 9,856$ 13,440$ Adjusted Net Income Excluding Tax Adjustments Per Share 1.96$ 2.46$ 3.36$ 0.72$ 0.94$ Three months ended Tax Adjustments Per Share (4) 0.42$ 0.47$ 0.56$ 0.12$ 0.16$ Sept. 30, 2021 Adjusted Shares Outstanding 75,039,357 79,397,568 82,893,928 79,584,887 83,575,753 81,829,784 Calculation of Adjusted Shares Outstanding: Weighted average shares of Class A common stock outstanding—basic (5) 46,792,389 48,678,584 57,317,477 50,723,913 61,290,333 59,940,166 Adjustments: Weighted average incremental shares of Class A common stock related to stock options, unvested Class A common stock and restricted stock units (6) 20,428 118,029 513,674 327,568 649,401 498,344 Weighted average Focus LLC common units outstanding (7) 22,424,378 21,461,080 15,200,900 20,814,064 12,046,461 12,609,173 Weighted average Focus LLC restricted common units outstanding (8) — 5,005 73,983 19,912 81,726 71,374 Weighted average common unit equivalent of Focus LLC incentive units outstanding (9) 5,802,162 9,134,870 9,787,894 7,699,430 9,507,832 8,710,727 Adjusted Shares Outstanding 75,039,357 79,397,568 82,893,928 79,584,887 83,575,753 81,829,784 Three months ended

* These footnotes refer to the tables on the previous page. 1. Represents one - time expenses primarily related to an acquisition. Refer to our 10 - Q and 10 - K filings for additional details. 2. Relates to offering expenses associated with the March 2021 and June 2021 secondary offerings. 3. The pro forma income tax rate of 27% reflects the estimated U.S. federal, state, local and foreign income tax rates applicabl e t o corporations in the jurisdictions we conduct business. 4. Tax Adjustments represent the tax benefits of intangible assets, including goodwill, associated with deductions allowed for t ax amortization of intangible assets in the respective periods based on a pro forma 27% income tax rate. Such amounts were generated from acquisitions completed where we received a step - up in basis for tax purposes. Acquired intangible assets may be amortized for tax purposes, generally over a 15 - year period. Due to our acquisitive nature, tax deductions allowed on acquired intangible assets provide additional significant supplemental economic benefit. The tax benefit from amortization is included to show the full economic benefit of deductions for acquired intangible assets with the step - up in tax basis. As of December 31, 2021, estimated Tax Adjustments from intangible asset related income tax benefits from closed acquisitions based on a pro forma 27% income tax rate for the next 12 months is $58.3 million. 5. Represents our GAAP weighted average Class A common stock outstanding – basic. 6. Represents the incremental shares related to stock options, unvested Class A common stock and restricted stock units as calculated under the treasury stock method. 7. Assumes that 100% of the Focus LLC common units, including contingently issuable Focus LLC common units, if any, were exchanged for Class A common stock. 8. Assumes that 100% of the Focus LLC restricted common units were exchanged for Class A common stock. 9. Assumes that 100% of the vested and unvested Focus LLC incentive units were converted into Focus LLC common units based on the closing price of our Class A common stock at the end of the respective period and such Focus LLC common units were exchanged for Class A common stock. 41 Net Income (Loss) to Adjusted Net Income Excluding Tax Adjustments and Adjusted Net Income Excluding Tax Adjustments Per Share Reconciliation

Reconciliation of Cash Flow Available for Capital Allocation 42 1. A portion of contingent consideration paid is classified as operating cash outflows in accordance with GAAP, and therefore is a reconciling item to arrive at Cash Flow Available for Capital Allocation. 2. Cash Flow Available for Capital Allocation excludes all contingent consideration that was included in either operating, inves tin g or financing activities of our consolidated statements of cash flows. 3. Net cash provided by operating activities for the three months ended March 31, 2020 and 2021, respectively, include cash outf low s related to due to affiliates (i.e. management fees). A portion of management fees were paid in Q1 post the issuance of the respective annual audit include d i n our Form 10 - K. ($ in thousands) June 30, 2019 Sept. 30, 2019 Dec. 31, 2019 March 31, 2020 (3) June 30, 2020 Sept. 30, 2020 Dec. 31, 2020 Net cash provided by operating activities 39,305$ 74,702$ 64,854$ 3,382$ 60,996$ 74,089$ 72,894$ Purchase of fixed assets (8,185) (10,698) (4,714) (3,188) (2,759) (6,744) (6,658) Distributions for unitholders (11,138) (3,491) (5,416) (4,567) (3,076) (8,122) (6,692) Payments under tax receivable agreements — — — — — — — Adjusted Free Cash Flow 19,982$ 60,513$ 54,724$ (4,373)$ 55,161$ 59,223$ 59,544$ Portion of contingent consideration paid included in operating activities (1) 4,012 825 815 8,344 16,369 3,806 2,394 Cash Flow Available for Capital Allocation (2) 23,994$ 61,338$ 55,539$ 3,971$ 71,530$ 63,029$ 61,938$ Three months ended ($ in thousands) Mar. 31, 2021 (3) June 30, 2021 Sept. 30, 2021 Dec. 31, 2021 Dec. 31, 2020 Dec. 31, 2021 Net cash provided by operating activities 34,128$ 117,832$ 85,888$ 76,070$ 211,361$ 313,918$ Purchase of fixed assets (2,835) (1,483) (2,242) (4,458) (19,349) (11,018) Distributions for unitholders (9,055) (10,053) (7,283) (5,920) (22,457) (32,311) Payments under tax receivable agreements (4,112) (311) — — — (4,423) Adjusted Free Cash Flow 18,126$ 105,985$ 76,363$ 65,692$ 169,555$ 266,166$ Portion of contingent consideration paid included in operating activities (1) 5,276 11,605 20,415 16,439 30,913 53,735 Cash Flow Available for Capital Allocation (2) 23,402$ 117,590$ 96,778$ 82,131$ 200,468$ 319,901$ Trailing 4-Quarters endedThree months ended