Exhibit 99.2

Focus Financial Partners Inc. Third Quarter 2022 Earnings Release Supplement November 3 , 2022

2 Disclaimer Special Note Regarding Forward - Looking Statements Some of the information in this presentation may contain forward - looking statements . Forward - looking statements give our current expectations, contain projections of results of operations or of financial condition, or forecasts of future events . Words such as “may,” “assume,” “forecast,” “position,” “predict,” “strategy,” “expect,” “intend,” “plan,” “estimate,” “anticipate,” “believe,” “project,” “budget,” “potential,” “continue,” “will” and similar expressions are used to identify forward - looking statements . They can be affected by assumptions used or by known or unknown risks or uncertainties . Consequently, no forward - looking statements can be guaranteed . When considering these forward - looking statements, you should keep in mind the risk factors and other cautionary statements in this presentation . Actual results may vary materially . You are cautioned not to place undue reliance on any forward - looking statements . You should also understand that it is not possible to predict or identify all such factors and should not consider the following list to be a complete statement of all potential risks and uncertainties . Factors that could cause our actual results to differ materially from the results contemplated by such forward - looking statements include the impact and duration of the outbreak of the novel coronavirus, fluctuations in wealth management fees, our reliance on our partner firms and the principals who manage their businesses, our ability to make successful acquisitions, unknown liabilities of or poor performance by acquired businesses, harm to our reputation, our inability to facilitate smooth succession planning at our partner firms, our inability to compete, our reliance on key personnel, our inability to attract, develop and retain talented wealth management professionals, our inability to retain clients following an acquisition, write down of goodwill and other intangible assets, our failure to maintain and properly safeguard an adequate technology infrastructure, cyber - attacks, our inability to recover from business continuity problems, inadequate insurance coverage, the termination of management agreements by management companies, our inability to generate sufficient cash to service all of our indebtedness, the failure of our partner firms to comply with applicable U . S . and non - U . S . regulatory requirements, legal proceedings and governmental inquiries and certain other factors . All forward - looking statements are expressly qualified in their entirety by the foregoing cautionary statements . Our forward - looking statements speak only as of the date of this presentation or as of the date as of which they are made . Except as required by applicable law, including federal securities laws, we do not intend to update or revise any forward - looking statements . Non - GAAP Financial Measures Adjusted EBITDA is a non - GAAP measure . Adjusted EBITDA is defined as net income (loss) excluding interest income, interest expense, income tax expense, amortization of debt financing costs, intangible amortization and impairments, if any, depreciation and other amortization, non - cash equity compensation expense, non - cash changes in fair value of estimated contingent consideration, loss on extinguishment of borrowings, other (income) expense, net, impairment of equity method investment, management contract buyout, other one - time transaction expenses and secondary offering expenses, if any . We believe that Adjusted EBITDA, viewed in addition to and not in lieu of, our reported GAAP results, provides additional useful information to investors regarding our performance and overall results of operations for various reasons, including the following : ( i ) non - cash equity grants made to employees or non - employees at a certain price and point in time do not necessarily reflect how our business is performing at any particular time ; stock - based compensation expense is not a key measure of our operating performance, (ii) contingent consideration or earn outs can vary substantially from company to company and depending upon each company’s growth metrics and accounting assumption methods ; the non - cash changes in fair value of estimated contingent consideration is not considered a key measure in comparing our operating performance, and (iii) amortization expenses can vary substantially from company to company and from period to period depending upon each company’s financing and accounting methods, the fair value and average expected life of acquired intangible assets and the method by which assets were acquired ; the amortization of intangible assets obtained in acquisitions are not considered a key measure in comparing our operating performance . We use Adjusted EBITDA ( i ) as a measure of operating performance, (ii) for planning purposes, including the preparation of budgets and forecasts, (iii) to allocate resources to enhance the financial performance of our business, (iv) to evaluate the effectiveness of our business strategies, and (v) as a consideration in determining compensation for certain employees . Adjusted EBITDA does not purport to be an alternative to net income (loss) or cash flows from operating activities . The term Adjusted EBITDA is not defined under GAAP, and Adjusted EBITDA is not a measure of net income (loss), operating income or any other performance or liquidity measure derived in accordance with GAAP . Therefore, Adjusted EBITDA has limitations as an analytical tool and should not be considered in isolation or as a substitute for analysis of our results as reported under GAAP . Some of these limitations are : ( i ) Adjusted EBITDA does not reflect all cash expenditures, future requirements for capital expenditures or contractual commitments, (ii) Adjusted EBITDA does not reflect changes in, or cash requirements for, working capital needs, and (iii) Adjusted EBITDA does not reflect the interest expense on our debt or the cash requirements necessary to service interest or principal payments . In addition, Adjusted EBITDA can differ significantly from company to company depending on strategic decisions regarding capital structure, the tax jurisdictions in which companies operate and capital investments . We compensate for these limitations by relying also on the GAAP results and using Adjusted EBITDA as supplemental information . We analyze our performance using Adjusted Net Income Excluding Tax Adjustments and Adjusted Net Income Excluding Tax Adjustments Per Share . Adjusted Net Income Excluding Tax Adjustments and Adjusted Net Income Excluding Tax Adjustments Per Share are non - GAAP measures . We define Adjusted Net Income Excluding Tax Adjustments as net income (loss) excluding income tax expense, amortization of debt financing costs, intangible amortization and impairments, if any, non - cash equity compensation expense, non - cash changes in fair value of estimated contingent consideration, loss on extinguishment of borrowings, impairment of equity method investment, management contract buyout, other one - time transaction expenses and secondary offering expenses, if any . The calculation of Adjusted Net Income Excluding Tax Adjustments also includes adjustments to reflect a pro forma 27 % income tax rate reflecting the estimated U . S . federal, state, local and foreign income tax rates applicable to corporations in the jurisdictions we conduct business . We believe that Adjusted Net Income Excluding Tax Adjustments and Adjusted Net Income Excluding Tax Adjustments Per Share, viewed in addition to and not in lieu of, our reported GAAP results, provide additional useful information to investors regarding our performance and overall results of operations for various reasons, including the following : ( i ) non - cash equity grants made to employees or non - employees at a certain price and point in time do not necessarily reflect how our business is performing at any particular time ; stock - based compensation expense is not a key measure of our operating performance, (ii) contingent consideration or earn outs can vary substantially from company to company and depending upon each company’s growth metrics and accounting assumption methods ; the non - cash changes in fair value of estimated contingent consideration is not considered a key measure in comparing our operating performance, and (iii) amortization expenses can vary substantially from company to company and from period to period depending upon each company’s financing and accounting methods, the fair value and average expected life of acquired intangible assets and the method by which assets were acquired ; the amortization of intangible assets obtained in acquisitions are not considered a key measure in comparing our operating performance . Adjusted Net Income Excluding Tax Adjustments and Adjusted Net Income Excluding Tax Adjustments Per Share do not purport to be an alternative to net income (loss) or cash flows from operating activities . The terms Adjusted Net Income Excluding Tax Adjustments and Adjusted Net Income Excluding Tax Adjustments Per Share are not defined under GAAP, and Adjusted Net Income Excluding Tax Adjustments and Adjusted Net Income Excluding Tax Adjustments Per Share are not a measure of net income (loss), operating income or any other performance or liquidity measure derived in accordance with GAAP . Therefore, Adjusted Net Income Excluding Tax Adjustments and Adjusted Net Income Excluding Tax Adjustments Per Share have limitations as an analytical tool and should not be considered in isolation or as a substitute for analysis of our results as reported under GAAP . Some of these limitations are : ( i ) Adjusted Net Income Excluding Tax Adjustments and Adjusted Net Income Excluding Tax Adjustments Per Share do not reflect all cash expenditures, future requirements for capital expenditures or contractual commitments, (ii) Adjusted Net Income Excluding Tax Adjustments and Adjusted Net Income Excluding Tax Adjustments Per Share do not reflect changes in, or cash requirements for, working capital needs, and (iii) Other companies in the financial services industry may calculate Adjusted Net Income Excluding Tax Adjustments and Adjusted Net Income Excluding Tax Adjustments Per Share differently than we do, limiting its usefulness as a comparative measure . In addition, Adjusted Net Income Excluding Tax Adjustments and Adjusted Net Income Excluding Tax Adjustments Per Share can differ significantly from company to company depending on strategic decisions regarding capital structure, the tax jurisdictions in which companies operate and capital investments . We compensate for these limitations by relying also on the GAAP results and use Adjusted Net Income Excluding Tax Adjustments and Adjusted Net Income Excluding Tax Adjustments Per Share as supplemental information . To supplement our statements of cash flows presented on a GAAP basis, we use non - GAAP liquidity measures on a trailing 4 - quarter basis to analyze cash flows generated from our operations . We consider Adjusted Free Cash Flow and Cash Flow Available for Capital Allocation to be liquidity measures that provide useful information to investors about the amount of cash generated by the business and are two factors in evaluating the amount of cash available to pay contingent consideration and deferred acquisition consideration, make strategic acquisitions and repay outstanding borrowings . Adjusted Free Cash Flow and Cash Flow Available for Capital Allocation do not represent our residual cash flow available for discretionary expenditures as they do not deduct our mandatory debt service requirements and other non - discretionary expenditures . We define Adjusted Free Cash Flow as net cash provided by operating activities, less purchase of fixed assets, distributions for Focus LLC unitholders and payments under tax receivable agreements (if any) . We define Cash Flow Available for Capital Allocation as Adjusted Free Cash Flow plus the portions of contingent consideration and deferred acquisition consideration paid which are classified as operating cash flows under GAAP . The balances of such contingent consideration and deferred acquisition consideration are classified as investing or financing cash flows under GAAP ; therefore, we add back the amounts included in operating cash flows so that the full amount of contingent consideration and deferred acquisition consideration payments are treated consistently . Adjusted Free Cash Flow and Cash Flow Available for Capital Allocation are not defined under GAAP and should not be considered as alternatives to net cash from operating, investing or financing activities . In addition, Adjusted Free Cash Flow and Cash Flow Available for Capital Allocation can differ significantly from company to company .

Table of Contents 3 Pages Key Investor Questions on Q3 2022 4 - 6 Selected Growth Trends 7 - 11 Third Quarter 2022 Recap 12 - 18 Fourth Quarter 2022 Outlook 19 - 20 Credit Profile, Interest Rate Sensitivity & Earnings Preference 21 - 26 Cash Flows 27 - 29 Appendix 30 - 34

Key Investor Questions on Q3 2022 4

Key Investor Questions on Q3 2022 5 1 What was your organic growth? 2 3 1. As of September 30, 2022. 2. Inception means first full four quarters as a Focus partner firm and reflects activity through all market cycles during that tim e. The analysis includes the 67 firms since inception that have been with us for at least 2 years as of September 30, 2022 in order to determine a baseline revenue growth rate. If Focus partner firms merged together , t heir financials have been combined. 3. The weightings are based on the September 30, 2022 LTM revenues of the respective partner firms. 4. Excluded the first full annual revenue from all the mergers made by our partner firm portfolio since joining Focus. 5. Analysis shows the actual interest expense for Q3’22, inclusive of the Company’s Term Loans, Revolver borrowings and the impa ct of the three cash flow hedges which effectively convert the LIBOR variable interest rate on the first $850 million of Term Loan borrowings to a fixed weighted average interest rate of 62 basis points. Th e analysis then assumes that 30 - day LIBOR and SOFR rates were either 150bps, 200bps or 250bps higher throughout the entire period. 6. Includes signed and pending close transactions. 7. Source: DeVoe & Company RIA Deal Book TM Third Quarter 2022. 9.1% 13.7% 12.4% 9.2% 10.4% 15.7% 14.8% 10.2% Firms that have not completed a merger (25 firms) Firms that have completed at least one merger (42 firms) Entire portfolio of 67 partner firms Entire portfolio of 67 partner firms Median Revenue CAGR Weighted Average Revenue CAGR (3) (3) (3) (3,4) Revenue CAGR Since Inception ( 1,2) Including Mergers Excluding Mergers Q3’22 Interest Expense Sensitivity to LIBOR/SOFR (5) Actual Q3’22 Reported Interest Expense (including impact of hedges) $26.5M Pre - tax Impact to Q3’22 Interest Expense if 30 - day LIBOR/SOFR was higher by: 150 bps 200 bps 250 bps +$6.2M +$8.2M +$10.1M 4.4% weighted average cost of debt $850M fixed at weighted average cost of 2.62% ~$1.6B floating at L+200 / 250 How sensitive are your earnings to higher interest rates? Has your M&A momentum been impacted by the recent market volatility? (6) 6 7 14 5 28 18 24 19 34 25 38 24 2019 2020 2021 2022 to date New Partner Firms Mergers +23% YOY increase in industry M&A transaction volumes as of 9M’22 (7) +54% YOY increase in M&A activity among RIAs with <$1bn in client assets as of 9M’22 (7) +52% Of RIAs seek to become a buyer of other RIAs as part of their growth strategy (7)
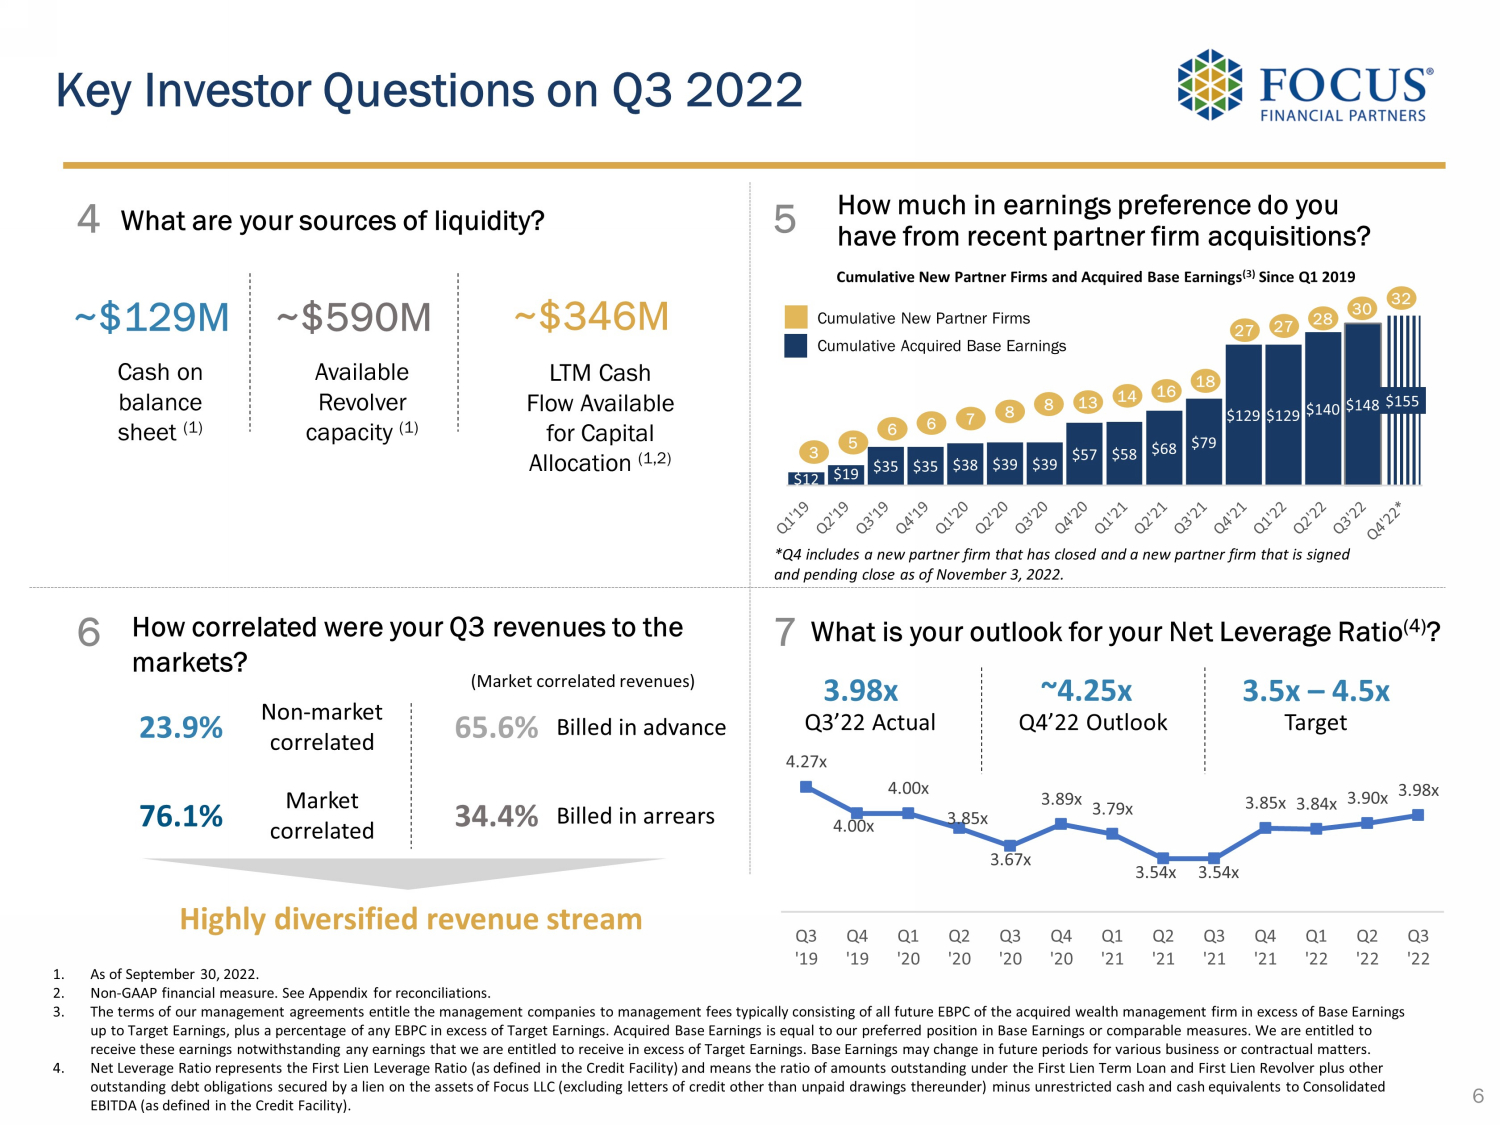
Key Investor Questions on Q3 2022 6 6 5 1. As of September 30, 2022. 2. Non - GAAP financial measure. See Appendix for reconciliations. 3. The terms of our management agreements entitle the management companies to management fees typically consisting of all future EB PC of the acquired wealth management firm in excess of Base Earnings up to Target Earnings, plus a percentage of any EBPC in excess of Target Earnings. Acquired Base Earnings is equal to our pre fer red position in Base Earnings or comparable measures. We are entitled to receive these earnings notwithstanding any earnings that we are entitled to receive in excess of Target Earnings. Base Earnin gs may change in future periods for various business or contractual matters. 4. Net Leverage Ratio represents the First Lien Leverage Ratio (as defined in the Credit Facility) and means the ratio of amount s o utstanding under the First Lien Term Loan and First Lien Revolver plus other outstanding debt obligations secured by a lien on the assets of Focus LLC (excluding letters of credit other than unpaid draw ing s thereunder) minus unrestricted cash and cash equivalents to Consolidated EBITDA (as defined in the Credit Facility). What is your outlook for your Net Leverage Ratio (4) ? 3.5x – 4.5x 3.98x ~4.25x Q3’22 Actual Q4’22 Outlook Target 4.27x 4.00x 4.00x 3.85x 3.67x 3.89x 3.79x 3.54x 3.54x 3.85x 3.84x 3.90x 3.98x Q3 '19 Q4 '19 Q1 '20 Q2 '20 Q3 '20 Q4 '20 Q1 '21 Q2 '21 Q3 '21 Q4 '21 Q1 '22 Q2 '22 Q3 '22 How correlated were your Q3 revenues to the markets? 23.9% Non - market correlated 76.1% Market correlated 65.6% 34.4% Highly diversified revenue stream 7 What are your sources of liquidity? ~$129M Cash on balance sheet (1) Available Revolver capacity (1) ~$590M ~$346M LTM Cash Flow Available for Capital Allocation (1,2) Billed in advance Billed in arrears (Market correlated revenues) 4 How much in earnings preference do you have from recent partner firm acquisitions? $12 $19 $35 $35 $38 $39 $39 $57 $58 $68 $79 $129 $129 $140 $148 $155 Cumulative New Partner Firms Cumulative Acquired Base Earnings 3 5 6 6 7 8 8 13 14 16 18 27 27 28 30 32 Cumulative New Partner Firms and Acquired Base Earnings (3) Since Q1 2019 *Q4 includes a new partner firm that has closed and a new partner firm that is signed and pending close as of November 3, 2022.

Selected Growth Trends 7

$68.7 $75.2 $80.6 $64.0 $1,149.7 $1,286.1 $1,717.4 $1,531.6 2019 2020 2021 Q3 '22 YTD 94.4% 94.5% 95.5% 96.0% Wealth Management Fees Allocation ($ in millions (3) , % of Revenues) 1. Non - GAAP financial measure. See Appendix for reconciliations. 2. Calculated as Adjusted EBITDA divided by revenues. 3. The sum of wealth management fees and other revenues as presented in this chart may not agree to total revenues as presented due to rounding. Strong and Sustained Revenue and Adjusted EBITDA Growth… 8 Revenues ($ in millions) Adjusted EBITDA (1) ($ in millions) Adjusted EBITDA Margin (2) (% o f Revenues) Wealth management fees Other revenues $1,218.3 $1,361.3 $1,798.0 $1,595.6 2019 2020 2021 Q3 '22 YTD CAGR: 21.5% $269.8 $321.8 $451.3 $400.8 2019 2020 2021 Q3 '22 YTD CAGR: 29.3% 22.1% 23.6% 25.1% 25.1% 2019 2020 2021 Q3 '22 YTD Margin: +3.0%

1. Non - GAAP financial measure. See Appendix for reconciliations. 2. Tax Adjustments represent the tax benefits of intangible assets, including goodwill, associated with deductions allowed for t ax amortization of intangible assets in the respective periods based on a pro forma 27% income tax rate. Such amounts were generated from acquisitions completed where the Company received a step - up in basis for tax purposes. Acquired intangible assets may be amortized for tax purposes, generally over a 15 - year period. Due to the Company’s acquisitive nature, tax deductions allowed on acquired intangible assets provide additional significant supplemental economic benefit. The tax benefit from amortization is identified to show the full economic benefit of deduction s f or acquired intangible assets with the step - up in tax basis. … Drives Strong Bottom - Line Performance Enhanced by a Tax Efficient Structure 9 Adjusted Net Income (“ ANI”) Excluding Tax Adjustments (1) ($ in millions) ANI Excluding Tax Adjustments Per Share (1) Tax Adjustments (2) ($ in millions) Tax Adjustments Per Share (1,2) $31.9 $37.3 $46.8 $47.5 2019 2020 2021 Q3 '22 YTD CAGR: 21.2% $0.42 $0.47 $0.56 $0.58 2019 2020 2021 Q3 '22 YTD CAGR: 15.5% $1.96 $2.46 $3.36 $2.88 2019 2020 2021 Q3 '22 YTD CAGR: 30.9% $146.7 $195.6 $278.7 $234.8 2019 2020 2021 Q3 '22 YTD CAGR: 37.8%

1. As of September 30, 2022. 2. Inception means first full four quarters as a Focus partner firm and reflects activity through all market cycles during that tim e. The analysis includes the 67 firms since inception that have been with us for at least 2 years as of September 30, 2022 in order to determine a baseline revenue growth rate. If Focus partner firms merged together, their financials have be en combined. 3. The weightings are based on the September 30, 2022 LTM revenues of the respective partner firms. 4. Excluded the first full annual revenue from all the mergers made by our partner firm portfolio since joining Focus. 5. The 67 partner firms have been with Focus for a weighted average of ~8 years and a median period of ~6 years. 9.1% 13.7% 12.4% 9.2% 10.4% 15.7% 14.8% 10.2% Firms that have not completed a merger (25 firms) Firms that have completed at least one merger (42 firms) Entire portfolio of 67 partner firms Entire portfolio of 67 partner firms Median Revenue CAGR Weighted Average Revenue CAGR Our Organic Growth is Strong, Including and Excluding Mergers 10 ▪ Partner firms who grow through mergers in addition to traditional client acquisition strategies have transformed their businesses through accelerated growth. ▪ Mergers enable efficient access to large pools of client assets, new spheres of influence, distribution channels and exceptional advisor talent. 67 partner firms (5) represented ~88% of our Q3 2022 LTM revenues (3) (3) (3) (3,4) Revenue CAGR Since Inception (1,2) Including Mergers Excluding Mergers

Our Average Organic Revenue Growth Demonstrates Partner Firm Strength and Resiliency ▪ Over the last 16 quarters, average organic growth has been 15.7% 1. Organic revenue growth represents the period - over - period growth in revenue related to partner firms, including growth related to acquisitions of wealth management practices and customer relationships by Focus's partner firms, including Connectus , and partner firms that have merged, that for the entire periods presented are included in Focus's consolidated statements o f operations for the entire periods presented. Focus believes these growth statistics are useful in that they present full - period revenue growth of partner firms on a ‘‘same s tore’’ basis exclusive of the effect of the partial period results of partner firms that are acquired during the comparable periods. 11 10.7% 7.7% 18.0% 22.4% 25.2% 21.2% (0.3%) 2.4% 7.3% 12.2% 28.8% 28.8% 26.6% 22.0% 15.0% 3.4% -30% -20% -10% 0% 10% 20% 30% Q4'18 Q1'19 Q2'19 Q3'19 Q4'19 Q1'20 Q2'20 Q3'20 Q4'20 Q1'21 Q2'21 Q3'21 Q4'21 Q1'22 Q2'22 Q3'22 Quarterly Organic Revenue Growth (1) Percentage Organic Revenue Growth Quarterly Average: 15.7% Average : 15.7%
Third Quarter 2022 Recap 12

Robust Year - Over - Year Financial Performance Reflects Sustained Momentum 13 Adjusted Net Income (“ANI”) Excluding Tax Adjustments (1) ($ in millions) 1. Non - GAAP financial measure. See Appendix for reconciliations. 2. Refer to footnote 2 on slide 9. Revenues ($ in millions) Adjusted EBITDA (1) ($ in millions) ANI Excluding Tax Adjustments Per Share (1) Tax Adjustments (2) ($ in millions) Tax Adjustments Per Share (1,2) $454.5 $519.9 Q3 '21 Q3 '22 14.4% $113.5 $128.7 Q3 '21 Q3 '22 13.4% $68.5 $70.1 Q3 '21 Q3 '22 2.2% $11.8 $16.7 Q3 '21 Q3 '22 40.8% $0.84 $0.86 Q3 '21 Q3 '22 2.4% $0.14 $0.20 Q3 '21 Q3 '22 42.9%

▪ Adjusted EBITDA: (2) $128.7 million, +13.4% year - over - year growth ▪ Adjusted EBITDA margin: (3) 24.8% ▪ Revenues: $ 519.9 million, +14.4% year - over - year growth ▪ Organic revenue growth rate: (1) +3.4 % year - over - year ▪ GAAP net income: $38.3 million, compared to $1.8 million in Q3 2021 ▪ GAAP basic and diluted net income per share attributable to common shareholders: $0.45 and $0.44 ▪ Adjusted Net Income Excluding Tax Adjustments: (2) $70.1 million, +2.2% year - over - year growth ▪ Tax Adjustments: (4) $16.7 million, +40.8% year - over - year growth ▪ Adjusted Net Income Excluding Tax Adjustments Per Share: (2) $0.86, +2.4% year - over - year growth ▪ Tax Adjustments Per Share: (2,4) $0.2 0 , +42.9% year - over - year growth Adjusted EBITDA Q3 2022 Financial Snapshot Revenues Net Income and Per Share Amounts 1. Organic revenue growth represents the period - over - period growth in revenues related to partner firms, including growth related t o acquisitions of wealth management practices and customer relationships by our partner firms, including Connectus, and partner firms that have merged, that for the entire periods presented, are included in our consolida ted statements of operations for each of the entire periods presented. We believe these growth statistics are useful in that they present full period revenue growth of partner firms on a ‘‘same store’’ basis exclusive of th e effect of the partial period results of partner firms that are acquired during the comparable periods. 2. Non - GAAP financial measure. See Appendix for reconciliations. 3. Calculated as Adjusted EBITDA divided by revenues. 4. Tax Adjustments represent the tax benefits of intangible assets, including goodwill, associated with deductions allowed for t ax amortization of intangible assets in the respective periods based on a pro forma 27% income tax rate. Such amounts were generated from acquisitions completed where the Company received a step - up in basis for tax purposes. Acquired intangible assets may be amortized for tax purposes, generally over a 15 - year period. Due to the Company’s acquisitive nature, tax deductions allowed on acquired intangible assets provide additional significant supplem ent al economic benefit. The tax benefit from amortization is identified to show the full economic benefit of deductions for acquired intangible assets with the step - up in tax basis. 5. Net Leverage Ratio represents the First Lien Leverage Ratio (as defined in the Credit Facility) and means the ratio of amount s o utstanding under the First Lien Term Loan and First Lien Revolver plus other outstanding debt obligations secured by a lien on the assets of Focus LLC (excluding letters of credit other than unpaid drawings thereunder) min us unrestricted cash and cash equivalents to Consolidated EBITDA (as defined in the Credit Facility). 14 Net Leverage & Cash Flow ▪ Net Leverage Ratio: (5) 3.98 x ▪ Net cash provided by operating activities: $ 306.4 million (LTM Q3 2022), - 1.4 % year - over - year ▪ Cash Flow Available for Capital Allocation: (2) $ 345.8 million (LTM Q3 2022), + 15.4 % year - over - year ▪ Unamortized gross tax shield at September 30, 2022 of $2.8+ billion ▪ No Tax Receivable Agreement payments

$499.1m , 96.0% $20.8m , 4.0% Wealth Management Fees Other ▪ Holistic wealth management fees tied to team - based service model ▪ Not a commission or interest revenue based model We Have Multiple Sources of Revenue Diversification $395.5m , 76.1% $124.4m , 23.9% Revenues Correlated to Markets Correlated to Markets Not Correlated to Markets ▪ Advance billing structure used by majority of partner firms gives high visibility into subsequent quarter ▪ Diversification of billing practices across partner firms is an embedded revenue hedge ▪ Non - correlated revenues typically include fixed fees for investment advice, tax fees and family office type services ▪ Diversification reduces market risk to revenue stream ▪ International sources provide growing revenue diversification ▪ 9 partner firms across Australia, Canada, Switzerland and the UK, together with partner firm Connectus, are platforms for growth $486.6m , 93.6% $33.3m , 6.4% Domestic International Q3 2022 Revenues by Source Q3 2022 Revenues by Region Q3 2022 Revenues Correlated to Markets 15 $259.6m , 65.6% $135.9m , 34.4% Billing Structure of Market - Correlated Revenues Advance Arrears

Continuing a Trend of Strong M&A Volume 16 85+ Partner Firms 250+ M&A Transactions Since 2006 5,500+ Partners and Employees Annual M&A Transactions Since 2019 1. Includes a signed and pending close transaction (1) 6 7 14 5 28 18 24 19 34 25 38 24 2019 2020 2021 2022 to date New Partner Firms Mergers

2022 M&A Activity Continues to be Robust 17 2022 YTD Highlights 24 closed or pending transactions to date: ▪ 5 new partner firms ▪ 19 mergers, including 1 Connectus merger Type Acquiring Partner Firm Closing Date Primary Office Location 1. FourThought Private Wealth 11/1/2022 Venice, FL 2. Beaumont Financial Partners Q4* Needham, MA 1. Dental Wealth Buckingham Strategic Wealth 10/1/2022 Bellevue, WA 2. Johnson Hill 10/1/2022 Brentwood, TN 3. Beekman Prime Quadrant 10/1/2022 New York, NY 4. Strategic Capital Advisers Transform Wealth 10/1/2022 Denver, CO 5. Guidry Summit Financial 10/25/2022 Metairie, LA 6. Alpha Insurance Ancora 11/1/2022 Westlake, OH 7. Schur & Sugarman Provident Financial Management 11/1/2022 Los Angeles, CA 1. Octogone Holding 7/1/2022 Geneva, Switzerland 2. Icon Wealth Partners 8/1/2022 Houston, TX 1. Grecu Capital Management Buckingham Strategic Wealth 7/1/2022 Bend, OR 2. Bergman Investment Management Buckingham Strategic Wealth 7/1/2022 San Mateo, CA 3. Samson Wealth Management XML 7/1/2022 Fort Washington, PA 4. Ross Bennet Smith NKSFB 7/1/2022 London, United Kingdom 5. Parsons Edge 8/26/2022 Dallas, TX 6. Skinner Cardinal Point 9/1/2022 Bahamas 7. RT Mosaic Cardinal Point 9/1/2022 Calgary, Canada Partner Firm Acquisitions 1. Azimuth Capital Management 4/1/2022 Bloomfield Hills, MI 1. Mid-Continent Capital Connectus 4/1/2022 Chicago, IL 2. Lumia Wealth Buckingham Strategic Wealth 4/1/2022 Overland Park, KS 3. Holloway Wealth Management ARS Wealth Advisors 5/1/2022 Gainesville, FL 4. Henry & Horne Wealth Management InterOcean Capital 6/1/2022 Scottsdale, AZ Q1 2022 Mergers 1. Harris, Saunders & Leach The Colony Group 2/4/2022 Washington, DC * Signed and pending close Q2 2022 Partner Firm Acquisitions Mergers Mergers Firm Name Q3 2022 Partner Firm Acquisitions Mergers Q4 2022

New Partner Firms Further Diversify Our Partnership (1) 18 » Headquartered in Venice, FL » Enhances Focus’ deep presence in attractive Florida wealth market » Serves HNW, UHNW, and institutional clients across the US » Headquartered in Needham, MA » Scaled regional platform with strong ties to multiple Boston area universities » Serves HNW/UHNW individuals and families, small businesses, and nonprofits Closed November 1, 2022 ~$1.1 Billion in Client Assets Fiduciary Wealth Manager Estimated Late Q4 Close ~$2.7 Billion in Client Assets Fiduciary Wealth Manager 1. We have over 85 partner firms with headquarters located across the United States as well as Australia, Canada, Switzerland an d t he United Kingdom. This data may not be representative of our other partner firms and is not necessarily indicative of these firms’ future performance. 2. Historical and estimated data based on the unaudited pre - acquisition financial statements of the acquired companies prepared by the acquired companies prior to Focus acquisition. Such financial statements may not have been prepared in accordance with GAAP or pursuant to the rules and regulations of the SEC and may not be comparable to the presentation of such data after being acquired by Focus. 3. The terms of our management agreements entitle the management companies to management fees typically consisting of all future EB PC of the acquired wealth management firm in excess of Base Earnings up to Target Earnings, plus a percentage of any EBPC in excess of Target Earnings. Acquired Base Earnings is equal t o o ur collective preferred position in Base Earnings or comparable measures. We are entitled to receive these earnings notwithstanding any earnings that we are entitled to receive in excess of Ta rget Earnings. Base Earnings may change in future periods for various business or contractual matters. FourThought Private Wealth Beaumont Financial Partners Estimated Annual Revenues: > $21 million ( 1)(2) Estimated Annual Acquired Base Earnings: ~ $7.3 million (3) Weighted Average ‘19 - ’21 Revenue CAGR: >20 % (1)(2)

19 Fourth Quarter 2022 Outlook

▪ Estimated Q4 revenues of ~$505 to $515 million (excludes performance fees). ▪ Estimated Q4 YOY organic revenue growth of negative ~10% (1) ▪ The $20 million in performance fees in the prior year has a negative ~4% impact on our Q4’22 organic revenue growth estimate ▪ Estimated Q4 revenue attributable to new partner firm closings: ~$3 million* and over $21 million annualized. *Relates to the closing of FourThought on 11/1/22 and the expected late Q4 closing of Beaumont. Q4 2022 Outlook 1. Organic revenue growth represents the period - over - period growth in revenue related to partner firms, including growth related to acquisitions of wealth management practices and customer relationships by our partner firms, including Connectus, and partner firms that have merged, that for the entire periods presented, are included in our consolida ted statements of operations for each of the entire periods presented. We believe these growth statistics are useful in that they present full period revenue growth of partner firms on a ‘‘same store’’ basis exclusive of th e effect of the partial period results of partner firms that are acquired during the comparable periods. 2. Non - GAAP financial measure. The Company is not providing a quantitative reconciliation of its forward - looking estimate of Adjust ed EBITDA or Adjusted EBITDA margin to its most directly comparable GAAP financial measure because such GAAP measure, which is not included in the Company’s outlook, is difficult to reliably predict or estimate witho ut unreasonable effort due to its dependency on future uncertainties such as the items noted under the heading “Special Note Regarding Forward - Looking Statements.” In addition, we believe such a reconciliation could imply a deg ree of precision that might be confusing or misleading to investors. 3. Calculated as Adjusted EBITDA divided by revenues. 4. The terms of our management agreements entitle the management companies to management fees typically consisting of all future EB PC of the acquired wealth management firm in excess of Base Earnings up to Target Earnings, plus a percentage of any EBPC in excess of Target Earnings. Acquired Base Earnings is equal to our collective prefe rre d position in Base Earnings or comparable measures. We are entitled to receive these earnings notwithstanding any earnings that we are entitled to receive in excess of Target Earnings. Base Earnings may change in future pe riods for various business or contractual matters. 5. See note 4 on page 14 for additional information regarding Tax Adjustments. Based on a pro forma 27.0% tax rate. 6. Net Leverage Ratio represents the First Lien Leverage Ratio (as defined in the Credit Facility), and means the ratio of amoun ts outstanding under the First Lien Term Loan and First Lien Revolver plus other outstanding debt obligations secured by a lien on the assets of Focus LLC (excluding letters of credit other than unpaid drawings thereunder) min us unrestricted cash and cash equivalents to Consolidated EBITDA (as defined in the Credit Facility). 20 Revenues Adjusted EBITDA (2) ▪ Estimated Q4 Adjusted EBITDA (2) margin (3) of ~23%. ▪ Estimated Q4 Adjusted EBITDA (2) attributable to new partner firm closings: ~$1 million*. ▪ Estimated Annualized Acquired Base Earnings (4) : ~$7.3 million*. *Relates to the closing of FourThought on 11/1/22 and the expected late Q4 closing of Beaumont. ▪ As of September 30 , 2022, estimated next twelve months Tax Adjustments (5) of ~$65.7 million. ▪ No Tax Receivable Agreement payments. Tax Adjustments & Other Net Leverage Ratio (6) and Cash Flow ▪ Estimated Net Leverage Ratio (6) ~4.25x. ▪ Estimated cash earnout payments of ~$38 million in Q4. ▪ No need to raise equity capital to support M&A and business expansion.

Credit Profile, Interest Rate Sensitivity & Earnings Preference 21
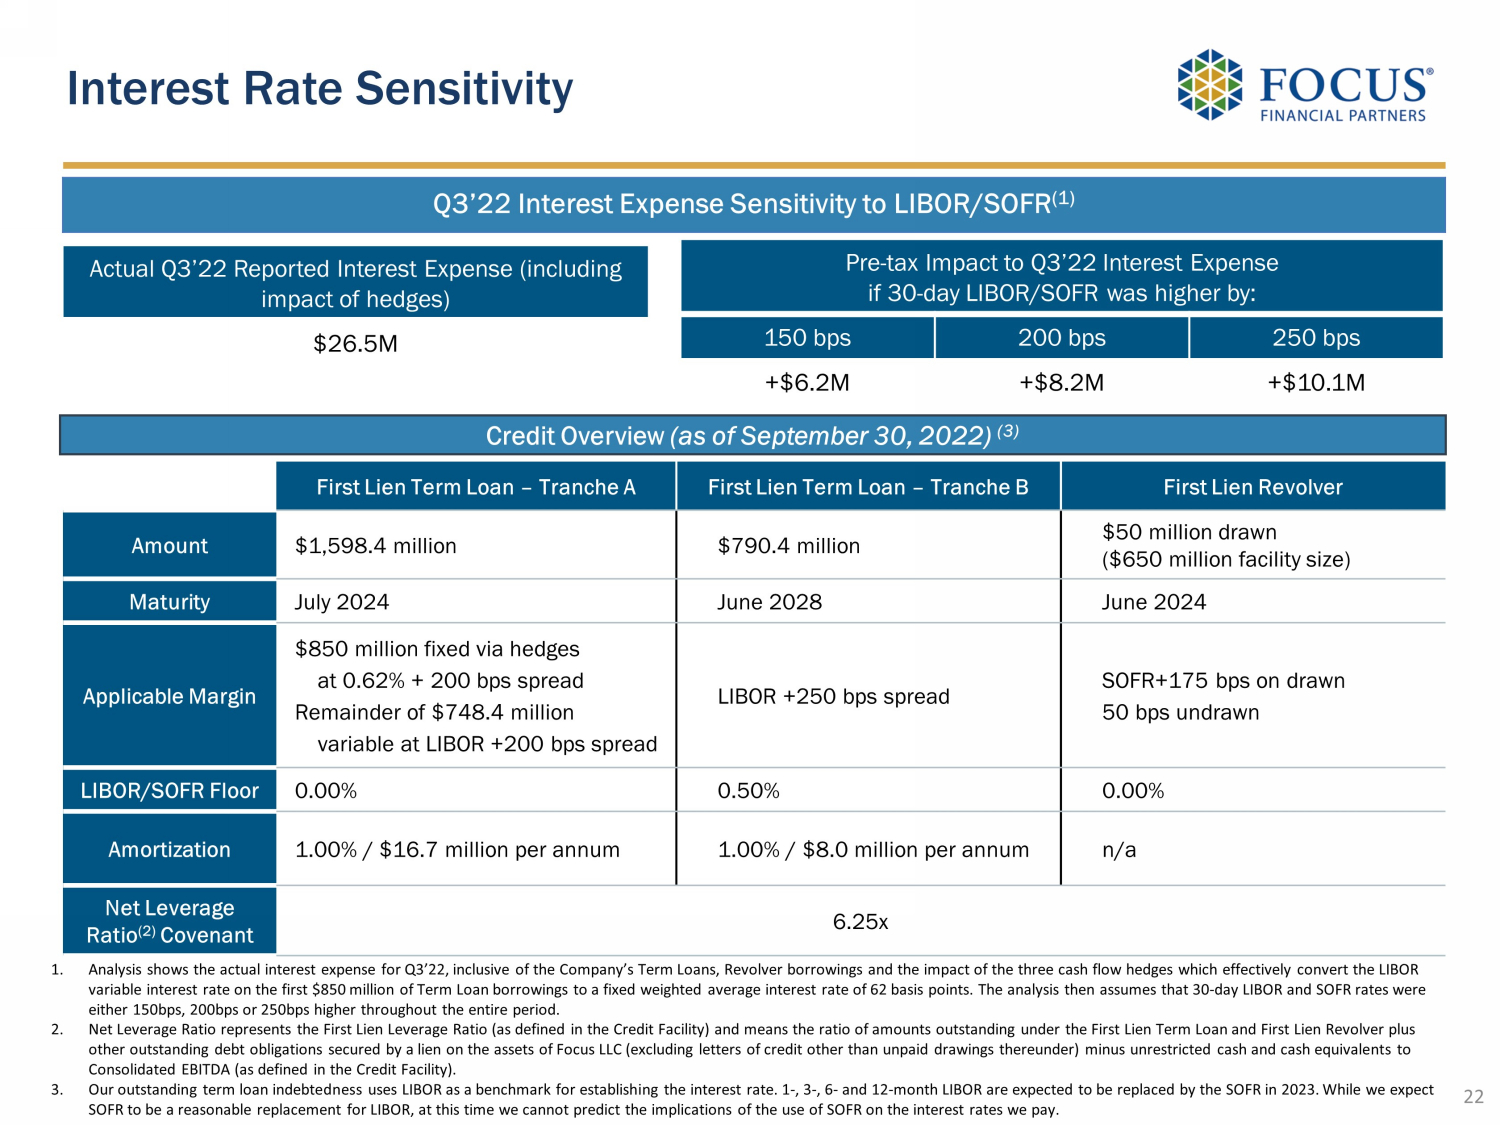
First Lien Term Loan – Tranche A First Lien Term Loan – Tranche B First Lien Revolver Amount $1,598.4 million $790.4 million $50 million drawn ($650 million facility size) Maturity July 2024 June 2028 June 2024 Applicable Margin $850 million fixed via hedges at 0.62% + 200 bps spread Remainder of $748.4 million variable at LIBOR +200 bps spread LIBOR +250 bps spread SOFR+175 bps on drawn 50 bps undrawn LIBOR/SOFR Floor 0.00% 0.50% 0.00% Amortization 1.00% / $16.7 million per annum 1.00% / $8.0 million per annum n/a Net Leverage Ratio (2) Covenant 6.25x Interest Rate Sensitivity 22 Credit Overview (as of September 30, 2022) (3) 1. Analysis shows the actual interest expense for Q3’22, inclusive of the Company’s Term Loans, Revolver borrowings and the impa ct of the three cash flow hedges which effectively convert the LIBOR variable interest rate on the first $850 million of Term Loan borrowings to a fixed weighted average interest rate of 62 basi s p oints. The analysis then assumes that 30 - day LIBOR and SOFR rates were either 150bps, 200bps or 250bps higher throughout the entire period. 2. Net Leverage Ratio represents the First Lien Leverage Ratio (as defined in the Credit Facility) and means the ratio of amount s o utstanding under the First Lien Term Loan and First Lien Revolver plus other outstanding debt obligations secured by a lien on the assets of Focus LLC (excluding letters of credit other than unpai d d rawings thereunder) minus unrestricted cash and cash equivalents to Consolidated EBITDA (as defined in the Credit Facility). 3. Our outstanding term loan indebtedness uses LIBOR as a benchmark for establishing the interest rate. 1 - , 3 - , 6 - and 12 - month LIB OR are expected to be replaced by the SOFR in 2023. While we expect SOFR to be a reasonable replacement for LIBOR, at this time we cannot predict the implications of the use of SOFR on the inte res t rates we pay. Q3’22 Interest Expense Sensitivity to LIBOR/SOFR (1) Pre - tax Impact to Q3’22 Interest Expense if 30 - day LIBOR/SOFR was higher by: 150 bps 200 bps 250 bps +$6.2M +$8.2M +$10.1M Actual Q3’22 Reported Interest Expense (including impact of hedges) $26.5M

Strong Credit and Liquidity Profile Debt cost ~4.4% weighted average interest rate on funded borrowings Duration risk ~1.8 years remaining to maturity for Tranche A Term Loan (July 2024) ~5.7 years remaining to maturity for Tranche B Term Loan (June 2028) ~1.8 years remaining to maturity for Revolver (June 2024) 95%+ fee - based and recurring revenues, variable management fees and earnings preference protect cash flows Downside protection 23 Liquidity ~$ 129 m illion cash ~$ 590 million available revolver capacity ~$ 346 million LTM Cash Flow Available for Capital Allocation (1) As of September 30, 2022: 1. Non - GAAP financial measure. See Appendix for reconciliations.

Equity market decline (20)% (40)% Assumed Client Portfolio Allocation to Equities 50% 50% Decline in market-correlated revenues (1) (10)% (20)% ($ in millions) Reported Q3'22 Market-Correlated Revenues 395.5$ 356.0$ 316.4$ Q3'22 Non-Correlated Revenues 124.4$ 124.4$ 124.4$ Total Revenue - Q3'22 519.9$ 480.4$ 440.8$ Covenant EBITDA (2) - LTM 579.9$ 559.4$ 539.2$ Net Debt (3) 2,310.3$ 2,310.3$ 2,310.3$ Net Leverage Ratio (2) 3.98x 4.13x 4.28x Change from Q3 Reported 0.15x 0.30x Sensitivity Analysis (Illustrative Only) Earnings Preference Provides Strong Downside Earnings Protection 1. The analysis depicts the impact on our Net Leverage Ratio (as defined in the Credit Facility) resulting from a hypothetical c han ge in Q3 market correlated revenues only. All other revenues/expenses were kept constant except management fees, which are tied to the profitability of our partner firms. 2. Net leverage ratio represents the First Lien Leverage Ratio (as defined in the Credit Facility), and means the ratio of amoun ts outstanding under the First Lien Term Loan and First Lien Revolver plus other outstanding debt obligations secured by a lien on the assets of Focus LLC (excluding letters of credit other than unpai d d rawings thereunder) minus unrestricted cash and cash equivalents to Consolidated EBITDA (as defined in the Credit Facility), which in the above table is referred to as “Covenant EBITDA.” 3. Net Debt represents amounts outstanding under the First Lien Term Loan and First Lien Revolver plus other outstanding debt ob lig ations secured by a lien on the assets of Focus LLC (excluding letters of credit other than unpaid drawings thereunder) minus unrestricted cash and cash equivalents. 4. The terms of our management agreements entitle the management companies to management fees typically consisting of all future EB PC of the acquired wealth management firm in excess of Base Earnings up to Target Earnings, plus a percentage of any EBPC in excess of Target Earnings. Acquired Base Earnings is equal t o o ur collective preferred position in Base Earnings or comparable measures. We are entitled to receive these earnings notwithstanding any earnings that we are entitled to receive in excess of Ta rget Earnings. Base Earnings may change in future periods for various business or contractual matters. ▪ Reflects one - quarter impact to revenues and Covenant EBITDA (1)(2) ▪ Assumes all other revenue sources and expenses remain unchanged except for management fees ▪ In the event of a multi - quarter downturn ▪ Partner firms would further reduce their cost structure ▪ M&A activity would moderate ▪ Cash flow would be available for debt r epayment ▪ Significant head room on covenant ▪ Q3 Covenant EBITDA - LTM (2) would need to drop to $369.6 million, or decline by 36 %, to reach 6.25x net leverage ratio covenant 24
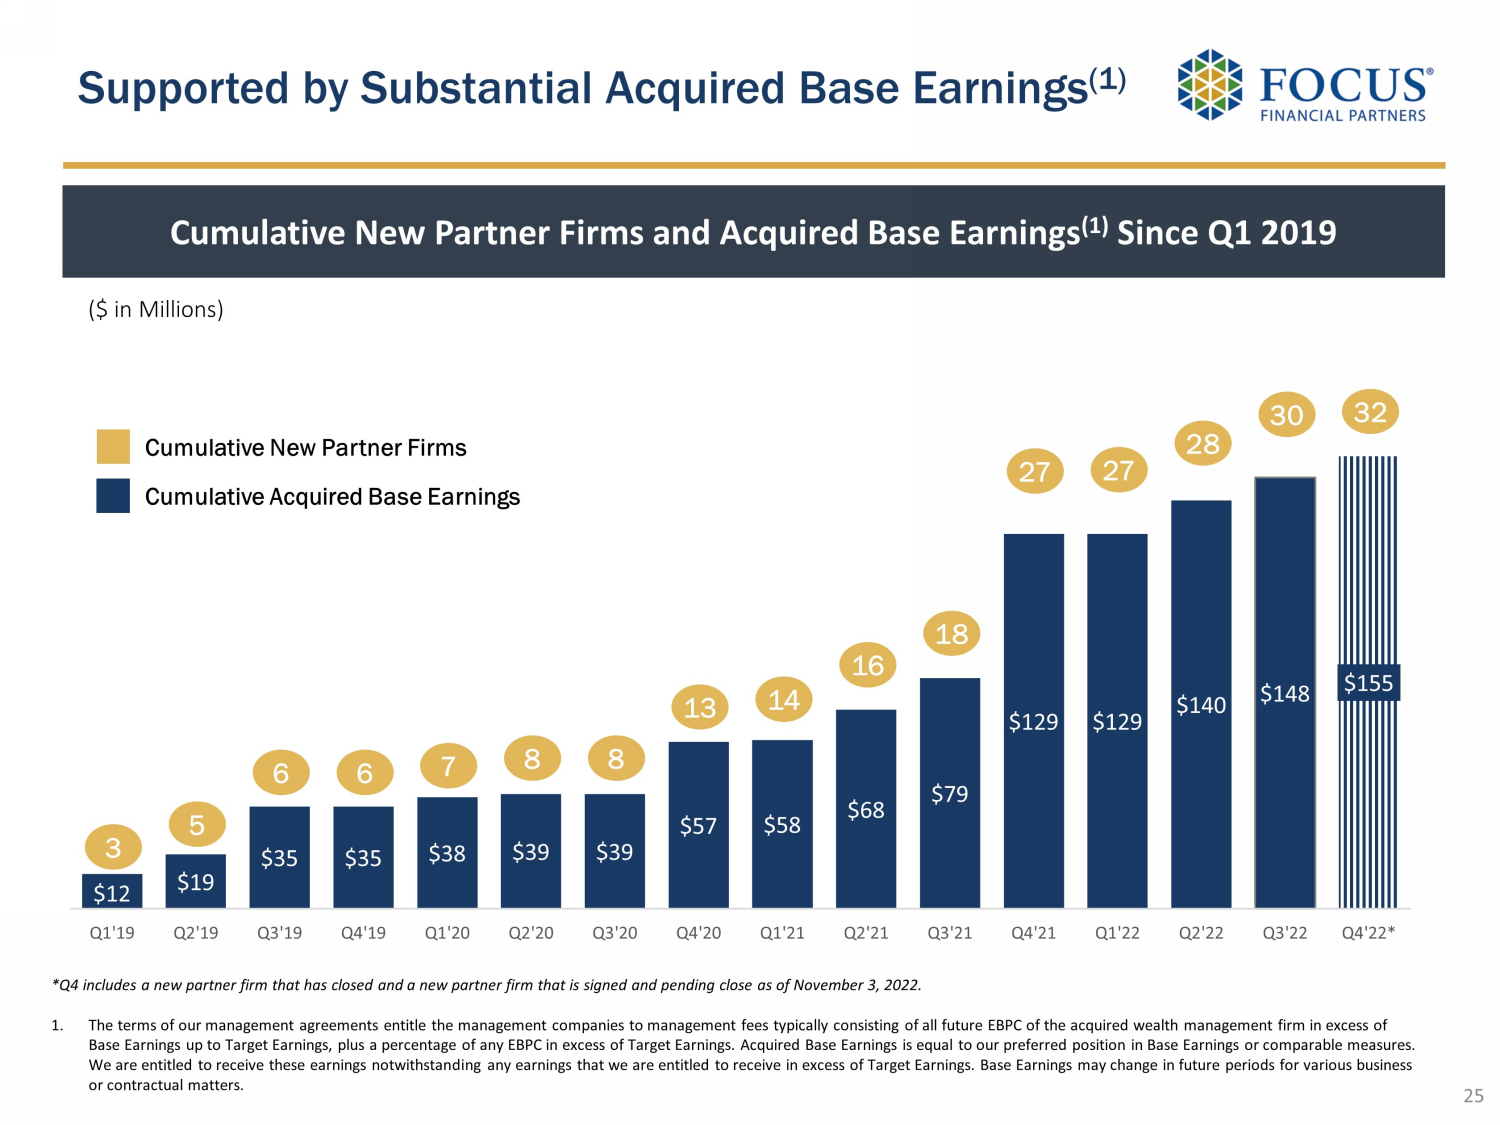
Supported by Substantial Acquired Base Earnings (1) 25 *Q4 includes a new partner firm that has closed and a new partner firm that is signed and pending close as of November 3, 202 2. 1. The terms of our management agreements entitle the management companies to management fees typically consisting of all future EB PC of the acquired wealth management firm in excess of Base Earnings up to Target Earnings, plus a percentage of any EBPC in excess of Target Earnings. Acquired Base Earnings is eq ual to our preferred position in Base Earnings or comparable measures. We are entitled to receive these earnings notwithstanding any earnings that we are entitled to receive in excess of Target Ea rni ngs. Base Earnings may change in future periods for various business or contractual matters. 3 5 6 6 7 8 8 13 14 16 18 27 ($ in Millions) Cumulative New Partner Firms Cumulative Acquired Base Earnings Cumulative New Partner Firms and Acquired Base Earnings (1) Since Q1 2019 27 28 30 $12 $19 $35 $35 $38 $39 $39 $57 $58 $68 $79 $129 $129 $140 $148 $155 Q1'19 Q2'19 Q3'19 Q4'19 Q1'20 Q2'20 Q3'20 Q4'20 Q1'21 Q2'21 Q3'21 Q4'21 Q1'22 Q2'22 Q3'22 Q4'22* 32

Illustrative Structural Protections in Our Financial Model 26 Earnings Preference Provides Downside Protection For Firms Above Target Earnings, Split Mitigates Downside Financial Impact to Focus 1. The terms of our management agreements entitle the management companies to management fees typically consisting of all Earnin gs Before Partner Compensation (“EBPC”) in excess of Base Earnings up to Target Earnings, plus a percentage of any EBPC in excess of Target Earnings. Acquired Base Earnings is equal t o o ur preferred position in Base Earnings or comparable measures. We are entitled to receive these earnings notwithstanding any earnings that we are entitled to receive in excess of Target Earni ngs . Base Earnings may change in future periods for various business or contractual matters. Management fees growth represents the period - over - period growth in GAAP management fees earned by managemen t companies. While an expense, we believe that growth in management fees reflect the strength of the partnership. Base Case +10% Revenues -10% Revenues Revenues $5,000 $5,500 $4,500 Operating Expenses (excl. management fees) -$2,000 -$2,000 -$2,000 Earnings Before Partner Compensation ("EBPC") (1) $3,000 $3,500 $2,500 Split 50% 50% 50% To Focus $1,500 $1,750 $1,500 To Management Company (as Management Fee) (1) $1,500 $1,750 $1,000 Management Fee as % of Revenue 30% 32% 22% At Time of Deal Focus Acquired Base Earnings (1) Base Case +10% Revenues -10% Revenues Revenues $10,000 $11,000 $9,000 Operating Expenses (excl. management fees) -$3,500 -$3,500 -$3,500 Earnings Before Partner Compensation ("EBPC") $6,500 $7,500 $5,500 Original Target EBPC at Time of Deal $3,000 $3,000 $3,000 Current EBPC Above Target $3,500 $4,500 $2,500 To Focus Preference On Original EBPC at Time of Deal (50%) $1,500 $1,500 $1,500 Split on Excess Above Target (50%) $1,750 $2,250 $1,250 $3,250 $3,750 $2,750 To Management Company (as Management Fee) (1) Original EBPC at Time of Deal (50%) $1,500 $1,500 $1,500 Split on Excess Above Target (50%) $1,750 $2,250 $1,250 $3,250 $3,750 $2,750 Management Fee as % of Revenue 33% 34% 31% Firm Has Grown Above Target Earnings

Cash Flows 27

Q4 2022 Supplemental Cash Flow Disclosures Strong and Sustained Growth in Cash Flows Continued in Q3 As % of Adjusted EBITDA (1) 73 % 65% Cash Flow Snapshot ▪ Q4 2022 estimated cash earnouts of ~$38 million ▪ No Tax Receivable Agreements (“TRA”) payments in Q4 2022 ▪ Q4 2022 required term loan amortization of ~$6.2 million ▪ Based on the terms of the Credit Facility, no excess cash flow payments required in 2022 ($ in millions) 1. Non - GAAP financial measure. See Appendix for reconciliations. 2. Net cash provided by operating activities for the three months ended March 31, 2021 and 2022, respectively, include cash outf low s related to due to affiliates (i.e. management fees). A portion of management fees were paid in Q1 post the issuance of the respective annual audit included in our Form 10 - K. 28 - 1.4% (1) + 15.4 % Cash Flow Trend ($ in millions) (2) (2) $310.7 $299.7 $306.4 $345.8 Net cash provided by operating activities Cash Flow Available for Capital Allocation Q3 '21 LTM Q3 '22 LTM $211.4 $242.1 $298.9 $310.7 $313.9 $275.1 $291.3 $306.4 $200.5 $219.9 $266.0 $299.7 $319.9 $299.6 $323.2 $345.8 Dec-20 Mar-21 Jun-21 Sep-21 Dec-21 Mar-22 Jun-22 Sep-22 LTM Cash Flows From Operating Activities LTM Cash Flow Available For Capital Allocation (1)

Over $2.8 Billion Tax Shield Created by Tax Efficient Transaction Structure 29 $61 $242 $241 $2,309 $17 $65 $65 $624 Q4 2022 2023 2024 2025 & Thereafter Unamortized Gross Tax Shield Estimated Tax Benefit Focus generally acquires intangible assets which generate tax shields (1) ($ in millions) 1. Focus partner firms typically have limited tangible assets on acquisition date. Focus typically purchases customer lists, man age ment contracts and goodwill. Consideration is typically paid in cash. Each incremental M&A transaction creates an additional tax shield which generates substantial value for shareholders and enhances our cash flows. Each tax shield is amortized over 15 years (as required under Internal Revenue Code Section 197). 2. As of September 30, 2022. 3. Based on 27% pro forma tax rate. 4. Based on assumed 8% discount rate. 5. Based on Q3 2022 Adjusted Shares Outstanding. See Appendix for reconciliation of number of shares. $2.8+ billion cumulative unamortized gross tax shield (1,2) ~$771 million economic benefit (3) ~$6.11 per share (4,5) ~$498 million net present value (4) Incremental acquisitions & earnout payments will drive new tax shields in the future. Any increase in corporate tax rates will also increase tax benefits.
Appendix 30

Net Income (Loss) to Adjusted EBITDA Reconciliation 1. Represents one - time expenses primarily related to an acquisition. Refer to our 10 - Q and 10 - K filings for additional details. 2. Relates to offering expenses associated with the March 2021 and June 2021 secondary offerings. 31 ($ in thousands) 2019 2020 2021 Sept. 30, 2021 Sept. 30, 2022 Sept. 30, 2021 Sept. 30, 2022 Net income (loss) (12,025)$ 48,965$ 24,440$ 1,849$ 38,289$ 9,505$ 126,689$ Interest income (1,164) (453) (422) (206) (126) (310) (146) Interest expense 58,291 41,658 55,001 16,543 26,491 37,893 63,999 Income tax expense 7,049 20,660 20,082 2,678 12,120 6,038 59,965 Amortization of debt financing costs 3,452 2,909 3,958 1,102 949 2,856 2,999 Intangible amortization 130,718 147,783 187,848 46,055 67,331 133,041 192,256 Depreciation and other amortization 10,675 12,451 14,625 3,622 4,016 10,835 11,454 Non-cash equity compensation expense 18,329 22,285 31,602 5,938 7,980 24,569 22,190 Non-cash changes in fair value of estimated contingent consideration 38,797 19,197 112,416 36,243 (30,708) 96,241 (82,450) Loss on extinguishment of borrowings — 6,094 — — — — — Other (income) expense, net 1,049 214 337 (312) 2,347 219 3,834 Impairment of equity method investment 11,749 — — — — — — Management contract buyout 1,428 — — — — — — Other one-time transaction expenses (1) 1,486 — — — — — — Secondary offering expenses (2) — — 1,409 — — 1,409 — Adjusted EBITDA 269,834$ 321,763$ 451,296$ 113,512$ 128,689$ 322,296$ 400,790$ Three months ended Nine months ended
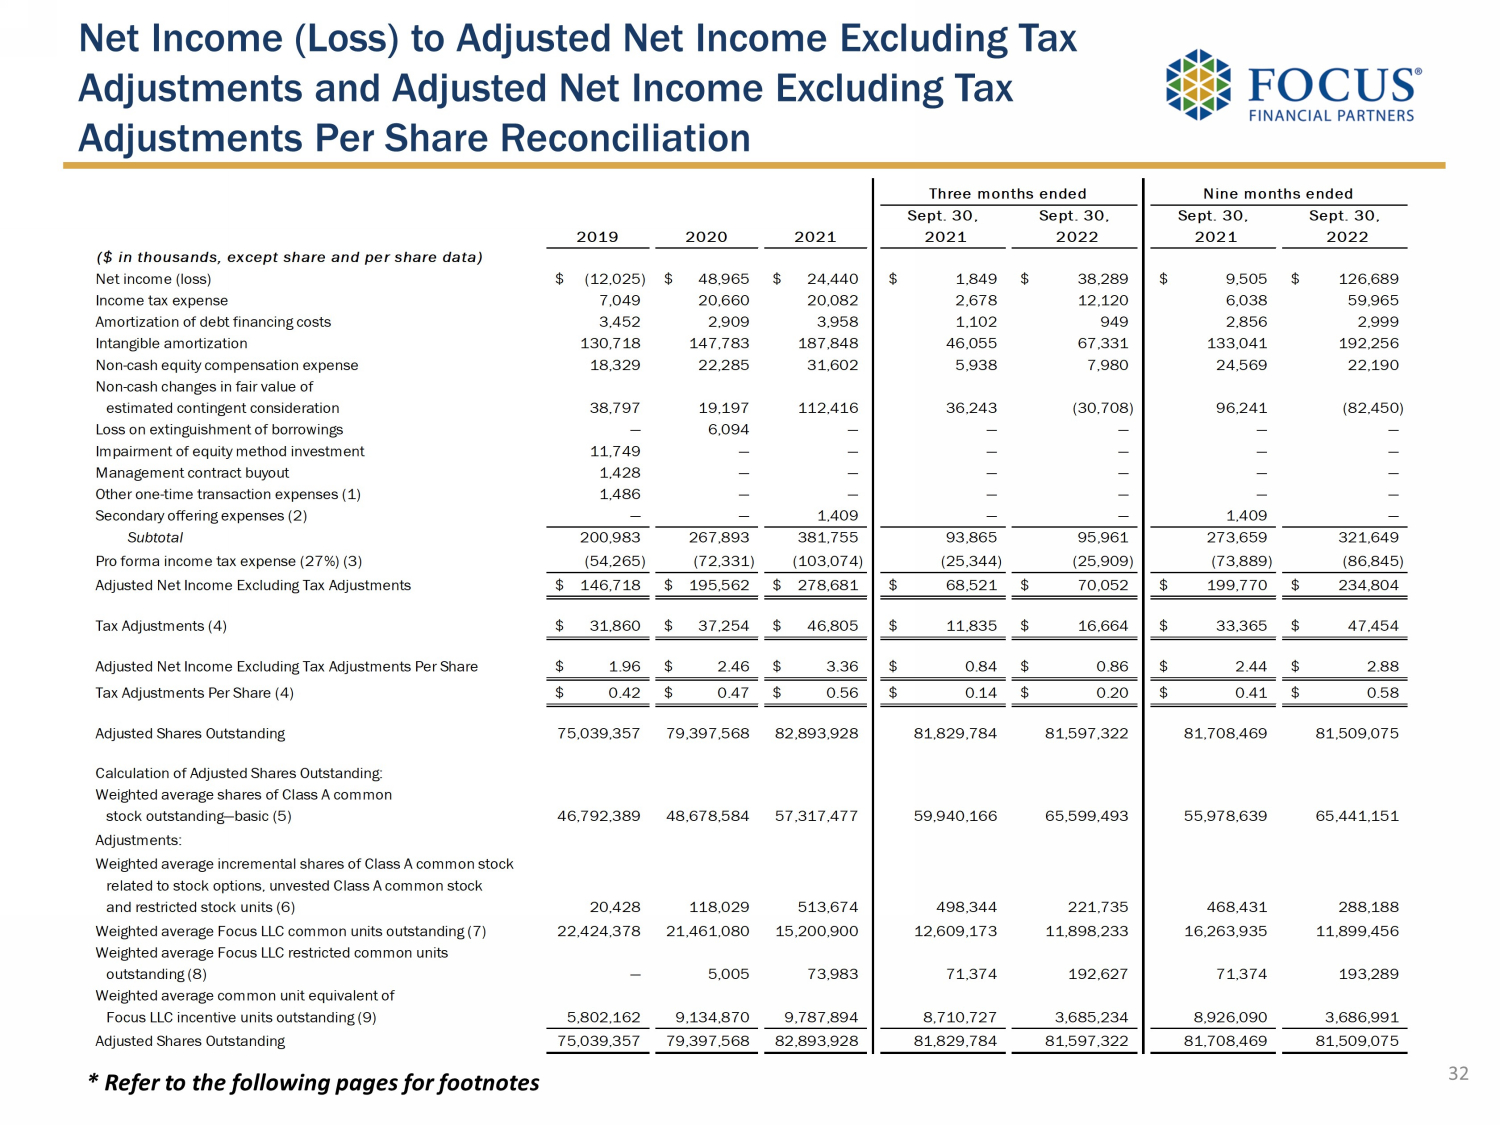
Net Income (Loss) to Adjusted Net Income Excluding Tax Adjustments and Adjusted Net Income Excluding Tax Adjustments Per Share Reconciliation * Refer to the following pages for footnotes 32 2019 2020 2021 Sept. 30, 2021 Sept. 30, 2022 Sept. 30, 2021 Sept. 30, 2022 ($ in thousands, except share and per share data) Net income (loss) (12,025)$ 48,965$ 24,440$ 1,849$ 38,289$ 9,505$ 126,689$ Income tax expense 7,049 20,660 20,082 2,678 12,120 6,038 59,965 Amortization of debt financing costs 3,452 2,909 3,958 1,102 949 2,856 2,999 Intangible amortization 130,718 147,783 187,848 46,055 67,331 133,041 192,256 Non-cash equity compensation expense 18,329 22,285 31,602 5,938 7,980 24,569 22,190 Non-cash changes in fair value of estimated contingent consideration 38,797 19,197 112,416 36,243 (30,708) 96,241 (82,450) Loss on extinguishment of borrowings — 6,094 — — — — — Impairment of equity method investment 11,749 — — — — — — Management contract buyout 1,428 — — — — — — Other one-time transaction expenses (1) 1,486 — — — — — — Secondary offering expenses (2) — — 1,409 — — 1,409 — Subtotal 200,983 267,893 381,755 93,865 95,961 273,659 321,649 Pro forma income tax expense (27%) (3) (54,265) (72,331) (103,074) (25,344) (25,909) (73,889) (86,845) Adjusted Net Income Excluding Tax Adjustments 146,718$ 195,562$ 278,681$ 68,521$ 70,052$ 199,770$ 234,804$ Tax Adjustments (4) 31,860$ 37,254$ 46,805$ 11,835$ 16,664$ 33,365$ 47,454$ Adjusted Net Income Excluding Tax Adjustments Per Share 1.96$ 2.46$ 3.36$ 0.84$ 0.86$ 2.44$ 2.88$ Tax Adjustments Per Share (4) 0.42$ 0.47$ 0.56$ 0.14$ 0.20$ 0.41$ 0.58$ Adjusted Shares Outstanding 75,039,357 79,397,568 82,893,928 81,829,784 81,597,322 81,708,469 81,509,075 Calculation of Adjusted Shares Outstanding: Weighted average shares of Class A common stock outstanding—basic (5) 46,792,389 48,678,584 57,317,477 59,940,166 65,599,493 55,978,639 65,441,151 Adjustments: Weighted average incremental shares of Class A common stock related to stock options, unvested Class A common stock and restricted stock units (6) 20,428 118,029 513,674 498,344 221,735 468,431 288,188 Weighted average Focus LLC common units outstanding (7) 22,424,378 21,461,080 15,200,900 12,609,173 11,898,233 16,263,935 11,899,456 Weighted average Focus LLC restricted common units outstanding (8) — 5,005 73,983 71,374 192,627 71,374 193,289 Weighted average common unit equivalent of Focus LLC incentive units outstanding (9) 5,802,162 9,134,870 9,787,894 8,710,727 3,685,234 8,926,090 3,686,991 Adjusted Shares Outstanding 75,039,357 79,397,568 82,893,928 81,829,784 81,597,322 81,708,469 81,509,075 Three months ended Nine months ended

* These footnotes refer to the tables on the previous page. 1. Represents one - time expenses primarily related to an acquisition. Refer to our 10 - Q and 10 - K filings for additional details. 2. Relates to offering expenses associated with the March 2021 and June 2021 secondary offerings. 3. The pro forma income tax rate of 27% reflects the estimated U.S. federal, state, local and foreign income tax rates applicabl e t o corporations in the jurisdictions we conduct business. 4. Tax Adjustments represent the tax benefits of intangible assets, including goodwill, associated with deductions allowed for t ax amortization of intangible assets in the respective periods based on a pro forma 27% income tax rate. Such amounts were generated from acquisitions comp let ed where we received a step - up in basis for tax purposes. Acquired intangible assets may be amortized for tax purposes, generally over a 15 - year period. Due to our acquisitive nature, tax deductions allowed on acquired intangible assets provide additional significant supplemental economic be nefit. The tax benefit from amortization is included to show the full economic benefit of deductions for acquired intangible assets with the step - up in tax basis. As of September 30, 2022, estimated Tax Adjustments from intangible asset related income tax benefits from closed acquisitions base d o n a pro forma 27% income tax rate for the next 12 months is $65.7 million. 5. Represents our GAAP weighted average Class A common stock outstanding – basic. 6. Represents the incremental shares related to stock options, unvested Class A common stock and restricted stock units as calcu lat ed under the treasury stock method. 7. Assumes that 100% of the Focus LLC common units, including contingently issuable Focus LLC common units, if any, were exchang ed for Class A common stock. 8. Assumes that 100% of the Focus LLC restricted common units were exchanged for Class A common stock. 9. Assumes that 100% of the vested and unvested Focus LLC incentive units were converted into Focus LLC common units based on th e c losing price of our Class A common stock at the end of the respective period and such Focus LLC common units were exchanged for Class A common st ock . 33 Net Income (Loss) to Adjusted Net Income Excluding Tax Adjustments and Adjusted Net Income Excluding Tax Adjustments Per Share Reconciliation

Reconciliation of Cash Flow Available for Capital Allocation 34 1. A portion of contingent consideration paid is classified as operating cash outflows in accordance with GAAP (with the balance re flected in investing or financing cash outflows) and therefore is a reconciling item to arrive at Cash Flow Available for Capital Allocation. 2. A portion of deferred acquisition consideration paid is classified as operating cash outflows in accordance with GAAP ( with the balance reflected in financing cash outflows) and therefore is a reconciling item to arrive at Cash Flow Available for Capital Allocation . 3. Cash Flow Available for Capital Allocation excludes all contingent consideration and deferred acquisition consideration that was included in either operating, investing or financing activities of our consolidated statements of cash flows. 4. Net cash provided by operating activities for the three months ended March 31, 2020, 2021 and 2022, respectively, include cas h o utflows related to due to affiliates (i.e. management fees). A portion of management fees were paid in Q1 post the issuance of the respective annual audit included in our Form 10 - K. ($ in thousands) March 31, 2020 (3) June 30, 2020 Sept. 30, 2020 Dec. 31, 2020 Mar. 31, 2021 (4) June 30, 2021 Net cash provided by operating activities 3,382$ 60,996$ 74,089$ 72,894$ 34,128$ 117,832$ Purchase of fixed assets (3,188) (2,759) (6,744) (6,658) (2,835) (1,483) Distributions for unitholders (4,567) (3,076) (8,122) (6,692) (9,055) (10,053) Payments under tax receivable agreements — — — — (4,112) (311) Adjusted Free Cash Flow (4,373)$ 55,161$ 59,223$ 59,544$ 18,126$ 105,985$ Portion of contingent consideration paid included in operating activities (1) 8,344 16,369 3,806 2,394 5,276 11,605 Portion of deferred acquisition consideration paid included in operating activities (2) — — — — — — Cash Flow Available for Capital Allocation (3) 3,971$ 71,530$ 63,029$ 61,938$ 23,402$ 117,590$ Three months ended ($ in thousands) Sept. 30, 2021 Dec. 31, 2021 Mar. 31, 2022 (4) June 30, 2022 Sept 30, 2022 Sept. 30, 2021 Sept. 30, 2022 Net cash provided by operating activities 85,888$ 76,070$ (4,642)$ 133,934$ 101,024$ 310,742$ 306,386$ Purchase of fixed assets (2,242) (4,458) (3,232) (3,197) (6,723) (13,218) (17,610) Distributions for unitholders (7,283) (5,920) (8,209) (7,747) (4,563) (33,083) (26,439) Payments under tax receivable agreements — — (3,856) — — (4,423) (3,856) Adjusted Free Cash Flow 76,363$ 65,692$ (19,939)$ 122,990$ 89,738$ 260,018$ 258,481$ Portion of contingent consideration paid included in operating activities (1) 20,415 16,439 23,049 18,202 29,571 39,690 87,261 Portion of deferred acquisition consideration paid included in operating activities (2) — — — — 16 — 16 Cash Flow Available for Capital Allocation (3) 96,778$ 82,131$ 3,110$ 141,192$ 119,325$ 299,708$ 345,758$ Trailing 4-Quarters endedThree months ended