Exhibit 99.(c)(9)
| Jefferies LLC Member SIPC The information provided in this document, including valuation discussions, represents the views of Jefferies Investment Banking. There is no assurance that the views expressed herein will be consistent with the views expressed by Jefferies Research or its Analysts. Nothing in this document should be understood as a promise or offer of favorable research coverage. Project Ferdinand Fairness Opinion February 2023 / Confidential Preliminary draft for discussion purposes only |
| Jefferies LLC / February 2023 / Preliminary draft for discussion purposes only Table of Contents Transaction Overview 3 Review of Management Provided Financial Forecast 7 Valuation Analysis 11 Appendix 21 2 |
| Jefferies LLC / February 2023 / Preliminary draft for discussion purposes only Transaction Overview 3 |

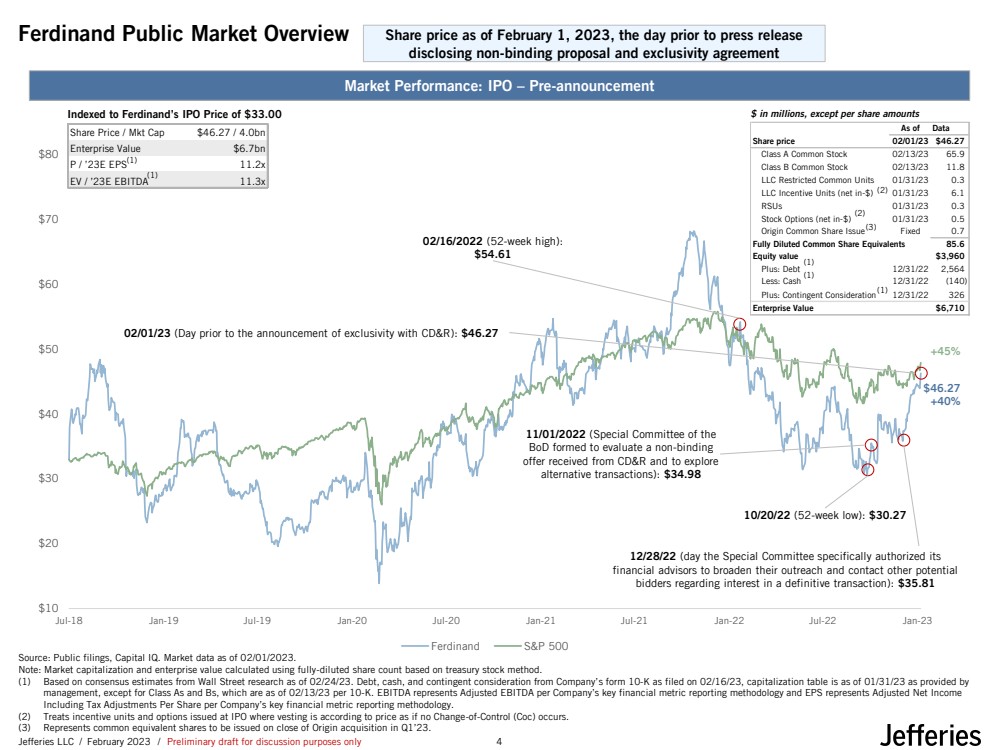
| Jefferies LLC / February 2023 / Preliminary draft for discussion purposes only Share Price / Mkt Cap $46.27 / 4.0bn Enterprise Value $6.7bn P / ’23E EPS 11.2x EV / ’23E EBITDA 11.3x $10 $20 $30 $40 $50 $60 $70 $80 Jul-18 Jan-19 Jul-19 Jan-20 Jul-20 Jan-21 Jul-21 Jan-22 Jul-22 Jan-23 Ferdinand S&P 500 $46.27 +40% Ferdinand Public Market Overview Market Performance: IPO – Pre-announcement +45% Source: Public filings, Capital IQ. Market data as of 02/01/2023. Note: Market capitalization and enterprise value calculated using fully-diluted share count based on treasury stock method. (1) Based on consensus estimates from Wall Street research as of 02/24/23. Debt, cash, and contingent consideration from Company’s form 10-K as filed on 02/16/23, capitalization table is as of 01/31/23 as provided by management, except for Class As and Bs, which are as of 02/13/23 per 10-K. EBITDA represents Adjusted EBITDA per Company’s key financial metric reporting methodology and EPS represents Adjusted Net Income Including Tax Adjustments Per Share per Company’s key financial metric reporting methodology. (2) Treats incentive units and options issued at IPO where vesting is according to price as if no Change-of-Control (Coc) occurs. (3) Represents common equivalent shares to be issued on close of Origin acquisition in Q1’23. Indexed to Ferdinand’s IPO Price of $33.00 (2) (1) (1) (3) (1) (1) 02/16/2022 (52-week high): $54.61 10/20/22 (52-week low): $30.27 $ in millions, except per share amounts Share price as of February 1, 2023, the day prior to press release disclosing non-binding proposal and exclusivity agreement 12/28/22 (day the Special Committee specifically authorized its financial advisors to broaden their outreach and contact other potential bidders regarding interest in a definitive transaction): $35.81 11/01/2022 (Special Committee of the BoD formed to evaluate a non-binding offer received from CD&R and to explore alternative transactions): $34.98 02/01/23 (Day prior to the announcement of exclusivity with CD&R): $46.27 (2) (1) As of Data Share price 02/01/23 $46.27 Class A Common Stock 02/13/23 65.9 Class B Common Stock 02/13/23 11.8 LLC Restricted Common Units 01/31/23 0.3 LLC Incentive Units (net in-$) 01/31/23 6.1 RSUs 01/31/23 0.3 Stock Options (net in-$) 01/31/23 0.5 Origin Common Share Issue Fixed 0.7 Fully Diluted Common Share Equivalents 85.6 Equity value $3,960 Plus: Debt 12/31/22 2,564 Less: Cash 12/31/22 (140) Plus: Contingent Consideration 12/31/22 326 Enterprise Value $6,710 4 |
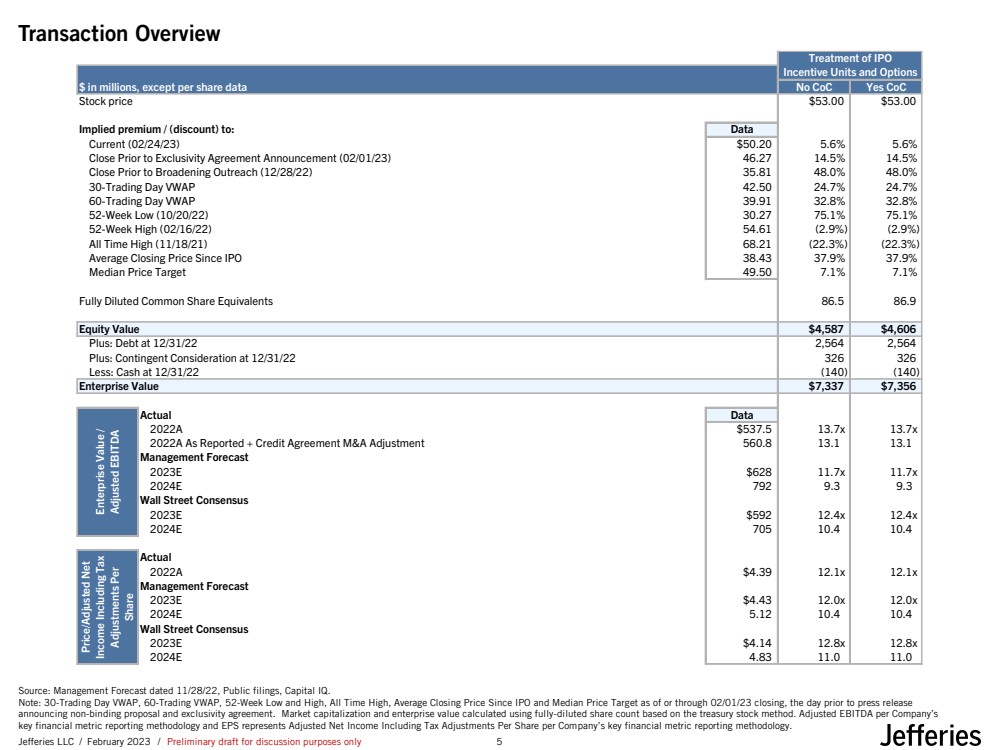
| Jefferies LLC / February 2023 / Preliminary draft for discussion purposes only Transaction Overview Source: Management Forecast dated 11/28/22, Public filings, Capital IQ. Note: 30-Trading Day VWAP, 60-Trading VWAP, 52-Week Low and High, All Time High, Average Closing Price Since IPO and Median Price Target as of or through 02/01/23 closing, the day prior to press release announcing non-binding proposal and exclusivity agreement. Market capitalization and enterprise value calculated using fully-diluted share count based on the treasury stock method. Adjusted EBITDA per Company’s key financial metric reporting methodology and EPS represents Adjusted Net Income Including Tax Adjustments Per Share per Company’s key financial metric reporting methodology. Treatment of IPO Incentive Units and Options $ in millions, except per share data No CoC Yes CoC Stock price $53.00 $53.00 Implied premium / (discount) to: Data Current (02/24/23) $50.20 5.6% 5.6% Close Prior to Exclusivity Agreement Announcement (02/01/23) 46.27 14.5% 14.5% Close Prior to Broadening Outreach (12/28/22) 35.81 48.0% 48.0% 30-Trading Day VWAP 42.50 24.7% 24.7% 60-Trading Day VWAP 39.91 32.8% 32.8% 52-Week Low (10/20/22) 30.27 75.1% 75.1% 52-Week High (02/16/22) 54.61 (2.9%) (2.9%) All Time High (11/18/21) 68.21 (22.3%) (22.3%) Average Closing Price Since IPO 38.43 37.9% 37.9% Median Price Target 49.50 7.1% 7.1% Fully Diluted Common Share Equivalents 86.5 86.9 Equity Value $4,587 $4,606 Plus: Debt at 12/31/22 2,564 2,564 Plus: Contingent Consideration at 12/31/22 326 326 Less: Cash at 12/31/22 (140) (140) Enterprise Value $7,337 $7,356 Actual Data 2022A $537.5 13.7x 13.7x 2022A As Reported + Credit Agreement M&A Adjustment 560.8 13.1 13.1 Management Forecast 2023E $628 11.7x 11.7x 2024E 792 9.3 9.3 Wall Street Consensus 2023E $592 12.4x 12.4x 2024E 705 10.4 10.4 Actual 2022A $4.39 12.1x 12.1x Management Forecast 2023E $4.43 12.0x 12.0x 2024E 5.12 10.4 10.4 Wall Street Consensus 2023E $4.14 12.8x 12.8x 2024E 4.83 11.0 11.0 Enterprise Value / Adjusted EBITDA Price/Adjusted Net Income Including Tax Adjustments Per Share 5 |
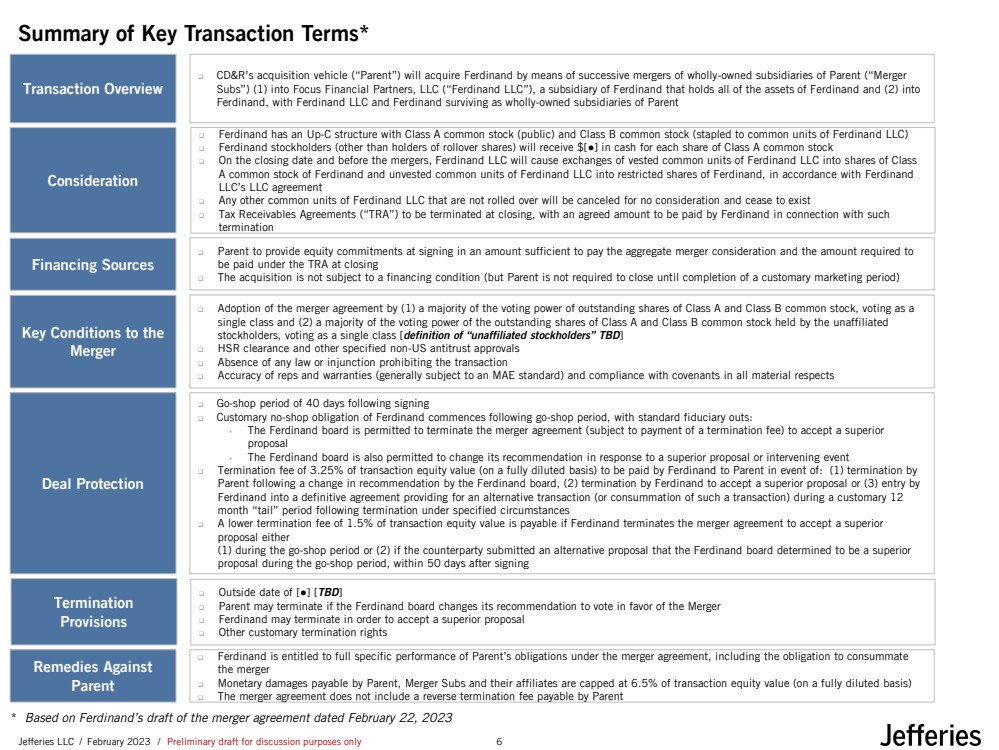
| Jefferies LLC / February 2023 / Preliminary draft for discussion purposes only Summary of Key Transaction Terms* ❑ CD&R’s acquisition vehicle (“Parent”) will acquire Ferdinand by means of successive mergers of wholly-owned subsidiaries of Parent (“Merger Subs”) (1) into Focus Financial Partners, LLC (“Ferdinand LLC”), a subsidiary of Ferdinand that holds all of the assets of Ferdinand and (2) into Ferdinand, with Ferdinand LLC and Ferdinand surviving as wholly-owned subsidiaries of Parent Transaction Overview ❑ Ferdinand has an Up-C structure with Class A common stock (public) and Class B common stock (stapled to common units of Ferdinand LLC) ❑ Ferdinand stockholders (other than holders of rollover shares) will receive $[●] in cash for each share of Class A common stock ❑ On the closing date and before the mergers, Ferdinand LLC will cause exchanges of vested common units of Ferdinand LLC into shares of Class A common stock of Ferdinand and unvested common units of Ferdinand LLC into restricted shares of Ferdinand, in accordance with Ferdinand LLC’s LLC agreement ❑ Any other common units of Ferdinand LLC that are not rolled over will be canceled for no consideration and cease to exist ❑ Tax Receivables Agreements (“TRA”) to be terminated at closing, with an agreed amount to be paid by Ferdinand in connection with such termination Consideration ❑ Parent to provide equity commitments at signing in an amount sufficient to pay the aggregate merger consideration and the amount required to be paid under the TRA at closing ❑ The acquisition is not subject to a financing condition (but Parent is not required to close until completion of a customary marketing period) Financing Sources ❑ Adoption of the merger agreement by (1) a majority of the voting power of outstanding shares of Class A and Class B common stock, voting as a single class and (2) a majority of the voting power of the outstanding shares of Class A and Class B common stock held by the unaffiliated stockholders, voting as a single class [definition of “unaffiliated stockholders” TBD] ❑ HSR clearance and other specified non-US antitrust approvals ❑ Absence of any law or injunction prohibiting the transaction ❑ Accuracy of reps and warranties (generally subject to an MAE standard) and compliance with covenants in all material respects Key Conditions to the Merger ❑ Go-shop period of 40 days following signing ❑ Customary no-shop obligation of Ferdinand commences following go-shop period, with standard fiduciary outs: ▪ The Ferdinand board is permitted to terminate the merger agreement (subject to payment of a termination fee) to accept a superior proposal ▪ The Ferdinand board is also permitted to change its recommendation in response to a superior proposal or intervening event ❑ Termination fee of 3.25% of transaction equity value (on a fully diluted basis) to be paid by Ferdinand to Parent in event of: (1) termination by Parent following a change in recommendation by the Ferdinand board, (2) termination by Ferdinand to accept a superior proposal or (3) entry by Ferdinand into a definitive agreement providing for an alternative transaction (or consummation of such a transaction) during a customary 12 month “tail” period following termination under specified circumstances ❑ A lower termination fee of 1.5% of transaction equity value is payable if Ferdinand terminates the merger agreement to accept a superior proposal either (1) during the go-shop period or (2) if the counterparty submitted an alternative proposal that the Ferdinand board determined to be a superior proposal during the go-shop period, within 50 days after signing Deal Protection ❑ Outside date of [●] [TBD] ❑ Parent may terminate if the Ferdinand board changes its recommendation to vote in favor of the Merger ❑ Ferdinand may terminate in order to accept a superior proposal ❑ Other customary termination rights Termination Provisions ❑ Ferdinand is entitled to full specific performance of Parent’s obligations under the merger agreement, including the obligation to consummate the merger ❑ Monetary damages payable by Parent, Merger Subs and their affiliates are capped at 6.5% of transaction equity value (on a fully diluted basis) ❑ The merger agreement does not include a reverse termination fee payable by Parent Remedies Against Parent * Based on Ferdinand’s draft of the merger agreement dated February 22, 2023 6 |
| Jefferies LLC / February 2023 / Preliminary draft for discussion purposes only Review of Management Provided Financial Forecast 7 |
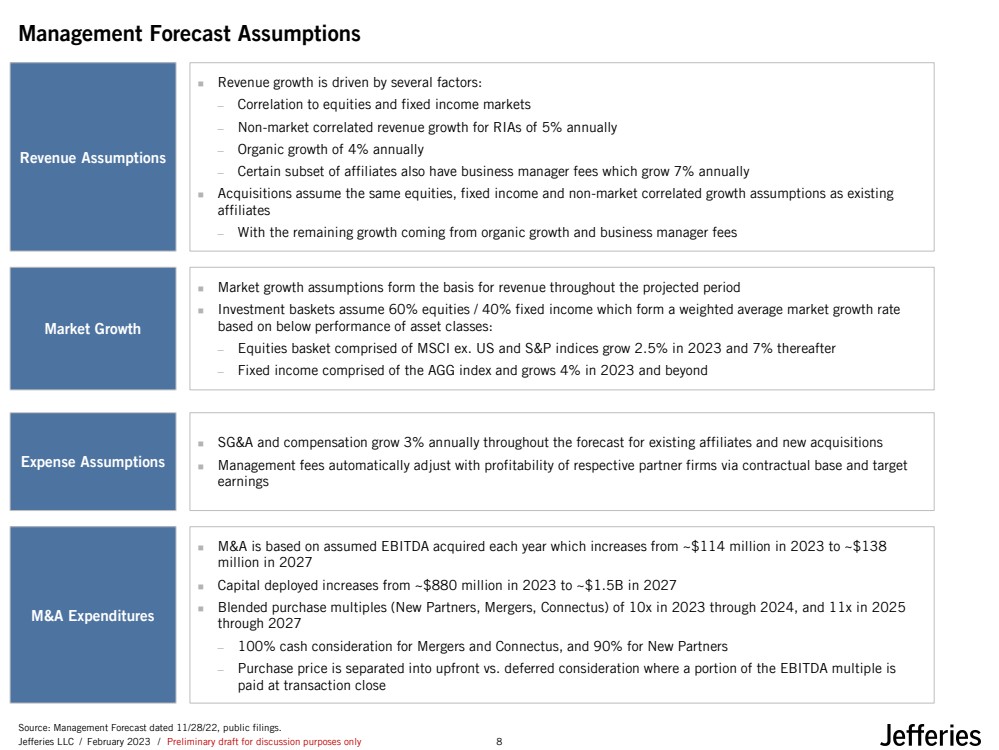
| Jefferies LLC / February 2023 / Preliminary draft for discussion purposes only Management Forecast Assumptions ◼ Market growth assumptions form the basis for revenue throughout the projected period ◼ Investment baskets assume 60% equities / 40% fixed income which form a weighted average market growth rate based on below performance of asset classes: ─ Equities basket comprised of MSCI ex. US and S&P indices grow 2.5% in 2023 and 7% thereafter ─ Fixed income comprised of the AGG index and grows 4% in 2023 and beyond Market Growth ◼ Revenue growth is driven by several factors: ─ Correlation to equities and fixed income markets ─ Non-market correlated revenue growth for RIAs of 5% annually ─ Organic growth of 4% annually ─ Certain subset of affiliates also have business manager fees which grow 7% annually ◼ Acquisitions assume the same equities, fixed income and non-market correlated growth assumptions as existing affiliates ─ With the remaining growth coming from organic growth and business manager fees Revenue Assumptions ◼ SG&A and compensation grow 3% annually throughout the forecast for existing affiliates and new acquisitions ◼ Management fees automatically adjust with profitability of respective partner firms via contractual base and target earnings Expense Assumptions ◼ M&A is based on assumed EBITDA acquired each year which increases from ~$114 million in 2023 to ~$138 million in 2027 ◼ Capital deployed increases from ~$880 million in 2023 to ~$1.5B in 2027 ◼ Blended purchase multiples (New Partners, Mergers, Connectus) of 10x in 2023 through 2024, and 11x in 2025 through 2027 ─ 100% cash consideration for Mergers and Connectus, and 90% for New Partners ─ Purchase price is separated into upfront vs. deferred consideration where a portion of the EBITDA multiple is paid at transaction close M&A Expenditures Source: Management Forecast dated 11/28/22, public filings. 8 |
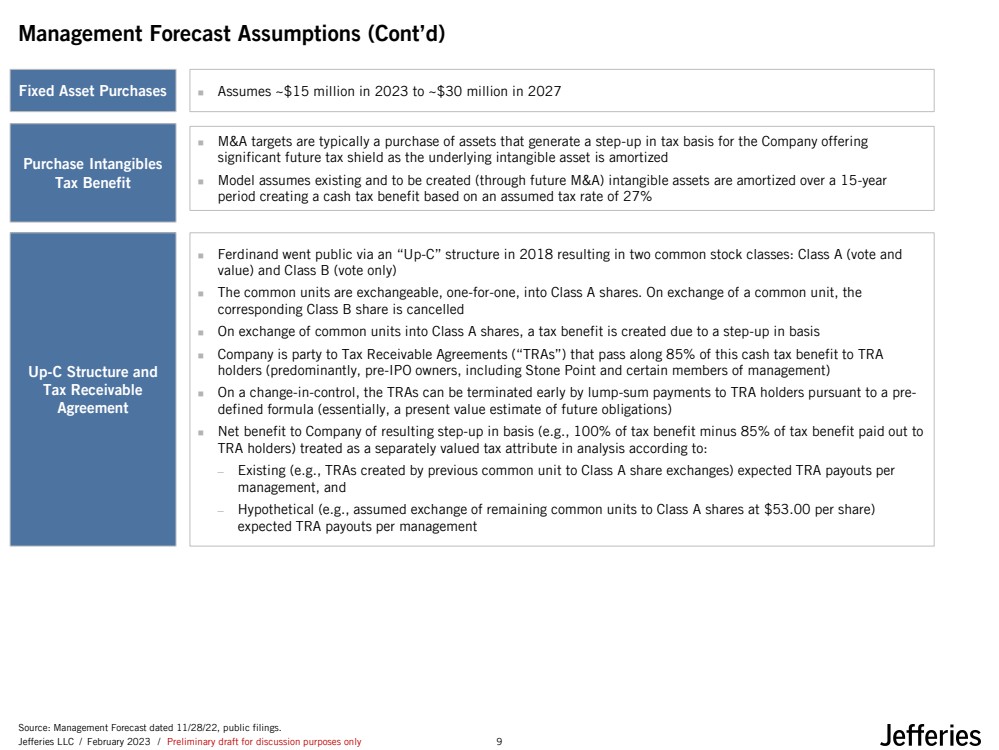
| Jefferies LLC / February 2023 / Preliminary draft for discussion purposes only Management Forecast Assumptions (Cont’d) ◼ Ferdinand went public via an “Up-C” structure in 2018 resulting in two common stock classes: Class A (vote and value) and Class B (vote only) ◼ The common units are exchangeable, one-for-one, into Class A shares. On exchange of a common unit, the corresponding Class B share is cancelled ◼ On exchange of common units into Class A shares, a tax benefit is created due to a step-up in basis ◼ Company is party to Tax Receivable Agreements (“TRAs”) that pass along 85% of this cash tax benefit to TRA holders (predominantly, pre-IPO owners, including Stone Point and certain members of management) ◼ On a change-in-control, the TRAs can be terminated early by lump-sum payments to TRA holders pursuant to a pre-defined formula (essentially, a present value estimate of future obligations) ◼ Net benefit to Company of resulting step-up in basis (e.g., 100% of tax benefit minus 85% of tax benefit paid out to TRA holders) treated as a separately valued tax attribute in analysis according to: ─ Existing (e.g., TRAs created by previous common unit to Class A share exchanges) expected TRA payouts per management, and ─ Hypothetical (e.g., assumed exchange of remaining common units to Class A shares at $53.00 per share) expected TRA payouts per management Up-C Structure and Tax Receivable Agreement Fixed Asset Purchases ◼ Assumes ~$15 million in 2023 to ~$30 million in 2027 ◼ M&A targets are typically a purchase of assets that generate a step-up in tax basis for the Company offering significant future tax shield as the underlying intangible asset is amortized ◼ Model assumes existing and to be created (through future M&A) intangible assets are amortized over a 15-year period creating a cash tax benefit based on an assumed tax rate of 27% Purchase Intangibles Tax Benefit Source: Management Forecast dated 11/28/22, public filings. 9 |
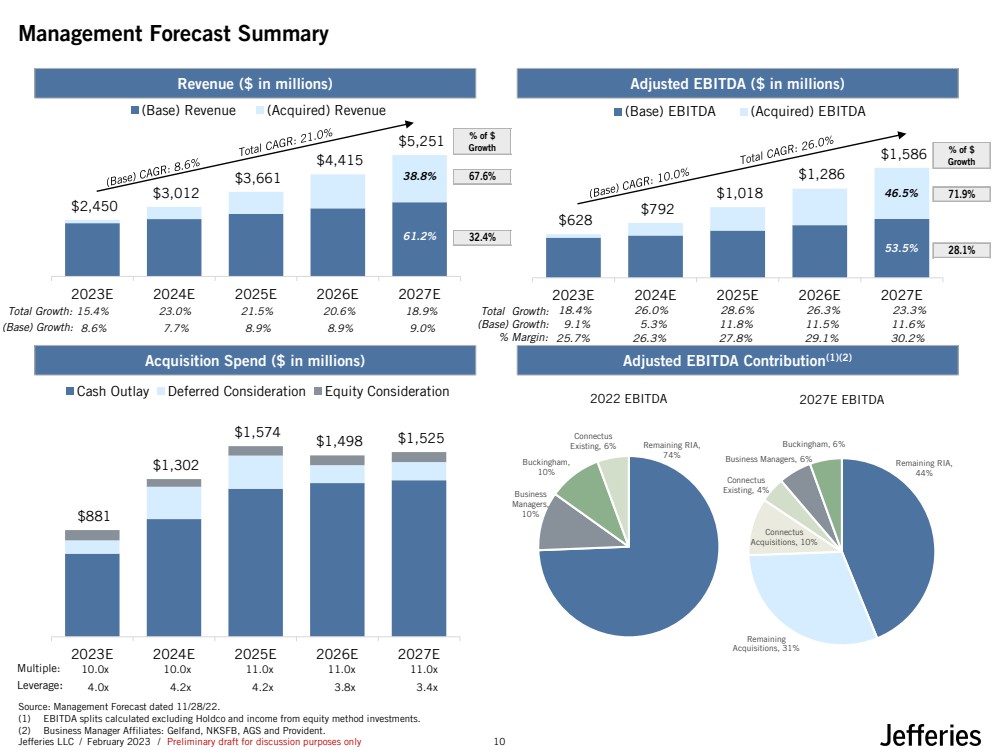
| Jefferies LLC / February 2023 / Preliminary draft for discussion purposes only $628 $792 $1,018 $1,286 $1,586 2023E 2024E 2025E 2026E 2027E (Base) EBITDA (Acquired) EBITDA $2,450 $3,012 $3,661 $4,415 $5,251 2023E 2024E 2025E 2026E 2027E (Base) Revenue (Acquired) Revenue Management Forecast Summary Source: Management Forecast dated 11/28/22. (1) EBITDA splits calculated excluding Holdco and income from equity method investments. (2) Business Manager Affiliates: Gelfand, NKSFB, AGS and Provident. Revenue ($ in millions) Adjusted EBITDA ($ in millions) Acquisition Spend ($ in millions) Adjusted EBITDA Contribution(1)(2) Total Growth: Total Growth: Multiple: % Margin: Leverage: 18.4% 26.0% 28.6% 26.3% 23.3% 25.7% 26.3% 27.8% 29.1% 30.2% 10.0x 10.0x 11.0x 11.0x 11.0x 4.0x 4.2x 4.2x 3.8x 3.4x $881 $1,302 $1,574 $1,498 $1,525 2023E 2024E 2025E 2026E 2027E Cash Outlay Deferred Consideration Equity Consideration (Base) Growth: (Base) Growth: 8.6% 7.7% 8.9% 8.9% 9.0% 15.4% 23.0% 21.5% 20.6% 18.9% 9.1% 5.3% 11.8% 11.5% 11.6% 38.8% 61.2% 46.5% 53.5% 67.6% 32.4% 71.9% 28.1% % of $ Growth % of $ Growth 2022 EBITDA 2027E EBITDA Remaining RIA, 44% Remaining Acquisitions, 31% Connectus Acquisitions, 10% Connectus Existing, 4% Business Managers, 6% Remaining RIA, Buckingham, 6% 74% Business Managers, 10% Buckingham, 10% Connectus Existing, 6% 10 |
| Jefferies LLC / February 2023 / Preliminary draft for discussion purposes only Valuation Analysis 11 |
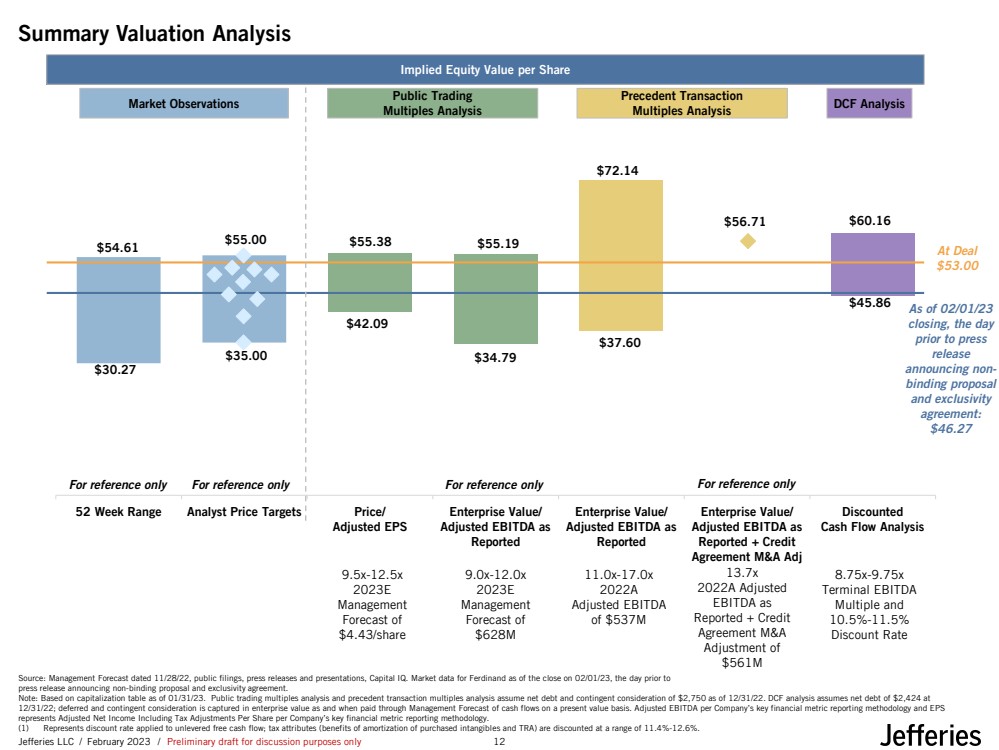
| Jefferies LLC / February 2023 / Preliminary draft for discussion purposes only 52 Week Range Analyst Price Targets Price/ Adjusted EPS Enterprise Value/ Adjusted EBITDA as Reported Enterprise Value/ Adjusted EBITDA as Reported Enterprise Value/ Adjusted EBITDA as Reported + Credit Agreement M&A Adj Discounted Cash Flow Analysis $54.61 $55.00 $55.38 $55.19 $72.14 $45.86 $60.16 $30.27 $35.00 $42.09 $34.79 $37.60 $56.71 Source: Management Forecast dated 11/28/22, public filings, press releases and presentations, Capital IQ. Market data for Ferdinand as of the close on 02/01/23, the day prior to press release announcing non-binding proposal and exclusivity agreement. Note: Based on capitalization table as of 01/31/23. Public trading multiples analysis and precedent transaction multiples analysis assume net debt and contingent consideration of $2,750 as of 12/31/22. DCF analysis assumes net debt of $2,424 at 12/31/22; deferred and contingent consideration is captured in enterprise value as and when paid through Management Forecast of cash flows on a present value basis. Adjusted EBITDA per Company’s key financial metric reporting methodology and EPS represents Adjusted Net Income Including Tax Adjustments Per Share per Company’s key financial metric reporting methodology. (1) Represents discount rate applied to unlevered free cash flow; tax attributes (benefits of amortization of purchased intangibles and TRA) are discounted at a range of 11.4%-12.6%. Implied Equity Value per Share Market Observations Public Trading Multiples Analysis Precedent Transaction Multiples Analysis DCF Analysis 9.5x-12.5x 2023E Management Forecast of $4.43/share 9.0x-12.0x 2023E Management Forecast of $628M 11.0x-17.0x 2022A Adjusted EBITDA of $537M 13.7x 2022A Adjusted EBITDA as Reported + Credit Agreement M&A Adjustment of $561M 8.75x-9.75x Terminal EBITDA Multiple and 10.5%-11.5% Discount Rate For reference only For reference only For reference only At Deal $53.00 As of 02/01/23 closing, the day prior to press release announcing non-binding proposal and exclusivity agreement: $46.27 For reference only Summary Valuation Analysis 12 |
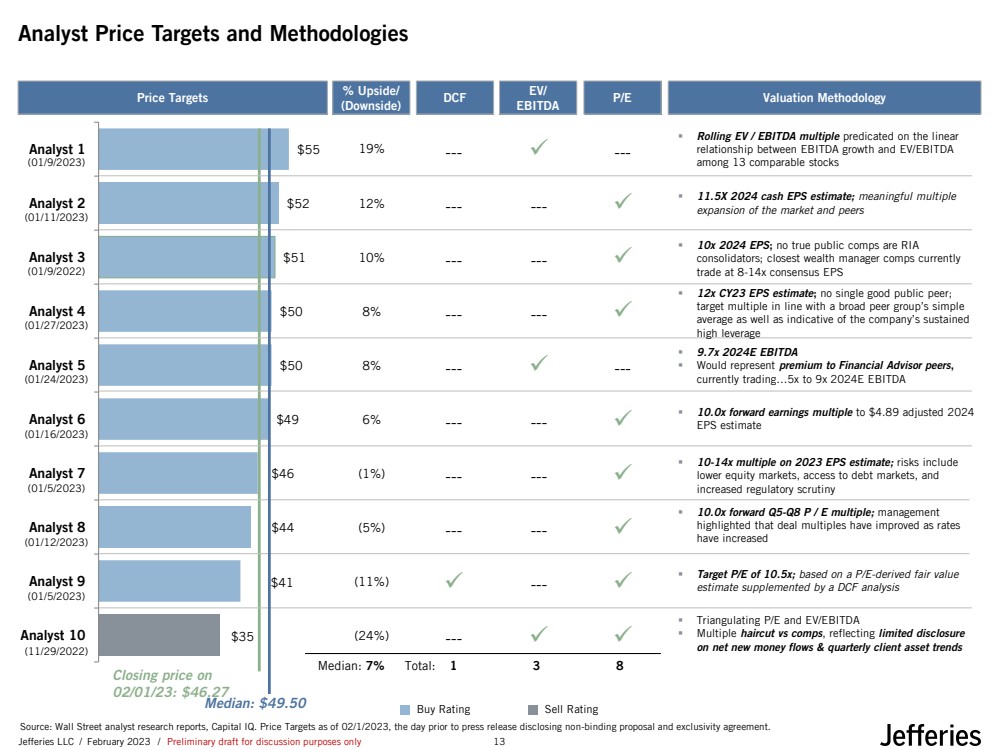
| Jefferies LLC / February 2023 / Preliminary draft for discussion purposes only $55 $52 $51 $50 $50 $49 $46 $44 $41 $35 Analyst 1 Analyst 2 Analyst 3 Analyst 4 Analyst 5 Analyst 6 Analyst 7 Analyst 8 Analyst 9 Analyst 10 Analyst Price Targets and Methodologies Median: $49.50 Source: Wall Street analyst research reports, Capital IQ. Price Targets as of 02/1/2023, the day prior to press release disclosing non-binding proposal and exclusivity agreement. Closing price on 02/01/23: $46.27 Price Targets % Upside/ (Downside) DCF Valuation Methodology EV/ EBITDA P/E ▪ Rolling EV / EBITDA multiple predicated on the linear relationship between EBITDA growth and EV/EBITDA among 13 comparable stocks 19% --- ✓ --- 12% --- --- ✓ 10% --- --- ✓ 8% --- --- ✓ 8% --- ✓ --- 6% --- --- ✓ (1%) --- --- ✓ (5%) --- --- ✓ (11%) --- ✓ (24%) --- ✓ ✓ ✓ ▪ Triangulating P/E and EV/EBITDA ▪ Multiple haircut vs comps, reflecting limited disclosure on net new money flows & quarterly client asset trends ▪ 10.0x forward Q5-Q8 P / E multiple; management highlighted that deal multiples have improved as rates have increased ▪ 11.5X 2024 cash EPS estimate; meaningful multiple expansion of the market and peers ▪ 9.7x 2024E EBITDA ▪ Would represent premium to Financial Advisor peers, currently trading…5x to 9x 2024E EBITDA ▪ 10.0x forward earnings multiple to $4.89 adjusted 2024 EPS estimate ▪ 10-14x multiple on 2023 EPS estimate; risks include lower equity markets, access to debt markets, and increased regulatory scrutiny ▪ Target P/E of 10.5x; based on a P/E-derived fair value estimate supplemented by a DCF analysis ▪ 10x 2024 EPS; no true public comps are RIA consolidators; closest wealth manager comps currently trade at 8-14x consensus EPS ▪ 12x CY23 EPS estimate; no single good public peer; target multiple in line with a broad peer group’s simple average as well as indicative of the company’s sustained high leverage (01/9/2023) (01/11/2023) (01/9/2022) (01/27/2023) (01/24/2023) (01/16/2023) (01/5/2023) (01/12/2023) (01/5/2023) (11/29/2022) Buy Rating Sell Rating Median: 7% Total: 1 3 8 13 |
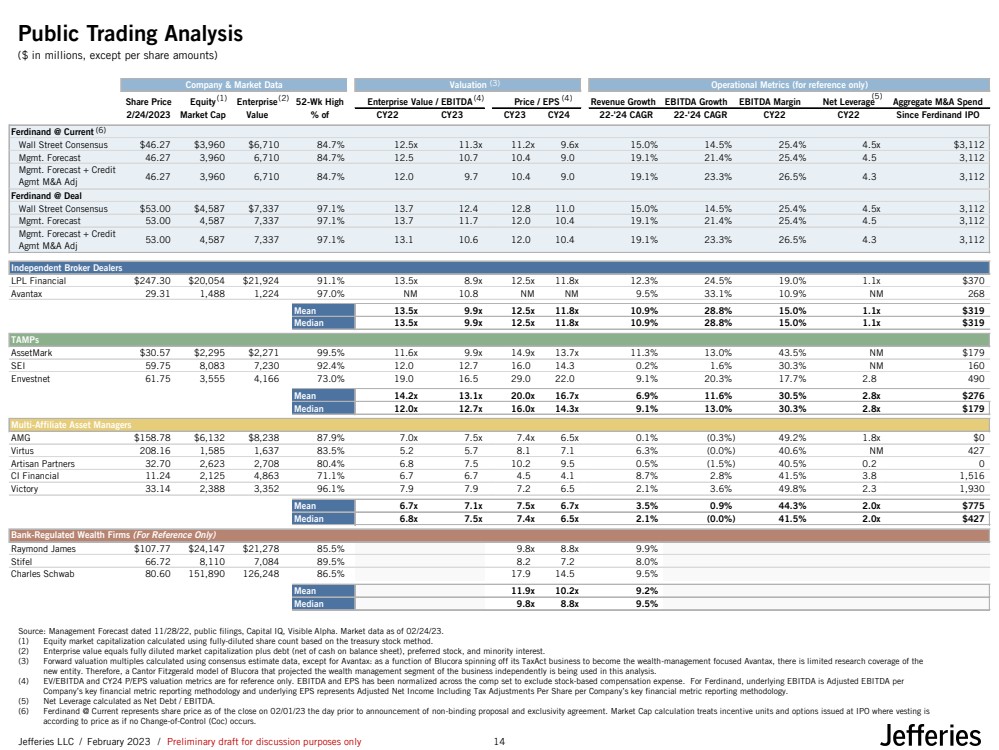
| Jefferies LLC / February 2023 / Preliminary draft for discussion purposes only Company & Market Data Valuation Operational Metrics (for reference only) Share Price Equity Enterprise 52-Wk High Enterprise Value / EBITDA Price / EPS Revenue Growth EBITDA Growth EBITDA Margin Net Leverage Aggregate M&A Spend 2/24/2023 Market Cap Value % of CY22 CY23 CY23 CY24 22-'24 CAGR 22-'24 CAGR CY22 CY22 Since Ferdinand IPO Ferdinand @ Current Wall Street Consensus $46.27 $3,960 $6,710 84.7% 12.5x 11.3x 11.2x 9.6x 15.0% 14.5% 25.4% 4.5x $3,112 Mgmt. Forecast 46.27 3,960 6,710 84.7% 12.5 10.7 10.4 9.0 19.1% 21.4% 25.4% 4.5 3,112 46.27 3,960 6,710 84.7% 12.0 9.7 10.4 9.0 19.1% 23.3% 26.5% 4.3 3,112 Ferdinand @ Deal Wall Street Consensus $53.00 $4,587 $7,337 97.1% 13.7 12.4 12.8 11.0 15.0% 14.5% 25.4% 4.5x 3,112 Mgmt. Forecast 53.00 4,587 7,337 97.1% 13.7 11.7 12.0 10.4 19.1% 21.4% 25.4% 4.5 3,112 53.00 4,587 7,337 97.1% 13.1 10.6 12.0 10.4 19.1% 23.3% 26.5% 4.3 3,112 Independent Broker Dealers LPL Financial $247.30 $20,054 $21,924 91.1% 13.5x 8.9x 12.5x 11.8x 12.3% 24.5% 19.0% 1.1x $370 Avantax 29.31 1,488 1,224 97.0% NM 10.8 NM NM 9.5% 33.1% 10.9% NM 268 Mean 13.5x 9.9x 12.5x 11.8x 10.9% 28.8% 15.0% 1.1x $319 Median 13.5x 9.9x 12.5x 11.8x 10.9% 28.8% 15.0% 1.1x $319 TAMPs AssetMark $30.57 $2,295 $2,271 99.5% 11.6x 9.9x 14.9x 13.7x 11.3% 13.0% 43.5% NM $179 SEI 59.75 8,083 7,230 92.4% 12.0 12.7 16.0 14.3 0.2% 1.6% 30.3% NM 160 Envestnet 61.75 3,555 4,166 73.0% 19.0 16.5 29.0 22.0 9.1% 20.3% 17.7% 2.8 490 Mean 14.2x 13.1x 20.0x 16.7x 6.9% 11.6% 30.5% 2.8x $276 Median 12.0x 12.7x 16.0x 14.3x 9.1% 13.0% 30.3% 2.8x $179 Multi-Affiliate Asset Managers AMG $158.78 $6,132 $8,238 87.9% 7.0x 7.5x 7.4x 6.5x 0.1% (0.3%) 49.2% 1.8x $0 Virtus 208.16 1,585 1,637 83.5% 5.2 5.7 8.1 7.1 6.3% (0.0%) 40.6% NM 427 Artisan Partners 32.70 2,623 2,708 80.4% 6.8 7.5 10.2 9.5 0.5% (1.5%) 40.5% 0.2 0 CI Financial 11.24 2,125 4,863 71.1% 6.7 6.7 4.5 4.1 8.7% 2.8% 41.5% 3.8 1,516 Victory 33.14 2,388 3,352 96.1% 7.9 7.9 7.2 6.5 2.1% 3.6% 49.8% 2.3 1,930 Mean 6.7x 7.1x 7.5x 6.7x 3.5% 0.9% 44.3% 2.0x $775 Median 6.8x 7.5x 7.4x 6.5x 2.1% (0.0%) 41.5% 2.0x $427 Bank-Regulated Wealth Firms (For Reference Only) Raymond James $107.77 $24,147 $21,278 85.5% 9.8x 8.8x 9.9% Stifel 66.72 8,110 7,084 89.5% 8.2 7.2 8.0% Charles Schwab 80.60 151,890 126,248 86.5% 17.9 14.5 9.5% Mean 11.9x 10.2x 9.2% Median 9.8x 8.8x 9.5% Mgmt. Forecast + Credit Agmt M&A Adj Mgmt. Forecast + Credit Agmt M&A Adj Public Trading Analysis Source: Management Forecast dated 11/28/22, public filings, Capital IQ, Visible Alpha. Market data as of 02/24/23. (1) Equity market capitalization calculated using fully-diluted share count based on the treasury stock method. (2) Enterprise value equals fully diluted market capitalization plus debt (net of cash on balance sheet), preferred stock, and minority interest. (3) Forward valuation multiples calculated using consensus estimate data, except for Avantax: as a function of Blucora spinning off its TaxAct business to become the wealth-management focused Avantax, there is limited research coverage of the new entity. Therefore, a Cantor Fitzgerald model of Blucora that projected the wealth management segment of the business independently is being used in this analysis. (4) EV/EBITDA and CY24 P/EPS valuation metrics are for reference only. EBITDA and EPS has been normalized across the comp set to exclude stock-based compensation expense. For Ferdinand, underlying EBITDA is Adjusted EBITDA per Company’s key financial metric reporting methodology and underlying EPS represents Adjusted Net Income Including Tax Adjustments Per Share per Company’s key financial metric reporting methodology. (5) Net Leverage calculated as Net Debt / EBITDA. (6) Ferdinand @ Current represents share price as of the close on 02/01/23 the day prior to announcement of non-binding proposal and exclusivity agreement. Market Cap calculation treats incentive units and options issued at IPO where vesting is according to price as if no Change-of-Control (Coc) occurs. (1) (2) (3) (4) ($ in millions, except per share amounts) (6) (4) (5) 14 |
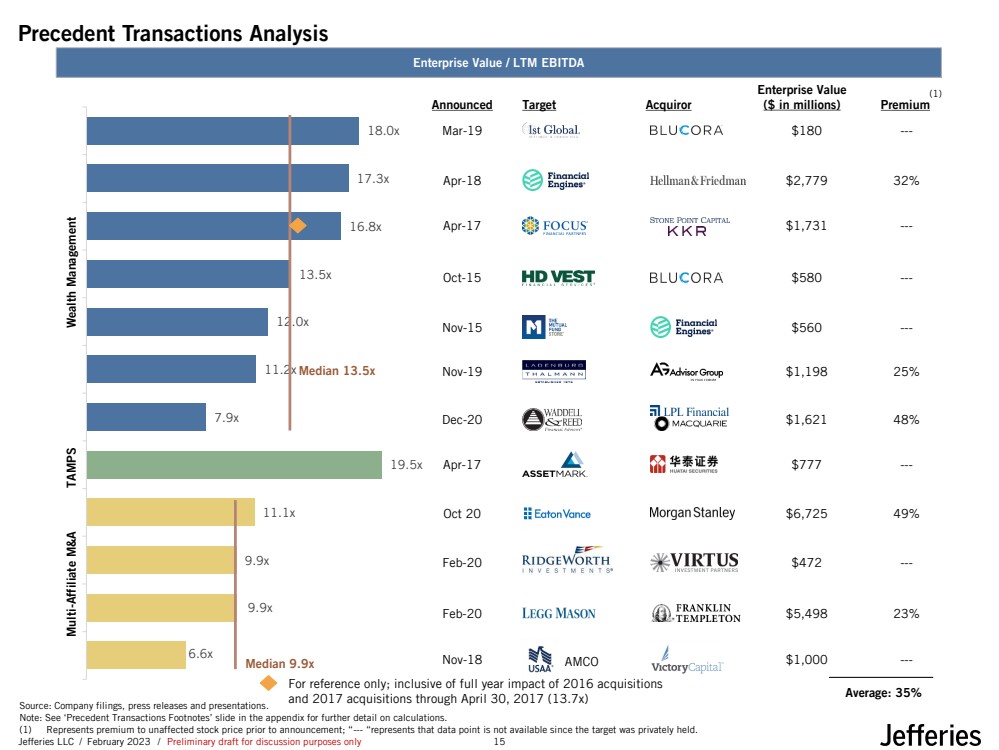
| Jefferies LLC / February 2023 / Preliminary draft for discussion purposes only Precedent Transactions Analysis 6.6x 9.9x 9.9x 11.1x 19.5x 7.9x 11.2x 12.0x 13.5x 16.8x 17.3x 18.0x Source: Company filings, press releases and presentations. Note: See ‘Precedent Transactions Footnotes’ slide in the appendix for further detail on calculations. (1) Represents premium to unaffected stock price prior to announcement; “--- “represents that data point is not available since the target was privately held. Enterprise Value / LTM EBITDA Announced Target Acquiror Enterprise Value ($ in millions) Premium Dec-20 $1,621 48% Nov-19 $1,198 25% Apr-18 $2,779 32% Oct 20 $6,725 49% Feb-20 $5,498 23% Mar-19 $180 --- Apr-17 $1,731 --- Oct-15 $580 --- Nov-15 $560 --- Apr-17 $777 --- For reference only; inclusive of full year impact of 2016 acquisitions and 2017 acquisitions through April 30, 2017 (13.7x) Median 13.5x Median 9.9x Wealth Management TAMPS Multi-Affiliate M&A Feb-20 $472 --- (1) Nov-18 AMCO $1,000 --- Average: 35% 15 |
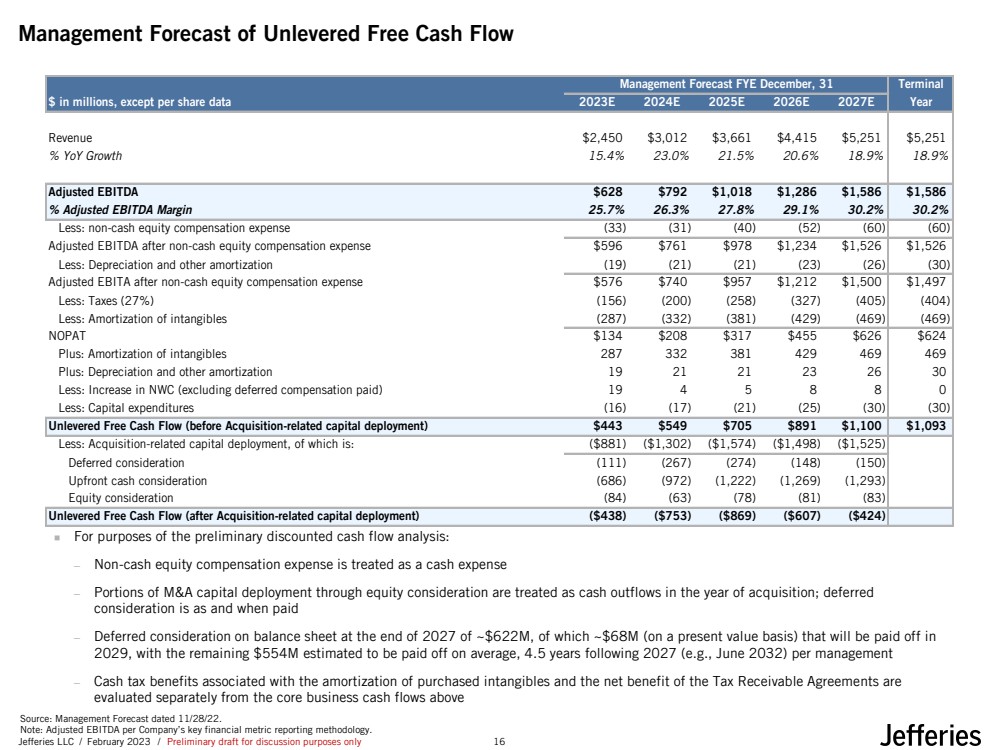
| Jefferies LLC / February 2023 / Preliminary draft for discussion purposes only Management Forecast of Unlevered Free Cash Flow Source: Management Forecast dated 11/28/22. Note: Adjusted EBITDA per Company’s key financial metric reporting methodology. ◼ For purposes of the preliminary discounted cash flow analysis: ─ Non-cash equity compensation expense is treated as a cash expense ─ Portions of M&A capital deployment through equity consideration are treated as cash outflows in the year of acquisition; deferred consideration is as and when paid ─ Deferred consideration on balance sheet at the end of 2027 of ~$622M, of which ~$68M (on a present value basis) that will be paid off in 2029, with the remaining $554M estimated to be paid off on average, 4.5 years following 2027 (e.g., June 2032) per management ─ Cash tax benefits associated with the amortization of purchased intangibles and the net benefit of the Tax Receivable Agreements are evaluated separately from the core business cash flows above Management Forecast FYE December, 31 Terminal $ in millions, except per share data 2023E 2024E 2025E 2026E 2027E Year Equity Value Revenue $2,123 $2,450 $3,012 $3,661 $4,415 $5,251 $5,251 % YoY Growth 15.4% 23.0% 21.5% 20.6% 18.9% 18.9% Adjusted EBITDA $628 $792 $1,018 $1,286 $1,586 $1,586 % Adjusted EBITDA Margin 25.7% 26.3% 27.8% 29.1% 30.2% 30.2% Less: non-cash equity compensation expense (33) (31) (40) (52) (60) (60) Adjusted EBITDA after non-cash equity compensation expense $596 $761 $978 $1,234 $1,526 $1,526 Less: Depreciation and other amortization (19) (21) (21) (23) (26) (30) Adjusted EBITA after non-cash equity compensation expense $576 $740 $957 $1,212 $1,500 $1,497 Less: Taxes (27%) (156) (200) (258) (327) (405) (404) Less: Amortization of intangibles (287) (332) (381) (429) (469) (469) NOPAT $134 $208 $317 $455 $626 $624 Plus: Amortization of intangibles 287 332 381 429 469 469 Plus: Depreciation and other amortization 19 21 21 23 26 30 Less: Increase in NWC (excluding deferred compensation paid) 19 4 5 8 8 0 Less: Capital expenditures (16) (17) (21) (25) (30) (30) Unlevered Free Cash Flow (before Acquisition-related capital deployment) $443 $549 $705 $891 $1,100 $1,093 Less: Acquisition-related capital deployment, of which is: ($881) ($1,302) ($1,574) ($1,498) ($1,525) $0 Deferred consideration (111) (267) (274) (148) (150) 0 Upfront cash consideration (686) (972) (1,222) (1,269) (1,293) 0 Equity consideration (84) (63) (78) (81) (83) 0 Unlevered Free Cash Flow (after Acquisition-related capital deployment) ($438) ($753) ($869) ($607) ($424) $1,093 16 |
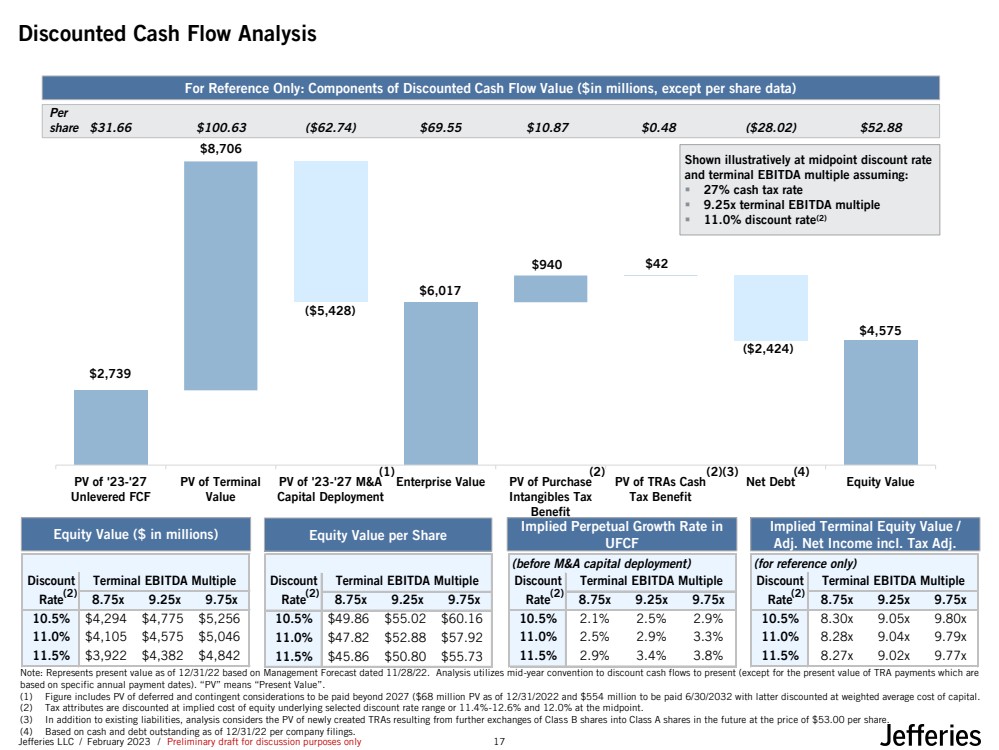
| Jefferies LLC / February 2023 / Preliminary draft for discussion purposes only Discount Terminal EBITDA Multiple Rate 8.75x 9.25x 9.75x 10.5% $4,294 $4,775 $5,256 11.0% $4,105 $4,575 $5,046 11.5% $3,922 $4,382 $4,842 Discount Terminal EBITDA Multiple Rate 8.75x 9.25x 9.75x 10.5% $49.86 $55.02 $60.16 11.0% $47.82 $52.88 $57.92 11.5% $45.86 $50.80 $55.73 (before M&A capital deployment) Discount Terminal EBITDA Multiple Rate 8.75x 9.25x 9.75x 10.5% 2.1% 2.5% 2.9% 11.0% 2.5% 2.9% 3.3% 11.5% 2.9% 3.4% 3.8% (for reference only) Discount Terminal EBITDA Multiple Rate 8.75x 9.25x 9.75x 10.5% 8.30x 9.05x 9.80x 11.0% 8.28x 9.04x 9.79x 11.5% 8.27x 9.02x 9.77x Discounted Cash Flow Analysis PV of '23-'27 Unlevered FCF PV of Terminal Value PV of '23-'27 M&A Capital Deployment Enterprise Value PV of Purchase Intangibles Tax Benefit PV of TRAs Cash Tax Benefit Net Debt Equity Value $2,739 $8,706 ($5,428) $6,017 $940 $42 ($2,424) $4,575 (1) (2) (4) For Reference Only: Components of Discounted Cash Flow Value ($in millions, except per share data) Per share $31.66 $100.63 ($62.74) $69.55 $10.87 $0.48 ($28.02) $52.88 Shown illustratively at midpoint discount rate and terminal EBITDA multiple assuming: ▪ 27% cash tax rate ▪ 9.25x terminal EBITDA multiple ▪ 11.0% discount rate(2) Note: Represents present value as of 12/31/22 based on Management Forecast dated 11/28/22. Analysis utilizes mid-year convention to discount cash flows to present (except for the present value of TRA payments which are based on specific annual payment dates). “PV” means “Present Value”. (1) Figure includes PV of deferred and contingent considerations to be paid beyond 2027 ($68 million PV as of 12/31/2022 and $554 million to be paid 6/30/2032 with latter discounted at weighted average cost of capital. (2) Tax attributes are discounted at implied cost of equity underlying selected discount rate range or 11.4%-12.6% and 12.0% at the midpoint. (3) In addition to existing liabilities, analysis considers the PV of newly created TRAs resulting from further exchanges of Class B shares into Class A shares in the future at the price of $53.00 per share. (4) Based on cash and debt outstanding as of 12/31/22 per company filings. Equity Value ($ in millions) Equity Value per Share Implied Perpetual Growth Rate in UFCF Implied Terminal Equity Value / Adj. Net Income incl. Tax Adj. (2) (3) (2) (2) (2) (2) 17 |
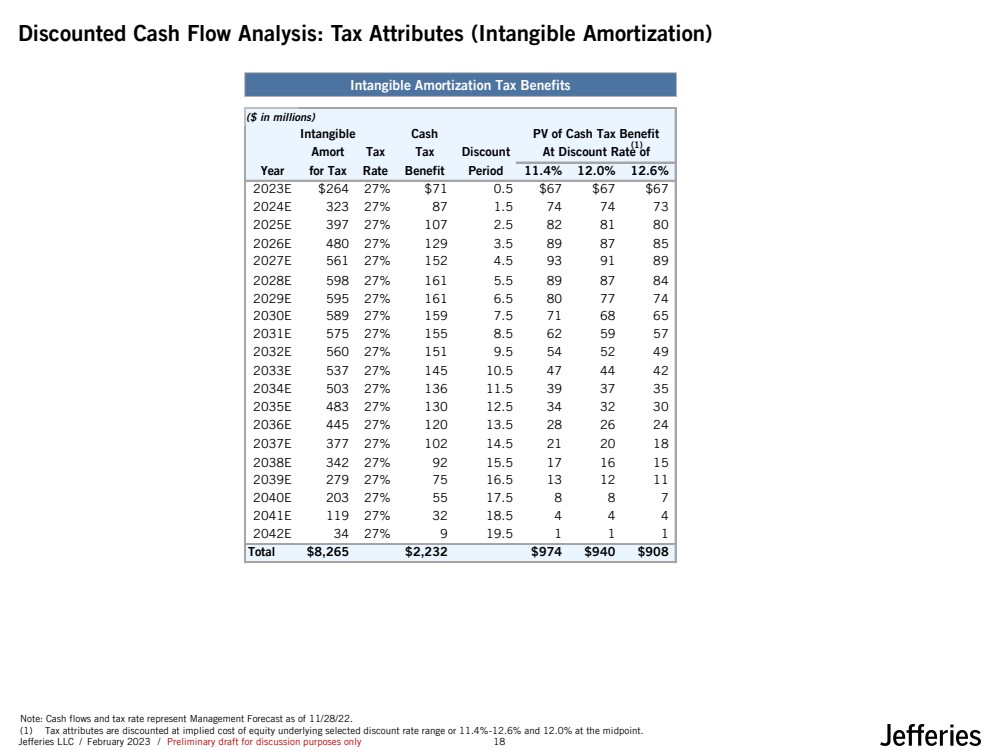
| Jefferies LLC / February 2023 / Preliminary draft for discussion purposes only Intangible Cash PV of Cash Tax Benefit Amort Tax Tax Discount At Discount Rate of Year for Tax Rate Benefit Period 11.4% 12.0% 12.6% 2023E $264 27% $71 0.5 $67 $67 $67 2024E 323 27% 87 1.5 74 74 73 2025E 397 27% 107 2.5 82 81 80 2026E 480 27% 129 3.5 89 87 85 2027E 561 27% 152 4.5 93 91 89 2028E 598 27% 161 5.5 89 87 84 2029E 595 27% 161 6.5 80 77 74 2030E 589 27% 159 7.5 71 68 65 2031E 575 27% 155 8.5 62 59 57 2032E 560 27% 151 9.5 54 52 49 2033E 537 27% 145 10.5 47 44 42 2034E 503 27% 136 11.5 39 37 35 2035E 483 27% 130 12.5 34 32 30 2036E 445 27% 120 13.5 28 26 24 2037E 377 27% 102 14.5 21 20 18 2038E 342 27% 92 15.5 17 16 15 2039E 279 27% 75 16.5 13 12 11 2040E 203 27% 55 17.5 8 8 7 2041E 119 27% 32 18.5 4 4 4 2042E 34 27% 9 19.5 1 1 1 Total $8,265 $2,232 $974 $940 $908 ($ in millions) Discounted Cash Flow Analysis: Tax Attributes (Intangible Amortization) Intangible Amortization Tax Benefits Note: Cash flows and tax rate represent Management Forecast as of 11/28/22. (1) Tax attributes are discounted at implied cost of equity underlying selected discount rate range or 11.4%-12.6% and 12.0% at the midpoint. (1) 18 |
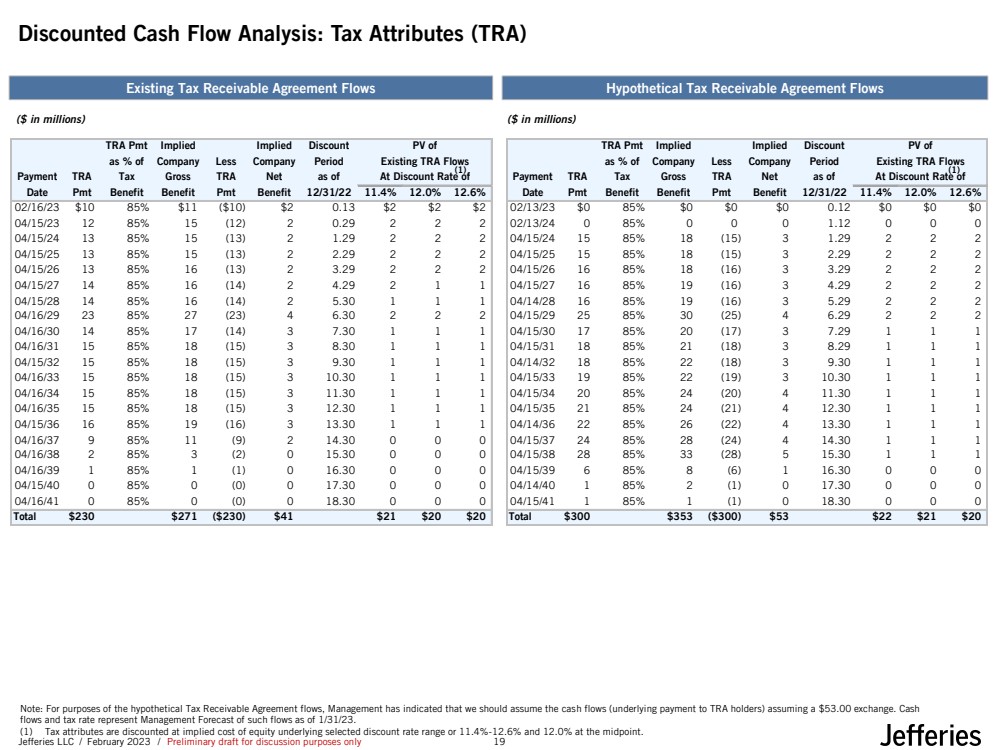
| Jefferies LLC / February 2023 / Preliminary draft for discussion purposes only TRA Pmt Implied Implied Discount PV of as % of Company Less Company Period Existing TRA Flows Payment TRA Tax Gross TRA Net as of At Discount Rate of Date Pmt Benefit Benefit Pmt Benefit 12/31/22 11.4% 12.0% 12.6% 02/16/23 $10 85% $11 ($10) $2 0.13 $2 $2 $2 04/15/23 12 85% 15 (12) 2 0.29 2 2 2 04/15/24 13 85% 15 (13) 2 1.29 2 2 2 04/15/25 13 85% 15 (13) 2 2.29 2 2 2 04/15/26 13 85% 16 (13) 2 3.29 2 2 2 04/15/27 14 85% 16 (14) 2 4.29 2 1 1 04/15/28 14 85% 16 (14) 2 5.30 1 1 1 04/16/29 23 85% 27 (23) 4 6.30 2 2 2 04/16/30 14 85% 17 (14) 3 7.30 1 1 1 04/16/31 15 85% 18 (15) 3 8.30 1 1 1 04/15/32 15 85% 18 (15) 3 9.30 1 1 1 04/16/33 15 85% 18 (15) 3 10.30 1 1 1 04/16/34 15 85% 18 (15) 3 11.30 1 1 1 04/16/35 15 85% 18 (15) 3 12.30 1 1 1 04/15/36 16 85% 19 (16) 3 13.30 1 1 1 04/16/37 9 85% 11 (9) 2 14.30 0 0 0 04/16/38 2 85% 3 (2) 0 15.30 0 0 0 04/16/39 1 85% 1 (1) 0 16.30 0 0 0 04/15/40 0 85% 0 (0) 0 17.30 0 0 0 04/16/41 0 85% 0 (0) 0 18.30 0 0 0 Total $230 $271 ($230) $41 $21 $20 $20 TRA Pmt Implied Implied Discount PV of as % of Company Less Company Period Existing TRA Flows Payment TRA Tax Gross TRA Net as of At Discount Rate of Date Pmt Benefit Benefit Pmt Benefit 12/31/22 11.4% 12.0% 12.6% 02/13/23 $0 85% $0 $0 $0 0.12 $0 $0 $0 02/13/24 0 85% 0 0 0 1.12 0 0 0 04/15/24 15 85% 18 (15) 3 1.29 2 2 2 04/15/25 15 85% 18 (15) 3 2.29 2 2 2 04/15/26 16 85% 18 (16) 3 3.29 2 2 2 04/15/27 16 85% 19 (16) 3 4.29 2 2 2 04/14/28 16 85% 19 (16) 3 5.29 2 2 2 04/15/29 25 85% 30 (25) 4 6.29 2 2 2 04/15/30 17 85% 20 (17) 3 7.29 1 1 1 04/15/31 18 85% 21 (18) 3 8.29 1 1 1 04/14/32 18 85% 22 (18) 3 9.30 1 1 1 04/15/33 19 85% 22 (19) 3 10.30 1 1 1 04/15/34 20 85% 24 (20) 4 11.30 1 1 1 04/15/35 21 85% 24 (21) 4 12.30 1 1 1 04/14/36 22 85% 26 (22) 4 13.30 1 1 1 04/15/37 24 85% 28 (24) 4 14.30 1 1 1 04/15/38 28 85% 33 (28) 5 15.30 1 1 1 04/15/39 6 85% 8 (6) 1 16.30 0 0 0 04/14/40 1 85% 2 (1) 0 17.30 0 0 0 04/15/41 1 85% 1 (1) 0 18.30 0 0 0 Total $300 $353 ($300) $53 $22 $21 $20 Discounted Cash Flow Analysis: Tax Attributes (TRA) Existing Tax Receivable Agreement Flows Hypothetical Tax Receivable Agreement Flows ($ in millions) ($ in millions) Note: For purposes of the hypothetical Tax Receivable Agreement flows, Management has indicated that we should assume the cash flows (underlying payment to TRA holders) assuming a $53.00 exchange. Cash flows and tax rate represent Management Forecast of such flows as of 1/31/23. (1) Tax attributes are discounted at implied cost of equity underlying selected discount rate range or 11.4%-12.6% and 12.0% at the midpoint. (1) (1) 19 |
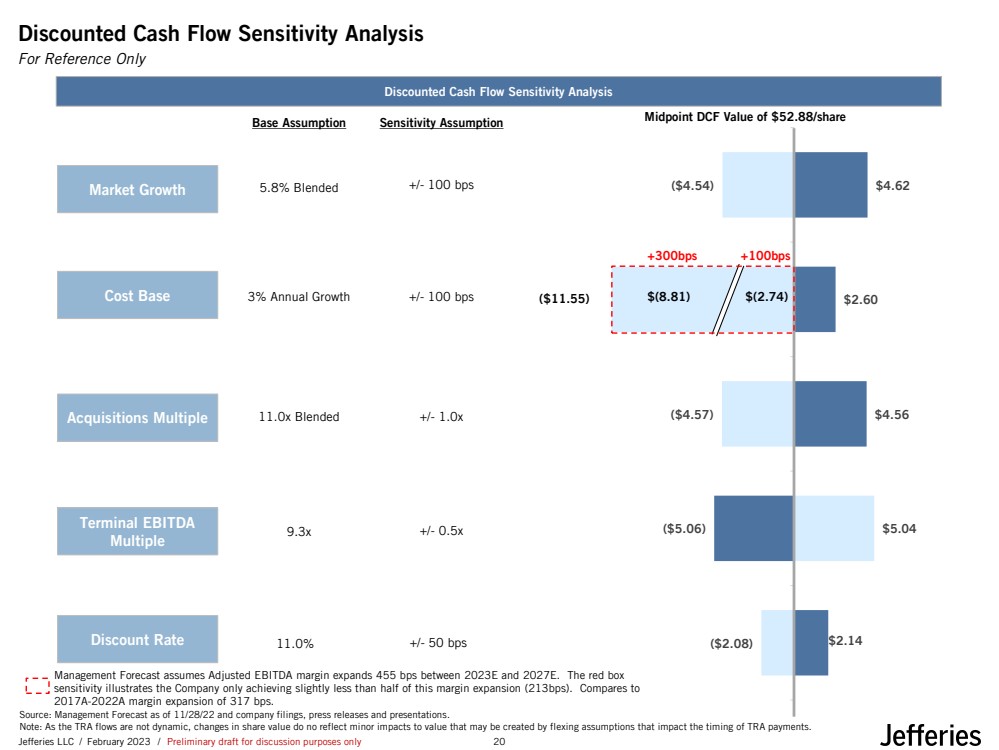
| Jefferies LLC / February 2023 / Preliminary draft for discussion purposes only $2.14 ($5.06) $4.56 $2.60 $4.62 ($2.08) $5.04 ($4.57) ($4.54) Discounted Cash Flow Sensitivity Analysis Source: Management Forecast as of 11/28/22 and company filings, press releases and presentations. Note: As the TRA flows are not dynamic, changes in share value do no reflect minor impacts to value that may be created by flexing assumptions that impact the timing of TRA payments. Discounted Cash Flow Sensitivity Analysis Base Assumption Sensitivity Assumption 5.8% Blended +/- 100 bps 3% Annual Growth +/- 100 bps 11.0x Blended +/- 1.0x 9.3x +/- 0.5x Midpoint DCF Value of $52.88/share Market Growth Cost Base Acquisitions Multiple Terminal EBITDA Multiple Discount Rate 11.0% +/- 50 bps ($11.55) $(2.74) Management Forecast assumes Adjusted EBITDA margin expands 455 bps between 2023E and 2027E. The red box sensitivity illustrates the Company only achieving slightly less than half of this margin expansion (213bps). Compares to 2017A-2022A margin expansion of 317 bps. +300bps For Reference Only +100bps $(8.81) 20 |
| Jefferies LLC / February 2023 / Preliminary draft for discussion purposes only Appendix 21 |
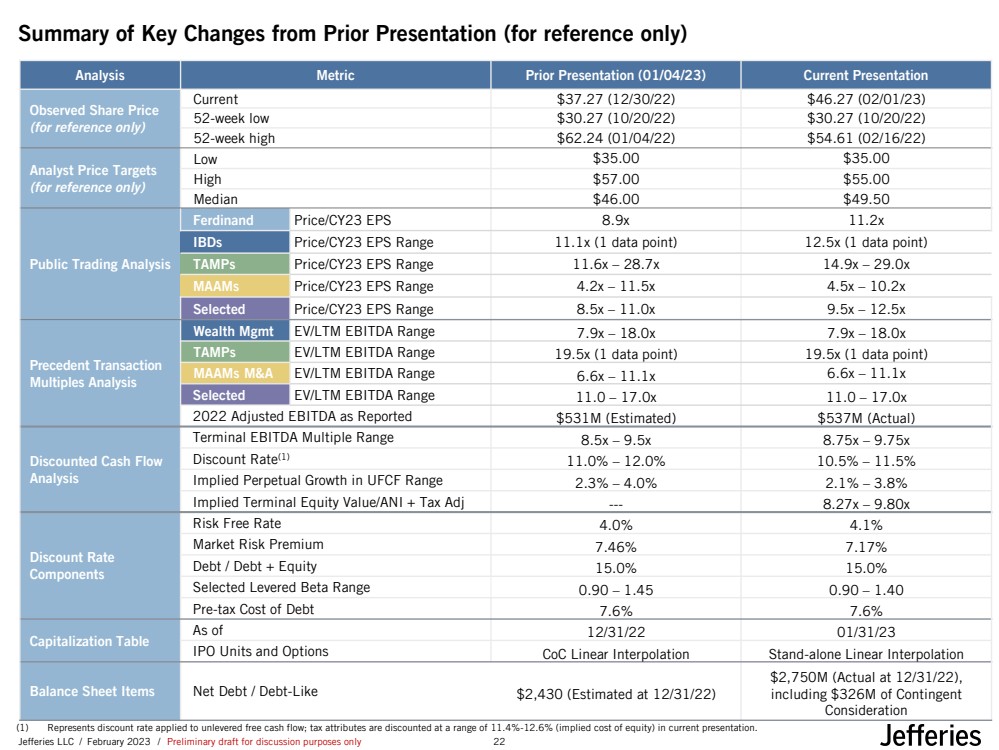
| Jefferies LLC / February 2023 / Preliminary draft for discussion purposes only Summary of Key Changes from Prior Presentation (for reference only) Analysis Metric Prior Presentation (01/04/23) Current Presentation Observed Share Price (for reference only) Current $37.27 (12/30/22) $46.27 (02/01/23) 52-week low $30.27 (10/20/22) $30.27 (10/20/22) 52-week high $62.24 (01/04/22) $54.61 (02/16/22) Analyst Price Targets (for reference only) Low $35.00 $35.00 High $57.00 $55.00 Median $46.00 $49.50 Public Trading Analysis Ferdinand Price/CY23 EPS 8.9x 11.2x IBDs Price/CY23 EPS Range 11.1x (1 data point) 12.5x (1 data point) TAMPs Price/CY23 EPS Range 11.6x – 28.7x 14.9x – 29.0x MAAMs Price/CY23 EPS Range 4.2x – 11.5x 4.5x – 10.2x Selected Price/CY23 EPS Range 8.5x – 11.0x 9.5x – 12.5x Precedent Transaction Multiples Analysis Wealth Mgmt EV/LTM EBITDA Range 7.9x – 18.0x 7.9x – 18.0x TAMPs EV/LTM EBITDA Range 19.5x (1 data point) 19.5x (1 data point) MAAMs M&A EV/LTM EBITDA Range 6.6x – 11.1x 6.6x – 11.1x Selected EV/LTM EBITDA Range 11.0 – 17.0x 11.0 – 17.0x 2022 Adjusted EBITDA as Reported $531M (Estimated) $537M (Actual) Discounted Cash Flow Analysis Terminal EBITDA Multiple Range 8.5x – 9.5x 8.75x – 9.75x Discount Rate(1) 11.0% – 12.0% 10.5% – 11.5% Implied Perpetual Growth in UFCF Range 2.3% – 4.0% 2.1% – 3.8% Implied Terminal Equity Value/ANI + Tax Adj --- 8.27x – 9.80x Discount Rate Components Risk Free Rate 4.0% 4.1% Market Risk Premium 7.46% 7.17% Debt / Debt + Equity 15.0% 15.0% Selected Levered Beta Range 0.90 – 1.45 0.90 – 1.40 Pre-tax Cost of Debt 7.6% 7.6% Capitalization Table As of 12/31/22 01/31/23 IPO Units and Options CoC Linear Interpolation Stand-alone Linear Interpolation Balance Sheet Items Net Debt / Debt-Like $2,430 (Estimated at 12/31/22) $2,750M (Actual at 12/31/22), including $326M of Contingent Consideration (1) Represents discount rate applied to unlevered free cash flow; tax attributes are discounted at a range of 11.4%-12.6% (implied cost of equity) in current presentation. 22 |
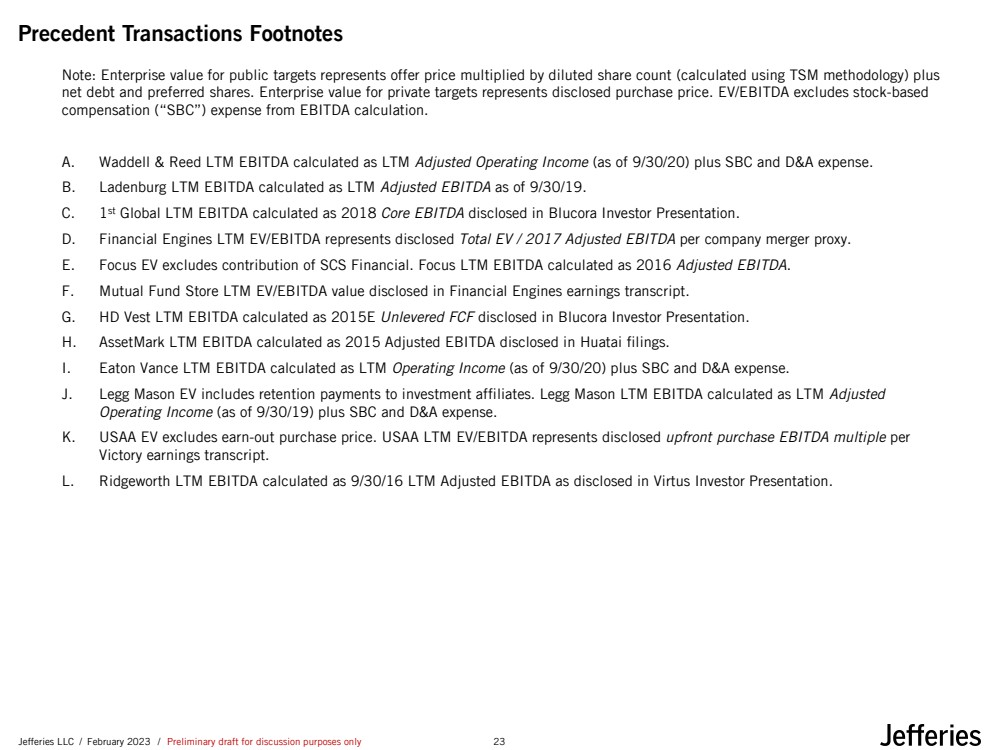
| Jefferies LLC / February 2023 / Preliminary draft for discussion purposes only Precedent Transactions Footnotes Note: Enterprise value for public targets represents offer price multiplied by diluted share count (calculated using TSM methodology) plus net debt and preferred shares. Enterprise value for private targets represents disclosed purchase price. EV/EBITDA excludes stock-based compensation (“SBC”) expense from EBITDA calculation. A. Waddell & Reed LTM EBITDA calculated as LTM Adjusted Operating Income (as of 9/30/20) plus SBC and D&A expense. B. Ladenburg LTM EBITDA calculated as LTM Adjusted EBITDA as of 9/30/19. C. 1st Global LTM EBITDA calculated as 2018 Core EBITDA disclosed in Blucora Investor Presentation. D. Financial Engines LTM EV/EBITDA represents disclosed Total EV / 2017 Adjusted EBITDA per company merger proxy. E. Focus EV excludes contribution of SCS Financial. Focus LTM EBITDA calculated as 2016 Adjusted EBITDA. F. Mutual Fund Store LTM EV/EBITDA value disclosed in Financial Engines earnings transcript. G. HD Vest LTM EBITDA calculated as 2015E Unlevered FCF disclosed in Blucora Investor Presentation. H. AssetMark LTM EBITDA calculated as 2015 Adjusted EBITDA disclosed in Huatai filings. I. Eaton Vance LTM EBITDA calculated as LTM Operating Income (as of 9/30/20) plus SBC and D&A expense. J. Legg Mason EV includes retention payments to investment affiliates. Legg Mason LTM EBITDA calculated as LTM Adjusted Operating Income (as of 9/30/19) plus SBC and D&A expense. K. USAA EV excludes earn-out purchase price. USAA LTM EV/EBITDA represents disclosed upfront purchase EBITDA multiple per Victory earnings transcript. L. Ridgeworth LTM EBITDA calculated as 9/30/16 LTM Adjusted EBITDA as disclosed in Virtus Investor Presentation. 23 |
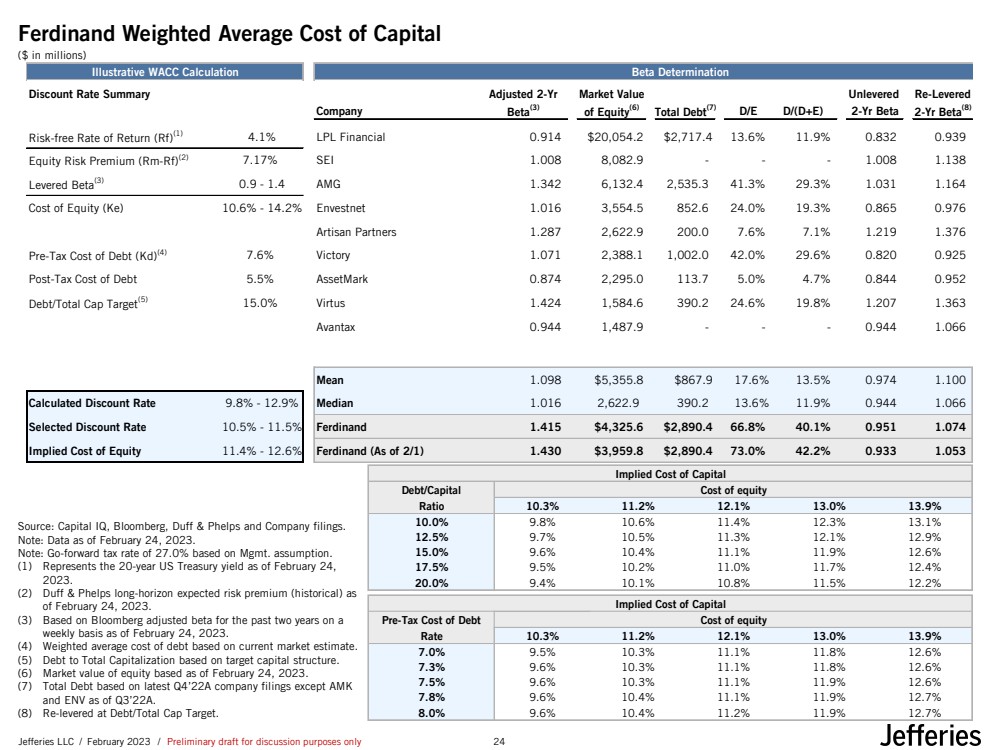
| Jefferies LLC / February 2023 / Preliminary draft for discussion purposes only Ferdinand Weighted Average Cost of Capital ($ in millions) Source: Capital IQ, Bloomberg, Duff & Phelps and Company filings. Note: Data as of February 24, 2023. Note: Go-forward tax rate of 27.0% based on Mgmt. assumption. (1) Represents the 20-year US Treasury yield as of February 24, 2023. (2) Duff & Phelps long-horizon expected risk premium (historical) as of February 24, 2023. (3) Based on Bloomberg adjusted beta for the past two years on a weekly basis as of February 24, 2023. (4) Weighted average cost of debt based on current market estimate. (5) Debt to Total Capitalization based on target capital structure. (6) Market value of equity based as of February 24, 2023. (7) Total Debt based on latest Q4’22A company filings except AMK and ENV as of Q3’22A. (8) Re-levered at Debt/Total Cap Target. Illustrative WACC Calculation Beta Determination Discount Rate Summary Adjusted 2-Yr Market Value Unlevered Re-Levered Company Beta(3) of Equity(6) Total Debt(7) D/E D/(D+E) 2-Yr Beta 2-Yr Beta(8) Risk-free Rate of Return (Rf)(1) 4.1% LPL Financial 0.914 $20,054.2 $2,717.4 13.6% 11.9% 0.832 0.939 Equity Risk Premium (Rm-Rf)(2) 7.17% SEI 1.008 8,082.9 - - - 1.008 1.138 Levered Beta(3) 0.9 - 1.4 AMG 1.342 6,132.4 2,535.3 41.3% 29.3% 1.031 1.164 Cost of Equity (Ke) 10.6% - 14.2% Envestnet 1.016 3,554.5 852.6 24.0% 19.3% 0.865 0.976 Artisan Partners 1.287 2,622.9 200.0 7.6% 7.1% 1.219 1.376 Pre-Tax Cost of Debt (Kd)(4) 7.6% Victory 1.071 2,388.1 1,002.0 42.0% 29.6% 0.820 0.925 Post-Tax Cost of Debt 5.5% AssetMark 0.874 2,295.0 113.7 5.0% 4.7% 0.844 0.952 Debt/Total Cap Target(5) 15.0% Virtus 1.424 1,584.6 390.2 24.6% 19.8% 1.207 1.363 Avantax 0.944 1,487.9 - - - 0.944 1.066 Mean 1.098 $5,355.8 $867.9 17.6% 13.5% 0.974 1.100 Calculated Discount Rate 9.8% - 12.9% Median 1.016 2,622.9 390.2 13.6% 11.9% 0.944 1.066 Selected Discount Rate 10.5% - 11.5% Ferdinand 1.415 $4,325.6 $2,890.4 66.8% 40.1% 0.951 1.074 Implied Cost of Equity 11.4% - 12.6% Ferdinand (As of 2/1) 1.430 $3,959.8 $2,890.4 73.0% 42.2% 0.933 1.053 Implied Cost of Capital Debt/Capital Cost of equity Ratio 10.3% 11.2% 12.1% 13.0% 13.9% 10.0% 9.8% 10.6% 11.4% 12.3% 13.1% 12.5% 9.7% 10.5% 11.3% 12.1% 12.9% 15.0% 9.6% 10.4% 11.1% 11.9% 12.6% 17.5% 9.5% 10.2% 11.0% 11.7% 12.4% 20.0% 9.4% 10.1% 10.8% 11.5% 12.2% Implied Cost of Capital Pre-Tax Cost of Debt Cost of equity Rate 10.3% 11.2% 12.1% 13.0% 13.9% 7.0% 9.5% 10.3% 11.1% 11.8% 12.6% 7.3% 9.6% 10.3% 11.1% 11.8% 12.6% 7.5% 9.6% 10.3% 11.1% 11.9% 12.6% 7.8% 9.6% 10.4% 11.1% 11.9% 12.7% 8.0% 9.6% 10.4% 11.2% 11.9% 12.7% 24 |
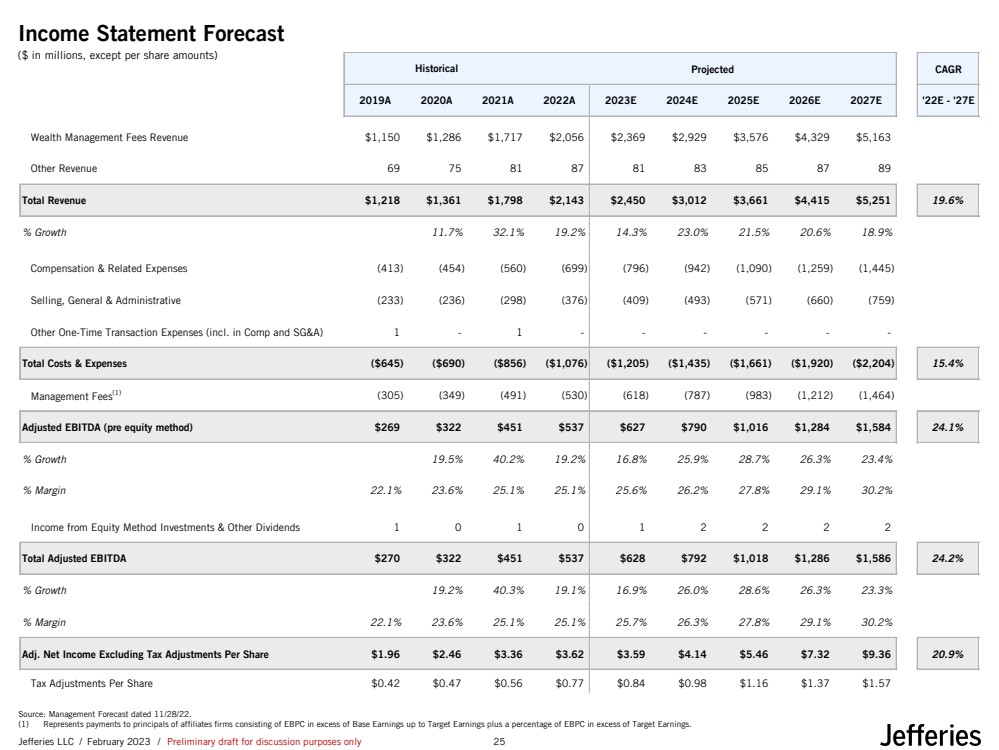
| Jefferies LLC / February 2023 / Preliminary draft for discussion purposes only Projected CAGR 2019A 2020A 2021A 2022A 2023E 2024E 2025E 2026E 2027E '22E - '27E Wealth Management Fees Revenue $1,150 $1,286 $1,717 $2,056 $2,369 $2,929 $3,576 $4,329 $5,163 Other Revenue 69 75 81 87 81 83 85 87 89 Total Revenue $1,218 $1,361 $1,798 $2,143 $2,450 $3,012 $3,661 $4,415 $5,251 19.6% % Growth 11.7% 32.1% 19.2% 14.3% 23.0% 21.5% 20.6% 18.9% Compensation & Related Expenses (413) (454) (560) (699) (796) (942) (1,090) (1,259) (1,445) Selling, General & Administrative (233) (236) (298) (376) (409) (493) (571) (660) (759) Other One-Time Transaction Expenses (incl. in Comp and SG&A) 1 - 1 - - - - - - Total Costs & Expenses ($645) ($690) ($856) ($1,076) ($1,205) ($1,435) ($1,661) ($1,920) ($2,204) 15.4% Management Fees(1) (305) (349) (491) (530) (618) (787) (983) (1,212) (1,464) Adjusted EBITDA (pre equity method) $269 $322 $451 $537 $627 $790 $1,016 $1,284 $1,584 24.1% % Growth 19.5% 40.2% 19.2% 16.8% 25.9% 28.7% 26.3% 23.4% % Margin 22.1% 23.6% 25.1% 25.1% 25.6% 26.2% 27.8% 29.1% 30.2% Income from Equity Method Investments & Other Dividends 1 0 1 0 1 2 2 2 2 Total Adjusted EBITDA $270 $322 $451 $537 $628 $792 $1,018 $1,286 $1,586 24.2% % Growth 19.2% 40.3% 19.1% 16.9% 26.0% 28.6% 26.3% 23.3% % Margin 22.1% 23.6% 25.1% 25.1% 25.7% 26.3% 27.8% 29.1% 30.2% Adj. Net Income Excluding Tax Adjustments Per Share $1.96 $2.46 $3.36 $3.62 $3.59 $4.14 $5.46 $7.32 $9.36 20.9% Tax Adjustments Per Share $0.42 $0.47 $0.56 $0.77 $0.84 $0.98 $1.16 $1.37 $1.57 Historical Income Statement Forecast Source: Management Forecast dated 11/28/22. (1) Represents payments to principals of affiliates firms consisting of EBPC in excess of Base Earnings up to Target Earnings plus a percentage of EBPC in excess of Target Earnings. ($ in millions, except per share amounts) 25 |
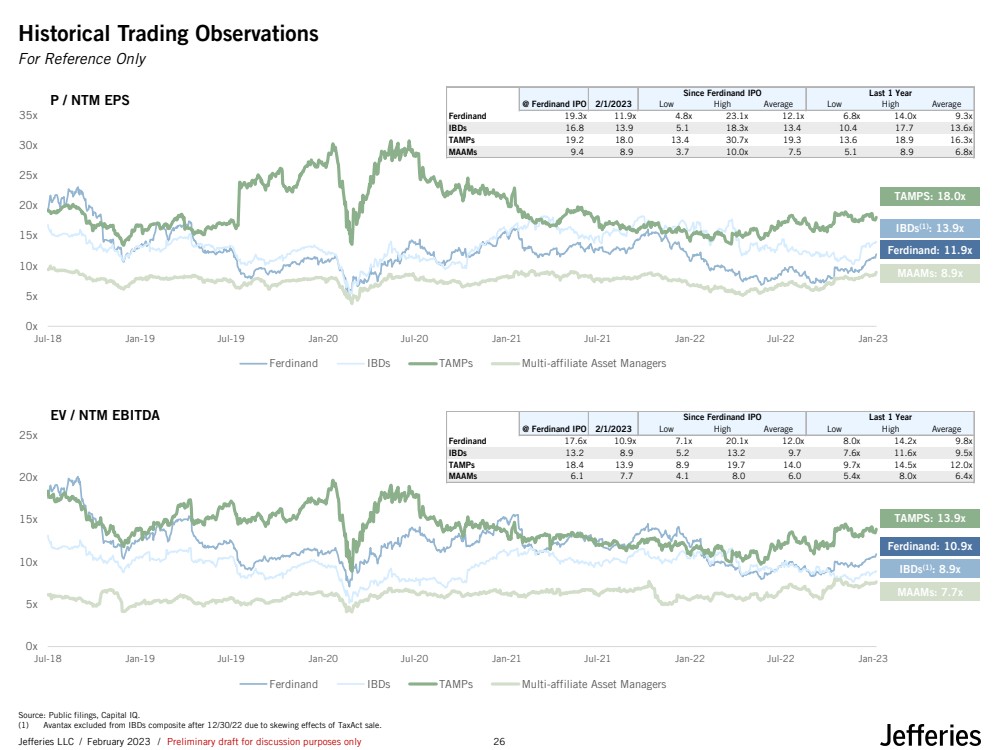
| Jefferies LLC / February 2023 / Preliminary draft for discussion purposes only Historical Trading Observations 0x 5x 10x 15x 20x 25x Jul-18 Jan-19 Jul-19 Jan-20 Jul-20 Jan-21 Jul-21 Jan-22 Jul-22 Jan-23 Ferdinand IBDs TAMPs Multi-affiliate Asset Managers TAMPS: 13.9x Ferdinand: 10.9x MAAMs: 7.7x IBDs(1): 8.9x 0x 5x 10x 15x 20x 25x 30x 35x Jul-18 Jan-19 Jul-19 Jan-20 Jul-20 Jan-21 Jul-21 Jan-22 Jul-22 Jan-23 Ferdinand IBDs TAMPs Multi-affiliate Asset Managers TAMPS: 18.0x Ferdinand: 11.9x MAAMs: 8.9x IBDs(1): 13.9x EV / NTM EBITDA P / NTM EPS Source: Public filings, Capital IQ. (1) Avantax excluded from IBDs composite after 12/30/22 due to skewing effects of TaxAct sale. Since Ferdinand IPO Last 1 Year @ Ferdinand IPO 2/1/2023 Low High Average Low High Average Ferdinand 19.3x 11.9x 4.8x 23.1x 12.1x 6.8x 14.0x 9.3x IBDs 16.8 13.9 5.1 18.3x 13.4 10.4 17.7 13.6x TAMPs 19.2 18.0 13.4 30.7x 19.3 13.6 18.9 16.3x MAAMs 9.4 8.9 3.7 10.0x 7.5 5.1 8.9 6.8x Since Ferdinand IPO Last 1 Year @ Ferdinand IPO 2/1/2023 Low High Average Low High Average Ferdinand 17.6x 10.9x 7.1x 20.1x 12.0x 8.0x 14.2x 9.8x IBDs 13.2 8.9 5.2 13.2 9.7 7.6x 11.6x 9.5x TAMPs 18.4 13.9 8.9 19.7 14.0 9.7x 14.5x 12.0x MAAMs 6.1 7.7 4.1 8.0 6.0 5.4x 8.0x 6.4x For Reference Only 26 |
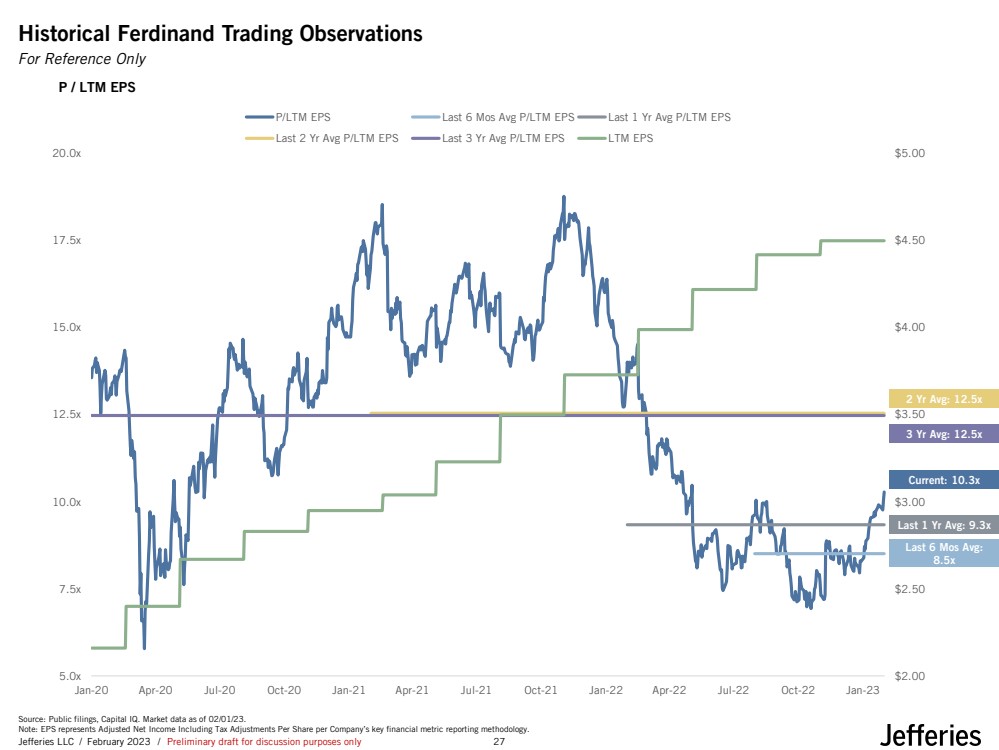
| Jefferies LLC / February 2023 / Preliminary draft for discussion purposes only Historical Ferdinand Trading Observations $2.00 $2.50 $3.00 $3.50 $4.00 $4.50 $5.00 5.0x 7.5x 10.0x 12.5x 15.0x 17.5x 20.0x Jan-20 Apr-20 Jul-20 Oct-20 Jan-21 Apr-21 Jul-21 Oct-21 Jan-22 Apr-22 Jul-22 Oct-22 Jan-23 P/LTM EPS Last 6 Mos Avg P/LTM EPS Last 1 Yr Avg P/LTM EPS Last 2 Yr Avg P/LTM EPS Last 3 Yr Avg P/LTM EPS LTM EPS Last 6 Mos Avg: 8.5x 3 Yr Avg: 12.5x Last 1 Yr Avg: 9.3x P / LTM EPS Source: Public filings, Capital IQ. Market data as of 02/01/23. Note: EPS represents Adjusted Net Income Including Tax Adjustments Per Share per Company’s key financial metric reporting methodology. 2 Yr Avg: 12.5x Current: 10.3x For Reference Only 27 |
| Jefferies LLC / February 2023 / Preliminary draft for discussion purposes only Ferdinand is the Only Publicly Traded RIA Roll-Up Platform Ferdinand Integrated Roll-Ups Independent Broker Dealer (“IBD”) Ownership ▪ Public ▪ Sponsor-backed (minority and majority) ▪ Public and sponsor-owned Acquisition Economics and Deal Structure ▪ Acquire substantially all assets but only 40-60% of Target economics ▪ Enter into management agreement with Target partners for multi-year term with non-competes) ▪ Maintain a preferred position in Target economics (provides downside protection) ▪ Typically acquire 100% assets and economics, mix of cash and stock (majority cash) consideration ▪ ~25-50% deferred consideration based on asset retention and growth (provides downside protection) ▪ IBD platform acquisitions – acquire 100% assets and economics ▪ Advisor recruitment: offer multi-year forgivable loans to independent advisors to join BD Level of Integration ▪ Does not integrate; affiliates maintain brand and independence ▪ Offer value-add services to affiliates (including marketing, business development, and M&A expertise) ▪ Leverage platform scale through cash, credit and trust solutions to all affiliates ▪ Full systematic integration ▪ Standardized modular deliverables to ensure consistent client outcomes ▪ Integrated technology, systems and back-office ▪ Sometimes keep brand ▪ Full integration on back-end: tech-stack and solutions, back-office and support functions Cost Synergies ▪ Minimal post-acquisition cost synergies from new partner firms ▪ Able to capture cost synergies from acquisitions by partner firms ▪ Achieve post-acquisition cost synergies from technology, back-office and support function integration ▪ Achieve post-acquisition cost synergies from integration (high probability) ▪ Guaranteed revenue synergies from new advisor platform fees, cash spread EBITDA Margins ▪ ~25% ▪ ~30-50% ▪ ~10-20% ▪ Tend to be lower since advisor-generated revenue payout > 90% Leverage ▪ ~4.0x-4.5x ▪ ~5.0x-7.0x ▪ ~2.0x (public) - 4.5x (sponsor-owned) Examples ▪ Public ▪ Private Comparison of Business Models 28 |

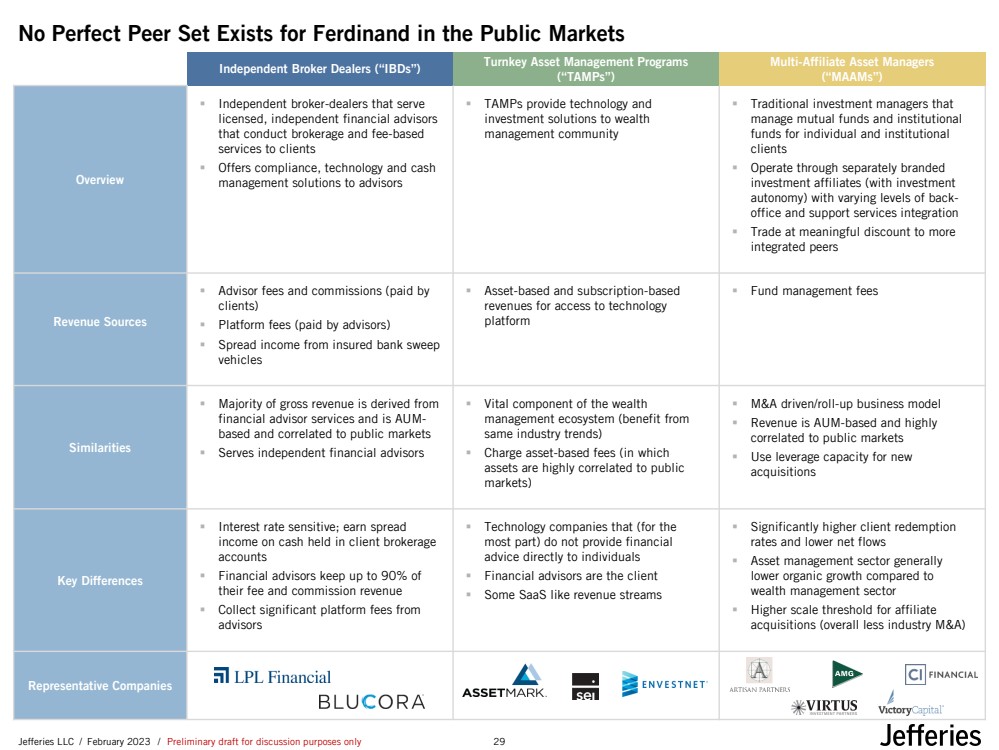
| Jefferies LLC / February 2023 / Preliminary draft for discussion purposes only No Perfect Peer Set Exists for Ferdinand in the Public Markets Independent Broker Dealers (“IBDs”) Turnkey Asset Management Programs (“TAMPs”) Multi-Affiliate Asset Managers (“MAAMs”) Overview ▪ Independent broker-dealers that serve licensed, independent financial advisors that conduct brokerage and fee-based services to clients ▪ Offers compliance, technology and cash management solutions to advisors ▪ TAMPs provide technology and investment solutions to wealth management community ▪ Traditional investment managers that manage mutual funds and institutional funds for individual and institutional clients ▪ Operate through separately branded investment affiliates (with investment autonomy) with varying levels of back-office and support services integration ▪ Trade at meaningful discount to more integrated peers Revenue Sources ▪ Advisor fees and commissions (paid by clients) ▪ Platform fees (paid by advisors) ▪ Spread income from insured bank sweep vehicles ▪ Asset-based and subscription-based revenues for access to technology platform ▪ Fund management fees Similarities ▪ Majority of gross revenue is derived from financial advisor services and is AUM-based and correlated to public markets ▪ Serves independent financial advisors ▪ Vital component of the wealth management ecosystem (benefit from same industry trends) ▪ Charge asset-based fees (in which assets are highly correlated to public markets) ▪ M&A driven/roll-up business model ▪ Revenue is AUM-based and highly correlated to public markets ▪ Use leverage capacity for new acquisitions Key Differences ▪ Interest rate sensitive; earn spread income on cash held in client brokerage accounts ▪ Financial advisors keep up to 90% of their fee and commission revenue ▪ Collect significant platform fees from advisors ▪ Technology companies that (for the most part) do not provide financial advice directly to individuals ▪ Financial advisors are the client ▪ Some SaaS like revenue streams ▪ Significantly higher client redemption rates and lower net flows ▪ Asset management sector generally lower organic growth compared to wealth management sector ▪ Higher scale threshold for affiliate acquisitions (overall less industry M&A) Representative Companies 29 |