
Q4 and Full Year 2018 Earnings Call February 2019
Forward-Looking Statements This presentation and responses to various questions contain forward-looking statements within the meaning of Section 27A of the Securities Act of 1933, as amended, and Section 21E of the Securities Exchange Act of 1934, as amended. The forward-looking statements present our current expectations and projections relating to our business, financial condition and results of operations, and do not refer to historical or current facts. These statements may include words such as “anticipate,” “estimate,” “expect,” “project,” “plan,” “intend,” “believe,” “may,” “will,” “should,” “likely” and other words and terms of similar meaning. The forward-looking statements include statements regarding: our future financial performance including our outlook for full fiscal year 2019; our expectation that our new credit models will be rolled out in the first half of 2019 and that our partner credit models and strategies will be rolled out in the first half of 2019; our perspectives on 2019, including our expectations regarding revenue, growth rate of revenue, net charge-offs, gross margin, operating expenses, operating margins, Adjusted EBITDA, net income, loan loss provision, direct marketing and other cost of sales and Adjusted EBITDA margin; our expectations regarding regulatory trends; our expectations regarding the cumulative loss rate as a percentage of originations for the 2018 vintage; our growth strategies and our ability to effectively manage that growth; anticipated key marketing and underwriting initiatives; new and expanded products like a lower-priced installment product in the UK; our expectations regarding the future expansion of the states in which our products are offered; the cost of customer acquisition, new customer originations, the efficacy and cost of our marketing efforts, our plan to maintain our UK portfolio balances through the second half of 2019 in advance of regulatory clarity on complaints; expanded marketing channels and new and growing marketing partnerships; continued growth and investment in data science and analytics; and additional bank partnerships. Forward‐looking statements involve certain risks and uncertainties, and actual results may differ materially from those discussed in any such statement. These risks and uncertainties include, but are not limited to: the Company’s limited operating history in an evolving industry; new laws and regulations in the consumer lending industry in many jurisdictions that could restrict the consumer lending products and services the Company offers, impose additional compliance costs on the Company, render the Company’s current operations unprofitable or even prohibit the Company’s current operations; scrutiny by regulators and payment processors of certain online lenders’ access to the Automated Clearing House system to disburse and collect loan proceeds and repayments; a lack of sufficient debt financing at acceptable prices or disruptions in the credit markets; the impact of competition in our industry and innovation by our competitors; our ability to prevent security breaches, disruption in service and comparable events that could compromise the personal and confidential information held in our data systems, reduce the attractiveness of our platform or adversely impact our ability to service loans; customer complaints or negative public perception could harm our business and other risks related to litigation, compliance and regulation. Additional factors that could cause actual results to differ are discussed under the heading "Risk Factors" and in other sections of the most recent Quarterly Report on Form 10-Q and in the Company's other current and periodic reports filed from time to time with the SEC. All written and oral forward-looking statements attributable to us, or persons acting on our behalf, are expressly qualified in their entirety by the cautionary statements regarding risks and uncertainties that are included in our public communications. You should evaluate all forward-looking statements made in this presentation in the context of these risks and uncertainties. Neither we nor any of our respective agents, employees or advisors intend or have any duty or obligation to supplement, amend, update or revise any of the forward-looking statements contained in this presentation. This presentation also contains estimates and other statistical data made by independent parties and by us relating to market size and growth and other data about our industry. This data involves a number of assumptions and limitations, and you are cautioned not to give undue weight to such estimates. Neither we nor any other person makes any representation as to the accuracy or completeness of such data or undertakes any obligation to update such data after the date of this presentation. In addition, projections, assumptions and estimates of our future performance and the future performance of the markets in which we operate are necessarily subject to a high degree of uncertainty and risk. The information and opinions contained in this presentation are provided as of the date of this presentation and are subject to change without notice. This presentation has not been approved by any regulatory or supervisory agency. See Appendix for additional information and definitions. 2

Elevate is reinventing non-prime credit with online products that provide financial relief today, and help people build a brighter financial future. So far, we’ve originated $6.7 billion to 2.2 million customers1 and saved them more than $4.8 billion over payday loans2 33
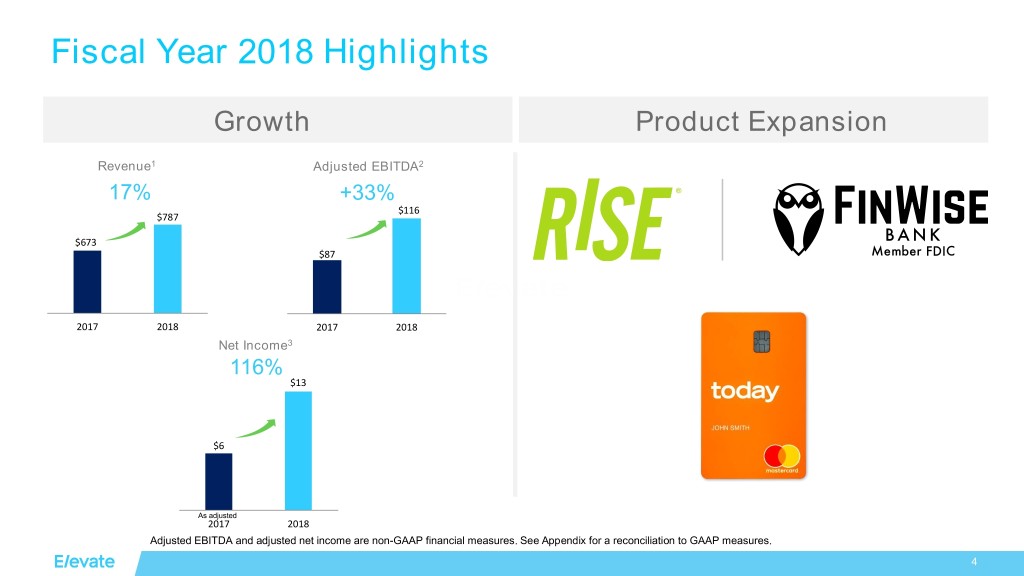
Fiscal Year 2018 Highlights Growth Product Expansion Revenue1 Adjusted EBITDA2 17% +33% $116 $787 $673 $87 2017 2018 2017 2018 Net Income3 116% $13 $6 As adjusted 2017 2018 Adjusted EBITDA and adjusted net income are non-GAAP financial measures. See Appendix for a reconciliation to GAAP measures. 4

Headway on 2018 Challenges Issue Status Delays in new credit Developed and being rolled out in 1H 2019 models & strategies Expansion of partner Partner credit models and strategies developed channels and being rolled out over 1H 2019 Lower complaint volumes, still looking for UK Complaints regulatory clarity 5
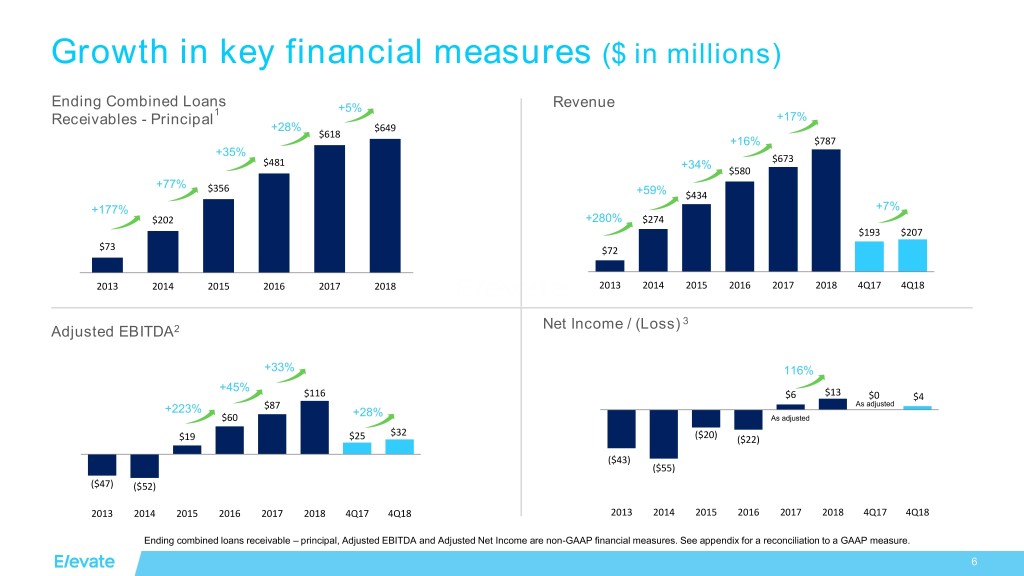
Growth in key financial measures ($ in millions) Ending Combined Loans Revenue 1 +5% Receivables - Principal +17% +28% $649 $618 +16% $787 +35% $481 +34% $673 $580 +77% $356 +59% $434 +177% +7% $202 +280% $274 $193 $207 $73 $72 2013 2014 2015 2016 2017 2018 2013 2014 2015 2016 2017 2018 4Q17 4Q18 Net Income / (Loss) 3 Adjusted EBITDA2 +33% 116% +45% $116 $6 $13 $0 $4 $87 As adjusted +223% +28% $60 As adjusted $32 $19 $25 ($20) ($22) ($43) ($55) ($47) ($52) 2013 2014 2015 2016 2017 2018 4Q17 4Q18 2013 2014 2015 2016 2017 2018 4Q17 4Q18 Ending combined loans receivable – principal, Adjusted EBITDA and Adjusted Net Income are non-GAAP financial measures. See appendix for a reconciliation to a GAAP measure. 6

Stable credit quality and customer acquisition costs Cumulative principal loss rates as a % of originations Customer Acquisition Costs by loan vintage $350 35% 30% $297 $300 25% $255 $256 $245 $250 20% 2017 2018 $235 $237 15% $200 10% $150 5% 0% $100 0 2 4 6 8 10 12 14 16 18 20 22 24 26 28 30 32 34 36 38 40 2013 2014 2015 2016 2017 2018 Months since origination 2013 2014 2015 2016 2017 2018 CAC Bottom Target Range $250 Top Target Range $300 2018 loan vintage is not yet fully matured. 7

Continued margin expansion % of Gross Revenues 2015 2016 2017 2018 LT Target Gross Revenue 100% 100% 100% 100% 100% Loan Loss Provision 54% 55% 53% 52% 50% Direct Marketing and 18% 14% 14% 13% 10% Other Cost of Sales Gross Margin 29% 31% 33% 35% 40% Operating Expenses 25% 21% 20% 20% 20% Adjusted EBITDA 1 4% 10% 13% 15% 20% Margin Adjusted EBITDA margin is a non-GAAP financial measure. See Appendix for a reconciliation to GAAP measure. 8
Amended Credit Facilities with Victory Park Capital • Significant reduction in cost of capital to LIBOR +7.5% from LIBOR +13% • New funds locked at 10.3% for existing $530 million of debt for five years • Total size of facilities increases to more than $1B ($500 million in availability) including new facility (SPV) for FinWise • 20% revolver component every Q1 (allows us to paydown during Q1 seasonality and reborrow at later time) • $2.4 million amendment fee in Q1 (no other prepayment penalty) See press release: “Elevate Announces Amended Credit Facilities with Victory Park Capital” February 11, 2018 9
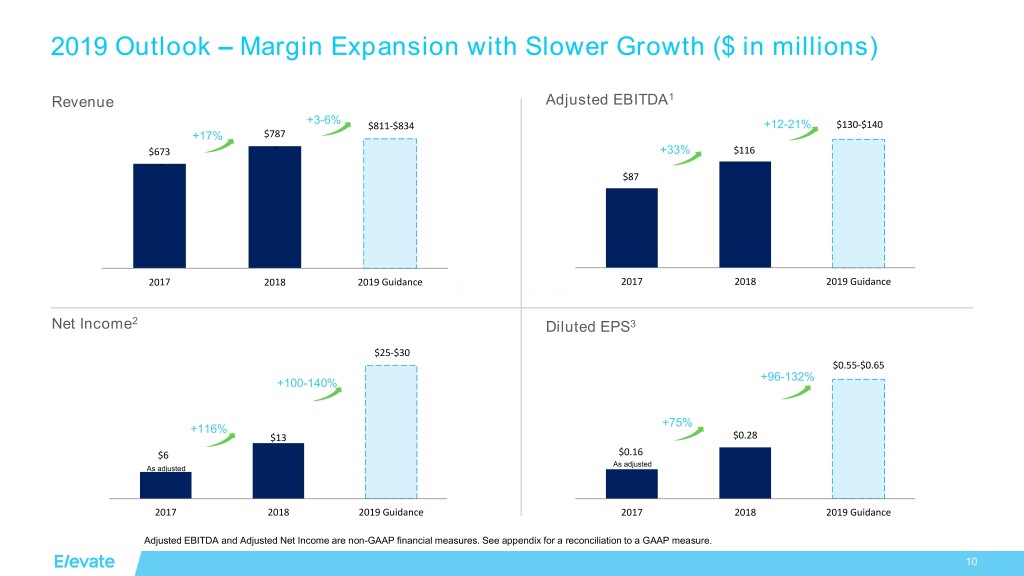
2019 Outlook – Margin Expansion with Slower Growth ($ in millions) Revenue Adjusted EBITDA1 +3-6% $811-$834 +12-21% $130-$140 +17% $787 - $673 +33% $116 - $87 2017 2018 2019 Guidance 2017 2018 2019 Guidance Net Income2 Diluted EPS3 $25-$30 $0.55-$0.65 +96-132% +100-140% +75% +116% $13 $0.28 $6 $0.16 As adjusted As adjusted 2017 2018 2019 Guidance 2017 2018 2019 Guidance Adjusted EBITDA and Adjusted Net Income are non-GAAP financial measures. See appendix for a reconciliation to a GAAP measure. 10
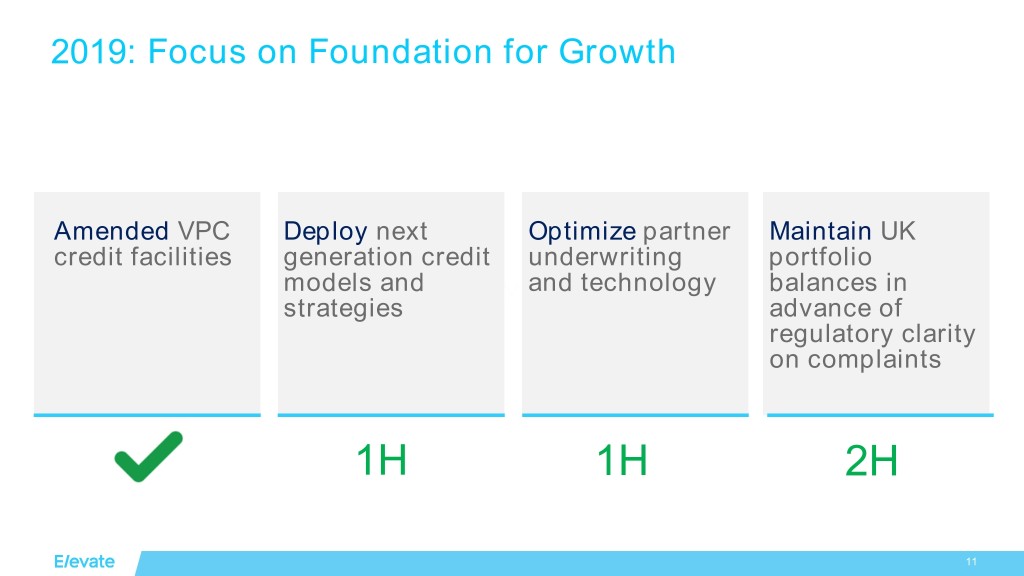
2019: Focus on Foundation for Growth Amended VPC Deploy next Optimize partner Maintain UK credit facilities generation credit underwriting portfolio models and and technology balances in strategies advance of regulatory clarity on complaints 1H 1H 2H 11
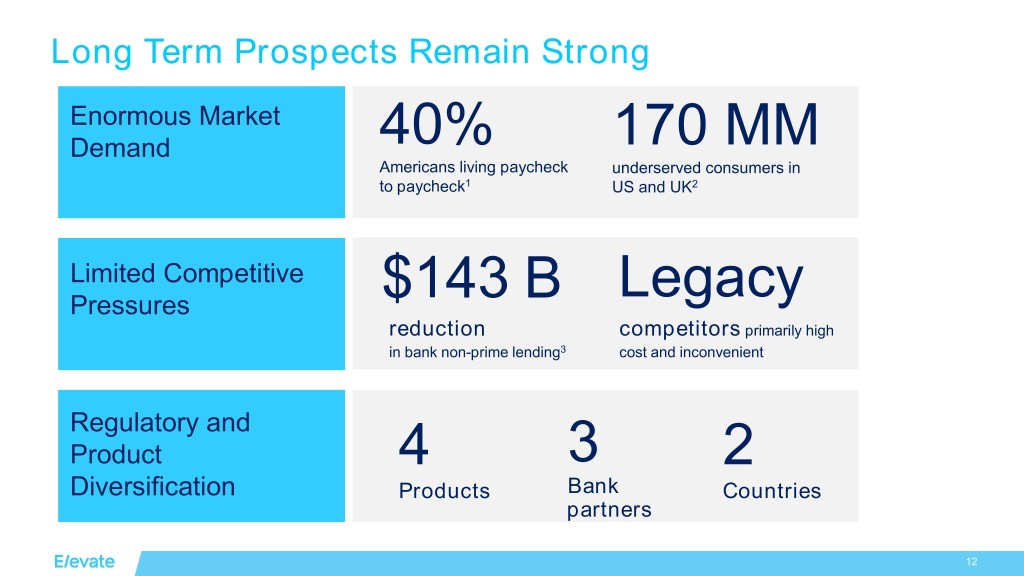
Long Term Prospects Remain Strong Enormous Market Demand 40% 170 MM Americans living paycheck underserved consumers in to paycheck1 US and UK2 Limited Competitive Pressures $143 B Legacy reduction competitors primarily high in bank non-prime lending3 cost and inconvenient Regulatory and Product 4 3 2 Diversification Products Bank Countries partners 12

We believe everyone deserves a lift. 1313

Appendix 14
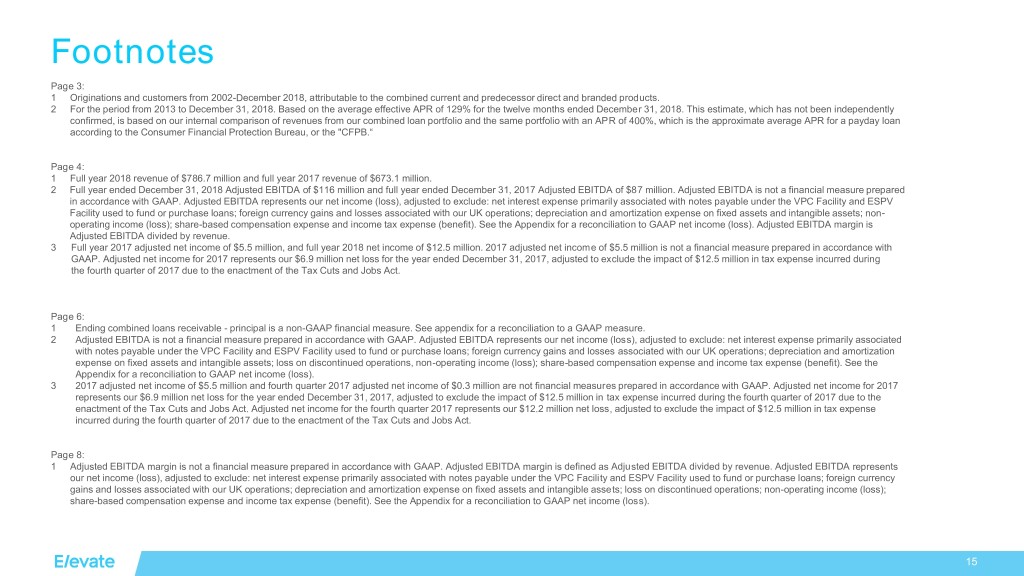
Footnotes Page 3: 1 Originations and customers from 2002-December 2018, attributable to the combined current and predecessor direct and branded products. 2 For the period from 2013 to December 31, 2018. Based on the average effective APR of 129% for the twelve months ended December 31, 2018. This estimate, which has not been independently confirmed, is based on our internal comparison of revenues from our combined loan portfolio and the same portfolio with an APR of 400%, which is the approximate average APR for a payday loan according to the Consumer Financial Protection Bureau, or the "CFPB.“ Page 4: 1 Full year 2018 revenue of $786.7 million and full year 2017 revenue of $673.1 million. 2 Full year ended December 31, 2018 Adjusted EBITDA of $116 million and full year ended December 31, 2017 Adjusted EBITDA of $87 million. Adjusted EBITDA is not a financial measure prepared in accordance with GAAP. Adjusted EBITDA represents our net income (loss), adjusted to exclude: net interest expense primarily associated with notes payable under the VPC Facility and ESPV Facility used to fund or purchase loans; foreign currency gains and losses associated with our UK operations; depreciation and amortization expense on fixed assets and intangible assets; non- operating income (loss); share-based compensation expense and income tax expense (benefit). See the Appendix for a reconciliation to GAAP net income (loss). Adjusted EBITDA margin is Adjusted EBITDA divided by revenue. 3 Full year 2017 adjusted net income of $5.5 million, and full year 2018 net income of $12.5 million. 2017 adjusted net income of $5.5 million is not a financial measure prepared in accordance with GAAP. Adjusted net income for 2017 represents our $6.9 million net loss for the year ended December 31, 2017, adjusted to exclude the impact of $12.5 million in tax expense incurred during the fourth quarter of 2017 due to the enactment of the Tax Cuts and Jobs Act. Page 6: 1 Ending combined loans receivable - principal is a non-GAAP financial measure. See appendix for a reconciliation to a GAAP measure. 2 Adjusted EBITDA is not a financial measure prepared in accordance with GAAP. Adjusted EBITDA represents our net income (loss), adjusted to exclude: net interest expense primarily associated with notes payable under the VPC Facility and ESPV Facility used to fund or purchase loans; foreign currency gains and losses associated with our UK operations; depreciation and amortization expense on fixed assets and intangible assets; loss on discontinued operations, non-operating income (loss); share-based compensation expense and income tax expense (benefit). See the Appendix for a reconciliation to GAAP net income (loss). 3 2017 adjusted net income of $5.5 million and fourth quarter 2017 adjusted net income of $0.3 million are not financial measures prepared in accordance with GAAP. Adjusted net income for 2017 represents our $6.9 million net loss for the year ended December 31, 2017, adjusted to exclude the impact of $12.5 million in tax expense incurred during the fourth quarter of 2017 due to the enactment of the Tax Cuts and Jobs Act. Adjusted net income for the fourth quarter 2017 represents our $12.2 million net loss, adjusted to exclude the impact of $12.5 million in tax expense incurred during the fourth quarter of 2017 due to the enactment of the Tax Cuts and Jobs Act. Page 8: 1 Adjusted EBITDA margin is not a financial measure prepared in accordance with GAAP. Adjusted EBITDA margin is defined as Adjusted EBITDA divided by revenue. Adjusted EBITDA represents our net income (loss), adjusted to exclude: net interest expense primarily associated with notes payable under the VPC Facility and ESPV Facility used to fund or purchase loans; foreign currency gains and losses associated with our UK operations; depreciation and amortization expense on fixed assets and intangible assets; loss on discontinued operations; non-operating income (loss); share-based compensation expense and income tax expense (benefit). See the Appendix for a reconciliation to GAAP net income (loss). 15

Footnotes (continued) Page 10: 1 Adjusted EBITDA is not a financial measure prepared in accordance with GAAP. Adjusted EBITDA represents our net income (loss), adjusted to exclude: net interest expense primarily associated with notes payable under the VPC Facility and ESPV Facility used to fund or purchase loans; foreign currency gains and losses associated with our UK operations; depreciation and amortization expense on fixed assets and intangible assets; non-operating income (loss); share-based compensation expense and income tax expense (benefit). See the Appendix for a reconciliation to GAAP net income (loss). 2 2017 adjusted net income of $5.5 million is not a financial measure prepared in accordance with GAAP. Adjusted net income for 2017 represents our $6.9 million net loss for the year ended December 31, 2017, adjusted to exclude the impact of $12.5 million in tax expense incurred during the fourth quarter of 2017 due to the enactment of the Tax Cuts and Jobs Act. 3 Adjusted diluted EPS for 2017 represents our $(0.20) diluted loss per share for the year ended December 31, 2017, adjusted to exclude the $0.36 per share impact of tax expense incurred during the fourth quarter of 2017 due to the enactment of the Tax Cuts and Jobs Act. Page 12: 1 According to the Federal Reserve’s Board Report on the Economic Well-Being of US Households in 2017. 2 According to our analysis based on CFSP report, “Data Point: Credit Invisibles.” May 2015 and 2018 Average US FICO data. 3 According to our analysis of master pool trust data of securitizations for the five major credit card issuers, we estimate that from 2008-2016, revolving credit US borrowers with FICO scores less than 680 was reduced by approximately $142 billion. 16

Non-GAAP financials reconciliation Adjusted EBITDA Reconciliation Three months ended December 31, For the years ended December 31, ($mm) 2018 2017 2018 2017 2016 2015 2014 2013 Net income (loss) $ 4 (12) $ 13 (7) (22) (20) (55) $ (45) Adjustments: Net interest expense 21 18 79 73 64 37 13 - Stock-based compensation 2 2 8 6 2 1 1 - Foreign currency transaction (gain) loss 1 - 2 (3) 9 2 1 - Depreciation and amortization 4 3 13 10 11 9 8 5 Non-operating expense (income) - - - (2) - (6) - (1) Income tax expense (benefit) - 14 1 10 (3) (5) (21) (9) Loss on discontinued operations - - - - - - - 2 Adjusted EBITDA $ 32 25 $ 116 87 60 19 (53) $ (47) Adjusted EBITDA Margin 15% 13% 15% 13% 10% 4% -19% -65% Adjusted EBITDA is a non-GAAP financial measure. The Company’s Adjusted EBITDA guidance does not include certain charges and costs. The adjustments in future periods are generally expected to be similar to the kinds of charges and costs excluded from Adjusted EBITDA in prior periods, such as the impact of income tax benefit or expense, non-operating income, foreign currency transaction gain or loss associated with our UK operations, net interest expense, stock-based compensation expense and depreciation and amortization expense, among others. The Company is not able to provide a reconciliation of the Company’s non-GAAP financial guidance to the corresponding GAAP measure without unreasonable effort because of the uncertainty and variability of the nature and amount of these future charges and costs. 17
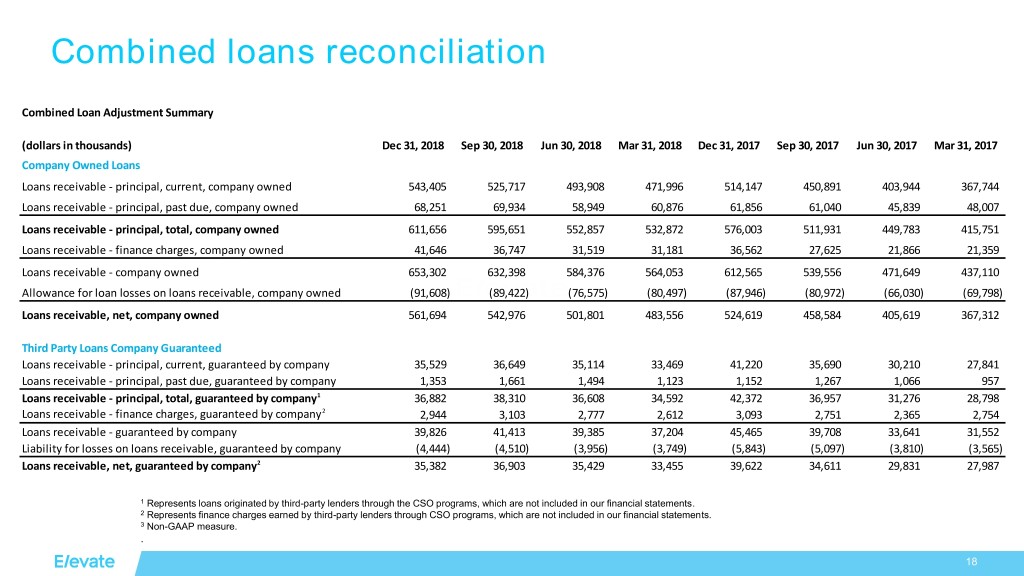
Combined loans reconciliation Combined Loan Adjustment Summary (dollars in thousands) Dec 31, 2018 Sep 30, 2018 Jun 30, 2018 Mar 31, 2018 Dec 31, 2017 Sep 30, 2017 Jun 30, 2017 Mar 31, 2017 Company Owned Loans Loans receivable - principal, current, company owned 543,405 525,717 493,908 471,996 514,147 450,891 403,944 367,744 Loans receivable - principal, past due, company owned 68,251 69,934 58,949 60,876 61,856 61,040 45,839 48,007 Loans receivable - principal, total, company owned 611,656 595,651 552,857 532,872 576,003 511,931 449,783 415,751 Loans receivable - finance charges, company owned 41,646 36,747 31,519 31,181 36,562 27,625 21,866 21,359 Loans receivable - company owned 653,302 632,398 584,376 564,053 612,565 539,556 471,649 437,110 Allowance for loan losses on loans receivable, company owned (91,608) (89,422) (76,575) (80,497) (87,946) (80,972) (66,030) (69,798) Loans receivable, net, company owned 561,694 542,976 501,801 483,556 524,619 458,584 405,619 367,312 Third Party Loans Company Guaranteed Loans receivable - principal, current, guaranteed by company 35,529 36,649 35,114 33,469 41,220 35,690 30,210 27,841 Loans receivable - principal, past due, guaranteed by company 1,353 1,661 1,494 1,123 1,152 1,267 1,066 957 Loans receivable - principal, total, guaranteed by company1 36,882 38,310 36,608 34,592 42,372 36,957 31,276 28,798 Loans receivable - finance charges, guaranteed by company2 2,944 3,103 2,777 2,612 3,093 2,751 2,365 2,754 Loans receivable - guaranteed by company 39,826 41,413 39,385 37,204 45,465 39,708 33,641 31,552 Liability for losses on loans receivable, guaranteed by company (4,444) (4,510) (3,956) (3,749) (5,843) (5,097) (3,810) (3,565) Loans receivable, net, guaranteed by company2 35,382 36,903 35,429 33,455 39,622 34,611 29,831 27,987 1 Represents loans originated by third-party lenders through the CSO programs, which are not included in our financial statements. 2 Represents finance charges earned by third-party lenders through CSO programs, which are not included in our financial statements. 3 Non-GAAP measure. . 18

Combined loans reconciliation (continued) Combined Loan Adjustment Summary (dollars in thousands) Dec 31, 2018 Sep 30, 2018 Jun 30, 2018 Mar 31, 2018 Dec 31, 2017 Sep 30, 2017 Jun 30, 2017 Mar 31, 2017 Combined Loans Receivable3 Combined loans receivable - principal, current 578,934 562,366 529,022 505,465 555,367 486,581 434,154 395,585 Combined loans receivable - principal, past due 69,604 71,595 60,443 61,999 63,008 62,307 46,905 48,964 Combined loans receivable - principal 648,538 633,961 589,465 567,464 618,375 548,888 481,059 444,549 Combined loans receivable - finance charges 44,590 39,850 34,296 33,793 39,655 30,376 24,231 24,113 Combined loans receivable 693,128 673,811 623,761 601,257 658,030 579,264 505,290 468,662 Combined Loan Loss Reserve3 Allowance for loan losses on loans receivable, company owned (91,608) (89,422) (76,575) (80,497) (87,946) (80,972) (66,030) (69,798) Liability for losses on loans receivable, guaranteed by company (4,444) (4,510) (3,956) (3,749) (5,843) (5,097) (3,810) (3,565) Combined loan loss reserve (96,052) (93,932) (80,531) (84,246) (93,789) (86,069) (69,840) (73,363) 1 Represents loans originated by third-party lenders through the CSO programs, which are not included in our financial statements. 2 Represents finance charges earned by third-party lenders through CSO programs, which are not included in our financial statements. 3 Non-GAAP measure. . 19

© 2017 Elevate. All Rights Reserved.


