
Second Quarter 2019 Earnings Call July 2019
Forward-Looking Statements This presentation and responses to various questions contain forward-looking statements within the meaning of Section 27A of the Securities Act of 1933, as amended, and Section 21E of the Securities Exchange Act of 1934, as amended. The forward-looking statements present our current expectations and projections relating to our business, financial condition and results of operations, and do not refer to historical or current facts. These statements may include words such as “anticipate,” “estimate,” “expect,” “project,” “plan,” “intend,” “believe,” “may,” “will,” “should,” “likely” and other words and terms of similar meaning. The forward-looking statements include statements regarding: our future financial performance including our outlook for full fiscal year 2019; our expectation that our new credit models will be rolled out in 2019 and that our partner credit models and strategies will be rolled out in 2019; our perspectives on 2019, including our expectations regarding revenue, growth rate of revenue, net charge-offs, gross margin, operating expenses, operating margins, Adjusted EBITDA, net income, loan loss provision, direct marketing and other cost of sales and Adjusted EBITDA margin; our expectations regarding regulatory trends; our expectations regarding the cumulative loss rate as a percentage of originations for the 2018 vintage; our growth strategies and our ability to effectively manage that growth; anticipated key marketing and underwriting initiatives; new and expanded products like a lower-priced installment product in the UK; our expectations regarding the future expansion of the states in which our products are offered; the cost of customer acquisition, new customer originations, the efficacy and cost of our marketing efforts, our plan to maintain our UK portfolio balances through the second half of 2019 in advance of regulatory clarity on complaints; expanded marketing channels and new and growing marketing partnerships; continued growth and investment in data science and analytics; and additional bank partnerships. Forward‐looking statements involve certain risks and uncertainties, and actual results may differ materially from those discussed in any such statement. These risks and uncertainties include, but are not limited to: the Company’s limited operating history in an evolving industry; new laws and regulations in the consumer lending industry in many jurisdictions that could restrict the consumer lending products and services the Company offers, impose additional compliance costs on the Company, render the Company’s current operations unprofitable or even prohibit the Company’s current operations; scrutiny by regulators and payment processors of certain online lenders’ access to the Automated Clearing House system to disburse and collect loan proceeds and repayments; a lack of sufficient debt financing at acceptable prices or disruptions in the credit markets; the impact of competition in our industry and innovation by our competitors; our ability to prevent security breaches, disruption in service and comparable events that could compromise the personal and confidential information held in our data systems, reduce the attractiveness of our platform or adversely impact our ability to service loans; customer complaints or negative public perception could harm our business and other risks related to litigation, compliance and regulation. Additional factors that could cause actual results to differ are discussed under the heading "Risk Factors" and in other sections of the most recent Form 10-Q and in the Company's other current and periodic reports filed from time to time with the SEC. All written and oral forward-looking statements attributable to us, or persons acting on our behalf, are expressly qualified in their entirety by the cautionary statements regarding risks and uncertainties that are included in our public communications. You should evaluate all forward-looking statements made in this presentation in the context of these risks and uncertainties. Neither we nor any of our respective agents, employees or advisors intend or have any duty or obligation to supplement, amend, update or revise any of the forward- looking statements contained in this presentation. This presentation also contains estimates and other statistical data made by independent parties and by us relating to market size and growth and other data about our industry. This data involves a number of assumptions and limitations, and you are cautioned not to give undue weight to such estimates. Neither we nor any other person makes any representation as to the accuracy or completeness of such data or undertakes any obligation to update such data after the date of this presentation. In addition, projections, assumptions and estimates of our future performance and the future performance of the markets in which we operate are necessarily subject to a high degree of uncertainty and risk. The information and opinions contained in this presentation are provided as of the date of this presentation and are subject to change without notice. This presentation has not been approved by any regulatory or supervisory agency. See Appendix for additional information and definitions. 2

Elevate is reinventing non-prime credit with online products that provide financial relief today, and help people build a brighter financial future. So far, we’ve originated $7.4 billion to 2.3 million customers1 and saved them more than $5.6 billion over payday loans2 33

Second Quarter 2019 Highlights • 87% YoY increase in Net Income • Strong credit quality – Near-record low past due loan balances – Annual 2019 charge-off curve is best in history • Low CAC of $229 – 12% lower than Q2 2018 • Continued Adjusted EBITDA margin expansion1 • Revenue and loans receivable-principal approximately flat with Q2 2018 4

Business Update Strategy priority 2019 Impact • Deployment of enhanced credit models complete Dedication to strong credit • YTD net charge-offs as a % of revenues are down to 45% from 50% a year ago • Driven by lower charge-off’s, lower CAC, and cost of capital reduction Margin expansion • Adjusted EBITDA1, Net Income and EPS guidance unchanged despite lowered revenue growth • New approach to measured growth in conjunction with confirming data from our credit models Measured growth • Addressable market opportunity remains significant 5
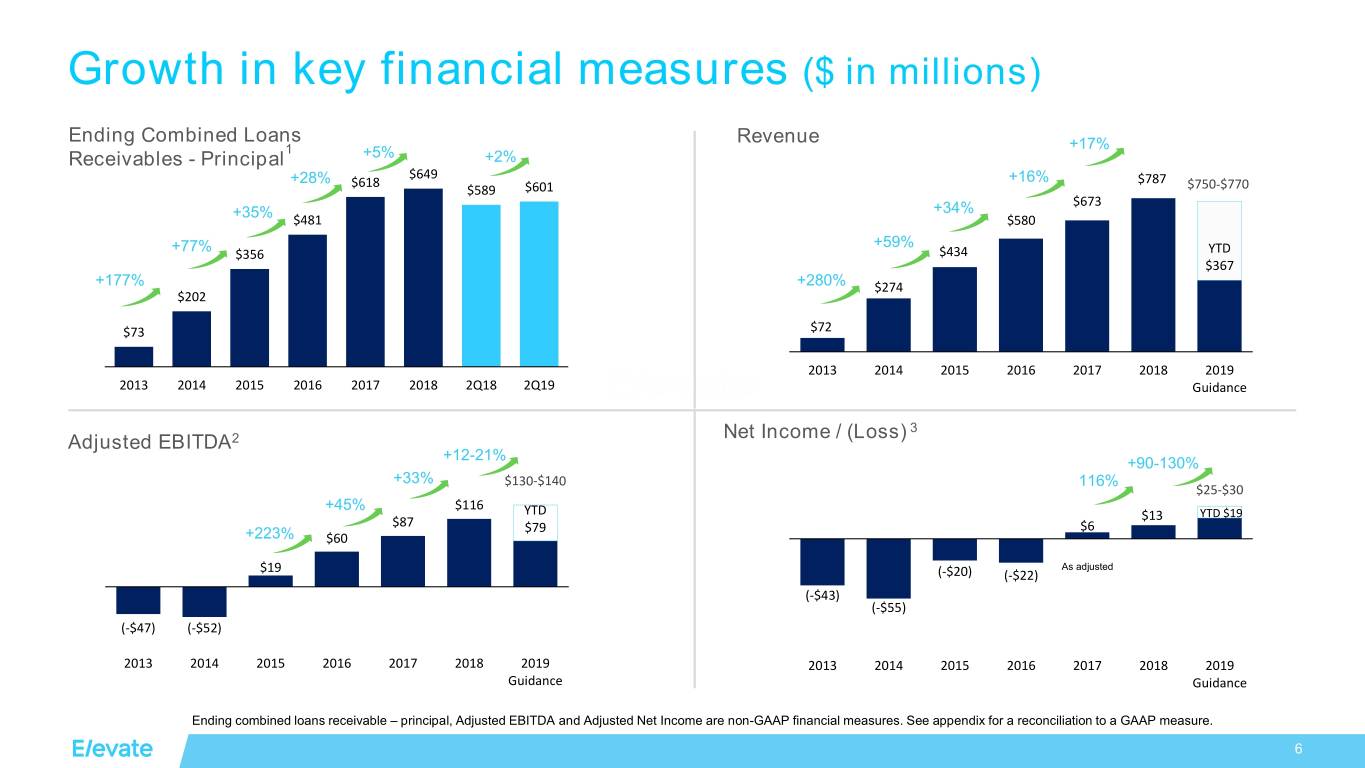
Growth in key financial measures ($ in millions) Ending Combined Loans Revenue 1 +17% Receivables - Principal +5% +2% $649 +28% $618 +16% $787 $589 $601 $750-$770 $673 +35% +34% $481 $580 +77% +59% $356 $434 YTD $367 +177% +280% $274 $202 $73 $72 2013 2014 2015 2016 2017 2018 2019 2013 2014 2015 2016 2017 2018 2Q18 2Q19 Guidance Net Income / (Loss) 3 Adjusted EBITDA2 +12-21% +90-130% +33% $130-$140 116% $25-$30 +45% $116 YTD $13 YTD $19 $87 $79 $6 +223% $60 $19 As adjusted (-$20) (-$22) (-$43) (-$55) (-$47) (-$52) 2013 2014 2015 2016 2017 2018 2019 2013 2014 2015 2016 2017 2018 2019 Guidance Guidance Ending combined loans receivable – principal, Adjusted EBITDA and Adjusted Net Income are non-GAAP financial measures. See appendix for a reconciliation to a GAAP measure. 6
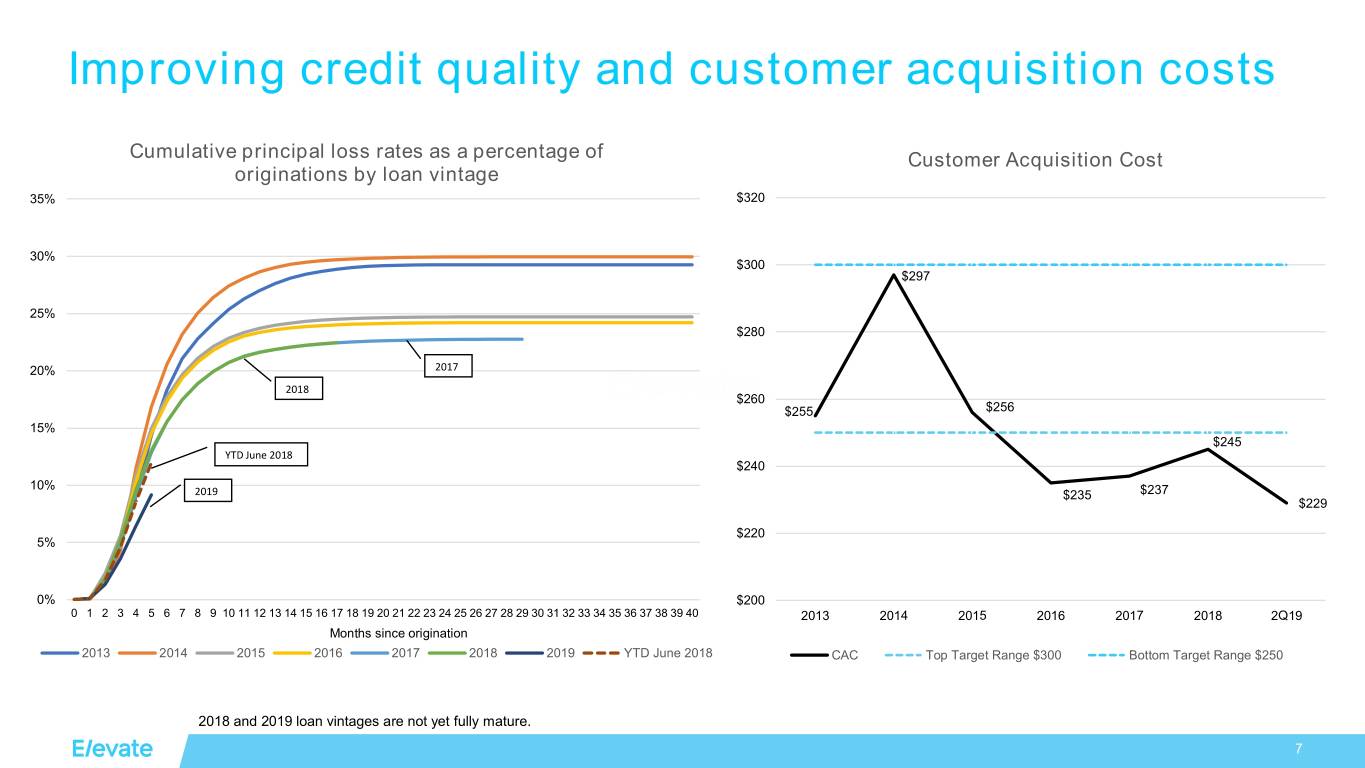
Improving credit quality and customer acquisition costs Cumulative principal loss rates as a percentage of Customer Acquisition Cost originations by loan vintage 35% $320 30% $300 $297 25% $280 20% 2017 2018 $260 $255 $256 15% $245 YTD June 2018 $240 10% 2019 $235 $237 $229 $220 5% 0% $200 0 1 2 3 4 5 6 7 8 9 10 11 12 13 14 15 16 17 18 19 20 21 22 23 24 25 26 27 28 29 30 31 32 33 34 35 36 37 38 39 40 2013 2014 2015 2016 2017 2018 2Q19 Months since origination 2013 2014 2015 2016 2017 2018 2019 YTD June 2018 CAC Top Target Range $300 Bottom Target Range $250 2018 and 2019 loan vintages are not yet fully mature. 7
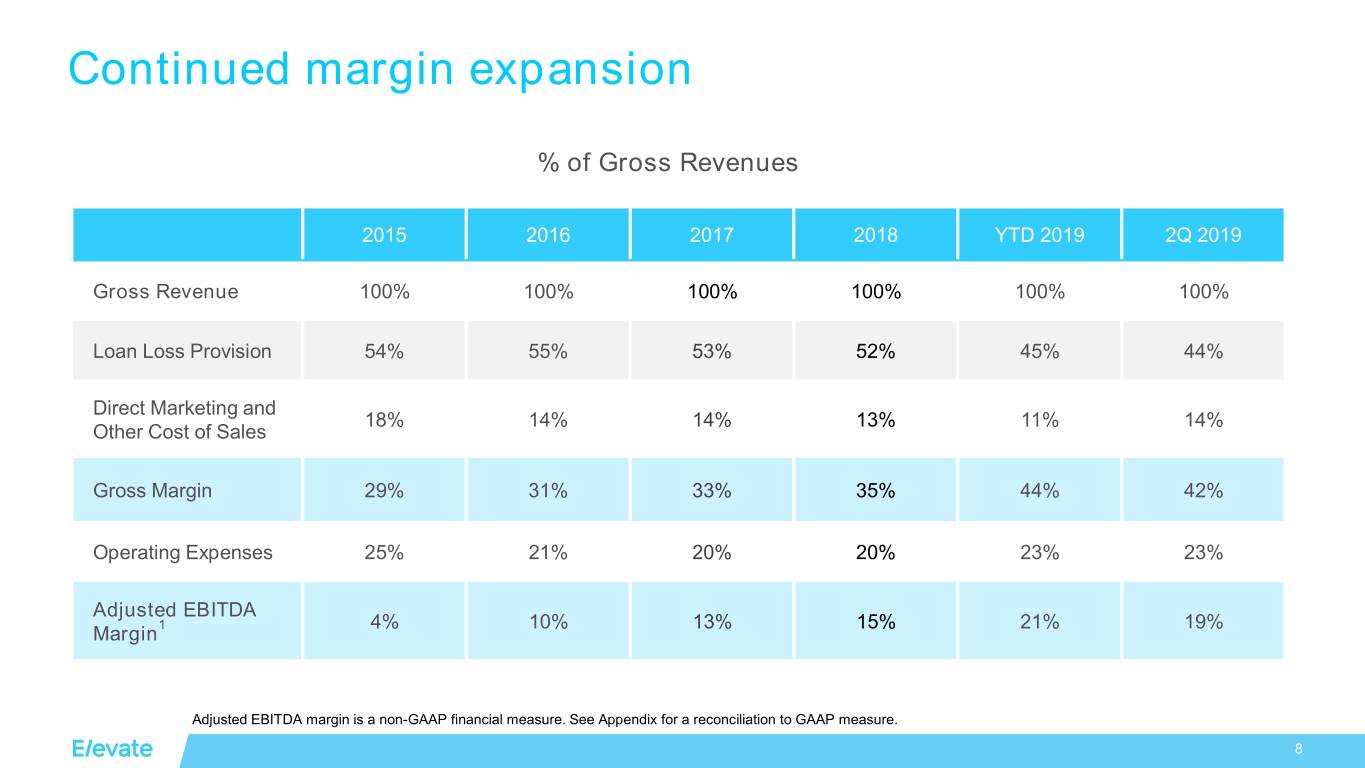
Continued margin expansion % of Gross Revenues 2015 2016 2017 2018 YTD 2019 2Q 2019 Gross Revenue 100% 100% 100% 100% 100% 100% Loan Loss Provision 54% 55% 53% 52% 45% 44% Direct Marketing and 18% 14% 14% 13% 11% 14% Other Cost of Sales Gross Margin 29% 31% 33% 35% 44% 42% Operating Expenses 25% 21% 20% 20% 23% 23% Adjusted EBITDA 1 4% 10% 13% 15% 21% 19% Margin Adjusted EBITDA margin is a non-GAAP financial measure. See Appendix for a reconciliation to GAAP measure. 8
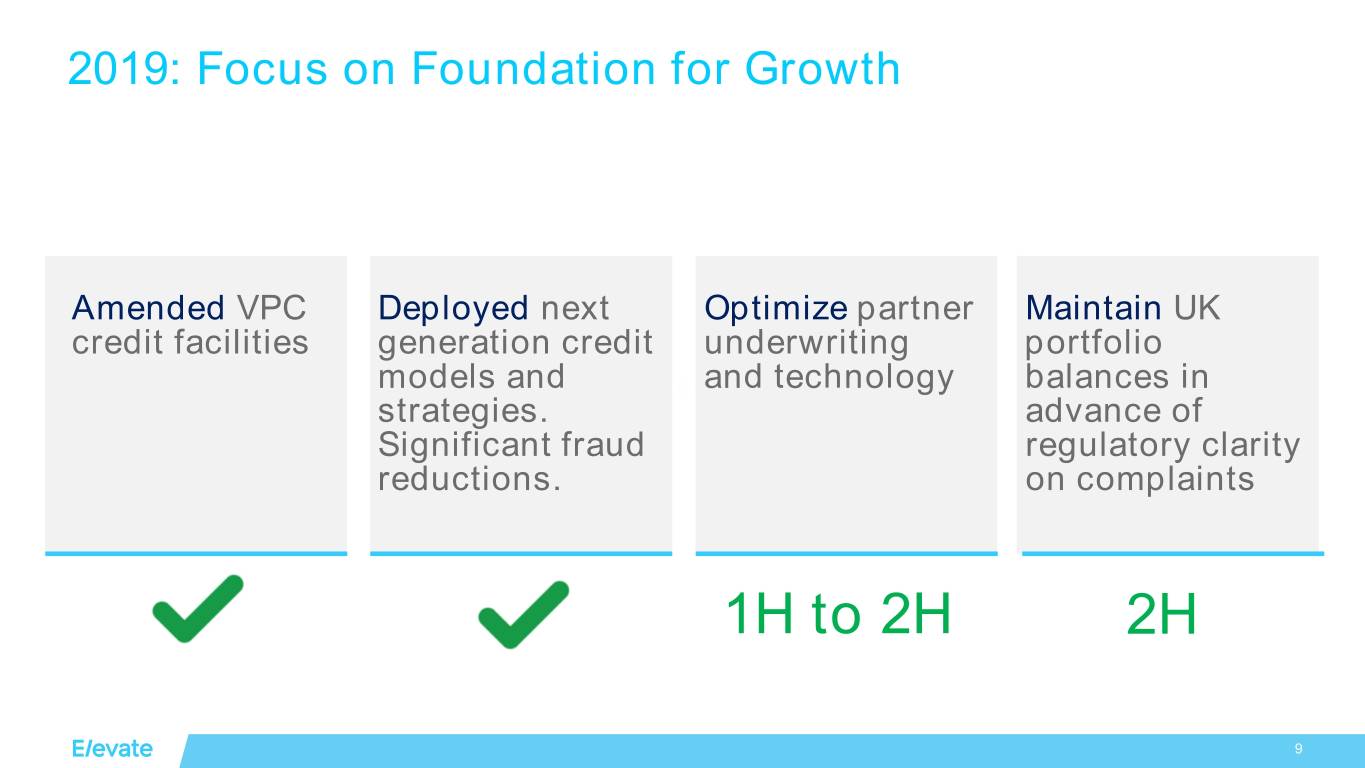
2019: Focus on Foundation for Growth Amended VPC Deployed next Optimize partner Maintain UK credit facilities generation credit underwriting portfolio models and and technology balances in strategies. advance of Significant fraud regulatory clarity reductions. on complaints 1H to 2H 2H 9

Regulatory update • California – AB539 continues to move through CA legislature, which would limit interest rates on loans from $2,500 to $10,000 – Elevate can offer alternatives, without CA rate cap provision via multiple bank partners and products 10

We believe everyone deserves a lift. 1111

Appendix 12
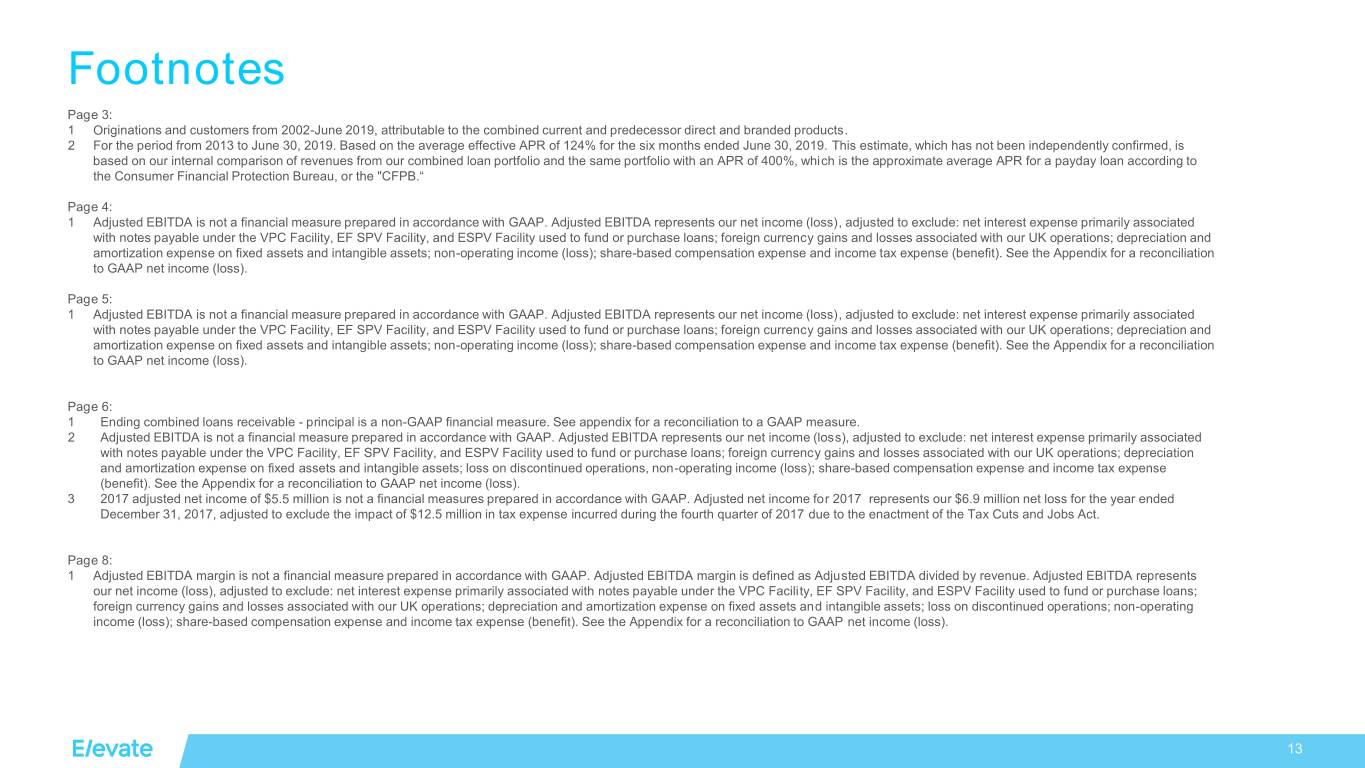
Footnotes Page 3: 1 Originations and customers from 2002-June 2019, attributable to the combined current and predecessor direct and branded products. 2 For the period from 2013 to June 30, 2019. Based on the average effective APR of 124% for the six months ended June 30, 2019. This estimate, which has not been independently confirmed, is based on our internal comparison of revenues from our combined loan portfolio and the same portfolio with an APR of 400%, which is the approximate average APR for a payday loan according to the Consumer Financial Protection Bureau, or the "CFPB.“ Page 4: 1 Adjusted EBITDA is not a financial measure prepared in accordance with GAAP. Adjusted EBITDA represents our net income (loss), adjusted to exclude: net interest expense primarily associated with notes payable under the VPC Facility, EF SPV Facility, and ESPV Facility used to fund or purchase loans; foreign currency gains and losses associated with our UK operations; depreciation and amortization expense on fixed assets and intangible assets; non-operating income (loss); share-based compensation expense and income tax expense (benefit). See the Appendix for a reconciliation to GAAP net income (loss). Page 5: 1 Adjusted EBITDA is not a financial measure prepared in accordance with GAAP. Adjusted EBITDA represents our net income (loss), adjusted to exclude: net interest expense primarily associated with notes payable under the VPC Facility, EF SPV Facility, and ESPV Facility used to fund or purchase loans; foreign currency gains and losses associated with our UK operations; depreciation and amortization expense on fixed assets and intangible assets; non-operating income (loss); share-based compensation expense and income tax expense (benefit). See the Appendix for a reconciliation to GAAP net income (loss). Page 6: 1 Ending combined loans receivable - principal is a non-GAAP financial measure. See appendix for a reconciliation to a GAAP measure. 2 Adjusted EBITDA is not a financial measure prepared in accordance with GAAP. Adjusted EBITDA represents our net income (loss), adjusted to exclude: net interest expense primarily associated with notes payable under the VPC Facility, EF SPV Facility, and ESPV Facility used to fund or purchase loans; foreign currency gains and losses associated with our UK operations; depreciation and amortization expense on fixed assets and intangible assets; loss on discontinued operations, non-operating income (loss); share-based compensation expense and income tax expense (benefit). See the Appendix for a reconciliation to GAAP net income (loss). 3 2017 adjusted net income of $5.5 million is not a financial measures prepared in accordance with GAAP. Adjusted net income for 2017 represents our $6.9 million net loss for the year ended December 31, 2017, adjusted to exclude the impact of $12.5 million in tax expense incurred during the fourth quarter of 2017 due to the enactment of the Tax Cuts and Jobs Act. Page 8: 1 Adjusted EBITDA margin is not a financial measure prepared in accordance with GAAP. Adjusted EBITDA margin is defined as Adjusted EBITDA divided by revenue. Adjusted EBITDA represents our net income (loss), adjusted to exclude: net interest expense primarily associated with notes payable under the VPC Facility, EF SPV Facility, and ESPV Facility used to fund or purchase loans; foreign currency gains and losses associated with our UK operations; depreciation and amortization expense on fixed assets and intangible assets; loss on discontinued operations; non-operating income (loss); share-based compensation expense and income tax expense (benefit). See the Appendix for a reconciliation to GAAP net income (loss). 13
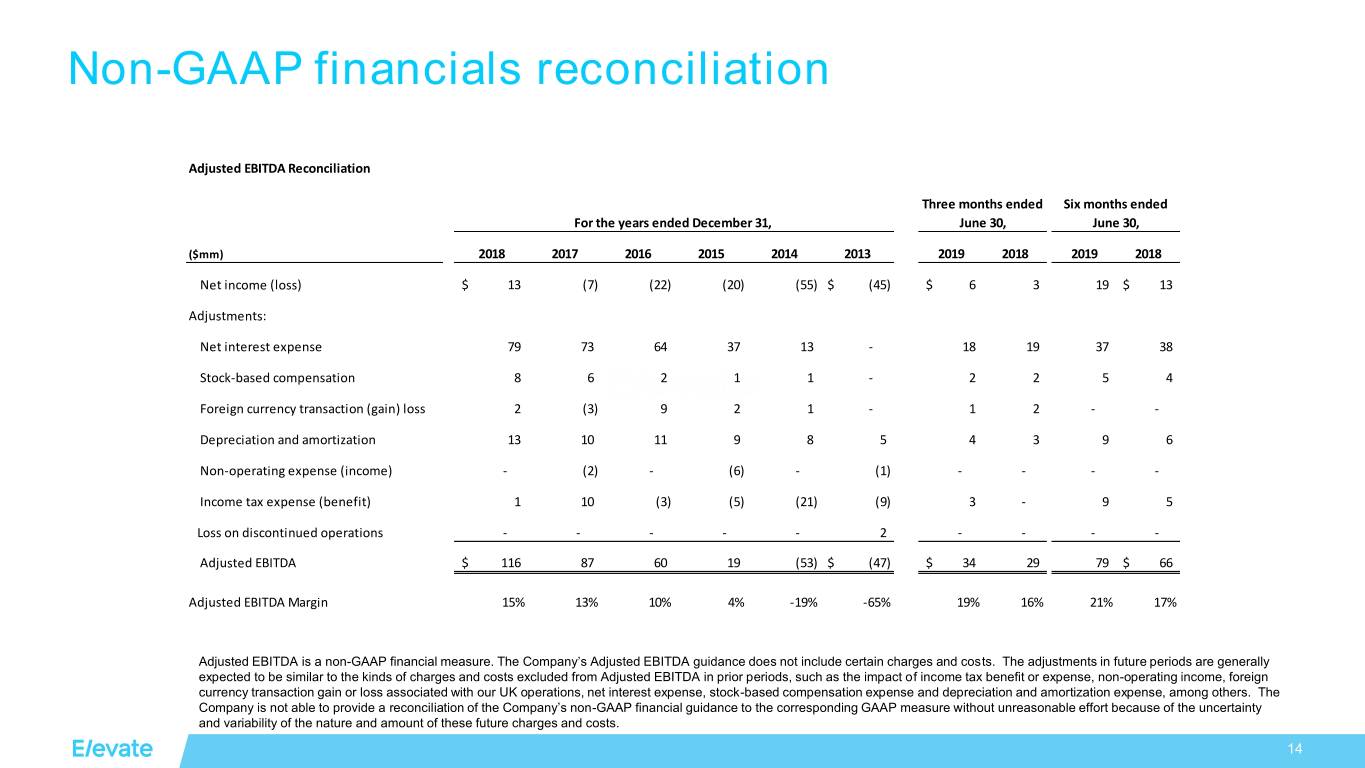
Non-GAAP financials reconciliation Adjusted EBITDA Reconciliation Three months ended Six months ended For the years ended December 31, June 30, June 30, ($mm) 2018 2017 2016 2015 2014 2013 2019 2018 2019 2018 Net income (loss) $ 13 (7) (22) (20) (55) $ (45) $ 6 3 19 $ 13 Adjustments: Net interest expense 79 73 64 37 13 - 18 19 37 38 Stock-based compensation 8 6 2 1 1 - 2 2 5 4 Foreign currency transaction (gain) loss 2 (3) 9 2 1 - 1 2 - - Depreciation and amortization 13 10 11 9 8 5 4 3 9 6 Non-operating expense (income) - (2) - (6) - (1) - - - - Income tax expense (benefit) 1 10 (3) (5) (21) (9) 3 - 9 5 Loss on discontinued operations - - - - - 2 - - - - Adjusted EBITDA $ 116 87 60 19 (53) $ (47) $ 34 29 79 $ 66 Adjusted EBITDA Margin 15% 13% 10% 4% -19% -65% 19% 16% 21% 17% Adjusted EBITDA is a non-GAAP financial measure. The Company’s Adjusted EBITDA guidance does not include certain charges and costs. The adjustments in future periods are generally expected to be similar to the kinds of charges and costs excluded from Adjusted EBITDA in prior periods, such as the impact of income tax benefit or expense, non-operating income, foreign currency transaction gain or loss associated with our UK operations, net interest expense, stock-based compensation expense and depreciation and amortization expense, among others. The Company is not able to provide a reconciliation of the Company’s non-GAAP financial guidance to the corresponding GAAP measure without unreasonable effort because of the uncertainty and variability of the nature and amount of these future charges and costs. 14
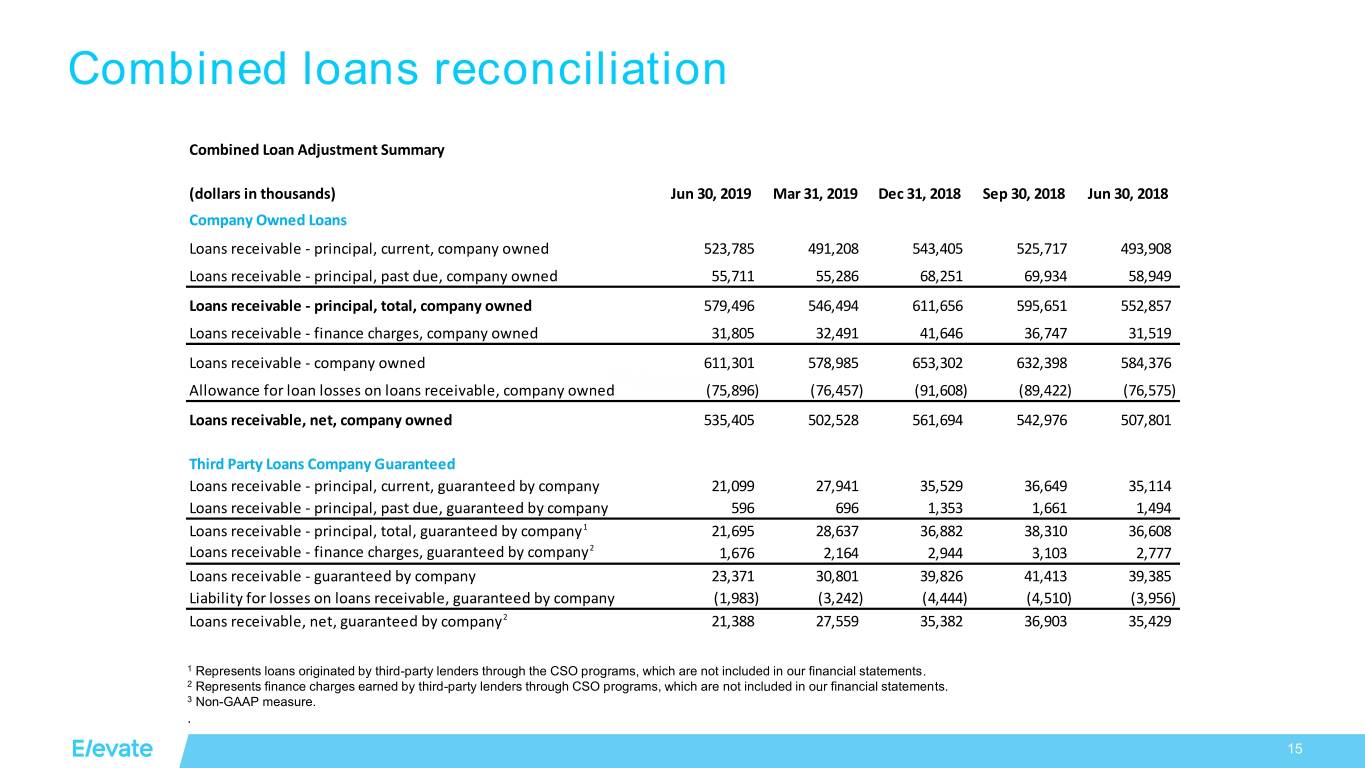
Combined loans reconciliation Combined Loan Adjustment Summary (dollars in thousands) Jun 30, 2019 Mar 31, 2019 Dec 31, 2018 Sep 30, 2018 Jun 30, 2018 Company Owned Loans Loans receivable - principal, current, company owned 523,785 491,208 543,405 525,717 493,908 Loans receivable - principal, past due, company owned 55,711 55,286 68,251 69,934 58,949 Loans receivable - principal, total, company owned 579,496 546,494 611,656 595,651 552,857 Loans receivable - finance charges, company owned 31,805 32,491 41,646 36,747 31,519 Loans receivable - company owned 611,301 578,985 653,302 632,398 584,376 Allowance for loan losses on loans receivable, company owned (75,896) (76,457) (91,608) (89,422) (76,575) Loans receivable, net, company owned 535,405 502,528 561,694 542,976 507,801 Third Party Loans Company Guaranteed Loans receivable - principal, current, guaranteed by company 21,099 27,941 35,529 36,649 35,114 Loans receivable - principal, past due, guaranteed by company 596 696 1,353 1,661 1,494 Loans receivable - principal, total, guaranteed by company1 21,695 28,637 36,882 38,310 36,608 Loans receivable - finance charges, guaranteed by company2 1,676 2,164 2,944 3,103 2,777 Loans receivable - guaranteed by company 23,371 30,801 39,826 41,413 39,385 Liability for losses on loans receivable, guaranteed by company (1,983) (3,242) (4,444) (4,510) (3,956) Loans receivable, net, guaranteed by company2 21,388 27,559 35,382 36,903 35,429 1 Represents loans originated by third-party lenders through the CSO programs, which are not included in our financial statements. 2 Represents finance charges earned by third-party lenders through CSO programs, which are not included in our financial statements. 3 Non-GAAP measure. . 15
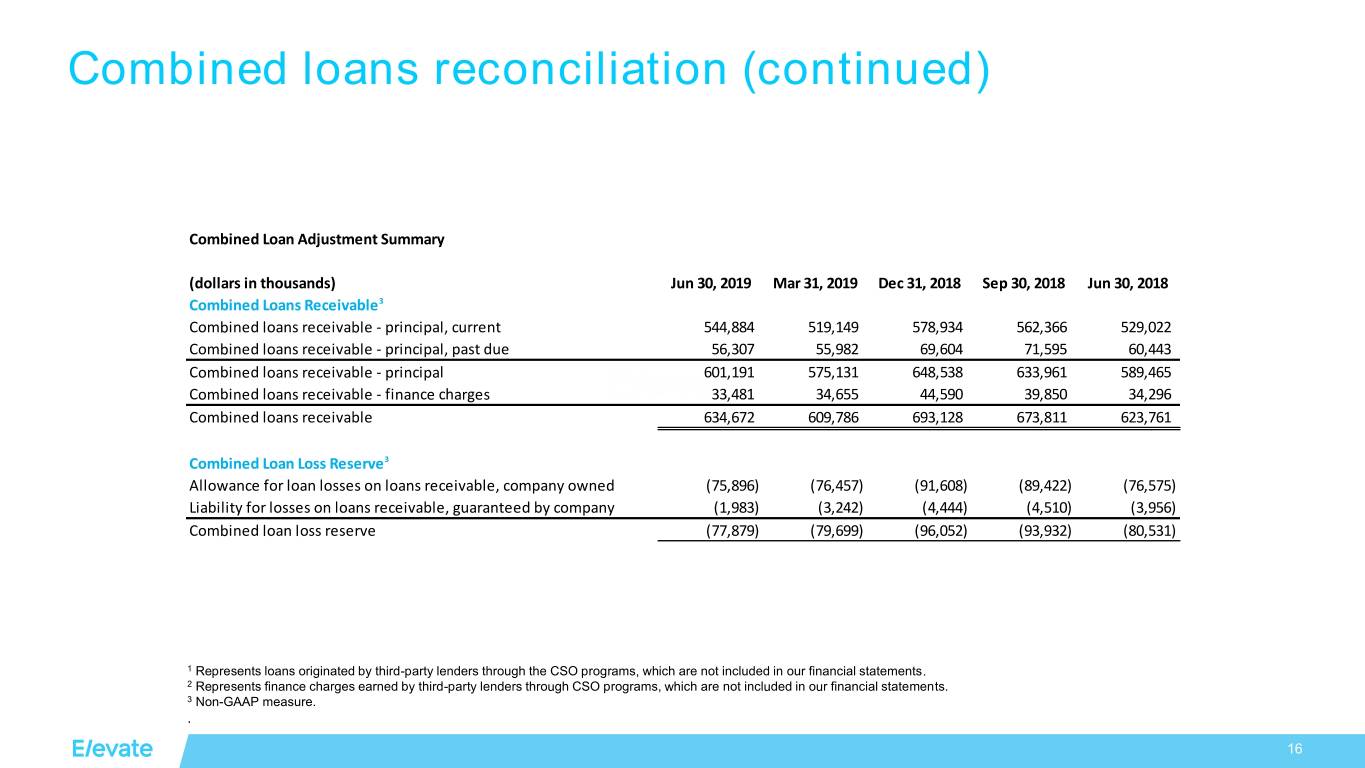
Combined loans reconciliation (continued) Combined Loan Adjustment Summary (dollars in thousands) Jun 30, 2019 Mar 31, 2019 Dec 31, 2018 Sep 30, 2018 Jun 30, 2018 Combined Loans Receivable3 Combined loans receivable - principal, current 544,884 519,149 578,934 562,366 529,022 Combined loans receivable - principal, past due 56,307 55,982 69,604 71,595 60,443 Combined loans receivable - principal 601,191 575,131 648,538 633,961 589,465 Combined loans receivable - finance charges 33,481 34,655 44,590 39,850 34,296 Combined loans receivable 634,672 609,786 693,128 673,811 623,761 Combined Loan Loss Reserve3 Allowance for loan losses on loans receivable, company owned (75,896) (76,457) (91,608) (89,422) (76,575) Liability for losses on loans receivable, guaranteed by company (1,983) (3,242) (4,444) (4,510) (3,956) Combined loan loss reserve (77,879) (79,699) (96,052) (93,932) (80,531) 1 Represents loans originated by third-party lenders through the CSO programs, which are not included in our financial statements. 2 Represents finance charges earned by third-party lenders through CSO programs, which are not included in our financial statements. 3 Non-GAAP measure. . 16

© 2017 Elevate. All Rights Reserved.


