 Investor Presentation May 9, 2017 Investor Presentation May 9, 2017 Exhibit 99.1 |
 Safe Harbor Statement This presentation may contain forward-looking statements that involve substantial risks and uncertainties. All statements, other than statements of historical facts, contained in this presentation, including statements regarding our strategy, future operations, future financial position, future revenues, projected costs, prospects, plans and objectives of management, are forward-looking statements. The words “anticipate,” “believe,” “estimate,” “expect,” “intend,” “may,” “plan,” “predict,” “project,” “target,” “potential,” “will,” “would,” “could,” “should,” “continue,” and similar expressions are intended to identify forward-looking statements, although not all forward-looking statements contain these identifying words. We may not actually achieve the plans, intentions or expectations disclosed in our forward-looking statements, and you should not place undue reliance on our forward-looking statements. Actual results or events could differ materially from the plans, intentions and expectations disclosed in the forward-looking statements we make. The forward-looking statements contained in this presentation reflect our current views with respect to future events, and we assume no obligation to update any forward- looking statements. Forward-looking statements represent our management’s beliefs and assumptions only as of the date of the preliminary prospectus, and our actual future results may be materially different from what we expect. We have included important factors in the cautionary statements included in our Quarterly Report on Form 10-Q for the three month period ended March 31, 2017 and other documents we have filed with the SEC, particularly in the Risk Factors section, that we believe could cause actual results or events to differ materially from the forward-looking statements that we make. Except as required by law, we assume no obligation to update these forward-looking statements publicly, or to update the reasons why actual results could differ materially from those anticipated in the forward-looking statements, even if new information becomes available in the future. Non-GAAP Financial Measures This presentation includes measures defined by the SEC as non-GAAP financial measures. We believe that these non-GAAP financial measures can provide useful supplemental information to investors when read in conjunction with our reported results. Reconciliations of these non-GAAP financial measures to their closest GAAP measures are available in the Appendix to this presentation and descriptions of these non-GAAP financial measures can be found in our earnings release with respect to our first quarter 2017 results. Copyright © 2017 – All Rights Reserved – Acacia Communications, Inc. I Connecting at the Speed of Light 1 |
 Copyright © 2017 – All Rights Reserved – Acacia Communications, Inc. I Connecting at the Speed of Light 2 Acacia Highlights Deliver silicon-based interconnects that transform cloud and communication networks by simplifying these networks, digitizing numerous complex analog functions, and providing significant improvements in speed, capacity and power consumption Coherent Optical Interconnect Provider Addressing High Growth Markets Driving the Siliconization of Optical Interconnect First to Market, Award Winning Products Trusted Leadership Strong Financials |
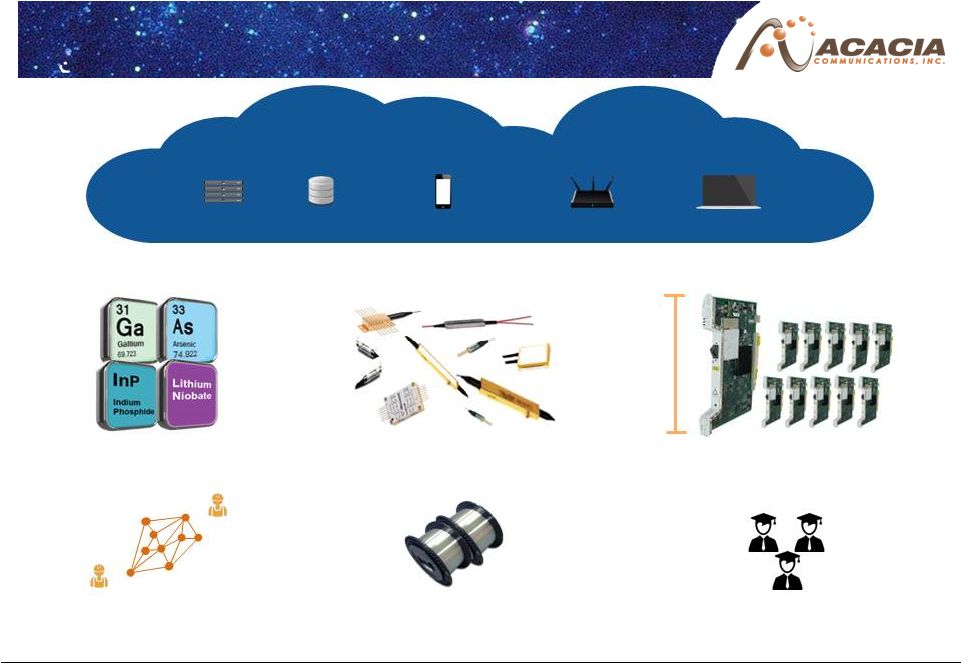 Most Network Elements Benefit from Silicon Economies of Scale Connecting at the Speed of Light Was Both Difficult and Costly Servers Storage Smart Phones Switches/Routers Computers Most Optical Interconnects Linking These Elements Were Analog and Not Based on Silicon Manual Network Calibration Expensive Fiber Management Army of Ph.D.s Required Leveraging Moore’s Law Today Exotic Materials Bulky Components; Low Yield Large, Costly End-Product B A 10 X 10G Required Copyright © 2017 – All Rights Reserved – Acacia Communications, Inc. I Connecting at the Speed of Light 3 |
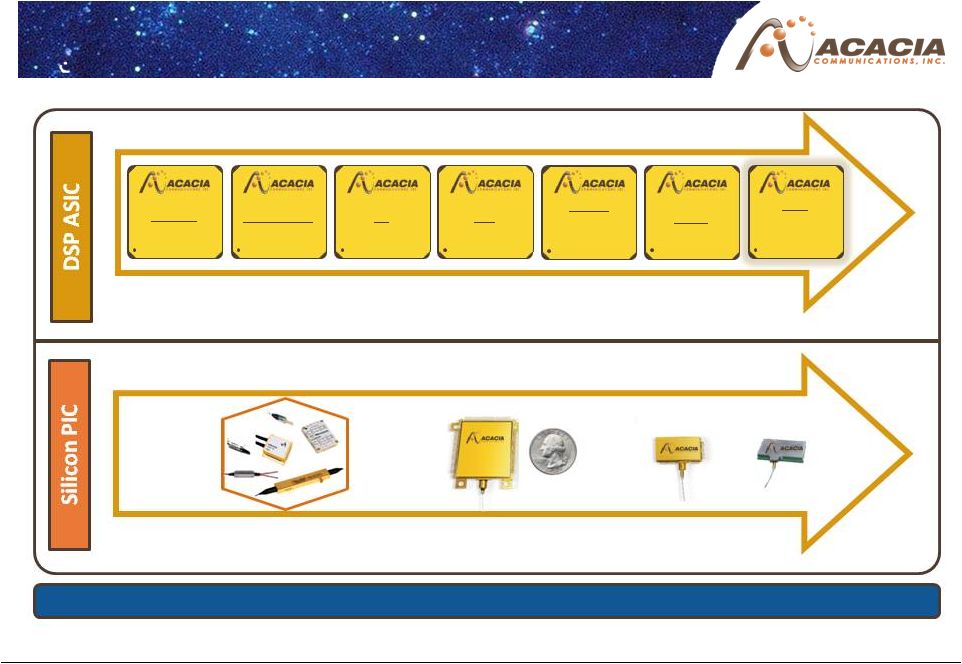
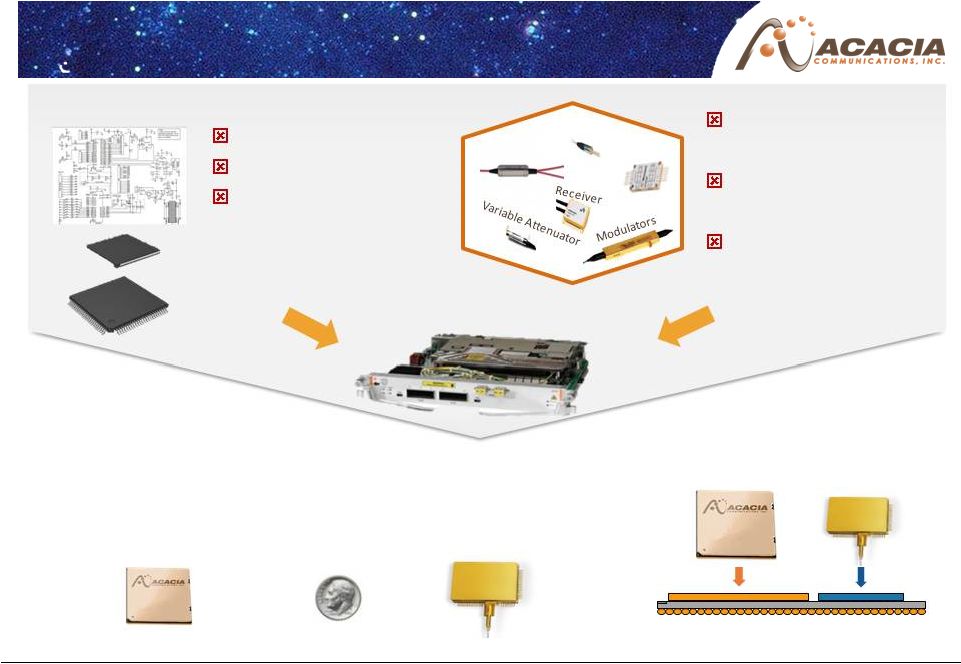 Siliconization of Optical Interconnect Transforming Optical Communications Silicon PIC DSP ASIC Multiple discrete, bulky components Non-Si PICs based on esoteric processes Customized design and manual integration – Significant engineering effort – Difficult to innovate High cost of development Few commercially available Existing offerings not optimized for – Power – Speed – Density Photonics Digital Signal Processors Pol Splitter Driver Typical 100G “Pizza Box Sized” Coherent Line Card Innovative Digital Signal Processor (DSP ASIC) in Latest CMOS Technology Industry-first CMOS Photonic Integrated Circuit (PIC) 1 + = > 1 billion transistors > 50 photonic functions Tap Detectors 1. Commercially available for coherent applications Acacia Optical Interconnect Solutions: high-speed, lower-cost, lower-power consumption Copyright © 2017 – All Rights Reserved – Acacia Communications, Inc. I Connecting at the Speed of Light 4 |
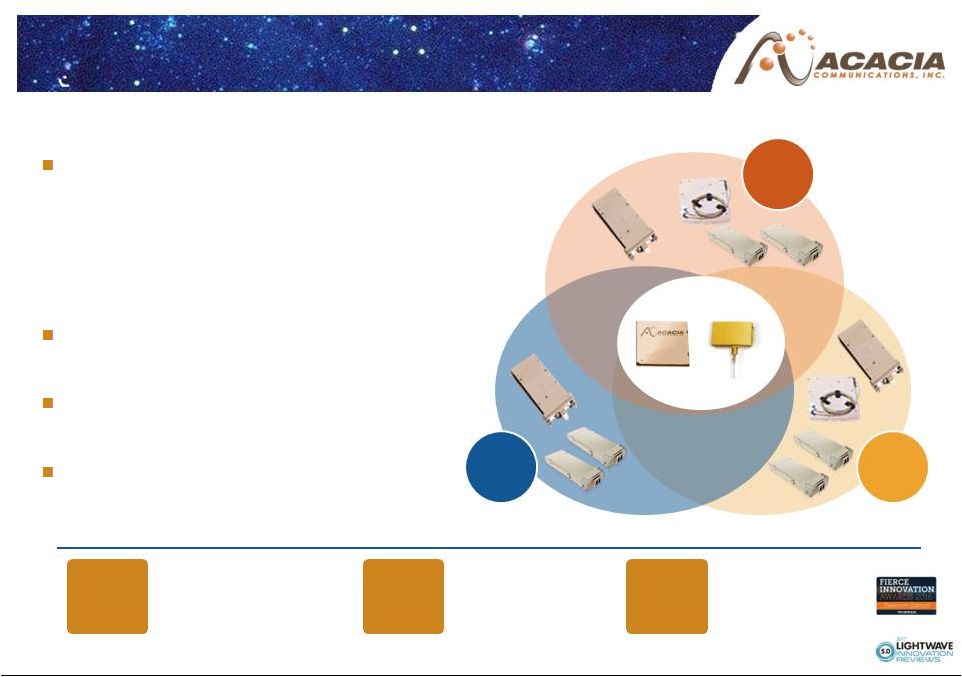
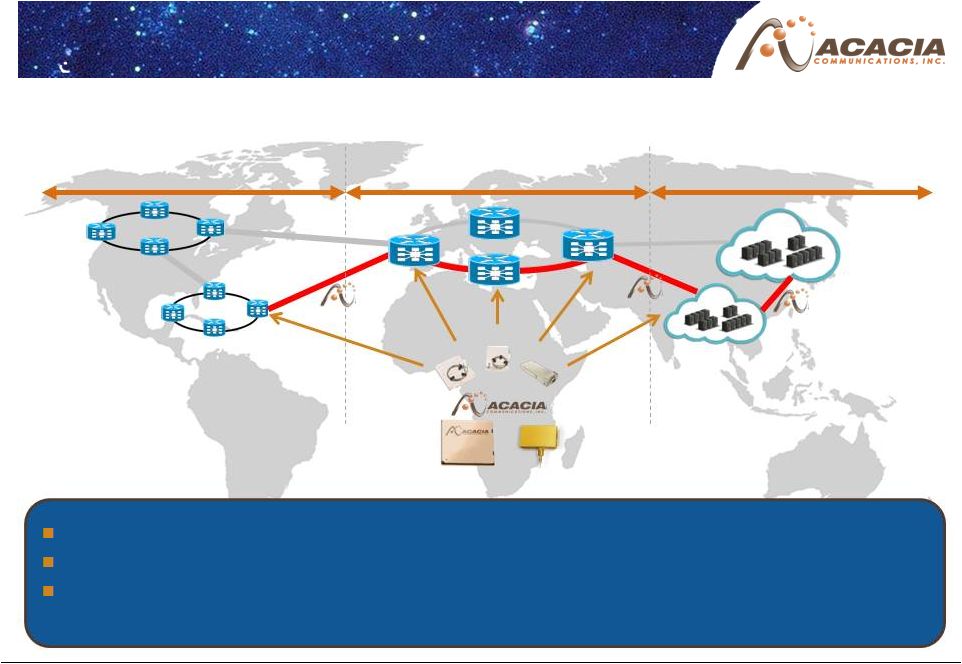 Siliconization of Optical Interconnect Significantly Reducing Complexity and Cost of High Speed Networks Plug and play with a variety of network equipment Simplifies optical link management eliminating complex manual calibration Key characteristics: speed, industry leading density and power efficiency, automation and manageability Metro Long-Haul Inter-Data Center Modules Copyright © 2017 – All Rights Reserved – Acacia Communications, Inc. I Connecting at the Speed of Light 5 |
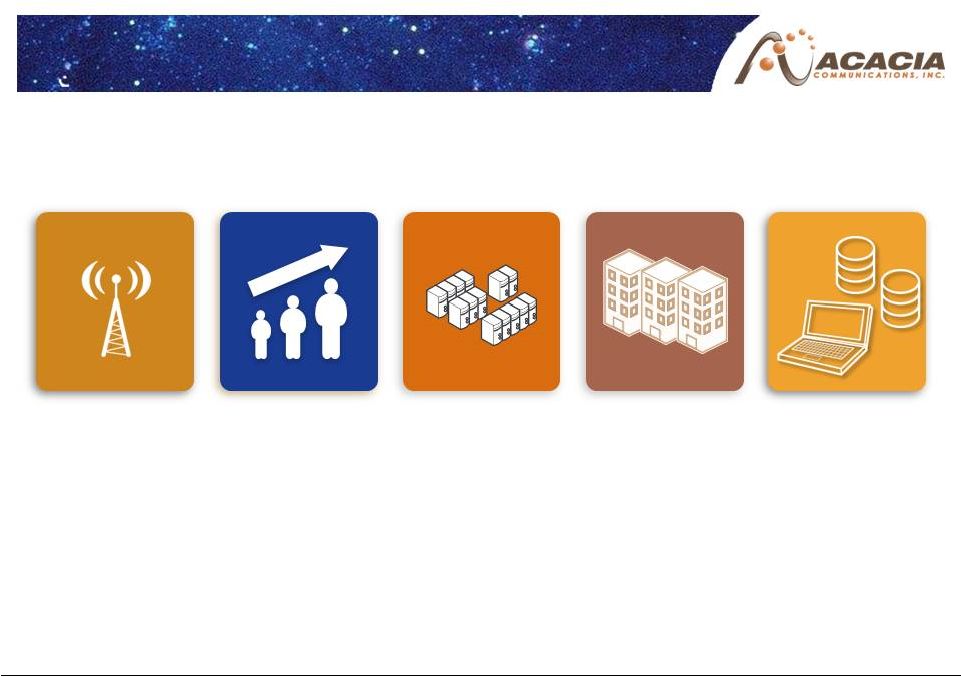
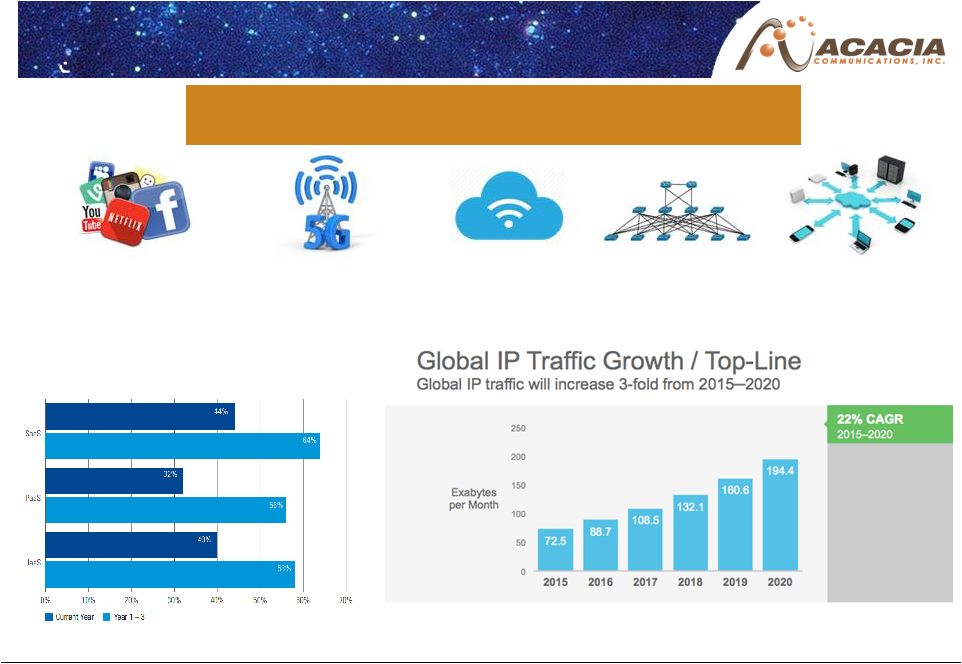 Increased Data and Video Consumption Growth in Mobile and 4GLTE/5G Communications Proliferation of Cloud Services Adoption of the “Internet of Things” Changing Traffic Patterns Traffic Demand is Growing for Traditional Carriers and Web 2.0 Content Providers Bandwidth and Network Capacity Growth Source: Journey to the Cloud, The Creative CIO Agenda, KPMG , 2017 Source: Cisco VNI Global IP Traffic Forecast 2015-2020 Cloud Investments by Type (Significant IT budgets > US$250m) Copyright © 2017 – All Rights Reserved – Acacia Communications, Inc. I Connecting at the Speed of Light 6 |
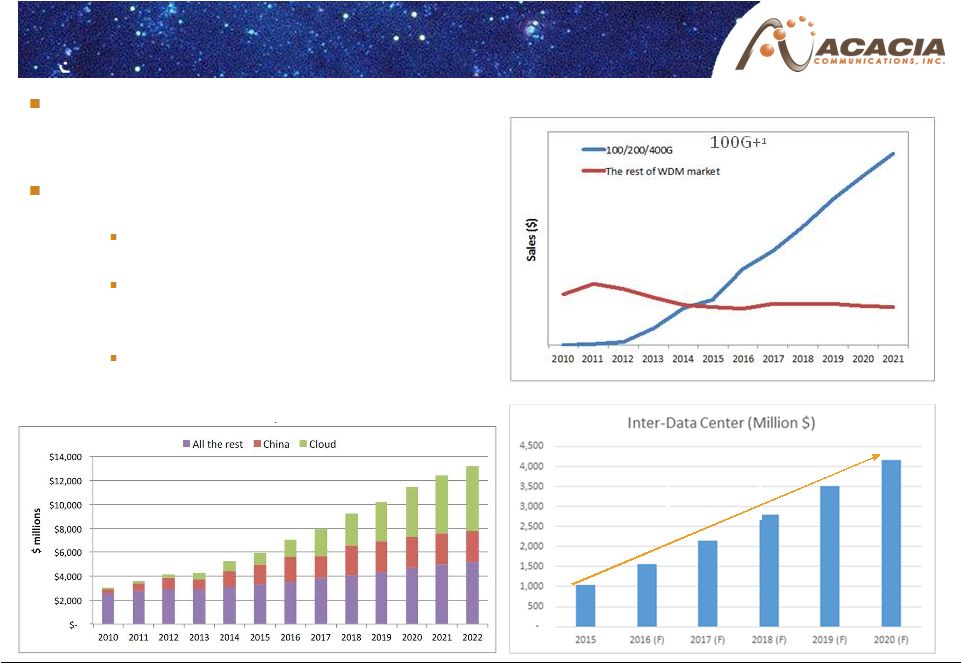 Key Market Segments 1. Source: LightCounting 2. Source: ACG Research Sept 2016 2 32% CAGR Sales of Optics Components and Modules According to LightCounting, optical component spend is estimated to reach $12+ billion by 2022 Three drivers for 100G+ market growth: – DCI Low-power, high-density, low-cost per bit – Metro Density, low-cost, plugability, interoperability – China Low-power, easy to deploy DCOs 1 Copyright © 2017 – All Rights Reserved – Acacia Communications, Inc. I Connecting at the Speed of Light 7 |
 Diverse Set of Skills and Expertise Represents High Barrier to Entrance Acacia Has All the Pieces to the High-Speed Interconnect Puzzle Superior performance Higher density Easy to deploy and manage Lower-cost DSP Radio Frequency Software Optics Siliconization Copyright © 2017 – All Rights Reserved – Acacia Communications, Inc. I Connecting at the Speed of Light 8 |
 Sky 100G Metro Everest 100G LH Rapid Pace of Innovation 2011 2012 2013 2014 2015 Strong and diverse portfolio of patents and intellectual property 2016 Optical Performance, Low Power, Rich Feature Set BGA 0.4 Inch 2 Many discrete components 1.5 Inch 2 Significant cost and size reduction SiPh PIC 0.4 Inch 2 SiPh PIC 2011 2012 2013 2014 2015 2016 2017 2017 Mouna Kea 100G ULH K2 40G ULH Denali 400G ULH/Metro Multi-core Meru 200G Metro Pico 1.2T DCI/Metro/LH Multi-core Copyright © 2017 – All Rights Reserved – Acacia Communications, Inc. I Connecting at the Speed of Light 9 |
 Family of products meet needs of network operators – Compact, low-power industry- standard interfaces – Integration in silicon CFP2-ACO and industry’s first CFP2-DCO module Integrates easily into all classes of Communication Equipment High yield / lower cost manufacturing driven by CMOS process Silicon Coherent PIC Dual-core DSP 100G MSA 100G CFP-DCO 400G Module 200G CFP2-DCO 1st Inter- Data Center Long Haul Metro 1st 1st First-to-Market, Award Winning Products Blending High Performance, Scale and Cost-Efficiency We believe we are the first to introduce to the market: Copyright © 2017 – All Rights Reserved – Acacia Communications, Inc. I Connecting at the Speed of Light 10 |
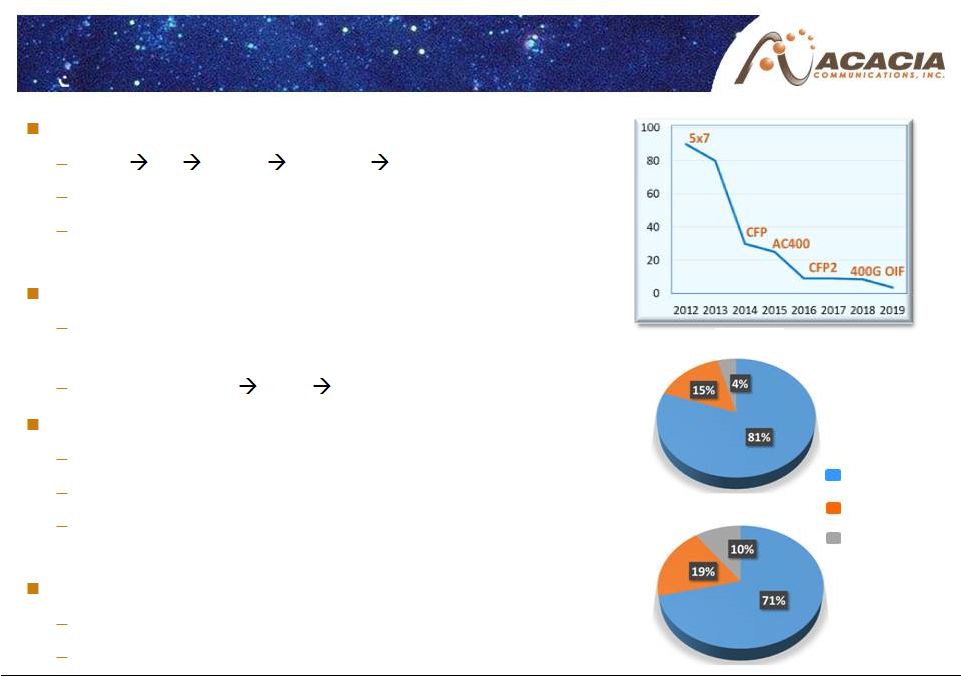 Expanding coherent applications Sub LH Metro Inter-DC 5G Provide low total cost of ownership Acacia: Technology innovation and vertical integration driving cost and power reductions DCO/ACO gaining share in coherent market Use of Acacia modules enables a faster time to market than use of individual components Acacia DCO: CFP CFP2 400G OIF Cloud and content providers looking to disaggregate Avoid being locked-in to single vendor Looking for best and lowest cost solutions Voyager platform within TIP is one example – “white box” solution based on AC400 Autonomous and secure networks Adding intelligence, performance metrics, encryption Increasing value by continued innovation Trends and Accomplishments 2017 1 2019 1 DCO ACO Non-Pluggable 1 Source: LightCounting Riding Moore’s Law Power/100G (W) ~40%/year reduction Copyright © 2017 – All Rights Reserved – Acacia Communications, Inc. I Connecting at the Speed of Light 11 |
 Our Growth Strategy Increased Investment in all Networks – 100G and Higher Expansion Opportunity with Existing Customers Expand Customer Base – Driven by Network Equipment Transformation Grow into Adjacent Markets Continued Innovation Copyright © 2017 – All Rights Reserved – Acacia Communications, Inc. I Connecting at the Speed of Light 12 |
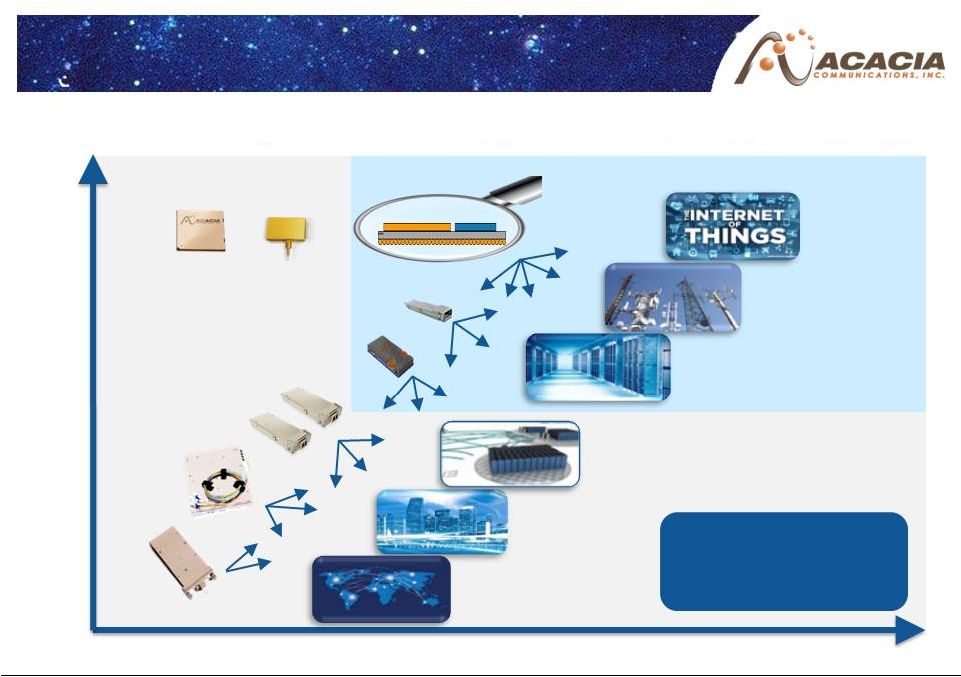 Expanding Coherent Markets Time Markets that may benefit from low-power DSP and SiPh technology Units Reducing Power, Size and Cost through Siliconization Long-Haul Metro Inter DC Intra DC 5G, Access New Markets A-CFP2 400G OIF DSP+PIC Tb plus CFP AC400 D-CFP2 Today Future Copyright © 2017 – All Rights Reserved – Acacia Communications, Inc. I Connecting at the Speed of Light 13 |
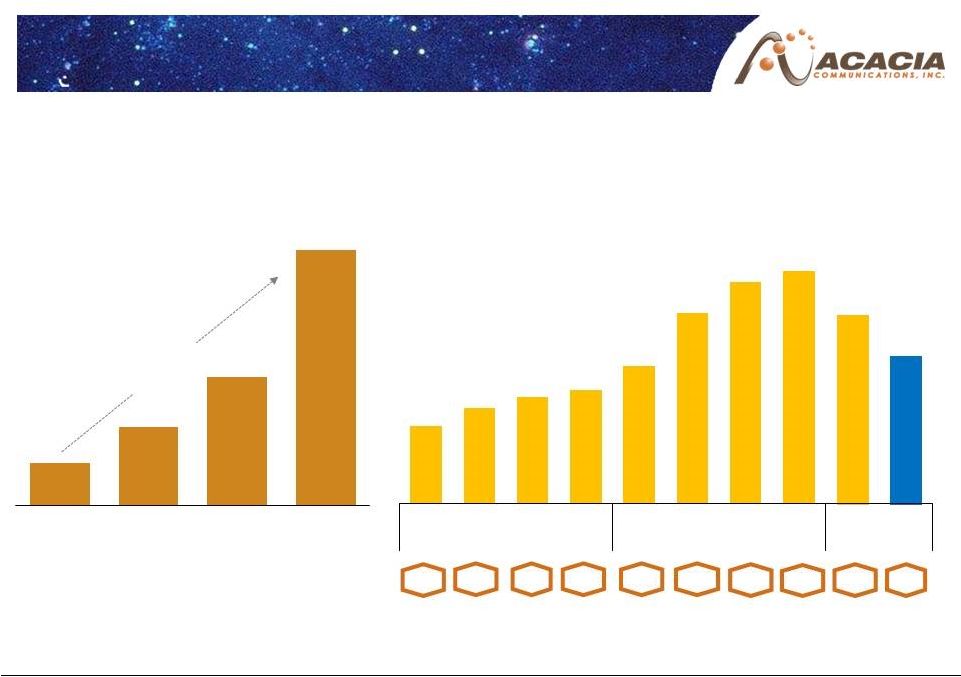 Financial Performance Revenue ($mm) Quarterly Revenue ($mm) *Midpoint of $85M - $95M Range Data 83% CAGR Year-Over-Year Change % $78 $146 $239 $478 2013A 2014A 2015A 2016A $47 $58 $65 $69 $84 $116 $135 $142 $115 $90 Q1 Q2 Q3 Q4 Q1 Q2 Q3 Q4 Q1 Q2* 2015 2016 2017 73% 86% 40% 67% 79% 101% 107% 108% 36% -22% Copyright © 2017 – All Rights Reserved – Acacia Communications, Inc. I Connecting at the Speed of Light 14 |
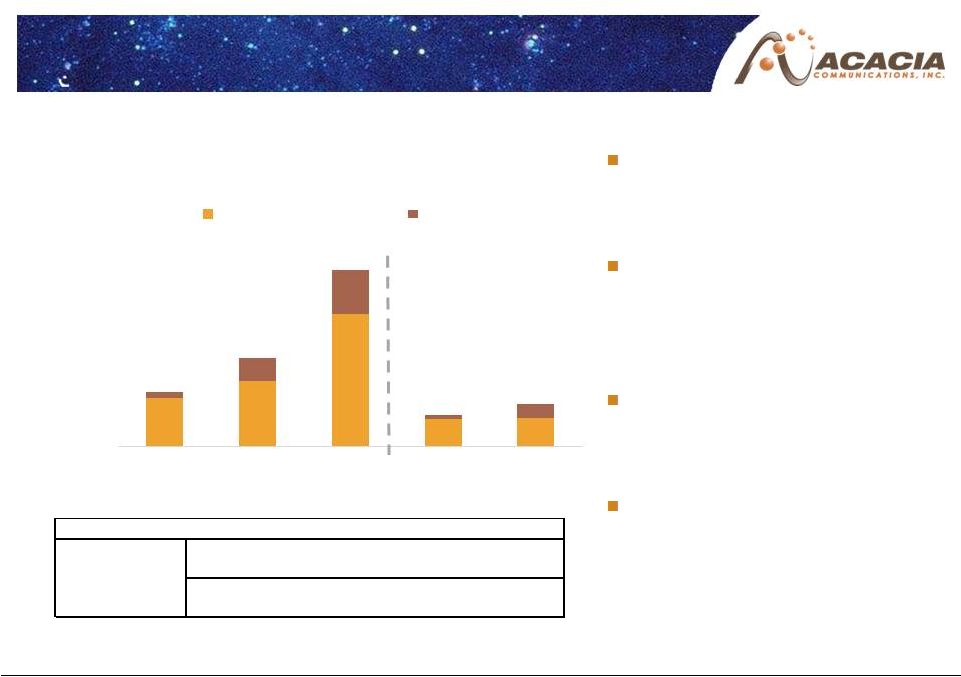 Continued Customer Diversification Revenue From Existing and New Customers 1 1 New Customers defined as customers who first purchased products from Acacia after the initial 8 customers in 2011. Ongoing diversification of customer base continues Revenue from new customers increased from Q1 2016 to Q1 2017 Primary drivers of growth are the China, metro and DCI markets In Q1 2017, we had 2 customers that each represented more than 10% of revenue and 3 additional customers represented over 5% of revenue each $85 *Rounded numbers represented A = Actual $478 2014A 2015A 2016A Q116A Q117A Original 8 Customers New Customers $146 $239 $115 2014-2015 Growth Rate % 2015-2016 Growth Rate % Q1 16 - Q1 17 Growth Rate % New Customers 284% 97% 223% Original 8 Customers 37% 101% 6% Growth Rates Copyright © 2017 – All Rights Reserved – Acacia Communications, Inc. I Connecting at the Speed of Light 15 |
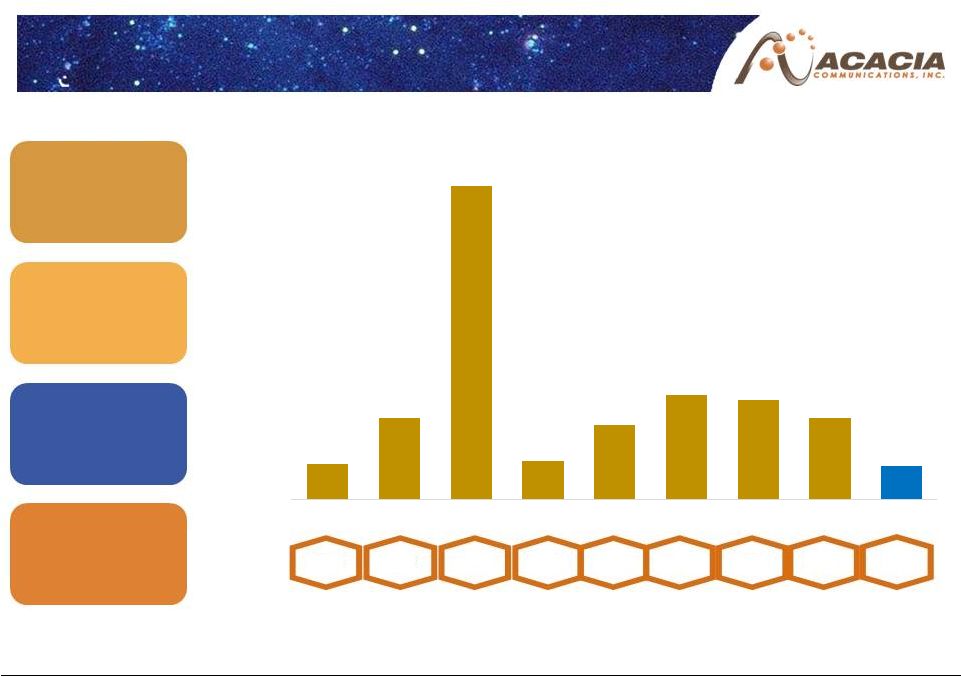 Proven Operating Leverage and Demonstrated Profitability Non-GAAP Net Income 1 ($mm) Capital Efficiency Leveraged Sales Model Low Sales and Support Costs Efficient R&D Key Drivers *Midpoint of $10M - $15M Range Data 1 This is a “non-GAAP financial measure” as defined in Regulation G under the Securities Exchange Act of 1934, as amended, and reconciliation of such non-GAAP financial measure to the most directly comparable financial measure calculated and presented in accordance with U.S. GAAP is provided in the Appendix to this presentation. Descriptions of this non-GAAP financial measure can be found in the company’s earnings release with respect to its first quarter 2017 results % of Revenue $14 $32 $123 $15 $29 $41 $39 $32 $13 2014A 2015A 2016A Q116A Q216A Q316A Q416A Q117A Q217F* 10% 14% 26% 17% 25% 30% 27% 28% 14% Copyright © 2017 – All Rights Reserved – Acacia Communications, Inc. I Connecting at the Speed of Light 16 |
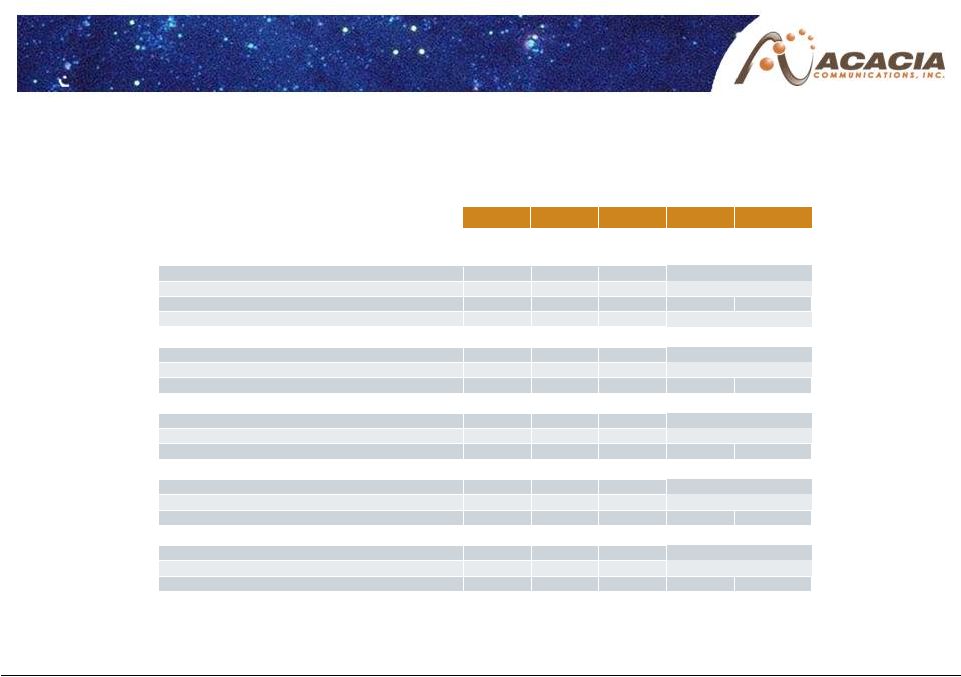
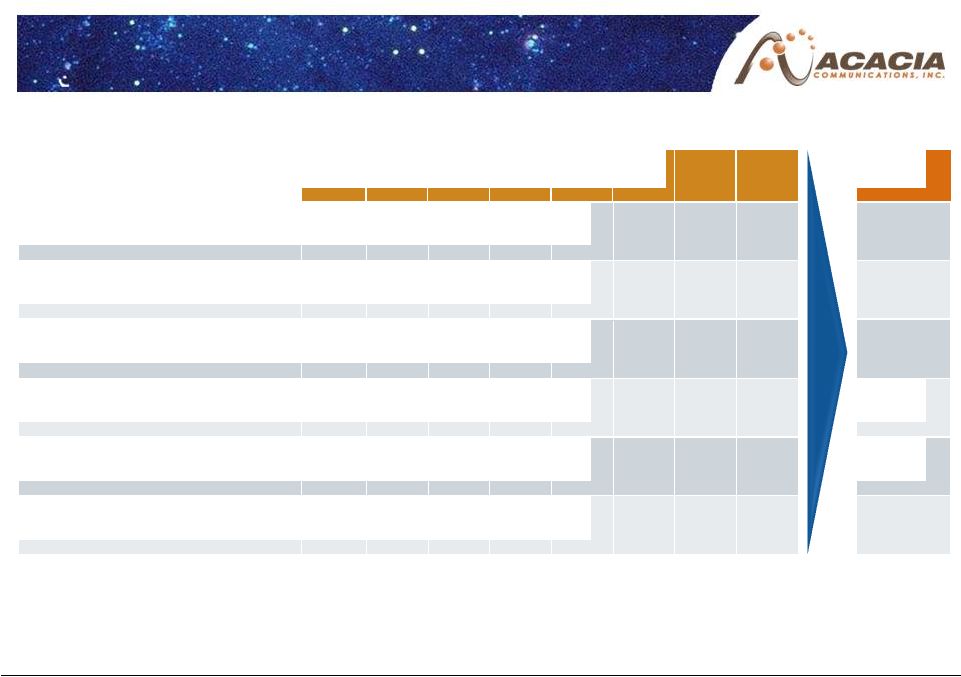           Long-Term Financial Goals Percent of Revenue (Non-GAAP Basis) Gross Profit Margin 36% 39% 47% 42% 47% 47% 48% 50% 48% - 50% Research & Development 19% 16% 13% 18% 14% 11% 12% 13% 17% - 19% Sales, General & Administrative 5% 5% 4% 5% 5% 4% 4% 7% 6% - 8% Operating Margin 12% 18% 29% 19% 28% 32% 32% 30% 23% - 27% Tax Rate (on Profit Before Tax) 16% 25% 11% 10% 11% 6% 16% 8% 9% - 12% Net Income Margin 10% 14% 26% 17% 25% 30% 27% 28% 21% - 25% 2014A (Audited) Q4 2016A Target Range Q1 2016A 2015A (Audited) Q2 2016A 2016A (Audited) Q3 2016A Q1 2017A These long-term financial goals are forward-looking, are subject to significant uncertainties and contingencies and are based upon assumptions with respect to future circumstances, which are subject to change. Actual results will vary and those variations may be material. For discussion of some of the important factors that could cause these variations, please consult the “Risk Factors” section of the Form 10-Q for the fiscal quarter ended March 31, 2017, that we have filed with the SEC. These long-term financial goals include “non-GAAP financial measures” as defined in Regulation G under the Securities Exchange Act of 1934, as amended, and reconciliations of such historical non-GAAP financial measures to their most directly comparable financial measures calculated and presented in accordance with U.S. GAAP are provided in the Appendix to this presentation. Acacia Communications has not reconciled the forward-looking non-GAAP measures included in these long-term financial goals because the expected tax benefits derived from any disqualifying dispositions of equity awards during the periods included in these long-range goals cannot be reasonably calculated or predicted at this time and, accordingly, a reconciliation is not available without unreasonable effort. Descriptions of the non-GAAP financial measures included in these long-term financial goals can be found in the company’s earnings release with respect to its first quarter 2017 results. Copyright © 2017 – All Rights Reserved – Acacia Communications, Inc. I Connecting at the Speed of Light 17 |
 APPENDIX |
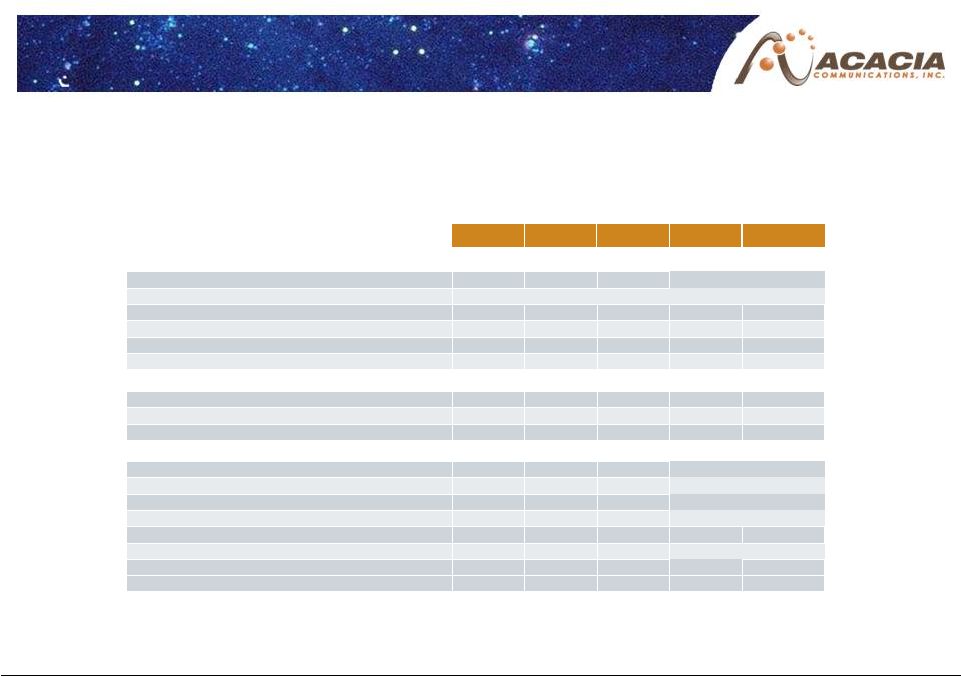
 Reconciliation of GAAP to Non-GAAP 2014 2015 2016 2016 2017 Non-GAAP Gross Profit;Non-GAAP Gross Profit Margin Gross profit $52,676 $93,706 $220,987 $35,406 $56,300 Stock-based compensation 17 75 1,629 32 442 Non-GAAP gross profit $52,693 $93,781 $222,616 $35,438 $56,742 Non-GAAP gross profit margin 36.0% 39.2% 46.5% 41.9% 49.5% Non-GAAP R&D Expenses GAAP research and development expenses $28,471 $38,645 $75,696 $15,414 $17,728 Stock-based compensation 258 561 12,347 189 2,992 Non-GAAP research and development expenses $28,213 $38,084 $63,349 $15,225 $14,736 Non-GAAP SG&A Expenses GAAP selling, general and administrative expenses $6,615 $13,124 $27,676 $4,054 $8,691 Stock-based compensation 132 189 6,769 69 1,198 Non-GAAP selling, general and administrative expenses $6,483 $12,935 $20,907 $3,985 $7,493 Non-GAAP Operating Expenses GAAP operating expenses $35,194 $51,769 $103,397 $19,468 $26,419 Stock-based compensation 390 750 19,116 258 4,190 Non-GAAP operating expenses $34,804 $51,019 $84,281 $19,210 $22,229 Non-GAAP Income from Operations (Loss) income from operations $17,482 $41,937 $117,590 $15,938 $29,881 Stock-based compensation 407 825 20,745 290 4,632 Non-GAAP income from operations $17,889 $42,762 $138,335 $16,228 $34,513 (in thousands) Year Ended December 31, Quarter Ended March 31, Copyright © 2017 – All Rights Reserved – Acacia Communications, Inc. I Connecting at the Speed of Light 19 |
 Reconciliation of GAAP to Non-GAAP 2014 2015 2016 2016 2017 Non-GAAP Net Income Net (loss) income $13,520 $40,520 $131,577 $14,598 $35,709 Stock-based compensation 407 825 20,745 290 4,632 Change in fair value of preferred stock warrant liability 483 2,154 3,361 (248) – Reversal of valuation allowance – (11,142) 0 – Tax effect of excluded items – (47) (32,324) (69) (8,297) Non-GAAP net income $14,410 $32,310 $123,359 $14,571 $32,044 Non-GAAP Effective Tax Rate GAAP Effective Tax Rate 17.8% (1.8%) (14.8%) 9.7% (17.9%) Total adjustments to GAAP provision for income taxes (0.9%) 26.3% 25.9% 0.4% 26.1% Non-GAAP effective tax rate 16.9% 24.5% 11.1% 10.1% 8.2% Adjusted EBITDA GAAP Net (loss) income $13,520 $40,520 $131,577 $14,598 $35,709 Depreciation 2,662 4,576 9,168 1,666 2,877 Interest expense(income), net 390 135 (453) (9) (445) Provision(benefit) for income taxes 2,933 (715) (16,956) 1,577 (5,421) EBITDA $19,505 $44,516 $123,336 $17,832 $32,720 Stock-based compensation 407 825 20,745 290 4,632 Change in fair value of preferred stock warrant liability 483 2,154 3,361 (248) – Adjusted EBITDA $20,395 $47,495 $147,442 $17,874 $37,352 Year Ended December 31, (in thousands) Quarter Ended March 31, Copyright © 2017 – All Rights Reserved – Acacia Communications, Inc. I Connecting at the Speed of Light 20 |