Legal Disclosure Forward-looking statements This presentation contains “forward-looking” statements that are based on our management’s beliefs and assumptions and on information currently available to management. Forward-looking statements as defined by the Private Securities Litigation Reform Act of 1995. These forward-looking statements include, without limitation, statements regarding Tabula Rasa HealthCare, Inc.’s (“Tabula Rasa”) goals and expectations regarding its acquisition of SinfoníaRx and the resulting combined company, the expected synergies from the combined company and the expected financial and operating performance of Tabula Rasa following the completion of the acquisition. When used in this discussion, the words “may,” “believes,” “intends,” “seeks,” “anticipates,” “plans,” “estimates,” “expects,” “should,” “assumes,” “continues,” “could,” “will,” “future” and the negative of these or similar terms and phrases are intended to identify forward-looking statements. Forward-looking statements involve known and unknown risks, uncertainties and other factors that may cause Tabula Rasa’s actual results, performance or achievements to be materially different from any future results, performance or achievements expressed or implied by the forward-looking statements. Forward-looking statements represent our management’s beliefs and assumptions only as of the date of this presentation. Tabula Rasa’s actual future results may be materially different from what we expect. Except as required by law, we assume no obligation to update these forward-looking statements publicly, or to update the reasons actual results could differ materially from those anticipated in the forward-looking statements, even if new information becomes available in the future. This presentation includes Adjusted EBITDA which is a non-GAAP financial measure. Tabula Rasa has not provided a reconciliation of its guidance for Adjusted EBITDA to a comparable GAAP measure, in reliance on the unreasonable efforts exception provided under Item 10(e)(1)(i)(B) of Regulation S-K. Tabula Rasa is unable, without unreasonable efforts, to forecast certain items required to develop a meaningful comparable GAAP financial measure. These items include the allocation of the purchase price between assets classes. For completed fiscal periods, reconciliations to the most directly comparable GAAP financial measures are provided in the Investor Relations section of our corporate website, http://ir.trhc.com. Non-GAAP financial measures have limitations as an analytical tool. Investors are encouraged to review the reconciliation of non-GAAP measures to their most directly comparable GAAP measures. Medication Risk Mitigation 2
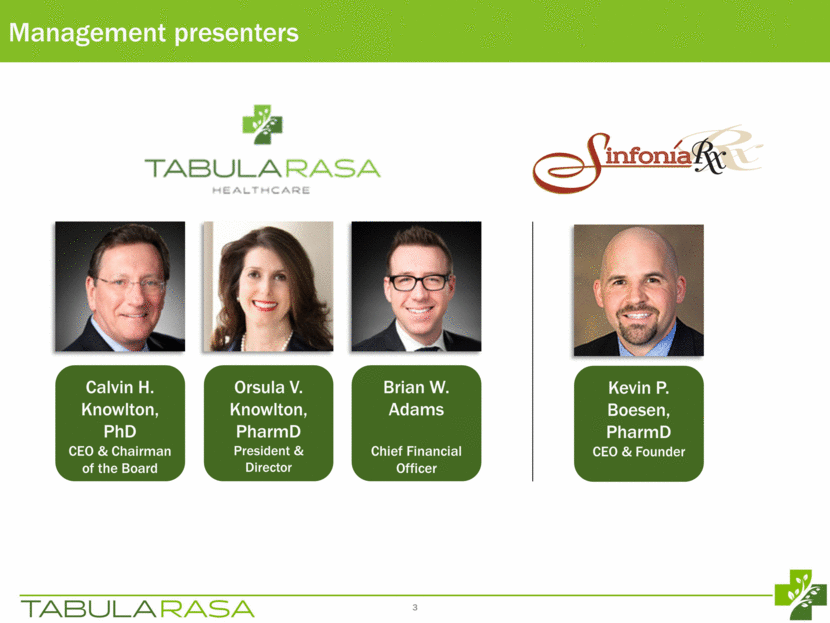
Management presenters Calvin H. Knowlton, PhD CEO & Chairman of the Board Brian W. Adams Chief Financial Officer Orsula V. Knowlton, PharmD President & Director 3 Kevin P. Boesen, PharmD CEO & Founder
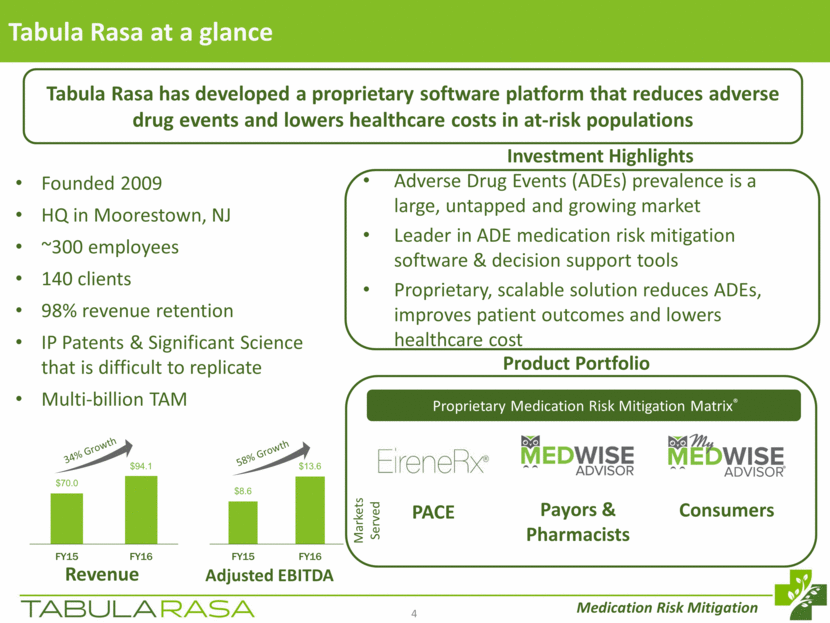
Tabula Rasa at a glance Founded 2009 HQ in Moorestown, NJ ~300 employees 140 clients 98% revenue retention IP Patents & Significant Science that is difficult to replicate Multi-billion TAM Proprietary Medication Risk Mitigation Matrix® Tabula Rasa has developed a proprietary software platform that reduces adverse drug events and lowers healthcare costs in at-risk populations Markets Served PACE Payors & Pharmacists Consumers Product Portfolio 34% Growth 58% Growth Revenue Adjusted EBITDA Medication Risk Mitigation 4 Adverse Drug Events (ADEs) prevalence is a large, untapped and growing market Leader in ADE medication risk mitigation software & decision support tools Proprietary, scalable solution reduces ADEs, improves patient outcomes and lowers healthcare cost Investment Highlights $70.0 $94.1 FY15 FY16 $8.6 $13.6 FY15 FY16
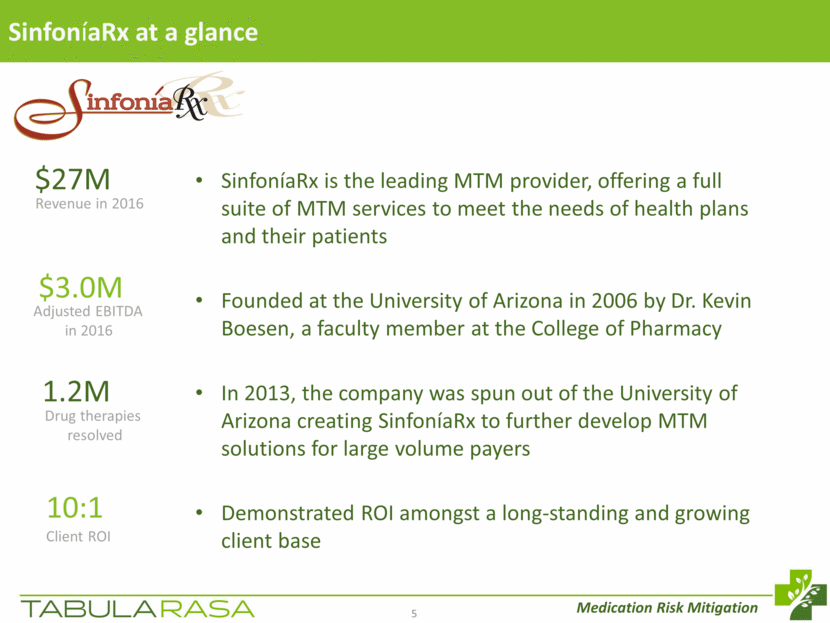
SinfoníaRx at a glance Medication Risk Mitigation 5 SinfoníaRx is the leading MTM provider, offering a full suite of MTM services to meet the needs of health plans and their patients Founded at the University of Arizona in 2006 by Dr. Kevin Boesen, a faculty member at the College of Pharmacy In 2013, the company was spun out of the University of Arizona creating SinfoníaRx to further develop MTM solutions for large volume payers Demonstrated ROI amongst a long-standing and growing client base 1.2M 10:1 Client ROI $27M Revenue in 2016 Drug therapies resolved $3.0M Adjusted EBITDA in 2016
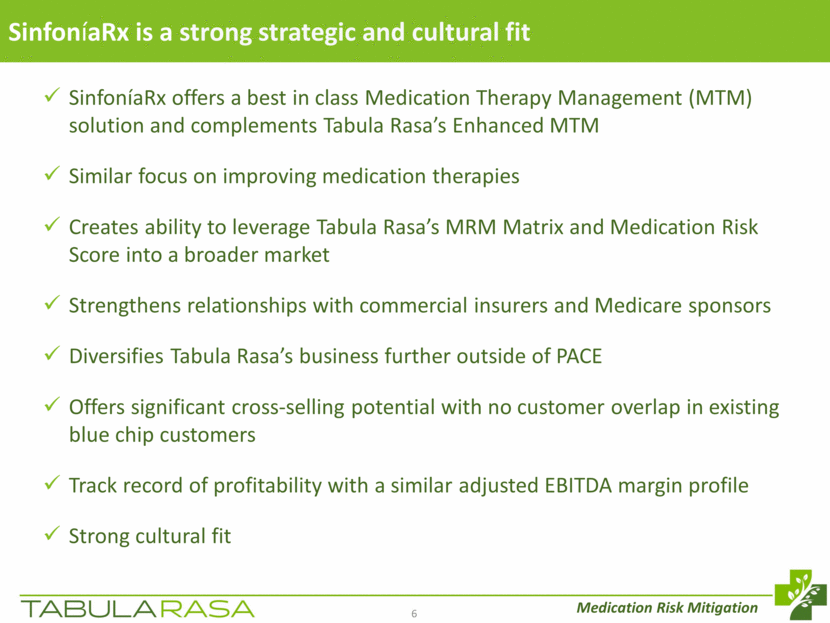
SinfoníaRx is a strong strategic and cultural fit Medication Risk Mitigation 6 SinfoníaRx offers a best in class Medication Therapy Management (MTM) solution and complements Tabula Rasa’s Enhanced MTM Similar focus on improving medication therapies Creates ability to leverage Tabula Rasa’s MRM Matrix and Medication Risk Score into a broader market Strengthens relationships with commercial insurers and Medicare sponsors Diversifies Tabula Rasa’s business further outside of PACE Offers significant cross-selling potential with no customer overlap in existing blue chip customers Track record of profitability with a similar adjusted EBITDA margin profile Strong cultural fit
SinfoníaRx Overview
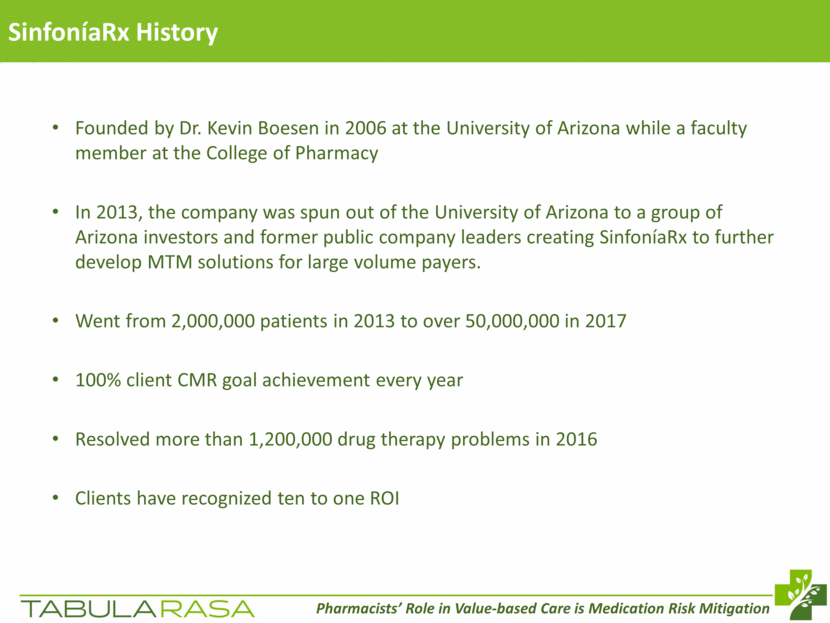
Founded by Dr. Kevin Boesen in 2006 at the University of Arizona while a faculty member at the College of Pharmacy In 2013, the company was spun out of the University of Arizona to a group of Arizona investors and former public company leaders creating SinfoníaRx to further develop MTM solutions for large volume payers. Went from 2,000,000 patients in 2013 to over 50,000,000 in 2017 100% client CMR goal achievement every year Resolved more than 1,200,000 drug therapy problems in 2016 Clients have recognized ten to one ROI SinfoníaRx History Pharmacists’ Role in Value-based Care is Medication Risk Mitigation
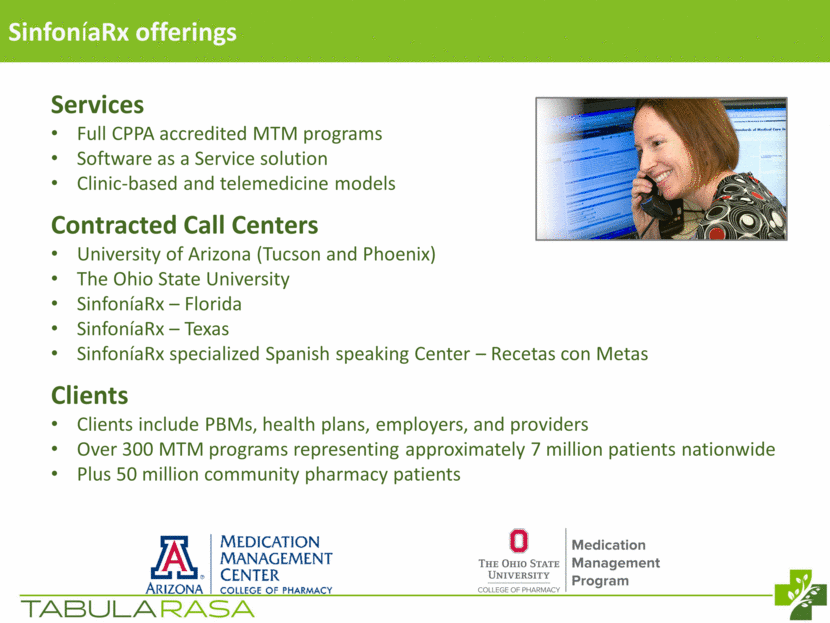
The Leading Provider of MTM Solutions Services Full CPPA accredited MTM programs Software as a Service solution Clinic-based and telemedicine models Contracted Call Centers University of Arizona (Tucson and Phoenix) The Ohio State University SinfoníaRx – Florida SinfoníaRx – Texas SinfoníaRx specialized Spanish speaking Center – Recetas con Metas Clients Clients include PBMs, health plans, employers, and providers Over 300 MTM programs representing approximately 7 million patients nationwide Plus 50 million community pharmacy patients SinfoníaRx offerings
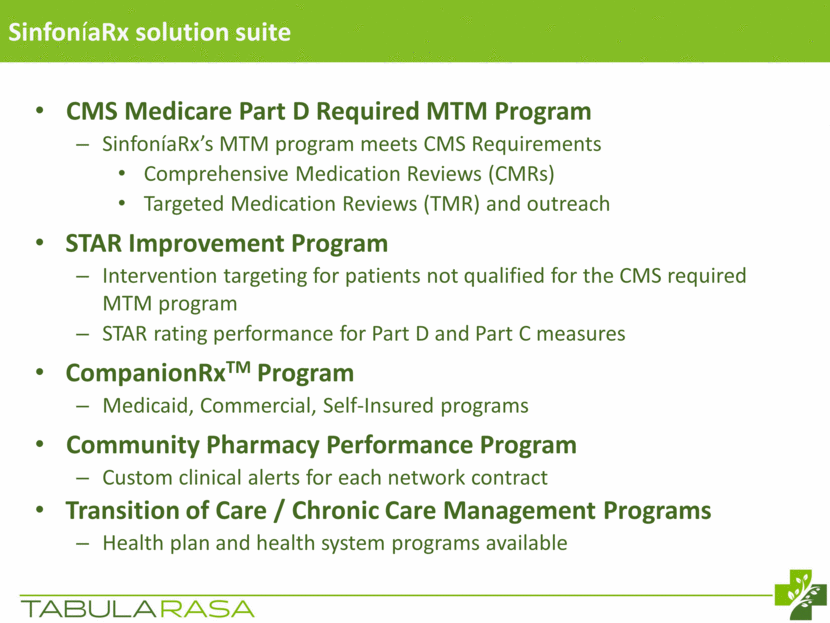
CMS Medicare Part D Required MTM Program SinfoníaRx’s MTM program meets CMS Requirements Comprehensive Medication Reviews (CMRs) Targeted Medication Reviews (TMR) and outreach STAR Improvement Program Intervention targeting for patients not qualified for the CMS required MTM program STAR rating performance for Part D and Part C measures CompanionRxTM Program Medicaid, Commercial, Self-Insured programs Community Pharmacy Performance Program Custom clinical alerts for each network contract Transition of Care / Chronic Care Management Programs Health plan and health system programs available SinfoníaRx solution suite
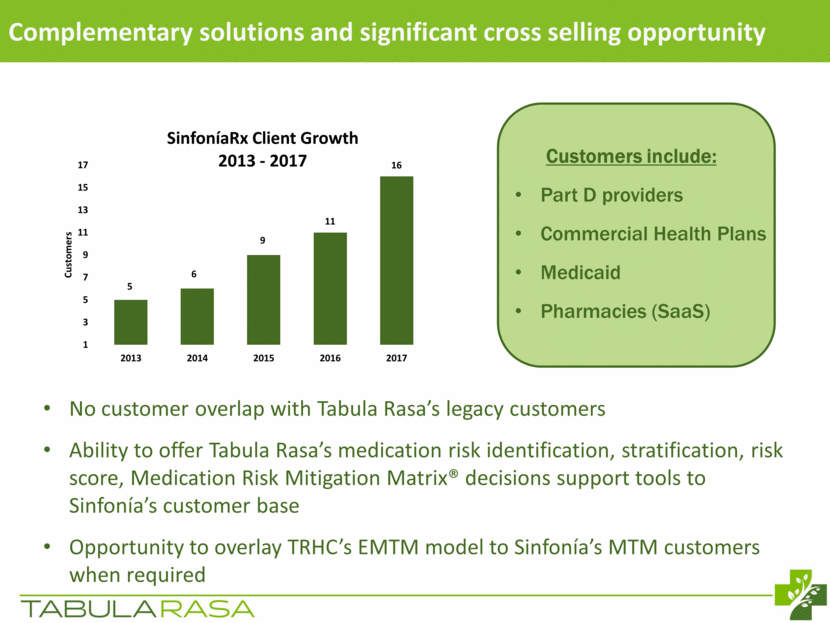
Complementary solutions and significant cross selling opportunity Customers include: Part D providers Commercial Health Plans Medicaid Pharmacies (SaaS) No customer overlap with Tabula Rasa’s legacy customers Ability to offer Tabula Rasa’s medication risk identification, stratification, risk score, Medication Risk Mitigation Matrix® decisions support tools to Sinfonía’s customer base Opportunity to overlay TRHC’s EMTM model to Sinfonía’s MTM customers when required 5 6 9 11 16 1 3 5 7 9 11 13 15 17 2013 2014 2015 2016 2017 Customers Sinfon í aRx Client Growth 2013 - 2017
Financial Overview
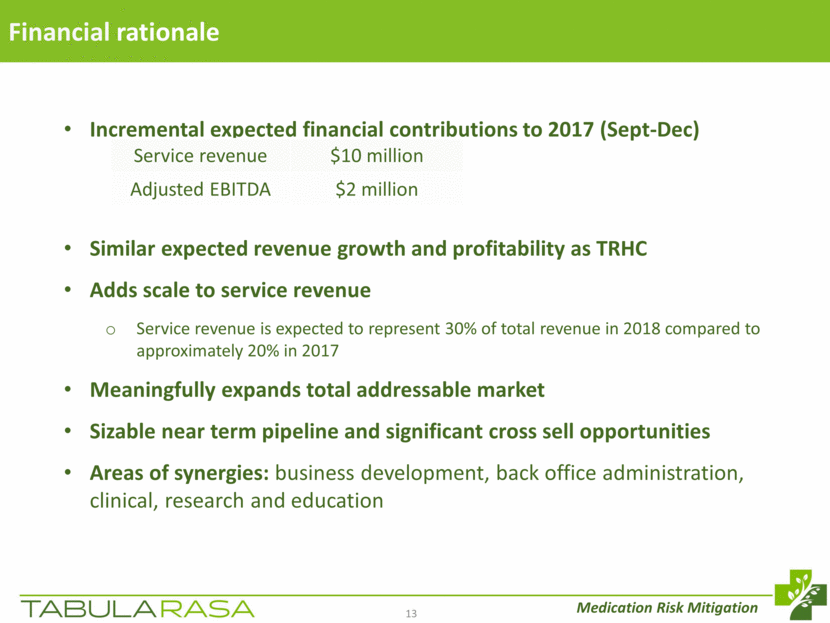
Financial rationale Medication Risk Mitigation 13 Incremental expected financial contributions to 2017 (Sept-Dec) Similar expected revenue growth and profitability as TRHC Adds scale to service revenue Service revenue is expected to represent 30% of total revenue in 2018 compared to approximately 20% in 2017 Meaningfully expands total addressable market Sizable near term pipeline and significant cross sell opportunities Areas of synergies: business development, back office administration, clinical, research and education Service revenue $10 million Adjusted EBITDA $2 million
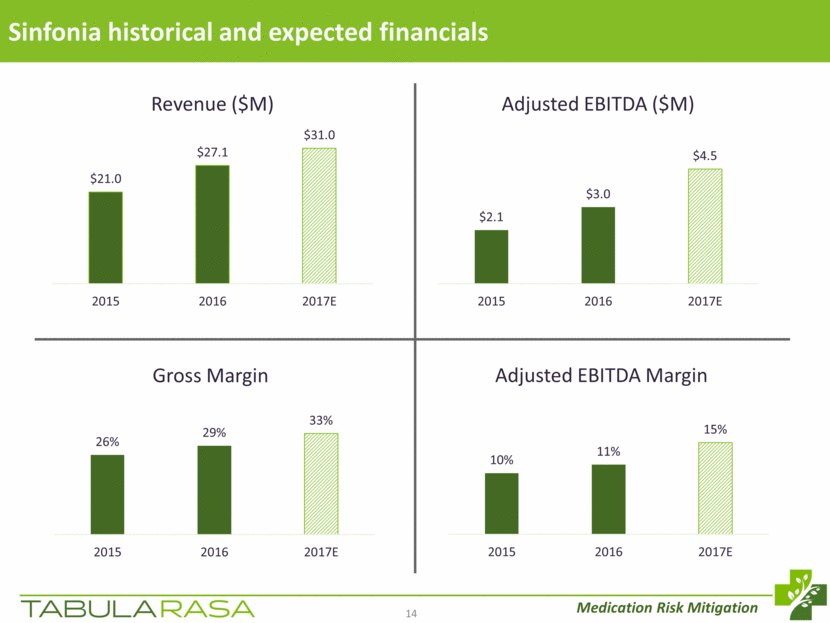
Sinfonia historical and expected financials Medication Risk Mitigation 14 $21.0 $27.1 $31.0 2015 2016 2017E Revenue ($M) $2.1 $3.0 $4.5 2015 2016 2017E Adjusted EBITDA ($M) 26% 29% 33% 2015 2016 2017E Gross Margin 10% 11% 15% 2015 2016 2017E Adjusted EBITDA Margin
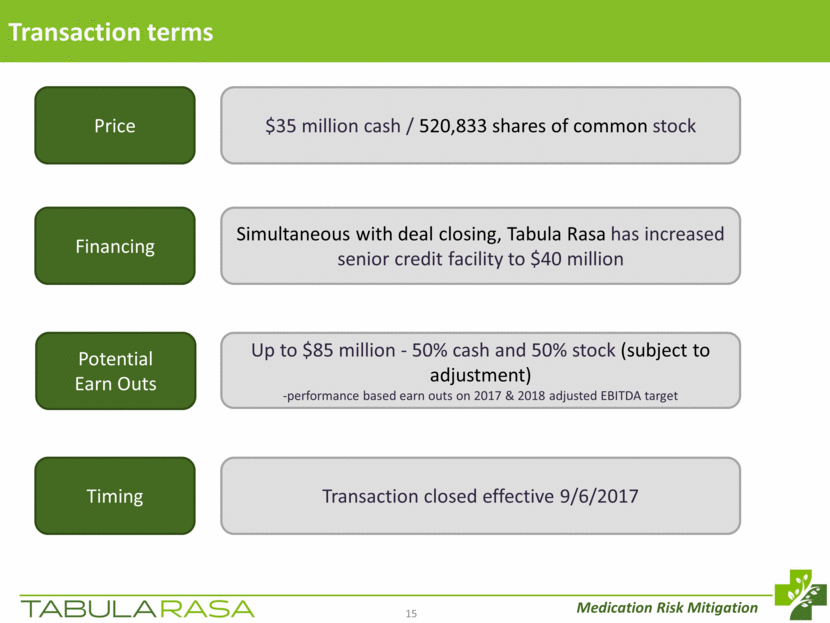
Transaction terms Medication Risk Mitigation 15 Price $35 million cash / 520,833 shares of common stock Financing Simultaneous with deal closing, Tabula Rasa has increased senior credit facility to $40 million Potential Earn Outs Up to $85 million - 50% cash and 50% stock (subject to adjustment) -performance based earn outs on 2017 & 2018 adjusted EBITDA target Timing Transaction closed effective 9/6/2017
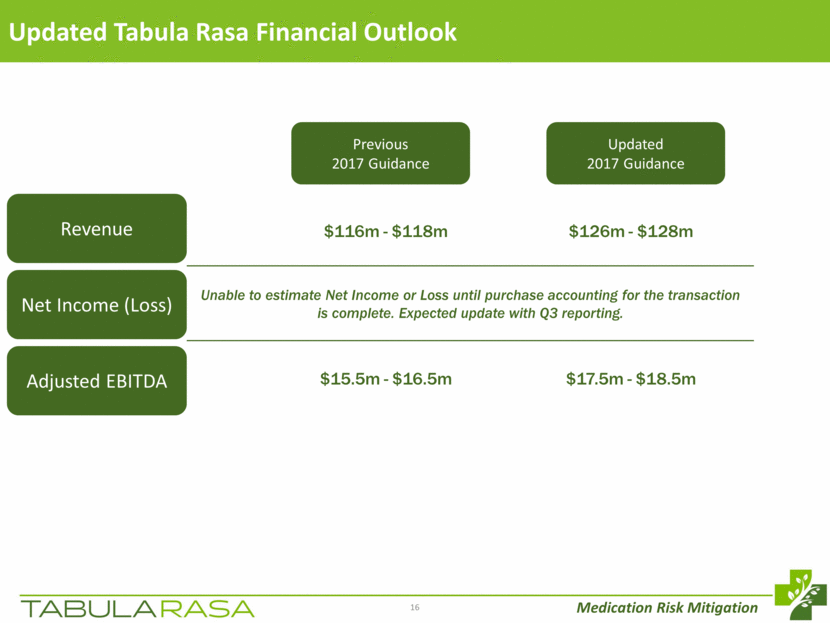
Updated Tabula Rasa Financial Outlook 16 $116m - $118m $126m - $128m Unable to estimate Net Income or Loss until purchase accounting for the transaction is complete. Expected update with Q3 reporting. $15.5m - $16.5m $17.5m - $18.5m Revenue Net Income (Loss) Adjusted EBITDA Medication Risk Mitigation Previous 2017 Guidance Updated 2017 Guidance
Closing
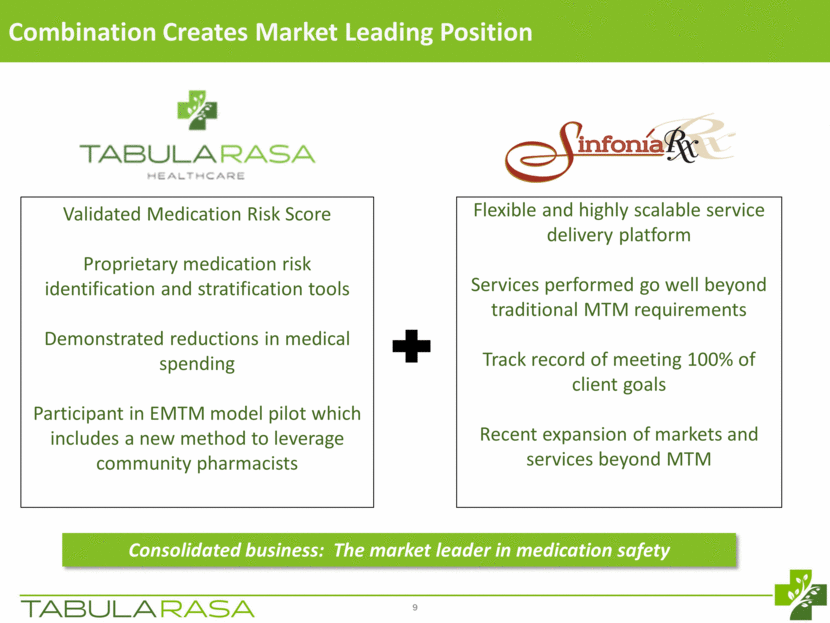
Flexible and highly scalable service delivery platform Services performed go well beyond traditional MTM requirements Track record of meeting 100% of client goals Recent expansion of markets and services beyond MTM Combination Creates Market Leading Position Validated Medication Risk Score Proprietary medication risk identification and stratification tools Demonstrated reductions in medical spending Participant in EMTM model pilot which includes a new method to leverage community pharmacists Consolidated business: The market leader in medication safety 9
Questions
Appendix
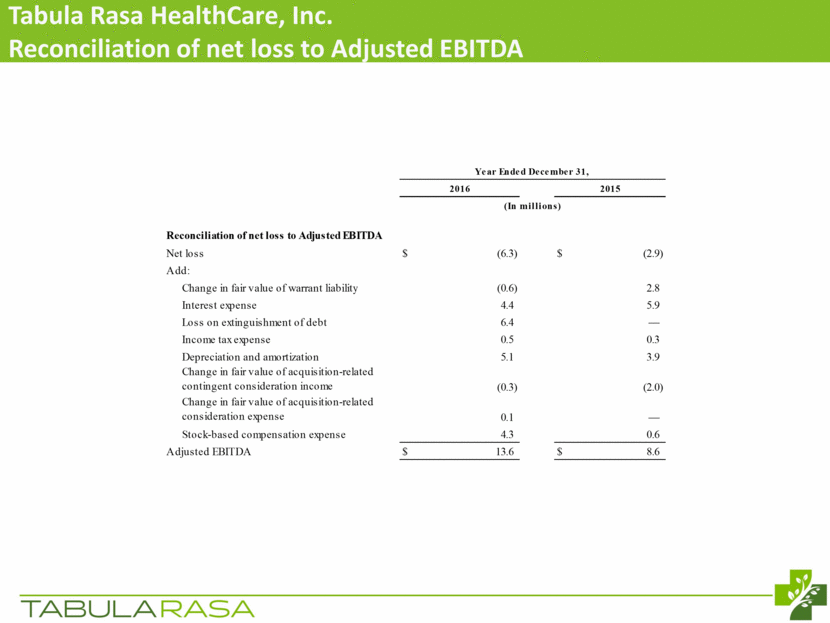
Tabula Rasa HealthCare, Inc. Reconciliation of net loss to Adjusted EBITDA Reconciliation of net loss to Adjusted EBITDA Net loss $ (6.3) $ (2.9) Add: Change in fair value of warrant liability (0.6) 2.8 Interest expense 4.4 5.9 Loss on extinguishment of debt 6.4 — Income tax expense 0.5 0.3 Depreciation and amortization 5.1 3.9 Change in fair value of acquisition-related contingent consideration income (0.3) (2.0) Change in fair value of acquisition-related consideration expense 0.1 — Stock-based compensation expense 4.3 0.6 Adjusted EBITDA $ 13.6 $ 8.6 (In millions) Year Ended December 31, 2016 2015
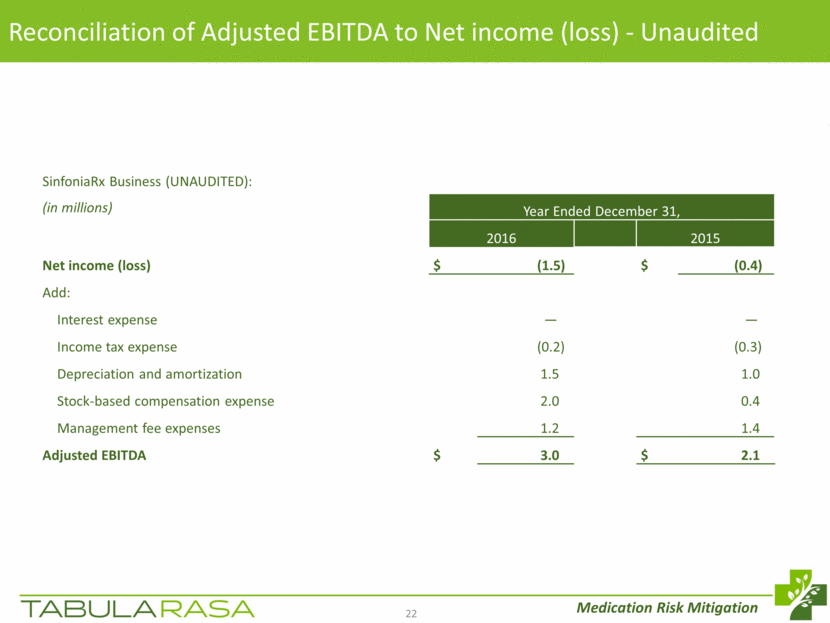
Reconciliation of Adjusted EBITDA to Net income (loss) - Unaudited Medication Risk Mitigation 22 SinfoniaRx Business (UNAUDITED): (in millions) Year Ended December 31, 2016 2015 Net income (loss) $ (1.5) $ (0.4) Add: Interest expense — — Income tax expense (0.2) (0.3) Depreciation and amortization 1.5 1.0 Stock-based compensation expense 2.0 0.4 Management fee expenses 1.2 1.4 Adjusted EBITDA $ 3.0 $ 2.1