UNITED STATES
SECURITIES AND EXCHANGE COMMISSION
WASHINGTON, D.C. 20549
FORM N-CSR
CERTIFIED SHAREHOLDER REPORT OF REGISTERED MANAGEMENT
INVESTMENT COMPANIES
Investment Company Act file number 811-23090
Oppenheimer Small Cap Value Fund
(Exact name of registrant as specified in charter)
6803 South Tucson Way, Centennial, Colorado 80112-3924
(Address of principal executive offices) (Zip code)
Cynthia Lo Bessette
OFI Global Asset Management, Inc.
225 Liberty Street, New York, New York 10281-1008
(Name and address of agent for service)
Registrant’s telephone number, including area code: (303) 768-3200
Date of fiscal year end: April 30
Date of reporting period: 4/29/2016
Item 1. Reports to Stockholders.
Annual Report
| 4/30/2016
| |||||
| ||||||
| ||||||

Oppenheimer Small Cap Value Fund
|
Class A Shares
CUMULATIVE TOTAL RETURNS AT 4/29/16*
Class A Shares of the Fund | ||||||
Russell 2000 Value Index
| ||||||
Without Sales Charge
| With Sales Charge
| |||||
Since Inception (12/7/15) | 1.40% | -4.43% | 1.60% | |||
Performance data quoted represents past performance, which does not guarantee future results. The investment return and principal value of an investment in the Fund will fluctuate so that an investor’s shares, when redeemed, may be worth more or less than their original cost. Fund returns include changes in share price, reinvested distributions, and a 5.75% maximum applicable sales charge except where “without sales charge” is indicated. Current performance may be lower or higher than the performance quoted. Returns do not consider capital gains or income taxes on an individual’s investment. For performance data current to the most recent month-end, visit oppenheimerfunds.com or call 1.800.CALL OPP (225.5677).
*April 29, 2016, was the last business day of the Fund’s fiscal year. See Note 2 of the accompanying Notes to Financial Statements. Index returns are calculated through April 30, 2016.
2 OPPENHEIMER SMALL CAP VALUE FUND
Since the Fund’s inception on December 7, 2015 through April 29, 2016, its Class A shares (without sales charge) produced a return of 1.40%. In comparison, the Russell 2000 Value Index (the “Index”) returned 1.60% during the same period. The Fund’s underperformance versus the Index stemmed from weaker relative stock selection in the industrials, financials and health care sectors. The Fund outperformed the Index within energy due to stock selection and an overweight position, and in consumer discretionary and information technology as a result of stock selection.
MARKET OVERVIEW
Since the Fund commenced operations on December 7, 2015 through April 29, 2016, markets have been volatile. Shortly after the Fund launched in December 2015, the U.S. Federal Reserve (the “Fed”) finally enacted their long-awaited rate rise, to mixed reviews. In addition, plummeting energy prices, decelerating emerging market growth and sluggish developed market growth all contributed to an environment where investor sentiment swung back and forth like a pendulum to close 2015. Volatility continued in the first four months of 2016. Adding to concerns over China’s slowing economy and falling crude oil prices were concerns of slowing global and domestic economic growth. However, sentiment improved in March as the Fed began to hint at lowering the trajectory of rate rises. Oil prices stabilized. Commodities, which have been declining from their super cycle peak for some time, rallied. In all, the Fund and the Index ended the period with a muted positive return.
While macroeconomic trends are interesting, one of the benefits of small-cap investing is we can largely divorce ourselves from the global economy and focus instead on individual companies. The sheer number of small-cap companies provides us with the opportunity to differentiate the Fund from the Index. The volatility in the global equity markets during the reporting period, while challenging, also presented investors with opportunities unlike any we have seen in many years. Between January 1 and February 12, roughly 30% of the companies in the Index were down over 20%. Almost 60% were down over 10%. So 30% of the Index constituents were in a “bear” market, and 60% experienced a “correction,” all in the first six weeks of 2016.
As value investors, our mouths begin to water when we see that kind of performance in such a short period of time, because for the most part, intrinsic values of individual business do not typically experience such abrupt changes.
3 OPPENHEIMER SMALL CAP VALUE FUND
Therein lies the opportunity. We were able to take advantage of the short-term changes in market prices to position the portfolio for the rest of the year.
FUND REVIEW
As mentioned earlier, energy was the Fund’s top performing sector during the reporting period. Weakness in energy stocks during the first few weeks of 2016 allowed us to add to positions in the sector, including WPX Energy, Inc. and Delek US Holdings, Inc. WPX is an independent petroleum and natural gas exploration and production company operating in the Permian Basin in Texas, the Williston Basin in North Dakota, and the San Juan Basin in New Mexico. New management has pursued a strategy of divesting non-core assets and a renewed focus on their most profitable acreage. Delek operates oil refineries and retail convenience stores, and has the opportunity to improve operations in both segments. WPX Energy, Inc. was the top performing holding of the Fund for the overall reporting period. Delek US Holdings detracted from performance this period.
Following WPX Energy, Huntsman Corp. and Potlatch Corp. were the next best performing holdings for the Fund this reporting period. Huntsman is a manufacturer of differentiated organic chemical products and of inorganic chemical products. Its shares performed positively during the reporting period. We
added to our position in Potlatch Corp., which is the Fund’s top holding at period end. Potlatch is a specialized real estate investment trust (REIT) that owns timberland in the United States. Currently the company is being valued at a discount to recent private market timberland transactions.
Aside from Delek US Holdings, top detractors included First NBC Bank Holding Co. and Esterline Technologies Corp. First NBC stated it would restate its financials from 2013-2015 because it undercounted losses from tax credit investments. Shares of Esterline, a provider of engineered products for the aerospace and defense industry, were down after reporting disappointing quarterly results.
STRATEGY & OUTLOOK
Our research process is centered around finding companies with improving return on invested capital, where that improvement has yet to be realized in today’s price. This process uncovered ideas during the reporting period that are more likely to be thought of as deep value (e.g. energy and materials).
We also believe this focus on value is timely. Since early 2009, the growth style of investing has significantly outperformed the value style. As value investors, this period has been a difficult one. But data is beginning to emerge that may suggest that value as a style may come back into favor:
4 OPPENHEIMER SMALL CAP VALUE FUND
| ● | Value dispersion—since 2009, the dispersion of valuations had been narrowing. In other words, the multiples investors pay for stocks has been converging. In such markets, growth tends to outperform as growth rates become the differentiating factor between businesses. Over the past year, those valuations have diverged significantly, which tends to reward a focus on valuation. |
| ● | Absolute valuations—the relative valuations of growth versus value, in aggregate, has approached peak levels, suggesting that the value portion of the market has become more attractive. This valuation data has tended to foreshadow value outperformance. |
| ● | Capital allocation trends—market volatility and economic uncertainty have led a number of companies to re-evaluate capital plans, most notably in the energy sector. The focus on prudently managing capital investments may generate higher long-term returns on capital, which tends to drive valuations higher. |
While many investors focus on a short-term view when considering potential investments, the Fund utilizes in-depth fundamental research to identify small-cap companies that we believe are poised for an unanticipated acceleration in return on invested capital over a multi-year time horizon. We believe this longer term approach provides a more comprehensive outlook of potential investments by focusing on all three financial statements—income statement, balance sheet and statement of cash flows—and helps us uncover companies whose generation and use of free cash flow we deem as yet to be fully reflected in the current stock price.
 |
| |
| Eric Hewitt | ||
| Portfolio Manager |

5 OPPENHEIMER SMALL CAP VALUE FUND
TOP TEN COMMON STOCK HOLDINGS
| Potlatch Corp. | 2.5% | |||
| WPX Energy, Inc. | 1.7 | |||
| MDC Holdings, Inc. | 1.6 | |||
| B&G Foods, Inc. | 1.6 | |||
| Huntsman Corp. | 1.5 | |||
| Great Western Bancorp, Inc. | 1.5 | |||
| Retail Opportunity Investments Corp. | 1.4 | |||
| Glacier Bancorp, Inc. | 1.4 | |||
| Louisiana-Pacific Corp. | 1.4 | |||
| Associated Banc-Corp. | 1.4 |
Portfolio holdings and allocations are subject to change. Percentages are as of April 29, 2016, and are based on net assets. For more current Fund holdings, please visit oppenheimerfunds.com.
TOP TEN COMMON STOCK INDUSTRIES
| Commercial Banks | 11.3% | |||
| Real Estate Investment Trusts (REITs) | 10.1 | |||
| Oil, Gas & Consumable Fuels | 6.1 | |||
| Insurance | 5.9 | |||
| Food Products | 4.3 | |||
| Hotels, Restaurants & Leisure | 4.0 | |||
| Electronic Equipment, Instruments, & Components | 3.9 | |||
| Capital Markets | 3.3 | |||
| Aerospace & Defense | 3.3 | |||
| Household Durables | 3.1 |
Portfolio holdings and allocations are subject to change. Percentages are as of April 29, 2016, and are based on net assets.
SECTOR ALLOCATION
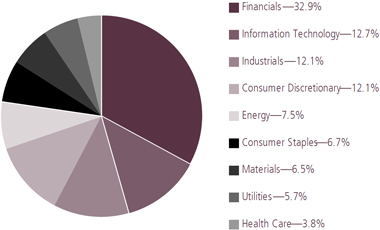
Portfolio holdings and allocations are subject to change. Percentages are as of April 29, 2016, and are based on the total market value of common stocks.
*April 29, 2016, was the last business day of the Fund’s fiscal year. See Note 2 of the accompanying Notes to Financial Statements.
6 OPPENHEIMER SMALL CAP VALUE FUND
Share Class Performance
CUMULATIVE TOTAL RETURNS WITHOUT SALES CHARGE AS OF 4/29/16
Inception
|
Since
| |||||||
Class A (OVSAX) |
|
12/7/15 |
| 1.40 | % | |||
Class C (OVSCX) |
|
12/7/15 |
| 1.07 | ||||
Class I (OVSIX) |
|
12/7/15 |
| 1.50 | ||||
Class R (OVSRX) |
|
12/7/15 |
| 1.27 | ||||
Class Y (OVSYX) |
|
12/7/15 |
| 1.44 | ||||
CUMULATIVE TOTAL RETURNS WITH SALES CHARGE AS OF 4/29/16
Inception
|
Since
| |||||||
Class A (OVSAX) |
|
12/7/15 |
| -4.43 | % | |||
Class C (OVSCX) |
|
12/7/15 |
| 0.07 | ||||
Class I (OVSIX) |
|
12/7/15 |
| 1.50 | ||||
Class R (OVSRX) |
|
12/7/15 |
| 1.27 | ||||
Class Y (OVSYX) |
|
12/7/15 |
| 1.44 | ||||
Performance data quoted represents past performance, which does not guarantee future results. The investment return and principal value of an investment in the Fund will fluctuate so that an investor’s shares, when redeemed, may be worth more or less than their original cost. Current performance may be lower or higher than the performance quoted. Returns do not consider capital gains or income taxes on an individual’s investment. For performance data current to the most recent month-end, visit oppenheimerfunds.com or call 1.800. CALL OPP (225.5677). Fund returns include changes in share price, reinvested distributions, and the applicable sales charge: for Class A shares, the current maximum initial sales charge of 5.75% and for Class C shares, the contingent deferred sales charge (“CDSC”) of 1% for the 1-year period. There is no sales charge for Class I and Class Y shares.
The Fund’s performance is compared to the performance of the Russell 2000® Value Index, which measures the performance of the small-cap value segment of the U.S. equity universe. It includes those Russell 2000 companies with lower price-to-book ratios and lower forecasted growth values. The Index is unmanaged and cannot be purchased directly by investors. While index comparisons may be useful to provide a benchmark for the Fund’s performance, it must be noted that the Fund’s investments are not limited to the investments comprising the Index. Index performance includes reinvestment of income, but does not reflect transaction costs, fees, expenses or taxes. Index performance is shown for illustrative purposes only as a benchmark for the Fund’s performance, and does not predict or depict performance of the Fund. The Fund’s performance reflects the effects of the Fund’s business and operating expenses.
The Fund’s investment strategy and focus can change over time. The mention of specific fund holdings does not constitute a recommendation by OppenheimerFunds, Inc. or its affiliates.
7 OPPENHEIMER SMALL CAP VALUE FUND
Before investing in any of the Oppenheimer funds, investors should carefully consider a fund’s investment objectives, risks, charges and expenses. Fund prospectuses and summary prospectuses contain this and other information about the funds, and may be obtained by asking your financial advisor, visiting oppenheimerfunds.com, or calling 1.800.CALL OPP (225.5677). Read prospectuses and summary prospectuses carefully before investing.
Shares of Oppenheimer funds are not deposits or obligations of any bank, are not guaranteed by any bank, are not insured by the FDIC or any other agency, and involve investment risks, including the possible loss of the principal amount invested.
8 OPPENHEIMER SMALL CAP VALUE FUND
Fund Expenses. As a shareholder of the Fund, you incur two types of costs: (1) transaction costs, which may include sales charges (loads) on purchase payments and/or contingent deferred sales charges on redemptions; and (2) ongoing costs, including management fees; distribution and service fees; and other Fund expenses. These examples are intended to help you understand your ongoing costs (in dollars) of investing in the Fund and to compare these costs with the ongoing costs of investing in other mutual funds.
The examples for Actual Expenses are based on an investment of $1,000.00 invested at the beginning of the period, December 7, 2015 (commencement of operations) and held for the period ended April 29, 2016. The Hypothetical Examples for Comparison Purposes are based on an investment of $1,000.00 invested on November 1, 2015 and held for the entire 6-month period ended April 29, 2016.
Actual Expenses. The first section of the table provides information about actual account values and actual expenses. You may use the information in this section for the class of shares you hold, together with the amount you invested, to estimate the expense that you paid over the period. Simply divide your account value by $1,000.00 (for example, an $8,600.00 account value divided by $1,000.00 = 8.60), then multiply the result by the number in the first section under the heading entitled “Expenses Paid During 6 Months Ended April 29, 2016” to estimate the expenses you paid on your account during this period.
Hypothetical Example for Comparison Purposes. The second section of the table provides information about hypothetical account values and hypothetical expenses based on the Fund’s actual expense ratio for each class of shares, and an assumed rate of return of 5% per year for each class before expenses, which is not the Fund’s actual return. The hypothetical account values and expenses may not be used to estimate the actual ending account balance or expenses you paid for the period. You may use this information to compare the ongoing costs of investing in the Fund and other funds. To do so, compare this 5% hypothetical example for the class of shares you hold with the 5% hypothetical examples that appear in the shareholder reports of the other funds.
Please note that the expenses shown in the table are meant to highlight your ongoing costs only and do not reflect any transactional costs, such as front-end or contingent deferred sales charges (loads). Therefore, the “hypothetical” section of the table is useful in comparing ongoing costs only, and will not help you determine the relative total costs of owning different funds. In addition, if these transactional costs were included, your costs would have been higher.
9 OPPENHEIMER SMALL CAP VALUE FUND
| Actual | Beginning Account Value | Ending Account Value | Expenses Paid During | |||
| ||||||
Class A | $ 1,000.00 | $ 1,014.00 | $ 4.96 | |||
| ||||||
Class C | 1,000.00 | 1,010.70 | 7.88 | |||
| ||||||
Class I | 1,000.00 | 1,015.00 | 3.68 | |||
| ||||||
Class R | 1,000.00 | 1,012.70 | 5.84 | |||
| ||||||
Class Y | 1,000.00 | 1,014.40 | 3.96 | |||
| Hypothetical | ||||||
| (5% return before expenses) | ||||||
| ||||||
Class A | 1,000.00 | 1,018.59 | 6.21 | |||
| ||||||
Class C | 1,000.00 | 1,014.98 | 9.86 | |||
| ||||||
Class I | 1,000.00 | 1,020.18 | 4.61 | |||
| ||||||
Class R | 1,000.00 | 1,017.51 | 7.31 | |||
| ||||||
Class Y | 1,000.00 | 1,019.83 | 4.96 | |||
1. Actual expenses paid are equal to the Fund’s annualized expense ratio for that class, multiplied by the average account value of the period, multiplied by 145/366 to reflect the period from December 7, 2015 (commencement of operations) to April 29, 2016.
2. Hypothetical expenses paid are equal to the Fund’s annualized expense ratio for that class, multiplied by the average account value over the period, multiplied by 181/366 (to reflect the one-half year period).
The expense ratios for the period from December 7, 2015 (commencement of operations) to April 29, 2016 are as follows:
| Class | Expense Ratios | |||
| ||||
Class A | 1.24% | |||
| ||||
Class C | 1.97 | |||
| ||||
Class I | 0.92 | |||
| ||||
Class R | 1.46 | |||
| ||||
Class Y | 0.99 | |||
The expense ratios reflect voluntary and/or contractual waivers and/or reimbursements of expenses by the Fund’s Manager. Some of these undertakings may be modified or terminated at any time, as indicated in the Fund’s prospectus. The “Financial Highlights” tables in the Fund’s financial statements, included in this report, also show the gross expense ratios, without such waivers or reimbursements and reduction to custodian expenses, if applicable.
10 OPPENHEIMER SMALL CAP VALUE FUND
STATEMENT OF INVESTMENTS April 29, 2016*
| Shares | Value | |||||||
| ||||||||
| Common Stocks—98.0% | ||||||||
| ||||||||
| Consumer Discretionary—11.8% | ||||||||
| ||||||||
| Auto Components—0.3% | ||||||||
| Visteon Corp. | 290 | $ 23,104 | ||||||
| ||||||||
| Automobiles—1.2% | ||||||||
| Thor Industries, Inc. | 1,189 | 76,120 | ||||||
| ||||||||
| Hotels, Restaurants & Leisure—4.0% | ||||||||
| Del Frisco’s Restaurant Group, Inc.1 | 4,560 | 72,641 | ||||||
| ||||||||
| Del Taco Restaurants, Inc.1 | 5,391 | 48,788 | ||||||
| ||||||||
| Intrawest Resorts Holdings, Inc.1 | 6,520 | 56,333 | ||||||
| ||||||||
| SeaWorld Entertainment, Inc. | 4,283 | 85,360 | ||||||
|
| |||||||
| 263,122 | ||||||||
| ||||||||
| Household Durables—3.1% | ||||||||
| LGI Homes, Inc.1 | 2,406 | 67,392 | ||||||
| ||||||||
| MDC Holdings, Inc. | 4,220 | 103,854 | ||||||
| ||||||||
| WCI Communities, Inc.1 | 2,207 | 35,268 | ||||||
|
| |||||||
| 206,514 | ||||||||
| ||||||||
| Leisure Products—0.3% | ||||||||
| Performance Sports Group Ltd.1 | 5,202 | 19,300 | ||||||
| ||||||||
| Media—1.9% | ||||||||
| Gannett Co., Inc. | 3,161 | 53,263 | ||||||
| ||||||||
| Regal Entertainment Group, Cl. A | 3,438 | 71,682 | ||||||
|
| |||||||
| 124,945 | ||||||||
| ||||||||
| Multiline Retail—0.8% | ||||||||
| Tuesday Morning Corp.1 | 5,787 | 50,231 | ||||||
| ||||||||
| Textiles, Apparel & Luxury Goods—0.2% | ||||||||
| Deckers Outdoor Corp.1 | 268 | 15,493 | ||||||
| ||||||||
| Consumer Staples—6.5% | ||||||||
| ||||||||
| Beverages—1.2% | ||||||||
| National Beverage Corp.1 | 1,682 | 78,617 | ||||||
| ||||||||
| Food Products—4.3% | ||||||||
| B&G Foods, Inc. | 2,484 | 102,366 | ||||||
| ||||||||
| Hain Celestial Group, Inc. (The)1 | 719 | 30,097 | ||||||
| ||||||||
| John B Sanfilippo & Son, Inc. | 1,369 | 75,747 | ||||||
| Shares | Value | |||||||
| ||||||||
| Food Products (Continued) | ||||||||
| ||||||||
| SunOpta, Inc.1 | 13,672 | $ | 73,555 | |||||
|
| |||||||
| 281,765 | ||||||||
| ||||||||
| Tobacco—1.0% | ||||||||
| Vector Group Ltd. | 3,208 | 69,293 | ||||||
| ||||||||
| Energy—7.4% | ||||||||
| ||||||||
| Energy Equipment & Services—1.3% | ||||||||
| Oceaneering International, Inc. | 600 | 21,990 | ||||||
| ||||||||
| Patterson-UTI Energy, Inc. | 3,247 | 64,128 | ||||||
|
| |||||||
| 86,118 | ||||||||
| ||||||||
| Oil, Gas & Consumable Fuels—6.1% | ||||||||
| Delek US Holdings, Inc. | 5,853 | 93,004 | ||||||
| ||||||||
| Denbury Resources, Inc. | 12,477 | 48,161 | ||||||
| ||||||||
| Gran Tierra Energy, Inc.1 | 7,601 | 22,499 | ||||||
| ||||||||
| Newfield Exploration Co.1 | 684 | 24,795 | ||||||
| ||||||||
| SM Energy Co. | 1,586 | 49,420 | ||||||
| ||||||||
| Whiting Petroleum Corp.1 | 4,082 | 48,984 | ||||||
| ||||||||
| WPX Energy, Inc.1 | 11,453 | 110,636 | ||||||
|
| |||||||
| 397,499 | ||||||||
| ||||||||
| Financials—32.2% | ||||||||
| ||||||||
| Capital Markets—3.3% | ||||||||
| Ares Management LP2 | 5,718 | 82,968 | ||||||
| ||||||||
| Houlihan Lokey, Inc., Cl. A | 2,789 | 70,311 | ||||||
| ||||||||
| Moelis & Co., Cl. A | 2,313 | 65,018 | ||||||
|
| |||||||
| 218,297 | ||||||||
| ||||||||
| Commercial Banks—11.3% | ||||||||
| Associated Banc-Corp. | 5,106 | 93,133 | ||||||
| ||||||||
| BancorpSouth, Inc. | 2,648 | 62,202 | ||||||
| ||||||||
| CoBiz Financial, Inc. | 5,704 | 69,075 | ||||||
| ||||||||
| First Interstate BancSystem, Inc., Cl. A | 2,330 | 63,143 | ||||||
| ||||||||
| First NBC Bank Holding Co.1 | 2,847 | 61,894 | ||||||
| ||||||||
| Glacier Bancorp, Inc. | 3,659 | 94,732 | ||||||
| ||||||||
| Great Western Bancorp, Inc. | 3,058 | 96,388 | ||||||
| ||||||||
| PacWest Bancorp | 1,356 | 54,213 | ||||||
11 OPPENHEIMER SMALL CAP VALUE FUND
STATEMENT OF INVESTMENTS Continued
| Shares | Value | |||||||
| ||||||||
| Commercial Banks (Continued) | ||||||||
| ||||||||
| Talmer Bancorp, Inc., Cl. A | 3,098 | $ | 60,101 | |||||
| ||||||||
| Umpqua Holdings Corp. | 5,715 | 90,468 | ||||||
|
| |||||||
|
| 745,349
|
| ||||||
| ||||||||
| Consumer Finance—0.6% | ||||||||
| Navient Corp. |
| 2,940
|
|
| 40,190
|
| ||
| ||||||||
| Insurance—5.9% | ||||||||
| CNO Financial Group, Inc. | 4,272 | 78,477 | ||||||
| ||||||||
| Genworth Financial, Inc., Cl. A1 | 14,500 | 49,735 | ||||||
| ||||||||
| Hanover Insurance Group, Inc. (The) | 973 | 83,445 | ||||||
| ||||||||
| Horace Mann Educators Corp. | 2,660 | 82,726 | ||||||
| ||||||||
| Validus Holdings Ltd. | 1,948 | 89,783 | ||||||
|
| |||||||
|
| 384,166
|
| ||||||
| ||||||||
| Real Estate Investment Trusts (REITs)—10.1% | ||||||||
| Care Capital Properties, Inc. | 2,610 | 69,609 | ||||||
| ||||||||
| Communications Sales & Leasing, Inc. | 1,522 | 35,356 | ||||||
| ||||||||
| CubeSmart | 302 | 8,942 | ||||||
| ||||||||
| DuPont Fabros Technology, Inc. | 1,800 | 71,676 | ||||||
| ||||||||
| Equity LifeStyle Properties, Inc. | 1,054 | 72,188 | ||||||
| ||||||||
| Healthcare Realty Trust, Inc. | 1,886 | 57,108 | ||||||
| ||||||||
| LaSalle Hotel Properties | 1,717 | 41,036 | ||||||
| ||||||||
| Potlatch Corp. | 4,576 | 161,167 | ||||||
| ||||||||
| Retail Opportunity Investments Corp. | 4,817 | 94,750 | ||||||
| ||||||||
| STORE Capital Corp. | 1,556 | 39,943 | ||||||
| ||||||||
| WP Glimcher, Inc. | 1,295 | 13,585 | ||||||
|
| |||||||
|
| 665,360
|
| ||||||
| ||||||||
| Real Estate Management & Development—1.0% | ||||||||
| RE/MAX Holdings, Inc., Cl. A |
| 1,791
|
|
| 65,909
|
| ||
| ||||||||
| Health Care—3.7% | ||||||||
| ||||||||
| Health Care Equipment & Supplies—0.8% | ||||||||
| Greatbatch, Inc.1 | 455 | 15,834 | ||||||
| ||||||||
| Halyard Health, Inc.1 | 1,399 | 39,396 | ||||||
|
| |||||||
| 55,230 | ||||||||
| Shares | Value | |||||||
| ||||||||
| Health Care Providers & Services—0.5% | ||||||||
| Owens & Minor, Inc. |
| 798
|
| $
| 29,039
|
| ||
| ||||||||
| Life Sciences Tools & Services—0.3% | ||||||||
| VWR Corp.1 |
| 793
|
|
| 21,126
|
| ||
| ||||||||
| Pharmaceuticals—2.1% | ||||||||
| Indivior plc | 35,997 | 84,452 | ||||||
| ||||||||
| Medicines Co. (The)1 | 1,582 | 56,303 | ||||||
|
| |||||||
|
| 140,755
|
| ||||||
| ||||||||
| Industrials—11.9% | ||||||||
| ||||||||
| Aerospace & Defense—3.3% | ||||||||
| BWX Technologies, Inc. | 2,014 | 67,248 | ||||||
| ||||||||
| Esterline Technologies Corp.1 | 1,056 | 72,505 | ||||||
| ||||||||
| Orbital ATK, Inc. | 892 | 77,604 | ||||||
|
| |||||||
|
| 217,357
|
| ||||||
| ||||||||
| Air Freight & Couriers—0.6% | ||||||||
| XPO Logistics, Inc.1 |
| 1,250
|
|
| 37,675
|
| ||
| ||||||||
| Building Products—1.2% | ||||||||
| Ply Gem Holdings, Inc.1 | 430 | 6,299 | ||||||
| ||||||||
| Universal Forest Products, Inc. | 921 | 70,595 | ||||||
|
| |||||||
|
| 76,894
|
| ||||||
| ||||||||
| Commercial Services & Supplies—0.6% | ||||||||
| Deluxe Corp. |
| 687
|
|
| 43,130
|
| ||
| ||||||||
| Electrical Equipment—1.0% | ||||||||
| AZZ, Inc. |
| 1,171
|
|
| 64,311
|
| ||
| ||||||||
| Machinery—1.4% | ||||||||
| Federal Signal Corp. | 4,290 | 58,730 | ||||||
| ||||||||
| ITT Corp. | 919 | 35,262 | ||||||
|
| |||||||
|
| 93,992
|
| ||||||
| ||||||||
| Professional Services—1.4% | ||||||||
| On Assignment, Inc.1 | 982 | 35,411 | ||||||
| ||||||||
| TrueBlue, Inc.1 | 2,983 | 55,752 | ||||||
|
| |||||||
|
| 91,163
|
| ||||||
| ||||||||
| Road & Rail—1.4% | ||||||||
| Celadon Group, Inc. | 3,409 | 34,329 | ||||||
| ||||||||
| Genesee & Wyoming, Inc., Cl. A1 | 875 | 56,971 | ||||||
|
| |||||||
|
| 91,300
|
| ||||||
| ||||||||
| Trading Companies & Distributors—1.0% | ||||||||
| WESCO International, Inc.1 | 1,095 | 64,375 | ||||||
12 OPPENHEIMER SMALL CAP VALUE FUND
| Shares | Value | |||||||
| Information Technology—12.5% | ||||||||
| Electronic Equipment, Instruments, & Components—3.9% | ||||||||
| Belden, Inc. | 661 | $ | 41,736 | |||||
| Dolby Laboratories, Inc., Cl. A | 1,343 | 63,940 | ||||||
| Littelfuse, Inc. | 621 | 72,334 | ||||||
| SYNNEX Corp. | 951 | 78,524 | ||||||
|
| 256,534
|
| ||||||
| Internet Software & Services—0.4% | ||||||||
Match Group, Inc.1
| 2,281 | 26,003 | ||||||
| IT Services—1.6% | ||||||||
| Blackhawk Network Holdings, Inc., Cl. A1 | 1,413 | 45,400 | ||||||
| Science Applications International Corp. | 1,066 | 56,594 | ||||||
|
| 101,994
|
| ||||||
| Semiconductors & Semiconductor Equipment—3.0% | ||||||||
| Microsemi Corp.1 | 1,697 | 57,341 | ||||||
| MKS Instruments, Inc. | 2,280 | 81,761 | ||||||
| Semtech Corp.1 | 2,623 | 56,762 | ||||||
|
| 195,864
|
| ||||||
| Software—2.3% | ||||||||
| Mentor Graphics Corp. | 4,487 | 89,560 | ||||||
| Verint Systems, Inc.1 | 1,833 | 62,029 | ||||||
|
| 151,589
|
| ||||||
| Technology Hardware, Storage & Peripherals—1.3% | ||||||||
| Lexmark International, Inc., Cl. A | 1,118 | 43,155 | ||||||
| Super Micro Computer, Inc.1 | 1,668 | 44,886 | ||||||
|
| 88,041
|
| ||||||
| Materials—6.4% | ||||||||
| Chemicals—2.6% | ||||||||
| Huntsman Corp. | 6,361 | 100,122 | ||||||
| LSB Industries, Inc.1 | 2,430 | 31,979 | ||||||
| Sensient Technologies Corp. | 591 | 39,745 | ||||||
|
| 171,846
|
| ||||||
| Construction Materials—0.6% | ||||||||
| Eagle Materials, Inc. | 513 | 38,023 | ||||||
| Shares | Value | |||||||
| Containers & Packaging—1.0% | ||||||||
Owens-Illinois, Inc.1
| 3,658 | $ | 67,527 | |||||
| Metals & Mining—0.8% | ||||||||
| Reliance Steel & Aluminum Co. |
| 665
|
|
| 49,190
|
| ||
| Paper & Forest Products—1.4% | ||||||||
Louisiana-Pacific Corp.1
| 5,486 | 93,262 | ||||||
| Utilities—5.6% | ||||||||
| Electric Utilities—3.0% | ||||||||
| ALLETE, Inc. | 1,293 | 72,654 | ||||||
| El Paso Electric Co. | 1,354 | 61,065 | ||||||
| Portland General Electric Co. | 1,540 | 61,169 | ||||||
|
| 194,888
|
| ||||||
| Multi-Utilities—2.6% | ||||||||
| Avista Corp. | 1,117 | 44,758 | ||||||
| MDU Resources Group, Inc. | 4,075 | 81,744 | ||||||
| NorthWestern Corp. | 840 | 47,746 | ||||||
| 174,248 | ||||||||
Total Common Stocks (Cost $6,222,606)
|
| 6,446,748
|
| |||||
| Investment Company—2.4% | ||||||||
Oppenheimer Institutional Money Market Fund, Cl. E, 0.48%3,4 (Cost $159,537)
|
| 159,537
|
|
| 159,537
|
| ||
| Total Investments, at Value (Cost $6,382,143) | 100.4% | 6,606,285 | ||||||
| Net Other Assets (Liabilities) | (0.4) | (26,693 | ) | |||||
| Net Assets | 100.0% | $ | 6,579,592 | |||||
13 OPPENHEIMER SMALL CAP VALUE FUND
STATEMENT OF INVESTMENTS Continued
Footnotes to Statement of Investments
*April 29, 2016 represents the last business day of the Fund’s reporting period. See Note 2 of the accompanying Notes.
1. Non-income producing security.
2. Security is a Master Limited Partnership.
3. Rate shown is the 7-day yield at period end.
4. Is or was an affiliate, as defined in the Investment Company Act of 1940, as amended, at or during the reporting
period, by virtue of the Fund owning at least 5% of the voting securities of the issuer or as a result of the Fund and the issuer having the same investment adviser. Transactions during the reporting period in which the issuer was an affiliate are as follows:
| Shares December 7, 2015 (commencement of operations) | Gross Additions | Gross Reductions | Shares April 29, 2016a | |||||||||||
| Oppenheimer Institutional Money Market Fund, Cl. E | — | 6,668,250 | 6,508,713 | 159,537 | ||||||||||
Value | Income | |||||||||||||
| Oppenheimer Institutional Money Market Fund, Cl. E | $ | 159,537 | $ 404 | |||||||||||
a. Represents the last business day of the Fund’s reporting period. See Note 2 of the accompanying Notes.
See accompanying Notes to Financial Statements.
14 OPPENHEIMER SMALL CAP VALUE FUND
STATEMENT OF ASSETS AND LIABILITIES April 29, 20161
| Assets | ||||
| Investments, at value—see accompanying statement of investments: | ||||
| Unaffiliated companies (cost $6,222,606) | $ | 6,446,748 | ||
| Affiliated companies (cost $159,537) | 159,537 | |||
|
| |||
| 6,606,285 | ||||
| ||||
| Receivables and other assets: | ||||
| Investments sold | 38,142 | |||
| Shares of beneficial interest sold | 10,011 | |||
| Dividends | 2,220 | |||
| Other | 13,218 | |||
|
| |||
| Total assets |
| 6,669,876
|
| |
| ||||
| Liabilities | ||||
| Bank overdraft | 3,975 | |||
| ||||
| Payables and other liabilities: | ||||
| Investments purchased | 56,125 | |||
| Legal, auditing and other professional fees | 23,209 | |||
| Shares of beneficial interest redeemed | 4,445 | |||
| Distribution and service plan fees | 1,263 | |||
| Shareholder communications | 1,250 | |||
| Trustees’ compensation | 10 | |||
| Other | 7 | |||
|
| |||
| Total liabilities |
| 90,284
|
| |
| ||||
| Net Assets | $ | 6,579,592 | ||
|
| |||
| ||||
| Composition of Net Assets | ||||
| Par value of shares of beneficial interest | $ | 652 | ||
| ||||
| Additional paid-in capital | 6,424,704 | |||
| ||||
| Accumulated net investment loss | (1,303) | |||
| ||||
| Accumulated net realized loss on investments and foreign currency transactions | (68,603) | |||
| ||||
| Net unrealized appreciation on investments and translation of assets and liabilities denominated in foreign currencies | 224,142 | |||
|
| |||
| Net Assets | $ | 6,579,592 | ||
|
| |||
15 OPPENHEIMER SMALL CAP VALUE FUND
STATEMENT OF ASSETS AND LIABILITIES Continued
| ||||
| Net Asset Value Per Share | ||||
| Class A Shares: | ||||
| Net asset value and redemption price per share (based on net assets of $5,921,524 and 586,524 shares of beneficial interest outstanding) | $ | 10.10 | ||
| Maximum offering price per share (net asset value plus sales charge of 5.75% of offering price) | $ | 10.72 | ||
| ||||
| Class C Shares: | ||||
| Net asset value, redemption price (excludes applicable contingent deferred sales charge) and offering price per share (based on net assets of $288,670 and 28,617 shares of beneficial interest outstanding) | $ | 10.09 | ||
| ||||
| Class I Shares: | ||||
| Net asset value, redemption price and offering price per share (based on net assets of $10,098 and 1,000 shares of beneficial interest outstanding) | $ | 10.10 | ||
| ||||
| Class R Shares: | ||||
| Net asset value, redemption price (excludes applicable contingent deferred sales charge) and offering price per share (based on net assets of $205,211 and 20,314 shares of beneficial interest outstanding) | $ | 10.10 | ||
| ||||
| Class Y Shares: | ||||
| Net asset value, redemption price and offering price per share (based on net assets of $154,089 and 15,254 shares of beneficial interest outstanding) | $ | 10.10 | ||
1. April 29, 2016 represents the last business day of the Fund’s reporting period. See Note 2 of the accompanying Notes.
See accompanying Notes to Financial Statements.
16 OPPENHEIMER SMALL CAP VALUE FUND
STATEMENT OF OPERATIONS For the Period Ended April 29, 20161,2
| Investment Income | ||
| Dividends: | ||
| Unaffiliated companies | $ 46,649 | |
| Affiliated companies | 404 | |
Total investment income
| 47,053 | |
| Expenses | ||
| Management fees | 17,113 | |
| Distribution and service plan fees: | ||
| Class A | 1,409 | |
| Class C | 474 | |
| Class R | 100 | |
| Transfer and shareholder servicing agent fees: | ||
| Class A | 4,423 | |
| Class C | 107 | |
| Class I | 1 | |
| Class R | 48 | |
| Class Y | 120 | |
| Shareholder communications: | ||
| Class A | 2,181 | |
| Class C | 1 | |
| Legal, auditing and other professional fees | 33,726 | |
| Trustees’ compensation | 38 | |
| Other | 2,193 | |
| Total expenses | 61,934 | |
| Less waivers and reimbursements of expenses | (35,093) | |
Net expenses
| 26,841 | |
| Net Investment Income | 20,212 | |
| Realized and Unrealized Gain (Loss) | ||
| Net realized gain (loss) on: | ||
| Investments from unaffiliated companies | (68,603) | |
| Foreign currency transactions | 48 | |
| Net realized loss | (68,555) | |
| Net change in unrealized appreciation/depreciation on: | ||
| Investments | 226,647 | |
| Translation of assets and liabilities denominated in foreign currencies | (2,505) | |
Net change in unrealized appreciation/depreciation
| 224,142 | |
| Net Increase in Net Assets Resulting from Operations | $ 175,799 | |
1. For the period from December 7, 2015 (commencement of operations) to April 29, 2016.
2. April 29, 2016 represents the last business day of the Fund’s reporting period. See Note 2 of the accompanying Notes.
See accompanying Notes to Financial Statements.
17 OPPENHEIMER SMALL CAP VALUE FUND
STATEMENT OF CHANGES IN NET ASSETS
| Period Ended April 29, 20161,2 | ||||
| Operations | ||||
Net investment income | $ | 20,212 | ||
Net realized loss | (68,555 | ) | ||
Net change in unrealized appreciation/depreciation | 224,142 | |||
Net increase in net assets resulting from operations
| 175,799 | |||
| Dividends and/or Distributions to Shareholders | ||||
Dividends from net investment income: | ||||
Class A | (21,834 | ) | ||
Class C | (300 | ) | ||
Class I | (49 | ) | ||
Class R | (149 | ) | ||
Class Y | (710 | ) | ||
|
| (23,042
| )
| ||
| Beneficial Interest Transactions | ||||
Net increase in net assets resulting from beneficial interest transactions: | ||||
Class A | 5,745,895 | |||
Class C | 258,928 | |||
Class I | — | |||
Class R | 187,821 | |||
Class Y | 134,191 | |||
|
| 6,326,835
|
| ||
| Net Assets | ||||
Total increase | 6,479,592 | |||
Beginning of period | 100,0003 | |||
End of period (including accumulated net investment loss of $1,303) | $ | 6,579,592 | ||
1. For the period from December 7, 2015 (commencement of operations) to April 29, 2016.
2. April 29, 2016 represents the last business day of the Fund’s reporting period. See Note 2 of the accompanying Notes.
3. Reflects the value of the Manager’s seed money invested on October 14, 2015.
See accompanying Notes to Financial Statements.
18 OPPENHEIMER SMALL CAP VALUE FUND
| Class A | Period Ended | |||
| ||||
| Per Share Operating Data | ||||
| Net asset value, beginning of period | $10.00 | |||
| ||||
| Income (loss) from investment operations: | ||||
| Net investment income3 | 0.04 | |||
| Net realized and unrealized gain | 0.10 | |||
|
| |||
| Total from investment operations | 0.14 | |||
| ||||
| Dividends and/or distributions to shareholders: | ||||
| Dividends from net investment income | (0.04) | |||
| ||||
| Net asset value, end of period | $10.10 | |||
|
| |||
| ||||
| Total Return, at Net Asset Value4 | 1.40% | |||
| ||||
| Ratios/Supplemental Data | ||||
| Net assets, end of period (in thousands) | $5,922 | |||
| ||||
| Average net assets (in thousands) | $5,052 | |||
| ||||
| Ratios to average net assets:5 | ||||
| Net investment income | 0.98% | |||
| Total expenses6 | 2.86% | |||
| Expenses after payments, waivers and/or reimbursements and reduction to custodian expenses | 1.25% | |||
| ||||
| Portfolio turnover rate | 22% | |||
1. For the period from December 7, 2015 (commencement of operations) to April 29, 2016.
2. April 29, 2016 represents the last business day of the Fund’s reporting period. See Note 2 of the accompanying Notes.
3. Per share amounts calculated based on the average shares outstanding during the period.
4. Assumes an initial investment on the business day before the first day of the fiscal period, with all dividends and distributions reinvested in additional shares on the reinvestment date, and redemption at the net asset value calculated on the last business day of the fiscal period. Sales charges are not reflected in the total returns. Total returns are not annualized for periods less than one full year. Returns do not reflect the deduction of taxes that a shareholder would pay on fund distributions or the redemption of fund shares.
5. Annualized for periods less than one full year.
6. Total expenses including indirect expenses from affiliated fund fees and expenses were as follows:
Period Ended April 29, 2016 | 2.87 | % |
See accompanying Notes to Financial Statements.
19 OPPENHEIMER SMALL CAP VALUE FUND
FINANCIAL HIGHLIGHTS Continued
| Class C | Period Ended April 29, | |||
| ||||
| Per Share Operating Data | ||||
| Net asset value, beginning of period | $10.00 | |||
| ||||
| Income (loss) from investment operations: | ||||
| Net investment loss3 | (0.02) | |||
| Net realized and unrealized gain | 0.13 | |||
|
| |||
| Total from investment operations | 0.11 | |||
| ||||
| Dividends and/or distributions to shareholders: | ||||
| Dividends from net investment income | (0.02) | |||
| ||||
| Net asset value, end of period | $10.09 | |||
|
| |||
| ||||
| Total Return, at Net Asset Value4 | 1.07% | |||
| ||||
| Ratios/Supplemental Data | ||||
| Net assets, end of period (in thousands) | $289 | |||
| ||||
| Average net assets (in thousands) | $123 | |||
| ||||
| Ratios to average net assets:5 | ||||
| Net investment loss | (0.46)% | |||
| Total expenses6 | 3.97% | |||
| Expenses after payments, waivers and/or reimbursements and reduction to custodian expenses | 1.96% | |||
| ||||
| Portfolio turnover rate | 22% | |||
1. For the period from December 7, 2015 (commencement of operations) to April 29, 2016.
2. April 29, 2016 represents the last business day of the Fund’s reporting period. See Note 2 of the accompanying Notes.
3. Per share amounts calculated based on the average shares outstanding during the period.
4. Assumes an initial investment on the business day before the first day of the fiscal period, with all dividends and distributions reinvested in additional shares on the reinvestment date, and redemption at the net asset value calculated on the last business day of the fiscal period. Sales charges are not reflected in the total returns. Total returns are not annualized for periods less than one full year. Returns do not reflect the deduction of taxes that a shareholder would pay on fund distributions or the redemption of fund shares.
5. Annualized for periods less than one full year.
6. Total expenses including indirect expenses from affiliated fund fees and expenses were as follows:
Period Ended April 29, 2016 | 3.98 | % |
See accompanying Notes to Financial Statements.
20 OPPENHEIMER SMALL CAP VALUE FUND
| Class I | Period Ended April 29, | |||
| ||||
| Per Share Operating Data | ||||
Net asset value, beginning of period | $10.00 | |||
| ||||
Income (loss) from investment operations: | ||||
Net investment income3 | 0.04 | |||
Net realized and unrealized gain | 0.11 | |||
|
| |||
Total from investment operations | 0.15 | |||
| ||||
Dividends and/or distributions to shareholders: | ||||
Dividends from net investment income | (0.05) | |||
| ||||
Net asset value, end of period | $10.10 | |||
|
| |||
| ||||
| Total Return, at Net Asset Value4 | 1.50% | |||
| ||||
| Ratios/Supplemental Data | ||||
Net assets, end of period (in thousands) | $10 | |||
| ||||
Average net assets (in thousands) | $9 | |||
| ||||
Ratios to average net assets:5 | ||||
Net investment income | 0.98% | |||
Total expenses6 | 2.47% | |||
Expenses after payments, waivers and/or reimbursements and reduction to custodian expenses | 0.93% | |||
| ||||
Portfolio turnover rate | 22% | |||
1. For the period from December 7, 2015 (commencement of operations) to April 29, 2016.
2. April 29, 2016 represents the last business day of the Fund’s reporting period. See Note 2 of the accompanying Notes.
3. Per share amounts calculated based on the average shares outstanding during the period.
4. Assumes an initial investment on the business day before the first day of the fiscal period, with all dividends and distributions reinvested in additional shares on the reinvestment date, and redemption at the net asset value calculated on the last business day of the fiscal period. Sales charges are not reflected in the total returns Total returns are not annualized for periods less than one full year. Returns do not reflect the deduction of taxes that a shareholder would pay on fund distributions or the redemption of fund shares.
5. Annualized for periods less than one full year.
6. Total expenses including indirect expenses from affiliated fund fees and expenses were as follows:
Period Ended April 29, 2016 | 2.48 | % |
See accompanying Notes to Financial Statements.
21 OPPENHEIMER SMALL CAP VALUE FUND
FINANCIAL HIGHLIGHTS Continued
| Class R | Period Ended April 29, | |||
| ||||
| Per Share Operating Data | ||||
| Net asset value, beginning of period | $10.00 | |||
| ||||
| Income (loss) from investment operations: | ||||
| Net investment loss3 | (0.00)4 | |||
| Net realized and unrealized gain | 0.13 | |||
|
| |||
| Total from investment operations | 0.13 | |||
| ||||
| Dividends and/or distributions to shareholders: | ||||
| Dividends from net investment income | (0.03) | |||
| ||||
| Net asset value, end of period | $10.10 | |||
|
| |||
| ||||
| Total Return, at Net Asset Value5 | 1.27% | |||
| ||||
| Ratios/Supplemental Data | ||||
| Net assets, end of period (in thousands) | $205 | |||
| ||||
| Average net assets (in thousands) | $57 | |||
| ||||
| Ratios to average net assets:6 | ||||
| Net investment loss | (0.03)% | |||
| Total expenses7 | 3.71% | |||
| Expenses after payments, waivers and/or reimbursements and reduction to custodian expenses | 1.45% | |||
| ||||
| Portfolio turnover rate | 22% | |||
1. For the period from December 7, 2015 (commencement of operations) to April 29, 2016.
2. April 29, 2016 represents the last business day of the Fund’s reporting period. See Note 2 of the accompanying Notes.
3. Per share amounts calculated based on the average shares outstanding during the period.
4. Less than $0.005 per share.
5. Assumes an initial investment on the business day before the first day of the fiscal period, with all dividends and distributions reinvested in additional shares on the reinvestment date, and redemption at the net asset value calculated on the last business day of the fiscal period. Sales charges are not reflected in the total returns. Total returns are not annualized for periods less than one full year. Returns do not reflect the deduction of taxes that a shareholder would pay on fund distributions or the redemption of fund shares.
6. Annualized for periods less than one full year.
7. Total expenses including indirect expenses from affiliated fund fees and expenses were as follows:
Period Ended April 29, 2016 | 3.72 | % |
See accompanying Notes to Financial Statements.
22 OPPENHEIMER SMALL CAP VALUE FUND
| Class Y | Period Ended April 29, 2016 1,2 | |
| ||
| Per Share Operating Data | ||
| Net asset value, beginning of period | $10.00 | |
| ||
| Income (loss) from investment operations: | ||
| Net investment income3 | 0.05 | |
| Net realized and unrealized gain | 0.09 | |
| ||
| Total from investment operations | 0.14 | |
| ||
| Dividends and/or distributions to shareholders: | ||
| Dividends from net investment income | (0.04) | |
| ||
| Net asset value, end of period | $10.10 | |
| ||
| ||
| Total Return, at Net Asset Value4 | 1.44% | |
| ||
| Ratios/Supplemental Data | ||
| Net assets, end of period (in thousands) | $154 | |
| ||
| Average net assets (in thousands) | $137 | |
| ||
| Ratios to average net assets:5 | ||
| Net investment income | 1.14% | |
| Total expenses6 | 2.67% | |
| Expenses after payments, waivers and/or reimbursements and reduction to custodian expenses | 1.00% | |
| ||
| Portfolio turnover rate | 22% | |
1. For the period from December 7, 2015 (commencement of operations) to April 29, 2016.
2. April 29, 2016 represents the last business day of the Fund’s reporting period. See Note 2 of the accompanying Notes.
3. Per share amounts calculated based on the average shares outstanding during the period.
4. Assumes an initial investment on the business day before the first day of the fiscal period, with all dividends and distributions reinvested in additional shares on the reinvestment date, and redemption at the net asset value calculated on the last business day of the fiscal period. Sales charges are not reflected in the total returns. Total returns are not annualized for periods less than one full year. Returns do not reflect the deduction of taxes that a shareholder would pay on fund distributions or the redemption of fund shares.
5. Annualized for periods less than one full year.
6. Total expenses including indirect expenses from affiliated fund fees and expenses were as follows:
Period Ended April 29, 2016 | 2.68 | % |
See accompanying Notes to Financial Statements.
23 OPPENHEIMER SMALL CAP VALUE FUND
NOTES TO FINANCIAL STATEMENTS April 29, 2016
1. Organization
Oppenheimer Small Cap Value Fund (the “Fund”) is a diversified open-end management investment company registered under the Investment Company Act of 1940, (“1940 Act”), as amended. The Fund’s investment objective is to seek capital appreciation. The Fund’s investment adviser is OFI Global Asset Management, Inc. (“OFI Global” or the “Manager”), a wholly-owned subsidiary of OppenheimerFunds, Inc. (“OFI” or the “Sub-Adviser”). The Manager has entered into a sub-advisory agreement with OFI. At period end, approximately 76.7% of the shares of the Fund were owned by the Manager, other funds advised or sub-advised by the Manager or an affiliate of the Manager. The Fund commenced operations on December 7, 2015.
The Fund offers Class A, Class C, Class I, Class R and Class Y shares. Class A shares are sold at their offering price, which is normally net asset value plus a front-end sales charge. Class C and Class R shares are sold without a front-end sales charge but Class C may be subject to a contingent deferred sales charge (“CDSC”). Class R shares are sold only through retirement plans. Retirement plans that offer Class R shares may impose charges on those accounts. Class I and Class Y shares are sold to certain institutional investors or intermediaries without either a front-end sales charge or a CDSC, however, the intermediaries may impose charges on their accountholders who beneficially own Class I and Class Y shares. All classes of shares have identical rights and voting privileges with respect to the Fund in general and exclusive voting rights on matters that affect that class alone. Earnings, net assets and net asset value per share may differ due to each class having its own expenses, such as transfer and shareholder servicing agent fees and shareholder communications, directly attributable to that class. Class A, C and R shares have separate distribution and/or service plans under which they pay fees. Class I and Class Y shares do not pay such fees.
The following is a summary of significant accounting policies followed in the Fund’s preparation of financial statements in accordance with accounting principles generally accepted in the United States (“U.S. GAAP”).
2. Significant Accounting Policies
Security Valuation. All investments in securities are recorded at their estimated fair value, as described in Note 3.
Reporting Period End Date. The last day of the Fund’s reporting period is the last day the New York Stock Exchange was open for trading during the period. The Fund’s financial statements have been presented through that date to maintain consistency with the Fund’s net asset value calculations used for shareholder transactions.
Foreign Currency Translation. The Fund’s accounting records are maintained in U.S. dollars. The values of securities denominated in foreign currencies and amounts related to the purchase and sale of foreign securities and foreign investment income are translated into U.S. dollars as of the close of the New York Stock Exchange (the “Exchange”), normally 4:00 P.M. Eastern time, on each day the Exchange is open for trading. Foreign exchange rates may be
24 OPPENHEIMER SMALL CAP VALUE FUND
2. Significant Accounting Policies (Continued)
valued primarily using a reliable bank, dealer or service authorized by the Board of Trustees.
Reported net realized gains and losses from foreign currency transactions arise from sales of portfolio securities, sales and maturities of short-term securities, sales of foreign currencies, exchange rate fluctuations between the trade and settlement dates on securities transactions, and the difference between the amounts of dividends, interest, and foreign withholding taxes recorded on the Fund’s books and the U.S. dollar equivalent of the amounts actually received or paid. Net unrealized appreciation and depreciation on the translation of assets and liabilities denominated in foreign currencies arise from changes in the values of assets and liabilities, including investments in securities at fiscal period end, resulting from changes in exchange rates.
The effect of changes in foreign currency exchange rates on investments is separately identified from the fluctuations arising from changes in market values of securities held and reported with all other foreign currency gains and losses in the Fund’s Statement of Operations.
Allocation of Income, Expenses, Gains and Losses. Income, expenses (other than those attributable to a specific class), gains and losses are allocated on a daily basis to each class of shares based upon the relative proportion of net assets represented by such class. Operating expenses directly attributable to a specific class are charged against the operations of that class.
Dividends and Distributions to Shareholders. Dividends and distributions to shareholders, which are determined in accordance with income tax regulations and may differ from U.S. GAAP, are recorded on the ex-dividend date. Income distributions, if any, are declared and paid quarterly. Capital gain distributions, if any, are declared and paid annually.
Investment Income. Dividend income is recorded on the ex-dividend date or upon ex-dividend notification in the case of certain foreign dividends where the ex-dividend date may have passed. Upon receipt of notification from the issuer, subsequent to the ex-dividend date, some of the dividend income originally recorded from a real estate investment trust (“REIT”) may be reclassified as a reduction of the cost of the related investment and/or realized gain. Non-cash dividends included in dividend income, if any, are recorded at the fair market value of the securities received. Interest income is recognized on an accrual basis. Discount and premium, which are included in interest income on the Statement of Operations, are amortized or accreted daily.
Return of Capital Estimates. Distributions received from the Fund’s investments in Master Limited Partnerships (MLPs) and Real Estate Investments Trusts (REITs), generally are comprised of income and return of capital. The Fund records investment income and return of capital based on estimates. Such estimates are based on historical information available from each MLP, REIT and other industry sources. These estimates may subsequently be revised based on information received from MLPs and REITs after their tax reporting periods are concluded.
25 OPPENHEIMER SMALL CAP VALUE FUND
NOTES TO FINANCIAL STATEMENTS Continued
2. Significant Accounting Policies (Continued)
Custodian Fees. “Custodian fees and expenses” in the Statement of Operations may include interest expense incurred by the Fund on any cash overdrafts of its custodian account during the period. Such cash overdrafts may result from the effects of failed trades in portfolio securities and from cash outflows resulting from unanticipated shareholder redemption activity. The Fund pays interest to its custodian on such cash overdrafts, to the extent they are not offset by positive cash balances maintained by the Fund, at a rate equal to the Federal Funds Rate plus 0.50%. The “Reduction to custodian expenses” line item, if applicable, represents earnings on cash balances maintained by the Fund during the period. Such interest expense and other custodian fees may be paid with these earnings.
Security Transactions. Security transactions are recorded on the trade date. Realized gains and losses on securities sold are determined on the basis of identified cost.
Indemnifications. The Fund’s organizational documents provide current and former Trustees and officers with a limited indemnification against liabilities arising in connection with the performance of their duties to the Fund. In the normal course of business, the Fund may also enter into contracts that provide general indemnifications. The Fund’s maximum exposure under these arrangements is unknown as this would be dependent on future claims that may be made against the Fund. The risk of material loss from such claims is considered remote.
Federal Taxes. The Fund intends to comply with provisions of the Internal Revenue Code applicable to regulated investment companies and to distribute substantially all of its investment company taxable income, including any net realized gain on investments not offset by capital loss carryforwards, if any, to shareholders. Therefore, no federal income or excise tax provision is required, however, during the reporting period, the Fund paid federal excise tax of $442. The Fund files income tax returns in U.S. federal and applicable state jurisdictions. The statute of limitations on the Fund’s tax return filings generally remains open for the three preceding fiscal reporting period ends. The Fund has analyzed its tax positions for the fiscal period ended April 29, 2016, including open tax years, and does not believe there are any uncertain tax positions requiring recognition in the Fund’s financial statements.
The tax components of capital shown in the following table represent distribution requirements the Fund must satisfy under the income tax regulations, losses the Fund may be able to offset against income and gains realized in future years and unrealized appreciation or depreciation of securities and other investments for federal income tax purposes.
Undistributed Net Investment Income | Undistributed Long-Term Gain | Accumulated Loss Carryforward1,2,3 | Net Unrealized for Federal Income | |||||||||
| ||||||||||||
$130 | $— | $50,711 | $205,195 | |||||||||
26 OPPENHEIMER SMALL CAP VALUE FUND
2. Significant Accounting Policies (Continued)
1. At period end, the Fund had $50,711 of net capital loss carryforward available to offset future realized capital gains, if any, and thereby reduce future taxable gain distributions. Details of the capital loss carryforwards are included in the table below. Capital loss carryovers with no expiration, if any, must be utilized prior to those with expiration dates.
Expiring
| ||||
| ||||
No expiration | $ | 50,711 | ||
2. During the reporting period, the Fund did not utilize any capital loss carryforward.
3. During the previous reporting period, the Fund did not utilize any capital loss carryforward.
Net investment income (loss) and net realized gain (loss) may differ for financial statement and tax purposes. The character of dividends and distributions made during the fiscal year from net investment income or net realized gains are determined in accordance with federal income tax requirements, which may differ from the character of net investment income or net realized gains presented in those financial statements in accordance with U.S. GAAP. Also, due to timing of dividends and distributions, the fiscal year in which amounts are distributed may differ from the fiscal year in which the income or net realized gain was recorded by the Fund.
Accordingly, the following amounts have been reclassified for the reporting period. Net assets of the Fund were unaffected by the reclassifications.
Reduction to Paid-in Capital | Reduction to Accumulated | Increase to Accumulated Net on Investments | ||||||
| ||||||||
$1,479 | $1,527 | $48 | ||||||
The tax character of distributions paid during the reporting periods:
| Period Ended April 30, 2016 | ||||
| ||||
Distributions paid from: | ||||
Ordinary income | $ | 23,042 | ||
The aggregate cost of securities and other investments and the composition of unrealized appreciation and depreciation of securities and other investments for federal income tax purposes at period end are noted in the following table. The primary difference between book and tax appreciation or depreciation of securities and other investments, if applicable, is attributable to the tax deferral of losses or tax realization of financial statement unrealized gain or loss.
Federal tax cost of securities | $ | 6,401,090 | ||
|
| |||
Gross unrealized appreciation | $ | 486,346 | ||
Gross unrealized depreciation | (281,151) | |||
|
| |||
Net unrealized appreciation | $ | 205,195 | ||
|
| |||
Use of Estimates. The preparation of financial statements in conformity with U.S. GAAP
27 OPPENHEIMER SMALL CAP VALUE FUND
NOTES TO FINANCIAL STATEMENTS Continued
2. Significant Accounting Policies (Continued)
requires management to make estimates and assumptions that affect the reported amounts of assets and liabilities and disclosure of contingent assets and liabilities at the date of the financial statements and the reported amounts of increases and decreases in net assets from operations during the reporting period. Actual results could differ from those estimates.
3. Securities Valuation
The Fund calculates the net asset value of its shares as of 4:00 P.M. Eastern time, on each day the New York Stock Exchange (the “Exchange”) is open for trading, except in the case of a scheduled early closing of the Exchange, in which case the Fund will calculate net asset value of the shares as of the scheduled early closing time of the Exchange.
The Fund’s Board has adopted procedures for the valuation of the Fund’s securities and has delegated the day-to-day responsibility for valuation determinations under those procedures to the Manager. The Manager has established a Valuation Committee which is responsible for determining a “fair valuation” for any security for which market quotations are not “readily available.” The Valuation Committee’s fair valuation determinations are subject to review, approval and ratification by the Fund’s Board at its next regularly scheduled meeting covering the calendar quarter in which the fair valuation was determined.
Valuation Methods and Inputs
Securities are valued using unadjusted quoted market prices, when available, as supplied primarily by third party pricing services or dealers.
The following methodologies are used to determine the market value or the fair value of the types of securities described below:
Securities traded on a registered U.S. securities exchange (including exchange-traded derivatives other than futures and futures options) are valued based on the last sale price of the security reported on the principal exchange on which it is traded, prior to the time when the Fund’s assets are valued. In the absence of a sale, the security is valued at the mean between the bid and asked price on the principal exchange or, if not available from the principal exchange, obtained from two dealers. If bid and asked prices are not available from either the exchange or two dealers, the security is valued by using one of the following methodologies (listed in order of priority): (1) a bid from the principal exchange, (2) the mean between the bid and asked price as provided by a single dealer, or (3) a bid from a single dealer. A security of a foreign issuer traded on a foreign exchange, but not listed on a registered U.S. securities exchange, is valued based on the last sale price on the principal exchange on which the security is traded, as identified by the third party pricing service used by the Manager, prior to the time when the Fund’s assets are valued. If the last sale price is unavailable, the security is valued at the most recent official closing price on the principal exchange on which it is traded. If the last sales price or official closing price for a foreign security is not available, the security is valued at the mean between the bid and asked price per the exchange or, if not available from the exchange, obtained from two dealers. If bid and asked prices are not available from either the exchange or two dealers, the security is valued
28 OPPENHEIMER SMALL CAP VALUE FUND
3. Securities Valuation (Continued)
by using one of the following methodologies (listed in order of priority): (1) a bid from the exchange, (2) the mean between the bid and asked price as provided by a single dealer, or (3) a bid from a single dealer.
Shares of a registered investment company that are not traded on an exchange are valued at that investment company’s net asset value per share.
Corporate and government debt securities (of U.S. or foreign issuers) and municipal debt securities, event-linked bonds, loans, mortgage-backed securities, collateralized mortgage obligations, and asset-backed securities are valued at the mean between the “bid” and “asked” prices utilizing evaluated prices obtained from third party pricing services or broker-dealers who may use matrix pricing methods to determine the evaluated prices.
Short-term money market type debt securities with a remaining maturity of sixty days or less are valued at cost adjusted by the amortization of discount or premium to maturity (amortized cost), which approximates market value. Short-term debt securities with a remaining maturity in excess of sixty days are valued at the mean between the “bid” and “asked” prices utilizing evaluated prices obtained from third party pricing services or broker-dealers.
A description of the standard inputs that may generally be considered by the third party pricing vendors in determining their evaluated prices is provided below.
| Security Type | Standard inputs generally considered by third-party pricing vendors | |
| ||
| Corporate debt, government debt, municipal, mortgage-backed and asset-backed securities | Reported trade data, broker-dealer price quotations, benchmark yields, issuer spreads on comparable securities, the credit quality, yield, maturity, and other appropriate factors. | |
| ||
| Loans | Information obtained from market participants regarding reported trade data and broker-dealer price quotations. | |
| ||
| Event-linked bonds | Information obtained from market participants regarding reported trade data and broker-dealer price quotations. | |
If a market value or price cannot be determined for a security using the methodologies described above, or if, in the “good faith” opinion of the Manager, the market value or price obtained does not constitute a “readily available market quotation,” or a significant event has occurred that would materially affect the value of the security, the security is fair valued either (i) by a standardized fair valuation methodology applicable to the security type or the significant event as previously approved by the Valuation Committee and the Fund’s Board or (ii) as determined in good faith by the Manager’s Valuation Committee. The Valuation Committee considers all relevant facts that are reasonably available, through either public information or information available to the Manager, when determining the fair value of a security. Fair value determinations by the Manager are subject to review, approval and ratification by the Fund’s Board at its next regularly scheduled meeting covering the calendar quarter in which the fair valuation was determined. Those fair valuation standardized methodologies include, but are not limited to, valuing securities at the last sale price or initially at cost and subsequently adjusting the value based on: changes in company specific fundamentals, changes in an appropriate securities index, or changes in the value of similar
29 OPPENHEIMER SMALL CAP VALUE FUND
NOTES TO FINANCIAL STATEMENTS Continued
3. Securities Valuation (Continued)
securities which may be further adjusted for any discounts related to security-specific resale restrictions. When possible, such methodologies use observable market inputs such as unadjusted quoted prices of similar securities, observable interest rates, currency rates and yield curves. The methodologies used for valuing securities are not necessarily an indication of the risks associated with investing in those securities nor can it be assured that the Fund can obtain the fair value assigned to a security if it were to sell the security.
To assess the continuing appropriateness of security valuations, the Manager, or its third party service provider who is subject to oversight by the Manager, regularly compares prior day prices, prices on comparable securities, and sale prices to the current day prices and challenges those prices exceeding certain tolerance levels with the third party pricing service or broker source. For those securities valued by fair valuations, whether through a standardized fair valuation methodology or a fair valuation determination, the Valuation Committee reviews and affirms the reasonableness of the valuations based on such methodologies and fair valuation determinations on a regular basis after considering all relevant information that is reasonably available.
Classifications
Each investment asset or liability of the Fund is assigned a level at measurement date based on the significance and source of the inputs to its valuation. Various data inputs are used in determining the value of each of the Fund’s investments as of the reporting period end. These data inputs are categorized in the following hierarchy under applicable financial accounting standards:
1) Level 1-unadjusted quoted prices in active markets for identical assets or liabilities (including securities actively traded on a securities exchange)
2) Level 2-inputs other than unadjusted quoted prices that are observable for the asset or liability (such as unadjusted quoted prices for similar assets and market corroborated inputs such as interest rates, prepayment speeds, credit risks, etc.)
3) Level 3-significant unobservable inputs (including the Manager’s own judgments about assumptions that market participants would use in pricing the asset or liability).
The inputs used for valuing securities are not necessarily an indication of the risks associated with investing in those securities.
The Fund classifies each of its investments in those investment companies which are publicly offered and reported on an exchange as Level 1, and those investment companies which are not publicly offered are not assigned a level, without consideration as to the classification level of the specific investments held by those investment companies.
The table below categorizes amounts that are included in the Fund’s Statement of Assets and Liabilities at period end based on valuation input level:
30 OPPENHEIMER SMALL CAP VALUE FUND
3. Securities Valuation (Continued)
| Level 1— Unadjusted Quoted Prices | Level 2— Other Significant Observable Inputs | Level 3— Significant Unobservable Inputs | Value | |||||||||||||
| ||||||||||||||||
Assets Table | ||||||||||||||||
Investments, at Value: | ||||||||||||||||
Common Stocks | ||||||||||||||||
Consumer Discretionary | $ | 778,829 | $ | — | $ | — | $ | 778,829 | ||||||||
Consumer Staples | 429,675 | — | — | 429,675 | ||||||||||||
Energy | 483,617 | — | — | 483,617 | ||||||||||||
Financials | 2,119,271 | — | — | 2,119,271 | ||||||||||||
Health Care | 161,698 | 84,452 | — | 246,150 | ||||||||||||
Industrials | 780,197 | — | — | 780,197 | ||||||||||||
Information Technology | 820,025 | — | — | 820,025 | ||||||||||||
Materials | 419,848 | — | — | 419,848 | ||||||||||||
Utilities | 369,136 | — | — | 369,136 | ||||||||||||
Investment Company | 159,537 | — | — | 159,537 | ||||||||||||
|
| |||||||||||||||
Total Assets | $ | 6,521,833 | $ | 84,452 | $ | — | $ | 6,606,285 | ||||||||
|
| |||||||||||||||
Forward currency exchange contracts and futures contracts, if any, are reported at their unrealized appreciation/depreciation at measurement date, which represents the change in the contract’s value from trade date. All additional assets and liabilities included in the above table are reported at their market value at measurement date.
4. Investments and Risks
Investments in Affiliated Funds. The Fund is permitted to invest in other mutual funds advised by the Manager (“Affiliated Funds”). Affiliated Funds are open-end management investment companies registered under the 1940 Act, as amended. The Manager is the investment adviser of, and the Sub-Adviser provides investment and related advisory services to, the Affiliated Funds. When applicable, the Fund’s investments in Affiliated Funds are included in the Statement of Investments. Shares of Affiliated Funds are valued at their net asset value per share. As a shareholder, the Fund is subject to its proportional share of the Affiliated Funds’ expenses, including their management fee. The Manager will waive fees and/ or reimburse Fund expenses in an amount equal to the indirect management fees incurred through the Fund’s investment in the Affiliated Funds.
Each of the Affiliated Funds in which the Fund invests has its own investment risks, and those risks can affect the value of the Fund’s investments and therefore the value of the Fund’s shares. To the extent that the Fund invests more of its assets in one Affiliated Fund than in another, the Fund will have greater exposure to the risks of that Affiliated Fund.
Investment in Oppenheimer Institutional Money Market Fund. The Fund is permitted to invest daily available cash balances in a money market Affiliated Fund. The Fund may invest the available cash in Class E shares of Oppenheimer Institutional Money Market Fund (“IMMF”) to seek current income while preserving liquidity or for defensive purposes. IMMF is
31 OPPENHEIMER SMALL CAP VALUE FUND
NOTES TO FINANCIAL STATEMENTS Continued
4. Investments and Risks (Continued)
regulated as a money market fund under the Investment Company Act of 1940, as amended.
Master Limited Partnerships (“MLPs”). MLPs issue common units that represent an equity ownership interest in a partnership and provide limited voting rights. MLP common units are registered with the Securities and Exchange Commission (“SEC”), and are freely tradable on securities exchanges such as the NYSE and the NASDAQ Stock Market (“NASDAQ”), or in the over-the-counter (“OTC”) market. An MLP consists of one or more general partners, who conduct the business, and one or more limited partners, who contribute capital. MLP common unit holders have a limited role in the partnership’s operations and management. The Fund, as a limited partner, normally would not be liable for the debts of the MLP beyond the amounts the Fund has contributed, but would not be shielded to the same extent that a shareholder of a corporation would be. In certain circumstances creditors of an MLP would have the right to seek return of capital distributed to a limited partner. This right of an MLP’s creditors would continue after the Fund sold its investment in the MLP.
Equity Security Risk. Stocks and other equity securities fluctuate in price. The value of the Fund’s portfolio may be affected by changes in the equity markets generally. Equity markets may experience significant short-term volatility and may fall sharply at times. Different markets may behave differently from each other and U.S. equity markets may move in the opposite direction from one or more foreign stock markets. Adverse events in any part of the equity or fixed-income markets may have unexpected negative effects on other market segments.
The prices of individual equity securities generally do not all move in the same direction at the same time and a variety of factors can affect the price of a particular company’s securities. These factors may include, but are not limited to, poor earnings reports, a loss of customers, litigation against the company, general unfavorable performance of the company’s sector or industry, or changes in government regulations affecting the company or its industry.
Shareholder Concentration. At period end, one shareholder owned 20% or more of the Fund’s total outstanding shares comprising 77% of the Fund.
The shareholder is a related party of the Fund. Related parties may include, but are not limited to, the investment manager and its affiliates, affiliated broker dealers, fund of funds, and directors or employees.
5. Market Risk Factors
The Fund’s investments in securities and/or financial derivatives may expose the Fund to various market risk factors:
Commodity Risk. Commodity risk relates to the change in value of commodities or commodity indexes as they relate to increases or decreases in the commodities market. Commodities are physical assets that have tangible properties. Examples of these types of assets are crude oil, heating oil, metals, livestock, and agricultural products.
Credit Risk. Credit risk relates to the ability of the issuer of debt to meet interest and
32 OPPENHEIMER SMALL CAP VALUE FUND
5. Market Risk Factors (Continued)
principal payments, or both, as they come due. In general, lower-grade, higher-yield debt securities are subject to credit risk to a greater extent than lower-yield, higher-quality securities.
Equity Risk. Equity risk relates to the change in value of equity securities as they relate to increases or decreases in the general market.
Foreign Exchange Rate Risk. Foreign exchange rate risk relates to the change in the U.S. dollar value of a security held that is denominated in a foreign currency. The U.S. dollar value of a foreign currency denominated security will decrease as the dollar appreciates against the currency, while the U.S. dollar value will increase as the dollar depreciates against the currency.
Interest Rate Risk. Interest rate risk refers to the fluctuations in value of fixed-income securities resulting from the inverse relationship between price and yield. For example, an increase in general interest rates will tend to reduce the market value of already issued fixed-income investments, and a decline in general interest rates will tend to increase their value. In addition, debt securities with longer maturities, which tend to have higher yields, are subject to potentially greater fluctuations in value from changes in interest rates than obligations with shorter maturities.
Volatility Risk. Volatility risk refers to the magnitude of the movement, but not the direction of the movement, in a financial instrument’s price over a defined time period. Large increases or decreases in a financial instrument’s price over a relative time period typically indicate greater volatility risk, while small increases or decreases in its price typically indicate lower volatility risk.
6. Shares of Beneficial Interest
The Fund has authorized an unlimited number of $0.001 par value shares of beneficial interest of each class. Transactions in shares of beneficial interest were as follows:
| Period Ended April 29, 20161,2,3 | ||||||||
| Shares | Amount | |||||||
| ||||||||
Class A | ||||||||
Sold | 588,992 | $ | 5,828,232 | |||||
| Dividends and/or distributions reinvested | 268 | 2,620 | ||||||
Redeemed | (8,736 | ) | (84,957) | |||||
|
| |||||||
Net increase | 580,524 | $ | 5,745,895 | |||||
|
| |||||||
| ||||||||
Class C | ||||||||
Sold | 37,181 | $ | 354,818 | |||||
| Dividends and/or distributions reinvested | 29 | 284 | ||||||
Redeemed | (9,593 | ) | (96,174) | |||||
|
| |||||||
Net increase | 27,617 | $ | 258,928 | |||||
|
| |||||||
33 OPPENHEIMER SMALL CAP VALUE FUND
NOTES TO FINANCIAL STATEMENTS Continued
6. Shares of Beneficial Interest (Continued)
| Period Ended April 29, 20161,2,3 | ||||||||
| Shares | Amount | |||||||
| ||||||||
Class I | ||||||||
Sold | — | $ — | ||||||
| Dividends and/or distributions reinvested | — | — | ||||||
Redeemed | — | — | ||||||
|
| |||||||
Net increase | — | $ — | ||||||
|
| |||||||
| ||||||||
Class R | ||||||||
Sold | 20,083 | $195,629 | ||||||
| Dividends and/or distributions reinvested | 13 | 123 | ||||||
Redeemed | (782 | ) | (7,931) | |||||
|
| |||||||
Net increase | 19,314 | $ 187,821 | ||||||
|
| |||||||
| ||||||||
Class Y | ||||||||
Sold | 15,686 | $148,149 | ||||||
| Dividends and/or distributions reinvested | 68 | 667 | ||||||
Redeemed | (1,500 | ) | (14,625) | |||||
|
| |||||||
Net increase | 14,254 | $ 134,191 | ||||||
|
| |||||||
1. For the period December 7, 2015 (commencement of operations) to April 29, 2016.
2. April 29, 2016 represents the last business day of the Fund’s reporting period. See Note 2.
3. The Fund sold 6,000 shares of Class A at a value of $60,000 and 1,000 shares of Class C, Class I, Class R and
Class Y at a value of $10,000, respectively, to the Manager upon seeding of the Fund on October 14, 2015. These amounts are not reflected in the table above.
7. Purchases and Sales of Securities
The aggregate cost of purchases and proceeds from sales of securities, other than short-term obligations and investments in IMMF, for the reporting period were as follows:
| Purchases | Sales | |||||||
| ||||||||
Investment securities | $ | 7,290,231 | $ | 989,573 | ||||
8. Fees and Other Transactions with Affiliates
Management Fees. Under the investment advisory agreement, the Fund pays the Manager a management fee based on the daily net assets of the Fund at an annual rate as shown in the following table:
| Fee Schedule | ||||
| ||||
Up to $500 million | 0.80% | |||
Next $500 million | 0.75 | |||
Next $4 billion | 0.70 | |||
Over $5 billion | 0.65 | |||
The Fund’s effective management fee for the reporting period was 0.80% of average annual net assets before any applicable waivers.
34 OPPENHEIMER SMALL CAP VALUE FUND
8. Fees and Other Transactions with Affiliates (Continued)
Sub-Adviser Fees. The Manager has retained the Sub-Adviser to provide the day-to-day portfolio management of the Fund. Under the Sub-Advisory Agreement, the Manager pays the Sub-Adviser an annual fee in monthly installments, equal to a percentage of the investment management fee collected by the Manager from the Fund, which shall be calculated after any investment management fee waivers. The fee paid to the Sub-Adviser is paid by the Manager, not by the Fund.
Transfer Agent Fees. OFI Global (the “Transfer Agent”) serves as the transfer and shareholder servicing agent for the Fund. The Fund pays the Transfer Agent a fee based on annual net assets. Fees incurred and average net assets for each class with respect to these services are detailed in the Statement of Operations and Financial Highlights, respectively.
Sub-Transfer Agent Fees. The Transfer Agent has retained Shareholder Services, Inc., a wholly-owned subsidiary of OFI (the “Sub-Transfer Agent”), to provide the day-to-day transfer agent and shareholder servicing of the Fund. Under the Sub-Transfer Agency Agreement, the Transfer Agent pays the Sub-Transfer Agent an annual fee in monthly installments, equal to a percentage of the transfer agent fee collected by the Transfer Agent from the Fund, which shall be calculated after any applicable fee waivers. The fee paid to the Sub-Transfer Agent is paid by the Transfer Agent, not by the Fund.
Offering and Organizational Costs. The Manager paid all initial offering and organizational costs associated with the registration and seeding of the Fund.
Trustees’ Compensation. The Fund’s Board of Trustees (“Board”) has adopted a compensation deferral plan for Independent Trustees that enables Trustees to elect to defer receipt of all or a portion of the annual compensation they are entitled to receive from the Fund. For purposes of determining the amount owed to the Trustee under the plan, deferred amounts are treated as though equal dollar amounts had been invested in shares of the Fund or in other Oppenheimer funds selected by the Trustee. The Fund purchases shares of the funds selected for deferral by the Trustee in amounts equal to his or her deemed investment, resulting in a Fund asset equal to the deferred compensation liability. Such assets are included as a component of “Other” within the asset section of the Statement of Assets and Liabilities. Deferral of Trustees’ fees under the plan will not affect the net assets of the Fund and will not materially affect the Fund’s assets, liabilities or net investment income per share. Amounts will be deferred until distributed in accordance with the compensation deferral plan.
Distribution and Service Plan (12b-1) Fees. Under its General Distributor’s Agreement with the Fund, OppenheimerFunds Distributor, Inc. (the “Distributor”) acts as the Fund’s principal underwriter in the continuous public offering of the Fund’s classes of shares.
Service Plan for Class A Shares. The Fund has adopted a Service Plan (the “Plan”) for Class A shares pursuant to Rule 12b-1 under the 1940 Act. Under the Plan, the Fund
35 OPPENHEIMER SMALL CAP VALUE FUND
NOTES TO FINANCIAL STATEMENTS Continued
8. Fees and Other Transactions with Affiliates (Continued)
reimburses the Distributor for a portion of its costs incurred for services provided to accounts that hold Class A shares. Reimbursement is made periodically at an annual rate of up to
0.25% of the daily net assets of Class A shares of the Fund. The Distributor currently uses all of those fees to pay dealers, brokers, banks and other financial institutions periodically for providing personal service and maintenance of accounts of their customers that hold Class A shares. Any unreimbursed expenses the Distributor incurs with respect to Class A shares in any fiscal year cannot be recovered in subsequent periods. Fees incurred by the Fund under the Plan are detailed in the Statement of Operations.
Distribution and Service Plans for Class C and Class R Shares. The Fund has adopted Distribution and Service Plans (the “Plans”) for Class C and Class R shares pursuant to Rule 12b-1 under the 1940 Act to compensate the Distributor for distributing those share classes, maintaining accounts and providing shareholder services. Under the Plans, the Fund pays the Distributor an annual asset-based sales charge of 0.75% on Class C shares’ daily net assets and 0.25% on Class R shares’ daily net assets. The Fund also pays a service fee under the Plans at an annual rate of 0.25% of daily net assets. The Plans continue in effect from year to year only if the Fund’s Board of Trustees votes annually to approve their continuance at an in person meeting called for that purpose. Fees incurred by the Fund under the Plans are detailed in the Statement of Operations.
Sales Charges. Front-end sales charges and CDSC do not represent expenses of the Fund. They are deducted from the proceeds of sales of Fund shares prior to investment or from redemption proceeds prior to remittance, as applicable. The sales charges retained by the Distributor from the sale of shares and the CDSC retained by the Distributor on the redemption of shares is shown in the following table for the period indicated.
| Period Ended | Class A Front-End | |||
| ||||
April 29, 2016 | $1,008 | |||
Waivers and Reimbursements of Expenses. The Manager has contractually agreed to waive fees and/or reimburse certain expenses so that “Expenses after payments, waivers and/ or reimbursements and reduction to custodian expenses”, excluding expenses incurred directly or indirectly by the Fund as a result of investments in other investment companies, wholly-owned subsidiaries and pooled investment vehicles; will not exceed 1.25% for Class A shares,
2.00% for Class C shares, 0.93% for Class I shares, 1.50% for Class R shares and 1.00% for Class Y shares. During the reporting period, the Manager waived $32,518, $982, $58, $507 and $916 for Class A, Class C, Class I, Class R and Class Y shares, respectively.
The Manager will waive fees and/or reimburse Fund expenses in an amount equal to the indirect management fees incurred through the Fund’s investment in IMMF. During the
36 OPPENHEIMER SMALL CAP VALUE FUND
8. Fees and Other Transactions with Affiliates (Continued)
reporting period, the Manager waived fees and/or reimbursed the Fund $112 for IMMF management fees.
Waivers and/or reimbursements may be modified or terminated as set forth according to the terms in the prospectus.
9. Pending Litigation
In 2009, several putative class action lawsuits were filed and later consolidated before the U.S. District Court for the District of Colorado against OppenheimerFunds, Inc. (“OFI”), OppenheimerFunds Distributor, Inc. (“OFDI”), and Oppenheimer Rochester California Municipal Fund, a fund advised by OFI Global Asset Management, Inc. and distributed by the Distributor (the “California Fund”), in connection with the California Fund’s investment performance. The plaintiffs asserted claims against OFI, OFDI and certain present and former trustees and officers of the California Fund under the federal securities laws, alleging, among other things, that the disclosure documents of the California Fund contained misrepresentations and omissions and the investment policies of the California Fund were not followed. Plaintiffs in the suit filed an amended complaint and defendants filed a motion to dismiss. In 2011, the court issued an order which granted in part and denied in part the defendants’ motion to dismiss. In 2012, plaintiffs filed a motion, which defendants opposed, to certify a class and appoint class representatives and class counsel. In March 2015, the court granted plaintiffs’ motion for class certification. In May 2015, the U.S. Court of Appeals for the Tenth Circuit vacated the class certification order and remanded the matter to the district court for further proceedings. In October 2015, the district court reaffirmed its order and determined that the suit will proceed as a class action. In December 2015, the Tenth Circuit denied defendants’ petition to appeal the district court’s reaffirmed class certification order.
OFI and OFDI believe the suit is without merit; that it is premature to render any opinion as to the likelihood of an outcome unfavorable to them in the suit; and that no estimate can yet be made as to the amount or range of any potential loss. Furthermore, OFI believes that the suit should not impair the ability of OFI or OFDI to perform their respective duties to the Fund and that the outcome of the suit should not have any material effect on the operations of any of the Oppenheimer funds.
37 OPPENHEIMER SMALL CAP VALUE FUND
REPORT OF INDEPENDENT REGISTERED PUBLIC ACCOUNTING FIRM
The Board of Trustees and Shareholders of Oppenheimer Small Cap Value Fund:
We have audited the accompanying statement of assets and liabilities of Oppenheimer Small Cap Value Fund, including the statement of investments, as of April 29, 2016, and the related statement of operations, the statement of changes in net assets and the financial highlights for the period from December 7, 2015 (commencement of operations) to April 29, 2016. These financial statements and financial highlights are the responsibility of the Fund’s management. Our responsibility is to express an opinion on these financial statements and financial highlights based on our audit.
We conducted our audit in accordance with the standards of the Public Company Accounting Oversight Board (United States). Those standards require that we plan and perform the audit to obtain reasonable assurance about whether the financial statements and financial highlights are free of material misstatement. An audit includes examining, on a test basis, evidence supporting the amounts and disclosures in the financial statements. Our procedures included confirmation of securities owned as of April 29, 2016, by correspondence with the custodian, transfer agent and brokers, or by other appropriate auditing procedures where replies from brokers were not received. An audit also includes assessing the accounting principles used and significant estimates made by management, as well as evaluating the overall financial statement presentation. We believe that our audit provides a reasonable basis for our opinion.
In our opinion, the financial statements and financial highlights referred to above present fairly, in all material respects, the financial position of Oppenheimer Small Cap Value Fund as of April 29, 2016, the results of its operations, the changes in its net assets and the financial highlights for the period from December 7, 2015 (commencement of operations) to April 29, 2016, in conformity with U.S. generally accepted accounting principles.
KPMGLLP
Denver, Colorado
June 24, 2016
38 OPPENHEIMER SMALL CAP VALUE FUND
FEDERAL INCOME TAX INFORMATION Unaudited
In early 2016, if applicable, shareholders of record received information regarding all dividends and distributions paid to them by the Fund during calendar year 2015.
Dividends, if any, paid by the Fund during the reporting period which are not designated as capital gain distributions should be multiplied by the maximum amount allowable but not less than 100% to arrive at the amount eligible for the corporate dividend-received deduction.
A portion, if any, of the dividends paid by the Fund during the reporting period which are not designated as capital gain distributions are eligible for lower individual income tax rates to the extent that the Fund has received qualified dividend income as stipulated by recent tax legislation. The maximum amount allowable but not less than $32,576 of the Fund’s fiscal year taxable income may be eligible for the lower individual income tax rates. In early 2016, shareholders of record received information regarding the percentage of distributions that are eligible for lower individual income tax rates.
Recent tax legislation allows a regulated investment company to designate distributions not designated as capital gain distributions, as either interest related dividends or short-term capital gain dividends, both of which are exempt from the U.S. withholding tax applicable to non U.S. taxpayers. For the reporting period, the maximum amount allowable but not less than $193 of the ordinary distributions to be paid by the Fund qualifies as an interest related dividend.
The foregoing information is presented to assist shareholders in reporting distributions received from the Fund to the Internal Revenue Service. Because of the complexity of the federal regulations which may affect your individual tax return and the many variations in state and local tax regulations, we recommend that you consult your tax advisor for specific guidance.
39 OPPENHEIMER SMALL CAP VALUE FUND
BOARD APPROVAL OF THE FUND’S INVESTMENT ADVISORY
AND SUB-ADVISORY AGREEMENTS Unaudited
The Fund has entered into an investment advisory agreement with OFI Global Asset Management, Inc. (“OFI Global” or the “Adviser”), a wholly-owned subsidiary of OppenheimerFunds, Inc. (“OFI” or the “Sub-Adviser”) (“OFI Global” and “OFI” together the “Managers”) and OFI Global has entered into a sub-advisory agreement with OFI whereby OFI provides investment sub-advisory services to the Fund (collectively, the “Agreements”). The Investment Company Act of 1940, as amended, requires that the Board request and evaluate, and that the Managers provide, such information as may be reasonably necessary to evaluate the terms of the Agreements. The Board employs an independent consultant to prepare a report that provides information, including comparative information that the Board requests for that purpose. The Board received information regarding the proposed services, fees, and expenses of the Fund.
The Managers provided information to the Board on the following factors: (i) the nature, quality and extent of the Managers’ proposed services, (ii) the proposed fees and projected expenses of the Fund, including estimated and comparative fee and expense information, (iii) the estimated cost to the Manager and its affiliates of providing services, (iv) whether economies of scale are expected to be realized as the Fund grows and whether fee levels reflect these economies of scale for Fund investors, and (v) other benefits that are expected to accrue to the Managers from their relationship with the Fund. The Board was aware that there are alternatives to retaining the Managers.
Outlined below is a summary of the principal information considered by the Board as well as the Board’s conclusions.
Nature, Quality and Extent of Services. The Board considered information about the nature, quality and extent of the services to be provided to the Fund and information regarding the Managers’ key personnel who will provide such services. The Managers’ duties will include providing the Fund with the services of the portfolio manager and the Sub-Adviser’s investment team, who provide research, analysis and other advisory services in regard to the Fund’s investments; and securities trading services. OFI Global is responsible for oversight of third-party service providers; monitoring compliance with applicable Fund policies and procedures and adherence to the Fund’s investment restrictions; risk management; and oversight of the Sub-Adviser. OFI Global is also responsible for providing certain administrative services to the Fund as well. Those services include providing and supervising all administrative and clerical personnel who are necessary in order to provide effective corporate administration for the Fund; compiling and maintaining records with respect to the Fund’s operations; preparing and filing reports required by the U.S. Securities and Exchange Commission; preparing periodic reports regarding the operations of the Fund for its shareholders; preparing proxy materials for shareholder meetings; and preparing the registration statements required by federal and state securities laws for the sale of the Fund’s shares. OFI Global will also provide the Fund with office space, facilities and equipment.
The Board also considered the quality of the services expected to be provided and the quality of the Managers’ resources that will be available to the Fund. The Board took account of the fact that the Sub-Adviser has had over fifty years of experience as an investment adviser and that its assets under management rank it among the top mutual fund managers
40 OPPENHEIMER SMALL CAP VALUE FUND
in the United States. The Board evaluated the Managers’ advisory, administrative, accounting, legal, compliance services and risk management, and information the Board has received regarding the experience and professional qualifications of the Managers’ key personnel and the size and functions of its staff. In its evaluation of the quality of the portfolio management services to be provided, the Board considered the experience of Eric Hewitt, the portfolio manager for the Fund, and the Sub-Adviser’s investment team and analysts. The Board members also considered the totality of their experiences with the Managers as directors or trustees of other funds advised by the Managers. The Board considered information regarding the quality of services to be provided by affiliates of the Managers, which the Board members have become knowledgeable about through their experiences with the Managers and in connection with the renewal of other funds’ service agreements. The Board concluded, in light of the Managers’ experience, reputation, personnel, operations and resources that the Fund should benefit from the services to be provided under the Agreements.
Fees and Expenses of the Fund. The Board reviewed the fees to be paid to the Adviser and the other expenses that will be borne by the Fund. The Board also considered how the Fund’s expenses will compare to a group of similar, unaffiliated funds (“expense peer group”). The Board also noted that the expenses the Fund will bear were competitive with those of its expense peer group. The Board noted that the Adviser has agreed to contractually agreed to waive fees and/or reimburse the Fund for certain expenses in order to limit “Total Annual Fund Operating Expenses After Fee Waiver and/or Expense Reimbursement” (excluding (i) interest and fees from borrowing, interest and related expenses from inverse floaters, taxes, dividends tied to short sales, brokerage commissions, and other expenditures which are capitalized in accordance with generally accepted accounting principles; (ii) expenses incurred directly or indirectly by the Fund as a result of investments in other investment companies, wholly-owned subsidiaries and pooled investment vehicles; (iii) certain other expenses attributable to, and incurred as a result of, a Fund’s investments; and (iv) other expenses (including litigation expenses) not incurred in the ordinary course of the Fund’s business) to annual rates of 1.25% for Class A shares, 2.00% for Class C shares, 1.50% for Class R shares, 1.00% for Class Y shares and 0.93% for Class I shares, as calculated on the daily net assets of the Fund. This contractual fee waiver and/or expense reimbursement may not be amended or withdrawn for one year from the date of the Fund’s prospectus, unless approved by the Board.
Performance. The Board considered that the Fund has no operational history and that its performance could not be a factor in deciding whether to approve the Agreement.
Economies of Scale To Be Realized by the Managers. The Board considered information regarding the Managers’ anticipated costs in serving as the Fund’s investment adviser and sub-adviser, including the costs associated with the personnel and systems necessary to manage the Fund. The Board also considered that the Managers must be able to pay and retain experienced professional personnel at competitive rates to provide quality services to the Fund. The Board reviewed whether the Managers may realize economies of scale in managing and supporting the Fund. The Board noted that it is proposed that the Fund will have management fee breakpoints, which are intended to share with Fund shareholders
41 OPPENHEIMER SMALL CAP VALUE FUND
BOARD APPROVAL OF THE FUND’S INVESTMENT ADVISORY
AND SUB-ADVISORY AGREEMENTS Unaudited / Continued
economies of scale that may exist as the Fund’s assets grow.
Other Benefits to the Managers. The Board considered information that was provided regarding the direct and indirect benefits the Managers may receive as a result of its relationship with the Fund, including compensation paid to the Managers’ affiliates and research that may be provided to the Manager in connection with permissible brokerage arrangements (soft dollar arrangements).
Conclusions. These factors were also considered by the independent Trustees meeting separately from the full Board, assisted by experienced counsel to the Fund and to the independent Trustees. Fund counsel and the independent Trustees’ counsel are independent of the Manager within the meaning and intent of the Securities and Exchange Commission Rules.
Based on its review of the information it received and its evaluations described above, the Board, including a majority of the independent Trustees, decided to approve the Agreements through September 30, 2016. In arriving at its decision, the Board did not identify any factor or factors as being more important than others, but considered all of the above information, and considered the terms and conditions of the Agreements, including the management fees, in light of all the surrounding circumstances.
42 OPPENHEIMER SMALL CAP VALUE FUND
PORTFOLIO PROXY VOTING POLICIES AND GUIDELINES;
UPDATES TO STATEMENTS OF INVESTMENTS Unaudited
The Fund has adopted Portfolio Proxy Voting Policies and Guidelines under which the Fund votes proxies relating to securities (“portfolio proxies”) held by the Fund. A description of the Fund’s Portfolio Proxy Voting Policies and Guidelines is available (i) without charge, upon request, by calling the Fund toll-free at 1.800.CALL OPP (225.5677), (ii) on the Fund’s website at www.oppenheimerfunds.com, and (iii) on the SEC’s website at www.sec.gov. In addition, the Fund is required to file Form N-PX, with its complete proxy voting record for the 12 months ended June 30th, no later than August 31st of each year. The Fund’s voting record is available (i) without charge, upon request, by calling the Fund toll-free at 1.800.CALL OPP (225.5677), and (ii) in the Form N-PX filing on the SEC’s website at www.sec.gov.
The Fund files its complete schedule of portfolio holdings with the SEC for the first quarter and the third quarter of each fiscal year on Form N-Q. The Fund’s Form N-Q filings are available on the SEC’s website at www.sec.gov. Those forms may be reviewed and copied at the SEC’s Public Reference Room in Washington, D.C. Information on the operation of the Public Reference Room may be obtained by calling 1-800-SEC-0330.
Householding—Delivery of Shareholder Documents
This is to inform you about OppenheimerFunds’ “householding” policy. If more than one member of your household maintains an account in a particular fund, OppenheimerFunds will mail only one copy of the fund’s prospectus (or, if available, the fund’s summary prospectus), annual and semiannual report and privacy policy. The consolidation of these mailings, called householding, benefits your fund through reduced mailing expense, and benefits you by reducing the volume of mail you receive from OppenheimerFunds. Householding does not affect the delivery of your account statements.
Please note that we will continue to household these mailings for as long as you remain an OppenheimerFunds shareholder, unless you request otherwise. If you prefer to receive multiple copies of these materials, please call us at 1.800.CALL-OPP (225-5677). You may also notify us in writing or via email. We will begin sending you individual copies of the prospectus (or, if available, the summary prospectus), reports and privacy policy within 30 days of receiving your request to stop householding.
43 OPPENHEIMER SMALL CAP VALUE FUND
DISTRIBUTION SOURCES Unaudited
For any distribution that took place over the Fund’s reporting period, the table below details on a per-share basis the percentage of the Fund’s total distribution payment amount that was derived from the following sources: net income, net profit from the sale of securities, and other capital sources. This information is based upon income and capital gains using generally accepted accounting principles as of the date of each distribution. Because the Fund is actively managed, the relative amount of the Fund’s total distributions derived from various sources over the calendar year may change. Please note that this information should not be used for tax reporting purposes as the tax character of distributable income may differ from the amounts used for this notification. You will receive IRS tax forms in the first quarter of each calendar year detailing the actual amount of the taxable and non-taxable portion of distributions paid to you during the tax year.
For the most current information, please go to oppenheimerfunds.com. Select your Fund, then the ‘Detailed’ tab; where ‘Dividends’ are shown, the Fund’s latest pay date will be followed by the sources of any distribution, updated daily.
| Fund Name | Pay Date | Net Income | Net Profit from Sale | Other Capital Sources | ||||||||||||
| ||||||||||||||||
Oppenheimer Limited-Term Bond Fund | 5/29/15 | 99.9% | 99.9% | 99.9% | ||||||||||||
| ||||||||||||||||
44 OPPENHEIMER SMALL CAP VALUE FUND
TRUSTEES AND OFFICERS Unaudited
| Name, Position(s) Held with the Fund, Length of Service, Year of Birth | Principal Occupation(s) During the Past 5 Years; Other Trusteeships/Directorships Held; Number of Portfolios in the Fund Complex Currently Overseen | |
| INDEPENDENT TRUSTEES | The address of each Trustee in the chart below is 6803 S. Tucson Way, Centennial, Colorado 80112-3924. Each Trustee serves for an indefinite term, or until his or her resignation, retirement, death or removal. | |
Brian F. Wruble, Chairman of the Board of Trustees and Trustee (since 2015) Year of Birth: 1943 | Governor and Vice Chairman of Community Foundation of the Florida Keys (non-profit) (since July 2012); Trustee of the Board of Trustees, The Jackson Laboratory (non-profit) (1991-2011 and since May 2014); Chairman Emeritus (since August 2011) of The Jackson Laboratory (non-profit); Member of Zurich Insurance Group’s Investment Management Advisory Council (insurance) (since 2004); Treasurer (since 2007) and Trustee of the Institute for Advanced Study (non-profit educational institute) (since May 1992); Director of Special Value Opportunities Fund, LLC (registered investment company) (affiliate of the Sub-Adviser’s parent company) (September 2004-June 2015); General Partner of Odyssey Partners, L.P. (hedge fund) (September 1995-December 2007); Special Limited Partner of Odyssey Investment Partners, LLC (private equity investment) (January 1999-September 2004). Oversees 55 portfolios in the OppenheimerFunds complex. Mr. Wruble has served on the Boards of certain Oppenheimer funds since April 2001, during which time he has become familiar with the Fund’s (and other Oppenheimer funds’) financial, accounting, regulatory and investment matters and has contributed to the Boards’ deliberations. | |
Beth Ann Brown, Trustee (since 2016) Year of Birth: 1968 | Advisor, Board of Advisors of Caron Engineering Inc. (since December 2014); Independent Consultant (since September 2012); held the following positions at Columbia Management Investment Advisers LLC: Head of Intermediary Distribution (2008-2012), Managing Director, Strategic Relations (2005-2008), Managing Director, Head of National Accounts (2004-2005); Senior Vice President, National Account Manager (2002-2004), Senior Vice President, Key Account Manager (1999-2002) and Vice President, Key Account Manager (1996-1999) of Liberty Funds Distributor, Inc.; President and Director, of Acton Shapleigh Youth Conservation Corps (non-profit) (since 2012); and Vice President and Director of Grahamtastic Connection (non-profit) (since May 2013). Oversees 55 portfolios in the OppenheimerFunds complex. Ms. Brown has served on the Boards of certain Oppenheimer funds since January 2016, during which time she has become familiar with the Fund’s (and other Oppenheimer funds’) financial, accounting, regulatory and investment matters and has contributed to the Boards’ deliberations. | |
Matthew P. Fink, Trustee (since 2015) Year of Birth: 1941 | Trustee of the Committee for Economic Development (policy research foundation) (2005-2011); Director of ICI Education Foundation (education foundation) (October 1991-August 2006); President of the Investment Company Institute (trade association) (October 1991-June 2004); Director of ICI Mutual Insurance Company (insurance company) (October 1991-June 2004); Author of The Rise of Mutual Funds: An Insider’s View published by Oxford University Press (second edition 2011). Oversees 55 portfolios in the OppenheimerFunds complex. Mr. Fink has served on the Boards of certain Oppenheimer funds since January 2005, during which time he has become familiar with the Fund’s (and other Oppenheimer funds’) financial, accounting, regulatory and investment matters and has contributed to the Boards’ deliberations. | |
45 OPPENHEIMER SMALL CAP VALUE FUND
TRUSTEES AND OFFICERS Unaudited / Continued
Edmund P. Giambastiani, Jr., Trustee (since 2015) Year of Birth: 1948 | Advisory Board Member of the Maxwell School of Citizenship and Public Affairs of Syracuse University (since April 2012); Director of Mercury Defense Systems Inc. (information technology) (August 2011-February 2013); Trustee of the U.S. Naval Academy Foundation (since November 2010); Advisory Board Member of the Massachusetts Institute of Technology Lincoln Laboratory (federally-funded research development center) (since May 2010); Director of The Boeing Company (aerospace and defense) (since October 2009); Trustee of MITRE Corporation (federally-funded research development center) (since September 2008); Independent Director of QinetiQ Group Plc (defense technology and security) (February 2008-August 2011); Chairman of Monster Worldwide, Inc. (on-line career services) (since March 2015), Lead Director (June 2011-March 2015); Chairman of Alenia North America, Inc. (military and defense products) (January 2008-October 2009); Director of SRA International, Inc. (information technology and services) (January 2008-July 2011); President of Giambastiani Group LLC (national security and energy consulting) (since October 2007); United States Navy, career nuclear submarine officer (June 1970-October 2007), Vice Chairman of the Joint Chiefs of Staff (2005-October 2007), Supreme Allied Commander of NATO Commander Transformation (2003-2005), Commander, U.S. Joint Forces Command (2002-2005). Since his retirement from the U.S. Navy in October 2007, Admiral Giambastiani has also served on numerous U.S. Government advisory boards, investigations and task forces for the Secretaries of Defense, State and Interior and the Central Intelligence Agency. He currently serves as a federal commissioner on the Military Compensation and Retirement Modernization Commission. Oversees 55 portfolios in the OppenheimerFunds complex. Admiral Giambastiani has served on the Boards of certain Oppenheimer funds since February 2013, during which time he has become familiar with the Fund’s (and other Oppenheimer funds’) financial, accounting, regulatory and investment matters and has contributed to the Boards’ deliberations. For purposes of this report, Admiral Giambastiani is identified as a Trustee. | |
Elizabeth Krentzman, Trustee (since 2015) Year of Birth: 1959 | Advisory Board Member of the University of Florida Law Center Association (since 2016) and the Securities and Exchange Commission Historical Society (since 2007); held the following positions at Deloitte & Touche LLP: Principal and Chief Regulatory Advisor for Asset Management Services (2007-2014) and U.S. Mutual Fund Leader (2011-2014); General Counsel of the Investment Company Institute (trade association) (June 2004-April 2007); held the following positions at Deloitte & Touche LLP: National Director of the Investment Management Regulatory Consulting Practice (1997-2004), Principal (2003-2004), Director (1998-2003) and Senior Manager (1997-1998); Assistant Director of the Division of Investment Management - Office of Disclosure and Investment Adviser Regulation (1996-1997) and various positions with the Division of Investment Management – Office of Regulatory Policy (1991-1996) of the U.S. Securities and Exchange Commission; Associate at Ropes & Gray (1987-1991). Oversees 55 portfolios in the OppenheimerFunds complex. Ms. Krentzman has served on the Boards of certain Oppenheimer funds since August 2014, during which time she has become familiar with the Fund’s (and other Oppenheimer funds’) financial, accounting, regulatory and investment matters and has contributed to the Boards’ deliberations. | |
Mary F. Miller, Trustee (since 2015) Year of Birth: 1942 | Trustee of International House (not-for-profit) (since June 2007); Trustee of the American Symphony Orchestra (not-for-profit) (October 1998-November 2011); and Senior Vice President and General Auditor of American Express Company (financial services company) (July 1998-February 2003). Oversees 55 portfolios | |
46 OPPENHEIMER SMALL CAP VALUE FUND
Mary F. Miller Continued | in the OppenheimerFunds complex. Ms. Miller has served on the Boards of certain Oppenheimer funds since August 2004, during which time she has become familiar with the Fund’s (and other Oppenheimer funds’) financial, accounting, regulatory and investment matters and has contributed to the Boards’ deliberations. | |
Joel W. Motley, Trustee (since 2015) Year of Birth: 1952 | Director of Greenwall Foundation (since October 2013); Member of Board and Investment Committee of The Greenwall Foundation (since April 2013); Member of the Vestry of Trinity Wall Street (since April 2012); Director of Southern Africa Legal Services Foundation (since March 2012); Board Member of Pulitzer Center for Crisis Reporting (non-profit journalism) (since March 2011); Managing Director of Public Capital Advisors, LLC (privately-held financial advisor) (since January 2006); Managing Director of Carmona Motley, Inc. (privately-held financial advisor) (since January 2002); Director of Columbia Equity Financial Corp. (privately-held financial advisor) (2002-2007); Managing Director of Carmona Motley Hoffman Inc. (privately-held financial advisor) (January 1998-December 2001); Member of the Finance and Budget Committee of the Council on Foreign Relations, Member of the Investment Committee and Board of Human Rights Watch (since July 2000) and Member of the Investment Committee and Board of Historic Hudson Valley (since February 2010).Oversees 55 portfolios in the OppenheimerFunds complex. Mr. Motley has served on the Boards of certain Oppenheimer funds since October 2002, during which time he has become familiar with the Fund’s (and other Oppenheimer funds’) financial, accounting, regulatory and investment matters and has contributed to the Boards’ deliberations. | |
Joanne Pace, Trustee (since 2015) Year of Birth: 1958 | Advisory Board Director of Massey Quick and Company, LLC (since October 2014); Board Director of Horizon Blue Cross Blue Shield of New Jersey (since November 2012); Advisory Board Director of The Alberleen Group LLC (since March, 2012); Board Member (since January 2015), Advisory Council Member (December 2012-December 2014) of 100 Women in Hedge Funds (non-profit) (since December, 2012); Advisory Council Member of Morgan Stanley Children’s Hospital (non-profit) (since May, 2012); Board Director of The Komera Project (non-profit) (since April, 2012); New York Advisory Board Director of Peace First (non-profit) (2010-2015); Senior Advisor of SECOR Asset Management, LP (2010-2011); Managing Director and Chief Operating Officer of Morgan Stanley Investment Management (2006-2010); Partner and Chief Operating Officer of FrontPoint Partners, LLC (hedge fund) (2005-2006); held the following positions at Credit Suisse: Managing Director (2003-2005); Global Head of Human Resources and member of Executive Board and Operating Committee (2004-2005), Global Head of Operations and Product Control (2003-2004); held the following positions at Morgan Stanley: Managing Director (1997-2003),Controller and Principal Accounting Officer (1999-2003); Chief Financial Officer (temporary assignment) for the Oversight Committee, Long Term Capital Management (1998-1999). Lead Independent Director and Chair of the Audit and Nominating Committee of The Global Chartist Fund, LLC of Oppenheimer Asset Management (2011-2012); Board Director of Managed Funds Association (2008-2010); Board Director of Morgan Stanley Foundation (2007-2010) and Investment Committee Chair (2008-2010). Oversees 55 portfolios in the OppenheimerFunds complex. Ms. Pace has served on the Boards of certain Oppenheimer funds since November 2012, including as an Advisory Board Member for certain Oppenheimer funds, during which time she has become familiar with the Fund’s (and other Oppenheimer funds’) financial, accounting, regulatory and investment matters and has contributed to the Board’s deliberations. For purposes of this report, Ms. Pace is identified as a Trustee. | |
47 OPPENHEIMER SMALL CAP VALUE FUND
TRUSTEES AND OFFICERS Unaudited / Continued
Daniel Vandivort, Trustee (since 2015) Year of Birth: 1954 | Chairman and Lead Independent Director/Trustee (March 2010 – September 2014), Chairman of the Audit Committee (March 2009 – September 2014) and Director/Trustee (December 2008 – September 2014) of the Board of Directors/ Trustees of Value Line Funds; Trustee, Board of Trustees of Huntington Disease Foundation of America (since January 2015 and June 2007 – December 2013): Trustee, Board of Trustees, RIM Retirement Savings Plan (2005 – 2007); President and Chief Investment Officer, Robeco Investment Management, formerly known as Weiss Peck and Greer (January 2005 – June 2007); Member, Management Committee of Robeco Investment Management (2001 – 2007); Chairman and Trustee of the Board of Trustees of Weiss, Peck and Greer Funds (2004 – 2005); Managing Director and Head of Fixed Income, Weiss, Peck and Greer (November 1994 – January 2005); Managing Director and Head of Fixed Income, CS First Boston Investment Management (January 1992 – November 1994); Director, Global Product Development, First Boston Asset Management (November 1989 to January 1992); Vice President, Fixed Income Sales, First Boston Corp. (May 1984 – November 1989). Oversees 55 portfolios in the OppenheimerFunds complex. Mr. Vandivort has served on the Boards of certain Oppenheimer funds since 2014, during which time he has become familiar with the Fund’s (and other Oppenheimer funds’) financial, accounting, regulatory and investment matters and has contributed to the Boards’ deliberations.
| |
INTERESTED TRUSTEE AND OFFICER | Mr. Steinmetz is an “Interested Trustee” because he is affiliated with the Manager and the Sub-Adviser by virtue of his positions as Chairman of the Sub-Adviser and officer and director of the Manager. Both as a Trustee and as an officer, Mr. Steinmetz serves for an indefinite term, or until his resignation, retirement, death or removal. Mr. Steinmetz’s address is 225 Liberty Street, New York, New York 10281-1008. | |
Arthur P. Steinmetz, Trustee, President and Principal Executive Officer (since 2015) Year of Birth: 1958 | Chairman of the Sub-Adviser (since January 2015); CEO and Chairman of the Manager (since July 2014), President of the Manager (since May 2013), a Director of the Manager (since January 2013), Director of the Sub-Adviser (since July 2014), President, Management Director and CEO of Oppenheimer Acquisition Corp. (the Sub-Adviser’s parent holding company) (since July 2014), and President and Director of OFI SteelPath, Inc. (since January 2013). Chief Investment Officer of the OppenheimerFunds advisory entities from (January 2013- December 2013); Executive Vice President of the Manager (January 2013-May 2013); Chief Investment Officer of the Sub-Adviser (October 2010-December 2012); Chief Investment Officer, Fixed-Income, of the Sub-Adviser (April 2009-October 2010); Executive Vice President of the Sub-Adviser (October 2009-December 2012); Director of Fixed Income of the Sub-Adviser (January 2009-April 2009); and a Senior Vice President of the Sub-Adviser (March 1993-September 2009). An officer of 101 portfolios in the OppenheimerFunds complex.
| |
| OTHER OFFICERS OF THE FUND | The addresses of the Officers in the chart below are as follows: for Mss. Lo Bessette, Sexton and Picciotto, 225 Liberty Street, New York, New York 10281-1008, for Messrs. Hewitt and Petersen, 6803 S. Tucson Way, Centennial, Colorado 80112-3924. Each Officer serves for an indefinite term or until his or her resignation, retirement, death or removal. | |
Eric Hewitt, Vice President (since 2015) Year of Birth: 1971 | Vice President of the Sub-Adviser (since March 2013). Customer portfolio manager and product manager for Columbia Management Investment Advisors, LLC (2012-2013). Senior Equity Analyst with Diamondback/Harbor Watch Capital Management, LLC (2009–2012) and a Senior Equity Analyst and Portfolio Manager with AllianceBernstein LP (1999–2009). A portfolio manager and an officer in the OppenheimerFunds complex. | |
48 OPPENHEIMER SMALL CAP VALUE FUND
Cynthia Lo Bessette, Secretary and Chief Legal Officer (since 2016) Year of Birth: 1969 | Senior Vice President and Deputy General Counsel (March 2015 to February 2016) and Executive Vice President, General Counsel and Secretary of the Manager (since February 2016); Chief Legal Officer of the Sub-Adviser and the Distributor (since February 2016); Vice President, General Counsel and Secretary of Oppenheimer Acquisition Corp. (since February 2016); General Counsel of OFI SteelPath, Inc., VTL Associates, LLC and Index Management Solutions, LLC (since February 2016); Chief Legal Officer of OFI Global Institutional, Inc., HarbourView Asset Management Corporation, OFI Global Trust Company, Oppenheimer Real Asset Management, Inc., OFI Private Investments Inc., Shareholder Services, Inc. and Trinity Investment Management Corporation (since February 2016); Vice President, Corporate Counsel (February 2012 – March 2015) and Deputy Chief Legal Officer (April 2013 – March 2015) of Jennison Associates LLC; Assistant General Counsel (April 2008 – September 2009) and Deputy General Counsel (October 2009 – February 2012) of Lord Abbett & Co. LLC. An officer of 101 portfolios in the OppenheimerFunds complex. | |
Jennifer Sexton, Vice President and Chief Business Officer (since 2015) Year of Birth: 1969 | Senior Vice President of OppenheimerFunds Distributor, Inc. (since June 2014); Vice President of OppenheimerFunds Distributor, Inc. (April 2006-June 2014); Vice President of the Sub-Adviser (January 1998-March 2006); Assistant Vice President of the Sub-Adviser (October 1991-December 1998). An officer of 101 portfolios in the OppenheimerFunds complex. | |
Mary Ann Picciotto, Chief Compliance Officer and Chief Anti-Money Laundering Officer (since 2015) Year of Birth: 1973 | Senior Vice President and Chief Compliance Officer of the Manager (since March 2014); Chief Compliance Officer of the Sub-Adviser, OFI SteelPath, Inc., OFI Global Trust Company, OFI Global Institutional, Inc., Oppenheimer Real Asset Management, Inc., OFI Private Investments, Inc., Harborview Asset Management Corporation, Trinity Investment Management Corporation, and Shareholder Services, Inc. (since March 2014); Managing Director of Morgan Stanley Investment Management Inc. and certain of its various affiliated entities; Chief Compliance Officer of various Morgan Stanley Funds (May 2010-January 2014); Chief Compliance Officer of Morgan Stanley Investment Management Inc. (April 2007-January 2014). An officer of 101 portfolios in the OppenheimerFunds complex. | |
Brian S. Petersen, Treasurer and Principal Financial & Accounting Officer (since 2016) Year of Birth: 1970 | Vice President of the Manager (since January 2013); Vice President of the Sub-Adviser (February 2007-December 2012); Assistant Vice President of the Sub- Adviser (August 2002-2007). An officer of 101 portfolios in the OppenheimerFunds complex. | |
The Fund’s Statement of Additional Information contains additional information about the Fund’s Trustees and Officers is available without charge upon request, by calling 1.800.CALL OPP (225.5677).
49 OPPENHEIMER SMALL CAP VALUE FUND
OPPENHEIMER SMALL CAP VALUE FUND
| Manager | OFI Global Asset Management, Inc. | |
| Sub-Adviser | OppenheimerFunds, Inc. | |
| Distributor | OppenheimerFunds Distributor, Inc. | |
| Transfer and Shareholder | OFI Global Asset Management, Inc. | |
| Servicing Agent | ||
| Sub-Transfer Agent | Shareholder Services, Inc. | |
| DBA OppenheimerFunds Services | ||
| Independent Registered | KPMG LLP | |
| Public Accounting Firm | ||
| Legal Counsel | Kramer Levin Naftalis & Frankel LLP | |
© 2016 OppenheimerFunds, Inc. All Rights reserved.
50 OPPENHEIMER SMALL CAP VALUE FUND
As an Oppenheimer fund shareholder, you are entitled to know how we protect your personal information and how we limit its disclosure.
Information Sources
We obtain nonpublic personal information about our shareholders from the following sources:
● Applications or other forms
● When you create a user ID and password for online account access
● When you enroll in eDocs Direct, our electronic document delivery service
● Your transactions with us, our affiliates or others
● A software program on our website, often referred to as a “cookie,” which indicates which parts of our site you’ve visited
● When you set up challenge questions to reset your password online
If you visit oppenheimerfunds.com and do not log on to the secure account information areas, we do not obtain any personal information about you. When you do log on to a secure area, we do obtain your user ID and password to identify you. We also use this information to provide you with products and services you have requested, to inform you about products and services that you may be interested in and assist you in other ways.
We do not collect personal information through our website unless you willingly provide it to us, either directly by email or in those areas of the website that request information. In order to update your personal information (including your mailing address, email address and phone number) you must first log on and visit your user profile.
If you have set your browser to warn you before accepting cookies, you will receive the warning message with each cookie. You can refuse cookies by turning them off in your browser. However, doing so may limit your access to certain sections of our website.
We use cookies to help us improve and manage our website. For example, cookies help us recognize new versus repeat visitors to the site, track the pages visited, and enable some special features on the website. This data helps us provide a better service for our website visitors.
Protection of Information
We do not disclose any non-public personal information (such as names on a customer list) about current or former customers to anyone, except as permitted by law.
Disclosure of Information
Copies of confirmations, account statements and other documents reporting activity in your fund accounts are made available to your financial advisor (as designated by you). We may also use details about you and your investments to help us, our financial service affiliates, or firms that jointly market their financial products and services with ours, to better serve your investment needs or suggest financial services or educational material that may be of interest to you. If this requires us to provide you with an opportunity to “opt in” or “opt out” of such information sharing with a firm not affiliated with us, you will receive notification on how to do so, before any such sharing takes place.
Right of Refusal
We will not disclose your personal information to unaffiliated third parties (except as permitted by law), unless we first offer you a reasonable opportunity to refuse or “opt out” of such disclosure.
51 OPPENHEIMER SMALL CAP VALUE FUND
PRIVACY POLICY NOTICE Continued
Internet Security and Encryption
In general, the email services provided by our website are encrypted and provide a secure and private means of communication with us. To protect your own privacy, confidential and/or personal information should only be communicated via email when you are advised that you are using a secure website. As a security measure, we do not include personal or account information in non-secure emails, and we advise you not to send such information to us in non-secure emails. Instead, you may take advantage of the secure features of our website to encrypt your email correspondence. To do this, you will need to use a browser that supports Secure Sockets Layer (SSL) protocol.
We do not guarantee or warrant that any part of our website, including files available for download, are free of viruses or other harmful code. It is your responsibility to take appropriate precautions, such as use of an anti-virus software package, to protect your computer hardware and software.
| ● | All transactions, including redemptions, exchanges and purchases, are secured by SSL and 256-bit encryption. SSL is used to establish a secure connection between your PC and OppenheimerFunds’ server. It transmits information in an encrypted and scrambled format. | |
| ● | Encryption is achieved through an electronic scrambling technology that uses a “key” to code and then decode the data. Encryption acts like the cable converter box you may have on your television set. It scrambles data with a secret code so that no one can make sense of it while it is being transmitted. When the data reaches its destination, the same software unscrambles the data. | |
| ● | You can exit the secure area by either closing your browser, or for added security, you can use the Log Out button before you close your browser. |
Other Security Measures
We maintain physical, electronic and procedural safeguards to protect your personal account information. Our employees and agents have access to that information only so that they may offer you products or provide services, for example, when responding to your account questions.
How You Can Help
You can also do your part to keep your account information private and to prevent unauthorized transactions. If you obtain a user ID and password for your account, do not allow it to be used by anyone else. Also, take special precautions when accessing your account on a computer used by others.
Who We Are
This joint notice describes the privacy policies of the Oppenheimer funds, OppenheimerFunds, Inc., each of its investment adviser subsidiaries, OppenheimerFunds Distributor, Inc. and OFI Global Trust Co. It applies to all Oppenheimer fund accounts you presently have, or may open in the future, using your Social Security number—whether or not you remain a shareholder of our funds. This notice was last updated March 2015. In the event it is updated or changed, we will post an updated notice on our website at oppenheimerfunds.com. If you have any questions about this privacy policy, write to us at P.O. Box 5270, Denver, CO 80217-5270, email us by clicking on the Contact Us section of our website at oppenheimerfunds.com or call us at 1.800.CALL OPP (225.5677).
52 OPPENHEIMER SMALL CAP VALUE FUND
THIS PAGE INTENTIONALLY LEFT BLANK.
53 OPPENHEIMER SMALL CAP VALUE FUND
THIS PAGE INTENTIONALLY LEFT BLANK.
54 OPPENHEIMER SMALL CAP VALUE FUND
THIS PAGE INTENTIONALLY LEFT BLANK.
55 OPPENHEIMER SMALL CAP VALUE FUND
Visit us at oppenheimerfunds.com for 24-hr access to account information and transactions or call us at 800.CALL OPP (800.225.5677) for 24-hr automated information and automated transactions. Representatives also available Mon–Fri 8am-8pm ET.
| ||
Visit Us
| ||
| oppenheimerfunds.com | ||
Call Us
| ||
| 800 225 5677 | ||
Follow Us
| ||
 | Oppenheimer funds are distributed by OppenheimerFunds Distributor, Inc. 225 Liberty Street, New York, NY 10281-1008 | |
| © 2016 OppenheimerFunds Distributor, Inc. All rights reserved. | ||
RA2455.001.0416 June 24, 2016 | ||

Item 2. Code of Ethics.
The registrant has adopted a code of ethics that applies to the registrant’s principal executive officer, principal financial officer, principal accounting officer or controller or persons performing similar functions.
Item 3. Audit Committee Financial Expert.
The Board of Trustees of the registrant has determined that Joanne Pace, the Board’s Audit Committee Chairman, is an audit committee financial expert and that Ms. Pace is “independent” for purposes of this
Item 3.
Item 4. Principal Accountant Fees and Services.
| (a) | Audit Fees |
The principal accountant for the audit of the registrant’s annual financial statements billed $20,600 in fiscal 2016 and no such fees in fiscal 2015.
| (b) | Audit-Related Fees |
The principal accountant for the audit of the registrant’s annual financial statements billed no such fees in fiscal 2016 and no such fees in fiscal 2015.
The principal accountant for the audit of the registrant’s annual financial statements billed $445,440 in fiscal 2016 and no such fees in fiscal 2015 to the registrant’s investment adviser or any entity controlling, controlled by, or under common control with the adviser that provides ongoing services to the registrant.
Such services include: Internal control reviews, GIPS attestation procedures, additional audit services, and system conversion testing
| (c) | Tax Fees |
The principal accountant for the audit of the registrant’s annual financial statements billed no such fees in fiscal 2016 and no such fees in fiscal 2015.
The principal accountant for the audit of the registrant’s annual financial statements billed $468,498 in fiscal 2016 and no such fees in fiscal 2015 to the registrant’s investment adviser or any entity controlling, controlled by, or under common control with the adviser that provides ongoing services to the registrant.
Such services include: tax compliance, tax planning and tax advice. Tax compliance generally involves preparation of original and amended tax returns, claims for a refund and tax payment-planning services. Tax planning and tax advice includes assistance with tax audits and appeals, tax advice related to mergers and acquisitions and requests for rulings or technical advice from taxing authorities.
| (d) | All Other Fees |
The principal accountant for the audit of the registrant’s annual financial statements billed no such fees in fiscal 2016 and no such fees in fiscal 2015.
The principal accountant for the audit of the registrant’s annual financial statements billed no such fees in fiscal 2016 and no such fees in fiscal 2015 to the registrant’s investment adviser or any entity controlling, controlled by, or under common control with the adviser that provides ongoing services to the registrant.
Such fees would include the cost to the principal accountant of attending audit committee meetings and consultations regarding the registrant’s retirement plan with respect to its Trustees.
| (e) | (1) During its regularly scheduled periodic meetings, the registrant’s audit committee will pre-approve all audit, audit-related, tax and other services to be provided by the principal accountants of the registrant. |
| The audit committee has delegated pre-approval authority to its Chairman for any subsequent new engagements that arise between regularly scheduled meeting dates provided that any fees such pre-approved are presented to the audit committee at its next regularly scheduled meeting. |
| Under applicable laws, pre-approval of non-audit services may be waived provided that: 1) the aggregate amount of all such services provided constitutes no more than five percent of the total amount of fees paid by the registrant to its principal accountant during the fiscal year in which services are provided 2) such services were not recognized by the registrant at the time of engagement as non-audit services and 3) such services are promptly brought to the attention of the audit committee of the registrant and approved prior to the completion of the audit. |
| (2) 0% |
| (f) | Not applicable as less than 50%. |
| (g) | The principal accountant for the audit of the registrant’s annual financial statements billed $913,938 in fiscal 2016 and no such fees in fiscal 2015 to the registrant and the registrant’s investment adviser or any entity controlling, controlled by, or under common control with the adviser that provides ongoing services to the registrant related to non-audit fees. Those billings did not include any prohibited non-audit services as defined by the Securities Exchange Act of 1934. |
| (h) | The registrant’s audit committee of the board of Trustees has considered whether the provision of non-audit services that were rendered to the registrant’s investment adviser, and any entity controlling, controlled by, or under common control with the investment adviser that provides ongoing services to the registrant that were not pre-approved pursuant to paragraph (c)(7)(ii) of Rule 2-01 of Regulation S-X is compatible with maintaining the principal accountant’s independence. No such services were rendered. |
Item 5. Audit Committee of Listed Registrants
Not applicable.
Item 6. Schedule of Investments.
a) Not applicable. The complete schedule of investments is included in Item 1 of this Form N-CSR.
b) Not applicable.
Item 7. Disclosure of Proxy Voting Policies and Procedures for Closed-End Management Investment Companies.
Not applicable.
Item 8. Portfolio Managers of Closed-End Management Investment Companies.
Not applicable.
Item 9. Purchases of Equity Securities by Closed-End Management Investment Company and Affiliated Purchasers.
Not applicable.
Item 10. Submission of Matters to a Vote of Security Holders.
The Fund’s Governance Committee Provisions with Respect to Nominations of Directors/Trustees to the Respective Boards
None
Item 11. Controls and Procedures.
Based on their evaluation of the registrant’s disclosure controls and procedures (as defined in rule 30a-3(c) under the Investment Company Act of 1940 (17 CFR 270.30a-3(c)) as of 4/29/2016, the registrant’s principal executive officer and principal financial officer found the registrant’s disclosure controls and procedures to provide reasonable assurances that information required to be disclosed by the registrant in the reports that it files under the Securities Exchange Act of 1934 (a) is accumulated and communicated to registrant’s management, including its principal executive officer and principal financial officer, to allow timely decisions regarding required disclosure, and (b) is recorded, processed, summarized and reported, within the time periods specified in the rules and forms adopted by the U.S. Securities and Exchange Commission.
There have been no changes in the registrant’s internal controls over financial reporting that occurred during the registrant’s second fiscal quarter of the period covered by this report that have materially affected, or are reasonably likely to materially affect, the registrant’s internal control over financial reporting.
Item 12. Exhibits.
| (a) | (1) Exhibit attached hereto. |
| (2) Exhibits attached hereto. |
| (3) Not applicable. |
| (b) | Exhibit attached hereto. |
SIGNATURES
Pursuant to the requirements of the Securities Exchange Act of 1934 and the Investment Company Act of 1940, the registrant has duly caused this report to be signed on its behalf by the undersigned, thereunto duly authorized.
Oppenheimer Small Cap Value Fund
| By: | /s/ Arthur P. Steinmetz | |
| Arthur P. Steinmetz | ||
| Principal Executive Officer | ||
| Date: | 6/15/2016 |
Pursuant to the requirements of the Securities Exchange Act of 1934 and the Investment Company Act of 1940, this report has been signed below by the following persons on behalf of the registrant and in the capacities and on the dates indicated.
| By: | /s/ Arthur P. Steinmetz | |
| Arthur P. Steinmetz | ||
| Principal Executive Officer | ||
| Date: | 6/15/2016 |
| By: | /s/ Brian S. Petersen | |
| Brian S. Petersen | ||
| Principal Financial Officer | ||
| Date: | 6/15/2016 |