Acquisition of William Charles Construction Group, including Ragnar Benson October 15, 2018
Disclaimer This presentation includes “forward looking statements” (within the meaning of the “safe harbor” provisions of the United States Private Securities Litigation Reform Act of 1995), including but not limited to those regarding the proposed acquisition by Infrastructure and Energy Alternatives, Inc. (the “Company” or “IEA”) of William Charles Construction Group. including Ragnar Benson (“William Charles” or “WCC”), (the “Acquisition”) and the transactions related thereto. Forward-looking statements may be identified by the use of words such as “forecast,” “intend,” “seek,” “target,” “anticipate,” “believe,” “expect,” “estimate,” “plan,” “outlook,” and “project” and other similar expressions that predict or indicate future events or trends or that are not statements of historical matters. Such forward looking statements include projected financial information. Such forward looking statements with respect to projections, revenues, earnings, performance, strategies, prospects and other aspects of the businesses of the Company are based on current expectations that are subject to risks and uncertainties. A number of factors could cause actual results or outcomes to differ materially from those indicated by such forward looking statements. These factors include, but are not limited to: (1) the ability of the parties to consummate the acquisition in a timely manner or at all; (2) satisfaction of the conditions precedent to consummation of the acquisition, including the ability to secure required consents and regulatory approvals in a timely manner or at all; (3) the ability to realize financial and strategic goals from acquisition and investment activity, including the ability to integrate acquired businesses; (4) our ability to manage projects effectively and in accordance with management estimates, as well as the ability to accurately estimate the costs associated with ours fixed price and other contracts, including any material changes in estimates for completion of projects; (5) the effect on demand for our services and changes in the amount of capital expenditures by customers; (6) significant changes in tax and other economic incentives and political and governmental policies which could materially and adversely affect the U.S. wind and solar industries.; and (7) other risks and uncertainties indicated in the Company’s Securities and Exchange Commission (the “SEC”) filings. You are cautioned not to place undue reliance upon any forward-looking statements, which speak only as of the date made. The Company does not undertake to update or revise the forward-looking statements, whether as a result of new information, future events or otherwise, except as required by law. This presentation includes information based on independent industry publications and other sources. You should not construe the contents of this presentation as legal, accounting, business or tax advice and you should consult your own professional advisors as to the legal, accounting, business, tax, financial or other matters contained herein. The estimates, forecasts and projections contained herein involve significant elements of subjective judgment and analysis and reflect numerous judgments, estimates and assumptions that are inherently uncertain in prospective financial information of any kind. As such, no representation can be made as to the attainability of such estimates, forecasts and projections. Investors are cautioned that such estimates, forecasts or projections have not been audited and have not been prepared in conformance with generally accepted accounting principles. For a listing of risks and other factors that could impact the combined company’s ability to attain its projected results, please refer to the “forward looking statements” above and the “Risk Factors” section of IEA’s Proxy Statement on Schedule 14A filed on February 9, 2018. This presentation includes projections that are forward-looking and based on growth assumptions that are inherently subject to significant uncertainties and contingencies, many of which are beyond IEA’s control. While all projections are necessarily speculative, IEA believes that projections relating to periods beyond 12 months from their date of preparation carry increasingly higher levels of uncertainty and should be read in that context. There will be differences between actual and projected results, and actual results may be materially greater or materially less than those contained in the projections. This presentation includes non-GAAP financial measures. Definitions of these non-GAAP financial measures and reconciliations of these non-GAAP financial measures to the most directly comparable GAAP financial measures are included elsewhere in this presentation. IEA believes that these non-GAAP financial measures provide useful information to management and investors regarding certain financial and business trends relating to IEA’s financial condition and results of operations. A more fulsome description of the nature of the adjustments from GAAP is provided elsewhere in this presentation. These non- GAAP financial measures may exclude items that are significant in understanding and assessing financial results. Therefore, these financial measures should not be considered in isolation or as an alternative to net income or other measures of profitability or performance under GAAP. Because these non-GAAP financial measures are not in conformity with GAAP, we urge you to review IEA’s audited financial statements, which have been filed with the SEC. 2
Conference Call Hosts and Agenda Conference Call Hosts J.P. Roehm CEO and President Andrew Layman CFO Conference Call Agenda • William Charles Overview • Strategic Rational and Transaction Overview • Key Investment Highlights • Industry Overview 3

William Charles Overview

William Charles Construction Profile Company Overview ◼ Formed in 1892, focused on growth in the heavy civil construction industry ◼ Diverse capabilities, including traditional civil, environmental remediation, electric power and other construction National Rail Roadway Environmental Remediation ◼ Market-leading position in the attractive rail market with ◼ Intermodal facilities ◼ Heavy highway ◼ Soil remediation limited competition, with unique and broad self-perform ◼ Maintenance facilities ◼ Road and bridge ◼ Landfill capping ◼ construction and ◼ capabilities, leveraging its deep rail / intermodal experience Auto marshaling yards Underground storage ◼ Fueling facilities rehabilitation tank removal and and extensive capabilities to serve clients on a nationwide ◼ ◼ Capacity improvements Underground utilities demolition ◼ basis ◼ Self-performs 40% of all Self-performs 50% of scope on rail projects scope on roadway ◼ Core capabilities in the planning, creation and maintenance of projects infrastructure projects from major railways and intermodal facilities to heavy highway construction projects Revenue by Construction Type(1) Other 16% Electrical Power Mining & Metals Commercial Building Rail ◼ High-quality, technically ◼ Owns and operates nine ◼ General contracting 49% complex electrical quarries, one sand and ◼ Construction Transportation projects gravel pit and two management 35% ◼ Commercial and asphalt plants ◼ Design-build services ◼ industrial Supports the company’s ◼ Site preparation, ◼ Traffic signal installation civil services architectural, civil, ◼ Roadway lighting structural, mechanical ◼ Airport lighting and electrical services (1) Revenues are based on management estimates for 2018 revenue split. 5
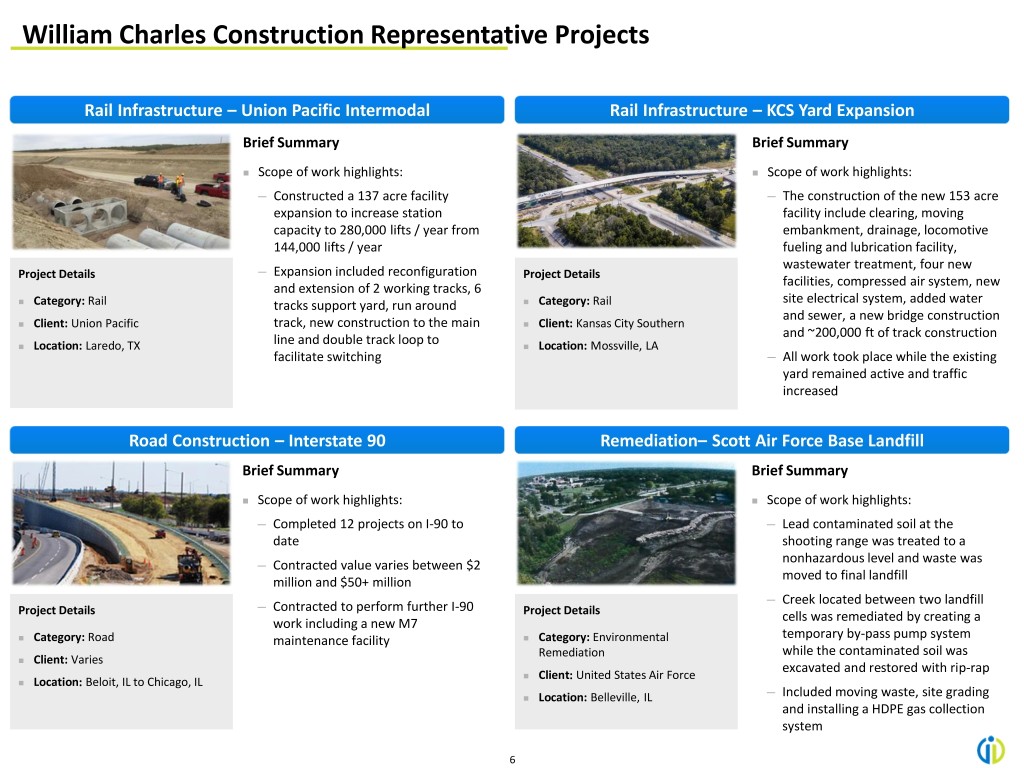
William Charles Construction Representative Projects Rail Infrastructure – Union Pacific Intermodal Rail Infrastructure – KCS Yard Expansion Brief Summary Brief Summary ◼ Scope of work highlights: ◼ Scope of work highlights: ─ Constructed a 137 acre facility ─ The construction of the new 153 acre expansion to increase station facility include clearing, moving capacity to 280,000 lifts / year from embankment, drainage, locomotive 144,000 lifts / year fueling and lubrication facility, wastewater treatment, four new Project Details ─ Expansion included reconfiguration Project Details facilities, compressed air system, new and extension of 2 working tracks, 6 ◼ ◼ site electrical system, added water Category: Rail tracks support yard, run around Category: Rail and sewer, a new bridge construction ◼ Client: Union Pacific track, new construction to the main ◼ Client: Kansas City Southern and ~200,000 ft of track construction ◼ Location: Laredo, TX line and double track loop to ◼ Location: Mossville, LA facilitate switching ─ All work took place while the existing yard remained active and traffic increased Road Construction – Interstate 90 Remediation– Scott Air Force Base Landfill Brief Summary Brief Summary ◼ Scope of work highlights: ◼ Scope of work highlights: ─ Completed 12 projects on I-90 to ─ Lead contaminated soil at the date shooting range was treated to a nonhazardous level and waste was ─ Contracted value varies between $2 moved to final landfill million and $50+ million ─ Creek located between two landfill ─ Contracted to perform further I-90 Project Details Project Details cells was remediated by creating a work including a new M7 ◼ ◼ temporary by-pass pump system Category: Road maintenance facility Category: Environmental Remediation while the contaminated soil was ◼ Client: Varies excavated and restored with rip-rap ◼ Client: United States Air Force ◼ Location: Beloit, IL to Chicago, IL ◼ Location: Belleville, IL ─ Included moving waste, site grading and installing a HDPE gas collection system 6
Strategic Rationale and Transaction Overview
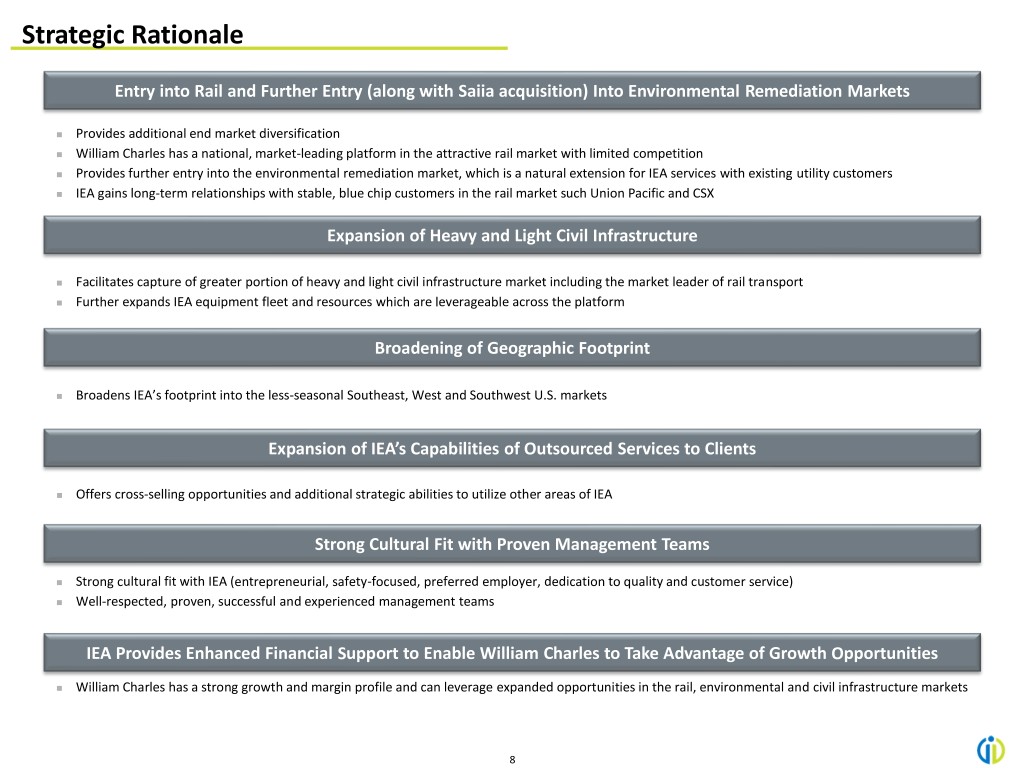
Strategic Rationale Entry into Rail and Further Entry (along with Saiia acquisition) Into Environmental Remediation Markets ◼ Provides additional end market diversification ◼ William Charles has a national, market-leading platform in the attractive rail market with limited competition ◼ Provides further entry into the environmental remediation market, which is a natural extension for IEA services with existing utility customers ◼ IEA gains long-term relationships with stable, blue chip customers in the rail market such Union Pacific and CSX Expansion of Heavy and Light Civil Infrastructure ◼ Facilitates capture of greater portion of heavy and light civil infrastructure market including the market leader of rail transport ◼ Further expands IEA equipment fleet and resources which are leverageable across the platform Broadening of Geographic Footprint ◼ Broadens IEA’s footprint into the less-seasonal Southeast, West and Southwest U.S. markets Expansion of IEA’s Capabilities of Outsourced Services to Clients ◼ Offers cross-selling opportunities and additional strategic abilities to utilize other areas of IEA Strong Cultural Fit with Proven Management Teams ◼ Strong cultural fit with IEA (entrepreneurial, safety-focused, preferred employer, dedication to quality and customer service) ◼ Well-respected, proven, successful and experienced management teams IEA Provides Enhanced Financial Support to Enable William Charles to Take Advantage of Growth Opportunities ◼ William Charles has a strong growth and margin profile and can leverage expanded opportunities in the rail, environmental and civil infrastructure markets 8
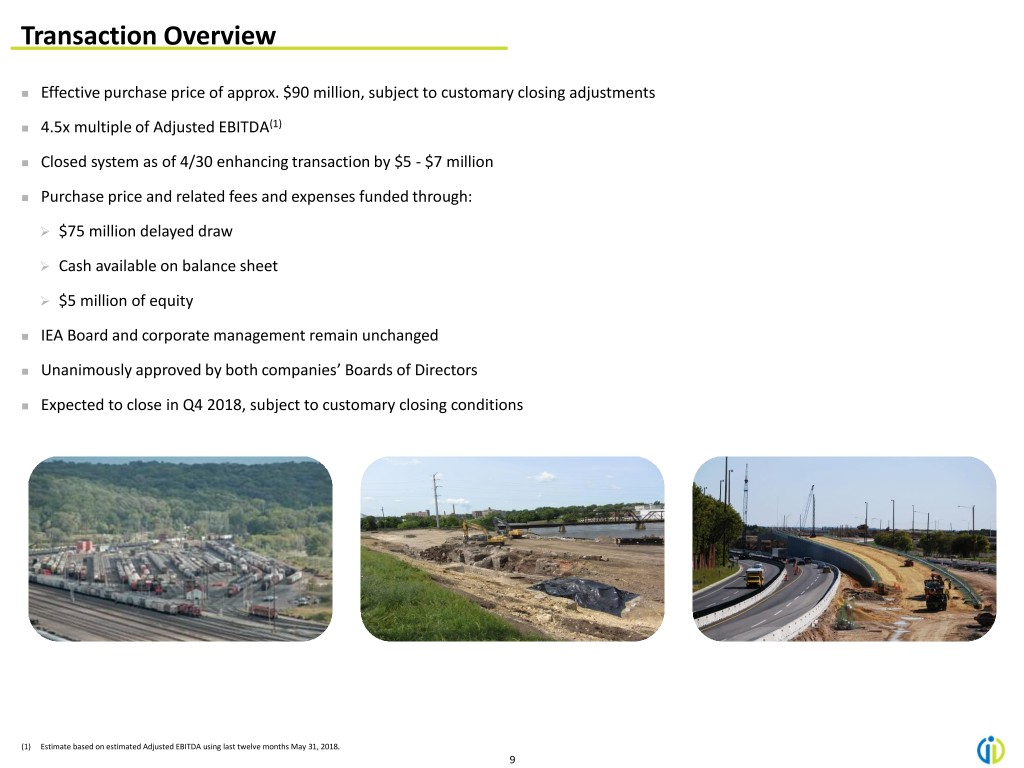
Transaction Overview ◼ Effective purchase price of approx. $90 million, subject to customary closing adjustments ◼ 4.5x multiple of Adjusted EBITDA(1) ◼ Closed system as of 4/30 enhancing transaction by $5 - $7 million ◼ Purchase price and related fees and expenses funded through: ➢ $75 million delayed draw ➢ Cash available on balance sheet ➢ $5 million of equity ◼ IEA Board and corporate management remain unchanged ◼ Unanimously approved by both companies’ Boards of Directors ◼ Expected to close in Q4 2018, subject to customary closing conditions (1) Estimate based on estimated Adjusted EBITDA using last twelve months May 31, 2018. 9
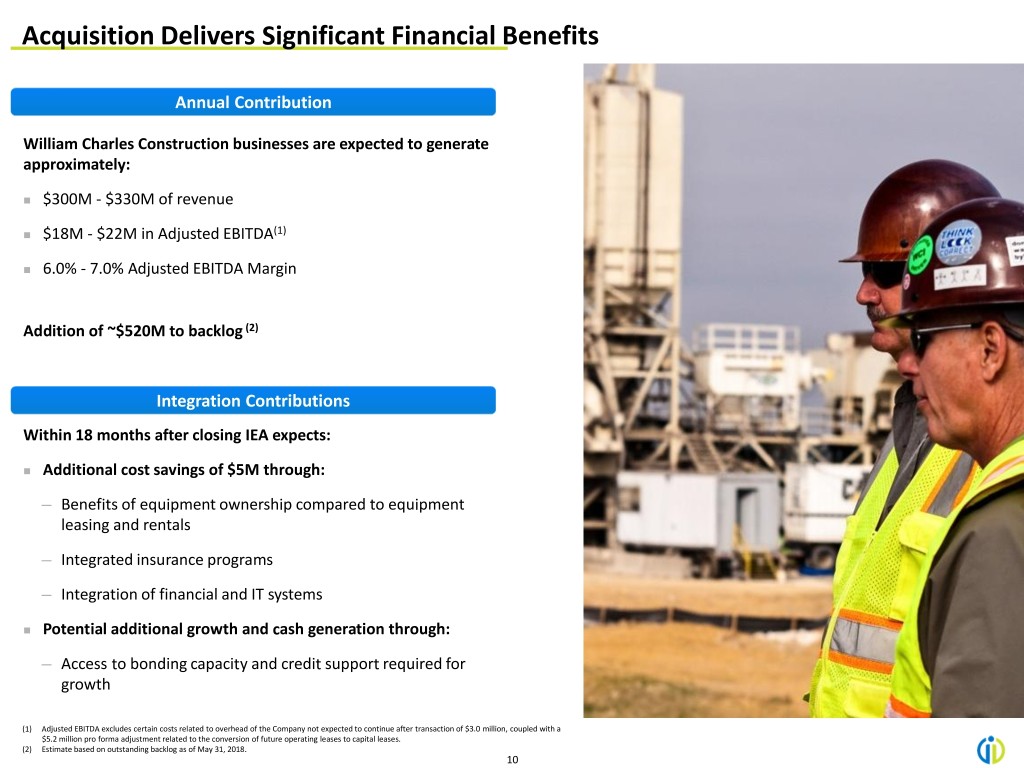
Acquisition Delivers Significant Financial Benefits Annual Contribution William Charles Construction businesses are expected to generate approximately: ◼ $300M - $330M of revenue ◼ $18M - $22M in Adjusted EBITDA(1) ◼ 6.0% - 7.0% Adjusted EBITDA Margin Addition of ~$520M to backlog (2) Integration Contributions Within 18 months after closing IEA expects: ◼ Additional cost savings of $5M through: ─ Benefits of equipment ownership compared to equipment leasing and rentals ─ Integrated insurance programs ─ Integration of financial and IT systems ◼ Potential additional growth and cash generation through: ─ Access to bonding capacity and credit support required for growth (1) Adjusted EBITDA excludes certain costs related to overhead of the Company not expected to continue after transaction of $3.0 million, coupled with a $5.2 million pro forma adjustment related to the conversion of future operating leases to capital leases. (2) Estimate based on outstanding backlog as of May 31, 2018. 10
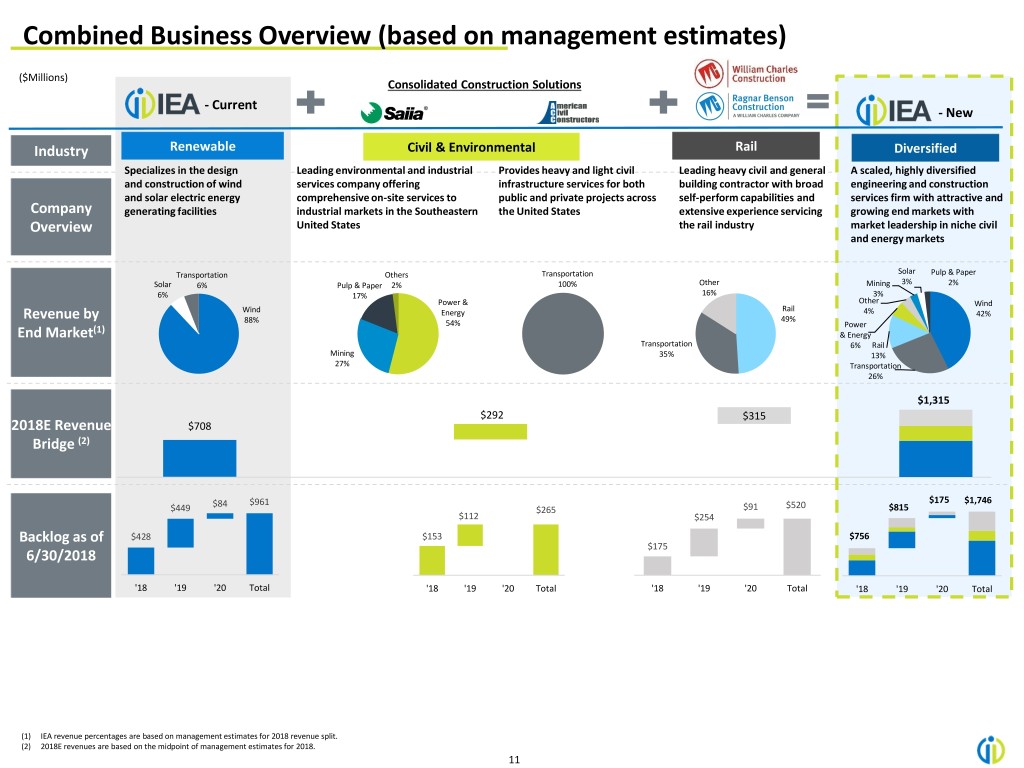
Combined Business Overview (based on management estimates) ($Millions) Consolidated Construction Solutions - Current - New Industry RenewableRenewable EnvironmentalCivil & Environmental / Power RailRail DiversifiedDiversified Specializes in the design Leading environmental and industrial Provides heavy and light civil Leading heavy civil and general A scaled, highly diversified and construction of wind services company offering infrastructure services for both building contractor with broad engineering and construction and solar electric energy comprehensive on-site services to public and private projects across self-perform capabilities and services firm with attractive and Company generating facilities industrial markets in the Southeastern the United States extensive experience servicing growing end markets with Overview United States the rail industry market leadership in niche civil and energy markets Transportation Others Transportation Solar Pulp & Paper Solar 6% Pulp & Paper 2% 100% Other Mining 3% 2% 6% 17% 16% 3% Power & Other Wind Rail Revenue by Wind Energy 4% 42% 88% 54% 49% (1) Power End Market & Energy Transportation 6% Rail Mining 35% 13% 27% Transportation 26% $1,315 $292 $315 2018E Revenue $708 Bridge (2) $84 $961 $175 $1,746 $449 $265 $91 $520 $815 $112 $254 Backlog as of $428 $153 $756 $175 6/30/2018 '18 '19 '20 Total '18 '19 '20 Total '18 '19 '20 Total '18 '19 '20 Total (1) IEA revenue percentages are based on management estimates for 2018 revenue split. (2) 2018E revenues are based on the midpoint of management estimates for 2018. 11
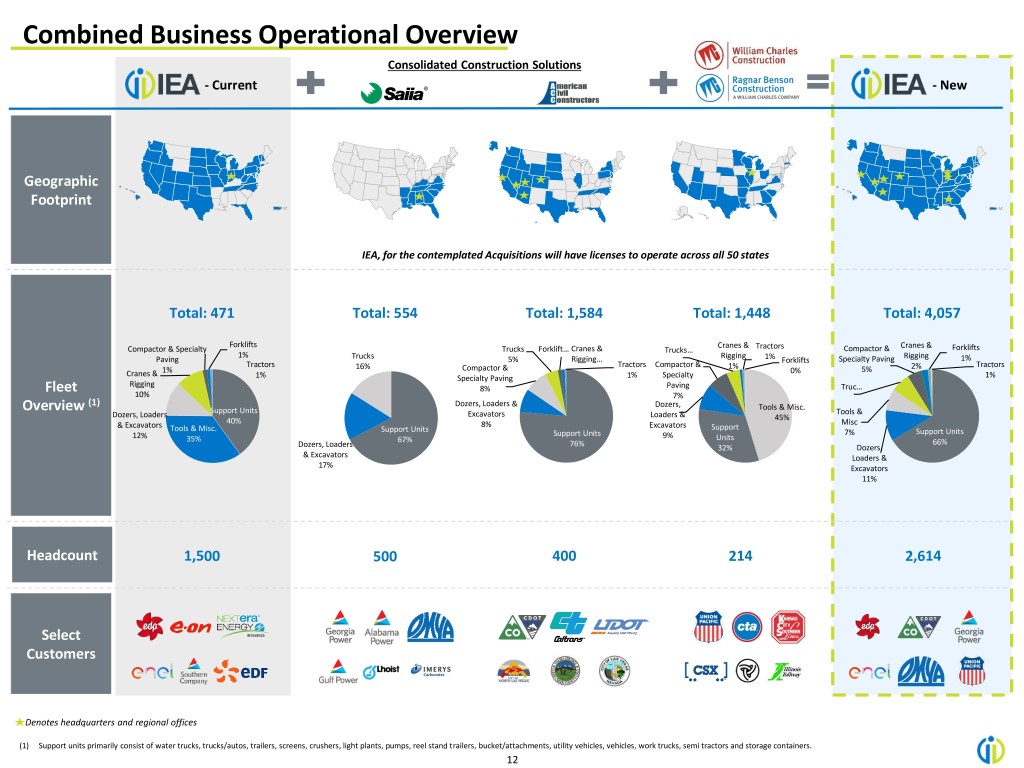
Combined Business Operational Overview Consolidated Construction Solutions - Current - New Geographic Footprint IEA, for the contemplated Acquisitions will have licenses to operate across all 50 states Total: 471 Total: 554 Total: 1,584 Total: 1,448 Total: 4,057 Forklifts Cranes & Cranes & Compactor & Specialty Trucks Forklift… Cranes & Trucks… Tractors Compactor & Forklifts 1% Rigging Rigging Paving Trucks 5% Rigging… 1% Forklifts Specialty Paving 1% Tractors 16% Compactor & Tractors Compactor & 1% 2% Tractors Cranes & 1% 0% 5% 1% Specialty Paving 1% Specialty 1% Rigging Fleet 8% Paving Truc… 10% 7% (1) Dozers, Loaders & Dozers, Tools & Misc. Overview Support Units Tools & Dozers, Loaders Excavators Loaders & 45% 40% Misc & Excavators 8% Excavators Support Tools & Misc. Support Units 7% Support Units 12% Support Units 9% Units 35% 67% 66% Dozers, Loaders 76% 32% Dozers, & Excavators Loaders & 17% Excavators 11% Headcount 1,500 500 400 214 2,614 Select Customers Denotes headquarters and regional offices (1) Support units primarily consist of water trucks, trucks/autos, trailers, screens, crushers, light plants, pumps, reel stand trailers, bucket/attachments, utility vehicles, vehicles, work trucks, semi tractors and storage containers. 12
Key Investment Highlights
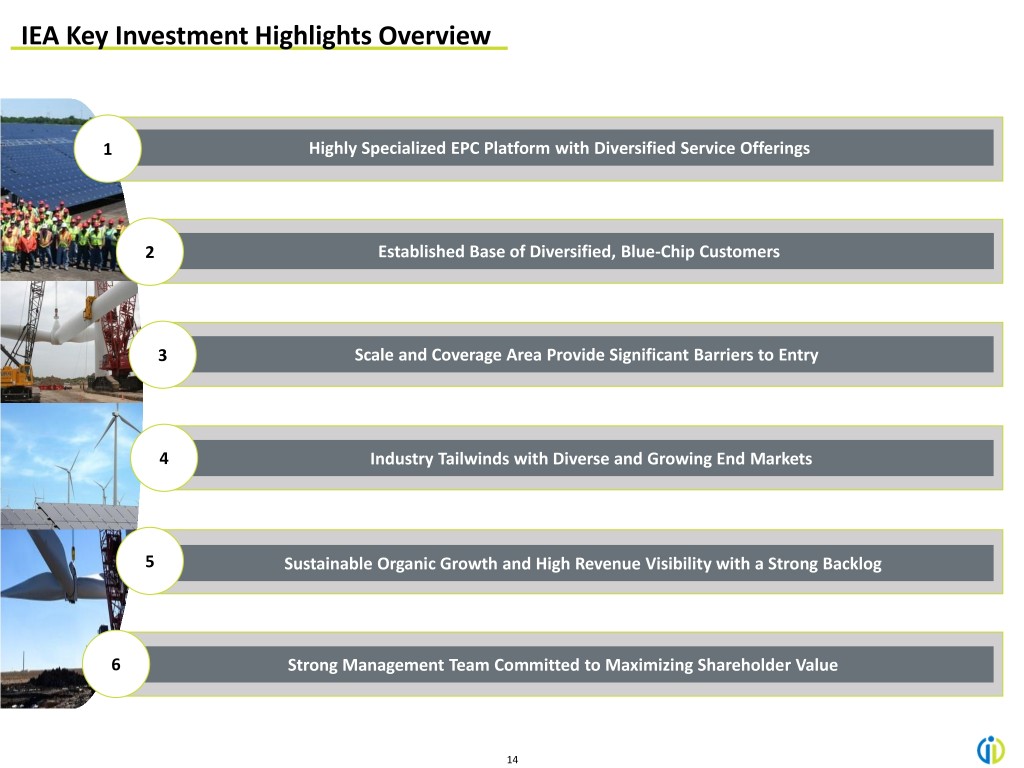
IEA Key Investment Highlights Overview 1 Highly Specialized EPC Platform with Diversified Service Offerings 2 Established Base of Diversified, Blue-Chip Customers 3 Scale and Coverage Area Provide Significant Barriers to Entry 4 Industry Tailwinds with Diverse and Growing End Markets 5 Sustainable Organic Growth and High Revenue Visibility with a Strong Backlog 6 Strong Management Team Committed to Maximizing Shareholder Value 14
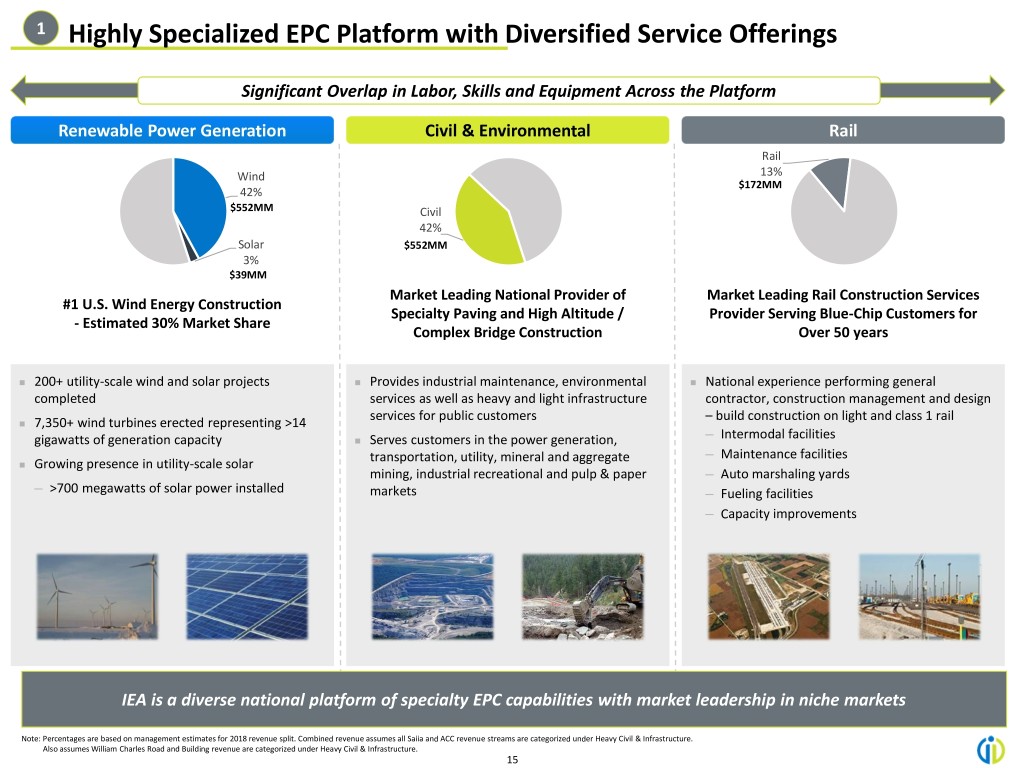
1 Highly Specialized EPC Platform with Diversified Service Offerings Significant Overlap in Labor, Skills and Equipment Across the Platform Renewable Power Generation Civil & Environmental Rail Rail Wind 13% $172MM 42% $552MM Civil 42% Solar $552MM 3% $39MM Market Leading National Provider of Market Leading Rail Construction Services #1 U.S. Wind Energy Construction Specialty Paving and High Altitude / Provider Serving Blue-Chip Customers for - Estimated 30% Market Share Complex Bridge Construction Over 50 years ◼ 200+ utility-scale wind and solar projects ◼ Provides industrial maintenance, environmental ◼ National experience performing general completed services as well as heavy and light infrastructure contractor, construction management and design services for public customers – build construction on light and class 1 rail ◼ 7,350+ wind turbines erected representing >14 gigawatts of generation capacity ◼ Serves customers in the power generation, ─ Intermodal facilities transportation, utility, mineral and aggregate ─ Maintenance facilities ◼ Growing presence in utility-scale solar mining, industrial recreational and pulp & paper ─ Auto marshaling yards ─ >700 megawatts of solar power installed markets ─ Fueling facilities ─ Capacity improvements IEA is a diverse national platform of specialty EPC capabilities with market leadership in niche markets Note: Percentages are based on management estimates for 2018 revenue split. Combined revenue assumes all Saiia and ACC revenue streams are categorized under Heavy Civil & Infrastructure. Also assumes William Charles Road and Building revenue are categorized under Heavy Civil & Infrastructure. 15
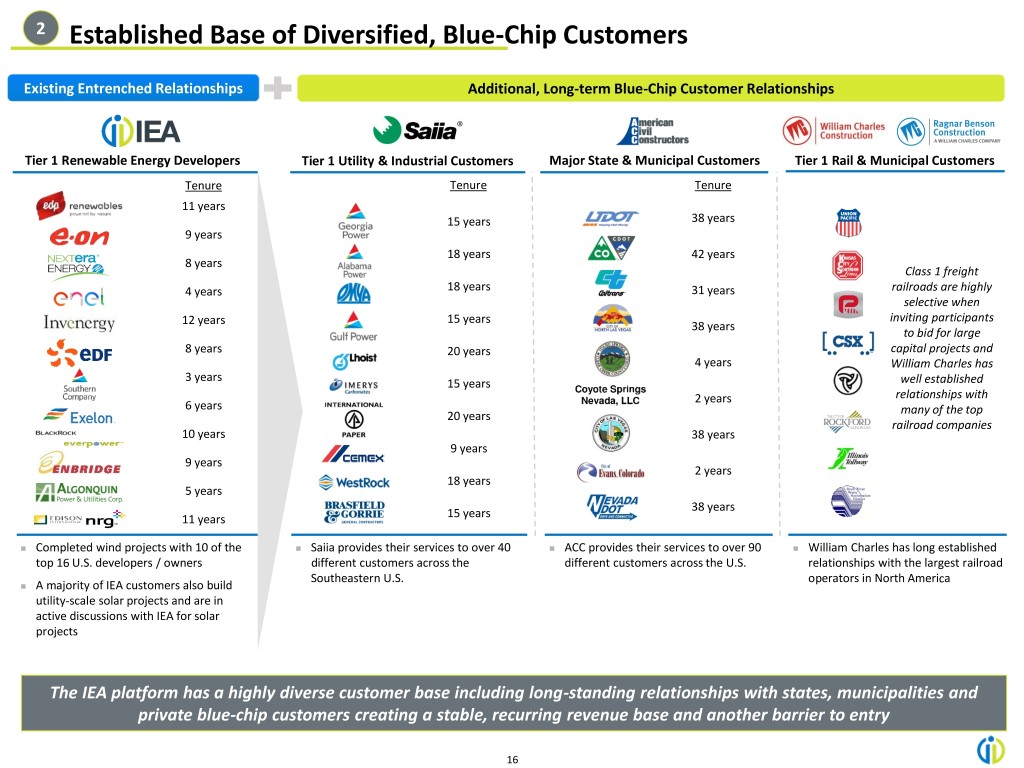
2 Established Base of Diversified, Blue-Chip Customers Existing Entrenched Relationships Additional, Long-term Blue-Chip Customer Relationships Tier 1 Renewable Energy Developers Tier 1 Utility & Industrial Customers Major State & Municipal Customers Tier 1 Rail & Municipal Customers Tenure Tenure Tenure 11 years 15 years 38 years 9 years 18 years 42 years 8 years Class 1 freight 4 years 18 years 31 years railroads are highly selective when 15 years inviting participants 12 years 38 years to bid for large 8 years 20 years capital projects and 4 years William Charles has 3 years 15 years well established 2 years relationships with 6 years many of the top 20 years railroad companies 10 years 38 years 9 years 9 years 2 years 18 years 5 years 38 years 11 years 15 years ◼ Completed wind projects with 10 of the ◼ Saiia provides their services to over 40 ◼ ACC provides their services to over 90 ◼ William Charles has long established top 16 U.S. developers / owners different customers across the different customers across the U.S. relationships with the largest railroad Southeastern U.S. operators in North America ◼ A majority of IEA customers also build utility-scale solar projects and are in active discussions with IEA for solar projects The IEA platform has a highly diverse customer base including long-standing relationships with states, municipalities and private blue-chip customers creating a stable, recurring revenue base and another barrier to entry 16
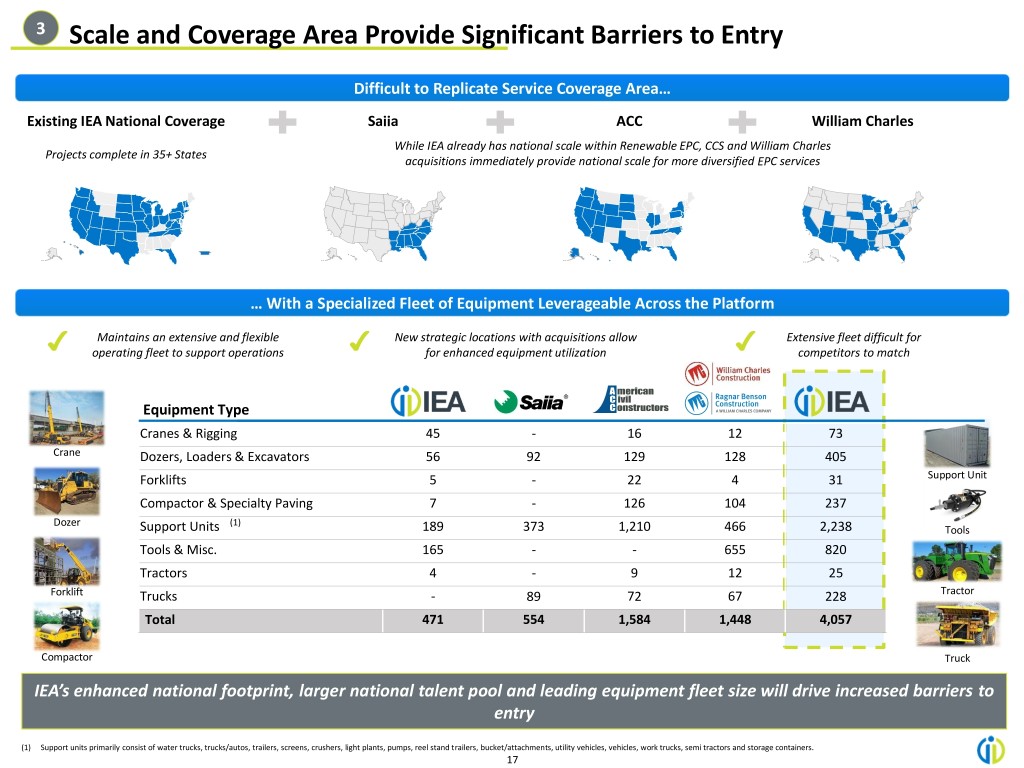
3 Scale and Coverage Area Provide Significant Barriers to Entry Difficult to Replicate Service Coverage Area… Existing IEA National Coverage Saiia ACC William Charles While IEA already has national scale within Renewable EPC, CCS and William Charles Projects complete in 35+ States acquisitions immediately provide national scale for more diversified EPC services … With a Specialized Fleet of Equipment Leverageable Across the Platform Maintains an extensive and flexible New strategic locations with acquisitions allow Extensive fleet difficult for ✔ operating fleet to support operations ✔ for enhanced equipment utilization ✔ competitors to match Equipment Type Cranes & Rigging 45 - 16 12 73 Crane Dozers, Loaders & Excavators 56 92 129 128 405 Forklifts 5 - 22 4 31 Support Unit Compactor & Specialty Paving 7 - 126 104 237 Dozer (1) Support Units 189 373 1,210 466 2,238 Tools Tools & Misc. 165 - - 655 820 Tractors 4 - 9 12 25 Forklift Trucks - 89 72 67 228 Tractor Total 471 554 1,584 1,448 4,057 Compactor Truck IEA’s enhanced national footprint, larger national talent pool and leading equipment fleet size will drive increased barriers to entry (1) Support units primarily consist of water trucks, trucks/autos, trailers, screens, crushers, light plants, pumps, reel stand trailers, bucket/attachments, utility vehicles, vehicles, work trucks, semi tractors and storage containers. 17
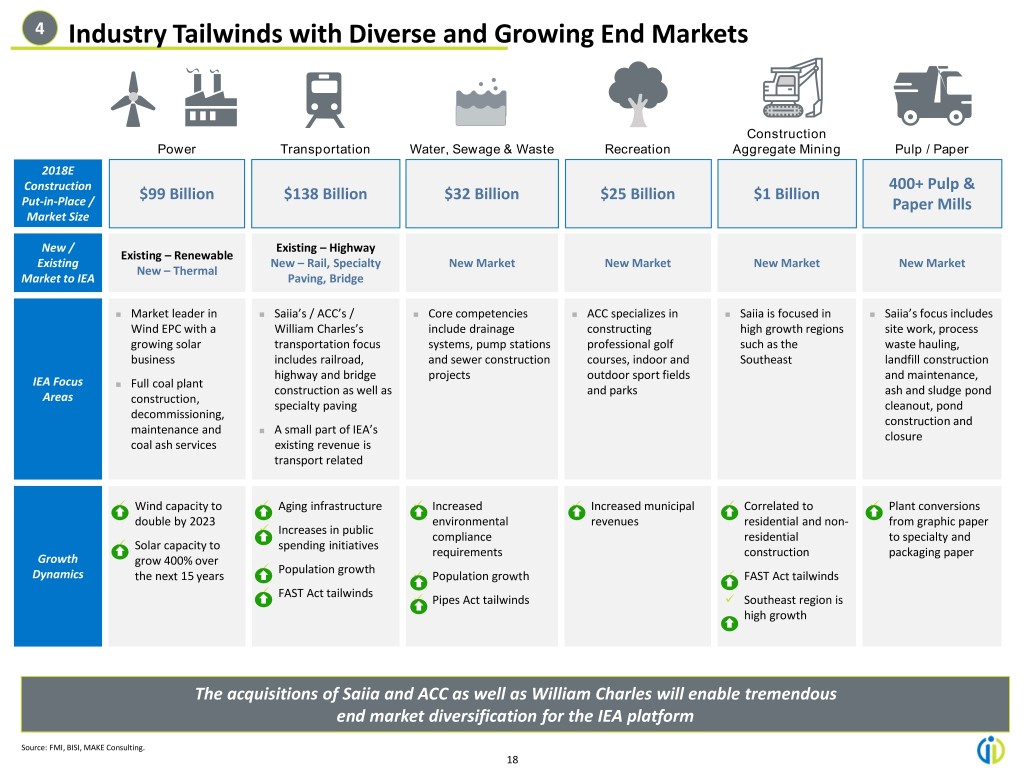
4 Industry Tailwinds with Diverse and Growing End Markets Construction Power Transportation Water, Sewage & Waste Recreation Aggregate Mining Pulp / Paper 2018E Construction 400+ Pulp & $99 Billion $138 Billion $32 Billion $25 Billion $1 Billion Put-in-Place / Paper Mills Market Size New / Existing – Highway Existing – Renewable Existing New – Rail, Specialty New Market New Market New Market New Market New – Thermal Market to IEA Paving, Bridge ◼ Market leader in ◼ Saiia’s / ACC’s / ◼ Core competencies ◼ ACC specializes in ◼ Saiia is focused in ◼ Saiia’s focus includes Wind EPC with a William Charles’s include drainage constructing high growth regions site work, process growing solar transportation focus systems, pump stations professional golf such as the waste hauling, business includes railroad, and sewer construction courses, indoor and Southeast landfill construction highway and bridge projects outdoor sport fields and maintenance, IEA Focus ◼ Full coal plant construction as well as and parks ash and sludge pond Areas construction, specialty paving cleanout, pond decommissioning, construction and maintenance and ◼ A small part of IEA’s closure coal ash services existing revenue is transport related ✓ Wind capacity to ✓ Aging infrastructure ✓ Increased ✓ Increased municipal ✓ Correlated to ✓ Plant conversions double by 2023 environmental revenues residential and non- from graphic paper ✓ Increases in public compliance residential to specialty and ✓ Solar capacity to spending initiatives requirements construction packaging paper Growth grow 400% over ✓ Population growth Dynamics the next 15 years ✓ Population growth ✓ FAST Act tailwinds ✓ FAST Act tailwinds ✓ Pipes Act tailwinds ✓ Southeast region is high growth The acquisitions of Saiia and ACC as well as William Charles will enable tremendous end market diversification for the IEA platform Source: FMI, BISI, MAKE Consulting. 18
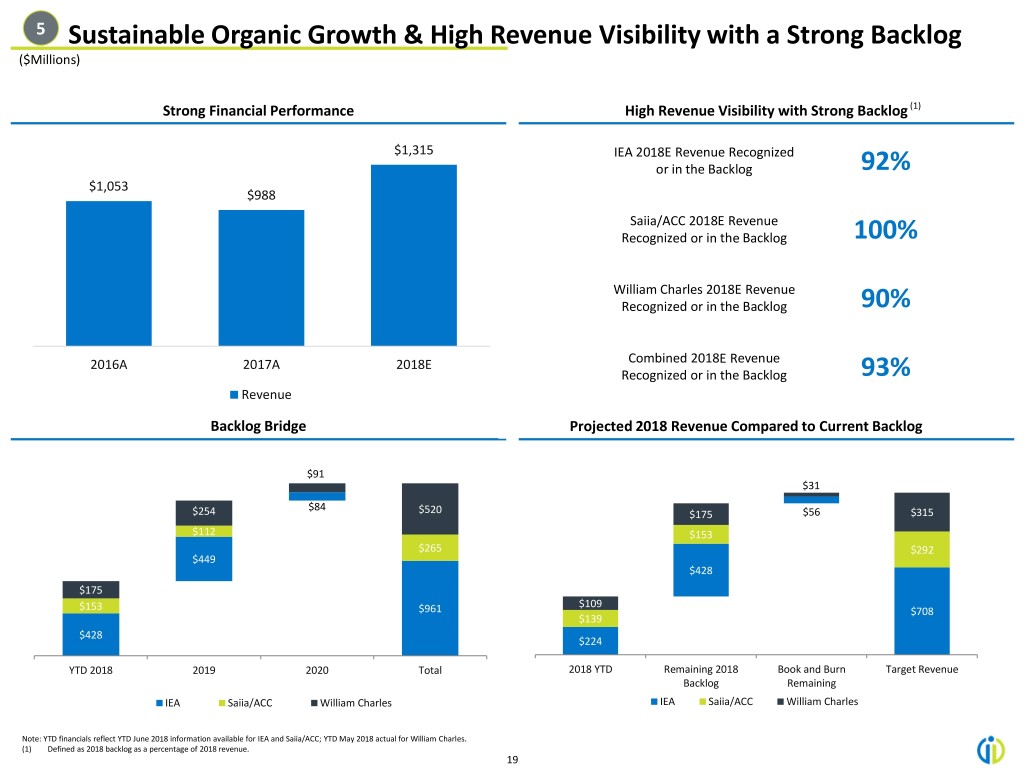
5 Sustainable Organic Growth & High Revenue Visibility with a Strong Backlog ($Millions) Strong Financial Performance High Revenue Visibility with Strong Backlog (1) 1400 $1,315 IEA 2018E Revenue Recognized or in the Backlog 92% 1200 $1,053 $988 1000 Saiia/ACC 2018E Revenue 800 Recognized or in the Backlog 100% 600 400 William Charles 2018E Revenue Recognized or in the Backlog 90% 200 0 2016A 2017A 2018E Combined 2018E Revenue Recognized or in the Backlog 93% Revenue Backlog Bridge Projected 2018 Revenue Compared to Current Backlog $91 $31 $84 $254 $520 $175 $56 $315 $112 $153 $265 $292 $449 $428 $175 $109 $153 $961 $708 $139 $428 $224 YTD 2018 2019 2020 Total 2018 YTD Remaining 2018 Book and Burn Target Revenue Backlog Remaining IEA Saiia/ACC William Charles IEA Saiia/ACC William Charles Note: YTD financials reflect YTD June 2018 information available for IEA and Saiia/ACC; YTD May 2018 actual for William Charles. (1) Defined as 2018 backlog as a percentage of 2018 revenue. 19
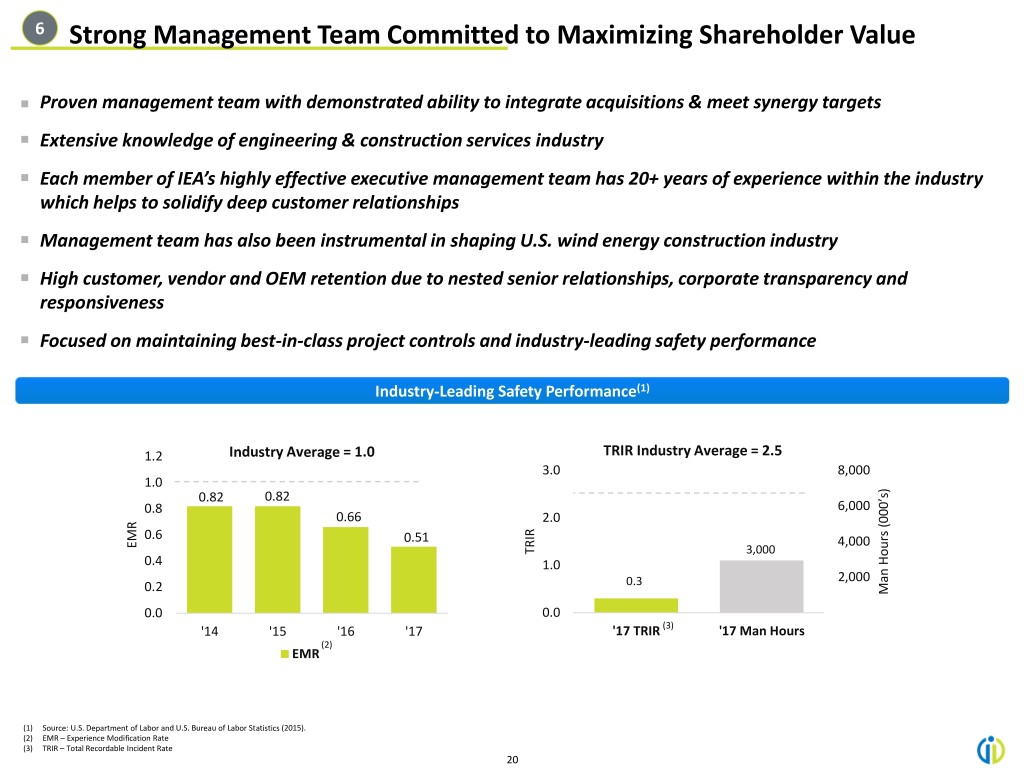
6 Strong Management Team Committed to Maximizing Shareholder Value ◼ Proven management team with demonstrated ability to integrate acquisitions & meet synergy targets ◼ Extensive knowledge of engineering & construction services industry ◼ Each member of IEA’s highly effective executive management team has 20+ years of experience within the industry which helps to solidify deep customer relationships ◼ Management team has also been instrumental in shaping U.S. wind energy construction industry ◼ High customer, vendor and OEM retention due to nested senior relationships, corporate transparency and responsiveness ◼ Focused on maintaining best-in-class project controls and industry-leading safety performance Industry-Leading Safety Performance(1) 1.2 Industry Average = 1.0 TRIR Industry Average = 2.5 3.0 8,000 1.0 0.82 0.82 0.8 6,000 0.66 2.0 0.6 0.51 EMR 4,000 TRIR 3,000 0.4 1.0 2,000 0.2 0.3 ManHours (000’s) 0.0 0.0 '14 '15 '16 '17 '17 TRIR (3) '17 Man Hours (2) EMR (1) Source: U.S. Department of Labor and U.S. Bureau of Labor Statistics (2015). (2) EMR – Experience Modification Rate (3) TRIR – Total Recordable Incident Rate 20

Industry Overview
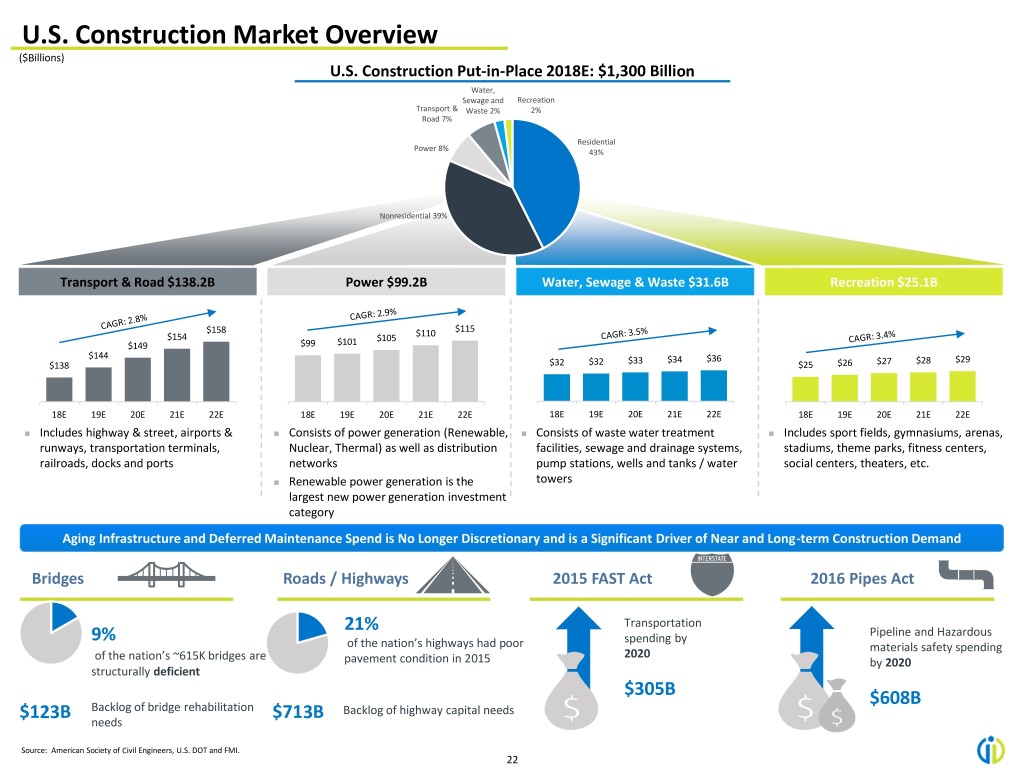
U.S. Construction Market Overview ($Billions) U.S. Construction Put-in-Place 2018E: $1,300 Billion Water, Sewage and Recreation Transport & Waste 2% 2% Road 7% Residential Power 8% 43% Nonresidential 39% Transport & Road $138.2B Power $99.2B Water, Sewage & Waste $31.6B Recreation $25.1B $158 $115 $154 $105 $110 $149 $99 $101 $144 $33 $34 $36 $28 $29 $138 $32 $32 $25 $26 $27 18E 19E 20E 21E 22E 18E 19E 20E 21E 22E 18E 19E 20E 21E 22E 18E 19E 20E 21E 22E ◼ Includes highway & street, airports & ◼ Consists of power generation (Renewable, ◼ Consists of waste water treatment ◼ Includes sport fields, gymnasiums, arenas, runways, transportation terminals, Nuclear, Thermal) as well as distribution facilities, sewage and drainage systems, stadiums, theme parks, fitness centers, railroads, docks and ports networks pump stations, wells and tanks / water social centers, theaters, etc. ◼ Renewable power generation is the towers largest new power generation investment category Aging Infrastructure and Deferred Maintenance Spend is No Longer Discretionary and is a Significant Driver of Near and Long-term Construction Demand Bridges Roads / Highways 2015 FAST Act 2016 Pipes Act 21% Transportation 9% spending by Pipeline and Hazardous of the nation’s highways had poor materials safety spending of the nation’s ~615K bridges are 2020 pavement condition in 2015 by 2020 structurally deficient $305B $608B $123B Backlog of bridge rehabilitation $713B Backlog of highway capital needs needs Source: American Society of Civil Engineers, U.S. DOT and FMI. 22
THANK YOU Investor Relations Contact: Financial Profiles Kimberly Esterkin, Senior Vice President kesterkin@finprofiles.com 310.622.8235