Exhibit 99.1

Q4 2016 Earnings Call 13 February 2017 1

Forward - Looking Statements Forward - Looking Statements : Certain of the statements made in this Release are “forward - looking statements” within the meaning and protections of Section 27 A of the Securities Act of 1933, as amended, and Section 21E of the Securities Exchange Act of 1934, as amended. Forward - looking statemen ts include statements with respect to our current beliefs, plans, objectives, goals, expectations, anticipations, assumptions, estimates, intentions, and future performance, and involve known and unknown risks, uncertainties and other factors, which may be beyond ou r control, and which may cause the actual results, performance, capital, ownership or achievements of the Bank to be materially di fferent from future results, performance or achievements expressed or implied by such forward - looking statements due to a variety of factors, including worldwide economic conditions, success in business retention and obtaining new business and other factors. All statements oth er than statements of historical fact are statements that could be forward - looking statements. You can identify these forward - looking st atements through our use of words such as “may,” “will,” “anticipate,” “assume,” “should,” “indicate,” “would,” “believe,” “contemplat e,” “expect,” “estimate,” “continue,” “plan,” “point to,” “project,” “could,” “intend,” “target” and other similar words and expressions of th e future . All written or oral forward - looking statements attributable to us are expressly qualified in their entirety by this cautionary n otice, including, without limitation, those risks and uncertainties described in our Securities and Exchange Commission (“SEC”) reports and fil ing s. Such reports are available upon request from the Bank, or from the SEC, including through the SEC’s Internet website at http://www.sec.gov . We have no obligation and do not undertake to update, revise or correct any of the forward - looking statements after the date hereof , or after the respective dates on which any such statements otherwise are made. About Non - GAAP Financial Measures : Certain statements in this release involve the use of non - GAAP financial measures. We believe such measures provide useful info rmation to investors that is supplementary to our financial condition, results of operations and cash flows computed in accordance with GAA P; however, our non - GAAP financial measures have a number of limitations. As such, investors should not view these disclosures as a substit ute for results determined in accordance with GAAP, and they are not necessarily comparable to non - GAAP financial measures that other co mpanies use . Reconciliations of these non - GAAP measures to corresponding GAAP financial measures are provided in the Appendix of this presentation. All information in $millions and as of 31 December 2016 unless noted otherwise. Conversion rate: 1 BMD$ = 1 US$. 2

Q4 2016 Earnings Call Michael Collins Chief Executive Officer Michael Schrum Chief Financial Officer Dan Frumkin Chief Risk Officer 3 Presenters Agenda • Overview • Financials • Summary • Q&A Butterfield Overview • Leading Bank in Attractive Markets • Strong Capital Generation and Return • Efficient, Conservative Balance Sheet • Visible Earnings Six International Locations
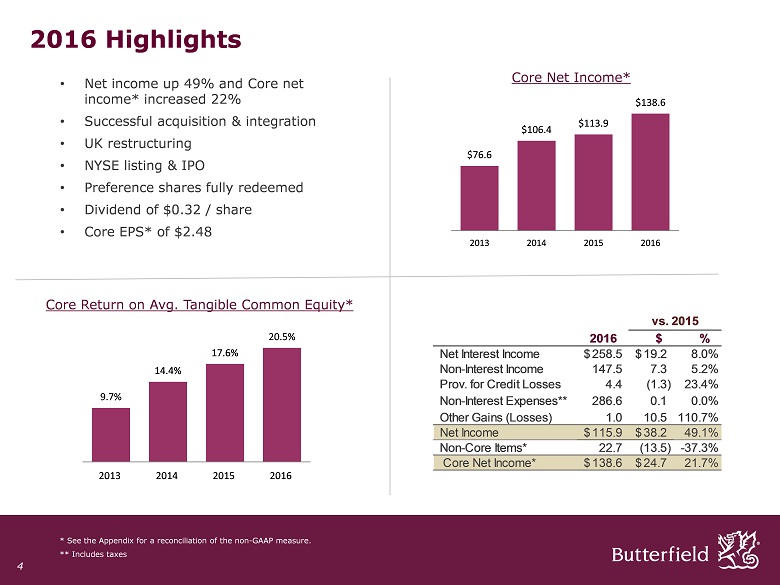
2016 Highlights • Net income up 49% and Core net income* increased 22% • Successful a cquisition & integration • UK restructuring • NYSE listing & IPO • Preference shares fully redeemed • Dividend of $0.32 / share • Core EPS* of $ 2.48 $76.6 $106.4 $113.9 $138.6 2013 2014 2015 2016 Core Net Income* 4 Core Return on Avg. Tangible Common Equity* 9.7% 14.4% 17.6% 20.5% 2013 2014 2015 2016 * See the Appendix for a reconciliation of the non - GAAP measure. ** Includes taxes 2016 $ % Net Interest Income 258.5$ 19.2$ 8.0% Non-Interest Income 147.5 7.3 5.2% Prov. for Credit Losses 4.4 (1.3) 23.4% Non-Interest Expenses** 286.6 0.1 0.0% Other Gains (Losses) 1.0 10.5 110.7% Net Income 115.9$ 38.2$ 49.1% Non-Core Items* 22.7 (13.5) -37.3% Core Net Income* 138.6$ 24.7$ 21.7% vs. 2015

Financials 5
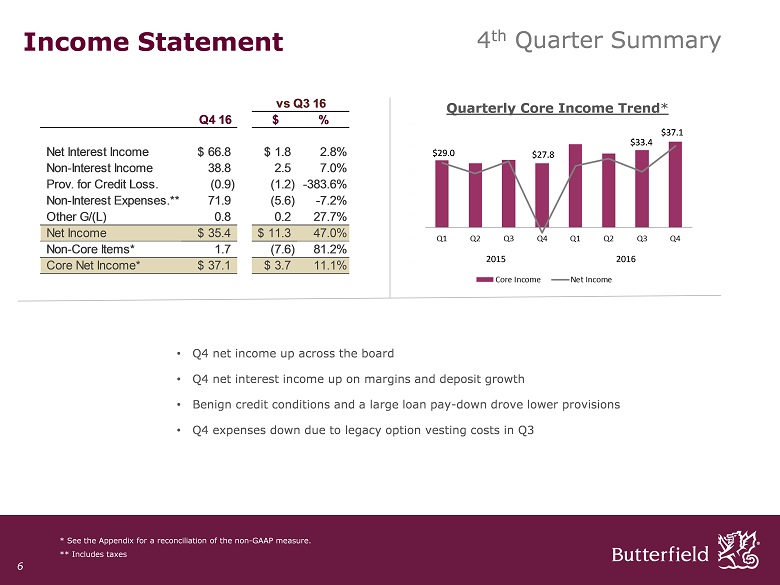
• Q4 net income up across the board • Q4 net interest income up on margins and deposit growth • Benign credit conditions and a large loan pay - down drove lower provisions • Q4 expenses down due to legacy option vesting costs in Q3 Income Statement 4 th Quarter Summary Quarterly Core Income Trend * $29.0 $27.8 $37.1 2015 2016 $ 33.4 6 * See the Appendix for a reconciliation of the non - GAAP measure. ** Includes taxes Q4 16 $ % Net Interest Income $66.8 $1.8 2.8% Non-Interest Income 38.8 2.5 7.0% Prov. for Credit Loss. (0.9) (1.2) -383.6% Non-Interest Expenses.** 71.9 (5.6) -7.2% Other G/(L) 0.8 0.2 27.7% Net Income $35.4 $11.3 47.0% Non-Core Items* 1.7 (7.6) 81.2% Core Net Income* $37.1 $3.7 11.1% vs Q3 16

Net Interest Margin & Yields • Deposit costs remained flat. • Q4 progress on deployment of excess liquidity • Loans partially repriced, but income offset by a government loan repayment. $66.8 $58.8 Net Interest Income Trend 2015 2016 $65.0 $61.2 Income Statement Net Interest Income 7 Avg. Avg. Bal. Yield Bal. Yield Cash, S/T Inv., Repos $2,885 0.49% -$40 0.14% Investments 4,223 1.98% 291 0.06% Loans (net) 3,708 4.92% -237 0.17% Earning assets $10,816 2.59% $14 0.06% Total Liabs $10,317 0.15% -$5 - Net Int Inc & Margin $66.8 2.45% $1.8 0.06% Q4 16 vs. Q3 16
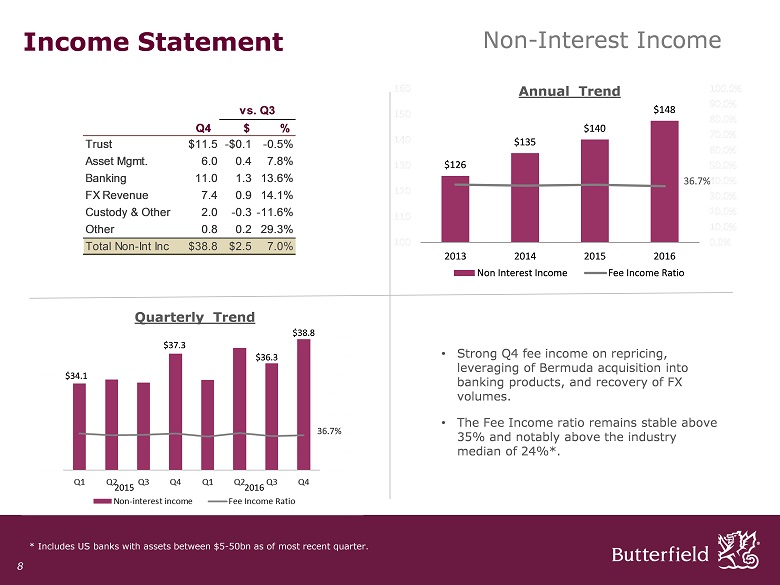
Quarterly Trend • Strong Q4 fee income on repricing, leveraging of Bermuda acquisition into banking products, and recovery of FX volumes. • The Fee Income ratio remains stable above 35% and notably above the industry median of 24%*. $126 $135 $140 $ 148 36.7% 0.0% 10.0% 20.0% 30.0% 40.0% 50.0% 60.0% 70.0% 80.0% 90.0% 100.0% 100 110 120 130 140 150 160 2013 2014 2015 2016 Non Interest Income Fee Income Ratio 36.7% $34.1 $36.3 $37.3 Income Statement Non - Interest Income Annual Trend $ 38.8 2015 2016 8 * Includes US banks with assets between $5 - 50bn as of most recent quarter. Q4 $ % Trust $11.5 -$0.1 -0.5% Asset Mgmt. 6.0 0.4 7.8% Banking 11.0 1.3 13.6% FX Revenue 7.4 0.9 14.1% Custody & Other 2.0 -0.3-11.6% Other 0.8 0.2 29.3% Total Non-Int Inc $38.8 $2.5 7.0% vs. Q3
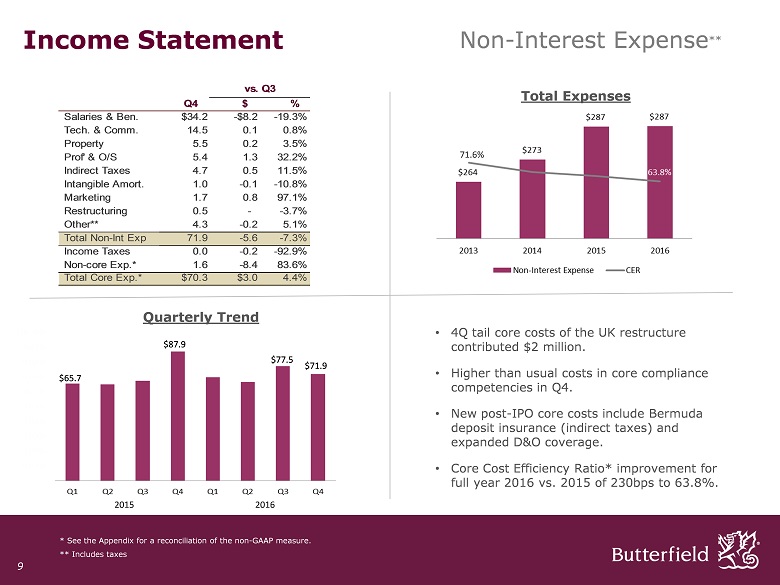
Quarterly Trend • 4Q tail core costs of the UK restructure contributed $2 million. • Higher than usual costs in core compliance competencies in Q4. • New post - IPO core costs include Bermuda deposit insurance (indirect taxes) and expanded D&O coverage. • Core Cost Efficiency Ratio* improvement for full year 2016 vs. 2015 of 230bps to 63.8%. 2015 2016 $ 77.5 $65.7 Non - Interest Expense ** 71.6% $87.9 $71.9 Total Expenses 9 * See the Appendix for a reconciliation of the non - GAAP measure. ** Includes taxes Q4 $ % Salaries & Ben. $34.2 -$8.2 -19.3% Tech. & Comm. 14.5 0.1 0.8% Property 5.5 0.2 3.5% Prof' & O/S 5.4 1.3 32.2% Indirect Taxes 4.7 0.5 11.5% Intangible Amort. 1.0 -0.1 -10.8% Marketing 1.7 0.8 97.1% Restructuring 0.5 - -3.7% Other** 4.3 -0.2 5.1% Total Non-Int Exp 71.9 -5.6 -7.3% Income Taxes 0.0 -0.2 -92.9% Non-core Exp.* 1.6 -8.4 83.6% Total Core Exp.* $70.3 $3.0 4.4% vs. Q3Income Statement
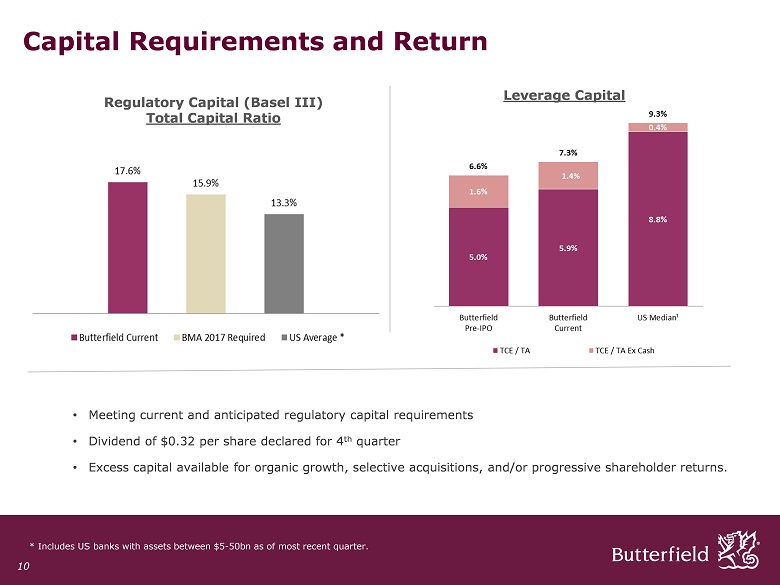
Regulatory Capital (Basel III) Total Capital Ratio Leverage Capital Capital Requirements and Return 10 * Includes US banks with assets between $5 - 50bn as of most recent quarter. • Meeting current and anticipated regulatory capital requirements • Dividend of $0.32 per share declared for 4 th quarter • Excess capital available for organic growth, selective acquisitions, and/or progressive shareholder returns.

Total Assets Deposits $4.4 $3.6 $11.1 $7.6 $2.4 $10.3 $9.2 Balance Sheet $9.7 $11.0 $10.0 11 Dec. 31 vs. Sept 30 Cash and Equiv. $2,102 $617 Loans (net) 3,570 -266 S/T Inv. & Repos. 669 -512 Investments 4,400 286 All Other Assets 363 0 Total Assets $11,104 $126 Int. bearing deposits $7,649 $110 Non-int. bearing deposits 2,385 257 Other Liabilities 359 13 Shareholders equity 711 -254 Total Liab. & Equity $3,455 $16 2016 • Good organic deposit growth in Q4. • Investments grow as acquired deposits are invested. • Loan decline driven by $200 million repayment of a government loan.
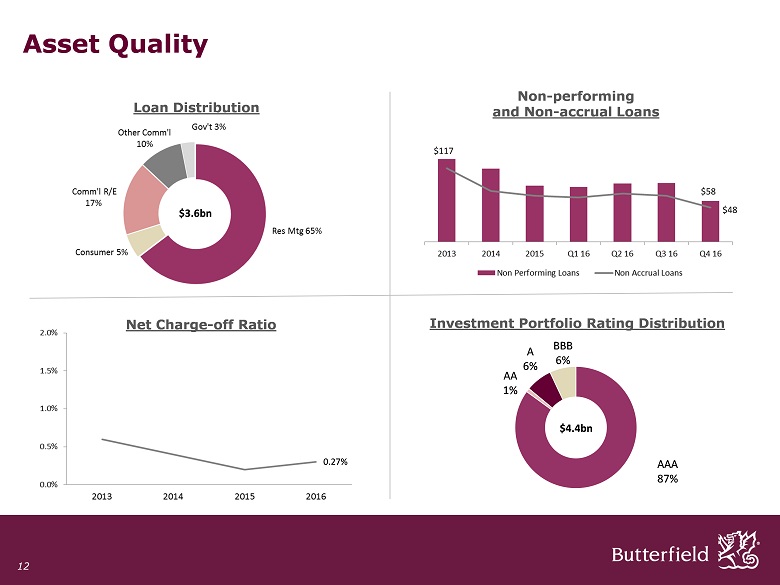
Net Charge - off Ratio Investment Portfolio Rating Distribution $4.4bn Non - performing and Non - accrual Loans Asset Quality $117 $58 $48 Loan Distribution $3.6bn 0.27% 12 AAA 87% AA 1% A 6% BBB 6%

Interest Rate Sensitivity 13 * Includes US banks with assets between $5 - 50bn as of most recent quarter. (8.9)% 5.6 % 11.6 % (3.1)% 1.9 % 3.3 % -100bps +100bps +200bps NTB US Median* • The Bank remains significantly more sensitive to increases in interest rates versus US peers. • The increase in HTM occurred late in Q4 and is reflected in the difference between the Q4 average and spot balances. • The Bank remains asset sensitive after increasing HTM investments and overall duration in the investment portfolio. vs. vs. Q4 16 Q3 16 Spot Dur Q3 16 AFS $3.4 $0.2 $3.3 2.5 0.5 HTM 0.8 0.1 1.1 6.3 1.3 Total $4.2 $0.3 $4.4 3.4 0.9 Avg. Bal. (Bns)
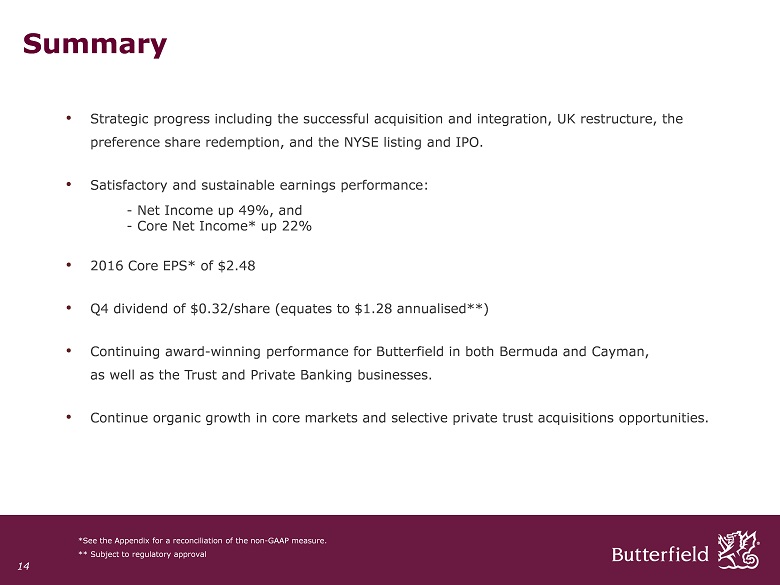
• Strategic progress including the successful acquisition and integration, UK restructure, the preference share redemption, and the NYSE listing and IPO. • Satisfactory and sustainable earnings performance: - Net Income up 49 %, and - Core Net Income* up 22% • 2016 Core EPS* of $2.48 • Q4 dividend of $0.32/share (equates to $1.28 annualised**) • Continuing award - winning performance for Butterfield in both Bermuda and Cayman, as well as the Trust and Private Banking businesses. • Continue organic growth in core markets and selective private trust acquisitions opportunities. Summary 14 *See the Appendix for a reconciliation of the non - GAAP measure. ** Subject to regulatory approval

15 Q&A | Appendix
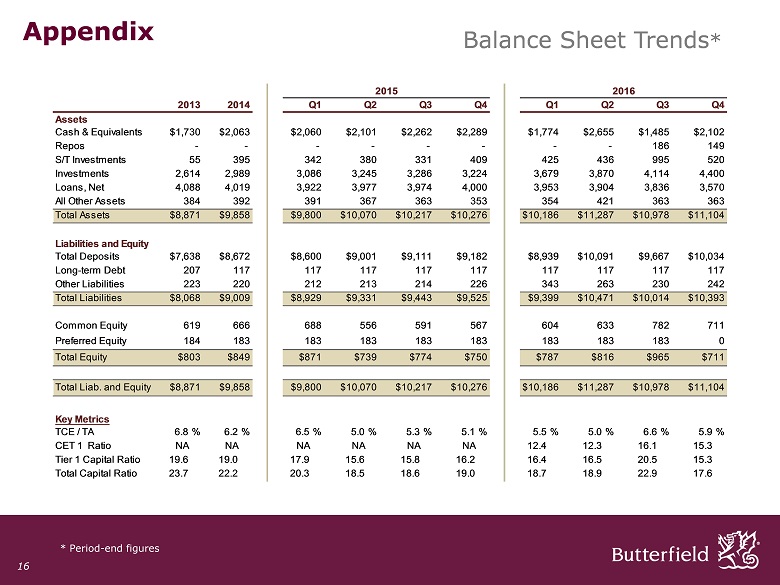
Appendix Balance Sheet Trends * * Period - end figures 16 2015 2016 2013 2014 Q1 Q2 Q3 Q4 Q1 Q2 Q3 Q4 Assets Cash & Equivalents $1,730 $2,063 $2,060 $2,101 $2,262 $2,289 $1,774 $2,655 $1,485 $2,102 Repos - - - - - - - - 186 149 S/T Investments 55 395 342 380 331 409 425 436 995 520 Investments 2,614 2,989 3,086 3,245 3,286 3,224 3,679 3,870 4,114 4,400 Loans, Net 4,088 4,019 3,922 3,977 3,974 4,000 3,953 3,904 3,836 3,570 All Other Assets 384 392 391 367 363 353 354 421 363 363 Total Assets $8,871 $9,858 $9,800 $10,070 $10,217 $10,276 $10,186 $11,287 $10,978 $11,104 Liabilities and Equity Total Deposits $7,638 $8,672 $8,600 $9,001 $9,111 $9,182 $8,939 $10,091 $9,667 $10,034 Long-term Debt 207 117 117 117 117 117 117 117 117 117 Other Liabilities 223 220 212 213 214 226 343 263 230 242 Total Liabilities $8,068 $9,009 $8,929 $9,331 $9,443 $9,525 $9,399 $10,471 $10,014 $10,393 Common Equity 619 666 688 556 591 567 604 633 782 711 Preferred Equity 184 183 183 183 183 183 183 183 183 0 Total Equity $803 $849 $871 $739 $774 $750 $787 $816 $965 $711 Total Liab. and Equity $8,871 $9,858 $9,800 $10,070 $10,217 $10,276 $10,186 $11,287 $10,978 $11,104 Key Metrics TCE / TA 6.8% 6.2% 6.5% 5.0% 5.3% 5.1% 5.5% 5.0% 6.6% 5.9% CET 1 Ratio NA NA NA NA NA NA 12.4 12.3 16.1 15.3 Tier 1 Capital Ratio 19.6 19.0 17.9 15.6 15.8 16.2 16.4 16.5 20.5 15.3 Total Capital Ratio 23.7 22.2 20.3 18.5 18.6 19.0 18.7 18.9 22.9 17.6
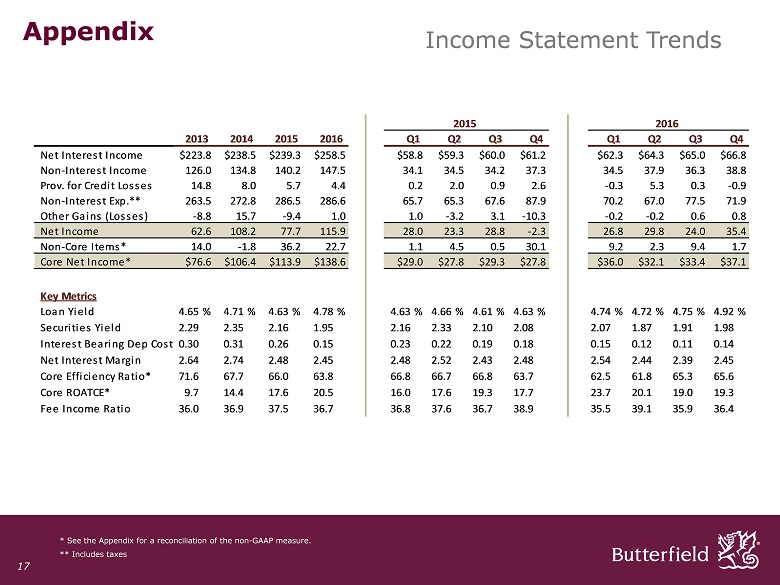
Appendix Income Statement Trends 17 * See the Appendix for a reconciliation of the non - GAAP measure. ** Includes taxes 2015 2016 2013 2014 2015 2016 Q1 Q2 Q3 Q4 Q1 Q2 Q3 Q4 Net Interest Income $223.8 $238.5 $239.3 $258.5 $58.8 $59.3 $60.0 $61.2 $62.3 $64.3 $65.0 $66.8 Non-Interest Income 126.0 134.8 140.2 147.5 34.1 34.5 34.2 37.3 34.5 37.9 36.3 38.8 Prov. for Credit Losses 14.8 8.0 5.7 4.4 0.2 2.0 0.9 2.6 -0.3 5.3 0.3 -0.9 Non-Interest Exp.** 263.5 272.8 286.5 286.6 65.7 65.3 67.6 87.9 70.2 67.0 77.5 71.9 Other Gains (Losses) -8.8 15.7 -9.4 1.0 1.0 -3.2 3.1 -10.3 -0.2 -0.2 0.6 0.8 Net Income 62.6 108.2 77.7 115.9 28.0 23.3 28.8 -2.3 26.8 29.8 24.0 35.4 Non-Core Items* 14.0 -1.8 36.2 22.7 1.1 4.5 0.5 30.1 9.2 2.3 9.4 1.7 Core Net Income* $76.6 $106.4 $113.9 $138.6 $29.0 $27.8 $29.3 $27.8 $36.0 $32.1 $33.4 $37.1 Key Metrics Loan Yield 4.65% 4.71% 4.63% 4.78% 4.63% 4.66% 4.61% 4.63% 4.74% 4.72% 4.75% 4.92% Securities Yield 2.29 2.35 2.16 1.95 2.16 2.33 2.10 2.08 2.07 1.87 1.91 1.98 Interest Bearing Dep Cost0.30 0.31 0.26 0.15 0.23 0.22 0.19 0.18 0.15 0.12 0.11 0.14 Net Interest Margin 2.64 2.74 2.48 2.45 2.48 2.52 2.43 2.48 2.54 2.44 2.39 2.45 Core Efficiency Ratio* 71.6 67.7 66.0 63.8 66.8 66.7 66.8 63.7 62.5 61.8 65.3 65.6 Core ROATCE* 9.7 14.4 17.6 20.5 16.0 17.6 19.3 17.7 23.7 20.1 19.0 19.3 Fee Income Ratio 36.0 36.9 37.5 36.7 36.8 37.6 36.7 38.9 35.5 39.1 35.9 36.4
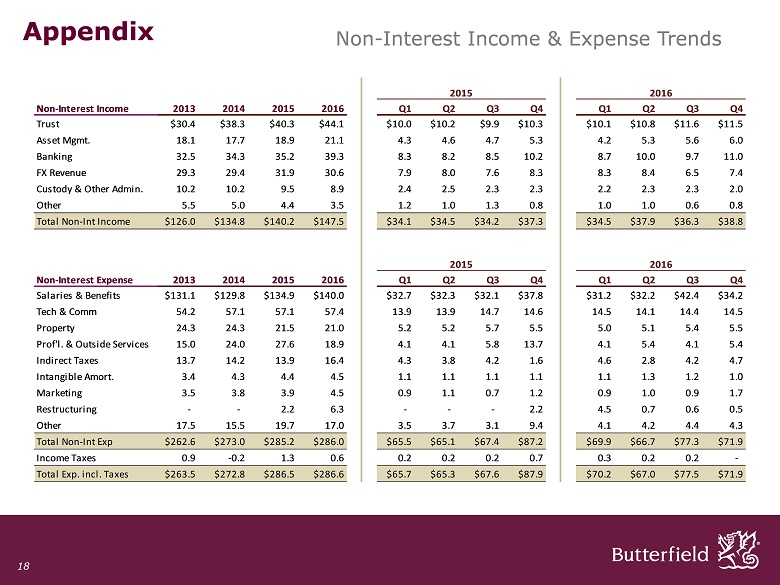
Appendix Non - Interest Income & Expense Trends 18 Non-Interest Income 2013 2014 2015 2016 Q1 Q2 Q3 Q4 Q1 Q2 Q3 Q4 Trust $30.4 $38.3 $40.3 $44.1 $10.0 $10.2 $9.9 $10.3 $10.1 $10.8 $11.6 $11.5 Asset Mgmt. 18.1 17.7 18.9 21.1 4.3 4.6 4.7 5.3 4.2 5.3 5.6 6.0 Banking 32.5 34.3 35.2 39.3 8.3 8.2 8.5 10.2 8.7 10.0 9.7 11.0 FX Revenue 29.3 29.4 31.9 30.6 7.9 8.0 7.6 8.3 8.3 8.4 6.5 7.4 Custody & Other Admin. 10.2 10.2 9.5 8.9 2.4 2.5 2.3 2.3 2.2 2.3 2.3 2.0 Other 5.5 5.0 4.4 3.5 1.2 1.0 1.3 0.8 1.0 1.0 0.6 0.8 Total Non-Int Income $126.0 $134.8 $140.2 $147.5 $34.1 $34.5 $34.2 $37.3 $34.5 $37.9 $36.3 $38.8 Non-Interest Expense 2013 2014 2015 2016 Q1 Q2 Q3 Q4 Q1 Q2 Q3 Q4 Salaries & Benefits $131.1 $129.8 $134.9 $140.0 $32.7 $32.3 $32.1 $37.8 $31.2 $32.2 $42.4 $34.2 Tech & Comm 54.2 57.1 57.1 57.4 13.9 13.9 14.7 14.6 14.5 14.1 14.4 14.5 Property 24.3 24.3 21.5 21.0 5.2 5.2 5.7 5.5 5.0 5.1 5.4 5.5 Prof'l. & Outside Services 15.0 24.0 27.6 18.9 4.1 4.1 5.8 13.7 4.1 5.4 4.1 5.4 Indirect Taxes 13.7 14.2 13.9 16.4 4.3 3.8 4.2 1.6 4.6 2.8 4.2 4.7 Intangible Amort. 3.4 4.3 4.4 4.5 1.1 1.1 1.1 1.1 1.1 1.3 1.2 1.0 Marketing 3.5 3.8 3.9 4.5 0.9 1.1 0.7 1.2 0.9 1.0 0.9 1.7 Restructuring - - 2.2 6.3 - - - 2.2 4.5 0.7 0.6 0.5 Other 17.5 15.5 19.7 17.0 3.5 3.7 3.1 9.4 4.1 4.2 4.4 4.3 Total Non-Int Exp $262.6 $273.0 $285.2 $286.0 $65.5 $65.1 $67.4 $87.2 $69.9 $66.7 $77.3 $71.9 Income Taxes 0.9 -0.2 1.3 0.6 0.2 0.2 0.2 0.7 0.3 0.2 0.2 - Total Exp. incl. Taxes $263.5 $272.8 $286.5 $286.6 $65.7 $65.3 $67.6 $87.9 $70.2 $67.0 $77.5 $71.9 2015 2016 2015 2016
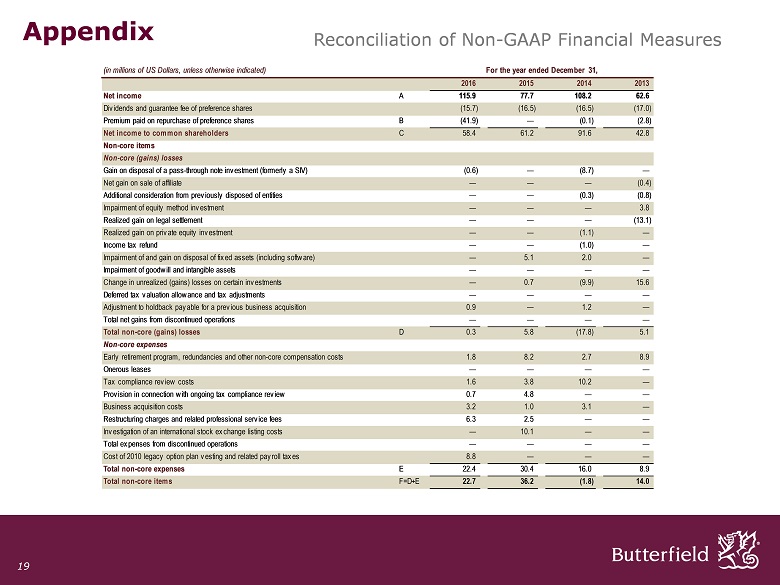
Appendix Reconciliation of Non - GAAP Financial Measures 19 (in millions of US Dollars, unless otherwise indicated) 2016 2015 2014 2013 Net income A 115.9 77.7 108.2 62.6 Dividends and guarantee fee of preference shares (15.7) (16.5) (16.5) (17.0) Premium paid on repurchase of preference shares B (41.9) — (0.1) (2.8) Net income to common shareholders C 58.4 61.2 91.6 42.8 Non-core items Non-core (gains) losses Gain on disposal of a pass-through note investment (formerly a SIV) (0.6) — (8.7) — Net gain on sale of affiliate — — — (0.4) Additional consideration from previously disposed of entities — — (0.3) (0.8) Impairment of equity method investment — — — 3.8 Realized gain on legal settlement — — — (13.1) Realized gain on private equity investment — — (1.1) — Income tax refund — — (1.0) — Impairment of and gain on disposal of fixed assets (including software) — 5.1 2.0 — Impairment of goodwill and intangible assets — — — — Change in unrealized (gains) losses on certain investments — 0.7 (9.9) 15.6 Deferred tax valuation allowance and tax adjustments — — — — Adjustment to holdback payable for a previous business acquisition 0.9 — 1.2 — Total net gains from discontinued operations — — — — Total non-core (gains) losses D 0.3 5.8 (17.8) 5.1 Non-core expenses Early retirement program, redundancies and other non-core compensation costs 1.8 8.2 2.7 8.9 Onerous leases — — — — Tax compliance review costs 1.6 3.8 10.2 — Provision in connection with ongoing tax compliance review 0.7 4.8 — — Business acquisition costs 3.2 1.0 3.1 — Restructuring charges and related professional service fees 6.3 2.5 — — Investigation of an international stock exchange listing costs — 10.1 — — Total expenses from discontinued operations — — — — Cost of 2010 legacy option plan vesting and related payroll taxes 8.8 — — — Total non-core expenses E 22.4 30.4 16.0 8.9 Total non-core items F=D+E 22.7 36.2 (1.8) 14.0 For the year ended December 31,
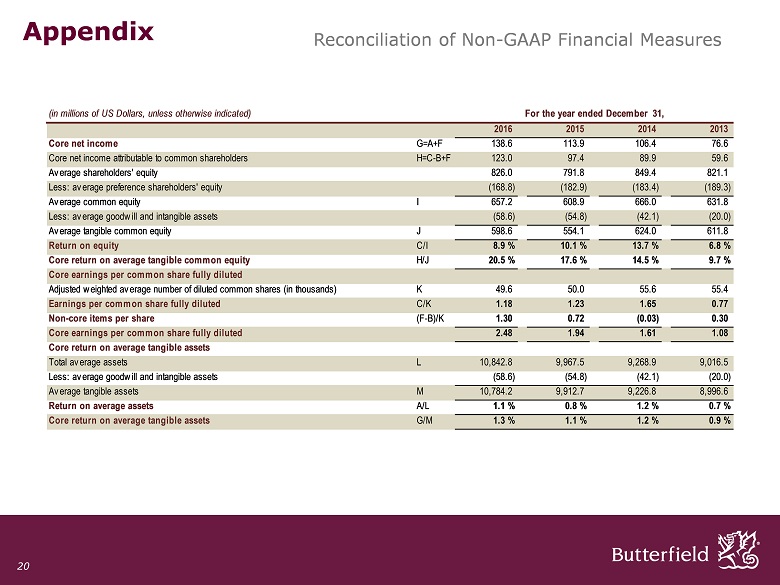
Appendix 20 Reconciliation of Non - GAAP Financial Measures (in millions of US Dollars, unless otherwise indicated) 2016 2015 2014 2013 Core net income G=A+F 138.6 113.9 106.4 76.6 Core net income attributable to common shareholders H=C-B+F 123.0 97.4 89.9 59.6 Average shareholders' equity 826.0 791.8 849.4 821.1 Less: average preference shareholders' equity (168.8) (182.9) (183.4) (189.3) Average common equity I 657.2 608.9 666.0 631.8 Less: average goodwill and intangible assets (58.6) (54.8) (42.1) (20.0) Average tangible common equity J 598.6 554.1 624.0 611.8 Return on equity C/I 8.9% 10.1% 13.7% 6.8% Core return on average tangible common equity H/J 20.5% 17.6% 14.5% 9.7% Core earnings per common share fully diluted Adjusted weighted average number of diluted common shares (in thousands) K 49.6 50.0 55.6 55.4 Earnings per common share fully diluted C/K 1.18 1.23 1.65 0.77 Non-core items per share (F-B)/K 1.30 0.72 (0.03) 0.30 Core earnings per common share fully diluted 2.48 1.94 1.61 1.08 Core return on average tangible assets Total average assets L 10,842.8 9,967.5 9,268.9 9,016.5 Less: average goodwill and intangible assets (58.6) (54.8) (42.1) (20.0) Average tangible assets M 10,784.2 9,912.7 9,226.8 8,996.6 Return on average assets A/L 1.1% 0.8% 1.2% 0.7% Core return on average tangible assets G/M 1.3% 1.1% 1.2% 0.9% For the year ended December 31,
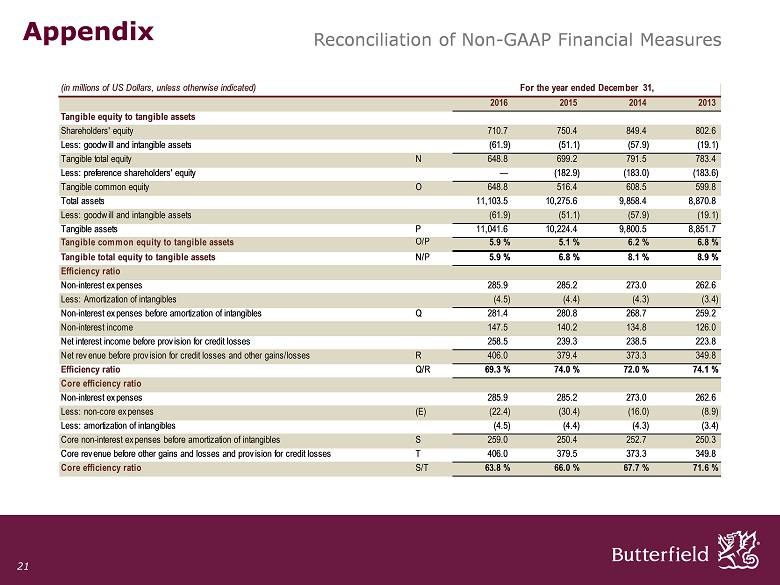
Appendix 21 Reconciliation of Non - GAAP Financial Measures (in millions of US Dollars, unless otherwise indicated) 2016 2015 2014 2013 Tangible equity to tangible assets Shareholders' equity 710.7 750.4 849.4 802.6 Less: goodwill and intangible assets (61.9) (51.1) (57.9) (19.1) Tangible total equity N 648.8 699.2 791.5 783.4 Less: preference shareholders' equity — (182.9) (183.0) (183.6) Tangible common equity O 648.8 516.4 608.5 599.8 Total assets 11,103.5 10,275.6 9,858.4 8,870.8 Less: goodwill and intangible assets (61.9) (51.1) (57.9) (19.1) Tangible assets P 11,041.6 10,224.4 9,800.5 8,851.7 Tangible common equity to tangible assets O/P 5.9% 5.1% 6.2% 6.8% Tangible total equity to tangible assets N/P 5.9% 6.8% 8.1% 8.9% Efficiency ratio Non-interest expenses 285.9 285.2 273.0 262.6 Less: Amortization of intangibles (4.5) (4.4) (4.3) (3.4) Non-interest expenses before amortization of intangibles Q 281.4 280.8 268.7 259.2 Non-interest income 147.5 140.2 134.8 126.0 Net interest income before provision for credit losses 258.5 239.3 238.5 223.8 Net revenue before provision for credit losses and other gains/losses R 406.0 379.4 373.3 349.8 Efficiency ratio Q/R 69.3% 74.0% 72.0% 74.1% Core efficiency ratio Non-interest expenses 285.9 285.2 273.0 262.6 Less: non-core expenses (E) (22.4) (30.4) (16.0) (8.9) Less: amortization of intangibles (4.5) (4.4) (4.3) (3.4) Core non-interest expenses before amortization of intangibles S 259.0 250.4 252.7 250.3 Core revenue before other gains and losses and provision for credit losses T 406.0 379.5 373.3 349.8 Core efficiency ratio S/T 63.8% 66.0% 67.7% 71.6% For the year ended December 31,
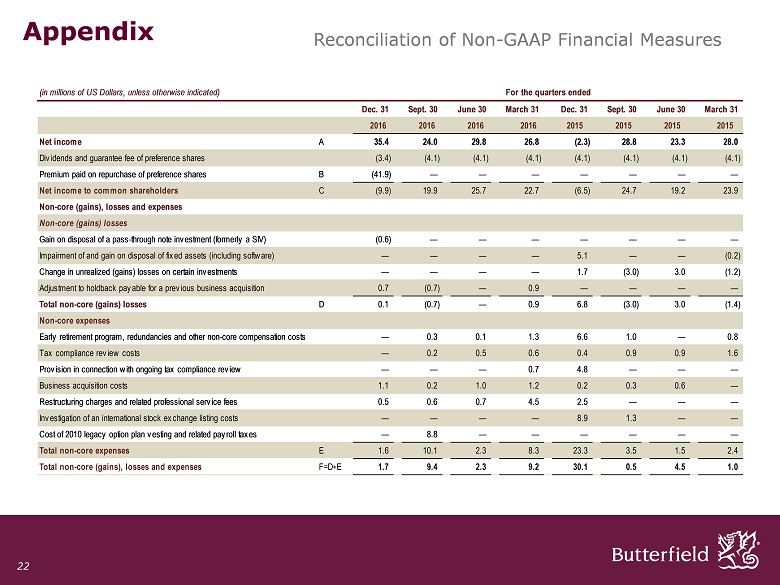
Appendix 22 Reconciliation of Non - GAAP Financial Measures (in millions of US Dollars, unless otherwise indicated) Dec. 31 Sept. 30 June 30 March 31 Dec. 31 Sept. 30 June 30 March 31 2016 2016 2016 2016 2015 2015 2015 2015 Net income A 35.4 24.0 29.8 26.8 (2.3) 28.8 23.3 28.0 Dividends and guarantee fee of preference shares (3.4) (4.1) (4.1) (4.1) (4.1) (4.1) (4.1) (4.1) Premium paid on repurchase of preference shares B (41.9) — — — — — — — Net income to common shareholders C (9.9) 19.9 25.7 22.7 (6.5) 24.7 19.2 23.9 Non-core (gains), losses and expenses Non-core (gains) losses Gain on disposal of a pass-through note investment (formerly a SIV) (0.6) — — — — — — — Impairment of and gain on disposal of fixed assets (including software) — — — — 5.1 — — (0.2) Change in unrealized (gains) losses on certain investments — — — — 1.7 (3.0) 3.0 (1.2) Adjustment to holdback payable for a previous business acquisition 0.7 (0.7) — 0.9 — — — — Total non-core (gains) losses D 0.1 (0.7) — 0.9 6.8 (3.0) 3.0 (1.4) Non-core expenses Early retirement program, redundancies and other non-core compensation costs — 0.3 0.1 1.3 6.6 1.0 — 0.8 Tax compliance review costs — 0.2 0.5 0.6 0.4 0.9 0.9 1.6 Provision in connection with ongoing tax compliance review — — — 0.7 4.8 — — — Business acquisition costs 1.1 0.2 1.0 1.2 0.2 0.3 0.6 — Restructuring charges and related professional service fees 0.5 0.6 0.7 4.5 2.5 — — — Investigation of an international stock exchange listing costs — — — — 8.9 1.3 — — Cost of 2010 legacy option plan vesting and related payroll taxes — 8.8 — — — — — — Total non-core expenses E 1.6 10.1 2.3 8.3 23.3 3.5 1.5 2.4 Total non-core (gains), losses and expenses F=D+E 1.7 9.4 2.3 9.2 30.1 0.5 4.5 1.0 For the quarters ended
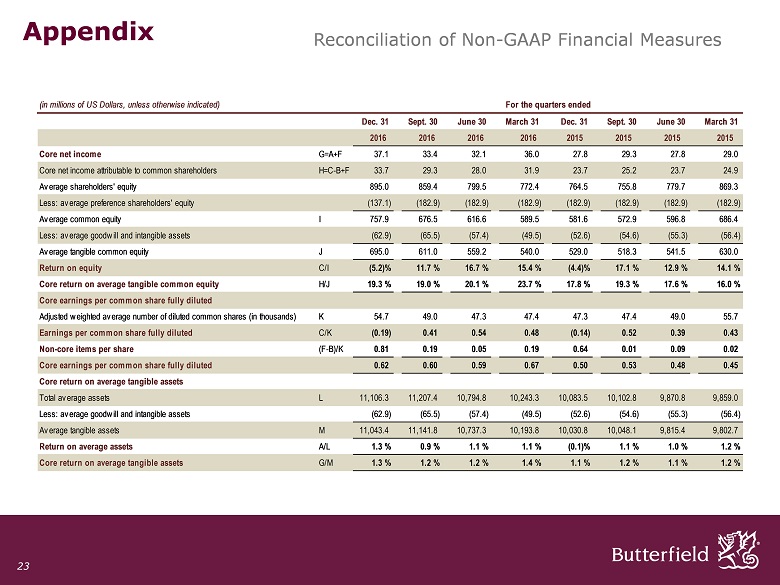
Appendix 23 Reconciliation of Non - GAAP Financial Measures (in millions of US Dollars, unless otherwise indicated) Dec. 31 Sept. 30 June 30 March 31 Dec. 31 Sept. 30 June 30 March 31 2016 2016 2016 2016 2015 2015 2015 2015 Core net income G=A+F 37.1 33.4 32.1 36.0 27.8 29.3 27.8 29.0 Core net income attributable to common shareholders H=C-B+F 33.7 29.3 28.0 31.9 23.7 25.2 23.7 24.9 Average shareholders' equity 895.0 859.4 799.5 772.4 764.5 755.8 779.7 869.3 Less: average preference shareholders' equity (137.1) (182.9) (182.9) (182.9) (182.9) (182.9) (182.9) (182.9) Average common equity I 757.9 676.5 616.6 589.5 581.6 572.9 596.8 686.4 Less: average goodwill and intangible assets (62.9) (65.5) (57.4) (49.5) (52.6) (54.6) (55.3) (56.4) Average tangible common equity J 695.0 611.0 559.2 540.0 529.0 518.3 541.5 630.0 Return on equity C/I (5.2)% 11.7% 16.7% 15.4% (4.4)% 17.1% 12.9% 14.1% Core return on average tangible common equity H/J 19.3% 19.0% 20.1% 23.7% 17.8% 19.3% 17.6% 16.0% Core earnings per common share fully diluted Adjusted weighted average number of diluted common shares (in thousands) K 54.7 49.0 47.3 47.4 47.3 47.4 49.0 55.7 Earnings per common share fully diluted C/K (0.19) 0.41 0.54 0.48 (0.14) 0.52 0.39 0.43 Non-core items per share (F-B)/K 0.81 0.19 0.05 0.19 0.64 0.01 0.09 0.02 Core earnings per common share fully diluted 0.62 0.60 0.59 0.67 0.50 0.53 0.48 0.45 Core return on average tangible assets Total average assets L 11,106.3 11,207.4 10,794.8 10,243.3 10,083.5 10,102.8 9,870.8 9,859.0 Less: average goodwill and intangible assets (62.9) (65.5) (57.4) (49.5) (52.6) (54.6) (55.3) (56.4) Average tangible assets M 11,043.4 11,141.8 10,737.3 10,193.8 10,030.8 10,048.1 9,815.4 9,802.7 Return on average assets A/L 1.3% 0.9% 1.1% 1.1% (0.1)% 1.1% 1.0% 1.2% Core return on average tangible assets G/M 1.3% 1.2% 1.2% 1.4% 1.1% 1.2% 1.1% 1.2% For the quarters ended

Appendix 24 Reconciliation of Non - GAAP Financial Measures (in millions of US Dollars, unless otherwise indicated) Dec. 31 Sept. 30 June 30 March 31 Dec. 31 Sept. 30 June 30 March 31 2016 2016 2016 2016 2015 2015 2015 2015 Tangible equity to tangible assets Shareholders' equity 710.7 964.7 815.9 786.9 750.4 773.9 739.0 871.5 Less: goodwill and intangible assets (61.9) (64.6) (66.4) (49.1) (51.1) (53.3) (56.0) (54.7) Tangible total equity N 648.8 900.1 749.5 737.8 699.3 720.6 683.0 816.8 Less: preference shareholders' equity — (182.9) (182.9) (182.9) (182.9) (182.9) (182.9) (182.9) Tangible common equity O 648.8 717.2 566.6 554.9 516.4 537.7 500.1 633.9 Total assets 11,103.5 10,978.5 11,287.2 10,185.6 10,275.6 10,216.5 10,069.8 9,800.3 Less: goodwill and intangible assets (61.9) (64.6) (66.4) (49.1) (51.1) (53.3) (56.0) (54.7) Tangible assets P 11,041.6 10,913.9 11,220.8 10,136.5 10,224.5 10,163.2 10,013.8 9,745.6 Tangible common equity to tangible assets O/P 5.9% 6.6% 5.0% 5.5% 5.1% 5.3% 5.0% 6.5% Tangible total equity to tangible assets N/P 5.9% 8.3% 6.7% 7.3% 6.8% 7.1% 6.8% 8.4% Efficiency ratio Non-interest expenses 71.9 77.3 66.7 69.9 87.2 67.4 65.1 65.5 Less: Amortization of intangibles (1.0) (1.2) (1.3) (1.1) (1.1) (1.1) (1.1) (1.1) Non-interest expenses before amortization of intangibles Q 70.9 76.1 65.4 68.8 86.1 66.3 64.0 64.4 Non-interest income 38.8 36.3 37.9 34.5 37.3 34.2 34.5 34.1 Net interest income before provision for credit losses 66.8 65.0 64.3 62.3 61.2 60.0 59.3 58.8 Net revenue before provision for credit losses and other gains/losses R 105.6 101.3 102.2 96.8 98.5 94.2 93.8 92.9 Efficiency ratio Q/R 67.1% 75.2% 64.0% 71.1% 87.4% 70.4% 68.2% 69.3% Core efficiency ratio Non-interest expenses 71.9 77.3 66.7 69.9 87.2 67.4 65.1 65.5 Less: non-core expenses (E) (1.6) (10.1) (2.3) (8.3) (23.3) (3.5) (1.5) (2.4) Less: amortization of intangibles (1.0) (1.2) (1.3) (1.1) (1.1) (1.1) (1.1) (1.1) Core non-interest expenses before amortization of intangibles S 69.3 66.0 63.1 60.5 62.8 62.8 62.5 62.0 Net revenue before provision for credit losses and other gains/losses T 105.6 101.3 102.2 96.8 98.5 94.2 93.8 92.9 Core efficiency ratio S/T 65.6% 65.3% 61.8% 62.5% 63.7% 66.8% 66.7% 66.8% For the quarters ended