| FREE WRITING PROSPECTUS | ||
| FILED PURSUANT TO RULE 433 | ||
| REGISTRATION FILE NO.: 333-193376-24 | ||
October 13, 2015
FREE WRITING PROSPECTUS
STRUCTURAL AND COLLATERAL TERM SHEET
$931,617,393
(Approximate Total Mortgage Pool Balance)
$803,520,000
(Approximate Offered Certificates)
COMM 2015-CCRE27 |
Deutsche Mortgage & Asset Receiving Corporation
Depositor
German American Capital Corporation
The Bank of New York Mellon
KeyBank National Association
Cantor Commercial Real Estate Lending, L.P.
Sponsors and Mortgage Loan Sellers
| Deutsche Bank Securities | Cantor Fitzgerald & Co. | |
| Joint Bookrunning Managers and Co-Lead Managers | ||
| KeyBanc Capital Markets | Goldman, Sachs & Co. | CastleOak Securities, L.P. |
| Co-Managers | ||
The depositor has filed a registration statement (including the prospectus) with the Securities and Exchange Commission (File No. 333-193376) for the offering to which this communication relates. Before you invest, you should read the prospectus in the registration statement and other documents the depositor has filed with the Securities and Exchange Commission for more complete information about the depositor, the issuing entity and this offering. You may get these documents for free by visiting EDGAR on the SEC website at www.sec.gov. Alternatively, the depositor or Deutsche Bank Securities Inc., any other underwriter, or any dealer participating in this offering will arrange to send you the prospectus if you request it by calling toll-free 1-800-503-4611 or by email to the following address: prospectus.cpdg@db.com. The offered certificates referred to in these materials, and the asset pool backing them, are subject to modification or revision (including the possibility that one or more classes of certificates may be split, combined or eliminated at any time prior to issuance or availability of a final prospectus) and are offered on a “when, as and if issued” basis. You understand that, when you are considering the purchase of these certificates, a contract of sale will come into being no sooner than the date on which the relevant class has been priced and we have verified the allocation of certificates to be made to you; any “indications of interest” expressed by you, and any “soft circles” generated by us, will not create binding contractual obligations for you or us.
COMM 2015-CCRE27 Mortgage Trust
Capitalized terms used but not defined herein have the meanings assigned to them in the other Free Writing Prospectus expected to be dated October 13, 2015, relating to the offered certificates (hereinafter referred to as the “Free Writing Prospectus”).
| KEY FEATURES OF SECURITIZATION |
| Offering Terms: | |
| Joint Bookrunners & Co-Lead Managers: | Deutsche Bank Securities Inc. and Cantor Fitzgerald & Co. |
| Co-Managers: | KeyBanc Capital Markets, CastleOak Securities, L.P. and Goldman, Sachs & Co. |
| Mortgage Loan Sellers: | German American Capital Corporation* (“GACC”) (42.7%), The Bank of New York Mellon (“BNYM”) (21.1%), KeyBank National Association (“KeyBank”) (20.8%) and Cantor Commercial Real Estate Lending, L.P. (“CCRE”) (15.4%). *An indirect wholly owned subsidiary of Deutsche Bank AG. |
| Master Servicer: | Midland Loan Services, a Division of PNC Bank, National Association |
| Operating Advisor: | Park Bridge Lender Services LLC |
| Special Servicer: | Rialto Capital Advisors, LLC |
| Trustee: | Wells Fargo Bank, National Association |
| Rating Agencies: | Moody’s Investors Service, Inc., Fitch Ratings, Inc. and DBRS, Inc. |
| Determination Date: | 6th day of each month, or if such 6th day is not a business day, the following business day, commencing in November 2015. |
| Distribution Date: | 4th business day following the Determination Date in each month, commencing in November 2015. |
| Cut-off Date: | Payment Date in October 2015 (or related origination date, if later). Unless otherwise noted, all Mortgage Loan statistics are based on balances as of the Cut-off Date. |
| Settlement Date: | On or about October 29, 2015 |
| Settlement Terms: | DTC, Euroclear and Clearstream, same day funds, with accrued interest. |
| ERISA Eligible: | All of the Offered Certificates are expected to be ERISA eligible. |
| SMMEA Eligible: | None of the Offered Certificates will be SMMEA eligible. |
| Day Count: | 30/360 |
| Tax Treatment: | REMIC |
| Rated Final Distribution Date: | October 2048 |
| Minimum Denominations: | $10,000 (or $100,000 with respect to Class X-A) and in each case in multiples of $1 thereafter. |
| Clean-up Call: | 1% (with certain exceptions described under“The Pooling and Servicing Agreement—Optional Termination” in the Free Writing Prospectus) |
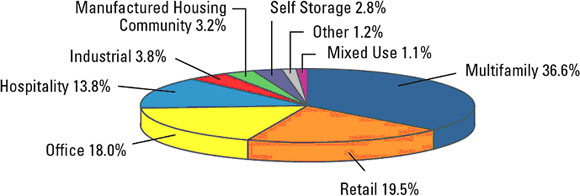
| Distribution of Collateral by Property Type |
THE INFORMATION IN THIS STRUCTURAL AND COLLATERAL TERM SHEET IS NOT COMPLETE AND MAY BE AMENDED PRIOR TO THE TIME OF SALE. THIS TERM SHEET IS NOT AN OFFER TO SELL THESE SECURITIES AND IT IS NOT A SOLICITATION OF AN OFFER TO BUY THESE SECURITIES IN ANY JURISDICTION WHERE THE OFFER OR SALE IS NOT PERMITTED.
| 3 |
COMM 2015-CCRE27 Mortgage Trust
| TRANSACTION HIGHLIGHTS |
| Mortgage Loan Sellers | Number of Mortgage Loans | Number of Mortgaged Properties | Aggregate Cut-off Date Balance | % of Outstanding Pool Balance | ||
| German American Capital Corporation | 20 | 34 | $397,893,862 | 42.7% | ||
| The Bank of New York Mellon | 12 | 16 | $196,225,586 | 21.1% | ||
| KeyBank National Association | 25 | 28 | $194,035,645 | 20.8% | ||
| Cantor Commercial Real Estate Lending, L.P. | 8 | 18 | $143,462,300 | 15.4% | ||
| Total: | 65 | 96 | $931,617,393 | 100.0% | ||
| Pooled Collateral Facts: | |
| Initial Outstanding Pool Balance: | $931,617,393 |
| Number of Mortgage Loans: | 65 |
| Number of Mortgaged Properties: | 96 |
| Average Mortgage Loan Cut-off Date Balance: | $14,332,575 |
| Average Mortgaged Property Cut-off Date Balance: | $9,704,348 |
| Weighted Average Mortgage Rate: | 4.4889% |
| Weighted Average Mortgage Loan Original Term to Maturity Date or ARD (months): | 115 |
| Weighted Average Mortgage Loan Remaining Term to Maturity Date or ARD (months): | 114 |
| Weighted Average Mortgage Loan Seasoning (months): | 1 |
| % of Mortgaged Properties Leased to a Single Tenant: | 3.1% |
| Credit Statistics(1): | |
| Weighted Average Mortgage Loan U/W NCF DSCR(2): | 1.77x |
| Weighted Average Mortgage Loan Cut-off Date LTV(3)(4): | 65.5% |
| Weighted Average Mortgage Loan Maturity Date or ARD LTV(3)(4): | 57.8% |
| Weighted Average U/W NOI Debt Yield: | 10.4% |
| Amortization Overview: | |
| % Mortgage Loans with Amortization through Maturity Date or ARD: | 33.9% |
| % Mortgage Loans which pay Interest Only through Maturity Date or ARD: | 20.6% |
| % Mortgage Loans which pay Interest Only followed by Amortization through Maturity Date or ARD: | 45.5% |
| Weighted Average Remaining Amortization Term (months)(2)(5): | 357 |
| Loan Structural Features: | |
| % Mortgage Loans with Upfront or Ongoing Tax Reserves: | 91.2% |
| % Mortgage Loans with Upfront or Ongoing Replacement Reserves(6): | 87.8% |
| % Mortgage Loans with Upfront or Ongoing Insurance Reserves: | 41.1% |
| % Mortgage Loans with Upfront or Ongoing TI/LC Reserves(7): | 92.1% |
| % Mortgage Loans with Upfront Engineering Reserves: | 49.3% |
| % Mortgage Loans with Upfront or Ongoing Other Reserves: | 38.6% |
| % Mortgage Loans with In Place Hard Lockboxes: | 31.2% |
| % Mortgage Loans with Cash Traps Triggered at DSCR Levels ≥ 1.10x: | 85.7% |
| % Mortgage Loans with Cash Traps Triggered only based on Loan Specific Debt Yield: | 7.5% |
| % Mortgage Loans with Defeasance Only After a Lockout Period and Prior to an Open Period: | 88.5% |
| % Mortgage Loans with Prepayment Only After a Lockout Period and Prior to an Open Period with a Yield Maintenance Charge: | 11.5% |
| (1) | With respect to the 11 Madison Avenue Mortgage Loan and NMS Los Angeles Multifamily Portfolio Mortgage Loan the LTV, DSCR and Debt Yield calculations include the relatedpari passucompanion loan(s), but not any related subordinate companion loan(s). |
| (2) | With respect to the Atlanta Multifamily Portfolio Mortgage Loan, representing approximately 4.8% of the initial outstanding pool balance, following an initial interest only period of 18 months, the mortgage loan amortizes based on a non-standard amortization schedule and the U/W NCF DSCR for such Mortgage Loan was calculated based on the debt service for the first 12 amortizing payments. For additional information, see Annex H to the Free Writing Prospectus. |
| (3) | With respect to two mortgage loans, representing 6.4% of the initial outstanding principal balance, the Cut-off Date LTV and Maturity Date or ARD LTV have been calculated based on the “as complete” or “as renovated” value. For additional information, see the Footnotes to Annex A-1 in the Free Writing Prospectus. |
| (4) | With respect to the NMS Los Angeles Multifamily Portfolio Mortgage Loan, Sandalwood Portfolio Mortgage Loan and the Midwest Shopping Center Portfolio Mortgage Loan, collectively representing 17.8% of the initial outstanding pool balance, the Cut-off Date LTV and Maturity Date or ARD LTV have been calculated based on the “as portfolio” appraised value, which attributes a premium to the aggregate value of the mortgaged properties as a whole. For additional information, see the Footnotes to Annex A-1 in the Free Writing Prospectus. |
| (5) | Excludes loans which are interest only for the full loan term. |
| (6) | Includes FF&E Reserves. |
| (7) | Represents the percent of the allocated initial outstanding principal balance of retail, office, industrial and mixed use properties only. |
THE INFORMATION IN THIS STRUCTURAL AND COLLATERAL TERM SHEET IS NOT COMPLETE AND MAY BE AMENDED PRIOR TO THE TIME OF SALE. THIS TERM SHEET IS NOT AN OFFER TO SELL THESE SECURITIES AND IT IS NOT A SOLICITATION OF AN OFFER TO BUY THESE SECURITIES IN ANY JURISDICTION WHERE THE OFFER OR SALE IS NOT PERMITTED.
| 4 |
COMM 2015-CCRE27 Mortgage Trust
| STRUCTURE OVERVIEW |
OFFERED CERTIFICATES
| Class(1) | Ratings (Moody’s/Fitch/DBRS) | Initial Certificate Balance or Notional Amount(2) | Initial | Weighted | Principal Window (months)(3) | Certificate Principal to Value Ratio(4) | Underwritten | ||||||||
| Class A-1 | Aaa(sf)/AAAsf/AAA(sf) | $38,731,000 | 30.000%(6) | 2.79 | 1 - 58 | 45.8% | 14.9% | ||||||||
| Class A-2 | Aaa(sf)/AAAsf/AAA(sf) | $72,542,000 | 30.000%(6) | 4.87 | 58 - 60 | 45.8% | 14.9% | ||||||||
| Class A-SB | Aaa(sf)/AAAsf/AAA(sf) | $62,544,000 | 30.000%(6) | 7.47 | 60 - 117 | 45.8% | 14.9% | ||||||||
| Class A-3 | Aaa(sf)/AAAsf/AAA(sf) | $215,000,000 | 30.000%(6) | 9.79 | 117 - 119 | 45.8% | 14.9% | ||||||||
| Class A-4 | Aaa(sf)/AAAsf/AAA(sf) | $263,315,000 | 30.000%(6) | 9.86 | 119 - 119 | 45.8% | 14.9% | ||||||||
| Class X-A(7) | Aa1(sf)/AAAsf/AAA(sf) | $705,700,000 | (8) | N/A | N/A | N/A | N/A | N/A | |||||||
| Class A-M | Aa2(sf)/AAAsf/AAA(sf) | $53,568,000 | 24.250% | 9.86 | 119 - 119 | 49.6% | 13.7% | ||||||||
| Class B | A1(sf)/AA-sf/AA(sf) | $54,732,000 | 18.375% | 9.86 | 119 - 119 | 53.5% | 12.7% | ||||||||
| Class C | NR/A-sf/A(sf) | $43,088,000 | 13.750% | 9.86 | 119 - 119 | 56.5% | 12.1% | ||||||||
NON-OFFERED CERTIFICATES
| Class(1) | Ratings (Moody’s/Fitch/DBRS) | Initial Certificate Balance or Notional Amount(2) | Initial | Weighted | Principal Window (months)(3) | Certificate Principal to Value Ratio(4) | Underwritten | ||||||||
| Class X-B(7) | NR/A-sf/AAA(sf) | $97,820,000 | (8) | N/A | N/A | N/A | N/A | N/A | |||||||
| Class X-C(7) | NR/BBB-sf/AAA(sf) | $51,238,000 | (8) | N/A | N/A | N/A | N/A | N/A | |||||||
| Class X-D(7) | NR/NR/AAA(sf) | $33,772,000 | (8) | N/A | N/A | N/A | N/A | N/A | |||||||
| Class X-E(7) | NR/NR/AAA(sf) | $13,974,000 | (8) | N/A | N/A | N/A | N/A | N/A | |||||||
| Class X-F(7) | NR/NR/AAA(sf) | $29,113,392 | (8) | N/A | N/A | N/A | N/A | N/A | |||||||
| Class D | NR/BBB-sf/BBB(low)(sf) | $51,238,000 | 8.250% | 9.94 | 119 - 120 | 60.1% | 11.3% | ||||||||
| Class E | NR/BB-sf/BB(low)(sf) | $24,455,000 | 5.625% | 9.95 | 120 - 120 | 61.8% | 11.0% | ||||||||
| Class F | NR/B-sf/B(high)(sf) | $9,317,000 | 4.625% | 9.95 | 120 - 120 | 62.5% | 10.9% | ||||||||
| Class G | NR/NR/B(low)(sf) | $13,974,000 | 3.125% | 9.95 | 120 - 120 | 63.5% | 10.7% | ||||||||
| Class H | NR/NR/NR | $29,113,392 | 0.000% | 9.95 | 120 - 120 | 65.5% | 10.4% | ||||||||
| (1) | The pass-through rates applicable to the Class A-1, Class A-2, Class A-SB, Class A-3, Class A-4, Class A-M, Class B, Class C, Class D, Class E, Class F, Class G and Class H Certificates will equal one of: (i) a fixed per annum rate, (ii) the weighted average of the net mortgage rates on the mortgage loans (in each case, adjusted, if necessary, to accrue on the basis of a 360-day year consisting of twelve 30-day months) as of their respective due dates in the month preceding the month in which such distribution date occurs, (iii) a rate equal to the lesser of a specified pass-through rate and the weighted average of the net mortgage rates on the mortgage loans (in each case, adjusted, if necessary, to accrue on the basis of a 360-day year consisting of twelve 30-day months) as of their respective due dates in the month preceding the month in which such distribution date occurs or (iv) the weighted average of the net mortgage rates on the mortgage loans) (in each case, adjusted, if necessary, to accrue on the basis of a 360-day year consisting of twelve 30-day months) as of their respective due dates in the month preceding the month in which such distribution date occurs, less a specified rate. |
| (2) | Approximate; subject to a permitted variance of plus or minus 5%. In addition, the notional amounts of the Class X-A, Class X-B, Class X-C, Class X-D, Class X-E and Class X-F Certificates (collectively, the “Class X Certificates”) may vary depending upon the final pricing of the classes of Certificates whose Certificate Balances comprise such notional amounts and, if as a result of such pricing the pass-through rate of any class of Class X Certificates would be equal to zero, such Class X Certificates may not be issued on the settlement date of this securitization. |
| (3) | The weighted average life and principal window during which distributions of principal would be received as set forth in the table with respect to each class of Certificates with a Certificate Balance is based on (i) modeling assumptions described in the Free Writing Prospectus, (ii) assumptions that there are no prepayments, delinquencies or losses on the mortgage loans and (iii) assumptions that there are no extensions of maturity dates and mortgage loans with anticipated repayment dates, if any, are repaid on the respective anticipated repayment dates. |
| (4) | “Certificate Principal to Value Ratio” for any class with a Certificate Balance is calculated as the product of (a) the weighted average Mortgage Loan Cut-off Date LTV of the mortgage pool, multiplied by (b) a fraction, the numerator of which is the total initial Certificate Balance of the related class of Certificates and all other classes with a Certificate Balance, if any, that are senior to such class, and the denominator of which is the total initial Certificate Balance of all Certificates. The Certificate Principal to Value Ratios of the Class A-1, Class A-2, Class A-SB, Class A-3 and Class A-4 Certificates are calculated in the aggregate for those classes as if they were a single class. |
| (5) | “Underwritten NOI Debt Yield” for any class with a Certificate Balance is calculated as the product of (a) the weighted average U/W NOI Debt Yield for the mortgage pool, multiplied by (b) a fraction, the numerator of which is the total initial Certificate Balance of all Certificates and the denominator of which is the total initial Certificate Balance of the related class of Certificates and all other classes with a Certificate Balance, if any, that are senior to such class. The Underwritten NOI Debt Yields of the Class A-1, Class A-2, Class A-SB, Class A-3 and Class A-4 Certificates are calculated in the aggregate for those classes as if they were a single class. |
| (6) | The initial subordination levels for the Class A-1, Class A-2, Class A-SB, Class A-3 and Class A-4 Certificates are represented in the aggregate. |
| (7) | As further described in the Free Writing Prospectus, the pass-through rate applicable to the Class X Certificates for each Distribution Date will generally be equal to the excess of (i) the weighted average of the net mortgage rates on the mortgage loans (in each case, adjusted, if necessary, to accrue on the basis of a 360 day year consisting of twelve 30-day months) as of their respective due dates in the month preceding the month in which such distribution date occurs over (ii)(A) with respect to the Class X-A Certificates, the weighted average of the pass-through rates of the Class A-1, Class A-2, Class A-SB, Class A-3, Class A-4 and Class A-M Certificates (based on their Certificate Balances), (B) with respect to the Class X-B Certificates, the weighted average of the pass-through rates of the Class B and Class C Certificates (based on their Certificate Balances), (C) with respect to the Class X-C Certificates, the pass-through rate of the Class D Certificates, (D) with respect to the Class X-D Certificates, the weighted average of the pass-through rates of the Class E and Class F Certificates (based on their Certificate Balances), (E) with respect to the Class X-E Certificates, the pass-through rate of the Class G Certificates and (F) with respect to the Class X-F Certificates, the pass-through rate of the Class H Certificates. |
| (8) | The Class X Certificates will not have Certificate Balances. None of the Class X Certificates will be entitled to distributions of principal. The interest accrual amounts on the Class X-A Certificates will be calculated by reference to a notional amount equal to the sum of the total Certificate Balance of each of the Class A-1, Class A-2, Class A-SB, Class A-3, Class A-4 and Class A-M Certificates. The interest accrual amounts on the Class X-B Certificates will be calculated by reference to a notional amount equal to the sum of the total Certificate Balance of each of the Class B and Class C Certificates. The interest accrual amounts on the Class X-C Certificates will be calculated by reference to a notional amount equal to the Certificate Balance of the Class D Certificates. The interest accrual amounts on the Class X-D Certificates will be calculated by reference to a notional amount equal to the sum of the total Certificate Balance of each the Class E and Class F Certificates. The interest accrual amounts on the Class X-E Certificates will be calculated by reference to a notional amount equal to the Certificate Balance of the Class G Certificates. The interest accrual amounts on the Class X-F Certificates will be calculated by reference to a notional amount equal to the Certificate Balance of the Class H Certificates. |
THE INFORMATION IN THIS STRUCTURAL AND COLLATERAL TERM SHEET IS NOT COMPLETE AND MAY BE AMENDED PRIOR TO THE TIME OF SALE. THIS TERM SHEET IS NOT AN OFFER TO SELL THESE SECURITIES AND IT IS NOT A SOLICITATION OF AN OFFER TO BUY THESE SECURITIES IN ANY JURISDICTION WHERE THE OFFER OR SALE IS NOT PERMITTED.
| 5 |
COMM 2015-CCRE27 Mortgage Trust
| STRUCTURE OVERVIEW |
| Class A-2 Principal Paydown(1) |
Mortgage | Mortgage Loan | Property Type | Cut-off Date Balance | Remaining Term to Maturity (Mos.) | Cut-off Date LTV Ratio | U/W | U/W NOI | |||||||
| GACC | The Phenix at Infinity Park II | Multifamily | $14,250,000 | 58 | 71.6% | 1.34x | 8.3% | |||||||
| GACC | Atlanta Multifamily Portfolio | Multifamily | $45,000,000 | 59 | 64.9% | 1.30x | 8.3% | |||||||
| BNYM | WHG Extended Stay Portfolio | Hospitality | $15,500,000 | 60 | 70.5% | 1.95x | 13.7% |
| (1) | This table reflects the mortgage loans whose balloon payments will be applied to pay down the Class A-2 Certificates, assuming (i) that none of the mortgage loans experience prepayments, defaults or losses, (ii) there are no extensions of maturity dates and (iii) each mortgage loan is paid in full on its stated maturity date, or in the case of any mortgage loan with an anticipated repayment date, on such repayment date. See “Yield and Maturity Considerations—Yield Considerations” in the Free Writing Prospectus. |
| (2) | With respect to the Atlanta Multifamily Portfolio Mortgage Loan, representing approximately 4.8% of the initial outstanding pool balance, following an initial interest only period of 18 months, the mortgage loan amortizes based on a non-standard amortization schedule and the U/W NCF DSCR for such Mortgage Loan was calculated based on the debt service for the first 12 amortizing payments. For additional information, see Annex H to the Free Writing Prospectus. |
THE INFORMATION IN THIS STRUCTURAL AND COLLATERAL TERM SHEET IS NOT COMPLETE AND MAY BE AMENDED PRIOR TO THE TIME OF SALE. THIS TERM SHEET IS NOT AN OFFER TO SELL THESE SECURITIES AND IT IS NOT A SOLICITATION OF AN OFFER TO BUY THESE SECURITIES IN ANY JURISDICTION WHERE THE OFFER OR SALE IS NOT PERMITTED.
| 6 |
COMM 2015-CCRE27 Mortgage Trust
| STRUCTURE OVERVIEW |
| Principal Payments: | Payments in respect of principal of the Certificates will be distributed,first, to the Class A-SB Certificates, until the Certificate Balance of such Class is reduced to the planned principal balance for the related Distribution Date set forth on Annex A-3 to the Free Writing Prospectus,then, to the Class A-1, Class A-2, Class A-3, Class A-4, Class A-SB, Class A-M, Class B, Class C, Class D, Class E, Class F, Class G and Class H Certificates, in that order, until the Certificate Balance of each such Class is reduced to zero. Notwithstanding the foregoing, if the total principal balance of the Class A-M, Class B, Class C, Class D, Class E, Class F, Class G and Class H Certificates have been reduced to zero as a result of loss allocation, payments in respect of principal of the Certificates will be distributed,first, to the Class A-1, Class A-2, Class A-SB, Class A-3 and Class A-4 Certificates, on apro rata basis, based on the Certificate Balance of each such Class,then, to the extent of any recoveries on realized losses, to the Class A-M, Class B, Class C, Class D, Class E, Class F, Class G and Class H Certificates, in that order, in each case until the Certificate Balance of each such Class is reduced to zero (or previously allocated realized losses have been fully reimbursed). | |
| Each Class of Class X Certificates will not be entitled to receive distributions of principal; however, (i) the notional amount of the Class X-A Certificates will be reduced by the aggregate amount of principal distributions and realized losses allocated to the Class A-1, Class A-2, Class A-SB, Class A-3, Class A-4 and Class A-M Certificates; (ii) the notional amount of the Class X-B Certificates will be reduced by the aggregate amount of principal distributions and realized losses allocated to the Class B and Class C Certificates; (iii) the notional amount of the Class X-C Certificates will be reduced by the principal distributions and realized losses allocated to the Class D Certificates; (iv) the notional amount of the Class X-D Certificates will be reduced by the aggregate amount of principal distributions and realized losses allocated to the Class E and Class F Certificates; (v) the notional amount of the Class X-E Certificates will be reduced by the principal distributions and realized losses allocated to the Class G Certificates and (vi) the notional amount of the Class X-F Certificates will be reduced by the principal distributions and realized losses allocated to the Class H Certificates. | ||
| Interest Payments: | On each Distribution Date, interest accrued for each Class of the Certificates at the applicable pass-through rate will be distributed in the following order of priority, to the extent of available funds:first, to the Class A-1, Class A-2, Class A-SB, Class A-3, Class A-4, Class X-A, Class X-B, Class X-C, Class X-D, Class X-E and Class X-F Certificates, on apro rata basis, based on the accrued and unpaid interest on each such Class andthen, to the Class A-M, Class B, Class C, Class D, Class E, Class F, Class G and Class H Certificates, in that order, in each case until the interest payable to each such Class is paid in full. | |
| The pass-through rates applicable to the Class A-1, Class A-2, Class A-SB, Class A-3, Class A-4, Class A-M, Class B, Class C, Class D, Class E, Class F, Class G and Class H Certificates for each Distribution Date will equal one of: (i) a fixedper annum rate, (ii) the weighted average of the net mortgage rates on the mortgage loans (in each case, adjusted, if necessary, to accrue on the basis of a 360-day year consisting of twelve 30-day months) as of their respective due dates in the month preceding the month in which such distribution date occurs, (iii) a rate equal to the lesser of a specified pass-through rate and the weighted average of the net mortgage rates on the mortgage loans (in each case, adjusted, if necessary, to accrue on the basis of a 360-day year consisting of twelve 30-day months) as of their respective due dates in the month preceding the month in which such distribution date occurs or (iv) the weighted average of the net mortgage rates on the mortgage loans (in each case, adjusted, if necessary, to accrue on the basis of a 360-day year consisting of twelve 30-day months) as of their respective due dates in the month preceding the month in which such distribution date occurs, less a specified rate. | ||
| As further described in the Free Writing Prospectus, the pass-through rates applicable to the Class X Certificates for each Distribution Date will generally be equal to the excess of (i) the weighted average of the net mortgage rates on the mortgage loans (in each case, adjusted, if necessary, to accrue on the basis of a 360-day year consisting of twelve 30-day months) as of their respective due dates in the month preceding the month in which such distribution date occurs over (ii) (A) with respect to the Class X-A Certificates, the weighted average of the pass-through rates of the Class A-1, Class A-2, Class A-SB, Class A-3, Class A-4 and Class A-M Certificates (based on their Certificate Balances), (B) with respect to the Class X-B Certificates, the weighted average of the pass-through rates of the Class B and Class C Certificates (based on their Certificate Balances), (C) with respect to the Class X-C Certificates, the pass-through rate of the Class D Certificates, (D) with respect to the Class X- |
THE INFORMATION IN THIS STRUCTURAL AND COLLATERAL TERM SHEET IS NOT COMPLETE AND MAY BE AMENDED PRIOR TO THE TIME OF SALE. THIS TERM SHEET IS NOT AN OFFER TO SELL THESE SECURITIES AND IT IS NOT A SOLICITATION OF AN OFFER TO BUY THESE SECURITIES IN ANY JURISDICTION WHERE THE OFFER OR SALE IS NOT PERMITTED.
| 7 |
COMM 2015-CCRE27 Mortgage Trust
| STRUCTURE OVERVIEW |
| D Certificates, the weighted average of the pass-through rates of the Class E and Class F Certificates (based on their Certificate Balances), (E) with respect to the Class X-E Certificates, the pass-through rate of the Class G Certificates and (F) with respect to the Class X-F Certificates, the pass-through rate of the Class H Certificates. | ||
| Prepayment Interest Shortfalls: | Prepayment interest shortfalls will be allocatedpro rata based on interest entitlements, in reduction of the interest otherwise payable with respect to each of the interest-bearing Classes of Certificates. | |
| Loss Allocation: | Losses will be allocated to each Class of Certificates entitled to principal in reverse alphabetical order starting with Class H through and including Class A-M and then to Class A-1, Class A-2, Class A-SB, Class A-3 and Class A-4 Certificates on apro ratabasis based on the Certificate Balance of each such Class. The notional amount of any Class of Class X Certificates will be reduced by the aggregate amount of realized losses allocated to the Certificates that are components of the notional amount of such Class of Class X Certificates. | |
| Prepayment Premiums: | A percentage of all prepayment premiums (either fixed prepayment premiums or yield maintenance amounts) collected on the Mortgage Loans will be allocated to each of the Class A-1, Class A-2, Class A-SB, Class A-3, Class A-4, Class A-M, Class B, Class C and Class D Certificates (the “YM P&I Certificates”) then entitled to principal distributions, which percentage will be equal to the product of (a) a fraction, not greater than one, the numerator of which is the amount of principal distributed to such Class on such Distribution Date and the denominator of which is the total amount of principal distributed to the holders of the Class A-1, Class A-2, Class A-SB, Class A-3, Class A-4, Class A-M, Class B, Class C, Class D, Class E, Class F, Class G and Class H Certificates on such Distribution Date, and (b) a fraction (expressed as a percentage which can be no greater than 100% nor less than 0%), the numerator of which is the excess of the pass-through rate of each such Class of Certificates currently receiving principal over the relevant Discount Rate, and the denominator of which is the excess of the Mortgage Rate of the related Mortgage Loan over the relevant Discount Rate. | |
| Prepayment Premium Allocation Percentage for all YM P&I Certificates = |
| (Pass-Through Rate - Discount Rate) | X | The percentage of the principal distribution amount to such Class as described in (a) above | ||
| (Mortgage Rate - Discount Rate) |
| The remaining percentage of the prepayment premiums will be allocated to the Class X-A, Class X-B, Class X-C, Class X-D, Class X-E and Class X-F Certificates in the manner described in the Free Writing Prospectus. In general, this formula provides for an increase in the percentage of prepayment premiums allocated to the YM P&I Certificates then entitled to principal distributions relative to the Class X-A, Class X-B, Class X-C, Class X-D, Class X-E and Class X-F Certificates as Discount Rates decrease and a decrease in the percentage allocated to such Classes as Discount Rates rise. | ||
| Loan Combinations: | The Mortgaged Property identified on Annex A–1 to the Free Writing Prospectus as 11 Madison Avenue secures (i) a Mortgage Loan evidenced by a promissory note designated as Note A-1-C2 with an outstanding principal balance as of the Cut-off Date of $70,000,000 (the “11 Madison Avenue Mortgage Loan”), representing approximately 7.5% of the Initial Outstanding Pool Balance. The 11 Madison Avenue Loan Combination (as defined below) is evidenced by: (i) one promissory Note A-1-C2 that evidences the 11 Madison Avenue Mortgage Loan; (ii) ninepari passu promissory notes designated as Note A-1-S1, Note A-1-S2, Note A-1-S3, Note A-2-S1, Note A-2-S2, Note A-2-S3, Note A-3-S1, Note A-3-S2 and Note A-3-S3, respectively, having an aggregate outstanding principal balance as of the Cut-off Date of $397,530,000 (the “11 Madison Avenue StandalonePari Passu Companion Loans”), each of which is generallypari passu in right of payment with the 11 Madison Avenue Mortgage Loan and the 11 Madison Avenue Non-StandalonePari Passu Companion Loans (as defined below); (iii) sixpari passu promissory notes designated as Note A-1-C1, Note A-1-C3, Note A-2-C1, Note A-2-C2, Note A-3-C1 and Note A-3-C2, respectively, having an aggregate outstanding principal balance as of the Cut-off Date of $296,800,000 (the “11 Madison Avenue Non-StandalonePari Passu Companion Loans” and, together with the 11 Madison Avenue StandalonePari Passu Companion Loans, the “11 Madison AvenuePari Passu Companion Loans”), each of which is generallypari passu in right of payment with the 11 Madison Avenue Mortgage Loan and the 11 Madison Avenue StandalonePari Passu Companion Loans; and (iv) three promissory notes designated as Note B-1-S, Note B-2-S and |
THE INFORMATION IN THIS STRUCTURAL AND COLLATERAL TERM SHEET IS NOT COMPLETE AND MAY BE AMENDED PRIOR TO THE TIME OF SALE. THIS TERM SHEET IS NOT AN OFFER TO SELL THESE SECURITIES AND IT IS NOT A SOLICITATION OF AN OFFER TO BUY THESE SECURITIES IN ANY JURISDICTION WHERE THE OFFER OR SALE IS NOT PERMITTED.
| 8 |
COMM 2015-CCRE27 Mortgage Trust
| STRUCTURE OVERVIEW |
| Note B-3-S, respectively, with an aggregate outstanding principal balance as of the Cut-off Date of $310,670,000 (together, the “11 Madison Avenue Subordinate Companion Loans” and, together with the 11 Madison AvenuePari Passu Companion Loans, the “11 Madison Avenue Companion Loans”), which are subordinate in right of payment in respect of each of the 11 Madison Avenue Mortgage Loan and the 11 Madison AvenuePari Passu Companion Loans. The 11 Madison Avenue StandalonePari Passu Companion Loans and the 11 Madison Avenue Subordinate Companion Loans are collectively referred to as the “11 Madison Avenue Standalone Companion Loans”) | ||
| The 11 Madison Avenue Subordinate Companion Loans, together with the 11 Madison Avenue Mortgage Loan and the 11 Madison AvenuePari Passu Companion Loans, are referred to as the “11 Madison Avenue Loan Combination”. Only the 11 Madison Avenue Mortgage Loan is included in the Issuing Entity. Each of the 11 Madison Avenue StandalonePari Passu Companion Loans and 11 Madison Avenue Subordinate Companion Loans has been included in the MAD 2015-11MD Mortgage Trust. The 11 Madison Avenue Non-StandalonePari Passu Companion Loans are currently being held as follows: (i) Note A-1-C1 has been contributed by GACC to the COMM 2015-CCRE26 securitization and Note A-1-C3 is currently being held by GACC, (ii) Note A-2-C1 and Note A-2-C2 are currently being held by Morgan Stanley Bank, N.A. and (iii) Note A-3-C1 and Note A-3-C2 are currently being held by Wells Fargo. | ||
| The 11 Madison Avenue Loan Combination will be serviced pursuant to the MAD 2015-11MD pooling and servicing agreement and the related intercreditor agreement. For additional information regarding the 11 Madison Avenue Loan Combination, see“Description of the Mortgage Pool—Loan Combinations—11 Madison Avenue Loan Combination”in the Free Writing Prospectus. | ||
| The portfolio of Mortgaged Properties identified on Annex A–1 to the Free Writing Prospectus as NMS Los Angeles Multifamily Portfolio secures (i) a Mortgage Loan evidenced by a promissory note designated as Note A-1, with an outstanding principal balance as of the Cut–off Date of $65,000,000 (the “NMS Los Angeles Multifamily Portfolio Mortgage Loan”), representing approximately 7.0% of the Initial Outstanding Pool Balance, (ii) a promissory note designated as Note A-2 (the “NMS Los Angeles Multifamily Portfolio Note A-2 Companion Loan”), with an outstanding principal balance as of the Cut-off Date of $30,000,000, which is currently held by CCRE or an affiliate and (iii) a promissory note designated as Note A-3 (together with the NMS Los Angeles Multifamily Portfolio Note A-2 Companion Loan, the “NMS Los Angeles Multifamily Portfolio Companion Loans”), with an outstanding principal balance as of the Cut-off Date of $25,000,000, which is currently held by CCRE or an affiliate. The NMS Los Angeles Multifamily Portfolio Mortgage Loan and the NMS Los Angeles Multifamily Portfolio Companion Loans arepari passu in right of payment and are collectively referred to herein as the “NMS Los Angeles Multifamily Portfolio Loan Combination”. | ||
| The NMS Los Angeles Multifamily Portfolio Loan Combination is being serviced pursuant to the COMM 2015-CCRE27 pooling and servicing agreement and the related intercreditor agreement. For additional information regarding the NMS Los Angeles Multifamily Portfolio Loan Combination, see“Description of the Mortgage Pool—Loan Combinations—NMS Los Angeles Multifamily Portfolio Loan Combination”in the Free Writing Prospectus. | ||
| The 11 Madison Avenue Mortgage Loan is referred to as a “Non-Serviced Mortgage Loan” and the 11 Madison Avenue Loan Combination is referred to as a “Non-Serviced Loan Combination”. The NMS Los Angeles Multifamily Portfolio Loan Combination is referred to as a “Serviced Loan Combination”. | ||
| Control Rights and Directing Holder: | Controlling Class Certificateholders will have certain control rights over servicing matters with respect to each Mortgage Loan (other than Non-Serviced Mortgage Loans) and Serviced Loan Combinations. The majority owner or appointed representative of the Class of Control Eligible Certificates that is the Controlling Class (such owner or representative, the “Directing Holder”), will be entitled to direct the Special Servicer to take, or refrain from taking certain actions with respect to a Mortgage Loan (other than Non-Serviced Mortgage Loans) and Serviced Loan Combinations. Furthermore, the Directing Holder will also have the right to receive notice and consent to certain material actions that the Master Servicer and the Special Servicer proposes to take with respect to such Mortgage Loan (other than Non-Serviced Mortgage Loans) and Serviced Loan Combinations. |
THE INFORMATION IN THIS STRUCTURAL AND COLLATERAL TERM SHEET IS NOT COMPLETE AND MAY BE AMENDED PRIOR TO THE TIME OF SALE. THIS TERM SHEET IS NOT AN OFFER TO SELL THESE SECURITIES AND IT IS NOT A SOLICITATION OF AN OFFER TO BUY THESE SECURITIES IN ANY JURISDICTION WHERE THE OFFER OR SALE IS NOT PERMITTED.
| 9 |
COMM 2015-CCRE27 Mortgage Trust
| STRUCTURE OVERVIEW |
| It is expected that RREF II CMBS AIV, LP or its affiliate will be the initial Directing Holder with respect to each Mortgage Loan (other than Non-Serviced Mortgage Loans) and Serviced Loan Combination. | ||
| For a description of the directing holder for each Non-Serviced Loan Combination see“Description of the Mortgage Pool—Loan Combinations” and “Description of the Pooling and Servicing Agreement—The Directing Holder”in theFree Writing Prospectus. | ||
| Control Eligible Certificates: | Class E, Class F, Class G and Class H Certificates. | |
| Controlling Class: | The Controlling Class will be the most subordinate Class of Control Eligible Certificates then outstanding that has an aggregate Certificate Balance, as notionally reduced by any Appraisal Reduction Amounts allocable to such Class, equal to no less than 25% of the initial Certificate Balance of such Class. | |
| The Controlling Class as of the Settlement Date will be the Class H Certificates. | ||
| Appraised-Out Class: | Any Class of Control Eligible Certificates that has been determined, as a result of Appraisal Reductions Amounts allocable to such Class, to no longer be the Controlling Class. | |
| Remedies Available to Holders | ||
| of an Appraised-Out Class: | Holders of the majority of any Class of Control Eligible Certificates that is determined at any time of determination to no longer be the Controlling Class as a result of an allocation of an Appraisal Reduction Amounts in respect of such Class will have the right, at their sole expense, to require the Special Servicer to order a second appraisal for any Mortgage Loan (other than Non-Serviced Mortgage Loans) for which an Appraisal Reduction Event has occurred. Upon receipt of the second appraisal, the Special Servicer will be required to determine, in accordance with the Servicing Standard, whether, based on its assessment of the second appraisal, a recalculation of the Appraisal Reduction Amount is warranted. If warranted, the Special Servicer will direct the Master Servicer to recalculate the Appraisal Reduction Amount based on the second appraisal, and if required by such recalculation, the Special Servicer will reinstate the Appraised-Out Class as the Controlling Class. The Holders of an Appraised-Out Class requesting a second appraisal will not be entitled to exercise any rights of the Controlling Class until such time, if any, as the Class is reinstated as the Controlling Class. | |
| Control Termination Event: | Will occur with respect to any Mortgage Loan (other than the Non-Serviced Mortgage Loans) or Serviced Loan Combination when no Class of Control Eligible Certificates has an aggregate Certificate Balance (as notionally or actually reduced by any Appraisal Reduction Amounts and Realized Losses) equal to or greater than 25% of the initial Certificate Balance of such Class. | |
| Upon the occurrence and the continuance of a Control Termination Event, the Directing Holder will no longer have any Control Rights. The Directing Holder will no longer have the right to direct certain actions of the Special Servicer and will no longer have consent rights with respect to certain material actions that the Master Servicer or Special Servicer proposes to take with respect to a Mortgage Loan. | ||
| Upon the occurrence and continuation of a Control Termination Event, the Directing Holder will retain non-binding consultation rights with respect to certain material actions that the Special Servicer proposes to take with respect to a Mortgage Loan (other than Non-Serviced Mortgage Loans) and Serviced Loan Combinations. Such consultation rights will continue until the occurrence of a Consultation Termination Event. | ||
| Consultation Termination Event: | Will occur with respect to any Mortgage Loan (other than Non-Serviced Mortgage Loans) and Serviced Loan Combinations when, without giving regard to the application of any Appraisal Reduction Amounts (i.e., giving effect to principal reduction through Realized Losses only), there is no Class of Control Eligible Certificates that has an aggregate Certificate Balance equal to 25% or more of the initial Certificate Balance of such Class. | |
| Upon the occurrence and continuance of a Consultation Termination Event the Directing Holder will have no rights under the Pooling and Servicing Agreement other than those rights that all Certificateholders have. |
THE INFORMATION IN THIS STRUCTURAL AND COLLATERAL TERM SHEET IS NOT COMPLETE AND MAY BE AMENDED PRIOR TO THE TIME OF SALE. THIS TERM SHEET IS NOT AN OFFER TO SELL THESE SECURITIES AND IT IS NOT A SOLICITATION OF AN OFFER TO BUY THESE SECURITIES IN ANY JURISDICTION WHERE THE OFFER OR SALE IS NOT PERMITTED.
| 10 |
COMM 2015-CCRE27 Mortgage Trust
| STRUCTURE OVERVIEW |
| Appointment and Replacement | ||
| of Special Servicer: | The Directing Holder will appoint the initial Special Servicer with respect to each Mortgage Loan (other than a Non-Serviced Mortgage Loan) and each Serviced Loan Combination as of the Settlement Date. Prior to the occurrence and continuance of a Control Termination Event, the Directing Holder generally may replace the Special Servicer with respect to each Mortgage Loan (other than a Non-Serviced Mortgage Loan) and each Serviced Loan Combination with or without cause at any time. | |
| Upon the occurrence and during the continuance of a Control Termination Event, the Directing Holder will no longer have the right to replace the Special Servicer and such replacement (other than with respect to the Non-Serviced Loan Combinations) will occur based on a vote of holders of all voting eligible Classes of Certificates as described below. See“Description of the Mortgage Pool—Loan Combinations” and “Description of the Pooling and Servicing Agreement”in theFree Writing Prospectus for a description of the special servicer appointment and replacement rights with respect to Non-Serviced Loan Combinations. | ||
| Replacement of Special Servicer | ||
| by Vote of Certificateholders: | Other than with respect to Non-Serviced Loan Combinations, if a Control Termination Event has occurred and is continuing, upon (i) the written direction of holders of Certificates evidencing not less than 25% of the voting rights of all Classes of Certificates entitled to principal (taking into account the application of Appraisal Reduction Amounts to notionally reduce the Certificate Balances of Classes to which such Appraisal Reduction Amounts are allocable) requesting a vote to replace the Special Servicer with a replacement Special Servicer, (ii) payment by such requesting holders to the Certificate Administrator of all reasonable fees and expenses to be incurred by the Certificate Administrator in connection with administering such vote and (iii) delivery by such holders to the Certificate Administrator of written confirmations from each Rating Agency that the appointment of the replacement Special Servicer will not result in a downgrade of the Certificates, the Certificate Administrator will be required to promptly provide written notice to all certificateholders of such request and conduct the solicitation of votes of all Certificates in such regard. Upon the written direction (within 180 days) of (i) Holders of at least 75% of a Certificateholder Quorum or (ii) the Holders of more than 50% of the voting rights of each Class of Non-Reduced Certificates, the Trustee will immediately replace the Special Servicer with the replacement Special Servicer (other than with respect to Non-Serviced Loan Combinations). | |
| “Certificateholder Quorum” means, in connection with any solicitation of votes in connection with the replacement of the Special Servicer as described above, the holders of Certificates evidencing at least 75% of the aggregate voting rights (taking into account Realized Losses and the application of any Appraisal Reduction Amounts to notionally reduce the Certificate Balance of the Certificates) of all classes of Certificates entitled to principal, on an aggregate basis. | ||
| In addition, after the occurrence of a Consultation Termination Event, if the Operating Advisor determines that the Special Servicer is not performing its duties in accordance with the Servicing Standard, the Operating Advisor will have the right to recommend the replacement of the Special Servicer (other than with respect to Non-Serviced Loan Combinations). The Operating Advisor’s recommendation to replace the Special Servicer (other than with respect Non-Serviced Loan Combinations) must be confirmed by a majority of the voting rights of all Classes of Certificates entitled to principal (taking into account the application of Appraisal Reduction Amounts to notionally reduce the Certificate Balances of Classes to which such Appraisal Reduction Amounts are allocable) within 180 days from the time such recommendation is posted to the Certificate Administrator website and is subject to the receipt of written confirmations from each Rating Agency that the appointment of the replacement Special Servicer will not result in a downgrade of the Certificates. | ||
| See“Description of the Mortgage Pool—Loan Combinations”and “Description of the Poolingand Servicing Agreement”in theFree Writing Prospectus for a description of the special servicer appointment and replacement rights with respect to Non-Serviced Loan Combinations. |
THE INFORMATION IN THIS STRUCTURAL AND COLLATERAL TERM SHEET IS NOT COMPLETE AND MAY BE AMENDED PRIOR TO THE TIME OF SALE. THIS TERM SHEET IS NOT AN OFFER TO SELL THESE SECURITIES AND IT IS NOT A SOLICITATION OF AN OFFER TO BUY THESE SECURITIES IN ANY JURISDICTION WHERE THE OFFER OR SALE IS NOT PERMITTED.
| 11 |
COMM 2015-CCRE27 Mortgage Trust
| STRUCTURE OVERVIEW |
| Cap on Workout and Liquidation | ||
| Fees: | The workout fees and liquidation fees payable to a Special Servicer under the Pooling and Servicing Agreement will be an amount equal to the lesser of: (1) 1.0% of each collection of interest and principal following a workout or liquidation and (2) $1,000,000 per workout or liquidation. All Modification Fees actually paid to the Special Servicer in connection with a workout or liquidation or in connection with any prior workout or partial liquidation that occurred within the prior 18 months will be deducted from the total workout and/or liquidation fees payable (other than Modification Fees earned while the Mortgage Loan was not in special servicing). In addition, the total amount of workout and liquidation fees actually payable by the Trust under the Pooling and Servicing Agreement will be capped in the aggregate at $1,000,000 for each related Mortgage Loan. If a new special servicer begins servicing the related Mortgage Loan, all amounts paid to the prior special servicer will be disregarded for purposes of calculating the cap. | |
| Special Servicer Compensation: | The special servicing fee will equal 0.25% per annum of the stated principal balance of the related specially serviced loan or REO property, as applicable. The Special Servicer and its affiliates will be prohibited from receiving or retaining any compensation or any other remuneration under the Pooling and Servicing Agreement (including in the form of commissions, brokerage fees, rebates, or as a result of any other fee-sharing arrangement) from any person (including the issuing entity, any borrower, any manager, any guarantor or indemnitor in respect of a Mortgage Loan or Serviced Loan Combination, if any, and any purchaser of any Mortgage Loan, Serviced Companion Loan or REO Property) in connection with the disposition, workout or foreclosure of any Mortgage Loan or Serviced Loan Combination, the management or disposition of any REO Property, or the performance of any other special servicing duties under the Pooling and Servicing Agreement, other than as expressly permitted in the Pooling and Servicing Agreement and other than commercially reasonable treasury management fees, banking fees and insurance commissions or fees received or retained by the Special Servicer or any of its affiliates in connection with any services performed by such party with respect to any mortgage loan. Subject to certain limited exceptions, the Special Servicer will also be required to report any compensation or other remuneration the Special Servicer or its affiliates have received from any person and such information will be disclosed in the Certificateholders’ monthly distribution date statement. | |
| Operating Advisor: | With respect to the Mortgage Loans (other than with respect to Non-Serviced Loan Combinations) and prior to the occurrence of a Control Termination Event, the Operating Advisor will have access to any final asset status report and all information available with respect to the transaction on the Certificate Administrator’s website but will not have any approval or consultation rights. After the occurrence and during the continuance of a Control Termination Event, the Operating Advisor will have consultation rights with respect to certain major decisions and will have additional monitoring responsibilities on behalf of the entire trust. | |
| The Operating Advisor will be subject to termination if holders of at least 15% of the aggregate voting rights of the Certificates (in connection with termination and replacement relating to the Mortgage Loans) vote to terminate and replace the Operating Advisor and such vote is approved by holders of more than 50% of the applicable voting rights that exercise their right to vote, provided that holders of at least 50% of the applicable voting rights have exercised their right to vote. The holders initiating such vote will be responsible for the fees and expenses in connection with the vote and replacement. | ||
| The Operating Advisor will not have consultation rights in respect of Non-Serviced Loan Combinations. | ||
| Liquidated Loan Waterfall: | On liquidation of any Mortgage Loan, all net liquidation proceeds will be applied so that amounts allocated as a recovery of accrued and unpaid interest will not, in the first instance, include any amount by which the interest portion of P&I Advances previously made was reduced as a result of Appraisal Reduction Amounts. After the adjusted interest amount is so allocated, any remaining net liquidation proceeds will be allocated to pay principal on the Mortgage Loan until the unpaid principal amount of the Mortgage Loan has been reduced to zero. Any remaining liquidation proceeds would then be allocated as a recovery of accrued and unpaid interest corresponding to the amount by which the interest portion of P&I Advances previously made was reduced as a result of Appraisal Reduction Amounts. |
THE INFORMATION IN THIS STRUCTURAL AND COLLATERAL TERM SHEET IS NOT COMPLETE AND MAY BE AMENDED PRIOR TO THE TIME OF SALE. THIS TERM SHEET IS NOT AN OFFER TO SELL THESE SECURITIES AND IT IS NOT A SOLICITATION OF AN OFFER TO BUY THESE SECURITIES IN ANY JURISDICTION WHERE THE OFFER OR SALE IS NOT PERMITTED.
| 12 |
COMM 2015-CCRE27 Mortgage Trust
|
| OVERVIEW OF MORTGAGE POOL CHARACTERISTICS |
Distribution of Cut-off Date Balances(1)(2) |
| Range of Cut-off Date Balances | Number of Mortgage Loans | Aggregate Cut-off Date Balance | % of Initial Pool | Weighted Averages | ||||||
| Mortgage Rate | Stated Remaining Term (Mos.)(3) | U/W NCF DSCR | Cut-off Date LTV Ratio(4)(5) | Maturity Date or ARD LTV(4)(5) | ||||||
| $966,058 | - | $7,499,999 | 28 | $118,293,275 | 12.7% | 4.5902% | 119 | 1.64x | 67.8% | 57.4% |
| $7,500,000 | - | $14,999,999 | 18 | $199,823,491 | 21.4% | 4.6004% | 115 | 1.64x | 68.9% | 60.1% |
| $15,000,000 | - | $24,999,999 | 9 | $168,853,099 | 18.1% | 4.5504% | 114 | 1.71x | 69.7% | 61.0% |
| $25,000,000 | - | $49,999,999 | 7 | $246,734,951 | 26.5% | 4.5244% | 108 | 1.52x | 68.0% | 60.0% |
| $50,000,000 | - | $70,000,000 | 3 | $197,912,576 | 21.2% | 4.2193% | 119 | 2.31x | 54.2% | 50.2% |
| Total/Weighted Average | 65 | $931,617,393 | 100.0% | 4.4889% | 114 | 1.77x | 65.5% | 57.8% | ||
Distribution of Mortgage Rates(1)(2) |
| Range of Mortgage Rates | Number of Mortgage Loans | Aggregate Cut-off Date Balance | % of Initial Outstanding Pool Balance | Weighted Averages | ||||||
| Mortgage Rate | Stated Remaining Term (Mos.)(3) | U/W NCF DSCR | Cut-off Date LTV Ratio(4)(5) | Maturity Date or ARD LTV(4)(5) | ||||||
| 3.5602% | - | 4.2499% | 6 | $190,965,889 | 20.5% | 3.9706% | 119 | 2.73x | 50.9% | 45.2% |
| 4.2500% | - | 4.4999% | 15 | $214,798,647 | 23.1% | 4.3536% | 115 | 1.44x | 69.2% | 60.1% |
| 4.5000% | - | 4.7499% | 29 | $299,395,996 | 32.1% | 4.6293% | 119 | 1.66x | 69.2% | 59.2% |
| 4.7500% | - | 5.1100% | 15 | $226,456,860 | 24.3% | 4.8688% | 103 | 1.39x | 69.5% | 64.4% |
| Total/Weighted Average | 65 | $931,617,393 | 100.0% | 4.4889% | 114 | 1.77x | 65.5% | 57.8% | ||
Property Type Distribution(1)(2)(6) |
| Property Type | Number of Mortgaged Properties | Aggregate Date Balance | % of Initial Outstanding Pool Balance | Number of Rooms/ Pads/Units/ NRA/Spaces | Weighted Averages | ||||||
Cut-off Date Unit/NRA/Space | Mortgage Rate | Stated Term | Occupancy | U/W NCF DSCR | Cut-off Ratio(4)(5) | Maturity Date or ARD LTV(4)(5) | |||||
| Multifamily | 29 | $341,141,062 | 36.6% | 5,061 | $138,319 | 4.5950% | 109 | 96.9% | 1.42x | 68.1% | 61.9% |
| Garden | 23 | $224,432,728 | 24.1% | 4,333 | $73,753 | 4.5581% | 103 | 96.1% | 1.49x | 67.3% | 60.2% |
| Mid Rise | 4 | $64,708,333 | 6.9% | 355 | $329,787 | 4.8747% | 119 | 97.6% | 1.30x | 71.4% | 68.2% |
| High Rise | 2 | $52,000,000 | 5.6% | 373 | $178,724 | 4.4062% | 119 | 99.1% | 1.30x | 67.3% | 61.5% |
| Retail | 24 | $181,503,349 | 19.5% | 2,371,940 | $136 | 4.4493% | 119 | 96.0% | 1.52x | 68.3% | 58.0% |
| Anchored(7) | 22 | $161,253,349 | 17.3% | 2,328,842 | $91 | 4.4756% | 119 | 96.1% | 1.50x | 69.0% | 58.2% |
| Unanchored | 2 | $20,250,000 | 2.2% | 43,098 | $496 | 4.2398% | 119 | 94.8% | 1.64x | 62.7% | 56.2% |
| Office | 7 | $167,582,500 | 18.0% | 2,980,966 | $231 | 4.1416% | 119 | 96.3% | 2.56x | 54.0% | 49.2% |
| Suburban | 3 | $87,162,500 | 9.4% | 654,943 | $143 | 4.5307% | 119 | 94.7% | 1.63x | 69.8% | 61.6% |
| CBD | 1 | $70,000,000 | 7.5% | 2,285,043 | $334 | 3.5602% | 119 | 97.8% | 3.89x | 32.5% | 32.5% |
| Medical | 3 | $10,420,000 | 1.1% | 40,980 | $279 | 4.7920% | 119 | 100.0% | 1.41x | 65.7% | 57.7% |
| Hospitality | 14 | $128,579,188 | 13.8% | 1,684 | $126,840 | 4.5320% | 111 | 75.5% | 2.26x | 65.2% | 55.3% |
| Full Service | 3 | $56,924,811 | 6.1% | 467 | $176,805 | 4.5040% | 118 | 77.3% | 2.22x | 64.1% | 52.0% |
| Limited Service | 5 | $37,678,584 | 4.0% | 553 | $76,273 | 4.4790% | 119 | 69.1% | 2.61x | 64.7% | 57.8% |
| Select Service | 1 | $18,475,793 | 2.0% | 117 | $157,913 | 4.5350% | 119 | 85.0% | 1.92x | 64.8% | 52.5% |
| Extended Stay | 5 | $15,500,000 | 1.7% | 547 | $29,220 | 4.7600% | 60 | 73.1% | 1.95x | 70.5% | 64.7% |
| Industrial | 7 | $35,362,500 | 3.8% | 787,462 | $51 | 4.6369% | 119 | 98.8% | 1.38x | 73.2% | 64.4% |
| Manufactured Housing Community | 4 | $30,076,497 | 3.2% | 794 | $39,789 | 4.6637% | 119 | 90.1% | 1.31x | 74.0% | 60.2% |
| Self Storage | 8 | $26,526,010 | 2.8% | 486,075 | $61 | 4.7817% | 119 | 85.3% | 1.49x | 68.8% | 57.8% |
| Parking | 2 | $10,846,286 | 1.2% | 3,189 | $3,544 | 4.7300% | 119 | NAP | 1.99x | 63.2% | 51.6% |
| Mixed Use | 1 | $10,000,000 | 1.1% | 30 | $333,333 | 4.7700% | 120 | 100.0% | 1.50x | 67.6% | 67.6% |
| Total/Weighted Average | 96 | $931,617,393 | 100.0% | 4.4889% | 114 | 93.2% | 1.77x | 65.5% | 57.8% | ||
THE INFORMATION IN THIS STRUCTURAL AND COLLATERAL TERM SHEET IS NOT COMPLETE AND MAY BE AMENDED PRIOR TO THE TIME OF SALE. THIS TERM SHEET IS NOT AN OFFER TO SELL THESE SECURITIES AND IT IS NOT A SOLICITATION OF AN OFFER TO BUY THESE SECURITIES IN ANY JURISDICTION WHERE THE OFFER OR SALE IS NOT PERMITTED.
| 13 |
COMM 2015-CCRE27 Mortgage Trust
|
| OVERVIEW OF MORTGAGE POOL CHARACTERISTICS |
Geographic Distribution(1)(2)(6) |
| State/Location | Number of | Aggregate Cut-off Date Balance | % of Initial Outstanding Pool Balance | Weighted Averages | ||||
| Mortgage Rate | Stated | U/W NCF DSCR | Cut-off Date LTV Ratio(4)(5) | Maturity Date or ARD LTV(4)(5) | ||||
| Texas | 12 | $126,118,259 | 13.5% | 4.3827% | 119 | 1.62x | 66.2% | 56.5% |
| Florida | 11 | $115,142,500 | 12.4% | 4.5769% | 119 | 1.69x | 71.4% | 64.0% |
| California | 9 | $92,986,331 | 10.0% | 4.7433% | 119 | 1.39x | 67.2% | 64.7% |
| Southern(8) | 8 | $88,742,134 | 9.5% | 4.7645% | 119 | 1.39x | 66.9% | 65.0% |
| Northern(8) | 1 | $4,244,197 | 0.5% | 4.3000% | 119 | 1.45x | 73.3% | 58.9% |
| New York | 5 | $89,562,262 | 9.6% | 3.8273% | 119 | 3.37x | 39.9% | 37.5% |
| New York City | 1 | $70,000,000 | 7.5% | 3.5602% | 119 | 3.89x | 32.5% | 32.5% |
| Remaining New York State | 4 | $19,562,262 | 2.1% | 4.7829% | 119 | 1.53x | 66.3% | 55.2% |
| Illinois | 8 | $52,493,290 | 5.6% | 4.4503% | 119 | 1.45x | 70.8% | 59.6% |
| Other | 51 | $455,314,751 | 48.9% | 4.5788% | 109 | 1.62x | 68.0% | 59.0% |
| Total/Weighted Average | 96 | $931,617,393 | 100.0% | 4.4889% | 114 | 1.77x | 65.5% | 57.8% |
Distribution of Cut-off Date LTV Ratios(1)(2)(4)(5) |
| Range of Cut-off Date LTV Ratios | Number of Mortgage Loans | Aggregate Cut-off Date Balance | % of Initial Outstanding Pool Balance | Weighted Averages | ||||||
| Mortgage Rate | Stated Remaining Term (Mos.)(3) | U/W NCF DSCR | Cut-off Date LTV Ratio | Maturity Date or ARD LTV | ||||||
| 32.5% | - | 54.9% | 2 | $84,280,263 | 9.0% | 3.6754% | 119 | 3.74x | 35.4% | 33.8% |
| 55.0% | - | 59.9% | 4 | $11,865,000 | 1.3% | 4.6124% | 119 | 2.07x | 57.8% | 55.2% |
| 60.0% | - | 64.9% | 15 | $248,471,872 | 26.7% | 4.5023% | 108 | 1.82x | 63.2% | 55.3% |
| 65.0% | - | 69.9% | 17 | $300,503,781 | 32.3% | 4.5511% | 119 | 1.48x | 68.4% | 61.0% |
| 70.0% | - | 74.9% | 20 | $197,577,674 | 21.2% | 4.6262% | 110 | 1.44x | 73.0% | 63.1% |
| 75.0% | - | 77.2% | 7 | $88,918,803 | 9.5% | 4.6913% | 120 | 1.37x | 75.5% | 65.7% |
| Total/Weighted Average | 65 | $931,617,393 | 100.0% | 4.4889% | 114 | 1.77x | 65.5% | 57.8% | ||
Distribution of Maturity Date or ARD LTV Ratios(1)(2)(4)(5) |
| Range of Maturity Date or ARD LTV Ratios | Number of Mortgage Loans | Aggregate Cut-off Date Balance | % of Initial Outstanding Pool Balance | Weighted Averages | ||||||
| Mortgage Rate | Stated Remaining Term (Mos.)(3) | U/W NCF DSCR | Cut-off Date LTV Ratio | Maturity Date or ARD LTV | ||||||
| 32.5% | - | 49.9% | 6 | $96,888,859 | 10.4% | 3.8378% | 119 | 3.50x | 38.8% | 35.3% |
| 50.0% | - | 54.9% | 11 | $187,282,616 | 20.1% | 4.4189% | 118 | 1.68x | 64.7% | 52.7% |
| 55.0% | - | 59.9% | 16 | $157,063,898 | 16.9% | 4.4788% | 119 | 1.66x | 67.9% | 57.1% |
| 60.0% | - | 64.9% | 23 | $295,407,020 | 31.7% | 4.5745% | 107 | 1.59x | 69.2% | 62.5% |
| 65.0% | - | 68.8% | 9 | $194,975,000 | 20.9% | 4.7583% | 115 | 1.34x | 72.2% | 67.3% |
| Total/Weighted Average | 65 | $931,617,393 | 100.0% | 4.4889% | 114 | 1.77x | 65.5% | 57.8% | ||
Distribution of Underwritten NCF Debt Service Coverage Ratios(1)(2) |
| Range of Underwritten NCF Debt Service Coverage Ratios | Number of Mortgage Loans | Aggregate Cut-off Date Balance | % of Initial Outstanding Pool Balance | Weighted Averages | ||||||
| Mortgage Rate | Stated Remaining Term (Mos.)(3) | U/W NCF DSCR | Cut-off Date LTV Ratio(4)(5) | Maturity Date or ARD LTV(4)(5) | ||||||
| 1.25x | - | 1.39x | 22 | $364,968,134 | 39.2% | 4.6971% | 109 | 1.31x | 70.7% | 64.0% |
| 1.40x | - | 1.44x | 9 | $85,566,360 | 9.2% | 4.5813% | 119 | 1.43x | 71.0% | 60.9% |
| 1.45x | - | 1.54x | 5 | $81,528,105 | 8.8% | 4.3857% | 118 | 1.52x | 68.6% | 59.4% |
| 1.55x | - | 1.99x | 20 | $251,730,775 | 27.0% | 4.4455% | 115 | 1.75x | 66.2% | 55.2% |
| 2.00x | - | 2.49x | 5 | $40,743,755 | 4.4% | 4.7156% | 119 | 2.22x | 63.0% | 57.5% |
| 2.50x | - | 2.99x | 1 | $3,800,000 | 0.4% | 4.5200% | 120 | 2.57x | 55.9% | 55.9% |
| 3.00x | - | 3.89x | 3 | $103,280,263 | 11.1% | 3.7737% | 119 | 3.67x | 40.2% | 38.8% |
| Total/Weighted Average | 65 | $931,617,393 | 100.0% | 4.4889% | 114 | 1.77x | 65.5% | 57.8% | ||
THE INFORMATION IN THIS STRUCTURAL AND COLLATERAL TERM SHEET IS NOT COMPLETE AND MAY BE AMENDED PRIOR TO THE TIME OF SALE. THIS TERM SHEET IS NOT AN OFFER TO SELL THESE SECURITIES AND IT IS NOT A SOLICITATION OF AN OFFER TO BUY THESE SECURITIES IN ANY JURISDICTION WHERE THE OFFER OR SALE IS NOT PERMITTED.
| 14 |
COMM 2015-CCRE27 Mortgage Trust
|
| OVERVIEW OF MORTGAGE POOL CHARACTERISTICS |
Original Terms to Maturity or ARD(1)(2)(3) |
| Original Terms to Maturity or ARD | Number of Mortgage Loans | Aggregate Cut-off Date Balance | % of Initial Outstanding Pool Balance | Weighted Averages | ||||
| Mortgage Rate | Stated Remaining Term (Mos.) | U/W NCF DSCR | Cut-off Date LTV Ratio(4)(5) | Maturity Date or ARD LTV(4)(5) | ||||
| 60 | 3 | $74,750,000 | 8.0% | 4.7138% | 59 | 1.44x | 67.3% | 63.6% |
| 120 | 62 | $856,867,393 | 92.0% | 4.4693% | 119 | 1.79x | 65.4% | 57.3% |
| Total/Weighted Average | 65 | $931,617,393 | 100.0% | 4.4889% | 114 | 1.77x | 65.5% | 57.8% |
Distribution of Remaining Terms to Maturity or ARD(1)(2)(3) |
| Range of Remaining Terms to Maturity or ARD | Number of Mortgage Loans | Aggregate Cut-off Date Balance | % of Initial Outstanding Pool Balance | Weighted Averages | ||||||
| Mortgage Rate | Stated Remaining Term (Mos.) | U/W NCF DSCR | Cut-off Date LTV Ratio(4)(5) | Maturity Date or ARD LTV(4)(5) | ||||||
| 58 | - | 60 | 3 | $74,750,000 | 8.0% | 4.7138% | 59 | 1.44x | 67.3% | 63.6% |
| 117 | - | 120 | 62 | $856,867,393 | 92.0% | 4.4693% | 119 | 1.79x | 65.4% | 57.3% |
| Total/Weighted Average | 65 | $931,617,393 | 100.0% | 4.4889% | 114 | 1.77x | 65.5% | 57.8% | ||
Distribution of Underwritten NOI Debt Yields(1)(2) |
| Range of Underwritten NOI Debt Yields | Number of Mortgage Loans | Aggregate Cut-off Date Balance | % of Initial Outstanding Pool Balance | Weighted Averages | ||||||
| Mortgage Rate | Stated Remaining Term (Mos.)(3) | U/W NCF DSCR | Cut-off Date LTV Ratio(4)(5) | Maturity Date or ARD LTV(4)(5) | ||||||
| 6.7% | - | 8.9% | 18 | $313,908,669 | 33.7% | 4.6917% | 108 | 1.31x | 70.1% | 64.3% |
| 9.0% | - | 9.9% | 16 | $158,099,878 | 17.0% | 4.6100% | 119 | 1.41x | 72.1% | 61.7% |
| 10.0% | - | 12.4% | 18 | $255,005,897 | 27.4% | 4.3865% | 119 | 1.69x | 65.7% | 56.1% |
| 12.5% | - | 14.9% | 8 | $154,131,872 | 16.5% | 4.1473% | 113 | 2.82x | 51.1% | 45.3% |
| 15.0% | - | 20.2% | 5 | $50,471,076 | 5.4% | 4.4095% | 119 | 2.88x | 59.6% | 52.0% |
| Total/Weighted Average | 65 | $931,617,393 | 100.0% | 4.4889% | 114 | 1.77x | 65.5% | 57.8% | ||
Amortization Types(1)(2) |
| Amortization Type | Number of Mortgage Loans | Aggregate Cut-off Date Balance | % of Initial Outstanding Pool Balance | Weighted Averages | ||||
| Mortgage Rate | Stated Remaining Term (Mos.)(3) | U/W NCF DSCR | Cut-off Date LTV Ratio(4)(5) | Maturity Date or ARD LTV(4)(5) | ||||
| Interest Only, then Amortizing | 28 | $403,141,300 | 43.3% | 4.5609% | 110 | 1.43x | 70.1% | 62.5% |
| Amortizing Balloon | 27 | $315,682,093 | 33.9% | 4.5053% | 116 | 1.71x | 66.8% | 54.2% |
| Interest Only | 8 | $192,319,000 | 20.6% | 4.3142% | 119 | 2.60x | 53.5% | 53.5% |
| Interest Only, then Amortizing, ARD | 2 | $20,475,000 | 2.2% | 4.4600% | 120 | 1.36x | 69.3% | 60.6% |
| Total/Weighted Average | 65 | $931,617,393 | 100.0% | 4.4889% | 114 | 1.77x | 65.5% | 57.8% |
Footnotes:
| (1) | With respect to the 11 Madison Avenue Mortgage Loan and NMS Los Angeles Multifamily Portfolio Mortgage Loan, LTV, DSCR, Debt Yield, and Cut-off Date Balance per Room/Pad/Unit/NRA/Space calculations include the relatedpari passu companion loan(s), but not any related subordinate companion loan(s). |
| (2) | With respect to the Atlanta Multifamily Portfolio Mortgage Loan, representing approximately 4.8% of the initial outstanding pool balance, following an initial interest only period of 18 months, the mortgage loan amortizes based on a non-standard amortization schedule and the U/W NCF DSCR for such Mortgage Loan was calculated based on the debt service for the first 12 amortizing payments. For additional information, see Annex H to the Free Writing Prospectus. |
| (3) | In the case of two mortgage loans with an anticipated repayment date, Original Terms to Maturity or ARD and Remaining Terms to Maturity or ARD are through the related anticipated repayment date. |
| (4) | With respect to two mortgage loans, representing 6.4% of the initial outstanding principal balance, the Cut-off Date LTV Ratio and Maturity Date or ARD LTV have been calculated based on the “as complete” or “as renovated” value. For additional information, see the Footnotes to Annex A-1 in the Free Writing Prospectus. |
| (5) | With respect to the NMS Los Angeles Multifamily Portfolio Mortgage Loan, Sandalwood Portfolio Mortgage Loan and the Midwest Shopping Center Portfolio Mortgage Loan, collectively representing 17.8% of the initial outstanding pool balance, the Cut-off Date LTV and Maturity Date or ARD LTV have been calculated based on the “as portfolio” appraised value, which attributes a premium to the aggregate value of the mortgaged properties as a whole. For additional information, see the Footnotes to Annex A-1 in the Free Writing Prospectus. |
| (6) | Reflects allocated loan amount for properties securing multi-property mortgage loans. |
| (7) | Anchored retail includes anchored, shadow anchored and single tenant properties. |
| (8) | Northern California properties have a zip code greater than 93600. Southern California properties have a zip code less than or equal to 93600. |
THE INFORMATION IN THIS STRUCTURAL AND COLLATERAL TERM SHEET IS NOT COMPLETE AND MAY BE AMENDED PRIOR TO THE TIME OF SALE. THIS TERM SHEET IS NOT AN OFFER TO SELL THESE SECURITIES AND IT IS NOT A SOLICITATION OF AN OFFER TO BUY THESE SECURITIES IN ANY JURISDICTION WHERE THE OFFER OR SALE IS NOT PERMITTED.
| 15 |
COMM 2015-CCRE27 Mortgage Trust
|
| OVERVIEW OF MORTGAGE POOL CHARACTERISTICS |
Ten Largest Mortgage Loans |
Mortgage Loan | Mortgage Loan | City, State | Property Type | Cut-off Date Balance | % of Initial Outstanding Pool Balance | Cut-off Date Balance per Room/Pad/Unit/NRA/ Space(1) | Cut-off Date Ratio(1)(2) | U/W NCF DSCR(1)(3) | U/W NOI Debt Yield(1) |
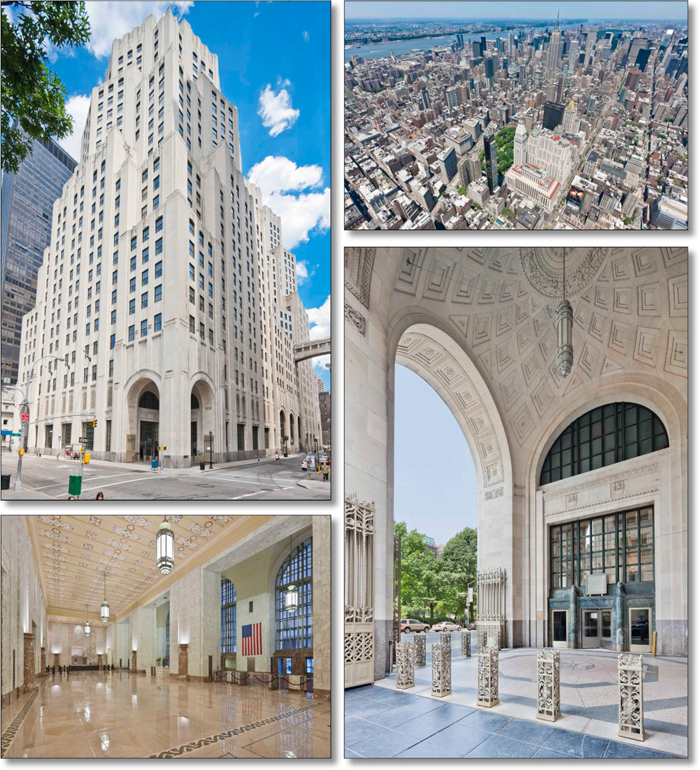
| 11 Madison Avenue | GACC | New York, NY | Office | $70,000,000 | 7.5% | $334 | 32.5% | 3.89x | 14.3% |
| NMS Los Angeles Multifamily Portfolio | CCRE | Various, CA | Multifamily | 65,000,000 | 7.0% | $312,500 | 68.8% | 1.31x | 6.7% |
| Sandalwood Portfolio | GACC | Various, TX | Multifamily | 62,912,576 | 6.8% | $38,268 | 63.3% | 1.60x | 10.2% |
| Atlanta Multifamily Portfolio | GACC | Various, GA | Multifamily | 45,000,000 | 4.8% | $76,531 | 64.9% | 1.30x | 8.3% |
| The Drake | BNYM | Washington, DC | Multifamily | 44,000,000 | 4.7% | $201,835 | 67.4% | 1.28x | 7.7% |
| Midwest Shopping Center Portfolio | GACC | Various, Various | Retail | 38,152,658 | 4.1% | $43 | 67.4% | 1.53x | 10.3% |
| Intellicenter | KeyBank | Tampa, FL | Office | 33,562,500 | 3.6% | $165 | 75.0% | 1.44x | 9.3% |
| Hotel deLuxe | BNYM | Portland, OR | Hospitality | 32,419,793 | 3.5% | $249,383 | 68.7% | 1.85x | 12.8% |
| Green Valley Corporate Center | BNYM | Henderson, NV | Office | 27,000,000 | 2.9% | $166 | 63.9% | 1.96x | 12.4% |
| Chase Park | GACC | Austin, TX | Office | 26,600,000 | 2.9% | $92 | 69.3% | 1.54x | 10.5% |
| Total/Weighted Average | $444,647,528 | 47.7% | 61.8% | 1.87x | 10.2% | ||||
| (1) | With respect to the 11 Madison Avenue Mortgage Loan and the NMS Los Angeles Multifamily Portfolio Mortgage Loan, LTV, DSCR, Debt Yield and Cut-off Date Balance per Room/Pad/Unit/NRA/Space calculations include the relatedpari passu companion loan(s) but not any related subordinate companion loan(s). |
| (2) | With respect to the NMS Multifamily Portfolio Mortgage Loan, Sandalwood Portfolio Mortgage Loan and the Midwest Shopping Center Portfolio Mortgage Loan, the Cut-off Date LTV Ratio has been calculated based on the “as portfolio” appraised value, which attributes a premium to the aggregate value of the mortgaged properties as a whole. With respect to the Atlanta Multifamily Portfolio Mortgage Loan, the Cut-off Date LTV Ratio has been calculated based on the “as renovated” appraised value, which takes into account renovations being performed at the mortgaged properties. |
| (3) | With respect to the Atlanta Multifamily Portfolio Mortgage Loan, representing approximately 4.8% of the initial outstanding pool balance, following an initial interest only period of 18 months, the mortgage loan amortizes based on a non-standard amortization schedule and the U/W NCF DSCR for such Mortgage Loan was calculated based on the debt service for the first 12 amortizing payments. For additional information, see Annex H to the Free Writing Prospectus. |
Pari Passu Companion Loan Summary |
| Mortgage Loan | Mortgage Loan Cut-off Date | Companion Cut-off Date | Loan Combination Cut-off Date Balance |
Pooling & Servicing Agreement | Master Servicer | Special Servicer | Control Rights |
| 11 Madison Avenue(1) | $70,000,000 | $694,330,000 | $764,330,000 | MAD 2015-11MD | KeyBank National Association | KeyBank National Association | NAP |
| NMS Los Angeles Multifamily Portfolio | $65,000,000 | $55,000,000 | $120,000,000 | COMM 2015-CCRE27 | Midland Loan Services | Rialto Capital Advisors, LLC | COMM 2015-CCRE27 |
| (1) | The Loan Combination Cut-off Date Balance excludes three subordinate companion loans in the aggregate original amount of $310.67 million as well as two mezzanine loans in the aggregate original balance of $325.0 million. |
Existing Mezzanine Debt Summary |
| Mortgage Loan | Mortgage Loan Cut-off Date Balance | Mezzanine Debt Cut-off Date Balance | Trust U/W NCF DSCR(1) | Total Debt U/W NCF DSCR(1) | Trust Cut-off Date LTV Ratio(2) | Total Debt Cut-off Date LTV Ratio(2) | Trust U/W NOI Debt Yield | Total Debt U/W NOI Debt Yield |
| 11 Madison Avenue(3)(4) | $70,000,000 | $325,000,000 | 3.89x | 1.97x | 32.5% | 59.6% | 14.3% | 7.8% |
| Atlanta Multifamily Portfolio | $45,000,000 | $5,000,000 | 1.30x | 1.04x | 64.9% | 72.2% | 8.3% | 7.5% |
| Midwest Shopping Center Portfolio | $38,152,658 | $5,500,000 | 1.53x | 1.21x | 67.4% | 77.1% | 10.3% | 9.0% |
| CSRA Food Lion Portfolio II | $6,500,000 | $780,000 | 1.40x | 1.10x | 67.9% | 76.0% | 10.6% | 9.4% |
| (1) | With respect to the Atlanta Multifamily Portfolio Mortgage Loan, representing approximately 4.8% of the initial outstanding pool balance, following an initial interest only period of 18 months, the mortgage loan amortizes based on a non-standard amortization schedule and the U/W NCF DSCR for such Mortgage Loan was calculated based on the debt service for the first 12 amortizing payments. For additional information, see Annex H to the Free Writing Prospectus. |
| (2) | With respect to the Atlanta Multifamily Portfolio Mortgage Loan, the Cut-off Date LTV Ratio has been calculated based on the “as renovated” appraised value, which takes into account renovations being performed at the mortgaged properties. With respect to the Midwest Shopping Center Portfolio Mortgage Loan, the Cut-off Date LTV Ratio has been calculated based on the “as portfolio” appraised value, which attributes a premium to the aggregate value of the mortgaged properties as a whole. |
| (3) | Consists of two mezzanine loans, a $150,000,000 mezzanine A loan, which is coterminous with the 11 Madison Avenue Mortgage Loan, accrues interest at a fixed per annum rate equal to 4.6500% and a $175,000,000 mezzanine B loan, which is coterminous with the 11 Madison Avenue Mortgage Loan, accrues interest at a fixed per annum rate equal to 4.8500%. |
| (4) | The Total Debt U/W NCF DSCR, Total Debt Cut-off Date LTV Ratio and the Total Debt U/W NOI Debt Yield were calculated based on the total debt amount of $1.4 billion, which includes the 11 Madison Avenue Mortgage Loan and 15 seniorpari passu companion loans in the aggregate original amount $694.33 million, three subordinate companion loans in the aggregate original amount of $310.67 million and two mezzanine loans in the aggregate original amount of $325.0 million. |
Subordinate Debt Summary |
| Mortgage Loan | Mortgage Loan Cut-off Date Balance | Pari Passu Companion | Subordinate Debt Cut-off Date Balance | Trust U/W NCF DSCR | Total Debt U/W NCF DSCR | Trust Cut-off Date LTV Ratio | Total Debt Cut-off Date LTV Ratio | Trust U/W NOI Debt Yield | Total Debt U/W NOI Debt Yield |
| 11 Madison Avenue(1) | $70,000,000 | $694,330,000 | $310,670,000 | 3.89x | 1.97x | 32.5% | 59.6% | 14.3% | 7.8% |
| (1) | The Total Debt U/W NCF DSCR, Total Debt Cut-off Date LTV Ratio and the Total Debt U/W NOI Debt Yield were calculated based on the total debt amount of $1.4 billion, which includes the 11 Madison Avenue Mortgage Loan and 15 seniorpari passu companion loans in the aggregate original amount $694.33 million, three subordinate companion loans in the aggregate original amount of $310.67 million and two mezzanine loans in the aggregate original amount of $325.0 million. |
THE INFORMATION IN THIS STRUCTURAL AND COLLATERAL TERM SHEET IS NOT COMPLETE AND MAY BE AMENDED PRIOR TO THE TIME OF SALE. THIS TERM SHEET IS NOT AN OFFER TO SELL THESE SECURITIES AND IT IS NOT A SOLICITATION OF AN OFFER TO BUY THESE SECURITIES IN ANY JURISDICTION WHERE THE OFFER OR SALE IS NOT PERMITTED.
| 16 |
(THIS PAGE INTENTIONALLY LEFT BLANK)
| 17 |
| 11 Madison Avenue New York, NY 10010 | Collateral Asset Summary – Loan No. 1 11 Madison Avenue | Cut-off Date Balance: Cut-off Date LTV: U/W NCF DSCR: U/W NOI Debt Yield: | $70,000,000 3.89x 14.3% |
THE INFORMATION IN THIS STRUCTURAL AND COLLATERAL TERM SHEET IS NOT COMPLETE AND MAY BE AMENDED PRIOR TO THE TIME OF SALE. THIS TERM SHEET IS NOT AN OFFER TO SELL THESE SECURITIES AND IT IS NOT A SOLICITATION OF AN OFFER TO BUY THESE SECURITIES IN ANY JURISDICTION WHERE THE OFFER OR SALE IS NOT PERMITTED.
| 18 |
| 11 Madison Avenue New York, NY 10010 | Collateral Asset Summary – Loan No. 1 11 Madison Avenue | Cut-off Date Balance: Cut-off Date LTV: U/W NCF DSCR: U/W NOI Debt Yield: | $70,000,000 3.89x 14.3% |
| Mortgage Loan Information | |
| Loan Seller: | GACC |
| Loan Purpose: | Acquisition |
Credit Assessment (Fitch/DBRS/Moody’s): | AAA/AA(low)/A2 |
| Sponsor: | SL Green Realty Corp. |
| Borrower: | 11 Madison Avenue Owner LLC; 11 Madison Avenue Owner 2 LLC; 11 Madison Avenue Owner 3 LLC; 11 Madison Avenue Owner 4 LLC; 11 Madison Avenue Owner 5 LLC; 11 Madison Avenue Owner 6 LLC; 11 Madison EAT Lender LLC |
| Original Balance(1): | $70,000,000 |
| Cut-off Date Balance(1): | $70,000,000 |
| % by Initial UPB: | 7.5% |
| Interest Rate: | 3.5602% |
| Payment Date: | 6thof each month |
| First Payment Date: | October 6, 2015 |
| Maturity Date: | September 6, 2025 |
| Amortization: | Interest Only |
| Additional Debt(1): | $694,330,000Pari Passu Debt; $310,670,000 Subordinate Secured Debt; $325,000,000 Mezzanine Debt |
| Call Protection(2): | L(25), D(88), O(7) |
| Lockbox / Cash Management: | Hard / Springing |
| Reserves(3) | ||
| Initial | Monthly | |
| Taxes: | $0 | Springing |
| Insurance: | $0 | Springing |
| Replacement: | $0 | Springing |
| TI/LC: | $81,152,102 | Springing |
| Credit Suisse Sublease(4): | $36,500,000 | $0 |
| Sony Free Rent: | $18,847,898 | $0 |
| Endorsement: | $1,000 | $0 |
| Financial Information | ||
| Senior Notes(5) | Total Debt(6) | |
| Cut-off Date Balance / Sq. Ft.: | $334 | $613 |
| Balloon Balance / Sq. Ft.: | $334 | $613 |
| Cut-off Date LTV: | 32.5% | 59.6% |
| Balloon LTV: | 32.5% | 59.6% |
| Underwritten NOI DSCR: | 3.97x | 2.01x |
| Underwritten NCF DSCR: | 3.89x | 1.97x |
| Underwritten NOI Debt Yield: | 14.3% | 7.8% |
| Underwritten NCF Debt Yield: | 14.1% | 7.7% |
| Underwritten NOI Debt Yield at Balloon: | 14.3% | 7.8% |
| Underwritten NCF Debt Yield at Balloon: | 14.1% | 7.7% |
| Property Information | |
| Single Asset / Portfolio: | Single Asset |
| Property Type: | CBD Office |
| Collateral: | Fee Simple/Leasehold |
| Location: | New York, NY |
| Year Built / Renovated: | 1932-1950 / 1994-1997, 2015 |
| Total Sq. Ft.: | 2,285,043 |
| Property Management: | SL Green Management LLC |
| Underwritten NOI(7): | $109,493,598 |
| Underwritten NCF: | $107,431,283 |
| Appraised Value: | $2,350,000,000 |
| Appraisal Date: | July 1, 2015 |
| Historical NOI | |
| Most Recent NOI(7): | $46,389,392 (T-12 May 31, 2015) |
| 2014 NOI: | $46,705,749 (December 31, 2014) |
| 2013 NOI: | $47,051,047 (December 31, 2013) |
| 2012 NOI: | $52,397,490 (December 31, 2012) |
| Historical Occupancy | |
| Most Recent Occupancy: | 97.8% (August 11, 2015) |
| 2014 Occupancy: | 94.0% (December 31, 2014) |
| 2013 Occupancy: | 87.5% (December 31, 2013) |
| 2012 Occupancy: | 99.1% (December 31, 2012) |
| (1) | The Original Balance and Cut-off Date Balance of $70.0 million represents the senior non-controlling Note A-1-C2 which, together with the remainingpari passu Senior Notes (defined herein) with an aggregate original principal balance of $764.33 million and the Junior Notes (defined herein) with an aggregate original principal balance of $310.67 million, comprises the 11 Madison Avenue Loan Combination with an aggregate original principal balance of $1.075 billion. For additional information regarding thepari passu Senior Notes and Junior Notes, see “The Loan” and “Current Mezzanine or Subordinate Indebtedness” herein. |
| (2) | The lockout period will be at least 25 payment dates beginning with and including the first payment date of October 6, 2015. Defeasance of the full $1.075 billion 11 Madison Avenue Loan Combination is permitted on or after the date that is the earlier to occur of (i) two years after the closing date of the securitization that includes the lastpari passu note to be securitized and (ii) August 18, 2018. The assumed lockout period of 25 payments is based on the expected COMM 2015-CCRE27 securitization closing date in October 2015. The actual lockout period may be longer. |
| (3) | See “Initial Reserves” and “Ongoing Reserves” herein. |
| (4) | The borrower deposited an additional $2,500,000 associated with outstanding sublease payments in relation to the Credit Suisse Sublease which were subsequently paid at closing. See “Initial Reserves” and “Ongoing Reserves” herein. |
| (5) | DSCR, LTV, Debt Yield and Balance / Sq. Ft. calculations are based on the Senior Notes only, which have an aggregate principal balance of $764.33 million. |
| (6) | DSCR, LTV, Debt Yield and Balance / Sq. Ft. calculations are based on the total debt in the amount of $1.4 billion. |
| (7) | The increase in Underwritten NOI over Most Recent NOI is due to the lender underwriting Credit Suisse’s higher contractual base rent beginning in 2017, for all floors except 11 and 13 and 8,770 sq. ft. of storage space, for which the in-place rent is reflected. The lender underwriting also includes WME’s expansion onto a portion of the 17thfloor, which occurred in August 2015. |
THE INFORMATION IN THIS STRUCTURAL AND COLLATERAL TERM SHEET IS NOT COMPLETE AND MAY BE AMENDED PRIOR TO THE TIME OF SALE. THIS TERM SHEET IS NOT AN OFFER TO SELL THESE SECURITIES AND IT IS NOT A SOLICITATION OF AN OFFER TO BUY THESE SECURITIES IN ANY JURISDICTION WHERE THE OFFER OR SALE IS NOT PERMITTED.
| 19 |
| 11 Madison Avenue New York, NY 10010 | Collateral Asset Summary – Loan No. 1 11 Madison Avenue | Cut-off Date Balance: Cut-off Date LTV: U/W NCF DSCR: U/W NOI Debt Yield: | $70,000,000 3.89x 14.3% |
| Tenant Summary | ||||||||
| Tenant | Ratings (Fitch/Moody’s/S&P)(1) | Net Rentable Area (Sq. Ft.) | % of Net Rentable Area | U/W Base Rent PSF | % of Total U/W | Lease Expiration | ||
| Credit Suisse(2)(3) | A/A1/A | 1,079,655 | 47.2% | $63.98 | 46.7% | 5/31/2037 | ||
| Credit Suisse (Option)(4) | A/A1/A | 186,396 | 8.2% | $26.18 | 3.3% | 5/31/2017 | ||
| Sony(5) | BB-/Ba1/BBB- | 578,791 | 25.3% | $73.75 | 28.9% | 1/31/2031 | ||
| Yelp | NR/NR/NR | 152,232 | 6.7% | $85.00 | 8.7% | 4/30/2025 | ||
| WME | NR/NR/NR | 103,426 | 4.5% | $85.02 | 5.9% | 9/30/2030 | ||
| Young & Rubicam, Inc. | NR/NR/NR | 99,107 | 4.3% | $74.65 | 5.0% | 3/30/2019 | ||
| Fidelity Brokerage Company | NR/NR/NR | 21,999 | 1.0% | $76.59 | 1.1% | 12/31/2028 | ||
| Eleven Madison Park | NR/NR/NR | 12,000 | 0.5% | $27.42 | 0.2% | 12/31/2017 | ||
| Subtotal / Wtd. Avg. | 2,233,606 | 97.7% | $66.16 | 99.9% | ||||
| Other(6) | 572 | 0.0% | $230.04 | 0.1% | ||||
| Total / Wtd. Avg. Occupied | 2,234,178 | 97.8% | $66.21 | 100.0% | ||||
| Vacant | 50,865 | 2.2% | ||||||
| Total / Wtd. Avg. | 2,285,043 | 100.0% | ||||||
| (1) | Certain ratings are those of the parent company whether or not the parent company guarantees the lease. |
| (2) | Credit Suisse pays $73.81 PSF for floors 3-10, $50.00 PSF for the second floor office space and $32.85 PSF for approximately 217,386 sq. ft. of concourse and lobby/storage space. |
| (3) | Credit Suisse has three partial termination options for one floor each, exercisable 5, 10 and 15 years into the lease term, upon 15 months’ written notice and subject to a termination fee. |
| (4) | Consists of space leased at below market rents on floors 11 and 13 as well as a portion of the first floor storage space. Credit Suisse has an option on this space to extend through 2037 at $73.81 PSF, which must be exercised by April 1, 2016. |
| (5) | Sony is not yet in occupancy and is not yet paying rent. It is anticipated that Sony will take occupancy of its space beginning in February 2016 and will commence paying rent following the expiration of the free rent periods for its respective premises. In connection with these free rent periods, the borrowers reserved $18,847,898 with the lender at loan closing. |
| (6) | Consists of Martin’s News & Sundry, which pays $77.19 PSF for 570 sq. ft., as well as two antenna / satellite tenants paying $12,000 PSF and $75,584 PSF respectively. |
Lease Rollover Schedule(1) | |||||||||||||||||
| Year | # of Leases Expiring | Total Expiring Sq. Ft. | % of Total Sq. Ft. Expiring | Cumulative Sq. Ft. Expiring | Cumulative % of Sq. Ft. Expiring | Annual U/W Base Rent PSF | % U/W Base Rent Rolling | Cumulative % of U/W Base Rent | |||||||||
| MTM | 0 | 0 | 0.0% | 0 | 0.0% | $0.00 | 0.0% | 0.0% | |||||||||
| 2015 | 0 | 0 | 0.0% | 0 | 0.0% | $0.00 | 0.0% | 0.0% | |||||||||
| 2016 | 2 | 2 | 0.0% | 2 | 0.0% | $43,792.00 | 0.1% | 0.1% | |||||||||
| 2017 | 3 | 198,966 | 8.7% | 198,968 | 8.7% | $26.40 | 3.6% | 3.6% | |||||||||
| 2018 | 0 | 0 | 0.0% | 198,968 | 8.7% | $0.00 | 0.0% | 3.6% | |||||||||
| 2019 | 1 | 99,107 | 4.3% | 298,075 | 13.0% | $74.65 | 5.0% | 8.6% | |||||||||
| 2020 | 0 | 0 | 0.0% | 298,075 | 13.0% | $0.00 | 0.0% | 8.6% | |||||||||
| 2021 | 0 | 0 | 0.0% | 298,075 | 13.0% | $0.00 | 0.0% | 8.6% | |||||||||
| 2022 | 0 | 0 | 0.0% | 298,075 | 13.0% | $0.00 | 0.0% | 8.6% | |||||||||
| 2023 | 0 | 0 | 0.0% | 298,075 | 13.0% | $0.00 | 0.0% | 8.6% | |||||||||
| 2024 | 0 | 0 | 0.0% | 298,075 | 13.0% | $0.00 | 0.0% | 8.6% | |||||||||
| 2025 | 1 | 152,232 | 6.7% | 450,307 | 19.7% | $85.00 | 8.7% | 17.4% | |||||||||
| Thereafter | 4 | 1,783,871 | 78.1% | 2,234,178 | 97.8% | $68.52 | 82.6% | 100.0% | |||||||||
| Vacant | NAP | 50,865 | 2.2% | 2,285,043 | 100.0% | NAP | NAP | ||||||||||
| Total / Wtd. Avg. | 11 | 2,285,043 | 100.0% | $66.21 | 100.0% | ||||||||||||
| (1) | Certain tenants have lease termination options that may become exercisable prior to the originally stated expiration date of the tenant lease that are not considered in the lease rollover schedule. |
THE INFORMATION IN THIS STRUCTURAL AND COLLATERAL TERM SHEET IS NOT COMPLETE AND MAY BE AMENDED PRIOR TO THE TIME OF SALE. THIS TERM SHEET IS NOT AN OFFER TO SELL THESE SECURITIES AND IT IS NOT A SOLICITATION OF AN OFFER TO BUY THESE SECURITIES IN ANY JURISDICTION WHERE THE OFFER OR SALE IS NOT PERMITTED.
| 20 |
| 11 Madison Avenue New York, NY 10010 | Collateral Asset Summary – Loan No. 1 11 Madison Avenue | Cut-off Date Balance: Cut-off Date LTV: U/W NCF DSCR: U/W NOI Debt Yield: | $70,000,000 3.89x 14.3% |
The Loan. The 11 Madison Avenue loan (the “11 Madison Avenue Loan”) is a fixed rate loan secured by the borrowers’ fee simple interests in 27 condominium units and leasehold interests (with the reversionary right to the fee simple interests related to such leasehold interests) in nine condominium units of the borrowers in a 29-story Class A office building consisting of 2,285,043 sq. ft. and located at 11 Madison Avenue in New York, New York (the “Property” or the “11 Madison Avenue Property”) with an original principal balance of $70.0 million. The 11 Madison Avenue Loan is comprised of the non-controlling Note A-1-C2 of a $1.075 billion whole loan that is evidenced by 19 promissory notes: 16 senior notes with an aggregate principal balance of $764,330,000 (the “Senior Notes”) and three junior notes with an aggregate principal balance of $310,670,000 (the “Junior Notes” and together with the Senior Notes the “11 Madison Avenue Loan Combination”). Only the $70.0 million non-controlling Note A-1-C2 will be included in the COMM 2015-CCRE27 trust. Nine of the Senior Notes with an aggregate principal balance of $397,530,000 along with the three Junior Notes are being contributed to the MAD 2015-11MD trust. The A-1-C1 Note is expected to be contributed to the COMM 2015-CCRE26 securitization and the remaining Senior Notes are held by GACC, Morgan Stanley Bank, N.A. (“MSBNA”) or Wells Fargo Bank, National Association (“Wells Fargo Bank”) as summarized in the chart below.
The relationship between the holders of the Senior Notes and the Junior Notes will be governed by a co-lender agreement as described under“Description of the Mortgage Pool – Loan Combinations – The 11 Madison Avenue Loan Combination” in the accompanying Free Writing Prospectus.
| Mortgage Loan Combination Note Summary | |||||
| Note | Original Balance | Cut-off Date Balance | Note Holder | Controlling Piece | |
| A-1-C2 | $70,000,000 | $70,000,000 | COMM 2015-CCRE27 | No | |
| A-1-S1, A-1-S2, A-1-S3, A-2-S1, A-2-S2, A-2-S3, A-3-S1, A-3-S2, A-3-S3 | $397,530,000 | $397,530,000 | MAD 2015-11MD | No | |
| B-1-S, B-2-S, B-3-S | $310,670,000 | $310,670,000 | MAD 2015-11MD | Yes(2) | |
| A-1-C1, A-1-C3(1) | $139,600,000 | $139,600,000 | COMM 2015-CCRE26 /GACC | No | |
| A-2-C1, A-2-C2 | $91,700,000 | $91,700,000 | MSBNA | No | |
| A-3-C1, A-3-C2 | $65,500,000 | $65,500,000 | Wells Fargo Bank | No | |
| Total | $1,075,000,000 | $1,075,000,000 | |||
| (1) | The A-1-C1 Note is expected to be contributed to the COMM 2015-CCRE26 securitization. |
| (2) | So long as the Junior Notes are included in the MAD 2015-11MD trust, there will be no controlling class or directing holder with respect to the 11 Madison Avenue Loan Combination. |
The 11 Madison Avenue Loan Combination has a 10-year term and pays interest only for the term of the loan. The 11 Madison Avenue Loan Combination accrues interest at a fixed rate equal to 3.5602% and has a cut-off date balance of $70.0 million. Loan proceeds, in addition to approximately $1.1 billion of cash equity from the sponsor, were used to purchase the 11 Madison Avenue Property for approximately $2.3 billion, pay approximately $139.6 million in costs associated with lease-stipulated improvements to the Property, fund upfront reserves of $100.0 million and pay transaction costs of approximately $22.7 million. Based on the appraised value of $2.35 billion as of July 1, 2015, the cut-off date LTV for the Senior Notes is 32.5%. The most recent prior financing of the 11 Madison Avenue Property was included in the CSMC 2006-C4 transaction.
| Sources and Uses | ||||||
| Sources | Proceeds | % of Total | Uses(1) | Proceeds | % of Total | |
| Mortgage Loan | $1,075,000,000 | 42.2% | Purchase Price(2) | $2,285,000,000 | 89.7% | |
| First Mezzanine Loan | $150,000,000 | 5.9% | Leasing/Base Building Costs | $139,562,788 | 5.5% | |
| Second Mezzanine Loan | $175,000,000 | 6.9% | Lease Costs Funds | $81,152,102 | 3.2% | |
| Sponsor Equity | $1,147,232,451 | 45.0% | Sony Free Rent Reserve | $18,847,898 | 0.7% | |
| Closing Costs | $22,669,663 | 0.9% | ||||
| Total Sources | $2,547,232,451 | 100.0% | Total Uses | $2,547,232,451 | 100.0% | |
| (1) | SLG also delivered a guaranty at loan closing in the amount of $59,060,332 to partially collateralize leasing obligations at the Property. |
| (2) | Purchase Price includes the $39,000,000 CS Sublease Reserve, $2,500,000 of which was paid down at closing. |
The Borrower / Sponsor. The borrowers, 11 Madison Avenue Owner LLC, 11 Madison Avenue Owner 2 LLC, 11 Madison Avenue Owner 3 LLC, 11 Madison Avenue Owner 4 LLC, 11 Madison Avenue Owner 5 LLC and 11 Madison Avenue Owner 6 LLC (collectively the “TIC Owners”) and 11 Madison EAT Lender LLC, are each a single purpose Delaware limited liability company structured to be bankruptcy-remote with two independent directors in its organizational structure. Each of the TIC Owners is a tenant-in-common owner of the Property who collectively own 100% of the fee simple and/or leasehold interest in the Property and have subsequently master leased the Property to 11 Madison EAT Lender. The sponsor of the borrowers and the non-recourse carveout guarantor is SL Green
THE INFORMATION IN THIS STRUCTURAL AND COLLATERAL TERM SHEET IS NOT COMPLETE AND MAY BE AMENDED PRIOR TO THE TIME OF SALE. THIS TERM SHEET IS NOT AN OFFER TO SELL THESE SECURITIES AND IT IS NOT A SOLICITATION OF AN OFFER TO BUY THESE SECURITIES IN ANY JURISDICTION WHERE THE OFFER OR SALE IS NOT PERMITTED.
| 21 |
| 11 Madison Avenue New York, NY 10010 | Collateral Asset Summary – Loan No. 1 11 Madison Avenue | Cut-off Date Balance: Cut-off Date LTV: U/W NCF DSCR: U/W NOI Debt Yield: | $70,000,000 3.89x 14.3% |
Realty Corp. (“SLG”). SLG also delivered a guaranty at loan closing in the amount of $59,060,332 to partially collateralize leasing obligations at the 11 Madison Avenue Property.
SLG (rated BBB-/Baa3/BB+ by Fitch/Moody’s/S&P), an S&P 500 company and New York City’s largest office landlord, is a fully integrated REIT that is focused primarily on acquiring, managing, and maximizing value of Manhattan commercial properties. As of June 30, 2015, SLG held interests in 120 Manhattan buildings totaling 44.1 million sq. ft. This included ownership interests in 29.0 million sq. ft. of commercial buildings and debt and preferred equity investments secured by 15.1 million sq. ft. of buildings. In addition to its Manhattan investments, SLG held ownership interests in 37 suburban buildings totaling 5.9 million sq. ft. in Brooklyn, Long Island, Westchester County, Connecticut and New Jersey.
As of June 30, 2015, SLG reported total assets of approximately $17.3 billion, including cash and cash equivalents of approximately $215.9 million. For fiscal year 2014, SLG reported total revenues of $1.5 billion, an increase of 10.9% over fiscal year 2013 revenues of approximately $1.4 billion. As of June 30, 2015, SLG reported a market capitalization of approximately $10.7 billion, and, over a 52-week period, its stock price ranged from $109.45 to $131.99.
The Property.The 11 Madison Avenue Property is a 29-story, 2,285,043 sq. ft., Class A office tower located directly east of Manhattan’s Madison Square Park. The Property enjoys full-block frontage on Madison Square Park and occupies an entire city “super block” between Park Avenue South, Madison Avenue, and East 24th and East 25th Streets. Developed by MetLife as part of its headquarters complex, the Property was constructed in three phases beginning in 1932: from 1932 to 1938, half of the building was built along Park Avenue between 24th and 25th Street; from 1938 to 1941, the northwest section of the building was completed; and from 1947 to 1950, the final phase, the southwest quadrant, was completed. The 11 Madison Avenue Property was built to an international headquarters quality standard and features an art deco design. The Property has an Alabama limestone exterior and four vaulted entrances with terrazzo floors at each corner that lead to a double-height marble lobby. Both the floors and walls are comprised of Italian Cremo marble, Tennessee granite and travertine. Due to the Property’s unique and high quality construction, the 11 Madison Avenue Property was added to the National Register of Historic Places in 1996.
Between 1994 and 1997, Credit Suisse and MetLife collectively modernized the Property at a cost exceeding $700.0 million. During that time, MetLife invested $400.0 million in technological enhancements at the Property and established the Property as a sought after headquarter location due to its modern building systems, large floor plates, landmark status, and amenity-rich park-fronting location. Furthermore, during that time, Credit Suisse invested an additional $300.0 million to create its North American headquarters, adding dedicated emergency generators, supplemental HVAC systems, its own UPS facility (additionally upgraded for $30.0 million in 2011), and other miscellaneous electrical upgrades. The Property is currently undergoing a number of base building projects totaling approximately $86.0 million, which, when combined with Sony’s and Credit Suisse’s tenant improvement and leasing commissions, will result in over $279.8 million of capital invested into the Property between 2015 and 2018. The capital is expected to be invested to modernize and update the Property to today’s headquarters standard, including a new BMS system, elevator modernization, chiller plant/cooling towers upgrade, increased ventilation capacity, private entrance and sky lobby for Sony, new 28th floor window line and a new usable rooftop garden.
The Property is 97.8% leased as of August 11, 2015 to 10 tenants including Credit Suisse (rated A/A1/A by Fitch/Moody’s/S&P) and Sony (rated BB-/Ba1/BBB- by Fitch/Moody’s/S&P). The Property has served as the North American headquarters for Credit Suisse since 1996 and is expected to be the U.S. headquarters for Sony starting in 2016. Credit Suisse recently renewed its lease at the Property through May 31, 2037 for 1,079,655 sq. ft. (which includes 862,269 sq. ft. of office space, 203,863 sq. ft. of concourse space and 13,523 sq. ft. of lobby/storage space. Credit Suisse currently occupies an additional 177,626 sq. ft. of office space and 8,770 sq. ft. of storage space that will expire in 2017. Credit Suisse has the option to extend its space on these floors through 2037. Sony is expected to relocate its headquarters to the Property from its previous location at 550 Madison Avenue in early 2016, having signed a lease through January 31, 2031 for 578,791 sq. ft. (548,113 sq. ft. of office space on the top 11 floors of the Property, 17,555 sq. ft. of retail space and 13,123 sq. ft. of storage space). Other tenants include Yelp, Young & Rubicam, Inc., William Morris Endeavor (“WME”) and the Eleven Madison Park restaurant. Credit Suisse and Sony will occupy in the aggregate 1,844,842 sq. ft. (80.7% of NRA) at the Property.
Located in Manhattan’s Midtown South neighborhood, the Property has direct access to the number 6 subway line which, along with the nearby N, R, Q, F and M lines, provides connections from the Upper East Side and Grand Central to Union Square, Downtown Manhattan and Brooklyn. Additionally, the Property is within walking distance of the Flatiron, Gramercy and Chelsea neighborhoods.
Environmental Matters.The Phase I environmental report dated April 30, 2015 recommended the continued implementation of an asbestos operation and maintenance plan at the Property, which is currently in place.
THE INFORMATION IN THIS STRUCTURAL AND COLLATERAL TERM SHEET IS NOT COMPLETE AND MAY BE AMENDED PRIOR TO THE TIME OF SALE. THIS TERM SHEET IS NOT AN OFFER TO SELL THESE SECURITIES AND IT IS NOT A SOLICITATION OF AN OFFER TO BUY THESE SECURITIES IN ANY JURISDICTION WHERE THE OFFER OR SALE IS NOT PERMITTED.
| 22 |
| 11 Madison Avenue New York, NY 10010 | Collateral Asset Summary – Loan No. 1 11 Madison Avenue | Cut-off Date Balance: Cut-off Date LTV: U/W NCF DSCR: U/W NOI Debt Yield: | $70,000,000 3.89x 14.3% |
Major Tenants.
Credit Suisse (1,266,051 sq. ft.; 55.4% of NRA; 50.0% of U/W Base Rent; A/A1/A by Fitch/Moody’s/S&P) Credit Suisse is a multinational financial services company based in Zurich, Switzerland. Credit Suisse is organized as a stock corporation with four divisions: Investment Banking, Private Banking, Asset Management, and a Shared Services Group. Operating out of global headquarters in Zurich, London and New York, Credit Suisse has 45,800 employees in 344 branches and offices in over 50 countries. Credit Suisse has used the Property as its North American headquarters since 1996. In 2014, Credit Suisse vacated a portion of its space, which it subleased to the borrowers to allow for Sony to take approximately 548,000 sq. ft. of office space on the Property’s top 11 floors. Credit Suisse currently occupies 1,266,051 sq. ft., which includes its office space on floors 2-11 and 13 as well as its space in the basement, the lobby and its concourse space.
Credit Suisse recently executed a new lease for 862,269 sq. ft. commencing in June 2017 through May 2037 for floors 2 through 10, as well as 217,386 sq. ft. of concourse space, mechanical and lobby space. Credit Suisse has two, 10-year extension options for the space that expires in 2037 as well as three partial termination options for one floor each, which are exercisable 5, 10 and 15 years into the lease term, upon 15 months written notice and subject to a termination fee as described in the lease documents. Credit Suisse’s space on floors 11 and 13 expires in 2017 (along with a small portion of storage space on the first floor) and the tenant has the option to extend these floors through 2037 at $73.81 PSF. This option must be exercised by April 1, 2016. Credit Suisse currently pays a blended base rent of $26.18 PSF for these floors, which is significantly below current market rents as the leases for these floors were signed over 15 years ago.
Sony (578,791 sq. ft.; 25.3% of NRA; 28.9% of U/W Base Rent; BB-/Ba1/BBB- by Fitch/Moody’s/S&P)Sony is a multinational electronics and entertainment company based in Tokyo, Japan. The company employs nearly 140,000 people worldwide and operates in four business segments: SONY Corporation (SONY Electronics in the US), SONY Pictures Entertainment, SONY Mobile Communications, and SONY Financial.
In 2015, Sony signed a 16-year lease at the Property for the top 11 floors, as well as retail space on the ground floor and mezzanine level. The Property is expected to serve as its U.S. headquarters as well as house its flagship store, the “SONY Experience.” Sony has made a significant financial commitment to the space, and is expected to spend approximately $150.0 million to complete its build-out, in addition to a TI allowance from the borrowers. Sony is leasing 548,113 sq. ft. in the top floors of the building (19-29) for its office space at a base rent of $74.00 PSF. Additionally, Sony is leasing 17,555 sq. ft. of retail space for its “SONY Experience” store, the ground floor of which has a base rent of $225.00 PSF and 13,123 sq. ft. of storage space. Sony has two successive extension options for all of its space, the first for 10 years and the second for either 5 or 10 years. Sony has not yet taken occupancy of its space at the Property as its space is still being built out. Substantially all of the Sony space is currently leased to Credit Suisse, which has subleased such space to the borrowers, which has in turn leased such space to Sony (which converts to a direct lease upon expiration of the Credit Suisse lease for that space in 2017). Sony is entitled to free rent periods with respect to various portions of its space following the related lease commencement.
The Market.The Property is located in the Midtown South office market - Manhattan’s smallest office market - housing 66.6 million sq. ft. of space. The market has a total of 35 Class A buildings totaling 17.3 million sq. ft. As of Q1 2015, the Midtown South office market exhibited a vacancy rate of 7.0% and a rental rate of $63.28 PSF. The Property is one of seven trophy office buildings in the Midtown South office market.
The Midtown South office market is geographically segmented into five major submarkets: SoHo, Greenwich Village/NoHo, Madison/Union Square, Hudson Square/West Village, and Chelsea. The 11 Madison Avenue Property is located in the Madison/Union Square submarket. The Madison/Union Square submarket contains over 32.0 million sq. ft. of office space and is Midtown South’s largest submarket. The submarket contains 10.4 million sq. ft. of Class A space (including the Property at 2.3 million sq. ft.). As of Q1 2015, the Madison/Union Square submarket had an overall vacancy rate of 7.3% and an overall asking rent of $64.22 PSF.
The appraiser identified 34 comparable properties totaling approximately 19.3 million sq. ft. of space that exhibited a rental range of $40.00 PSF to $90.00 PSF with a weighted average occupancy of approximately 96.8%. However, according to the appraiser, the Property is directly competitive with ten Class A office properties located within the Madison/Union Square submarket. The average direct occupancy rate for the directly competitive buildings is 100.0%, compared to 96.8% for the full competitive set and 95.90% for the Class A Midtown South market as a whole. The chart below summarizes the ten properties considered to be directly competitive to the 11 Madison Avenue Property within the Madison/Union Square office submarket.
THE INFORMATION IN THIS STRUCTURAL AND COLLATERAL TERM SHEET IS NOT COMPLETE AND MAY BE AMENDED PRIOR TO THE TIME OF SALE. THIS TERM SHEET IS NOT AN OFFER TO SELL THESE SECURITIES AND IT IS NOT A SOLICITATION OF AN OFFER TO BUY THESE SECURITIES IN ANY JURISDICTION WHERE THE OFFER OR SALE IS NOT PERMITTED.
| 23 |
| 11 Madison Avenue New York, NY 10010 | Collateral Asset Summary – Loan No. 1 11 Madison Avenue | Cut-off Date Balance: Cut-off Date LTV: U/W NCF DSCR: U/W NOI Debt Yield: | $70,000,000 3.89x 14.3% |
| Competitive Set(1) | |||||||||
| Building | Net Rentable Area | Available Sq. Ft. (Direct) | Available Sq. Ft. (Sublease) | Direct Occupancy | Total Occupancy | ||||
| One Madison Avenue | 1,443,908 | 0 | 0 | 100.0% | 100.0% | ||||
| 41 Madison Avenue | 532,525 | 0 | 55,126 | 100.0% | 89.7% | ||||
| 51 Madison Avenue | 974,653 | 0 | 0 | 100.0% | 100.0% | ||||
| 63 Madison Avenue | 636,660 | 0 | 8,296 | 100.0% | 98.7% | ||||
| 114 Fifth Avenue | 287,804 | 0 | 19,326 | 100.0% | 93.3% | ||||
| 160 Fifth Avenue | 117,900 | 0 | 0 | 100.0% | 100.0% | ||||
| 200 Fifth Avenue | 594,089 | 0 | 0 | 100.0% | 100.0% | ||||
| 770 Broadway | 911,213 | 0 | 0 | 100.0% | 100.0% | ||||
| 111 Eighth Avenue | 2,300,000 | 0 | 0 | 100.0% | 100.0% | ||||
| 51 Astor Place | 307,839 | 0 | 0 | 100.0% | 100.0% | ||||
| Total / Wtd. Avg. | 8,106,591 | 0 | 82,748 | 100.0% | 99.0% | ||||
| (1) | Source: Appraisal. |
The appraiser identified nine comparable transactions that are under contract or have occurred since June 2014. The transactions reflect a range of unadjusted price PSF from $713.02 to $1,819.33 PSF. After making adjustments including but not limited to location, age, condition, quality and appeal, the appraiser determined an adjusted price range of approximately $972.21 PSF to $1,107.94 PSF for the comparable sales transactions.
| Comparable Retail Sales – Multi-Level(1) | |||||||
| Location | Net Rentable Area (Sq. Ft.) | Year Built/Renovated | No. Stories | Transaction Date | Price | Price/NRA | Occupancy at Sale |
| 757 Third Avenue | 504,893 | 1964 | 27 | Mar-15 | $360,000,000 | $713 | 95.0% |
| 230 Park Avenue | 1,404,918 | 1928 | 34 | Mar-15 | $1,200,000,000 | $854 | 90.0% |
| 717 Fifth Avenue | 352,951 | 1959/2001 | 26 | Feb-15 | $415,000,000 | $1,176 | 92.0% |
| 11 Times Square | 1,107,839 | 2010 | 40 | Feb-15 | $1,400,000,000 | $1,264 | 85.0% |
| 601 Lexington Avenue (Allocated) | 1,669,897 | 1977 | 61 | Dec-14 | $2,400,000,000 | $1,437 | 99.0% |
| 1045 Sixth Avenue/7 Bryant Park (Leasehold) | 473,672 | 2015 (under construction) | 28 | Dec-14 | $598,000,000 | $1,262 | 0.0% |
| 1095 Sixth Avenue | 1,179,552 | 1973/2008 | 41 | Nov-14 | $2,146,000,000 | $1,819 | 96.0% |
| 1740 Broadway | 620,928 | 1950/2007 | 26 | Nov-14 | $600,912,768 | $968 | 98.0% |
| Park Avenue Tower | 616,082 | 1986 | 36 | Jun-14 | $750,000,000 | $1,217 | 96.0% |
| (1) | Source: Appraisal. |
The appraiser concluded an average rental rate for the 11 Madison Avenue Property in the mid $80s, as summarized in the chart below.
| Office Market Rent(1) | |
| Type | Market Rent PSF |
| Concourse | $30.00 |
| Office Floors 2, 5-12 | $80.00 |
| Office Floors 3-4 | $85.00 |
| Office Floors 13-14, 16-20 | $90.00 |
| Office Floors 15 | $70.00 |
| Office Floors 21-24 | $95.00 |
| Office Floors 25-29 | $100.00 |
| (1) | Source: Appraisal. |
THE INFORMATION IN THIS STRUCTURAL AND COLLATERAL TERM SHEET IS NOT COMPLETE AND MAY BE AMENDED PRIOR TO THE TIME OF SALE. THIS TERM SHEET IS NOT AN OFFER TO SELL THESE SECURITIES AND IT IS NOT A SOLICITATION OF AN OFFER TO BUY THESE SECURITIES IN ANY JURISDICTION WHERE THE OFFER OR SALE IS NOT PERMITTED.
| 24 |
| 11 Madison Avenue New York, NY 10010 | Collateral Asset Summary – Loan No. 1 11 Madison Avenue | Cut-off Date Balance: Cut-off Date LTV: U/W NCF DSCR: U/W NOI Debt Yield: | $70,000,000 3.89x 14.3% |
Cash Flow Analysis.
| Cash Flow Analysis | |||||||||||
| 2013 | 2014 | T-12 5/31/2015 | Sponsor Budget | U/W | U/W PSF | ||||||
| Base Rent(1) | $52,888,225 | $52,592,579 | $53,715,326 | $159,869,968 | $147,917,623 | $64.73 | |||||
| Rent Abatements | 0 | 0 | 0 | (5,368,454) | 0 | 0.00 | |||||
| Straight Line Rents(2) | 0 | 0 | 0 | 0 | 1,932,702 | 0.85 | |||||
| Value of Vacant Space | 0 | 0 | 0 | 0 | 4,796,680 | 2.10 | |||||
| Gross Potential Rent | $52,888,225 | $52,592,579 | $53,715,326 | $154,501,514 | $154,647,005 | $67.68 | |||||
| Total Recoveries | 15,059,977 | 14,780,924 | 13,408,807 | 3,799,446 | 5,509,992 | 2.41 | |||||
| Total Other Income | 2,724,962 | 2,996,156 | 3,461,086 | 8,005,327 | 7,679,439 | 3.36 | |||||
| Less: Vacancy/Bad Debt(3) | (725,384) | (488,860) | (319,721) | 0 | (4,796,680) | (2.10) | |||||
| Effective Gross Income | $69,947,780 | $69,880,799 | $70,265,498 | $166,306,287 | $163,039,756 | $71.35 | |||||
| Total Variable Expenses | 13,213,979 | 12,999,874 | 13,312,685 | 31,651,567 | 31,569,448 | 13.82 | |||||
| Total Fixed Expenses | 9,682,754 | 10,175,176 | 10,563,422 | 21,976,710 | 21,976,710 | 9.62 | |||||
| Net Operating Income | $47,051,047 | $46,705,749 | $46,389,392 | $112,678,010 | $109,493,598 | $47.92 | |||||
| TI/LC | 0 | 0 | 0 | 0 | 1,605,307 | 0.70 | |||||
| Capital Expenditures | 0 | 0 | 0 | 0 | 457,009 | 0.20 | |||||
| Net Cash Flow | $47,051,047 | $46,705,749 | $46,389,392 | $112,678,010 | $107,431,283 | $47.01 | |||||
| (1) | Base Rent includes Credit Suisse’s contractual base rent beginning in 2017 for all floors except 11 and 13 and 8,770 sq. ft. of storage space, for which the in-place rent is reflected. Base Rent also includes WME’s expansion onto a portion of the 17th floor, which occurred in August 2015. |
| (2) | Straight Line Rents is equal to the average rent for Sony’s space over the loan term. |
| (3) | U/W Vacancy/Bad Debt is based on the in-place vacancy. |
Property Management. The 11 Madison Avenue Property is managed by SL Green Management LLC, a borrower affiliate.
Lockbox / Cash Management. The 11 Madison Avenue Loan Combination is structured with a hard lockbox and springing cash management. At closing, the borrowers were required to deliver tenant direction letters requiring all rents, revenues and receipts from the Property to be deposited directly by the tenants into a clearing account established by the borrowers. Amounts on deposit in the clearing account are required to be transferred daily to a deposit account controlled by the lender, and provided no Trigger Period (defined herein) exists, automatic daily transfers of such deposits are required to be made from the deposit account into borrower’s operating account. During a Trigger Period, any transfers to borrower’s operating account will cease and sums on deposit in the deposit account are required to be applied to payment of all monthly amounts due under the loan documents.
A “Trigger Period” will commence upon the occurrence or commencement, as applicable, of (i) an event of default, (ii) a Low Debt Yield Trigger Period (defined herein), (iii) a default by the borrowers of any major lease obligation, (iv) a Lease Collateral Sweep Period (defined herein), (v) a Lease Sweep Period (defined herein) or (vi) a First Mezzanine or Second Mezzanine loan default.
A “Low Debt Yield Trigger Period” will commence if , as of the last day of any quarter, the mortgage loan debt yield falls below 7.50% or the aggregate debt yield falls below 5.75% and will cease to exist if either (i) the mortgage loan debt yield exceeds 7.50% or the total debt yield exceeds 5.75% for two consecutive quarters or (ii) the borrowers provide cash or a letter of credit to the lender in the amount that the outstanding principal balance would need to be reduced to cause the mortgage loan debt yield to be equal to or greater than 7.50% or the total debt yield to be equal to or greater than 5.75% (such cash or letter of credit are required to be released to the borrowers upon the borrowers meeting the conditions set forth in subsection (i) hereof).
A “Lease Collateral Sweep Period” will commence if the long-term unsecured credit rating of the guarantor under the Lease Costs Guaranty falls below the minimum credit rating requirement as further described in “Initial Reserves” below and will end if either (i) all lease costs have been fully funded in cash into the lease costs account or (ii) upon the subsequent date that guarantor meets the minimum credit rating.
THE INFORMATION IN THIS STRUCTURAL AND COLLATERAL TERM SHEET IS NOT COMPLETE AND MAY BE AMENDED PRIOR TO THE TIME OF SALE. THIS TERM SHEET IS NOT AN OFFER TO SELL THESE SECURITIES AND IT IS NOT A SOLICITATION OF AN OFFER TO BUY THESE SECURITIES IN ANY JURISDICTION WHERE THE OFFER OR SALE IS NOT PERMITTED.
| 25 |
| 11 Madison Avenue New York, NY 10010 | Collateral Asset Summary – Loan No. 1 11 Madison Avenue | Cut-off Date Balance: Cut-off Date LTV: U/W NCF DSCR: U/W NOI Debt Yield: | $70,000,000 3.89x 14.3% |
A “Lease Sweep Period” will commence upon a bankruptcy proceeding in which the tenant and/or guarantor under either the Credit Suisse Lease or the Sony Lease, or its respective parent entity, (each a “Major Tenant”) is the debtor and will end upon the earlier to occur of (i) in the event either of the Major Tenant leases are rejected in the applicable bankruptcy proceeding, the date on which a sufficient portion of the space occupied under the defaulted Major Tenant Lease is re-leased so as to achieve a mortgage loan debt yield of 7.50% or greater and an aggregate debt yield of 5.75%, (ii) the date of an assumption or assignment of the applicable Major Tenant lease out of bankruptcy or (iii) the date on which the amount of $75.00 per rentable square foot of the relevant space is deposited into a rollover reserve account for approved leasing costs.
Initial Reserves. At loan closing, the borrowers deposited (i) $18,847,898 into the Sony free rent reserve account on account of free rent concessions with respect to the Sony lease, (ii) $39,000,000 in cash on account of outstanding payments with respect to the Credit Suisse sublease ($2,500,000 of the sublease payments were paid off at closing and the remaining $36,500,000 was deposited into the Credit Suisse sublease account), (iii) $1,000 into an endorsement reserve on account of outstanding disbursements to be made with respect to the delivery of updates to the title insurance policy and (iv) (a) $81,152,102 into the lease costs account to partially fund the lease costs, and (b) the Lease Costs Guaranty (defined below). The lease costs consist of (1) outstanding TI/LC obligations with respect to the Credit Suisse, Sony, Yelp and WME leases (collectively, the “Outstanding TI/LC Expenses”) and (2) the outstanding base building work obligations, detailed in the chart below, with respect to the Credit Suisse, Sony, Yelp and WME leases (the “Base Building Work”).
On the origination date, the guarantor delivered a guaranty (the “Lease Costs Guaranty”) in the amount of $59,060,332, which represents the remaining portion of the $140,212,434 of lease costs owed by the borrowers under existing leases, less the amount deposited in the lease costs reserve. The Lease Costs Guaranty covers an amount equal to (i) the lease costs outstanding (including any cost overruns) minus (ii) the sum of (A) the reserve funds in the lease costs account and (B) the amount of any lease costs letters of credit. In the event that the long-term unsecured S&P credit rating of the guarantor is less than “BB+”, the borrowers will be required to immediately deposit cash reserves into the lease costs account in the amount of (and in exchange for) any lease costs covered by the Lease Costs Guaranty; provided that in lieu of such cash collateralization, so long as no event of default exists, the borrower may elect to have all available cash applied to the lease costs account until all of the lease costs have been fully funded in cash.
Lease cost funds are required to be released and the Lease Costs Guaranty will be reduced, generally, on a pro rata basis as the borrowers satisfy the leasing obligations and incur the lease costs. In addition, amounts on reserve in the Sony free rent reserve account will be transferred to the lease costs account monthly in connection with the amortization of Sony’s free rent. The Lease Costs Guaranty will be reduced by such deposits into the lease costs account as well as deposits of any other reserve funds into the lease costs account.
| Lease Costs | |
| Lease Costs | Outstanding Amount |
| Credit Suisse Landlord Base Building Work | $21,591,448 |
| Sony Landlord Base Building Work | 19,931,438 |
| Credit Suisse Tenant Improvements(1) | 43,898,724 |
| Sony Tenant Improvements | 43,641,509 |
| Other Tenant Improvements | 4,533,205 |
| Credit Suisse Leasing Commissions | 4,529,626 |
| Sony Leasing Commissions | 0 |
| Other Leasing Commissions | 2,086,484 |
| Total Lease Costs | $140,212,434 |
| (1) | Includes $33,806,313 in anticipated work allowance under the 2017 Credit Suisse Lease. |
Ongoing Reserves. During the continuance of a Trigger Period, the borrowers are required to deposit, on a monthly basis, (i) 1/12 of the taxes payable in the next 12 months, (ii) provided an acceptable blanket policy is no longer in place, 1/12 of the insurance premiums payable in the next 12 months and (iii) $342,756 for annual capital expenditures.
Current Mezzanine or Subordinate Indebtedness. Two mezzanine loans were funded concurrently with the closing of the 11 Madison Avenue Loan Combination. A $150,000,000 mezzanine A loan, which is coterminous with the 11 Madison Avenue Loan, and accrues interest at a fixed per annum rate equal to 4.650% and a $175,000,000 mezzanine B loan, which is coterminous with the 11 Madison Avenue Loan, and accrues interest at a fixed per annum rate equal to 4.850%. An intercreditor agreement is in place with respect to the 11 Madison Avenue Loan and the related mezzanine loans.
Future Mezzanine or Subordinate Indebtedness Permitted. None.
THE INFORMATION IN THIS STRUCTURAL AND COLLATERAL TERM SHEET IS NOT COMPLETE AND MAY BE AMENDED PRIOR TO THE TIME OF SALE. THIS TERM SHEET IS NOT AN OFFER TO SELL THESE SECURITIES AND IT IS NOT A SOLICITATION OF AN OFFER TO BUY THESE SECURITIES IN ANY JURISDICTION WHERE THE OFFER OR SALE IS NOT PERMITTED.
| 26 |
| 11 Madison Avenue New York, NY 10010 | Collateral Asset Summary – Loan No. 1 11 Madison Avenue | Cut-off Date Balance: Cut-off Date LTV: U/W NCF DSCR: U/W NOI Debt Yield: | $70,000,000 3.89x 14.3% |
IDA Lease Units.A portion of the 11 Madison Avenue Property consisting of the leasehold interests in 9 condominium units, the related fee simple interests of which are owned by the New York City Industrial Development Agency, (“IDA”) is subject to a certain overlease agreement dated December 22, 1995, by and between the borrowers (as successor to tenant’s interest) and the IDA (as assigned and/or amended, the “11 Madison Avenue Overlease”). The rent under the 11 Madison Avenue Overlease is $10 for the full term and has been fully prepaid. The purpose of the 11 Madison Avenue Overlease is to substitute real property tax obligations with payments in lieu of real estate taxes. Credit Suisse is required to pay all PILOT pursuant to a PILOT Agreement dated December 1, 1995 between the IDA and Credit Suisse First Boston Corporation; however, under the sublease described under “Major Tenants” above, the borrowers have agreed to make such payments as to the subleased space. The IDA structure terminates on December 31, 2016. If the 11 Madison Avenue Overlease terminates for any reason, the fee simple interest in the condominium units subject to the 11 Madison Avenue Overlease reverts back to the borrower. The mortgage provides that upon any such reversion of condominium units to the borrowers, such condominium units will automatically be subject to the mortgage.
THE INFORMATION IN THIS STRUCTURAL AND COLLATERAL TERM SHEET IS NOT COMPLETE AND MAY BE AMENDED PRIOR TO THE TIME OF SALE. THIS TERM SHEET IS NOT AN OFFER TO SELL THESE SECURITIES AND IT IS NOT A SOLICITATION OF AN OFFER TO BUY THESE SECURITIES IN ANY JURISDICTION WHERE THE OFFER OR SALE IS NOT PERMITTED.
| 27 |
| 11 Madison Avenue New York, NY 10010 | Collateral Asset Summary – Loan No. 1 11 Madison Avenue | Cut-off Date Balance: Cut-off Date LTV: U/W NCF DSCR: U/W NOI Debt Yield: | $70,000,000 3.89x 14.3% |
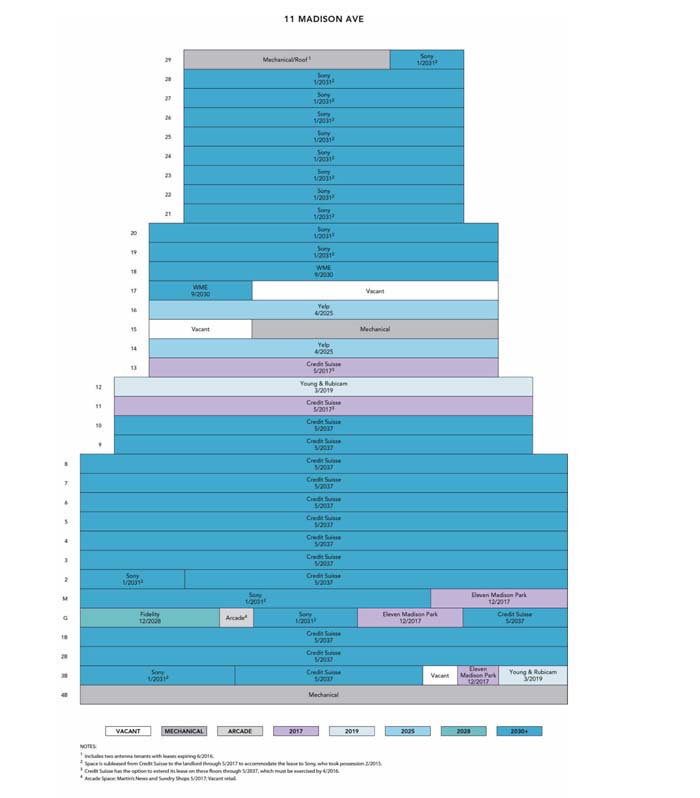
THE INFORMATION IN THIS STRUCTURAL AND COLLATERAL TERM SHEET IS NOT COMPLETE AND MAY BE AMENDED PRIOR TO THE TIME OF SALE. THIS TERM SHEET IS NOT AN OFFER TO SELL THESE SECURITIES AND IT IS NOT A SOLICITATION OF AN OFFER TO BUY THESE SECURITIES IN ANY JURISDICTION WHERE THE OFFER OR SALE IS NOT PERMITTED.
| 28 |
| 11 Madison Avenue New York, NY 10010 | Collateral Asset Summary – Loan No. 1 11 Madison Avenue | Cut-off Date Balance: Cut-off Date LTV: U/W NCF DSCR: U/W NOI Debt Yield: | $70,000,000 3.89x 14.3% |
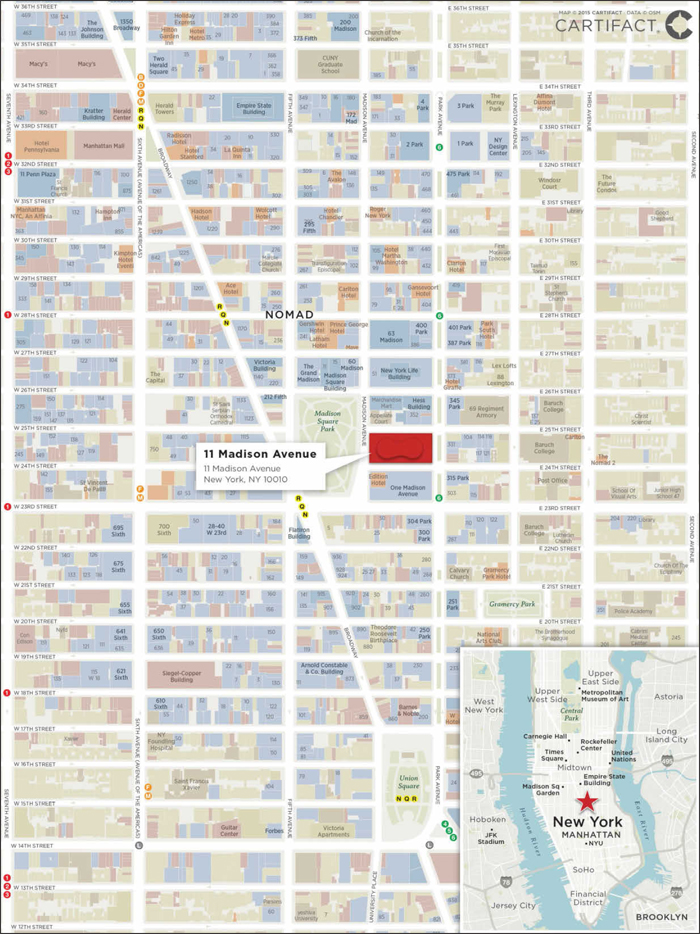
THE INFORMATION IN THIS STRUCTURAL AND COLLATERAL TERM SHEET IS NOT COMPLETE AND MAY BE AMENDED PRIOR TO THE TIME OF SALE. THIS TERM SHEET IS NOT AN OFFER TO SELL THESE SECURITIES AND IT IS NOT A SOLICITATION OF AN OFFER TO BUY THESE SECURITIES IN ANY JURISDICTION WHERE THE OFFER OR SALE IS NOT PERMITTED.
| 29 |
| Various, California | Collateral Asset Summary – Loan No. 2 NMS Los Angeles Multifamily | Cut-off Date Balance: Cut-off Date LTV: U/W NCF DSCR: U/W NOI Debt Yield: | $65,000,000 68.8% 1.31x 6.7% |
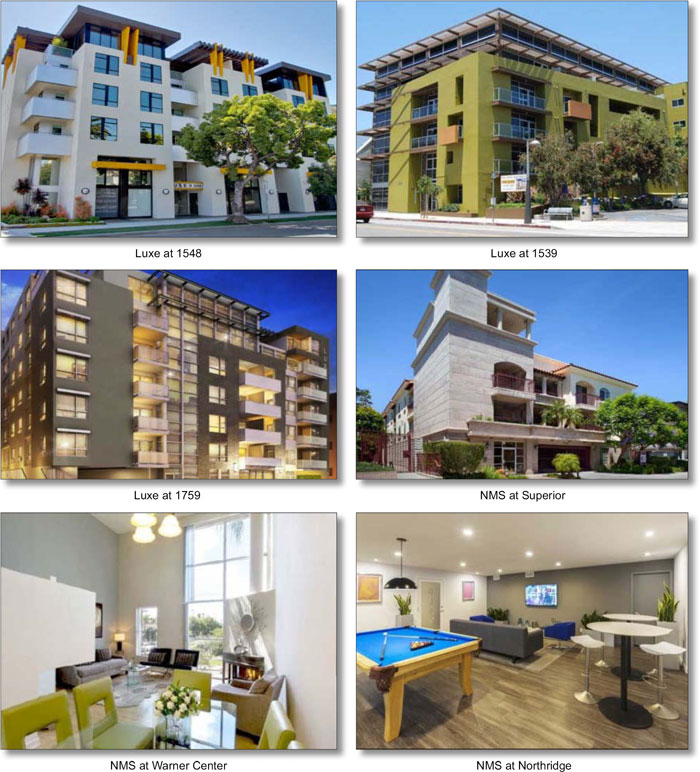
THE INFORMATION IN THIS STRUCTURAL AND COLLATERAL TERM SHEET IS NOT COMPLETE AND MAY BE AMENDED PRIOR TO THE TIME OF SALE. THIS TERM SHEET IS NOT AN OFFER TO SELL THESE SECURITIES AND IT IS NOT A SOLICITATION OF AN OFFER TO BUY THESE SECURITIES IN ANY JURISDICTION WHERE THE OFFER OR SALE IS NOT PERMITTED.
| 30 |
| Various, California | Collateral Asset Summary – Loan No. 2 NMS Los Angeles Multifamily | Cut-off Date Balance: Cut-off Date LTV: U/W NCF DSCR: U/W NOI Debt Yield: | $65,000,000 68.8% 1.31x 6.7% |
| Mortgage Loan Information | |
| Loan Seller: | CCRE |
| Loan Purpose: | Refinance |
| Sponsor: | Naum Neil Shekhter; Margot V. Shekhter |
| Borrower: | NMS 1539, LLC; NMS 1548, LLC; NMS 1759, LLC; NMS Superior Apartments, LLC; NMS Warner Center, LLC; NMS Northridge, LLC |
| Original Balance(1): | $65,000,000 |
| Cut-off Date Balance(1): | $65,000,000 |
| % by Initial UPB: | 7.0% |
| Interest Rate: | 4.9380% |
| Payment Date: | 6th of each month |
| First Payment Date: | October 6, 2015 |
| Maturity Date: | September 6, 2025 |
| Amortization: | Interest Only |
| Additional Debt(1): | $55,000,000 Pari Passu Debt |
| Call Protection(2)(3): | L(25), D(92), O(3) |
| Lockbox / Cash Management: | Springing Soft / Springing |
| Reserves(4) | ||
| Initial | Monthly | |
| Taxes: | $633,333 | $79,167 |
| Insurance: | $52,199 | $10,440 |
| Replacement: | $0 | $8,000 |
| Required Repairs: | $199,100 | NAP |
| Financial Information(5) | ||
| Cut-off Date Balance / Unit: | $312,500 | |
| Balloon Balance / Unit: | $312,500 | |
| Cut-off Date LTV(6): | 68.8% | |
| Balloon LTV(6): | 68.8% | |
| Underwritten NOI DSCR: | 1.33x | |
| Underwritten NCF DSCR: | 1.31x | |
| Underwritten NOI Debt Yield: | 6.7% | |
| Underwritten NCF Debt Yield: | 6.6% | |
| Underwritten NOI Debt Yield at Balloon: | 6.7% | |
| Underwritten NCF Debt Yield at Balloon: | 6.6% | |
| Property Information | |
| Single Asset / Portfolio: | Portfolio of six properties |
| Property Type: | Multifamily - Various |
| Collateral: | Fee Simple |
| Location: | Various, CA |
| Year Built / Renovated: | 1987-1988, 2003, 2008-2009 / 2015 |
| Total Units: | 384 |
| Property Management: | NMS Properties, Inc. |
| Underwritten NOI: | $7,981,432 |
| Underwritten NCF: | $7,885,432 |
| Appraised Value(6): | $174,300,000 |
| Appraisal Date: | June 9, 2015 |
| Historical NOI | |
| Most Recent NOI: | $7,372,651 (T-12 June 30, 2015) |
| 2014 NOI: | $7,012,973 (December 31, 2014) |
| 2013 NOI: | $6,035,021 (December 31, 2013) |
| 2012 NOI: | NAV |
| Historical Occupancy | |
| Most Recent Occupancy: | 99.2% (August 25, 2015) |
| 2014 Occupancy: | 94.8% (December 31, 2014) |
| 2013 Occupancy: | 94.8% (December 31, 2013) |
| 2012 Occupancy: | 96.9% (December 31, 2012) |
| (1) | The NMS Los Angeles Multifamily Portfolio Loan Combination is evidenced by threepari passu notes in the aggregate original principal amount of $120.0 million. The controlling Note A-1, with an original principal balance of $65.0 million, will be included in the COMM 2015-CCRE27 mortgage trust. The non-controlling Note A-2 and Note A-3, with an aggregate original principal balance of $55.0 million, will not be included in the trust and are expected to be held by CCRE or an affiliate. For additional information on thepari passu companion loans, see “The Loan” herein. |
| (2) | Partial release is permitted. See “Partial Release” herein. |
| (3) | The lockout period for defeasance will be at least 25 payment dates beginning with and including the first payment date of October 6, 2015. Defeasance of the full $120.0 million NMS Los Angeles Multifamily Portfolio Loan Combination is permitted on or after the date that is the earlier to occur of (i) two years after the closing date of the securitization that includes the lastpari passu note to be securitized and (ii) October 6, 2019. The assumed lockout period of 25 payments is based on the expected COMM 2015-CCRE27 securitization closing date in October 2015. The actual lockout period may be longer. |
| (4) | See “Initial Reserves” and “Ongoing Reserves” herein. |
| (5) | DSCR, LTV, Debt Yield and Balance / Unit calculations are based on the aggregate NMS Los Angeles Multifamily Portfolio Loan Combination. |
| (6) | The portfolio Appraised Value of $174.3 million reflects a premium attributed to the aggregate value of the NMS Los Angeles Multifamily Portfolio as a whole. The sum of the value of each of the NMS Los Angeles Multifamily Portfolio Properties on an individual basis is $163.8 million, which represents a Cut-off Date LTV and Balloon LTV of 73.3%. See “Letter of Credit” herein. |
THE INFORMATION IN THIS STRUCTURAL AND COLLATERAL TERM SHEET IS NOT COMPLETE AND MAY BE AMENDED PRIOR TO THE TIME OF SALE. THIS TERM SHEET IS NOT AN OFFER TO SELL THESE SECURITIES AND IT IS NOT A SOLICITATION OF AN OFFER TO BUY THESE SECURITIES IN ANY JURISDICTION WHERE THE OFFER OR SALE IS NOT PERMITTED.
| 31 |
| Various, California | Collateral Asset Summary – Loan No. 2 NMS Los Angeles Multifamily | Cut-off Date Balance: Cut-off Date LTV: U/W NCF DSCR: U/W NOI Debt Yield: | $65,000,000 68.8% 1.31x 6.7% |
| Portfolio Summary | |||||||||||||||
| Property | Location | Year Built / Renovated | # of Units | Allocated Loan Amount ($) | Allocated Loan Amount (%) | Appraised Value(1) | Occupancy(2) | ||||||||
| Luxe at 1548 | Santa Monica, CA | 2009 / NAP | 54 | $27,200,000 | 22.7% | $37,100,000 | 100.0% | ||||||||
| Luxe at 1539 | Santa Monica, CA | 2008 / NAP | 62 | $26,300,000 | 21.9% | $35,930,000 | 100.0% | ||||||||
| Luxe at 1759 | West Los Angeles, CA | 2009 / NAP | 61 | $23,500,000 | 19.6% | $32,110,000 | 100.0% | ||||||||
| NMS at Northridge | Northridge, CA | 1987 / 2015 | 102 | $21,500,000 | 17.9% | $29,290,000 | 99.0% | ||||||||
| NMS at Warner Center | Canoga Park, CA | 1988 / NAP | 79 | $15,300,000 | 12.8% | $20,920,000 | 97.5% | ||||||||
| NMS at Superior | Northridge, CA | 2003 / 2015 | 26 | $6,200,000 | 5.2% | $8,450,000 | 100.0% | ||||||||
| Total / Wtd. Avg. | 384 | $120,000,000 | 100.0% | $163,800,000 | 99.2% | ||||||||||
| Total with Portfolio Premium | $174,300,000 | ||||||||||||||
| (1) | The portfolio Appraised Value of $174.3 million reflects a premium attributed to the aggregate value of the NMS Los Angeles Multifamily Portfolio as a whole. The sum of the value of each of the NMS Los Angeles Multifamily Portfolio Properties on an individual basis is $163.8 million. |
| (2) | Occupancy based on a rent roll dated August 25, 2015. |
The Loan.The NMS Los Angeles Multifamily Portfolio loan (the “NMS Los Angeles Multifamily Portfolio Loan”) is a fixed rate loan secured by the borrowers’ fee simple interest in a 384-unit, six property portfolio of mid-rise and garden apartment properties located in Santa Monica, Northridge and Canoga Park, Los Angeles, California (each a “Property”, collectively, the “NMS Los Angeles Multifamily Portfolio Properties”) with an original and cut-off date principal balance of $120.0 million. The NMS Los Angeles Multifamily Portfolio Loan is evidenced by the controlling Note A-1, with original principal balance of $65.0 million, which will be included in the COMM 2015-CCRE27 Mortgage Trust. The pari passu non-controlling Note A-2, and Note A-3, with an aggregate original principal balance of $55.0 million (and, together with the NMS Los Angeles Multifamily Portfolio Loan, the “NMS Los Angeles Multifamily Portfolio Loan Combination”), will not be included in the trust and are expected to be held by CCRE or an affiliate or transferred to a future securitization.
The relationship between the holders of the NMS Los Angeles Multifamily Portfolio Loan Combination is governed by a co-lender agreement as described under “Description of the Mortgage Pool–Loan Combinations–The NMS Los Angeles Multifamily Portfolio Loan” in the Free Writing Prospectus.
| Loan Combination Summary | |||||
| Original Balance | Cut-off Date Balance | Note Holder | Controlling Piece | ||
| Note A-1 | $65,000,000 | $65,000,000 | COMM 2015-CCRE27 | Yes | |
| Note A-2 & A-3 | $55,000,000 | $55,000,000 | CCRE | No | |
| Total | $120,000,000 | $120,000,000 | |||
The NMS Los Angeles Multifamily Portfolio Loan has a 10-year term and interest only payments for the term of the loan. The NMS Los Angeles Multifamily Portfolio Loan accrues interest at a fixed rate equal to 4.9380%. Loan proceedswere used to retire existing debt of approximately $89.5 million, fund upfront reserves of approximately $884,632, pay closing costs and return approximately $28.8 million of equity to the borrower. Based on the portfolio appraised value of $174.3 million as of June 9, 2015, the cut-off date LTV ratio is 68.8%. The most recent prior financings of the NMS Los Angeles Multifamily Portfolio Properties were included in the FREMF 2010-K9, FREMF 2011-K11, FREMF 2012-K709 and COMM 2007-C9 securitizations.
| Sources and Uses | ||||||
| Sources | Proceeds | % of Total | Uses | Proceeds | % of Total | |
| Mortgage Loan | $120,000,000 | 100.0% | Loan Payoff | $89,464,958 | 74.6% | |
| Reserves | $884,632 | 0.7% | ||||
| Closing Costs | $857,010 | 0.7% | ||||
| Return of Equity | $28,793,400 | 24.0% | ||||
| Total Sources | $120,000,000 | 100.0% | Total Uses | $120,000,000 | 100.0% | |
The Borrowers / Sponsor.The borrowers are NMS 1539, LLC, NMS 1548, LLC, NMS 1759, LLC, NMS Superior Apartments, LLC, NMS Warner Center, LLC, NMS Northridge, LLC, each a single purpose Delaware limited liability company, structured to be bankruptcy-remote, with two independent directors in its organizational structure. The sponsors of the borrower and the nonrecourse carve-out guarantors are Naum Neil Shekhter and Margot V. Shekhter, on a joint and several basis.
THE INFORMATION IN THIS STRUCTURAL AND COLLATERAL TERM SHEET IS NOT COMPLETE AND MAY BE AMENDED PRIOR TO THE TIME OF SALE. THIS TERM SHEET IS NOT AN OFFER TO SELL THESE SECURITIES AND IT IS NOT A SOLICITATION OF AN OFFER TO BUY THESE SECURITIES IN ANY JURISDICTION WHERE THE OFFER OR SALE IS NOT PERMITTED.
| 32 |
| Various, California | Collateral Asset Summary – Loan No. 2 NMS Los Angeles Multifamily | Cut-off Date Balance: Cut-off Date LTV: U/W NCF DSCR: U/W NOI Debt Yield: | $65,000,000 68.8% 1.31x 6.7% |
Neil Shekhter has over 25 years of developing and managing multifamily properties. Mr. Shekhter founded NMS Properties, a privately owned real estate development and management firm, in 1988. NMS Properties manages more than 50 properties with approximately 2,000 apartment units and 320,000 sq. ft. of retail and commercial space in the Los Angeles area. NMS Properties also has an additional 2,500 multifamily units and 200,000 sq. ft. of mixed-use space under development.
The Properties.The NMS Los Angeles Multifamily Portfolio Properties consist of six, Class A mid-rise (66.3% of appraised value) and garden style (33.7% of appraised value) multifamily properties totaling 384 units located in the Santa Monica, Los Angeles and San Fernando Valley areas of California. As of August 25, 2015, the NMS Los Angeles Multifamily Portfolio Properties were 99.2% occupied and have maintained a weighted average historical occupancy of 96.7% since 2011.
The NMS Los Angeles Multifamily Portfolio Properties are equipped with various mixes of luxury amenities and fixtures including pools, jacuzzis, fitness rooms, saunas, stainless steel appliances, loft-style high ceilings, in-unit washers and dryers, central A/C and heating, on-site management and maintenance, underground gated parking, hardwood style flooring, and large windows and balconies.
The Luxe at 1548, Luxe at 1539 and Luxe at 1759 Properties (collectively, the “West LA / Santa Monica Properties”) were all built by the sponsor within the past seven years, (2009, 2008, and 2009 respectively). NMS at Superior was built by the sponsor in 2003 and the NMS at Northridge and NMS at Warner Center (collectively, the “Canoga Park / Northridge Properties”) were purchased by the sponsor in 1999 and 1997, respectively. The Properties are well located in their respective markets proximate to the respective major demand drivers including the Third Street Promenade and Santa Monica Pier in Santa Monica, UCLA in Westwood and Sawtelle Japantown in West Los Angeles, and California State University at Northridge (CSUN), Pierce College and Warner Center in the San Fernando Valley.
The NMS Los Angeles Multifamily Portfolio Properties have experienced consistent growth in rental rates. For the West LA / Santa Monica Properties and Canoga Park / Northridge Properties, new leases executed over the past three months have average net rental rates that are 7.0% and 5.0% higher, respectively, as compared to their twelve month averages.
Luxe at 1548 Property The Luxe at 1548 Property consists of one, Class A five-story apartment building with 54 units and approximately 1,000 sq. ft. of ground floor commercial/office space. The Luxe at 1548 Property was constructed in 2009 and is 100.0% occupied as of August 25, 2015. The Luxe at 1548 Property features 1 bed/1 bath configurations and 2 bed/2 bath configurations, 102 subterranean garage parking spaces and a concierge dry cleaning service. The Luxe at 1548 Property is located in the city of Santa Monica in west Los Angeles County, California.
The property is situated five blocks from Ocean Avenue and less than a mile from the Santa Monica Pier. Additionally, the property is located within one block of the Santa Monica station of the Expo Line, a light-rail line providing access to downtown Los Angeles that is anticipated to open in 2016. According to walkscore.com, the Luxe at 1548 Property received a walk score of 92. One unit at the Luxe at 1548 Property is currently leased to low income tenants under affordability restrictions. The Luxe at 1548 Property is subject to a springing deed restriction as described below under “Letter of Credit.”
| Luxe at 1548 Property Unit Mix Summary(1) | |||||||
| Unit Type | # of Units | % of Total | Occupied Units | Occupancy | Average Unit Size (Sq. Ft.) | Average Monthly Rental Rate | Average Monthly Rental Rate PSF |
| 1 Bed / 1 Bath | 17 | 31.5% | 17 | 100.0% | 676 | $3,312 | $4.90 |
| 1 Bed / 1 Bath | 1 | 1.9% | 1 | 100.0% | 625 | $1,708(2) | $2.73 |
| 2 Bed / 2 Bath | 33 | 61.1% | 33 | 100.0% | 875 | $3,719 | $4.25 |
| 1 Bed / 1 Bath-Pent | 1 | 1.9% | 1 | 100.0% | 725 | $4,031 | $5.56 |
| 1 Bed / 1 Bath-Pent | 1 | 1.9% | 1 | 100.0% | 1,050 | $5,558 | $5.29 |
| 2 Bed / 2 Bath | 1 | 1.9% | 1 | 100.0% | 1,100 | $5,885 | $5.35 |
| Total / Wtd. Avg. | 54 | 100.0% | 54 | 100.0% | 812 | $3,634 | $4.47 |
| (1) | Based on appraisal. |
| (2) | Affordable unit. |
THE INFORMATION IN THIS STRUCTURAL AND COLLATERAL TERM SHEET IS NOT COMPLETE AND MAY BE AMENDED PRIOR TO THE TIME OF SALE. THIS TERM SHEET IS NOT AN OFFER TO SELL THESE SECURITIES AND IT IS NOT A SOLICITATION OF AN OFFER TO BUY THESE SECURITIES IN ANY JURISDICTION WHERE THE OFFER OR SALE IS NOT PERMITTED.
| 33 |
| Various, California | Collateral Asset Summary – Loan No. 2 NMS Los Angeles Multifamily | Cut-off Date Balance: Cut-off Date LTV: U/W NCF DSCR: U/W NOI Debt Yield: | $65,000,000 68.8% 1.31x 6.7% |
Luxe at 1539 Property The Luxe at 1539 Property consists of one, Class A six-story apartment building with 62 units and approximately 940 sq. ft. of ground floor office space. The Luxe at 1539 Property was constructed in 2008 and is 100.0% occupied as of August 25, 2015. The Luxe at 1539 Property features 1 bed/1 bath configurations and loft/1.5 bath configurations as well as 83 subterranean garage parking spaces. The Luxe at 1539 Property is located in the city of Santa Monica in west Los Angeles County, California, which is located approximately 16 miles of west of the Los Angeles CBD.
The property is located three blocks from Ocean Avenue and approximately 0.5 miles from the Santa Monica Pier. Additionally, the Luxe at 1539 Property is directly across the street from Santa Monica Place and Third Street Promenade, a premier shopping destination, and adjacent to the Santa Monica station of the Expo Line. According to walkscore.com, the Luxe at 1539 Property received a walk score of 94.
| Luxe at 1539 Property Unit Mix Summary(1) | |||||||
| Unit Type | # of Units | % of Total | Occupied Units | Occupancy | Average Unit Size (Sq. Ft.) | Average Monthly Rental Rate | Average Monthly Rental Rate PSF |
| 1 Bed / 1 Bath-Jr. | 26 | 41.9% | 26 | 100.0% | 482 | $2,724 | $5.65 |
| 1 Bed / 1 Bath | 19 | 30.6% | 19 | 100.0% | 599 | $2,929 | $4.89 |
| 1 Bed / 1 Bath+Den | 2 | 3.2% | 2 | 100.0% | 803 | $3,104 | $3.87 |
| Loft / 1.5 Bath | 14 | 22.6% | 14 | 100.0% | 803 | $3,688 | $4.59 |
| 1 Bed / 1 Bath-Pent | 1 | 1.6% | 1 | 100.0% | 1,025 | $3,922 | $3.83 |
| Total / Wtd. Avg. | 62 | 100.0% | 62 | 100.0% | 609 | $3,036 | $4.98 |
| (1) | Based on appraisal. |
Luxe at 1759 PropertyThe Luxe at 1759 Property consists of one, seven-story apartment building with 61 units. The Luxe at 1759 Property was constructed in 2009 and is 100.0% occupied as of August 25, 2015. The Luxe at 1759 Property features 1 bed/1 bath configurations, loft/1 bath configurations, 2 bed/2 bath configurations, 3 bed/2 bath configurations, 3 bed/3 bath configurations and 4 bed/3 bath configurations as well as 81 subterranean garage parking spaces. The Luxe at 1759 Property is located within the community of Sawtelle in the city of Los Angeles in west Los Angeles County, California. The property is adjacent to San Diego Freeway (Interstate 405) and the Sawtelle corridor and is proximate to Brentwood (approximately 2.1 miles), UCLA (approximately 2.5 miles), Century City (approximately 2.9 miles), Beverly Hills (approximately 3.5 miles) and Santa Monica (approximately 3.3 miles).
Downtown Los Angeles is accessible from the 10 Freeway, approximately 11 miles east of the Luxe at 1759 Property. According to walkscore.com, the Luxe at 1539 Property received a walk score of 93. Five units at the Luxe at 1759 Property are currently leased to low income tenants under affordability restrictions.
| Luxe at 1759 Property Unit Mix Summary(1) | |||||||
| Unit Type | # of Units | % of Total | Occupied Units | Occupancy | Average Unit Size (Sq. Ft.) | Average Monthly Rental Rate | Average Monthly Rental Rate PSF |
| 1 Bed / 1 Bath | 26 | 42.6% | 26 | 100.0% | 447 | $2,182 | $4.88 |
| 1 Bed / 1 Bath | 4 | 6.6% | 4 | 100.0% | 630 | $2,553 | $4.05 |
| Loft / 1 Bath | 4 | 6.6% | 4 | 100.0% | 750 | $3,117 | $4.16 |
| 2 Bed / 2 Bath | 16 | 26.2% | 16 | 100.0% | 1,008 | $3,144 | $3.12 |
| 3 Bed / 2 Bath | 6 | 9.8% | 6 | 100.0% | 1,133 | $3,797 | $3.35 |
| 3 Bed / 3 Bath | 2 | 3.3% | 2 | 100.0% | 1,323 | $4,358 | $3.30 |
| 3 Bed / 3 Bath | 1 | 1.6% | 1 | 100.0% | 1,520 | $4,600 | $3.03 |
| 4 Bed / 3 Bath | 2 | 3.3% | 2 | 100.0% | 1,400 | $5,013 | $3.58 |
| Total / Wtd. Avg. | 61 | 100.0% | 61 | 100.0% | 771 | $2,883 | $3.74 |
| (1) | Based on appraisal. |
THE INFORMATION IN THIS STRUCTURAL AND COLLATERAL TERM SHEET IS NOT COMPLETE AND MAY BE AMENDED PRIOR TO THE TIME OF SALE. THIS TERM SHEET IS NOT AN OFFER TO SELL THESE SECURITIES AND IT IS NOT A SOLICITATION OF AN OFFER TO BUY THESE SECURITIES IN ANY JURISDICTION WHERE THE OFFER OR SALE IS NOT PERMITTED.
| 34 |
| Various, California | Collateral Asset Summary – Loan No. 2 NMS Los Angeles Multifamily | Cut-off Date Balance: Cut-off Date LTV: U/W NCF DSCR: U/W NOI Debt Yield: | $65,000,000 68.8% 1.31x 6.7% |
NMS at Northridge Property The NMS at Northridge Property consists of four, two-story apartment buildings with 102 units, a clubhouse, pool, and spa and fitness center. The NMS at Northridge Property was constructed in 1987 and is 99.0% occupied as of August 25, 2015. NMS at Northridge Property features 1 bed/1 bath configurations, 2 bed/2 bath configurations and 3 bed/2 bath configurations, and private garages providing 211 parking spaces. The property is currently undergoing in-unit renovations, which include flooring upgrades, stainless steel appliances, new cabinets, granite countertops and upgraded light fixtures, among other things. According to the borrower, approximately 60% of the units have been renovated with the remaining units scheduled for renovation as tenants vacate. The NMS at Northridge Property is located in the city of Northridge within the San Fernando Valley area.
Additionally, the NMS at Northridge Property is located across the street from California State University at Northridge (approximately 32,500 full-time students) and 40,131 total students). The university has the largest student body out of all 23 campuses in the California State University system and is the second largest university in California. According to the borrower, approximately 33.0% of the NMS at Northridge Property is leased to students. Twelve units at the NMS at Northridge Property are currently leased to low income tenants under affordability restrictions. The restrictions expired in 2012 and the borrower intends to lease these units to market rent tenants as the current tenants vacate.
| NMS at Northridge Property Unit Mix Summary(1) | |||||||
| Unit Type | # of Units | % of Total | Occupied Units | Occupancy | Average Unit Size (Sq. Ft.) | Average Monthly Rental Rate | Average Monthly Rental Rate PSF |
| 1 Bed / 1 Bath | 6 | 5.9% | 6 | 100.0% | 650 | $1,472 | $2.26 |
| 1 Bed / 1 Bath | 10 | 9.8% | 10 | 100.0% | 700 | $1,473 | $2.10 |
| 2 Bed / 2 Bath | 85 | 83.3% | 84 | 98.8% | 900 | $1,856 | $2.06 |
| 3 Bed / 2 Bath | 1 | 1.0% | 1 | 100.0% | 1,100 | $2,000 | $1.82 |
| Total / Wtd. Avg. | 102 | 100.0% | 101 | 99.0% | 868 | $1,797 | $2.07 |
| (1) | Based on appraisal. |
NMS at Warner Center Property The NMS at Warner Center Property consists of eight, two and three-story apartment buildings with 79 units. The NMS at Warner Center Property was constructed in 1988 and is 97.5% occupied as of August 25, 2015. The NMS at Warner Center Property features 1 bed/1 bath configurations, 2 bed/2 bath configurations and 3 bed/2 bath configurations as well as 195 subterranean garage parking spaces. The NMS at Warner Center Property is located in the city of Canoga Park within the San Fernando Valley. Additionally, the NMS at Warner Center Property is located within approximately one mile of Warner Center, 1.5 miles of Westfield Topanga and Westfield Promenade and approximately 5.1 miles of Northridge Fashion Center. Eight units at the NMS at Warner Center Property are currently leased to low income tenants under affordability restrictions. The restrictions expired in 2013 and the borrower intends to lease these units to market rent tenants as the current tenants vacate.
| NMS at Warner Center Property Unit Mix Summary(1) | |||||||
| Unit Type | # of Units | % of Total | Occupied Units | Occupancy | Average Unit Size | Average Monthly Rental Rate | Average Monthly Rental Rate PSF |
| 1 Bed / 1 Bath | 26 | 32.9% | 24 | 92.3% | 700 | $1,633 | $2.33 |
| 2 Bed / 2 Bath | 40 | 50.6% | 40 | 100.0% | 900 | $1,860 | $2.07 |
| 3 Bed / 2 Bath | 13 | 16.5% | 13 | 100.0% | 1,050 | $2,127 | $2.03 |
| Total / Wtd. Avg. | 79 | 100.0% | 77 | 97.5% | 859 | $1,829 | $2.13 |
| (1) | Based on appraisal. |
NMS at Superior Property The NMS at Superior Property consists of one two-story apartment building with 26 units. The NMS at Superior Property was constructed in 2003 and is 100.0% occupied as of August 25, 2015. The NMS at Superior Property features 1 bed/2 bath configurations, 2 bed/2 bath configurations, 3 bed/2 bath configurations and 3 bed/3 bath configurations, 58 podium parking spaces. The NMS at Superior Property is located in the city of Northridge in the county of Los Angeles, California. The NMS at Superior Property is located in the San Fernando Valley area, adjacent to the NMS at Northridge Property and within walking distance of the California State University at Northridge. According to the borrower, approximately 33.0% of the NMS at Superior Property is leased to students.
| NMS at Superior Property Unit Mix Summary(1) | |||||||
| Unit Type | # of Units | % of Total | Occupied Units | Occupancy | Average Unit Size (Sq. Ft.) | Average Monthly Rental Rate | Average Monthly Rental Rate PSF |
| 1 Bed / 2 Bath | 2 | 7.7% | 2 | 100.0% | 900 | $1,822 | $2.02 |
| 2 Bed / 2 Bath | 20 | 76.9% | 20 | 100.0% | 1,000 | $2,131 | $2.13 |
| 3 Bed / 2 Bath | 2 | 7.7% | 2 | 100.0% | 1,200 | $2,611 | $2.18 |
| 3 Bed / 3 Bath | 2 | 7.7% | 2 | 100.0% | 1,250 | $2,672 | $2.14 |
| Total / Wtd. Avg. | 26 | 100.0% | 26 | 100.0% | 1,027 | $2,186 | $2.13 |
| (1) | Based on appraisal. |
THE INFORMATION IN THIS STRUCTURAL AND COLLATERAL TERM SHEET IS NOT COMPLETE AND MAY BE AMENDED PRIOR TO THE TIME OF SALE. THIS TERM SHEET IS NOT AN OFFER TO SELL THESE SECURITIES AND IT IS NOT A SOLICITATION OF AN OFFER TO BUY THESE SECURITIES IN ANY JURISDICTION WHERE THE OFFER OR SALE IS NOT PERMITTED.
| 35 |
| Various, California | Collateral Asset Summary – Loan No. 2 NMS Los Angeles Multifamily | Cut-off Date Balance: Cut-off Date LTV: U/W NCF DSCR: U/W NOI Debt Yield: | $65,000,000 68.8% 1.31x 6.7% |
Environmental Matters.The Phase I environmental reports dated August 25, 2015 or August 12, 2015 recommended no further action at the NMS Los Angeles Multifamily Properties other than the continued implementation of the existing asbestos operations & maintenance plans.
The Market.
| Market Comparison(1) | ||||||||
| Market Conclusion(4) | 5-Mile Radius | |||||||
| Property Name | Monthly Rent Per Unit(2) | Monthly Rent PSF |
Occupancy(3) | Monthly Rent Per Unit | Monthly Rent PSF | Occupancy | Population | Median Household Income |
| Luxe at 1548 Property | $3,634 | $4.47 | 100.0% | $3,473 | $4.28 | 96% | 428,511 | $69,889 |
| Luxe at 1539 Property | $3,036 | $4.98 | 100.0% | $2,946 | $4.83 | 96% | 419,112 | $70,180 |
| Luxe at 1759 Property | $2,883 | $3.74 | 100.0% | $2,797 | $3.63 | 96% | 598,596 | $68,451 |
| NMS at Northridge Property | $1,797 | $2.07 | 99.0% | $1,804 | $2.08 | 95% | 583,649 | $53,692 |
| NMS at Warner Center Property | $1,829 | $2.13 | 97.5% | $1,813 | $2.11 | 95% | 445,276 | $61,411 |
| NMS at Superior Property | $2,186 | $2.13 | 100.0% | $2,081 | $2.03 | 95% | 584,359 | $53,707 |
| Wtd. Average: | $2,461 | $3.16 | 99.2% | $2,401 | $3.08 | 95% | 509,222 | $62,565 |
| (1) | Based on appraisals. |
| (2) | Monthly Rent Per Unit amounts are exclusive (gross) of concessions. |
| (3) | Based on rent rolls dated August 25, 2015. |
| (4) | Represents appraiser’s concluded market rent and occupancy. |
The NMS Los Angeles Multifamily Portfolio Properties are all located within Los Angeles County. As of Q1 2015, the Los Angeles apartment market reported an average vacancy rate of 3.2%, in line with the average vacancy rate from 2010 to 2014 of 3.7%. During the same time period, Class A units reported an increase in asking rent of 2.5% year-over year.
The Santa Monica / West Los Angeles Properties are situated in West Los Angeles. From 2010-2015, the population grew by approximately 3.45% and is estimated to grow by an additional 3.82% by 2020. The Canoga Park / Northridge Properties are situated in the San Fernando Valley. From 2010-2015, the population grew by approximately 3.76% and is estimated to grow by an additional 4.08% by 2020.
Santa Monica The Luxe at 1548 Property and Luxe at 1539 Property are located in the city of Santa Monica in west Los Angeles County, California. As of August 25, 2015, the occupancy and average monthly rent per unit at the Luxe at 1548 Property and Luxe at 1539 Property was 100.0% and $3,634, respectively, and 100.0% and $3,036, respectively.
West Los Angeles The Luxe at 1759 Property is located in the city of Los Angeles in west Los Angeles County, California. As of August 25, 2015, the occupancy and average monthly rent per unit at the Luxe at 1759 Property were 100.0% and $2,883, respectively.
Northridge The NMS at Northridge Property and NMS at Superior Property are located in the city of Northridge within the San Fernando Valley area of northern Los Angeles. As of August 25, 2015, the occupancy and average monthly rent per unit at the NMS at Northridge Property and NMS at Superior Property were 99.0% and $1,797, respectively, and 100.0% and $2,186, respectively.
Canoga Park The NMS at Warner Center Property is located in the city of Canoga Park, within the San Fernando Valley area of northern Los Angeles, California. As of July 20, 2015, the occupancy and average monthly rent per unit at the NMS at Warner Center Property was 97.5% and $1,829, respectively.
Inventory growth is limited within the NMS Los Angeles Multifamily Portfolio’s submarkets due to high barriers to entry including significant costs of development. In addition to the lack of new supply, the submarkets have averaged a net effective rent growth rate of approximately 2.5% per year for the past five years.
| NMS Los Angeles Multifamily Portfolio – Submarket Inventory Growth and Rent Growth(1) | ||||||||||||
| Santa Monica | West Los Angeles | Northridge | Canoga Park | |||||||||
| Year | Inventory Growth | Vacancy | Rent Growth | Inventory Growth | Vacancy | Rent Growth | Inventory Growth | Vacancy | Rent Growth | Inventory Growth | Vacancy | Rent Growth |
| 2011 | 0.0% | 3.3% | 2.2% | 0.4% | 4.1% | 1.1% | 0.0% | 3.0% | 1.7% | 2.6% | 6.8% | 1.6% |
| 2012 | 0.2% | 3.0% | 3.7% | 0.2% | 3.4% | 4.4% | 0.0% | 2.4% | 2.8% | 0.5% | 5.2% | 3.9% |
| 2013 | 0.7% | 2.8% | 1.2% | 0.2% | 3.1% | 1.3% | 0.0% | 2.0% | 3.2% | 4.1% | 6.2% | 4.6% |
| 2014 | 0.8% | 3.2% | 2.6% | 0.2% | 2.9% | 3.9% | 0.0% | 1.5% | 2.0% | 0.0% | 5.0% | 1.2% |
| 2015 | 0.0% | 3.0% | 2.1% | 0.1% | 2.9% | 2.4% | 0.0% | 1.3% | 2.5% | 0.0% | 4.3% | 2.3% |
| Avg. | 0.3% | 3.1% | 2.4% | 0.2% | 3.3% | 2.6% | 0.0% | 2.0% | 2.4% | 1.4% | 5.5% | 2.7% |
| (1) | Source: Market Research Report. |
THE INFORMATION IN THIS STRUCTURAL AND COLLATERAL TERM SHEET IS NOT COMPLETE AND MAY BE AMENDED PRIOR TO THE TIME OF SALE. THIS TERM SHEET IS NOT AN OFFER TO SELL THESE SECURITIES AND IT IS NOT A SOLICITATION OF AN OFFER TO BUY THESE SECURITIES IN ANY JURISDICTION WHERE THE OFFER OR SALE IS NOT PERMITTED.
| 36 |
| Various, California | Collateral Asset Summary – Loan No. 2 NMS Los Angeles Multifamily | Cut-off Date Balance: Cut-off Date LTV: U/W NCF DSCR: U/W NOI Debt Yield: | $65,000,000 68.8% 1.31x 6.7% |
Cash Flow Analysis.
| Cash Flow Analysis | ||||||
| 2013 | 2014 | T-12 6/30/2015 | T-3 6/30/2015 Annualized | U/W | U/W per Unit | |
| Gross Potential Rent(1) | $10,534,060 | $10,944,140 | $11,107,643 | $11,151,132 | $11,281,164 | $29,378 |
| Total Other Income(2) | 328,176 | 545,392 | 578,080 | 586,980 | 582,021 | 1,516 |
| Less: Vacancy & Concessions(3) | (1,868,645) | (1,597,137) | (1,365,050) | (1,116,340) | (1,022,203) | (2,662) |
| Effective Gross Income | $8,993,590 | $9,892,396 | $10,320,673 | $10,621,772 | $10,840,983 | $28,232 |
| Total Operating Expenses(4) | 2,958,570 | 2,879,423 | 2,948,022 | 2,948,022 | 2,859,551 | 7,447 |
| Net Operating Income | $6,035,021 | $7,012,972 | $7,372,650 | $7,673,750 | $7,981,432 | $20,785 |
| Capital Expenditures | 0 | 0 | 0 | 0 | 96,000 | 250 |
| Net Cash Flow(5) | $6,035,021 | $7,012,972 | $7,372,650 | $7,673,750 | $7,885,432 | $20,535 |
| (1) | U/W Gross Potential Rent is based on the rent rolls as of August 25, 2015. |
| (2) | Other Income includes, among other things, commercial rental income and furnished unit rental income. |
| (3) | Vacancy & Concessions collectively represents 9.1% of U/W Gross Potential Rent. Vacancy represents approximately 4.0% of U/W Gross Potential Rent. As of August 25, 2015, in-place vacancy at the NMS Los Angeles Multifamily Portfolio Properties is 0.8%. The appraiser concluded an average market vacancy rate of 4.0%. |
| (4) | Taxes are based on the T-12 actual taxes for the period ending June 30, 2015. |
| (5) | The increase in Net Cash Flow from 2013 to U/W is the result of, among other things: (1) four newly built units coming online in 2014 at the Luxe at 1548 Property, (2) general re-stabilization following displacement/disruption during the construction period (2013-2014) of the four units at the Luxe at 1548 Property, (3) general re-stabilization following displacement/disruption at the Luxe at 1548 Property and Luxe at 1539 Property as result of the 2013-2014 ongoing construction of the adjacent Santa Monica Light Rail Expo, (4) initiation of furnished rental program in 2014, (5) NMS at Northridge Property rental rate growth resulting from ongoing interior unit renovations, (6) commercial space leasing and (7) general market rent growth. |
Property Management. The NMS Los Angeles Multifamily Portfolio Properties are managed by NMS Properties, Inc. a California corporation and an affiliate of the borrowers.
Lockbox / Cash Management. The NMS Los Angeles Multifamily Portfolio Loan is structured with a springing soft lockbox and springing cash management. A soft lockbox, in-place cash management and an excess cash flow sweep will occur during a Cash Trap Period.
A “Cash Trap Period” will occur (i) during an event of default, (ii) during any bankruptcy action of the borrowers, guarantors or property manager or (iii) upon the failure of the borrowers after the end of two consecutive calendar quarters to maintain an aggregate NMS Los Angeles Multifamily Portfolio Loan debt service coverage ratio of at least 1.20x until the debt service coverage ratio is at least 1.25x for two consecutive calendar quarters.
Initial Reserves.At loan closing, the borrowers deposited (i) $633,333 into a tax reserve account, (ii) $52,199 into an insurance reserve account and (iii) $199,100 into a required repairs reserve account, which represents approximately 125.0% of the engineer’s estimated immediate repairs.
Ongoing Reserves. On a monthly basis, the borrowers are required to deposit reserves of (i) 1/12 of the estimated annual real estate taxes, which currently equates to $79,167, into a tax reserve account, (ii) 1/12 of the annual insurance premiums, which currently equates to $10,440, into an insurance reserve account and (iii) $8,000 ($250 per unit annually) into a capital expenditure account.
Current Mezzanine or Subordinate Indebtedness. None.
Future Mezzanine or Subordinate Indebtedness Permitted. None.
Partial Release.On any payment date after the lockout period, the borrower may obtain the release of any NMS Los Angeles Multifamily Portfolio Property, provided, among other things, (i) no event of default has occurred and (ii) the borrowers deliver defeasance collateral in an amount equal to the greater of (a) 125% of the related allocated loan amount for the individual property being released, (b) 100% of the net sales proceeds with respect to such property or (c) the amount necessary to satisfy the requirements that (i) the combined LTV of the remaining properties is less than or equal to the lesser of (x) 68.8% or (y) the LTV immediately prior to the release, (ii) the combined DSCR of the remaining properties is at least equal to the greater of (x) 1.20x or (y) the DSCR immediately prior to the release, (iii) the combined debt yield of the remaining properties is at least equal to the greater of (x) 6.0% or (y) the debt yield immediately prior to the release and (iv) the loan documents require that two of the following properties: (A) the Luxe at 1759 Property, (B) the NMS at Warner Center Property or (C) the NMS at Northridge Property be released before a release of the Luxe at 1548 Property or Luxe at 1539 Property is permitted.
THE INFORMATION IN THIS STRUCTURAL AND COLLATERAL TERM SHEET IS NOT COMPLETE AND MAY BE AMENDED PRIOR TO THE TIME OF SALE. THIS TERM SHEET IS NOT AN OFFER TO SELL THESE SECURITIES AND IT IS NOT A SOLICITATION OF AN OFFER TO BUY THESE SECURITIES IN ANY JURISDICTION WHERE THE OFFER OR SALE IS NOT PERMITTED.
| 37 |
| Various, California | Collateral Asset Summary – Loan No. 2 NMS Los Angeles Multifamily | Cut-off Date Balance: Cut-off Date LTV: U/W NCF DSCR: U/W NOI Debt Yield: | $65,000,000 68.8% 1.31x 6.7% |
Letter of Credit.The Luxe at 1548 Property is subject to a springing deed restriction by the city of Santa Monica to provide 19 units of affordable housing. The loan sponsors agreed with the city to build a multifamily building at a nearby location (the “New Building”) and provide the affordable housing units at that property (which property will not be collateral for the NMS Los Angeles Portfolio Loan). In the event the New Building provides the required affordable housing units, the city is required to release the deed restriction. In the event the sponsors have not made affordable housing units available at the New Building, the city may require that the borrowers lease 19 units at the Luxe at 1548 Property to low income tenants as units become vacant. The appraisal did not consider the springing deed restriction. However, the borrowers delivered a $7.0 million evergreen letter of credit to lender as additional collateral for the NMS Los Angeles Multifamily Loan and the loan sponsors provided a personal guarantee with respect to the last $7.0 million of principal repaid under the NMS Los Angeles Multifamily Loan. The letter of credit and the personal guarantee will be released upon a release of the deed restriction encumbering the Luxe at 1548 Property or in the event the Luxe at 1548 Property is released from the lien of the security instrument in accordance with the loan documents. Pursuant to the August 14, 2015 appraisal (before the springing deed restriction), the appraised value for this property was $37,100,000. This value was used in the calculation of the sum of the value of each of the properties on an individual basis. On October 8, 2014, the appraiser provided a supplemental appraisal that included a hypothetical value of $31,100,000 in the event the 19 units are subject to Section 8 restrictions and $26,330,000 in the event the 19 units are subject to HUD restrictions.
THE INFORMATION IN THIS STRUCTURAL AND COLLATERAL TERM SHEET IS NOT COMPLETE AND MAY BE AMENDED PRIOR TO THE TIME OF SALE. THIS TERM SHEET IS NOT AN OFFER TO SELL THESE SECURITIES AND IT IS NOT A SOLICITATION OF AN OFFER TO BUY THESE SECURITIES IN ANY JURISDICTION WHERE THE OFFER OR SALE IS NOT PERMITTED.
| 38 |
| Various, California | Collateral Asset Summary – Loan No. 2 NMS Los Angeles Multifamily | Cut-off Date Balance: Cut-off Date LTV: U/W NCF DSCR: U/W NOI Debt Yield: | $65,000,000 68.8% 1.31x 6.7% |
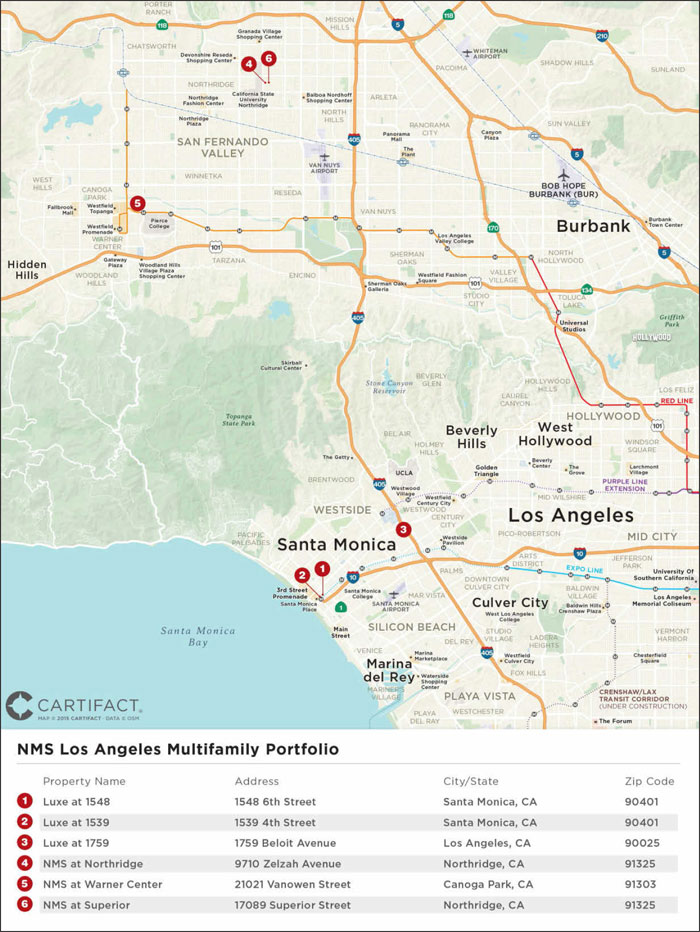
THE INFORMATION IN THIS STRUCTURAL AND COLLATERAL TERM SHEET IS NOT COMPLETE AND MAY BE AMENDED PRIOR TO THE TIME OF SALE. THIS TERM SHEET IS NOT AN OFFER TO SELL THESE SECURITIES AND IT IS NOT A SOLICITATION OF AN OFFER TO BUY THESE SECURITIES IN ANY JURISDICTION WHERE THE OFFER OR SALE IS NOT PERMITTED.
| 39 |
Various, TX | Collateral Asset Summary – Loan No. 3 Sandalwood Portfolio | Cut-off Date Balance: Cut-off Date LTV: U/W NCF DSCR: U/W NOI Debt Yield: | $62,912,576 63.3% 1.60x 10.2% |

THE INFORMATION IN THIS STRUCTURAL AND COLLATERAL TERM SHEET IS NOT COMPLETE AND MAY BE AMENDED PRIOR TO THE TIME OF SALE. THIS TERM SHEET IS NOT AN OFFER TO SELL THESE SECURITIES AND IT IS NOT A SOLICITATION OF AN OFFER TO BUY THESE SECURITIES IN ANY JURISDICTION WHERE THE OFFER OR SALE IS NOT PERMITTED.
| 40 |
Various, TX | Collateral Asset Summary – Loan No. 3 Sandalwood Portfolio | Cut-off Date Balance: Cut-off Date LTV: U/W NCF DSCR: U/W NOI Debt Yield: | $62,912,576 63.3% 1.60x 10.2% |
| Mortgage Loan Information | |
| Loan Seller: | GACC |
| Loan Purpose: | Refinance |
| Sponsor: | Thomas D. Crowson, Sr., M.D. |
| Borrower(1): | Various |
| Original Balance: | $63,000,000 |
| Cut-off Date Balance: | $62,912,576 |
| % by Initial UPB: | 6.8% |
| Interest Rate: | 4.2100% |
| Payment Date: | 6th of each month |
| First Payment Date: | October 6, 2015 |
| Maturity Date: | September 6, 2025 |
| Amortization: | 360 months |
| Additional Debt: | None |
| Call Protection(2): | L(25), D(90), O(5) |
| Lockbox / Cash Management: | Soft / Springing |
| Reserves(3) | ||
| Initial | Monthly | |
| Taxes: | $1,322,157 | $165,270 |
| Insurance: | $175,000 | Springing |
| Replacement: | $0 | $41,100 |
| Required Repairs: | $497,169 | NAP |
| Financial Information | |
| Cut-off Date Balance / Unit: | $38,268 |
| Balloon Balance / Unit: | $30,672 |
| Cut-off Date LTV(4): | 63.3% |
| Balloon LTV(4): | 50.8% |
| Underwritten NOI DSCR: | 1.73x |
| Underwritten NCF DSCR: | 1.60x |
| Underwritten NOI Debt Yield: | 10.2% |
| Underwritten NCF Debt Yield: | 9.4% |
| Underwritten NOI Debt Yield at Balloon: | 12.7% |
| Underwritten NCF Debt Yield at Balloon: | 11.8% |
| Property Information | |
| Single Asset / Portfolio: | Portfolio of seven properties |
| Property Type: | Garden Multifamily |
| Collateral: | Fee Simple |
| Location: | Various, TX |
| Year Built / Renovated: | Various |
| Total Units: | 1,644 |
| Property Management: | Sandalwood Management, Inc. |
| Underwritten NOI: | $6,421,137 |
| Underwritten NCF: | $5,927,937 |
| Appraised Value(4): | $99,310,000 |
| Appraisal Date: | July 13, 2015 |
| Historical NOI | |
| Most Recent NOI(5): | $6,017,102 (T-12 June 30, 2015) |
| 2014 NOI(5): | $6,448,976 (December 31, 2014) |
| 2013 NOI: | $6,406,928 (December 31, 2013) |
| 2012 NOI: | $5,872,126 (December 31, 2012) |
| Historical Occupancy | |
| Most Recent Occupancy: | 96.4% (July 31, 2015) |
| 2014 Occupancy(5): | 90.5% (December 31, 2014) |
| 2013 Occupancy(5): | 94.3% (December 31, 2013) |
| 2012 Occupancy: | NAV |
| (1) | The borrowers under the Sandalwood Portfolio Loan are SAT Brandon Oaks Apts., LTD.; TX Arlington Oaks Apts., LTD.; Cimarron Crossing Apts., LTD.; SAT Oaks of Northgate Apts., LTD.; Sugar Tree Apts., LTD.; Sundance Apts., LTD.; WEB Lakeshire Place Apts., LTD. |
| (2) | Partial release is permitted. See “Partial Release” herein. |
| (3) | See “Initial Reserves” and “Ongoing Reserves” herein. |
| (4) | The portfolio Appraised Value of $99.31 million reflects a premium attributed to the aggregate value of the Sandalwood Portfolio Properties as a whole. The sum of the value of each of the Sandalwood Portfolio Properties on an individual basis is $97.58 million, which represents a Cut-off Date LTV and Balloon LTV of 64.5% and 51.7%, respectively. |
| (5) | The decline in Most Recent NOI compared to 2014 NOI and the decline in 2014 Occupancy compared to 2013 Occupancy reflects the renovation of 24 units damaged in a fire at the Oaks of Northgate Property. The units were totally renovated and have re-entered the leasing pool as of August 2015. |
THE INFORMATION IN THIS STRUCTURAL AND COLLATERAL TERM SHEET IS NOT COMPLETE AND MAY BE AMENDED PRIOR TO THE TIME OF SALE. THIS TERM SHEET IS NOT AN OFFER TO SELL THESE SECURITIES AND IT IS NOT A SOLICITATION OF AN OFFER TO BUY THESE SECURITIES IN ANY JURISDICTION WHERE THE OFFER OR SALE IS NOT PERMITTED.
| 41 |
Various, TX | Collateral Asset Summary – Loan No. 3 Sandalwood Portfolio | Cut-off Date Balance: Cut-off Date LTV: U/W NCF DSCR: U/W NOI Debt Yield: | $62,912,576 63.3% 1.60x 10.2% |
| Portfolio Summary | |||||||
| Property Name | Location | Units | Year Built / Renovated | Allocated Loan Amount | Appraised Value(1) | Occupancy(2) | |
| Oaks of Northgate | San Antonio, TX | 276 | 1985 / 2015 | $10,550,000 | $16,400,000 | 89.9% | |
| Cimarron Crossing | Austin, TX | 160 | 1981 / NAP | $10,450,000 | $15,460,000 | 100.0% | |
| Brandon Oaks | San Antonio, TX | 276 | 1986 / 2015 | $10,200,000 | $17,200,000 | 96.4% | |
| Sugar Tree Apartments | Corpus Christi, TX | 250 | 1983 / NAP | $9,450,000 | $13,650,000 | 94.4% | |
| Arlington Oaks | Arlington, TX | 202 | 1981 / NAP | $8,500,000 | $12,630,000 | 98.0% | |
| Lakeshire Place | Webster, TX | 304 | 1979 / NAP | $8,250,000 | $14,140,000 | 98.7% | |
| Sundance Apartments | San Antonio, TX | 176 | 1972 / NAP | $5,600,000 | $8,100,000 | 100.0% | |
| Total / Wtd. Avg. | 1,644 | $63,000,000 | $97,580,000 | 96.4% | |||
| Total with Portfolio Premium | $99,310,000 | ||||||
| (1) | The portfolio Appraised Value of $99.31 million reflects a premium attributed to the aggregate value of the Sandalwood Portfolio Properties as a whole. The sum of the value of each of the Sandalwood Portfolio Properties on an individual basis is $97.58 million. |
| (2) | Occupancy based on rent rolls dated July 31, 2015. |
The Loan. The Sandalwood Portfolio loan (the “Sandalwood Portfolio Loan”) is a fixed rate loan secured by the borrowers’ fee simple interest in a 1,644 unit multifamily portfolio located in Texas within the cities of San Antonio, Austin, Corpus Christi, Arlington and Webster, collectively the “Sandalwood Portfolio Properties” with an original principal balance of $63.0 million. The Sandalwood Portfolio Loan has a 10-year term and amortizes on a 30-year schedule. The Sandalwood Portfolio Loan accrues interest at a fixed rate of 4.2100% and has a cut-off date balance of $62,912,576. The Sandalwood Portfolio Loan proceeds were used to refinance the refinance approximately $37.7 million of existing debt, fund upfront reserves of approximately $2.0 million, pay closing costs of approximately $0.8 million and return approximately $22.5 million of equity to the borrower. Based on the portfolio appraised value of $99.31 million, the cut-off date LTV is 63.3%. The most recent prior financing of the Sandalwood Portfolio Properties was included in the COMM 2006-C7 securitization.
| Sources and Uses | ||||||
| Sources | Proceeds | % of Total | Uses | Proceeds | % of Total | |
| Mortgage Loan | $63,000,000 | 100.0% | Loan Payoff | $37,742,526 | 59.9% | |
| Reserves | $1,994,325 | 3.2% | ||||
| Closing Costs | $776,231 | 1.2% | ||||
| Return of Equity | $22,486,917 | 35.7% | ||||
| Total Sources | $63,000,000 | 100.0% | Total Uses | $63,000,000 | 100.0% | |
The Borrowers / Sponsor. The borrowers, SAT Brandon Oaks Apts., LTD., TX Arlington Oaks Apts., LTD., Cimarron Crossing Apts., LTD., SAT Oaks of Northgate Apts., LTD., Sugar Tree Apts., LTD., Sundance Apts., LTD., WEB Lakeshire Place Apts., LTD., are each Texas limited partnerships with two independent directors. Thomas D. Crowson, Sr., M.D. is the sponsor of each of the borrowers and the non-recourse carve-out guarantor for the Sandalwood Portfolio Loan.
Thomas D. Crowson, Sr., M.D. has been in the multifamily and commercial real estate business since the 1970s and his current commercial real estate holdings include approximately 2,361 apartment units in Texas, Mississippi and Arkansas; five new and used car dealerships in Mississippi; eight Newks Eatery Restaurants in Birmingham, Alabama, as well as in Austin and Houston, Texas; two Country Clubs/Golf Courses in Florida and Mississippi; and a Modular Home Builder in Georgia.
The Properties.The Sandalwood Portfolio Properties consists of seven Class B/C garden-style apartment complexes located in Texas, within five markets, including San Antonio, Austin, Corpus Christi, Arlington and Webster. The properties were built between 1972 and 1986, and acquired by the sponsor between 1993 and 1995. Since acquisition, the sponsor invested approximately $12.3 million ($7,501/unit) including approximately $1.6 million ($954/unit) spent in 2015 for capital improvements to renovate and update each of the Sandalwood Portfolio Properties. Amenities at each of the properties generally include a pool, fitness center, leasing office, resident clubhouse and laundry room. Unit amenities generally feature a standard appliance package, washer and dryers, and balcony or patios.
THE INFORMATION IN THIS STRUCTURAL AND COLLATERAL TERM SHEET IS NOT COMPLETE AND MAY BE AMENDED PRIOR TO THE TIME OF SALE. THIS TERM SHEET IS NOT AN OFFER TO SELL THESE SECURITIES AND IT IS NOT A SOLICITATION OF AN OFFER TO BUY THESE SECURITIES IN ANY JURISDICTION WHERE THE OFFER OR SALE IS NOT PERMITTED.
| 42 |
Various, TX | Collateral Asset Summary – Loan No. 3 Sandalwood Portfolio | Cut-off Date Balance: Cut-off Date LTV: U/W NCF DSCR: U/W NOI Debt Yield: | $62,912,576 63.3% 1.60x 10.2% |
Land Use Restriction Agreement: Five of the seven properties are subject to a Land Use Restriction Agreement (“LURA”) requiring 523 units (31.8%) to be leased to tenants who earn less than 80% of the area’s median income (“Low Income Tenants”) and to tenants who earn less than 50% of area median income (“Very Low Income Tenants”). The remaining 1,121 units (68.2%) can be leased at market rents. The LURA’s restrictions can be terminated in one of three ways: 1) a total casualty or condemnation of the applicable property, 2) through lender foreclosure proceedings or other exercise of lender’s remedies under the Mortgage, or 3) through the natural expiration of time (i.e. the later of 40 years from the date of execution of the Agreement or 50 years from the date the property was initially occupied as a multifamily property). Salient details about the 523 units (31.8%) across the properties that are subject to these restrictions are detailed below:
| Land Use Restriction Agreement(1) | ||||||||
| Property Name | Subject to LURA | Subject to Master LURA | Total Units | Restricted Units | % Restricted | Restricted Low Income (80%) | Very Low Income (50%) | LURA Expiration |
| Oaks of Northgate | Yes | Yes | 276 | 97 | 35.1% | 41 | 56 | 2033 |
| Cimarron Crossing | No | No | 160 | 0 | 0.0% | 0 | 0 | NAP |
| Brandon Oaks | Yes | Yes | 276 | 138 | 50.0% | 82 | 56 | 2033 |
| Sugar Tree Apartments | Yes | Yes | 250 | 88 | 35.2% | 38 | 50 | 2034 |
| Arlington Oaks | No | No | 202 | 0 | 0.0% | 0 | 0 | NAP |
| Lakeshire Place | Yes | No | 304 | 107 | 35.2% | 46 | 61 | 2034 |
| Sundance Apartments | Yes | Yes | 176 | 93 | 52.8% | 55 | 38 | 2033 |
| Total | 1,644 | 523 | 31.8% | 262 | 261 | |||
| (1) | Source: LURA Agreements and MLURA Agreements for Oaks of Northgate, Brandon Oaks, Lakeshire Place, Sugar Tree Apartments and Sundance Apartments. |
According to the Sugar Tree Apartments appraisal, the Low Income Tenant rents do not impact rent levels that can be achieved at the properties subject to the LURA, because the monthly rental rates for both tenants that pay market level rents and Low Income Tenants are the same. However, the rental rates that Very Low Income Tenants pay are discounted when compared to market rental rates. Four of the five properties subject to the LURA, are also subject to Master LURAs (as indicated above), which designate occupancy requirements on a portfolio basis. The Master LURAs provide the sponsor with the flexibility to allocate the income restricted units across the portfolio which helps manage vacancy, rental rates, and move-outs across the portfolio.
Oaks of Northgate (16.7% of Total Loan Amount)is a 276-unit Class B garden-style apartment complex located at 8000 Oakdell Way in San Antonio, Texas. Built in 1985, and renovated in 2015, the property contains 19, two and three-story residential buildings. The property underwent renovations in 2015, consisting of complete renovations to 24 units that were damaged in a fire at building one. The units have been totally renovated and have re-entered the leasing pool in August. According to the sponsor, rents on these units are projected to be higher than comparable size units in the other buildings at this property and the units are expected to lease-up in a short period. The property has a total of 419 open surface parking spaces which equates to a parking ratio of 1.5 spaces per unit. As of July 31, 2015, Oaks of Northgatewas 89.9% occupied. Concessions are currently offered on the one-bedroom units and are reflected in the quoted rents shown below.
| Unit Mix Summary – Oaks of Northgate(1) | ||||||||||
| Unit Type | # | Unit Size (Sq. Ft.) | % of Total Units | Occupied Units | Occupancy Rate | Avg. Monthly Rental Rate | Avg. Monthly Rental Rate PSF | Monthly Market Rental Rate(2) | Monthly Market Rate PSF(2) | |
| 1 Bed / 1 Bath | 72 | 660 | 26.1% | 70 | 97.2% | $650 | $0.99 | $625 | $0.95 | |
| 1 Bed / 1 Bath(3) | 8 | 660 | 2.9% | 0(4) | 0.0% | NAV(4) | NAV(4) | $675 | $1.02 | |
| 1 Bed / 1 Bath(5) | 16 | 660 | 5.8% | 0(4) | 0.0% | NAV(4) | NAV(4) | $775 | $1.17 | |
| 1 Bed / 1 Bath | 44 | 710 | 15.9% | 44 | 100.0% | $671 | $0.95 | $640 | $0.90 | |
| 2 Bed / 2 Bath | 64 | 838 | 23.2% | 62 | 96.9% | $753 | $0.90 | $765 | $0.91 | |
| 2 Bed / 2 Bath | 72 | 966 | 26.1% | 72 | 100.0% | $825 | $0.85 | $840 | $0.87 | |
| Total / Wtd. Avg. | 276 | 789 | 100.0% | 248 | 89.9% | $730 | $0.93 | $726 | $0.92 | |
| (1) | Source: July 31, 2015 rent roll. |
| (2) | Source: Appraisal. |
| (3) | Units fully renovated after a building fire. The units that received upgraded flooring and appliances command a $50 premium according to management. |
| (4) | Occupied units exclude 24 units significantly damaged in a fire. Renovations were completed in August 2015 and the units are in the process of being leased. |
| (5) | Units fully renovated after a building fire, and command a $150 premium according to management. |
THE INFORMATION IN THIS STRUCTURAL AND COLLATERAL TERM SHEET IS NOT COMPLETE AND MAY BE AMENDED PRIOR TO THE TIME OF SALE. THIS TERM SHEET IS NOT AN OFFER TO SELL THESE SECURITIES AND IT IS NOT A SOLICITATION OF AN OFFER TO BUY THESE SECURITIES IN ANY JURISDICTION WHERE THE OFFER OR SALE IS NOT PERMITTED.
| 43 |
Various, TX | Collateral Asset Summary – Loan No. 3 Sandalwood Portfolio | Cut-off Date Balance: Cut-off Date LTV: U/W NCF DSCR: U/W NOI Debt Yield: | $62,912,576 63.3% 1.60x 10.2% |
Cimarron Crossing (16.6% of Total Loan Amount)is a 160-unit Class B garden-style apartment complex located at 9500 Jollyville Road in Austin, Texas. Built in 1981, the property contains 34, one- and two-story residential buildings. The property has 263 surface parking spaces for a parking ratio of 1.6 spaces per unit. As of July 31, 2015, Cimarron Crossing was 100.0% occupied.
| Unit Mix Summary – Cimarron Crossing(1) | |||||||||
| Unit Type | # | Unit Size (Sq. Ft.) | % of Total Units | Occupied Units | Occupancy Rate | Avg. Monthly Rental Rate | Avg. Monthly Rental Rate PSF | Monthly Market Rental Rate(2) | Monthly Market Rate PSF(2) |
| Studio | 24 | 400 | 15.0% | 24 | 100.0% | $690 | $1.73 | $725 | $1.81 |
| 1 Bed / 1 Bath | 62 | 700 | 38.8% | 62 | 100.0% | $842 | $1.20 | $860 | $1.23 |
| 1 Bed / 1 Bath | 30 | 750 | 18.8% | 30 | 100.0% | $867 | $1.16 | $900 | $1.20 |
| 1 Bed / 1 Bath | 8 | 780 | 5.0% | 8 | 100.0% | $957 | $1.23 | $1,000 | $1.28 |
| 2 Bed / 2.5 Bath | 12 | 1,020 | 7.5% | 12 | 100.0% | $1,106 | $1.08 | $1,189 | $1.17 |
| 2 Bed / 2 Bath | 24 | 1,025 | 15.0% | 24 | 100.0% | $1,084 | $1.06 | $1,200 | $1.17 |
| Total / Wtd. Avg. | 160 | 741 | 100.0% | 160 | 100.0% | $886 | $1.24 | $930 | $1.25 |
| (1) | Source: July 31, 2015 rent roll. |
| (2) | Source: Appraisal. |
Brandon Oaks (16.2% of Total Loan Amount)is a 276-unit, Class B garden-style apartment complex located at 800 Vista Valet in San Antonio, Texas. Built in 1986, and renovated in 2015, the property contains 29, two- and three-story residential buildings. The property renovation in 2015 included interior upgrades, new carpet and vinyl, appliances, upgrades to the office and club house, in addition to landscaping upgrades, some of which are currently on-going. The property has 419 surface parking spaces and a parking ratio of 1.5 spaces per unit. As of July 31, 2015, Brandon Oaks was 96.4% occupied.
| Unit Mix Summary – Brandon Oaks(1) | |||||||||
| Unit Type | # of Units | Unit Size | % of Total Units | Occupied Units | Occupancy Rate | Avg. Monthly Rental Rate | Avg. Monthly Rental Rate PSF | Monthly Market Rental Rate(2) | Monthly Market Rate PSF(2) |
| 1Bed / 1Bath | 41 | 506 | 14.9% | 40 | 97.6% | $580 | $1.15 | $575 | $1.14 |
| 1Bed / 1Bath | 19 | 506 | 6.9% | 19 | 100.0% | $575 | $1.14 | $575 | $1.14 |
| 2Bed / 1Bath | 56 | 855 | 20.3% | 54 | 96.4% | $768 | $0.90 | $770 | $0.90 |
| 2Bed / 1Bath | 72 | 944 | 26.1% | 70 | 97.2% | $803 | $0.85 | $825 | $0.87 |
| 2Bed / 2Bath | 56 | 1,037 | 20.3% | 53 | 94.6% | $881 | $0.85 | $880 | $0.85 |
| 3Bed / 2Bath | 32 | 1,174 | 11.6% | 30 | 93.8% | $1,091 | $0.93 | $1,054 | $0.90 |
| Total / Wtd. Avg. | 276 | 876 | 100.0% | 266 | 96.4% | $794 | $0.91 | $797 | $0.91 |
| (1) | Source: July 31, 2015 rent roll. |
| (2) | Source: Appraisal. |
Sugar Tree Apartments (15.0% of Total Loan Amount)is a 250-unit Class B garden-style apartment complex located at 8050 South Padre Island Drive in Corpus Christi, Texas. Built in 1983, the property contains 16, two- and three-story residential buildings. The property has 439 open surface parking spaces which equates to a parking ratio of 1.8 spaces per unit. As of July 31, 2015, Sugar Tree Apartments was 94.4% occupied.
| Unit Mix Summary – Sugar Tree Apartments(1) | |||||||||
| Unit Type | #of Units | Unit Size (Sq. Ft.) | % of Total Units | Occupied Units | Occupancy Rate | Avg. Monthly Rental Rate | Avg. Monthly Rental Rate PSF | Monthly Market Rental Rate(2) | Monthly Market Rate PSF(2) |
| 1Bed / 1Bath | 80 | 540 | 32.0% | 79 | 98.8% | $681 | $1.26 | $705 | $1.31 |
| 1Bed / 1Bath | 16 | 600 | 6.4% | 16 | 100.0% | $727 | $1.21 | $750 | $1.25 |
| 1Bed / 1Bath | 50 | 670 | 20.0% | 46 | 92.0% | $765 | $1.14 | $765 | $1.14 |
| 1Bed / 1Bath | 24 | 745 | 9.6% | 15 | 62.5% | $843 | $1.13 | $800 | $1.07 |
| 1Bed / 1Bath | 12 | 890 | 4.8% | 12 | 100.0% | $869 | $0.98 | $900 | $1.01 |
| 2Bed / 1Bath | 24 | 825 | 9.6% | 24 | 100.0% | $879 | $1.07 | $905 | $1.10 |
| 2Bed / 1.5Bath | 8 | 1,125 | 3.2% | 8 | 100.0% | $1,026 | $0.91 | $1,050 | $0.93 |
| 2Bed / 2Bath | 36 | 1,000 | 14.4% | 36 | 100.0% | $994 | $0.99 | $1,000 | $1.00 |
| Total / Wtd. Avg. | 250 | 719 | 100.0% | 236 | 94.4% | $800 | $1.11 | $811 | $1.13 |
| (1) | Source: July 31, 2015 rent roll. |
| (2) | Source: Appraisal. |
THE INFORMATION IN THIS STRUCTURAL AND COLLATERAL TERM SHEET IS NOT COMPLETE AND MAY BE AMENDED PRIOR TO THE TIME OF SALE. THIS TERM SHEET IS NOT AN OFFER TO SELL THESE SECURITIES AND IT IS NOT A SOLICITATION OF AN OFFER TO BUY THESE SECURITIES IN ANY JURISDICTION WHERE THE OFFER OR SALE IS NOT PERMITTED.
| 44 |
Various, TX | Collateral Asset Summary – Loan No. 3 Sandalwood Portfolio | Cut-off Date Balance: Cut-off Date LTV: U/W NCF DSCR: U/W NOI Debt Yield: | $62,912,576 63.3% 1.60x 10.2% |
Arlington Oaks (13.5% of Total Loan Amount)is a 202-unit Class B garden-style apartment complex located at 1111 Honeysuckle Way in Arlington, Texas. Built in 1981, the property contains 20, one-, two-, and three-story residential buildings. The property has 362 surface parking spaces which equates to a parking ratio of 1.8 spaces per unit. As of July 31 2015, Arlington Oaks was 98.0% occupied. The Arlington Oaks property is legal non-conforming as to zoning with respect to the use of the property as a multifamily dwelling.For additional information, see “Risk Factors—Risks Related to the Mortgage Loans—Risks Related to Zoning Laws” in the free writing prospectus.
| Unit Mix Summary – Arlington Oaks(1) | |||||||||
| Unit Type | # of Units | Unit Size | % of Total Units | Occupied Units | Occupancy Rate | Avg. Monthly Rental Rate | Avg. Monthly Rental Rate PSF | Monthly Market Rental Rate(2) | Monthly Market Rate PSF (2) |
| 1 Bed / 1 Bath | 78 | 556 | 38.6% | 78 | 100.0% | $601 | $1.08 | $645 | $1.16 |
| 1 Bed / 1 Bath | 30 | 684 | 14.9% | 30 | 100.0% | $637 | $0.93 | $685 | $1.00 |
| 1 Bed / 1 Bath | 20 | 775 | 9.9% | 20 | 100.0% | $723 | $0.93 | $760 | $0.98 |
| 1 Bed / 1 Bath | 18 | 850 | 8.9% | 18 | 100.0% | $737 | $0.87 | $770 | $0.91 |
| 1 Bed / 1 Bath | 4 | 914 | 2.0% | 4 | 100.0% | $818 | $0.89 | $855 | $0.94 |
| 2 Bed / 2 Bath | 16 | 950 | 7.9% | 12 | 75.0% | $843 | $0.89 | $865 | $0.91 |
| 2 Bed / 2 Bath | 8 | 954 | 4.0% | 8 | 100.0% | $818 | $0.86 | $865 | $0.91 |
| 2 Bed / 2 Bath | 8 | 972 | 4.0% | 8 | 100.0% | $844 | $0.87 | $895 | $0.92 |
| 2 Bed / 2 Bath | 20 | 1,105 | 9.9% | 20 | 100.0% | $931 | $0.84 | $1,015 | $1.00 |
| Total / Wtd. Avg. | 202 | 748 | 100.0% | 198 | 98.0% | $702 | $0.94 | $750 | $1.00 |
| (1) | Source: July 31, 2015 rent roll. |
| (2) | Source: Appraisal. |
Lakeshire Place (13.1% of Total Loan Amount)is a 304-unit Class B garden-style apartment complex located at 503 El Dorado Boulevard in Webster, Texas. Built in 1979, the property contains 20, two-story residential buildings. The property has 486 surface parking spaces which equates to a parking ratio of 1.6 spaces per unit. As of July 31, 2015, Lakeshire Place was 98.7% occupied.
| Unit Mix Summary – Lakeshire Place(1) | |||||||||
| Unit Type | # of Units | Unit Size | % of Total Units | Occupied Units | Occupancy Rate | Avg. Monthly Rental Rate | Avg. Monthly Rental Rate PSF | Monthly Market Rental Rate(2) | Monthly Market Rate PSF (2) |
| 1Bed / 1Bath | 4 | 539 | 1.3% | 4 | 100.0% | $663 | $1.23 | $650 | $1.21 |
| 1Bed / 1Bath | 76 | 539 | 25.0% | 76 | 100.0% | $582 | $1.08 | $595 | $1.10 |
| 1Bed / 1Bath | 12 | 660 | 3.9% | 11 | 91.7% | $721 | $1.09 | $740 | $1.12 |
| 1Bed / 1Bath | 108 | 660 | 35.5% | 107 | 99.1% | $612 | $0.93 | $625 | $0.95 |
| 2Bed / 1Bath | 48 | 857 | 15.8% | 46 | 95.8% | $778 | $0.91 | $795 | $0.93 |
| 2Bed / 2Bath | 56 | 950 | 18.4% | 56 | 100.0% | $840 | $0.88 | $855 | $0.90 |
| Total / Wtd. Avg. | 304 | 713 | 100.0% | 300 | 98.7% | $677 | $0.95 | $692 | $0.97 |
| (1) | Source: July 31, 2015 rent roll. |
| (2) | Source: Appraisal. |
Sundance Apartments (8.9% of Total Loan Amount)is a 176-unit Class B/C garden-style apartment complex located at 4615 Gardendale Street in San Antonio, Texas. Built in 1972, the property contains 23, two-story residential buildings. The property has 274 open surface parking spaces which equates to a parking ratio of 1.6 spaces per unit. As of July 31, 2015, Sundance Apartments was 100.0% occupied.
| Unit Mix Summary – Sundance Apartments(1) | |||||||||
| Unit Type | # of Units | Unit Size | % of Total Units | Occupied Units | Occupancy Rate | Avg. Monthly Rental Rate | Avg. Monthly Rental Rate PSF | Monthly Market Rental Rate(2) | Monthly Market Rate PSF (2) |
| 1Bed / 1Bath | 56 | 523 | 31.8% | 56 | 100.0% | $568 | $1.09 | $565 | $1.08 |
| 1Bed / 1Bath | 32 | 709 | 18.2% | 32 | 100.0% | $632 | $0.89 | $625 | $0.88 |
| 2Bed / 2Bath | 48 | 909 | 27.3% | 48 | 100.0% | $726 | $0.80 | $695 | $0.76 |
| 2Bed / 2Bath | 24 | 1,037 | 13.6% | 24 | 100.0% | $822 | $0.79 | $754 | $0.73 |
| 3Bed / 2Bath | 16 | 1,258 | 9.1% | 16 | 100.0% | $958 | $0.76 | $884 | $0.70 |
| Total / Wtd. Avg. | 176 | 799 | 100.0% | 176 | 100.0% | $693 | $0.87 | $666 | $0.83 |
| (1) | Source: July 31, 2015 rent roll. |
| (2) | Source: Appraisal. |
THE INFORMATION IN THIS STRUCTURAL AND COLLATERAL TERM SHEET IS NOT COMPLETE AND MAY BE AMENDED PRIOR TO THE TIME OF SALE. THIS TERM SHEET IS NOT AN OFFER TO SELL THESE SECURITIES AND IT IS NOT A SOLICITATION OF AN OFFER TO BUY THESE SECURITIES IN ANY JURISDICTION WHERE THE OFFER OR SALE IS NOT PERMITTED.
| 45 |
Various, TX | Collateral Asset Summary – Loan No. 3 Sandalwood Portfolio | Cut-off Date Balance: Cut-off Date LTV: U/W NCF DSCR: U/W NOI Debt Yield: | $62,912,576 63.3% 1.60x 10.2% |
Environmental Matters.The Phase I environmental reports dated July 17, 2015 recommended no further action at the Sandalwood Portfolio Properties.
The Market.
San Antonio(Three properties; 728 units; 41.8% of Total Loan Amount) The Brandon Oaks, Oaks of Northgate and Sundance Apartments properties are located in San Antonio, Texas within the San Antonio MSA. The San Antonio MSA occupies approximately 368.6 square miles and spans the counties of Atascosa, Bandera, Bexar, Comal, Guadalupe, Kendall, Medina and Wilson. According to the appraiser, employment in San Antonio has increased more than both the national average and the average for Texas over the past year and unemployment has declined to a cyclical low of 3.8%. Major economic drivers in the area include government and military, healthcare, energy and construction. As of Q1 2015, the San Antonio apartment market contains 145,002 sq. ft. of existing supply, with 4,392 units coming online in the last 12 months. Average occupancy over that time period was 92.6%, compared to 96.4%, 89.9% (including 24 fully renovated units that came online in August 2014 after fire damage) and 100.0% at the Brandon Oaks, Oaks of Northgate and Sundance Apartments properties, respectively, as of July 31, 2015. Average rent PSF per month for the San Antonio Market as of Q1 2015 was $1.03, compared to $0.91, $0.93 and $0.87 for the Brandon Oaks, Oaks of Northgate and Sundance Apartments properties, respectively. Over the past 12 months, absorption in the San Antonio MSA has been a positive at 6,145 units.
Austin(One property; 160 units; 16.6% of Total Loan Amount) The Cimarron Crossing property is located within the Austin City MSA, about 15 miles northwest of the Austin CBD. According to the appraiser, the unemployment rate in the Austin MSA is 3.5%, below the U.S. average and the labor force is rising rapidly. Economic drivers in the MSA include the IT Industry, residential construction and state government, as Austin the state capital, as well as the University of Texas. According to the appraiser, the area experienced a 1.40% growth in population from 2010-2015 and has a median household income of $55,622 within a 5 mile radius of the Cimarron Crossing property. As of Q1 2015, the Austin MSA has a total of 158,822 existing apartments units, 2,175 of which were constructed in the last 12 months. For that same time period average occupancy was 93.8%, compared to 100.0% at Cimarron Crossing property as of July 31, 2015, and average monthly rent was $1.28 PSF compared to $1.24 PSF for the Cimarron Crossing property.
Corpus Christi (One property; 250 units; 15.0% of Total Loan Amount) The Sugar Tree Apartments property is located in the Corpus Christi metro area. According to the appraiser, Corpus Christi’s economy continues to expand despite downward pressure from declining oil prices with an unemployment rate of 5%. The economy is supported by large scale investment projects spurred by the recent boom as well as the Port of Corpus Christi, which is the sixth largest in the world by tonnage and is expected to grow even larger with the construction of the LA Quinta Container Terminal. Economic drivers in the area include the oil and natural gas industry, university research centers and premier healthcare facilities as well as the region’s tropical climate and wealth of outdoor activities. According to the appraiser, the area has experienced a 1.43% growth in population from 2010-2015 and has a median household income of $59,055 within a 5 mile radius of the Sugar Tree Apartments property. As of June 2015, the Corpus Christi metro area contained 23,467 apartment units, with 737 units coming online in the last 12 months. Over the last 12 months absorption was positive at 1,111 units. Average occupancy as of June 2015 was 91.5%, compared to 94.4% at Sugar Tree Apartments property as of July 31, 2015, and average rent PSF per month was $1.08, compared to $1.11 rents achieved at the Sugar Tree Apartments property.
Fort Worth-Arlington (One property; 202 units; 13.5% of Total Loan Amount) The Arlington Oaks property is located in the Fort Worth-Arlington metro area. According to the appraiser, the economy of the Fort Worth-Arlington metro area is growing faster than the nation as a whole, led by gains in personal services and construction. The unemployment rate has declined over the past year and a half and is at a cyclical low of 4.1%. Economic drivers in the area include transportation and air travel (supported by DFW Airport, the world’s third busiest airport), aerospace manufacturing and residential construction. According to the appraiser, there are three new projects expected to be delivered to the submarket over the next two years, and net absorption is projected to negative over the next year. However, the new supply is not expected to compete with the subject owing to its vintage and construction class. According to the appraiser, the area has experienced a 0.79% growth in population from 2010-2015 and has a median household income of $40,695 within a 5 mile radius of the Arlington Oaks property. There are 172,893 apartment units in the Fort Worth-Arlington metro area and the appraiser concluded to an occupancy of 95.1%, compared to 98.0% at Arlington Oaks property as of July 31, 2015, and average rent PSF per month of $0.94, compared to rent of $0.94 PSF per month at Arlington Oaks property.
THE INFORMATION IN THIS STRUCTURAL AND COLLATERAL TERM SHEET IS NOT COMPLETE AND MAY BE AMENDED PRIOR TO THE TIME OF SALE. THIS TERM SHEET IS NOT AN OFFER TO SELL THESE SECURITIES AND IT IS NOT A SOLICITATION OF AN OFFER TO BUY THESE SECURITIES IN ANY JURISDICTION WHERE THE OFFER OR SALE IS NOT PERMITTED.
| 46 |
Various, TX | Collateral Asset Summary – Loan No. 3 Sandalwood Portfolio | Cut-off Date Balance: Cut-off Date LTV: U/W NCF DSCR: U/W NOI Debt Yield: | $62,912,576 63.3% 1.60x 10.2% |
Webster/Houston (One property; 304 units; 13.1% of Total Loan Amount) The Lakeshire Place property is located in Webster, Texas, a suburb approximately 24 miles southeast of the Houston central business district, within The Woodlands-Sugar Land metro area. According to the appraiser, unemployment in the metro area is near a cyclical low at 4.3% despite the impact of the recent decline in oil prices. Major economic drivers in the area include oil drilling, petrochemical, construction, healthcare and local government. Additionally, the area is home to a technical workforce due to the presence of the NASA/Johnson Space Center, the Clear Lake Medical Center, the Houston Ship Channel and its associated petrochemical complex, which is the largest in the world. According to the appraiser, the area has experienced a 1.67% growth in population from 2010-2015 and has a median household income of $73,173 within a five mile radius of the Lakeshire Place property. As of July 2015, the Clear Lake submarket contained 24,520 units with 913 coming on line in the last five years. Over the last 12 months absorption was positive at 538 units. Average occupancy as of July 2015 was 95.5%, compared to 98.7% at the Lakeshire Place property as of July 31, 2015, and average rent PSF per month was $1.13, compared to $0.95 rents achieved at the Lakeshire Place property.
Overall, the appraiser concluded to an occupancy and market rent of 94.1% and $0.98 PSF per month, which is in line with the in place occupancy and rent for the Sandalwood Portfolio of 96.4% and $0.99 PSF per month.
| Market Rate Conclusion | |||||
| Property Name | # of Units | Avg. Monthly | Monthly Market | Occupancy Rate(1) | Appraiser Concluded |
| Oaks of Northgate | 276 | $0.93 | $0.92 | 89.9% | 94.0% |
| Cimarron Crossing | 160 | $1.24 | $1.25 | 100.0% | 95.0% |
| Brandon Oaks | 276 | $0.91 | $0.91 | 96.4% | 93.0% |
| Sugar Tree Apartments | 250 | $1.11 | $1.13 | 94.4% | 94.0% |
| Arlington Oaks | 202 | $0.94 | $1.00 | 98.0% | 95.0% |
| Lakeshire Place | 304 | $0.95 | $0.97 | 98.7% | 95.0% |
| Sundance Apartments | 176 | $0.87 | $0.83 | 100.0% | 93.0% |
| Sandalwood Portfolio | 1,644 | $0.98 | $0.99 | 96.4% | 94.1% |
| (1) | Source: July 31, 2015 rent roll. |
| (2) | Stabilized occupancy projections, inclusive of concessions and bad debt as determined within the appraisals. |
Cash Flow Analysis.
| Cash Flow Analysis | ||||||
| 2012 | 2013 | 2014 | T-12 6/30/2015 | U/W | U/W per Unit | |
| Gross Potential Rent | $13,048,315 | $13,458,617 | $14,028,392 | $14,248,796 | $14,809,372 | $9,008 |
| Total Other Income | 1,513,134 | 1,667,579 | 1,661,742 | 1,640,804 | 1,640,804 | 998 |
| Less: Vacancy(1) | (951,374) | (647,475) | (1,128,238) | (1,182,354) | (1,483,691) | (902) |
| Less: Bad Debt(1) | (158,323) | (141,267) | (140,135) | (151,666) | (138,993) | (85) |
| Less: Concessions(1) | (275,597) | (103,745) | (105,310) | (99,366) | (96,571) | (59) |
| Effective Gross Income | $13,176,155 | $14,233,709 | $14,316,451 | $14,456,214 | $14,730,922 | $8,960 |
| Total Operating Expenses | 7,304,029 | 7,826,781 | 7,867,475 | 8,439,113 | 8,309,785 | 5,055 |
| Net Operating Income | $5,872,126 | $6,406,928 | $6,448,976 | $6,017,102 | $6,421,137 | $3,906 |
| Capital Expenditures | 0 | 0 | 0 | 0 | 493,200 | 300 |
| Net Cash Flow | $5,872,126 | $6,406,928 | $6,448,976 | $6,017,102 | $5,927,937 | $3,606 |
| (1) | U/W Vacancy, together with Bad Debt and Concessions represents approximately 11.6% of Gross Potential Rent, which is higher than the appraiser’s concluded average vacancy rate of 5.9% for the Sandalwood Portfolio Properties. |
Property Management. The Sandalwood Portfolio Properties are managed by Sandalwood Management, Inc. Founded in 1985 in Austin, Texas, Sandalwood Management, Inc. has expanded throughout 13 US states and Quebec Canada. The company’s current portfolio includes more than 80 owned and manages properties across North America. The company’s holdings encompass approximately 6.0 million sq. ft. of retail and office space and more than 6,000 multifamily residential units.
THE INFORMATION IN THIS STRUCTURAL AND COLLATERAL TERM SHEET IS NOT COMPLETE AND MAY BE AMENDED PRIOR TO THE TIME OF SALE. THIS TERM SHEET IS NOT AN OFFER TO SELL THESE SECURITIES AND IT IS NOT A SOLICITATION OF AN OFFER TO BUY THESE SECURITIES IN ANY JURISDICTION WHERE THE OFFER OR SALE IS NOT PERMITTED.
| 47 |
Various, TX | Collateral Asset Summary – Loan No. 3 Sandalwood Portfolio | Cut-off Date Balance: Cut-off Date LTV: U/W NCF DSCR: U/W NOI Debt Yield: | $62,912,576 63.3% 1.60x 10.2% |
Lockbox / Cash Management. The Sandalwood Portfolio Loan is structured with a soft lockbox and springing cash management. All rents from the Sandalwood Portfolio Properties are required to be deposited directly into the clearing account by the property manager within one business day of receipt and until the commencement of a Trigger Period (as defined below), all sums deposited in the clearing account will be transferred daily to the borrower’s operating account. Following the commencement of a Trigger Period, funds deposited into the clearing account are required to be swept daily by the clearing bank into a lender controlled deposit account, where the funds are required to be disbursed in accordance with the loan agreement. During a Trigger Period, excess cash flow is deposited into a lender controlled cash collateral account.
A “Trigger Period” will commence (i) upon and during the continuance of an event of default or (ii) if the debt service coverage ratio falls below 1.20x for any calendar quarter and will end if all events of default have been cured and such cure has been accepted by the lender with respect to clause (i) and the debt service coverage ratio has increased to at least 1.25x for two consecutive calendar quarters with respect to clause (ii).
Initial Reserves. At loan closing, the borrowers deposited (i) $1,322,157 into a tax reserve account, (ii) $175,000 into an insurance reserve account, and (iii) $497,169 into a required repairs reserve account, which represents 125% of the engineer’s recommended repairs at the Sandalwood Portfolio Properties.
Ongoing Reserves. On a monthly basis, the borrowers are required to deposit reserves of (i) 1/12 of the estimated annual real estate taxes, which currently equates to $165,270, into a tax reserve account, (ii) $41,100 into a replacement reserve account, which represents 125% of the engineer’s recommendation and (iii) 1/12 of the annual insurance premiums into an insurance reserve account if an acceptable blanket insurance policy is no longer in place.
Current Mezzanine or Subordinate Indebtedness. None.
Future Mezzanine or Subordinate Indebtedness Permitted. None.
Partial Release. After the expiration of the lockout period, the borrowers may obtain the release of an individual property or properties upon an arm’s length third-party sale provided, among other things, (i) the LTV ratio for the remaining properties does not exceed the lesser of the LTV immediately preceding such release and 63.4%, (ii) the DSCR for the remaining properties is not less than the greater of the DSCR immediately preceding the partial release and 1.54x and (iii) the borrowers partially defease the loan in an amount equal to the greater of 125% of the allocated loan amount for the released property or 100% of the net sales proceeds from the released property, which in no event may be less than 94% of the gross sales price of the property to be released.
Substitution.None.
THE INFORMATION IN THIS STRUCTURAL AND COLLATERAL TERM SHEET IS NOT COMPLETE AND MAY BE AMENDED PRIOR TO THE TIME OF SALE. THIS TERM SHEET IS NOT AN OFFER TO SELL THESE SECURITIES AND IT IS NOT A SOLICITATION OF AN OFFER TO BUY THESE SECURITIES IN ANY JURISDICTION WHERE THE OFFER OR SALE IS NOT PERMITTED.
| 48 |
Various, TX | Collateral Asset Summary – Loan No. 3 Sandalwood Portfolio | Cut-off Date Balance: Cut-off Date LTV: U/W NCF DSCR: U/W NOI Debt Yield: | $62,912,576 63.3% 1.60x 10.2% |
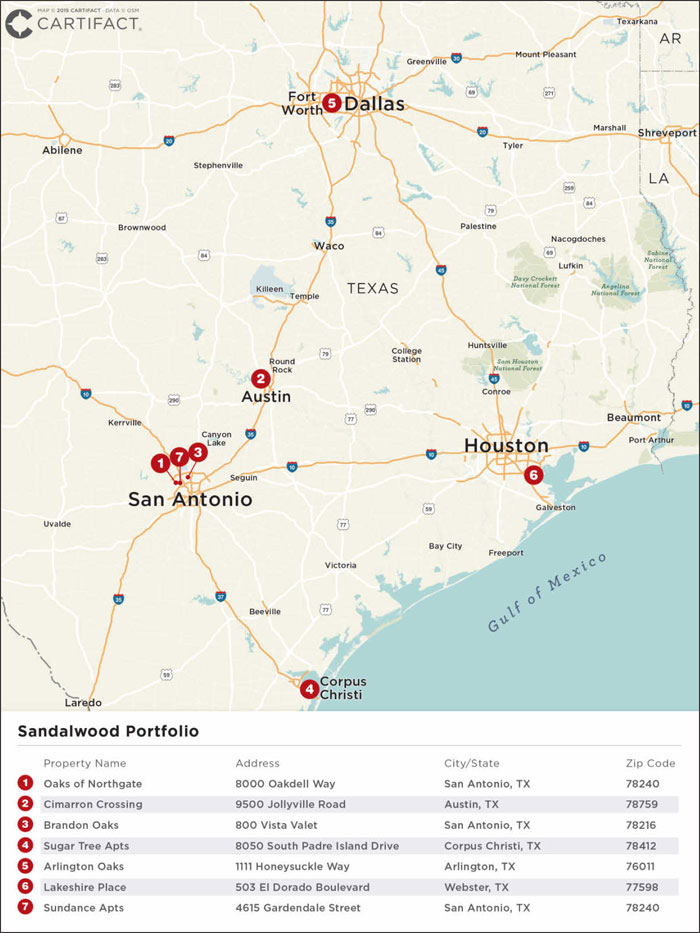
THE INFORMATION IN THIS STRUCTURAL AND COLLATERAL TERM SHEET IS NOT COMPLETE AND MAY BE AMENDED PRIOR TO THE TIME OF SALE. THIS TERM SHEET IS NOT AN OFFER TO SELL THESE SECURITIES AND IT IS NOT A SOLICITATION OF AN OFFER TO BUY THESE SECURITIES IN ANY JURISDICTION WHERE THE OFFER OR SALE IS NOT PERMITTED.
| 49 |
| Various | Collateral Asset Summary – Loan No. 4 Atlanta Multifamily Portfolio | Cut-off Date Balance: Cut-off Date LTV: U/W NCF DSCR: U/W NOI Debt Yield: | $45,000,000 64.9% 1.30x 8.3% |
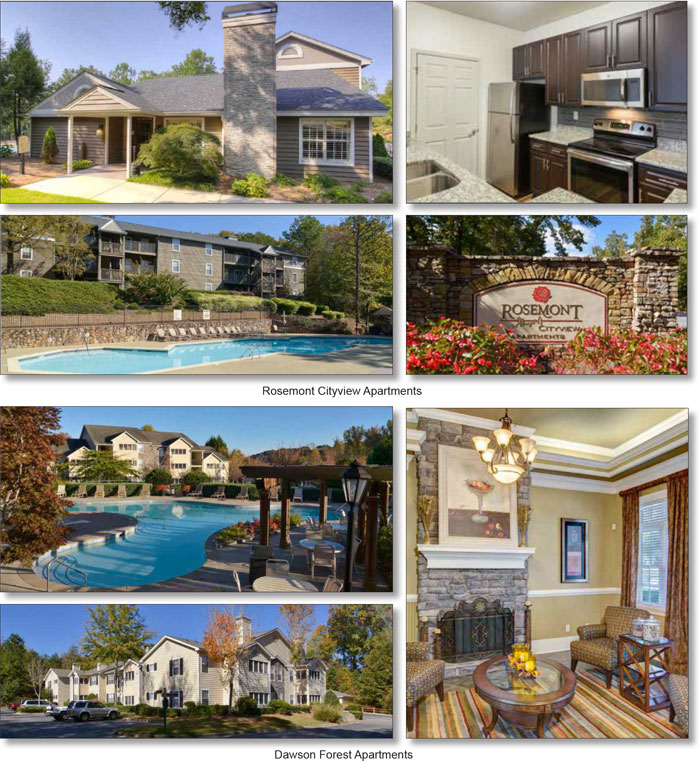
THE INFORMATION IN THIS STRUCTURAL AND COLLATERAL TERM SHEET IS NOT COMPLETE AND MAY BE AMENDED PRIOR TO THE TIME OF SALE. THIS TERM SHEET IS NOT AN OFFER TO SELL THESE SECURITIES AND IT IS NOT A SOLICITATION OF AN OFFER TO BUY THESE SECURITIES IN ANY JURISDICTION WHERE THE OFFER OR SALE IS NOT PERMITTED.
| 50 |
| Various | Collateral Asset Summary – Loan No. 4 Atlanta Multifamily Portfolio | Cut-off Date Balance: Cut-off Date LTV: U/W NCF DSCR: U/W NOI Debt Yield: | $45,000,000 64.9% 1.30x 8.3% |
| Mortgage Loan Information | |
| Loan Seller: | GACC |
| Loan Purpose: | Acquisition |
| Sponsor: | Franck A. Ruimy |
| Borrower: | 3Mind Rosemont Cityview, LLC; 3Mind Dawson Forest, LLC; SG Atlantic, LLC; SG Moezinia, LLC; SG Single, LLC; SG Avaria, LLC |
| Original Balance: | $45,000,000 |
| Cut-off Date Balance: | $45,000,000 |
| % by Initial UPB: | 4.8% |
| Interest Rate: | 4.8100% |
| Payment Date: | 6thof each month |
| First Payment Date: | October 6, 2015 |
| Maturity Date: | September 6, 2020 |
| Amortization(1): | Interest only for first 18 months; 360 months thereafter |
| Additional Debt(2): | $5,000,000 Mezzanine Debt |
| Call Protection: | L(25), D(31), O(4) |
| Lockbox / Cash Management: | Soft / In Place |
| Reserves(3) | ||
| Initial | Monthly | |
| Taxes: | $86,429 | $37,076 |
| Insurance: | $0 | Springing |
| Replacement: | $0 | $12,250 |
| Required Repairs: | $43,750 | NAP |
| Capital Expenditure Holdback: | $3,690,000 | $0 |
| Tax Reassessment: | $500,000 | $0 |
| Financial Information | |||
| Mortgage Loan | Total Debt | ||
| Cut-off Date Balance / Unit: | $76,531 | $85,034 | |
| Balloon Balance / Unit: | $72,968 | $81,076 | |
| Cut-off Date LTV(4): | 64.9% | 72.2% | |
| Balloon LTV(4): | 61.9% | 68.8% | |
| Underwritten NOI DSCR(5): | 1.36x | 1.08x | |
| Underwritten NCF DSCR(5): | 1.30x | 1.04x | |
| Underwritten NOI Debt Yield: | 8.3% | 7.5% | |
| Underwritten NCF Debt Yield: | 8.0% | 7.2% | |
| Underwritten NOI Debt Yield at Balloon: | 8.7% | 7.8% | |
| Underwritten NCF Debt Yield at Balloon: | 8.3% | 7.5% | |
| Property Information | ||||
| Single Asset / Portfolio: | Portfolio of two properties | |||
| Property Type: | Garden Multifamily | |||
| Collateral: | Fee Simple | |||
| Location: | Marietta, GA; Dawsonville, GA | |||
| Year Built / Renovated: | Various | |||
| Total Units: | 588 | |||
| Property Management: | Vesta Management Services, LLC | |||
| Underwritten NOI: | $3,725,685 | |||
| Underwritten NCF: | $3,578,685 | |||
| “As-is” Appraised Value: | $63,800,000 | |||
| “As-is” Appraisal Date: | June 30, 2015 | |||
| “As Renovated” Appraised Value(4): | $69,300,000 | |||
| “As Renovated” Appraisal Date: | October 31, 2016 | |||
| Historical NOI | ||||
| Most Recent NOI: | $3,635,435 (T-12 June 30, 2015) | |||
| 2014 NOI: | $3,426,383 (December 31, 2014) | |||
| 2013 NOI: | $3,161,986 (December 31, 2013) | |||
| 2012 NOI: | $3,014,476 (December 31, 2012) | |||
| Historical Occupancy | ||||
| Most Recent Occupancy: | 95.6% (June 11, 2015) | |||
| 2014 Occupancy: | 96.3% (December 31, 2014) | |||
| 2013 Occupancy: | 96.0% (December 31, 2013) | |||
| 2012 Occupancy: | 95.6% (December 31, 2012) | |||
| (1) | Following an initial 18-month interest only period beginning on the first payment date, the Atlanta Multifamily Portfolio Loan is structured with a fixed amortization schedule based on a non-standard amortization schedule attached as Annex H in the Free Writing Prospectus. |
| (2) | See “Current Mezzanine or Subordinate Indebtedness” herein. |
| (3) | See “Initial Reserves” and “Ongoing Reserves” herein. |
| (4) | The “As Renovated” Appraised Value takes into account upgrades being performed at each property. At closing, $3.69 million was deposited in escrows for capital improvements. Based on the “As-is” appraised value of $63.8 million, the Cut-off Date LTV and Balloon LTV for the Atlanta Multifamily Portfolio Loan are 70.5% and 67.2%, respectively. Based on the “As-is” appraised value of $63.8 million, the Total Debt Cut-off Date LTV and Total Debt Balloon LTV for the Atlanta Multifamily Portfolio Loan are 78.4% and 74.7%, respectively. |
| (5) | Based on amortizing debt service payments. Based on the current interest only payments, the Underwritten NOI DSCR and Underwritten NCF DSCR for the mortgage loan are 1.70x and 1.63x, respectively. The Underwritten NOI DSCR and Underwritten NCF DSCR for the total debt are 1.32x and 1.27x, respectively. |
| Property Summary | ||||||
| Property Name | Location | Units | Year Built / Renovated | Allocated Loan Amount | “As Renovated” Appraised Value | Occupancy(1) |
| Rosemont Cityview Apartments | Marietta, GA | 320 | 1987 / 2015 | $23,000,000 | $35,600,000 | 94.4% |
| Dawson Forest Apartments | Dawsonville, GA | 268 | 1999 / 2015 | $22,000,000 | $33,700,000 | 97.0% |
| Total / Wtd. Avg. | 588 | $45,000,000 | $69,300,000 | 95.6% | ||
| (1) | Based on the June 11, 2015 rent rolls. |
THE INFORMATION IN THIS STRUCTURAL AND COLLATERAL TERM SHEET IS NOT COMPLETE AND MAY BE AMENDED PRIOR TO THE TIME OF SALE. THIS TERM SHEET IS NOT AN OFFER TO SELL THESE SECURITIES AND IT IS NOT A SOLICITATION OF AN OFFER TO BUY THESE SECURITIES IN ANY JURISDICTION WHERE THE OFFER OR SALE IS NOT PERMITTED.
| 51 |
| Various | Collateral Asset Summary – Loan No. 4 Atlanta Multifamily Portfolio | Cut-off Date Balance: Cut-off Date LTV: U/W NCF DSCR: U/W NOI Debt Yield: | $45,000,000 64.9% 1.30x 8.3% |
The Loan.The Atlanta Multifamily Portfolio loan (the “Atlanta Multifamily Portfolio Loan”) is a fixed rate loan secured by the borrowers’ fee simple interests in a 588-unit garden multifamily portfolio located at 1650 Barnes Mill Road in Marietta, Georgia (the “Rosemont Cityview Apartments Property”) and 100 Green Forest Drive in Dawsonville, Georgia (the “Dawson Forest Apartment Property”, and together with the Rosemont Cityview Apartments Property, the “Atlanta Multifamily Portfolio Properties”) with an original principal balance of $45.0 million. The Atlanta Multifamily Portfolio Loan has a five-year term and, after an initial 18-month interest only period, amortizes on a non-standard amortization schedule. The Atlanta Multifamily Portfolio Loan accrues interest at a fixed rate equal to 4.8100% and has a cut-off date balance of $45.0 million. The Atlanta Multifamily Portfolio Loan proceeds, along with a $5.0 million mezzanine loan and approximately $17.9 million of sponsor equity were used to acquire the Atlanta Multifamily Portfolio Properties for approximately $61.5 million, fund reserves, a capital expenditure holdback of approximately $3.7 million, a tax reassessment reserve of $0.5 million and pay closing costs of approximately $2.0 million. Based on the “As Renovated” appraised value of the properties of $69.3 million as of October 31, 2016, the cut-off date LTV is 64.9%. The “As Renovated” appraised value takes into account upgrades being performed at each property. At closing, $3.69 million was deposited in escrows for capital improvements. The “As-is” appraised value is approximately $63.8 million as of June 30, 2015.The most recent prior financing of the Dawson Forest Apartments Property was included in the BSCMS 2006-PW13 securitization. The most recent prior financing of the Rosemont Cityview Apartments Property was not included in a securitization.
| Sources and Uses | ||||||
| Sources | Proceeds | % of Total | Uses | Proceeds | % of Total | |
| Mortgage Loan | $45,000,000 | 66.3% | Purchase Price | $61,500,000 | 90.6% | |
| Mezzanine Loan | $5,000,000 | 7.4% | Capital Expenditure Holdback | $3,690,000 | 5.4% | |
| Sponsor Equity | $17,854,910 | 26.3% | Tax Reassessment | $500,000 | 0.7% | |
| Reserves | $130,179 | 0.2% | ||||
| Closing Costs | $2,034,732 | 3.0% | ||||
| Total Sources | $67,854,910 | 100.0% | Total Uses | $67,854,910 | 100.0% | |
The Borrowers / Sponsor.The borrowers, 3Mind Rosemont Cityview, LLC; SG Atlantic, LLC; SG Moezinia, LLC; SG Single, LLC; and SG Avaria, LLC and 3Mind Dawson Forest, LLC; SG Atlantic, LLC; SG Moezinia, LLC; SG Single, LLC; and SG Avaria, LLC are each newly formed Delaware limited liability companies. 3Mind Rosemont Cityview, LLC and 3Mind Dawson Forest, LLC are each known as a “3Mind Borrower” and are collectively known as the “3Mind Borrowers”. SG Atlantic, LLC; SG Moezinia, LLC; SG Single, LLC; and SG Avaria, LLC are collectively known as the “Core TIC Group”. The Rosemont Cityview Apartments Property is owned by the Core TIC Group and 3Mind Rosemont Cityview, LLC as tenants-in-common and the Dawson Forest Apartments Property is owned by the Core TIC Group and 3Mind Dawson Forest, LLC as tenants-in-common. Each borrower is managed by Franck A. Ruimy. Franck A. Ruimy is the sponsor of each of the 3Mind Borrowers, the manager of each of the borrowers and the non-recourse carve-out guarantor for the Atlanta Multifamily Portfolio Loan.
Franck Ruimy has 22 years of experience in real estate investment, finance and asset management in North America and Europe. Mr. Ruimy is the chief executive officer of Aerium Group, a European real estate investment manager that acquires, owns and manages portfolios of commercial properties for investment funds. Founded in 1988, Aerium is headquartered in Luxembourg and has offices in London, Geneva, Paris, Düsseldorf and Istanbul. Aerium currently manages over €6.1 billion in property assets across 12 countries. Mr. Ruimy also served as director of several of Aerium’s subsidiaries since 1992 and led the 2003 launch of its pan-European investment platform. Mr. Ruimy’s real estate schedule of US assets includes nine rental homes/condos located in New York, NY as well as a big box anchored retail center in Paradise Valley, Arizona.
The Properties.The Atlanta Multifamily Portfolio Properties include two Class B multifamily garden properties totaling 588 units located in Marietta, Georgia and Dawsonville, Georgia. A summary of each property is below:
THE INFORMATION IN THIS STRUCTURAL AND COLLATERAL TERM SHEET IS NOT COMPLETE AND MAY BE AMENDED PRIOR TO THE TIME OF SALE. THIS TERM SHEET IS NOT AN OFFER TO SELL THESE SECURITIES AND IT IS NOT A SOLICITATION OF AN OFFER TO BUY THESE SECURITIES IN ANY JURISDICTION WHERE THE OFFER OR SALE IS NOT PERMITTED.
| 52 |
| Various | Collateral Asset Summary – Loan No. 4 Atlanta Multifamily Portfolio | Cut-off Date Balance: Cut-off Date LTV: U/W NCF DSCR: U/W NOI Debt Yield: | $45,000,000 64.9% 1.30x 8.3% |
The Rosemont Cityview Apartments Property
| Unit Mix Summary – Rosemont Cityview Apartments(1) | ||||||||||||
| Unit Type | # of Units | % of Total | Occupied Units | Occupancy | Avg. Unit Size (Sq. Ft.) | Avg. Monthly Rental Rate | Avg. Monthly Rental Rate PSF | Monthly Market Rental Rate(2) | Monthly Market Rate PSF(2) | “As Renovated” Monthly Market Rental Rate(2) | “As Renovated” Monthly Market Rate PSF(2) | |
| 1 Bed / 1 Bath | 100 | 31.3% | 91 | 91.0% | 688 | $742 | $1.08 | $735 | $1.07 | $810 | $1.18 | |
| 1 Bed / 1 Bath | 78 | 24.4% | 75 | 96.2% | 844 | $809 | $0.96 | $900 | $1.07 | $975 | $1.16 | |
| 1 Bed / 1 Bath | 50 | 15.6% | 49 | 98.0% | 979 | $833 | $0.85 | $1,050 | $1.07 | $1,125 | $1.15 | |
| 2 Bed / 2 Bath | 92 | 28.8% | 87 | 94.6% | 1,197 | $932 | $0.78 | $1,160 | $0.97 | $1,235 | $1.03 | |
| Total / Wtd. Avg. | 320 | 100.0% | 302 | 94.4% | 918 | $827 | $0.90 | $947 | $1.04 | $1,022 | $1.12 | |
| (1) | Based on the rent roll dated June 11, 2015. |
| (2) | Source: Appraisal. |
The Rosemont Cityview Apartments Property is a 320-unit, Class B garden complex comprised of 24, three-story residential buildings on a 40.9-acre site located at 1650 Barnes Mill Road in Marietta, Georgia. The property was built in 1987 and amenities include an on-site leasing office, clubhouse, fitness center, outdoor kitchen, sand volleyball court, lighted tennis court and swimming pool. The residential units feature carpeting and vinyl tile flooring, standard kitchen appliances, ceiling fans, laundry connections and patio or balconies. In addition, the property has 621 open surface spaces, which equates to 1.94 parking spaces per unit.
The borrowers have budgeted $2,080,732 ($6,502 per unit) to be invested in capital improvements at the Rosemont Cityview Apartments Property including interior upgrades, improvement of shared amenities, and exterior renovations. The full amount of the renovation budget has been reserved upfront. Of a total of 320 units at the property, 54 units were recently renovated by the seller of the Rosemont Cityview Apartments Property and are generating rental premiums of $75 per unit. A tiered renovation plan will be implemented for 50% of the remaining unrenovated units (total of 133 units), with 50% receiving level 1 upgrades and 50% receiving level 2 upgrades. The interior renovations will be completed as units are vacated with an overall budget of $4,211 per unit for the 133 units that fall under the current capital improvement plan. Interior upgrades will include plank flooring, new cabinets, new countertops, new appliances, upgraded carpeting, upgraded hardware and lighting and new paint colors including an accent wall. Exterior upgrades will include upgrades and improvements to the roof, landscaping, ironwork, paving, pool and pool area amenities, signage and renovations to the leasing center and model units. The U/W NCF does not take into account any rental premiums for the planned upgrades.
| Rosemont Cityview Apartments Capital Expenditure Budget | ||
| Capital Expenditures | Budgeted Renovations | Budgeted Renovations per Unit |
| Interior Upgrades | $560,000 | $4,211(1) |
| Exterior/Amenity Upgrades(2) | $1,520,732 | $4,752 |
| Total | $2,080,732 | $6,502(3) |
| (1) | Represents the amount of Budgeted Renovations per Unit for 133 units selected for interior upgrades at the property. |
| (2) | Exterior/Amenity upgrades include contingency budget and construction fee. |
| (3) | Based on 320 units. |
The Dawson Forest Apartments Property
| Unit Mix Summary – Dawson Forest Apartments(1) | |||||||||||
| Unit Type | # of Units | % of Total | Occupied Units | Occupancy | Average Unit Size (Sq. Ft.) | Average Monthly Rental Rate | Average Monthly Rental Rate PSF | Monthly Market Rental Rate(2) | Monthly Rental Rate PSF(2) | “As Renovated” Monthly Market Rental Rate(2) | “As Renovated” Monthly Market Rate PSF(2) |
| 1 Bed / 1 Bath | 84 | 31.3% | 81 | 96.4% | 778 | $772 | $0.99 | $800 | $1.03 | $875 | $1.12 |
| 2 Bed / 2 Bath | 71 | 26.5% | 69 | 97.2% | 1,109 | $878 | $0.79 | $975 | $0.88 | $1,050 | $0.95 |
| 2 Bed / 2 Bath | 73 | 27.2% | 71 | 97.3% | 1,144 | $915 | $0.80 | $1,000 | $0.87 | $1,075 | $0.94 |
| 3 Bed / 2 Bath | 40 | 14.9% | 39 | 97.5% | 1,378 | $1,107 | $0.80 | $1,225 | $0.89 | $1,300 | $0.94 |
| Total / Wtd. Avg. | 268 | 100.0% | 260 | 97.0% | 1,055 | $889 | $0.83 | $964 | $0.91 | $1,039 | $0.97 |
| (1) | Based on the rent roll dated June 11, 2015. |
| (2) | Source: Appraisal. |
THE INFORMATION IN THIS STRUCTURAL AND COLLATERAL TERM SHEET IS NOT COMPLETE AND MAY BE AMENDED PRIOR TO THE TIME OF SALE. THIS TERM SHEET IS NOT AN OFFER TO SELL THESE SECURITIES AND IT IS NOT A SOLICITATION OF AN OFFER TO BUY THESE SECURITIES IN ANY JURISDICTION WHERE THE OFFER OR SALE IS NOT PERMITTED.
| 53 |
| Various | Collateral Asset Summary – Loan No. 4 Atlanta Multifamily Portfolio | Cut-off Date Balance: Cut-off Date LTV: U/W NCF DSCR: U/W NOI Debt Yield: | $45,000,000 64.9% 1.30x 8.3% |
The Dawson Forest Apartments Property is a 268-unit, Class B garden complex comprised of 23, two- and three-story residential buildings and five amenity buildings on a 23.1-acre site located at 100 Green Forest Drive in Dawsonville, Georgia. The property was built in 1999 and amenities include a resort-style swimming pool with a pergola, detached garages, lighted tennis court, 24-hour fitness center, clubhouse, cyber lounge, controlled access gates, playground, car care center and laundry facility. The residential units feature carpeting and vinyl tile flooring, standard kitchen appliances, ceiling fans, laundry connections and patio or balconies. In addition, the property has 534 open surface spaces and 15 covered spaces, which equates to 2.05 parking spaces per unit.
The borrowers have budgeted $1,609,268 ($6,005 per unit) to be invested in capital improvements at the Dawson Forest Apartments Property including interior upgrades, improvement of shared amenities, and exterior renovations. The full amount of the renovation budget has been reserved upfront. A tiered renovation plan will be implemented for 50% of the units (total of 134 units), with 50% receiving level 1 upgrades and 50% receiving level 2 upgrades. The interior renovations will be completed as units are vacated with an overall budget of $3,500 per unit for the 134 units that fall under the current capital improvement plan. Interior upgrades will include plank flooring, new cabinets, new countertops, new appliances, upgraded carpeting, upgraded hardware and lighting and new paint colors including an accent wall. Exterior upgrades will include upgrades and improvements to the roof, landscaping, ironwork, paving, pool and pool area amenities, signage and renovations to the leasing center and model units. The U/W NCF does not take into account any rental premiums for the planned upgrades.
| Dawson Forest Apartments Capital Expenditure Budget | ||
| Capital Expenditures | Budgeted Renovations | Budgeted Renovations per Unit |
| Interior Upgrades | $469,000 | $3,500(1) |
| Exterior/Amenity Upgrades(2) | $1,110,268 | $4,143 |
| Total | $1,609,268 | $6,005(3) |
| (1) | Represents the amount of Budgeted Renovations per Unit for 134 units selected for interior upgrades at the property. |
| (2) | Exterior/Amenity upgrades include contingency budget and construction fee. |
| (3) | Based on 268 units. |
Environmental Matters.The Phase I environmental reports dated July 13, 2015 recommended no further action at the Rosemont Cityview Apartments Property or the Dawson Forest Apartments Property.
The Market.
Atlanta-Sandy Springs-Roswell MSAThe Atlanta Multifamily Portfolio Properties are located in the Atlanta-Sandy Springs-Roswell metropolitan statistical area (“Atlanta MSA”). The Atlanta MSA has a total estimated population of 5,527,230 as of 2015 and has experienced an annual growth rate of 0.9% since 2010. Atlanta is the primary transportation hub of the southeast region of the country, via highway, railroad, and air, with Hartsfield - Jackson Atlanta International Airport holding the title of the world’s busiest airport since 1998. The Atlanta metropolitan area is the eighth largest economy in the country and 17th largest in the world. Corporate operations comprise a large portion of the Atlanta’s economy, with the city serving as the regional, national or global headquarters for many corporations such as 19 Fortune 500 companies, including Delta Airlines, Wal-Mart Stores, AT&T, UPS, Coca-Cola and Home Depot. The unemployment rate in the region decreased to 5.9% in May 2015 from 6.8% in Q4 2014. The 2015 median household income for the Atlanta MSA was $56,889, which is higher than the state’s median income of $49,210 and the country’s median income of $53,217.
The Rosemont Cityview Apartments Property is located within the Marietta multifamily submarket. The average submarket vacancy in Q2 2015 reached a low of 3.4%, representing an improvement of 0.2% from the previous quarter and 1.0% from Q2 2014. Monthly effective rental rates averaged $835 per unit in Q2 2015, representing a 1.0% increase from the previous quarter and a 3.2% increase from Q2 2014. In Q2 2015, properties of the same vintage as the Rosemont Cityview Apartments Property (built between 1980 and 1989) reported average monthly asking rent of $873 per unit and an average vacancy rate of 3.2%.
| Rosemont Cityview Apartments Property Competitive Set(1) | ||||||
| Name | Rosemont Cityview Apartments Property | Jefferson at Lakeside | Watermark at East Cobb | The Knolls | Falls at Sope Creek | Azalea Springs |
| Location | 1650 Barnes Mill Road | 2085 Roswell Road | 2000 East Lake Way | 1675 Roswell Road | 1950 Roswell Road | 2010 Roswell Road |
| City | Marietta | Marietta | Marietta | Marietta | Marietta | Marietta |
| Year Built | 1987 | 1992 | 1986 | 1983 | 1984 | 1995 |
| Total Occupancy | 94.4%(2) | 91.2% | 96.6% | 94.0% | 95.6% | 97.4% |
| Units | 320 | 323 | 510 | 312 | 463 | 232 |
| Average Rent per Unit | $827(2) | $897 | $1,260 | $879 | $913 | $1,002 |
| Average Rent PSF | $0.90(2) | $0.91 | $1.20 | $0.89 | $0.99 | $1.09 |
| (1) | Source: Appraisal. |
| (2) | As of the June 11, 2015 rent roll. |
THE INFORMATION IN THIS STRUCTURAL AND COLLATERAL TERM SHEET IS NOT COMPLETE AND MAY BE AMENDED PRIOR TO THE TIME OF SALE. THIS TERM SHEET IS NOT AN OFFER TO SELL THESE SECURITIES AND IT IS NOT A SOLICITATION OF AN OFFER TO BUY THESE SECURITIES IN ANY JURISDICTION WHERE THE OFFER OR SALE IS NOT PERMITTED.
| 54 |
| Various | Collateral Asset Summary – Loan No. 4 Atlanta Multifamily Portfolio | Cut-off Date Balance: Cut-off Date LTV: U/W NCF DSCR: U/W NOI Debt Yield: | $45,000,000 64.9% 1.30x 8.3% |
The Dawson Forest Apartments Property is located in Dawsonville, Georgia, which falls outside of the submarkets tracked by standard market research reports. The property is approximately 50 miles north of downtown Atlanta. The primary competitive set shown below represents the closest properties achieving similar rental rates. As exhibited below, the average monthly rent at Dawson Forest Apartments Property falls within range of the comparables on a per unit and PSF basis. Despite the Dawson Forest Apartments Property being further from Atlanta then its primary competitive set, the property benefits from the absence of competitive properties within the town of Dawsonville and the above average household income within a five-mile radius of the property ($84,144 versus national average and State of Georgia of $74,699 and $68,131, respectively).
| Dawson Forest Apartments Property Competitive Set(1) | ||||||
| Name | Dawson Forest Apartments Property | Park Creek | Carrington Park at Lanier | Lake Lanier Club | Preston Pointe at Windemere | Evergreen at Aubrey’s Landing |
| Location | 100 Green Forest Drive | 1100 Park Creek | 150 Carrington Park Drive | 1701 Dawsonville Highway | 3100 Preston Pointe Way | 3305 Hutchinson Road |
| City | Dawsonville | Gainesville | Gainesville | Gainesville | Cumming | Cumming |
| Year Built | 1999 | 1997 | 2007 | 1998 | 2001 | 2000 |
| Total Occupancy | 97.0%(2) | 100.0% | 96.5% | 98.0% | 96.0% | 97.2% |
| Units | 268 | 200 | 303 | 517 | 346 | 184 |
| Average Rent per Unit | $888(2) | $843 | $825 | $970 | $1,174 | $1,238 |
| Average Rent PSF | $0.83(2) | $0.88 | $0.88 | $0.83 | $0.94 | $1.00 |
| (1) | Source: Appraisal. |
| (2) | As of the June 11, 2015 rent roll. |
Cash Flow Analysis.
| CashFlow Analysis | ||||||
| 2012 | 2013 | 2014 | T-12 6/30/2015 | U/W | U/W per Unit | |
| Gross Potential Rent | $5,622,819 | $5,851,033 | $5,964,789 | $5,988,910 | $6,065,712 | $10,316 |
| Total Other Income | 576,432 | 578,559 | 726,173 | 757,946 | 757,946 | 1,289 |
| Less: Concessions(1) | (676,098) | (738,637) | (635,749) | (496,392) | (327,910) | (558) |
| Less: Vacancy(2) | (253,747) | (248,631) | (210,565) | (187,397) | (337,199) | (573) |
| Less: Credit Loss & Bad Debt | (35,292) | (32,509) | (19,038) | (14,312) | 0 | 0 |
| Effective Gross Income | $5,234,114 | $5,409,815 | $5,825,610 | $6,048,756 | $6,158,549 | $10,474 |
| Total Expenses | 2,219,638 | 2,247,829 | 2,399,227 | 2,413,321 | 2,432,865 | 4,138 |
| Net Operating Income | $3,014,476 | $3,161,986 | $3,426,383 | $3,635,435 | $3,725,685 | $6,336 |
| Replacement Reserves | 147,000 | 147,000 | 147,000 | 147,000 | 147,000 | 250 |
| Capital Expenditures | 131,061 | 277,167 | 285,802 | 170,612 | 0 | 0 |
| Net Cash Flow | $2,736,415 | $2,737,819 | $2,993,581 | $3,317,823 | $3,578,685 | $6,086 |
| (1) | U/W Concessions represent 5.41% of Gross Potential Rent. |
| (2) | U/W Vacancy represents 5.56% of Gross Potential Rent, which is higher than the appraiser’s concluded vacancy rate with respect to the Rosemont Cityview Apartments Property and higher than all comparable properties with respect to the Dawson Forest Apartments Property. |
Property Management.The Atlanta Multifamily Portfolio Properties are managed by Vesta Management Services, LLC (“Vesta”), a professional property management company with expertise in the management of full-service multifamily properties. Vesta is the property management arm of InterCapital Group and manages over 38 properties nationwide with over 9,000 multifamily units.
Lockbox / Cash Management.The Atlanta Multifamily Portfolio Loan is structured with a soft lockbox and in place cash management. All rents and other gross revenue are required to be deposited by the borrowers or property manager into a clearing account within one business day of receipt. All funds in the clearing account are swept daily to a cash management account under the control of the lender and disbursed in accordance with the Atlanta Multifamily Portfolio Loan documents.
Additionally, all excess cash will be swept into a lender controlled account upon (i) an event of default under the Atlanta Multifamily Portfolio Loan documents, (ii) an event of default under the mezzanine loan documents or (iii) if the debt service coverage ratio is less than 1.15x on the last day of the calendar quarter, and any excess cash sweep will end if (a) with respect to clause (i) or (ii) above, the respective event of default has been cured or waived and no other event of default is then continuing or (b) with respect to clause (iii) above, the debt service coverage ratio is at least 1.20x for two consecutive calendar quarters.
THE INFORMATION IN THIS STRUCTURAL AND COLLATERAL TERM SHEET IS NOT COMPLETE AND MAY BE AMENDED PRIOR TO THE TIME OF SALE. THIS TERM SHEET IS NOT AN OFFER TO SELL THESE SECURITIES AND IT IS NOT A SOLICITATION OF AN OFFER TO BUY THESE SECURITIES IN ANY JURISDICTION WHERE THE OFFER OR SALE IS NOT PERMITTED.
| 55 |
| Various | Collateral Asset Summary – Loan No. 4 Atlanta Multifamily Portfolio | Cut-off Date Balance: Cut-off Date LTV: U/W NCF DSCR: U/W NOI Debt Yield: | $45,000,000 64.9% 1.30x 8.3% |
Initial Reserves.At loan closing, the borrowers deposited (i) $86,429 into a tax reserve account, (ii) $43,750 into a required repairs reserve account, which represents approximately 125% of the engineer’s estimated cost of the required repairs, (iii) $3,690,000 into a capital expenditure holdback account related to the budgeted renovations at the Atlanta Multifamily Portfolio Properties and (iv) $500,000 in a tax reassessment reserve account, related to a pending tax assessment, which amount will be available to be transferred to the tax reserve account in the event the assessment is greater than the current assessment.
Ongoing Reserves.On a monthly basis, the borrowers are required to deposit reserves of (i) 1/12 of the estimated annual real estate taxes, which currently equates to $37,076, into a tax reserve account and (ii) $12,250 into a replacement reserve account. In addition, the borrowers are required to deposit 1/12 of the annual insurance premiums into an insurance reserve account if an acceptable blanket policy is no longer in place.
Current Mezzanine or Subordinate Indebtedness.A $5,000,000 mezzanine loan was funded concurrently with the Atlanta Multifamily Portfolio Loan and is currently held by Rmezz Atlanta 2-Pack, LLC, an affiliate of Rialto Capital. The mezzanine loan accrues interest at a rate of 12.5000% and after an initial 18-month interest only period, amortizes on a non-standard amortization schedule. An intercreditor agreement is in place with respect to the mezzanine loan.
Future Mezzanine or Subordinate Indebtedness Permitted.None.
Partial Release.None.
Substitution.None.
THE INFORMATION IN THIS STRUCTURAL AND COLLATERAL TERM SHEET IS NOT COMPLETE AND MAY BE AMENDED PRIOR TO THE TIME OF SALE. THIS TERM SHEET IS NOT AN OFFER TO SELL THESE SECURITIES AND IT IS NOT A SOLICITATION OF AN OFFER TO BUY THESE SECURITIES IN ANY JURISDICTION WHERE THE OFFER OR SALE IS NOT PERMITTED.
| 56 |
| Various | Collateral Asset Summary – Loan No. 4 Atlanta Multifamily Portfolio | Cut-off Date Balance: Cut-off Date LTV: U/W NCF DSCR: U/W NOI Debt Yield: | $45,000,000 64.9% 1.30x 8.3% |
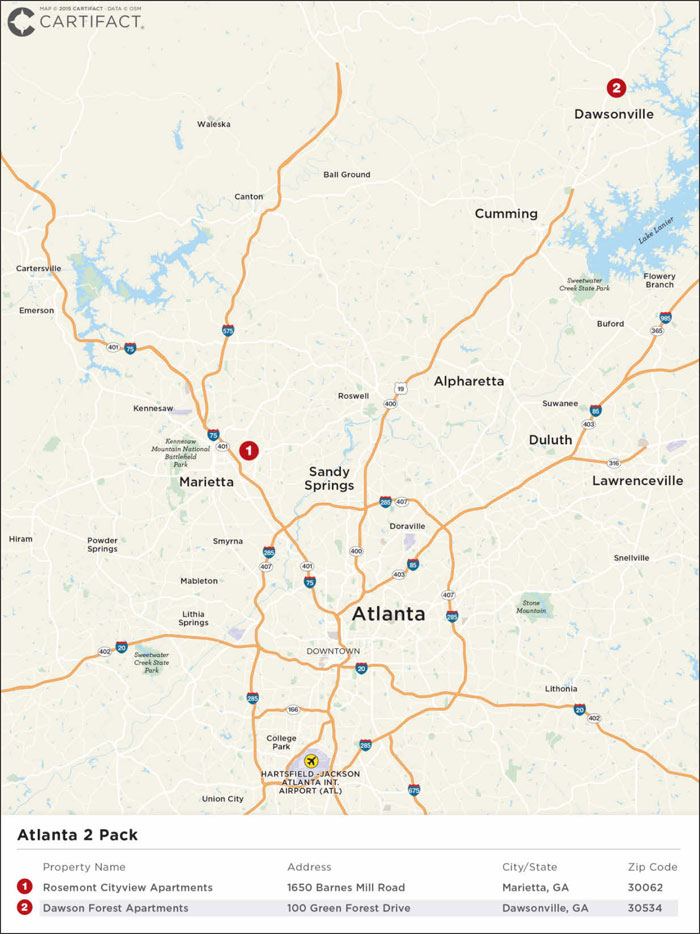
THE INFORMATION IN THIS STRUCTURAL AND COLLATERAL TERM SHEET IS NOT COMPLETE AND MAY BE AMENDED PRIOR TO THE TIME OF SALE. THIS TERM SHEET IS NOT AN OFFER TO SELL THESE SECURITIES AND IT IS NOT A SOLICITATION OF AN OFFER TO BUY THESE SECURITIES IN ANY JURISDICTION WHERE THE OFFER OR SALE IS NOT PERMITTED.
| 57 |
1355 17th Street Northwest Washington, DC 20036 | Collateral Asset Summary – Loan No. 5 The Drake | Cut-off Date Balance: Cut-off Date LTV: U/W NCF DSCR: U/W NOI Debt Yield: | $44,000,000 67.4% 1.28x 7.7% |
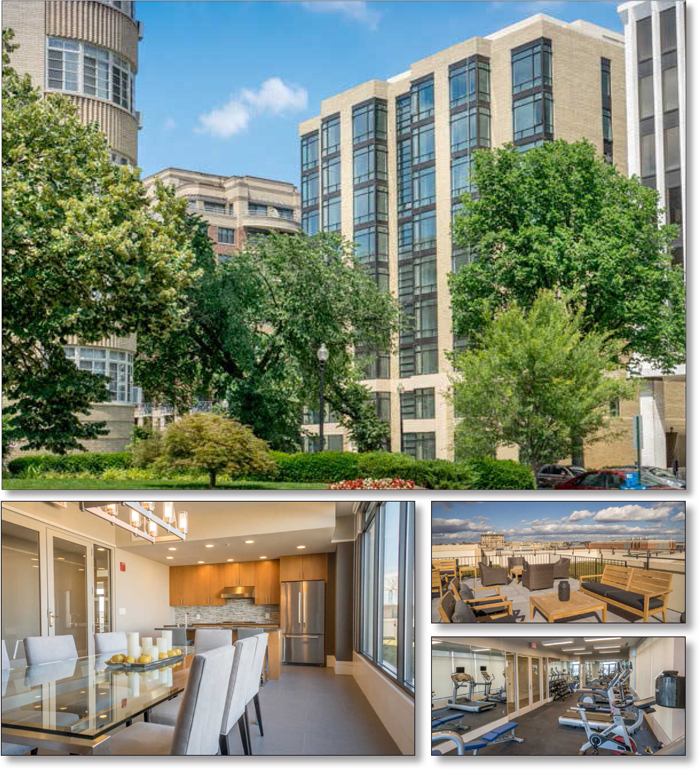
THE INFORMATION IN THIS STRUCTURAL AND COLLATERAL TERM SHEET IS NOT COMPLETE AND MAY BE AMENDED PRIOR TO THE TIME OF SALE. THIS TERM SHEET IS NOT AN OFFER TO SELL THESE SECURITIES AND IT IS NOT A SOLICITATION OF AN OFFER TO BUY THESE SECURITIES IN ANY JURISDICTION WHERE THE OFFER OR SALE IS NOT PERMITTED.
| 58 |
1355 17th Street Northwest Washington, DC 20036 | Collateral Asset Summary – Loan No. 5 The Drake | Cut-off Date Balance: Cut-off Date LTV: U/W NCF DSCR: U/W NOI Debt Yield: | $44,000,000 67.4% 1.28x 7.7% |
| Mortgage Loan Information | |
| Loan Seller: | BNYM |
| Loan Purpose: | Refinance |
| Sponsor: | Gary I. Squire; Claude E. Keener |
| Borrower: | KS/FBC L.L.C. |
| Original Balance: | $44,000,000 |
| Cut-off Date Balance: | $44,000,000 |
| % by Initial UPB: | 4.7% |
| Interest Rate: | 4.3400% |
| Payment Date: | 6thof each month |
| First Payment Date: | October 6, 2015 |
| Maturity Date: | September 6, 2025 |
| Amortization: | Interest only for first 72 months; 360 months thereafter |
| Additional Debt: | None |
| Call Protection: | L(25), YM1(91), O(4) |
| Lockbox / Cash Management: | Springing Soft / Springing |
| Reserves(1) | ||
| Initial | Monthly | |
| Taxes: | $100,596 | $16,750 |
| Insurance: | $0 | Springing |
| Replacement: | $0 | $2,725 |
| Ground Rent: | $0 | Springing |
| Financial Information | |
| Cut-off Date Balance / Sq. Ft.: | $201,835 |
| Balloon Balance / Sq. Ft.: | $188,057 |
| Cut-off Date LTV: | 67.4% |
| Balloon LTV: | 62.8% |
| Underwritten NOI DSCR(2): | 1.29x |
| Underwritten NCF DSCR(2): | 1.28x |
| Underwritten NOI Debt Yield: | 7.7% |
| Underwritten NCF Debt Yield: | 7.6% |
| Underwritten NOI Debt Yield at Balloon: | 8.3% |
| Underwritten NCF Debt Yield at Balloon: | 8.2% |
| Property Information | ||
| Single Asset / Portfolio: | Single Asset | |
| Property Type: | High Rise Multifamily | |
| Collateral: | Leasehold | |
| Location: | Washington, D.C. | |
| Year Built / Renovated: | 2014 / NAP | |
| Total Sq. Ft.: | 218 | |
| Property Management: | Keener Management, Inc. | |
| Underwritten NOI: | $3,389,139 | |
| Underwritten NCF: | $3,356,439 | |
| Appraised Value: | $65,300,000 | |
| Appraisal Date: | July 19, 2015 | |
| Historical NOI(3) | ||
| Most Recent NOI: | NAV | |
| 2014 NOI: | NAP | |
| 2013 NOI: | NAP | |
| 2012 NOI: | NAP | |
| Historical Occupancy(3) | ||
| Most Recent Occupancy: | 99.1% (August 10, 2015) | |
| 2014 Occupancy: | NAP | |
| 2013 Occupancy: | NAP | |
| 2012 Occupancy: | NAP | |
| (1) | See “Initial Reserves” and “Ongoing Reserves” herein. |
| (2) | Based on amortizing debt service payments. Based on the current interest only payments, the Underwritten NOI DSCR and Underwritten NCF DSCR are 1.75x and 1.73x, respectively. |
| (3) | The Drake was completed in late 2014. As such, Historical NOI and Historical Occupancy are not available. |
THE INFORMATION IN THIS STRUCTURAL AND COLLATERAL TERM SHEET IS NOT COMPLETE AND MAY BE AMENDED PRIOR TO THE TIME OF SALE. THIS TERM SHEET IS NOT AN OFFER TO SELL THESE SECURITIES AND IT IS NOT A SOLICITATION OF AN OFFER TO BUY THESE SECURITIES IN ANY JURISDICTION WHERE THE OFFER OR SALE IS NOT PERMITTED.
| 59 |
1355 17th Street Northwest Washington, DC 20036 | Collateral Asset Summary – Loan No. 5 The Drake | Cut-off Date Balance: Cut-off Date LTV: U/W NCF DSCR: U/W NOI Debt Yield: | $44,000,000 67.4% 1.28x 7.7% |
| Market Rate Unit Mix Summary(1) | ||||||||||||||
| Average Unit Size | Average Monthly | Average Monthly | ||||||||||||
| Unit Type | # of Units | % of Total | Occupied Units | Occupancy | (Sq. Ft.) | Rental Rate | Rental Rate PSF | |||||||
Studio | 43 | 19.7% | 41 | 95.3% | 342 | $1,833 | $5.40 | |||||||
| 1 Bed / 1 Bath Jr. | 157 | 72.0% | 157 | 100.0% | 412 | $2,156 | $5.25 | |||||||
| 1 Bed / 1 Bath | 3 | 1.4% | 3 | 100.0% | 517 | $2,022 | $3.87 | |||||||
| 2 Bed / 1 Bath | 15 | 6.9% | 15 | 100.0% | 701 | $3,329 | $4.76 | |||||||
| Total / Wtd. Avg. | 218 | 100.0% | 216 | 99.1% | 419 | $2,171 | $5.23 | |||||||
| (1) | Based on the rent roll dated August 10, 2015. |
The Loan.The Drake loan (the “Drake Loan”) is a fixed rate loan secured by the borrower’s leasehold interest in a 218-unit high rise apartment complex located at 1355 17th Street Northwest in Washington, D.C. (the “Drake Property”) with an original and cut-off date principal balance of $44.0 million. The Drake Loan has a 10-year term and subsequent to a 72-month interest only period, amortizes on a 30-year schedule. The Drake Loan accrues interest at a fixed rate equal to 4.3400%. Loan proceeds were used to retire existing construction debt of approximately $28.8 million, pay closing costs of $472,075, fund reserves of $100,596 and return approximately $14.6 million of equity to the sponsor. Based on the appraised value of $65.3 million as of June 19, 2015, the cut-off date LTV ratio is 67.4%. The most recent prior financing of The Drake Property was not included in a securitization.
| Sources and Uses | ||||||
| Sources | Proceeds | % of Total | Uses | Proceeds | % of Total | |
| Mortgage Loan | $44,000,000 | 100.0% | Loan Payoff | $28,865,723 | 65.6% | |
Closing Costs | $472,075 | 1.1% | ||||
| Reserves | $100,596 | 0.2% | ||||
| Return of Equity | $14,561,606 | 33.1% | ||||
| Total Sources | $44,000,000 | 100.0% | Total Uses | $44,000,000 | 100.0% | |
The Borrower / Sponsor.The borrower is KS/FBC L.L.C., a single purpose District of Columbia limited liability company structured to be bankruptcy-remote, with two independent directors in its organizational structure. The sponsors of the borrower and the nonrecourse carve-out guarantors are Claude E. Keener and Gary I. Squire, on a joint and several basis.
Since 1984, Claude E. Keener and Gary I. Squire have been engaged in the acquisition, renovation, construction and management of residential property in the Northwest quadrant of Washington, D.C. The sponsors currently own and manage more than 2,000 condominiums and apartment units, including 13 rental buildings.
The Property.The Drake Property is a Class A, 218-unit high rise multifamily complex constructed in 2014, located at 1355 17thStreet in Washington, D.C. The Drake Property is comprised of one nine-story residential building, as well as a leasing office and 92 parking spaces in an on-site garage, on an approximately 0.32-acre site. The units are available in four different configurations with an average unit size of 419 sq. ft. Amenities at the Drake Property include a rooftop deck with grilling areas, a fitness center, a business center, a resident lounge, a kitchen/dining area, bike storage, and a 24-hour front desk/concierge. Each unit contains stainless steel appliances, a washer and dryer, and silestone counters.
| Trailing 12 - Month Occupancy History(1) | |||||||||||||
| Oct 14 | Nov 14 | Dec 14 | Jan 15 | Feb 15 | Mar 15 | Apr 15 | May 15 | Jun 15 | Jul 15 | Aug 15 | Sep 15 | ||
| 6.0% | 18.0% | 23.0% | 32.0% | 36.0% | 42.0% | 49.0% | 56.0% | 65.0% | 81.0% | 98.0% | 99.1% | ||
| (1) As provided by the borrower and represents occupancy based on the rent roll dated August 15, 2015. | |||||||||||||
The Drake Property is located in the DuPont Circle/Adams Morgan submarket of Washington, D.C., in close proximity to the several bus and subway lines. In addition, the Union Station commuter rail is approximately a 13 minute drive or 17 minute subway ride from the Drake Property. The DuPont Circle/Adams Morgan submarket has high barriers to entry, and a 3.7% vacancy rate across nearly 12,000 units.
The Drake Property is subject to an inclusionary zoning covenant in favor of the Department of Housing and Community Development of the District of Columbia, and as such, 17 of the 218 units at the property are required to be leased to families with income levels at or below 80% of the area median income.
Environmental Matters.The Phase I environmental report dated June 23, 2015 recommended no further action at the Drake Property.
THE INFORMATION IN THIS STRUCTURAL AND COLLATERAL TERM SHEET IS NOT COMPLETE AND MAY BE AMENDED PRIOR TO THE TIME OF SALE. THIS TERM SHEET IS NOT AN OFFER TO SELL THESE SECURITIES AND IT IS NOT A SOLICITATION OF AN OFFER TO BUY THESE SECURITIES IN ANY JURISDICTION WHERE THE OFFER OR SALE IS NOT PERMITTED.
| 60 |
1355 17th Street Northwest Washington, DC 20036 | Collateral Asset Summary – Loan No. 5 The Drake | Cut-off Date Balance: Cut-off Date LTV: U/W NCF DSCR: U/W NOI Debt Yield: | $44,000,000 67.4% 1.28x 7.7% |
The Market.The Drake Property is located in Washington, D.C., in the DuPont Circle/Adams Morgan submarket.According to the appraisal, in 2014, the number of households in the Washington, D.C. region increased by 0.9%. That figure is anticipated to grow by another 1.4% in 2015 as the economy continues to improve. The immediate area has experienced moderate growth over the past decade. The population within a one-mile radius is projected to grow at an annual rate of 0.91% compared to 3.11% for the greater Washington, D.C. area.
The Washington, D.C. multifamily market contains 97,428 apartment units with an average occupancy of 93.4%. The DuPont Circle/Adams Morgan submarket contains 11,805 units with an average occupancy of 96.3%. Demand for apartments in the DuPont Circle/Adams Morgan submarket remains strong although the average occupancy has decreased from 97.6% in 2010 to 96.4% in April 2015. The 2014 population within a three-mile radius of the Drake Property is 363,702, with a median household income of $116,550.
The appraisal identified five comparable properties that were sold between March 2013 and November 2014.The average adjusted sales price per unit was $309,801, as compared to the appraised value per unit at the Drake Property of$299,541 and the Drake Loan per unit of $201,835.
The appraisal identified six competitive properties located within 1.3 miles of the Drake Property in the DuPont Circle/Adams Morgan submarket containing 1,074 units (exclusive of the Drake Property). The Drake Property’s competitive set exhibited a range of occupancy between 95% and 99%, and monthly rental rates ranged from $1,795 to $6,072 for the competitive set. The appraisal concluded a stabilized occupancy of 96.0% and a market rent of $2,208 per unit, in line with the Drake Property’s current occupancy of 99.1% as of August 10, 2015 and average rent per unit of $2,171. The Drake Property competitive set is summarized below.
| Competitive Set(1) | |||||||
Name | Drake Apartments(2) |
Bond Building |
14W |
The District |
Flats at |
View 14 |
The |
| Distance from Subject | NAP | 0.6 miles | 1.1 miles | .07 miles | 0.5 miles | 1.1 miles | 1.6 miles |
| Year Built / Renovated | 2014 / NAP | 1929 / 2012 | 2013 / NAP | 2013 / NAP | 1967 / 2006 | 2010 / NAP | 2013 / NAP |
| Total Occupancy | 99.1% | 98% | 97% | 99% | 98% | 96% | 95% |
| No. of Units | 218 | 83 | 231 | 125 | 306 | 185 | 144 |
| Avg. Rent Per Unit |
| ||||||
Studio
| $1,833 | $2,057 - $2,138 | $1,850 - $2,005 | $2,003 - $2,494 | $1,955 - $2,300 | $2,058 - $2,098
| $1,795 - $2,050 $2,275 - $3,350 |
1 Bed / 1 Bath 1 Bed / 1 Bath Jr | $2,022 $2,156 | $2,525 - $2,850 - | $2,200 - $3,015 - | $2,583 - $3,581 - | $2,385 - $2,745 $2,480 - $2,615 | $2,616 - $3,658 - | $2,275 - $3,350 $1,825 - $2,600 |
1 Bed / 1 Bath Den 1 Bed / 1.5 Bath 2 Bed / 1 Bath |
$3,329 | - - $2,831 - $3,650 | $2,265 - $3,050 - $3,365 - $3,445 | - $3,368 - $3,941 - | - - - | $2,853 - $4,206 - - | - - - |
| 2 Bed / 2 Bath | $3,395 - $3,600 | $3,755 - $4,685 | $4,274 - $5,000 | $4,200 - $4,295 | $4,261 - $6,072 | - | |
| (1) | Source: Appraisal |
| (2) | Based on the rent roll dated August 10, 2015. |
Cash Flow Analysis.
| Cash Flow Analysis(1) | |||||
| U/W | U/W per Unit | ||||
| Gross Potential Rent | $5,672,940 | $26,023 | |||
| Total Other Income(2) | 294,536 | 1,351 | |||
| Less: Vacancy(3) | (226,918) | (1,041) | |||
| Effective Gross Income | $5,740,558 | $26,333 | |||
| Total Operating Expenses(4) | 2,351,420 | 10,786 | |||
| Net Operating Income | $3,389,139 | $15,547 | |||
| Capital Expenditures | (32,700) | (150) | |||
| Net Cash Flow(2) | $3,356,439 | $15,397 | |||
| (1) | The Drake Property was constructed in 2014. As such, historical data is not yet available. |
| (2) | Total Other Income is based upon the competitive set identified in the appraisal in an amount equal to 0.024% of Effective Gross Income. |
| (3) | U/W Vacancy 4.0% of UW Gross Potential Rent, in-line with the appraiser’s conclusion for the submarket. As of August 10, 2015, the Drake Property was 99.1% leased. |
| (4) | U/W Total Operating Expenses are based on the appraiser’s conclusion. |
THE INFORMATION IN THIS STRUCTURAL AND COLLATERAL TERM SHEET IS NOT COMPLETE AND MAY BE AMENDED PRIOR TO THE TIME OF SALE. THIS TERM SHEET IS NOT AN OFFER TO SELL THESE SECURITIES AND IT IS NOT A SOLICITATION OF AN OFFER TO BUY THESE SECURITIES IN ANY JURISDICTION WHERE THE OFFER OR SALE IS NOT PERMITTED.
| 61 |
1355 17th Street Northwest Washington, DC 20036 | Collateral Asset Summary – Loan No. 5 The Drake | Cut-off Date Balance: Cut-off Date LTV: U/W NCF DSCR: U/W NOI Debt Yield: | $44,000,000 67.4% 1.28x 7.7% |
Property Management.The Drake Property is managed by Keener Management, Inc., an affiliate of the borrower.
Lockbox / Cash Management.The Drake Loan is structured with a springing soft lockbox and springing cash management. The borrower is required to deposit all rents and other payments into the lockbox account controlled by the lender upon the commencement of a Cash Trap Period (as defined below). During a Cash Trap Period, all funds in the lockbox account are to be swept daily to a cash management account under the control of the lender and disbursed in accordance with the loan documents. In addition, during a Cash Trap Period an excess cash flow sweep will be in effect and all excess cash will be deposited into a lender-controlled account, to be held by the lender as additional collateral for the Drake Loan.
A “Cash Trap Period” will commence upon (i) the occurrence and continuance of an event of default under the Drake Loan or (ii) the debt service coverage ratio falling below 1.05x as of the end of a calendar quarter (without regard to the interest only period and based on a 30-year amortization period).
A Cash Trap Period will cease to exist, with respect to clause (i), when such event of default has been cured and no other event under clause (ii) of the definition has occurred and is continuing, and with respect to clause (ii), when the debt service coverage ratio is at least equal to 1.15x for two consecutive calendar quarters, provided no event of default has occurred and is then continuing.
Initial Reserves.At loan closing, the borrower deposited $100,596 into a tax reserve account.
Ongoing Reserves.On a monthly basis, the borrower is required to deposit reserves of (i) 1/12 of the estimated annual real estate taxes, which currently equates to $16,750, into a tax reserve account and (ii) $2,725 ($150 per unit annually) into a replacement reserve account. In addition, upon notice from the lender, the borrower will be required to deposit on a monthly basis (i) 1/12th of the estimated annual insurance premiums into an insurance reserve account if (a) an event of default has occurred, (b) an acceptable blanket insurance policy is no longer in place, (c) the borrower fails to provide evidence of renewal of the blanket insurance policy or (d) the borrower fails to provide evidence that the insurance premiums have been paid and (ii) an amount equal to the monthly ground rent into a ground rent reserve account if (a) an event of default has occurred, (b) the borrower fails to provide satisfactory evidence of payment of the ground rent prior to the 15th of each month or (c) the lender does not receive certification of the borrower’s current and timely payment of the ground rent.
Current Mezzanine or Subordinate Indebtedness.None.
Future Mezzanine or Subordinate Indebtedness Permitted.None.
Ground Lease.The Drake Property is subject to a ground lease with The Trustees of the First Baptist Church of the City of Washington D.C. as ground lessor. The ground lease expires on November 30, 2111, with no renewal options. The current annual ground rent payment for the Drake Property ground lease is $1,008,042.09 per annum. On December 1st of each year during the term of the Drake Loan, the ground rent payments for the 12-month period commencing on such date will be subject to adjustment by the percentage increase in the Consumer Price Index for the prior calendar year, subject to a floor of 2% per annum and a ceiling of 4% per annum.
THE INFORMATION IN THIS STRUCTURAL AND COLLATERAL TERM SHEET IS NOT COMPLETE AND MAY BE AMENDED PRIOR TO THE TIME OF SALE. THIS TERM SHEET IS NOT AN OFFER TO SELL THESE SECURITIES AND IT IS NOT A SOLICITATION OF AN OFFER TO BUY THESE SECURITIES IN ANY JURISDICTION WHERE THE OFFER OR SALE IS NOT PERMITTED.
| 62 |
1355 17th Street Northwest Washington, DC 20036 | Collateral Asset Summary – Loan No. 5 The Drake | Cut-off Date Balance: Cut-off Date LTV: U/W NCF DSCR: U/W NOI Debt Yield: | $44,000,000 67.4% 1.28x 7.7% |
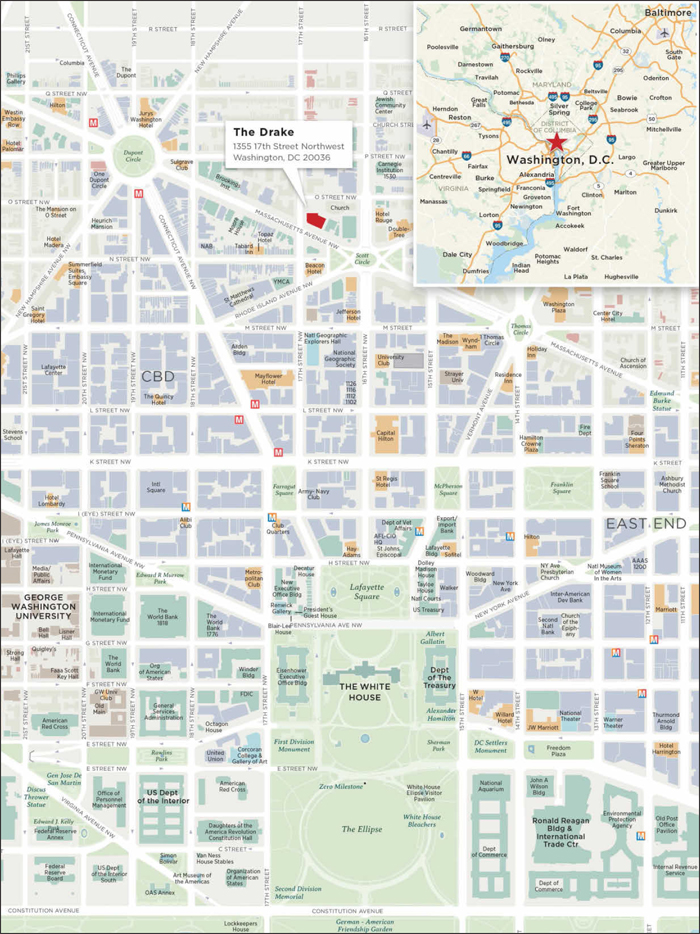
THE INFORMATION IN THIS STRUCTURAL AND COLLATERAL TERM SHEET IS NOT COMPLETE AND MAY BE AMENDED PRIOR TO THE TIME OF SALE. THIS TERM SHEET IS NOT AN OFFER TO SELL THESE SECURITIES AND IT IS NOT A SOLICITATION OF AN OFFER TO BUY THESE SECURITIES IN ANY JURISDICTION WHERE THE OFFER OR SALE IS NOT PERMITTED.
| 63 |
| Various | Collateral Asset Summary – Loan No. 6 Midwest Shopping Center Portfolio | Cut-off Date Balance: Cut-off Date LTV: U/W NCF DSCR: U/W NOI Debt Yield: | $38,152,658 67.4% 1.53x 10.3% |
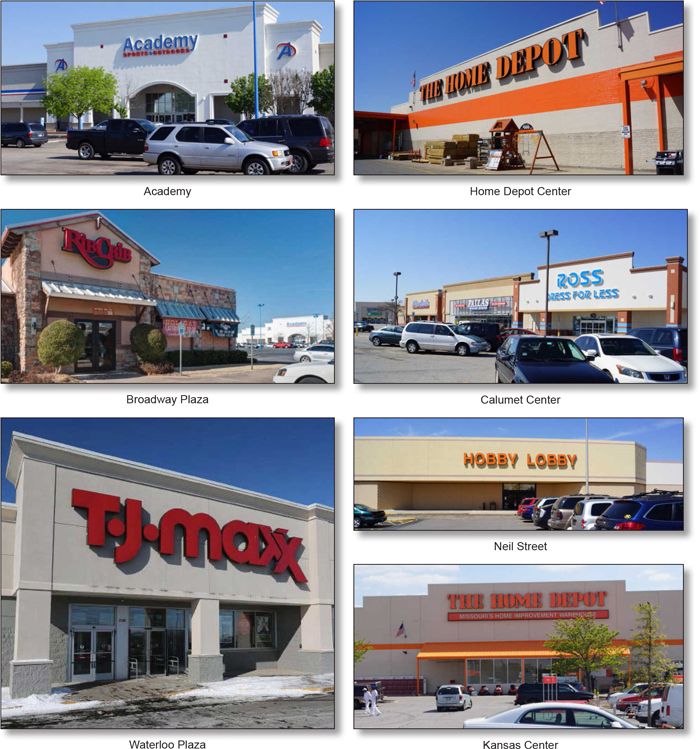
THE INFORMATION IN THIS STRUCTURAL AND COLLATERAL TERM SHEET IS NOT COMPLETE AND MAY BE AMENDED PRIOR TO THE TIME OF SALE. THIS TERM SHEET IS NOT AN OFFER TO SELL THESE SECURITIES AND IT IS NOT A SOLICITATION OF AN OFFER TO BUY THESE SECURITIES IN ANY JURISDICTION WHERE THE OFFER OR SALE IS NOT PERMITTED.
| 64 |
| Various | Collateral Asset Summary – Loan No. 6 Midwest Shopping Center Portfolio | Cut-off Date Balance: Cut-off Date LTV: U/W NCF DSCR: U/W NOI Debt Yield: | $38,152,658 67.4% 1.53x 10.3% |
| Mortgage Loan Information | |
| Loan Seller: | GACC |
| Loan Purpose: | Refinance |
| Sponsor: | Natin Paul |
| Borrower(1): | Various |
| Original Balance: | $38,300,000 |
| Cut-off Date Balance: | $38,152,658 |
| % by Initial UPB: | 4.1% |
| Interest Rate: | 4.3300% |
| Payment Date: | 6thof each month |
| First Payment Date: | August 6, 2015 |
| Maturity Date: | July 6, 2025 |
| Amortization: | 360 months |
| Additional Debt(2): | $5,500,000 Mezzanine Debt |
| Call Protection(3): | L(27), D(89), O(4) |
| Lockbox / Cash Management: | Hard / In Place |
| Reserves(4) | ||
| Initial | Monthly | |
| Taxes: | $894,563 | $224,518 |
| Insurance: | $0 | Springing |
| Replacement: | $0 | $14,824 |
| TI/LC(5): | $500,000 | $29,647 |
| Required Repairs: | $105,640 | NAP |
| Ross Dress for Less: | $58,401 | $0 |
| Lease Sweep: | $0 | Springing |
| Financial Information | ||
| Mortgage Loan | Total Debt | |
| Cut-off Date Balance / Sq. Ft.: | $43 | $49 |
| Balloon Balance / Sq. Ft.: | $35 | $41 |
| Cut-off Date LTV(6): | 67.4% | 77.1% |
| Balloon LTV(6): | 54.4% | 64.1% |
| Underwritten NOI DSCR: | 1.73x | 1.36x |
| Underwritten NCF DSCR: | 1.53x | 1.21x |
| Underwritten NOI Debt Yield: | 10.3% | 9.0% |
| Underwritten NCF Debt Yield: | 9.2% | 8.0% |
| Underwritten NOI Debt Yield at Balloon: | 12.8% | 10.9% |
| Underwritten NCF Debt Yield at Balloon: | 11.4% | 9.6% |
| Property Information | |
| Single Asset / Portfolio: | Portfolio of six properties |
| Property Type: | Anchored Retail |
| Collateral: | Fee Simple |
| Location: | Various |
| Year Built / Renovated: | Various |
| Total Sq. Ft.(7): | 889,413 |
| Property Management: | Greenstar Property Management, LLC |
| Underwritten NOI: | $3,945,112 |
| Underwritten NCF: | $3,496,815 |
| Appraised Value(6): | $56,630,000 |
| Appraisal Date: | April 3, 2015 |
| Historical NOI | |
| Most Recent NOI: | $4,164,051 (T-9 July 31, 2015 Ann.) |
| 2014 NOI: | $4,245,414 (December 31, 2014) |
| 2013 NOI: | $3,875,455 (December 31, 2013) |
| 2012 NOI: | $4,482,923 (December 31, 2012) |
| Historical Occupancy | |
| Most Recent Occupancy: | 90.2% (August 18, 2015) |
| 2014 Occupancy: | 91.0% (December 31, 2014) |
| 2013 Occupancy: | 96.9% (December 31, 2013) |
| 2012 Occupancy: | 96.5% (December 31, 2012) |
| (1) | The borrowers under the Midwest Shopping Center Portfolio Loan are WC MRP Calumet Center, LLC; WC MRP Des Moines Center, LLC; WC MRP Kansas Center, LLC; WC MRP Champaign Center, LLC; WC MRP Broadway Plaza, LLC and WC MRP Waterloo Plaza, LLC. |
| (2) | See “Current Mezzanine or Subordinate Indebtedness” herein. |
| (3) | Partial release is permitted. See “Partial Release” herein. |
| (4) | See “Initial Reserves” and “Ongoing Reserves” herein. |
| (5) | The TI/LC reserve is subject to a cap of $1,000,000 so long as (i) the debt yield is no less than 10% and (ii) the Home Depot leases have been renewed, extended or replaced in accordance with the terms and conditions provided in the loan documents. |
| (6) | The Appraised Value of $56.63 million reflects a premium attributed to the aggregate value of the Midwest Shopping Center Portfolio Properties as a whole. The sum of the value of each of the properties on an individual basis is $54.6 million, which represents a Cut-off Date LTV of 69.9% and a Balloon LTV of 56.4%. |
| (7) | Total Sq. Ft. includes 37,143 sq. ft. across three leased fee outparcels including a vacant pad site at the Calumet Center property (25,280 sq. ft.), Rib Crib BBQ & Grill (5,500 sq. ft.) and Bank of the West (6,363 sq. ft.). |
THE INFORMATION IN THIS STRUCTURAL AND COLLATERAL TERM SHEET IS NOT COMPLETE AND MAY BE AMENDED PRIOR TO THE TIME OF SALE. THIS TERM SHEET IS NOT AN OFFER TO SELL THESE SECURITIES AND IT IS NOT A SOLICITATION OF AN OFFER TO BUY THESE SECURITIES IN ANY JURISDICTION WHERE THE OFFER OR SALE IS NOT PERMITTED.
| 65 |
| Various | Collateral Asset Summary – Loan No. 6 Midwest Shopping Center Portfolio | Cut-off Date Balance: Cut-off Date LTV: U/W NCF DSCR: U/W NOI Debt Yield: | $38,152,658 67.4% 1.53x 10.3% |
| Portfolio Summary | ||||||
| Property Name | Location | Sq. Ft. | Year Built | Allocated Loan Amount | “As-is” Appraised Value(1) | Occupancy(2) |
| Home Depot Shopping Center | Des Moines, IA | 260,801 | 1991-2000 | $10,968,500 | $15,250,000 | 87.9% |
| Calumet Center | Calumet City, IL | 159,145 | 1974 | $6,725,000 | $11,950,000 | 84.1% |
| Waterloo Plaza | Waterloo, IA | 104,074 | 1991 | $6,456,500 | $8,400,000 | 100.0% |
| Broadway Plaza | Edmond, OK | 103,027 | 1994 | $5,835,000 | $7,800,000 | 100.0% |
| Kansas Center | Kansas City, MO | 150,381 | 1999 | $4,481,500 | $5,800,000 | 80.2% |
| Neil Street Shopping Center | Champaign, IL | 111,985 | 1984 | $3,833,500 | $5,400,000 | 100.0% |
| Total / Wtd. Avg. | 889,413 | $38,300,000 | $54,600,000 | 90.2% | ||
| Total with Portfolio Premium | $56,630,000 | |||||
| (1) | The portfolio “As-Is” Value of $56.63 million reflects a premium attributed to the aggregate value of the Midwest Shopping Center Portfolio as a whole. The sum of the value of each of the properties on an individual basis is $54.60 million. |
| (2) | Occupancy based on rent rolls dated August 18, 2015. |
| Tenant Summary | ||||||||
Tenant | Property | Credit Rating (Fitch/ Moody’s/S&P)(1) | Net Rentable Area (Sq. Ft.) | % of Net Rentable Area | U/W Base Rent PSF | % of Total U/W | Lease Expiration | |
| Home Depot(2) | Kansas Center | A/A2/A | 113,969 | 12.8% | $3.34 | 7.1% | 1/31/2020 | |
| Home Depot(3) | Home Depot Center | A/A2/A | 111,847 | 12.6% | $2.81 | 5.8% | 1/31/2020 | |
| Academy Sports(4) | Broadway Plaza | NR/NR/NR | 97,527 | 11.0% | $5.25 | 9.5% | 4/30/2019 | |
| Hobby Lobby(5) | Neil Street Shopping Center | NR/NR/NR | 70,695 | 7.9% | $3.71 | 4.9% | 7/31/2017 | |
| Hobby Lobby(6) | Waterloo Plaza | NR/NR/NR | 65,045 | 7.3% | $5.00 | 6.0% | 11/30/2024 | |
| Total Major Tenants(7) | 459,083 | 51.6% | $3.91 | 33.4% | ||||
| Remaining Tenants(8) | 343,564 | 38.6% | $10.43 | 66.6% | ||||
| Total Occupied Collateral | 802,647 | 90.2% | $6.70 | 100.0% | ||||
| Vacant | 86,766 | 9.8% | ||||||
| Total | 889,413 | 100.0% | ||||||
| (1) | Certain ratings are those of the parent company whether or not the parent company guarantees the lease. |
| (2) | Home Depot at the Kansas Center property has six, five-year renewal options upon written notice no later than twelve months prior to the lease expiration date of January 31, 2020. The tenant has no termination options. |
| (3) | Home Depot at the Home Depot Center property has ten, five-year renewal options upon written notice no later than twelve months prior to the lease expiration date of January 31, 2020. The tenant has no termination options. |
| (4) | Academy Sports at the Broadway Plaza property has one, five-year renewal option upon written notice no later than 210 days prior to the lease expiration date of April 30, 2019. The tenant has no termination options. |
| (5) | Hobby Lobby at the Neil Street Shopping Center property has two, five-year renewal options upon written notice no later than twelve months prior to the lease expiration date of July 31, 2017. The tenant has no termination options. |
| (6) | Hobby Lobby at the Waterloo Plaza property has one, five-year renewal option upon written notice no later than twelve months prior to the lease expiration date of November 30, 2024. The tenant has no termination options. |
| (7) | None of the Major Tenants shown above were required to report sales. |
| (8) | Includes the B-Bops leased fee parcel, which is excluded from collateral sq. ft. and accounts for $52,470 in U/W base rent as well as the Rib Crib BBQ & Grill and Bank of the West leased fee outparcels which are 5,500 sq. ft. and 6,363 sq. ft., respectively. |
THE INFORMATION IN THIS STRUCTURAL AND COLLATERAL TERM SHEET IS NOT COMPLETE AND MAY BE AMENDED PRIOR TO THE TIME OF SALE. THIS TERM SHEET IS NOT AN OFFER TO SELL THESE SECURITIES AND IT IS NOT A SOLICITATION OF AN OFFER TO BUY THESE SECURITIES IN ANY JURISDICTION WHERE THE OFFER OR SALE IS NOT PERMITTED.
| 66 |
| Various | Collateral Asset Summary – Loan No. 6 Midwest Shopping Center Portfolio | Cut-off Date Balance: Cut-off Date LTV: U/W NCF DSCR: U/W NOI Debt Yield: | $38,152,658 67.4% 1.53x 10.3% |
| Lease Rollover Schedule(1) | ||||||||
| Year | # of Leases Expiring | Total Expiring Sq. Ft. | % of Total Sq. Ft. Expiring | Cumulative Sq. Ft. Expiring | Cumulative % of Sq. Ft. Expiring | Annual U/W Per Sq. Ft. | % U/W Rolling | Cumulative % of U/W Base Rent |
| MTM | 2 | 3,345 | 0.4% | 3,345 | 0.4% | $13.32 | 0.8% | 0.8% |
| 2015 | 1 | 2,940 | 0.3% | 6,285 | 0.7% | $15.00 | 0.8% | 1.6% |
| 2016 | 4 | 70,889 | 8.0% | 77,174 | 8.7% | $9.36 | 12.3% | 14.0% |
| 2017 | 7 | 127,269 | 14.3% | 204,443 | 23.0% | $7.01 | 16.6% | 30.6% |
| 2018(2) | 5 | 79,039 | 8.9% | 283,482 | 31.9% | $6.28 | 9.2% | 39.8% |
| 2019(3) | 2 | 104,127 | 11.7% | 387,609 | 43.6% | $6.06(3) | 11.7% | 51.5% |
| 2020 | 4 | 283,245 | 31.8% | 670,854 | 75.4% | $4.86 | 25.6% | 77.1% |
| 2021 | 0 | 0 | 0.0% | 670,854 | 75.4% | $0.00 | 0.0% | 77.1% |
| 2022 | 0 | 0 | 0.0% | 670,854 | 75.4% | $0.00 | 0.0% | 77.1% |
| 2023 | 2 | 37,814 | 4.3% | 708,668 | 79.7% | $10.64 | 7.5% | 84.6% |
| 2024 | 2 | 83,979 | 9.4% | 792,647 | 89.1% | $8.27 | 12.9% | 97.5% |
| 2025 | 1 | 10,000 | 1.1% | 802,647 | 90.2% | $13.50 | 2.5% | 100.0% |
| Thereafter | 0 | 0 | 0.0% | 802,647 | 90.2% | $0.00 | 0.0% | 100.0% |
| Vacant | NAP | 86,766 | 9.8% | 889,413 | 100.0% | NAP | NAP | |
| Total / Wtd. Avg. | 30 | 889,413 | 100.0% | $6.70 | 100.0% | |||
| (1) | Certain tenants have lease termination options that may become exercisable prior to the originally stated expiration date of the tenant lease and that are not considered in the lease rollover schedule. |
| (2) | Includes the Rib Crib BBQ & Grill and Bank of the West leased fee outparcels which are 5,500 sq. ft. and 6,363 sq. ft., respectively. |
| (3) | Includes the B-Bop leased fee parcel, which is excluded from collateral sq. ft., which accounts for $52,470 in U/W base rent. |
The Loan. The Midwest Shopping Center Portfolio loan (the “Midwest Shopping Center Portfolio Loan”) is a $38.3 million fixed rate loan secured by the borrowers’ fee simple interest in a portfolio of six anchored retail properties located across four states, totaling 889,413 sq. ft. (the “Midwest Shopping Center Portfolio Properties”). The Midwest Shopping Center Portfolio Loan has a 10-year term and amortizes on a 30-year schedule. The Midwest Shopping Center Portfolio Loan accrues at a fixed rate equal to 4.3300%. Loan proceeds, along with a $5.5 million mezzanine loan, were used to retire existing debt of approximately $40.3 million, fund upfront reserves of approximately $1.6 million, pay closing costs of approximately $0.5 million and return approximately $1.4 million of equity to the borrowers. Based on the portfolio “as-is” appraised value of $56.63 million as of April 3, 2015, which reflects a premium attributed to the aggregate value of the Midwest Shopping Center Portfolio as a whole, the cut-off date LTV is 67.4%. The most recent prior financing of the Midwest Shopping Center Portfolio Loan was not included in a securitization.
| Sources and Uses | ||||||
| Sources | Proceeds | % of Total | Uses | Proceeds | % of Total | |
| Mortgage Loan | $38,300,000 | 87.4% | Loan Payoff | $40,257,681 | 91.9% | |
| Mezzanine Loan | $5,500,000 | 12.6% | Reserves | $1,558,604 | 3.6% | |
| Closing Costs | $537,343 | 1.2% | ||||
| Return of Equity | $1,446,372 | 3.3% | ||||
| Total Sources | $43,800,000 | 100.0% | Total Uses | $43,800,000 | 100.0% | |
The Borrowers / Sponsor. The borrower consists of six single purpose Delaware limited liability companies each structured to be bankruptcy-remote, with two independent directors in their organizational structure. The sponsor of the borrowers and nonrecourse carve-out guarantor is Natin Paul.
Natin Paul is the chief executive officer and founder of World Class Capital Group, LLC, a national real estate investment firm focusing on acquiring, developing and managing real estate. World Class Capital Group owns and operates a diverse mix of real estate properties including office buildings, retail centers, apartments, student housing and hotels. World Class Capital Group, LLC currently owns over 8 million sq. ft. in 16 states in its national portfolio.
The Properties. The Midwest Shopping Center Portfolio Properties are comprised of six retail properties totaling 889,413 sq. ft., located across Illinois, Iowa, Missouri and Oklahoma. The Midwest Shopping Center Portfolio is currently 90.2% occupied with tenants that include Home Depot, Academy Sports, Hobby Lobby, Best Buy, TJ Maxx, Big Lots, OfficeMax and PetSmart.
The Midwest Shopping Center Portfolio has maintained a weighted average historical occupancy of approximately 94.2% since 2011. The Midwest Shopping Center Portfolio tenants have been in occupancy for an average of 14.5 years. Approximately 79.9% of net rentable area of the Midwest Shopping Center Portfolio’s tenants is leased to national retailers and 42.2% of the net rentable area is leased to investment grade tenants.
THE INFORMATION IN THIS STRUCTURAL AND COLLATERAL TERM SHEET IS NOT COMPLETE AND MAY BE AMENDED PRIOR TO THE TIME OF SALE. THIS TERM SHEET IS NOT AN OFFER TO SELL THESE SECURITIES AND IT IS NOT A SOLICITATION OF AN OFFER TO BUY THESE SECURITIES IN ANY JURISDICTION WHERE THE OFFER OR SALE IS NOT PERMITTED.
| 67 |
| Various | Collateral Asset Summary – Loan No. 6 Midwest Shopping Center Portfolio | Cut-off Date Balance: Cut-off Date LTV: U/W NCF DSCR: U/W NOI Debt Yield: | $38,152,658 67.4% 1.53x 10.3% |
The five largest tenants occupy 51.6% of the total sq. ft. and account for 33.4% of the U/W Base Rent. The Midwest Shopping Center Portfolio exhibits a weighted average (based on sq. ft.) in-place rent of $6.70 PSF.
The Home Depot Shopping Center property is a 260,801 sq. ft. retail center located in Des Moines, Iowa. The Home Depot Shopping Center property is 87.9% occupied as of August 18, 2015 and is anchored by Home Depot (42.9% of Home Depot Shopping Center NRA), Best Buy (13.5%), OfficeMax (9.4%) and PetSmart (8.7%). Approximately 56.4% of the Home Depot Shopping Center property is occupied by investment grade tenants. The Home Depot Center Shopping Center property is located with excellent visibility along US Highway 69 and McKinley Street. US Highway 69 is a major north-south thoroughfare in the Des Moines metropolitan area and provides access to the retail corridor servicing the South Des Moines submarket. The 2015 population and average household income within a three-mile radius of the property are 61,953 and $58,759, respectively.
The Calumet Center property is a 159,145 sq. ft. retail center located in Calumet City, Illinois, a suburb of Chicago. The Calumet Center property is situated in a retail corridor along Torrence Avenue in close proximity to I-294. The Calumet Center property is 84.1% occupied as of August 18, 2015 and is anchored by Marshalls (19.2% of Calumet Center NRA), Big Lots (17.8%), Ross Dress for Less (16.4%) and Petco (9.4%). The Calumet Center property also benefits from its close proximity to River Oaks Mall, a mall anchored by Macy’s and JC Penney. Approximately 53.4% of the Calumet Center property is occupied by investment grade tenants and the average tenant has occupied its space for over 10 years. The neighborhood surrounding the property is an established retail market and features good population density and access to numerous thoroughfares. The 2015 population and average household income within a three-mile radius of the property are 122,448 and $54,217, respectively.
The Waterloo Plaza property is a 104,074 sq. ft. retail center located in Waterloo, Iowa, that is 100.0% occupied as of August 18, 2015. The Waterloo Plaza property is anchored by Hobby Lobby (62.5% of Waterloo Plaza NRA), TJ Maxx (27.9%) and Shoe Carnival (9.6%) and is shadow anchored by Dick’s Sporting Goods. The Waterloo Plaza property is located adjacent to Crossroads Center, a regional mall anchored by Gordman’s, Dillard’s, Younkers and Sears. The Waterloo Plaza property has been 100.0% occupied since 2011 and features no tenant turnover within the first five years of the Midwest Shopping Center Portfolio Loan term. The 2015 population and average household income with a three-mile radius of the property are 47,859 and $54,851, respectively.
The Broadway Plaza property is a 103,027 sq. ft. retail center located in Edmond, Oklahoma that is 94.7% occupied by Academy Sports as of August 18, 2015. The Broadway Plaza property also includes a restaurant outparcel ground leased to Rib Crib BBQ & Grill. Academy Sports has been a tenant at the Broadway Plaza property since 2003 and recently executed a five year renewal through 2019. In addition, Academy Sports has invested approximately $0.5 million into its space in 2014. The proximate area features dense residential areas to the east via Highway 77. The 2015 population and average household income within a three-mile radius of the property are 73,886 and $76,052, respectively.
The Kansas Center property is a 150,381 sq. ft. retail center located in Kansas City, Missouri. The Kansas Center property is 80.2% occupied, as of August 18, 2015, by two tenants, Home Depot (75.8% of Kansas Center NRA), the anchor tenant, and Firestone Tire (4.4%). Home Depot has been a tenant since 1998 and recently executed a five year renewal through January 2020 and has six, five-year renewal options remaining. The Kansas Center property is located in close proximity to the 4.5 million sq. ft. Three Trails redevelopment, an office development anticipated to employ approximately 15,000 people and nearby Oxford on the Blue, a 350-acre biotech office park located in south Kansas City. The 2015 population and average household income within a three-mile radius of the property are 52,319 and $46,797, respectively.
The Neil Street Shopping Center property is an 111,985 sq. ft. retail center 100.0% leased to Hobby Lobby (63.1% of Neil Street Shopping Center NRA) and Carle Clinic (36.9%), which is an out-patient primary care facility, under triple net leases, located in Champaign, Illinois. The property has been 100.0% occupied since 2008 and is located adjacent to Marketplace Mall, a 1,100,000 sq. ft. mall anchored by JC Penney, Bergner’s and Macy’s. In addition, there is a retail corridor nearby the Neil Street Shopping Center property which features national retailers such as Wal-Mart, Meijer, Dick’s Sporting Goods, Best Buy, Michael’s, UIta, Menard’s and Lowe’s. The Neil Street Shopping Center property is also located adjacent to a bus stop on the University of Illinois bus route which traverses Neil Street and provides access to Champaign’s retail corridor. The area is also supported by national companies, including State Farm, Dow Chemical Company, Caterpillar and Sony. The 2015 population and average household income with a three-mile radius of the property are 76,308 and $44,009, respectively.
Environmental Matters. The Phase I environmental reports and subsequent reliance letter dated April 28, 2015 recommended no further action other than at the Kansas Center property. At the Kansas Center property, a Phase II subsurface investigation was recommended to assess whether the subsurface had been impacted by the historical and current long-term use of the property by auto repair operations. The Phase II investigation was completed as of the date of the reliance letter and no further action is recommended at the Kansas Center property.
THE INFORMATION IN THIS STRUCTURAL AND COLLATERAL TERM SHEET IS NOT COMPLETE AND MAY BE AMENDED PRIOR TO THE TIME OF SALE. THIS TERM SHEET IS NOT AN OFFER TO SELL THESE SECURITIES AND IT IS NOT A SOLICITATION OF AN OFFER TO BUY THESE SECURITIES IN ANY JURISDICTION WHERE THE OFFER OR SALE IS NOT PERMITTED.
| 68 |
| Various | Collateral Asset Summary – Loan No. 6 Midwest Shopping Center Portfolio | Cut-off Date Balance: Cut-off Date LTV: U/W NCF DSCR: U/W NOI Debt Yield: | $38,152,658 67.4% 1.53x 10.3% |
The Market.The Midwest Shopping Center Portfolio is geographically diversified, representing six different markets: Des Moines, Iowa, Calumet City, Illinois, Waterloo, Iowa, Edmond, Oklahoma, Kansas City, Missouri and Champaign, Illinois.
Des Moines Market. The Home Depot Shopping Center property is located in Des Moines, Iowa within the South Des Moines Submarket. Des Moines, the capital and most populous city in Iowa, is a major center for the insurance and financial services industries. Des Moines is home to a number of financial services companies, including Wells Fargo, Nationwide Mutual Insurance and Principal Financial Group. The Des Moines retail market experienced a moderate improvement in market conditions in Q4 2014. The vacancy rate decreased from 6.0% in Q3 2014 to 5.4% in Q4 2014. Quoted rental rates decreased from Q3 2014 levels, ending at $10.70 PSF. The South Des Moines Submarket is comprised of 28 buildings and 1.79 million sq. ft. There were no new deliveries in the submarket in 2014 and 7,360 sq. ft. of negative absorption. The Q4 2014 submarket vacancy was 7.3% and quoted rental rates were $8.28 PSF.
Calumet City Market.The Calumet Center property is located in Calumet City, Illinois, a southern suburb located within the Chicago metropolitan statistical area (the “Chicago MSA”). Chicago is the third most populous city in the United States, after New York City and Los Angeles and acts as the economic hub for the entire Midwestern region. The Chicago MSA retail market has grown 23.2% since 2002. During Q4 2014, the Chicago retail market vacancy rate dropped 0.3% from 9.8% in Q3 2014 to 9.5% in Q4 2014. Net asking lease rates increased in Q4 2014 to $17.85 PSF from $17.73 PSF in Q3 2014. The Calumet Center property is located within the South Suburbs Submarket of the Chicago MSA retail market. The submarket is comprised of 42 buildings and approximately 6.5 million sq. ft. The Q4 2014 submarket vacancy was 18.0% and quoted rental rates were $13.64 PSF.
Waterloo Market.The Waterloo Plaza property is located in Waterloo, Iowa within the Waterloo metropolitan statistical area (the “Waterloo MSA”). The Waterloo MSA is home to the University of North Iowa which has a current enrollment of over 14,000 students and a staff of more than 1,700 employees. Waterloo-Cedar Falls’ population growth is supported by the growth of the University of Northern Iowa as well as the presence of Deere & Co.’s, operations in the Waterloo region. Deere & Co., one of the world’s largest manufacturers of agricultural equipment, is the top employer in the MSA with over 6,000 employees at their operations facilities. The Waterloo-Cedar Falls retail market is comprised of 480 buildings totaling 7.22 million sq. ft. The market had 134,552 sq. ft. of absorption in 2014. The Q4 2014 market vacancy was 5.5% and quoted rents were $9.96 PSF. The Waterloo Plaza property is located within the Black Hawk County retail submarket. The Black Hawk County retail submarket is comprised of 409 properties consisting of 6.44 million sq. ft. The Q4 2014 vacancy rate was 5.4%, representing a 1.3% decrease from Q4 2013. The Q4 2014 average rental rate was $10.34 PSF, representing a 10.7% increase over Q4 2013.
Edmond Market.The Broadway Plaza property is located in Edmond, Oklahoma a suburb located in the Oklahoma City metropolitan statistical area. Oklahoma City is the state capital of Oklahoma and national headquarters to two Fortune 500 companies, Chesapeake Energy Corporation and Devon. Oklahoma City was recently named as one of the “Top Metro Areas with the Most Economic Momentum Going into 2014” by Forbes Magazine. As of the end of Q4 2014, the Oklahoma City retail vacancy rate stood at 6.7%, representing a 0.1% decrease year over year. Net absorption was positive 96,480 sq. ft., and vacant sublease space increased by 6,160 sq. ft. during the same time period. Quoted rents ended Q4 2014 at $11.08 PSF, which represents an increase from $10.87 PSF in the Q3 2014 and $10.84 PSF at the end of Q1 2014.
Kansas City Market.The Kansas Center property is located in Kansas City, Missouri within the Kansas City metropolitan statistical area (the “Kansas City MSA”). The Kansas City MSA is home to nearly 2.1 million residents as of 2012 and is undergoing a major renaissance with over $9.0 billion in major improvements currently under construction or recently completed. The Kansas City MSA has nearly 110 million sq. ft. of retail space and the MSA reported an average occupancy of 91.9% and average rent of $12.28 PSF as of Q4 2014. The South Kansas City Shopping Center Submarket, where the Kansas Center property is located, encompasses 8.57 million sq. ft. The Q4 2014 submarket vacancy was 11.3% and quoted rental rates averaged $11.40 PSF.
Champaign Market.The Neil Street property is located in Champaign, Illinois within the Champaign-Urbana metropolitan statistical area (the “Champaign-Urbana MSA”). The Champaign-Urbana MSA had a 2014 population of approximately 236,100 and experienced total employment growth in both 2013 and 2014. In addition, the unemployment rate in the Champaign-Urbana MSA decreased 1.3% from 2013 to 2014 to 6.9%. The Champaign-Urbana retail market is comprised of 575 buildings and 9.86 million sq. ft. The Champaign-Urbana market had 137,726 sq. ft. of absorption in 2014. The Q4 2014 market vacancy was 4.4% and quoted rents were $10.98 PSF. There are 54 retail properties with greater than 30,000 sq. ft. (approximately 5.48 million sq. ft.) within a five mile radius of the Neil Street property. The Q4 2014 vacancy rate was 4.1% and asking rents ranged from $4.25 to $15.50 PSF with an average of $7.79 PSF.
THE INFORMATION IN THIS STRUCTURAL AND COLLATERAL TERM SHEET IS NOT COMPLETE AND MAY BE AMENDED PRIOR TO THE TIME OF SALE. THIS TERM SHEET IS NOT AN OFFER TO SELL THESE SECURITIES AND IT IS NOT A SOLICITATION OF AN OFFER TO BUY THESE SECURITIES IN ANY JURISDICTION WHERE THE OFFER OR SALE IS NOT PERMITTED.
| 69 |
| Various | Collateral Asset Summary – Loan No. 6 Midwest Shopping Center Portfolio | Cut-off Date Balance: Cut-off Date LTV: U/W NCF DSCR: U/W NOI Debt Yield: | $38,152,658 67.4% 1.53x 10.3% |
Cash Flow Analysis.
| Cash Flow Analysis | ||||||
| 2012 | 2013 | 2014 | T-9 7/31/2015 Ann. | U/W | U/W PSF | |
| Gross Potential Rent | $5,249,110 | $5,272,520 | $5,768,146 | $5,135,304 | $6,291,596 | $7.07 |
| Reimbursements | 2,617,067 | 2,084,576 | 1,541,287 | 2,340,269 | 1,855,680 | 2.09 |
| Other Income(1) | 371,472 | 154,811 | 289,995 | 203,401 | 199,521 | 0.22 |
| Gross Potential Income | $8,237,649 | $7,511,907 | $7,599,428 | $7,678,975 | $8,346,797 | $9.38 |
| Less: Vacancy(2) | 0 | 0 | 0 | 0 | (908,366) | (1.02) |
| Effective Gross Income | $8,237,649 | $7,511,907 | $7,599,428 | $7,678,975 | $7,438,431 | $8.36 |
| Total Operating Expenses | 3,754,726 | 3,636,452 | 3,354,015 | 3,514,924 | 3,493,319 | 3.93 |
| Net Operating Income | $4,482,923 | $3,875,455 | $4,245,413 | $4,164,051 | $3,945,112 | $4.44 |
| TI/LC | 0 | 0 | 0 | 0 | 305,765 | 0.34 |
| Capital Expenditures | 0 | 0 | 0 | 0 | 142,531 | 0.16 |
| Net Cash Flow | $4,482,923 | $3,875,455 | $4,245,413 | $4,164,051 | $3,496,815 | $3.93 |
(1) Other Income includes miscellaneous property level income.
(2) U/W Vacancy represents 11.1% of gross income.
Property Management. The Midwest Shopping Center Portfolio Properties are managed by Greenstar Property Management, LLC. Greenstar Property Management, LLC is a Texas based company that provides property management services, accounting and reporting for income-producing properties.
Lockbox / Cash Management. The Midwest Shopping Center Portfolio Loan is structured with a hard lockbox and in place cash management. The borrowers instructed the tenants to deposit all rents and other payments into the lockbox account controlled by the lender. All funds in the lockbox account are swept daily to a cash management account under the control of the lender. Provided no Trigger Period (as defined herein) exists, all funds in the cash management account after payment of all required monthly debt service and reserve amounts due under the Midwest Shopping Center Portfolio Loan documents will be remitted to the borrower.
A “Trigger Period” will commence (i) upon an event of default under the mortgage loan documents, (ii) if the DSCR is less than 1.10x on the last day of any calendar quarter, (iii) upon an event of default under the mezzanine loan or (iv) upon the commencement of a Lease Sweep Period (as defined below). A Trigger Period will cease to exist when (a) with respect to clause (i) and (iii), such event of default has been cured, (b) with respect to clause (ii) the DSCR is at least 1.15x for two consecutive quarters and (c) with respect to clause (iv) when such Lease Sweep Period has ended and no other Lease Sweep Period is then continuing.
A “Lease Sweep Period” will commence on the first monthly payment date following the occurrence of any of the following: (i) the date that is 18 months prior to the earliest stated expiration of a Lease Sweep Lease (as defined herein), (ii) the receipt by borrower or manager of a notice from any tenant under a Lease Sweep Lease exercising its right to terminate its lease sweep space, (iii) the date on which a Lease Sweep Tenant Party surrenders, cancels or terminates its Lease Sweep Lease (or any material portion thereof) prior to its then current expiration date or the date on which a Lease Sweep Tenant Party delivers to the borrower or property manager a notice that it intends to surrender, cancel or terminate its Lease Sweep Lease (or any material portion thereof) prior to its then current expiration date, (iv) the date that any Lease Sweep Tenant Party discontinues its business in the space demised under the applicable Lease Sweep Lease, (v) upon the occurrence of a monetary or material non-monetary default under a Lease Sweep Lease by the tenant thereunder that continues beyond any applicable notice and cure period, (vi) upon a Lease Sweep Tenant Party insolvency proceeding or (vii) upon a decline in the credit rating of the tenant under a Lease Sweep Lease below “BBB+” or equivalent of any of the rating agencies.
The “Lease Sweep Lease” means (i) the certain lease between KRCV Corp. and Home Depot U.S.A., Inc., dated as of October 19, 1998, (ii) the certain lease between Kimven Corporation and Home Dept U.S.A., Inc., dated as October 16, 1998 (collectively with the lease identified in subclause (i), the “Home Depot Leases”) or (iii) any replacement lease that, either individually or when taken together with any other lease with the same tenant (or its affiliate), covers 80% of the space demised pursuant to the Lease Sweep Lease that is being replaced.
A “Lease Sweep Tenant Party” means the tenant under a Lease Sweep Lease or its direct or indirect parent company, if any.
THE INFORMATION IN THIS STRUCTURAL AND COLLATERAL TERM SHEET IS NOT COMPLETE AND MAY BE AMENDED PRIOR TO THE TIME OF SALE. THIS TERM SHEET IS NOT AN OFFER TO SELL THESE SECURITIES AND IT IS NOT A SOLICITATION OF AN OFFER TO BUY THESE SECURITIES IN ANY JURISDICTION WHERE THE OFFER OR SALE IS NOT PERMITTED.
| 70 |
| Various | Collateral Asset Summary – Loan No. 6 Midwest Shopping Center Portfolio | Cut-off Date Balance: Cut-off Date LTV: U/W NCF DSCR: U/W NOI Debt Yield: | $38,152,658 67.4% 1.53x 10.3% |
Initial Reserves. At loan closing, the borrowers deposited (i) $894,563 into a tax reserve account, (ii) $500,000 into the TI/LC reserve account, (iii) $105,640 into the required repairs reserve account, which represents 110% of the engineer’s recommendation and (iv) $58,401 into a Ross Dress for Less reserve account, which was reserved for common area maintenance reconciliations for 2012 and 2013.
Ongoing Reserves. On a monthly basis, the borrowers are required to deposit reserves of (i) $14,824 into a replacement reserve account, (ii) $29,647 into a TI/LC reserve account, subject to a cap of $1,000,000 so long as (a) the debt yield is no less than 10% and (b) the Home Depot leases have been renewed, extended or replaced in accordance with the terms and conditions provided in the loan documents, (iii) 1/12 of the estimated annual taxes, initially estimated to be $224,518 (which excludes taxes for any portion of the properties where Home Depot and Rib Crib BBQ are obligated to pay the taxing authority directly and such tenant is paying the applicable authority in accordance with the loan documents) and (iv) 1/12 of the annual insurance premiums into an insurance reserve account if an acceptable blanket insurance policy is no longer in place. On each monthly payment date during a Lease Sweep Period, all excess cash flow will be deposited to the lease sweep reserve.
Current Mezzanine or Subordinate Indebtedness. A $5,500,000 mezzanine loan was funded concurrently with the funding of the Midwest Shopping Center Portfolio Loan. The mezzanine loan is coterminous with the Midwest Shopping Center Portfolio Loan, accrues interest at a rate of 11.0000% and is interest only for the entire term. The current holder of the mezzanine loan is WC MRP6 Mezz, LLC.
Future Mezzanine or Subordinate Indebtedness Permitted.None.
Partial Release. On any payment date after the lockout period, the borrowers may obtain the release of an individual property upon a bona fide third-party sale provided, among other things, (i) the LTV for the remaining properties does not exceed the lesser of the LTV immediately preceding such sale and 77.3%, (ii) the DSCR for the remaining properties is not less than the greater of the DSCR immediately preceding the sale and 1.19x and (iii) the borrowers partially defease to the lender a release amount equal to the greater of (a) 87.443% of net sale proceeds and (b) 120% of the allocated loan amount for the property being sold. For the avoidance of doubt, the LTV and DSCR calculations used in connection with the release of an individual property from the Midwest Shopping Center Portfolio are based on the sum of the outstanding principal balance of the Midwest Shopping Center Portfolio Loan and the outstanding principal balance of the current mezzanine loan.
Substitution.None.
THE INFORMATION IN THIS STRUCTURAL AND COLLATERAL TERM SHEET IS NOT COMPLETE AND MAY BE AMENDED PRIOR TO THE TIME OF SALE. THIS TERM SHEET IS NOT AN OFFER TO SELL THESE SECURITIES AND IT IS NOT A SOLICITATION OF AN OFFER TO BUY THESE SECURITIES IN ANY JURISDICTION WHERE THE OFFER OR SALE IS NOT PERMITTED.
| 71 |
| Various | Collateral Asset Summary – Loan No. 6 Midwest Shopping Center Portfolio | Cut-off Date Balance: Cut-off Date LTV: U/W NCF DSCR: U/W NOI Debt Yield: | $38,152,658 67.4% 1.53x 10.3% |
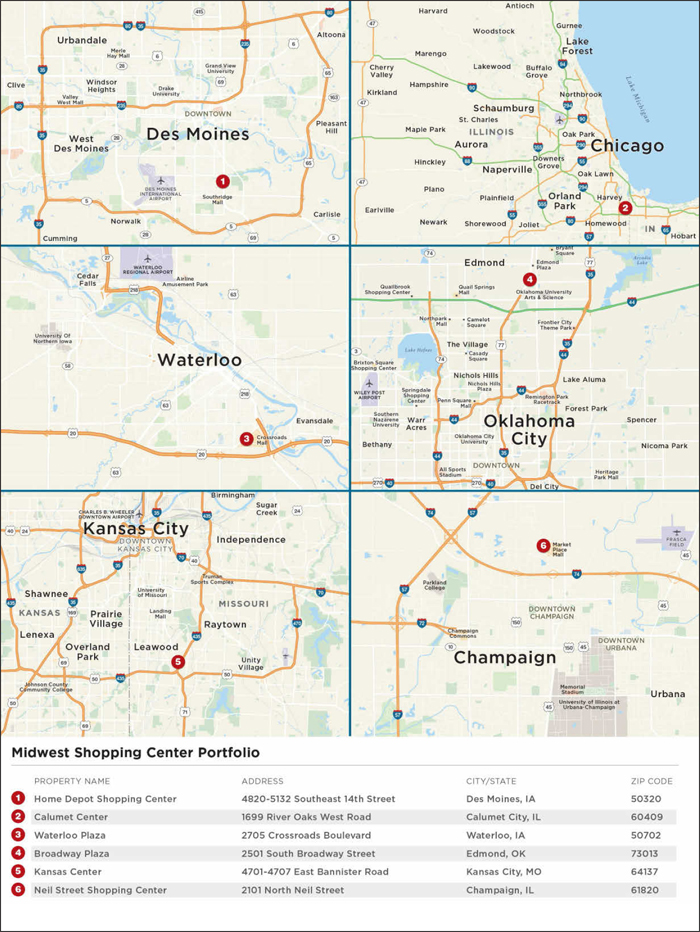
THE INFORMATION IN THIS STRUCTURAL AND COLLATERAL TERM SHEET IS NOT COMPLETE AND MAY BE AMENDED PRIOR TO THE TIME OF SALE. THIS TERM SHEET IS NOT AN OFFER TO SELL THESE SECURITIES AND IT IS NOT A SOLICITATION OF AN OFFER TO BUY THESE SECURITIES IN ANY JURISDICTION WHERE THE OFFER OR SALE IS NOT PERMITTED.
| 72 |
(THIS PAGE INTENTIONALLY LEFT BLANK)
| 73 |
12653 Telecom Drive | Collateral Asset Summary – Loan No. 7 Intellicenter | Cut-off Date Balance: Cut-off Date LTV: U/W NCF DSCR: U/W NOI Debt Yield: | $33,562,500 75.0% 1.44x 9.3% |

THE INFORMATION IN THIS STRUCTURAL AND COLLATERAL TERM SHEET IS NOT COMPLETE AND MAY BE AMENDED PRIOR TO THE TIME OF SALE. THIS TERM SHEET IS NOT AN OFFER TO SELL THESE SECURITIES AND IT IS NOT A SOLICITATION OF AN OFFER TO BUY THESE SECURITIES IN ANY JURISDICTION WHERE THE OFFER OR SALE IS NOT PERMITTED.
| 74 |
12653 Telecom Drive | Collateral Asset Summary – Loan No. 7 Intellicenter | Cut-off Date Balance: Cut-off Date LTV: U/W NCF DSCR: U/W NOI Debt Yield: | $33,562,500 75.0% 1.44x 9.3% |
| Mortgage Loan Information | |
| Loan Seller: | KeyBank |
| Loan Purpose: | Acquisition |
| Sponsor: | City Office REIT Operating Partnership, L.P. |
| Borrower: | CIO Intellicenter, Limited Partnership |
| Original Balance: | $33,562,500 |
| Cut-off Date Balance: | $33,562,500 |
| % by Initial UPB: | 3.6% |
| Interest Rate: | 4.6500% |
| Payment Date: | 1st of each month |
| First Payment Date: | November 1, 2015 |
| Maturity Date: | October 1, 2025 |
| Amortization: | Interest only for first 36 months; 360 months thereafter |
| Additional Debt: | None |
| Call Protection: | L(25), YM1(92), O(3) |
| Lockbox / Cash Management: | Soft / Springing |
| Reserves(1) | ||
| Initial | Monthly | |
| Taxes: | $630,000 | $52,500 |
| Insurance: | $0 | Springing |
| Replacement: | $3,392 | $3,392 |
| TI/LC(2): | $250,000 | $16,959 |
| Morgan Stanley: | $0 | Springing |
| Major Tenant Rollover: | $0 | Springing |
| Financial Information | |
| Cut-off Date Balance / Sq. Ft.: | $165 |
| Balloon Balance / Sq. Ft.: | $145 |
| Cut-off Date LTV: | 75.0% |
| Balloon LTV: | 65.9% |
| Underwritten NOI DSCR(3): | 1.50x |
| Underwritten NCF DSCR(3): | 1.44x |
| Underwritten NOI Debt Yield: | 9.3% |
| Underwritten NCF Debt Yield: | 8.9% |
| Underwritten NOI Debt Yield at Balloon: | 10.6% |
| Underwritten NCF Debt Yield at Balloon: | 10.2% |
| Property Information | |
| Single Asset / Portfolio: | Single Asset |
| Property Type: | Suburban Office |
| Collateral: | Fee Simple |
| Location: | Tampa, FL |
| Year Built / Renovated: | 2008 / NAP |
| Total Sq. Ft.: | 203,509 |
| Property Management: | Cassidy Turley Commercial Real Estate Services, Inc., d/b/a Cushman and Wakefield |
| Underwritten NOI: | $3,110,342 |
| Underwritten NCF: | $3,000,142 |
| Appraised Value: | $44,750,000 |
| Appraisal Date: | August 5, 2015 |
| Historical NOI(4) | |
| Most Recent NOI: | $2,876,120 (T-12 June 30, 2015) |
| 2014 NOI: | $2,340,841 (December 31, 2014) |
| 2013 NOI: | $271,194 (December 31, 2013) |
| 2012 NOI: | NAV |
| Historical Occupancy | |
| Most Recent Occupancy: | 100.0% (July 1, 2015) |
| 2014 Occupancy: | 100.0% (December 15, 2014) |
| 2013 Occupancy: | NAV |
| 2012 Occupancy: | NAV |
| (1) | See “Initial Reserves” and “Ongoing Reserves” herein. |
| (2) | The TI/LC reserve is subject to a cap of $525,000. |
| (3) | Based on amortizing debt service payments. Based on the current interest only debt service payments, the Underwritten NOI DSCR and Underwritten NCF DSCR are 1.97x and 1.90x, respectively. |
| (4) | For information regarding the increase in Historical NOI see “Cash Flow Analysis” herein. |
THE INFORMATION IN THIS STRUCTURAL AND COLLATERAL TERM SHEET IS NOT COMPLETE AND MAY BE AMENDED PRIOR TO THE TIME OF SALE. THIS TERM SHEET IS NOT AN OFFER TO SELL THESE SECURITIES AND IT IS NOT A SOLICITATION OF AN OFFER TO BUY THESE SECURITIES IN ANY JURISDICTION WHERE THE OFFER OR SALE IS NOT PERMITTED.
| 75 |
12653 Telecom Drive | Collateral Asset Summary – Loan No. 7 Intellicenter | Cut-off Date Balance: Cut-off Date LTV: U/W NCF DSCR: U/W NOI Debt Yield: | $33,562,500 75.0% 1.44x 9.3% |
| Tenant Summary |
| Tenant | Ratings (Fitch/Moody’s/S&P)(1) | Net Rentable Area (Sq. Ft.) | % of Net Rentable Area | U/W Base Rent PSF | % of Total U/W Base Rent | Lease Expiration | ||||||||||
| H. Lee Moffitt Cancer Center(2) | NR/A3/A- | 154,963 | 76.1 | % | $23.88 | (3) | 76.8 | % | 3/31/2027 | |||||||
| Morgan Stanley(4) | A/A3/A- | 25,294 | 12.4 | % | $24.23 | (5) | 12.7 | % | 3/31/2024(6) | |||||||
| Open Text(7) | NR/ Ba1/BB+ | 21,344 | 10.5 | % | $23.69 | 10.5 | % | 3/31/2019 | ||||||||
| Total Major Tenants | 201,601 | 99.1 | % | $23.90 | 100.0 | % | ||||||||||
| Non-Major Tenants | 1,908 | 0.9 | % | $0.00 | (8) | 0.0 | % | |||||||||
| Total Occupied Collateral | 203,509 | 100.0 | % | $23.68 | 100.0 | % | ||||||||||
| Vacant | 0 | 0.0 | % | |||||||||||||
| Total | 203,509 | 100.0 | % | |||||||||||||
| (1) | Certain ratings are those of the parent company whether or not the parent company guarantees the lease. |
| (2) | The H. Lee Moffitt Cancer Center lease contains two, ten-year extension options with written notice to exercise an option delivered no earlier than 18 months and no later than 15 months prior to expiration. |
| (3) | U/W Base Rent PSF includes $374,494 in step rent which represents the straight line of average rent underwritten throughout the loan term. The current in-place base rent PSF is $21.46. |
| (4) | The Morgan Stanley lease contains one, seven-year extension option with written notice to exercise an option delivered no earlier than 18 months and no later than 12 months prior to expiration. |
| (5) | Morgan Stanley U/W Base Rent PSF includes a rental increase effective April 1, 2016. |
| (6) | Morgan Stanley has the right to terminate their lease on 3/31/2019 upon at least 12 months’ notice and payment of a termination fee of $855,214 ($33.81 PSF). |
| (7) | The Open Text lease contains two, five-year extension options with notice of tenant’s exercise of option delivered no earlier than 12 months and no later than 9 months prior to expiration. |
| (8) | The Non-Major Tenant, Four Fingers IC, Inc. d/b/a Nature’s Table (cafeteria operator), pays percentage rent at the rate of 7% of gross sales. No rent was underwritten for the tenant. |
| Lease Rollover Schedule(1) | ||||||||||||||||||||||||
| Year | # of Leases Expiring | Total Expiring Sq. Ft. | % of Total Sq. Ft. Expiring | Cumulative Sq. Ft. Expiring | Cumulative % of Sq. Ft. Expiring | Annual U/W Base Rent PSF | % U/W Base Rent Rolling | Cumulative % of U/W Base Rent | ||||||||||||||||
| MTM | 0 | 0 | 0.0 | % | 0 | 0.0% | $0.00 | 0.0 | % | 0.0 | % | |||||||||||||
| 2015 | 0 | 0 | 0.0 | % | 0 | 0.0% | $0.00 | 0.0 | % | 0.0 | % | |||||||||||||
| 2016 | 0 | 0 | 0.0 | % | 0 | 0.0% | $0.00 | 0.0 | % | 0.0 | % | |||||||||||||
| 2017 | 0 | 0 | 0.0 | % | 0 | 0.0% | $0.00 | 0.0 | % | 0.0 | % | |||||||||||||
| 2018 | 0 | 0 | 0.0 | % | 0 | 0.0% | $0.00 | 0.0 | % | 0.0 | % | |||||||||||||
| 2019 | 1 | 21,344 | 10.5 | % | 21,344 | 10.5% | $23.69 | 10.5 | % | 10.5 | % | |||||||||||||
| 2020 | 0 | 0 | 0.0 | % | 21,344 | 10.5% | $0.00 | 0.0 | % | 10.5 | % | |||||||||||||
| 2021 | 0 | 0 | 0.0 | % | 21,344 | 10.5% | $0.00 | 0.0 | % | 10.5 | % | |||||||||||||
| 2022 | 0 | 0 | 0.0 | % | 21,344 | 10.5% | $0.00 | 0.0 | % | 10.5 | % | |||||||||||||
| 2023 | 1 | 1,908 | 0.9 | % | 23,252 | 11.4% | $0.00 | 0.0 | % | 10.5 | % | |||||||||||||
| 2024 | 1 | 25,294 | 12.4 | % | 48,546 | 23.9% | $24.23 | 12.7 | % | 23.2 | % | |||||||||||||
| 2025 | 0 | 0 | 0.0 | % | 48,546 | 23.9% | $0.00 | 0.0 | % | 23.2 | % | |||||||||||||
| Thereafter | 1 | 154,963 | 76.1 | % | 203,509 | 100.0% | $23.88 | 76.8 | % | 100.0 | % | |||||||||||||
| Vacant | NAP | 0 | 0.0 | % | 203,509 | 100.0% | NAP | NAP | ||||||||||||||||
| Total / Wtd. Avg. | 4 | 203,509 | 100.0 | % | $23.68 | 100.0 | % | |||||||||||||||||
| (1) | Certain tenants have lease termination options that may become exercisable prior to the originally stated expiration date of the tenant lease that are not considered in the lease rollover schedule. |
The Loan. The Intellicenter loan (the “Intellicenter Loan”) is a $33.5625 million fixed rate loan secured by the borrower’s fee simple interest in a 203,509 sq. ft. Class A office property located at 12653 Telecom Drive in Tampa, Florida (the “Intellicenter Property”). The Intellicenter Loan has a 10-year term and is interest only for the first 36 months of the term and amortizes on a 30-year schedule thereafter. The Intellicenter Loan accrues interest at a fixed rate equal to 4.6500%. Loan proceeds, along with approximately $12.5 million of sponsor equity, were used to acquire the Intellicenter Property for $44.6 million, fund upfront reserves of approximately $0.9 million and pay closing costs of approximately $0.6 million. Based on the appraised value of $44.75 million as of August 5, 2015, the cut-off date LTV ratio is 75.0%. The most recent prior financing of the Intellicenter Property was not included in a securitization.
THE INFORMATION IN THIS STRUCTURAL AND COLLATERAL TERM SHEET IS NOT COMPLETE AND MAY BE AMENDED PRIOR TO THE TIME OF SALE. THIS TERM SHEET IS NOT AN OFFER TO SELL THESE SECURITIES AND IT IS NOT A SOLICITATION OF AN OFFER TO BUY THESE SECURITIES IN ANY JURISDICTION WHERE THE OFFER OR SALE IS NOT PERMITTED.
| 76 |
12653 Telecom Drive | Collateral Asset Summary – Loan No. 7 Intellicenter | Cut-off Date Balance: Cut-off Date LTV: U/W NCF DSCR: U/W NOI Debt Yield: | $33,562,500 75.0% 1.44x 9.3% |
| Sources and Uses | ||||||
| Sources | Proceeds | % of Total | Uses | Proceeds | % of Total | |
| Mortgage Loan | $33,562,500 | 72.8% | Purchase Price | $44,600,000 | 96.8% | |
| Sponsor Equity | $12,512,969 | 27.2% | Reserves | $883,392 | 1.9% | |
| Closing Costs | $592,077 | 1.3% | ||||
| Total Sources | $46,075,469 | 100.0% | Total Uses | $46,075,469 | 100.0% | |
The Borrower / Sponsor. The borrower is CIO Intellicenter, Limited Partnership, a single purpose Delaware limited partnership structured to be bankruptcy-remote, with one independent director in its organizational structure. The sponsor of the borrower and the non-recourse carve-out guarantor is City Office REIT Operating Partnership, L.P.
City Office REIT Operating Partnership, L.P. is a subsidiary of City Office REIT, Inc. (“CIO”). CIO, which was formed in 2013, is a Maryland corporation focused on acquiring, owning and operating high-quality Class A and B office properties located primarily within 12 target markets in the southern and western United States. As of June 20, 2015, CIO owned 12 office complexes comprising 25 buildings, representing 2.7 million square feet. Chief Executive Officer and Director of CIO, James Farrar, has over 15 years of experience in the private equity, real estate and corporate finance industries. Since 2009, he has been involved in over $1 billion of real estate acquisitions across the United States.
The Property.The Intellicenter Property is a four-story, suburban office building totaling 203,509 sq. ft.,located in Tampa, Florida. The Intellicenter Property was constructed in 2008, features a LEED Silver Core & Shell certification and has high quality interior finishes. There are 1,155 available surface parking spaces at the Intellicenter Property which equates to a parking ratio of approximately 5.68 spaces per 1,000 sq. ft. The Intellicenter Property is located within the 199-acre Tampa Telecom Park, one of the Tampa Bay area’s largest business parks containing approximately two million square feet within 33 buildings. Tampa Telecom Park, a master planned mixed-use business park located along the Hillsborough River, features office, medical office, retail, service center and light industrial uses, as well as a variety of restaurants, hotels and a full service child care facility.
As of July 1, 2015, the Intellicenter Property is 100.0% leased to four tenants. Approximately 88.6% of the net rentable area is occupied by investment grade tenants.
Environmental Matters. The Phase I environmental report dated July 16, 2015 recommended no further action at the Intellicenter Property.
Major Tenants.
H. Lee Moffitt Cancer Center(“Moffitt”)(154,963 sq. ft., 76.1% of NRA, 76.8% of U/W Base Rent; rated A3/A- by Moody’s/S&P) Moffitt is a nonprofit cancer treatment and research center located in Tampa, Florida on the University of South Florida Campus, approximately four miles from the Intellicenter Property. Moffitt opened in 1986 and has been ranked as one of the nation’s top cancer hospitals since 1999. It is one of 41 National Cancer Institute-designated Comprehensive Cancer Centers in the United States and the only one located in Florida. Moffitt combines compassionate clinical practice, focused, innovative research and education to further their mission goal of preventing and curing cancer. As of December 31, 2014, Moffitt employed approximately 4,556 people and its capital expenditures, operations and employment were estimated to generate a $1.7 billion economic impact in the state of Florida. Net patient revenues have grown over the past five years by 36.3% from approximately $556.8 million in 2010 to $758.7 million in 2014.
Moffitt’s lease expires March 31, 2027 and has two, ten-year extension options. Renewal rent will be at fair market value. Moffitt does not have any termination options. The Intellicenter Property serves as Moffitt’s business and administrative headquarters after consolidating those functions from around the Tampa region.
Morgan Stanley(25,294 sq. ft., 12.4% of NRA, 12.7% of U/W Base Rent; rated A3/A-/A by Moody’s/S&P/Fitch) Morgan Stanley is a financial holding company that provides various financial products and services to corporations, governments, financial institutions and individuals worldwide. Morgan Stanley’s business segments includes Institutional Securities, which offers financial advisory services on mergers and acquisitions and capital-raising services; Wealth Management, which provides comprehensive financial services to high net worth individuals and small to medium sized businesses; and Investment Management, which provides traditional asset management, alternative investments, merchant banking and real estate investing services. As of year-end 2014 Morgan Stanley had 55,802 employees worldwide and reported net revenue of approximately $34.3 billion.
Morgan Stanley’s lease expires March 31, 2024 and has one, seven-year extension option. Renewal rent will be at fair market value. Morgan Stanley has one termination option effective March 31, 2019 with at least 12 months’ notice and payment of a termination fee of $855,214 ($33.81 PSF). Morgan Stanley reportedly invested $6.6 million ($261 PSF) into their space at the Intellicenter Property.
THE INFORMATION IN THIS STRUCTURAL AND COLLATERAL TERM SHEET IS NOT COMPLETE AND MAY BE AMENDED PRIOR TO THE TIME OF SALE. THIS TERM SHEET IS NOT AN OFFER TO SELL THESE SECURITIES AND IT IS NOT A SOLICITATION OF AN OFFER TO BUY THESE SECURITIES IN ANY JURISDICTION WHERE THE OFFER OR SALE IS NOT PERMITTED.
| 77 |
12653 Telecom Drive | Collateral Asset Summary – Loan No. 7 Intellicenter | Cut-off Date Balance: Cut-off Date LTV: U/W NCF DSCR: U/W NOI Debt Yield: | $33,562,500 75.0% 1.44x 9.3% |
The Market. The Intellicenter Property is located in the I-75 Corridor market within the Tampa-St. Petersburg-Clearwater, FL metropolitan statistical area (“MSA”) and is part of the Northeast Tampa office submarket. Primary access to the Intellicenter Property’s neighborhood is provided by Interstate 75 located approximately 1.5 miles to the east. Interstate 75 is the major north/south arterial through the central and western Florida. Interstate 4 is located approximately six miles to the south, provides access to the Tampa CBD and continues to Interstate 275 linking Tampa to St. Petersburg across Old Tampa Bay. The Intellicenter Property is located approximately four miles from the Moffitt Cancer Center on the University of South Florida campus, approximately 17 miles from the Tampa CBD and approximately 23 miles from the Tampa International Airport.
The Northeast Tampa submarket is located within the I-75 Corridor market, the third largest market by leasable area in the Tampa/St. Petersburg/Clearwater, FL MSA. The submarket is bounded roughly by Interstate 4 to the south, State Highway 41 to the west and the Hillsborough County lines to the north and east. The I-75 Corridor market consists of 1,264 buildings providing approximately 19.3 million sq. ft. of commercial office space. The vacancy rate in the I-75 Corridor market was 13.1% at the end of Q2 2015, down 1.5% from the 13.3% vacancy rate in Q2 2014. Asking rents were $19.05 PSF at the end of Q2 2015, up 2.2% from $18.64 PSF in Q2 2014. Class A vacancy in the I-75 Corridor market was 10.8% with asking rent of $22.35 PSF as of Q2 2015.Class A vacancy in the Northeast Tampa submarket was 15.3% with asking rent of $22.90 PSF as of Q2 2015. There are no new projects under construction in the submarket.
| Summary of Comparable Office Rentals(1) | ||||
| Name | Intellicenter Property | Highland Oaks IV | Highland Oaks V | 8800 Hidden River |
| Distance from subject (miles) | NAP | 8.6 | 8.9 | 1.8 |
| Building Sq. Ft. | 203,509 | 128,376 | 98,472 | 135,000 |
| Year Built | 2008 | 2008 | 2007 | 1992 |
| Occupancy | 100.0% | 98.0% | 98.0% | 100.0% |
| Rent PSF | $23.68 | $24.70 | $22.75 | $20.00 |
| Expense Basis | Modified Gross | FS | FS | FS |
| (1) | Source: Appraisal. |
Cash Flow Analysis.
| Cash Flow Analysis | |||||
| 2013 | 2014 | T-12 6/30/2015 | U/W | U/W PSF | |
| Base Rent(1)(2) | $1,408,694 | $3,396,696 | $3,991,312 | $4,421,483 | $21.73 |
| Value of Vacant Space | 0 | 0 | 0 | 396,909 | 1.95 |
| Gross Potential Rent | $1,408,694 | $3,396,696 | $3,991,312 | $4,818,392 | $23.68 |
| Total Recoveries | 3,950 | 435,517 | 388,334 | 591,463 | 2.91 |
| Total Other Income | 14,394 | 8,753 | 7,760 | 6,000 | 0.03 |
| Less: Vacancy & Credit Loss(3) | 0 | 0 | 0 | (396,909) | (1.95) |
| Effective Gross Income | $1,427,038 | $3,840,966 | $4,387,406 | $5,018,946 | $24.66 |
| Total Operating Expenses | 1,155,844 | 1,500,125 | 1,511,286 | 1,908,604 | 9.38 |
| Net Operating Income | $271,194 | $2,340,841 | $2,876,120 | $3,110,342 | $15.28 |
| TI/LC(4) | 3,823,057 | 831,549 | 433,686 | 69,497 | 0.34 |
| Capital Expenditures | 627,107 | 41,257 | 184,964 | 40,704 | 0.20 |
| Net Cash Flow | $(4,178,970) | $1,468,035 | $2,257,470 | $3,000,142 | $14.74 |
| (1) | U/W Base Rent includes $374,494 in step rent averaged over the loan term for Moffitt and $14,923 in base rent steps for Morgan Stanley through April 2016. In-place base rent is $4,053,074 ($19.92 PSF) which results in an underwritten NCF DSCR of 1.27x. |
| (2) | The increase in base rent from the 2013 to T-12 6/30/2015 period was due to increasing occupancy at the Intellicenter Property. |
| (3) | U/W Vacancy represents 7.3% of gross income. The physical occupancy as of July 1, 2015 is 100.0%. |
| (4) | In lieu of normalized monthly TI/LC reserve collections of $0.34 PSF per annum, the borrower accelerated collections into the TI/LC reserve account by depositing $250,000 at closing along with ongoing monthly collection of $16,959 ($1.00 PSF per annum) until the TI/LC reserve cap of $525,000 is reached. Using TI/LC collections of $1.00 PSF, the loan underwrites to a NCF DSCR of 1.38x. |
Property Management. The Intellicenter Property is managed by Cassidy Turley Commercial Real Estate Services, Inc., d/b/a Cushman and Wakefield.
THE INFORMATION IN THIS STRUCTURAL AND COLLATERAL TERM SHEET IS NOT COMPLETE AND MAY BE AMENDED PRIOR TO THE TIME OF SALE. THIS TERM SHEET IS NOT AN OFFER TO SELL THESE SECURITIES AND IT IS NOT A SOLICITATION OF AN OFFER TO BUY THESE SECURITIES IN ANY JURISDICTION WHERE THE OFFER OR SALE IS NOT PERMITTED.
| 78 |
12653 Telecom Drive | Collateral Asset Summary – Loan No. 7 Intellicenter | Cut-off Date Balance: Cut-off Date LTV: U/W NCF DSCR: U/W NOI Debt Yield: | $33,562,500 75.0% 1.44x 9.3% |
Lockbox / Cash Management. The Intellicenter Loan is structured with a soft lockbox and springing cash management. The borrower and property manager are required to deposit all rents and other revenue into a clearing account within two business days of receipt. All funds in the clearing account are swept daily into the borrower’s operating account unless a Cash Sweep Event (as defined herein) is continuing, in which event funds will be swept on a daily basis into the cash management account and disbursed in accordance with the loan documents.
A “Cash Sweep Event” will commence upon (i) the occurrence of an event of default, (ii) bankruptcy, insolvency, or similar action of the borrower or the property manager, (iii) if the debt service coverage ratio falls below 1.20x on a trailing three-month basis or (iv) the date that Moffitt or its successors ceases operations, vacates, or abandons the Intellicenter Property (or gives notice), or files for bankruptcy, insolvency or similar action of such tenant (“Moffitt Cash Sweep Event”).
Initial Reserves. At loan closing, the borrower deposited (i) $630,000 into a tax reserve account, (ii) $250,000 into a TI/LC reserve account and (iii) $3,392 into a replacement reserve account.
Ongoing Reserves. On a monthly basis, the borrower is required to deposit reserves of (i) 1/12 of the estimated annual real estate taxes, which currently equates to $52,500, into a reserve account, (ii) 1/12 of the annual insurance premium will be required to be deposited into an insurance reserve account if an acceptable blanket insurance policy is no longer in place, (iii) $3,392 into a replacement reserve account and (iv) $16,959 into a TI/LC reserve account, subject to a TI/LC reserve cap equal to $525,000. In lieu of ongoing monthly TI/LC reserve deposits, the borrower may post a letter of credit in an amount equal to the difference between the TI/LC reserve cap and the then current balance in the TI/LC reserve. In addition, upon a Moffitt Cash Sweep Event, all excess cash flow will be deposited in the major tenant rollover reserve to fund tenant improvements and leasing commissions for the Moffitt premises. Furthermore, the borrower will be required to deposit within one business day of receipt any fees or payments received in connection with the rejection, buy-out, termination, surrender or cancellation of the Morgan Stanley lease into the Morgan Stanley reserve account.
Current Mezzanine or Subordinate Indebtedness. None.
Future Mezzanine or Subordinate Indebtedness Permitted. None.
THE INFORMATION IN THIS STRUCTURAL AND COLLATERAL TERM SHEET IS NOT COMPLETE AND MAY BE AMENDED PRIOR TO THE TIME OF SALE. THIS TERM SHEET IS NOT AN OFFER TO SELL THESE SECURITIES AND IT IS NOT A SOLICITATION OF AN OFFER TO BUY THESE SECURITIES IN ANY JURISDICTION WHERE THE OFFER OR SALE IS NOT PERMITTED.
| 79 |
12653 Telecom Drive | Collateral Asset Summary – Loan No. 7 Intellicenter | Cut-off Date Balance: Cut-off Date LTV: U/W NCF DSCR: U/W NOI Debt Yield: | $33,562,500 75.0% 1.44x 9.3% |
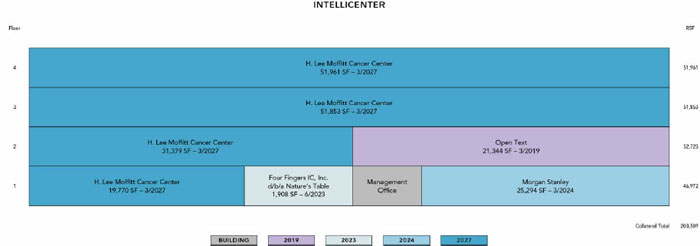
THE INFORMATION IN THIS STRUCTURAL AND COLLATERAL TERM SHEET IS NOT COMPLETE AND MAY BE AMENDED PRIOR TO THE TIME OF SALE. THIS TERM SHEET IS NOT AN OFFER TO SELL THESE SECURITIES AND IT IS NOT A SOLICITATION OF AN OFFER TO BUY THESE SECURITIES IN ANY JURISDICTION WHERE THE OFFER OR SALE IS NOT PERMITTED.
| 80 |
12653 Telecom Drive | Collateral Asset Summary – Loan No. 7 Intellicenter | Cut-off Date Balance: Cut-off Date LTV: U/W NCF DSCR: U/W NOI Debt Yield: | $33,562,500 75.0% 1.44x 9.3% |
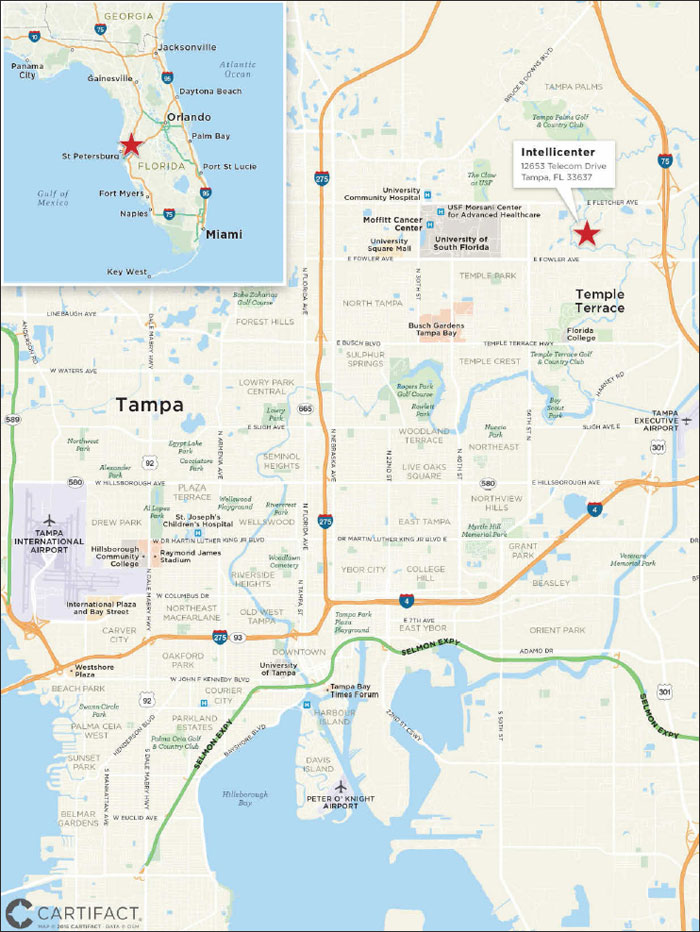
THE INFORMATION IN THIS STRUCTURAL AND COLLATERAL TERM SHEET IS NOT COMPLETE AND MAY BE AMENDED PRIOR TO THE TIME OF SALE. THIS TERM SHEET IS NOT AN OFFER TO SELL THESE SECURITIES AND IT IS NOT A SOLICITATION OF AN OFFER TO BUY THESE SECURITIES IN ANY JURISDICTION WHERE THE OFFER OR SALE IS NOT PERMITTED.
| 81 |
729 Southwest 15th Avenue Portland, OR 97205 | Collateral Asset Summary – Loan No. 8 Hotel deLuxe | Cut-off Date Balance: Cut-off Date LTV: U/W NCF DSCR: U/W NOI Debt Yield: | $32,419,793 68.7% 1.85x 12.8% |

THE INFORMATION IN THIS STRUCTURAL AND COLLATERAL TERM SHEET IS NOT COMPLETE AND MAY BE AMENDED PRIOR TO THE TIME OF SALE. THIS TERM SHEET IS NOT AN OFFER TO SELL THESE SECURITIES AND IT IS NOT A SOLICITATION OF AN OFFER TO BUY THESE SECURITIES IN ANY JURISDICTION WHERE THE OFFER OR SALE IS NOT PERMITTED.
| 82 |
729 Southwest 15th Avenue Portland, OR 97205 | Collateral Asset Summary – Loan No. 8 Hotel deLuxe | Cut-off Date Balance: Cut-off Date LTV: U/W NCF DSCR: U/W NOI Debt Yield: | $32,419,793 68.7% 1.85x 12.8% |
| Mortgage Loan Information | |
| Loan Seller: | BNYM |
| Loan Purpose: | Refinance |
| Sponsor(1): | Gordon D. Sondland |
| Borrower: | Aspen Mallory Holdings, LLC |
| Original Balance: | $32,500,000 |
| Cut-off Date Balance: | $32,419,793 |
| % by Initial UPB: | 3.5% |
| Interest Rate: | 4.5900% |
| Payment Date: | 6th of each month |
| First Payment Date: | September 6, 2015 |
| Maturity Date: | August 6, 2025 |
| Amortization: | 360 months |
| Additional Debt: | None |
| Call Protection: | L(26), D(89), O(5) |
| Lockbox / Cash Management: | Hard / Springing |
| Reserves(2) | ||||
| Initial | Monthly | |||
| Taxes: | $102,978 | $5,598 | ||
| Insurance: | $0 | Springing | ||
| FF&E: | $0 | 4.0% of prior month’s gross revenues | ||
| Financial Information | ||||
| Cut-off Date Balance / Room: | $249,383 | |||
| Balloon Balance / Room: | $202,773 | |||
| Cut-off Date LTV: | 68.7% | |||
| Balloon LTV: | 55.8% | |||
| Underwritten NOI DSCR: | 2.08x | |||
| Underwritten NCF DSCR: | 1.85x | |||
| Underwritten NOI Debt Yield: | 12.8% | |||
| Underwritten NCF Debt Yield: | 11.4% | |||
| Underwritten NOI Debt Yield at Balloon: | 15.8% | |||
| Underwritten NCF Debt Yield at Balloon: | 14.0% | |||
| Property Information | |
| Single Asset / Portfolio: | Single Asset |
| Property Type: | Full Service Hospitality |
| Collateral: | Fee Simple |
| Location: | Portland, OR |
| Year Built / Renovated: | 1912 / 2006 |
| Total Rooms: | 130 |
| Property Management: | Aspen Lodging Group, LLC |
| Underwritten NOI: | $4,152,863 |
| Underwritten NCF: | $3,701,794 |
| Appraised Value: | $47,200,000 |
| Appraisal Date: | April 10, 2015 |
| Historical NOI | |
| Most Recent NOI: | $4,159,812 (T-12 June 30, 2015) |
| 2014 NOI: | $3,611,828 (December 31, 2014) |
| 2013 NOI: | $3,083,637 (December 31, 2013) |
| 2012 NOI: | $2,593,684 (December 31, 2012) |
| Historical Occupancy | |
| Most Recent Occupancy: | 80.5% (June 30, 2015) |
| 2014 Occupancy: | 78.1% (December 31, 2014) |
| 2013 Occupancy: | 79.2% (December 31, 2013) |
| 2012 Occupancy: | 75.6% (December 31, 2012) |
| (1) | The sponsor is also the sponsor of the mortgage loan identified on Annex A-1 to the Free Writing Prospectus as Hotel Preston, which has a Cut-off Date Balance of $10,224,755. |
| (2) | See “Initial Reserves” and “Ongoing Reserves” herein. |
THE INFORMATION IN THIS STRUCTURAL AND COLLATERAL TERM SHEET IS NOT COMPLETE AND MAY BE AMENDED PRIOR TO THE TIME OF SALE. THIS TERM SHEET IS NOT AN OFFER TO SELL THESE SECURITIES AND IT IS NOT A SOLICITATION OF AN OFFER TO BUY THESE SECURITIES IN ANY JURISDICTION WHERE THE OFFER OR SALE IS NOT PERMITTED.
| 83 |
729 Southwest 15th Avenue Portland, OR 97205 | Collateral Asset Summary – Loan No. 8 Hotel deLuxe | Cut-off Date Balance: Cut-off Date LTV: U/W NCF DSCR: U/W NOI Debt Yield: | $32,419,793 68.7% 1.85x 12.8% |
The Loan. The Hotel deLuxe loan (the “Hotel deLuxe Loan”) is a $32.5 million fixed rate loan secured by the borrower’s fee simple interest in a 130-room full service boutique hotel located at 729 Southwest 15th Avenue in Portland, Oregon (the “Hotel deLuxe Property”). The Hotel deLuxe Loan has a 10-year term and amortizes on a 30-year schedule. The Hotel deLuxe Loan accrues interest at a fixed rate equal to 4.5900%. Loan proceeds were used to retire existing debt of $24.5 million, pay closing costs of approximately $0.3 million, fund reserves of approximately $0.1 million and return approximately $7.6 million in equity to the borrower. Based on the appraised value of $47.2 million as of April 10, 2015, the cut-off date LTV is 68.7%. The most recent prior financing of the Hotel deLuxe Property was included in the CD 2007-CD5 securitization.
| Sources and Uses | ||||||
| Sources | Proceeds | % of Total | Uses | Proceeds | % of Total | |
| Mortgage Loan | $32,500,000 | 100.0% | Loan Payoff | $24,520,808 | 75.4% | |
Closing Costs | $281,482 | 0.9% | ||||
| Reserves | $102,978 | 0.3% | ||||
| Return of Equity | $7,594,732 | 23.4% | ||||
| Total Sources | $32,500,000 | 100.0% | Total Uses | $32,500,000 | 100.0% | |
The Borrower / Sponsor. The borrower, Aspen Mallory Holdings, LLC, is a single purpose Delaware limited liability company structured to be bankruptcy-remote, with two independent directors in the organizational structure. The sponsor of the borrower and nonrecourse carve-out guarantor is Gordon D. Sondland.
Gordon D. Sondland is a principal of The Aspen Companies (“Aspen”) and the founder and CEO of Provenance Hotels (“Provenance”). Aspen owns, develops and manages a diversified portfolio of income properties including hotels, retail centers, office buildings and residential properties. Founded in 1985, Provenance serves as Aspen’s boutique hotel brand. In 2001, Provenance launched a management company that today operates six independent boutique hotels with two additional properties currently undergoing construction and rebranding. Provenance manages six additional hotels, including The Westin Portland. Provenance is also an approved manager for Starwood and Marriott. Including the Hotel DeLuxe Property, Provenance owns, or retains an equity interest in, thirteen hotels, totaling 2,236 rooms, all of which are located in Oregon, Washington and Tennessee.
The sponsor has advised the lender that it intends to effect a restructuring of its ownership interests in its real estate portfolio into a consolidated holding company controlled by the sponsor (“Holdco”), as permitted by the loan documents. In such event, the borrower will be permitted to replace the sponsor as nonrecourse carve-out guarantor with Holdco, subject to satisfaction of various conditions, including that Holdco meets specified minimum net worth and liquidity requirements.
The Property.The Hotel deLuxe Property is an eight-story, 130-room, full service luxury boutique hotel located in Portland, Oregon. The Hotel deLuxe Property includes 1,772 sq. ft. of banquet and meeting space and a 5,700 sq. ft. rooftop event space in the adjacent parking structure that is part of the Hotel deLuxe Property. The Hotel deLuxe Property was built in 1912 as the Mallory Hotel. After being acquired by the sponsor in 2006, the Hotel deLuxe Property underwent a $9.0 million renovation ($69,231 per room), and reopened in May 2006 as the Hotel deLuxe. In 2007, the Hotel deLuxe Property was added to the National Register of Historical Places. In addition to the $9.0 million renovation expenditures and rebranding in 2006, capital expenditures between 2010 and 2014 totaled $485,450 for guest room case goods and soft goods, computer/phone system upgrades, a fitness center, carpet replacement and upgrades to the parking structure.
The collateral for the Hotel deLuxe Loan includes a 205-space, four-story parking structure, completed in 1999, located across the street from the Hotel deLuxe Property at the corner of Southwest Yamhill Street and 15th Avenue. The parking structure offers monthly and long-term parking to local residents and employees (i.e. employees of the U.S. General Services Administration, the current tenant in the ground floor office space).
| Historical Occupancy, ADR, RevPar(1) | |||||||||
| Hotel deLuxe Property(2) | Competitive Set | Penetration Factor | |||||||
| Year | Occupancy | ADR | RevPAR | Occupancy | ADR | RevPAR | Occupancy | ADR | RevPAR |
| 2013 | 75.8% | $142.15 | $107.70 | 80.6% | $143.88 | $115.93 | 94.0% | 98.8% | 92.9% |
| 2014 | 78.0% | $155.56 | $121.36 | 78.9% | $160.65 | $126.75 | 98.9% | 96.8% | 95.7% |
| T–12 April 2015 | 79.9% | $180.23 | $143.99 | 82.5% | $184.23 | $151.96 | 96.9% | 97.8% | 94.8% |
| (1) | Source: Hospitality research report. |
| (2) | The minor variances between the underwriting, the hospitality research report and the above table with respect to Occupancy, ADR and RevPAR at the Hotel deLuxe Property are attributable to variances in reporting methodologies and/or timing differences. |
Environmental Matters. The Phase I environmental report dated April 14, 2015 recommended no further action at the Hotel deLuxe Property other than the implementation of an asbestos operations and maintenance plan due to the property’s age.
THE INFORMATION IN THIS STRUCTURAL AND COLLATERAL TERM SHEET IS NOT COMPLETE AND MAY BE AMENDED PRIOR TO THE TIME OF SALE. THIS TERM SHEET IS NOT AN OFFER TO SELL THESE SECURITIES AND IT IS NOT A SOLICITATION OF AN OFFER TO BUY THESE SECURITIES IN ANY JURISDICTION WHERE THE OFFER OR SALE IS NOT PERMITTED.
| 84 |
729 Southwest 15th Avenue Portland, OR 97205 | Collateral Asset Summary – Loan No. 8 Hotel deLuxe | Cut-off Date Balance: Cut-off Date LTV: U/W NCF DSCR: U/W NOI Debt Yield: | $32,419,793 68.7% 1.85x 12.8% |
The Market.The Hotel deLuxe Property is located on the western border of Portland’s central business district on Southwest 15th Avenue, two blocks west of Interstate 405, which loops around the west side of downtown Portland. West Burnside Street is two blocks north of the Hotel deLuxe Property, which is an east/west arterial that bisects the central business district. The Hotel deLuxe Property is one block north of the MAX light rail line which connects the central business district directly to the Oregon Convention Center, Memorial Coliseum, MODA Center and Portland International Airport (PDX). The street trolley stop is immediately south of the Hotel deLuxe Property. According to the appraisal, the Hotel deLuxe Property is the closest full service hotel to the Pearl District and Nob Hill, which are destination shopping neighborhoods. The Hotel deLuxe Property is also a few blocks away from another retail shopping core along southwest Broadway, which is downtown Portland’s primary north-south retail arterial.The full service hospitality Portland submarket had an estimated occupancy rate of 81.5% in 2014, which is expected to remain steady at about 80% into 2018, while ADR was an estimated $166.46 in 2014 and is expected to increase to $203.09 in 2018.
The Portland area attracts many leisure travelers due to numerous annual events and festivals, including the Rock and Roll Marathon in May and the Portland Marathon in October. According to the appraisal, leisure travelers make up 63.0% of the Hotel deLuxe Property’s room night demand, which is slightly less than the competitive set. Tax-free shopping, popular arts culture and a growing culinary scene are among the reasons leisure demand is anticipated to remain strong.
In downtown Portland, corporate demand is driven by business growth and increases in occupied office space, which is forecasted to slightly increase and improve as the economy continues to improve. According to the appraisal, commercial travelers and meeting and group travelers make up 21.0% and 16.0%, respectively, of the Hotel deLuxe Property’s room night demand. This segment is driven by social events, annual festivals, meetings from local and regional business and the Oregon Convention Center. Stable growth is forecasted for the meeting and group segment in Portland.
According to the appraisal, additional commercial demand generators include Nike, the largest lodging demand generator in downtown Portland, placing approximately 30,000 room nights in the market annually. NikeTown, Nike’s signature interactive retail venue, attracts millions of consumers every year. Intel is the largest private employer in downtown Portland. With an annual payroll of $1.5 billion, more than 90% of Intel’s 17,500 Oregon employees live in the Portland area. A $3.0 billion expansion project is anticipated to be completed by 2016. Providence Portland Medical Center, a part of Providence Health & Services, is the largest healthcare employer in the area with 15,239 employees. The Oregon Health and Sciences University (“OHSU”) is Oregon’s only health and research university. OHSU operates on a $1.4 billion dollar budget and is one of Portland’s largest employers, with 14,616 employees. Adidas, the second largest sports goods manufacturer in the world, has its North American headquarters located in Portland, Oregon.
The subsequent chart presents the primary competitive set to the Hotel deLuxe Property:
Primary Competitive Set (1) | ||||||
| Property | Rooms | Year Opened | Approximate Distance | 2014 Occupancy(2) | 2014 ADR(2) | 2014 RevPAR(2) |
| Hotel deLuxe Property | 130 | 1912 | NAP | 78.1% | $172.23 | $134.55 |
| Hotel Lucia | 127 | 1908 | 0.6 miles | 79.0% | $178.00 | $140.62 |
| Hotel Monaco Portland | 221 | 1996 | 0.6 miles | 92.0% | $206.00 | $189.52 |
| Hotel Vintage Plaza | 117 | 1991 | 0.6 miles | 87.0% | $194.00 | $168.78 |
| Sentinel Hotel | 100 | 1909 | 0.3 miles | 79.0% | $196.00 | $154.84 |
| Westin Portland | 205 | 1999 | 0.5 miles | 83.0% | $200.90 | $166.75 |
| Total / Wtd. Avg. | 900 | 84.0% | $193.94 | $162.94 | ||
| (1) | Source: Appraisal. |
| (2) | 2014 Occupancy, 2014 ADR and 2014 RevPAR represent estimates from the appraisal. The minor variances between the underwriting, the hospitality research report and the above table with respect to 2014 Occupancy, 2014 ADR and 2014 RevPAR at the Hotel deLuxe Property are attributable to variances in reporting methodologies and/or timing differences. |
The appraiser determined demand segmentation of 63% leisure, 21% commercial and 16% meeting and group for the Hotel deLuxe Property, compared to 43% leisure, 40% commercial and 17% meeting and group for the primary competitive set. The market demand mix is presented in the table below:
| Demand Segmentation(1) | ||||
| Property | Rooms | Leisure | Commercial | Meeting and Group |
| Hotel deLuxe Property | 130 | 63% | 21% | 16% |
| Hotel Lucia | 127 | 45% | 30% | 25% |
| Hotel Monaco Portland | 221 | 40% | 40% | 20% |
| Hotel Vintage Plaza | 117 | 45% | 40% | 15% |
| Sentinel Hotel | 100 | 38% | 40% | 22% |
| Westin Portland | 205 | 35% | 56% | 9% |
| Total / Wtd. Avg. | 900 | 43% | 39% | 17% |
| (1) | Source: Appraisal. |
THE INFORMATION IN THIS STRUCTURAL AND COLLATERAL TERM SHEET IS NOT COMPLETE AND MAY BE AMENDED PRIOR TO THE TIME OF SALE. THIS TERM SHEET IS NOT AN OFFER TO SELL THESE SECURITIES AND IT IS NOT A SOLICITATION OF AN OFFER TO BUY THESE SECURITIES IN ANY JURISDICTION WHERE THE OFFER OR SALE IS NOT PERMITTED.
| 85 |
729 Southwest 15th Avenue Portland, OR 97205 | Collateral Asset Summary – Loan No. 8 Hotel deLuxe | Cut-off Date Balance: Cut-off Date LTV: U/W NCF DSCR: U/W NOI Debt Yield: | $32,419,793 68.7% 1.85x 12.8% |
Cash Flow Analysis.
| Cash Flow Analysis | |||||||
| 2012 | 2013 | 2014 | T-12 6/30/2015 | U/W | U/W per Room | ||
| Occupancy | 75.6% | 79.2% | 78.1% | 80.5% | 80.5% | ||
| ADR | $140.73 | $150.36 | $172.28 | $183.60 | $183.60 | ||
| RevPAR | $106.39 | $119.09 | $134.55 | $147.82 | $147.82 | ||
| Room Revenue | $5,061,968 | $5,650,642 | $6,384,323 | $7,013,945 | $7,013,945 | $53,953 | |
| F&B Revenue | 2,521,767 | 2,663,593 | 2,657,609 | 2,851,986 | 2,851,986 | 21,938 | |
| Parking Income | 655,008 | 701,084 | 746,861 | 801,620 | 801,620 | 6,166 | |
| Other Revenue | 426,499 | 557,089 | 603,791 | 609,172 | 609,172 | 4,686 | |
| Total Revenue | $8,665,242 | $9,572,408 | $10,392,584 | $11,276,723 | $11,276,723 | $86,744 | |
| Operating Expenses | 3,730,750 | 3,988,216 | 4,165,299 | 4,337,815 | 4,337,815 | 33,368 | |
| Undistributed Expenses | 1,789,564 | 1,896,785 | 1,966,178 | 2,094,146 | 2,094,146 | 16,109 | |
| Gross Operating Profit | $3,144,928 | $3,687,407 | $4,261,107 | $4,844,762 | $4,844,762 | $37,267 | |
| Management Fee(1) | 346,584 | 383,305 | 415,682 | 444,120 | 451,069 | 3,470 | |
| Total Fixed Charges | 204,660 | 220,465 | 233,597 | 240,830 | 240,830 | 1,853 | |
| Net Operating Income | $2,593,684 | $3,083,637 | $3,611,828 | $4,159,812 | $4,152,863 | $31,945 | |
| FF&E(2) | 339,234 | 339,234 | 369,503 | 427,763 | 451,069 | 3,470 | |
| Net Cash Flow | $2,254,450 | $2,744,403 | $3,242,325 | $3,732,049 | $3,701,794 | $28,475 | |
| (1) | U/W Management Fee represents 4.0% of Total Revenue. |
| (2) | U/W FF&E represents 4.0% of Total Revenue. |
Property Management. The Hotel deLuxe Property is managed by Aspen Lodging Group, LLC, a borrower affiliate.
Lockbox / Cash Management. The Hotel deLuxe Loan is structured with a hard lockbox and springing cash management. The borrower is required to direct the credit card processing companies or tenants, as applicable, to deposit all credit card receipts and commercial rents directly into a lockbox account controlled by the lender. All non-credit card receipts are required to be deposited in the clearing account within two business days of receipt by the borrower or property manager. For so long as no Cash Flow Trigger Period (as defined below) exists, all funds in the lockbox will be swept daily to the borrower’s operating account. During a Cash Flow Trigger Period, amounts on deposit in the clearing account will be swept daily to a cash management account established and maintained by the lender, and applied to make required payments in accordance with the loan documents, with any excess funds (after payment of debt service, reserve payments and all other amounts due under the loan documents) held by the lender as additional cash collateral.
A “Cash Flow Trigger Period” will commence upon the occurrence of (i) an event of default or (ii) the debt service coverage ratio falling below 1.15x as of the end of any calendar quarter. A Cash Flow Trigger Period will cease to exist (a) with respect to clause (i) above, if such event of default has been cured or waived and (b) with respect to clause (ii) above, if the debt service coverage ratio exceeds 1.20x for two consecutive calendar quarters.
Initial Reserves.At loan closing, the borrower deposited $102,978 into a tax reserve account.
Ongoing Reserves.On a monthly basis, the borrower is required to deposit reserves of (i) 1/12 of the estimated annual real estate taxes, which currently equates to $5,598, into a tax reserve account and (ii) 4.0% of the prior month’s gross revenues into a FF&E reserve account. In addition, upon notice from the lender, theborrower will be required to deposit 1/12 of the annual insurance premiums into an insurance reserve account if (i) an event of default has occurred, (ii) an acceptable blanket insurance policy is no longer in place, (iii) the borrower fails to provide evidence of renewal of the blanket insurance policy or (iv) the borrower fails to provide evidence that the insurance premiums have been paid.
Property Release. None.
Current Mezzanine or Subordinate Indebtedness. None.
Future Mezzanine or Subordinate Indebtedness Permitted. None.
THE INFORMATION IN THIS STRUCTURAL AND COLLATERAL TERM SHEET IS NOT COMPLETE AND MAY BE AMENDED PRIOR TO THE TIME OF SALE. THIS TERM SHEET IS NOT AN OFFER TO SELL THESE SECURITIES AND IT IS NOT A SOLICITATION OF AN OFFER TO BUY THESE SECURITIES IN ANY JURISDICTION WHERE THE OFFER OR SALE IS NOT PERMITTED.
| 86 |
729 Southwest 15th Avenue Portland, OR 97205 | Collateral Asset Summary – Loan No. 8 Hotel deLuxe | Cut-off Date Balance: Cut-off Date LTV: U/W NCF DSCR: U/W NOI Debt Yield: | $32,419,793 68.7% 1.85x 12.8% |

THE INFORMATION IN THIS STRUCTURAL AND COLLATERAL TERM SHEET IS NOT COMPLETE AND MAY BE AMENDED PRIOR TO THE TIME OF SALE. THIS TERM SHEET IS NOT AN OFFER TO SELL THESE SECURITIES AND IT IS NOT A SOLICITATION OF AN OFFER TO BUY THESE SECURITIES IN ANY JURISDICTION WHERE THE OFFER OR SALE IS NOT PERMITTED.
| 87 |
2475, 2485 & 2495 Village View Drive Henderson, NV 89074 | Collateral Asset Summary – Loan No. 9 Green Valley Corporate Center | Cut-off Date Balance: Cut-off Date LTV: U/W NCF DSCR: U/W NOI Debt Yield: | $27,000,000 12.4% |
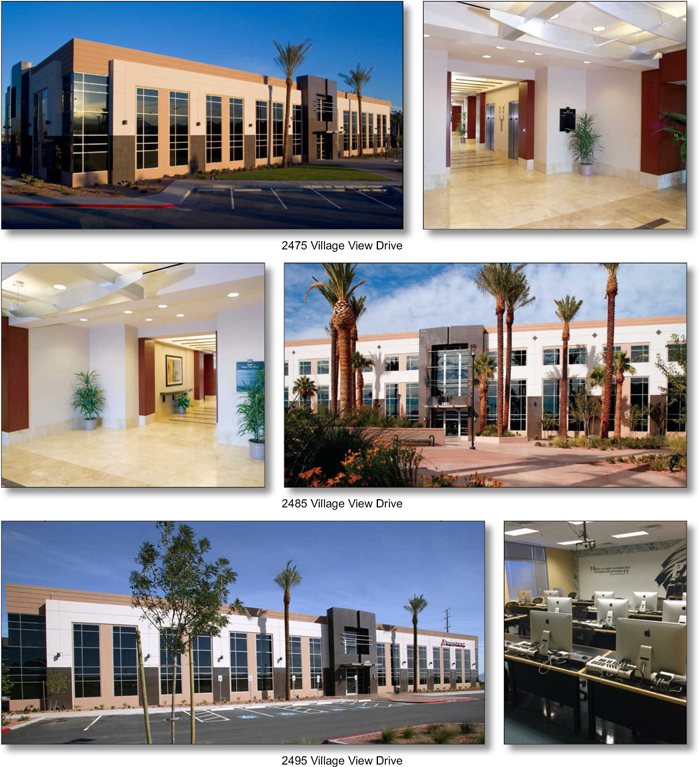
THE INFORMATION IN THIS STRUCTURAL AND COLLATERAL TERM SHEET IS NOT COMPLETE AND MAY BE AMENDED PRIOR TO THE TIME OF SALE. THIS TERM SHEET IS NOT AN OFFER TO SELL THESE SECURITIES AND IT IS NOT A SOLICITATION OF AN OFFER TO BUY THESE SECURITIES IN ANY JURISDICTION WHERE THE OFFER OR SALE IS NOT PERMITTED.
| 88 |
2475, 2485 & 2495 Village View Drive Henderson, NV 89074 | Collateral Asset Summary – Loan No. 9 Green Valley Corporate Center | Cut-off Date Balance: Cut-off Date LTV: U/W NCF DSCR: U/W NOI Debt Yield: | $27,000,000 12.4% |
| Mortgage Loan Information | |
| Loan Seller: | BNYM |
| Loan Purpose: | Refinance |
| Sponsor: | Brian Greenspun; Danny Greenspun; Susan Fine, Jane Gale |
| Borrower: | GVR Back Office 123, LLC |
| Original Balance: | $27,000,000 |
| Cut-off Date Balance: | $27,000,000 |
| % by Initial UPB: | 2.9% |
| Interest Rate: | 4.5900% |
| Payment Date: | 6th of each month |
| First Payment Date: | September 6, 2015 |
| Maturity Date: | August 6, 2025 |
| Amortization: | Interest only for first 24 months; 360 months thereafter |
| Additional Debt: | None |
| Call Protection: | L(26), D(90), O(4) |
| Lockbox / Cash Management: | Hard / In Place |
| Reserves | ||
| Initial | Monthly | |
| Taxes: | $11,771 | $12,515 |
| Insurance: | $0 | Springing |
| Replacement: | $3,000 | $3,393 |
| TI/LC: | $1,652,360 | $15,626 |
| Financial Information | |
| Cut-off Date Balance / Sq. Ft.: | $166 |
| Balloon Balance / Sq. Ft.: | $142 |
| Cut-off Date LTV: | 63.9% |
| Balloon LTV: | 54.7% |
| Underwritten NOI DSCR(1): | 2.02x |
| Underwritten NCF DSCR(1): | 1.96x |
| Underwritten NOI Debt Yield: | 12.4% |
| Underwritten NCF Debt Yield: | 12.0% |
| Underwritten NOI Debt Yield at Balloon: | 14.5% |
| Underwritten NCF Debt Yield at Balloon: | 14.1% |
| Property Information | ||
| Single Asset / Portfolio: | Single Asset | |
| Property Type: | Suburban Office | |
| Collateral: | Fee Simple | |
| Location: | Henderson, NV | |
| Year Built / Renovated: | 2004 / NAP | |
| Total Sq. Ft.: | 163,052 | |
| Property Management: | American Nevada Realty, LLC | |
| Underwritten NOI: | $3,351,001 | |
| Underwritten NCF: | $3,247,729 | |
| Appraised Value: | $42,280,000 | |
| Appraisal Date: | June 12, 2015 | |
| Historical NOI | ||
| Most Recent NOI: | $3,411,612 (T-12 May 31, 2015) | |
| 2014 NOI: | $3,423,618 (December 31, 2014) | |
| 2013 NOI: | $3,092,565 (December 31, 2013) | |
| 2012 NOI: | $3,583,269 (December 31, 2012) | |
| Historical Occupancy | ||
| Most Recent Occupancy: | 95.7% (July 21, 2015) | |
| 2014 Occupancy: | 91.6% (December 31, 2014) | |
| 2013 Occupancy: | 91.6% (December 31, 2013) | |
| 2012 Occupancy: | 85.9% (December 31, 2012) | |
| (1) | Based on amortizing debt service payments. Based on the current interest only payments, the Underwritten NOI DSCR and Underwritten NCF DSCR are 2.67x and 2.58x, respectively. |
THE INFORMATION IN THIS STRUCTURAL AND COLLATERAL TERM SHEET IS NOT COMPLETE AND MAY BE AMENDED PRIOR TO THE TIME OF SALE. THIS TERM SHEET IS NOT AN OFFER TO SELL THESE SECURITIES AND IT IS NOT A SOLICITATION OF AN OFFER TO BUY THESE SECURITIES IN ANY JURISDICTION WHERE THE OFFER OR SALE IS NOT PERMITTED.
| 89 |
2475, 2485 & 2495 Village View Drive Henderson, NV 89074 | Collateral Asset Summary – Loan No. 9 Green Valley Corporate Center | Cut-off Date Balance: Cut-off Date LTV: U/W NCF DSCR: U/W NOI Debt Yield: | $27,000,000 12.4% |
| Tenant Summary | |||||||
| Tenant | Ratings (Fitch/Moody’s/S&P) | Net Rentable Area (Sq. Ft.) |
% of Net Rentable Area | U/W Base Rent PSF | % of Total U/W Base Rent | Lease Expiration | |
| IADT(1) | NR/NR/NR | 49,902 | 30.6% | $27.90 | 33.4% | 4/30/2016 | |
| Cypress Capital, LLC | NR/NR/NR | 12,819 | 7.9% | $25.92 | 8.0% | 5/31/2018 | |
| Amica Mutual Insurance Company | NR/NR/NR | 12,451 | 7.6% | $23.40 | 7.0% | 12/31/2023 | |
| Toyota Financial Savings Bank | NR/NR/NR | 12,028 | 7.4% | $27.01 | 7.8% | 11/30/2015 | |
| PAR Springer-Miller Systems(2) | NR/NR/NR | 12,000 | 7.4% | $26.28 | 7.6% | 7/31/2020 | |
| CHM2 Hill, Inc | NR/NR/NR | 11,209 | 6.9% | $29.04 | 7.8% | 1/31/2016 | |
| Equity Title | NR/NR/NR | 10,351 | 6.3% | $25.96 | 6.4% | 7/31/2020 | |
| Total Major Tenants | 120,760 | 74.1% | $26.92 | 78.0% | |||
| Remaining Tenants | 35,232 | 21.6% | $26.09 | 22.0 % | |||
| Total Occupied Tenants | 155,992 | 95.7% | $26.73 | 100.0% | |||
| Vacant | 7,060 | 4.3% | |||||
| Total | 163,052 | 100% | |||||
| (1) | IADT has advised the sponsor that it will be vacating approximately 25,000 sq. ft. of their 49,602 sq. ft. space at the end of its lease on April 30, 2016 and has commenced discussions with the sponsor about a renewal lease for the balance of the square footage. |
| (2) | Par Springer-Miller Systems is in a free rent period through October 31, 2015. |
| Lease Rollover Schedule(1) | ||||||||
| Year | # of Leases Expiring | Total Expiring Sq. Ft. | % of Total Sq. Ft. Expiring | Cumulative Sq. Ft. Expiring | Cumulative % of Sq. Ft. Expiring | Annual U/W PSF | % U/W Rolling | Cumulative % of U/W Base Rent |
| MTM | 0 | 0 | 0.0% | 0 | 0.0% | $0.00 | 0.0% | 0.0% |
| 2015 | 2 | 15,302 | 9.4% | 15,302 | 9.4% | $27.57 | 10.1% | 10.1% |
| 2016 | 7 | 88,547 | 54.3% | 103,849 | 63.7% | $27.46 | 58.3% | 68.4% |
| 2017 | 0 | 0 | 0.0% | 103,849 | 63.7% | $0.00 | 0.0% | 68.4% |
| 2018 | 2 | 17,341 | 10.6% | 121,190 | 74.3% | $25.42 | 10.6% | 79.0% |
| 2019 | 0 | 0 | 0.0% | 121,190 | 74.3% | $0.00 | 0.0% | 79.0% |
| 2020 | 2 | 22,351 | 13.7% | 143,541 | 88.0% | $26.13 | 14.0% | 93.0% |
| 2021 | 0 | 0 | 0.0% | 143,541 | 88.0% | $0.00 | 0.0% | 93.0% |
| 2022 | 0 | 0 | 0.0% | 143,541 | 88.0% | $0.00 | 0.0% | 93.0% |
| 2023 | 1 | 12,451 | 7.6% | 155,992 | 95.7% | $23.40 | 7.0% | 100.0% |
| 2024 | 0 | 0 | 0.0% | 155,992 | 95.7% | $0.00 | 0.0% | 100.0% |
| 2025 | 0 | 0 | 0.0% | 155,992 | 95.7% | $0.00 | 0.0% | 100.0% |
| Thereafter | 0 | 0 | 0.0% | 155,992 | 95.7% | $0.00 | 0.0% | 100.0% |
| Vacant | NAP | 7,060 | 4.3% | 163,052 | 100.0% | NAP | NAP | |
| Total / Wtd. Avg. | 14 | 163,052 | 100.0% | $26.73 | 100.0% | |||
| (1) | Certain tenants have lease termination options that may become exercisable prior to the originally stated expiration date of the tenant lease that are not considered in the lease rollover schedule. |
THE INFORMATION IN THIS STRUCTURAL AND COLLATERAL TERM SHEET IS NOT COMPLETE AND MAY BE AMENDED PRIOR TO THE TIME OF SALE. THIS TERM SHEET IS NOT AN OFFER TO SELL THESE SECURITIES AND IT IS NOT A SOLICITATION OF AN OFFER TO BUY THESE SECURITIES IN ANY JURISDICTION WHERE THE OFFER OR SALE IS NOT PERMITTED.
| 90 |
2475, 2485 & 2495 Village View Drive Henderson, NV 89074 | Collateral Asset Summary – Loan No. 9 Green Valley Corporate Center | Cut-off Date Balance: Cut-off Date LTV: U/W NCF DSCR: U/W NOI Debt Yield: | $27,000,000 12.4% |
The Loan. The Green Valley Corporate Center loan (the “GVCC Loan”) is a $27.0 million fixed rate loan secured by the borrower’s fee simple interest in a three-building, 163,052 sq. ft. suburban office building center at 2475, 2485 and 2495 Village View Drive in Henderson, Nevada (the “GVCC Property”). The GVCC Loan has a 10-year term and subsequent to a 24-month interest only period, amortizes on a 30-year schedule thereafter. The GVCC Loan accrues interest at a fixed rate equal to 4.5900% and has a cut-off date balance of $27.0 million. Proceeds of the GVCC Loan were used to retire existing debt of approximately $26.9 million, pay closing costs of approximately $0.3 million, and fund reserves of approximately $1.7 million. Based on the appraised value of $42.28 million as of June 12, 2015, the cut-off date LTV is 63.9%. The most recent prior financing of the GVCC Property was included in the GSMS 2006-GG8 securitization.
| Sources and Uses | ||||||
| Sources | Proceeds | % of Total | Uses | Proceeds | % of Total | |
| Mortgage Loan | $27,000,000 | 93.6% | Loan Payoff | $26,898,801 | 93.2% | |
| Sponsor Equity | $1,855,731 | 6.4% | Reserves | $1,667,131 | 5.8% | |
| Closing Costs | $289,798 | 1.0% | ||||
| Total Sources | $28,855,731 | 100.0% | Total Uses | $28,855,731 | 100.0% | |
The Borrower / Sponsor. The borrower, GVR Back Office 123, LLC, is a single purpose Nevada limited liability company structured to be bankruptcy-remote, with two independent directors in its organizational structure. The sponsors of the borrower areBrian Greenspun, Danny Greenspun, Susan Fine and Jane Gale and the non-recourse carveout guarantor is American Nevada Holdings, LLC (“ANH”), which is controlled by the sponsors.
ANH is the developer of Green Valley in Henderson, Nevada, which is an 7,100-acre community with over 75,000 residents. ANH also developed the communities of Green Valley Ranch and Seven Hills and is the managing partner in the community of Aliante. ANH has over 60 years of combined industry experience and has developed over 3.0 million sq. ft. of commercial properties, including office, retail, industrial, mixed-use and apartment properties.
The Property.The GVCC Property consists of three office buildings totaling 163,052 sq. ft. on a 12.75 acre site. All three buildings were built in 2004 by the sponsor as part of the 90-acre, master planned business park known as the Green Valley Corporate Center. Two of the buildings (2475 and 2495) are two stories and the third (2485) is three stories. Downtown Henderson is approximately six miles east of the GVCC Property while downtown Las Vegas is approximately seven miles north of the GVCC Property. The property is located off of Village View Drive which intersects Green Valley Parkway to the east, a major north/south thoroughfare that provides access to the I-215 beltway north of the GVCC Property. Village View Drive also intersects Pase Verde Parkway to the south, which is a major east/west thoroughfare that runs parallel to the 215 Freeway to the north. I-215 is a 50.5 mile beltway route circling three-quarters of the Las Vegas Valley. The Green Valley Corporate Center is surrounded by single-family residential properties in addition to several other amenities. Adjacent to the business park is a large lifestyle center with national retailers and restaurants such as Pottery Barn, Loft, P.F. Chang’s and Whole Foods. Another neighborhood power retail center called the “Beltway Marketplace” is 1.5 miles west of the property. The Legacy Golf Club, a public golf course, is two miles north of the property. The University of Nevada, Las Vegas (“UNLV”) is approximately eight miles northwest of the property.
As of July 21, 2015, the GVCC Property was 95.7% occupied by 14 tenants representing the healthcare, financial, real estate, and education sectors. The three largest tenants at the GVCC Property occupy a total of 46.1% of the total NRA and account for 48.3% of underwritten base rent. The largest tenant, International Academy of Design and Technology (“IADT”), occupies 49,902 sq. ft., or 30.6% of total NRA, and accounts for 33.4% of underwritten base rent. IADT has advised the sponsor that it will be vacating approximately 25,000 sq. ft. of their 49,602 sq. ft. space at the end of its lease on April 30, 2016 and has commenced discussions with the sponsor about a renewal lease for the balance of the square footage. The second largest tenant, Cypress Capital, LLC, occupies 12,819 sq. ft. or 7.9% of total NRA, and accounts for 8.0% of underwritten base rent. The third largest tenant, Amica Mutual Insurance Company, occupies 12,451 sq. ft. or 7.6% of total NRA, and accounts for 7.0% of underwritten base rent.
Environmental Matters. The Phase I environmental report dated June 15, 2015 recommended no further action at the GVCC Property.
| Recent Leasing Activity(1) | ||||||
| Tenant | New / Renewal / Relocation / Expansion | Net Rentable Area | Lease/Renewal Start Date | Term (years) | Base Rent PSF | Annual Rent |
| Equity Title | New | 10,351 | 5/15/2015 | 5.2 | $25.96 | $268,712 |
| All Western Mortgage, INC. | New | 4,743 | 7/3/2013 | 3.4 | $22.87 | $108,453 |
| Total | 15,094 | $377,165 | ||||
| (1) | Based on the rent roll dated July 21, 2015. |
THE INFORMATION IN THIS STRUCTURAL AND COLLATERAL TERM SHEET IS NOT COMPLETE AND MAY BE AMENDED PRIOR TO THE TIME OF SALE. THIS TERM SHEET IS NOT AN OFFER TO SELL THESE SECURITIES AND IT IS NOT A SOLICITATION OF AN OFFER TO BUY THESE SECURITIES IN ANY JURISDICTION WHERE THE OFFER OR SALE IS NOT PERMITTED.
| 91 |
2475, 2485 & 2495 Village View Drive Henderson, NV 89074 | Collateral Asset Summary – Loan No. 9 Green Valley Corporate Center | Cut-off Date Balance: Cut-off Date LTV: U/W NCF DSCR: U/W NOI Debt Yield: | $27,000,000 12.4% |
Major Tenants.
IADT, (49,902 sq. ft., 30.6% of NRA; 33.4% of U/W Base Rent)IADT is a for-profit college, which merged with Sanford-Brown in March 2014, resulting in locations in 16 U.S. cities, including Chicago, Henderson, Orlando, Seattle, San Antonio and Tampa. Sanford-Brown is accredited by the Accredited Council for Independent Colleges and Schools to award associates degrees and bachelor degrees. IADT has advised the Sponsor that they will be vacating approximately 25,000 sq. ft. of its 49,902 sq. ft. space at the end of its lease on April 30, 2016 and has commenced discussions with the Sponsor about a renewal lease for the balance of the square footage.
Cypress Capital, LLC (12,819 sq. ft., 7.9% of NRA; 8.0% of U/W Base Rent) Cypress Capital isan investment services and personal financing firm.
Amica Mutual Insurance Company, (12,451 sq. ft.; 7.6% of NRA; 7.0% of U/W Base Rent)Amica is the oldest mutual insurer of automobiles in the U.S., with over 100 years of experience. Amica also offers home, marine, personal umbrella liability and life insurance products.
The Market.The GVCC Property is located in the Southeast submarket within the Las Vegas market and considered a Class B property. As of Q1 2015, the Las Vegas market has 956 Class B office buildings, while the Southeast submarket contains 226. According to the appraisal, there are five projects totaling 591,151 sq. ft. currently under construction in the Las Vegas office market, however, only 149,129 sq. ft. of Class B space is located in the Central East and Southwest submarkets. There is currently no new construction for office buildings in the Southeast submarket. The Southeast submarket has an overall occupancy of 81.7% for Class B office buildings, up by 4% from 77.7% in Q1 2014. The asking rent for Class B properties in the Southeast increased by 4.0% from $1.75 PSF as of Q1 2014 to $1.82 as of Q1 2015. Office related employment represents 19.0% of the workforce. The Las Vegas unemployment rate as of February 2015 was 7.2%. Over the last 12 months, Las Vegas added about 27,650 new jobs or a 3.2% increase. The appraiser notes that with a high correlation between office market fundamentals and employment growth, the office market should continue to sustain positive growth in the near future as unemployment decreases.
Historical and Current Occupancy.
| Historical and Current Occupancy(1) | ||||||||||
| 2005 | 2006 | 2007 | 2008 | 2009 | 2010 | 2011 | 2012 | 2013 | 2014 | Most Recent(2) |
| NAP | 93.7% | 82.8% | 69.2% | 70.7% | 86.3% | 92.2% | 86.1% | 89.3% | 91.6% | 95.7% |
| (1) | Source: Borrower. |
| (2) | Based on the rent roll dated July 21, 2015. |
The appraisal analyzed a set of six comparable properties within the immediate competitive area of the GVCC Property. The chart below summarizes the competitive set as determined by the appraisal.
| Competitive Set(1) | |||||
| Building | Location | Year Built | Total GLA | Occupancy | Parking/1,000 SF |
| GVCC Property | 2475, 2485 & 2495 Village View Drive, Henderson, NV | 2004 | 163,052(2) | 95.7%(2) | 5.2 |
| Corporate Center I | 901 North Green Valley Parkway, Henderson, NV | 1995 | 46,737 | 91% | NAV |
| Green Valley Corporate Center | 2290 Corporate Circle, Henderson, NV | 1998 | 54,192 | 100% | 7.0 |
| Green Valley Corporate Center | 2230-2260 Corporate Circle, Henderson, NV | 1997 | 112,267 | 82% | NAV |
| Green Valley Corporate Center | 2275 Corporate Circle, Henderson, NV | 2000 | 66,800 | 93% | NAV |
| Green Valley Corporate Center 2285 | 2285 Corporate Circle, Henderson, NV | 2002 | 44,108 | 92% | NAV |
| Commerce on The Green | 2200 Paseo Verde Parkway, Henderson, NV | 2004 | 59,818 | 78% | NAV |
| (1) | Source: Appraisal. |
| (2) | Based on the rent roll dated July 21, 2015. |
THE INFORMATION IN THIS STRUCTURAL AND COLLATERAL TERM SHEET IS NOT COMPLETE AND MAY BE AMENDED PRIOR TO THE TIME OF SALE. THIS TERM SHEET IS NOT AN OFFER TO SELL THESE SECURITIES AND IT IS NOT A SOLICITATION OF AN OFFER TO BUY THESE SECURITIES IN ANY JURISDICTION WHERE THE OFFER OR SALE IS NOT PERMITTED.
| 92 |
2475, 2485 & 2495 Village View Drive Henderson, NV 89074 | Collateral Asset Summary – Loan No. 9 Green Valley Corporate Center | Cut-off Date Balance: Cut-off Date LTV: U/W NCF DSCR: U/W NOI Debt Yield: | $27,000,000 12.4% |
Cash Flow Analysis.
| Cash Flow Analysis | |||||
| 2013 | 2014 | T-12 5/31/2015 | U/W | U/W PSF | |
| Base Rent | $3,766,248 | $4,031,445 | $4,013,649 | $4,132,906 | $25.35 |
| Base Rent Steps | 0 | 0 | 0 | 36,518 | 0.22 |
| Vacant Gross Up(1) | 0 | 0 | 0 | 186,384 | 1.14 |
| Gross Potential Rent | $3,766,248 | $4,031,445 | $4,013,649 | $4,355,808 | $26.71 |
| Total Recoveries | 14,228 | 60,984 | 49,467 | 49,467 | 0.30 |
| Total Other Income | 43,332 | 101,875 | 102,952 | 50,000 | 0.31 |
| Less: Vacancy | 0 | 0 | 0 | (353,784) | (2.17) |
| Effective Gross Income | $3,823,808 | $4,194,304 | $4,166,068 | $4,101,491 | $25.15 |
| Total Operating Expenses | 731,243 | 770,686 | 754,456 | 750,489 | 4.60 |
| Net Operating Income | $3,092,565 | $3,423,618 | $3,411,612 | $3,351,001 | $20.55 |
| TI/LC | 0 | 0 | 0 | 187,510 | 1.15 |
| Capital Expenditures | 0 | 0 | 0 | 40,763 | 0.25 |
| Amortizing TI | 0 | 0 | 0 | (125,000) | (0.77) |
| Net Cash Flow | $3,092,565 | $3,423,618 | $3,411,612 | $3,247,729 | $19.92 |
| (1) | UW Vacancy Gross Up includes IADT at its current rent. |
Property Management. The GVCC Property is managed by American Nevada Realty, LLC, an affiliate of the borrower.
Lockbox / Cash Management. The GVCC Loan is structured with a hard lockbox and in place cash management. The borrower is required to send direction letters to all tenants instructing them to deposit all rents and other payments into the lockbox account controlled by the lender. All funds are swept daily into a lender-controlled cash management account, where the funds are to be disbursed in accordance with the loan documents. In addition, during a Cash Trap Period an excess cash flow sweep will be in effect and all excess cash will be deposited into a lender-controlled account, to be held as additional collateral for the GVCC Loan.
A “Cash Trap Period” will commence upon (i) the occurrence of an event of default, (ii) the debt service coverage ratio falling below 1.20x on the last day of any calendar quarter or (iii) the occurrence of a Tenant Cash Trap Event (as defined below). A Cash Trap Period will cease to exist (a) with respect to clause (i), when such event of default has been cured and no other event of default exists, (b) with respect to clause (ii), when the debt service coverage ratio exceeds 1.25x for two consecutive quarters and (c) with respect to clause (iii), when either the Tenant Cash Trap Event has been cured or an amount of excess cash flow equal to the expenses incurred by the borrower in excess of the disbursement cap of $25.00 PSF (the “Tenant Disbursement Cap”) has been deposited with the lender.
A “Tenant Cash Trap Event” will occur when the expenses incurred by the borrower with respect to the re-tenanting of the IADT space exceed the Tenant Disbursement Cap, and such expenses above the Tenant Disbursement Cap remain unpaid.
Initial Reserves. At loan closing, the borrower deposited (i) $11,771 into a tax reserve account, (ii) $3,000 into a replacement reserve account and (iii) $1,652,360 into a TI/LC reserve account, of which $1,250,000 was reserved for the retenanting of the IADT space and $402,360 was reserved for tenant work allowances.
Ongoing Reserves. On a monthly basis, the borrower is required to deposit reserves of (i) 1/12 of the estimated annual real estate taxes, which currently equates to $12,515, into a tax reserve account, (ii) $3,393 into a replacement reserve account and (iii) $15,626 into a TI/LC reserve account. In addition, upon notice from the lender, the borrower will be required to deposit 1/12 of the annual insurance premiums into an insurance reserve account if (i) an event of default has occurred, (ii) an acceptable blanket insurance policy is no longer in place, (iii) the borrower fails to provide evidence of renewal of insurance or (iv) the borrower fails to provide evidence that the insurance premiums have been paid.
Current Mezzanine or Subordinate Indebtedness. None.
Future Mezzanine or Subordinate Indebtedness Permitted. None.
THE INFORMATION IN THIS STRUCTURAL AND COLLATERAL TERM SHEET IS NOT COMPLETE AND MAY BE AMENDED PRIOR TO THE TIME OF SALE. THIS TERM SHEET IS NOT AN OFFER TO SELL THESE SECURITIES AND IT IS NOT A SOLICITATION OF AN OFFER TO BUY THESE SECURITIES IN ANY JURISDICTION WHERE THE OFFER OR SALE IS NOT PERMITTED.
| 93 |
2475, 2485 & 2495 Village View Drive Henderson, NV 89074 | Collateral Asset Summary – Loan No. 9 Green Valley Corporate Center | Cut-off Date Balance: Cut-off Date LTV: U/W NCF DSCR: U/W NOI Debt Yield: | $27,000,000 12.4% |
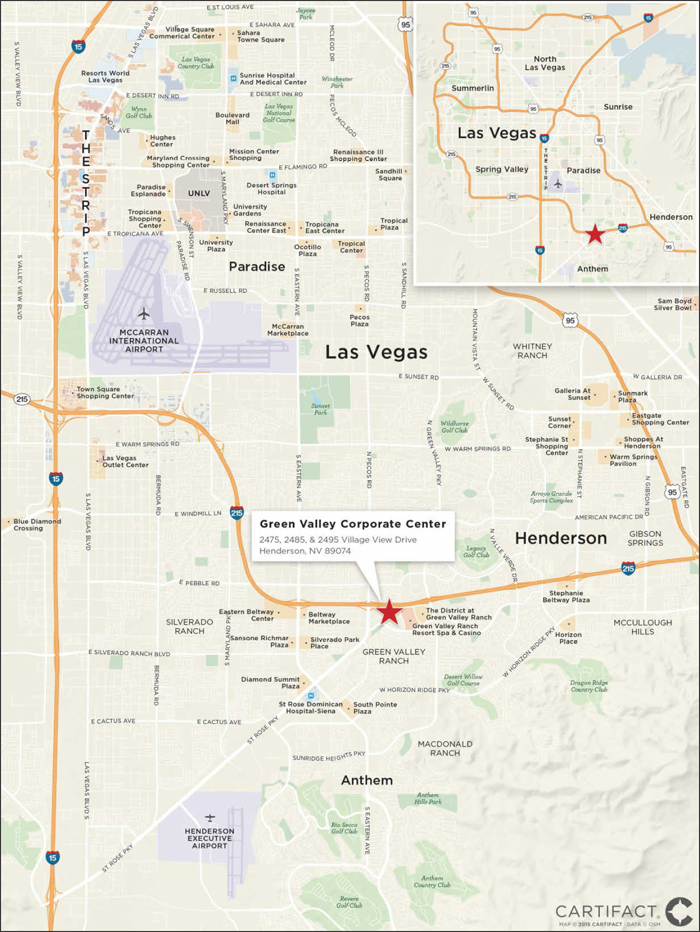
THE INFORMATION IN THIS STRUCTURAL AND COLLATERAL TERM SHEET IS NOT COMPLETE AND MAY BE AMENDED PRIOR TO THE TIME OF SALE. THIS TERM SHEET IS NOT AN OFFER TO SELL THESE SECURITIES AND IT IS NOT A SOLICITATION OF AN OFFER TO BUY THESE SECURITIES IN ANY JURISDICTION WHERE THE OFFER OR SALE IS NOT PERMITTED.
| 94 |
(THIS PAGE INTENTIONALLY LEFT BLANK)
| 95 |
7600, 7700, 7715 & 7745 Chevy Austin, TX 78752 | Collateral Asset Summary – Loan No. 10 Chase Park | Cut-off Date Balance: Cut-off Date LTV: U/W NCF DSCR: U/W NOI Debt Yield: | $26,600,000 69.3% 1.54x 10.5% |
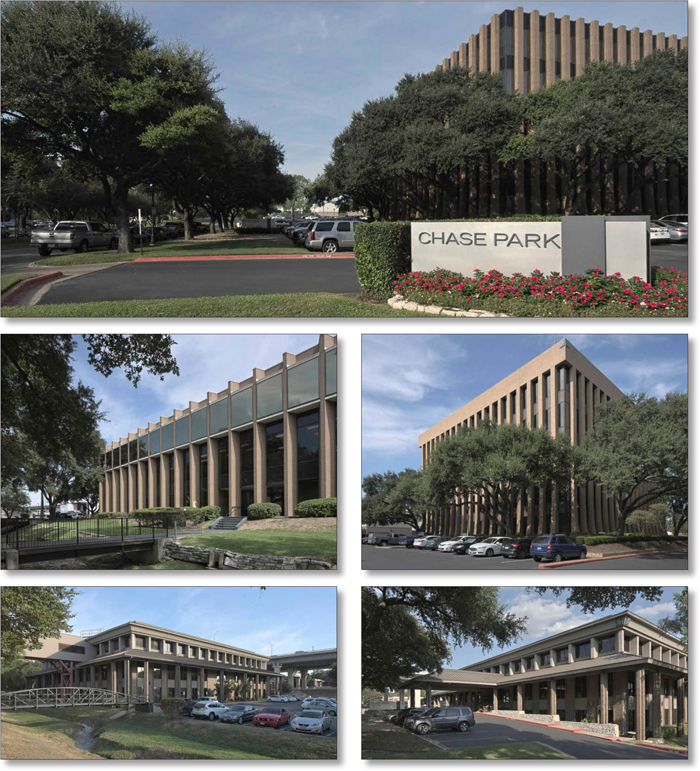
THE INFORMATION IN THIS STRUCTURAL AND COLLATERAL TERM SHEET IS NOT COMPLETE AND MAY BE AMENDED PRIOR TO THE TIME OF SALE. THIS TERM SHEET IS NOT AN OFFER TO SELL THESE SECURITIES AND IT IS NOT A SOLICITATION OF AN OFFER TO BUY THESE SECURITIES IN ANY JURISDICTION WHERE THE OFFER OR SALE IS NOT PERMITTED.
| 96 |
7600, 7700, 7715 & 7745 Chevy Austin, TX 78752 | Collateral Asset Summary – Loan No. 10 Chase Park | Cut-off Date Balance: Cut-off Date LTV: U/W NCF DSCR: U/W NOI Debt Yield: | $26,600,000 69.3% 1.54x 10.5% |
| Mortgage Loan Information | |
| Loan Seller: | GACC |
| Loan Purpose: | Refinance |
| Sponsor: | Benjamin Nazarian; Neil Kadisha |
| Borrower: | Omninet Chase Park, LLC |
| Original Balance: | $26,600,000 |
| Cut-off Date Balance: | $26,600,000 |
| % by Initial UPB: | 2.9% |
| Interest Rate: | 4.3200% |
| Payment Date: | 6thof each month |
| First Payment Date: | October 6, 2015 |
| Maturity Date: | September 6, 2025 |
| Amortization: | Interest only for first 60 months; 360 months thereafter |
| Additional Debt: | None |
| Call Protection: | L(25), D(91), O(4) |
| Lockbox / Cash Management: | Hard / Springing |
| Reserves(1) | ||
| Initial | Monthly | |
| Taxes: | $375,850 | $46,981 |
| Insurance: | $0 | Springing |
| Replacement: | $0 | $4,566 |
| TI/LC: | $1,433,086 | $25,137 |
| Lease Sweep: | $0 | Springing |
| Required Repairs: | $9,775 | NAP |
| Free Rent: | $67,479 | $0 |
| Financial Information | ||
| Cut-off Date Balance / Sq. Ft.: | $92 | |
| Balloon Balance / Sq. Ft.: | $84 | |
| Cut-off Date LTV(2): | 69.3% | |
| Balloon LTV(2): | 63.2% | |
| Underwritten NOI DSCR(3): | 1.77x | |
| Underwritten NCF DSCR(3): | 1.54x | |
| Underwritten NOI Debt Yield: | 10.5% | |
| Underwritten NCF Debt Yield: | 9.1% | |
| Underwritten NOI Debt Yield at Balloon: | 11.5% | |
| Underwritten NCF Debt Yield at Balloon: | 10.0% | |
| Property Information | |
| Single Asset / Portfolio: | Single Asset |
| Property Type: | Suburban Office |
| Collateral: | Fee Simple |
| Location: | Austin, TX |
| Year Built / Renovated: | 1969-1975 / 2006-2015 |
| Total Sq. Ft.: | 288,382 |
| Property Management: | Omninet Property Management, Inc. |
| Underwritten NOI: | $2,799,028 |
| Underwritten NCF: | $2,431,423 |
| “As-is” Appraised Value: | $38,400,000 |
| “As-is” Appraisal Date: | May 29, 2015 |
| “As Stabilized” Appraised Value(2): | $41,200,000 |
| “As Stabilized” Appraisal Date: | May 29, 2015 |
| Historical NOI(4) | |
| Most Recent NOI: | $2,439,268 (T-12 March 31, 2015) |
| 2014 NOI: | $2,245,338 (December 31, 2014) |
| 2013 NOI: | $1,717,397 (December 31, 2013) |
| 2012 NOI: | NAV |
| Historical Occupancy | |
| Most Recent Occupancy(5): | 87.0% (August 20, 2015) |
| 2014 Occupancy: | 72.7% (December 31, 2014) |
| 2013 Occupancy: | 71.9% (December 31, 2013) |
| 2012 Occupancy: | 64.4% (December 31, 2012) |
| (1) | See “Initial Reserves” and “Ongoing Reserves” herein. |
| (2) | The “As Stabilized” Appraised Value assumes that the property is at stabilized occupancy of 90.0% as of the appraisal date. Based on the “As Stabilized” appraised value of $41,200,000, the Cut-off Date LTV and Balloon LTV are 64.6% and 58.9%, respectively. |
| (3) | Based on amortizing debt service payments. Based on the current interest only payments, the Underwritten NOI DSCR and Underwritten NCF DSCR are 2.40x and 2.09x, respectively. |
| (4) | The sponsors acquired the mortgaged property in April 2013; as such, Historical NOI prior to that is not available. |
| (5) | Most Recent Occupancy includes the executed expansion space lease of 8,600 sq. ft. effective November 1, 2015 (3.0% of NRA) for Seton, the largest tenant, as well as the 29,859 sq. ft. of space (10.4% of NRA) for Austin Stone Church (which tenant is not yet in occupancy). Austin Stone Church is expected to take occupancy of 28,614 sq. ft. of its space and begin paying rent in November 2015 and the remaining 1,245 sq. ft. in October 2016. |
THE INFORMATION IN THIS STRUCTURAL AND COLLATERAL TERM SHEET IS NOT COMPLETE AND MAY BE AMENDED PRIOR TO THE TIME OF SALE. THIS TERM SHEET IS NOT AN OFFER TO SELL THESE SECURITIES AND IT IS NOT A SOLICITATION OF AN OFFER TO BUY THESE SECURITIES IN ANY JURISDICTION WHERE THE OFFER OR SALE IS NOT PERMITTED.
| 97 |
7600, 7700, 7715 & 7745 Chevy Austin, TX 78752 | Collateral Asset Summary – Loan No. 10 Chase Park | Cut-off Date Balance: Cut-off Date LTV: U/W NCF DSCR: U/W NOI Debt Yield: | $26,600,000 69.3% 1.54x 10.5% |
| Tenant Summary | ||||||||||||||||
| Major Tenants | Ratings (Fitch/Moody’s/S&P)(1) | Net Rentable Area (Sq. Ft.) | % of Net Rentable Area |
| U/W Base Rent PSF | % of Total U/W Base Rent | Lease Expiration | |||||||||
| Seton(2) | NR/NR/NR | 68,105 | 23.6% | $20.75 | 27.2% | 3/31/2023 | ||||||||||
| Austin Stone Church(3) | NR/NR/NR | 29,859 | 10.4% | $19.17 | 11.0% | 10/30/2020 | ||||||||||
| Jacobs Engineering | NR/NR/NR | 27,775 | 9.6% | $20.25 | 10.8% | 3/31/2019 | ||||||||||
| Northrop Grumman | BBB+/Baa2/BBB+ | 18,945 | 6.6% | $22.50 | 8.2% | 11/30/2016 | ||||||||||
| Total Major Tenants | 144,684 | 50.2% | $20.55 | 57.3% | ||||||||||||
| Non-Major Tenants | 106,159 | 36.8% | $20.88 | 42.7% | ||||||||||||
| Total Occupied Collateral | 250,843 | 87.0% | $20.69 | 100.0% | ||||||||||||
| Vacant | 37,539 | 13.0% | ||||||||||||||
| Total | 288,382 | 100.0% | ||||||||||||||
| (1) | Certain ratings are those of the parent company whether or not the parent company guarantees the lease. |
| (2) | Seton occupies 4,050 sq. ft. of space that expires on March 31, 2016. Seton’s Net Rentable Area (Sq. Ft.) also includes 8,600 sq. ft. of expansion space that is not yet in occupancy. It is expected that Seton will take occupancy of this expansion space and begin paying rent on the space in November 1, 2015. |
| (3) | Austin Stone Church has signed a lease for 28,614 sq. ft. of space at the mortgaged property but has not yet taken occupancy or begun paying rent. It is expected that Austin Stone Church will take occupancy of this space and begin paying rent on November 1, 2015. Austin Stone Church’s Net Rentable Area (Sq. Ft.) includes an additional 1,245 sq. ft. of space which it is expected to take occupancy of on October 1, 2016 and which expires on September 30, 2020. |
Lease Rollover Schedule(1) | ||||||||||||||||||||||||
| Year | # of Leases Expiring | Total Expiring Sq. Ft. | % of Total Sq. Ft. Expiring | Cumulative Sq. Ft. Expiring | Cumulative % of Sq. Ft. Expiring | Annual U/W Base Rent PSF | % U/W | Cumulative % of U/W Base Rent | ||||||||||||||||
| MTM | 0 | 0 | 0.0 | % | 0 | 0.0 | % | $0.00 | 0.0 | % | 0.0 | % | ||||||||||||
| 2015 | 1 | 5,378 | 1.9 | % | 5,378 | 1.9 | % | $25.55 | 2.6 | % | 2.6 | % | ||||||||||||
| 2016 | 5 | 44,772 | 15.5 | % | 50,150 | 17.4 | % | $20.85 | 18.0 | % | 20.6 | % | ||||||||||||
| 2017 | 0 | 0 | 0.0 | % | 50,150 | 17.4 | % | $0.00 | 0.0 | % | 20.6 | % | ||||||||||||
| 2018 | 2 | 8,863 | 3.1 | % | 59,013 | 20.5 | % | $22.65 | 3.9 | % | 24.5 | % | ||||||||||||
| 2019 | 6 | 68,787 | 23.9 | % | 127,800 | 44.3 | % | $20.95 | 27.8 | % | 52.3 | % | ||||||||||||
| 2020 | 6 | 53,819 | 18.7 | % | 181,619 | 63.0 | % | $20.23 | 21.0 | % | 73.2 | % | ||||||||||||
| 2021 | 0 | 0 | 0.0 | % | 181,619 | 63.0 | % | $0.00 | 0.0 | % | 73.2 | % | ||||||||||||
| 2022 | 0 | 0 | 0.0 | % | 181,619 | 63.0 | % | $0.00 | 0.0 | % | 73.2 | % | ||||||||||||
| 2023 | 6 | 67,296 | 23.3 | % | 248,915 | 86.3 | % | $20.64 | 26.8 | % | 100.0 | % | ||||||||||||
| 2024 | 0 | 0 | 0.0 | % | 248,915 | 86.3 | % | $0.00 | 0.0 | % | 100.0 | % | ||||||||||||
| 2025 | 0 | 0 | 0.0 | % | 248,915 | 86.3 | % | $0.00 | 0.0 | % | 100.0 | % | ||||||||||||
| Thereafter | 1 | 1,928 | 0.7 | % | 250,843 | 87.0 | % | $0.00 | 0.0 | % | 100.0 | % | ||||||||||||
| Vacant | NAP | 37,539 | 13.0 | % | 288,382 | 100.0 | % | NAP | NAP | |||||||||||||||
| Total / Wtd. Avg. | 27 | 288,382 | 100.00 | % | $20.69 | 100.0 | % | |||||||||||||||||
| (1) | Certain tenants have lease termination options that may become exercisable prior to the originally stated expiration date of the tenant lease that are not considered in the lease rollover schedule. |
THE INFORMATION IN THIS STRUCTURAL AND COLLATERAL TERM SHEET IS NOT COMPLETE AND MAY BE AMENDED PRIOR TO THE TIME OF SALE. THIS TERM SHEET IS NOT AN OFFER TO SELL THESE SECURITIES AND IT IS NOT A SOLICITATION OF AN OFFER TO BUY THESE SECURITIES IN ANY JURISDICTION WHERE THE OFFER OR SALE IS NOT PERMITTED.
| 98 |
7600, 7700, 7715 & 7745 Chevy Austin, TX 78752 | Collateral Asset Summary – Loan No. 10 Chase Park | Cut-off Date Balance: Cut-off Date LTV: U/W NCF DSCR: U/W NOI Debt Yield: | $26,600,000 69.3% 1.54x 10.5% |
The Loan.The Chase Park loan (the “Chase Park Loan”) is a $26.6 million fixed rate loan secured by the borrower’s fee simple interest in a 288,382 sq. ft. Class B/C, suburban office complex comprised of five, two- to five-story buildings located at 7600, 7700, 7715 and 7745 Chevy Chase Drive and 313 Anderson Lane in Austin, Texas (the “Chase Park Property”). The Chase Park Loan has a 10-year term and is interest only for the first 60 months of the term and amortizes on a 30-year schedule thereafter. The Chase Park Loan accrues interest at a fixed rate equal to 4.3200% per annum. Loan proceeds were used to refinance the Chase Park Property for approximately $18.8 million, fund upfront reserves of approximately $1.9 million, pay closing costs of approximately $0.2 million and return approximately $5.7 million of equity to the sponsor. Based on the “As-is” Appraised Value of $38.4 million as of May 29, 2015, the Cut-off Date LTV ratio is 69.3%. Based on the “As Stabilized” Appraised Value of $41.2 million, which assumes that the Chase Park Property is at stabilized occupancy of 90.0% as of the appraisal date, the Cut-off Date LTV is 64.6%. The most recent prior financing of the Chase Park Property was not included in a securitization.
| Sources and Uses | ||||||
| Sources | Proceeds | % of Total | Uses | Proceeds | % of Total | |
| Mortgage Loan | $26,600,000 | 100.0% | Loan Payoff | $18,774,562 | 70.6% | |
| Reserves | $1,886,190 | 7.1% | ||||
| Closing Costs | $234,804 | 0.9% | ||||
| Return of Equity | $5,704,444 | 21.4% | ||||
| Total Sources | $26,600,000 | 100.0% | Total Uses | $26,600,000 | 100.0% | |
The Borrower / Sponsor.The borrower is Omninet Chase Park, LLC, a single purpose Delaware limited liability company structured to be bankruptcy-remote, with one independent director in its organizational structure. The sponsors of the borrower and the non-recourse carve-out guarantors are Benjamin Nazarian and Neil Kadisha on a joint and several basis. Benjamin Nazarin and Neil Kadisha are both managing partners of Omninet Capital, LLC. For additional information regarding Neil Kadisha, see “Risk Factors—Risks Related to the Mortgage Loans—Prior Bankruptcies, Defaults or Other Proceedings May Be Relevant to Future Performance” in the Free Writing Prospectus.
The sponsors, through their controlling stake in Omninet Capital, LLC have been investing in commercial real estate and venture capital for over 20 years. Omninet Capital, LLC is a private equity firm that specializes in leveraged buyouts and growth equity financing in high growth middle markets. Omninet Capital, LLC pursues direct investment in commercial real estate debt and income producing properties. Omninet’s commercial real estate portfolio includes nearly 4 million sq. ft. across six states.
The Property.The Chase Park Property is a 288,382 sq. ft. Class B/C, suburban office complex comprised of five, two- to five-story buildings located in Austin, Texas. The buildings were constructed between 1969 and 1975 and renovated in 2006. The Chase Park Property is located at the intersection of two of the Austin metro area’s major highway arterials, Interstate 35 and US-183. As of August 20, 2015, the Chase Park Property was 87.0% leased to a diverse mix of 19 tenants including one investment grade tenant, Northrop Grumman. The Chase Park Property has 1,213 surface parking spaces, which equates to a parking ratio of 4.21 spaces per 1,000 sq. ft.
The sponsors acquired the Chase Park Property in April 2013 for $23.0 million ($79.76 PSF), at which time the property was 67.0% occupied. Since acquisition, according to the sponsors, they have invested approximately $1.8 million ($6.24 PSF) to update the lobby, renovate the restrooms, upgrade the elevator cab, update lighting and install a new electronic directory, which upgrades have contributed to the increased occupancy level. In the past 12 months five new leases have been signed at the Chase Park Property, accounting for 18.3% of NRA and 20.3% of base rent. Additionally, in February 2013, the largest tenant at the building, Seton, renewed their lease through 2023 and expanded their space at the Chase Park Property by 16,237 sq. ft and recently finalized a second expansion for an additional 8,600 sq. ft. at the Chase Park Property, bringing their total space up to 68,105 sq. ft. Only 4,050 sq. ft. of space occupied by Seton is set to expire in March 2016.
Environmental Matters.The Phase I environmental report dated June 4, 2015 recommended no further action at the Chase Park Property.
Major Tenants.
Seton (68,105 sq. ft., 23.6% of NRA, 27.2% of U/W Base Rent) Seton is a faith-based, non-profit health care provider that operates more than 100 clinical locations, including four teaching hospitals affiliated with The University of Texas. Seton moved into the Chase Park Property in January 2003, and has expanded from its initial space of 12,743 sq. ft. to its current size of 68,105 sq. ft., with the most recent expansion executed in August 2015 for 8,600 additional sq. ft. The expansion space lease will commence at the earlier of (i) tenant work completion or (ii) November 1, 2015. Seton does not have any extension options remaining and has no termination options.
THE INFORMATION IN THIS STRUCTURAL AND COLLATERAL TERM SHEET IS NOT COMPLETE AND MAY BE AMENDED PRIOR TO THE TIME OF SALE. THIS TERM SHEET IS NOT AN OFFER TO SELL THESE SECURITIES AND IT IS NOT A SOLICITATION OF AN OFFER TO BUY THESE SECURITIES IN ANY JURISDICTION WHERE THE OFFER OR SALE IS NOT PERMITTED.
| 99 |
7600, 7700, 7715 & 7745 Chevy Austin, TX 78752 | Collateral Asset Summary – Loan No. 10 Chase Park | Cut-off Date Balance: Cut-off Date LTV: U/W NCF DSCR: U/W NOI Debt Yield: | $26,600,000 69.3% 1.54x 10.5% |
Austin Stone Church(29,859 sq. ft., 10.4% of NRA, 11.0% of U/W Base Rent) Austin Stone Church is one of the largest Christian churches in the Austin area. It is expected that Austin Stone Church will take occupancy of 28,614 sq. ft. and 1,245 sq. ft. and commence rent payments in November 2015 and October 2016, respectively. According to the sponsor, this tenant intends to use its space as office and administration space for the church, which has four campuses in Austin and one in Round Rock, Texas. The Chase Park Loan was structured with approximately $1.4 million upfront reserve related to the outstanding TI/LC relating to the Austin Stone Church lease. Austin Stone Church’s 1,245 sq. ft. lease expires September 30, 2020, and the 28,614 sq. ft. lease expires October 30, 2020. Austin Stone Church has one five-year extension option and no termination options.
Jacobs Engineering(27,775 sq. ft., 9.6% of NRA, 10.8% of U/W Base Rent) Jacobs Engineering is an international technical professional services firm that provides a diverse range of technical, professional and construction services to industrial, commercial and government clients. Jacobs Engineering has been at the Chase Park Property since May of 2014. The current lease expires March 31,2019 but the tenant has the option to extend the term of the lease for (i) the entire premises, or (ii) only their space in building 2 or (iii) their space in building 5, in any case, for a period of the longer of (a) one year or (b) the remaining length of time on any client contract that Jacobs Engineering services from the property. Jacobs Engineering has the right to terminate its lease after May 31, 2017 provided that it has received notice from the Texas Department of Transportation of the loss or cancellation of no less than 51% of Jacobs Engineering’s funding for contracts with the Texas Department of Transportation. Subject to conditions set forth in the lease, Jacobs Engineering has a right of first refusal during the initial lease term to lease any available space on the 4th floor of building 2 and the 3rd floor of building 5.
The Market.The Chase Park Property is located in Austin, Texas, approximately six miles northeast of the central business district and approximately five miles northeast of The University of Texas. The property is one block southwest of Interstate-35 and US-183, which provides access to the entire Austin metro area. The Austin metro area is home to a diverse base of businesses in the government, trade, transportation and utilities and professional services. The 2015 population and median household income within a three-mile radius of the Chase Park Property was 147,804 and $41,471. As of Q2 2015, the Central Class B and Class C submarkets consisted of approximately 2.8 million sq. ft. and 2.5 million sq. ft., respectively. According to an industry report, as of Q2 2015, vacancy within the Central Class B and Class C submarkets was 9.8% and 3.1%, respectively, with quoted rents of $22.98 PSF and $20.67 PSF, respectively. The appraiser projected a stabilized vacancy of 10.0% and a rent of $21.50 PSF for the Chase Park Property. As of August 20, 2015, vacancy at the Chase Park Property was 13.0% and the weighted average underwritten rent was $20.69 PSF.
| Summary of Comparable Office Rentals(1) | |||||||||||
| Name | Chase Park Property | La Costa Centre | Chase Northcross | One La Costa | Centennial Towers | Greystone II | |||||
| Distance from subject (miles) | NAP | 2.5 | 2.5 | 2.0 | 1.7 | 1.7 | |||||
| Building Sq. Ft. | 288,382(2) | 80,821 | 82,909 | 61,654 | 156,293 | 47,318 | |||||
| Year Built/Renovated | 1969-1975/2006 | 1982 | 1972-84 | 1979 | 1986 | 1980 | |||||
| Occupancy | 87.0%(2) | 85.1% | 89.7% | 96.5% | 91.5% | 73.8% | |||||
| Rent PSF | $20.69(2) | $19.50 | $24.00 | $19.00 | $22.00 | $23.50 | |||||
| Expense Basis | Gross | Gross | Gross | Gross | Modified Gross | Full Service | |||||
| (1) | Source: Appraisal. |
| (2) | Per underwritten rent roll. |
THE INFORMATION IN THIS STRUCTURAL AND COLLATERAL TERM SHEET IS NOT COMPLETE AND MAY BE AMENDED PRIOR TO THE TIME OF SALE. THIS TERM SHEET IS NOT AN OFFER TO SELL THESE SECURITIES AND IT IS NOT A SOLICITATION OF AN OFFER TO BUY THESE SECURITIES IN ANY JURISDICTION WHERE THE OFFER OR SALE IS NOT PERMITTED.
| 100 |
7600, 7700, 7715 & 7745 Chevy Austin, TX 78752 | Collateral Asset Summary – Loan No. 10 Chase Park | Cut-off Date Balance: Cut-off Date LTV: U/W NCF DSCR: U/W NOI Debt Yield: | $26,600,000 69.3% 1.54x 10.5% |
Cash Flow Analysis.
| Cash Flow Analysis | |||||||||
| 2013 | 2014 | T-12 3/31/2015 | U/W | U/W PSF | |||||
| Base Rent(1)(2) | $3,067,112 | $3,756,670 | $3,992,162 | $5,303,941 | $18.39 | ||||
| Value of Vacant Space | 0 | 0 | 0 | 790,929 | 2.74 | ||||
| Gross Potential Rent | $3,067,112 | $3,756,670 | $3,992,162 | $6,094,871 | $21.13 | ||||
| Total Recoveries | 705,916 | 754,652 | 709,020 | 33,454 | 0.12 | ||||
| Total Other Income | 0 | 4,603 | 4,604 | 3,000 | 0.01 | ||||
| Less: Vacancy(3) | 0 | 0 | 0 | (790,929) | (2.74) | ||||
| Effective Gross Income | $3,773,028 | $4,515,925 | $4,705,786 | $5,340,395 | $18.52 | ||||
| Total Operating Expenses | 2,055,631 | 2,270,587 | 2,266,517 | 2,541,367 | 8.81 | ||||
| Net Operating Income | $1,717,397 | $2,245,338 | $2,439,268 | $2,799,028 | $9.71 | ||||
| TI/LC | 0 | 0 | 0 | 312,812 | 1.08 | ||||
| Capital Expenditures | 0 | 0 | 0 | 54,793 | 0.19 | ||||
| Net Cash Flow | $1,717,397 | $2,245,338 | $2,439,268 | $2,431,423 | $8.43 | ||||
| (1) | U/W Base Rent includes 12 months ($113,268) in rent steps. |
| (2) | The increase in base rent from T-12 3/31/2015 to U/W was due to increased occupancy at the Chase Park Property. |
| (3) | U/W Vacancy represents 12.9% of gross income. The in-place occupancy as of August 20, 2015 is 87.0%, inclusive of the expansion space lease (3.0% of NRA) effective November 1, 2015 for Seton, the largest tenant, as well as 29,859 sq. ft. (10.4% of NRA) for Austin Stone Church, which is expected to take occupancy of 28,614 sq. ft. of its space on November 1, 2015 and the remaining 1,245 sq. ft. on October 1, 2016. |
Property Management. The Chase Park Property is managed by Omninet Property Management, Inc., a borrower affiliate.
Lockbox / Cash Management.The Chase Park Loan is structured with a hard lockbox and a springing cash management. At loan closing, the borrower was required to deliver tenant direction letters requiring all rents, revenues and receipts from the Chase Park Property to be deposited directly by the tenants into a clearing account established by the borrower. Amounts on deposit in the clearing account are required to be transferred daily from the clearing account into borrower’s operating account. During a Trigger Period (as defined below), sums on deposit in the clearing account are required to be swept daily into a lender controlled deposit account.
A “Trigger Period” will commence (i) upon an event of default, (ii) if the DSCR falls below 1.20x (a “Low Debt Service Period”) until such time that the DSCR is at least 1.20x for two consecutive calendar quarters or (iii) the commencement of a Lease Sweep Period (as defined below). The borrower may prevent a Trigger Period commencing due to a Low Debt Service Period by depositing cash or posting a letter of credit in an amount equal to $315,000, which amount will be increased by (i) $315,000 if the Low Debt Service Period continues for two calculation dates after the initial commencement, (ii) an additional $315,000 if the Low Debt Service Period is continuing for eight calculation dates after the initial commencement, and (iii) $315,000 for each succeeding four calculation dates thereafter if the Low Debt Service Period is continuing.
If the debt yield is less than 8.0%, a “Lease Sweep Period” will commence on the first monthly payment date following (i) 15 months prior to the expiration of a Lease Sweep Lease (as defined below), (ii) the tenant under the Lease Sweep Lease failing to renew its lease, defaulting under its lease or becoming subject to insolvency proceedings or (iii) the giving of notice from any tenant under a Lease Sweep Lease exercising its right to terminate its lease.
A “Lease Sweep Lease” includes (i) the Seton lease or (ii) any replacement lease (or leases) with a tenant that leases the full or substantially all of the 68,105 sq. ft. of the applicable lease space.
Initial Reserves.At loan closing, the borrower deposited (i) $375,850 into a tax reserve account, (ii) $1,433,086 into a TI/LC reserve account, (iii) $9,775 into a required repairs reserve account, which represents 115% of the engineer’s recommendation and (iv) $67,479 into a free rent account. The initial TI/LC deposit is comprised of (i) Austin Stone Church outstanding tenant improvements of $1,316,244, (ii) Austin Stone Church outstanding leasing commissions of $108,238 and (iii) Patricio Garza Izaguirre TI/LC of $8,604. The free rent deposit is comprised of $47,690 for the free rent for month of September 2015 for Austin Stone Church, as well as an additional $19,789 for two tenants that account for 1.7% of total NRA for the months of September 2015 through January 2016.
Ongoing Reserves.On a monthly basis, the borrower is required to deposit reserves of (i) 1/12 of the estimated annual real estate taxes, which currently equates to $46,981, into a tax reserve account, (ii) $4,566 into a replacement reserve account and (iii) $25,137 into a TI/LC reserve account, subject to a TI/LC reserve cap equal to $1.4 million, which does not include the initial deposit of $1,433,086. Additionally, during a Lease Sweep Period, all excess cash will be deposited into a lease sweep account, and if an acceptable blanket insurance policy is no longer in place the borrower is required to deposit 1/12 of the estimated annual insurance premiums into an insurance reserve account.
THE INFORMATION IN THIS STRUCTURAL AND COLLATERAL TERM SHEET IS NOT COMPLETE AND MAY BE AMENDED PRIOR TO THE TIME OF SALE. THIS TERM SHEET IS NOT AN OFFER TO SELL THESE SECURITIES AND IT IS NOT A SOLICITATION OF AN OFFER TO BUY THESE SECURITIES IN ANY JURISDICTION WHERE THE OFFER OR SALE IS NOT PERMITTED.
| 101 |
7600, 7700, 7715 & 7745 Chevy Austin, TX 78752 | Collateral Asset Summary – Loan No. 10 Chase Park | Cut-off Date Balance: Cut-off Date LTV: U/W NCF DSCR: U/W NOI Debt Yield: | $26,600,000 69.3% 1.54x 10.5% |
Current Mezzanine or Subordinate Indebtedness. None.
Future Mezzanine or Subordinate Indebtedness Permitted. None.
THE INFORMATION IN THIS STRUCTURAL AND COLLATERAL TERM SHEET IS NOT COMPLETE AND MAY BE AMENDED PRIOR TO THE TIME OF SALE. THIS TERM SHEET IS NOT AN OFFER TO SELL THESE SECURITIES AND IT IS NOT A SOLICITATION OF AN OFFER TO BUY THESE SECURITIES IN ANY JURISDICTION WHERE THE OFFER OR SALE IS NOT PERMITTED.
| 102 |
7600, 7700, 7715 & 7745 Chevy Austin, TX 78752 | Collateral Asset Summary – Loan No. 10 Chase Park | Cut-off Date Balance: Cut-off Date LTV: U/W NCF DSCR: U/W NOI Debt Yield: | $26,600,000 69.3% 1.54x 10.5% |
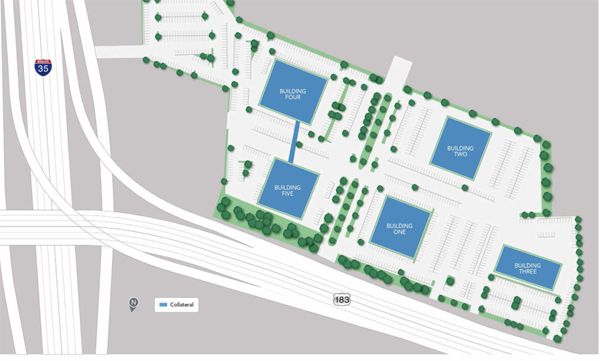
THE INFORMATION IN THIS STRUCTURAL AND COLLATERAL TERM SHEET IS NOT COMPLETE AND MAY BE AMENDED PRIOR TO THE TIME OF SALE. THIS TERM SHEET IS NOT AN OFFER TO SELL THESE SECURITIES AND IT IS NOT A SOLICITATION OF AN OFFER TO BUY THESE SECURITIES IN ANY JURISDICTION WHERE THE OFFER OR SALE IS NOT PERMITTED.
| 103 |
7600, 7700, 7715 & 7745 Chevy Austin, TX 78752 | Collateral Asset Summary – Loan No. 10 Chase Park | Cut-off Date Balance: Cut-off Date LTV: U/W NCF DSCR: U/W NOI Debt Yield: | $26,600,000 69.3% 1.54x 10.5% |

THE INFORMATION IN THIS STRUCTURAL AND COLLATERAL TERM SHEET IS NOT COMPLETE AND MAY BE AMENDED PRIOR TO THE TIME OF SALE. THIS TERM SHEET IS NOT AN OFFER TO SELL THESE SECURITIES AND IT IS NOT A SOLICITATION OF AN OFFER TO BUY THESE SECURITIES IN ANY JURISDICTION WHERE THE OFFER OR SALE IS NOT PERMITTED.
| 104 |
(THIS PAGE INTENTIONALLY LEFT BLANK)
| 105 |
900 Terminal Place Richmond, VA 23220 | Collateral Asset Summary – Loan No. 11 Cookie Factory Lofts | Cut-off Date Balance: Cut-off Date LTV: U/W NCF DSCR: U/W NOI Debt Yield: | $23,000,000 76.2% 1.28x 8.2% |
| Mortgage Loan Information | |
| Loan Seller: | BNYM |
| Loan Purpose: | Refinance |
| Sponsor: | Kevin T. McFadden; Robert W. Hargett; Daniel L. Hargett |
| Borrower: | Interbake Partners, LLC |
| Original Balance: | $23,000,000 |
| Cut-off Date Balance: | $23,000,000 |
| % by Initial UPB: | 2.5% |
| Interest Rate: | 4.7600% |
| Payment Date: | 6thof each month |
| First Payment Date: | November 6, 2015 |
| Maturity Date: | October 6, 2025 |
| Amortization: | Interest only for first 36 months; 360 months thereafter |
| Additional Debt: | None |
| Call Protection: | L(24), D(92), O(4) |
| Lockbox / Cash Management(1): | Springing Soft / Springing |
| Reserves | ||
| Initial | Monthly | |
| Taxes: | $42,720 | $5,340 |
| Insurance(2): | $22,428 | Springing |
| Replacement: | $0 | $2,967 |
| Debt Service: | $360,353 | $0 |
| Financial Information | ||
| Cut-off Date Balance / Unit: | $129,213 | |
| Balloon Balance / Unit: | $113,784 | |
| Cut-off Date LTV: | 76.2% | |
| Balloon LTV: | 67.1% | |
| Underwritten NOI DSCR(3): | 1.30x | |
| Underwritten NCF DSCR(3): | 1.28x | |
| Underwritten NOI Debt Yield: | 8.2% | |
| Underwritten NCF Debt Yield: | 8.0% | |
| Property Management | |
| Single Asset / Portfolio: | Single Asset |
| Property Type: | Mid Rise Multifamily |
| Collateral: | Fee Simple |
| Location: | Richmond, VA |
| Year Built / Renovated: | 1927 / 2014 |
| Total Units: | 178 |
| Property Management: | 1414 W. Marshall St. LLC d/b/a Pondok Management |
| Underwritten NOI: | $1,877,808 |
| Underwritten NCF: | $1,842,208 |
| Appraised Value: | $30,200,000 |
| Appraisal Date: | August 11, 2015 |
| Historical NOI(4) | |
| Most Recent NOI: | $1,156,756 (T-3 July 31, 2015 Ann.) |
| 2014 NOI: | NAV |
| 2013 NOI: | NAV |
| 2012 NOI: | NAV |
| Historical Occupancy(4) | |
| Most Recent Occupancy: | 93.3% (September 14, 2015) |
| 2014 Occupancy: | NAV |
| 2013 Occupancy: | NAV |
| 2012 Occupancy: | NAV |
| (1) | A soft lockbox and in place cash management will be triggered (i) upon an event of default or (ii) if the DSCR falls below 1.10x (based on amortizing debt service payments) for two consecutive calendar quarters. |
| (2) | Upon notice from the lender, the borrower will be required to deposit 1/12 of the annual insurance premiums into an insurance reserve account if (i) an event of default has occurred, (ii) an acceptable blanket insurance policy is no longer in place, (iii) the borrower fails to provide evidence of renewal of the blanket insurance policy or (iv) the borrower fails to provide evidence that the insurance premiums have been paid. |
| (3) | Based on amortizing debt service payments. Based on the current interest only payments, the Underwritten NOI DSCR and Underwritten NCF DSCR are 1.69x and 1.66x, respectively. |
| (4) | The redevelopment of the Cookie Factory Lofts property was completed in late 2014. As such, Historical NOI and Historical Occupancy are not available. |
TRANSACTION HIGHLIGHTS |
| ■ | Property.The Cookie Factory Lofts property is comprised of a six-story residential building and a single-story building containing a leasing office on approximately 4.14 acres. The property also has 245 parking spaces on-site, 101 of which are in an underground garage. The property was formerly a bakery factory that was converted into multifamily apartments in 2014. Amenities include a rooftop deck with grilling areas, a fitness center, a business center, a resident lounge, a communal kitchen and dining area and an outdoor pool. Each unit contains new appliances, including a washer and dryer. The property is a historic structure listed on the National Register of Historic Places. |
| ■ | Location.The property is located at 900 Terminal Place in Richmond, Virginia. Richmond is the state capital of Virginia. The property is located in the Scott’s Addition multifamily submarket. The property is adjacent to the Washington Redskins training facility and the Science Museum of Richmond. |
| ■ | Historic Tax Credits. As a result of the 2014 gut renovation and the building’s status as a historic structure, the property qualified for state and federal historic rehabilitation tax credits. The borrower leased the entirety of the property under a master lease to a master tenant in order to pass the federal tax credits through to the 99% owner of the master tenant, The Sherwin-Williams Company. The master lease expires on September 30, 2039 and may not be terminated nor accelerated until December 31, 2019. The current annual base rent under the master lease is $1,764,962.The federal historic tax credits have an estimated value of $5.332 million. The Virginia historic tax credits were allocated by the borrower to The Virginia Historic Tax Credit Fund L.P., which acquired an approximately 4% equity interest in the borrower in exchange for payments estimated at $6.635 million. |
| ■ | Sponsor.The sponsors are Kevin T. McFadden, Robert W. Hargett, and Daniel L. Hargett, who are principals in Rebkee Group, a real estate company specializing in the development, ownership and management of multifamily and retail properties throughout the Southeastern United States. |
THE INFORMATION IN THIS STRUCTURAL AND COLLATERAL TERM SHEET IS NOT COMPLETE AND MAY BE AMENDED PRIOR TO THE TIME OF SALE. THIS TERM SHEET IS NOT AN OFFER TO SELL THESE SECURITIES AND IT IS NOT A SOLICITATION OF AN OFFER TO BUY THESE SECURITIES IN ANY JURISDICTION WHERE THE OFFER OR SALE IS NOT PERMITTED.
| 106 |
949 Crowsnest Circle Orlando, FL 32825 | Collateral Asset Summary – Loan No. 12 Windrift Apartments | Cut-off Date Balance: Cut-off Date LTV: U/W NCF DSCR: U/W NOI Debt Yield: | $21,450,000 74.7% 1.31x 8.5% |
| Mortgage Loan Information | |
| Loan Seller: | GACC |
| Loan Purpose: | Refinance |
| Sponsor: | Shaul Kopelowitz |
| Borrower: | WE Windrift LLC |
| Original Balance: | $21,450,000 |
| Cut-off Date Balance: | $21,450,000 |
| % by Initial UPB: | 2.3% |
| Interest Rate: | 4.6100% |
| Payment Date: | 6thof each month |
| First Payment Date: | October 6, 2015 |
| Maturity Date: | September 6, 2025 |
| Amortization: | Interest only for first 24 months; 360 months thereafter |
| Additional Debt: | None |
| Call Protection: | L(25), D(91), O(4) |
| Lockbox / Cash Management(1): | Springing Soft / Springing |
| Reserves | ||
| Initial | Monthly | |
| Taxes: | $263,475 | $23,952 |
| Insurance: | $78,160 | $11,166 |
| Replacement: | $0 | $7,416 |
| Required Repairs(2): | $0 | Springing |
| Financial Information | ||
| Cut-off Date Balance / Unit: | $74,479 | |
| Balloon Balance / Unit: | $63,794 | |
| Cut-off Date LTV: | 74.7% | |
| Balloon LTV: | 64.0% | |
| Underwritten NOI DSCR(3): | 1.38x | |
| Underwritten NCF DSCR(3): | 1.31x | |
| Underwritten NOI Debt Yield: | 8.5% | |
| Underwritten NCF Debt Yield: | 8.1% | |
| Property Information | |
| Single Asset / Portfolio: | Single Asset |
| Property Type: | Garden Multifamily |
| Collateral: | Fee Simple |
| Location: | Orlando, FL |
| Year Built / Renovated: | 1987 / 2011 |
| Total Units: | 288 |
| Property Management: | Greystar RS FL, LLC |
| Underwritten NOI: | $1,817,748 |
| Underwritten NCF: | $1,728,756 |
| Appraised Value: | $28,700,000 |
| Appraised Date: | June 30, 2015 |
| Historical NOI(4) | |
| Most Recent NOI: | $1,741,247 (T-12 June 30, 2015) |
| 2014 NOI: | $1,727,556 (December 31, 2014) |
| 2013 NOI: | $1,306,956 (T-12 September 30, 2013) |
| 2012 NOI: | NAV |
| Historical Occupancy(4) | |
| Most Recent Occupancy: | 95.1% (August 10, 2015) |
| 2014 Occupancy: | 93.8% (December 31, 2014) |
| 2013 Occupancy: | NAV |
| 2012 Occupancy: | NAV |
| (1) | A soft lockbox and cash management will be triggered (i) upon an event of default or (ii) if the DSCR falls below 1.15x until such time that the DSCR is at least 1.20x for two consecutive calendar quarters. |
| (2) | If certain identified required repairs are not completed by November 29, 2015, the borrower is required to deposit 125% of the estimated cost of the then-remaining required repairs, estimated (as of the loan closing date) to be $46,000. |
| (3) | Based on amortizing debt service payments. Based on the current interest only debt service payments, the Underwritten NOI DSCR and Underwritten NCF DSCR are 1.81x and 1.72x, respectively. |
| (4) | The sponsor acquired the property in December 2013; as such, Historical NOI and Occupancy are not available prior to September 2013. |
TRANSACTION HIGHLIGHTS |
| ■ | Property.Windrift Apartments is a Class B multifamily development located in Orlando, Florida. The property was constructed in 1987 and renovated in 2011, and contains 288 units in 17, two-story garden style buildings. As of May 2015, according to the borrower, it invested approximately $1.2 million ($4,259/unit) in capital expenditures at the property. Amenities at Windrift Apartments include a swimming pool and hot tub, tennis courts, racquetball courts, a picnic area, a clubhouse and a fitness center. One and two bedroom units vary in size from 567-760 sq. ft. and 912-1,077 sq. ft., respectively and unit amenities include fully equipped kitchens, washer and dryer hookups, walk in closets, balconies and tenant storage space. The property contains 532 surface parking spaces, which equates to a parking ratio of 1.85 spaces per unit. |
| ■ | Location/Market.Windrift Apartments is located in Orange County, within the greater Orlando metropolitan statistical area. The property is located approximately six miles east of downtown Orlando, 15 miles north of the greater Orlando International Airport and is accessible via State Road 417, State Road 408 and State Road 50. According to a market research report, as of Q1 2015, the Orlando apartment market contains 129,805 rental units across 554 buildings. 15% of that total inventory is located within the property’s submarket. Overall vacancy as of Q1 2015 was 5.5% for the greater Orlando apartment market and 6.1% for the property’s submarket and the average quoted market rents were $974/month and $993/month, respectively. According to the appraiser, a projected 2,619 units will be added to the submarket over the next five years. |
| ■ | Sponsor.Shaul Kopelowitz, the sponsor of the borrower and the non-recourse careveout guarantor, has over 20 years of experience in real estate investment, development and management with 5,410 multifamily units owned across six states. |
THE INFORMATION IN THIS STRUCTURAL AND COLLATERAL TERM SHEET IS NOT COMPLETE AND MAY BE AMENDED PRIOR TO THE TIME OF SALE. THIS TERM SHEET IS NOT AN OFFER TO SELL THESE SECURITIES AND IT IS NOT A SOLICITATION OF AN OFFER TO BUY THESE SECURITIES IN ANY JURISDICTION WHERE THE OFFER OR SALE IS NOT PERMITTED.
| 107 |
5003A & 5000-5007 Victory Boulevard Yorktown, VA 23693 | Collateral Asset Summary – Loan No. 13 Village Square at Kiln Creek | Cut-off Date Balance: Cut-off Date LTV: U/W NCF DSCR: U/W NOI Debt Yield: | $20,400,000 68.9% 1.43x 9.4% |
| Mortgage Loan Information | |
| Loan Seller: | KeyBank |
| Loan Purpose: | Refinance |
| Sponsor: | C. Torrey Breeden; A. Kent Little |
| Borrower: | Kiln Creek Shopping Center, L.L.C. |
| Original Balance: | $20,400,000 |
| Cut-off Date Balance: | $20,400,000 |
| % by Initial UPB: | 2.2% |
| Interest Rate: | 4.3400% |
| Payment Date: | 1stof each month |
| First Payment Date: | October 1, 2015 |
| Maturity Date: | September 1, 2025 |
| Amortization: | Interest only for first 12 months; 360 months thereafter |
| Additional Debt: | None |
| Call Protection: | L(25), D(91), O(4) |
| Lockbox / Cash Management(1): | Soft / Springing |
| Reserves | ||
| Initial | Monthly | |
| Taxes(2): | $23,511 | $5,878 |
| Insurance(3): | $0 | Springing |
| Replacement: | $4,450 | $4,450 |
| TI/LC(4): | $500,000 | $13,796 |
| Debt Service(5): | $0 | Springing |
| Kmart BK(6): | $0 | Springing |
| Financial Information | ||
| Cut-off Date Balance / Sq. Ft.: | $76 | |
| Balloon Balance / Sq. Ft.: | $63 | |
| Cut-off Date LTV: | 68.9% | |
| Balloon LTV: | 57.0% | |
| Underwritten NOI DSCR(7): | 1.57x | |
| Underwritten NCF DSCR(7): | 1.43x | |
| Underwritten NOI Debt Yield: | 9.4% | |
| Underwritten NCF Debt Yield: | 8.5% | |
| Property Information | |
| Single Asset / Portfolio: | Single Asset |
| Property Type: | Anchored Retail |
| Collateral: | Fee Simple |
| Location: | Yorktown, VA |
| Year Built / Renovated: | 1993 / 2015 |
| Total Sq. Ft.: | 267,021 |
| Property Management: | The Breeden Company, Inc. |
| Underwritten NOI: | $1,911,857 |
| Underwritten NCF: | $1,743,543 |
| Appraised Value: | $29,600,000 |
| Appraisal Date: | July 10, 2015 |
| Historical NOI | |
| Most Recent NOI: | $1,987,468 (T-12 June 30, 2015) |
| 2014 NOI: | $2,015,085 (December 31, 2014) |
| 2013 NOI: | $2,069,360 (December 31, 2013) |
| 2012 NOI: | $2,107,683 (December 31, 2012) |
| Historical Occupancy | |
| Most Recent Occupancy: | 97.2% (August 5, 2015) |
| 2014 Occupancy: | 97.2% (December 31, 2014) |
| 2013 Occupancy: | 97.2% (December 31, 2013) |
| 2012 Occupancy: | 98.6% (December 31, 2012) |
| (1) | In place cash management will be triggered upon (i) an event of default, (ii) any bankruptcy action of the borrower or property manager, (iii) the occurrence of a Kmart failure to renew event, (a “Renewal Event”), or (iv) the DSCR on a trailing three month basis falling below 1.20x (a “DSCR Event”). |
| (2) | In addition to the monthly deposits, the borrower will be required to deposit 1/12 of the annual taxes that are currently paid directly by Kmart into the tax reserve upon (i) an event of default, (ii) Kmart no longer paying all taxes directly, (iii) the borrower failing to provide evidence that taxes have been paid upon lender’s request or (iv) the Kmart lease no longer being in full force and effect. |
| (3) | If an acceptable blanket insurance policy is no longer in place, the borrower is required to deposit 1/12 of the annual premiums into the insurance reserve on a monthly basis. |
| (4) | TI/LC reserves are subject to a cap of $600,000. During the continuance of a cash sweep period due to a Renewal Event or a DSCR Event following either a Kmart go-dark event (a “Go-Dark Event”) or a Kmart bankruptcy event (a “Bankruptcy Event”), all excess cash will be deposited into the TI/LC reserve, subject to an increased cap of $875,000. During the continuance of a cash sweep period due to a Renewal Event, Go-Dark Event or a Bankruptcy Event, if the Kmart premises is leased per lender’s approval, then the cap of $875,000 will decrease to the modified rollover reserve cap, as defined in the loan documents. |
| (5) | Upon the occurrence of a DSCR Event following a Go-Dark Event or a Bankruptcy Event, all excess cash flow will be deposited into the TI/LC reserve until the cap has been reached and then into the Debt Service Reserve which is capped at $608,601. If a Bankruptcy Event occurs during a Cash Sweep Period due to a DSCR Event following a Go-Dark Event, within 30 days the borrower will be required to deposit cash or a letter of credit in an amount equal to the difference between $608,601 and the amount already on deposit in the Debt Service Reserve. |
| (6) | Provided no cash sweep period due to a DSCR Event following a Go-Dark Event is ongoing, within 30 days following a Bankruptcy Event the borrower is required to deposit cash or a letter of credit in an amount equal to $608,601 into the Kmart BK Reserve. The borrower will not be obligated to fund both the Debt Service Reserve and the Kmart BK Reserve upon the occurrence of a Bankruptcy Event. |
| (7) | Based on amortizing debt service payments. Based on the current interest only payments, the Underwritten NOI DSCR and Underwritten NCF DSCR are 2.13x and 1.94x, respectively. |
TRANSACTION HIGHLIGHTS |
| ■ | Tenancy.The property is anchored by Kmart Corporation (“Kmart”) and Kroger (rated Baa2/BBB/BBB by Moody’s/S&P/Fitch). Kmart occupies 36.9% of the NRA via a 25-year lease expiring November 30, 2018 with 10 five-year options, and Kroger occupies 34.6% of the NRA via a 20-year sublease with Kmart expiring September 30, 2033. Kroger invested approximately $11.5 million ($125 PSF) into their space and is projecting 2015 annual sales of approximately $45.0 million ($487 PSF). The property is 97.2% occupied by 18 tenants and has been over 97.0% occupied since 2012. Excluding the anchor tenants, no individual tenant occupies more than 7.3% of the NRA. |
| ■ | Market.The property is located in Yorktown, Virginia, along Victory Boulevard, approximately one mile east of Interstate 64 in an established in-fill location. Victory Boulevard is a main retail corridor for the surrounding area and has an average daily traffic count of 43,000. The submarket vacancy is 6.9%. The 2015 population within a five-mile radius of the property is 180,473 with estimated average household income of $78,930. |
| ■ | Sponsor.C. Torrey Breeden, a sponsor of the loan, is the Executive Vice President at The Breeden Company, a family-owned and operated real estate development company founded in 1961. The Breeden Company’s portfolio consists of 70 properties valued at approximately $990.7 million. |
THE INFORMATION IN THIS STRUCTURAL AND COLLATERAL TERM SHEET IS NOT COMPLETE AND MAY BE AMENDED PRIOR TO THE TIME OF SALE. THIS TERM SHEET IS NOT AN OFFER TO SELL THESE SECURITIES AND IT IS NOT A SOLICITATION OF AN OFFER TO BUY THESE SECURITIES IN ANY JURISDICTION WHERE THE OFFER OR SALE IS NOT PERMITTED.
| 108 |
Various Ocala, FL 34474 | Collateral Asset Summary – Loan No. 14 Ocala Portfolio - AHIP | Cut-off Date Balance: Cut-off Date LTV: U/W NCF DSCR: U/W NOI Debt Yield: | $19,000,000 61.3% 3.34x 16.1% |
| Mortgage Loan Information | |
| Loan Seller: | GACC |
| Loan Purpose: | Acquisition |
| Sponsor: | American Hotel Income Properties REIT Inc. |
| Borrower: | AHIP FL Ocala 3712 Properties LLC; AHIP FL Ocala 3712 Enterprises LLC; AHIP FL Ocala 4101 Properties LLC; AHIP FL Ocala 4101 Enterprises LLC; AHIP FL Ocala 3610 Properties LLC; AHIP FL Ocala 3610 Enterprises LLC |
| Original Balance: | $19,000,000 |
| Cut-off Date Balance: | $19,000,000 |
| % by Initial UPB: | 2.0% |
| Interest Rate: | 4.2100% |
| Payment Date: | 6thof each month |
| First Payment Date: | September 6, 2015 |
| Maturity Date: | August 6, 2025 |
| Amortization: | Interest Only |
| Additional Debt: | None |
| Call Protection(1): | L(26), D(90), O(4) |
| Lockbox / Cash Management(2): | Hard / Springing |
| Reserves | ||
| Initial | Monthly | |
| Taxes: | $197,032 | $21,892 |
| Insurance(3): | $0 | Springing |
| FF&E(4): | $0 | Springing |
| Required Repairs | $16,500 | NAP |
| PIP: | $3,170,000 | $0 |
| Financial Information | ||
| Cut-off Date Balance / Room: | $53,977 | |
| Balloon Balance / Room: | $53,977 | |
| Cut-off Date LTV: | 61.3% | |
| Balloon LTV: | 61.3% | |
| Underwritten NOI DSCR: | 3.77x | |
| Underwritten NCF DSCR: | 3.34x | |
| Underwritten NOI Debt Yield: | 16.1% | |
| Underwritten NCF Debt Yield: | 14.3% | |
| Property Information | |
| Single Asset / Portfolio: | Portfolio of three properties |
| Property Type: | Limited Service Hospitality |
| Collateral: | Fee Simple |
| Location: | Ocala, FL |
| Year Built / Renovated: | Various |
| Total Rooms: | 352 |
| Property Management: | One FL Ocala CY Management LLC; One FL Ocala FI Management LLC; One FL Ocala RI Management LLC |
| Underwritten NOI: | $3,057,634 |
| Underwritten NCF: | $2,711,748 |
| Appraised Value: | $31,000,000 |
| Appraisal Date: | June 1, 2015 |
| Historical NOI | |
| Most Recent NOI: | $3,358,140 (T-12 April 30, 2015) |
| 2014 NOI: | $2,966,280 (December 31, 2014) |
| 2013 NOI: | $2,251,470 (December 31, 2013) |
| 2012 NOI: | $2,225,230 (December 31, 2012) |
| Historical Occupancy | |
| Most Recent Occupancy: | 61.6% (April 30, 2015) |
| 2014 Occupancy: | 59.7% (December 31, 2014) |
| 2013 Occupancy: | 55.4% (December 31, 2013) |
| 2012 Occupancy: | 55.5% (December 31, 2012) |
| (1) | Any time after the expiration of the lockout period the borrowers may obtain the release of an individual property upon a bona fide third-party sale provided, among other things, (i) no event of default has occurred and is continuing, (ii) if the debt yield for the remaining properties is less than 15% then the LTV for the remaining properties may not exceed the lesser of the LTV immediately preceding such release and 61.3%, (iii) the DSCR for the remaining properties is not less than the greater of the DSCR immediately preceding the partial release and 2.30x and (iv) borrowers partially defease to lender 110% of the allocated loan amount for the released property. |
| (2) | Cash management will be triggered (i) upon an event of default or (ii) if the DSCR falls below 1.20x until such time that the DSCR is at least 1.20x for two consecutive calendar quarters. |
| (3) | The borrowers will be required to deposit 1/12 of the annual insurance premiums into an insurance reserve if an acceptable blanket policy is no longer in place. |
| (4) | FF&E reserves will be waived until the payment date in August 2017. Commencing on the monthly payment date in August 2017, the borrowers are required to make monthly deposits in an amount equal to the greater of 1/12 of 4.0% of such year’s annual rents and the then required amount under the franchise agreement, provided that in lieu of monthly reserves, the borrowers may deliver to the lender a letter of credit in an amount equal to 4.0% of prior year’s gross revenues. |
TRANSACTION HIGHLIGHTS |
| ■ | Property.Ocala Portfolio - AHIP consists of three limited service, Marriott International, Inc. franchised hotel properties containing a total of 352 guestrooms and located in Ocala, Florida. The properties in the portfolio are each three stories and include the 169-room Courtyard Ocala that opened in 1988, the 87-room Residence Inn Ocala that opened in 2007, and the 96-room Fairfield Inn & Suites Ocala that opened in 1998. The loan is structured with a $3,170,000 property improvement plan, of which $3,095,000 is allocated to the Courtyard Ocala property, with $2,785,500 appropriated for hard costs and $309,500 for soft costs, and the remainder $75,000 is allocated to Fairfield Inn & Suites Ocala, with $67,500 appropriated for hard costs and $7,500 soft costs. |
| ■ | Performance.Based on an April 2015 industry report, the portfolio’s T-12 ADR, RevPAR and occupancy were $103.37, $63.71 and 61.6%, respectively. The RevPAR penetration rates over the same time period were 78.1% for Courtyard Ocala, 112.4% for Residence Inn Ocala and 90.0% for Fairfield Inn & Suites Ocala. |
| ■ | Market.The hotels are each located at the intersection of I-75 and Southwest College Road in Ocala, Florida, within a 0.6 mile radius of each other and approximately 40 miles south of Gainesville and 80 miles north of Orlando. The region is a major retiree and tourist destination and as the baby boomer population retires, the region is expected to see strong gains in consumer services (including leisure/hospitality) and healthcare demand. In addition to the retirement and traveler demand, the area has several corporate headquarters and major regional offices, including Lockheed Martin, AT&T, Signature Brands and K-Mart. In addition, Ocala is considered the “horse capital of the world” with over 1,200 horse farms, which employ over 44,000 individuals and generate over $2.2 billion in annual revenue for the county. |
| ■ | Sponsorship.The sponsor of the borrowers and the non-recourse carve-out guarantor is American Hotel Income Properties REIT Inc., which is the United States holding company for all of American Hotel Income Properties REIT LP’s (“AHIP”) US assets. AHIP is traded on the Toronto Exchange under the symbol HOT-UN.TO. AHIP indirectly owns and acquires hotel properties in the United States. The portfolio is comprised of 78 hotel properties that provide railway crew accommodation and 24-hour food service in 27 states. The branded portfolio consists of 35 hotels and 3,331 guestrooms and is affiliated with the world’s largest hotel brands. As of June 30, 2015, American Hotel Income Properties REIT Inc. had a net worth of approximately $235.9 million and liquidity of $31.0 million. |
THE INFORMATION IN THIS STRUCTURAL AND COLLATERAL TERM SHEET IS NOT COMPLETE AND MAY BE AMENDED PRIOR TO THE TIME OF SALE. THIS TERM SHEET IS NOT AN OFFER TO SELL THESE SECURITIES AND IT IS NOT A SOLICITATION OF AN OFFER TO BUY THESE SECURITIES IN ANY JURISDICTION WHERE THE OFFER OR SALE IS NOT PERMITTED.
| 109 |
| 2400 Cascade Pointe Boulevard, Charlotte, NC 28208 | Collateral Asset Summary – Loan No. 15 Hilton Garden Inn Charlotte Airport | Cut-off Date Balance: Cut-off Date LTV: U/W NCF DSCR: U/W NOI Debt Yield: | $18,475,793 64.8% 1.92x 12.9% |
| Mortgage Loan Information | |
| Loan Seller: | BNYM |
| Loan Purpose: | Refinance |
| Sponsor: | Ashok Patel; Surendra Patel |
| Borrower: | Naman Lakepointe, LLC |
| Original Balance: | $18,500,000 |
| Cut-off Date Balance: | $18,475,793 |
| % by Initial UPB: | 2.0% |
| Interest Rate: | 4.5350% |
| Payment Date: | 6thof each month |
| First Payment Date: | October 6, 2015 |
| Maturity Date: | September 6, 2025 |
| Amortization: | 360 months |
| Additional Debt: | None |
| Call Protection: | L(25), D(91), O(4) |
| Lockbox / Cash Management(1): | Springing Hard / Springing |
| Reserves | ||
| Initial | Monthly | |
| Taxes: | $112,489 | $11,841 |
| Insurance: | $4,739 | $1,185 |
| FF&E: | $18,360 | 1/12 of 4.0% of prior year’s gross revenues |
| Financial Information | ||
| Cut-off Date Balance / Room: | $157,913 | |
| Balloon Balance / Room: | $128,000 | |
| Cut-off Date LTV: | 64.8% | |
| Balloon LTV: | 52.5% | |
| Underwritten NOI DSCR: | 2.11x | |
| Underwritten NCF DSCR: | 1.92x | |
| Underwritten NOI Debt Yield: | 12.9% | |
| Underwritten NCF Debt Yield: | 11.7% | |
| Property Information | |
| Single Asset / Portfolio: | Single Asset |
| Property Type: | Select Service Hospitality |
| Collateral: | Fee Simple |
| Location: | Charlotte, NC |
| Year Built / Renovated: | 2013 / NAP |
| Total Rooms: | 117 |
| Property Management: | Naman Management, LLC |
| Underwritten NOI: | $2,388,321 |
| Underwritten NCF: | $2,163,872 |
| Appraised Value: | $28,500,000 |
| Appraisal Date: | June 18, 2015 |
| Historical NOI(2) | |
| Most Recent NOI: | $2,396,114 (T-12 August 31, 2015) |
| 2014 NOI: | $1,726,805 (December 31, 2014) |
| 2013 NOI: | NAP |
| 2012 NOI: | NAP |
| Historical Occupancy(2) | |
| Most Recent Occupancy: | 85.0% (August 31, 2015) |
| 2014 Occupancy: | 73.1% (December 31, 2014) |
| 2013 Occupancy: | NAP |
| 2012 Occupancy: | NAP |
| (1) | A hard lockbox and in place cash management will be triggered upon (i) an event of default or (ii) the failure by the borrower to maintain a DSCR of at least 1.15x, until such time as the DSCR is at least 1.20x for two consecutive calendar quarters. |
| (2) | The property was opened in 2013 and as such, Historical NOI and Historical Occupancy are not available. |
TRANSACTION HIGHLIGHTS |
| ■ | Property. The Hilton Garden Inn Charlotte Airport is a select service 117-room hotel in Charlotte, North Carolina that was developed in 2013. The property offers studio rooms and 2-room suites set within a corporate office park among lakes, jogging trails, and gardens. Each room includes high speed internet, 42-inch flat screen televisions with complimentary HBO, a work desk, and Serta Suite Dreams bedding and non-allergenic feather pillows. The property features a 24-hour business center, a fitness center, an outdoor pool, The Pavilion Pantry, which sells sundries, beverages and ready-to-cook meals, and guest laundry facilities. The property’s restaurant, the Garden Grill and Bar, serves breakfast, lunch and dinner. The property operates pursuant to a Hilton brand franchise agreement that expires in October 2029. |
| ■ | Location.The property is located in Charlotte, North Carolina in a primarily commercial and industrial neighborhood. There are residential developments scattered throughout the neighborhood off of main thoroughfares. The property is less than five miles southeast of the Charlotte Douglas International Airport, which is the primary demand generator in the immediate area. The property is accessible by a number of regional throughways, including Interstate 77 and Interstate 485. The property is adjacent to an on-ramp for Interstate 77, which provides access to downtown Charlotte. |
| ■ | Sponsor.Ashok Patel and Surendra Patel co-founded Naman Hotels (“Naman”), an owner, operator and manager of restaurants and hotels in the Southeastern United States, in 1978. Naman currently owns and manages 19 hotels, containing more than 1,950 guest rooms, and has offices in South Carolina and Georgia. Ashok Patel is the Chief Executive Officer of Naman Hotels with 35 years’ experience in the hospitality industry and has completed training programs for Hilton Hotels, Marriot Hotels, InterContinental Hotels Group, Choice Hotels, and Denny’s Restaurants. Surendra Patel is the Director of Real Estate and Construction and is currently responsible for acquisitions, purchasing and construction and renovation projects. |
| ■ | Performance.For the trailing 12-month period ending August 31, 2015, the Hilton Garden Inn Charlotte Airport property reported occupancy, ADR and RevPAR of 85.0%, $135.06 and $114.77, respectively. According to a third party market research firm, the property competitive set reported occupancy, ADR and RevPAR of 84.3%, $120.85 and $101.91, respectively, as of June 2015. |
THE INFORMATION IN THIS STRUCTURAL AND COLLATERAL TERM SHEET IS NOT COMPLETE AND MAY BE AMENDED PRIOR TO THE TIME OF SALE. THIS TERM SHEET IS NOT AN OFFER TO SELL THESE SECURITIES AND IT IS NOT A SOLICITATION OF AN OFFER TO BUY THESE SECURITIES IN ANY JURISDICTION WHERE THE OFFER OR SALE IS NOT PERMITTED.
| 110 |
| Various | Collateral Asset Summary – Loan No. 16 GSP MHP Portfolio I | Cut-off Date Balance: Cut-off Date LTV: U/W NCF DSCR: U/W NOI Debt Yield: | $17,927,306 74.9% 1.29x 8.2% |
| Mortgage Loan Information | |
| Loan Seller: | CCRE |
| Loan Purpose: | Refinance |
| Sponsor(1): | Frank T. Perano |
| Borrowers: | Cedar Manor Management, LLC; Indian Creek Village Management, LLC |
| Original Balance: | $17,950,000 |
| Cut-off Date Balance: | $17,927,306 |
| % by Initial UPB: | 1.9% |
| Interest Rate: | 4.7235% |
| Payment Date: | 6thof each month |
| First Payment Date: | October 6, 2015 |
| Maturity Date: | September 6, 2025 |
| Amortization: | 360 months |
| Additional Debt: | None |
| Call Protection(2): | L(25), D(92), O(3) |
| Lockbox / Cash Management(3): | Soft / Springing |
| Reserves | ||
| Initial | Monthly | |
| Taxes: | $152,182 | $21,740 |
| Insurance(4): | $0 | Springing |
| Replacement: | $0 | $2,167 |
| Required Repairs: | $3,188 | NAP |
| Sewer Charges: | $360,614 | $0 |
| Financial Information | ||
| Cut-off Date Balance / Pad: | $35,152 | |
| Balloon Balance / Pad: | $28,675 | |
| Cut-off Date LTV: | 74.9% | |
| Balloon LTV: | 61.1% | |
| Underwritten NOI DSCR: | 1.31x | |
| Underwritten NCF DSCR: | 1.29x | |
| Underwritten NOI Debt Yield: | 8.2% | |
| Underwritten NCF Debt Yield: | 8.0% | |
| Property Information | |
| Single Asset / Portfolio: | Portfolio of two properties |
| Property Type: | Manufactured Housing Community |
| Collateral: | Fee Simple |
| Location: | Various, PA |
| Year Built / Renovated: | 1970, 2001, 2004 / NAP |
| Total Pads: | 510 |
| Property Management: | GSP Management Co. |
| Underwritten NOI: | $1,465,669 |
| Underwritten NCF: | $1,439,664 |
| Appraised Value: | $23,950,000 |
| Appraisal Date: | June 26, 2015 |
| Historical NOI | |
| Most Recent NOI: | $1,478,861 (T-12 June 30, 2015) |
| 2014 NOI: | $1,247,462 (December 31, 2014) |
| 2013 NOI: | $1,413,333 (December 31, 2013) |
| 2012 NOI: | $1,310,556 (December 31, 2012) |
| Historical Occupancy | |
| Most Recent Occupancy: | 86.3% (July 9, 2015) |
| 2014 Occupancy: | 87.0% (December 31, 2014) |
| 2013 Occupancy: | 87.6% (December 31, 2013) |
| 2012 Occupancy: | 88.2% (December 31, 2012) |
| (1) | The sponsor is also the sponsor of the mortgage loan secured by the mortgaged property identified on Annex A-1 to the Free Writing Prospectus as Brookhaven MHP, which mortgage loan represents approximately 0.8% of the initial pool balance. For additional information, see “Risk Factors—Risks Related to the Mortgage Loans—Risks Related to Litigation and Condemnation” in the free writing prospectus. |
| (2) | On any date after the expiration of the lockout period and prior to the open prepayment date, the borrowers may obtain the release of the Cedar Manor MHP property upon a bona fide third-party sale provided, among other things, (i) the LTV for the Indian Creek Village property does not exceed the lesser of the LTV immediately preceding such sale and 75.0%, (ii) the DSCR for the Indian Creek Village property is not less than the greater of the DSCR immediately preceding the sale and 1.30x and (iii) borrowers partially defease to lender a release amount equal to the greater of (a) 120% of the allocated loan amount for the Cedar Manor MHP property (which ALA is equal to $8,880,000) and (b) 100% of the net sales proceeds. |
| (3) | In place cash management will be triggered upon the occurrence of (i) an event of default, (ii) any bankruptcy action of the borrowers, guarantor or property manager, (iii) failure by the borrowers, after the end of two calendar quarters to maintain a debt service coverage ratio of at least 1.10x, until the debt service coverage ratio is at least 1.25x for four consecutive quarters. |
| (4) | The borrowers will be required to deposit 1/12 of the annual insurance premiums into the insurance account (i) upon an event of default, (ii) if an acceptable blanket insurance policy is no longer in place or (iii) if the borrowers fail to provide evidence of the payment of all insurance premiums. |
TRANSACTION HIGHLIGHTS |
| ■ | Portfolio.GSP MHP Portfolio I is a portfolio of two manufactured housing communities located in Macungie and Elizabethtown, Pennsylvania. The portfolio contains a total of 510 pads that are 86.3% occupied as of July 9, 2015; 194 pads (99.5% occupied) at the Indian Creek Village property and 316 pads (78.2% occupied) at the Cedar Manor MHP property. |
| ■ | Occupancy History. GSP MHP Portfolio I has maintained a weighted average occupancy of 91.9% since 2006. |
| ■ | Market & Location.The Indian Creek Village property is located in Macungie, Pennsylvania within Lehigh County. The property is accessible via I-76, which is located three miles to the north. The Indian Creek Village property is located approximately 8.5 miles southwest of Allentown and 50 miles north of Philadelphia. As of the 2010 census, the Lehigh Valley region had a population of 821,623 and is the fastest growing and third most populous region in Pennsylvania. Allentown is home to several global manufacturing companies such as Mack Trucks, PPL and Air Products. The Cedar Manor MHP property is located in Elizabethtown, Pennsylvania, within the Harrisburg-York-Lebanon combined statistical area. As of the 2010 census, the Harrisburg-York-Lebanon combined statistical area had a population of 1,233,708. Since Harrisburg is the state capital, the economy is driven by the government as well as companies in the private sector such as IBM, Hershey Foods and Rite Aid Corporation. |
| ■ | Sponsor.Frank T. Perano has over 30 years of experience owning and operating manufactured housing communities throughout Pennsylvania and Delaware. His manufactured housing portfolio consists of over 10,000 pads across 72 properties. |
THE INFORMATION IN THIS STRUCTURAL AND COLLATERAL TERM SHEET IS NOT COMPLETE AND MAY BE AMENDED PRIOR TO THE TIME OF SALE. THIS TERM SHEET IS NOT AN OFFER TO SELL THESE SECURITIES AND IT IS NOT A SOLICITATION OF AN OFFER TO BUY THESE SECURITIES IN ANY JURISDICTION WHERE THE OFFER OR SALE IS NOT PERMITTED.
| 111 |
1151 Maple Avenue & 158 Santee Street Los Angeles, CA 90015 | Collateral Asset Summary – Loan No. 17 A&H Pacific | Cut-off Date Balance: Cut-off Date LTV: U/W NCF DSCR: U/W NOI Debt Yield: | $17,600,000 61.1% 1.69x 10.0% |
| Mortgage Loan Information | |
| Loan Seller: | GACC |
| Loan Purpose: | Refinance |
| Sponsor: | Moshe Aflalo; Efrem Harkham; Uri Harkham |
| Borrower(1): | 1151 Maple-1-AHPP, LLC; 1151 Maple-37.125-EHS, LLC; 1151 Maple-37.125 HFE, LLC; 1151 Maple-24.75-1151MA, LLC |
| Original Balance: | $17,600,000 |
| Cut-off Date Balance: | $17,600,000 |
| % by Initial UPB: | 1.9% |
| Interest Rate: | 4.1600% |
| Payment Date: | 6thof each month |
| First Payment Date: | October 6, 2015 |
| Maturity Date: | September 6, 2025 |
| Amortization: | Interest only for first 60 months; 360 months thereafter |
| Additional Debt: | None |
| Call Protection: | L(25), D(91), O(4) |
| Lockbox / Cash Management(2): | Soft Springing Hard / Springing |
| Reserves | ||
| Initial | Monthly | |
| Taxes: | $66,752 | $8,344 |
| Insurance(3): | $0 | Springing |
| Replacement(4): | $0 | $249 |
| TI/LC(4): | $25,000 | $2,083 |
| Required Repairs: | $27,500 | NAP |
| Financial Information | ||
| Cut-off Date Balance / Sq. Ft.: | $530 | |
| Balloon Balance / Sq. Ft.: | $482 | |
| Cut-off Date LTV: | 61.1% | |
| Balloon LTV: | 55.6% | |
| Underwritten NOI DSCR(5): | 1.72x | |
| Underwritten NCF DSCR(5): | 1.69x | |
| Underwritten NOI Debt Yield: | 10.0% | |
| Underwritten NCF Debt Yield: | 9.9% | |
| Property Information | |
| Single Asset / Portfolio: | Single Asset |
| Property Type: | Unanchored Retail |
| Collateral: | Fee Simple |
| Location: | Los Angeles, CA |
| Year Built / Renovated: | 1981, 1985 / NAP |
| Total Sq. Ft.: | 33,202 |
| Property Management: | A&H Management |
| Underwritten NOI: | $1,767,586 |
| Underwritten NCF: | $1,739,598 |
| Appraised Value: | $28,800,000 |
| Appraisal Date: | April 15, 2015 |
| Historical NOI | |
| Most Recent NOI: | $1,893,064 (T-12 June 30, 2015) |
| 2014 NOI: | $1,900,957 (December 31, 2014) |
| 2013 NOI: | $1,895,989 (December 31, 2013) |
| 2012 NOI: | $1,799,694 (December 31,2012) |
| Historical Occupancy | |
| Most Recent Occupancy: | 96.2% (July 1, 2015) |
| 2014 Occupancy: | 99.9% (December 31, 2014) |
| 2013 Occupancy: | 99.9% (December 31, 2013) |
| 2012 Occupancy: | 100.0% (December 31, 2012) |
| (1) | The borrowers, 1151 Maple-1-AHPP, LLC, 1151 Maple-37.125-EHS, LLC, 1151 Maple-37.125 HFE, LLC and 1151 Maple-24.75-1151MA, LLC, are structured as tenants-in-common. |
| (2) | A hard lockbox and in place cash management will be triggered (i) upon an event of default or (ii) if the DSCR falls below 1.15x until such time that the DSCR is at least 1.20x for two consecutive calendar quarters. |
| (3) | If an acceptable blanket insurance policy is no longer in place, the borrowers are required to deposit 1/12 of the annual insurance premiums into the insurance reserve account on a monthly basis. |
| (4) | Replacement reserves and TI/LC reserves are subject to caps of $37,000 and $50,000, respectively. |
| (5) | Based on amortizing debt service payments. Based on the current interest only debt service payments, the Underwritten NOI DSCR and UW NCF DSCR are 2.38x and 2.34x, respectively. |
TRANSACTION HIGHLIGHTS |
| ■ | Property. A&H Pacific is a 33,202 sq. ft. retail strip center comprised of two retail buildings, totaling 19,202 sq. ft. and 14,000 sq. ft. of rooftop parking space, located along East 12th Street between Santee Street and Maple Avenue in the fashion district of downtown Los Angeles. The two buildings face each other along Santee Alley, a pedestrian only shopping alley made popular by the its fashion retailers. The buildings were constructed in 1981 and 1985 and are currently 96.2% occupied as of July 1, 2015 by 22 tenants (including the 14,000 sq. ft. parking lease). The rooftop parking lot contains 64 parking spaces, which equates to a parking ratio of 3.3 spaces per 1,000 sq. ft. of retail space, and is leased out to a third party parking operator. |
| ■ | Location/Market.A&H Pacific is located in the fashion district of Los Angeles, specifically within the Santee Alley shopping center. Wholesale distribution of fashion and accessories drives economic activity in the area, supporting a network of design rooms, warehouses and showrooms. The fashion district contains over 2,800 businesses with approximately 14,600 employees. According to the appraiser, the estimated 2015 population within a one, three and five-mile radius are 50,034, 582,255 and 1,308,435, respectively and 2015 median household incomes are $24,698, $28,427 and $32,771, respectively. The appraiser identified eight comparable retail properties within a 0.2 mile radius of A&H Pacific that ranged in occupancy from 90.0% to 100.0%. No new inventory has been added to the fashion district since 2008 and no new supply is expected in the near future. |
THE INFORMATION IN THIS STRUCTURAL AND COLLATERAL TERM SHEET IS NOT COMPLETE AND MAY BE AMENDED PRIOR TO THE TIME OF SALE. THIS TERM SHEET IS NOT AN OFFER TO SELL THESE SECURITIES AND IT IS NOT A SOLICITATION OF AN OFFER TO BUY THESE SECURITIES IN ANY JURISDICTION WHERE THE OFFER OR SALE IS NOT PERMITTED.
| 112 |
| Various | Collateral Asset Summary – Loan No. 18 WHG Extended Stay Portfolio | Cut-off Date Balance: Cut-off Date LTV: U/W NCF DSCR: U/W NOI Debt Yield: | $15,500,000 70.5% 1.95x 13.7% |
| Mortgage Loan Information | |
| Loan Seller: | BNYM |
| Loan Purpose: | Recapitalization |
| Sponsor: | R-Roof Assets LLC |
| Borrower: | WHG SU Montgomery LLC; WHG SU Louisville LLC; WHG SU Alexandria LLC; WHG SU Columbia LLC; WHG SU Gainesville LLC |
| Original Balance: | $15,500,000 |
| Cut-off Date Balance: | $15,500,000 |
| % by Initial UPB: | 1.7% |
| Interest Rate: | 4.7600% |
| Payment Date: | 6thof each month |
| First Payment Date: | November 6, 2015 |
| Maturity Date: | October 6, 2020 |
| Amortization: | 360 months |
| Additional Debt: | None |
| Call Protection(1): | L(24), D(32), O(4) |
| Lockbox / Cash Management(2): | Springing Hard / Springing |
| Reserves | ||
| Initial | Monthly | |
| Taxes: | $140,352 | $20,050 |
| Insurance(3): | $0 | Springing |
| FF&E(4): | $100,000 | 1/12 of 4.0% of gross revenues |
| Financial Information | ||
| Cut-off Date Balance / Room: | $28,336 | |
| Balloon Balance / Room: | $26,041 | |
| Cut-off Date LTV: | 70.5% | |
| Balloon LTV: | 64.7% | |
| Underwritten NOI DSCR: | 2.19x | |
| Underwritten NCF DSCR: | 1.95x | |
| Underwritten NOI Debt Yield: | 13.7% | |
| Underwritten NCF Debt Yield: | 12.2% | |
| Property Information | |
| Single Asset / Portfolio: | Portfolio of five properties |
| Property Type: | Extended Stay Hospitality |
| Collateral: | Fee Simple |
| Location: | Various |
| Year Built / Renovated: | Various / 2014 |
| Total Rooms: | 547 |
| Property Management: | Suburban Management LLC |
| Underwritten NOI: | $2,128,266 |
| Underwritten NCF: | $1,893,838 |
| Appraised Value: | $22,000,000 |
| Appraisal Date: | Various |
| Historical NOI | |
| Most Recent NOI: | $2,110,177 (T-12 June 30, 2015) |
| 2014 NOI: | $1,759,964 (December 31, 2014) |
| 2013 NOI(5): | NAP |
| 2012 NOI(5): | NAP |
| Historical Occupancy | |
| Most Recent Occupancy: | 73.1% (July 31, 2015) |
| 2014 Occupancy: | 68.9% (December 31, 2014) |
| 2013 Occupancy: | 61.0% (December 31, 2013) |
| 2012 Occupancy(5): | NAP |
| (1) | Any time after the lockout period ends and prior to the open date, the borrowers may release a property, provided, among other things per the loan documents, (i) no event of default has occurred and is continuing, (ii) borrowers shall defease a portion of the loan equal to the greater of (A) (a) 125% of the Amortized Allocated Loan Amount or (b) 100% of Net Sales Proceeds with respect to such Individual Property, (B) the DSCR for the remaining properties is no less than the greater of 1.25x and the DSCR immediately preceding such release, (C) the LTV for the remaining properties is no greater than 70.0% and (D) the Debt Yield for the remaining properties is no less than 12.0%. |
| (2) | A hard lockbox and in place cash management will be triggered (i) upon an event of default or (ii) if the DSCR falls below 1.15x after the end of any calendar quarter until such time that the DSCR is at least 1.20x for two consecutive quarters. |
| (3) | Upon notice from the lender, the borrower will be required to deposit 1/12 of the annual insurance premiums into an insurance reserve account if (i) an event of default has occurred, (ii) an acceptable blanket insurance policy is no longer in place, (iii) the borrower fails to provide evidence of renewal of insurance or (iv) borrower fails to provide evidence that the insurance premiums have been paid. |
| (4) | The borrower is required to deposit monthly the greater of (i) 1/12 of 4.0% of gross revenues of the month that is two months prior to such date, (ii) any amount required under the franchise agreement for FF&E and (iii) $15,000. |
| (5) | The sponsor purchased the properties in 2013. As such, Historical NOI and Historical Occupancy are not available. |
TRANSACTION HIGHLIGHTS |
| ■ | Properties. The WHG Extended Stay Portfolio is comprised of five extended stay hotels totaling 547 rooms located in five states, predominately throughout the southeastern US. The typical amenity package consists of an outdoor swimming pool, fitness center, and business center. Each property consists of a single three- to four-story building. |
| ■ | Location.Sun Suites Louisville is an approximately 18-year-old, 141-guestroom, three-story hotel complex located at, 4540 Taylorsville Road, Louisville, Kentucky. Sun Suites Gainesville is an approximately 15-year-old, 110-guestroom, four-story hotel complex located at 1115 Jesse Jewell Parkway Southwest, Gainesville, Georgia. Sun Suites Alexandria is an approximately 10-year-old, 113-guestroom, four -story hotel complex located at 1000 MacArthur Road, Alexandria, Louisiana. HomeTowne Suites Columbia is an approximately 16-year-old, 88-guestroom, three-story hotel complex located at, 350 Columbiana Drive, Columbia, South Carolina. HomeTowne Suites Montgomery is an approximately 17-year-old, 95-guestroom, three-story hotel complex located at, 5047 Carmichael Road, Montgomery, Alabama. Three properties operate under the Sun Suites flag and two properties operate under the HomeTowne Suites flag. The properties have new five-year franchise agreements, with successive five-year renewal terms unless earlier terminated. |
| ■ | Sponsor.The sponsor is R-Roof Assets LLC, an affiliate of Westmont Hospitality Group (“Westmont”). Westmont is a large privately-held hospitality organization and currently operates over 500 hotels across three continents. Since 1976, Westmont has co-owned and through its subsidiaries, operated more than 800 hotels in North America. Currently, Westmont has ownership interests in excess of 400 hotels across North America, with approximately 85,000 rooms. |
| ■ | Performance.For the trailing 12-month period ending June 2015, the WHG Extended Stay Portfolio reported occupancy, ADR and RevPAR of 73.2%, $39.27 and $28.74, respectively. |
THE INFORMATION IN THIS STRUCTURAL AND COLLATERAL TERM SHEET IS NOT COMPLETE AND MAY BE AMENDED PRIOR TO THE TIME OF SALE. THIS TERM SHEET IS NOT AN OFFER TO SELL THESE SECURITIES AND IT IS NOT A SOLICITATION OF AN OFFER TO BUY THESE SECURITIES IN ANY JURISDICTION WHERE THE OFFER OR SALE IS NOT PERMITTED.
| 113 |
| Various, MA | Collateral Asset Summary – Loan No. 19 Greater Boston Industrial Portfolio I | Cut-off Date Balance: Cut-off Date LTV: U/W NCF DSCR: U/W NOI Debt Yield: | $15,500,000 73.5% 1.26x 9.4% |
| Mortgage Loan Information | |
| Loan Seller: | CCRE |
| Loan Purpose: | Acquisition |
| Sponsor: | Christopher J. Knisley; Mark J. McInerney |
| Borrower: | Albany Road-Technology LLC; Albany Road-South LLC; Albany Road-Sunnyslope LLC |
| Original Balance: | $15,500,000 |
| Cut-off Date Balance: | $15,500,000 |
| % by Initial UPB: | 1.7% |
| Interest Rate: | 4.9030% |
| Payment Date: | 6thof each month |
| First Payment Date: | October 6, 2015 |
| Maturity Date: | September 6, 2025 |
| Amortization: | Interest only for first 60 months; 300 months thereafter |
| Additional Debt: | None |
| Call Protection: | L(25), D(90), O(5) |
| Lockbox / Cash Management(1): | Soft / Springing |
| Reserves | ||
| Initial | Monthly | |
| Taxes: | $63,857 | $31,928 |
| Insurance: | $6,133 | $2,044 |
| Replacement(2): | $1,050,000 | Springing |
| TI/LC(3): | $1,010,771 | Springing |
| Required Repairs: | $38,125 | NAP |
| Financial Information | ||
| Cut-off Date Balance / Sq. Ft.: | $56 | |
| Balloon Balance / Sq. Ft.: | $50 | |
| Cut-off Date LTV: | 73.5% | |
| Balloon LTV: | 65.2% | |
| Underwritten NOI DSCR(4): | 1.36x | |
| Underwritten NCF DSCR(4): | 1.26x | |
| Underwritten NOI Debt Yield: | 9.4% | |
| Underwritten NCF Debt Yield: | 8.7% | |
| Property Information | |
| Single Asset / Portfolio: | Portfolio of three properties |
| Property Type: | Industrial / Various |
| Collateral: | Fee Simple |
| Location: | Various, MA |
| Year Built / Renovated: | Various |
| Total Sq. Ft.: | 275,441 |
| Property Management: | Albany Road Asset Services; CB Richard Ellis-N.E. Partners, LP |
| Underwritten NOI: | $1,463,059 |
| Underwritten NCF: | $1,352,883 |
| Appraised Value: | $21,100,000 |
| Appraisal Date: | Various |
| Historical NOI | |
| Most Recent NOI: | $1,530,390 (T-12 May 31, 2015) |
| 2014 NOI: | $1,503,339 (December 31, 2014) |
| 2013 NOI: | $1,436,413 (December 31, 2013) |
| Historical Occupancy | |
| Most Recent Occupancy: | 100.0% (August 25, 2015) |
| 2014 Occupancy: | 100.0% (December 31, 2014) |
| 2013 Occupancy: | 100.0% (December 31, 2013) |
| 2012 Occupancy: | 100.0% (December 31, 2012) |
| (1) | In place cash management and an excess cash trap will commence in the occurrence of (i) the event of default, (ii) if the DSCR falls below a 1.15x for two consecutive quarters or (iii) the earliest to occur of (a) the date upon which EBP and/or Hutchinson gives notice to terminate their respective lease(s), (b) the date EBP and/or Hutchinson delivers notice to not renew their respective leases, or (c) twelve months prior to the then current expiration date of the EBP and/or Hutchinson leases. |
| (2) | Replacement reserves are subject to a cap of $100,000. Upon the reserve balance being less than $100,000, the borrower will be required to make monthly deposits of $2,295 to be due for replacements and repairs required to be made to the property during the calendar year. |
| (3) | TI/LC reserves are subject to a cap $300,000. Upon the reserve balance being less than or equal to $150,000, the borrower will be required to make monthly deposits of $6,886 into the Rollover Reserve on each payment date, which shall be held by Lender for approved leasing expenses incurred following the date hereof. |
| (4) | Based on amortizing debt service payments. Based on the current interest only payments, Underwritten NOI DSCR and Underwritten NCF DSCR are 1.90x and 1.76x, respectively. |
TRANSACTION HIGHLIGHTS |
| ■ | Portfolio.Greater Boston Industrial Portfolio I consists of three cross-collateralized, cross-defaulted, flex and warehouse/distribution industrial properties in the greater Boston area. The properties in the portfolio combine for 275,441 sq. ft., and are currently 100% occupied as of August 25th, 2015. Two of the three properties are single tenant. 65 Sunnyslope Avenue (153,641 sq. ft.) is occupied by Eastern Bag & Paper Co. and is located in Tewksbury, Massachusetts. 82 South Street (70,600 sq. ft.), is occupied by Hutchinson Aerospace & Industry, Inc. and located in Hopkinton, Massachusetts. The third property, 19 Technology Drive (51,200 sq. ft.), is located in Auburn, Massachusetts. Its two tenants, Accelerated Media Technologies, Inc. and Harrell’s Turf Specialty, LLC, consist of 27,200 and 24,000 sq. ft. respectively. |
| ■ | Strong Market.The portfolio is located just outside of Boston within the Route 495-Mass Pike West & Route 3 North submarkets that have average occupancies of 83.2% and 85.1%, respectively as of Q2 2015. |
| ■ | Consistent Occupancy.The properties are currently 100.0% leased and have maintained an average occupancy of 100.0% since 2012. Eastern Bag & Paper Co. and Hutchinson Aerospace & Industry, Inc., the portfolio’s two largest tenants, have occupied their buildings since 2006 and 2005, respectively. Both of their leases have been extended for terms of five or more years in late 2014. Eastern Bag & Paper Co. has a lease expiration date of October 31, 2021 and Hutchinson Aerospace & Industry, Inc. has a lease expiration date of January 31, 2020. |
| ■ | Sponsor.Boston-based Albany Road was established in July, 2012. The company and its team combine for over 200 years of real estate, investment banking, and venture capital experience. After an initial focus on opportunities in New England, the firm has also expanded its reach by closing investments in Tennessee and Georgia. Albany Road aims to structure its investments with a combination of company equity in addition to high net worth/family office or institutional equity and leverages investments with a debt component that is usually 65-75%. |
THE INFORMATION IN THIS STRUCTURAL AND COLLATERAL TERM SHEET IS NOT COMPLETE AND MAY BE AMENDED PRIOR TO THE TIME OF SALE. THIS TERM SHEET IS NOT AN OFFER TO SELL THESE SECURITIES AND IT IS NOT A SOLICITATION OF AN OFFER TO BUY THESE SECURITIES IN ANY JURISDICTION WHERE THE OFFER OR SALE IS NOT PERMITTED.
| 114 |
3149 Landtree Place Orlando, FL 32812 | Collateral Asset Summary – Loan No. 20 Reserve at Conway | Cut-off Date Balance: Cut-off Date LTV: U/W NCF DSCR: U/W NOI Debt Yield: | $14,800,000 73.6% 1.29x 8.3% |
| Mortgage Loan Information | |
| Loan Seller: | GACC |
| Loan Purpose: | Acquisition |
| Sponsor: | David J. Carlson; Mark A. Isaacson |
| Borrower: | Redwood Reserve at Conway, LLC |
| Original Balance: | $14,800,000 |
| Cut-off Date Balance: | $14,800,000 |
| % by Initial UPB: | 1.6% |
| Interest Rate: | 4.6000% |
| Payment Date: | 6thof each month |
| First Payment Date: | October 6, 2015 |
| Maturity Date: | September 6, 2025 |
| Amortization: | Interest only for first 60 months; 360 months thereafter |
| Additional Debt: | None |
| Call Protection: | L(25), D(91), O(4) |
| Lockbox / Cash Management(1): | Springing Soft / Springing |
| Reserves | ||
| Initial | Monthly | |
| Taxes: | $188,411 | $18,841 |
| Insurance(2): | $0 | Springing |
| Replacement: | $0 | $4,583 |
| Required Repairs: | $11,625 | NAP |
| Required Renovation Reserve: | $1,391,748 | $0 |
| Financial Information | ||
| Cut-off Date Balance / Unit: | $67,273 | |
| Balloon Balance / Unit: | $61,656 | |
| Cut-off Date LTV(3): | 73.6% | |
| Balloon LTV(3): | 67.5% | |
| Underwritten NOI DSCR(4): | 1.35x | |
| Underwritten NCF DSCR(4): | 1.29x | |
| Underwritten NOI Debt Yield: | 8.3% | |
| Underwritten NCF Debt Yield: | 7.9% | |
| Property Information | |
| Single Asset / Portfolio: | Single Asset |
| Property Type: | Garden Multifamily |
| Collateral: | Fee Simple |
| Location: | Orlando, FL |
| Year Built / Renovated: | 1983 / 2015 |
| Total Units: | 220 |
| Property Management: | American Management Services Central LLC |
| Underwritten NOI: | $1,225,710 |
| Underwritten NCF: | $1,170,710 |
| “As Complete” Appraised Value(5): | $20,100,000 |
| “As Complete” Appraised Date(5): | July 1, 2016 |
| Historical NOI | |
| Most Recent NOI: | $1,147,430 (T-12 May 31, 2015) |
| 2014 NOI: | $1,082,560 (December 31, 2014) |
| 2013 NOI: | $1,022,157 (December 31, 2013) |
| 2012 NOI: | NAV |
| Historical Occupancy | |
| Most Recent Occupancy: | 95.5% (July 8, 2015) |
| 2014 Occupancy: | 94.3% (December 31, 2014) |
| 2013 Occupancy: | 95.1% (December 31, 2013) |
| 2012 Occupancy: | NAV |
| (1) | A soft lockbox and in place cash management will be triggered (i) upon an event of default or (ii) if the DSCR falls below 1.10x until such time that the DSCR is at least 1.20x for two consecutive calendar quarters. |
| (2) | If an acceptable blanket insurance policy is no longer in place, the borrower is required to deposit 1/12 of the annual insurance premiums into the insurance reserve account on a monthly basis. |
| (3) | The Cut-off Date LTV and Balloon LTV are based on the “As Complete” appraised value of $20.1 million as of July 1, 2016. Based on the “As-is” appraised value of $18.6 million as of July 8, 2015, the Cut-off Date LTV and Balloon LTV is 79.6% and 72.9%, respectively. |
| (4) | Based on amortizing payments. Based on the current interest only debt service payments, the Underwritten NOI DSCR and Underwritten NCF DSCR are 1.78x and 1.70x, respectively. |
| (5) | The “As Complete” appraised value assumes the completion of planned capital expenditures at the property by July 1, 2016. The full amount of planned capital expenditures, $1,391,748, was reserved for at loan closing. |
TRANSACTION HIGHLIGHTS |
| ■ | Property.The Reserve at Conway property is a 220-unit, garden style apartment complex located in Orlando, Florida. The property was constructed in 1983 and consists of 15 apartment buildings with 164,484 sq. ft. of rentable area and one clubhouse/office. The Reserve at Conway property offers one- and two-bedroom floor plans with an average unit size of 748 sq. ft. The Reserve at Conway property amenities include a swimming pool, fitness center, grill area, tennis court, clubhouse, laundry facility, dog park, business center, car care center and 24-hour emergency maintenance. Parking is provided via 356 open surface parking spaces, which equates to a parking ratio of 1.62 spaces per unit. |
| ■ | Capital Improvements.According to the sponsor, since early 2012, the seller has invested approximately $941,000 ($4,277 per unit) in capital improvements at the Reserve at Conway property. The improvements included unit upgrades, including a full renovation of 36 units, exterior painting, pool upgrades, HVAC and water heater replacement, landscaping upgrades, exterior enhancements, new signage, clubhouse upgrades and roofing and parking lot repairs. The borrower plans to spend an additional $1,391,748 ($6,326 per unit) in capital improvements post loan origination. Budgeted improvements at the Reserve at Conway property include $1.06 million of unit interior improvements, $117,000 of common area improvements, including landscaping, clubhouse and fitness center renovations, pool deck resurfacing, and $215,000 of exterior improvements. |
| ■ | Market. Reserve at Conway is located in Orlando, Florida within the Orlando MSA, approximately four miles southeast of the Orlando central business district and 3.5 miles north of the Orlando International Airport. According to the appraisal, the population within a one-, three- and five-mile radius is 16,565, 112,783 and 270,886, respectively, and median household income is $39,636, $39,363 and $40,199, respectively. As of Q1 2015, the Orlando multifamily market had a total inventory of 129,805 units and the Reserve at Conway property’s submarket had an inventory of 18,672 units. New inventory of 200 units was added to the Orlando multifamily market in Q1 2015 and 4,376 units were added in 2014, compared to no new units in Q1 2015 and 1,326 units in 2014 for the Reserve at Conway property’s submarket. |
THE INFORMATION IN THIS STRUCTURAL AND COLLATERAL TERM SHEET IS NOT COMPLETE AND MAY BE AMENDED PRIOR TO THE TIME OF SALE. THIS TERM SHEET IS NOT AN OFFER TO SELL THESE SECURITIES AND IT IS NOT A SOLICITATION OF AN OFFER TO BUY THESE SECURITIES IN ANY JURISDICTION WHERE THE OFFER OR SALE IS NOT PERMITTED.
| 115 |
SECURITIES, PRICING ESTIMATES AND OTHER INFORMATION
This material is for your information, and none of Deutsche Bank Securities Inc., Cantor Fitzgerald & Co., KeyBanc Capital Markets, CastleOak Securities, L.P., and Goldman, Sachs & Co. or any other underwriter, (the “Underwriters”) are soliciting any action based upon it. This material is not to be construed as an offer to sell or the solicitation of any offer to buy any security in any jurisdiction where such an offer or solicitation would be illegal.
Neither this document nor anything contained herein shall form the basis for any contract or commitment whatsoever. The information contained herein is preliminary as of the date hereof. These materials are subject to change, completion or amendment from time to time. The information contained herein will be superseded by similar information delivered to you as part of the offering document relating to the COMM 2015-CCRE27 Mortgage Trust, Commercial Mortgage Pass-Through Certificates (the “Offering Document”). The information contained herein supersedes any such information previously delivered and should be reviewed only in conjunction with the entire Offering Document. All of the information contained herein is subject to the same limitations and qualifications contained in the Offering Document. The information contained herein does not contain all relevant information relating to the underlying mortgage loans or mortgaged properties. Such information is described elsewhere in the Offering Document. The information contained herein will be more fully described elsewhere in the Offering Document. The information contained herein should not be viewed as projections, forecasts, predictions or opinions with respect to value. Prior to making any investment decision, prospective investors are strongly urged to read the Offering Document its entirety. Neither the Securities and Exchange Commission nor any state securities commission has approved or disapproved of these securities or determined if this free writing prospectus is truthful or complete. Any representation to the contrary is a criminal offense.
The attached information contains certain tables and other statistical analyses (the “Computational Materials”) which have been prepared in reliance upon information furnished by the Mortgage Loan Sellers. Numerous assumptions were used in preparing the Computational Materials, which may or may not be reflected herein. As such, no assurance can be given as to the Computational Materials’ accuracy, appropriateness or completeness in any particular context; or as to whether the Computational Materials and/or the assumptions upon which they are based reflect present market conditions or future market performance. The Computational Materials should not be construed as either projections or predictions or as legal, tax, financial or accounting advice. You should consult your own counsel, accountant and other advisors as to the legal, tax, business, financial and related aspects of a purchase of these securities. Any weighted average lives, yields and principal payment periods shown in the Computational Materials are based on prepayment and/or loss assumptions, and changes in such prepayment and/or loss assumptions may dramatically affect such weighted average lives, yields and principal payment periods. In addition, it is possible that prepayments or losses on the underlying assets will occur at rates higher or lower than the rates shown in the attached Computational Materials. The specific characteristics of the securities may differ from those shown in the Computational Materials due to differences between the final underlying assets and the preliminary underlying assets used in preparing the Computational Materials. The principal amount and designation of any security described in the Computational Materials are subject to change prior to issuance. None of Underwriters or any of their respective affiliates makes any representation or warranty as to the actual rate or timing of payments or losses on any of the underlying assets or the payments or yield on the securities.
This document contains forward-looking statements. Those statements are subject to certain risks and uncertainties that could cause the success of collections and the actual cash flow generated to differ materially from the information set forth herein. While such information reflects projections prepared in good faith based upon methods and data that are believed to be reasonable and accurate as of the dates thereof, the depositor undertakes no obligation to revise these forward-looking statements to reflect subsequent events or circumstances. Individuals should not place undue reliance on forward-looking statements and are advised to make their own independent analysis and determination with respect to the forecasted periods, which reflect the issuer’s view only as of the date hereof.
| IMPORTANT NOTICE RELATING TO AUTOMATICALLY GENERATED EMAIL DISCLAIMERS |
Any legends, disclaimers or other notices that may appear at the bottom of the email communication to which this free writing prospectus is attached relating to (1) these materials not constituting an offer (or a solicitation of an offer), (2) no representation being made that these materials are accurate or complete and may not be updated or (3) these materials possibly being confidential, are not applicable to these materials and should be disregarded. Such legends, disclaimers or other notices have been automatically generated as a result of these materials having been sent via Bloomberg or another system.